Composite Structural Health Monitoring Through Use of Embedded PZT Sensors
18
http://jim.sagepub.com/ Structures Journal of Intelligent Material Systems and http://jim.sagepub.com/content/22/8/739 The online version of this article can be found at: DOI: 10.1177/1045389X11406303 2011 22: 739 originally published online 19 May 2011 Journal of Intelligent Material Systems and Structures Hong-Yue Tang, Charles Winkelmann, Wahyu Lestari and Valeria La Saponara Composite Structural Health Monitoring Through Use of Embedded PZT Sensors Published by: http://www.sagepublications.com can be found at: Journal of Intelligent Material Systems and Structures Additional services and information for http://jim.sagepub.com/cgi/alerts Email Alerts: http://jim.sagepub.com/subscriptions Subscriptions: http://www.sagepub.com/journalsReprints.nav Reprints: http://www.sagepub.com/journalsPermissions.nav Permissions: http://jim.sagepub.com/content/22/8/739.refs.html Citations: at UNIV CALIFORNIA DAVIS on July 21, 2011 jim.sagepub.com Downloaded from
Transcript of Composite Structural Health Monitoring Through Use of Embedded PZT Sensors

http://jim.sagepub.com/Structures
Journal of Intelligent Material Systems and
http://jim.sagepub.com/content/22/8/739The online version of this article can be found at:
DOI: 10.1177/1045389X11406303
2011 22: 739 originally published online 19 May 2011Journal of Intelligent Material Systems and StructuresHong-Yue Tang, Charles Winkelmann, Wahyu Lestari and Valeria La Saponara
Composite Structural Health Monitoring Through Use of Embedded PZT Sensors
Published by:
http://www.sagepublications.com
can be found at:Journal of Intelligent Material Systems and StructuresAdditional services and information for
http://jim.sagepub.com/cgi/alertsEmail Alerts:
http://jim.sagepub.com/subscriptionsSubscriptions:
http://www.sagepub.com/journalsReprints.navReprints:
http://www.sagepub.com/journalsPermissions.navPermissions:
http://jim.sagepub.com/content/22/8/739.refs.htmlCitations:
at UNIV CALIFORNIA DAVIS on July 21, 2011jim.sagepub.comDownloaded from
Composite Structural Health Monitoring Through Use ofEmbedded PZT Sensors
HONG-YUE ‘RAY’ TANG,1 CHARLES WINKELMANN,1 WAHYU LESTARI2,* AND VALERIA LA SAPONARA
1,*1Department of Mechanical and Aerospace Engineering, University of California, Davis, CA 95616, USA
2Department of Aerospace Engineering, Embry-Riddle Aeronautical University, Prescott, AZ 86301, USA
ABSTRACT: The need to understand and monitor the integrity of structural componentsmade of composite materials is becoming critical, due to an increase of the use of compositesin aerospace, civil, wind energy, and transportation engineering. Off-the-shelf piezoelectrictransducers embedded inside the composites or bonded onto the structure surface are a pos-sible solution for on-line structural health monitoring and non-destructive evaluation: theycan be used to generate Lamb waves, which are able to detect damage. This article focuses onthe behavior of two sets of woven fiberglass/epoxy specimens, one with embedded, one withsurface-mounted piezoelectric wafer transducers (lead zirconate titanate). The specimens aretested under axial tensile fatigue at high stress ratio, and the transducers are interrogated inpitch-catch mode at different stages of the specimens’ life, while they are subjected to the meantest load (the testing machine is paused). A novel signal processing technique based on waveletthresholding/denoising and Gabor wavelet transform is discussed. This technique identifieschanges in boundary conditions, loading/unloading prior to damage and during damage. Itappears to correlate the contour area changes with the so-called characteristic damage stateobserved in the literature in composite laminates under tensile fatigue.
Key Words: composite, fatigue, embedded, piezoelectric, wavelet.
INTRODUCTION
COMPOSITE structures are characterized by high spe-cific stiffness and specific strength and the ability to
customize material properties to specific applications.However, their complex damage states require signifi-cant efforts for non-destructive evaluation and struc-tural health monitoring. For example, the cost ofinspection is an estimated 30% of the total cost ofthe acquisition and operation of composite structures(Bar-Cohen, 2000).One possible solution is to monitor the behavior of a
composite component and compare it to an acceptableperformance benchmark representing the ‘signature’ of ahealthy structure. A number of techniques are availablein the literature. Among them, an approach based onbonded piezoelectrics has the potential to minimizedowntime and maintenance costs when compared tohuman inspection. Piezoelectrics allow the inspectionof a structure utilizing Lamb waves, and their advan-tages range from negligible mass and excellent mechan-ical strength to wide frequency response and low cost,e.g., reviews by Su et al. (2006), Chopra (2002),
Giurgiutiu (2008). However, they have a number ofdrawbacks: (1) they generate concurrent multipleLamb wave modes, thus further complicating signal pro-cessing and interpretation, and requiring a careful selec-tion of the input signal (Wilcox et al., 2001; Dıaz Valdesand Soutis, 2002; Su et al., 2006); (2) they are point-to-point detection methods, and thus may necessitate a net-work to interrogate larger volumes, (Diamanti et al.,2007; Giurgiutiu, 2008); (3) they may degrade themechanical properties of the host structure, (Singh andVizzini, 1994; Bronowicki et al., 1996; Schaaf et al.,2006; Winkelmann et al., 2008). There are, however,some researchers who showed that degradation of thehost structure or of the transducer does not occur undersome circumstances, (Mall and coworkers, 1998, 2000,2002; Paget and Levin, 1999; Qing et al., 2007).
The scope of this article is to use embedded and sur-face-mounted lead zirconate titanate (PZT) transducersto identify signal features related to global damage ofwoven fiberglass/epoxy composites under tensile fatigue,at high stress ratio, and high testing frequency. This wasdone with low ultrasonic frequencies and low hardwarecost. We made an effort to understand the behavior ofan ideal smart composite structure in its operational life,while it is loaded. Therefore, we queried the sampleswith PZT pairs in pitch-catch mode, while the sampleswere loaded, and as they accumulated fatigue damage.
*Authors to whom correspondence should be addressed.E-mail: [email protected]; [email protected] 1!9 appear in color online: http://jim.sagepub.com
JOURNAL OF INTELLIGENT MATERIAL SYSTEMS AND STRUCTURES, Vol. 22—May 2011 739
1045-389X/11/08 0739!17 $10.00/0 DOI: 10.1177/1045389X11406303! The Author(s), 2011. Reprints and permissions:http://www.sagepub.co.uk/journalsPermissions.nav
at UNIV CALIFORNIA DAVIS on July 21, 2011jim.sagepub.comDownloaded from

The presence of loading complicates the interpretationof the wave velocities’ changes with fatigue: there is con-current deterioration of the host specimens and thebonded transducers, while the specimens are understrain. The tests are carried out in load control; hencethe strain of the composite is non-linear and depends onits existing damage, fiber and matrix cracks at multiplelocations and of multiple scale (inside the yarn, insidethe ply, between plies). These cracks will cause scatter-ing, reflection, mode conversion of the multimode, dis-persive and direction-dependent Lamb waves launchedin the structure.A technique based on wavelet analysis is presented in
this study: it is based on wavelet thresholding(denoising) and on Gabor wavelet transform. The out-come of this technique is the area of one of the contoursfrom the Gabor wavelet transform, which varies withfatigue damage. Its pattern may be correlated to theso-called characteristic damage state, which is used torepresent fatigue failure of laminates made of unidirec-tional pre-preg or woven plies (Highsmith andReifsnider, 1982; Berthelot, 2003; Naik, 2003). The pro-posed technique appears robust to the acquisition rateselected. It may be able to discriminate between loadedand unloaded conditions, and to identify variability dueto boundary conditions in the same specimen andmanufacturing scatter among specimens.Very few studies appear to have addressed the effect
of load on the properties of guided waves (Chen andWilcox, 2007, for isotropic structures). Here, we shownovel results on how measured wave velocity respondsto composite damage under loading, and its relationshipwith the characteristic damage state. Wavelet analysishas been adopted by many researchers to date, e.g., tomention a few, Paget et al. (2003), Kessler et al. (2002),Kim and Melhem (2004), Sohn et al. (2004), Okafor andDutta (2000), Rizzo et al. (2007). However, to the best ofour knowledge, the contour technique and interpreta-tion shown in this article are new.The second and the third sections show, respectively,
the experimental set-up, and the signal processing tech-nique and the wave velocity measurements. Discussion,results, and future work are given in the fourth section,while the last section summarizes the key findings of thisarticle.
EXPERIMENTAL
Manufacturing and Testing Set-Up
At the beginning of this project, considerable effortwas spent to devise a manufacturing technique thatwould produce good-quality composite specimens withpiezoelectric wafers embedded inside the plates. The lackof an available autoclave dictated the use of woven
materials in place of pre-pregs, and the adoption of con-ventional Vacuum Assisted Resin Transfer Molding(VARTM). VARTM is a common out-of-autoclavemanufacturing technique that is utilized for automotiveand ship engineering, and in wind turbine blades. Inmore recent years, the Composite AffordabilityInitiative launched by the US Air Force ResearchLaboratory and aerospace industries has demonstratedthat ‘VARTM is an aerospace-ready process’ (Russell,2007). Parts made with VARTM will be also present onthe Boeing 787 airliner (Brosius, 2007). It is understoodthat the manufacturing variability may be higher forwoven composites produced by VARTM than for pre-preg composites produced by autoclave. However, anyNDE/SHM method for the engineering practice has toovercome the issue of scatter and defects, which occur inall composites’ manufacturing processes.
Fiberglass woven reinforcement was chosen for tworeasons: (1) the ability to track the transducers in thespecimens, because of the transparency of the curedmaterial and (2) the easier wiring and grounding of thetransducers located inside the plates, as fiberglass is non-conductive.
After tuning-up the manufacturing technique, we pre-pared the first group of specimens (Figure 1(a) and (b))out of plain weave E-glass (type 3733 from AppliedVehicle Technologies), infiltrated with Proset 117LVepoxy/237 at a cure cycle of 4 h at 52!C, followed by16 h at 60!C. The lay-up of these specimens was [(0/90)2/("45)2]s, for a total of eight layers.1 The nominal speci-men gage length and width were, respectively,100mm and 25.4mm. The measured properties for asingle lamina are E11#E22# (16.9" 1.17)GPa,G12# (2.91" 0.262) GPa, v12# 0.0782" 0.0390, andthe density 1594 kg/m3. We varied the size and locationof the piezoelectric wafer pairs in these specimens toinvestigate the effects of these variables on static andfatigue tensile strengths. Obtaining tensile propertieswas considered the very first step toward the character-ization of the conditioned specimens, consistently withsome work present in the literature (Bronowicki et al.,1996; Mall and coworkers, 1998, 2000, 2002). In futurework, it is envisioned that static and fatigue compressiveproperties, and reversed (compression/tension) fatigueproperties will be measured.
A 22 factorial design of experiments was followed, andresults presented in Winkelmann et al. (2008). The pie-zoelectric wafers had diameter$ thickness either equalto 7$ 0.2mm2 (type SM412 from Steiner Martins, Inc.)or equal to 15$ 0.9mm2 (type SM411 from SteinerMartins, Inc.). During lay-up, PZT pairs were placedin the middle of the specimens (between the fourth and
1For the woven lay-ups of this article, we use one of the notations available in theliterature (Shimokawa et al., 2007; Huang and Waas, 2009; Li et al., 2010).
740 H.-Y. R. TANG ET AL.
at UNIV CALIFORNIA DAVIS on July 21, 2011jim.sagepub.comDownloaded from

fifth ply) or one layer below the surface. The nominaldistance between transmitter and receiver was 70mm.Based on the test results of this group, discussed in the
section ‘Axial Fatigue Test Results,’ the second group ofspecimens was built with a different lay-up, which wouldbe easier to understand and model: a cross-ply configu-ration with eight plies, [(0/90)2]s, from a predominantlyunidirectional E-glass fabric (type 7715 from AppliedVehicle Technology). The same resin system was used,and the nominal specimen gage length$width wasequal to 151$ 25.4mm2. The longer gage length permit-ted an increased distance between transmitter and recei-ver (approximately 100mm). The measured propertiesfor a single lamina are E11# (37.6" 2.22)GPa, E22#(12.0" 0.682), G12# (3.42" 0.192)GPa, v12# 0.254" 0.0131, and the density 1740 kg/m3. Moreover, onepair of surface-mounted piezoelectric wafers wasbonded to each sample. After observing the failuremode occurring in the fatigue tests of the first specimengroup (section ‘Axial Fatigue Test Results’), smaller pie-zoelectric wafers were chosen, with a 5mm diameter anda 0.4mm thickness (type SM121 from Steiner Martins,Inc.). These were bonded onto the surface of the speci-mens with the aid of a conductive epoxy adhesive(Loctite 3888), which granted electrical access to thelower lead (Figure 1(c)).Regarding the thickness and diameter of the embed-
ded piezoelectric wafers with respect to the host struc-ture dimensions, the literature shows similar choices,(Singh and Vizzini, 1994; Bronowicki et al., 1996; Malland coworkers, 1998, 2000, 2002; Paget and coworkers,1999, 2002; Qing et al., 2007).Baseline specimens (with no transducers) were tested
in static tension in a MTS 810 hydraulic testing machineat a rate of 2mm/min. Control specimens with lay-ups
equal to those of the first and second groups had respec-tive ultimate tensile loads of (9.24" 0.265) kNand (15.9" 0.496) kN. This corresponded, respectively,to mean tensile strengths of 225 and 365MPa. We uti-lized this information to design the tensile fatiguetests, with a load ratio high enough to accelerate fail-ure, but still able to allow sufficient waveform dataacquisitions before failure. Such a trade-off wasobtained for the baseline specimens with a frequencyof 10Hz and a load ratio R of 0.8. For the first group,this led to testing at R # 0:6 ultimate tensile load
0:75 ultimate tensile load # 0:8,with a mean load of 6.23 kN. The second grouphad R # 0:515 ultimate tensile load
0:635 ultimate tensile load # 0:8 and a mean load of8.96 kN.
It should be pointed out that while the ultimate tensileloads of the control specimens of the two groups hadvery small scatter (coefficient of variation %3%), thebaseline fatigue loads for the first group exhibited con-siderable variability (coefficient of variation %90%).This may be partly attributed to the process of panelcutting, which in the first group of specimens wasdone with a tile saw blade of inferior quality with respectto the blade used for the second group. Unfortunately,baseline fatigue data for the second group areunavailable.
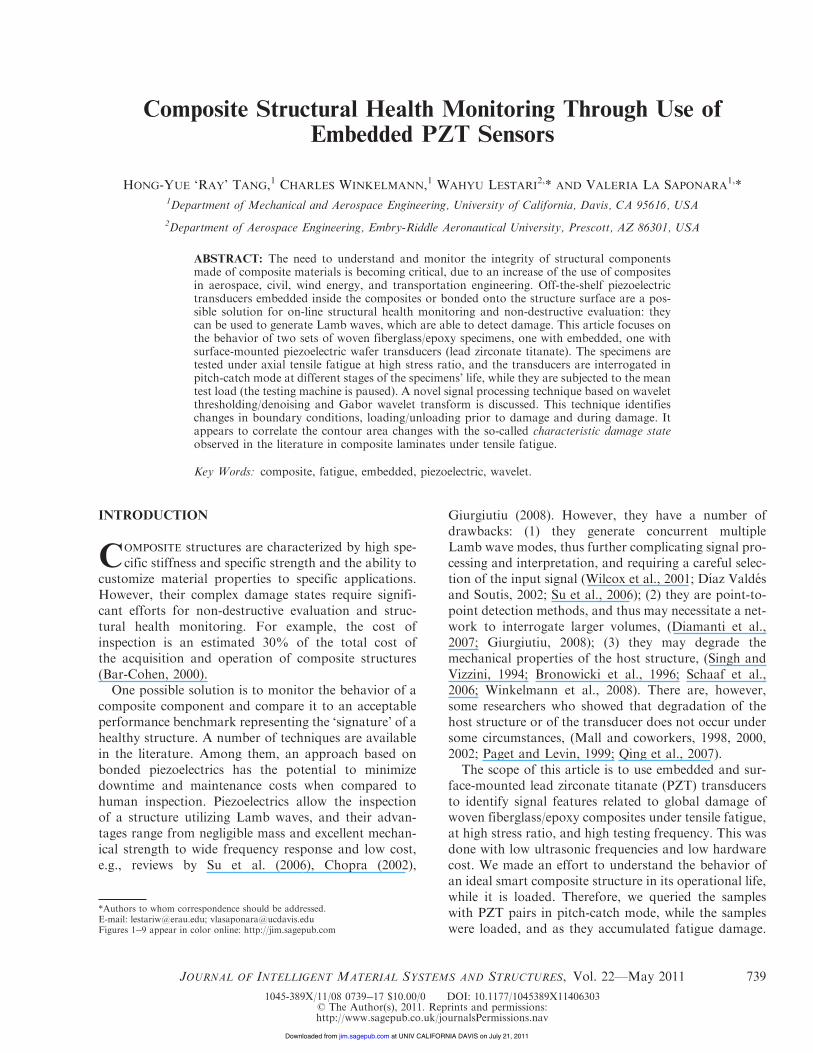
The wave propagation experiments were run concur-rently with the fatigue tests, Figure 2. The set-up wasdriven by MATLAB Instrument Control Toolbox, andthe signal was generated by an Agilent 33220A functiongenerator, and amplified by an A.A. Lab Systems Ltd.A303 High Voltage Amplifier and Modulator. AnAgilent DSO6014A four-channel oscilloscope recordedinput and output signals. The excitation waveform was afive sine wave pulse modulated by a Hamming window.It is similar to modulated sine pulses which have been
(a) (b) (c)
C D E F
BA
Figure 1. Pictures of the three sets of tested specimens. Notes: From left to right, specimens A!B (piezoelectric wafers in the mid-thickness),specimens C!F (piezoelectric wafers one layer below the surface) from the first group, and selected specimens (surface-mounted piezoelectricwafers), from the second group. The nominal width is 25.4mm.
Composite Structural Health Monitoring 741
at UNIV CALIFORNIA DAVIS on July 21, 2011jim.sagepub.comDownloaded from
successfully used in the literature to launch Lamb wavesin composites and identify time of flight (TOF) of dif-ferent modes, (Guo and Cawley, 1993; Wilcox et al.,2001; Kessler et al., 2002; Paget et al., 2003). The ampli-tudes of the amplified signal were, respectively, 60 and80V for first and second groups of specimens, selectedby trial and error to increase sensor’s reception withinthe amplifier’s capabilities.The transducers were driven at center frequencies
ranging from 10 to 50 kHz, with 10 kHz increments.This bandwidth gave very limited distortion in theamplified input signal, while the received waveformshad different levels of separation between the Lambmodes’ arrivals. Low ultrasonic frequencies are expectedto launch Lamb waves with reduced attenuation (Wilcoxet al., 2001). Waveforms were acquired at set intervals asthe machine was paused and the specimens were subjectto their mean loads. In most cases, the waveform acqui-sition was obtained at the mean load, before any fatiguedamage, then at 1000 cycles, and at 10,000 cycle inter-vals afterward, until failure was reached. For the secondgroup, an additional measurement was made for eachspecimen when it was unloaded in the machine’s grips,before any fatigue cycle. All tests were run in one singleday per specimen, with the exception of one specimen ofthe second group: in this case, the test was carried out intwo different days 2 weeks apart, and there were
additional records, as discussed in the section‘Waveform Acquisition and Signal Data ProcessingTechnique.’ This test turned out to give a critical pieceof information. More tests were conducted on specimenswith embedded piezoelectric wafers, subject to impact(Tang et al., 2008), but these will be not focused uponin this article.
Axial Fatigue Test Results
Woven composites are made of three major compo-nents: longitudinal strand (warp), transverse strand (fillor weft), and matrix-only regions (Naik, 2003).Mechanical properties depend on local details such asyarn interlocking, spacing, and undulation (Naik andShembekar, 1992). Fatigue failure in woven compositesoccurs due to the sequence of micro-structural (e.g.,matrix microcracks, fibers/matrix interface cracks,fiber breakage) and macro-structural damage (trans-verse cracks in fill, shear failure in warp, cracks inpure-matrix regions, inter-ply, and intra-ply delamina-tion), Naik (2003).
In the large majority of our tests for the first group ofspecimens (16 specimens overall, four per configura-tion), fatigue failure occurred at the leads of the piezo-electric wafers, especially for the larger 15mm diameterpiezo wafers (Winkelmann et al., 2008) (Figure 1(a)
Figure 2. (a) Testing set-up. The top shelf of the cart contains the laptop running MATLAB, and the four-channel oscilloscope. The bottom shelfof the cart contains the function generator and the amplifier; (b) One specimen with surface-mounted piezoelectric wafers; Specimenwidth# 25.4mm.
742 H.-Y. R. TANG ET AL.
at UNIV CALIFORNIA DAVIS on July 21, 2011jim.sagepub.comDownloaded from
and (b)). There is clear evidence that the piezo wafersbehaved as stress raisers. The scatter of cycles to failurewas considerable for all configurations in the first group,with coefficients of variation up to 107% (Winkelmannet al., 2008). Knowing the intricacy of the damage mech-anisms in woven composites mentioned above, thisshould not be surprising. Further complications willarise from the presence of embedded piezoelectrics,whose thickness was of the order of approximately oneto five times the average ply thickness (0.19mm). It isreasonable to expect the formation of resin pocketsaround the piezoelectric wafers during the resininfiltration.On the other hand, the specimens of the second group
(six overall) failed at a number of cycles equal to53,656" 23,344, corresponding to a coefficient of varia-tion of 43.5%. Failure was typically in the gage section,reasonably away from the wafers, Figure 1(c). The ten-sile fatigue performance (quantified in number of cyclesto failure, scatter, damage features) clearly favors theuse of surface-mounted piezoelectric wafers versus theembedded piezoelectric wafers.In the following sections, we show how the processed
waveform data may be tied to the complex global stateof damage in the specimens of these two groups.
WAVEFORM ACQUISITION AND SIGNAL DATAPROCESSING TECHNIQUE
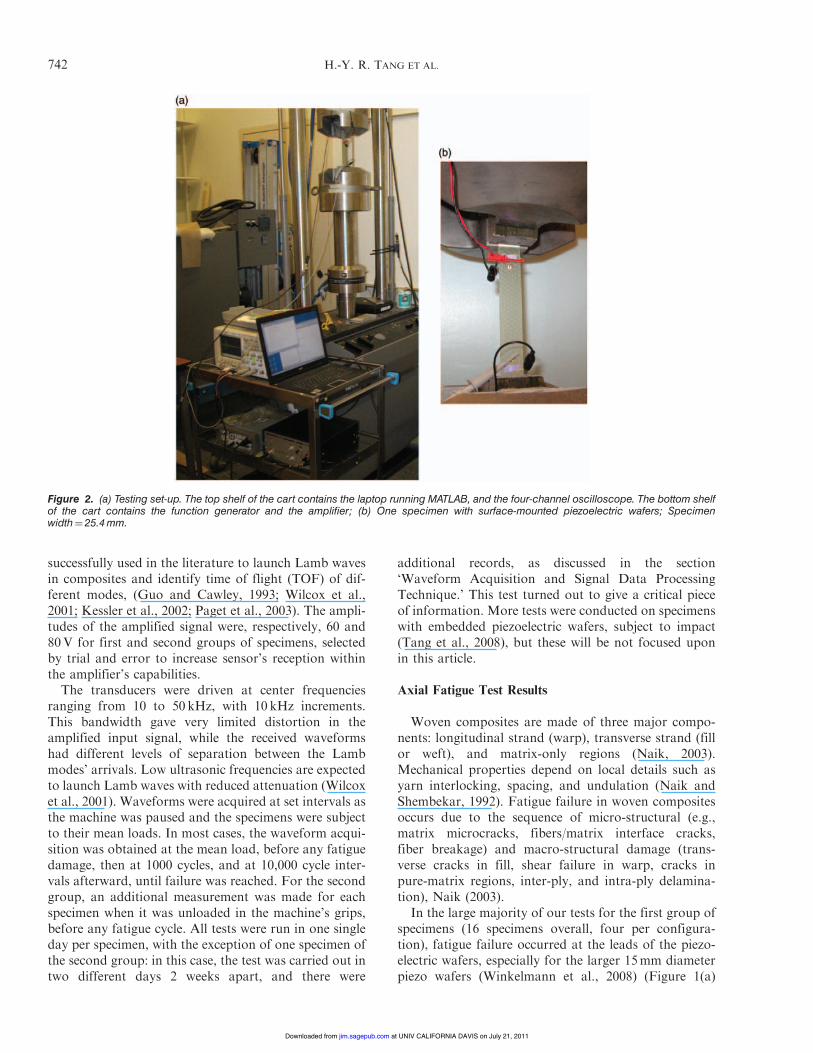
In this article, we present the waveform results for atotal of 10 specimens (Table 1): six from the first group,named A through F, all with 7$ 0.2mm2 piezoelectricwafers; four from the second group, named 1 through 4.Out of the first set, two have PZT transducers in themid-thickness location, while four have the PZT trans-ducers one layer below the surface. These specimenswere selected out of a total of 22 specimens tested over2 years because of the clarity of their waveforms, thenumber of acquisitions, and/or detailed test records.
In the testing period, the acquisition rate changed,due to improvements in the oscilloscope software inthe testing period: the received signals of specimensA!F were 1000$ 1 vectors, while those of the secondgroup were 20,833$ 1 vectors, except for one case (spe-cimen 1 with 1000$ 1 points). The recorded outputsignal in response to a 50 kHz center frequency inputhas a duration of 4:495$ 10&4 sfor the first group and4:4997$ 10&4 sfor the second group.
The two groups of specimens had dissimilaritiesdue to: geometry (variation in gage length, distancebetween transmitter and receiver), type of lay-upand weave (i.e., [(0/90)2/("45) 2]s from plain weave fiber-glass and cross-ply [(0/90)2]s from unidirectional fiber-glass), location of the transducers (mid-thickness ofthe plate, one layer below the surface, surface), dimen-sions of the transducers, input voltage, and acquisitionrate.
We were looking for a robust signal processing tech-nique able to carry out some daunting tasks: (1) captureand quantify the presence of global composite damagewith cost-effective hardware, e.g., at low ultrasonic fre-quencies and/or low acquisition rates; (2) be portable tocomposite structures of a similar material make-up, withpossibly unknown manufacturing defects (but withavailable baseline signals); (3) discriminate betweenloaded and unloaded status ! in fact, actual engineeringstructures are loaded in their operational life; and(4) differentiate signatures of embedded piezoelectricwafers from those of surface-mounted piezoelectricwafers, in the presence of unknown noise. This articlepresents a novel technique, which we believe showsmuch promise toward these goals.
The technique is based on Gabor wavelet transformsapplied to denoised signals. We introduced the tech-nique for the first time in a very recent publication(La Saponara et al., 2011a) for a concurrent project.This entailed a study of delaminated fiberglass/epoxyspecimens with surface-mounted piezoelectric (PZT
Table 1. Life to failure of tested glass/epoxy specimens.
Specimen PZT location Cycles to failureCycles of last
waveform acquisitionNumber of waveform
acquisitions
A Mid-thickness 57,974 51,000 7B Mid-thickness 211,081 211,000 23C One layer below surface 34,353 31,000 5D One layer below surface 78,280 71,000 7E One layer below surface 28,730 21,000 4F One layer below surface 23,421 21,000 41 Surface 48,761 41,000 72a Surface 70,451 61,000 8 on first day,
3 on second day3a Surface 70,491 61,000 94a Surface 79,244 76,000 12
aStands for 20,833$ 1 acquired data. All other acquired data were 1000$1 vectors.
Composite Structural Health Monitoring 743
at UNIV CALIFORNIA DAVIS on July 21, 2011jim.sagepub.comDownloaded from
and PMN-PT) wafers, also tested under axial tensilefatigue.Since then, further insight was gained, which is dis-
cussed in this article.
Wavelet Transforms, Signal Thresholding
The first step of our process is to denoise the acquiredreceiver signal. This is done with a technique called inthe literature wavelet thresholding: it consists of calculat-ing the wavelet transform of a signal, and then settingthe wavelet coefficients equal to zero, when they arebelow a given threshold. The calculated signal is thenconverted back into the time domain.Wavelet transforms have been successfully adopted in
many applications for frequency!time multiresolutionof noisy, non-stationary signals (Lau and Weng, 1995;Nakken, 1999; Gunther et al., 2000; Wink andRoerdink, 2004; Poornachandra, 2008; Zhao et al.,2009, to mention few examples of non-structural engi-neering topics). General overviews on wavelet trans-forms are given in many references (Mallat, 1989;Daubechies, 1992; Lau and Weng, 1995; Burrus et al.,1998; Torrence and Compo, 1998; Sheng, 2000, etc.).A concise discussion is given here in this article, basedon Sheng (2000).Through the continuous wavelet transform (CWT) of
a signal f 't( 2 L2, the signal is decomposed into a set offunctions hs,!(t) called wavelets:
CWTf 's, !( #Z
f 't(h)s,!'t( dt '1(
where * indicates the complex conjugate. The waveletsare obtained by scaling and translating a fundamentalfunction h(t), the ‘mother wavelet’:
hs,!'t( #1!!s
p ht& !
s
" #'2(
In Equations (1) and (2), s is the scale and ! the trans-lation factor. The term s&1=2 allows wavelets’ normaliza-tion, so that all the wavelets scaled by the factor s havethe same energy.Regarding denoising of a signal through wavelet
thresholding, the statistics literature presents severalalgorithms, (Donoho and Johnstone, 1995;Abramovich and Benjamini, 1996; Serban, 2010).Some of these, in particular those in La Saponaraet al. (2011a) and in this article, are implemented inthe open-source WaveLab toolbox, built upon the com-mercial software MATLAB. WaveLab has beenadopted in the literature (Nakken, 1999; Guntheret al., 2000; Wink and Roerdink, 2004), and was exten-sively used for the signal processing of this article.A common hypothesis in the literature is that the
acquired signal is affected by white noise with aGaussian distribution (e.g., Donoho and Johnstone
1995; Wink and Roerdink 2004; Poornachandra 2008;Zhang et al., 2008, etc.). We cannot verify it at this stagefor our signals. We chose soft thresholding in place ofhard thresholding, due to its demonstrated advantages(Donoho and Johnstone, 1995).
To apply thresholding with WaveLab, the signals’length has to be in the form of 2n. In our case, thereceived signals are either 1000$ 1 vectors (specimensA!F and 1) or 20,833$ 1 vectors (specimens 2!4),which are then zero-padded to a 2n length.
At the beginning, there was no downsampling of the20,833$ 1 signals prior to zero padding and threshold-ing. Subsequently, a 20:1 downsampling was performedon those signals, which will be commented upon in‘Discussion and Results’ section.
The outcome of thresholding was approved if themost distinctive aspects of the denoised signal did notchange, in comparison with the original noisy signal.The number of non-zero wavelet coefficients of thedenoised signal depended on the type of wavelet familyused for the thresholding (with software options‘Symmlet’, ‘Daubechies’, ‘Haar’, ‘Battle’, and‘Coiflet’). The denoised signal energy was then com-puted back in the time domain, compared with that ofthe original noisy signal, and utilized to measure thestrength of the denoised signal as the specimens werefatigued, in the 10!50 kHz center frequency bandwidth:the energy of signals is the highest at a 50 kHz centerfrequency for specimens A!F, and in specimens 1!4, thepeak energy is obtained at a 10 kHz center frequency.This difference confirms the expectation that the sur-face-mounted and embedded piezoelectric wafers havediverse vibration.
To aid the comparison between the two sets of speci-mens, a 50 kHz center frequency was selected for all ofthem, and the denoised signals were normalized withrespect to the input amplitude (60 and 80V) prior toadditional processing.
Wave Velocity and Wave Attenuation Study
From the acquired thresholded data on the specimenswith embedded piezoelectric wafers, the wave velocityand attenuation were determined and plotted as a func-tion of the fatigue cycles, as defined in the section‘Manufacturing and Testing Set-up.’ In particular, thewave velocities were calculated using the actual distancebetween the piezoelectric wafers at each acquisitioninterval, divided by TOF. The actual distance wasdefined as d 't( # 70* "r't( $ 100$ L0 (mm), where"r't( is the residual strain, calculated from the cross-head displacement of the testing machine, as"r't( # L't( & L0' (=L0 $ 100, L0 being the initial gagelength. The TOF was determined visually using the dif-ference between the centers of the sinewave pulses of thereceived and incident waves, while the wave amplitude
744 H.-Y. R. TANG ET AL.
at UNIV CALIFORNIA DAVIS on July 21, 2011jim.sagepub.comDownloaded from
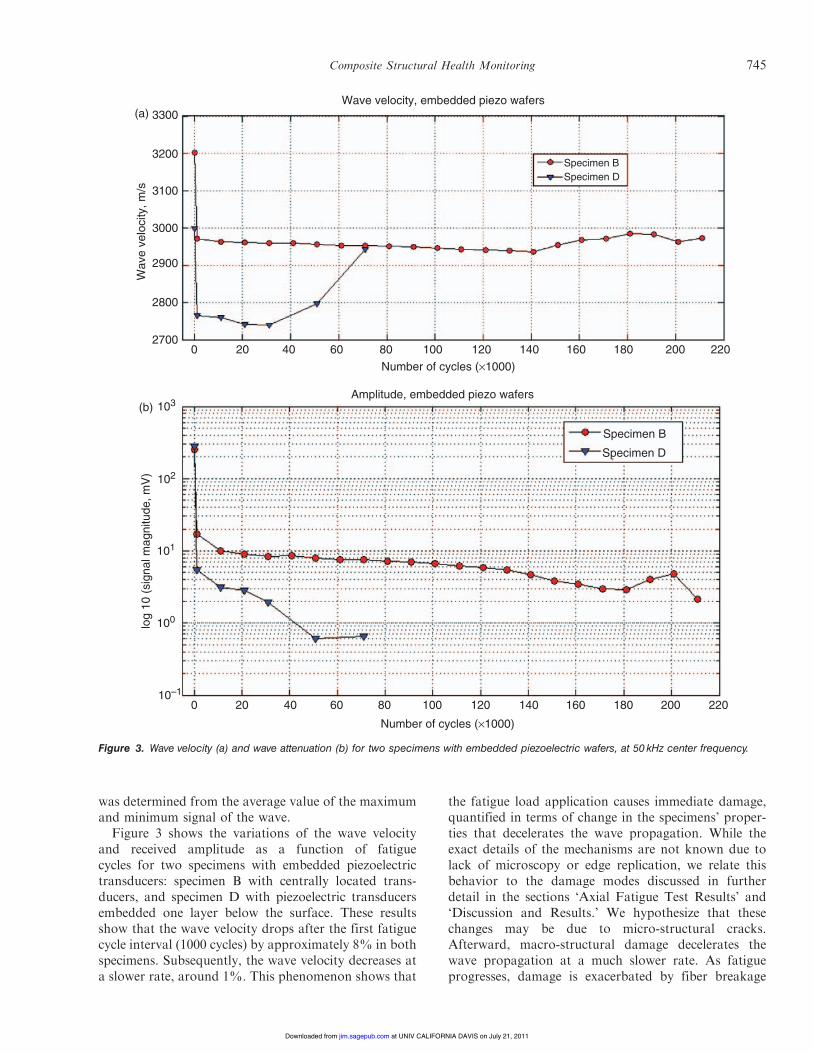
was determined from the average value of the maximumand minimum signal of the wave.Figure 3 shows the variations of the wave velocity
and received amplitude as a function of fatiguecycles for two specimens with embedded piezoelectrictransducers: specimen B with centrally located trans-ducers, and specimen D with piezoelectric transducersembedded one layer below the surface. These resultsshow that the wave velocity drops after the first fatiguecycle interval (1000 cycles) by approximately 8% in bothspecimens. Subsequently, the wave velocity decreases ata slower rate, around 1%. This phenomenon shows that
the fatigue load application causes immediate damage,quantified in terms of change in the specimens’ proper-ties that decelerates the wave propagation. While theexact details of the mechanisms are not known due tolack of microscopy or edge replication, we relate thisbehavior to the damage modes discussed in furtherdetail in the sections ‘Axial Fatigue Test Results’ and‘Discussion and Results.’ We hypothesize that thesechanges may be due to micro-structural cracks.Afterward, macro-structural damage decelerates thewave propagation at a much slower rate. As fatigueprogresses, damage is exacerbated by fiber breakage
3300
Wav
e ve
loci
ty, m
/s3200
3100
3000
2900
2800
27000
103
102
101
100
10–10 20 40 60 80 100
Number of cycles (!1000)
120 140 160 180 200 220
log
10 (
sign
al m
agni
tude
, mV
)
20 40 60 80 100 120Number of cycles (!1000)
Amplitude, embedded piezo wafers
Wave velocity, embedded piezo wafers
Specimen B
Specimen D
140 160 180 200 220
(a)
(b)
Specimen BSpecimen D
Figure 3. Wave velocity (a) and wave attenuation (b) for two specimens with embedded piezoelectric wafers, at 50 kHz center frequency.
Composite Structural Health Monitoring 745
at UNIV CALIFORNIA DAVIS on July 21, 2011jim.sagepub.comDownloaded from
and further macro-structural damage, causing the wavevelocity to increase at higher rate: this damage may infact generate more wave scattering and the possibility ofwave conversion. These waves may have shorter TOFand consequently have faster wave velocity. Our opinionis supported by the pronounced cracking sound gener-ated by the specimens during the application of themean load.As shown in Figure 3, the magnitude of the received
signal drops significantly in the first few cycles, while asmaller change affects the data after the thirdacquisition.Regarding the specimens with surface-mounted trans-
ducers, by mishap records of the original distancebetween the actuator and the sensor were lost; hence,the TOF measurement is not deemed accurate. A pre-liminary calculation on a distance of 100mm (inferredfrom the tested specimens) shows a similar trend (sub-stantial drop in the first 1000 cycles, decrease at a muchlower rate in the second part) followed by a third phase,in which there is another strong drop in the latest part ofthe fatigue life. The trend of wave velocity and waveattenuation variations during the fatigue testing are con-sistent with the trend observed from the Gabor waveletanalysis, reported in the following section.
Gabor Wavelet Transform, Contour Area
The thresholded and normalized waveforms at a50 kHz center frequency were further examined with aCWT, Gabor wavelet transform, which has been shownin the literature as able to detect structural damage(Gaul and Hurlebaus, 1997; Kim and Kim, 2001;Quek et al., 2001; Lanza di Scalea and McNamara,2004; Todorovska and Trifunac, 2007). It is also reason-ably similar to the input signal, thus following one of therecommendations of Li et al. (2009) for the selection ofthe optimal mother wavelet: the closer the mother wave-let to the signal, the larger the wavelet coefficients. TheGabor wavelet function is given by (Quek et al., 2001):
h't( # 1!!!"4
p
!!!!!!2"
#
s
exp& 2"=#' (2t2
2* j2"t
$ %,
with # # "!!!!!!!!!!!!!2= ln 2
p'3(
The wavelet transform maps a one-dimensional signalinto three dimensions, represented by the plot typicallyused for wavelets, the ‘scalogram’, and numerically by a(k, j, c) array. In our study, k is equal to the number ofrows of the denoised signal (after zero padding, there aren # 2048 rows for specimens A!F, and n # 32, 768 rowsfor specimens 1!4). Borrowing nomenclature frommusic, the total number of scales (maximum value ofthe index j) is calculated as the product of the numberof octaves by the number of voices per octave. The num-bers of octaves are computed from the signal itself as
log2'n( & 4, (Wavelab 850), while 12 voices per octaveare chosen for this project. Twelve is considered a rea-sonable trade-off between resolution and computationaltime, and is also the default value selected by the devel-opers of WaveLab. Consequently, the thresholded sig-nals from specimens A!F are portrayed by a2048$ 84$ c array consisting of the absolute values oftheir Gabor wavelet transforms, while those from speci-mens 1!4 are represented by 32,768$ 132$ c arrays.The third index of the array, c, is given often in termsof a color scale, where the color is associated to the valueof the wavelet coefficients, Figure 4. Therefore, a scalo-gram is a three-dimensional plot.
Since Gabor wavelet transform is not orthonormal,Parseval’s theorem does not apply and therefore onecannot deduct the energy of the signal from the signal’swavelet components, (Burrus et al., 1998). Our analysisdoes not rely on the energy concept, but on the repre-sentation of the wavelet transform through contourplots, and on their area variations as the specimens’damage increases. We noticed that the contour valueschanged with physical changes, e.g., fatigue damage,unloading and loading at zero cycles, and loading andunloading in the presence of damage.
In particular, we recorded the variation of the area ofthe external contour with the number of cycles. Thecontour area change was selected after other attemptsat identifying the right damage-related parameter. Forexample, we looked into clustering, centers of clusters,and fuzzy mean logic. Clustering was discarded afterlearning that some clustering algorithms will create arti-fact clusters where none exists, thus requiring clustervalidation (Pal and Bezdek, 1995; Jain et al., 1999).Moreover, fuzzy logic routines may not converge tothe same value, depending on the initial cluster seedings(Tari et al., 2009).
The contour area is a much more robust measure ofthe contour than a maximum, a minimum, or a clustercenter, because it is calculated over thousands of points,corresponding to the rows and columns of the absolutevalue of the Gabor wavelet transform (more commentson this follow). Once the contour value was selected, thearea was calculated with a published MATLAB code(Contour2Area.m, 2010), Figures 5!7. Contours ofwavelet transforms have been utilized in the literature(Gaul and Hurlebaus, 1997; Yoon et al., 2000; Lanza diScalea and McNamara, 2004). However, there appearsno analysis similar to the one presented in this article orin related prior work (La Saponara et al., 2011a, b). Inthis work, every point in Figures 5!9 required:
1. A convergence process. The resolution of the Gaborwavelet transform varies with the number of contoursselected. The convergence criterion was yi*1 & yi' (=yi$100 + 5 (i.e., 5% convergence) and yi is the area ofthe external contour. It was observed that the contour
746 H.-Y. R. TANG ET AL.
at UNIV CALIFORNIA DAVIS on July 21, 2011jim.sagepub.comDownloaded from

area typically increased, but some cases appeared tohave a local minimum for the area corresponding at13 contours. Herein, all the calculations for the plotswere carried out at 13 contours.
2. A careful selection of the area of the actual contribut-ing contours (e.g., the code Contour2Area.m calcu-lated also the area of internal empty contours).
3. Attention to possible ringing of the received signalwith the input signal, at time close to 0 s. Ringingwould appear in the Gabor wavelet transform, andhence it needed to be disregarded from the calculationof the contour areas. In two cases only (specimens Cand F at 0 cycles), the areas could not be separated,and hence, the actual area should be actually smaller.
0.01
0.05
0
–0.005
–0.01
–0.015
1
2
34
5
6
7
8
9
0
0 200 400 600i th component of absolute value of Gabor wavelet transform
800
Specimen B, 0 cycles, loaded
1000 1200 1400 1600 1800 2000
0.5 1 1.5 2Time (s)
2.5 3 3.5 4 4.5! 10–4
Den
oise
d si
gnal
/(in
put
ampl
itude
)
log 2
(fu
nctio
n of
sca
le)
(a)
(b)
Figure 4. (a) Denoised signal of specimen B at 0 cycles, normalized with respect to the input amplitude; (b) absolute value of its Gabor wavelettransform. Each point has coordinates (i, m), where i 2 ,1, 2048- and m is given the log2(function of scale), in WaveLab 850.
40
jth
com
pone
nt o
f abs
olut
e va
lue
of G
abor
wav
elet
tran
sfor
mjt
h co
mpo
nent
of a
bsol
ute
valu
eof
Gab
or w
avel
et tr
ansf
orm
3530
252015
105
40
100 200
0.000606
300i th component of absolute value of Gabor wavelet transform
Specimen B, 0 cycles, loaded
i th component of absolute value of Gabor wavelet transform
400 500 600 700 800 900 10001
2
3
4
5
6
7
! 10–3
100 200 300 400 500 600 700 800 900 1000
35
30
25
20
15
10
5
(a)
(b)
Figure 5. (a) Close-up of contour plots of absolute value of Gabor wavelet transform of denoised signal for specimen B, at mean load and 0fatigue cycles. The y-axis is a zoomed-in scale (top). Software: MATLAB and WaveLab 850; (b) area of external contour (level#0.000606). Onlythe solid areas were added for the rest of the analysis (bottom). Software: MATLAB and Contour2Area.m.
Composite Structural Health Monitoring 747
at UNIV CALIFORNIA DAVIS on July 21, 2011jim.sagepub.comDownloaded from
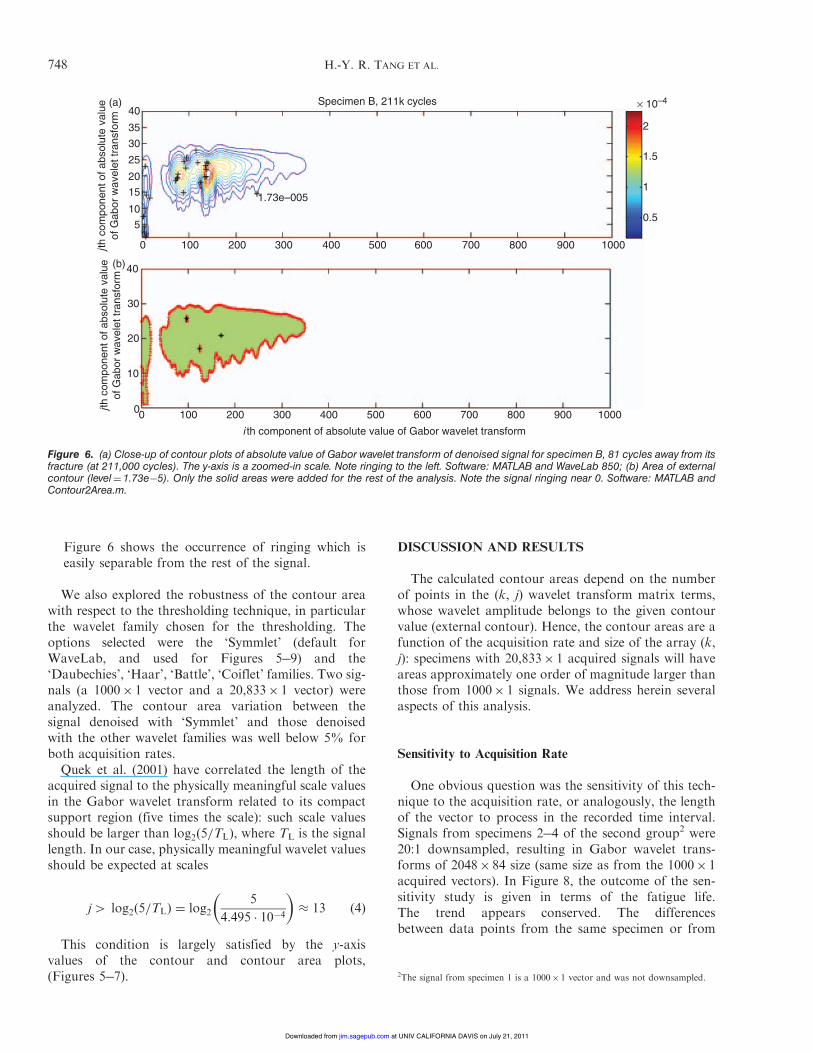
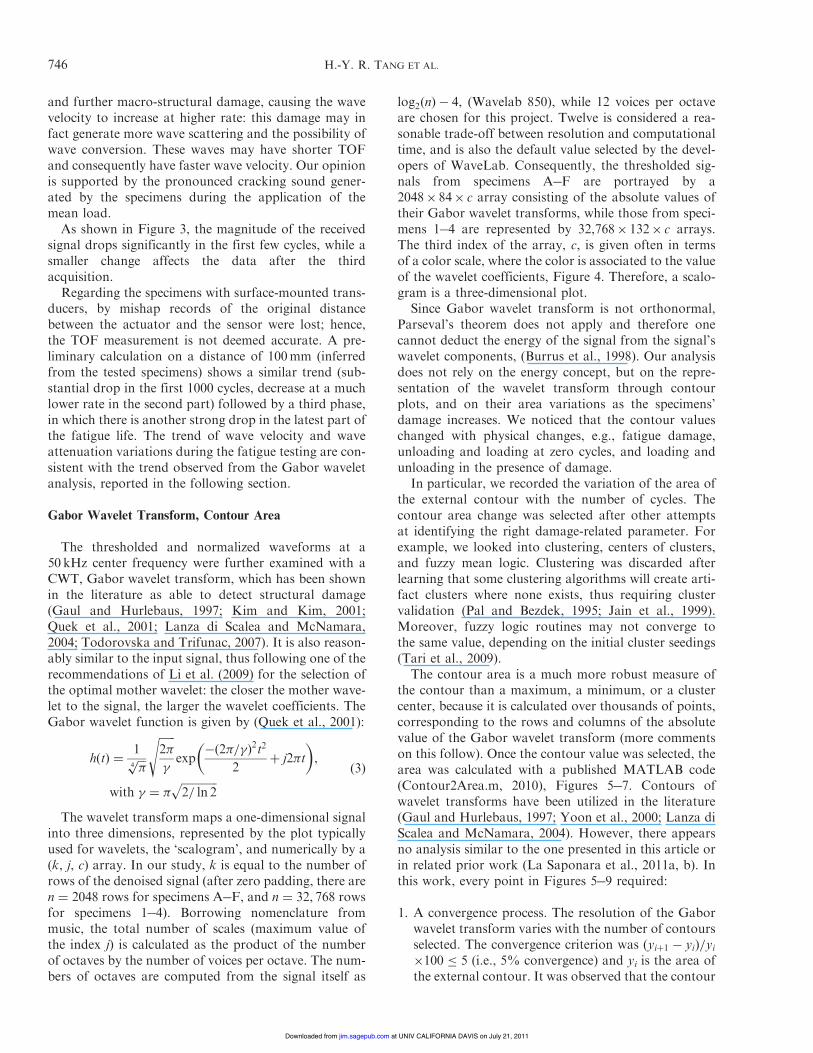
Figure 6 shows the occurrence of ringing which iseasily separable from the rest of the signal.
We also explored the robustness of the contour areawith respect to the thresholding technique, in particularthe wavelet family chosen for the thresholding. Theoptions selected were the ‘Symmlet’ (default forWaveLab, and used for Figures 5!9) and the‘Daubechies’, ‘Haar’, ‘Battle’, ‘Coiflet’ families. Two sig-nals (a 1000$ 1 vector and a 20,833$ 1 vector) wereanalyzed. The contour area variation between thesignal denoised with ‘Symmlet’ and those denoisedwith the other wavelet families was well below 5% forboth acquisition rates.Quek et al. (2001) have correlated the length of the
acquired signal to the physically meaningful scale valuesin the Gabor wavelet transform related to its compactsupport region (five times the scale): such scale valuesshould be larger than log2'5=TL(, where TL is the signallength. In our case, physically meaningful wavelet valuesshould be expected at scales
j4 log2 5=TL' ( # log25
4:495 . 10&4
$ %/ 13 '4(
This condition is largely satisfied by the y-axisvalues of the contour and contour area plots,(Figures 5!7).
DISCUSSION AND RESULTS
The calculated contour areas depend on the numberof points in the (k, j) wavelet transform matrix terms,whose wavelet amplitude belongs to the given contourvalue (external contour). Hence, the contour areas are afunction of the acquisition rate and size of the array (k,j): specimens with 20,833$ 1 acquired signals will haveareas approximately one order of magnitude larger thanthose from 1000$ 1 signals. We address herein severalaspects of this analysis.
Sensitivity to Acquisition Rate
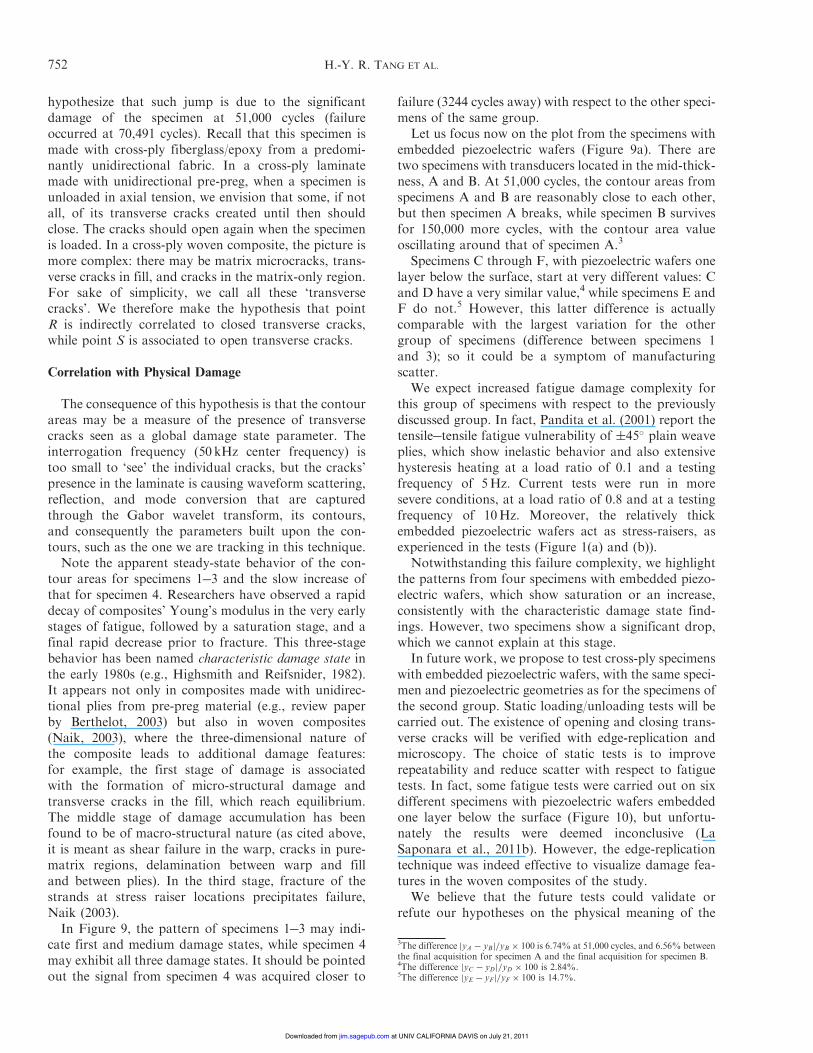
One obvious question was the sensitivity of this tech-nique to the acquisition rate, or analogously, the lengthof the vector to process in the recorded time interval.Signals from specimens 2!4 of the second group2 were20:1 downsampled, resulting in Gabor wavelet trans-forms of 2048$ 84 size (same size as from the 1000$ 1acquired vectors). In Figure 8, the outcome of the sen-sitivity study is given in terms of the fatigue life.The trend appears conserved. The differencesbetween data points from the same specimen or from
40
3530
25
2015
105
40
30
20
10
0
jth c
ompo
nent
of a
bsol
ute
valu
eof
Gab
or w
avel
et tr
ansf
orm
jth c
ompo
nent
of a
bsol
ute
valu
eof
Gab
or w
avel
et tr
ansf
orm
0 100 200
1.73e–005
Specimen B, 211k cycles ! 10–4
2
1.5
1
0.5
300 400 500 600 700 800 900 1000
0 100 200
i th component of absolute value of Gabor wavelet transform
300 400 500 600 700 800 900 1000
(a)
(b)
Figure 6. (a) Close-up of contour plots of absolute value of Gabor wavelet transform of denoised signal for specimen B, 81 cycles away from itsfracture (at 211,000 cycles). The y-axis is a zoomed-in scale. Note ringing to the left. Software: MATLAB and WaveLab 850; (b) Area of externalcontour (level# 1.73e&5). Only the solid areas were added for the rest of the analysis. Note the signal ringing near 0. Software: MATLAB andContour2Area.m.
2The signal from specimen 1 is a 1000$ 1 vector and was not downsampled.
748 H.-Y. R. TANG ET AL.
at UNIV CALIFORNIA DAVIS on July 21, 2011jim.sagepub.comDownloaded from

specimens with similar behavior are consistent: note,for example, the relative distances between pointsP and S, ' yP & yS(=yS $ 100, and points S andQ, ' yS & yQ(=yQ $ 100, are equal in both plots
(respectively, 13.8% and &10%). The relative differencebetween points P and T, i.e., ' yP & yT(=yT $ 100, isapproximately 2% in both plots. Downsampling doesnot seem to alter the relative pattern among points,
40
35
30
25
20
15
10
5
40
35
30
25
20
15
10
5
40
35
30
25
20
15
10
5
40
35
30
25
20
15
10
5
jth c
ompo
nent
of a
bsol
ute
valu
eof
Gab
or w
avel
et tr
ansf
orm
jth c
ompo
nent
of a
bsol
ute
valu
eof
Gab
or w
avel
et tr
ansf
orm
jth c
ompo
nent
of a
bsol
ute
valu
eof
Gab
or w
avel
et tr
ansf
orm
jth
com
pone
nt o
f abs
olut
e va
lue
of G
abor
wav
elet
tran
sfor
m
0 100 200 300 400 500 600 700 800 900 1000
0 100 200 300 400 500 600 700 800 900 1000
0 100 200 300 400 500 600 700 800 900 1000
0 100 200 300 400 500 600 700 800 900 1000
1
2
3
4
5
6
7
2
4
6
8
10
12
x 10–4
x 10–4Specimen 4, 0 cycles, unloaded
Specimen 4, 76k cycles
0.000103
5.53e–005
i th component of absolute value of Gabor wavelet transform
i th component of absolute value of Gabor wavelet transform
(a)
(b)
Figure 7. Contour analysis for specimen 4 at (a) unloading before fatigue and (b) last acquisition prior to fracture (3244 cycles away fromfailure). Software: MATLAB, WaveLab 850 and Contour2Area.m.
Composite Structural Health Monitoring 749
at UNIV CALIFORNIA DAVIS on July 21, 2011jim.sagepub.comDownloaded from

but modifies the actual values (e.g., yP, yT). Theseresults hint that the interpretation from this signal pro-cessing technique is robust with the acquisition rate, aslong as all signals under examination are acquired atthe same rate and represented on the same measure-ment scale.We now have the means to query the contour areas of
the two specimen groups for a correlation with materialdamage, and for similarities/differences.
Effect of Boundary and Loading Conditions
All contour areas are plotted in the range obtainedfrom analyzing (2048$ 84) Gabor wavelet matrices,
with respect to the fatigue lives, Figure 9. We start ourdiscussion with the plot for the specimens with surface-mounted piezoelectric wafers, which shows some strik-ing features. First, note the unloaded condition at 0cycles (symbols with no line): the technique is able tocapture a difference between the ‘no-load’ status (speci-mens in the grips with zero load) and the ‘load’ status(specimens at the mean load), with no fatigue damage.The contour area values drop further at 1000 cycles andthen seem to oscillate toward a steady-state value.
Specimen 2 had to be tested over two different days.The last two acquisitions of the first day, points P andQ, correspond, respectively, to the loaded sample at41,000 cycles, and to the unloaded sample at 51,000
5000
Comparison specimens with surface-mounted piezo wafers: acquisition rate effect
4500
4000
3500
Are
a of
ext
erna
l con
trol
Are
a of
ext
erna
l con
trol
3000
2500
9.5
9
8.5
8
7.5
7
6.5
6
5.5
5
4.5
! 104
0 20 40 60
Cycles (! 1000)
Cycles (! 1000)
1000 ! 1 vectors
Specimen 1 N/A
20833 ! 1 vectors
Q
Q
R
R
S
S
P
P
Specimen 1
Specimen 3
Specimen 1 (no load)
Specimen 3 (no load)
Specimen 4 (no load)Specimen 4
Specimen 3
Specimen 3 (no load)
Specimen 4 (no load)
Specimen 4
Specimen 2 (1st day)
Specimen 2 (1st day)
Specimen 2 (2nd day)
Specimen 2 (2nd day)
Specimen 2 (no load), 2nd day
Specimen 2 (no load), 2nd day
Specimen 2 (no load), 1st day
Specimen 2 (no load), 1st day
80 100 120 140
0 20 40 60 80 100 120 140
(a)
(b)
Figure 8. External contour areas of absolute values of Gabor wavelet transform for the group of specimens with surface-mounted piezoelectricwafers: (a) original acquisition rate and (b) 20:1 downsampled acquisition rate. Note: Points P, Q, R, S correspond to unloading/loadingoccurrences for specimen 2 over two days testing period.
750 H.-Y. R. TANG ET AL.
at UNIV CALIFORNIA DAVIS on July 21, 2011jim.sagepub.comDownloaded from
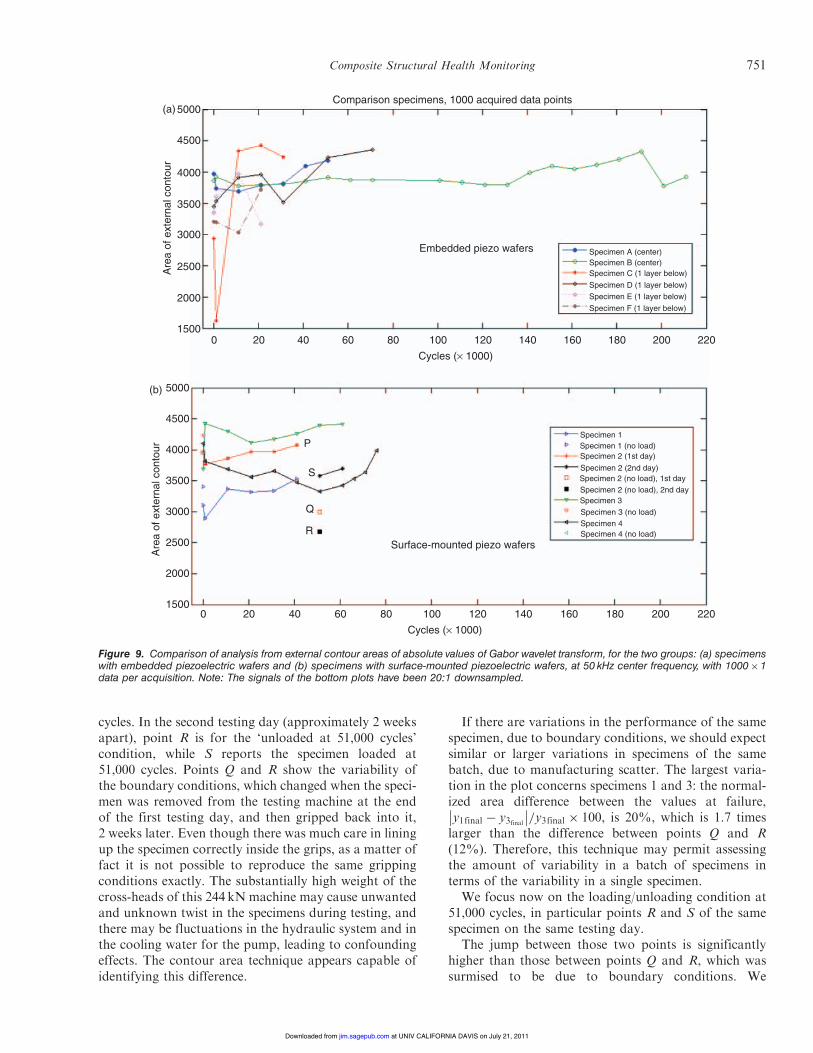
cycles. In the second testing day (approximately 2 weeksapart), point R is for the ‘unloaded at 51,000 cycles’condition, while S reports the specimen loaded at51,000 cycles. Points Q and R show the variability ofthe boundary conditions, which changed when the speci-men was removed from the testing machine at the endof the first testing day, and then gripped back into it,2 weeks later. Even though there was much care in liningup the specimen correctly inside the grips, as a matter offact it is not possible to reproduce the same grippingconditions exactly. The substantially high weight of thecross-heads of this 244 kN machine may cause unwantedand unknown twist in the specimens during testing, andthere may be fluctuations in the hydraulic system and inthe cooling water for the pump, leading to confoundingeffects. The contour area technique appears capable ofidentifying this difference.
If there are variations in the performance of the samespecimen, due to boundary conditions, we should expectsimilar or larger variations in specimens of the samebatch, due to manufacturing scatter. The largest varia-tion in the plot concerns specimens 1 and 3: the normal-ized area difference between the values at failure,y1final & y3final&& &&=y3final $ 100, is 20%, which is 1.7 timeslarger than the difference between points Q and R(12%). Therefore, this technique may permit assessingthe amount of variability in a batch of specimens interms of the variability in a single specimen.
We focus now on the loading/unloading condition at51,000 cycles, in particular points R and S of the samespecimen on the same testing day.
The jump between those two points is significantlyhigher than those between points Q and R, which wassurmised to be due to boundary conditions. We
5000
4500
4000
3500
3000
2500
Are
a of
ext
erna
l con
tour
Are
a of
ext
erna
l con
tour
2000
1500
5000
4500
4000
3500
3000
2500
2000
1500
R
Q
S
P
0 20 40 60 80Cycles (! 1000)
Embedded piezo wafers
Comparison specimens, 1000 acquired data points
Surface-mounted piezo wafers
100 120 140 160
Specimen A (center)
Specimen 1
Specimen 3
Specimen 4Specimen 3 (no load)
Specimen 4 (no load)
Specimen 1 (no load)Specimen 2 (1st day)Specimen 2 (2nd day)Specimen 2 (no load), 1st daySpecimen 2 (no load), 2nd day
Specimen B (center)Specimen C (1 layer below)Specimen D (1 layer below)Specimen E (1 layer below)Specimen F (1 layer below)
180 200 220
0 20 40 60 80Cycles (! 1000)
100 120 140 160 180 200 220
(a)
(b)
Figure 9. Comparison of analysis from external contour areas of absolute values of Gabor wavelet transform, for the two groups: (a) specimenswith embedded piezoelectric wafers and (b) specimens with surface-mounted piezoelectric wafers, at 50 kHz center frequency, with 1000$1data per acquisition. Note: The signals of the bottom plots have been 20:1 downsampled.
Composite Structural Health Monitoring 751
at UNIV CALIFORNIA DAVIS on July 21, 2011jim.sagepub.comDownloaded from
hypothesize that such jump is due to the significantdamage of the specimen at 51,000 cycles (failureoccurred at 70,491 cycles). Recall that this specimen ismade with cross-ply fiberglass/epoxy from a predomi-nantly unidirectional fabric. In a cross-ply laminatemade with unidirectional pre-preg, when a specimen isunloaded in axial tension, we envision that some, if notall, of its transverse cracks created until then shouldclose. The cracks should open again when the specimenis loaded. In a cross-ply woven composite, the picture ismore complex: there may be matrix microcracks, trans-verse cracks in fill, and cracks in the matrix-only region.For sake of simplicity, we call all these ‘transversecracks’. We therefore make the hypothesis that pointR is indirectly correlated to closed transverse cracks,while point S is associated to open transverse cracks.
Correlation with Physical Damage
The consequence of this hypothesis is that the contourareas may be a measure of the presence of transversecracks seen as a global damage state parameter. Theinterrogation frequency (50 kHz center frequency) istoo small to ‘see’ the individual cracks, but the cracks’presence in the laminate is causing waveform scattering,reflection, and mode conversion that are capturedthrough the Gabor wavelet transform, its contours,and consequently the parameters built upon the con-tours, such as the one we are tracking in this technique.Note the apparent steady-state behavior of the con-
tour areas for specimens 1!3 and the slow increase ofthat for specimen 4. Researchers have observed a rapiddecay of composites’ Young’s modulus in the very earlystages of fatigue, followed by a saturation stage, and afinal rapid decrease prior to fracture. This three-stagebehavior has been named characteristic damage state inthe early 1980s (e.g., Highsmith and Reifsnider, 1982).It appears not only in composites made with unidirec-tional plies from pre-preg material (e.g., review paperby Berthelot, 2003) but also in woven composites(Naik, 2003), where the three-dimensional nature ofthe composite leads to additional damage features:for example, the first stage of damage is associatedwith the formation of micro-structural damage andtransverse cracks in the fill, which reach equilibrium.The middle stage of damage accumulation has beenfound to be of macro-structural nature (as cited above,it is meant as shear failure in the warp, cracks in pure-matrix regions, delamination between warp and filland between plies). In the third stage, fracture of thestrands at stress raiser locations precipitates failure,Naik (2003).In Figure 9, the pattern of specimens 1!3 may indi-
cate first and medium damage states, while specimen 4may exhibit all three damage states. It should be pointedout the signal from specimen 4 was acquired closer to
failure (3244 cycles away) with respect to the other speci-mens of the same group.
Let us focus now on the plot from the specimens withembedded piezoelectric wafers (Figure 9a). There aretwo specimens with transducers located in the mid-thick-ness, A and B. At 51,000 cycles, the contour areas fromspecimens A and B are reasonably close to each other,but then specimen A breaks, while specimen B survivesfor 150,000 more cycles, with the contour area valueoscillating around that of specimen A.3
Specimens C through F, with piezoelectric wafers onelayer below the surface, start at very different values: Cand D have a very similar value,4 while specimens E andF do not.5 However, this latter difference is actuallycomparable with the largest variation for the othergroup of specimens (difference between specimens 1and 3); so it could be a symptom of manufacturingscatter.
We expect increased fatigue damage complexity forthis group of specimens with respect to the previouslydiscussed group. In fact, Pandita et al. (2001) report thetensile!tensile fatigue vulnerability of "45! plain weaveplies, which show inelastic behavior and also extensivehysteresis heating at a load ratio of 0.1 and a testingfrequency of 5Hz. Current tests were run in moresevere conditions, at a load ratio of 0.8 and at a testingfrequency of 10Hz. Moreover, the relatively thickembedded piezoelectric wafers act as stress-raisers, asexperienced in the tests (Figure 1(a) and (b)).
Notwithstanding this failure complexity, we highlightthe patterns from four specimens with embedded piezo-electric wafers, which show saturation or an increase,consistently with the characteristic damage state find-ings. However, two specimens show a significant drop,which we cannot explain at this stage.
In future work, we propose to test cross-ply specimenswith embedded piezoelectric wafers, with the same speci-men and piezoelectric geometries as for the specimens ofthe second group. Static loading/unloading tests will becarried out. The existence of opening and closing trans-verse cracks will be verified with edge-replication andmicroscopy. The choice of static tests is to improverepeatability and reduce scatter with respect to fatiguetests. In fact, some fatigue tests were carried out on sixdifferent specimens with piezoelectric wafers embeddedone layer below the surface (Figure 10), but unfortu-nately the results were deemed inconclusive (LaSaponara et al., 2011b). However, the edge-replicationtechnique was indeed effective to visualize damage fea-tures in the woven composites of the study.
We believe that the future tests could validate orrefute our hypotheses on the physical meaning of the
3The difference jyA & yBj=yB $ 100 is 6.74% at 51,000 cycles, and 6.56% betweenthe final acquisition for specimen A and the final acquisition for specimen B.4The difference jyC & yDj=yD $ 100 is 2.84%.5The difference jyE & yFj=yF $ 100 is 14.7%.
752 H.-Y. R. TANG ET AL.
at UNIV CALIFORNIA DAVIS on July 21, 2011jim.sagepub.comDownloaded from

signal processing technique presented in this article. Thistechnique could be a potential breakthrough toward theprediction of damage in woven composites subject totensile fatigue loading.
SUMMARY AND CONCLUSIONS
Experimental results were presented for woven fiber-glass/epoxy specimens instrumented with: (1) embeddedor (2) surface-mounted piezoelectric transducers.The specimens were tested in axial tensile fatigue, andpitch-catch waveforms were recorded through their life.A modulated five-count sinewave pulse was launched atrelatively low center frequency (10!50 kHz), as themachine was paused and the specimens subjected totheir mean load.The behavior of the specimens from the two groups
was affected by diverse amounts of scatter. Failure iscaused by the stress-raisers leads of the piezoelectricwafers for the embedded configuration, while the speci-mens with surface-mounted piezoelectric wafers typi-cally break in the gage section away from thetransducers.A novel technique based on wavelets was presented in
this article: the signal is first denoised, and then analyzedwith the Gabor wavelet transform. The area of the exter-nal contour is logged with respect to the fatigue life. Thebehavior of such parameter appears to be independentof the acquisition rate; therefore, in principle, reliableresults could be obtained with as little as 1000$ 1points, and with low amount of storage space in theoscilloscope.We identified features related to boundary conditions
and loading/unloading conditions. We compared thebehavior of the contour area with fatigue life to resultsobtained in the literature, namely the characteristicdamage state reported for laminates made with unidirec-tional pre-preg as well as with woven plies. Moreover,this damage sequence seems to explain the resultsobtained from the wave velocity study reasonably well.A hypothesis is presented in this article about the cor-
relation of the contour area with the presence of
transverse cracks captured in a global specimen scale.If proven correct, further advances on this techniquemay allow non-destructive evaluation and, more impor-tantly, damage prediction in woven composites.
ACKNOWLEDGMENTS
The authors thank Dr Duncan Temple Lang,Department of Statistics, UC Davis, for his insightfulsuggestions on denoising and signal processing. Theauthors also acknowledge the assistance of formerundergraduate research assistants Yong Yin Chuahand Gordon Kwong in manufacturing the specimensand their dedication to the testing program. The workfor this article was supported by the National ScienceFoundation, (CAREER grant CMMI-0642814). Anyopinions, findings, and conclusions or recommendationsexpressed in this material are those of the authors anddo not necessarily reflect the views of the NationalScience Foundation.
REFERENCES
Abramovich, F. and Benjamini, Y. 1996. ‘‘AdaptiveThresholding of Wavelet Coefficients,’’ Comput. Stat. DataAnal., 22:351!361.
Bar-Cohen, Y. 2000. ‘‘Emerging NDE Technologies and Challenges atthe Beginning of the 3rd Millennium, Part II’’, NDT.net, vol. 5.Available at: http://www.ndt.net/article/v05n02/barcohen/barcohen.htm (accessed June 2010).
Berthelot, J.-M. 2003. ‘‘Transverse Cracking and Delamination inCross-ply Glass-fiber and Carbon-fiber Reinforced PlasticLaminates: Static and Fatigue Loading,’’ ASME Appl. Mech.Rev., 56:111!147.
Bronowicki, A.J., McIntyre, L.J., Betros, R.S. and Dvorsky, G.R.1996. ‘‘Mechanical Validation of Smart Structures,’’ SmartMater. Struct., 5:129!139.
Brosius, D. ‘‘Boeing 787 Update’’, High-PerformanceComposites Magazine, May 2007. Available at: http://www.compositesworld.com/articles/boeing-787-update (accessedMay 1, 2007).
Burrus, C.S., Gopinath, R.A. and Guo, H. 1998. Introduction toWavelets and WaveletTransforms: A Primer, 07458, PrenticeHall, New Jersey.
Chen, F. and Wilcox, P.D. 2007. ‘‘The Effect of Load on GuidedWave Propagation,’’ Ultrasonics, 47:111!122.
Figure 10. Edge replications of different locations in one specimen tested at 14,000 cycles (specimen not included in this article). Note: Left,unloaded configuration. Right, loaded configuration (9.12 kN), (La Saponara et al., 2011b).
Composite Structural Health Monitoring 753
at UNIV CALIFORNIA DAVIS on July 21, 2011jim.sagepub.comDownloaded from

Chopra, I. 2002. ‘‘Review of State of Art of Smart Structures andIntegrated Systems,’’ AIAA J., 40:2145!2187.
Contour2Area.m, Developed by Per Sundqvist. Available at: http://www.mathworks.com/matlabcentral/fileexchange/26480-contour2area (accessed January 26, 2010). This code was verifiedagainst a well-known geometric problem (areas of concentriccircles).
Daubechies, I. 1992. ‘‘Ten Lectures on Wavelet’’, CBMS-NSF LectureNotes n. 61,SIAM.
Diamanti, K., Soutis, C. and Hodgkinson, J.M. 2007. ‘‘PiezoelectricTransducer Arrangement for the Inspection of Large CompositeStructures,’’ Composites: Part A, 38:1121!1130.
Dıaz Valdes, S.H. and Soutis, C. 2002. ‘‘Real-time NondestructiveEvaluation of Fiber Composite Laminates using Low-frequencyLamb Waves,’’ J. Acoust. Soc. Am., 111:2026!2033.
Donoho, D.L. and Johnstone, I.M. 1995. ‘‘Adapting to UnknownSmoothness via Wavelet Shrinkage,’’ J. Am. Stat. Assoc.,90:1200!1224.
Gaul, L. and Hurlebaus, S. 1997. ‘‘Identification of the ImpactLocation on a Plate using Wavelets,’’ Mech. Syst. Sig. Process.,12:783!795.
Giurgiutiu, V. 2008. Structural Health Monitoring with PiezoelectricWafer Active Sensors, Academic Press, Boston.
Gunther, U.L., Ludwig, C. and Ruterjans, H. 2000. ‘‘NMRLAB !Advanced NMR Data Processing in MATLAB,’’ J. Magn.Reson., 145:201!208.
Guo, N. and Cawley, P. 1993. ‘‘The Interaction of Lamb Waves withDelaminations in Composite Laminates,’’ J. Acoust. Soc. Am.,94:2240!2246.
Highsmith, A.L. and Reifsnider, K.L. 1982. ‘‘Stiffness ReductionMechanisms in Composite Laminates,’’ In: Reifsnider, K.L.(ed.), Damage in Composite Materials, pp. 103!117, ASTMSTP 775, Philadelphia PA.
Huang, H. and Waas, A.M. 2009. ‘‘Compressive Response of Z-pinned Woven Glass Fiber Textile Composite Laminates:Experiments,’’ Compos. Sci. Technol., 69:2331!2337.
Jain, A.K., Murty, M.N. and Flynn, P.J. 1999. ‘‘Data Clustering: AReview,’’ ACM Comput. Surv., 31:264!323.
Kessler, S.S., Spearing, S.M. and Soutis, C. 2002. ‘‘Damage Detectionin Composite Materials using Lamb Wave Methods,’’ SmartMater. Struct., 11:269!278.
Kim, H. and Melhem, H. 2004. ‘‘Damage Detection of Structures byWavelet Analysis,’’ Eng. Struct., 26:347!362.
Kim, Y.Y. and Kim, E.-H. 2001. ‘‘Effectiveness of the ContinuousWavelet Transform in the Analysis of Some Dispersive ElasticWaves,’’ J. Acoust. Soc. Am., 110:86!94.
Lanza di Scalea, F. and McNamara, J. 2004. ‘‘Measuring High-fre-quency Wave Propagation in Railroad Tracks by Joint Time-Frequency Analysis,’’ J. Sound Vib., 273:637!651.
La Saponara, V., Horsley, D. A. and Lestari, W. 2011a. ‘‘StructuralHealth Monitoring of Glass/Epoxy Composite Plates Using PZTand PMN-PT Transducers’’, ASME J. Eng. Mater. Technol.,133, URL: http://link.aip.org/link/?JYT/133/011011, DOI:10.1115/1.4002644.
La Saponara, V., Lestari, W., Winkelmann, C., Arronche, L. andTang, H.-Y. 2011b. ‘‘Fatigue Damage Identification inComposite Structures Through Ultrasonics and WaveletTransform Signal Processing’’, In: Proceedings of QNDE 2010(Review of Progress in Quantitative NondestructiveEvaluation),July 2010, San Diego, CA (in press as of December 2010, to bepublished in 2011).
Lau, K.-M. and Weng, H. 1995. ‘‘Climate Signal Detection UsingWavelet Transform: How to Make a Time Series Sing,’’ Bull.Am. Meteorol. Soc., 76:2391!2402.
Li, F., Meng, G., Kageyama, K., Su, Z. and Ye, L. 2009. ‘‘OptimalMother Wavelet for Lamb Wave Analyses,’’ J. Intell. Mater.Syst. Struct., 20:1147!1161.
Li, W. H., Wong, A. and Leach, D. 2010. ‘‘Advances in BenzoxazineResins for Aerospace Applications,’’ In: Proceedings of SAMPEInternational Symposium and Exhibition, Seattle, WA.
Mall, S. and Coleman, J.M. 1998. ‘‘Monotonic and Fatigue LoadingBehavior of Quasi-isotropic Graphite/Epoxy LaminateEmbedded with Piezoelectric Sensor,’’ Smart Mater. Struct.,7:822!832.
Mall, S. and Hsu, T.L. 2000. ‘‘Electromechanical Fatigue Behavior ofGraphite/Epoxy Laminate Embedded with PiezoelectricActuator,’’ Smart Mater. Struct., 9:78!84.
Mall, S. 2002. ‘‘Integrity of Graphite/Epoxy Laminate Embedded withPiezoelectric Sensor/Actuator under Monotonic and FatigueLoads,’’ Smart Mater. Struct., 11:527!533.
Mallat, S.G. 1989. ‘‘A Theory for Multiresolution SignalDecomposition: The Wavelet Representation,’’ IEEE Trans.Pattern Anal. Mach. Intell., 11:674!693.
Naik, N.K. and Shembekar, P.S. 1992. ‘‘Elastic Behavior of WovenFabric Composites: III Laminate Design,’’ J. Compos. Mater.,26:2522!2541.
Naik, N.K. 2003. ‘‘Woven-fibre Thermoset Composites,’’In: Harris, B. (ed.), Fatigue in Composites: Science andTechnology of the Fatigue Response of Fibre-reinforcedPlastics, CRC Press.
Nakken, M. 1999. ‘‘Wavelet Analysis of Rainfall-runoff VariabilityIsolating Climatic from Anthropogenic Patterns,’’ Environ.Modell. Softw., 14:283!295.
Okafor, A.C. and Dutta, A. 2000. ‘‘Structural Damage Detection inBeams by Wavelet Transforms,’’ Smart Mater. Struct.,9:906!917.
Paget, C. A. and Levin, K. 1999. ‘‘Structural Integrity of Compositeswith Embedded Piezoelectric Ceramic Transducer’’, In:Proceedings of the SPIE Conference on Smart Structures andIntegrated Systems, Newport Beach, CA, SPIE Vol. 3668, pp.306!313.
Paget, C.A., Levin, K. and Delebarre, C. 2002. ‘‘ActuationPerformance of Embedded Piezoceramic Transducer inMechanically Loaded Composites,’’ Smart Mater. Struct.,11:886!891.
Paget, C.A., Grondel, S., Levin, K. and Delebarre, C. 2003. ‘‘DamageAssessment in Composites by Lamb Waves and WaveletCoefficients,’’ Smart Mater. Struct., 12:393!402.
Pal, N.R. and Bezdek, J.C. 1995. ‘‘On Cluster Validity for the Fuzzy c-Means Model,’’ IEEE Trans. Fuzzy Syst., 3:370!379.
Pandita, S.D., Huysmans, G., Wevers, M. and Verpoest, I. 2001.‘‘Tensile Fatigue Behaviour of Glass Plain-weave FabricComposites in on- and off-axis Directions,’’ Composites: PartA, 32:1533!1539.
Poornachandra, S. 2008. ‘‘Wavelet-based Denoising using SubbandDependent Threshold for ECG Signals,’’ Digital Signal Process,18:49!55.
Qing, X.P., Beard, S.J., Kumar, A., Ooi, T.K. and Chang, F.-K. 2007.‘‘Built-in Sensor Network for Structural Health Monitoringof Composite Structures,’’ J. Intell. Mater. Syst. Struct.,18:39!49.
Quek, S.T., Wang, Q., Zhang, L. and Ong, K.H. 2001. ‘‘PracticalIssues in the Detection of Damage in Beams Using Wavelets,’’Smart Mater. Struct., 10:1009!1017.
Rizzo, P., Sorrivi, E., Lanza di Scalea, F. and Viola, E. 2007.‘‘Wavelet-based Outlier Analysis for Guided Wave StructuralHealth Monitoring: Application to Multi-wire Strands,’’J. Sound Vib., 307:52!68.
Russell, J. 2007. ‘‘Market Trends: The Composites AffordabilityInitiative, Part I’’, High-Performance CompositesMagazine. Available at: http://www.compositesworld.com/columns/market-trends-the-composites-affordability-initiative-part-I (accessed March 1, 2007).
Schaaf, K., Rye, P., Ghezzo, F., Starr, A. and Nemat-Nasser, S.2006. ‘‘Optimization of Mechanical Properties of CompositeMaterials with Integrated Embedded Sensor Networks’’, In:Proceedings of SPIE, Smart Structures and Materials:Sensors and Smart Structures Technologies for Civil,Mechanical, and Aerospace Systems, San Diego, CA, US,Vol. 6174, pp. 617443-1 to 617443-5.
754 H.-Y. R. TANG ET AL.
at UNIV CALIFORNIA DAVIS on July 21, 2011jim.sagepub.comDownloaded from
Serban, N. 2010. ‘‘Noise reduction for Enhanced ComponentIdentification in Multi-dimensional Biomolecular NMR studies,’’Comput. Stat. Data Anal., 54:1051!1065.
Singh, D.A. and Vizzini, A.J. 1994. ‘‘Structural Integrity of CompositeLaminates with Interlaced Actuators,’’ Smart Mater. Struct.,3:71!79.
Sheng, Y. 2000. ‘‘Wavelet Transform,’’ In: Poularikas, A.D. (ed.), TheTransforms and Applications Handbook, Chapter 10, 2nd edn,CRC Press LLC, Boca Raton.
Shimokawa, T., Kakuta, Y., Saeki, D. and Kogo, Y. 2007. ‘‘CarbonPlain-Weave Fabric Low-Temperature Vacuum Cure EpoxyComposite: Static and Fatigue Strength at Room and HighTemperatures and Practical Evaluation,’’ J. Compos. Mater.,41:2245!2265.
Sohn, H., Park, G., Wait, J.R., Limback, N.P. and Farrar, C.R. 2004.‘‘Wavelet-based Active Sensing for Delamination Detection inComposite Structures,’’ Smart Mater. Struct., 13:153!160.
Su, Z., Ye, L. and Lu, Y. 2006. ‘‘Guided Lamb Waves forIdentification of Damage in Composite Structures: A Review,’’J. Sound Vib., 295:753!780.
Tang, H.-Y., Winkelmann, C., La Saponara, V. and Lestari, W. 2008.‘‘Embedded Sensors for Composite Structural HealthMonitoring’’, In: Proceedings of the International SAMPESymposium and Exhibition, Long Beach, CA.
Tari, L., Baral, C. and Kim, S. 2009. ‘‘Fuzzy c-means Clustering withPrior Biological Knowledge,’’ J. Biomed. Inf., 42:74!81.
Todorovska, M.I. and Trifunac, M.D. 2007. ‘‘Earthquake DamageDetection in the Imperial County Services Building I: The Dataand Time-Frequency Analysis,’’ Soil Dyn. Earthquake Eng.,27:564!576.
Torrence, C. and Compo, G.P. 1998. ‘‘A Practical Guide to WaveletAnalysis,’’ Bull. Am. Meterol. Soc., 79:61!78.
WaveLab 850, Developed by Professors of the Department ofStatistics of Stanford University and their collaborators.Available at: http://www-stat.stanford.edu/%wavelab/.
Wink, A.M. and Roerdink, J.B.T.M. 2004. ‘‘DenoisingFunctional MR Images: A Comparison of Wavelet Denoisingand Gaussian Smoothing,’’ IEEE Trans. Med. Imaging,23:374!387.
Wilcox, P.D., Lowe, M.J.S. and Cawley, P. 2001. ‘‘Mode andTransducer Selection for Long Range Lamb Wave Inspection,’’J. Intell. Mater. Syst. Struct., 12:553!565.
Winkelmann, C., Tang, H.-Y. and La Saponara, V. 2008. ‘‘Influenceof Embedded Structural Health Monitoring Sensors on theMechanical Performance of Glass/Epoxy Composites’’, In:Proceedings of the International SAMPE Symposium andExhibition, Long Beach, CA.
Yoon, D.-J., Weiss, W.J. and Shah, S.P. 2000. ‘‘Assessing Damage inCorroded Reinforced Concrete Using Acoustic Emission,’’ASCE J. Eng. Mech., 126:273!283.
Zhang, G.-M., Harvey, D.M. and Braden, D.R. 2008. ‘‘SignalDenoising and Ultrasonic Flaw Detection Via Overcompleteand Spare Representations,’’ J. Acoust. Soc. Am.,124:2963!2972.
Zhao, W., Sankaran, S., Ibanez, A.M., Dandekar, A.M. and Davis,C.E. 2009. ‘‘Two-dimensional Wavelet Analysis BasedClassification of Gas Chromatogram Differential MobilitySpectrometry Signals,’’ Anal. Chim. Acta, 647:46!53.
Composite Structural Health Monitoring 755
at UNIV CALIFORNIA DAVIS on July 21, 2011jim.sagepub.comDownloaded from