Performance engineering: Understanding and improving the performance of large-scale codes
10
eScholarship provides open access, scholarly publishing services to the University of California and delivers a dynamic research platform to scholars worldwide. Lawrence Berkeley National Laboratory Lawrence Berkeley National Laboratory Peer Reviewed Title: Performance Engineering: Understanding and Improving the Performance of Large-Scale Codes Author: Bailey, David H. Lucas, Robert Hovland, Paul Norris, Boyana Yelick, Kathy Gunter, Dan de Supinski, Bronis Quinlan, Dan Worley, Pat Vetter, Jeff Roth, Phil Mellor-Crummey, John Snavely, Allan Hollingsworth, Jeff Reed, Dan Fowler, Rob Zhang, Ying Hall, Mary Chame, Jacque Dongarra, Jack Moore, Shirley Publication Date: 06-13-2008 Publication Info: Lawrence Berkeley National Laboratory Permalink: http://escholarship.org/uc/item/5w37095v Keywords: parallel computing performance
Transcript of Performance engineering: Understanding and improving the performance of large-scale codes
eScholarship provides open access, scholarly publishingservices to the University of California and delivers a dynamicresearch platform to scholars worldwide.
Lawrence Berkeley National LaboratoryLawrence Berkeley National Laboratory
Peer Reviewed
Title:Performance Engineering: Understanding and Improving the Performance of Large-Scale Codes
Author:Bailey, David H.Lucas, RobertHovland, PaulNorris, BoyanaYelick, KathyGunter, Dande Supinski, BronisQuinlan, DanWorley, PatVetter, JeffRoth, PhilMellor-Crummey, JohnSnavely, AllanHollingsworth, JeffReed, DanFowler, RobZhang, YingHall, MaryChame, JacqueDongarra, JackMoore, Shirley
Publication Date:06-13-2008
Publication Info:Lawrence Berkeley National Laboratory
Permalink:http://escholarship.org/uc/item/5w37095v
Keywords:parallel computing performance
Performance Engineering: Understanding and Improving the Performance of Large-Scale Codes
David H. Bailey1, Robert Lucas2, and a host of others3
26 September 2007
Abstract Achieving good performance on high-end computing systems is growing ever more challenging due to enormous scale, increasing architectural complexity, and increasing application complex-ity. To address these challenges in DOE’s SciDAC-2 program [1], the Performance Engineering Research Institute (PERI) has embarked on an ambitious research plan encompassing perform-ance modeling and prediction, automatic performance optimization and performance engineering of high profile applications. The principal new component is a research activity in automatic tun-ing software, which is spurred by the strong user preference for automatic tools.
1. Introduction Understanding and enhancing the performance of large-scale scientific programs is a crucial component of the high-performance computing world. This is due not only to the increasing processor count, architectural complexity and application complexity that we face, but also due to the sheer cost of these systems. A quick calculation shows that if one can increase by just 30% the performance of two of the major SciDAC applications codes (which together use say 10% of the NERSC and ORNL high-end systems over three years), this represents a savings of some $6 million.
Within just five years, systems with one million processors are expected, which poses a chal-lenge not only to application developers but also to those engaged in performance tuning. Earlier research and development by us and others in the performance research area focused on the memory wall – the rising disparity between processor speed and memory latency. Now the emerging multi-core commodity microprocessor designs, with many processors on a single chip and large shared caches, create even greater penalties for off-chip memory accesses and further increase optimization complexity. With the release of systems such as the Cray X1, custom vec-tor processing systems have re-emerged in U.S. markets. Other emerging designs include single- 1 Lawrence Berkeley National Laboratory, Berkeley, CA 94720, [email protected]. Supported in part by the Direc-tor, Office of Computational and Technology Research, Division of Mathematical, Information, and Computational Sciences of the U.S. Department of Energy, under contract number DE-AC02-05CH11231. 2 University of Southern California, Information Sciences Institute, Marina Del Rey, CA 90077, [email protected]. Supported in part by the Director, Office of Computational and Technology Research, Division of Mathematical, Information, and Computational Sciences of the U.S. Department of Energy, under contract number DE-AC02-05CH11231. 3 Argonne National Laboratory Paul Hovland and Boyana Norris Lawrence Berkeley National Laboratory Kathy Yelick, and Dan Gunter Lawrence Livermore National Laboratory Bronis de Supinski and Dan Quinlan Oak Ridge National Laboratory Pat Worley, Jeff Vetter, and Phil Roth Rice University John Mellor-Crummey University of California at San Diego Allan Snavely University of Maryland Jeff Hollingsworth University of North Carolina Dan Reed, Rob Fowler, and Ying Zhang University of Southern California Mary Hall, and Jacque Chame University of Tennessee at Knoxville Jack Dongarra and Shirley Moore
- 1 of 9 -
instruction multiple-data (SIMD) extensions, field-programmable gate arrays (FPGAs), graphics processors and the Sony-Toshiba-IBM Cell processor. Understanding the performance implica-tions for such diverse architectures is a daunting task.
In concert with the growing scale and complexity of systems is the growing scale and complexity of the scientific applications themselves. Applications are increasingly multilingual, with source code and libraries created using a blend of Fortran 77, Fortran-90, C, C++, Java, and even inter-preted languages such as Python. Large applications typically have rather complex build proc-esses, involving code preprocessors, macros and make files. Effective performance analysis methodologies must deal seamlessly with such structures. Applications can be large, often ex-ceeding one million lines of code. Optimizations may be required at many locations in the code, and seeming local changes can affect global data structures. Applications are often componen-tized and performance can depend significantly on the context in which the components are used. Finally, applications increasingly involve advanced features such as adaptive mesh refinement, data intensive operations and multi-scale, multi-physics and multi-method computations.
The PERI project emphasizes three aspects of performance tuning for high-end systems and the complex SciDAC applications that run on them: (1) performance modeling of applications and systems; (2) automatic performance tuning; and (3) application engagement and tuning. The next section discusses the modeling activities we are undertaking both to understand the performance of applications better as well as to be able to determine what are reasonable bounds on expected performance. Section 3 presents the PERI vision for how we are creating an automatic perform-ance tuning capability, which ideally will alleviate scientific programmers of this burden. Automating performance tuning is a long-term research project, and the SciDAC program has scientific objectives that cannot await its outcome. Thus, as Section 4 discusses, we are engag-ing with DOE computational scientists to address today’s most pressing performance problems. Finally, Section 5 summarizes the current state of the PERI SciDAC-2 project.
2. Performance Modeling and Prediction The goal of performance modeling is to understand the performance of an application on a com-puter system via measurement and analysis. This information can be used for a variety of tasks: evaluating architectural tradeoffs early in the system design cycle, validating performance of a new system installation, guiding algorithm choice when developing a new application, improv-ing optimization of applications on specific platforms, and guiding the application of techniques for automated tuning and optimization [2]. Modeling is now an integral part of many high-end system procurements [3], thus making performance research useful beyond the confines of per-formance tuning. For performance engineering, modeling analyses (when coupled with empiri-cal data) can inform us when tuning is needed, and just as importantly, when we are done. Natu-rally, if they are to support automatic performance tuning, then the models themselves must be automatically generated.
Traditional performance modeling and prediction has been done via some combination of three methods: (1) analytical modeling; (2) statistical modeling derived from measurement; and (3) simulation. In the earlier SciDAC-1 Performance Evaluation Research Center (PERC), research-ers developed a semi-automatic yet accurate methodology based on application signatures, ma-chine profiles and convolutions. These methodologies allow us to predict performance to within reasonable tolerances for an important set of applications on traditional clusters of SMPs for spe-cific inputs and processor counts.
- 2 of 9 -
PERI is extending these techniques not only to account for the effects of emerging architectures but also to model scaling of input and processor counts. It has been shown that modeling the response of a system’s memory hierarchy to an application’s workload is crucial for accurately predicting its performance on today’s systems with deep their memory hierarchies. The current state-of-the-art works well for weak scaling (i.e., increasing the processor count proportionally with input). PERI is developing advanced schemes for modeling application performance, such as by using neural networks [4]. We are also exploring variations of existing techniques and pa-rameterized statistical models built from empirical observations to predict application scaling. We are also pursuing methods for automated extrapolation of scaling models, as a function of increasing processor count, while holding the input constant [5]. One of our goals is to provide the ability to reliably forecast the performance of a code on a machine size that has not yet been built.
Within PERI we are also extending our framework to model communication performance as a function of the type, size, and frequency of application messages, and the characteristics of the interconnect. Several parallel communication models have been developed that predict perform-ance of message-passing operations based on system parameters [6] [7] [8]. Assessing the parame-ters for these models within local area networks is relatively straightforward and the methods to approximate them have already been established and are well understood [8] [9]. Our models, which are similar to PlogP, capture the effects of network bandwidth and latency; however, a more robust model must also account for noise, contention and concurrency limits. We are de-veloping performance models directly from observed characteristics of applications on existing architectures. Predictions from such models can serve as the basis to optimize collective MPI operations [10], and permit us to predict network performance in a very general way. This work will require us to develop a new open-source network simulator to analyze communication per-formance.
Finally, we will reduce the time needed to develop models, since automated tuning requires on-the-fly model modification. For example, a compiler, or application, may propose a code change in response to a performance observation and need an immediate forecast of the performance impact of the change. Dynamic tracing, the foundation of current modeling methods, requires running existing codes and can be quite time consuming. Static analysis of binary executables can make trace acquisition much faster by limiting it to only those features that are not known before execution. User annotations [11] can broaden the reach of modeling by specifying at a high level the expected characteristics of code fragments. Application phase modeling can re-duce the amount of data required to form models. We are exploring less expensive techniques to identify dynamic phases through statistical sampling and time-series cluster analysis. For on-the-fly observation, we are using DynInst to attach to a running application, slow it down mo-mentarily to measure something, then detach [12]. In PERI we will advance automated, rapid, machine-independent model formation to push the efficacy of performance modeling down into lower levels of the application and architecture lifecycle.
3. Automatic Performance Tuning In discussions with application scientists it is clear that users want to focus on their science, and not be burdened with optimizing their code’s performance. Thus, the ideal performance tool ana-lyzes and optimizes performance without human intervention, a long-term vision that we term automatic performance tuning. This vision encompasses tools that analyze a scientific applica-
- 3 of 9 -
tion, both as source code and during execution, generate a space of tuning options, and search for a near-optimal performance solution. There are numerous daunting challenges to realizing the vision, including enhancement of automatic code manipulation tools, automatic run-time pa-rameter selection, automatic communication optimization, and intelligent heuristics to control the combinatorial explosion of tuning possibilities. On the other hand, we are encouraged by recent successful results such as ATLAS, which has automatically tuned components of the LAPACK linear algebra library [13]. We are also studying techniques used in the highly successful FFTW library [14] and several other related projects [15] [16] [17]. The PERI strategy for automatic per-formance tuning is presented in greater detail in this section of this paper.
Figure 1 illustrates the automated performance tuning process and integration we are pursuing in PERI. We are attempting to integrate performance measurement and modeling techniques with code transformations to create an automated tuning process for optimizing complex codes on large-scale architectures. The result will be an integrated compile-time and run-time optimization methodology that can reduce dependence on human experts and automate key aspects of code optimization. The color and shape code in Figure 1 indicates the processes associated with the automation of empirical tuning on either libraries or whole applications. Blue rectangles indicate specific tools or parts of tools to support automated empirical tuning. Yellow ovals indicate ac-tivities that are part of a code that is using automatic tuning at run-time. Green hexagons indi-cate information may be supplied to guide the optimization selection during empirical tuning. The large green hexagon lists the type of information that may be used.
As shown in Figure 1, the main input to the automatic tuning process is the application source code. In addition, there may also be external code (e.g., libraries), ancillary information such as performance models or annotations, sample input data and historical data from previous execu-tions and analyses. With these inputs, we anticipate that the automatic tuning process involves the following steps:
• Triage. This step involves performance measurement, analysis and modeling to determine whether an application has opportunities for optimization.
• Semantic analysis. This step involves analysis of program semantics to support safe trans-formation of the source code, including traditional compiler analyses to determine data and control dependencies. Here we can also exploit semantic information provided by the user.
• Transformation. Transformations include traditional optimizations such as loop optimizations and in-lining, as well as more aggressive data structure reorganizations and domain-specific optimizations. Tiling transformations may be parameterized to allow for input size and ma-chine characteristic tuning. Unlike traditional compiler transformations, we allow user input.
• Code generation. The code generation phase produces a set of possible implementations to be considered. Code generation may either come from general transformations to source code in an application or from a domain-specific tool that produces a set of implementations for a given computation, as is the case with the ATLAS BLAS generator.
• Offline search. This phase evaluates the generated code to select the “best” version. Offline search entails running the generated code and searching for the best-performing implementa-tion. The search process may be constrained by guidance from a performance model or user input. By viewing these constraints as guidance, we allow the extremes of pure search-based, model-based, or user-directed, as well as arbitrary combinations.
• Application assembly. At this point, the components of optimized code are integrated to pro-duce an executable code, including possible instrumentation and support for dynamic tuning.
- 4 of 9 -
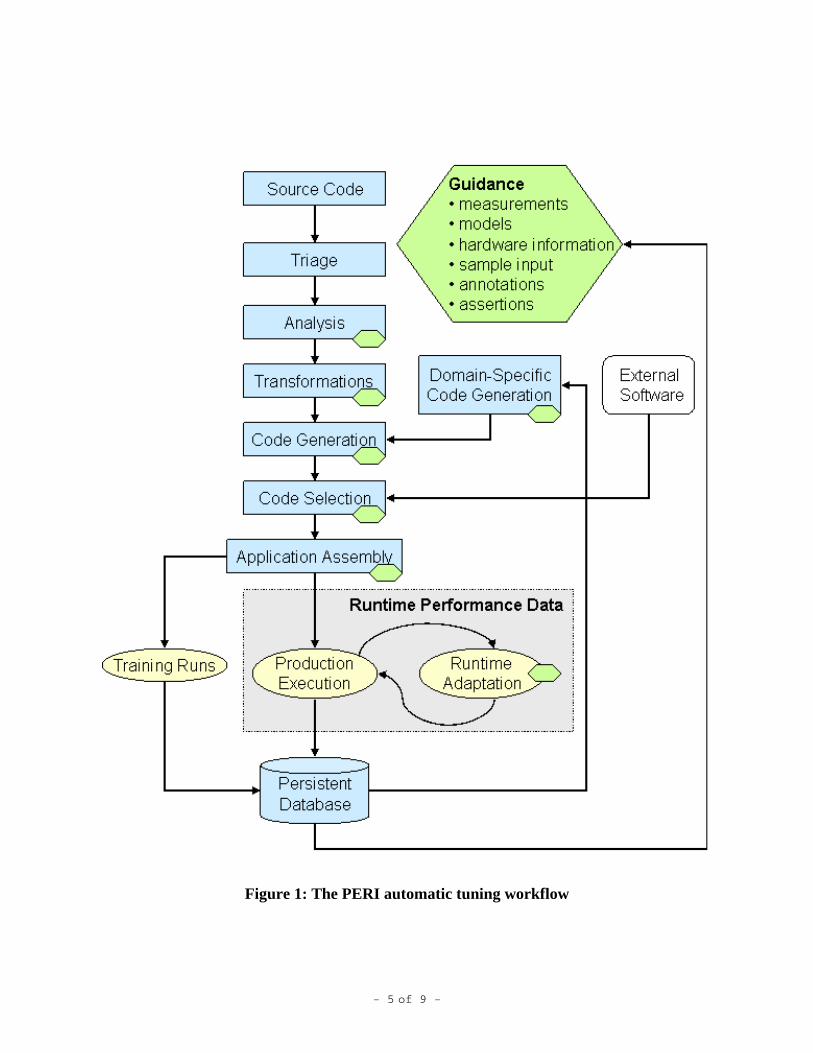
Figure 1: The PERI automatic tuning workflow
- 5 of 9 -
• Training runs. Training runs involve a separate execution step designed mainly to produce performance data for feedback into the optimization process. This step may be used prior to a large run to have the code well-tuned for a particular input set.
• Online adaptation. Finally, optimizations may occur during production runs, especially for problems or machines whose optimal configuration changes during the execution.
Automatic tuning of a particular application need not involve all of these steps. Furthermore, there will likely not be a single automatic tuning tool, but rather of suite of interacting tools which are themselves research projects.
A key part of the automatic tuning process is the maintenance of a persistent store of perform-ance information from both training and production runs. Of particular concern are changes in the behavior of production codes over time. Such changes can be symptomatic of changes in the hardware, of the versions and configuration of system software, of changes to the application, or of changes to problems being solved. Regardless of the source, such changes require analysis and remediation. The problem of maintaining persistent performance data is recognized across the HPC community. PERI therefore formed a Performance Database Working Group, which involves PERI researchers as well as colleagues at the University of Oregon, Portland State Uni-versity, and Texas A&M University. The group has developed technology for storing perform-ance data collected by a number of performance measurement and analysis tools, including TAU, PerfTrack, Prophesy, and SvPablo. The PERI Database system provides web interfaces that link to the performance data and analysis tools in each tool's home database.
4. Application Engagement The key long-term research objective of PERI is to automate as much of the performance tuning process as possible. Ideally in five years we will produce a prototype of the kind of system that will free scientific programmers from the burden of tuning their codes, especially when simply porting from one system to another. While this may offer today’s scientific programmers hope for a brighter future, it does little to help with the immediate problems they face as they try ready their codes for Petascale. PERI has therefore created a third activity that we are calling applica-tion engagement wherein PERI researchers will bring their tools and skills to bear in order both to help DOE meet its performance objectives as well as to ground our own research in practical experience. This section discusses the current status of our application engagement activities. PERI has a two-pronged application engagement strategy. Our first strategy is establishing long term liaison relationships with many of the application teams. PERI liaisons who work with ap-plication teams without significant, immediate performance optimization needs provide these application teams with advice on how to collect performance data and track performance evolu-tion, and ensure that PERI becomes aware of any changes in these needs. For application teams with immediate performance needs, the PERI liaison works actively with the team to help them meet their needs, utilizing other PERI personnel as needed. The status of a PERI liaison activity, passive or active, changes over time as the performance needs of the application teams change. As of June 2007, PERI is working actively with six application teams and passively with ten oth-ers. The nature of each interaction is specific to each application team. The other primary PERI application engagement strategy is tiger teams. A tiger team works di-rectly with application teams with immediate, high-profile performance requirements. Our tiger
- 6 of 9 -
teams, consisting of several PERI researchers, strive to improve application performance by ap-plying the full range of PERI capabilities, including not only performance modeling and auto-mated tuning research but also in-depth familiarity with today’s state-of-the-art performance analysis tools. Tiger team assignments are of a relatively short duration, lasting between six and twelve months. As of June 2007, PERI tiger teams are working with two application codes that will be part of the 2007 JOULE report: S3D [18] and GTC_s [19]. We have already identified sig-nificant opportunities for performance improvements for both applications. Current work is fo-cused on providing these improvements through automated tools that support the continuing code evolution required by the JOULE criteria.
5. Summary The Performance Engineering Research Institute was created to focus on the increasingly diffi-cult problem of achieving high scientific throughput on large-scale computing systems. These performance challenges arise not only from the scale and complexity of leadership class com-puters, but also from the increasing sophistication of today’s scientific software. Experience has shown that scientists want to focus there programming efforts on discovery and do not want to be burdened by the need to constantly refine their codes to maximize performance. Performance tools that they can use themselves are not embraced, but rather viewed as a necessary evil.
To alleviate scientists from the burden of performance tuning, PERI has embarked on a research program addressing three different aspects of performance tuning: performance modeling of ap-plications and systems; automatic performance tuning; and application engagement and tuning. Our application engagement activities are intended to both help scientists address today’s per-formance related problems. We hope that our automatic performance tuning research will lead to technology that in the future will significantly reduce this burden. Performance modeling in-forms both of these activities.
While PERI is a new project, as are all SciDAC-2 efforts, it builds on five years of SciDAC-1 research and decades of prior art. We believe that PARI is off to a good start, and that its inves-tigators have already made contributions to SciDAC-2 and to DOE’s 2007 Joule codes. We con-fidently look forward to an era of Petascale computing in which scientific codes migrate amongst a variety of leadership class computing systems without their developers being overly burdened by the need to continually refine them so as to achieve acceptable levels of throughput.
6. Bibliography [1] DOE SciDAC Program – www.scidac.gov [2] D.H. Bailey and A. Snavely, “Performance Modeling: Understanding the Present and Predict-ing the Future” , EuroPar 2005 , September 2005, Lisbon. [3] A. Hoisie, O. Lubeck and H. Wasserman, “Performance and Scalability Analysis of Teraflop-Scale Parallel Architectures Using Multidimensional Wavefront Applications,” International Journal of High Performance Computing Applications, vol. 14 (2000), no. 4, pg 330-346. [4] E. Ipek, B.R. de Supinski, M. Schulz and S.A. McKee, “An Approach to Performance Predic-tion for Parallel Applications,” Euro-Par 2005, Lisbon, Portugal, Sept. 2005.
- 7 of 9 -
[5] J. Weinberg, M. O. MCracken, A. Snavely, E. Strohmaier, “Quantifying Locality In The Memory Access Patterns of HPC Applications,” Proceedings of SC2005, Seattle, WA, Nov. 2005. [6] David Culler, Richard Karp, David Patterson, Abhijit Sahay, Klaus Erik Schauser, Eunice San-tos, Ramesh Subramonian, and Thorsten von Eicken, “LogP: Towards a Realistic Model of Par-allel Computation,” Proceedings of the Fourth ACM SIGPLAN Symposium on Principles and Practice of Parallel Programming, ACM Press, 1993, pg. 1-12. [7] Albert Alexandrov, Mihai F. Ionescu, Klaus E. Schauser, and Chris Scheiman. LogGP: Incor-porating long messages into the LogP model. In Proceedings of the 7th annual ACM Sympo-sium on Parallel Algorithms and Architectures, ACM Press, 1995, pg. 95-105. [8] T. Kielmann, H.E. Bal, and K. Verstoep, “Fast Measurement of LogP Parameters for Message Passing Platforms,” in Jose D.P. Rolim, editor, IPDPS Workshops, volume 1800 of Lecture Notes in Computer Science, pp. 1176-1183, Cancun, Mexico, May 2000. Springer-Verlag. [9] D. Culler, L.T. Lui, R.P. Martin, and C. Yoshikawa. “Assessing Fast Network Interfaces.” IEEE Micro, vol. 16 (1996), pg. 35-43. [10] J. Pjesivac-Grbovic, T. Angskun, G. Bosilca, G. Fagg, E. Gabriel, J. Dongarra, “Performance Analysis of MPI Collective Operations,” 4th International Workshop on Performance Modeling, Evaluation, and OptmizationOptimization of Parallel and Distributed Systems (PMEO-PDS 2005) Denver, CO, Apr. 2005. [11] S.R. Alam and J.S. Vetter, “A Framework to Develop Symbolic Performance Models of Par-allel Applications,” Proc. 5th International Workshop on Performance Modeling, Evaluation, and Optimization of Parallel and Distributed Systems (PMEO-PDS 2006), 2006. [12] B. R. Buck and J. K. Hollingsworth, “An API for Runtime Code Patching,” Journal of High Performance Computing Applications, vol. 14 (2000) no. 4. [13] C. Whaley, A. Petitet and J. Dongarra, “Automated Empirical Optimizations of Software and the ATLAS Project,” Parallel Computing, vol. 27 (2001), no. 1, pg. 3-25. [14] M. Frigo and S. Johnson, “FFTW: An Adaptive Software Architecture for the FFT,” Proceed-ings of the International Conference on Acoustics, Speech, and Signal Processing, Seattle, Wash-ington, May 1998. [15] J. Bilmes and K. Asanovic and C.W. Chin and J. Demmel, “Optimizing Matrix Multiply using PHiPAC: a Portable, High-Performance, ANSI C Coding Methodology,” Proceedings of the In-ternational Conference on Supercomputing, Vienna, Austria, ACM SIGARCH, July 1997. [16] R. Vuduc, J. Demmel, K. Yelick, “OSKI: A Library of Automatically Tuned sparse Matrix Kernels, “ Proceedings of SciDAC 2005, Journal of Physics: Conference Series, June 2005.
- 8 of 9 -
[17] C. Chen, J. Chame and M. Hall, “Combining Models and Guided Empirical Search to Opti-mize for Multiple Levels of the Memory Hierarchy,” Proceedings of the Conference on Code Generation and Optimization, March, 2005. [18] T. Echekki and J. H. Chen, "DNS of Autoignition in Nonhomogeneous Hydrogen-Air Mix-tures," Combust. Flame 134: 169-191 (2003). [19] Z. Lin, T. S. Hahm, W. W. Lee, W. M. Tang, and R. B. White, “Turbulent Transport Reduc-tion by Zonal Flows: Massively Parallel Simulations”, Science, 281 (1998), pg. 1835-1837
- 9 of 9 -