IMPROVING PERFORMANCE IN FIRST YEAR CHEMISTRY ...
279
IMPROVING PERFORMANCE IN FIRST YEAR CHEMISTRY by KENT ALAN CHAMBERS, B.S., M.S. A DISSERTATION IN CHEMISTRY Submitted to the Graduate Faculty of Texas Tech University in Partial Fulfillment of the Requirements for the Degree of DOCTOR OF PHILOSOPHY Approved Bob Blake Chairperson of the Committee Dominick Casadonte William Poirier Accepted John Borrelli Dean of the Graduate School AUGUST, 2005
-
Upload
khangminh22 -
Category
Documents
-
view
2 -
download
0
Transcript of IMPROVING PERFORMANCE IN FIRST YEAR CHEMISTRY ...

IMPROVING PERFORMANCE IN
FIRST YEAR CHEMISTRY
by
KENT ALAN CHAMBERS, B.S., M.S.
A DISSERTATION
IN
CHEMISTRY
Submitted to the Graduate Faculty of Texas Tech University in
Partial Fulfillment of the Requirements for
the Degree of
DOCTOR OF PHILOSOPHY
Approved
Bob Blake Chairperson of the Committee
Dominick Casadonte
William Poirier
Accepted
John Borrelli Dean of the Graduate School
AUGUST, 2005

Copyright 2005, Kent Alan Chambers

TABLE OF CONTENTS
ACKNOWLEDGMENTS iv
ABSTRACT v
LIST OF TABLES vii
LIST OF FIGURES xiii
CHAPTER
I. INTRODUCTION 1
1.1 An Overview of the Project 1
1.2 Works Cited 7
II. PREDICTING STUDENT SUCCESS IN 8 GENERAL CHEMISTRY
2.1 Introduction 8
2.2 Discussion 11
2.3 Conclusions 29
2.4 Works Cited 31
III. THE EFFECT OF DISCUSSION SECTIONS ON STUDENT 33 PERFORMANCE IN INTRODUCTORY CHEMISTRY
3.1 Introduction and Background 33
3.1.1 The Need for Introductory Chemistry 33
3.1.2 The Effect of Introductory Chemistry 34
3.1.3 The Evolution of Introductory Chemistry 39 at Texas Tech University
3.1.4 The Historical Effects of Introductory Chemistry 39
3.2 Increasing Student Performance in Introductory 43 Chemistry
3.2.1 Discussion Section Type 1: 45 Peer Led Team Learning
3.2.2 Discussion Section Type 2: 53 Practice Exam Groups
3.2.3 Discussion Section Type 3: 54 LearnStar
i

3.4 Experimental Design 57
3.5 Results: Student Performance in Introductory Chemistry 60
3.5.1 Results for Practice Exam Sections 60
3.5.2 Results for Peer Led Team Learning Sections 63
3.5.3 Results for LearnStar Sections 66
3.5.4 Comparison Between Discussion Section 70 Group Types in Introductory Chemistry
3.5.5 Summary of Student Performance in 72 Introductory Chemistry
3.6 Participation in Discussion Sections 72
3.7 Post Test Removal of Intervention 74
3.8 Conclusions 76
3.9 Works Cited 77
IV. THE LONGITUDINAL EFFECTS OF DISCUSSION SECTIONS 79 ON STUDENT PERFORMANCE IN GENERAL CHEMISTRY
4.1 Introduction 79
4.2 Experimental Design 80
4.3 Results 84
4.3.1 Student Performance in General Chemistry 84
4.3.2 Comparisons between Discussion Sections 87 and the Spring 2001 Control Group
4.3.3 Comparisons between Discussion Sections 93 and the Spring 2004 Control Group
4.3.4 Comparisons Between Discussion Group Types 102 in General Chemistry
4.4 Conclusion 104
4.5 Works Cited 107
V. PARTICIPATION IS PERFORMANCE 108
5.1 Introduction 108
5.2 Background and Rationale 112
5.3 The Initial Project 113
ii

5.3.1 Research Methods for the Initial Project 113
5.3.2 Initial Results 114
5.3.3 Discussion 116
5.3.4 Conclusions of the Initial Project 117
5.4 The Expanded Project 119
5.4.1 Overview 119
5.4.2 Results and Discussion 120
5.5 Conclusion 126
5.6 Works Cited 127
VI. ENHANCING STUDENT PERFORMANCE IN FIRST SEMESTER 129 GENERAL CHEMISTRY USING THE WORLD WIDE WEB
6.1 Introduction 129
6.2 Experimental 132
6.2.1 Use and Administration of the JiTT Questions 134
6.2.2 An Example of the JiTT Process 135
6.3 The Effects of JiTT on First Semester General Chemistry 143
6.4 Conclusion 144
6.5 Works Cited 146
VII. CONCLUSION 148
APPENDIX 152
A. Glossary 152 B. Student Leader Training Materials 154 For Discussion Sections
C. Sample Peer Led Team Learning Units 178 From Discussion Sections
D. Sample Practice Exam Exercises From 201 Discussion Sections
E. Sample Learn Star Competitions 207 From Discussion Sections
F. Statistical Analysis 217
iii

ACKNOWLEDGEMENTS
I would like to thank Dr. Bob Blake for his guidance and help over the last four
years. Bob has been a great research mentor and a good friend. I would also like to
thank the rest of my committee, Drs. Dominick Casadonte and Bill Poirier for their
flexibility and support during this project. Large portions of the JiTT project would not
have been possible without the excellent technical support provided by Dr. Ed Anderson
and Michael Horton in the TLTC. Funding for these projects came from a number of
sources including: The National Science Foundation (LearnStar and JiTT), The Office of
the Provost, The Office of Student Services, The Texas Higher Education Coordinating
Board and The Texas Education Association.
I would also like to thank Holly Morrell for her statistical insights; Jud Thorn and
all of the student leaders that made the discussion sections possible; Dr. Greg Gellene for
his in-depth historical research that laid a foundation for much of this work; and Drs.
Andrew Gavern and Gregor Novak for the original JiTT development.
I would like to recognize Drs. Chris McNair and Michelle Dose my dean and
department head from Hardin - Simmons University and thank them for being so flexible
and understanding over the past four years as I worked on my Ph.D. Finally, I would
like to thank my parents for all of their support, my lovely wife Lynnette and my
Heavenly Father for the faith and endurance to persevere even when I thought this would
never end. Thank you all and God bless you.
iv

ABSTRACT
General Chemistry is a degree requirement for over thirty different baccalaureate
degrees offered by Texas Tech University. Historical success rates for this course have
been low, with overall attrition rates as high as 70% in some years. Students are placed
into either General Chemistry or Introductory Chemistry based on their performance on a
chemistry placement exam.
This dissertation contains in-depth studies on improving student performance and
reducing attrition in both Introductory and General Chemistry classes. There is a high
statistical correlation between student performance in Introductory Chemistry and student
performance in General Chemistry in the following semester. Since 70-80% of the
students are placed into Introductory Chemistry, it was postulated that by improving
student performance in Introductory Chemistry, the student performance in General
Chemistry would be significantly improved.
Three different methods of improving student performance in Introductory
Chemistry are discussed. The impact of these three methods upon student performance
and attrition rates in Introductory Chemistry are evaluated in detail, as are their
longitudinal effects on student performance in General Chemistry in the following
semester. It was determined that all three methods significantly improved student
performance and reduced attrition rates in Introductory Chemistry. It was also found that
all three methods significantly increased student performance and decreased attrition
rates longitudinally in General Chemistry.
v

The relationship between student participation in classroom activities and student
performance in General Chemistry was evaluated. This study showed that a significant
percentage of the variance in final course grade was explained by student participation
and attendance. Both student participation and attendance were determined to be good
predictors of student success in General Chemistry
Finally, a study using Just in Time Teaching (JiTT) techniques in General
Chemistry was performed. This pedagogical approach and its effect on student
performance and attrition is discussed. The class involved in the JiTT program was
found to have significantly improved student performance and significantly reduced
attrition rates in General Chemistry.
In conclusion, this dissertation presents and discusses several studies focused on
improving student performance and decreasing attrition rates in the first year chemistry
curriculum at Texas Tech University.
vi

LIST OF TABLES
1.1 Average Attrition Rates for Beginning Chemistry Fall 1999 – Fall 2001 3 2.1 Attrition Data for the 2000 – 2001 Academic Year 18 2.2 Correlations Between Predictors and Student Performance in 21 General Chemistry 2.3 Relationship Between High School Chemistry Performance and 25 Success in General Chemistry 2.4 Correspondence Between ACT Math and SAT Math Scores 27 2.5 Accuracy of Student Performance Predictors 28 2.6 Relationship Between Introductory Chemistry Performance and 28 Success in General Chemistry 3.1 The Longitudinal Relationship Between Grade Distributions in 36 Introductory Chemistry and General Chemistry 3.2 Problem Development Approaches used in Peer Led Team 51 Learning Exercises 3.3 Normal Competition Format For LearnStar 56 3.4 Class Distributions for Introductory Chemistry Fall 2003 58 3.5 Areas of Evaluation for Discussion Sections with Respect 61 to Introductory Chemistry 3.6 Summary of Results for Practice Exam Sections Effect on 64 Performance in Introductory Chemistry 3.7 Summary of Results for Peer Led Team Learning Sections 67 Effect on Performance in Introductory Chemistry 3.8 Summary of Results for LearnStar Sections Effect on 69 Performance in Introductory Chemistry 3.9 ANOVA Analysis of Student Participation Levels in 73 Discussion Sections by Discussion Section Type
vii

3.10 Comparisons of DFW Rates in Introductory Chemistry by 75 Discussion Section Type versus Pre and Post Control Groups. (Z – Test for Ratios) 3.11 Comparisons of Student Performance in Introductory Chemistry 75 by Discussion Section versus Pre and Post Control Groups 4.1 Areas of Evaluation for Discussion Sections with Respect to 81 General Chemistry: 4.2 Class Distributions for General Chemistry Spring 2004 83 4.3 Hypothetical DFW rates with Uniform Cutoff Score of 65% for a C 86 4.4 Summary of Results for Practice Exam Sections versus 89 Spring 2001 Control Group in General Chemistry 4.5 Summary of Results for Peer Led Team Learning Sections 90 versus Spring 2001 Control Group in General Chemistry 4.6 Summary of Results for LearnStar Sections versus Spring 2001 92 Control Group in General Chemistry 4.7 ANOVA Analysis of Significant Differences in Overall Class 94 Performance by Lecture Section in General Chemistry Spring 2004 4.8 Summary of Results for Practice Exam Sections versus 97 Spring 2004 Control Group in General Chemistry 4.9 Summary of Results for Peer Led Team Learning Sections 99 versus Spring 2004 Control Group in General Chemistry 4.10 Summary of Results for LearnStar Sections versus Spring 2004 101 Control Group in General Chemistry 4.11 Exam Participation Data for General Chemistry Spring 2004 103 4.12 Student Performance in General Chemistry Spring 2004 105 with Spring 2001 and Spring 2004 Control Groups 5.1 Grade Distribution in General Chemistry by Number of 109 Missed Assignments
viii

5.2 Proportion of Variance (R2) in Course Grade Accounted 115 for by Three Multiple Linear Regression Models 5.3 Grading Criteria for General Chemistry Section 1 Fall 2002 118 5.4 Relative Importance of Predictors of Student Performance in General 118 Chemistry (Standard Regression Weights all Six Variables Included) 5.5 Correlation Between Student Performance and Course Grade in 122 Introductory Chemistry (Multiple Linear Regression) 5.6 Correlation Between Student Participation in Introductory 124 Chemistry and Longitudinal Performance in General Chemistry (Multiple Linear Regression) 5.7 Correlation Between Student Performance and Course Grade in 125 General Chemistry (Multiple Linear Regression) 6.1 Class Composition for the Experimental Group 133 6.2 Student Responses to the Warm-up Question: 137 Which of These is not a Base 6.3 Comparison of Student Performance versus Control Group 1 145 6.4 Comparison of Student Performance versus Control Group 2 145 F.1 Descriptive Statistics for Student Performance in Introductory 218 Chemistry by Discussion Section Type (Fall 2003) vs. Control (Fall 2000) F.2 Test of Homogeneity of Variances for Student Performance in 219 Introductory Chemistry by Discussion Section Type (Fall 2003) vs. Control (Fall 2000) F.3 ANOVA for Student Performance in Introductory Chemistry by 219 Discussion Section Type (Fall 2003) versus Control (Fall 2000) F.4 Post Hoc Tests for Student Performance in Introductory Chemistry 220 by Discussion Section Type (Fall 2003) versus Control (Fall 2000) LSD Multiple Comparisons
ix

F.5 Descriptive Statistics for Student Performance in Introductory 222 Chemistry by Lecture Section: Discussion Sections (Fall 2003) and Control Groups (Fall 2000) F.6 Test of Homogeneity of Variances for Student Performance in 223 Introductory Chemistry by Lecture Section: Discussion Sections (Fall 2003) and Control Groups (Fall 2000) F.7 ANOVA for Student Performance in Introductory Chemistry by 224 Lecture Section: Discussion Sections (Fall 2003) and Control Groups (Fall 2000) F.8 Post Hoc Tests for Student Performance in Introductory Chemistry 225 by Lecture Section: Discussion Sections (Fall 2003) and Control Groups (Fall 2000) LSD Multiple Comparisons F.9 Descriptive Statistics for Student Performance in General Chemistry 238 by Introductory Chemistry Discussion Section Type versus Spring 2001 Control Group F.10 Test of Homogeneity of Variances for Student Performance in 239 General Chemistry by Introductory Chemistry Discussion Section Type versus Spring 2001 Control Group F.11 ANOVA for Student Performance in General Chemistry by 239 Introductory Chemistry Discussion Section Type versus Spring 2001 Control Group F.12 Post Hoc Tests for Student Performance in General Chemistry 240 by Introductory Chemistry Discussion Section Type versus Spring 2001 Control Group LSD Multiple Comparisons F.13 Descriptive Statistics for Student Performance in General Chemistry 243 by Introductory Chemistry Discussion Section Type versus Student Performance by Students who had Passed the Chemistry Placement Exam Spring 2004 F.14 Test of Homogeneity of Variances for Student Performance in 244 General Chemistry by Introductory Chemistry Discussion Section Type versus Student Performance by Students who had Passed the Chemistry Placement Exam Spring 2004
x

F.15 ANOVA for Student Performance in General Chemistry by 244 Introductory Chemistry Discussion Section Type versus Student Performance by Students who had Passed the Chemistry Placement Exam Spring 2004 F.16 Post Hoc Tests for Student Performance in General Chemistry 245 by Introductory Chemistry Discussion Section Type versus Student Performance by Students who had Passed the Chemistry Placement Exam Spring 2004 LSD Multiple Comparisons F.17 Descriptive Statistics for Student Performance by Lecture Section in 248 General Chemistry F.18 Test of Homogeneity of Variances for Student Performance by 249 Lecture Section in General Chemistry F.19 ANOVA for Student Performance by Lecture Section in 249 General Chemistry F.20 Post Hoc Tests for Student Performance by Lecture Section in 250 General Chemistry LSD Multiple Comparisons F.21 Descriptive Statistics for Participation and Performance in 255 Introductory Chemistry F.22 Correlations for Participation and Performance in 255 Introductory Chemistry F.23 Model Summary for Participation and Performance in 255 Introductory Chemistry F.24 ANOVA for Participation and Performance in 256 Introductory Chemistry F.25 Coefficients for Participation and Performance in 256 Introductory Chemistry F.26 Descriptive Statistics for Participation and Performance in 257 Practice Exam Groups in Introductory Chemistry F.27 Correlations for Participation and Performance in 257 Practice Exam Groups in Introductory Chemistry
xi

F.28 Model Summary for Participation and Performance in 257 Practice Exam Groups in Introductory Chemistry F.29 ANOVA for Participation and Performance in 258 Practice Exam Groups in Introductory Chemistry F.30 Coefficients for Participation and Performance in 258 Practice Exam Groups in Introductory Chemistry F.31 Descriptive Statistics for Participation and Performance in 259 Peer Led Team Learning in Introductory Chemistry F.32 Correlations for Participation and Performance in 259 Peer Led Team Learning in Introductory Chemistry F.33 Model Summary for Participation and Performance in 259 Peer Led Team Learning in Introductory Chemistry F.34 ANOVA for Participation and Performance in Peer Led 260 Team Learning in Introductory Chemistry F.35 Coefficients for Participation and Performance in Peer Led 260 Team Learning in Introductory Chemistry F.36 Excluded Variables for Participation and Performance in 260 Peer Led Team Learning in Introductory Chemistry F.37 Descriptive Statistics for Participation and Performance in 261 LearnStar in Introductory Chemistry F.38 Correlations for Participation and Performance in 261 LearnStar in Introductory Chemistry F.39 Model Summary for Participation and Performance in 261 LearnStar in Introductory Chemistry F.40 ANOVA for Participation and Performance in 262 LearnStar in Introductory Chemistry F.41 Coefficients for Participation and Performance in 262 LearnStar in Introductory Chemistry
xii

LIST OF FIGURES
1.1 Percent Attrition of Beginning Chemistry Students Through the 3 First Semester of General Chemistry by Type Fall 1999 – Fall 2001 2.1 General Chemistry DFW rates Fall 1996 – Spring 2001 12 2.2 Percentage of Total Attrition Accounted for by Attrition Type for 14 Beginning Chemistry Students Historical Data 1996-2001 2.3 Introductory Chemistry versus General Chemistry Correlation 23 Scatter Plot 3.1 Correlation Scatter Plot: Introductory Chemistry Fall 2002 versus 36 General Chemistry Spring 2003 Correlation Scatter Plot 3.2 Grade Distribution in General Chemistry for Students that 37 Received an A in Introductory Chemistry 3.3 Grade Distribution in General Chemistry for Students that 37 Received a B in Introductory Chemistry 3.4 Grade Distribution in General Chemistry for Students that 38 Received a C in Introductory Chemistry 3.5 Grade Distribution in General Chemistry by Students’ Previous 38 Performance in Introductory Chemistry 3.6 Historical General Chemistry DFW Rates Fall 1996 – Fall 2001 41 3.7 Percentage of Total Attrition Accounted for by Attrition Type for 41 Beginning Chemistry Students Fall 1996 – Fall 2001 3.8 Advancement of Introductory Chemistry Students into General 44 Chemistry by Student Performance in Introductory Chemistry 3.9 Student Performance in Introductory Chemistry: 62 Practice Exam Sections versus Control 3.10 DFW and Attrition Rates in Introductory Chemistry: 62 Practice Exam Sections versus Control
xiii
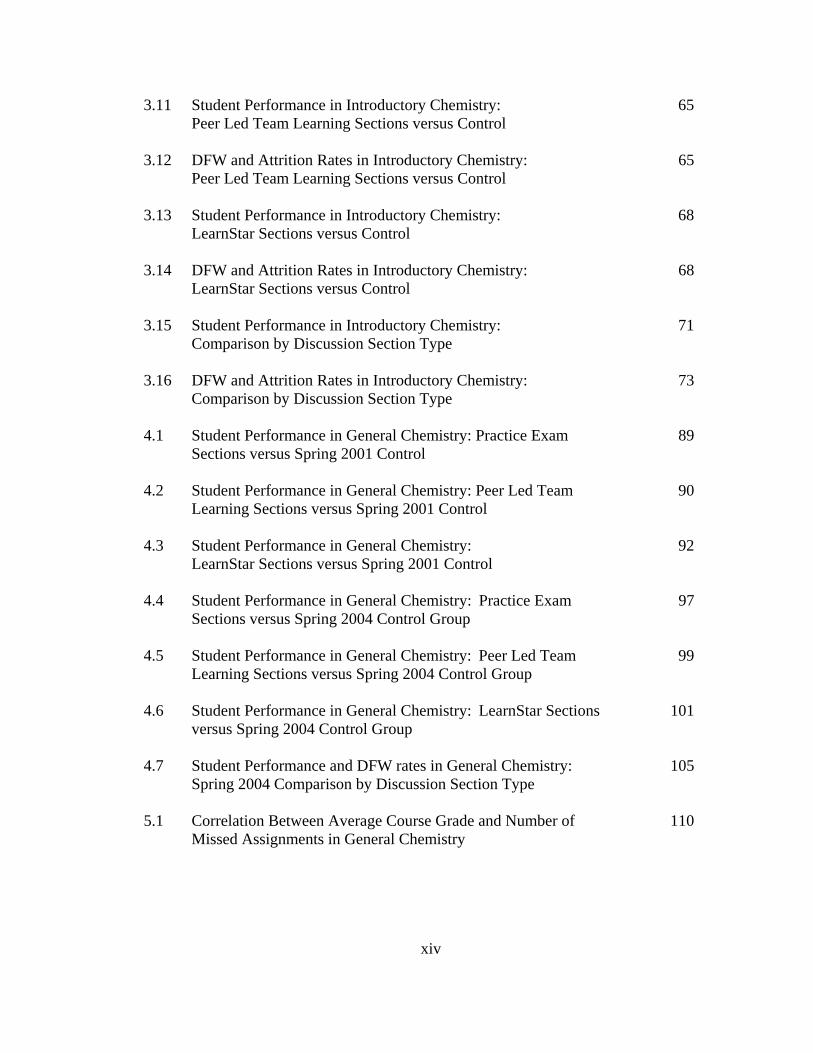
3.11 Student Performance in Introductory Chemistry: 65 Peer Led Team Learning Sections versus Control 3.12 DFW and Attrition Rates in Introductory Chemistry: 65 Peer Led Team Learning Sections versus Control 3.13 Student Performance in Introductory Chemistry: 68 LearnStar Sections versus Control 3.14 DFW and Attrition Rates in Introductory Chemistry: 68 LearnStar Sections versus Control 3.15 Student Performance in Introductory Chemistry: 71 Comparison by Discussion Section Type 3.16 DFW and Attrition Rates in Introductory Chemistry: 73 Comparison by Discussion Section Type 4.1 Student Performance in General Chemistry: Practice Exam 89 Sections versus Spring 2001 Control 4.2 Student Performance in General Chemistry: Peer Led Team 90 Learning Sections versus Spring 2001 Control 4.3 Student Performance in General Chemistry: 92 LearnStar Sections versus Spring 2001 Control 4.4 Student Performance in General Chemistry: Practice Exam 97 Sections versus Spring 2004 Control Group 4.5 Student Performance in General Chemistry: Peer Led Team 99 Learning Sections versus Spring 2004 Control Group 4.6 Student Performance in General Chemistry: LearnStar Sections 101 versus Spring 2004 Control Group 4.7 Student Performance and DFW rates in General Chemistry: 105 Spring 2004 Comparison by Discussion Section Type 5.1 Correlation Between Average Course Grade and Number of 110 Missed Assignments in General Chemistry
xiv

6.1 Student Responses to JiTT Exercises 140 6.2 Student Performance on Midterm Exam Question versus Previous 142 Performance on Warm-up 3 (Point by Point Analysis)
xv

CHAPTER I
INTRODUCTION
1.1 An Overview of the Project
The ultimate goal of this project is to improve student performance and retention
in and into General Chemistry. The importance of this goal is highlighted by the fact that
at least one semester of General Chemistry is a degree requirement for over thirty
different majors in seventeen departments at Texas Tech University. The need for
improvement in student performance and retention become evident when data from 1999
– 2001 showed that over 70% of all incoming beginning chemistry students were failing
to complete the first semester of General Chemistry with a grade of C or better (Gellene
and Bentley 2005).
When looking at student success, retention and attrition, it is important to identify
where the students are performing poorly and where the majority of the attrition is
occurring so that improvements can be made. The procedure for enrolling in General
Chemistry at Texas Tech University is rather unique. All students who desire to take
General Chemistry are required to either pass the chemistry placement exam (CPE) or
pass an Introductory Chemistry course prior to taking General Chemistry. This process is
nondiscretionary and no exceptions are made. On the average 70 - 80% of the students
desiring to take General Chemistry are placed in to or elect to take Introductory
Chemistry. The remainder score high enough on the CPE to be placed directly into
General Chemistry. When classroom data from 1999 – 2001 was analyzed, it was
determined that the major sources of attrition for beginning chemistry students were
1

coming from three areas. A number of students fail to complete Introductory Chemistry
successfully. Secondly, many students who complete Introductory Chemistry
successfully elect not to enroll in General Chemistry. Finally, there is attrition due to
students who fail to complete the first semester of General Chemistry successfully The
average percent attrition for each area is presented in Table 1.1 and Figure 1.1. Much of
this historical data is based on a previous study performed at Texas Tech University
(Gellene and Bentley 2005)
This attrition data shows that the majority of the student losses are occurring in
the Introductory Chemistry portion of the course sequence. Accordingly, the idea that
improving performance in Introductory Chemistry would increase retention into General
Chemistry was proposed. In addition to this idea, one of the major hypothesis that is
developed in this dissertation is that if student performance in Introductory Chemistry is
improved then performance in General Chemistry would also be improved in subsequent
semesters. In order to establish a predictive framework to evaluate this hypothesis,
Chapter II focuses on the correlation between prior student performance in Introductory
Chemistry and student performance in General Chemistry. In addition to this topic,
Chapter II discusses several other predictors of student performance in General
Chemistry that have been presented in the literature from 1929 to the present, and on the
importance of proper student placement into the beginning chemistry curriculum.
Chapter III focuses on improving student performance in Introductory Chemistry.
Three different discussion section types were added to the Introductory Chemistry
curriculum in hopes that by requiring students to participate in these discussion sections
2

Table 1.1. Average Attrition Rates for Beginning Chemistry Fall 1999 – Fall 2001
Type of Attrition
Percentage of Total Beginning Chemistry Population
Attrition from students who failed to complete Introductory Chemistry successfully
35.8%
Attrition from students who failed to complete the first semester of General Chemistry successfully
18.5%
Attrition from students who completed Introductory Chemistry successfully but did not enroll in General Chemistry
19.4%
0
10
20
30
40
50
60
70
80
90
100
Fall 1999 Spring 2000 Fall 2000 Spring 2001 Fall 2001
Semester
Perc
ent o
f Beg
inni
ng C
hem
istry
Pop
ulat
ion
Introductory Chemistry Attrition General Chemistry Attrition Voluntary Attrition
Figure 1.1. Percent Attrition of Beginning Chemistry Students Through the
First Semester of General Chemistry by Type Fall 1999 – Fall 2001
3

student performance and retention in Introductory Chemistry would be increased. The
three discussion sections types were: 1) Practice Exam Sections where students met once
per week in small groups and took a practice exam over material that they had covered in
class that week. After taking the practice exam the students discussed the exam topics
and questions with an undergraduate student leader. 2) Peer Led Team Learning (PLTL)
Sections used the teaching model developed by the workshop chemistry project funded
by the National Science Foundation (Gosser and Roth 1998). Students involved in PLTL
met for two hours a week with an undergraduate student leader in a small group
discussion format to work through challenging exercises, and develop critical thinking
skills. 3) LearnStar sections used a computer based trivia game to develop chemistry
vocabulary, naming, and problem solving skills in a competitive, fun learning
environment. LearnStar sections met for one hour per week and were led by an
undergraduate student leader. Chapter III describes all of these discussion section types
in detail and compares the student performance and attrition rates of the students
involved in these discussion section groups to control groups from the Fall of 2000. The
longitudinal attrition rates from Introductory Chemistry into General Chemistry are also
evaluated with respect to the Fall 2000 control group.
Chapter IV describes the longitudinal effects on student performance and
retention from the students involved in the different types of discussion sections as these
students move into the first semester of General Chemistry. Statistical analysis compare
the student performance of each of the discussion section formats to control groups from
the Spring of 2001 and to students in the same General Chemistry classes that had been
4

admitted into General Chemistry by passing the chemistry placement exam. At this point
the hypothesis proposed in Chapter II is tested.
Chapter V evaluates the correlation between participation and performance in
beginning chemistry for several different variables. This study shows that a significant
percentage of the variance in final course grade can be explained by student participation
and attendance, which make up a very small percentage of the final course grade.
Chapter V highlights the need for students to be actively involved and participating in the
course in order for them to be successful in General Chemistry.
The final study, presented in Chapter VI, is the effect of using Just in Time
Teaching (JiTT) techniques in General Chemistry on both student performance and
attrition rates. The JiTT concept was originally developed by A. Gavrin and G. M.
Novak for use in the undergraduate physics classroom (Novak, Patterson, Gavrin, A. and
Christian 1999). This pedagogical approach, as applied at Texas Tech University,
involves the use of the World Wide Web to develop an active feed back loop between the
students and the professor. A web site and data base were developed allowing the
professor to ask warm-up questions to determine prior student knowledge about specific
classroom topics before presenting them in class. The warm-up questions were assigned
after each lecture and were due before the next lecture. This system also allowed the
professor to ask questions about materials that had been covered in class to determine
how well the class as a whole was assimilating the information and what misconceptions
they may be drawing about the material. The question format was typically two free
response questions and a single multiple choice question after each lecture. In most cases
5

two of the questions were focused on upcoming material and one was used as a check-up
to ask about material that had been previously covered in class. This active feedback
from the students allowed the professor to customize lectures to best meet the needs of
the class.
The application of the JiTT approach and its effect on student performance and
attrition are discussed in detail, as is the specific application of JiTT to concepts in acid
base chemistry. The performance and attrition rates of the class involved in the JiTT
study in the Fall of 2002 were compared to two control groups. The first was a section of
the same professor’s class from the Fall 2001. The second, was the combined first
semester General Chemistry population from the Fall of 2001.
In conclusion, this dissertation presents and discusses five studies focused on
improving student performance and decreasing attrition rates in the first year chemistry
curriculum at Texas Tech University.
6

1.2 Works Cited Gellene, Gregory and Bentley, Andrea. “A Six-Year Study of the Effects of a Remedial
Course in the Chemistry Curriculum.” Journal of Chemical Education, vol. 82 no.1, January 2005, pp. 125-130.
Gosser, David and Roth, Vicki. “The Workshop Chemistry Project: Peer-Led Team
Learning.” Journal of Chemical Education, vol. 75 no.2, February 1998, pp. 185-187.
Novak, G., Patterson, E., Gavrin, A. and Christian, W. Just-In-Time Teaching Blending
Active Learning with Web Technology. Upper Saddle River, New Jersey: Prentice Hall, 1999.
7
CHAPTER II
PREDICTING STUDENT SUCCESS
IN GENERAL CHEMSITRY
2.1 Introduction
Predicting the performance of students in General Chemistry has been an
important concern of educators for at least the past 75 years (Smith and Tremble 1929).
This study has determined that there is a high predictive correlation between student
performance in Introductory Chemistry and student performance in General Chemistry.
By evaluating a student’s prior performance in Introductory Chemistry, it is possible to
determine with a relatively high level of accuracy how that student will perform in
General Chemistry. The literature concerning several other common methods of
predicting student performance in General Chemistry is reviewed and compared to the
data developed by this study.
One of the major difficulties with having an Introductory Chemistry class in the
beginning chemistry curriculum is how the institution determines which students need to
be placed in a Introductory Chemistry class versus the students who need to be placed in
a General Chemistry class. This question becomes of even greater importance when the
university institutes a requirement that all beginning chemistry students that the
university determines to be under-prepared must pass an Introductory Chemistry course
before they will be allowed to take General Chemistry. Proper placement into the correct
chemistry course can be a very important factor in maximizing student performance in
General Chemistry.
8

There are two ways that a student may be misplaced in the chemistry curriculum.
First, a student that would have been successful in General Chemistry is wrongly placed
into Introductory Chemistry. Second, a student that should have been placed into
Introductory Chemistry is placed into General Chemistry and fails to complete the course
successfully.
Based on the goals of the institution, there are three primary philosophies of
placement into General Chemistry. The first philosophy, is to allow any students who
have a reasonable chance of passing General Chemistry to be admitted into the course. In
this case the entrance requirements for the course are set at a low level. The disadvantage
is that this low entrance requirement allows a large number of unprepared students into
General Chemistry where they proceed to fail. These students may have been successful
in General Chemistry if they had taken Introductory Chemistry first. The second
philosophy, is to restrict access into General Chemistry to only those students who have
demonstrated mastery of the prerequisite skills, and have a high probability of success in
the course. In this case the entrance requirements are set at a high level. This high
entrance requirement forces a large number of prepared and/or motivated students who
would have been successful in General Chemistry into Introductory Chemistry. Finally,
the third philosophy of student placement is to optimized the cutoff score of the
placement instrument to maximize the number of correctly placed students. In this case,
there will be a significant number of incorrectly placed students in both categories, but
the overall number of correctly placed students will be maximized. An instrument used
in this application must be able to place both prepared and unprepared students
9

effectively. Conversely, the previous placement philosophies instruments are only
required to place one type of student accurately.
Historically, student performance in General Chemistry has been predicted by
several methods. These methods have also been used to evaluate students for placement
into General Chemistry. Some of the common predictors of General Chemistry
performance are: SAT and ACT mathematics scores (Coley 1973; Pickering 1975;
Ozsogomonyan and Loftus 1979; Craney and Armstrong 1985), previous high school
performance (Kunhart, Olson and Gammons 1958; Schelar, Cluff and Roth 1963;
Wagner, Sasser and DiBiase 2002), level of intellectual development (Beistel 1975;
Herron 1975; Goodstein and Howe 1978; Wagner et al. 2002) and several other
predictors such as placement exams (Hovey and Krohn 1963; Coley 1973; Hunter 1976;
McFate and Olmsted 1999). The vast majority of these studies involving only a single
predictor, consistently show that accurate prediction is only possible for the best and
poorest of students (Smith and Tremble 1929). However, when performance in General
Chemistry is predicted by several factors in conjunction, the correlation becomes much
more significant, especially if all that is being predicted is success or failure in the course
(Kunhart et al. 1958; Coley 1973). However, even in this limited application most
studies have shown that only 70-80% of the students are placed correctly into either
Introductory or General Chemistry (Hovey and Krohn 1958; Goodstien and Howe 1978;
McFate and Olmsted 1999; Wagner et al. 2002).
10
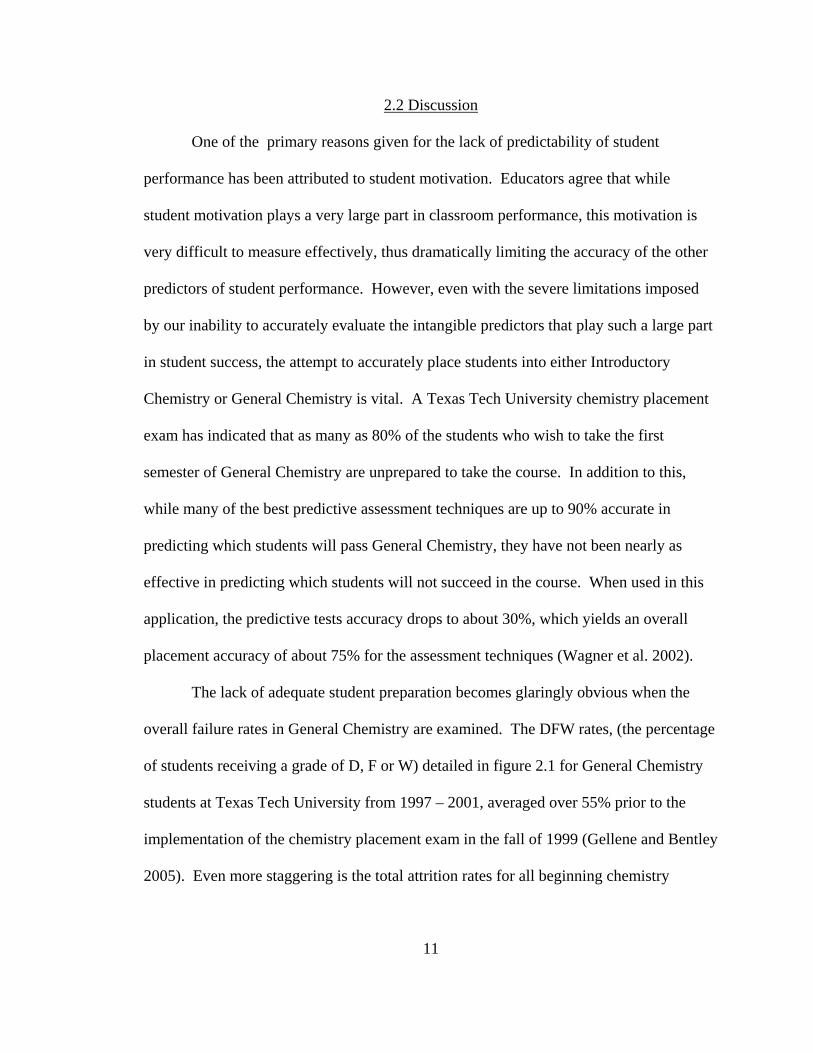
2.2 Discussion
One of the primary reasons given for the lack of predictability of student
performance has been attributed to student motivation. Educators agree that while
student motivation plays a very large part in classroom performance, this motivation is
very difficult to measure effectively, thus dramatically limiting the accuracy of the other
predictors of student performance. However, even with the severe limitations imposed
by our inability to accurately evaluate the intangible predictors that play such a large part
in student success, the attempt to accurately place students into either Introductory
Chemistry or General Chemistry is vital. A Texas Tech University chemistry placement
exam has indicated that as many as 80% of the students who wish to take the first
semester of General Chemistry are unprepared to take the course. In addition to this,
while many of the best predictive assessment techniques are up to 90% accurate in
predicting which students will pass General Chemistry, they have not been nearly as
effective in predicting which students will not succeed in the course. When used in this
application, the predictive tests accuracy drops to about 30%, which yields an overall
placement accuracy of about 75% for the assessment techniques (Wagner et al. 2002).
The lack of adequate student preparation becomes glaringly obvious when the
overall failure rates in General Chemistry are examined. The DFW rates, (the percentage
of students receiving a grade of D, F or W) detailed in figure 2.1 for General Chemistry
students at Texas Tech University from 1997 – 2001, averaged over 55% prior to the
implementation of the chemistry placement exam in the fall of 1999 (Gellene and Bentley
2005). Even more staggering is the total attrition rates for all beginning chemistry
11

0
10
20
30
40
50
60
70
80
F'96 S'97 F'97 S'98 F'98 S'99 F'99 S'00 F'00 S'01 F'01
Semester
Perc
ent
Implementation of Chemistry Placement Exam
Figure 2.1. General Chemistry DFW rates Fall 1996-Fall 2001
12

students from 1997-2001 as detailed in figure 2.2 (Gellene and Bentley 2005). This
attrition percentage was determined from the total number of beginning chemistry
students who failed to successfully complete the first semester of General Chemistry with
a grade of C or better. It is important to note that the attrition is not due solely to either
General Chemistry or Introductory Chemistry alone. Contributors to attrition include:
1. Students who fail to successfully complete Introductory Chemistry.
2. Student who fail to successfully complete General Chemistry.
3. Students who successfully complete Introductory Chemistry, but elect not to take General Chemistry.
The way that Introductory Chemistry has been integrated into the overall
chemistry curriculum at Texas Tech University has evolved considerably over the past
ten years. When Introductory Chemistry was first offered at Texas Tech University in
1988, enrollment was entirely voluntary. Typically, students who enrolled in
Introductory Chemistry at this time were students who felt that their previous background
in chemistry was either inadequate or entirely missing. The decision of whether or not to
take Introductory Chemistry was the personal choice of the student, not determined by
the department or an advisor.
In the fall of 1999 the Department of Chemistry and Biochemistry developed a
placement exam to determine which students were prepared to take General Chemistry,
and which students needed to be placed in Introductory Chemistry for remediation. The
placement exam consists of twenty multiple choice questions that address basic math
skills, general science knowledge and specific chemistry knowledge. Ten questions are
used to address basic math and general science knowledge and ten questions are used to
13

0
10
20
30
40
50
60
70
80
90
100
F'96 S'97 F'97 S'98 F'98 S'99 F'99 S'00 F'00 S'01 F'01
Semester
Perc
ent
General Chemistry Attrition Introductory Chemistry Attrition Voluntary Attrition
Implementation of Chemistry Placement E
Figure 2.2. Percentage of Total Attrition Accounted for by Attrition Type
for Beginning Chemistry Students Historical Data 1996-2001
14

assess specific chemistry knowledge. A minimum score of 50% is required for a student
to pass the placement exam and be allowed into General Chemistry. Thus, it is possible
for a student to pass the placement exam despite answering all of the chemistry questions
incorrectly. It should be noted, that no exceptions are made to the placement exam
requirement. If a student fails the placement exam or elects not to take the placement
exam, they are required to pass Introductory Chemistry before they are allowed to take
General Chemistry.
Prior to the fall of 1999 approximately 20% of all beginning chemistry students
would enroll into Introductory Chemistry, with the remaining 80% electing to enroll
directly into General Chemistry. Since the placement exam has been instituted,
approximately 75% of all chemistry students either elect, or are required to, take
Introductory Chemistry before they take General Chemistry. Figure 2.2 shows the
fraction of the total attrition rate (the total number of beginning chemistry students who
do not successfully complete the first semester of General Chemistry) that is attributed to
the Introductory and General Chemistry courses over six years (Gellene and Bentley
2005). It is important to note that after the placement exam became mandatory in the Fall
of 1999, an average of 44% of the students that had successfully completed Introductory
Chemistry elected not to advance into General Chemistry (voluntary attrition), as
compared to a rate of 32% prior to the institution of the placement exam. Since
approximately 75% of the total beginning chemistry population has been placed into
Introductory Chemistry since the Fall of 1999, as compared to 20% prior to the
15
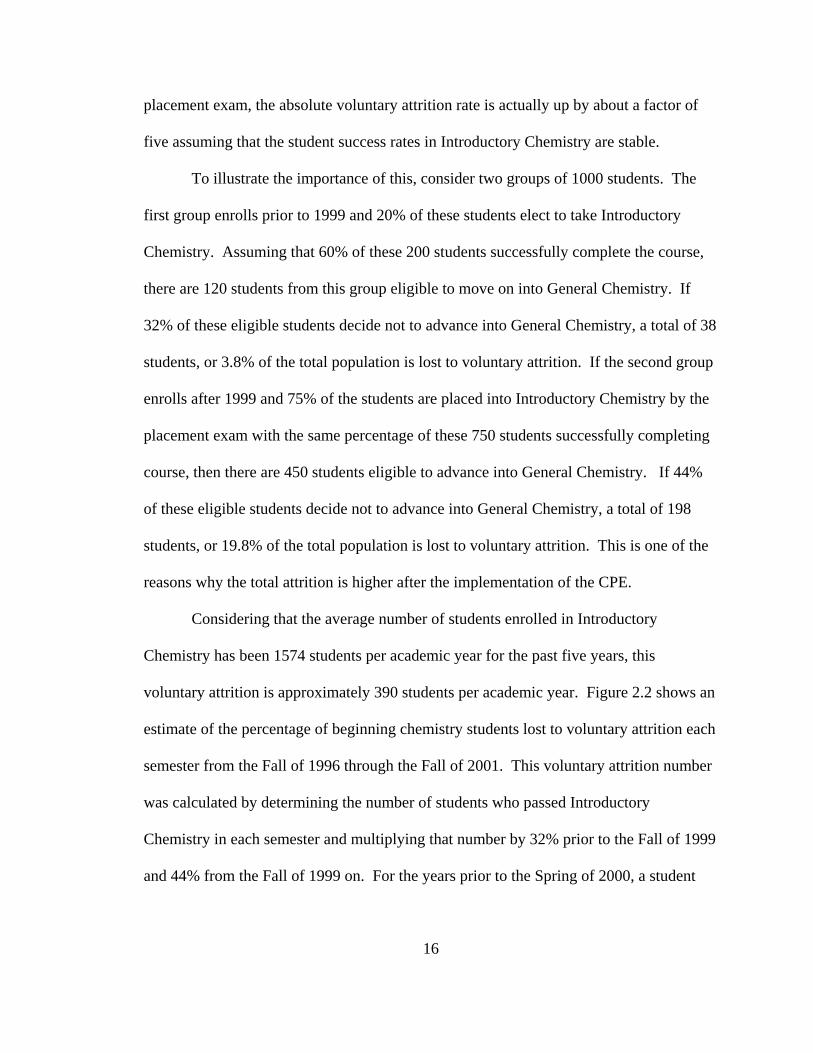
placement exam, the absolute voluntary attrition rate is actually up by about a factor of
five assuming that the student success rates in Introductory Chemistry are stable.
To illustrate the importance of this, consider two groups of 1000 students. The
first group enrolls prior to 1999 and 20% of these students elect to take Introductory
Chemistry. Assuming that 60% of these 200 students successfully complete the course,
there are 120 students from this group eligible to move on into General Chemistry. If
32% of these eligible students decide not to advance into General Chemistry, a total of 38
students, or 3.8% of the total population is lost to voluntary attrition. If the second group
enrolls after 1999 and 75% of the students are placed into Introductory Chemistry by the
placement exam with the same percentage of these 750 students successfully completing
course, then there are 450 students eligible to advance into General Chemistry. If 44%
of these eligible students decide not to advance into General Chemistry, a total of 198
students, or 19.8% of the total population is lost to voluntary attrition. This is one of the
reasons why the total attrition is higher after the implementation of the CPE.
Considering that the average number of students enrolled in Introductory
Chemistry has been 1574 students per academic year for the past five years, this
voluntary attrition is approximately 390 students per academic year. Figure 2.2 shows an
estimate of the percentage of beginning chemistry students lost to voluntary attrition each
semester from the Fall of 1996 through the Fall of 2001. This voluntary attrition number
was calculated by determining the number of students who passed Introductory
Chemistry in each semester and multiplying that number by 32% prior to the Fall of 1999
and 44% from the Fall of 1999 on. For the years prior to the Spring of 2000, a student
16

success rate of 55% for Introductory Chemistry was used to calculate voluntary attrition
as these grade books were not available. Information presented in table 2.1 shows the
actual number of students affected by the different types of attrition for the 2000 – 2001
academic year.
The high failure rates in General Chemistry, detailed in figure 2.1, show how vital
it is that the under prepared students are given a chance to increase their knowledge of
basic chemistry by taking preparatory class such as Introductory Chemistry. However, it
is almost as important that we do not unjustly limit students who are prepared to take
General Chemistry by incorrectly forcing them to enroll in an introductory course. This
is especially true when the high voluntary attrition rates in Introductory Chemistry are
taken into account. Thus, it would be useful to develop a more effective tool for
assessing students before they are placed into either one of the beginning chemistry
courses.
To date, there have been no rigorous reliability or accuracy of placement analysis
performed on the internally developed Chemistry Placement Exam (CPE) that is
currently being used at Texas Tech University (Gellene and Bentley 2005). A small
study to determine the placement accuracy of the CPE was performed on a group of 192
students that passed the CPE in the Spring of 2004. It was determined that the CPE had a
predictive accuracy of 50.5% when determining which students would get a C or better in
the course. Unfortunately, there was no way to evaluate the CPE’s predictive accuracy
with respect to students that the CPE predicted failure for since all of those students were
placed into Introductory Chemistry. This is not an unexpected outcome since,
17
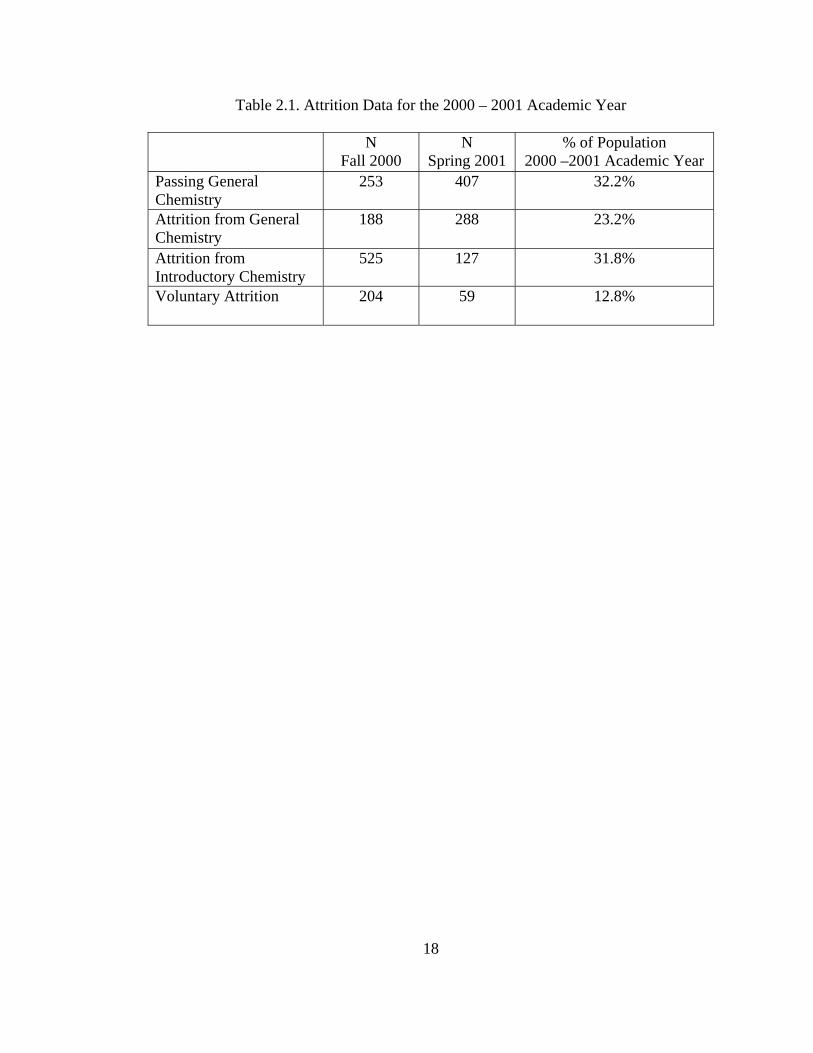
Table 2.1. Attrition Data for the 2000 – 2001 Academic Year
N Fall 2000
N Spring 2001
% of Population 2000 –2001 Academic Year
Passing General Chemistry
253 407 32.2%
Attrition from General Chemistry
188 288 23.2%
Attrition from Introductory Chemistry
525 127
31.8%
Voluntary Attrition 204 59 12.8%
18

several studies indicate that even the best single variable predictors have not been very
effective at determining which students are truly in need of remediation and which are
ready to enroll in General Chemistry (Schelar et al. 1963; Coley 1973; Ozsogomonyan
and Loftus 1979; Bunce and Hutchinson 1993;Wagner et al. 2002).
Since the CPE is the only predictor that is currently being used to determine
student placement into General Chemistry at this time and its predictive accuracy appears
to be rather low, a change to the use of a nationally normed and committee developed
exam such as the Toledo Chemistry Placement Exam or the California Chemistry
Diagnostic Test, may be more effective in placing students into General Chemistry as
their predictive abilities have been rigorously evaluated and appear to be significantly
more accurate than the CPE. The Toledo Chemistry Placement Exam, for example, has a
well established positive predictive accuracy (correctly predicting students who pass
General Chemistry) of 87% and a total predictive accuracy of 75% (Wagner et al. 2002).
In addition to a placement exam, there are two other predictors that should be
commonly available and relatively easy to obtain: SAT or ACT math scores and students
previous performance in high school chemistry. Thus, it is possible to develop a
combined ranking and placement system that would use data from the students
performance on a nationally normalized placement exam, their SAT or ACT math scores,
and their previous performance in high school chemistry. This combined ranking system
would then be used to determine the students placement into either Introductory or
General Chemistry. According to several studies, such a multivariate placement system
19

should significantly increase the percentage of students who are placed accurately into
the beginning chemistry curriculum (Coley 1973; Ozsogomonyan and Loftus 1979).
A number of studies have been evaluated that look at the correlation between
predictors and student performance, and are summarized in table 2.2. Hovey’s study on
the Toledo Chemistry Placement Exam found a correlation coefficient of r =0.58 and r2 =
0.34 with respect to students final grade performance in General Chemistry (Hovey and
Krohn 1958). A study at Northern Illinois University found a correlation of r = 0.63 and
r2 = 0.40 between Math ACT scores and students final grade performance in General
Chemistry (Schelar et al. 1963). Finally, a similar study conducted at the University of
California Berkeley found a correlation of r = 0.51 and r2 = 0.26 between Math SAT
scores and students final grade performance in General Chemistry, as well as a
correlation of r = 0.38 and r2 = 0.14 between a student’s final grade performance in high
school chemistry and their final grade performance in General Chemistry
(Ozsogomonyan and Loftus 1979). No study has been found at this time that has
conducted a multivariate analysis of all of these variables. In general, predictors that are
not collinear will progressively explain a greater part of the total variance of the
dependant variable when taken in conjunction with each other. Thus, we would expect a
much higher multivariate correlation between all three of these variables with respect to
student performance than we would for the correlation from any single variable.
Unfortunately, it was not possible to actually perform this multivariate study and
determine the overall predictive accuracy that such a method would provide. In order to
perform such a study, a large group of students would need to be given a standardized
20

Table 2.2. Correlation Between Predictors and Student Performance in General Chemistry
Criteria Correlation
r Variance Explained
r2
Toledo Chemistry Placement Exam
0.58 0.34
Math Score ACT
0.63 0.40
Math Score SAT
0.51 0.26
High School Chemistry Grade
0.38 0.14
Introductory Chemistry Grade
0.70 0.49
21

placement exam and have their SAT and High School Data collected. It would then be
necessary to place all of these students in to General Chemistry and collect data on their
performance.
In addition to the studies that were evaluated in the literature, a correlational study
was performed that related student performance in Introductory Chemistry to student
performance in General Chemistry in sequential semesters. The semesters that were
studied were the Fall of 2002 for Introductory Chemistry and the Spring of 2003 for
General Chemistry and involved 735 students. The correlation coefficient between
course grade in Introductory Chemistry and course grade in General Chemistry was
determined to be r = 0.698, r2 = 0.49 and the correlation was significant at p<0.001
(Figure 2.3). Thus, it was determined that students previous performance in Introductory
Chemistry explained 49% of the variance in their subsequent performance in General
Chemistry. This significant correlation led to the hypothesis that by improving student
performance in Introductory Chemistry, student performance in General Chemistry could
also be improved.
As valuable as the actual prediction of a students final grade in General Chemistry
is, for the application of placement, the most significant concern is whether or not a
student passes or fails the course. Thus, while the linear correlations between the
predictors and the final course grade in General Chemistry are only moderate, a
discussion of their predictive value in determining whether a student will pass or fail
General Chemistry is extremely important. An in-depth study conducted at the
University of North Carolina
22

y = 1.5437x - 53.632r = 0.698 p<0.001
0
20
40
60
80
100
120
50 60 70 80 90 100 110
Introductory Chemistry Grade
Gen
eral
Che
mist
ry G
rade
Figure 2.3. Introductory Chemistry versus General Chemistry Correlation Scatter Plot
23

at Charlotte has examined two of these predictors in detail and issued some very
promising results. It was determined that the Toledo Placement Exam was able to
accurately predict the success or failure of 75.1% of the students in General Chemistry
with a cutoff score of 51%. Secondly, Math SAT scores were able to accurately predict
the success or failure of 75.0% of the students with a cutoff score of 440 (Wagner et al.
2002).
A study relating high school chemistry performance to General Chemistry
performance conducted by the University of California at Berkeley, showed that 87.3%
of students who had received a grade of A in high school chemistry went on to receive a
grade of C or better in General Chemistry. 63.5% of students who received a B in high
school chemistry went on to receive a grade of C or better in General Chemistry and
45.6% of students who received a C in high school chemistry went on to receive a grade
of C or better in General Chemistry. It was also determined that 54.5% of the students
who had not taken chemistry in high school, received a grade of C or better in General
Chemistry (Ozsogomonyan and Loftus 1979). If the cutoff score of B is used for high
school chemistry performance, then 78% of the students who received a grade of B or
higher went on to receive a grade of C or better in General Chemistry making this a very
useful predictor (table 2.3).
No predictor studies directly related to ACT Math scores, were found. However,
correlational data that would allow for the accurate prediction of a students SAT Math
score from their ACT Math score was found. According to College Board Report 99-1
issued by the college entrance examination board, there is a correlation of r = 0.89
24

Table 2.3. Relationship Between High School Chemistry Performance and Success in General Chemistry
Performance in
High School Chemistry Percentage of Students
Receiving a C or Better in General Chemistry
A
87.3%
B
63.5%
C
45.6%
No High School
54.5%
25

between SAT Math scores and ACT Math scores. In addition, this report contained a set
of equivalency tables that directly relate SAT Math scores to equivalent ACT Math
scores. This information is presented in table 2.4 (Dorans 1999). A summary of the
prediction accuracy of all of the these predictors is found in table 2.5.
A prediction study was also performed to determine how accurately student
performance in Introductory Chemistry would predict whether a student would pass or
fail General Chemistry. Two cutoff points were selected: Students receiving a C or
better in Introductory Chemistry and students receiving a B or better in Introductory
Chemistry. For students receiving a C or better, student performance in Introductory
Chemistry predicted student success with 60% accuracy, indicating that 60% of the
students that received a C or better in Introductory Chemistry received a C or better in
General Chemistry. Student performance in Introductory Chemistry predicted student
failure with 88% accuracy with a C cutoff, indicating that 88% of the students that
received less that a C in Introductory Chemistry received less than a C in General
Chemistry. The total predictive accuracy, with a cutoff value of C, was 66%. This
suggests that a student who received a D in Introductory Chemistry should not be allowed
to take General Chemistry as they are almost certain to fail. For students receiving a B or
better, student performance in Introductory Chemistry predicted students success with
84% accuracy and student failure with 65% accuracy for a total accuracy of prediction of
74%. Success rates in General Chemistry as predicted by prior performance in
Introductory Chemistry, are detailed in table 2.6. This table also includes performance
26

Table 2.4. Correspondence Between ACT Math and SAT Math Scores
ACT Math SAT I Math
36 800 35 790 34 780 33 740 32 720 31 700 30 680 29 650 28 640 27 620 26 600 25 580 24 560 23 540 22 520 21 500 20 480 19 460 18 440 17 420 16 390 15 360 14 330 13 290 12 250 11 220
27

Table 2.5. Accuracy of Student Performance Predictors
Criteria Cutoff Score Total Prediction Accuracy
Toledo Chemistry Placement Exam
51% 75.1%
Math Score ACT
18 About 75% Based on SAT study
Math Score SAT
440 75.0%
High School Chemistry Grade
B or better 78%
Introductory Chemistry Grade
B or better 74%
Introductory Chemistry Grade
C or better 66%
Chemistry Placement Exam
50% 50.5% Success only
Table 2.6. Relationship Between Introductory Chemistry Performance and Success in General Chemistry
Performance in
Introductory Chemistry % of Students Receiving a C or Better in General
Chemistry
N C or Better
N DFW
A
84.2% 101 19
B
66.8% 184 90
C
51.1% 117 112
D
12.7% 14 98
Pass the Chemistry Placement Exam
50.5% 97 96
28

data for students who were accepted into General Chemistry based on passing the
chemistry placement exam. Based on these numbers, it appears that the chemistry
placement exam has a predictive accuracy of about 50% for student success in General
Chemistry. However, since no data exists that shows how students who have failed the
placement exam would have performed in General Chemistry, this instruments total
predictive accuracy cannot be assessed.
2.3 Conclusions
By using a nationally standardized and normalized chemistry placement exam in
conjunction with students previous performance in high school chemistry and their SAT
Math score, a much more accurate prediction of a students probability to pass General
Chemistry can be developed. This placement technique should have a much higher level
of accuracy and selectivity than the system that is currently in place. The initial
performance of this student placement program would need to be optimized to determine
the ideal cut off scores for each prediction criteria. However, it should be possible to
simply switch the current placement exam to a nationally normalized exam for the first
year while data is collected for SAT Math scores and high school chemistry performance
to determine the optimum cutoff scores to use for the other two predictors. This would
be especially simple for the Toledo Exam since optimum cutoff points have already been
extensively studied. Once the student performance data has been collected and analyzed,
a multivariate chemistry placement system can be implemented using either a composite
or multiple scoring system. Final student placement into either Introductory Chemistry
or General Chemistry would then be dependant on the students pervious performance in
29

high school chemistry, their college placement test and their performance on the
chemistry placement exam. Exact procedures and cut off points would of course be at the
discretion of the department.
Secondly, after analyzing the data from students who took Introductory Chemistry
before they took General Chemistry, it becomes clear that there is a strong correlation
between performance in the two classes. Based on this correlation, it is hypothesized that
by increasing student performance and retention in Introductory Chemistry, student
performance and retention in General Chemistry can also be increased.
30

2.4 Works Cited Beistel, D. W. “A Piagetian Approach to General Chemistry” Journal of Chemical
Education, vol. 52 no.3, March 1975, pp. 151-152. Bunce, Diane and Hutchinson, Kira. “The use of the GALT (Group Assessment of
Logical Thinking) as a Predictor of Academic Success in College Chemistry” Journal of Chemical Education, vol. 76 1993, pp. 183-187.
Coley, Neil. “Prediction of Success in General Chemistry in a Community College”
Journal of Chemical Education, vol. 50 no.9, September 1973, pp. 613-615. Craney, C. L. and Armstrong, R. W. “Predictors of Grades in General Chemistry for
Allied Health Students” Journal of Chemical Education, vol. 62 no.2, February 1985, pp. 127-129.
Dorans, Neil. “Correspondences Between ACT and SAT I Scores College Board Report
No. 99-1” College Entrance Examination Board And Educational Testing Service. New York, New York 10101-0886. 1999, 18 pages.
Gellene, Gregory and Bentley, Andrea. “A Six-Year Study of the Effects of a Remedial
Course in the Chemistry Curriculum” Journal of Chemical Education, vol. 82, no.1, January 2005, pp. 125-130.
Goodstein, Madeline and Howe, Ann. “Application of Piagetian Theory to Introductory
Chemistry Instruction” Journal of Chemical Education, vol. 55 no.3, March 1978, pp. 171-173.
Herron, Dudley. “Piaget for Chemists” Journal of Chemical Education, vol. 52 no.3,
March 1975, pp. 146-150. Hovey, Nelson and Krohn, Albertine. “Predicting Failures in General Chemistry” Journal
of Chemical Education, vol. 35, 1958, pp. 507-509. Hovey, Nelson and Krohn, Albertine. “An Evaluation of the Toledo Chemistry Placement
Examination” Journal of Chemical Education, vol. 40, no. 7, July 1963, pp. 370-372.
Hunter, Norman. “A Chemistry Prep Course That Seems to Work” Journal of Chemical
Education, vol. 53 no.5, May 1976, pp. 301. Kunhart, William; Olson, Lionel and Gammons, Roger. “Predicting Success of Junior
College Students in Introductory Chemsitry” Journal of Chemical Education, vol. 35, no. 8, 1958, pp. 391.
31

McFate, Craig and Olmsted, John. “Assessing Student Preparation Through Placement
Tests” Journal of Chemical Education, vol. 76 no.4, April 1999, pp. 562-565. Ozsogomonyan, Ardas and Loftus, Drew. “Predictors of General Chemistry Grades”
Journal of Chemical Education, vol. 56 no.3, March 1979, pp. 173-175. Pickering, Miles. “Helping the High Risk Freshman Chemist” Journal of Chemical
Education, vol. 52 no.8, August 1975, pp. 512-514. Schelar, Virginia; Cluff, Robert and Roth, Bernice. “Placement in General Chemistry”
Journal of Chemical Education, vol. 40 no.7, July 1963, pp. 369. Smith, O. M. and Trimble, H. M. “The Prediction of the Future Performance of Students
from Their Past Records” Journal of Chemical Education, vol. 6, 1929, pp. 93-97. Wagner, Eugene; Sasser, Howell and DiBiase, Warren. “Predicting Students at Risk in
General Chemistry Using Pre-semester Assessments and Demographic Information” Journal of Chemical Education, vol. 79 no.6, June 2002, pp. 749-755.
32
CHAPTER III
THE EFFECT OF DISCUSSION SECTIONS ON STUDENT
PERFORMANCE IN INTRODUCTORY CHEMISTRY
3.1 Introduction and Background
Over the last several years there has been considerable concern that a large
percentage of graduating seniors are not prepared to enroll into a college level science
course (Valverde and Schmidt 1998; National Center for Education Statistics 1996). One
of the most common methods used to attempt to improve the probability of student
success in their college level science courses is to use remedial or introductory classes to
prepare these students for college level courses in science. Throughout the course of this
chapter the advantages and disadvantages of using Introductory / Remedial Chemistry
courses to prepare students for General Chemistry will be evaluated. The method of
placement that is in use to determine which students are placed into Introductory
Chemistry is discussed. This study also examines how student performance in
Introductory Chemistry relates to student performance in General Chemistry, and the
overall effect that Introductory Chemistry has had on General Chemistry at Texas Tech
University from 1996 to the present.
3.1.1 The Need For Introductory Chemistry
Prior to the fall of 1988, Texas Tech University did not offer an Introductory
Chemistry class of any type. All students that needed to take General Chemistry as part
of their degree requirement simply enrolled in the course and attempted to succeed. Prior
33

to the institution of Introductory Chemistry, fewer than half of the students were an
acceptable grade of C or better in General Chemistry.
In order to increase the number of students that were successfully completing
General Chemistry, the Department of Chemistry and Biochemistry added Chemistry
1301, Introductory Chemistry, to their curriculum in 1996. The sole purpose of
Introductory Chemistry was to help under-prepared students develop the needed skills to
take General Chemistry. Introductory Chemistry is not part of any degree plan at Texas
Tech University, and since a lab is not offered with it, Introductory Chemistry will not
fulfill any general education requirements.
3.1.2 The Effect of Introductory Chemistry
Introductory Chemistry is offered in a standard lecture format. Typical class sizes
for Introductory Chemistry range from about 100-350 students per class section. The
textbook that has been in use in various editions since 1996 is “Basic Chemistry” by
Stephen Zumdahl (Zumdahl 2004). Over the past nine years, the majority of the class
sections that were taught in the same semester had common exams and cumulative finals.
The course descriptions for Introductory and General Chemistry are as follows:
Chem 1301, Introductory Chemistry: Basic vocabulary, concepts, and problem solving skills required for Chem 1307 and 1308. This course has no laboratory and will not satisfy a laboratory science requirement. (Texas Tech University 2005) Chem 1307, Principals of Chemistry I, Prerequisite: Chem 1301 or a passing grade on the Chemistry Placement Exam. A study of the fundamental concepts of chemistry including nomenclature, states or matter, the periodic table and periodic trends, chemical reactions, atomic structure, chemical bonding, molecular structure, and the properties of gasses, liquids, solutions, and solids.
34

This course is recommended for students who plan careers in the physical and biological sciences as well as medicine and engineering. (Texas Tech University 2005)
Since the sole purpose of Introductory Chemistry is to remediate under-prepared
students and increase their performance in General Chemistry, any apparent benefit of
improving student performance in the introductory class would be contingent on
improved student performance in General Chemistry. A correlation study was performed
on a group of 735 Introductory Chemistry students from the Fall of 2002, and it was
determined by linear regression at the 99.9% confidence interval, that 49% of the overall
variance (r = 0.698, p<0.001) in their performance in General Chemistry in the Spring of
2003 was directly explained by the students’ previous performance in Introductory
Chemistry (figure 3.1).
The grade distributions in General Chemistry are presented for this group of
students by their previous grade in Introductory Chemistry in table 3.1. A student who
receives a grade of A in Introductory Chemistry has an 84.2% chance of receiving a C or
better in General Chemistry (figure 3.2). Students who earned a B in the introductory
course had a 67.2% chance of receiving a C or better in General Chemistry (figure 3.3)
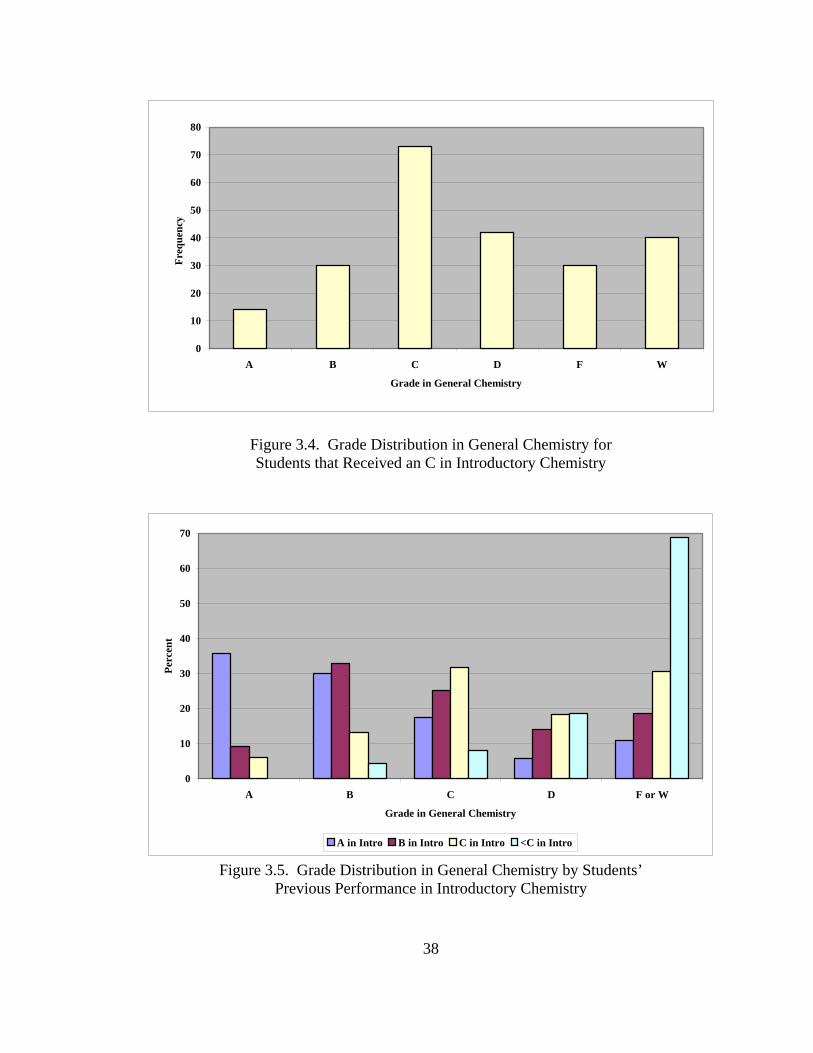
while students who received a C were only 51% likely to earn a grade of C or better in
General Chemistry (figure 3.4). At this time the students are only required to pass
Introductory Chemistry before being allowed to take General Chemistry. Thus, students
who earned a D (figure 3.5) in the introductory course are allowed into General
Chemistry, even though this study shows that only 12% of these students will receive a C
or better in General Chemistry.
35

y = 1.5437x - 53.632r = 0.698 p<0.001
0
20
40
60
80
100
120
50 60 70 80 90 100 110
Introductory Chemistry Grade
Gen
eral
Che
mist
ry G
rade
Figure 3.1. Correlation Scatter Plot: Introductory Chemistry Fall 2002 versus General Chemistry Spring 2003
Table 3.1. The Longitudinal Relationship Between Grade Distributions in Introductory Chemistry and General Chemistry
Performance in General Chemistry
Intro Chem Grade A
B C D F W %Pass %DFW
A 45
36 21 7 5 7 84.2%
15.8%
B 25
90 69 39 18 33 67.2% 32.8%
C 14
30 73 42 30 40 51.1% 48.9%
D 0
5 9 21 32 45 12.5% 87.5%
36

0
5
10
15
20
25
30
35
40
45
50
A B C D F W
Grade in General Chemistry
Freq
uenc
y
Figure 3.2. Grade Distribution in General Chemistry for Students that Received an A in Introductory Chemistry
0
10
20
30
40
50
60
70
80
90
100
A B C D F W
Grade in General Chemistry
Freq
uenc
y
Figure 3.3. Grade Distribution in General Chemistry for
Students that Received a B in Introductory Chemistry
37
0
10
20
30
40
50
60
70
80
A B C D F W
Grade in General Chemistry
Freq
uenc
y
Figure 3.4. Grade Distribution in General Chemistry for Students that Received an C in Introductory Chemistry
0
10
20
30
40
50
60
70
A B C D F or W
Grade in General Chemistry
Perc
ent
A in Intro B in Intro C in Intro <C in Intro
Figure 3.5. Grade Distribution in General Chemistry by Students’ Previous Performance in Introductory Chemistry
38

3.1.3 The Evolution of Introductory Chemistry at Texas Tech University
As detailed in Chapter II, the way that Introductory Chemistry has been integrated
into the overall chemistry curriculum has evolved considerably over the years from
voluntary selection to active student placement in the course. After the implementation
of the Chemistry Placement Exam (CPE), about three quarters of incoming beginning
chemistry students are being placed into Introductory Chemistry as compared to about
20% prior to the CPE.
Since such a large percentage of the entering students are required to take
Introductory Chemistry, several methods have been considered to increase student
performance in the course. The Department of Chemistry and Biochemistry considered
offering traditional recitation sections taught by graduate students for the Introductory
Chemistry classes. Unfortunately, the department was never able to implement that
program due to a number of reasons including lack of classroom space, scheduling
conflicts and most recently, a lack of available graduate students. All three discussion
section types that were developed and implemented in this study used undergraduate
teaching assistants which leaves the graduate student population available to teach the
numerous undergraduate laboratory sections.
3.1.4 The Historical Effects of Introductory Chemistry
The initial effects of Introductory Chemistry appeared to be quite positive. The
overall academic performance in General Chemistry increased dramatically, with average
grades increasing significantly, and the DFW rates falling from an average of 58% to
39

46% as shown in figure 3.6 (Gellene and Bentley 2005). In addition to increased
classroom performance, some professors had indicated that the amount of class material
that was being covered in the first semester of General Chemistry was increased by as
much as two or three chapters.
A study performed at Texas Tech University on data from 1996 - 2001 has shown
that as a group, students who pass Introductory Chemistry with a C or better, perform at
statistically the same level in General Chemistry as those students who were judged not
to need remediation (Gellene and Bentley 2005). Unfortunately, there were some
unanticipated effects of requiring 75% of the beginning chemistry students to take
Introductory Chemistry. While the performance in General Chemistry was significantly
higher, the actual fraction of initial students who were successfully completing General
Chemistry began to drop. The total attrition rate for the Introductory / General Chemistry
sequence rose from an average of 63% in the three years prior to the chemistry placement
exam to an average of 73% in the three years after the placement exam was instituted as
shown in figure 3.7 (Gellene and Bentley 2005). A major contributor to this increased
attrition were the large numbers of students who had been successful in Introductory
Chemistry and received a grade of C or better and then elected not to take General
Chemistry. For the purposes of this study, this action is defined as voluntary attrition.
Prior to the placement exam, 32% of the students who received a grade of C or
better in Introductory Chemistry elected not to take General Chemistry. After the
placement exam was implemented this number rose to 44% of the successful students
40

0
10
20
30
40
50
60
70
80
F'96 S'97 F'97 S'98 F'98 S'99 F'99 S'00 F'00 S'01 F'01
Semester
Perc
ent
Implementation of Chemistry Placement Exam
Figure 3.6. Historical General Chemistry DFW rates Fall 1996-Fall 2001
0
10
20
30
40
50
60
70
80
90
100
F'96 S'97 F'97 S'98 F'98 S'99 F'99 S'00 F'00 S'01 F'01
Semester
Perc
ent
General Chemistry Attrition Introductory Chemistry Attrition Voluntary Attrition
Implementation of Chemistry Placement E
Figure 3.7. Percentage of Total Attrition Accounted for by Attrition Type
for Beginning Chemistry Students Fall 1996 – Spring 2001
41

who decided not to advance into General Chemistry. At first glance this rise of 12% does
not seem overly significant, especially when you consider the fact that the DFW rate for
General Chemistry fell at least as much as the voluntary attrition rose. However, this
view does not take the huge increase in the fraction of the total population of beginning
chemistry students who are now required to take Introductory Chemistry into account.
Before the placement exam was instated, only 20% of the total beginning chemistry
population was enrolling in Introductory Chemistry. With an average of 32% of the
successful students electing not to advance into General Chemistry, this voluntary
attrition accounts for only 2.5 – 4.5 % of the total population depending on the student
success rates in Introductory Chemistry. However, when 75% of all beginning chemistry
students are being placed into Introductory Chemistry, and 44% of the successful
students decide not to enroll in General Chemistry, this voluntary attrition is removing
from 13.2% to 23.1% of the total population. These numbers are based on a student
success range of 40% - 70% for Introductory Chemistry. For any given student success
value, the absolute increase in voluntary attrition in Introductory Chemistry is up about a
factor of five. This voluntary attrition has caused Introductory Chemistry to account for a
much higher percentage of the total attrition in the overall beginning chemistry
population since the inception of the chemistry placement exam in the fall of 1999 (figure
3.7).
When total attrition (the total number of beginning chemistry students who do not
successfully complete the first semester of General Chemistry) is examined, it becomes
apparent that the mandatory placement of students into Introductory Chemistry in its
42

current form, has done at least as much harm as good for the total throughput of
successful students. In order to counter act these negative effects, methods were
developed to attempt to increase student performance in Introductory Chemistry.
Historical data strongly indicates that students who receive a grade of A or B in
Introductory Chemistry are both more likely to advance into General Chemistry (figure
3.8) and more likely to be successful in the course (figures 3.2-3.5 and table 3.1). Thus,
if the percentage of A and B students in Introductory Chemistry can be increased, then
the percentage of students who advance into and are successful in General Chemistry
should also increase.
3.2 Increasing Student Performance in
Introductory Chemistry
In order to increase the student performance and retention in Introductory
Chemistry, three different types of weekly discussion groups were developed and
integrated into the Introductory Chemistry curriculum. All students that were enrolled in
Introductory Chemistry were also required to enroll in a discussion group. The actual
discussion group format that each student was assigned to was determined by which
lecture section that student was enrolled in. Each lecture section of Introductory
Chemistry was involved in only one type of discussion group. The original plan for this
project envisioned using graduate students to lead traditional recitation sessions in a small
group format with 20 – 25 students per group. However, due to lack of personnel this
plan was not able to be implemented. Thus, the different discussion section formats
43

0
10
20
30
40
50
60
70
80
90
100
< C C B A
Grade in Introducory Chemistry
Perc
ent A
dvan
cing
into
Gen
eral
Che
mist
ry
Figure 3.8. Advancement of Introductory Chemistry Students into General Chemistry
by Student Performance in Introductory Chemistry
44
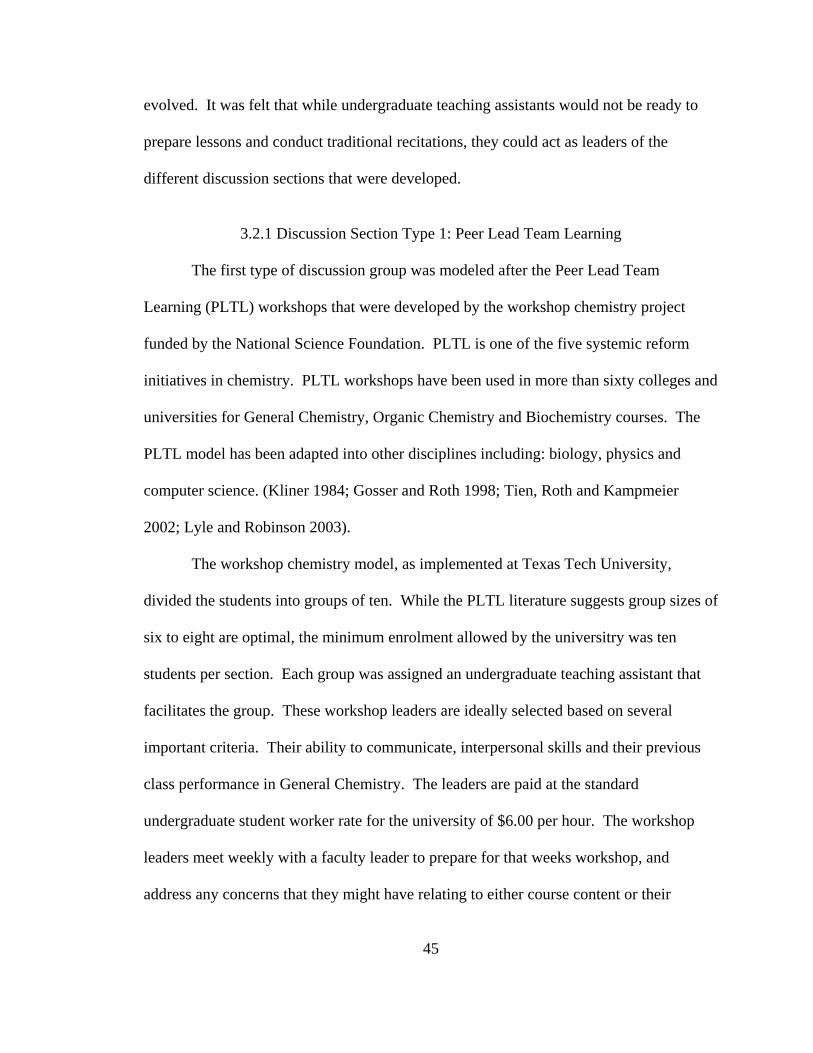
evolved. It was felt that while undergraduate teaching assistants would not be ready to
prepare lessons and conduct traditional recitations, they could act as leaders of the
different discussion sections that were developed.
3.2.1 Discussion Section Type 1: Peer Lead Team Learning
The first type of discussion group was modeled after the Peer Lead Team
Learning (PLTL) workshops that were developed by the workshop chemistry project
funded by the National Science Foundation. PLTL is one of the five systemic reform
initiatives in chemistry. PLTL workshops have been used in more than sixty colleges and
universities for General Chemistry, Organic Chemistry and Biochemistry courses. The
PLTL model has been adapted into other disciplines including: biology, physics and
computer science. (Kliner 1984; Gosser and Roth 1998; Tien, Roth and Kampmeier
2002; Lyle and Robinson 2003).
The workshop chemistry model, as implemented at Texas Tech University,
divided the students into groups of ten. While the PLTL literature suggests group sizes of
six to eight are optimal, the minimum enrolment allowed by the universitry was ten
students per section. Each group was assigned an undergraduate teaching assistant that
facilitates the group. These workshop leaders are ideally selected based on several
important criteria. Their ability to communicate, interpersonal skills and their previous
class performance in General Chemistry. The leaders are paid at the standard
undergraduate student worker rate for the university of $6.00 per hour. The workshop
leaders meet weekly with a faculty leader to prepare for that weeks workshop, and
address any concerns that they might have relating to either course content or their
45

individual groups dynamics. Student leaders are also required to keep a journal detailing
their weekly workshop experience. This journal is reviewed regularly by the faculty
leader who is in charge of coordinating the workshop sections.
The role of the workshop leader is rather unique. Their primary goal is to actively
engage students with both the course material and with each other (Gosser and Roth
1998). It is important to note that the workshop leader does not actively teach but rather
acts as a guide and facilitator who helps keep the team focused. Good student leaders
should frequently ask probing questions to the rest of the team, leading them in the
correct direction in order to meet the workshops goal for that session. One of the
primary jobs of the workshop leader is to control the overall attitude and demeanor of the
group. The group leader must create an environment where all of the group members feel
free to share their ideas and opinions in a respectful and constructive manner. It is also
important for the workshop leader to make sure that all members of the group are given
an equal opportunity to participate. Effective workshop leaders must encourage all of
their group members to become actively involved in the workshop process.
New workshop leaders are primarily recruited from students that have done well
in the first or second semester of General Chemistry. For this project we needed a total
of 30 workshop leaders for the PLTL sections. Invitations were sent out to prospective
students based on a list generated by the registrar the semester before the project was
initiated. The weekend prior to the start of classes, the student leaders were trained to
prepare them for the upcoming semesters workshops.
46

3.2.1.1 Student Leader Training All of the student leaders that were involved in this project were recruited based
on their previous performance in General Chemistry. All of the student leaders had
completed at least one semester of General Chemistry and several were advanced
undergraduate chemistry majors. The student leaders were recruited at the end of the
Spring semester of 2003 and went through initial student leader training program in early
August before the semester started in the Fall of 2004. Regardless of the type of
discussion section that they were eventually selected to lead, all of the student leaders
went through the training seminar that was developed for Peer Led Team Learning.
PLTL required the most rigorous training of the three discussion section types, however,
the training was not overly time consuming. Thus, it was decided to train all of the
undergraduate student leaders to this standard so that any of the student leaders could
teach any of the discussion section types if needed. In addition to this consideration, it
was simpler and more time efficient to just train all of the student leaders to the higher
standard of PLTL than to split them up into three separate groups for training.
Training consisted of a three hour pre-semester session that introduced the student
leaders to the overall concept and mechanics of workshop chemistry. This was followed
by weekly ninety – minute staff meetings. One of the primary goals of the workshop
leader training was to ensure that the educational process stayed student centered.
Without detailed training in active learning techniques, it is quite common for students to
teach the way that they have been taught. It was very important to impress upon the
workshop leaders that their role in the workshops was not to be a recitation lecturer or a
47

tutor, but rather a group facilitator. Workshop leader training covered three major areas:
group dynamics, pedagogy and chemistry content. Some of specific areas that were
covered in training include sessions on learning styles, cognitive development, leadership
development, conflict resolution, cultural and gender differences and how to best address
these areas within the workshop environment
During these sessions the basic pedagogical ideas behind Peer Led Team
Learning are examined in detail. The undergraduate student leaders responsibilities are
established and modeled with other student leaders, and the importance of active problem
solving is heavily emphasized. A typical training session is outlined below, with the
actual training materials located in Appendix B.
1. Welcome to the Training Session and Ice Breakers 2. What is a PLTL Workshop?
a. Organization b. Goals
3. A closer look at the model a. What PLTL workshops are not b. Active learning
4. How Many How Often a. Group size b. Meeting times c. Locations
5. What? No answer key a. Leader expectations b. Student expectations c. Teamwork d. Real problem solving
48

6. The role of a student leader a. Expert in learning chemistry b. Facilitator c. Collaborative learning guide d. Coach e. Troubleshooter f. Role model
7. Interpersonal Skills a. Voice and speech b. Body language c. Listening d. Drawing out group members
8. The First Day a. Preparation b. Room arrangement c. The first meeting d. Attendance e. Ice breaker f. Introduction g. Getting started h. Direct discussion back to the group i. Breaks and snacks j. Closing k. Journal entries
9. Leader to Leader Advice a. The first day b. Student-Leader relationships c. How do I handle the student who gets everything right? d. Helping a group that won’t talk much e. Dealing with a question that stumps the leader
10. The Student Leader Contract
Once the student leaders have completed the initial training program they are
required to meet weekly for 90 minutes with the faculty coordinator of the discussion
sections. The purpose of these meetings are to debrief and discuss any issues that may
have developed over the past week and prepare for the next weeks session. The weekly
49

meetings normally consist of three parts; each about a half an hour long. The first 30
minute section is used to discuss the past weeks activities and group dynamics, including
any problems that the student leaders may have had. This time is also used for the
student leaders to suggest any ideas that they may have developed to improve the past
weeks lessons for the next generation of student leaders. The second 30 minute section is
used to discuss pedagogy and specific learning strategies that may help the students in the
upcoming workshop. Finally, the last 30 minutes is devoted to chemistry review and
presentation of the next weeks lesson. Early in the semester more time in the weekly
meetings is spent on group dynamics. As the semester progresses, and the leaders
become more comfortable with their groups, the emphasis shifts towards pedagogy and
content.
3.2.1.2 Peer Led Team Learning Specifics
The Peer Lead Team Learning workshops primary focus is on team work and the
development of high level problem solving skills. Due to this fact, the exercises that
these groups perform tend to be of a significantly higher difficulty level than any of the
other groups. The PLTL groups used a Introductory Chemistry workbook developed by
Dr. Robert Blake, Texas Tech University, that was designed to integrate directly with the
subjects and materials that were being presented in the students lecture course. A variety
of approaches were used to develop the problems and exercises that were incorporated
into this workbook and are listed in table 3.2.
It is important to note that the students were not given answers to any of the
workshop exercises. PLTL is much more concerned with developing problem solving
50

Table 3.2. Problem Development Approaches used in Peer Led Team Learning Exercises
Problem Type
1 Problems based on real life issues that relate to the students
2 Problems based on the interpretation of data sets and graphs
3 Problems using molecular models
4 Reflective problem solving
5 Structured or Stepwise problems
6 Problems requiring extrapolation into a new idea or area of thought
51

skills and fostering team working skills than with specific content knowledge. Due to
this fact, providing an answer key would be counter productive to the workshop process.
One of PLTL’s primary goals is for the students to develop an understanding of how they
had solved a problem which in turn develops self confidence and reduces the need for
external validation. It was observed that in many cases if an answer is available,
students will reverse engineer a process to obtain this answer without ever really
understanding the underlying concepts or to simply be satisfied that they have the right
answer.
The PLTL workshops met once per week for two hours. Grades for the PLTL
groups were assigned on two criteria, attendance and active participation in the group,
and the completion of the pre-workshop homework. The grading criteria were equally
weighted, five points each for a total of ten points per session. Students who were absent
received no credit. Students who were late received half credit for attendance, but could
turn their homework and participate in the workshop. Students who refused to participate
in the group or missed a significant portion of the workshop, received only half credit for
attendance. Students who had not attempted the homework received no credit. Students
who had attempted but not completed the homework received half credit while students
who had completed the homework received full credit. Thus, the possible scores that a
student could receive in the PLTL workshops were 0, 2.5, 5 , 7.5 and 10. There were
normally 12 PLTL sessions offered over the course of a semester, therefore, each session
counted for 0.83% of the students final grade. Some sample chapters of this workbook
are found in appendix C. The primary costs for the PLTL sections are the cost of the
52
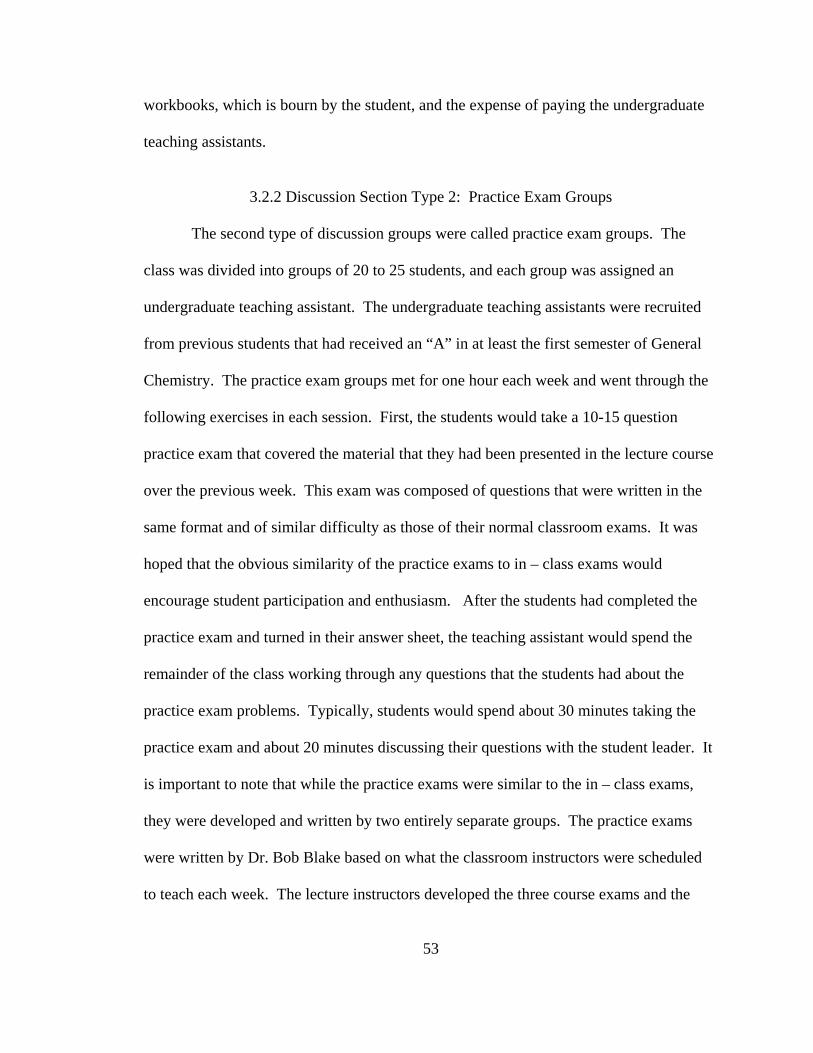
workbooks, which is bourn by the student, and the expense of paying the undergraduate
teaching assistants.
3.2.2 Discussion Section Type 2: Practice Exam Groups
The second type of discussion groups were called practice exam groups. The
class was divided into groups of 20 to 25 students, and each group was assigned an
undergraduate teaching assistant. The undergraduate teaching assistants were recruited
from previous students that had received an “A” in at least the first semester of General
Chemistry. The practice exam groups met for one hour each week and went through the
following exercises in each session. First, the students would take a 10-15 question
practice exam that covered the material that they had been presented in the lecture course
over the previous week. This exam was composed of questions that were written in the
same format and of similar difficulty as those of their normal classroom exams. It was
hoped that the obvious similarity of the practice exams to in – class exams would
encourage student participation and enthusiasm. After the students had completed the
practice exam and turned in their answer sheet, the teaching assistant would spend the
remainder of the class working through any questions that the students had about the
practice exam problems. Typically, students would spend about 30 minutes taking the
practice exam and about 20 minutes discussing their questions with the student leader. It
is important to note that while the practice exams were similar to the in – class exams,
they were developed and written by two entirely separate groups. The practice exams
were written by Dr. Bob Blake based on what the classroom instructors were scheduled
to teach each week. The lecture instructors developed the three course exams and the
53

cumulative final as a group without prior knowledge of the questions that were on the
practice exams.
The undergraduate teaching assistants would meet with a faculty advisor weekly
to discuss the material contained in the practice exam for that week, and to clarify any
content or conceptual questions that they might have before they met with their student
groups. The students performance in the practice exam groups accounted for 10% of
their total grade in Introductory Chemistry. The students were told that those students
who attended the practice exam sessions and scored at least 50% on the exam would
received full credit for that week. The students were told that if they scored less that 50%
on the exam they would receive only 70% credit for that weeks meeting. In reality, for
logistical reasons, all of the students that participated received full credit for each week
they participated. Three of the twelve practice exams that were used are found in
appendix D. The primary costs associated with the practice exam sections are the cost of
copying the exams, Scantrons, and the expense of paying the undergraduate teaching
assistants.
3.2.3 Discussion Section Type 3: LearnStar
The final type of discussion section format utilized was a computer based
educational system called LearnStar. The LearnStar program was modeled after the NTN
trivia systems that are used commercially for entertainment purposes. Each student uses
a wireless control keyboard that allows them to log into the system and compete in the
learning modules. The learning modules were developed by the research group to
specifically address the concepts that were being taught in the Introductory Chemistry
54
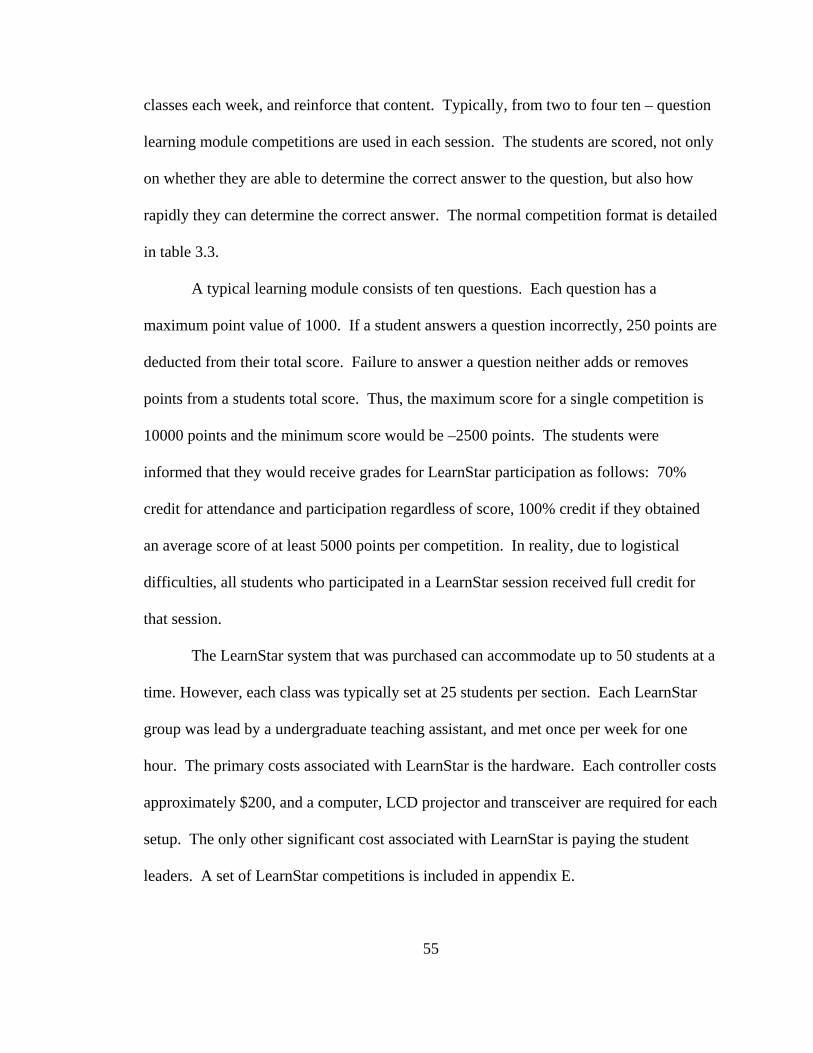
classes each week, and reinforce that content. Typically, from two to four ten – question
learning module competitions are used in each session. The students are scored, not only
on whether they are able to determine the correct answer to the question, but also how
rapidly they can determine the correct answer. The normal competition format is detailed
in table 3.3.
A typical learning module consists of ten questions. Each question has a
maximum point value of 1000. If a student answers a question incorrectly, 250 points are
deducted from their total score. Failure to answer a question neither adds or removes
points from a students total score. Thus, the maximum score for a single competition is
10000 points and the minimum score would be –2500 points. The students were
informed that they would receive grades for LearnStar participation as follows: 70%
credit for attendance and participation regardless of score, 100% credit if they obtained
an average score of at least 5000 points per competition. In reality, due to logistical
difficulties, all students who participated in a LearnStar session received full credit for
that session.
The LearnStar system that was purchased can accommodate up to 50 students at a
time. However, each class was typically set at 25 students per section. Each LearnStar
group was lead by a undergraduate teaching assistant, and met once per week for one
hour. The primary costs associated with LearnStar is the hardware. Each controller costs
approximately $200, and a computer, LCD projector and transceiver are required for each
setup. The only other significant cost associated with LearnStar is paying the student
leaders. A set of LearnStar competitions is included in appendix E.
55

Table 3.3. Normal Competition Format for LearnStar
Sequence Number
Action
1 The students log in to the system
2
The LearnStar competition is started
3 The question appears on the screen for a set amount of time
4 The question and the possible answers appear in the screen for a set amount of time
5 The timer starts and the point value of the question begins to drop
6 Clues begin to appear every few seconds
7 Time runs out and the correct answer is shown
8 Points are awarded for all correct answers and points are removed for all incorrect answers
9 Each student receives feedback on their controller as to their score on the question and their total score
10 The top ten scores are displayed on the screen
11 The next question starts or after all the questions have been given the competition is over.
Note: Typically 2 – 4 Competitions can be run in a 50 minute session
56

3.3 Experimental Design
All of the students enrolled in Introductory Chemistry were required to be in one
of the three discussion section types. The type of discussion group that they were
assigned to was determined by which lecture section they were enrolled in. Each lecture
section was only involved with a single type of discussion section format. The students
were not made aware of which type of discussion section they were going to be assigned
to in the catalog, however, a description of the different discussion section types was
posted on the chemistry website. All of the discussion section types were simply labeled
as discussion groups on the course schedule. The degree of self selection is not known.
The experimental group for this study consisted of six sections of Introductory
Chemistry offered in the Fall of 2003 with the average class size of 201 students. All six
of the of the Introductory Chemistry classes used common exams and finals that were
administered at the same time. All lecture sections used the same textbook, “Basic
Chemistry 5th Edition” by Stephen Zumdahl (Zumdahl 2004). This text has been in use
in various editions since 1996. All six classes used common grading scales and
techniques. Participation in the discussion sections amounted to 10% of the students total
grade in the course. There were a total of 1207 students involved in the experimental
group. The student distributions and discussion section assignments are detailed in table
3.4.
Four professors taught the six sections of Introductory Chemistry offered in the
Fall of 2003. Two professors, Dr. Blake and Dr Tomlinson, each taught two sections. In
order to eliminate as many confounding variables as possible, each of the four professors
57
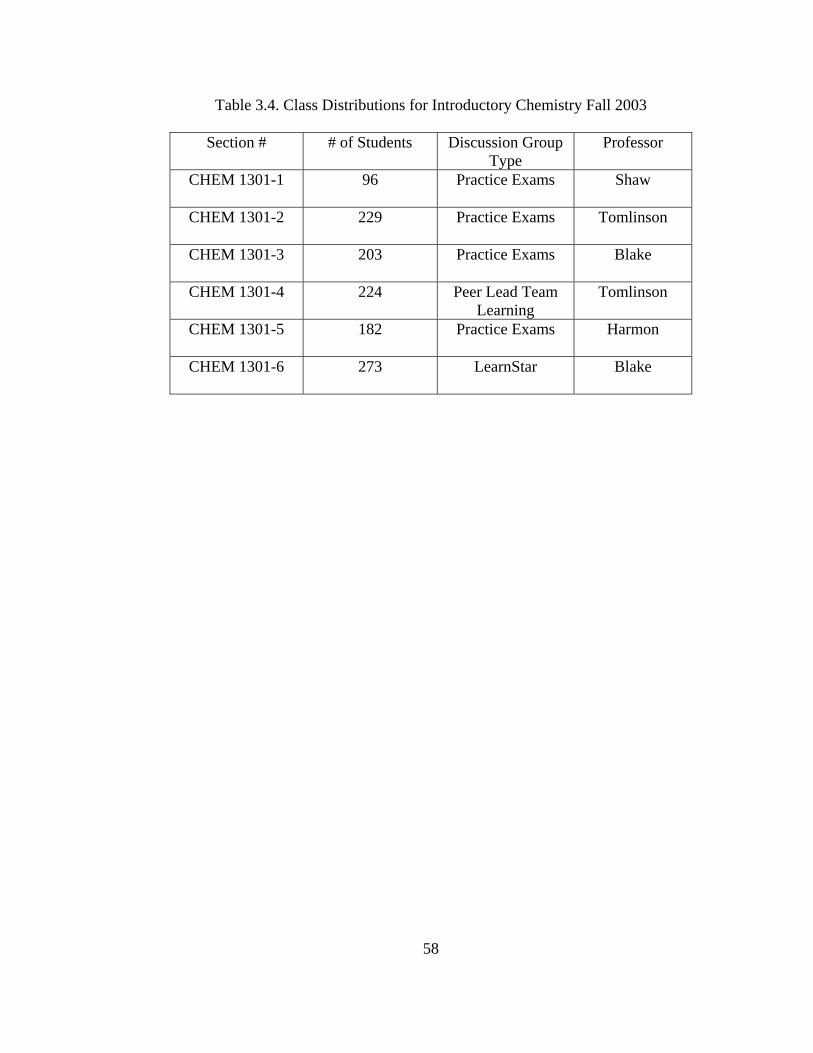
Table 3.4. Class Distributions for Introductory Chemistry Fall 2003
Section # # of Students Discussion Group Type
Professor
CHEM 1301-1
96 Practice Exams Shaw
CHEM 1301-2
229 Practice Exams Tomlinson
CHEM 1301-3
203 Practice Exams Blake
CHEM 1301-4
224 Peer Lead Team Learning
Tomlinson
CHEM 1301-5
182 Practice Exams Harmon
CHEM 1301-6
273 LearnStar Blake
58

taught a section of Introductory Chemistry that had the practice exam discussion groups
assigned to it. Dr. Blake also taught the LearnStar section and Dr. Tomlinson also taught
the PLTL section. This allowed the study to take variances in performance due to
professor into account by cross comparing all three types of discussion groups.
In order to evaluate the effectiveness of the discussion groups on Introductory Chemistry,
a historical control group of Introductory Chemistry classes from the Fall of 2000 was
examined. The control group consisted of four lecture sections taught by four different
instructors and contained a total of 1076 students. Again, the same text book
(Zumdahl Basic Chemistry 4th Edition) was used and all four instructors used common
exams and similar grading procedures.
The performance of the Fall 2003 experimental groups was compared to the
performance of the Introductory Chemistry classes from the Fall of 2000 for a number of
variables described in table 3.4. It is worthy of note, that over the past few years, there
have been noticeable differences between the quality of the students in the Fall
Introductory Chemistry sections and the Spring Introductory Chemistry sections. It is
hypothesized that this difference is due to the way students are assigned into the classes
and the fact that the Spring section is off sequence. It has been determined that the Fall
sections of Introductory Chemistry tend to perform slightly better than do the Spring
sections both academically (exam scores and final grades) and in terms of DFW rate.
Thus, we chose to compare only the performance of Fall semesters to those of other Fall
semesters so that the results would not be skewed by systematic differences in student
performance by semester.
59

3.5 Results: Student Performance in Introductory Chemistry
There were positive effects from the discussion sections on student academic
performance in Introductory Chemistry. Performance for each discussion section type in
the Fall of 2003 was evaluated in eight areas (four individual exams, course grade, DFW
rate, voluntary attrition and total longitudinal attrition) directly related to Introductory
Chemistry. This data was then compared to the performance of the historical control
group from the Fall of 2000. The eight areas that were evaluated are detailed in table 3.5.
The full statistical reports for these analyses are found in appendix F.
3.5.1 Results for Practice Exam Sections
It was determined that the students involved in the practice exam sections
performed significantly higher (ANOVA p<0.001) on the three normal lecture exams by
14.4%, 9.4% and 19.4% respectively than the control group (figure 3.9). The students
participating in the practice exam sections also performed significantly higher (ANOVA
p<0.001) on the cumulative final examination with an increase of 11.2% and received a
significantly higher (ANOVA p<0.001) final course grade average with an increase of
11.5% over the control group (figure 3.9). The overall DFW rate, which is the
percentage of Introductory Chemistry students that do not successfully complete the
course with a grade of C or better, for the practice exam sections was significantly lower
(Z – test p<0.001) at 29.2% as compared to 48.8% for the control group (figure 3.10).
The voluntary attrition rate, which is the percentage of successful students who elect not
to enroll into General Chemistry, for the practice exam sections was also significantly
60

Table 3.5. Areas of Evaluation for Discussion Sections with Respect to Introductory Chemistry
Attribute Explanation Statistical Analysis
Student Performance on Exam 1
Average student score on the first exam in Introductory Chemistry
ANOVA
Student Performance on Exam 2
Average student score on the second exam in Introductory Chemistry
ANOVA
Student Performance on Exam 3
Average student score on the third exam in Introductory Chemistry
ANOVA
Student performance on the cumulative final exam
Average student score on the cumulative final exam in Introductory Chemistry
ANOVA
Overall Student Performance in Introductory Chemistry
Average grade for the entire course including all exams, homework, quizzes etc.
ANOVA
Overall DFW rate
The percentage of students who received a grade of D, F or withdrew from the class.
Z – Test For
Ratios Voluntary Attrition
The percentage of successful students who elected not to advance into General Chemistry
Z – Test For
Ratios Total Longitudinal Attrition
The total percentage of Introductory Chemistry students who do not enroll in General Chemistry in the following Semester
Z – Test For
Ratios
61

0.00
10.00
20.00
30.00
40.00
50.00
60.00
70.00
80.00
90.00
Exam 1 Exam 2 Exam 3 Final Course Grade
Perc
ent
Control Sections Practice Exam Sections
Figure 3.9. Student Performance in Introductory Chemistry: Practice Exam Sections versus Control
0.00
10.00
20.00
30.00
40.00
50.00
60.00
70.00
80.00
DFW Rate Voluntary Attrition Total Attrition
Perc
ent
Control Sections Practice Exam Sections
Figure 3.10. DFW and Attrition Rates in Introductory Chemistry: Practice Exam Sections versus Control
62

lower (Z – test p<0.001) at 13.5%, while the voluntary attrition rate for the control group
averaged 37.1%. The total longitudinal attrition rate, which is percentage of Introductory
Chemistry students who do not enroll into General Chemistry in the following semester,
for the practice exam sections was significantly lower (z – test p<0.001) at 33.4% as
compared to 67.8% for the control group (figure 3.10). It should be noted that the total
longitudinal attrition rate is only the percentage of students who do not make it into
General Chemistry from Introductory Chemistry. The total longitudinal attrition does not
take the number of students who fail to complete General Chemistry into account. The
overall effects of the practice exam sections on Introductory Chemistry are summarized
in table 3.6.
3.5.2 Results for Peer Led Team Learning Sections
The Peer Led Team Learning (PLTL) groups also performed extremely well as
compared to the control groups. Students participating in the PLTL workshop sections
performed significantly higher (ANOVA p<0.001) on the three normal lecture exams by
11.7%, 10.7% and 19.6% respectively than the control group sections (figure 3.11). The
students in the PLTL sections also performed significantly higher (ANOVA p<0.001) on
the cumulative final examination with an increase of 13.6% and received a significantly
higher (ANOVA p<0.001) final grade with an increase of 12.2% with respect to the
control group (figure 3.11). The overall DFW rate for the PLTL sections was
significantly lower (Z – test p<0.001) at 29.5% as compared to 48.8% for the control
group (figure 3.12). The voluntary attrition rate for the PLTL sections was significantly
lower (Z – test p<0.001) at 13.3% while the voluntary attrition rate for the control group
63

Table 3.6. Summary of Results for Practice Exam Sections Effect on Performance in Introductory Chemistry
Variable
Practice Exam Sections Fall 2003
A
Control Group Fall 2000
B
Difference
(A – B) Student Performance on Exam 1
82.5%
68.1%
14.4% ANOVA p<0.001
Significant Difference Student Performance on Exam 2
70.2%
60.8%
9.4% ANOVA p<0.001
Significant Difference Student Performance on Exam 3
68.6%
49.2%
19.4% ANOVA p<0.001
Significant Difference Student Performance on the Cumulative Final Exam
68.3%
57.1%
11.2% ANOVA p<0.001
Significant Difference Overall Student Performance in Introductory Chemistry
73.0%
61.5%
11.5% ANOVA p<0.001
Significant Difference Overall DFW rate
29.2%
48.8%
19.6% Z = 8.26, p<0.001
Significant Difference Voluntary Attrition
13.5%
37.1%
23.6% Z = 8.71, p<0.001
Significant Difference Total Longitudinal Attrition
33.4%
67.8%
34.4% Z = 14.2, p<0.001
Significant Difference
64

0.00
10.00
20.00
30.00
40.00
50.00
60.00
70.00
80.00
90.00
Exam 1 Exam 2 Exam 3 Final Course Grade
Perc
ent
Control Sections Peer Lead Team Learning Sections
Figure 3.11. Student Performance in Introductory Chemistry: Peer Led Team Learning Sections versus Control
0.00
10.00
20.00
30.00
40.00
50.00
60.00
70.00
80.00
DFW Rate Voluntary Attrition Total Attrition
Perc
ent
Control Sections Peer Lead Team Learning Sections
Figure 3.12. DFW and Attrition Rates in Introductory Chemistry: Peer Led Team Learning Sections versus Control
65

averaged 37.1%. The total longitudinal attrition rate for the PLTL sections was also
significantly lower (Z – test p<0.001) at 30.4% as compared to 67.8% for the control
group (figure 3.12). The overall effects of the PLTL sections on Introductory Chemistry
are summarized in table 3.7.
3.5.3 Results for LearnStar Sections
The performance of the students involved in the LearnStar program was also
comparable to the two other types of discussion sections. Students that participated in
the LearnStar sections performed significantly higher (ANOVA p<0.001) on the three
normal lecture exams by 13.3%, 9.1% and 22.6% respectively when compared to the
Fall 2000 control group (figure 3.13). The students involved in LearnStar also performed
significantly higher (ANOVA p<0.001) on the cumulative final when compared to the
control group, with an increase in performance of 12.8%. LearnStar students received a
significantly higher final grade (ANOVA p<0.001) with an increase of 12.1% with
respect to the control group (figure 3.13). The overall DFW rate for the LearnStar
sections was significantly lower (z – test p<0.001) at 32.2% as compared to 48.8% for the
control group (figure 3.14). The voluntary attrition rate for the LearnStar sections was
significantly lower (z – test p<0.001) at 18.4% while the voluntary attrition rate for the
control group averaged 37.1%. The total longitudinal attrition rate for the LearnStar
sections was significantly lower (z – test p<0.001) at 36.6% as compared to 67.8% for the
control group (figure 3.14). The overall effects of the LearnStar sections on Introductory
Chemistry are summarized in table 3.8
66

Table 3.7. Summary of Results for Peer Led Team Learning Sections Effect on Performance in Introductory Chemistry
Variable
Peer Led Team Learning Sections Fall 2003
A
Control Group Fall 2000
B
Difference
(A – B) Student Performance on Exam 1
79.9%
68.1%
11.7% ANOVA p<0.001
Significant Difference Student Performance on Exam 2
71.5%
60.8%
10.7% ANOVA p<0.001
Significant Difference Student Performance on Exam 3
68.9%
49.2%
19.6% ANOVA p<0.001
Significant Difference Student Performance on the Cumulative Final Exam
70.7%
57.1%
13.6% ANOVA p<0.001
Significant Difference Overall Student Performance in Introductory Chemistry
73.5%
61.5%
12.2% ANOVA p<0.001
Significant Difference Overall DFW rate
29.5%
48.8%
19.3% Z = 5.29, p<0.001
Significant Difference Voluntary Attrition
13.3%
37.1%
23.8% Z = 5.65, p<0.001
Significant Difference Total Longitudinal Attrition
30.4%
67.8%
37.4% Z = 10.5, p<0.001
Significant Difference
67

0.00
10.00
20.00
30.00
40.00
50.00
60.00
70.00
80.00
90.00
Exam 1 Exam 2 Exam 3 Final Course Grade
Perc
ent
Control Sections Learn Star Sections
Figure 3.13. Student Performance in Introductory Chemistry: LearnStar Sections versus Control
0.00
10.00
20.00
30.00
40.00
50.00
60.00
70.00
80.00
DFW Rate Voluntary Attrition Total Attrition
Perc
ent
Control Sections Learn Star Sections
Figure 3.14. DFW and Attrition Rates in Introductory Chemistry: LearnStar Sections versus Control
68

Table 3.8. Summary of Results for LearnStar Sections Effect on Performance in Introductory Chemistry
Variable LearnStar Sections
Fall 2003 A
Control Group Fall 2000
B
Difference
(A – B) Student Performance on Exam 1
81.4%
68.1%
13.3% ANOVA p<0.001
Significant Difference Student Performance on Exam 2
69.9%
60.8%
9.1% ANOVA p<0.001
Significant Difference Student Performance on Exam 3
71.9%
49.2%
22.6% ANOVA p<0.001
Significant Difference Student Performance on the Cumulative Final Exam
69.9%
57.1%
12.8% ANOVA p<0.001
Significant Difference Overall Student Performance in Introductory Chemistry
73.6%
61.5%
12.1% ANOVA p<0.001
Significant Difference Overall DFW rate
32.2%
48.8%
16.6% Z = 4.91, p<0.001
Significant Difference Voluntary Attrition
18.4%
37.1%
19.7% Z = 4.58, p<0.001
Significant Difference Total Longitudinal Attrition
36.6%
67.8%
31.2% Z = 9.44, p<0.001
Significant Difference
69

3.5.4 Comparisons Between Discussion Group Types in Introductory Chemistry
While all three types of discussion section formats made very significant impacts
on student performance and retention in Introductory Chemistry, a detailed comparison of
the different types of discussion sections performance against each other could be
valuable in determining which discussion group format was the most effective. In order
to accomplish this, several sets of statistical analysis were performed comparing the three
different discussion section formats to each other. These analysis are detailed in table
3.5. The full statistical reports for these analyses are found in appendix F.
It was determined that the students involved in the practice exam sections performed
significantly higher (ANOVA p<0.05) on only the first of the three normal lecture exams
by 2.7% with respect to the PLTL sections, and that there was no significant difference
on any of the other exams including the final (ANOVA p>0.05) with respect to either
LearnStar or PLTL sections. There was no significant difference in the final grade
(ANOVA p>0.05) between any of the discussion section types (figure 3.15). In fact all
three discussion section types had final grades with 0.5% of each other. There was no
significant difference in the overall DFW rates for the different discussion section types
with practice exam sections at 29.15% as compared to 29.46% for PLTL and 32.23% for
LearnStar (Z – Test p>0.05). The voluntary attrition rates also showed no significant
differences (Z – Test p>0.05) ranging from a high of 18.38% for LearnStar to a low of
13.29% for PLTL with practice exam sections falling in the middle at 13.48%. The total
longitudinal attrition rates for the practice exam sections was 33.37%, with
70

0
10
20
30
40
50
60
70
80
90
Exam 1 Exam 2 Exam 3 Final Course Grade
Perc
ent
Practice Exam Sections PLTL Sections Learn Star Sections
Figure 3.15. Student Performance in Introductory Chemistry: Comparison by Discussion Section Type
71

30.36% for PLTL and 36.63% for LearnStar (figure 3.16) again showing no significant
difference between the groups (Z – Test p>0.05).
3.5.5 Summary of Student Performance in
Introductory Chemistry
Based on these results we have determined that all three types of discussion
sections are highly effective and provide significant increases in student performance in
Introductory Chemistry. In addition, all three types of discussion groups have shown
significant decreases (Z – Test p<0.001) in the DFW rates in Introductory Chemistry and
a significantly increased (Z – Test p<0.001) level of student retention into General
Chemistry. While there are some minor differences in student performance, DFW and
attrition rates in Introductory Chemistry with respect to the three different discussion
section formants, there are virtually no statistically valid significant differences in any of
the variables that were evaluated. Thus, it is postulated that there is no significant
difference in performance, student success or attrition in Introductory Chemistry between
the three different types of discussion sections that were evaluated.
3.6 Participation in Discussion Sections
It has been shown that participation in class activities and attendance can have a
significant effect on students overall success or failure in a course (Durden and Ellis
1995; House 1994; Marburger 2001 and Romer 1993). Due to this fact, it was decided
that the overall participation percentage for each of the discussion sections should be
calculated and examined to determine if there were any significant differences in
participation with respect to discussion section type. The results are detailed in table 3.9
72

0
10
20
30
40
50
60
70
80
90
100
DFW Rate Voluntary Attrition Total Attrition
Perc
ent
Practice Exam Sections PLTL Sections Learn Star Sections
Figure 3.16. DFW and Attrition Rates in Introductory Chemistry: Comparison by Discussion Section Type
Table 3.9. ANOVA Analysis of Student Participation Levels in Discussion Sections by Discussion Section Type
N
Average
ParticipationPractice Exams
PLTL Learn Star
Practice Exams
224 85.7% N/A P = .603 No Sig. Diff.
P = .603 No Sig. Diff.
PLTL
710 84.8% P = .603 No Sig. Diff.
N/A P = .561 No Sig. Diff.
LearnStar
273 83.6% P = .195 No Sig. Diff.
P = .561 No Sig. Diff.
N/A
Total
1207 85.0% N/A N/A N/A
73

It is apparent from this data that the overall level of participation in the discussion
sections was high, averaging 85%, and that there is no significant difference in
participation in between the three different discussion section types.
3.7 Post Test and Removal of Intervention
After successful implementation, the discussion sections were removed from the
Introductory Chemistry curriculum after the Fall of 2004. The first set of grade data from
the Spring 2005 semester has been collected and analyzed. While there are some slight
differences in performance between the Fall and Spring semester classes, this data clearly
indicates a return to baseline performance after the intervention was removed.
A total of 429 Introductory Chemistry students enrolled in the course in the
Spring of 2005. They were compared to several control groups and the three
experimental groups to evaluate the effect of removing the discussion sections from the
curriculum. It was determined that there was no significant difference between the Fall
2000 control group and the Spring 2005 group with respect to either total class grade or
DFW rate at the 99% confidence interval. However, there were significant differences
between the three discussion section groups and the Spring 2005 group in class
performance on the three lecture exams, the comprehensive final and in overall class
grade. In all cases the three experimental groups significantly outperformed the Spring
2005 classes at the 99.9% confidence interval. The three discussion section groups also
had significantly lower DFW rates than the Spring 2005 groups. These results are
detailed in tables 3.10 and 3.11 and clearly show that the removal of the discussion
sections returned student performance and success rates to their previous low levels.
74

Table 3.10. Comparisons of DFW Rates in Introductory Chemistry by Discussion Section Type versus Pre and Post Control Groups. (Z-Test for Ratios)
N DFW Rate Significance vs. Pre -Test Control
Significance vs. Post -Test Control
Pre-Test Control Fall 2000
1076
48.8%
N/A
Z = -1.28, p > 0.05 No Significant Difference
Practice Exams Fall 2003
710
29.2%
Z = 8.26, p < 0.001 Significant Difference
Z = 7.85, p < 0.001 Significant Difference
Peer Led Team Learning Fall 2003
224
29.5%
Z = 5.29, p < 0.001 Significant Difference
Z = 5.61, p < 0.001 Significant Difference
LearnStar Fall 2003
273
32.2%
Z = 4.91, p < 0.001 Significant Difference
Z = 5.25, p < 0.001 Significant Difference
Post Test Control Spring 2005
429
52.4%
Z = -1.28, p > 0.05 No Significant Difference
N/A
Table 3.11. Comparisons of Student Performance in Introductory Chemistry by Discussion Section versus Pre and Post Control Groups
N Exam 1 Exam 2 Exam 3 Final Grade Pre-Test Control Fall 2000
1076
68.1%
60.8%
49.2%
57.1%
61.5%
Practice Exams Fall 2003
710
82.5%a,b
70.2%a,b
68.6%a,b
68.3%a,b
73.0%a,b
PLTL Fall 2003
224
79.9%a,b
71.5%a,b
68.9%a,b
70.7%a,b
73.5%a,b
LearnStar Fall 2003
273
81.4%a,b
69.9%a,b
71.9%a,b
69.9%a,b
73.6%a,b
Post Test Control Spring 2005
429
63.0%
56.0%
59.6%
49.5%
59.0%
a Significantly higher than pre-test control group for this variable p<0.001 b Significantly higher than post-test control group for this variable p<0.001
75

3.8 Conclusions
The results from this study clearly indicate that the discussion sections had a
significant positive impact on student performance and retention in Introductory
Chemistry. The data also indicates that there was no significant difference in
performance between the three discussion section types. The average student
performance for all three of the discussion section formats significantly outperformed the
Fall 2000 control group in every aspect of class performance that was studied (lecture
exams, cumulative final exam and course grade). DFW rates and student retention into
General Chemistry were also significantly improved. Voluntary attrition fell significantly
from 37.1% to an average of 14.4%, and the total longitudinal attrition into General
Chemistry dropped from 67.8% to an average of 33.5% for the three experimental
groups. The results were further verified by the removal of the discussion sections from
the curriculum. After the discussion sections were removed in the Spring 2005 semester,
the student performance and DFW rates returned to the previous baseline established in
the Fall 2000 semester. Thus, it is concluded that the three discussion section formats
were equally and significantly effective in improving performance and retention in
Introductory Chemistry.
76
3.9 Works Cited
Brown, LeMay and Bursten. Chemistry the Central Science. 9th Edition. Upper Saddle River, New Jersey: Pearson Education Inc., 2003.
Durden, G. and Ellis, L. “The effects of attendance on student learning in principals of
economics.” American Economic Review Papers and Proceedings, vol. 85 1995, pp. 343-346.
Gellene, Gregory and Bentley, Andrea. “A Six-Year Study of the Effects of a Remedial
Course in the Chemistry Curriculum.” Journal of Chemical Education, vol. 82 no.1, January 2005, pp. 125-130.
Gosser, David and Roth, Vicki. “The Workshop Chemistry Project: Peer-Led Team
Learning.” Journal of Chemical Education, vol. 75 no.2, February 1998, pp. 185-187.
House, J. D. “Student motivation and achievement in college chemistry.” International
Journal of Instructional Media, vol. 21 1994 no.1, pp. 1-11. Kliner, Cary. “Let Your Students Teach Themselves Chemistry.” Journal of Chemical
Education, vol. 61 no.5, May 1984, pp. 185-187. Lyle, Kenneth and Robinson, William. “A Statistical Evaluation: Peer-Led Team
Learning in an Organic Chemistry Course.” Journal of Chemical Education, vol. 80 no.2, February 2003, pp. 132-134.
Marburger, D. “Absenteeism and undergraduate exam performance.” The Journal of
Economic Education, vol. 32 2001, no.2, pp. 99-109. National Center for Education Statistics. “Remedial Education at Higher Education
Institutions, Fall 1995.” U.S Department of Education , Office of Educational Research and Improvement. 1996
Romer, D. “Do Students go to class? Should they?” Journal of Economic Perspectives
vol. 7 1993, pp. 167-174. Tien, Lydia; Roth, Vicki and Kampmeier, J.A. “Implementation of a Peer-Led Team
Learning Approach in an Undergraduate Organic Chemistry Course.” Journal of Research in Science Teaching, vol. 39 no.7, 2002, pp. 606-632.
University Catalog 2005. Texas Tech University, Lubbock, TX, 2005.
77

Valverde, Gilbert and Schmidt, William “Refocusing U.S. Math and Science Education.” Issues in Science and Technology, vol. 60, Winter 1997-1998, pp.6-13.
Zumdahl, Steven. Basic Chemistry. 5th Edition. New York, NY: Houghton Mifflin,
2004.
78

CHAPTER IV
THE LONGITUDINAL EFFECTS OF DISCUSSION SECTIONS
ON STUDENT PERFORMANCE IN GENERAL CHEMISTRY
4.1 Introduction
One of the fundamental hypothesis that was developed at the onset of this project
was that if student performance in Introductory Chemistry could be improved, then
student performance in General Chemistry would also be improved. Since the only
reason for the existence of Introductory Chemistry is to prepare students to succeed in
General Chemistry, it is vital to determine if there are any positive or negative effects of
the discussion sections on student performance in General Chemistry. In fact, if there are
not significant, positive, longitudinal effects from the discussion sections into General
Chemistry, there is no practical reason to spend the resources necessary to implement the
discussion sections in Introductory Chemistry.
It is especially important to evaluate the longitudinal effects of the discussion
sections on General Chemistry due to the fact that an average of 75% of the General
Chemistry population is composed of students who have successfully completed
Introductory Chemistry in the preceding semester. The remainder of the General
Chemistry population is made up of students who either passed the chemistry placement
exam (average of 22%) or students who had passed Introductory Chemistry earlier than
the previous semester (average of 3%). Results from the previous chapter indicate that
the percentage of students entering General Chemistry from Introductory Chemistry have
increased significantly due to the implementation of the discussion sections.
79

4.2 Experimental Design
The longitudinal effects of the discussion sections on General Chemistry were
evaluated in two ways. First, the General Chemistry performance of the students from
the three different discussion section types were compared to a historical control group
consisting of the four General Chemistry courses taught in the Spring of 2001 (N = 692).
This control group was selected since these General Chemistry classes immediately
followed the Fall 2000 control group that was used in the Introductory Chemistry studies.
The students from the Fall 2000 classes would have advanced into General Chemistry in
the Spring of 2001. Student performance on exams, overall course grade and DFW rates
were evaluated. The variables that were evaluated and the statistical analysis that were
used for each evaluation are detailed in table 4.1. Secondly, the performance of the
students from the different discussion section types were compared to current students in
the same classes that had been admitted into General Chemistry by passing the chemistry
placement exam (N = 193). This second control group was selected based on a previous
six year study that showed that there was no significant difference in performance
between students who had passed Introductory Chemistry and those students who had
passed the chemistry placement exam (Gellene and Bentley 2005). Since the students
who had passed the placement exam were enrolled in the same General Chemistry classes
with the same professors as the students from the discussion section groups, it was felt
that they would provide an excellent standard of reference for comparison. This second
control group was also compared to the Spring 2001 control group in terms of overall
80

Table 4.1. Areas of Evaluation for Discussion Sections with Respect to General Chemistry:
Attribute Explanation Statistical Analysis
Student Performance on Exam 1
Average student score on the first exam in General Chemistry
ANOVA
Student Performance on Exam 2
Average student score on the second exam in General Chemistry
ANOVA
Student Performance on Exam 3
Average student score on the third exam in General Chemistry
ANOVA
Student performance on the cumulative final exam
Average student score on the cumulative final exam in General Chemistry
ANOVA
Overall Student Performance in General Chemistry
Average grade for the entire course including all exams, homework, quizzes etc.
ANOVA
Overall DFW rate The percentage of students who received a grade of D, F or withdrew from the class.
Z – Test For
Ratios
81

class performance and DFW rate. There were 30 students in the spring semester of
General Chemistry who had passed Introductory Chemistry in previous semesters. These
students were not incorporated into the study in any way. The same variables that were
used in the comparisons between the Spring 2001 historical control group and the
discussion sections were used for comparisons between the Spring 2004 students who
had passed the placement exam and the discussion sections. These variables are detailed
in table 4.1.
There were six sections of General Chemistry offered in the Spring of 2004 with
the average class size being 165 students. All six of the General Chemistry classes used
common exams and finals that were administered at the same time. All lecture sections
used the same textbook “Chemistry the Central Science 9th Edition” by Brown, LeMay
and Bursten (Brown, LeMay and Bursten 2003). All six classes used common grading
scales and techniques. There were a total of 989 students involved in the classes. 193 of
these students had passed the chemistry placement exam and 766 had advanced from
Introductory Chemistry in the previous semester. The remaining 30 students had passed
Introductory Chemistry before the Fall of 2003. The class distributions are detailed in
table 4.2.
82

Table 4.2. Class Distributions for General Chemistry Spring 2004
Section
N Pass CPE Pass 1301 Fall 2003
Pass 1301 not Fall 2003
Professor
1307-1
96
12 77 7 Blake
1307-2
65 31 32 2 Quitevis
1307-3
276 57 206
13 Quitevis
1307-4
277 48 224 5 Poirier
1307-5
94 23 70 1 Gellene
1307-6
186 22 162 2 Tomlinson
83

4.3 Results
4.3.1 Student Performance in General Chemistry
The successful completion of Introductory Chemistry is mandatory for a student to
advance into General Chemistry unless that student can pass the chemistry placement
exam and take General Chemistry directly. Typically, about 25% of the General
Chemistry population is made up of students who have passed the placement exam. The
other 75% are students who have successfully completed Introductory Chemistry. The
hypothesis that improving student performance in Introductory Chemistry will have a
positive longitudinal effect on performance and retention in General Chemistry is the
basis of the curriculum changes that have been made in Introductory Chemistry. Since
such a high percentage of the General Chemistry population is made up of students who
have first completed Introductory Chemistry, it is vital to study the effects that changing
the Introductory Chemistry curriculum has on student performance in General Chemistry.
It has also been determined that the vast majority (>90%) of students who elect to take
General Chemistry after passing Introductory Chemistry do so in the next semester or not
at all.
This set of statistical evaluations will focus on the performance of the three
experimental groups from the Spring of 2004 versus the control group from the Spring of
2001, and the experimental groups versus students in the same classes that enrolled into
General Chemistry by passing the chemistry placement exam (Spring 2004 control
group). The areas that will be evaluated by discussion section type are detailed in table
4.1 The full statistical reports for these analysis are found in appendix F.
84
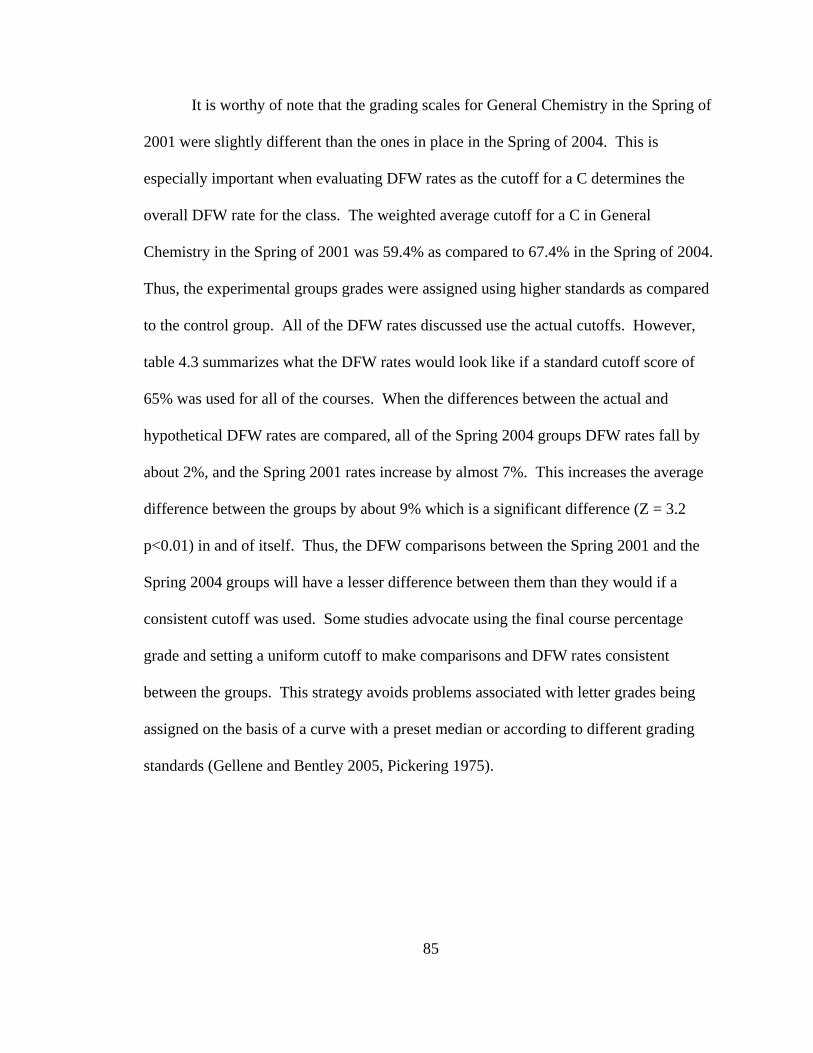
It is worthy of note that the grading scales for General Chemistry in the Spring of
2001 were slightly different than the ones in place in the Spring of 2004. This is
especially important when evaluating DFW rates as the cutoff for a C determines the
overall DFW rate for the class. The weighted average cutoff for a C in General
Chemistry in the Spring of 2001 was 59.4% as compared to 67.4% in the Spring of 2004.
Thus, the experimental groups grades were assigned using higher standards as compared
to the control group. All of the DFW rates discussed use the actual cutoffs. However,
table 4.3 summarizes what the DFW rates would look like if a standard cutoff score of
65% was used for all of the courses. When the differences between the actual and
hypothetical DFW rates are compared, all of the Spring 2004 groups DFW rates fall by
about 2%, and the Spring 2001 rates increase by almost 7%. This increases the average
difference between the groups by about 9% which is a significant difference (Z = 3.2
p<0.01) in and of itself. Thus, the DFW comparisons between the Spring 2001 and the
Spring 2004 groups will have a lesser difference between them than they would if a
consistent cutoff was used. Some studies advocate using the final course percentage
grade and setting a uniform cutoff to make comparisons and DFW rates consistent
between the groups. This strategy avoids problems associated with letter grades being
assigned on the basis of a curve with a preset median or according to different grading
standards (Gellene and Bentley 2005, Pickering 1975).
85

Table 4.3. Hypothetical DFW rates with Uniform Cutoff Score of 65% for a C
DFW Rate
As Assigned (A)
DFW Rate Hypothetical
(B)
Difference
(A – B) Control I
Spring 2001 44.3% 51.2% - 6.9%
Practice Exams
34.9% 32.8% + 2.1%
PLTL
31.8% 28.5% + 3.3%
Learn Star
34.3% 31.9% + 2.4%
CPE Control Spring 2004
49.8% 48.1% + 1.7%
86

4.3.2 Comparisons between Discussion Sections and the Spring 2001 Control Group
The first set of comparisons are between General Chemistry students in the Spring
of 2004 that were involved in one of the three types of discussion sections in their
Introductory Chemistry class in the Fall of 2003 and the control group of General
Chemistry students from the Spring of 2001. The Spring 2001 control group was
selected due to the fact that this set of students corresponds to the same group of students
that were used as the control groups for the Introductory Chemistry studies in the
previous semester.
4.3.2.1 Results for Practice Exam Sections versus Spring 2001 Control Group
It was determined that the students that were involved in the practice exam
sections in the Fall of 2003 in Introductory Chemistry performed significantly higher
(ANOVA p<0.01) on all three of the normal lecture exams in General Chemistry in the
Spring of 2004 than the Spring 2001 control group with an average increase in
performance of 6.1%, 6.3% and 12.8% respectively. It was also determined that the
students that were involved in the practice exam sections in Introductory Chemistry
performed significantly higher (ANOVA p< 0.01) than the control group on both the
cumulative final exam and the overall class grade in General Chemistry. The average
increase in performance on the final exam was 6.3% and the average increase in total
class grade was 7.6%. The overall DFW rate in General Chemistry for students that had
been involved in the practice exam sections in Introductory Chemistry was 34.9% as
87

compared to an overall DFW rate of 44.3% for the control group (figure 4.1). This
represents a statistically significant reduction (Z – Test p<0.001) in the overall DFW rate
of 21.3%. The results for the practice exam sections versus the Spring 2001 control
group are summarized in table 4.4.
4.3.2.2 Results for Peer Led Team Learning Sections versus Spring 2001 Control Group It was determined that the students who had been involved in the PLTL sections in
Introductory Chemistry performed significantly higher (ANOVA p<0.01) on all three of
the normal lecture exams in General Chemistry than the control group with an average
increase in performance of 6.0%, 6.7% and 12.1% respectively. It was also determined
that the students that were involved in the PLTL sections in Introductory Chemistry
performed significantly higher (ANOVA p< 0.01) than the control group on both the
cumulative final exam and the overall class grade in General Chemistry. The average
increase in performance on the final exam was 6.9% and the average increase in total
class grade was 9.2%. The overall DFW rate in General Chemistry for students that had
been involved in PLTL in Introductory Chemistry was 31.8% as compared to an overall
DFW rate of 44.3% for the control group. This represents a statistically significant
reduction (Z – Test p<0.001) in overall DFW rate of 28.2% (figure 4.2). The results for
the PLTL sections versus the Spring 2001 control group are summarized in table 4.5.
88

0
10
20
30
40
50
60
70
80
90
Exam 1 Exam 2 Exam 3 Final Course Grade DFW
Perc
ent
Control Sections Practice Exam Sections
Figure 4.1. Student Performance in General Chemistry: Practice Exam Sections versus Spring 2001 Control
Table 4.4. Summary of Results for Practice Exam Sections Versus Spring 2001 Control Group in General Chemistry
Variable
Practice Exam Sections Spring 2004
A
Control Group Spring 2001
B
Difference
(A – B) Student Performance on Exam 1
78.2%
72.1%
6.1% ANOVA p<0.001
Significant Difference Student Performance on Exam 2
66.6%
60.3%
6.3% ANOVA p<0.001
Significant Difference Student Performance on Exam 3
77.4%
64.5%
12.8% ANOVA p<0.001
Significant Difference Student Performance on the Cumulative Final Exam
73.8%
67.5%
6.3% ANOVA p<0.001
Significant Difference Overall Student Performance in General Chemistry
67.1%
59.5%
7.6% ANOVA p<0.001
Significant Difference Overall DFW rate
34.9%
44.3%
9.4% Z = 3.18, p<0.01
Significant Difference
89

0
10
20
30
40
50
60
70
80
90
Exam 1 Exam 2 Exam 3 Final Course Grade DFW
Perc
ent
Control Sections Peer Lead Team Learning Sections
Figure 4.2. Student Performance in General Chemistry: Peer Led Team Learning Sections versus Spring 2001 Control
Table 4.5. Summary of Results for Peer Led Team Learning Sections Versus Spring 2001 Control Group in General Chemistry
Variable
PLTL Sections Spring 2004
A
Control Group Spring 2001
B
Difference
(A – B) Student Performance on Exam 1
78.1%
72.1%
6.0% ANOVA p<0.001
Significant Difference Student Performance on Exam 2
66.9%
60.3%
6.6% ANOVA p<0.001
Significant Difference Student Performance on Exam 3
76.6%
64.5%
12.1% ANOVA p<0.001
Significant Difference Student Performance on the Cumulative Final Exam
74.4%
67.5%
6.9% ANOVA p<0.001
Significant Difference Overall Student Performance in General Chemistry
68.7%
59.5%
9.2% ANOVA p<0.001
Significant Difference Overall DFW rate
31.8%
44.3%
12.5% Z = 2.76, p<0.01
Significant Difference
90

4.3.2.3 Results for LearnStar Sections versus Spring 2001 Control Group
It was found that the students that had been involved in the LearnStar sections in
Introductory Chemistry performed significantly higher (ANOVA p<0.01) on all three of
the normal lecture exams in General Chemistry than the control group with an average
increase in performance of 5.9%, 7.0% and 13.1% respectively. It was also found that
the students that were involved in the LearnStar sections in Introductory Chemistry
performed significantly higher (ANOVA p< 0.01) than the control group on both the
cumulative final exam and the overall class grade in General Chemistry. The average
increase in performance on the final exam was 6.8% and the average increase in overall
class grade was 8.0%. The overall DFW rate in General Chemistry for students that had
been involved in the practice exam sections in Introductory Chemistry was 34.3% as
compared to an overall DFW rate of 44.3% for the control group. This represents a
statistically significant reduction (Z – Test p<0.001) in overall DFW rate of 22.6%
(figure 4.3). The results for the LearnStar sections versus the Spring 2001 control group
are summarized in table 4.6.
4.3.2.4 Summary of Results for Discussion Sections versus Spring 2001 Control Group
It is apparent from these results that the students involved in all three of the
discussion section types in Introductory Chemistry performed significantly higher in all
respects than the students from the Spring 2001 control group in General Chemistry. All
three discussion section types performed significantly higher on all of the lecture exams,
the cumulative final and the overall course grade with respect to the Spring 2001 control
91
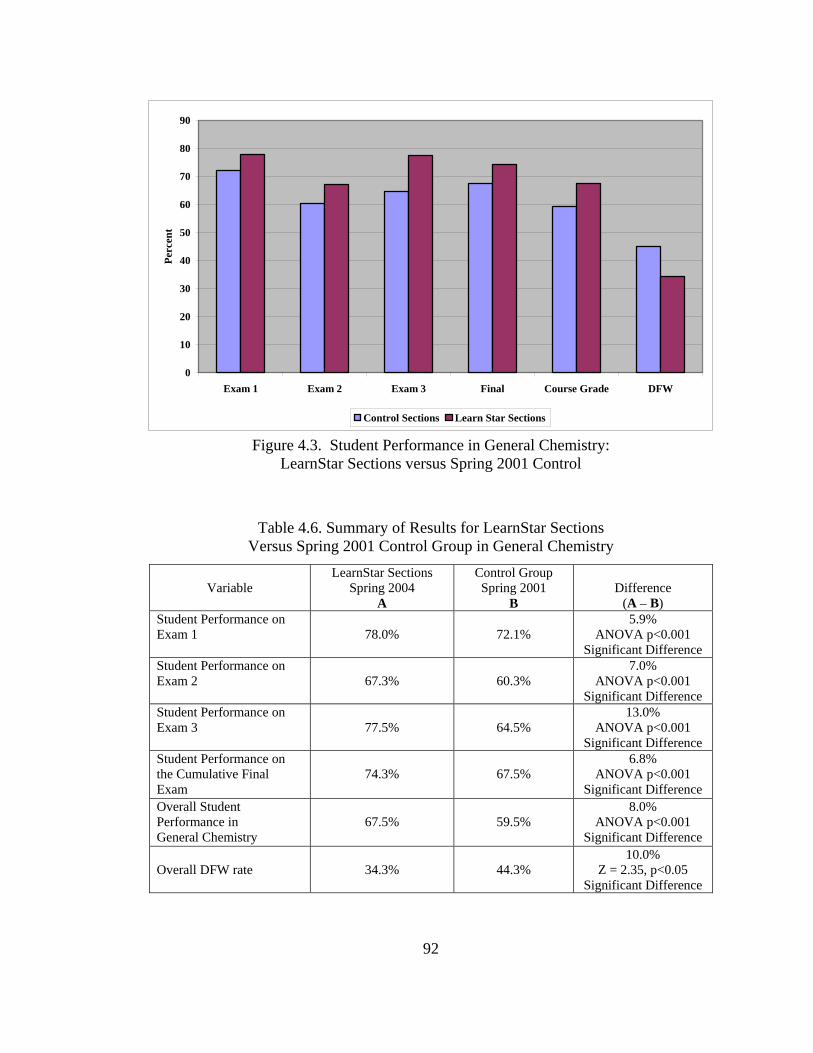
0
10
20
30
40
50
60
70
80
90
Exam 1 Exam 2 Exam 3 Final Course Grade DFW
Perc
ent
Control Sections Learn Star Sections
Figure 4.3. Student Performance in General Chemistry: LearnStar Sections versus Spring 2001 Control
Table 4.6. Summary of Results for LearnStar Sections Versus Spring 2001 Control Group in General Chemistry
Variable
LearnStar Sections Spring 2004
A
Control Group Spring 2001
B
Difference
(A – B) Student Performance on Exam 1
78.0%
72.1%
5.9% ANOVA p<0.001
Significant Difference Student Performance on Exam 2
67.3%
60.3%
7.0% ANOVA p<0.001
Significant Difference Student Performance on Exam 3
77.5%
64.5%
13.0% ANOVA p<0.001
Significant Difference Student Performance on the Cumulative Final Exam
74.3%
67.5%
6.8% ANOVA p<0.001
Significant Difference Overall Student Performance in General Chemistry
67.5%
59.5%
8.0% ANOVA p<0.001
Significant Difference Overall DFW rate
34.3%
44.3%
10.0% Z = 2.35, p<0.05
Significant Difference
92

group. The average overall grade increase was 8.2%, almost a letter grade. Additionally,
the DFW rates for the discussion section students in General Chemistry were
significantly lower than those of the Spring 2001 control group dropping from 44.3% to
33.6%.
4.3.3 Comparisons between Discussion Sections
and the Spring 2004 Control Group
The second set of statistical evaluations focused on differences in performance
between the Spring 2004 General Chemistry students that had been involved in the three
types of discussion section groups in their Introductory Chemistry courses in the Fall of
2003 and the Spring 2004 General Chemistry students that had been admitted into
General Chemistry by passing the chemistry placement exam (CPE). There were a total
of 193 students in the Spring of 2004 that were admitted into General Chemistry by
passing the CPE. These students were, for all practical purposes, randomly distributed
into the six General Chemistry lecture sections. However, since the lecture sections were
self selected the distribution cannot be considered truly random. The class distributions
for the Spring 2004 General Chemistry classes are detailed in table 4.2. Since major
differences between individual classes and instructor variance can generate confounding
variables, a comparison between the six Spring 2004 General Chemistry classes was
performed. The only significant differences in overall student performance between the
six General Chemistry lecture sections were between lecture section five which was the
lowest performing group and lecture sections three, four and six which all performed
significantly higher (ANOVA p<0.05) than section five. See table 4.7 for details. Based
93

Table 4.7. ANOVA Analysis of Significant Differences in Overall Class Performance
by Lecture Section in General Chemistry Spring 2004
Section N Class Grade
Significance with respect to Section 1307-5
Difference with Respect to Section 1307-5
1307-1
96 63.8 p = 0.059 - 6.32
1307-2
65 61.9 p = 0.231 - 4.45
1307-3
276 66.6 p = 0.001* - 9.08
1307-4
274 67.2 p < 0.001* - 9.71
1307-5
94 57.5* N/A N/A
1307-6
184 68.1 p < 0.001* - 10.64
TOTAL
988 65.6 N/A N/A
* Indicates statistically significant differences at the 95% or higher confidence interval.
94

on these results it can be postulated that the six sections of General Chemistry offered in
the Spring of 2004 were very similar courses and with the exception of section five had
no significant differences in overall student performance. This level of uniformity
between the sections greatly reduces the concern that instructor variation would
significantly alter the validity of the study.
Previous research conducted on class data from 1996 -2001 had shown that
General Chemistry students who had passed the CPE performed at statistically equivalent
levels in General Chemistry to students who had successfully completed the Introductory
Chemistry course (Gellene and Bentley 2005). Thus, any statistically valid differences in
performance in General Chemistry either positive or negative between the students who
had passed the CPE and those who had been admitted based on their previous
performance in Introductory Chemistry, would be highly significant. Due to this fact, the
three experimental groups were compared to the group of students who had been
admitted into General Chemistry in the Spring of 2004 based on their CPE score.
4.3.3.1 Results for Practice Exam Sections versus Spring 2004 Control Group
It was determined that the students who were involved in the practice exam
sections in Introductory Chemistry did perform slightly higher on the first two lecture
exams by 0.65% and 2.0% respectively than the students admitted into General
Chemistry by passing the chemistry placement exam (Spring 2004 control group).
Unfortunately, these differences were not significant at the 95% confidence interval
(ANOVA p>0.05). However, the students that had been involved in practice exam
95

sections in Introductory Chemistry performed significantly higher (ANOVA p<0.01) on
both the third lecture exam and the cumulative final exam in General Chemistry when
compared to the Spring 2004 control group. The average increase in exam performance
was 4.7% and 4.8% respectively. It was also determined that the students that were
involved in the practice exam sections in Introductory Chemistry received significantly
higher (ANOVA p< 0.001) overall course grades in General Chemistry when compared
to the Spring 2004 control group. The average increase in performance in the course
grade was 8.9%. The overall DFW rate in General Chemistry for students that had been
involved in the practice exam groups in Introductory Chemistry was 34.9% as compared
to the overall DFW rate of 49.8% for the Spring 2004 control group. This represents a
statistically significant reduction (Z – Test p<0.001) in overall DFW rate of 29.9% when
compared to the Spring 2004 control group (figure 4.4). The results for the practice exam
sections versus the Spring 2004 control group are summarized in table 4.8.
4.3.3.2 Results for Peer Led Team Learning Sections versus Spring 2004 Control Group
It was found that the students who were involved in the Peer Led Team Learning
(PLTL) sections in Introductory Chemistry performed slightly higher on the first three
lecture exams by 0.5%, 2.3% and 3.7% respectively when compared to the Spring 2004
control group. None of the differences in performance for the three lecture exams were
significant at the 95% confidence interval (ANOVA p>0.05). However, students that had
been involved in the PLTL sections in Introductory Chemistry did perform significantly
higher (ANOVA p<0.01) on the cumulative final exam when compared to the Spring
96

0
10
20
30
40
50
60
70
80
90
Exam 1 Exam 2 Exam 3 Final Course Grade DFW
Perc
ent
Passed Placement Exam Practice Exam Sections
Figure 4.4. Student Performance in General Chemistry: Practice Exam Sections versus Spring 2004 Control Group
Table 4.8. Summary of Results for Practice Exam Sections Versus Spring 2004 Control Group in General Chemistry
Variable
Practice Exam Sections Spring 2004
A
Control Group Spring 2004
B
Difference
(A – B) Student Performance on Exam 1
78.2%
77.5%
0.65% ANOVA p>0.05
No Significant Difference Student Performance on Exam 2
66.6%
64.6%
2.0% ANOVA p>0.05
No Significant Difference Student Performance on Exam 3
77.4%
72.7%
4.7% ANOVA p<0.01
Significant Difference Student Performance on the Cumulative Final Exam
73.8%
69.0%
4.8% ANOVA p<0.01
Significant Difference Overall Student Performance in General Chemistry
67.1%
58.1%
8.9% ANOVA p<0.001
Significant Difference Overall DFW rate
34.9%
49.8%
14.9% Z = 3.53, p<0.01
Significant Difference
97
2004 control group. The average increase in final exam performance was 5.4%. It was
also determined that the students that were involved in the PLTL sections in Introductory
Chemistry received significantly higher (ANOVA p< 0.001) overall course grades in
General Chemistry than the Spring 2004 control group. The average increase in
performance in the overall course grade in General Chemistry was 10.5%. The DFW rate
in General Chemistry for students that had been involved in the PLTL groups in
Introductory Chemistry was 31.8% as compared to a DFW rate of 49.8% for the Spring
2004 control group. This represents a statistically significant reduction (Z – Test
p<0.001) in overall DFW rate of 36.1% when compared to students who were admitted
into General Chemistry based on their placement exam score (figure 4.5). The results for
the PLTL sections versus the Spring 2004 control group are summarized in table 4.9.
4.3.3.3 Results for LearnStar Sections versus Spring 2004 Control Group
Analysis of the data showed that the students who were involved in the LearnStar
sections in Introductory Chemistry performed slightly higher on the first two lecture
exams by 0.4% and 2.6% respectively than the students admitted into General Chemistry
in the Spring of 2004 by passing the chemistry placement exam (Spring 2004 control
group). Unfortunately, these differences were not significant at the 95% confidence
interval (ANOVA p>0.05). However, like the practice exam groups, students that had
been involved in LearnStar sections in Introductory Chemistry performed significantly
higher (ANOVA p<0.02) on both the third lecture exam and the cumulative final exam
than the Spring 2004 control group. The average increase in exam performance was
98

0
10
20
30
40
50
60
70
80
90
Exam 1 Exam 2 Exam 3 Final Course Grade DFW
Perc
ent
Passed Placement Exam Peer Lead Team Learning Sections
Figure 4.5. Student Performance in General Chemistry: Peer Led Team Learning Sections versus Spring 2004 Control Group
Table 4.9. Summary of Results for PLTL Sections Versus Spring 2004 Control Group in General Chemistry
Variable
PLTL Sections Spring 2004
A
Control Group Spring 2004
B
Difference
(A – B) Student Performance on Exam 1
78.1%
77.5%
0.5% ANOVA p>0.05
No Significant Difference Student Performance on Exam 2
66.9%
64.6%
2.3% ANOVA p>0.05
No Significant Difference Student Performance on Exam 3
76.6%
72.7%
3.7% ANOVA p>0.05
No Significant Difference Student Performance on the Cumulative Final Exam
74.4%
69.0%
5.4% ANOVA p<0.01
Significant Difference Overall Student Performance in General Chemistry
68.7%
58.1%
10.5% ANOVA p<0.001
Significant Difference Overall DFW rate
31.8%
49.8%
18.0% Z = 3.28, p<0.01
Significant Difference
99

4.8% and 5.3% respectively. It was also determined that the students that were involved
in the LearnStar sections in Introductory Chemistry received significantly higher
(ANOVA p< 0.001) overall course grades in General Chemistry than the Spring 2004
control group. The average increase in performance in the overall course grade was
9.4%. The overall DFW rate in General Chemistry for students that had been involved in
the LearnStar groups in Introductory Chemistry was 34.3% as compared to an overall
DFW rate of 49.8% for the Spring 2004 control group. This represents a statistically
significant reduction (Z – Test p<0.001) in overall DFW rate of 31.1% when compared to
the Spring 2004 control group (figure 4.6). The results for the LearnStar sections versus
the Spring 2004 control group are summarized in Table 4.10.
4.3.3.4 Summary of Results for Discussion Sections versus Spring 2004 Control Group
The data shows that the students who were involved in all three of the
discussion section types in Introductory Chemistry performed significantly higher in
General Chemistry as a whole. While the experimental groups did outperform the control
group on all of the exams, there was no statistically significant difference in exam
performance for the first two lecture exams between any of the experimental groups and
the control group. However, there were differences in participation. In every case, a
higher percentage of students in the experimental groups took the exams than did the
students in the control group. Since students who do not take an exam are not averaged
in as a zero for the statistical analysis of the individual exam averages, this difference is
not apparent when comparing the exam scores between the groups. However, these zeros
100

0
10
20
30
40
50
60
70
80
90
Exam 1 Exam 2 Exam 3 Final Course Grade DFW
Perc
ent
Passed Placement Exam Learn Star Sections
Figure 4.6. Student Performance in General Chemistry: LearnStar Sections versus Spring 2004 Control Group
Table 4.10. Summary of Results for LearnStar Sections Versus Spring 2004 Control Group in General Chemistry
Variable
LearnStar Sections Spring 2004
A
Control Group Spring 2004
B
Difference
(A – B) Student Performance on Exam 1
78.0%
77.5%
0.4% ANOVA p>0.05
No Significant Difference Student Performance on Exam 2
67.3%
64.6%
2.6% ANOVA p>0.05
No Significant Difference Student Performance on Exam 3
77.5%
72.7%
4.8% ANOVA p<0.02
Significant Difference Student Performance on the Cumulative Final Exam
74.3%
69.0%
5.3% ANOVA p<0.01
Significant Difference Overall Student Performance in General Chemistry
67.5%
58.1%
9.4% ANOVA p<0.001
Significant Difference Overall DFW rate
34.3%
49.8%
15.5% Z = 3.18, p<0.01
Significant Difference
101

do count towards the final course grade. This helps explain the significantly higher final
course grades for the experimental groups who had a higher percentage of their total
population participating in each exam than did the control group. This participation data
is presented in table 4.11. and seems to indicate that the students who had taken
Introductory Chemistry were more resilient or persistent in General Chemistry than the
students who had been admitted based on their CPE score.
The experimental groups also had significantly lower DFW rates than the control
group. The average DFW rate for the experimental groups was 31% as compared to
49.8% for the control group. An increase in the overall student success rate of this
magnitude is impressive, especially considering the number of students that enroll in
General Chemistry each semester.
Finally, the overall class performance and DFW rates for the two control groups
were compared to each other. It was determined that there was no significant difference
between the two groups in overall class performance (ANOVA p>0.05) and that there
was no significant difference in DFW rates (Z = 1.3, p>0.05) between the two control
groups.
4.3.4 Comparisons Between Discussion Group Types
in General Chemistry
The General Chemistry performance of the students who had been involved in the
three different types of discussion groups in Introductory Chemistry were also compared
to each other by discussion section type to determine if there were any significant
differences in performance in General Chemistry between the experimental group types.
102

Table 4.11. Exam Participation Data for General Chemistry Spring 2004
Exam 1 Exam 2 Exam 3 Final N
Pass CPE 93.3% 92.7% 81.9% 71.5% 193
Practice Exams
96.9% 95.2% 89.6% 84.1% 438
PLTL 100% 97.3% 89.1% 85.0% 147
LearnStar 100% 97.5% 87.6% 83.9% 161
103

It was found that there were no significant differences (ANOVA p>0.05) between the
group types for any of the exams including the cumulative final. In addition, there was
no significant difference (ANOVA p>0.05) between the group types in overall course
grade in General Chemistry. Finally, the DFW rates for all three discussion group types
were almost identical ranging from a low of 31.8% to a high of 34.9% and showed no
statistical difference (Z – Test p>0.05) (figure 4.7). Thus, there is no significant
difference in performance in General Chemistry between the three experimental groups.
A summary of the results for student performance in General Chemistry is given in table
4.12
4.4 Conclusion
The results from this study clearly indicate that the discussion sections had a
significant positive impact on student performance and retention in General Chemistry.
The student groups from all three of the discussion section formats significantly
outperformed both control groups in terms of overall class performance and retention in
General Chemistry. The significant differences found between the discussion sections
and the Spring 2004 control group are especially interesting since they indicate that the
remediated students are significantly outperforming the prepared students that were
placed into General Chemistry based on their placement exam scores. This is highly
significant since earlier studies had shown that the prepared students and the remediated
students performed at statistically identical levels. Based on these results, the hypotheses
that improving student performance in Introductory Chemistry will improve subsequent
student performance in General Chemistry has been verified in two ways. A greater
104

0
10
20
30
40
50
60
70
80
90
Exam 1 Exam 2 Exam 3 Final Course Grade DFW
Perc
ent
Practice Exam Sections Learn Star Sections PLTL Sections
Figure 4.7. Student Performance and DFW rates in General Chemistry: Spring 2004 Comparison by Discussion Section Type
Table 4.12. Student Performance in General Chemistry Spring 2004 with Spring 2001 and Spring 2004 Control Groups
DFW Rate Exam 1 Exam 2 Exam 3 Final
Exam Course Grade
Control I Spring 2001
44.3% 72.1% 60.3% 64.5% 67.5% 59.4%
Practice Exams
34.9% 78.2% 66.6% 77.4% 73.8% 67.1%
PLTL
31.8% 78.1% 66.9% 76.6% 74.4% 68.7%
LearnStar
34.3% 78.0% 67.3% 77.5% 74.3% 67.5%
CPE Control
Spring 2004
49.8% 77.5% 64.6% 72.7% 69.0% 58.1%
105

number of students continue on into General Chemistry from Introductory Chemistry
and they outperform those students who were directly placed into General Chemistry by
the placement exam.
106

4.5 Works Cited
Brown, LeMay and Bursten. Chemistry the Central Science. 9th Edition. Upper Saddle River, New Jersey: Pearson Education Inc., 2003.
Gellene, Gregory and Bentley, Andrea. “A Six-Year Study of the Effects of a Remedial
Course in the Chemistry Curriculum.” Journal of Chemical Education, vol. 82 no.1, January 2005, pp. 125-130.
Pickering, Miles. “Helping the High Risk Freshman Chemist” Journal of Chemical
Education, vol. 52 no.8, August 1975, pp. 512-514.
107

CHAPTER V
PARTICIPATION IS PERFORMANCE
5.1 Introduction
The importance of student success in General Chemistry has been described in the
previous two chapters, as has the fact that the success rate for students in the course has
historically been low. In order to better understand some of the predictors of student
performance in first year chemistry, the correlation between participation in course
assignments and attendance was evaluated with respect to the students final grade in the
course. These correlation analyses were performed on both Introductory Chemistry and
General Chemistry.
This study began when Dr. Blake noticed that most of the students who had
unacceptable grades in his Fall 2001 General Chemistry class had simply failed to
complete most of their assignments. After a quick analysis of this classes performance, it
was determined that the percentage of students who received a grade of D, F or withdrew
from the course, the DFW rate, was 48%. Although high, this figure was not atypical for
a first year general chemistry course at a major research university. Secondly, the
number of students who did not have a grade for a particular assignment was quite high.
Very few students had completed every assignment and a significant number of students
had missed at least 25% of their assignments over the course of the semester. A cursory
examination of this data led to the hypothesis that students who had completed the
majority of the assignments in the course were successful and those who missed several
assignments were not. Table 5.1 and figure 5.1 details the grade distributions and
108

Table 5.1. Grade Distribution in General Chemistry by Number of Missed Assignments
Number of
missed assignments
Grade of A
Grade of B
Grade of C
Grade of D
Grade of F
Withdrew from the Course
0 9 9 12 0 0 0 1 2 10 6 1 0 0 2 0 3 3 2 0 0 3 0 4 3 1 0 0 4 0 1 2 2 0 0 5 0 0 3 2 1 0 6 0 0 0 1 0 1 7 0 0 0 2 0 0 8 0 0 0 1 2 2 9 0 0 0 0 1 0 10 0 0 0 2 4 2 11 0 0 0 0 4 2 12 0 0 0 1 0 1 13 0 0 0 0 0 2 14 0 0 0 0 4 2 15 0 0 0 0 2 5 16 0 0 0 0 1 5 17 0 0 0 0 0 4 18 0 0 0 0 1 1 19 0 0 0 0 0 4 All 0 0 0 0 0 1
a Students who did not miss any assignments during the semester received a grade of A, B or C. b No student who missed more than one assignment received a grade of A. c Any student missing 5 or more of the assignments failed to earn a grade of A, B or C in the course.
109

y = -2.7723x + 77.294R2 = 0.8448
0
10
20
30
40
50
60
70
80
90
0 5 10 15 20 25
Number of Missed Assignments
Ave
rage
Cou
rse
Gra
de
Figure 5.1. Correlation Between Average Course Grade and Number of Missed Assignments in General Chemistry
110
correlations from this initial analysis. At this point a much more comprehensive study of
all of the grade data from this class was performed in collaboration with Holly Morrell a
graduate student in the department of Psychology.
This more comprehensive study was designed to investigate the degree to which
six “common sense” variables predicted the students final course grade in the first
semester of General Chemistry. The variables that were evaluated were: average exam
score, average quiz score, average homework score, number of absences, number of
missed quizzes, and number of missed homework assignments. The data that was
analyzed came from Dr. Blake’s Fall 2001 General Chemistry course. This class had a
total enrollment of 137 students. It was determined that the six independent variables
accounted for 90% of the variance in final grades for the students who enrolled in the
course, 96% of the variance in final grades for students who completed the course, and
62% of the variance in final grades for students who dropped the course before taking the
final exam. These findings empirically validate several common sense predictors of
success in the classroom, and they imply that engaging in simple behaviors, such as
attending class and completing assignments may significantly enhance a student’s
performance in the first semester of General Chemistry.
After examining the results of the initial study, a larger more focused study was
conducted on a group of 12 first year chemistry classes. Six Introductory Chemistry
classes from the Fall of 2003 and six first semester General Chemistry classes from the
Spring of 2004. It should be noted that approximately 75% of the students in the General
Chemistry classes had advanced there directly from the introductory course in the
111

previous semester. This second set of studies was primarily concerned with student
participation in the classroom and how well participation and attendance predicted
overall student performance in the course.
5.2 Background and Rationale
In recent years, a significant amount of research has been focused on determining
what factors contribute to student success in the chemistry classroom (Duchovic 1998)
and (Kerns, 1996). Nevertheless, this research often neglects factors that might be
considered “common sense” by the layperson. Such factors include attending class
regularly, completing all assignments, showing up for quizzes and exams, and performing
well on assignments and tests. Instead of striving to empirically validate these common
sense predictors of success and to determine the strength of these predictors, researchers
have examined a host of other predictors. For example, a large body of literature focuses
on learning styles as predictors of success in the chemistry classroom (Krause 1998), and
indeed the classroom in general (Boyle, Duffy and Dunleavy 2003). Still others focus on
the student’s internal motivation to succeed (House 1994; Zusho and Coppola 2003),
previous knowledge of chemistry (Yager, Snider and Krajcik, 1988), or the benefits of
supplemental instruction (Ramirez 1997; Turner 1990). While these lines of inquiry are
by no means irrelevant or unimportant, they do not address some of the most basic issues
related to the student’s investment in their classroom experience. The only literature that
has been found to date, that directly examined the effects of these types of predictors on
student performance, were studies related to student absenteeism in college economics
classes (Marburger 2001; Romer 1993; Durden and Ellis 1995). All of these studies
112
showed a negative correlation between student absences and class performance.
However, some of these studies relied on student supplied survey data to assess
absenteeism while others took a very limited number of attendance checks over the
course of the semester. This study was designed to investigate some of the gaps in our
current understanding of factors and student behaviors that predict success in the
chemistry classroom.
5.3 The Initial Project
5.3.1 Research Methods for the Initial project
The data that was used for the initial study was collected from a single
undergraduate first semester General Chemistry class from Texas Tech University. The
class that was evaluated was taught during the Fall semester of 2001 in a standard lecture
hall format. The text that was used was Chemistry the Central Science by: Brown,
LeMay and Bursten 9th edition (Brown, LeMay and Bursten 2003). The major areas of
study for the course included: Matter, Atomic Theory and Structure, Nomenclature,
Chemical Reactions, Chemical Equations, Solutions, Acids and Bases, Thermochemistry,
Electronic Structure of Atoms, Periodic Properties, Chemical Bonds, Molecular
Geometry and Gases.
Over the course of the semester each student was required to complete 10
homework assignments, 6 quizzes (one of which was dropped), three semester exams,
and one final exam. In addition to these assignments, the instructor took attendance on
five predetermined, but unannounced, dates throughout the semester. The independent
113

variables were defined as (1) average exam score, not including the final exam; (2)
average quiz score; (3) average homework score; (4) number of missed quizzes; (5)
number of missed homework assignments; and (6) number of absences. The dependent
variable was defined as each student’s final grade in the class.
5.3.2 Initial Results
The data was analyzed using simultaneous multiple linear regression. First,
average scores, missing assignments, and absences were computed for each student.
Next, the six independent variables were simultaneously entered into regression models
to determine the level of prediction with respect to the final grades for the students who
completed the course, the final grades for students who did not complete the course, and
the final grades for all of the students that enrolled in the course.
The data was analyzed using three different models. The first model was
designed to look only at student participation and incorporated three independent
variables: 1) the number of missed quizzes, 2) the number of missed homework
assignments and 3) the number of absences. The second model was designed to take
student performance into account and incorporated three different independent variables:
1) average quiz score, 2) average homework score and 3) average exam score. The third
model incorporated all six variables. The predictive abilities for the three models are
summarized in table 5.2
The data indicates that all three models predict a significant portion of the
variance in the final course grade. The three variables in the first model (number of
missed quizzes, number of missed homework and number of absences) determine at most
114

Table 5.2. Proportion of Variance (R2) in Course Grade Accounted for by Three Multiple Linear Regression Models
Model
Dropped a Completed b Total c
1 d
R = 0.41, R2 = 0.17
p>0.05 R = 0.82, R2 = 0.68
p<0.01 R = 0.91, R2 = 0.82
p<0.01 2 e
R = 0.62, R2 = 0.39
p<0.01 R = 0.96, R2 = 0.92
p<001 R = 0.86, R2 = 0.74
p<0.01 3 f
R = 0.79, R2 = 0.62 p<0.01
R = 0.98, R2 = 0.96 p<0.01
R = 0.95, R2 = 0.90 p<0.01
Notes:
a Students who dropped the course before taking the final exam b Students who completed the course c All students enrolled in the course d Independent variables included number of missed quizzes, number of missed homework assignments, and number of absences. e Independent variables included average quiz score, average exam score and average homework score. f Independent variables included all predictors from models 1 and 2
115
20% of the final course grade. It is interesting to note that these student participation
variables actually predict more of the variance in the final course grade for the class as a
whole than does model two which uses student performance variables, including exams,
that directly account for 65% of the final course grade.
5.3.3 Discussion
The results from the initial study clearly support the idea that certain common
sense factors do indeed contribute to student success in the first semester General
Chemistry classroom. Specifically, attending class regularly, completing all assignments,
being present for quizzes and exams, and performing well on assignments and tests
accounted for as much as 96% of the variance in final grades. It is important to note that
these predictors did not account for nearly as much variance in final grade for students
who dropped the course as they did for students who completed the course, although the
correlation was still significant. One possible explanation for this phenomenon is that
students who dropped the course may actually represent a different, self-selected sample.
Similarly, certain factors, such as missed assignments, may have actually predicted those
students’ decisions to drop the course rather than their overall performance.
Due to the fact that the initial study was conducted on a single undergraduate
General Chemistry class, it is uncertain whether the results may be generalized to other
courses, age groups, and methods of instruction. However, this study sets the stage for
assessing similar variables in diverse settings. The significance levels for the study
tended to be quite high with p< 0.01 or better for the majority of the statistical analysis.
116

However, it is recognized that the R2 values may appear inflated for models two
and three, due to the fact that final grades were in a large part dependent upon average
lecture exam scores, quiz scores, and homework scores (i.e., higher scores corresponded
with higher grades in the class). The grading criteria for the course is detailed in
table 5.3. It should be noted that, while there were high bivariate correlations among
several of the variables (table 5.4), preliminary analyses revealed no problems with
multicollinearity that might invalidate the results of the regression analyses. Furthermore,
the regression model that only included average exam, quiz, and homework scores as
predictors, did not always account for more variance than the model that only included
absences, missing quizzes, and missing homework assignments as predictors. Thus,
while exam scores do account for a large portion of the class grade, they tend to be no
better predictor of the final class grade than do absences, missing quizzes, and missing
homework assignments.
5.3.4 Conclusions of the Initial Project
These initial findings empirically validate several common sense predictors of
success in the classroom. These results are encouraging because they imply that simple
behaviors, such as regularly attending class and completing assignments, may
significantly enhance a student’s performance in first semester General Chemistry . As
such, it may be to the students advantage for instructors to employ strategies that promote
these behaviors in their students. These strategies could include: giving random quizzes
or graded attendance checks to encourage regular attendance.
117

Table 5.3. Grading Criteria for General Chemistry Section 1 Fall 2001
Assignment Percentage of Final Grade Midterm Examinations x 3
45
Final Examination
35
Homework x 10
10
Quizzes x 6
5
Attendance x 5
5
Total 100
Table 5.4. Relative Importance of Predictors of Student Performance in General Chemistry (Standard Regression Weights all Six Variables Included)
Predictor Dropped a Completed b Total c
Average exam score
0.57 p<0.001
0.64 p<0.001
0.30 p<0.001
Average quiz score
0.29 p<0.01
0.10 p<0.001
0.08 p<0.05
Average homework score
-0.29 p<0.001
0.07 p<0.01
0.03 p>0.05
Number of missed quizzes
-0.15 p>0.05
-0.06 p<0.05
-0.17 p<0.001
Number of missed homework assignments
-0.24 p>0.05
-0.19 p<0.001
-0.53 p<0.001
Number of absences
-0.29 p>0.05
-0.09 p<0.001
0.01 p>0.05
a Students who dropped the course before taking the final exam b Students who completed the course c All students enrolled in the course
118

5.4 The Expanded Project
5.4.1 Overview
Since exam scores account for the majority of the class grade, it is inevitable that
any linear regression using exam performance as a predictor of total class grade will have
artificially inflated correlation coefficients. Due to this fact, it was decided to focus the
second set of studies more strictly on student participation and attendance rather than on
student performance on exams. In order to accomplish this two predictor variables were
developed. The first variable was simply called the student participation variable and
was created by determining the percentage of homework, quizzes and attendance grades
that each student received a grade for. This variable did not take student performance on
homework and quizzes into account, and was only concerned with whether or not the
student participated in the assignment. It should be noted that different instructors had
different numbers of homework assignments, quizzes and attendance grades that they
collected. However, all of the classes involved in the study had at least 10 participation
grades of some type. Some classes had as many as 26 assignments, and or participation
grades, that could be used in the study. The second variable, called the student
performance variable, included student performance for any of the assignments that had
variable grades rather than just giving the student full credit for participation. Thus, if a
professor had six homework assignments, six quizzes and six attendance grades, the
value for this variable would be the non-weighted arithmetic average for the 18
assignments’ percent score with the attendance grades given as either a 100% for
attendance or a 0 for absence. Thus, in every case, the value for the student performance
119

variable was less than or equal to the student participation variable for any given student.
It should also be noted that some instructors gave all students full credit for homework as
long as they turned it in. Thus, for these classes the participation and performance
variables were identical for these areas.
The follow up study evaluated two different, but related courses: Introductory
Chemistry and first semester General Chemistry. As has been explained in detail in
previous chapters, Introductory Chemistry is a remedial course that has no value to a
students degree plan regardless of major. The courses only purpose is to prepare students
to succeed in General Chemistry. The sections of Introductory Chemistry that were
evaluated were the six classes taught in the Fall of 2003 and consisted of 1207 total
students. Six sections of first semester General Chemistry from the Spring of 2004 were
also examined and consisted of a total of 989 students. These sections of first semester
General Chemistry were directly related to the six sections of Introductory Chemistry in
that 77.6% of the students in the General Chemistry classes in the Spring of 2004 had
successfully passed Introductory Chemistry the previous semester. Full statistical reports
for this project are found in appendix F.
5.4.2 Results and Discussion
5.4.2.1 Introductory Chemistry The six sections of Introductory Chemistry were evaluated individually, as a
group and by the type of discussion section that they were paired with for additional
instruction. The correlation between the student participation variable and final class
120

grade is statistically significant at the 99.9% confidence level and is above 0.72 in all
cases. The overall correlation between student participation and final grade was R =
0.763 (p<0.001). This correlation explained 58.2% of the total variance in the course
grade for students in Introductory Chemistry. As would be expected, there is a slightly
higher correlation between the student performance variable and final grade. This is due
to the fact that the scores that make up these variables account for 20% of the students
final grade in the class. The correlation between the student performance variable and
final course grade in Introductory Chemistry was highly significant at or above 0.74 and
in the 99.9% confidence interval in all cases. The overall correlation between student
performance and final grade was R = 0.784 (p<0.001). This correlation explained 61.5%
of the total variance in the course grade for students in Introductory Chemistry.
Individual correlation coefficients, significance data, and population information is
presented in table 5.5. This data indicates that the correlations are relatively constant
between the different lecture sections and the discussion section types. It is also apparent
from this data that the two prediction variables are almost collinear since, when used in
conjunction, they explain almost no additional variance.
In addition to the normal analysis of the two variables with respect to final course
grade in the two classes, these variables were also used to predict the future performance
of Introductory Chemistry Students in General Chemistry for those students who
advanced into General Chemistry. This data is presented both corporately for all of the
Introductory Chemistry students that took General Chemistry and by discussion section
121
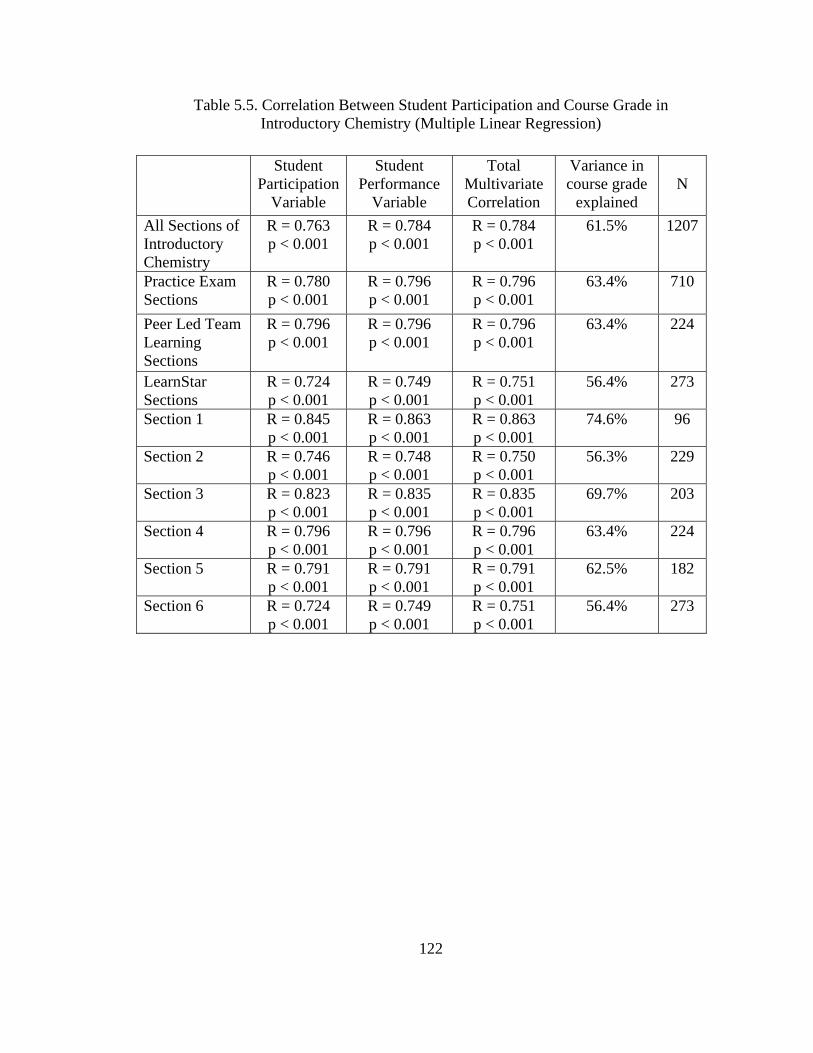
Table 5.5. Correlation Between Student Participation and Course Grade in Introductory Chemistry (Multiple Linear Regression)
Student Participation
Variable
Student Performance
Variable
Total Multivariate Correlation
Variance in course grade
explained
N
All Sections of Introductory Chemistry
R = 0.763 p < 0.001
R = 0.784 p < 0.001
R = 0.784 p < 0.001
61.5%
1207
Practice Exam Sections
R = 0.780 p < 0.001
R = 0.796 p < 0.001
R = 0.796 p < 0.001
63.4% 710
Peer Led Team Learning Sections
R = 0.796 p < 0.001
R = 0.796 p < 0.001
R = 0.796 p < 0.001
63.4% 224
LearnStar Sections
R = 0.724 p < 0.001
R = 0.749 p < 0.001
R = 0.751 p < 0.001
56.4% 273
Section 1 R = 0.845 p < 0.001
R = 0.863 p < 0.001
R = 0.863 p < 0.001
74.6% 96
Section 2 R = 0.746 p < 0.001
R = 0.748 p < 0.001
R = 0.750 p < 0.001
56.3% 229
Section 3 R = 0.823 p < 0.001
R = 0.835 p < 0.001
R = 0.835 p < 0.001
69.7% 203
Section 4 R = 0.796 p < 0.001
R = 0.796 p < 0.001
R = 0.796 p < 0.001
63.4% 224
Section 5 R = 0.791 p < 0.001
R = 0.791 p < 0.001
R = 0.791 p < 0.001
62.5% 182
Section 6 R = 0.724 p < 0.001
R = 0.749 p < 0.001
R = 0.751 p < 0.001
56.4% 273
122

type. As a group these two variables explained 19.7% of the total variance in the final
grade for General Chemistry. The total multivariate correlation was R = 0.444 (p<0.001).
For students involved in the practice exam sections, these two variables explained 21.1%
of the total variance in their final grade for General Chemistry, with a total multivariate
correlation of R = 0.459 (p<0.001). For students involved in the PLTL sections, these
two variables explained only 12.9% of the total variance in their final grade for General
Chemistry, with a total multivariate correlation of R = 0.359 (p<0.001). For students
involved in the LearnStar sections, these two variables explained 22.2% of the total
variance in their final grade for General Chemistry, with a total multivariate correlation
of R = 0.471 (p<0.001). Individual correlation data for all of the groups and variables
evaluated in this longitudinal analysis are presented in table 5.6.
5.4.2.2 General Chemistry
The six sections of first semester General Chemistry were examined both
individually and as a group. Individual correlation coefficients, significance data, and
population information is presented in table 5.7. It was determined that both the student
participation variable and the student performance variable correlated highly with
students final grade in the class. Student participation had a correlation of (R = 0.802,
p<0.001) and accounted for 64.3% of the variance in final grade for the General
Chemistry classes as a whole. The student performance variable had a slightly higher
correlation due to the fact that changes in this variable did slightly effect the final grade.
The correlation between the student performance variable and final grade was
123

Table 5.6. Correlation Between Student Participation in Introductory Chemistry and Longitudinal Performance in General Chemistry (Multiple Linear Regression)
Student Participation
Variable
Student Performance
Variable
Total Multivariate Correlation
Variance in Course Grade
explained
N All Sections of Introductory Chemistry
R = 0.407 p < 0.001
R = 0.440 p < 0.001
R = 0.444 p < 0.001
19.7%
765
Practice Exam Sections
R = 0.422 p < 0.001
R = 0.451 p < 0.001
R = 0.459 p < 0.001
21.1%
457
Peer Led Team Learning Sections
R = 0.344 p < 0.001
R = 0.356 p < 0.001
R = 0.359 p < 0.001
12.9%
147
LearnStar Sections
R = 0.417 p < 0.001
R = 0.471 p < 0.001
R = 0.471 p < 0.001
22.2%
161
124

Table 5.7. Correlation Between Student Participation and Course Grade in General Chemistry (Multiple Linear Regression)
Student Participation
Variable
Student Performance
Variable
Total Multivariate Correlation
Variance in course grade
explained
N
All Sections of General Chemistry
R = 0.802 p < 0.001
R = 0.828 p < 0.001
R = 0.836 p < 0.001
69.9%
995
Section 1 R = 0.835 p < 0.001
R = 0.878 p < 0.001
R = 0.883 p < 0.001
78.0% 96
Section 2 R = 0.865 p < 0.001
R = 0.921 p < 0.001
R = 0.926 p < 0.001
85.7% 65
Section 3 R = 0.752 p < 0.001
R = 0.867 p < 0.001
R = 0.867 p < 0.001
75.2% 276
Section 4 R = 0.810 p < 0.001
R = 0.830 p < 0.001
R = 0.832 p < 0.001
69.3% 277
Section 5 R = 0.798 p < 0.001
R = 0.789 p < 0.001
R = 0.801 p < 0.001
64.1% 94
Section 6 R = 0.828 p < 0.001
R = 0.845 p < 0.001
R = 0.849 p < 0.001
72.1% 187
125

(r = 0.828, p<0.001) and explained 68.6% of the variance in final grade for the General
Chemistry classes as a whole. This data indicates that the correlations are relatively
constant between the different lecture sections for both variables and for the multivariate
model.
5.5 Conclusion
The findings developed over the course of this study strongly emphasize how vital
it is for students to participate in their educational process. The participation variables
that were evaluated for over 2200 students in this study, conclusively show that
participation and attendance explain the majority of the variance in final course grade in
both Introductory and General Chemistry. Previous participation even explains about
20% of the variance in final grade of sequential classes taken in the next semester. It is
also interesting to note that the student performance variable was only a slightly better
predictor of final grade than the student participation variable. In fact in the instance of
the greatest difference between the two variables, the difference only accounted for a
change in 10.5% of the variance predicted. Academic performance may be significantly
improved if methods could be developed to encourage students to attend class and
participate in class assignments regardless of the direct point value towards their grade.
It appears clear that the indirect value of active and consistent classroom participation by
students, is a vital part of improving student success in chemistry.
126

5.6 Works Cited
Boyle, B. A., Duffy, T. and Dunleavy, K. “Learning styles and academic outcome: The validity and utility of Vermunt’s Inventory of Learning Styles in a British higher education setting.” The British Journal of Educational Psychology, vol. 73 2003, no.2, pp. 267-290.
Brown, LeMay and Bursten. Chemistry the Central Science. 9th Edition. Upper Saddle
River, New Jersey: Pearson Education Inc., 2003. Duchovic, D. “Teaching college general chemistry: Techniques designed to communicate
a conceptual framework.” Journal of Chemical Education, vol. 75 1998 no.7, pp. 856-857.
Durden, G. and Ellis, L. “The effects of attendance on student learning in principals of
economics.” American Economic Review Papers and Proceedings, vol. 85 1995, pp. 343-346.
House, J. D. “Student motivation and achievement in college chemistry.” International
Journal of Instructional Media, vol. 21 1994 no.1, pp. 1-11. Kerns, T. “Should we use cooperative learning in college chemistry?” Journal of College
Science Teaching, vol. 25 1996, pp. 435-438. Krause, L. “The cognitive profile model of learning styles: Differences in student
achievement in general chemistry - considering the ways our students learn and teaching to their strengths.” Journal of College Science Teaching, vol. 28 1998, no.1, pp. 57-61.
Marburger, D. “Absenteeism and undergraduate exam performance.” The Journal of
Economic Education, vol. 32 2001, no.2, pp. 99-109.
Ramirez, G. M. “Supplemental instruction: The long-term impact.” Journal of Developmental Education, vol. 21 1997, pp. 2-4.
Romer, D. “Do Students go to class? Should they?” Journal of Economic Perspectives
vol. 7 1993, pp. 167-174.
Turner, K. E. “A supplemental course to improve performance in introductory chemistry.” Journal of Chemical Education, vol. 67 1990, pp. 954-957.
Yager, R. E., Snider, B. and Krajcik, J. S. “Relative success in college chemistry for
students who experienced a high-school course in chemistry and those who had not.” Journal of Research in Science Teaching, vol. 25 1988, pp. 387-396.
127

Zusho, A. and Coppola, B. “Skill and will: The role of motivation and cognition in the
learning of college chemistry.” International Journal of Science Education, vol. 25 2003, no.9, pp. 1081-1094.
128

CHAPTER VI
ENHANCING STUDENT PERFORMANCE IN FIRST
SEMESTER GENERAL CHEMISTRY USING
THE WORLD WIDE WEB
6.1 Introduction
Educators in almost any discipline will routinely face three very important issues.
First, how to address the subject matter that needs to be taught. Second, what types of
relationships can be developed in the classroom that will allow the students to connect to
the material that they need to learn. Third, in what way will prior student knowledge be
evaluated, versus the knowledge that students are to learn from the class? Many books
and articles have been written examining these subjects, including: “Teaching on Solid
Ground: A collaborative publication of the National Center on Postsecondary Teaching,
Learning and Assessment” and “Teaching Tips” by Wilbert J. McKeachie. However, no
true consensus has been reached. In addition, there has been a great deal of debate over
the years as to what teaching methods are the best for students and how to provide the
ideal learning environment. Some are advocates of “individual active learning
techniques”(Bonwell and Eison 1991) while others support group and team learning in
the classroom (Landa and Tarule 1992; Vygotsky 1962). There are even some who
advocate the master-apprentice approach as the only true way to master certain
disciplines (Evanciew and Rojewski 1999; Cash, Behrmann, and Stadt 1997). However,
there are very few supporters in the literature (Jones 2003) of the most commonly
practiced teaching method of all, (Taylor and Tobin 2002; Feldman, K. and Paulsen
129
1994) the lecture. However, there is a plethora of literature written by experts that have
performed numerous studies indicating that the traditional lecture is a less than ideal
teaching technique. A small sample of these includes: Cooper and Mueck 1990;
Daempfle 2002; Huba and Freed 2000; Lippincott and Bodner 1984; McManus, Dunn
and Denig 2003; Sawrey 1990; Ward, R. and Bodner 1993. Unfortunately, it has been
observed that even those who claim to be advocates of other teaching techniques, tend to
give lectures to their peers at conferences and symposiums supporting their preferred
method rather than actually putting their teaching techniques into practice. In fact, there
were at least 30 lectures given at the 225th national meeting of The American Chemical
Society that focused on how poor of a teaching technique lecturing is, while being
lectures themselves. So why if there are so many other “vastly superior teaching
methods” (Goodsell et al. 1992; Cooper and Mueck 1990) available, does the majority of
higher education occur in the lecture hall (Taylor, Gilmer, and Tobin 2002; Feldman, K.
and Paulsen 1994)?
The simple answer of course is economy. The lecture format is simply the easiest
and most cost efficient way to disseminate information to large numbers of students.
However, this method can only be said to be efficient if the students are actually
developing and incorporating the material presented into their own knowledge base.
This study will discuss an interactive feedback system supported by the World
Wide Web that allows the instructor to develop a better understanding of his students
prior knowledge, and misconceptions about particular subjects and concepts. The
instructor can then tailor the lecture to best meet the needs of the class as a whole. The
130

feedback system also allows the instructor to evaluate how effectively the students were
able to understand and apply specific concepts that were covered in lecture. It was hoped
that this feedback process and tailored lectures would lead to increased student
performance in the first semester of General Chemistry.
The interactive feedback system that was used for this study was based on the Just
In Time Teaching (JiTT) concept that was originally developed by A. Gavrin and G. M.
Novak at Indiana University Purdue University Indianapolis and the United States Air
Force Academy (Novak, Patterson, Gavrin, and Christian 1999). JiTT was originally
developed for use in General Physics, but now has been expanded into a number of fields
including biology, chemistry, mathematics, sociology, and writing (Gavrin, Jeffrey,
Marrs and Blake 2003).
The program implemented at Texas Tech University is an expansion of the
original JiTT concept that uses web-based warm-up questions to evaluate the classes
prior knowledge base and check-up problems to evaluate how well the class is mastering
the material. These questions also evaluate broad based misconceptions that they may
have developed. The questions may be either free response or multiple choice in nature.
Typically, two free response and one multiple choice question are assigned to the class
after each lecture. The students then must complete and submit their answers to these
problems by a preset time before the next class meeting. The student responses are
evaluated by the instructor who then modifies his lecture to best meet the needs of the
class. A typical web assignment consists of two warm-up questions over material that
131

will be presented in the next lecture, and one check-up question over material that has
already been presented.
In order to be able to better access and analyze the data generated by the student
responses to the warm-up and check-up questions, the web site was linked to a Microsoft
Access database. The database makes it considerably easier to process, store, and analyze
the large number of submissions that are generated, especially when compared to the e-
mail system that was used when this process was first implemented.
The student responses to the warm-up and check-up exercises are evaluated by the
professor after student submissions and before the next lecture. Based on the student
responses, the professor tries to assess the classes prior knowledge of the concepts that
were assigned. This allows the professor to structure the lectures by taking advantage of
concepts that the students are familiar with and spending additional time explaining
concepts that the student responses have indicated the class does not understand well.
Additionally, since data is collected after every lecture, it is possible to evaluate
how each lecture shapes student understanding of specific concepts each time the class
meets. Thus, it is possible to determine how the class performs on a questions about a
specific topic before the lecture, and how well they can perform afterwards, giving some
indication of the effectiveness of each lecture.
6.2 Experimental
The class that was studied was taught in the Fall semester of 2002 and had an
enrollment of 179 students. The class composition is detailed in table 6.1. This class was
compared to two control groups. The first control group was a class taught by the
132

Table 6.1. Class Composition for the Experimental Group
Total enrollment 179 Male Students 67.1% Female Students 32.9% Freshman 57.5% Sophomores 21.3% Juniors 11.5% Seniors 9.8% Pursuing a BA 24.7% Pursuing a BS 75.3%
133

same professor in the Fall of 2001 (N = 137). With the exception of JiTT, this class was
virtually identical to the experimental group using the same text (Brown, LeMay and
Bursten 8th Ed.) and grading procedures. The similarity between these two classes helps
minimize the confounding variables that arise from class and instructor variance. The
second control group was the entire first semester General Chemistry population from the
Fall 2001. semester (N = 411). It was felt that having a larger control group that
involved multiple sections and professors, would give more validity to the results and
allow them to be more generalized if there were significant differences between the
experimental groups and the control groups. All of the classes in the Fall of 2001 used
the same text and similar grading procedures
6.2.1 Use and Administration of the JiTT Questions
The warm-up and check-up questions serve two primary purposes. The first is to
assess prior student knowledge. Warm-up questions are ask before any material about
the subject has been presented in class. In most cases, the actual results for these
questions are not shared with the students. However, the student responses for these
questions help determine which areas of a particular concept the instructor needs to focus
on, and what preexisting misconceptions may be inhibiting student progress in those
areas. The second purpose, is to evaluate student progress and mastery of concepts as
they are presented in class. Check-up questions are posted after the concept has been
presented and explained in detail. In most cases, the check-up questions are more
challenging and require more problem solving skills than do the warm-up questions. In
all cases the questions may be ask in either a free response or multiple choice format.
134

The free response format questions provide the instructor with a much better perception
of the classes understanding of a concept. However, the free response questions are
much more time consuming to evaluate.
The JiTT questions were available for student response about three hours after
each lecture. For this particular course, which met from 9:00 to 10:00AM Monday,
Wednesday and Friday, the assignments were published to the web by 1:00 PM on those
days and were due by 8:00 PM the night before the next class. Student participation in
the JiTT program was mandatory and accounted for 10% of the students overall course
grade. The warm-up questions were open book and had no practical time limit, except
for the fact that they had to be completed by 8:00 PM the day before the next lecture.
Since all of the student responses were submitted to a database with a timestamp and ID
code, direct cut and paste cheating for the free response questions was limited and
obvious. Unless the students were blatantly coping each others work, they were
encouraged to work together on their JiTT assignments.
6.2.2 An Example of the JiTT Process
A good example of a concept that was evaluated through the JiTT process was the
classes understanding of how to identify what types of chemicals are classified as bases.
A series of questions similar to the following were posed to the students.
Which substance is not a base?
A: NaOH B: NH3 C: CH3OH D: NaH E: They are all bases
135

In each case the four chemical choices were: a strong base, ammonia, a common alcohol,
and a metal hydride. Thus while the questions were very similar they were not identical.
The basic question ws presented at four different times: First, before acids and bases had
been introduced, second, after acids and bases had been explained in detail in lecture,
third, after the subject had been reinforced and clarified a second time in class, and
fourth time on the mid-term exam.
When the question was administered the first time, only 8 of 117 students (6.8%)
were able to answer the question correctly. Since random chance would indicate that
about 20% of the respondents should have answered the question correctly, there was
clearly some student misconception that was affecting the result. It was felt that the most
likely cause of this misconception was due to earlier exposure to this material. In many
high school classes only the Arrhenius theory of acids and bases is presented. This
theory leads many students to believe that only compounds that have a hydroxyl group
attached to them have basic properties, and that any compound containing an OH group
is a base. In addition to this misconception, many students also believe that binary
compounds that contain hydrogen are acids regardless of the composition of the second
element. When the student responses detailed in table 6.2 are evaluated, it is apparent
that a large percentage of the students were distracted by these two misconceptions. Over
60% of the students either selected sodium hydride or ammonia as their answer in their
first exposure to the question, indicating that the majority of the students thought that a
binary compound containing hydrogen could not act as a base. However, less than 2%
selected sodium hydroxide, indicating that the students had enough knowledge not to
136
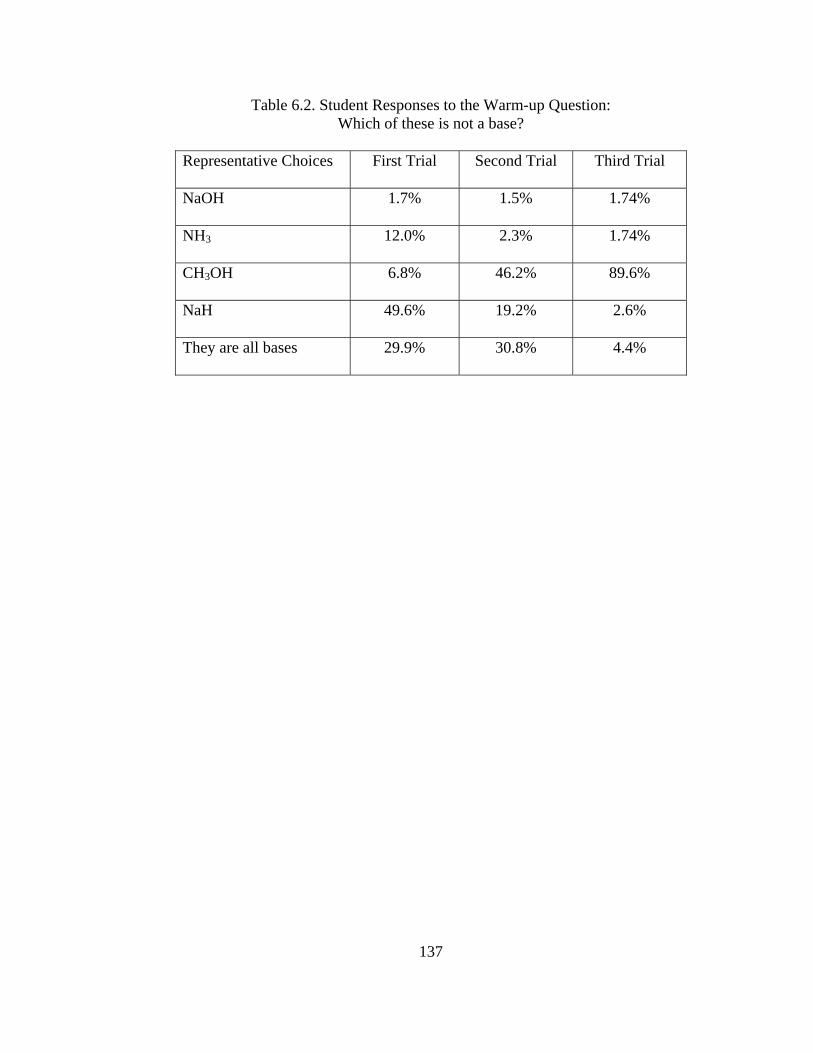
Table 6.2. Student Responses to the Warm-up Question: Which of these is not a base?
Representative Choices
First Trial Second Trial Third Trial
NaOH
1.7% 1.5% 1.74%
NH3
12.0% 2.3% 1.74%
CH3OH
6.8% 46.2% 89.6%
NaH
49.6% 19.2% 2.6%
They are all bases
29.9% 30.8% 4.4%
137

select a common strong base. The second time the question was asked was after acids
and bases had been discussed in lecture once. However, the students previous
performance on the first warm-up question was not discussed with the class at this time,
nor was the correct answer for that question given. After a detailed description of acids
and bases was presented in lecture, 46.2% of the students that responded were able to
answer the question correctly. While this is a dramatic improvement, still less than half
of the students responding were able to answer correctly. It is interesting to note that the
percentage of students who thought that all of the compounds were bases, remained
effectively constant. However, the percentage of students that thought that metal
hydrides were acidic dropped from almost 50% to less than 20%, and accounted for the
majority of the increase in the correct response. The remainder of the change came from
students understanding that ammonia typically behaves as a base. Thus, the majority of
the students that were still answering the question incorrectly, were now indicating that
they thought that all of the compounds were bases, though a substantial percentage still
thought that metal hydrides would not behave as a base.
At this point a second similar question was assigned that involved the acid base
characteristics of salts dissolved in water. This question was ask before any new material
or the students responses to the warm-up questions were presented in class.
Confirmation Question: Which of the following is least likely to act as a base when dissolved in water?
A. Sodium Phosphate 28.4% B. Sodium Hydride 14.2% C. Ammonia 9.2% D. Ammonium Chloride 41.3% E. Iron (III) Hydroxide 6.9%
138

The students’ response to this question was 41.3% correct indicating a similar
level of understanding of acid/base character to the prior question. This confirmation
also establishes a level of independent validity for the second warm-up question. A Z-test
for ratios indicates that there is no significant difference between the response rates for
the second warm-up question and the confirmation question (Z = 0.71, p > 0.05). When,
responses for both questions were analyzed, it was found that 36% answered both
questions correctly, 10% answered only the first question correctly, 5% answered only
the second question correctly, and 49% answered both questions incorrectly.
After the second warm-up question and the confirmation question, a final check-
up question about bases was administered after a short clarification session in class. The
clarification session consisted of a discussion of the classes responses to the first two
warm-up questions and the confirmation question which addressed the acid base
characteristics of salts dissolved in water. The common misconceptions were discussed
individually: 1. The idea that any compound with a hydroxyl group is not necessarily a
base, but that its acid base character is determined by what the hydroxyl group is attached
to. 2. That metal hydrides do not act as acids when dissolved in water, and that what the
hydrogen is bonded to determines the hydrogen’s acid base character. 3. A compound
can act as a proton acceptor (base) with out having a hydroxyl group attached. The
number of correct responses to the final check-up question rose to 89.6% at this point
(figure 6.1).
Three weeks later the students were evaluated again on their midterm
examination. Only 46% of the students taking the exam were able to answer the question
139

0
10
20
30
40
50
60
70
80
90
100
Warm up 1 Warm up 2 Confimation Warm up 3 Exam
Question
Perc
ent C
orre
ct
Figure 6.1. Student Responses to JiTT Exercises
140
correctly. However, when interpreting this data, it is important to realize that less than
100% of the students actually participated in the JiTT exercises. The average percentage
of students that participated in the web exercises varied from 50-80% with average
participation levels being about 66%. Participation on the midterm exam was over 98%.
Due to this fact, there were a sizable percentage of students who did not participate in the
warm-ups, but who did take the mid-term examination. In order to study the
effectiveness of the warm-ups as a pedagogical tool, these students performance had to be
taken into account. In order to address this, a student-by-student analysis was performed
to determine how many of the students that correctly answered the third warm-up
question, also correctly answered the exam problem. (Figure 6.2).
Of the 103 students that determined the correct answer on the third warm-up
question, 61 of them were able to determine the correct answer on the exam. While a
drop from 89% to 59% in student performance initially appears discouraging, it must be
remembered that the environment is completely different. While the students are
working on a warm-up exercise, they have access to their books, notes and friends.
During an exam the students have access only to their individual memory. Of the 12
students who did not answer the third warm-up question correctly, only 2, or 16.5% of
them, were able to determine the correct answer on the midterm exam. Considering that a
five-response multiple-choice question gives the student a 20% chance of a random
correct response, an average response rate of 16.5% suggests a virtually nonexistent level
of understanding. The third group of students were those that had not participated in the
third warm-up at all. Of these students, only 18.75% of them obtained the correct answer
141

0
10
20
30
40
50
60
70
Correct response to Warm-up 3 Incorrect response to Warm-up 3 No response to Warm-up 3
Student Response
Perc
ent C
orrc
et o
n Ex
am
Figure 6.2. Student Performance on Midterm Exam Question
versus Previous Performance on Warm-up 3 (Point by Point Analysis)
142

on the exam. Again considering the structure of the exam, this response level of 18.75%
suggests a virtually nonexistent level of understanding. The data indicates that the
students who had successfully answered the third warm-up question correctly were
approximately three times more likely to obtain the correct answer on the exam than
either those students who were not able to determine the correct answer on the third
warm-up, or those who did not participate in the third warm-up at all.
6. 3 The Effects of JiTT on First
Semester General Chemistry
The JiTT approach was applied to all of the major subjects covered in this first
semester General Chemistry class. Due to the massive quantity of data collected, it
would be impractical to attempt to disseminate all of this information in a single
document. However, general trends in overall student performance for the course as a
whole are available. The student performance for this class was compared with two
control groups. The first control group was a first semester General Chemistry class
offered in the Fall of 2001 and taught by the same professor without JiTT. This class had
a total enrollment of 137 students. Both classes used the same text (Brown, LeMay and
Bursten 8th Ed.) and had identical grading procedures. The second control group
incorporated all of the normal first semester General Chemistry classes taught in the Fall
of 2001 and had a total enrolment of 411 students. All three of the classes used the same
text and had similar evaluation and grading procedures.
With the exception of the first exam, the JiTT class significantly outperformed
both control groups on all the remaining exams, the cumulative final and overall course
143

grade (ANOVA p<0.05). In addition, the overall DFW rate (the percentage of students
receiving a grade of D, F or withdrawing from the course) fell 9.3% (Z = 1.82, p<0.05)
with respect to control group 1 and 12.7% (Z = 2.8, p<0.01) with respect to control group
2. The performance data for these courses is detailed in tables 6.3 and 6.4
6.4 Conclusion
The JiTT approach to instruction gives the instructor some valuable tools. First, it
allows the professor to be able to probe his classes prior knowledge about specific
concepts before presenting material on that subject. Second, it can give the professor
insight about student misconceptions in a particular area of study. Finally, the JiTT
process provides the unique ability to evaluate the effectiveness of individual lectures or
groups of lectures within a subject area.
It is apparent from the overall class results, that the students involved in the JiTT
based course significantly outperformed both control groups, on two of the three semester
exams, the cumulative final and on their overall course grade. Additionally, the students
involved in the JiTT based course had significantly lower DFW rates than both control
groups. Based on this data, the use of active feedback techniques such as JiTT, offer the
possibility of significant classroom improvement for professors who have the time and
resources to perform the continuous data analysis required to utilize this teaching
technique.
144
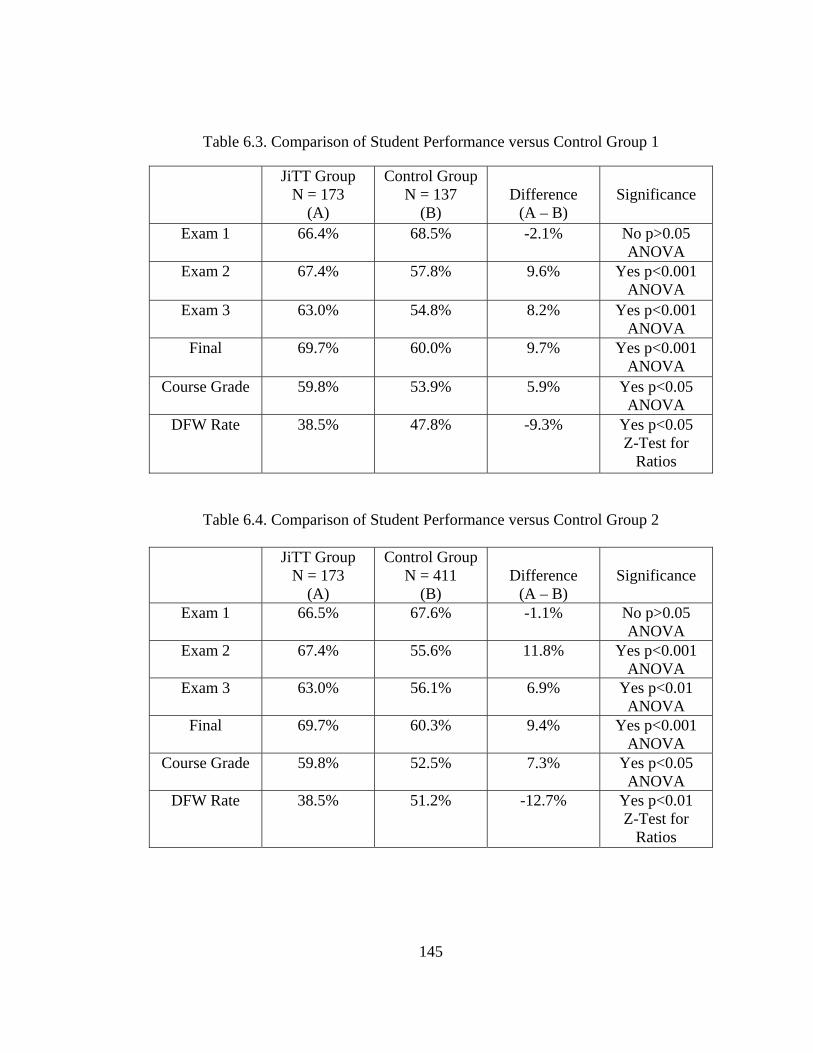
Table 6.3. Comparison of Student Performance versus Control Group 1
JiTT Group N = 173
(A)
Control Group N = 137
(B)
Difference
(A – B)
Significance
Exam 1
66.4% 68.5% -2.1% No p>0.05 ANOVA
Exam 2
67.4% 57.8% 9.6% Yes p<0.001 ANOVA
Exam 3
63.0% 54.8% 8.2% Yes p<0.001 ANOVA
Final
69.7% 60.0% 9.7% Yes p<0.001 ANOVA
Course Grade
59.8% 53.9% 5.9% Yes p<0.05 ANOVA
DFW Rate
38.5% 47.8% -9.3% Yes p<0.05 Z-Test for
Ratios
Table 6.4. Comparison of Student Performance versus Control Group 2
JiTT Group N = 173
(A)
Control Group N = 411
(B)
Difference
(A – B)
Significance
Exam 1 66.5% 67.6% -1.1% No p>0.05 ANOVA
Exam 2 67.4% 55.6% 11.8% Yes p<0.001 ANOVA
Exam 3 63.0% 56.1% 6.9% Yes p<0.01 ANOVA
Final 69.7% 60.3% 9.4% Yes p<0.001 ANOVA
Course Grade 59.8% 52.5% 7.3% Yes p<0.05 ANOVA
DFW Rate 38.5% 51.2% -12.7% Yes p<0.01 Z-Test for
Ratios
145

6.5 Works Cited
Brown, LeMay and Bursten. Chemistry the Central Science. 9th Edition. Upper Saddle River, New Jersey: Pearson Education Inc., 2003.
Bonwell, C. C. and Eison, J. A. “Active learning: creating excitement in the classroom.”
(ASHE-ERIC Higher Education Report No. 1, 1991) Washington DC: George Washington University, School of Education and Human Development.
Cash, Joseph; Behrmann, Michael and Stadt, Ronald. “Effectiveness of cognitive
apprenticeship instructional methods in college automotive technology classrooms.” Journal of Industrial Teacher Education vol. 34 1997, pp. 29-49.
Cooper, J. and Mueck, R. “Student involvement in learning: cooperative learning and
college instruction.” Journal on Excellence in College Teaching no. 1 1990, pp. 68-76.
Daempfle, P. “Instructional Approaches for the Improvement of Reasoning in
Introductory College Biology Courses: A Review of the Research.” Paper presented March 2002 Obtained through EDRS Document Number ED468720, 40 pp.
Evanciew, Cheryl and Rojewski, Jay. “Skill and knowledge acquisition in the workplace:
a case study of mentor – apprentice relationships in youth apprenticeship programs.” Journal of Industrial Teacher Education vol. 36 1999, no. 2 pp. 24-54.
Feldman, K. and Paulsen, M. Teaching and Learning in the College Classroom (ASHE
Reader Series). Ginn Press. Needham Heights, MA. 1994. Gavrin, A., Jeffrey X., Marrs K. and Blake, R. “Just-in-time teaching (JiTT): using the
web to enhance classroom learning.” Proceedings of the 2003 American society for Engineering Education Annual conference and Exposition.
Goodsell, A.; Maher, M.; Tinto, V.; Smith B.L. and MacGregor, J. Collaborative
Learning: a sourcebook for higher education. National Center on Postsecondary Teaching, Learning, and Assessment. 1992.
Huba, M, and Freed, J. Learner-Centered Assessment on College Campuses: Shifting the
Focus from Teaching to Learning. Allyn & Bacon Boston, MA 2000 286 pp. Jones, L. “Are Lectures a Thing of The Past? Tips and Techniques for Success.” Journal
of College Science Teaching vol. 32 2003, no. 7 pp. 453-57.
146

Landa, A. and Tarule, J. “Models II: collaboration in post-secondary education.”
Cambridge MA: Collaborative Learning Project of Lesley College Center for Research, Pedagogical, and Policy Studies. 1992.
Lippincott, T. and Bodner, G. “Chemical education: Where we've been; where we are;
where we're going.” Journal of Chemical Education vol. 61 1984, pp. 843. McKeachie Wilbert. Teaching Tips Strategies, Research and Theory for College and
University Teachers. Houghton Mifflin Company Boston Mass. 1999. McManus, D.; Dunn, R. and Denig, S. “Effects of Traditional Lecture versus Teacher-
Constructed and Student-Constructed Self-Teaching Instructional Resources on Short-Term Science Achievement and Attitudes.” American Biology Teacher Vol. 65 2003, no. 2 pp. 93-102.
Novak, G., Patterson, E., Gavrin, A. and Christian, W. Just-In-Time Teaching Blending
Active Learning with Web Technology. Prentice Hall Upper Saddle River, NJ. 1999.
Sawrey, B. (1990). “Concept learning versus problem solving: Revisited.” Journal of
Chemical Education, Vol. 67 1990, pp. 253. Taylor, P.; Gilmer, P. and Tobin, K. Transforming Undergraduate Science Teaching:
Social Constructivist Perspectives. Counterpoints: Studies in the Postmodern Theory of Education. Peter Lang Publishing, Inc New York, NY 2002, 481 pp.
Vygotsky, L. S. Thought and Action (Translated and Edited by: E. Hanfmann and N,
Vaker) Harvard University Press Cambridge, MA. 1962. Ward, R. and Bodner, G. “How lecture can undermine the motivation of our students.”
Journal of Chemical Education, vol. 70 1993, pp. 198.
147

CHAPTER VII
CONCLUSION
As stated in the introduction, the ultimate goal of all of the studies, interventions
and curriculum changes explored over the course of this project has been to improve
student performance and retention in General Chemistry. One of the observations that
inspired this project was that there was a significant correlation between performance in
Introductory Chemistry and performance in General Chemistry. This correlation was
quantified and showed that a students previous performance in Introductory Chemistry is
an excellent predictor of a students subsequent performance in General Chemistry. Since
being able to predict a students performance in General Chemistry is essential for
effective student placement, many of the predictors that are available for this purpose
were examined in detail both experimentally and in the literature. It was determined that
multivariate prediction techniques tend to be more accurate the univariate predictors. It
was also determined that students who earn less than a C in Introductory Chemistry have
only a 12% probability of passing General Chemistry.
The hypotheses that there is a strong correlation between student performance in
Introductory Chemistry and student performance in General Chemistry was the basis for
a study. This hypotheses was that improving student performance in Introductory
Chemistry would improve longitudinal student performance in General Chemistry. This
idea was explored in detail through the implementation of discussion sections in
Introductory Chemistry. It was determined that this hypotheses was correct, and that
148

there were two major effects: First, there was a significant improvement in student
performance in Introductory Chemistry. Second, this group of students showed
significant longitudinal improvement in General Chemistry. The data collected clearly
indicates that improving performance in Introductory Chemistry leads to improved
performance in General Chemistry.
All three of the discussion section formats that were used to improve performance
in Introductory Chemistry were determined to be statistically equivalent to each other in
terms of their effect on student performance in Introductory Chemistry. It was also
determined that the three discussion section formats were statistically equivalent in their
effect on longitudinal student performance in General Chemistry. Students involved in
all three of the discussion section formats significantly out performed all of the control
groups that they were compared to in both Introductory Chemistry and General
Chemistry. It is especially worthy of note that the students involved in the discussion
sections in Introductory Chemistry significantly outperformed the students that had
passed the chemistry placement exam in General Chemistry.
Since it had been determined by a previous study that a large portion of the
attrition among beginning chemistry students is taking place in the Introductory
Chemistry courses, this project investigated the effects of the three types of discussion
sections on student attrition. It was found that all three of discussion section formats
significantly decreased the attrition in the Introductory Chemistry classes. In addition to
the decrease in normal attrition due to poor student performance, it was determined that
149

students involved in the discussion sections had a significantly higher probability of
advancing into General Chemistry after successfully completing Introductory Chemistry
than students from the control groups. Finally it was determined that the students that
had been involved in the discussion sections in Introductory Chemistry had significantly
lower attrition rates in General Chemistry when compared to both control groups. It can
be conclude that the effects of the discussion sections in Introductory Chemistry, on both
Introductory Chemistry and General Chemistry, were positive and highly significant.
The study relating student participation to class performance clearly showed that
student performance in both Introductory and General Chemistry are strongly effected by
student participation and attendance, which make up a very small percentage of the final
course grade. This study shows how important it is that instructors find ways to get their
students actively involved and participating in the course. This data indicated that
students who were involved in class, attending regularly, and turning in all of their
assignments were almost certain to receive a grade of C or better in General Chemistry.
The final study, presented in this project is the effect of using Just in Time
Teaching (JiTT) techniques in General Chemistry on both student performance and DFW
rates. It was determined that the students involved in the JiTT based General Chemistry
course significantly outperformed both control groups in terms of student academic
performance and overall DFW rate. Based on this data, JiTT appears to be an effective
tool for increasing student performance in General Chemistry.
150

In conclusion, this project has explored and developed several effective methods
for improving student performance and reducing attrition in Introductory Chemistry.
These methods also increased student retention into the General Chemistry courses where
student performance was significantly improved. This project also explored a method for
improving student performance in General Chemistry directly and found it to be
effective.
151

APPENDIX A
GLOSSARY
152

GLOSSARY
Attrition – The percentage of students failing to successfully complete a class with a grade of C or better.
Beginning Chemistry – The first semester of college chemistry taken at Texas Tech
University. Beginning Chemistry Population – The total student population in a given semester that
desires to take general chemistry. A combination of students who have passed the chemistry placement exam and those placed into Introductory Chemistry.
DFW rate – The percentage of students in a course that receive a grade of D, F or
withdraw from the course. Discussion Section – any of the three types of supplemental instruction offered with
Introductory Chemistry in the Fall of 2003. General Chemistry – A standard fundamental first year college chemistry course. For the
purposes of this paper, only the first semester of this course is evaluated. Introductory Chemistry – A developmental chemistry class designed to help under-
prepared students develop the background to be successful in General Chemistry. Longitudinal Attrition – The total percentage of Introductory Chemistry students from
any given long semester that do not enroll in General Chemistry the next long semester.
Retention – The percentage of Introductory Chemistry students that take General
Chemistry in the following semester. Student Performance – The average grade receive by the student group for the variable in
question. Ranging from Individual exam scores to final course grade. Student Success Rate – The percentage of students in a class that earn a C or better. Voluntary Attrition – The percentage of successful Introductory Chemistry students who
elect not to take General Chemistry in the following semester.
153

APPENDIX B
STUDENT LEADER TRAINING MATERIALS
FOR DISCUSSION SECTIONS
154

Welcome to Workshop Chemistry
What is a Workshop? If you haven't been in a workshop before you may be wondering what this model is all about. The idea is really simplicity itself. Small groups of students get together under the guidance of a trained student (that's you) who has been successful in the course in a previous semester. Under the gentle mentoring of a leader, the group works its way through a set of challenging problems. The topics of these problems are introduced and reinforced during regular lectures. One goal is for the student participants to construct their own genuine knowledge of the discipline by working through real issues. Another is for all of the students in the group to feel that they have gained experience and confidence in tough problem solving each week -- and that they've achieved this success together. Sounds easy in principle. But in practice, getting a group to work smoothly for a whole semester requires genuine skill and finesse. If you've been nominated to be a leader, this is an indication that you have much of the natural talent needed to set a group in motion and keep it functioning well; this handbook is designed to help you make the most of your own intrinsic abilities. A closer look at the model. Now let's spend a few moments outlining the nature of workshops in a little more detail. At the risk of sounding negative, we'll start out by discussing what a workshop isn't. A workshop isn't a reprise of the lecture; we aren't asking leaders to stand up and repeat what the instructor has already said about the subject matter. Certainly leaders will want to know and understand what was discussed and demonstrated in class, but the goal of the workshop definitely isn't to re-do the lecture during the workshop session. A workshop isn't a recitation or question-and-answer session, where students bring their problems du jour so the leader can fill in the blanks. Of course, questions are asked during the session, but the intention of workshops is to work collaboratively to solve problems, not to ask, say, for a few pointers about Problem #2 on page 39 of the text. A workshop isn't a tutorial, either, during which one person serves as the "helper" and the others are the "helper's." In workshops, the intent is for everyone to help each other out with the material--and to avoid a passive or remedial approach to this work. This model has been shown to benefit students of all levels of ability and experience, so we want the whole group to feel actively engaged by these sessions.
155

How many, how often. The class is divided into small sets of students, usually six to eight per group. Your set of students will meet for the duration of the academic term on a weekly basis, probably for 1 and 1/2 to 2-hour session. During that time, they will work through a set of problems that the instructor has provided, maybe with some input from you. At first, many of your participants will probably be looking to you for lots of information and even the answers to the problems, but after a couple of sessions, due to your reassurance and guidance, they will begin to rely most of the time on the group's fund of knowledge and expertise in problem solving. We say that, when a group is functioning well, an observer can watch the group for some time before determining which student is the official leader. The workshop modules are developed by the course instructor; he or she may borrow or modify the problems from the sample sets of questions previously developed by other faculty members using the workshop model, and then develop some entirely new problems to match the needs of this particular class of students. At most workshop sites, students are not asked to solve the problems before the session, although they are expected to attend lectures conscientiously, read their texts, and complete their other homework for the course. What? No answer key? Also, in most programs, an answer key to the workshop problems is not provided, either to the students or to their leaders. AS you might expect, this at first causes some grumbling among the troops, sometimes rather loud grumbling. The leaders themselves sometimes feel a bit at sea with this approach; they often tell us that they would feel more confident if they could face their students with the right answers tucked in their back pockets. If we've stuck to our guns on this issue of answer key, even after hearing these requests (well, complaints) for several years now, you might guess that we have strong motivation for doing so. No, it isn't because we want to "toughen up" students or put them through a hazing process of some kind. Instead, we know that answer keys can undermine the nature of what we're trying to create--that is, the students' confidence in solving tough problems, in solving strategies for developing their own solutions, and with finding answers that, in the group's opinion, hold up under scrutiny. When you think about it, there are already plenty of "right answers' available in any course: in the back of the text, from old exams, in class, etc. But in real life (whatever that is!), we aren't provided with many verified right answers as we make our way through problems, both professional and personal. Engineers trying to develop new designs for more fuel efficient, cost effective cars can turn to previous work done by other engineers, and they can rely on the expertise and creativity of their own work
156

groups. But there is no manual on their shelves that has the right design at the back of the book. Families facing decisions about how to raise and educate a child have the experiences of others to draw from, but there is no official answer key for this very complex set of choice. Biologists setting up brand new labs may have an enormous amount of information about the equipment they could purchase, but--well, you get the idea. So working without a net, so to speak, is much like the real world, but not much like the academic world most students have experienced to date. Many of the members of your group may firmly believe that it is your job--and that of the instructor --to provide "correct information," and if is their job to memorize this to the best of their ability and then provide a reasonable facsimile of this data on the exams. We want you to emphasize the importance of students believing in themselves as real problem solvers.
157

The Role of a Workshop Leader
• Function as an expert in learning chemistry: proof that students can
succeed in this subject.
• Function as a facilitator: help students develop the thinking and reasoning skills which characterize academic maturity.
• Function as a collaborative learning guide: help students build
comfortable learning communities and share learning strategies while reviewing course material.
• Function as a coach: good coaches occasionally demonstrate a
particular move or strategy for you, but, most of the time, they sit on the sidelines and call out timely advice and encouragement while you run down the track, shoot for the basket, or kick the ball.
• Function as a troubleshooter: spot problems with group dynamics and
with individual students, and help the group find it's way.
• Function as a role model: use student's names and personally acknowledge each student, come to workshop prepared and get your students to do the same.
158

Interpersonal Skills
Voice and Speech • Your voice is a powerful motivator and can either encourage or inhibit student
dialogue. Use your tone of voice to energize and establish the pace of the student/group, interaction.
Body Language • Your body positioning is important: be attentive to whether or not you appear
approachable. • Avoid clasping your hands, clock watching, or tapping your fingers. This can send a
message that you are impatient or uninterested in what the student has to say. • Be attentive to eye contact (without staring). • Respect each student's personal space, being too close or remaining too distant can be
equally distracting. • Be attentive to cultural differences related to comfort level. Listening • Remain non-judgmental and non-evaluative. • The use of silence at appropriate times encourages the sender to continue sending
his/her message. This also reinforces that what is being said is valuable. • Use non-verbal and verbal encouragers such as: nodding, maintaining eye contact,
avoid looking disinterested, respond with Please go on, Tell me more, etc. • Show that you both heard and understood what was said by repeating a word or
phrase. • Retain/store information for future acknowledgment or follow-up. Drawing out group members • Use eye contact to identify the person you are focusing on. Eye contact will be
viewed as an invitation to talk. • Use encouragement to engage a shy/quiet student. • Limit interruptions from other students.
159

THE FIRST DAY
Preparation There is nothing that will help as much as good preparation. For the very first session, plan on spending twice as much time getting ready as you will need later in the term. Start out with the content itself. Re-read the chapter(s) keyed to the first workshop module. This is fun on its own behalf since you'll notice so much more this time than when you read this material as a new student in the course. In terms of the workshop, you'll find that no textbook is perfect. Now you are in a good position to see where the explanations are too complex for a beginning student and where the author has skipped over some necessary steps or failed to define new terminology in a meaningful way. Make note of these places, not with the goal of mocking out the author (it's amazingly difficult to write good beginning chapters to introductory tests), but rather to know in advance where your students may be confused. You want your group to look at the text as a helpful resource, even if it has some weak spots. A good way to do this is to prepare a quick summary sheet of the current reading to collect the main points for your students and fill in the blanks. Students appreciate their leaders' efforts in pulling together cheat sheets like these. Not only do these summaries help students see the forest for the trees, but they also encourage students to prepare these sheets on their own for this course and for other classes. Since most college students feel like they are drowning in information, anything that helps to organize and clarify matters is a plus.
It's also crucial to spend preparation time with the workshop modules. Here are a few things to keep in mind.
• What will the student's reactions be when they read the problems for the first
time?
• What terminology needs decoding?
• Where are the clues in each problem that will help students get started?
• Where are the bear traps?
• How will you confirm your own understanding to the solution? Your fellow leaders are your best connections in this program, so we strongly urge you to
meet weekly with a couple of your counterparts, just to review your own preparation and compare notes. Many leaders have told us that this is one of the most rewarding elements of the workshop program.
• Are you ready to create a comfortable working environment in your group?
• Make sure you have your attendance lists and workshop problems. It may also be a good idea to have an extra copy or two of the workshop problems. Have an icebreaker activity planned to promote positive group dynamics.
160

Room Arrangement
An ideal workshop room is fairly small, so people don't feel lost in a cavernous space. It has comfortable chairs and several small tables that are all easily moved into a square or circular configuration. There is plenty of black- or while-board space, with lots of chalk, markers, and erasers at hand. The room itself is in a quiet location and has good acoustics, so no one needs to shout to be heard. We hope that this is an accurate description of the room you've been assigned, but we know that it's often necessary to work with less than perfect space. • If you don't have movable chairs and desks, figure out how to get students grouped
closely together anyway, so they can look at each other and hold real conversations, rather that all staring ahead at you!
• If the room has little or no writing space, contact the program directs ASAP.
Alternatives are big sheets of drafting paper, a flipchart or an easel, and markers. • If you really hate your room speak up. There may be something else available
somewhere. Also, don't be afraid to be a room detective. You might know of other little conference rooms around campus that would be good choices for workshops.
The First Meeting We would suggest you arrive at your room five to ten minutes early to make sure you've had time to settle in before your students arrive. You should also take a moment to arrange the room for group work as we just described. As the students file in, introduce yourself to each of them and give them a little something to do, just to break the tension of being in a new group. You need them to get to know each other anyway, so you could give them all a piece of paper and ask them to make a table chart with their names (and a drawing of something about themselves, to spark conversation) on them. This is a little kindergarten-like, but it really does help people remember new names. If they start to spread around the room, coax them into moving so that they can see one another. Students are accustomed to sitting in rows and looking to the front of the room that rearranging them may take a little nudging, but don't give up.
161

Attendance Make sure you take attendance and get a list of the email addresses of your group members so you have an easy way to get in touch with them. Ice breaker Set aside 15 minutes for this first meeting to allow students to get to know each other. One suggestion: each student should select someone they don't know well to introduce to the group. The goal here is really just to get every single one of them to say something in the group right away. During this first meeting, working on a positive group environment is your main job. Introduce yourself and the workshop program It is crucial that you spend a few minutes describing yourself and your job as a workshop leader. You'll need to do this in a way that fits your own style and personality, of course, but you'll want to get the idea across that you aren't the junior instructor or the human answer key and all that. Instead, establish yourself as somebody who is a step ahead of them, and who know where the quicksand is in the material. Remind them that you plowed your way through similar work recently, and that now you are eager to help this group do the same. You don't need to mention your GPA, but you will want to assure the group that you found the course do-able. You should also describe the group process very briefly. You probably don't want to spend much time doing this, or you'll run the risk of lecturing at them about how you don't want to lecture! But you can take a minute or two to let them know that the real power of the workshop model is right there in the group itself, and that, among them all, they will be able to find good problem solving approaches and good answers to the workshop problems. Getting down to business
After you've helped your students reach a first name basis with each other, it's time to get down to the work itself. If you're not used to getting people busy check out the Leader Lines for some phrases you could try.
Ex. Ok, now that we know each other a little bit, let's take a look at those problems the instructor handed you for this week.
One of the students has to take the bait at this point. Being the first student to speak up about a workshop problem is a fairly precarious role; you'll want to make this as easy as possible for somebody to start talking. An almost painless way to do this is to ask someone to read the first question out loud, promising this person that he or she will not be expected to start answering the question right away. We say that this almost painless
162
because sometimes there are words within the question that some of the students don't feel comfortable about pronouncing yet. This brings us to an essential principle of working with other people:
Many people would rather fail later than look stupid in front of others at the moment.
As a workshop leader, you should keep this idea in mind at all times. It is one of the key reasons why lectures alone aren't a very effective instructional system: there are far too many ways to look dumb in front of your peers and the instructor if you speak up. The goal is for the workshop to be a place in which a few risks can be taken and mistakes can be made without feeling terrible. You can help right away with this "read the question out loud" plan by using the difficult words in the question in your own request:
Could I get somebody to read this problem about stoichiometry aloud for the group, just to get it on the table?
After the problem is in front of the group, it's time to figure out some approaches to it. They may look at you with big puppy eyes, but resist the temptation to start teaching, no matter how sorry you may be for them. Instead, get them to start picking apart the problem. See the Leader Lines for some ideas. Going up to the board Another important part of starting up the group is making people feel ok about going up to the board or the flipchart. Nobody wants to look like a fool standing up there; so make sure that your volunteers (or your draftees) know that they are being asked to serve at first only as a scribe for the group. Their job is just to write down what the group calls out, step by step. This way, you can get your students used to standing up with a piece of chalk or a marker n hand without making them feel too exposed. An added incentive: the student who has gone up to the board and written something gets to pick the next person to take the chalk. (We're not sure why this works, but it does, and it takes the pressure off the leader). Also, a little competition can be a good thing, even in a program where cooperation is a major goal. So try dividing your students into pairs or triads and set up a friendly contest between the teams. This is a good way to get the students talking to at least one other group member, and it keeps them from looking at you every step of the way.
163

Breaks and snacks Two hours is a long time to stay continuously focused and productive. You may feel tension and frustration begin rise among members of your group from concentrating so hard on these challenging problems. Short breaks are very effective at ensuring a healthy, friendly atmosphere, and good relations between students. After finishing a tough problem don't be afraid to take a 5 minute social break. It's also not a bad idea for group members to take turns bringing a snack to share to workshop--consider it brain food. Leaders, don't forget that it's your job to get the group back on task in a timely manner--this isn't a social hour. Closing Use closure methods to help students pull together key concepts in the last five to ten minutes before they leave the workshop session. Have students identify the big ideas of the workshop and summarize key concepts. What are the main points you learned today? Ok, I'll see you next week!
The First Day in Review
• Attendance • Icebreaker • Introduction • Getting Started • Direct Discussion Back to the Group • Breaks and Snacks • Closing • Journal Entry
164

Leader Lines Getting Focused:
• Well, what do you guys think of the problems in Workshop One?
• Ok, now that we know each other a little bit, let's take a look at those problems in this week's workshop.
• Ok, enough fun and games everyone! Let's see what we've got to work with in Problem One.
Getting Started:
• Could I get somebody to read this problem about stoichiometry aloud for the group, just to get it on the table?
• In the next section, we're going to look at the differences between rate and equilibrium. Would somebody read this question for us?
• Any terms here that we should define before we go on?
• Well, what do you figure this problem is really asking us to do?
• H'mm--this is a challenge isn't it? What information here seems the most essential to you right now?
• What do you remember from the lecture or the text about this topic?
• I have a feeling it's going to take all of us to solve this one. Directing Discussion Back to the Group
• Will you help Mary answer that question?
• Will you find the answer to that in your notes?
• Let's look that up in the book.
• What do you think about that?
• Let's see if we can figure out how to answer it together?
• Let's rephrase it on the board and figure out what information we will need to answer it.
• Can you be more specific?
• Give an example of that.
• What do we need to know in order to solve the problem?
165

• How is that related to…?
• Will you summarize the discussion up to this point?
• How would you say that in a different way?
• Which words in the question do you not understand?
• What are we trying to figure out?
• What do you need to do next? Stumped Leader Responses:
• That’s a great question. Let's take a look in the text to see what the author has to say on this issue.
• That's a great question, but it's a bit beyond me. I'll check with the instructor tomorrow, and I'll email you all the answer.
• That's a great question. Who has a start toward answering it?
166

Leader to Leader Advice The First Day by: Jeremy Chukka, workshop leader The first workshop session is the most important workshop of the semester. It is where the students are first introduced to the "workshop" format, the workshop leader, each other, and to organic chemistry problem solving. The recipe for a successful workshop requires a successful first day. All too often, critical issues are not stressed, and the group is sent down the path of the all-too-boring silent, ineffective workshop. When students enter the workshop environment for the first time, they do not know what to expect. They have already been through traditional discussion sections and recitations, and most of them will initially feel more comfortable in that setting than in the workshop environment. As a result, it would not be unusual for them to use the recitation style as a safety blanket when first entering the workshop program. This is what we do NOT want to happen. A successful first day, in order to bring students out of the realm of the recitation and into the realm of the workshop, must dot the following: • Give students a general understanding of the workshop program. They should
understand the goal of the program, and what is requires of them as students. • Show the students what workshop leaders are. They're not scary. They are just
normal students who want to help everyone in their workshop understand the material in the most enjoyable and effective way possible. Ideally, this would lead everyone to an "A" in the course. Let it be known the leader is there to help.
• Create a pleasant atmosphere where learning is both effective and fun. Give students
some time to get to know one another. Avoid the following: "My name is ______, and I am a _______ major." It produces the aura of a traditional classroom.
• Give the students a SEMI-format for solving workshop problems. No rigid structure
should be given. What should be stressed is that the students should be working together actively. The more chem-, bio-, physics-, or math-noise, the better.
If these suggestions are followed, and the leader adds a little bit of his/her "special spice," then there's no doubt the workshop will be off to a successful start.
167

Student-Leader Relationships by: Kristin Ganschow, workshop leader The Problem: A problem often faced by workshop leaders is maintaining a student-leader relationship that conveys friendship and encourages group interaction, while at the same time maintaining some sort of authority and control over the group. Often the students will look to the leader for all the answers, which can detract from group learning and interaction. The workshop leader must somehow step down from the teacher role , but still keep enough control to head the group in the right direction, and enough authority to obtain and keep students' trust. Possible Causes: A possible cause of this problem is the leaders' desire to teach the students everything they know about organic chemistry. It is often easy to step in to soon and show students the answer rather than letting the group work things out for themselves. Watching others make mistakes is difficult when the answer seems obvious. A cause for the opposite problem--a lack of authority--can be a lack of preparation. If the leader does not know what a problem is all about or makes too many mistakes, the students' trust could be lost. Possible Impact: If left unattended, an overly ambitious workshop leader could wind up handing out information in answer-key format rather than letting students discover and truly understand the concepts behind the problems. The workshops will turn into a large lecture format where the leader is spewing out information that the students will try to ingest. Conversely, if a leader has no authority, the students may not respond to the group leader's directions and end up in the middle of Kansas looking for the Sears Tower. Suggestions: Here are several things workshop leaders should keep in mind to achieve a good student-leader relationship: • Be honest with students. Tell them you are not there to give them answers, but to
facilitate group interaction. • Direct questions elsewhere. When students look to you for help, try to get them to
help each other. Do not step in until everyone seems clueless. • Rely on confidence and knowledge to convey authority. Even if you infrequently
answer questions and insist you don't have all the answers, a confidently answered question once in awhile will keep students' trust.
Following these guidelines will not only help you to achieve a good balance in the leadership position, but will also foster good group interaction as well. A harder distinction to make is the difference between a worship leader and a friend, especially if you are close in age to your workshop students. Good workshop leaders are certainly friendly and supportive people, but, at least during workshop sessions themselves, they are employees of their institutions. You've seen this in your best instructors; they are able to demonstrate a genuine personal concern for their students,
168
and, during class time, they find ways to keep the focus on the students' academic needs. So, as a leader, you'll want to be congenial and more or less a peer, but not really a buddy. Even more confusing are the romantic attachments that may develop between a student and the leader during the course of the academic term. It's not hard to see how this can happen; after all, you're students at the same institution, and you have a lot in common. The bottom line from our previous leaders goes like this: if the attraction isn't mutual, kindly but distinctly, let the student know that you need to keep a professional relationship in place. If the feelings are coming from both of you, remember that an academic term is a very short span of time. It might be hard to stick to boundaries for awhile, but if there is anything good between you, it will last until your official duties with that workshop group are concluded.
169

How Do I Handle the Student Who Gets Everything Right? Dealing with Uneven Abilities in the Workshop by: Andrew Epstein, workshop leader A potential problem in the dynamics of groups is an uneven distribution in the intrinsic abilities of the members. While intelligence/academic performance is by no means an "all-or-none" phenomenon, and certainly relies heavily on steady work habits, interest in learning, and more personal motivations (vocational, etc.), some individuals may be "natural" or more comfortable with certain material. This heterogeneity is particularly believed to be present in scientific education, in terms of the stereotypical "math and science" person--these people just seem to "get it." Let's say we have such an individual in our workshop--what might this mean for the rest of the group? A workshop leader doesn't want to ignore the needs of other students who must have their skills enhanced at a different pace! This set of circumstances can worsen very quickly if left unattended. Students who excel may not be immediately interested in sharing their talent, may not have the confidence to do so, or may not know how. Other less advanced students may become frustrated with their own efforts, and resent the "ease" with which fellow group members reach an understanding of concepts. These people may lose confidence in themselves, withdraw from the group in terms of participation and contribution, and eventually not even care about the subject in any way--all problems that the cooperative learning method in workshop attempts to extinguish. In light of these thoughts, the following are some ideas that may help your group dynamics: • Pair strong students with weaker students in group activities. This will encourage
strong students to share their thought processes in a closer setting. Weaker students may be less inclined towards embarrassment if fewer people are watching. They may also develop a friendly working relationship with the stronger student that will enhance confidence, interest, and motivation. Presentations to the group are made by the weaker student with the assurance of the stronger student's input--a potentially huge confidence builder that improves participation.
• After seeing this happen, try rotating your pairs. This gradually challenges your
weaker students to take some confidence and individual thinking skills with them to a new mini-group. Try to maintain the stronger-weaker ratio as best you can.
• Chances are your stronger students are aware of their abilities relative to the group.
Take them aside and praise them on their talent, and challenge them to integrate their abilities. Make mention of how they are a valuable resource--remind them this is THEIR group. Everyone wants to feel important.
170

• Remember to let students work individually on occasion as well. This is a great opportunity to challenge the intellects of your future leaders with more advanced concepts. Push them! I always enjoyed figuring out what stumped me. This individual work also provides weaker students with a chance to actualize their improvement. Tailor the problems you give them to their current abilities, but don't necessarily baby them. When they get something right on their own, it is invaluable for growth.
As always, a successful workshop is a unique combination of these ideas. Good luck , leaders!
171

Helping a Group That Won't Talk Much by: Ryan Rekuski, workshop leader Silence: At times, nothing can be sweeter. So quiet you can hear your own heart beat. However, your workshop is neither the time nor the place. After all, it's not a test. It's an adventure in group learning, a collaborative effort to help each other learn and understand the subject. What you want is lively discussion and interaction. What if this does not happen? What if the group sits quietly and stares at you, waiting for you to spit out answers like the average T.A.? What if they work, but by themselves, like it really were an exam? What if they only talk to the one other person in the workshop they know? What if there is dead silence? What is a workshop leader to do? How does one facilitate interaction and discussion? Well, let's look at some possible causes , the effect they can have on the workshop, and finally some viable solutions. It is early in the semester and people are still apprehensive about workshop and don't feel comfortable with the other members in the group and the leader. If a level of comfort in which people feel they can freely ask or answer questions is never established, people will never open up. They will sit quietly and wait for answers to be given by someone else. Group members hope that person will be you. There will be neither interaction nor discussion. The group will get accustomed to the format of this "faux workshop," which will make it hard to develop a good group dynamic as the semester progresses.
This problem can be alleviated by establishing a high level of comfort early. Get students talking to each other right away, even if it is not always about the course content. Give them time in the beginning to talk and set up relationships. It will help them become more comfortable, which will lead to better group dynamics, better discussion and a better overall experience for everyone.
The group is just quiet and reserved, introverted. This is not really a "problem." It can lead to some of the same problems as in (1), in that there could be a lack of interaction and discussion. However, this may not be indicative of a lack of learning and benefit. People may benefit from being able to talk to others, when necessary, though it may not be often.
There is not much to "solve "here Try to get students to interact, but allow them to have their space. Let them work in a way that is best for the group. If it's quiet, that's okay, as long as the workshop is productive.
172

Students come unprepared. This is a huge problem. If the cause of the silence is unprepared students, workshop becomes an exercise in futility. Unprepared students slow the group down, and want you to teach them the material. Those students who do come prepared begin to resent those who do not. People feel like workshop is not helpful. It is frustrating for the leader as well, because this can cause students' expectations of the leader to rise. They expect you to have answers, when they should be working together to find them. You become the answer key, not a resource.
To resolve this, try to find out why they are unprepared. Then, let students know early that the material builds on itself / understanding early concepts is vital to comprehending later material. Tell them about personal experiences of how being prepared/unprepared helped/hurt your performance. Let them know the implications of their actions, how their being unprepared hurts the group.
If the cause of poor preparation is that student feel lost and confused, point them in the right direction to get help. Remind them that the professor has office hours for exactly those reasons. Tell them about the learning center, study groups, and tutoring. Be the resource of information that you are.
173

Dealing with a Question that Stumps the Leader: Finding the Answer by: Laurie Kurtelawicz, workshop leader One of the things both new and experienced workshop leaders fear is not knowing the answer to a problem or question. Most people will encounter this circumstance sooner or later, and contrary to popular belief, it probably won't cast doubt on your worthiness to be a workshop leader. The most important thing to remember when you are in this situation is: Don't Fake It!!! The group will know if you are making an answer up and that will cause them to lose confidence in you. The next most important thing to remember is Don't Panic!! As a workshop leader, you have many resources available that can help you find the answer to a tough problem. One resource is the textbook. It can help you to understand the problem. After you work through the problem with your group, it often helps students if you tell them the area in the text where they can review the principles behind the problem. Other workshop leaders are also an excellent resource. Doing the problems ahead of time with other workshop leaders gives you a chance to pool information with others when dealing with difficult problems. It also offers you the opportunity to practice explaining the reasoning behind the problems. Another resource which if often overlooked by workshop leaders is the professor of the class. Don't be afraid to ask him or her questions if you are really stuck. One of the most constructive things you can do in the workshop itself is to direct the question back at the group. Ask questions such as, "Does anybody have any ideas on this topic?" More often than not, together the group will be able to solve the problem using their collective knowledge. you can lessen the stress of this situation before it happens by reminding your students that, while you are qualified to help them, you aren't a professor and don't have all of the answers.
174

CHEM 1301 Workshop Chemistry Fall 2003
Meetings Workshops begin the week of August 30th
Attend weekly meetings.
Attendance Assign point values of 5, 2.5, or zero. Please do not
& Self-tests leave attendance or self-test boxes blank. You must assign one of the above values.
Journals Please write one reflective journal entry immediately
following each workshop. Turn your journal in to CHEM 038 No later than Monday morning. Journals will be read and returned to you during the weekly meeting.
Review Review workshop materials before workshop. Do all
problems without using your notes/workbook.
Plan Ahead Tell your group what to do if you are late/unable to make it to workshop due to an emergency. Call and email Dr Blake (742-4200, [email protected]) if you will miss a workshop. Also, contact Dr. Blake if you cannot make it to a weekly meeting. Unexcused absences are unacceptable.
175
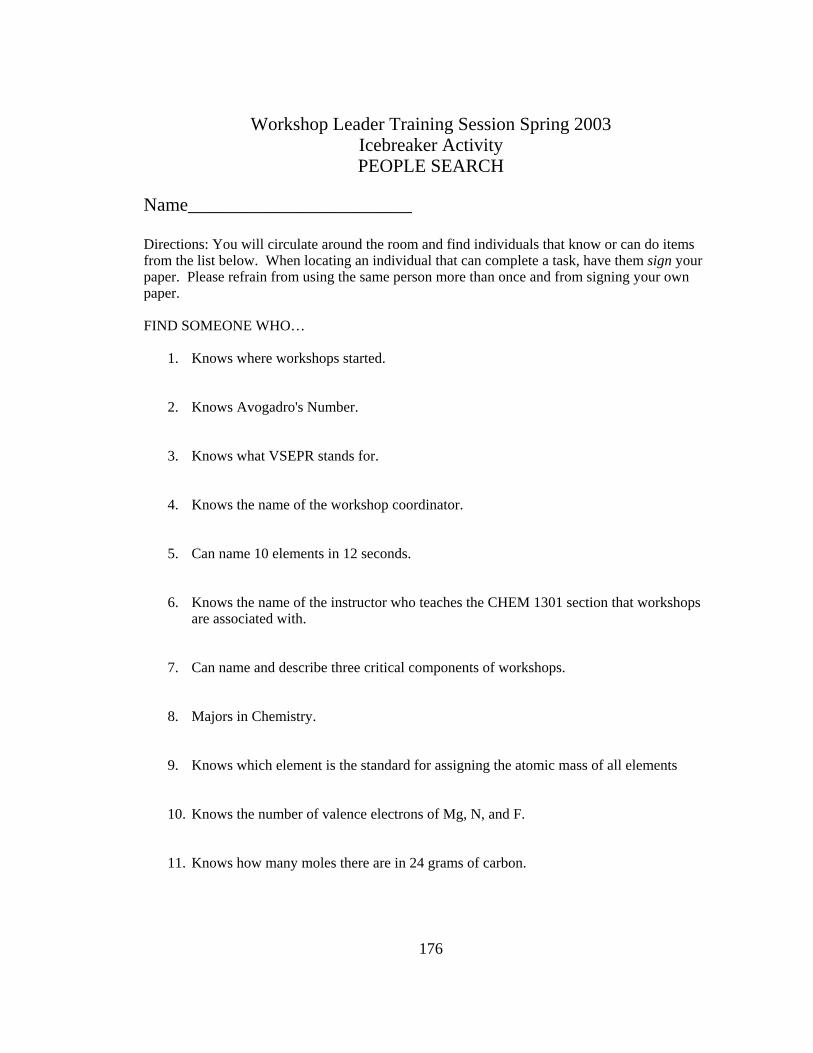
Workshop Leader Training Session Spring 2003
Icebreaker Activity PEOPLE SEARCH
Name________________________ Directions: You will circulate around the room and find individuals that know or can do items from the list below. When locating an individual that can complete a task, have them sign your paper. Please refrain from using the same person more than once and from signing your own paper. FIND SOMEONE WHO…
1. Knows where workshops started.
2. Knows Avogadro's Number.
3. Knows what VSEPR stands for.
4. Knows the name of the workshop coordinator.
5. Can name 10 elements in 12 seconds.
6. Knows the name of the instructor who teaches the CHEM 1301 section that workshops are associated with.
7. Can name and describe three critical components of workshops.
8. Majors in Chemistry.
9. Knows which element is the standard for assigning the atomic mass of all elements
10. Knows the number of valence electrons of Mg, N, and F.
11. Knows how many moles there are in 24 grams of carbon.
176

CHEM 1301 Workshop Leader – Fall 2003
Job Description a. Conduct weekly Workshop sessions (two hours) during the designated time. b. Attend weekly Workshop training course and complete all assigned work for
the course. c. Prepare for each Workshop session. d. Write a weekly journal entry reflecting on each workshop. e. Maintain regular attendance records for your Workshop. f. Respect the feelings and rights of individuals in the Workshop and treat all
matters in a confidential manner - even the most obvious. The workshop responsibilities begin the first week of classes and continue through the Final Exam in Chem 1301. I will receive $500 per semester for executing these duties. ____________________________ ________________________ Leader's signature Social Security Number
____________________________ _________________________ Supervisor's signature Date
177

APPENDIX C
SAMPLE PEER LEAD TEAM LEARNING UNITS
FROM DISCUSSION SECTIONS
178
Unit 5: Describing the Action As you will see during your study of chemistry, chemists try to describe the world, predict how components of the world interact with each other and try to use this knowledge to improve the quality of life. Chemical reactions are involved in the manufacture of materials, the growth and death of all organisms and many of the processes that generate energy. Understanding these reactions can help us to take control of them. Conservation of Matter During ordinary chemical reactions, matter is conserved. In addition, during ordinary chemical reactions, atoms do not change identity. Because of these observations, we know that during a chemical process, the number of each type of atom at the end of a reaction must be equal to the number of each type of atom at the end of a chemical reaction. Whenever we try to describe a process using a chemical equation, we need to keep this in mind. Formulas A formula tells us the composition of a material. It tells us which atoms are part of the material and how many of each type. A very simple formula is H2O, which is the formula for water. Water is composed of two hydrogen atoms attached to one oxygen atom. You could visualize this as two little spheres attached to one big sphere.
Our visual representation of water will improve in accuracy as we learn more about the
ial. he ions can
e separated from each other fairly easily, but the NO3 ions will tend to stay in one piece. Here is a simple visualization of the components of calcium nitrate.
details of the shape of the molecule and its behavior. Sometimes the formula will tell us more about the arrangement of atoms in the materThe formula Ca(NO3)2 tells us that there are two NO3
- units for each Ca2+. T-b
179

Unbalanced Chemical Equations Chemical equations describe chemical reactions. If you mix sodium with oxygen, you will produce sodium oxide. This can be expressed concisely with the following chequation.
emical
Na + O2 Na2O
ants and products, but as written suggests a Matter. There was only one sodium atom in the
ite
alancing Chemical Equations
ibe
It is helpful to start by looking at tion and to try to add or change e coefficients of the compounds that contain it so that there is the same number of that
e number of sodium atoms and the number of oxygen atoms. To balance the number of
This describes the identities of the reactiolation of the Law of Conservation ofv
reactant, but there are two sodium atoms in the product. We might be tempted to wrNaO as a product to fix this problem, but we are not allowed to change any of the subscripts in the formulas. NaO does not exist, but Na2O does. Remember that charges have to balance to have a stable compound, so sodium oxide requires two sodium(+1) ions for every oxide(-2) ion. B In order to correctly describe what happens during a chemical reaction, we need to correctly describe the identities of the reactants and products. We also need to descrthe amounts of each product and reactant so that the Law of Conservation of Matter is obeyed. In order to do this, we will include coefficients as part of the equation. They will identify the relative amounts of reactants and products that are involved in the reaction.
one of atoms in the equathatom on each side of the equation. Many times it is helpful to look first at the most complicated molecule in the equation. If we change the coefficient of the Na2O, we alter thsodium atoms, we can add a coefficient of 2 to the Na, and then we will have 2 sodium atoms on each side of the equation.
2 Na + O2 Na2O After we make this change, we must preserve the 2 to 1 ratio of sodium to sodium oxide to preserve the equality in the number of sodium atoms between each side of the reaction.
180

Next we need to consider the num the above reaction, there are 2
xygen atoms on the left side of the equation, but only one on the right side. Thus, we
oefficient of sodium oxide, we must also double the coefficient of the sodium.
4
ber of oxygen atoms. Inowill want to change to coefficient of the sodium oxide from one to two. When we do this, we must remember that changing the coefficient of the sodium oxide will alter the number of sodium atoms as well as the number of oxygen atoms. If we double the c
Na + O2 2 Na2O
st whole number oefficients that describe the proper ratios of reactants and products. A typical type of
reaction is a combustion rea flammable substance is urned in the presence of oxygen to form oxides. If the flammable substance contains
n
Ethanal plus oxygen will form carbon dioxide and water.
n carbon atoms in
e ethanal, then we need a coefficient of 2 for the carbon dioxide to balance the carbon atoms.
Balancing a reaction is like a game in which we constantly need to be aware of what wehave done in the past and how what we will do next will affect what we have done. Wewill learn more strategy to help us balance equations as we learn more chemistry. Properly Balanced Most chemists prefer balanced chemical equations to contain the lowec
ction. In a combustion reaction, a bcarbon, one of the products is carbon dioxide. If the flammable substance contains hydrogen, one of the products will be water. Here is the stepwise balance of the equatiofor the combustion of ethanal, CH3CHO. The first step is to write the unbalanced equation.
CH3CHO + O2 CO2 + H2O Again, we start with the complicated molecule, in this case CH3COH. All of the carboin the starting material ends up in the carbon dioxide. If there are two th
1 CH3CHO + O2 2 CO2 + H2O
Likewise, all of the hydrogen in the ethanal becomes part of the water. If the ethanal contains 4 hydrogen atoms, we need a coefficient of 2 for the water.
1 CH3CHO + O2 2 CO2 + 2 H2O After we have added that coefficient, we have balanced the numbers of carbon and hydrogen atoms, so only the oxygen balance is left. We have fixed all of the coefficients except that of the elemental oxygen, so we will add a coefficient there to complete the
alancing of the equation. Due to the carbon dioxide, there are 4 product oxygen atoms and due to the water, there are 2 product oxygen atoms for a total of 6 product oxygen b
181

atoms. The ethanal supplies one oxygen atom, so the oxygen starting material must supply 5 oxygen atoms. One half an O2 molecule is one oxygen atom, so 5/2 O2 molecules would be 5 oxygen atoms. Thus, we can balance the equation by writing
CH3CHO + 5/2 O2 2 CO2 + 2 H2O Chemists prefer to have integer
ant to convert the 5/2 to a wh coefficients for all reactants and products, so we will ole number. If we multiply all of the coefficients by a
ation of States
One of the important pieces o ed in a complete chemical equation is the state of each reactant and product. This is done using an abbreviation in parenthesis. Solids are followed by (s), liquids by (l), gases by (g) and solutes dissolved in water by (aq), for aqueous. For completeness, we can re-write the balanced equations
omplex Ions
any times the polyatomic ions do not get involved in a reaction. They can be counted
H2O(l) + Na3PO4(aq)
Any chemist wo his reaction. his observation allows the counting of phosphate as a unit, which is much simpler than
dium
3
wfactor of 2, we eliminate the fraction from our equation.
2 CH3COH + 5 O2 4 CO2 + 4 H2O Design
f information that can be convey
above.
2 Na(s) + O2(g) Na2O(s)
2 CH3COH(aq) + 5 O2(g) 4 CO2(g) + 4 H2O(l)
C
Mas units instead of keeping track of all the individual atoms that they are composed of. Thinking of groups of atoms can greatly simplify the balancing of some chemical equations. Consider the following unbalanced equation.
NaOH(aq) + H3PO4(aq)
uld recognize that phosphate (PO43-) is unchanged during t
Taccounting for each individual atom. Initial inspection of the equation reveals that the phosphate ions are already balanced. Placing a coefficient of three in front of the sohydroxide will balance the sodium atoms.
NaOH(aq) + H3PO4(aq) H2O(l) + 1 Na3PO4(aq)
ther than the sodium atoms and phosphate ions, only the hydrogen and non-phosphate Ooxygen atoms are left to worry about. On the left there are 6 hydrogen atoms, so a
182

coefficient of three for the water molecules will balance the hydrogen atoms. This alsbalances the oxygen atoms.
o
3 NaOH(aq) + 1 H PO (aq) 33 4 H2O(l) + Na3PO4(aq)
ists have noticed many patterns of
atterns of Chemical Reactivity
on scheme based on chemical reactivity. of the chemical equation that is
any elements or compounds are involved.
ingle Displacement Reactions
lement that reacts with a compound to become part of e compound, causing one of the elements that was part of the compound to be left
eone “cu Double Displacement Reactions These reactions involve two compounds. They react with each other such that both partners are exchanged, similar to when two couples are square dancing. An example is
ith practice evaluating chemical equations, chemW
behavior that make balancing chemical equations easier. Treating polyatomic ions as groups is one such example. In the next unit, we will see that chemists also look for patterns of chemical reactivity. If you wish to do well in chemistry classes, discovering these patterns and thinking like a chemist will be a great asset to you. P
the last example, we saw that thinking of the phosphate ion as a unit was helpful. If Inwe examine the rest of the equation, we can see an important reactivity pattern. Hydrogen ions in the phosphoric acid react with hydroxide ions in the sodium hydroxide to form water. There are many examples where hydrogen atoms from one compound react with hydroxide atoms from another to form water. Classifying Chemical Equations In the next unit we will examine a classificati
here is another classification scheme based on the formTappropriate to examine now. The four categories are a) single displacement reactions, b) double displacement reactions, c) synthesis (combination) reactions and d) decomposition reactions. These classifications do not tell us why something happened,
ut they do tell us something about how mb S These reactions involve one pure ethbehind as a pure element. An example is
Na + AuCl Au + NaCl
any people think this type of reaction is similar to the situation when a couple is Mdancing and som ts in”.
183
NaCl + AgNO3 NaNO3 + AgCl
uring decomposition reactions, a compound is broken down into two or more smaller pieces. An example is
O3 CO2 + CaO
o or more chemicals that combine to form a single larger hemical. It is easy to see that combination reactions are the opposite of decomposition
reactions. An example is
2 Mg + O2 2 MgO
Decomposition Reactions D
CaC
Combination Reactions These reactions involve twc
184
Pre-workshop Problems 1. For each compound, write the chemical formula and list how many of each type
of atom are in each formula unit.
a. calcium phosphate b. sodium nitrate c. ammonium carbonate d. iron (III) hydroxide e. magnesium chlorate
2. Using your textbook, give examples of unbalanced chemical equations of each
type listed below that are different than the examples shown in this unit.
a. single displacement b. double displacement c. synthesis (combination) d. decomposition
185

Cooperative Group Problems 1. What is the difference between a coefficient and a subscript in a chemical
equation? What is the result if you change a coefficient in an equation? What is the result if you change a subscript?
2. For the balanced chemical equation
3 NaOH(aq) + H3PO4(aq) 3 H2O(l) + Na3PO4(aq)
a. Draw pictures of all four reactant molecules and all four product molecules.
b. Count the number of atoms of each type on the reactant and product sides of the equation.
Element Reactant atoms Product atoms H O Na P
c. Does this reaction obey the Law of Conservation of Matter? Explain.
186

3. For each reaction described below, write an unbalanced chemical equation and
then balance it. For each step in the process, explain to your group what you do and why you do it. If you know the states of matter for the reactants and products, indicate them in your final answer.
a. Calcium hydroxide reacts with nitric acid to form calcium nitrate and
water. b. When heated, sodium peroxide will release oxygen gas and be
transformed into sodium oxide.
187

c. Iron (III) oxide will react with carbon dioxide from the air to form iron (III) carbonate.
d. A blue-green solution of cobalt (III) chloride will turn colorless after zinc
metal is added to the solution. A precipitate of cobalt metal grows as the blue-green color disappears from the solution.
188

4. For each reaction you balanced in problem 2, describe what type of reaction it is and explain how you made your decision.
a. b. c. d.
5. For the four types of chemical equations discussed in this unit, write a general form
of an equation for each one. Where it is appropriate, use the general symbols A and B for metal atoms or ions and the general symbols C and D for nonmetal atoms or ions.
a. Single displacement b. Double displacement c. Synthesis d. Decomposition
189

6. For each sentence below, write the unbalanced chemical equation that summarizes the process and then balance the equation.
a. Lead (IV) oxide reacts with perchloric acid to form lead (IV) perchlorate and water. b. Butyl alcohol (C4H9OH) is burned in air to form a hot gaseous mixture of carbon
dioxide and water. c. Platinum (IV) nitrate reacts with sodium bromide to form platinum (II) nitrate,
bromine and sodium nitrate.
190

Unit 6: Predicting the Results This unit deals with a critically important concept in chemistry: predicting the course of chemical reactions. At any time on planet Earth, there are literally millions of chemical reactions occurring simultaneously. In order to understand as many of these reactions as possible, general types of reactions have been recognized and described. Classifying types of reactions dramatically reduces the amount of memorization that we need to do to understand them. You will have to memorize many facts to become good at doing chemistry, but understanding general principles will lessen the load.
Types of Reactions The millions of chemical reactions can be classified into thousands of different general types of reactions. At this point, we will only study a few of the most important reaction types, acid/base, precipitation and oxidation/reduction. Reaction Tendencies If you observe society, you will see that each person you know will tend to react predictably in certain ways. People with short tempers generally are more likely to get into arguments than people who are more easy-going. Likewise, chemicals sometimes seem to have personalities because they predictably follow the same patterns of behavior when involved in reactions. If you wish to predict what a chemical will do in a particular reaction, it is useful to know how it normally reacts. As the reaction types are described in this unit, the compounds that participate in each type of reaction will also be described. Make sure that you learn how to identify each type of compound and predict what it might do.
Acid/Base Reactions There are many definitions for acids and bases, but we will only use one definition for acids in this course. An acid is a chemical that will transfer a H+ ion to another chemical. The chemical that receives the H+ is called a base. If you are given an equation for an acid/base reaction, recognizing that it is an acid/base reaction follows simply from understanding these definitions. This is illustrated below, both with a chemical equation and a picture.
191
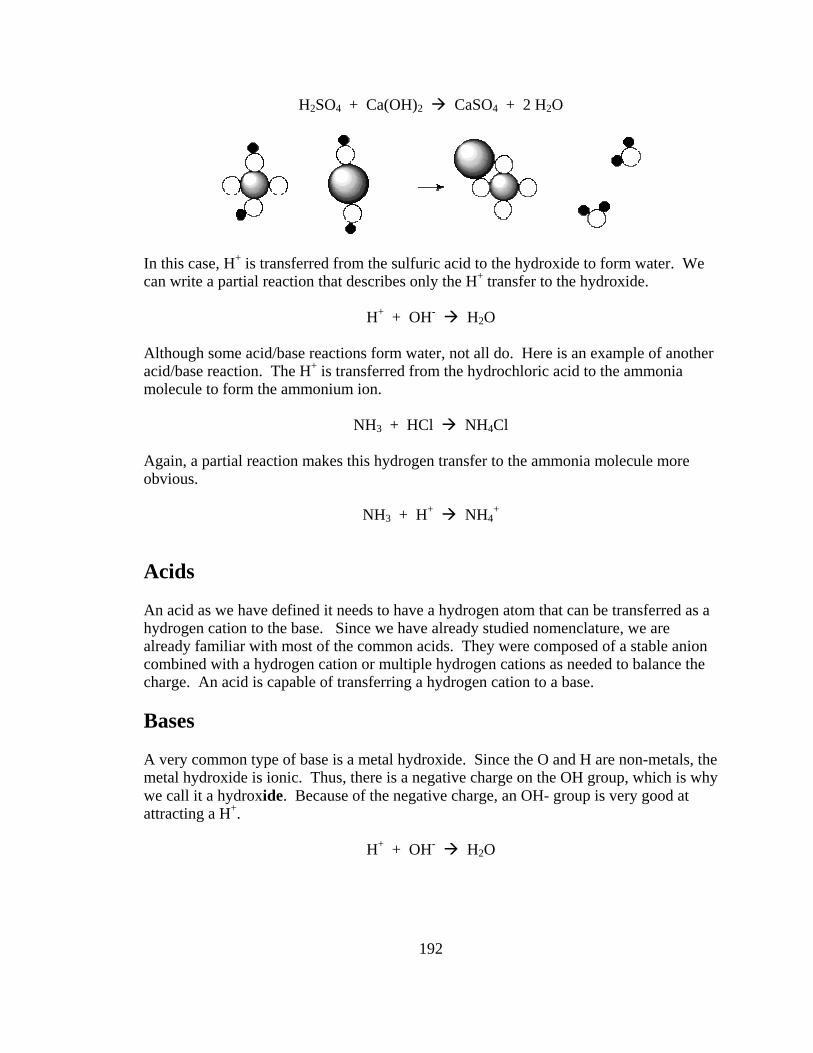
H2SO4 + Ca(OH)2 CaSO4 + 2 H2O
H + OH- H2O
lthough some acid/base reactions form water, not all do. Here is an example of another
form the ammonium ion.
N l
gain, a partial reaction makes this hydrogen transfer to the ammonia molecule more
+ +
n acid as we have defined it needs to have a hydrogen atom that can be transferred as a cation to the base. Since we have already studied nomenclature, we are miliar with most of the common acids. They were composed of a stable anion
A very common type of base is a m e the O and H are non-metals, the metal hydroxide is ionic. Thus, there is a negative charge on the OH group, which is why
In this case, H+ is transferred from the sulfuric acid to the hydroxide to form water. We can write a partial reaction that describes only the H+ transfer to the hydroxide.
+
Aacid/base reaction. The H+ is transferred from the hydrochloric acid to the ammonia molecule to
H3 + HCl NH4C Aobvious.
NH3 + H NH4 Acids Ahydrogenlready faa
combined with a hydrogen cation or multiple hydrogen cations as needed to balance the charge. An acid is capable of transferring a hydrogen cation to a base. Bases
etal hydroxide. Sinc
we call it a hydroxide. Because of the negative charge, an OH- group is very good at attracting a H+.
H+ + OH- H2O
192

If an OH group is combined with non-metals, then it will not have a negative charge act as a base. An OH group is not termed a hydroxi
or de unless it is in an ionic compound.
Most other negatively charged ions, especially highly charged ones, can also accept the ositively charged H+. One important example of this is carbonate. Carbonate can
d.
H+ H2CO3 H2O + CO2
d olorless liquids. This type of reaction looks like magic for people who
o not normally watch chemistry in action. The key to understanding these reactions is lve in water, but others do not. It
predict
set of rules is far from complete. To keep the list
f rules manageable, only the most common ions are included. Secondly, the criterion for deciding what is soluble is somewhat arbitrary. No compound is completely insoluble; they all dissolve at least a little bit in water. A good set of solubility rules will clearly state a quantitative definition of solubility that was used to write the rules. The criterion must include the amount of compound that will dissolve in a particular amount of water at a particular temperature.
paccept two hydrogen ions to form carbonic acid, which subsequently decomposes intocarbon dioxide and water. The basicity of carbonate is very important for antacids, geological sciences and the stability of our bloo
CO32- + 2
Another very important base is ammonia, which was shown earlier in this unit. It is involved in the preparation of fertilizers and important specialty chemicals. Ammonia reacts with acids to form the ammonium ion. Precipitation Reactions A very popular demonstration of chemical reactions involves the precipitation of a solifrom two clear, cdan understanding of solubility. Some compounds disso
possible to mix two soluble compounds that are dissolved in water such that an isinsoluble solid precipitates from the reaction mixture. If we wish to accurately predict the course of these reactions, we first need to learn which compounds are soluble and which are not. Solubility Rules for Ionic Compounds Most textbooks have a list of rules for you to memorize so that you will be able towhich ionic compounds dissolve in water and which do not. Similarly, the flash card packet that accompanies this workbook has a set of solubility rules that generalizes the patterns of solubility for ionic substances. There are a few important points about this setof generalizations and others. First, theo
193

Predicting Precipitation Reactions For you to gain skill in making predictions about precipitation reactions, you must first have an understanding of the solubility guidelines. Many people find that learning the solubility rules is much harder than applying them. If a pair of ions that form an insoluble compound is brought together in water, then the insoluble compound will precipitate. Here is an example of a precipitation reaction.
AgNO3(aq) + NaI(aq) AgI(s) + NaNO3(aq) Silver nitrate, like all nitrates, is soluble. Sodium iodide, like most iodides, is also soluble. Thus, they both form homogeneous solutions in water. Silver iodide is one of the few insoluble iodides, so when a solution containing the silver ion is mixed with a solution containing the iodide ion, solid silver iodide forms. When you are trying to predict chemical reactivity, knowing which ions generally precipitates is just as important as knowing which compounds are acids and how to name compounds. Oxidation/Reduction Reactions Predicting the course of oxidation/reduction reactions is a skill that is quite advanced. For this reason, at this stage we will only concern ourselves with the identification of oxidation/reduction reactions. Historically, oxidation referred only to the reaction of a substance with oxygen to form an oxide. Many substances will participate in this type of reaction. For instance, sulfur will react with oxygen to form either sulfur dioxide or sulfur trioxide. Later, scientists recognized that most compounds that reacted with oxygen would also react in a similar fashion with chlorine or fluorine. Sulfur can react to form sulfur tetrafluoride or sulfur hexafluoride. In either case, our view is that the sulfur transfers electrons to oxygen to form oxides or to fluorine to form fluorides. When studying acid/base reactions, we needed to keep track of H+ transfers. When studying oxidation/reduction reactions, we will keep track of electron transfers. Definitions: Oxidation and Reduction If an element is oxidized, it loses electrons. If an element is on the other end of the electron transfer and gains electrons, it is reduced. Many students can remember LEO says GER, which is a mnemonic for Loss of Electrons is Oxidation and Gain of Electrons is Reduction.
194

Definitions: Oxidizing Agents and Reducing Agents If you wanted to clean the floor, you would use some sort of cleaning agent, like a soap or detergent. The transfer of the dirt from the floor to the cleaning agent would mean that the floor was cleaned. The terminology for oxidizing agents is similar. If you wanted iron (III) ions, and you only had iron metal, you would need to oxidize the metal by removing some of its electrons. Anything that could take electrons from iron metal would allow you to accomplish the oxidation of the iron, just like anything that could take the dirt off the floor accomplished the mission of cleaning the floor. During the process of oxidizing something, the oxidizing agent becomes reduced, just like during the process of cleaning something, the cleaning agent becomes dirty.
Fe + oxidizing agent Fe3+
Iron is oxidized by the oxidizing agent Oxidation Numbers Oxidation numbers were invented so that chemists could keep track of electron transfer reactions. For compounds that are not ionic, like carbon dioxide, it does not really make sense to talk about the charge on the carbon atom. Carbon dioxide stays intact and never dissociates into carbon ions and oxygen ions. Even so, it is useful to think of the formation of carbon dioxide as involving a transfer of electrons from carbon to oxygen. The most important rule when determining oxidation numbers is that the sum of the oxidation numbers in a molecule or ion must equal the charge on the molecule or ion. For simple ionic compounds like sodium oxide, the oxidation number of each element equals the charge of its ion. Sodium has an oxidation number of +1 and oxygen has an oxidation number of –2. You can look in your textbook for a complete list of rules for determining oxidation numbers.
195

Change in Oxidation Numbers The reaction between potassium permanganate and hydroiodic acid to form manganese (IV) oxide and iodine is an example of an oxidation/reduction reaction. The way to tell that it is an oxidation/reduction reaction is to determine the oxidation numbers of all the elements in the reactants and products of the reaction. If the oxidation numbers of any elements change during the reaction, then you know it is an oxidation/reduction reaction.
2 KMnO4 + 6 HI 2 MnO2 + 3 I2 + K2O + 3 H2O
Element Reactant Oxidation Number
Product Oxidation Number
Half Reaction
K +1 +1 None, not involved Mn +7 +4 Mn7+ + 3e- Mn4+
O -2 -2 None, not involved H +1 +1 None, not involved I -1 0 I- 1/2 I2 + e-
Naming the Oxidizing Agent There are two ways that are commonly used to identify the oxidizing and reducing agents in a reaction. In one, we identify the atom that undergoes the change in oxidation number. In the other, we identify the compound containing the atom that undergoes the change in oxidation number. In the above reaction, potassium permanganate contains the manganese atom, which went from having an oxidation number of +7 to +4. That means it was reduced (gained electrons) and was the oxidizing agent. Some chemists would say that the element manganese was the oxidizing agent, but others would say that the compound potassium permanganate was the oxidizing agent. Both are correct, but they use different conventions.
196

Pre-workshop Problems 1. For each of the following compounds or ions, determine the oxidation of each
element.
a. sodium oxide b. sodium peroxide c. aluminum nitrate d. carbonate e. zinc phosphite f. oxygen difluoride
g. ammonium chromate
2. For each compound, decide whether it is an acid, a base or neither. Write the name of each compound.
a. CaS b. NaNO3 c. HC2H3O2 d. HBr e. Ca(OH)2
f. CH3OH 3. Using the rules of solubility, predict whether each of the following compounds
are soluble or not. Write the formula for each compound.
197

a. calcium sulfide
b. sodium nitrate
c. lead (II) chloride
d. ammonium phosphate e. barium sulfate f. iron (III) hydroxide
198

Cooperative Group Problems 1. For each reaction below, decide whether it is an acid/base reaction, a precipitation
reaction or an oxidation/reduction reaction. For the oxidation/reduction reactions, state which reactants are the oxidizing and reducing agents.
a. Sodium hydride reacts with silver nitrate to form silver metal, hydrogen and sodium
nitrate. b. Sodium sulfide reacts with hydrochloric acid to form hydrogen sulfide and sodium
chloride. c. Sodium sulfate reacts with barium chloride to form sodium chloride and barium
sulfate. d. Sodium hydroxide reacts with hydrobromic acid to form water and sodium bromide. e. Sodium chloride reacts with mercury (I) nitrate to form sodium nitrate and mercury (I)
chloride. f. Mercury (I) nitrate reacts with zinc to form mercury and zinc nitrate.
199

2. Using the solubility flash cards, play the around the world game with your team. For
each compound, you must decide whether it is soluble or insoluble and whether it follows a rule or is an important exception to a rule. The flash cards that you have are based entirely on anion rules, which is important in deciding whether a compound is soluble by rule or by exception. If your instructor prefers to define the rule “all group I salts are soluble”, then you should change the flash cards to be consistent with this before you start playing.
3. For each reaction below, identify what type of reaction it is, predict the products and
write a balanced equation that describes the reaction. a. Barium hydroxide reacts with chlorous acid. b. Lead (II) chloride reacts with sodium sulfate. c. Sodium hydride reacts with hydrochloric acid. d. Silver nitrate reacts with iron (II) bromide. e. Sodium carbonate reacts with acetic acid. f. Sodium carbonate reacts with calcium iodate.
200

APPENDIX D
SAMPLE PRACTICE EXAM EXERCISES
FROM DISCUSSION SECTIONS
201

CHEM 1301 Practice Exam Week 2 States of Matter, Classification of Matter, Heat Changes 1. The state of matter that has assumes the shape of its container but has a definite volume is
a. solid b. liquid c. gas d. plasma e. supercritical fluid
2. The state of matter that has neither definite volume nor a definite shape is
a. solid b. liquid c. gas d. solution e. emulsion
3. Which one of the following involves a chemical change?
a. sublimation of naphthalene b. distillation of crude oil c. boiling of gasoline d. germination of a seed e. melting of iron
4. An example of a physical change is a. dissolving sodium chloride in water b. explosion of dynamite c. baking brownies d. hardening of concrete e. digesting sugar
5. All of the following are chemical changes except
a. fermentation of sugar b. hydrolysis of protein c. spoiling milk d. lighting a candle e. frost forming
6. If a substance boils at -25°C and melts at -113°C, what state is it in at -20°C?
a. solid b. liquid c. gas d. solution e. gel
7. How many kJ are equivalent to 2336 calories? 1 cal = 4.184 J
a. 558.3 kJ b. 9774 kJ c. 9.774 kJ d. 0.5583 kJ e. none of the above
8. A sample of mercury (specific heat = 0.14 J/(g °C)) is heated from 22.3°C to 29.6°C with 21.6 J of heat. What is the mass of the mercury?
a. 0.14 g b. 21 g c. 6.3 g d. 19 g e. none of the above
202

9. A 12.4 g sample of aluminum (specific heat = 0.89 J/(g °C)) is heated to 43.2°C using 85 J of heat. What temperature was the aluminum at before heating?
a. 3.5°C b. 7.7°C c. 6.9°C d. 50.9°C e. 35.5°C
10. The density of carbon dioxide at 0°C and 1 atm pressure is 1.96g/L. What volume does 12.5 g of carbon dioxide occupy?
a. 6.377 mL b. 6.38 mL c. 6377 mL d. 6380 mL e. 6.4 mL
11. Which is a typical unit for specific heat capacity?
a. Joules b. calories c. cal/(K g) d. J/g e. g/(J °C)
12. The amount of heat required to raise one gram of water in temperature by one degree Celsius is the definition of the word
a. Joule b. heat capacity c. specific heat d. calorie e. British thermal unit (BTU)
13. Which is a pure substance?
a. table salt b. Gatorade c. maple syrup d. brass e. air
14. Which cannot be a pure substance?
a. sand b. glass c. honey d. water e. polyethylene
203

CHEM 1301 Practice Exam Week 3 The elements, ions and compounds 1. What is the symbol for tin?
a. Si b. Ti c. Tn d. Sb e. Sn
2. What is the symbol for potassium?
a. P b. Po c. Pt d. K e. Pb
3. Which element is a diatomic liquid under normal conditions?
a. hydrogen b. nitrogen c. chlorine d. bromine e. iodine
4. Which is not a gas at room temperature?
a. radon b. xenon c. chlorine d. iodine e. hydrogen
5. ____ fired alpha particles at gold foil and discovered ____.
a. Rutherford, the nucleus b. Milliken, the nucleus c. Thomson, electrons d. Thomson, the nucleus
6. An atom with 35 protons and 44 neutrons is
a. gallium b. gold c. phosphorus d. bromine e. selenium
7. An +2 ion made from a Pt-195 atom has ___ neutrons and ___ electrons.
a. 195, 78 b. 195, 80 c. 195, 76 d. 117, 78 e. 117, 76
8. Which element is a metalloid?
a. Pb b. Al c. Si d. Xe e. U
9. Graphite is the most stable form of which element?
a. iodine b. aluminum c. lead d. tin e. carbon
10. Carbonate has which formula?
a. CO3-
204

b. C4- c. CO2
- d. CO3
2- e. CO2
2-
11. Phosphide has what formula?
a. PO33-
b. P3- c. PO2
- d. PO3
2- e. PO3
4- 12. What is the name of NO2
-?
a. nitrite b. nitrate c. nitride d. nitrogen dioxide e. none of the above
13. What is the name of F-
a. flourine b. flouride c. fluorine d. fluoride e. floride
14. Which compound would be formed from the reaction of magnesium and chlorine?
a. MgCl b. MgCl2c. Mg2Cl d. MgCl3e. Mg3Cl
15. What is the formula of sodium oxide?
a. NaO b. NaO2
c. Na2O d. NaO3 e. Na3O
16. Chlorine is an example of a
a. alkaline earth metal b. pnictogen c. chalcogen d. noble gas e. halogen
205

CHEM 1301 Practice Exam Week 4 6. The name of NO2 is Nomenclature a. nitrogen (II) oxide b. nitrogen (IV) oxide 1. What is the formula of tin (II) chloride?
c. nitrous oxide d. nitric oxide
e. nitrogen dioxide a. Ti2Cl b. TiCl2 7. What is the formula of potassium
nitride? c. Sn2Cl d. SnCl2 a. K3N
2. What is the name of AlF3? b. KNO2 c. KNO3
a. aluminum fluoride d. K2NO2b. aluminum (I) fluoride e. K2NO3c. aluminum (III) fluoride d. aluminum trifluoride 8. What is the formula for peroxide?
a. O2- 3. What is the formula of sulfite? b. O2
2- a. SO2
- c. O2-
b. SO22- d. O3
- c. SO3
- e. O32-
d. SO32-
e. SO42- 9. What is the formula of ammonium
phosphite? 4. What is the name of HI? a. (NH4)2PO3
a. iodic acid b. (NH4)2PO4c. NH4PO3b. iodous acid
c. hypoiodous acid d. (NH4)3PO3e. (NH4)3PO4d. periodic acid
e. hydroiodic acid 10. What is the name of HBrO? 5. The formula for chloric acid is
a. hydrobromic acid b. bromous acid a. HCl c. bromic acid b. HClO d. perbromic acid c. HClO2e. hypobromous acid d. HClO3 e. H2ClO3
206

APPENDIX E
SAMPLE LEARN STAR COMPITITIONS
FROM DISCUSSION SECTIONS
207
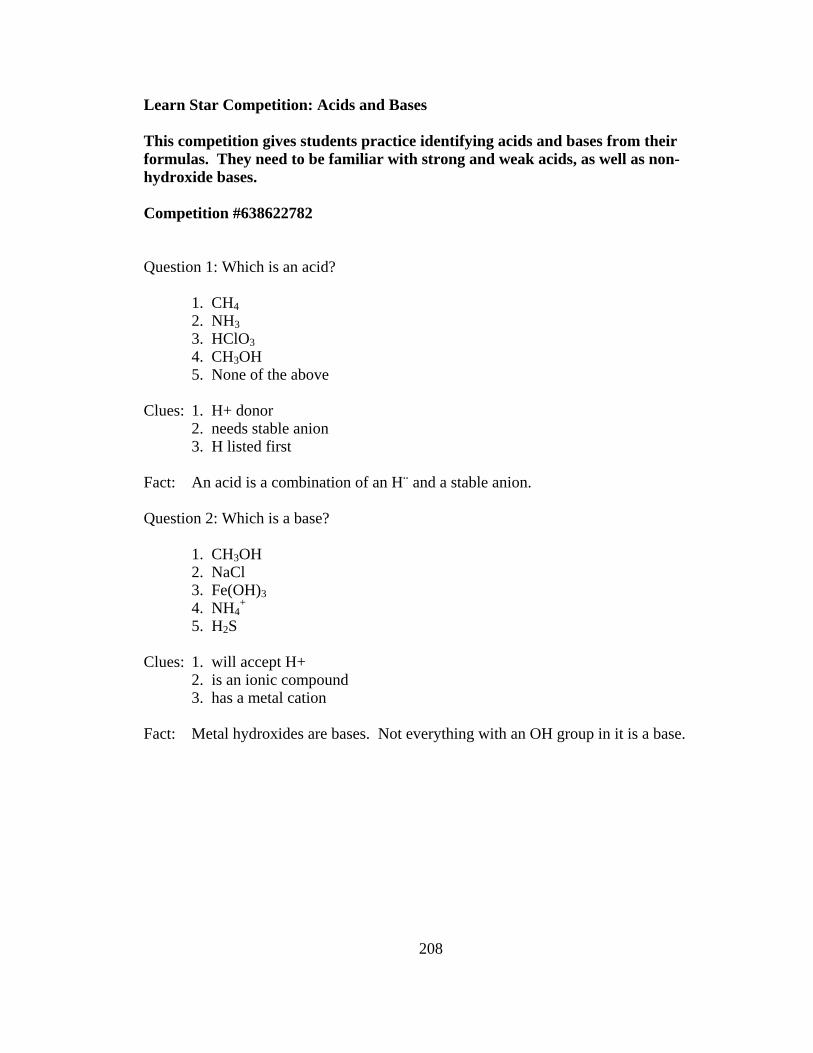
Learn Star Competition: Acids and Bases This competition gives students practice identifying acids and bases from their formulas. They need to be familiar with strong and weak acids, as well as non-hydroxide bases. Competition #638622782 Question 1: Which is an acid? 1. CH4 2. NH3 3. HClO3 4. CH3OH
5. None of the above Clues: 1. H+ donor 2. needs stable anion 3. H listed first Fact: An acid is a combination of an H¨ and a stable anion. Question 2: Which is a base? 1. CH3OH 2. NaCl 3. Fe(OH)3 4. NH4
+ 5. H2S Clues: 1. will accept H+ 2. is an ionic compound 3. has a metal cation Fact: Metal hydroxides are bases. Not everything with an OH group in it is a base.
208

Question 3: Which is a strong acid? 1. HClO4 2. HNO2 3. H2SO3 4. HClO 5. NH4
+ Clues: 1. memorize the list 2. has "ic" in name 3. 4 oxygens Fact: Of those acids, only perchloric was the strong one. Sulfurous and nitrous are
weak. Question 4: Which is the best base? 1. NH3 2. CH3OH 3. H2 4. C6H7OH 5. ClOH Clues: 1. methanol is not 2. is in cleaning agents 3. ammonia is a base Fact: Ammonia is an important base. ClOH is hypochlorous acid.
OH in carbon compounds is not basic. Question 5: Which is not a base: 1. Na2S 2. Na3PO4 3. NH3 4. CH3OH 5. NaOH Clues: 1. anions are basic 2. ammonia is basic 3. methanol is not basic Fact: Organic OH groups (those attached to carbon) are alcohols, not hydroxides. Question 6: Which is the strongest acid?
209
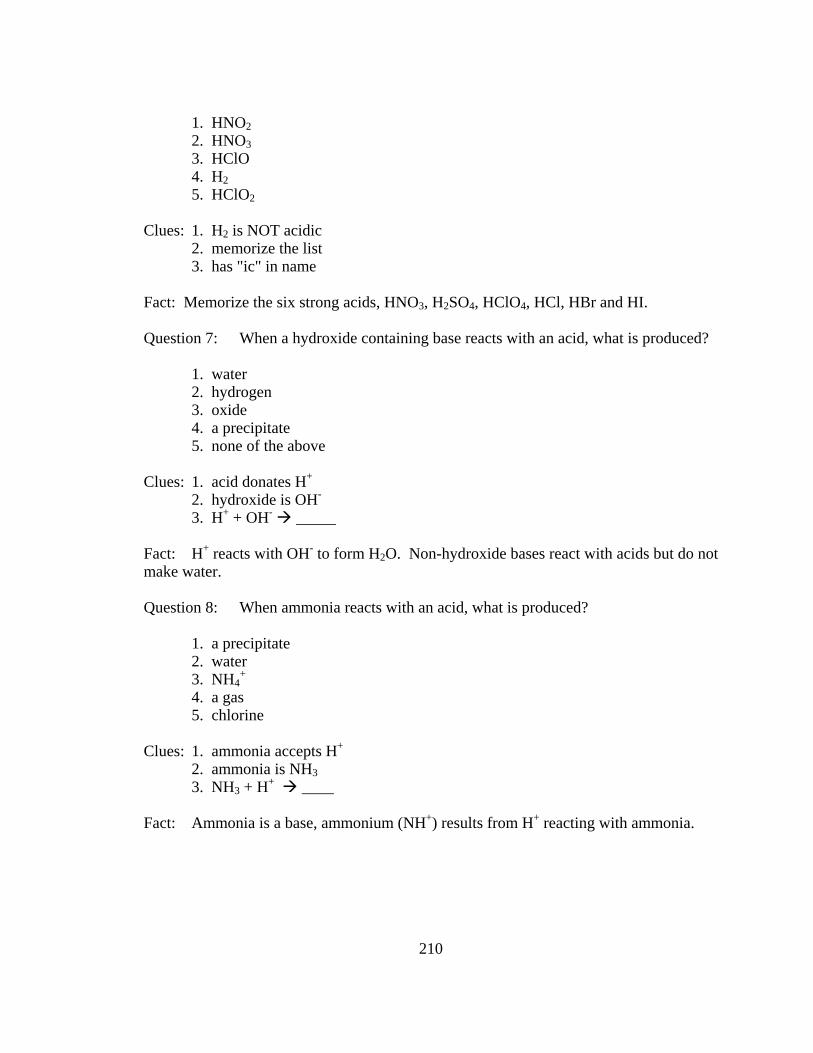
1. HNO2 2. HNO3 3. HClO 4. H2 5. HClO2 Clues: 1. H2 is NOT acidic 2. memorize the list 3. has "ic" in name Fact: Memorize the six strong acids, HNO3, H2SO4, HClO4, HCl, HBr and HI. Question 7: When a hydroxide containing base reacts with an acid, what is produced? 1. water 2. hydrogen 3. oxide 4. a precipitate 5. none of the above Clues: 1. acid donates H+
2. hydroxide is OH- 3. H+ + OH- _____
Fact: H+ reacts with OH- to form H2O. Non-hydroxide bases react with acids but do not make water. Question 8: When ammonia reacts with an acid, what is produced?
1. a precipitate 2. water 3. NH4
+ 4. a gas 5. chlorine
Clues: 1. ammonia accepts H+ 2. ammonia is NH3 3. NH3 + H+ ____ Fact: Ammonia is a base, ammonium (NH+) results from H+ reacting with ammonia.
210

Question 9: Why are acids named acids? 1. They react with bases
2. They are corrosive 3. They taste sour 4. They burn skin 5. They kill fish
Clues: 1. nothing fishy
2. no skin off my back 3. tasty!
Fact: Citrus fruits contain citric acid, which makes them sour. Question 10: What product is formed when an acid reacts with a metal?
1. water 2. hydrogen 3. chlorine 4. a solid 5. electrons
Clues: 1. e- transfer reaction
2. H+ gains electrons 3. gas escapes
Fact: When H+ ions take electrons from a metal, H2 is formed.
211

Learn Star Competition: Aqueous Reactions 2 This competition gives students practice in identifying acid/base, precipitation, oxidation-reduction, single displacement, and double displacement reactions. They should have seen solubility rules and know which compounds are acids and bases to do well here. Competition #645496188 Question 1: Which compound is not soluble in water?
1. potassium phosphate 2. iron chloride 3. tin (II) acetate 4. mercury (I) iodide 5. lead nitrate
Clues: 1. need to know rules
2. all nitrates are soluble 3. Hg
Fact: Mercury (I), Hg2
2+, will precipitate all the halides. Question 2. What type of reaction is 2HCl + Na2CO3 CO2 + H2O + NaCl ? 1. oxidation-reduction
2. precipitation 3. acid-base 4. single displacement 5. none of the above
Clues: 1. no solid products
2. no electron transfer 3. H+ donor
Fact: H+ reacts with carbonate to make H2CO3, which decomposes to water and CO2.
212

Question 3. Which of the following is not an acid? 1. HC2H3O2 2. HF 3. HCl 4. NH3 5. HClO4 Clues: 1. HC2H3O2 is in vinegar
2. H first usually = acid 3. ammonia is a base
Fact: Although NH3 does not have OH- ions, it produces them when reacted with H2O. Question 4: What kind of product would you expect from this reaction?
Na2SO4+ Sr(NO3)2 ? 1. precipitate 2. gas 3. base 4. acid 5. no reaction will occur
Clues: 1. double displacement
2. know solubility rules 3. solid forms
Fact: This reaction forms SrSO4 , a solid, and 2NaNO3. The solid SrSO4 is not soluble in water.
Question 5: _______ dissociate completely into ions when they dissolve in water.
1. strong acids and bases 2. weak acids and bases 3. reducing agents 4. oxidizing agents 5. none of the above
Clues: 1. not vinegar
2. no e- transfer 3. react strongly
Fact: Strong acids and bases are characterized by complete dissociation in aqueous solutions.
Question 6. Electron transfer characterizes what kind of reaction?
213

1. acid-base 2. precipitation 3. oxidation-reduction 4. gas-forming 5. none of the above
Clues: 1. OIL RIG?
2. LEO SAYS GER? 3. Loss of e- is oxidation
Fact: An oxidizing agents give up electrons while reducing agents accept them. Question 7: What type of reaction is 2Al + 3H2SO4--> Al2(SO4)3 + 3H2 classified as?
1. double displacement 2. precipitation 3. acid-base 4. single displacement 5. none of the above
Clues: 1. no base present
2. no solid product 3. single
Fact: A single displacement reaction is when a pure element replaces one ion in a compound.
Question 8: What is the product of this reaction? NH4ClO4 + NaBr ? 1. NH4Br 2. NaClO4
3. BrClO44. both 1 and 2 5. none of the above
Clues: 1. no base present
2. no electron transfer 3. no precipitation
Fact: Because of the solubility rules, these salts do not react. All of the ions are soluble in water.
Question 9: What type of reaction is 2AgNO3 + Na2CrO4 --> Ag2CrO4 + 2NaNO3
214

1. double displacement 2. oxidation-reduction 3. acid-base 4. gas forming 5. combustion
Clues: 1. silver chromate solid
2. no H+ present 3. double switch
Fact: Many precipitation reactions are also double displacement reactions. Question 10: When Magnesium reacts with oxygen it forms magnesium oxide. What
type of reaction is this?
1. precipitation 2. oxidation-reduction 3. acid-base 4. gas forming 5. none of the above
Clues: 1. look at charges 2. product is a solid 3. cation forms
Fact: Mg gives up electrons to form Mg2+, while O2 accepts electrons to form O2-. Question 11: What type of reaction is 2HgO 2Hg + O2?
1. synthesis 2. single displacement 3. double displacement 4. decomposition 5. none of the above
Clues: 1. start with something big
2. heat it up 3. watch it decompose
Fact: Many decomposition reactions involve heating a solid and driving off a gas.
215
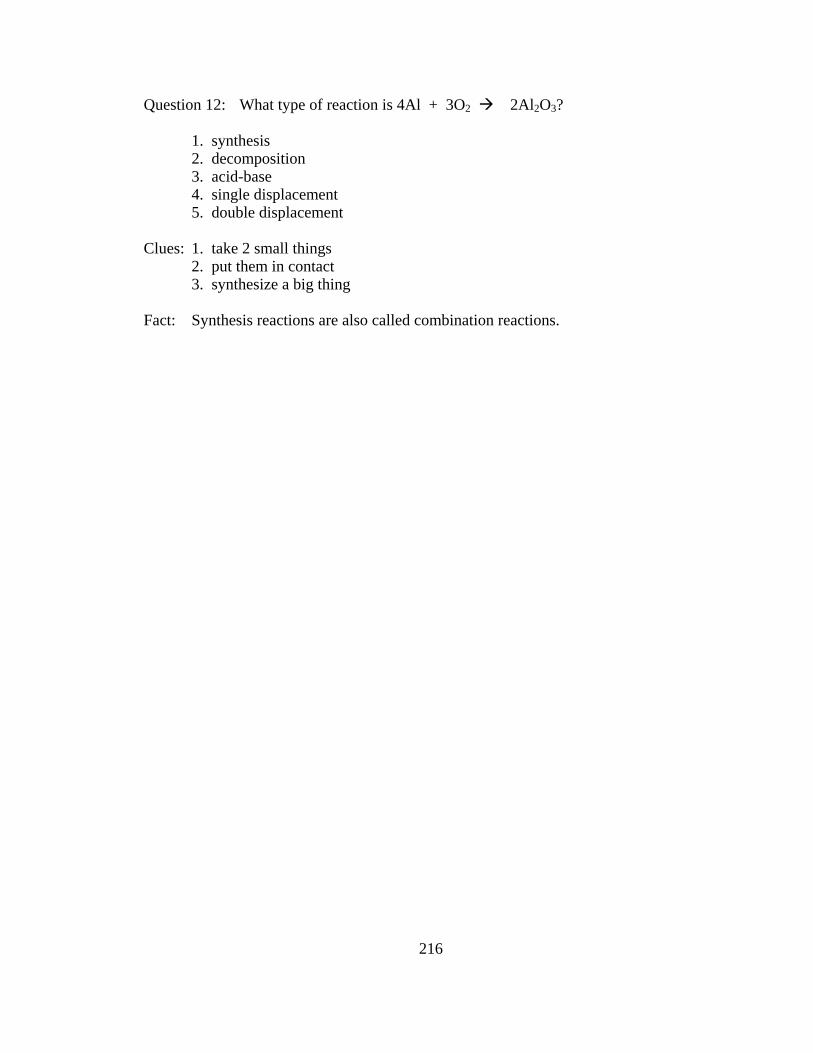
Question 12: What type of reaction is 4Al + 3O2 2Al2O3?
1. synthesis 2. decomposition 3. acid-base 4. single displacement 5. double displacement
Clues: 1. take 2 small things 2. put them in contact 3. synthesize a big thing
Fact: Synthesis reactions are also called combination reactions.
216

APPENDIX F
STATISTICAL ANALYSIS
217

Table F.1. Descriptive Statistics for Student Performance in Introductory Chemistry by Discussion Section Type (Fall 2003) versus Control Group (Fall 2000)
N Mean Std.
Deviation Std. Error 95% Confidence Interval for
Mean Descriptive Statistics Lower Bound Upper Bound Exam 1 Control 1076 68.1494 20.50278 .62504 66.9229 69.3758 PLTL 224 79.8571 14.95635 .99931 77.8878 81.8264 Practice
Exam 710 82.5352 14.09762 .52907 81.4965 83.5740
Learn Star 273 81.4359 12.92699 .78238 79.8956 82.9762 Total 2283 75.3608 18.66775 .39070 74.5947 76.1270Exam 2 Control 1076 60.7800 25.73071 .78441 59.2408 62.3191 PLTL 224 71.5179 19.88261 1.32846 68.8999 74.1358 Practice
Exam 710 70.2197 19.51824 .73251 68.7816 71.6579
Learn Star 272 69.8529 18.94273 1.14857 67.5917 72.1142 Total 2282 65.8524 23.12684 .48413 64.9031 66.8018Exam 3 Control 1076 49.2435 28.07474 .85587 47.5641 50.9229 PLTL 224 68.8571 21.12141 1.41123 66.0761 71.6382 Practice
Exam 709 68.6488 21.09668 .79230 67.0933 70.2043
Learn Star 273 71.8828 21.01787 1.27206 69.3785 74.3871 Total 2282 59.9062 26.61434 .55713 58.8137 60.9988Final Control 1076 57.1242 28.82954 .87888 55.3997 58.8488 PLTL 224 70.7411 18.31574 1.22377 68.3294 73.1527 Practice
Exam 710 68.3380 21.01376 .78863 66.7897 69.8864
Learn Star 273 69.8828 19.61282 1.18702 67.5459 72.2197 Total 2283 63.4734 25.37379 .53105 62.4320 64.5147Class Grade Control 1076 61.4963 23.08776 .70384 60.1152 62.8773 PLTL 224 73.5168 15.68143 1.04776 71.4520 75.5815 Practice
Exam 710 73.0291 16.25949 .61021 71.8310 74.2271
Learn Star 272 73.5580 15.96923 .96828 71.6517 75.4643 Total 2282 67.7021 20.54599 .43010 66.8587 68.5455
218

Table F.2. Test of Homogeneity of Variances for Student Performance in Introductory Chemistry by Discussion Section Type (Fall 2003) versus Control Group (Fall 2000)
Levene Statistic df1 df2 Sig.
Exam 1 46.362 3 2279 .000 Exam 2 29.701 3 2278 .000 Exam 3 41.971 3 2278 .000 Final 53.112 3 2279 .000 Class Grade 48.238 3 2278 .000
Table F.3. ANOVA for Student Performance in Introductory Chemistry by Discussion Section Type (Fall 2003) versus Control Group (Fall 2000)
Sum of Squares df Mean Square F Sig.
Between Groups 107106.499 3 35702.166 118.240 .000
Within Groups 688136.310 2279 301.947
Exam 1
Total 795242.809 2282 Between Groups 52769.993 3 17589.998 34.329 .000
Within Groups 1167224.472 2278 512.390
Exam 2
Total 1219994.465 2281
Between Groups 233630.782 3 77876.927 128.362 .000
Within Groups 1382054.683 2278 606.697
Exam 3
Total 1615685.465 2281
Between Groups 83223.666 3 27741.222 45.615 .000
Within Groups 1385994.190 2279 608.159
Final
Total 1469217.857 2282
Between Groups 78487.327 3 26162.442 67.387 .000
Within Groups 884408.807 2278 388.239
Class Grade
Total 962896.133 2281
219

Table F.4. Post Hoc Tests for Student Performance in Introductory Chemistry by
Discussion Section Type (Fall 2003) versus Control Group (Fall 2000) LSD Multiple Comparisons
Dependent Variable (I) Type2 (J) Type2
Mean Difference
(I-J) Std. Error Sig. 95% Confidence Interval
Lower Bound
Upper Bound
Exam 1 Control PLTL -11.70777(*) 1.27616 .000 -14.2103 -9.2052 Practice Exam -14.38584(*) .84018 .000 -16.0334 -12.7382 Learn Star -13.28653(*) 1.17756 .000 -15.5957 -10.9773 PLTL Control 11.70777(*) 1.27616 .000 9.2052 14.2103 Practice Exam -2.67807(*) 1.33164 .044 -5.2894 -.0667 Learn Star -1.57875 1.56653 .314 -4.6507 1.4932 Practice Exam Control 14.38584(*) .84018 .000 12.7382 16.0334 PLTL 2.67807(*) 1.33164 .044 .0667 5.2894 Learn Star 1.09931 1.23746 .374 -1.3274 3.5260 Learn Star Control 13.28653(*) 1.17756 .000 10.9773 15.5957 PLTL 1.57875 1.56653 .314 -1.4932 4.6507 Practice Exam -1.09931 1.23746 .374 -3.5260 1.3274Exam 2 Control PLTL -10.73787(*) 1.66242 .000 -13.9979 -7.4778 Practice Exam -9.43973(*) 1.09447 .000 -11.5860 -7.2935 Learn Star -9.07296(*) 1.53622 .000 -12.0855 -6.0604 PLTL Control 10.73787(*) 1.66242 .000 7.4778 13.9979 Practice Exam 1.29814 1.73468 .454 -2.1036 4.6999 Learn Star 1.66492 2.04236 .415 -2.3402 5.6700 Practice Exam Control 9.43973(*) 1.09447 .000 7.2935 11.5860 PLTL -1.29814 1.73468 .454 -4.6999 2.1036 Learn Star .36678 1.61414 .820 -2.7986 3.5321 Learn Star Control 9.07296(*) 1.53622 .000 6.0604 12.0855 PLTL -1.66492 2.04236 .415 -5.6700 2.3402 Practice Exam -.36678 1.61414 .820 -3.5321 2.7986
220

Table F.4. Continued
95% Confidence Interval Dependent Variable
(I) Type2
(J) Type2
Mean Difference
(I-J) Std. Error
Sig.
Lower Bound
Upper Bound
Exam 3 Control PLTL -19.61366(*) 1.80895 .000 -23.1610 -16.0663 Practice Exam -19.40532(*) 1.19145 .000 -21.7418 -17.0689 Learn Star -22.63930(*) 1.66918 .000 -25.9126 -19.3660 PLTL Control 19.61366(*) 1.80895 .000 16.0663 23.1610 Practice Exam .20834 1.88790 .912 -3.4938 3.9105 Learn Star -3.02564 2.22054 .173 -7.3801 1.3289 Practice Exam Control 19.40532(*) 1.19145 .000 17.0689 21.7418 PLTL -.20834 1.88790 .912 -3.9105 3.4938 Learn Star -3.23398 1.75443 .065 -6.6744 .2065 Learn Star Control 22.63930(*) 1.66918 .000 19.3660 25.9126 PLTL 3.02564 2.22054 .173 -1.3289 7.3801 Practice Exam 3.23398 1.75443 .065 -.2065 6.6744Final Control PLTL -13.61682(*) 1.81113 .000 -17.1685 -10.0652 Practice Exam -11.21378(*) 1.19238 .000 -13.5520 -8.8755 Learn Star -12.75854(*) 1.67119 .000 -16.0358 -9.4813 PLTL Control 13.61682(*) 1.81113 .000 10.0652 17.1685 Practice Exam 2.40304 1.88986 .204 -1.3030 6.1091 Learn Star .85829 2.22321 .699 -3.5014 5.2180 Practice Exam Control 11.21378(*) 1.19238 .000 8.8755 13.5520 PLTL -2.40304 1.88986 .204 -6.1091 1.3030 Learn Star -1.54476 1.75620 .379 -4.9887 1.8992 Learn Star Control 12.75854(*) 1.67119 .000 9.4813 16.0358 PLTL -.85829 2.22321 .699 -5.2180 3.5014 Practice Exam 1.54476 1.75620 .379 -1.8992 4.9887Class Grade Control PLTL -12.02049(*) 1.44708 .000 -14.8582 -9.1828 Practice Exam -11.53277(*) .95270 .000 -13.4010 -9.6645 Learn Star -12.06176(*) 1.33722 .000 -14.6841 -9.4395 PLTL Control 12.02049(*) 1.44708 .000 9.1828 14.8582 Practice Exam .48772 1.50998 .747 -2.4733 3.4488 Learn Star -.04128 1.77780 .981 -3.5275 3.4450 Practice Exam Control 11.53277(*) .95270 .000 9.6645 13.4010 PLTL -.48772 1.50998 .747 -3.4488 2.4733 Learn Star -.52900 1.40505 .707 -3.2843 2.2263 Learn Star Control 12.06176(*) 1.33722 .000 9.4395 14.6841 PLTL .04128 1.77780 .981 -3.4450 3.5275 Practice Exam .52900 1.40505 .707 -2.2263 3.2843
* The mean difference is significant at the .05 level.
221

Table F.5. Descriptive Statistics for Student Performance in Introductory Chemistry by
Lecture Section: Discussion Sections (Fall 2003) and Control Groups (Fall 2000)
Descriptive Statistics N Mean
Std. Deviation Std. Error
95% Confidence Interval for Mean
Lower Bound Upper Bound Exam 1 Sec 1 PE 96 82.6667 16.29896 1.66351 79.3642 85.9691 Sec 2 PE 229 83.5459 13.84893 .91516 81.7426 85.3491 Sec 3 PE 203 82.7783 15.14305 1.06283 80.6827 84.8740 Sec 4 PLTL 224 79.8571 14.95635 .99931 77.8878 81.8264 Sec 5 PE 182 80.9231 11.72920 .86943 79.2076 82.6386 Sec 6 LS 273 81.4359 12.92699 .78238 79.8956 82.9762 Sec 7control 173 65.1638 20.18162 1.53438 62.1351 68.1924 Sec 8control 301 71.1962 20.38820 1.17516 68.8836 73.5088 Sec 9control 299 73.4894 16.45656 .95171 71.6165 75.3623 Sec 10control 303 61.5578 22.31627 1.28204 59.0349 64.0806 Total 2283 75.3608 18.66775 .39070 74.5947 76.1270Exam 2 Sec 1 PE 96 72.0833 23.14243 2.36196 67.3942 76.7724 Sec 2 PE 229 71.0742 18.89348 1.24852 68.6141 73.5343 Sec 3 PE 203 70.4039 20.43232 1.43407 67.5763 73.2316 Sec 4 PLTL 224 71.5179 19.88261 1.32846 68.8999 74.1358 Sec 5 PE 182 67.9560 16.96008 1.25717 65.4755 70.4366 Sec 6 LS 272 69.8529 18.94273 1.14857 67.5917 72.1142 Sec 7control 173 58.3816 28.12527 2.13832 54.1608 62.6023 Sec 8control 301 52.5579 22.86814 1.31810 49.9640 55.1518 Sec 9control 299 72.4526 24.38362 1.41014 69.6775 75.2277 Sec 10control 303 58.7987 24.30019 1.39601 56.0515 61.5458 Total 2282 65.8524 23.12684 .48413 64.9031 66.8018Exam 3 Sec 1 PE 96 65.5833 24.08741 2.45841 60.7028 70.4639 Sec 2 PE 229 67.4934 21.56236 1.42488 64.6858 70.3011 Sec 3 PE 202 71.2277 21.96600 1.54552 68.1802 74.2752 Sec 4 PLTL 224 68.8571 21.12141 1.41123 66.0761 71.6382 Sec 5 PE 182 68.8571 17.34319 1.28556 66.3205 71.3938 Sec 6 LS 273 71.8828 21.01787 1.27206 69.3785 74.3871 Sec 7control 173 42.6204 26.75997 2.03452 38.6046 46.6363 Sec 8control 301 58.5050 29.71742 1.71288 55.1342 61.8757 Sec 9control 299 51.3266 27.50882 1.59088 48.1959 54.4574 Sec 10control 303 41.7690 24.55295 1.41053 38.9933 44.5447 Total 2282 59.9062 26.61434 .55713 58.8137 60.9988
222

Table F.5. Continued
Descriptive Statistics N Mean
Std. Deviation Std. Error
95% Confidence Interval for Mean
Lower Bound Upper Bound Final Sec 1 PE 96 64.5000 27.93828 2.85144 58.8392 70.1608 Sec 2 PE 229 69.7031 20.84401 1.37741 66.9890 72.4171 Sec 3 PE 203 68.4631 21.81748 1.53129 65.4437 71.4824 Sec 4 PLTL 224 70.7411 18.31574 1.22377 68.3294 73.1527 Sec 5 PE 182 68.5055 15.20859 1.12734 66.2811 70.7299 Sec 6 LS 273 69.8828 19.61282 1.18702 67.5459 72.2197 Sec 7control 173 48.5069 30.83948 2.34468 43.8788 53.1349 Sec 8control 301 56.9834 27.74052 1.59894 53.8368 60.1299 Sec 9control 299 59.7726 30.07912 1.73952 56.3493 63.1959 Sec 10control 303 59.5710 26.53576 1.52444 56.5711 62.5708 Total 2283 63.4734 25.37379 .53105 62.4320 64.5147Class Grade
Sec 1 PE 96 70.9990 19.15137 1.95463 67.1185 74.8794
Sec 2 PE 229 73.0087 16.30573 1.07751 70.8855 75.1319 Sec 3 PE 203 73.7719 17.53413 1.23065 71.3453 76.1985 Sec 4 PLTL 224 73.5168 15.68143 1.04776 71.4520 75.5815 Sec 5 PE 182 73.2969 12.73415 .94392 71.4344 75.1594 Sec 6 LS 272 73.5580 15.96923 .96828 71.6517 75.4643 Sec 7control 173 54.0173 24.29864 1.84739 50.3709 57.6638 Sec 8control 301 62.6844 22.80110 1.31423 60.0981 65.2707 Sec 9control 299 65.3846 22.18461 1.28297 62.8598 67.9094 Sec 10control 303 60.7492 22.58530 1.29749 58.1959 63.3024 Total 2282 67.7021 20.54599 .43010 66.8587 68.5455
Table F.6. Test of Homogeneity of Variances for Student Performance in Introductory Chemistry by Lecture Section: Discussion Sections (Fall 2003)
and Control Groups (Fall 2000)
Levene Statistic df1 df2 Sig.
exam1 16.056 9 2273 .000 exam2 6.616 9 2272 .000 exam3 13.796 9 2272 .000 final 22.174 9 2273 .000 classgrd 17.209 9 2272 .000
223

Table F.7. ANOVA for Student Performance in Introductory Chemistry by Lecture Section: Discussion Sections (Fall 2003) and Control Groups (Fall 2000)
Sum of Squares df Mean Square F Sig.
Between Groups 133854.880 9 14872.764 51.113 .000
Within Groups 661387.929 2273 290.976
Exam 1
Total 795242.809 2282 Between Groups 117482.148 9 13053.572 26.900 .000
Within Groups 1102512.317 2272 485.261
Exam 2
Total 1219994.465 2281
Between Groups 287822.437 9 31980.271 54.719 .000
Within Groups 1327863.029 2272 584.447
Exam 3
Total 1615685.465 2281
Between Groups 101836.505 9 11315.167 18.809 .000
Within Groups 1367381.351 2273 601.576
Final
Total 1469217.857 2282
Between Groups 93799.461 9 10422.162 27.246 .000
Within Groups 869096.673 2272 382.525
Class Grade
Total 962896.133 2281
224

Table F.8. Post Hoc Tests for Student Performance in Introductory Chemistry by Lecture Section: Discussion Sections (Fall 2003) and Control Groups (Fall 2000)
LSD Multiple Comparisons
Dependent Variable
Lecture Section
(I)
Lecture Section
(J)
Mean Difference
(I-J) Std. Error Sig. 95% Confidence
Interval
Lower Bound
Upper Bound
Exam 1 Sec 1 PE Sec 2 PE -.87918 2.07404 .672 -4.9464 3.1880 Sec 3 PE -.11166 2.11291 .958 -4.2551 4.0318 Sec 4 PLTL 2.80952 2.08086 .177 -1.2711 6.8901 Sec 5 PE 1.74359 2.15169 .418 -2.4759 5.9631 Sec 6 LS 1.23077 2.02407 .543 -2.7384 5.2000 Sec 7control 17.50291(*) 2.17093 .000 13.2457 21.7601 Sec 8control 11.47045(*) 1.99942 .000 7.5496 15.3913 Sec 9control 9.17726(*) 2.00104 .000 5.2532 13.1013 Sec 10control 21.10891(*) 1.99783 .000 17.1912 25.0267 Sec 2 PE Sec 1 PE .87918 2.07404 .672 -3.1880 4.9464 Sec 3 PE .76753 1.64439 .641 -2.4571 3.9922 Sec 4 PLTL 3.68871(*) 1.60301 .021 .5452 6.8322 Sec 5 PE 2.62277 1.69393 .122 -.6990 5.9446 Sec 6 LS 2.10995 1.52856 .168 -.8876 5.1075 Sec 7control 18.38209(*) 1.71831 .000 15.0125 21.7517 Sec 8control 12.34964(*) 1.49577 .000 9.4164 15.2829 Sec 9control 10.05644(*) 1.49793 .000 7.1190 12.9939 Sec 10control 21.98810(*) 1.49364 .000 19.0591 24.9171 Sec 3 PE Sec 1 PE .11166 2.11291 .958 -4.0318 4.2551 Sec 2 PE -.76753 1.64439 .641 -3.9922 2.4571 Sec 4 PLTL 2.92118 1.65299 .077 -.3203 6.1627 Sec 5 PE 1.85525 1.74131 .287 -1.5595 5.2700 Sec 6 LS 1.34243 1.58089 .396 -1.7577 4.4426 Sec 7control 17.61457(*) 1.76503 .000 14.1533 21.0758 Sec 8control 11.58211(*) 1.54922 .000 8.5441 14.6201 Sec 9control 9.28892(*) 1.55130 .000 6.2468 12.3310 Sec 10control 21.22057(*) 1.54716 .000 18.1866 24.2546
225

Table F.8. Continued
Dependent Variable
Lecture Section
(I)
Lecture Section
(J)
Mean Difference
(I-J) Std. Error Sig. 95% Confidence
Interval
Lower Bound
Upper Bound
Exam 1 Sec 4 PLTL Sec 1 PE -2.80952 2.08086 .177 -6.8901 1.2711 Sec 2 PE -3.68871(*) 1.60301 .021 -6.8322 -.5452 Sec 3 PE -2.92118 1.65299 .077 -6.1627 .3203 Sec 5 PE -1.06593 1.70228 .531 -4.4041 2.2723 Sec 6 LS -1.57875 1.53781 .305 -4.5944 1.4369 Sec 7control 14.69339(*) 1.72654 .000 11.3076 18.0791 Sec 8control 8.66093(*) 1.50522 .000 5.7092 11.6127 Sec 9control 6.36773(*) 1.50737 .000 3.4118 9.3237 Sec 10control 18.29939(*) 1.50310 .000 15.3518 21.2470 Sec 5 PE Sec 1 PE -1.74359 2.15169 .418 -5.9631 2.4759 Sec 2 PE -2.62277 1.69393 .122 -5.9446 .6990 Sec 3 PE -1.85525 1.74131 .287 -5.2700 1.5595 Sec 4 PLTL 1.06593 1.70228 .531 -2.2723 4.4041 Sec 6 LS -.51282 1.63236 .753 -3.7139 2.6883 Sec 7control 15.75932(*) 1.81127 .000 12.2074 19.3112 Sec 8control 9.72686(*) 1.60171 .000 6.5859 12.8678 Sec 9control 7.43367(*) 1.60372 .000 4.2888 10.5786 Sec 10control 19.36532(*) 1.59971 .000 16.2283 22.5024 Sec 6 LS Sec 1 PE -1.23077 2.02407 .543 -5.2000 2.7384 Sec 2 PE -2.10995 1.52856 .168 -5.1075 .8876 Sec 3 PE -1.34243 1.58089 .396 -4.4426 1.7577 Sec 4 PLTL 1.57875 1.53781 .305 -1.4369 4.5944 Sec 5 PE .51282 1.63236 .753 -2.6883 3.7139 Sec 7control 16.27214(*) 1.65764 .000 13.0215 19.5228 Sec 8control 10.23968(*) 1.42567 .000 7.4439 13.0354 Sec 9control 7.94649(*) 1.42794 .000 5.1463 10.7467 Sec 10control 19.87814(*) 1.42343 .000 17.0868 22.6695 Sec 7 control Sec 1 PE -17.50291(*) 2.17093 .000 -21.7601 -13.2457 Sec 2 PE -18.38209(*) 1.71831 .000 -21.7517 -15.0125 Sec 3 PE -17.61457(*) 1.76503 .000 -21.0758 -14.1533 Sec 4 PLTL -14.69339(*) 1.72654 .000 -18.0791 -11.3076 Sec 5 PE -15.75932(*) 1.81127 .000 -19.3112 -12.2074 Sec 6 LS -16.27214(*) 1.65764 .000 -19.5228 -13.0215 Sec 8control -6.03246(*) 1.62746 .000 -9.2239 -2.8410 Sec 9control -8.32565(*) 1.62945 .000 -11.5210 -5.1303 Sec 10control 3.60600(*) 1.62550 .027 .4184 6.7936
226

Table F.8. Continued
Dependent Variable
Lecture Section
(I)
Lecture Section
(J)
Mean Difference
(I-J) Std. Error Sig. 95% Confidence
Interval
Lower Bound
Upper Bound
Exam 1 Sec 8 control Sec 1 PE -11.47045(*) 1.99942 .000 -15.3913 -7.5496 Sec 2 PE -12.34964(*) 1.49577 .000 -15.2829 -9.4164 Sec 3 PE -11.58211(*) 1.54922 .000 -14.6201 -8.5441 Sec 4 PLTL -8.66093(*) 1.50522 .000 -11.6127 -5.7092 Sec 5 PE -9.72686(*) 1.60171 .000 -12.8678 -6.5859 Sec 6 LS -10.23968(*) 1.42567 .000 -13.0354 -7.4439 Sec 7control 6.03246(*) 1.62746 .000 2.8410 9.2239 Sec 9control -2.29320 1.39279 .100 -5.0245 .4381 Sec 10control 9.63846(*) 1.38817 .000 6.9162 12.3607 Sec 9 control Sec 1 PE -9.17726(*) 2.00104 .000 -13.1013 -5.2532 Sec 2 PE -10.05644(*) 1.49793 .000 -12.9939 -7.1190 Sec 3 PE -9.28892(*) 1.55130 .000 -12.3310 -6.2468 Sec 4 PLTL -6.36773(*) 1.50737 .000 -9.3237 -3.4118 Sec 5 PE -7.43367(*) 1.60372 .000 -10.5786 -4.2888 Sec 6 LS -7.94649(*) 1.42794 .000 -10.7467 -5.1463 Sec 7control 8.32565(*) 1.62945 .000 5.1303 11.5210 Sec 8control 2.29320 1.39279 .100 -.4381 5.0245 Sec 10control 11.93165(*) 1.39050 .000 9.2049 14.6584 Sec 10 control Sec 1 PE -21.10891(*) 1.99783 .000 -25.0267 -17.1912 Sec 2 PE -21.98810(*) 1.49364 .000 -24.9171 -19.0591 Sec 3 PE -21.22057(*) 1.54716 .000 -24.2546 -18.1866 Sec 4 PLTL -18.29939(*) 1.50310 .000 -21.2470 -15.3518 Sec 5 PE -19.36532(*) 1.59971 .000 -22.5024 -16.2283 Sec 6 LS -19.87814(*) 1.42343 .000 -22.6695 -17.0868 Sec 7control -3.60600(*) 1.62550 .027 -6.7936 -.4184 Sec 8control -9.63846(*) 1.38817 .000 -12.3607 -6.9162 Sec 9control -11.93165(*) 1.39050 .000 -14.6584 -9.2049Exam 2 Sec 1 PE Sec 2 PE 1.00910 2.67840 .706 -4.2433 6.2615 Sec 3 PE 1.67939 2.72860 .538 -3.6714 7.0302 Sec 4 PLTL .56548 2.68722 .833 -4.7042 5.8351 Sec 5 PE 4.12729 2.77868 .138 -1.3217 9.5763 Sec 6 LS 2.23039 2.61512 .394 -2.8979 7.3587 Sec 7control 13.70177(*) 2.80353 .000 8.2040 19.1995 Sec 8control 19.52546(*) 2.58205 .000 14.4620 24.5889 Sec 9control -.36929 2.58413 .886 -5.4368 4.6982 Sec 10control 13.28465(*) 2.57998 .000 8.2253 18.3440
227

Table F.8. Continued
Dependent Variable
Lecture Section
(I)
Lecture Section
(J)
Mean Difference
(I-J) Std. Error Sig. 95% Confidence
Interval
Lower Bound
Upper Bound
Exam 2 Sec 2 PE Sec 1 PE -1.00910 2.67840 .706 -6.2615 4.2433 Sec 3 PE .67029 2.12356 .752 -3.4940 4.8346 Sec 4 PLTL -.44362 2.07012 .830 -4.5031 3.6159 Sec 5 PE 3.11819 2.18754 .154 -1.1716 7.4080 Sec 6 LS 1.22129 1.97562 .537 -2.6529 5.0955 Sec 7control 12.69268(*) 2.21901 .000 8.3412 17.0442 Sec 8control 18.51636(*) 1.93163 .000 14.7284 22.3043 Sec 9control -1.37838 1.93442 .476 -5.1718 2.4150 Sec 10control 12.27556(*) 1.92888 .000 8.4930 16.0581 Sec 3 PE Sec 1 PE -1.67939 2.72860 .538 -7.0302 3.6714 Sec 2 PE -.67029 2.12356 .752 -4.8346 3.4940 Sec 4 PLTL -1.11392 2.13466 .602 -5.3000 3.0722 Sec 5 PE 2.44790 2.24871 .276 -1.9619 6.8576 Sec 6 LS .55100 2.04316 .787 -3.4557 4.5576 Sec 7control 12.02238(*) 2.27935 .000 7.5526 16.4922 Sec 8control 17.84607(*) 2.00065 .000 13.9228 21.7694 Sec 9control -2.04868 2.00335 .307 -5.9773 1.8799 Sec 10control 11.60526(*) 1.99799 .000 7.6872 15.5233 Sec 4 PLTL Sec 1 PE -.56548 2.68722 .833 -5.8351 4.7042 Sec 2 PE .44362 2.07012 .830 -3.6159 4.5031 Sec 3 PE 1.11392 2.13466 .602 -3.0722 5.3000 Sec 5 PE 3.56181 2.19832 .105 -.7491 7.8727 Sec 6 LS 1.66492 1.98756 .402 -2.2327 5.5625 Sec 7control 13.13630(*) 2.22965 .000 8.7639 17.5086 Sec 8control 18.95998(*) 1.94384 .000 15.1481 22.7719 Sec 9control -.93476 1.94661 .631 -4.7521 2.8826 Sec 10control 12.71918(*) 1.94110 .000 8.9127 16.5257 Sec 5 PE Sec 1 PE -4.12729 2.77868 .138 -9.5763 1.3217 Sec 2 PE -3.11819 2.18754 .154 -7.4080 1.1716 Sec 3 PE -2.44790 2.24871 .276 -6.8576 1.9619 Sec 4 PLTL -3.56181 2.19832 .105 -7.8727 .7491 Sec 6 LS -1.89690 2.10958 .369 -6.0338 2.2400 Sec 7control 9.57448(*) 2.33907 .000 4.9875 14.1614 Sec 8control 15.39817(*) 2.06844 .000 11.3419 19.4544 Sec 9control -4.49658(*) 2.07104 .030 -8.5579 -.4352 Sec 10control 9.15736(*) 2.06586 .000 5.1062 13.2085
228

Table F.8. Continued
Dependent Variable
Lecture Section
(I)
Lecture Section
Mean Difference
(I-J) 95% Confidence
Interval (J) Std. Error Sig.
Lower Bound
Upper Bound
Exam 2 Sec 6 LS Sec 1 PE -2.23039 2.61512 .394 -7.3587 2.8979 Sec 2 PE -1.22129 1.97562 .537 -5.0955 2.6529 Sec 3 PE -.55100 2.04316 .787 -4.5576 3.4557 Sec 4 PLTL -1.66492 1.98756 .402 -5.5625 2.2327 Sec 5 PE 1.89690 2.10958 .369 -2.2400 6.0338 Sec 7control 11.47138(*) 2.14220 .000 7.2705 15.6723 Sec 8control 17.29507(*) 1.84288 .000 13.6812 20.9090 Sec 9control -2.59968 1.84580 .159 -6.2193 1.0200 Sec 10control 11.05426(*) 1.83999 .000 7.4460 14.6625 Sec 7control Sec 1 PE -13.70177(*) 2.80353 .000 -19.1995 -8.2040 Sec 2 PE -12.69268(*) 2.21901 .000 -17.0442 -8.3412 Sec 3 PE -12.02238(*) 2.27935 .000 -16.4922 -7.5526 Sec 4 PLTL -13.13630(*) 2.22965 .000 -17.5086 -8.7639 Sec 5 PE -9.57448(*) 2.33907 .000 -14.1614 -4.9875 Sec 6 LS -11.47138(*) 2.14220 .000 -15.6723 -7.2705 Sec 8control 5.82369(*) 2.10170 .006 1.7022 9.9451 Sec 9control -14.07106(*) 2.10426 .000 -18.1975 -9.9446 Sec 10control -.41712 2.09917 .843 -4.5336 3.6994 Sec 8control Sec 1 PE -19.52546(*) 2.58205 .000 -24.5889 -14.4620 Sec 2 PE -18.51636(*) 1.93163 .000 -22.3043 -14.7284 Sec 3 PE -17.84607(*) 2.00065 .000 -21.7694 -13.9228 Sec 4 PLTL -18.95998(*) 1.94384 .000 -22.7719 -15.1481 Sec 5 PE -15.39817(*) 2.06844 .000 -19.4544 -11.3419 Sec 6 LS -17.29507(*) 1.84288 .000 -20.9090 -13.6812 Sec 7control -5.82369(*) 2.10170 .006 -9.9451 -1.7022 Sec 9control -19.89475(*) 1.79864 .000 -23.4219 -16.3676 Sec 10control -6.24081(*) 1.79267 .001 -9.7563 -2.7254 Sec 9control Sec 1 PE .36929 2.58413 .886 -4.6982 5.4368 Sec 2 PE 1.37838 1.93442 .476 -2.4150 5.1718 Sec 3 PE 2.04868 2.00335 .307 -1.8799 5.9773 Sec 4 PLTL .93476 1.94661 .631 -2.8826 4.7521 Sec 5 PE 4.49658(*) 2.07104 .030 .4352 8.5579 Sec 6 LS 2.59968 1.84580 .159 -1.0200 6.2193 Sec 7control 14.07106(*) 2.10426 .000 9.9446 18.1975 Sec 8control 19.89475(*) 1.79864 .000 16.3676 23.4219 Sec 10control 13.65394(*) 1.79568 .000 10.1326 17.1753
229

Table F.8. Continued
Dependent Variable
Lecture Section
(I)
Lecture Section
(J)
Mean Difference
(I-J) Std. Error Sig. 95% Confidence
Interval
Lower Bound
Upper Bound
Exam 2 Sec 10control Sec 1 PE -13.28465(*) 2.57998 .000 -18.3440 -8.2253 Sec 2 PE -12.27556(*) 1.92888 .000 -16.0581 -8.4930 Sec 3 PE -11.60526(*) 1.99799 .000 -15.5233 -7.6872 Sec 4 PLTL -12.71918(*) 1.94110 .000 -16.5257 -8.9127 Sec 5 PE -9.15736(*) 2.06586 .000 -13.2085 -5.1062 Sec 6 LS -11.05426(*) 1.83999 .000 -14.6625 -7.4460 Sec 7control .41712 2.09917 .843 -3.6994 4.5336 Sec 8control 6.24081(*) 1.79267 .001 2.7254 9.7563 Sec 9control -13.65394(*) 1.79568 .000 -17.1753 -10.1326Exam 3 Sec 1 PE Sec 2 PE -1.91012 2.93941 .516 -7.6743 3.8541 Sec 3 PE -5.64439 2.99688 .060 -11.5213 .2325 Sec 4 PLTL -3.27381 2.94909 .267 -9.0570 2.5094 Sec 5 PE -3.27381 3.04946 .283 -9.2538 2.7062 Sec 6 LS -6.29945(*) 2.86859 .028 -11.9248 -.6741 Sec 7control 22.96293(*) 3.07673 .000 16.9294 28.9964 Sec 8control 7.07838(*) 2.83367 .013 1.5215 12.6352 Sec 9control 14.25669(*) 2.83596 .000 8.6954 19.8180 Sec 10control 23.81436(*) 2.83140 .000 18.2619 29.3668 Sec 2 PE Sec 1 PE 1.91012 2.93941 .516 -3.8541 7.6743 Sec 3 PE -3.73427 2.33355 .110 -8.3104 .8418 Sec 4 PLTL -1.36369 2.27185 .548 -5.8188 3.0914 Sec 5 PE -1.36369 2.40071 .570 -6.0715 3.3441 Sec 6 LS -4.38933(*) 2.16633 .043 -8.6375 -.1411 Sec 7control 24.87305(*) 2.43526 .000 20.0975 29.6486 Sec 8control 8.98850(*) 2.11987 .000 4.8314 13.1456 Sec 9control 16.16681(*) 2.12293 .000 12.0037 20.3299 Sec 10control 25.72447(*) 2.11685 .000 21.5733 29.8756 Sec 3 PE Sec 1 PE 5.64439 2.99688 .060 -.2325 11.5213 Sec 2 PE 3.73427 2.33355 .110 -.8418 8.3104 Sec 4 PLTL 2.37058 2.34573 .312 -2.2294 6.9706 Sec 5 PE 2.37058 2.47074 .337 -2.4746 7.2157 Sec 6 LS -.65506 2.24369 .770 -5.0550 3.7448 Sec 7control 28.60732(*) 2.50432 .000 23.6963 33.5183 Sec 8control 12.72277(*) 2.19886 .000 8.4108 17.0348 Sec 9control 19.90108(*) 2.20181 .000 15.5833 24.2188 Sec 10control 29.45875(*) 2.19594 .000 25.1525 33.7650
230

Table F.8. Continued
Dependent Variable
Lecture Section
(I)
Lecture Section
(J)
Mean Difference
(I-J) Std. Error Sig. 95% Confidence
Interval
Lower Bound
Upper Bound
Exam 3 Sec 4 PLTL Sec 1 PE 3.27381 2.94909 .267 -2.5094 9.0570 Sec 2 PE 1.36369 2.27185 .548 -3.0914 5.8188 Sec 3 PE -2.37058 2.34573 .312 -6.9706 2.2294 Sec 5 PE .00000 2.41255 1.000 -4.7310 4.7310 Sec 6 LS -3.02564 2.17944 .165 -7.2995 1.2483 Sec 7control 26.23674(*) 2.44693 .000 21.4383 31.0352 Sec 8control 10.35219(*) 2.13327 .000 6.1688 14.5355 Sec 9control 17.53050(*) 2.13631 .000 13.3412 21.7198 Sec 10control 27.08817(*) 2.13026 .000 22.9107 31.2656 Sec 5 PE Sec 1 PE 3.27381 3.04946 .283 -2.7062 9.2538 Sec 2 PE 1.36369 2.40071 .570 -3.3441 6.0715 Sec 3 PE -2.37058 2.47074 .337 -7.2157 2.4746 Sec 4 PLTL .00000 2.41255 1.000 -4.7310 4.7310 Sec 6 LS -3.02564 2.31346 .191 -7.5623 1.5111 Sec 7control 26.23674(*) 2.56701 .000 21.2028 31.2707 Sec 8control 10.35219(*) 2.27001 .000 5.9007 14.8037 Sec 9control 17.53050(*) 2.27287 .000 13.0734 21.9876 Sec 10control 27.08817(*) 2.26718 .000 22.6422 31.5341 Sec 6 LS Sec 1 PE 6.29945(*) 2.86859 .028 .6741 11.9248 Sec 2 PE 4.38933(*) 2.16633 .043 .1411 8.6375 Sec 3 PE .65506 2.24369 .770 -3.7448 5.0550 Sec 4 PLTL 3.02564 2.17944 .165 -1.2483 7.2995 Sec 5 PE 3.02564 2.31346 .191 -1.5111 7.5623 Sec 7control 29.26238(*) 2.34928 .000 24.6554 33.8693 Sec 8control 13.37783(*) 2.02052 .000 9.4156 17.3401 Sec 9control 20.55614(*) 2.02373 .000 16.5876 24.5247 Sec 10control 30.11381(*) 2.01735 .000 26.1578 34.0698 Sec 7control Sec 1 PE -22.96293(*) 3.07673 .000 -28.9964 -16.9294 Sec 2 PE -24.87305(*) 2.43526 .000 -29.6486 -20.0975 Sec 3 PE -28.60732(*) 2.50432 .000 -33.5183 -23.6963 Sec 4 PLTL -26.23674(*) 2.44693 .000 -31.0352 -21.4383 Sec 5 PE -26.23674(*) 2.56701 .000 -31.2707 -21.2028 Sec 6 LS -29.26238(*) 2.34928 .000 -33.8693 -24.6554 Sec 8control -15.88455(*) 2.30651 .000 -20.4076 -11.3615 Sec 9control -8.70624(*) 2.30932 .000 -13.2348 -4.1776 Sec 10control .85143 2.30373 .712 -3.6662 5.3691
231

Table F.8. Continued
Dependent Variable
Lecture Section
(I)
Lecture Section
(J)
Mean Difference
(I-J) Std. Error Sig. 95% Confidence
Interval
Lower Bound
Upper Bound
Exam 3 Sec 8control Sec 1 PE -7.07838(*) 2.83367 .013 -12.6352 -1.5215 Sec 2 PE -8.98850(*) 2.11987 .000 -13.1456 -4.8314 Sec 3 PE -12.72277(*) 2.19886 .000 -17.0348 -8.4108 Sec 4 PLTL -10.35219(*) 2.13327 .000 -14.5355 -6.1688 Sec 5 PE -10.35219(*) 2.27001 .000 -14.8037 -5.9007 Sec 6 LS -13.37783(*) 2.02052 .000 -17.3401 -9.4156 Sec 7control 15.88455(*) 2.30651 .000 11.3615 20.4076 Sec 9control 7.17831(*) 1.97392 .000 3.3074 11.0492 Sec 10control 16.73597(*) 1.96737 .000 12.8779 20.5940 Sec 9control Sec 1 PE -14.25669(*) 2.83596 .000 -19.8180 -8.6954 Sec 2 PE -16.16681(*) 2.12293 .000 -20.3299 -12.0037 Sec 3 PE -19.90108(*) 2.20181 .000 -24.2188 -15.5833 Sec 4 PLTL -17.53050(*) 2.13631 .000 -21.7198 -13.3412 Sec 5 PE -17.53050(*) 2.27287 .000 -21.9876 -13.0734 Sec 6 LS -20.55614(*) 2.02373 .000 -24.5247 -16.5876 Sec 7control 8.70624(*) 2.30932 .000 4.1776 13.2348 Sec 8control -7.17831(*) 1.97392 .000 -11.0492 -3.3074 Sec 10control 9.55767(*) 1.97067 .000 5.6932 13.4222 Sec 10control Sec 1 PE -23.81436(*) 2.83140 .000 -29.3668 -18.2619 Sec 2 PE -25.72447(*) 2.11685 .000 -29.8756 -21.5733 Sec 3 PE -29.45875(*) 2.19594 .000 -33.7650 -25.1525 Sec 4 PLTL -27.08817(*) 2.13026 .000 -31.2656 -22.9107 Sec 5 PE -27.08817(*) 2.26718 .000 -31.5341 -22.6422 Sec 6 LS -30.11381(*) 2.01735 .000 -34.0698 -26.1578 Sec 7control -.85143 2.30373 .712 -5.3691 3.6662 Sec 8control -16.73597(*) 1.96737 .000 -20.5940 -12.8779 Sec 9control -9.55767(*) 1.97067 .000 -13.4222 -5.6932Final Sec 1 PE Sec 2 PE -5.20306 2.98218 .081 -11.0511 .6450 Sec 3 PE -3.96305 3.03807 .192 -9.9207 1.9946 Sec 4 PLTL -6.24107(*) 2.99199 .037 -12.1084 -.3737 Sec 5 PE -4.00549 3.09383 .196 -10.0725 2.0615 Sec 6 LS -5.38278 2.91032 .065 -11.0900 .3244 Sec 7control 15.99312(*) 3.12149 .000 9.8718 22.1144 Sec 8control 7.51661(*) 2.87489 .009 1.8789 13.1543 Sec 9control 4.72742 2.87722 .101 -.9148 10.3697 Sec 10control 4.92904 2.87260 .086 -.7041 10.5622
232

Table F.8. Continued
Dependent Variable
Lecture Section
(I)
Lecture Section
(J)
Mean Difference
(I-J) Std. Error Sig. 95% Confidence
Interval
Lower Bound
Upper Bound
Final Sec 2 PE Sec 1 PE 5.20306 2.98218 .081 -.6450 11.0511 Sec 3 PE 1.24000 2.36440 .600 -3.3966 5.8766 Sec 4 PLTL -1.03801 2.30490 .653 -5.5579 3.4819 Sec 5 PE 1.19756 2.43564 .623 -3.5787 5.9739 Sec 6 LS -.17973 2.19785 .935 -4.4897 4.1303 Sec 7control 21.19618(*) 2.47068 .000 16.3511 26.0412 Sec 8control 12.71967(*) 2.15071 .000 8.5021 16.9372 Sec 9control 9.93048(*) 2.15382 .000 5.7068 14.1541 Sec 10control 10.13210(*) 2.14764 .000 5.9206 14.3436 Sec 3 PE Sec 1 PE 3.96305 3.03807 .192 -1.9946 9.9207 Sec 2 PE -1.24000 2.36440 .600 -5.8766 3.3966 Sec 4 PLTL -2.27802 2.37677 .338 -6.9389 2.3828 Sec 5 PE -.04244 2.50375 .986 -4.9523 4.8674 Sec 6 LS -1.41973 2.27310 .532 -5.8773 3.0378 Sec 7control 19.95618(*) 2.53786 .000 14.9794 24.9329 Sec 8control 11.47967(*) 2.22756 .000 7.1114 15.8479 Sec 9control 8.69048(*) 2.23056 .000 4.3163 13.0646 Sec 10control 8.89210(*) 2.22460 .000 4.5296 13.2545 Sec 4 PLTL Sec 1 PE 6.24107(*) 2.99199 .037 .3737 12.1084 Sec 2 PE 1.03801 2.30490 .653 -3.4819 5.5579 Sec 3 PE 2.27802 2.37677 .338 -2.3828 6.9389 Sec 5 PE 2.23558 2.44764 .361 -2.5643 7.0354 Sec 6 LS .85829 2.21115 .698 -3.4778 5.1944 Sec 7control 22.23419(*) 2.48252 .000 17.3659 27.1024 Sec 8control 13.75768(*) 2.16430 .000 9.5135 18.0019 Sec 9control 10.96850(*) 2.16739 .000 6.7182 15.2188 Sec 10control 11.17011(*) 2.16125 .000 6.9319 15.4083 Sec 5 PE Sec 1 PE 4.00549 3.09383 .196 -2.0615 10.0725 Sec 2 PE -1.19756 2.43564 .623 -5.9739 3.5787 Sec 3 PE .04244 2.50375 .986 -4.8674 4.9523 Sec 4 PLTL -2.23558 2.44764 .361 -7.0354 2.5643 Sec 6 LS -1.37729 2.34711 .557 -5.9800 3.2254 Sec 7control 19.99862(*) 2.60436 .000 14.8915 25.1058 Sec 8control 11.52211(*) 2.30303 .000 7.0058 16.0384 Sec 9control 8.73292(*) 2.30593 .000 4.2110 13.2549 Sec 10control 8.93454(*) 2.30016 .000 4.4239 13.4452
233

Table F.8. Continued
Dependent Variable
Lecture Section
(I)
Lecture Section
(J)
Mean Difference
(I-J) Std. Error Sig. 95% Confidence
Interval
Lower Bound
Upper Bound
Final Sec 6 LS Sec 1 PE 5.38278 2.91032 .065 -.3244 11.0900 Sec 2 PE .17973 2.19785 .935 -4.1303 4.4897 Sec 3 PE 1.41973 2.27310 .532 -3.0378 5.8773 Sec 4 PLTL -.85829 2.21115 .698 -5.1944 3.4778 Sec 5 PE 1.37729 2.34711 .557 -3.2254 5.9800 Sec 7control 21.37591(*) 2.38346 .000 16.7019 26.0499 Sec 8control 12.89940(*) 2.04992 .000 8.8795 16.9193 Sec 9control 10.11021(*) 2.05318 .000 6.0839 14.1365 Sec 10control 10.31183(*) 2.04670 .000 6.2982 14.3254 Sec 7control Sec 1 PE -15.99312(*) 3.12149 .000 -22.1144 -9.8718 Sec 2 PE -21.19618(*) 2.47068 .000 -26.0412 -16.3511 Sec 3 PE -19.95618(*) 2.53786 .000 -24.9329 -14.9794 Sec 4 PLTL -22.23419(*) 2.48252 .000 -27.1024 -17.3659 Sec 5 PE -19.99862(*) 2.60436 .000 -25.1058 -14.8915 Sec 6 LS -21.37591(*) 2.38346 .000 -26.0499 -16.7019 Sec 8control -8.47651(*) 2.34007 .000 -13.0654 -3.8876 Sec 9control -11.26570(*) 2.34292 .000 -15.8602 -6.6712 Sec 10control -11.06408(*) 2.33724 .000 -15.6474 -6.4807 Sec 8control Sec 1 PE -7.51661(*) 2.87489 .009 -13.1543 -1.8789 Sec 2 PE -12.71967(*) 2.15071 .000 -16.9372 -8.5021 Sec 3 PE -11.47967(*) 2.22756 .000 -15.8479 -7.1114 Sec 4 PLTL -13.75768(*) 2.16430 .000 -18.0019 -9.5135 Sec 5 PE -11.52211(*) 2.30303 .000 -16.0384 -7.0058 Sec 6 LS -12.89940(*) 2.04992 .000 -16.9193 -8.8795 Sec 7control 8.47651(*) 2.34007 .000 3.8876 13.0654 Sec 9control -2.78919 2.00264 .164 -6.7164 1.1380 Sec 10control -2.58757 1.99599 .195 -6.5017 1.3266 Sec 9control Sec 1 PE -4.72742 2.87722 .101 -10.3697 .9148 Sec 2 PE -9.93048(*) 2.15382 .000 -14.1541 -5.7068 Sec 3 PE -8.69048(*) 2.23056 .000 -13.0646 -4.3163 Sec 4 PLTL -10.96850(*) 2.16739 .000 -15.2188 -6.7182 Sec 5 PE -8.73292(*) 2.30593 .000 -13.2549 -4.2110 Sec 6 LS -10.11021(*) 2.05318 .000 -14.1365 -6.0839 Sec 7control 11.26570(*) 2.34292 .000 6.6712 15.8602 Sec 8control 2.78919 2.00264 .164 -1.1380 6.7164 Sec 10control .20162 1.99934 .920 -3.7191 4.1223
234

Table F.8. Continued
Dependent Variable
Lecture Section
(I)
Lecture Section
(J)
Mean Difference
(I-J) Std. Error Sig. 95% Confidence
Interval
Lower Bound
Upper Bound
Final Sec 10control Sec 1 PE -4.92904 2.87260 .086 -10.5622 .7041 Sec 2 PE -10.13210(*) 2.14764 .000 -14.3436 -5.9206 Sec 3 PE -8.89210(*) 2.22460 .000 -13.2545 -4.5296 Sec 4 PLTL -11.17011(*) 2.16125 .000 -15.4083 -6.9319 Sec 5 PE -8.93454(*) 2.30016 .000 -13.4452 -4.4239 Sec 6 LS -10.31183(*) 2.04670 .000 -14.3254 -6.2982 Sec 7control 11.06408(*) 2.33724 .000 6.4807 15.6474 Sec 8control 2.58757 1.99599 .195 -1.3266 6.5017 Sec 9control -.20162 1.99934 .920 -4.1223 3.7191Class Grade
Sec 1 PE Sec 2 PE -2.00974 2.37803 .398 -6.6731 2.6536
Sec 3 PE -2.77296 2.42260 .252 -7.5237 1.9778 Sec 4 PLTL -2.51781 2.38586 .291 -7.1965 2.1609 Sec 5 PE -2.29793 2.46707 .352 -7.1359 2.5400 Sec 6 LS -2.55909 2.32185 .271 -7.1123 1.9941 Sec 7control 16.98162(*) 2.48913 .000 12.1004 21.8628 Sec 8control 8.31457(*) 2.29248 .000 3.8190 12.8102 Sec 9control 5.61434(*) 2.29434 .014 1.1151 10.1136 Sec 10control 10.24978(*) 2.29065 .000 5.7578 14.7418 Sec 2 PE Sec 1 PE 2.00974 2.37803 .398 -2.6536 6.6731 Sec 3 PE -.76322 1.88541 .686 -4.4605 2.9341 Sec 4 PLTL -.50807 1.83796 .782 -4.1123 3.0962 Sec 5 PE -.28819 1.94222 .882 -4.0969 3.5205 Sec 6 LS -.54935 1.75407 .754 -3.9891 2.8904 Sec 7control 18.99136(*) 1.97016 .000 15.1279 22.8549 Sec 8control 10.32431(*) 1.71501 .000 6.9612 13.6875 Sec 9control 7.62408(*) 1.71749 .000 4.2561 10.9921 Sec 10control 12.25953(*) 1.71256 .000 8.9012 15.6179 Sec 3 PE Sec 1 PE 2.77296 2.42260 .252 -1.9778 7.5237 Sec 2 PE .76322 1.88541 .686 -2.9341 4.4605 Sec 4 PLTL .25515 1.89527 .893 -3.4615 3.9718 Sec 5 PE .47503 1.99653 .812 -3.4402 4.3903 Sec 6 LS .21387 1.81403 .906 -3.3435 3.7712 Sec 7control 19.75458(*) 2.02373 .000 15.7860 23.7231 Sec 8control 11.08754(*) 1.77629 .000 7.6042 14.5709 Sec 9control 8.38731(*) 1.77868 .000 4.8993 11.8753 Sec 10control 13.02275(*) 1.77393 .000 9.5441 16.5014
235

Table F.8. Continued
Dependent Variable
Lecture Section
(I)
Lecture Section
(J)
Mean Difference
(I-J) Std. Error Sig. 95% Confidence
Interval
Lower Bound
Upper Bound
Class Grade
Sec 4 PLTL Sec 1 PE 2.51781 2.38586 .291 -2.1609 7.1965
Sec 2 PE .50807 1.83796 .782 -3.0962 4.1123 Sec 3 PE -.25515 1.89527 .893 -3.9718 3.4615 Sec 5 PE .21989 1.95179 .910 -3.6076 4.0474 Sec 6 LS -.04128 1.76466 .981 -3.5018 3.4192 Sec 7control 19.49943(*) 1.97960 .000 15.6174 23.3814 Sec 8control 10.83239(*) 1.72585 .000 7.4480 14.2168 Sec 9control 8.13216(*) 1.72831 .000 4.7429 11.5214 Sec 10control 12.76760(*) 1.72341 .000 9.3880 16.1472 Sec 5 PE Sec 1 PE 2.29793 2.46707 .352 -2.5400 7.1359 Sec 2 PE .28819 1.94222 .882 -3.5205 4.0969 Sec 3 PE -.47503 1.99653 .812 -4.3903 3.4402 Sec 4 PLTL -.21989 1.95179 .910 -4.0474 3.6076 Sec 6 LS -.26116 1.87300 .889 -3.9341 3.4118 Sec 7control 19.27955(*) 2.07676 .000 15.2070 23.3521 Sec 8control 10.61250(*) 1.83647 .000 7.0112 14.2138 Sec 9control 7.91227(*) 1.83879 .000 4.3064 11.5181 Sec 10control 12.54771(*) 1.83419 .000 8.9509 16.1446 Sec 6 LS Sec 1 PE 2.55909 2.32185 .271 -1.9941 7.1123 Sec 2 PE .54935 1.75407 .754 -2.8904 3.9891 Sec 3 PE -.21387 1.81403 .906 -3.7712 3.3435 Sec 4 PLTL .04128 1.76466 .981 -3.4192 3.5018 Sec 5 PE .26116 1.87300 .889 -3.4118 3.9341 Sec 7control 19.54071(*) 1.90196 .000 15.8109 23.2705 Sec 8control 10.87366(*) 1.63621 .000 7.6650 14.0823 Sec 9control 8.17343(*) 1.63881 .000 4.9597 11.3871 Sec 10control 12.80887(*) 1.63365 .000 9.6053 16.0125 Sec 7control Sec 1 PE -16.98162(*) 2.48913 .000 -21.8628 -12.1004 Sec 2 PE -18.99136(*) 1.97016 .000 -22.8549 -15.1279 Sec 3 PE -19.75458(*) 2.02373 .000 -23.7231 -15.7860 Sec 4 PLTL -19.49943(*) 1.97960 .000 -23.3814 -15.6174 Sec 5 PE -19.27955(*) 2.07676 .000 -23.3521 -15.2070 Sec 6 LS -19.54071(*) 1.90196 .000 -23.2705 -15.8109 Sec 8control -8.66704(*) 1.86600 .000 -12.3263 -5.0078 Sec 9control -11.36727(*) 1.86828 .000 -15.0310 -7.7036 Sec 10control -6.73183(*) 1.86376 .000 -10.3867 -3.0770
236
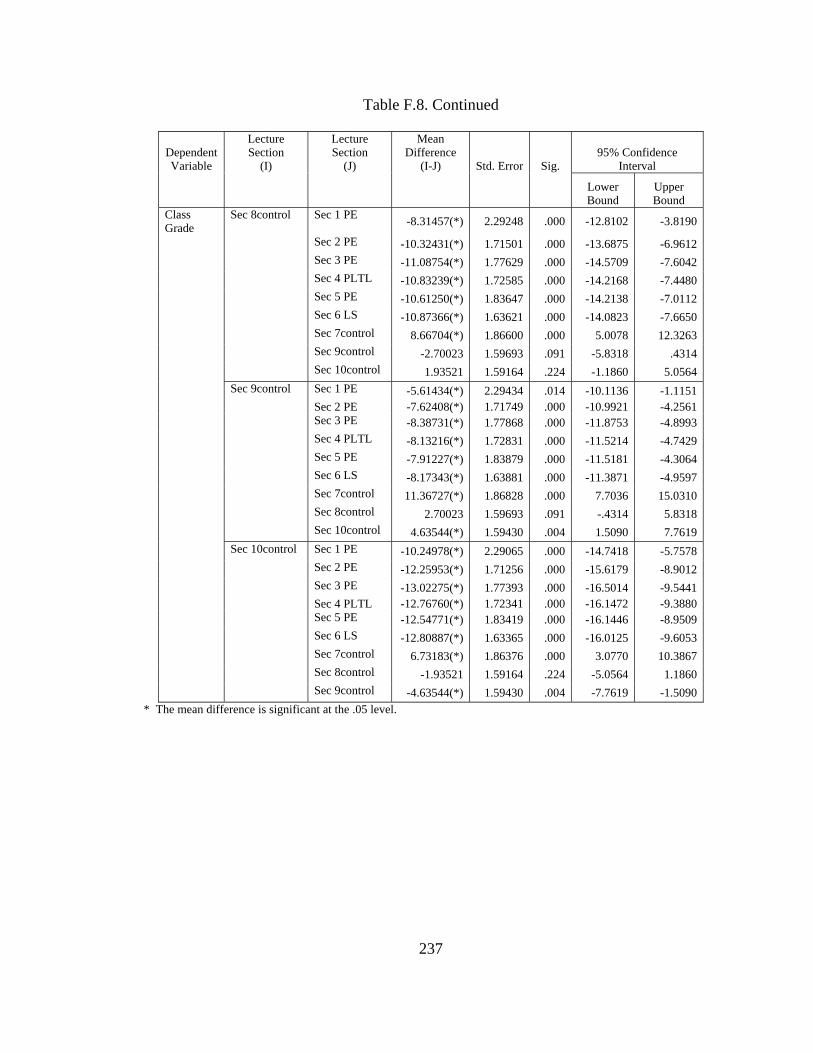
Table F.8. Continued
Dependent Variable
Lecture Section
(I)
Lecture Section
(J)
Mean Difference
(I-J) Std. Error Sig. 95% Confidence
Interval
Lower Bound
Upper Bound
Class Grade
Sec 8control Sec 1 PE -8.31457(*) 2.29248 .000 -12.8102 -3.8190
Sec 2 PE -10.32431(*) 1.71501 .000 -13.6875 -6.9612 Sec 3 PE -11.08754(*) 1.77629 .000 -14.5709 -7.6042 Sec 4 PLTL -10.83239(*) 1.72585 .000 -14.2168 -7.4480 Sec 5 PE -10.61250(*) 1.83647 .000 -14.2138 -7.0112 Sec 6 LS -10.87366(*) 1.63621 .000 -14.0823 -7.6650 Sec 7control 8.66704(*) 1.86600 .000 5.0078 12.3263 Sec 9control -2.70023 1.59693 .091 -5.8318 .4314 Sec 10control 1.93521 1.59164 .224 -1.1860 5.0564 Sec 9control Sec 1 PE -5.61434(*) 2.29434 .014 -10.1136 -1.1151 Sec 2 PE -7.62408(*) 1.71749 .000 -10.9921 -4.2561 Sec 3 PE -8.38731(*) 1.77868 .000 -11.8753 -4.8993 Sec 4 PLTL -8.13216(*) 1.72831 .000 -11.5214 -4.7429 Sec 5 PE -7.91227(*) 1.83879 .000 -11.5181 -4.3064 Sec 6 LS -8.17343(*) 1.63881 .000 -11.3871 -4.9597 Sec 7control 11.36727(*) 1.86828 .000 7.7036 15.0310 Sec 8control 2.70023 1.59693 .091 -.4314 5.8318 Sec 10control 4.63544(*) 1.59430 .004 1.5090 7.7619 Sec 10control Sec 1 PE -10.24978(*) 2.29065 .000 -14.7418 -5.7578 Sec 2 PE -12.25953(*) 1.71256 .000 -15.6179 -8.9012 Sec 3 PE -13.02275(*) 1.77393 .000 -16.5014 -9.5441 Sec 4 PLTL -12.76760(*) 1.72341 .000 -16.1472 -9.3880 Sec 5 PE -12.54771(*) 1.83419 .000 -16.1446 -8.9509 Sec 6 LS -12.80887(*) 1.63365 .000 -16.0125 -9.6053 Sec 7control 6.73183(*) 1.86376 .000 3.0770 10.3867 Sec 8control -1.93521 1.59164 .224 -5.0564 1.1860 Sec 9control -4.63544(*) 1.59430 .004 -7.7619 -1.5090
* The mean difference is significant at the .05 level.
237
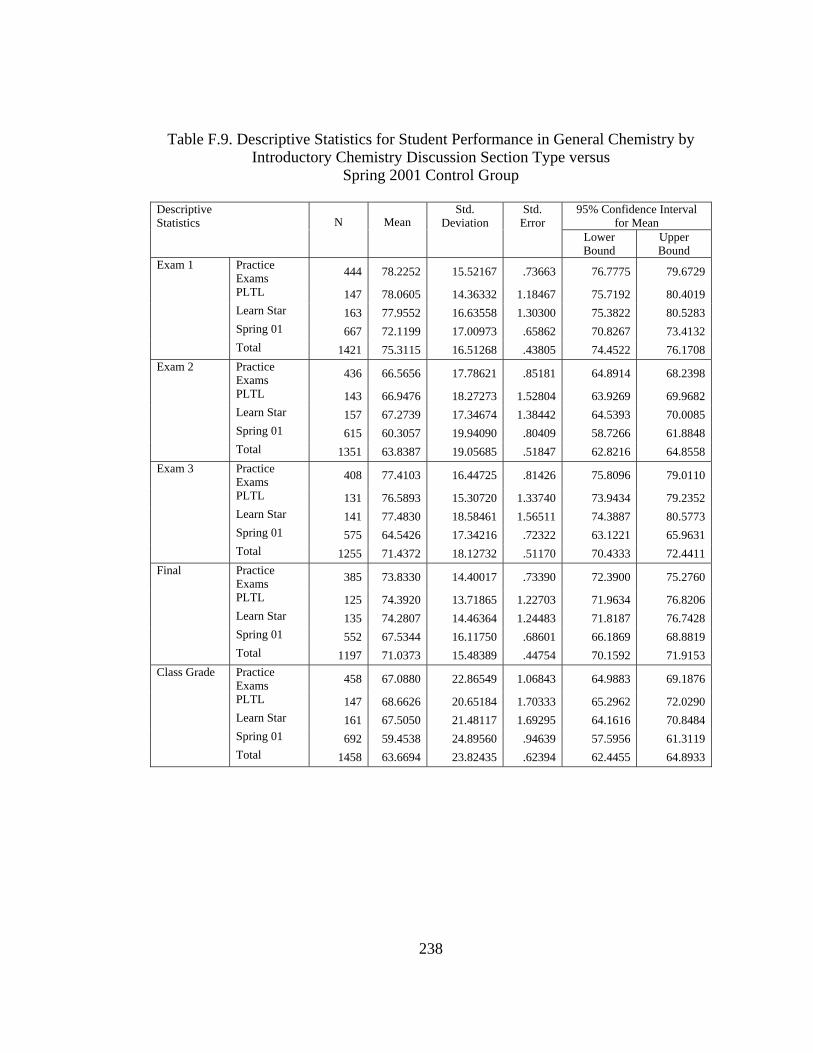
Table F.9. Descriptive Statistics for Student Performance in General Chemistry by Introductory Chemistry Discussion Section Type versus
Spring 2001 Control Group
Descriptive Statistics N Mean
Std. Deviation
Std. Error
95% Confidence Interval for Mean
Lower Bound
Upper Bound
Exam 1 Practice Exams 444 78.2252 15.52167 .73663 76.7775 79.6729
PLTL 147 78.0605 14.36332 1.18467 75.7192 80.4019 Learn Star 163 77.9552 16.63558 1.30300 75.3822 80.5283 Spring 01 667 72.1199 17.00973 .65862 70.8267 73.4132 Total 1421 75.3115 16.51268 .43805 74.4522 76.1708Exam 2 Practice
Exams 436 66.5656 17.78621 .85181 64.8914 68.2398
PLTL 143 66.9476 18.27273 1.52804 63.9269 69.9682 Learn Star 157 67.2739 17.34674 1.38442 64.5393 70.0085 Spring 01 615 60.3057 19.94090 .80409 58.7266 61.8848 Total 1351 63.8387 19.05685 .51847 62.8216 64.8558Exam 3 Practice
Exams 408 77.4103 16.44725 .81426 75.8096 79.0110
PLTL 131 76.5893 15.30720 1.33740 73.9434 79.2352 Learn Star 141 77.4830 18.58461 1.56511 74.3887 80.5773 Spring 01 575 64.5426 17.34216 .72322 63.1221 65.9631 Total 1255 71.4372 18.12732 .51170 70.4333 72.4411Final Practice
Exams 385 73.8330 14.40017 .73390 72.3900 75.2760
PLTL 125 74.3920 13.71865 1.22703 71.9634 76.8206 Learn Star 135 74.2807 14.46364 1.24483 71.8187 76.7428 Spring 01 552 67.5344 16.11750 .68601 66.1869 68.8819 Total 1197 71.0373 15.48389 .44754 70.1592 71.9153Class Grade Practice
Exams 458 67.0880 22.86549 1.06843 64.9883 69.1876
PLTL 147 68.6626 20.65184 1.70333 65.2962 72.0290 Learn Star 161 67.5050 21.48117 1.69295 64.1616 70.8484 Spring 01 692 59.4538 24.89560 .94639 57.5956 61.3119 Total 1458 63.6694 23.82435 .62394 62.4455 64.8933
238

Table F.10. Test of Homogeneity of Variances Statistics for Student Performance in General Chemistry by Introductory Chemistry Discussion Section Type
versus Spring 2001 Control Group
Levene Statistic df1 df2 Sig.
Exam1.1307 3.646 3 1417 .012 Exam2.1307 3.450 3 1347 .016 Exam3.1307 2.991 3 1251 .030
Final1307 2.844 3 1193 .037 Grade1307 4.804 3 1454 .002
Table F.11. ANOVA for Student Performance in General Chemistry by Introductory Chemistry Discussion Section Type versus
Spring 2001 Control Group
Sum of Squares df Mean Square F Sig.
Between Groups 12813.727 3 4271.242 16.167 .000Within Groups 374375.836 1417 264.203
Exam1.1307
Total 387189.563 1420 Between Groups 14153.372 3 4717.791 13.347 .000Within Groups 476117.154 1347 353.465
Exam2.1307
Total 490270.525 1350 Between Groups 50520.465 3 16840.155 58.270 .000Within Groups 361543.707 1251 289.004
Exam3.1307
Total 412064.172 1254 Between Groups 12609.179 3 4203.060 18.291 .000Within Groups 274132.819 1193 229.784
Final1307
Total 286741.998 1196 Between Groups 23684.071 3 7894.690 14.290 .000Within Groups 803308.384 1454 552.482
Grade1307
Total 826992.456 1457
239

Table F.12. Post Hoc Tests for Student Performance in General Chemistry by Introductory Chemistry Discussion Section Type versus Spring 2001 Control Group
LSD Multiple Comparisons
Dependent Variable (I) Type (J) Type
Mean Difference
(I-J) Std. Error Sig. 95% Confidence Interval
Lower Bound
Upper Bound
Exam 1 Practice Exams
PLTL .16468 1.54672 .915 -2.8694 3.1988
Learn Star .27001 1.48860 .856 -2.6501 3.1901 Spring 01 6.10529(*) .99557 .000 4.1523 8.0582 PLTL Practice
Exams -.16468 1.54672 .915 -3.1988 2.8694
Learn Star .10533 1.84883 .955 -3.5214 3.7321 Spring 01 5.94060(*) 1.48102 .000 3.0354 8.8458 Learn Star Practice
Exams -.27001 1.48860 .856 -3.1901 2.6501
PLTL -.10533 1.84883 .955 -3.7321 3.5214 Spring 01 5.83527(*) 1.42021 .000 3.0493 8.6212 Spring 01 Practice
Exams -6.10529(*) .99557 .000 -8.0582 -4.1523
PLTL -5.94060(*) 1.48102 .000 -8.8458 -3.0354 Learn Star -5.83527(*) 1.42021 .000 -8.6212 -3.0493Exam 2 Practice
Exams PLTL -.38196 1.81176 .833 -3.9361 3.1722
Learn Star -.70829 1.74988 .686 -4.1411 2.7245 Spring 01 6.25991(*) 1.17705 .000 3.9509 8.5689 PLTL Practice
Exams .38196 1.81176 .833 -3.1722 3.9361
Learn Star -.32633 2.17328 .881 -4.5897 3.9371 Spring 01 6.64186(*) 1.74543 .000 3.2178 10.0659 Learn Star Practice
Exams .70829 1.74988 .686 -2.7245 4.1411
PLTL .32633 2.17328 .881 -3.9371 4.5897 Spring 01 6.96819(*) 1.68110 .000 3.6703 10.2661 Spring 01 Practice
Exams -6.25991(*) 1.17705 .000 -8.5689 -3.9509
PLTL -6.64186(*) 1.74543 .000 -10.0659 -3.2178 Learn Star -6.96819(*) 1.68110 .000 -10.2661 -3.6703
240

Table F.12. Continued
Dependent Variable (I) Type (J) Type
Mean Difference
(I-J) Std. Error Sig. 95% Confidence Interval
Lower Bound
Upper Bound
Exam 3 Practice Exams
PLTL .82098 1.70718 .631 -2.5283 4.1702
Learn Star -.07268 1.66073 .965 -3.3308 3.1854 Spring 01 12.86769(*) 1.10044 .000 10.7088 15.0266 PLTL Practice
Exams -.82098 1.70718 .631 -4.1702 2.5283
Learn Star -.89367 2.06296 .665 -4.9409 3.1536 Spring 01 12.04670(*) 1.64583 .000 8.8178 15.2756 Learn Star Practice
Exams .07268 1.66073 .965 -3.1854 3.3308
PLTL .89367 2.06296 .665 -3.1536 4.9409 Spring 01 12.94037(*) 1.59759 .000 9.8061 16.0746 Spring 01 Practice
Exams -12.86769(*) 1.10044 .000 -15.0266 -10.7088
PLTL -12.04670(*) 1.64583 .000 -15.2756 -8.8178 Learn Star -12.94037(*) 1.59759 .000 -16.0746 -9.8061Final Practice
Exams PLTL -.55901 1.56049 .720 -3.6206 2.5026
Learn Star -.44775 1.51623 .768 -3.4225 2.5270 Spring 01 6.29857(*) 1.00654 .000 4.3238 8.2733 PLTL Practice
Exams .55901 1.56049 .720 -2.5026 3.6206
Learn Star .11126 1.88159 .953 -3.5803 3.8029 Spring 01 6.85758(*) 1.50152 .000 3.9117 9.8035 Learn Star Practice
Exams .44775 1.51623 .768 -2.5270 3.4225
PLTL -.11126 1.88159 .953 -3.8029 3.5803 Spring 01 6.74632(*) 1.45547 .000 3.8908 9.6019 Spring 01 Practice
Exams -6.29857(*) 1.00654 .000 -8.2733 -4.3238
PLTL -6.85758(*) 1.50152 .000 -9.8035 -3.9117 Learn Star -6.74632(*) 1.45547 .000 -9.6019 -3.8908
241

Table F.12. Continued
Dependent Variable (I) Type (J) Type
Mean Difference
(I-J) Std. Error Sig. 95% Confidence Interval
Lower Bound
Upper Bound
Class Grade
Practice Exams
PLTL -1.57459 2.22815 .480 -5.9453 2.7961
Learn Star -.41698 2.15357 .846 -4.6414 3.8075 Spring 01 7.63423(*) 1.41587 .000 4.8569 10.4116 PLTL Practice
Exams 1.57459 2.22815 .480 -2.7961 5.9453
Learn Star 1.15762 2.68141 .666 -4.1022 6.4175 Spring 01 9.20883(*) 2.13466 .000 5.0215 13.3962 Learn Star Practice
Exams .41698 2.15357 .846 -3.8075 4.6414
PLTL -1.15762 2.68141 .666 -6.4175 4.1022 Spring 01 8.05121(*) 2.05668 .000 4.0168 12.0856 Spring 01 Practice
Exams -7.63423(*) 1.41587 .000 -10.4116 -4.8569
PLTL -9.20883(*) 2.13466 .000 -13.3962 -5.0215 Learn Star -8.05121(*) 2.05668 .000 -12.0856 -4.0168
* The mean difference is significant at the .05 level.
242

Table F.13. Descriptive Statistics for Student Performance in General Chemistry by Introductory Chemistry Discussion Section Type versus Student Performance
by Students Who Had Passed the Chemistry Placement Exam
Descriptive Statistics N Mean
Std. Deviation Std. Error
95% Confidence Interval for Mean
Lower Bound
Upper Bound
Exam 1 Pass CPE 180 77.5022 15.31874 1.05709 75.4951 79.6630 Practice
Exams 444 78.2252 15.52167 .73663 76.7775 79.6729
PLTL 147 78.0605 14.36332 1.18467 75.7192 80.4019 Learn Star 163 77.9552 16.63558 1.30300 75.3822 80.5283 Total 934 78.0137 15.48075 .49860 77.0352 78.9922Exam 2 Pass CPE 179 64.5994 18.93953 1.31322 62.0437 67.2217 Practice
Exams 436 66.5656 17.78621 .85181 64.8914 68.2398
PLTL 143 66.9476 18.27273 1.52804 63.9269 69.9682 Learn Star 157 67.2739 17.34674 1.38442 64.5393 70.0085 Total 915 66.3154 18.04426 .58729 65.1628 67.4679Exam 3 Pass CPE 158 72.7139 18.64720 1.36728 70.1735 75.5684 Practice
Exams 408 77.4103 16.44725 .81426 75.8096 79.0110
PLTL 131 76.5893 15.30720 1.33740 73.9434 79.2352 Learn Star 141 77.4830 18.58461 1.56511 74.3887 80.5773 Total 838 76.3230 17.20796 .58475 75.1753 77.4707Final Pass CPE 138 68.9986 14.20517 1.11263 67.2470 71.6413 Practice
Exams 385 73.8330 14.40017 .73390 72.3900 75.2760
PLTL 125 74.3920 13.71865 1.22703 71.9634 76.8206 Learn Star 135 74.2807 14.46364 1.24483 71.8187 76.7428 Total 783 73.1089 14.36250 .50527 72.1171 74.1007Class Grade Pass CPE 193 58.1472 25.36136 1.69832 55.9513 62.6451 Practice
Exams 458 67.0880 22.86549 1.06843 64.9883 69.1876
PLTL 147 68.6626 20.65184 1.70333 65.2962 72.0290 Learn Star 161 67.5050 21.48117 1.69295 64.1616 70.8484 Total 959 65.6335 23.15357 .73624 64.1887 67.0782
243

Table F.14. Test of Homogeneity of Variances for Student Performance in General
Chemistry by Introductory Chemistry Discussion Section Type versus Student Performance by Students Who Had Passed the Chemistry Placement Exam
Levene Statistic df1 df2 Sig.
Exam 1 1.378 3 930 .248 Exam 2 .530 3 911 .662 Exam 3 3.894 3 834 .009
Final .340 3 879 .796 Class Grade 4.833 3 955 .002
Table F15. ANOVA for Student Performance in General Chemistry by Introductory Chemistry Discussion Section Type versus Student Performance
by Students Who Had Passed the Chemistry Placement Exam
Sum of Squares df Mean Square F Sig.
Between Groups 60.420 3 20.140 .094 .963Within Groups 230726.140 960 240.340
Exam 1
Total 230786.559 963 Between Groups 817.626 3 272.542 .770 .511Within Groups 306218.721 940 325.765
Exam 2
Total 307036.347 943 Between Groups 2897.829 3 965.943 3.088 .027Within Groups 253240.824 862 293.783
Exam 3
Total 256138.653 865 Between Groups 2782.161 3 927.387 4.785 .003Within Groups 163686.935 804 203.591
Final
Total 166469.096 807 Between Groups 11831.899 3 3943.966 8.622 .000Within Groups 517822.903 985 525.709
Class Grade
Total 529654.802 988
244

Table F.16. Post Hoc Tests for Student Performance in General Chemistry by Introductory Chemistry Discussion Section Type versus Student Performance
by Students Who Had Passed the Chemistry Placement Exam LSD Multiple Comparisons
Dependent Variable
Discussion Section Type
(I)
Discussion Section Type
(J)
Mean Difference
(I-J) Std. Error Sig. 95% Confidence Interval
Lower Bound
Upper Bound
Exam 1 Pass CPE Practice Exams -.64618 1.29838 .619 -3.1942 1.9018
PLTL -.48150 1.66716 .773 -3.7532 2.7902 Learn Star -.37617 1.61832 .816 -3.5520 2.7997 Practice
Exams Pass CPE .64618 1.29838 .619 -1.9018 3.1942
PLTL .16468 1.47522 .911 -2.7303 3.0597 Learn Star .27001 1.41978 .849 -2.5162 3.0562 PLTL Pass CPE .48150 1.66716 .773 -2.7902 3.7532 Practice
Exams -.16468 1.47522 .911 -3.0597 2.7303
Learn Star .10533 1.76336 .952 -3.3552 3.5658 Learn Star Pass CPE .37617 1.61832 .816 -2.7997 3.5520 Practice
Exams -.27001 1.41978 .849 -3.0562 2.5162
PLTL -.10533 1.76336 .952 -3.5658 3.3552Exam 2 Pass CPE Practice
Exams -1.93290 1.52097 .204 -4.9178 1.0520
PLTL -2.31486 1.96068 .238 -6.1627 1.5329 Learn Star -2.64119 1.90817 .167 -6.3860 1.1036 Practice
Exams Pass CPE 1.93290 1.52097 .204 -1.0520 4.9178
PLTL -.38196 1.73932 .826 -3.7954 3.0314 Learn Star -.70829 1.67991 .673 -4.0051 2.5885 PLTL Pass CPE 2.31486 1.96068 .238 -1.5329 6.1627 Practice
Exams .38196 1.73932 .826 -3.0314 3.7954
Learn Star -.32633 2.08639 .876 -4.4208 3.7682 Learn Star Pass CPE 2.64119 1.90817 .167 -1.1036 6.3860 Practice
Exams .70829 1.67991 .673 -2.5885 4.0051
PLTL .32633 2.08639 .876 -3.7682 4.4208
245

Table F.16. Continued
Dependent Variable
Discussion Section Type
(I)
Discussion Section Type
(J)
Mean Difference
(I-J) Std. Error Sig. 95% Confidence Interval
Lower Bound
Upper Bound
Exam 3 Pass CPE Practice Exams -4.69633(*) 1.51642 .003 -7.5156 -1.5630
PLTL -3.71835 1.95502 .058 -7.5555 .1188 Learn Star -4.76905(*) 1.91391 .016 -8.3685 -.8555 Practice
Exams Pass CPE 4.69633(*) 1.51642 .003 1.5630 7.5156
PLTL .82098 1.72124 .634 -2.5573 4.1993 Learn Star -.07268 1.67440 .965 -3.3591 3.2137 PLTL Pass CPE 3.71835 1.95502 .058 -.1188 7.5555 Practice
Exams -.82098 1.72124 .634 -4.1993 2.5573
Learn Star -.89367 2.07995 .668 -4.9760 3.1887 Learn Star Pass CPE 4.76905(*) 1.91391 .016 .8555 8.3685 Practice
Exams .07268 1.67440 .965 -3.2137 3.3591
PLTL .89367 2.07995 .668 -3.1887 4.9760Final Pass CPE Practice
Exams -4.83882(*) 1.33335 .001 -7.0061 -1.7716
PLTL -5.39345(*) 1.69639 .002 -8.2777 -1.6179 Learn Star -5.28219(*) 1.66045 .002 -8.0959 -1.5772 Practice
Exams Pass CPE 4.83882(*) 1.33335 .001 1.7716 7.0061
PLTL -.55901 1.46885 .704 -3.4423 2.3242 Learn Star -.44775 1.42720 .754 -3.2492 2.3537 PLTL Pass CPE 5.39345(*) 1.69639 .002 1.6179 8.2777 Practice
Exams .55901 1.46885 .704 -2.3242 3.4423
Learn Star .11126 1.77110 .950 -3.3653 3.5878 Learn Star Pass CPE 5.28219(*) 1.66045 .002 1.5772 8.0959 Practice
Exams .44775 1.42720 .754 -2.3537 3.2492
PLTL -.11126 1.77110 .950 -3.5878 3.3653
246

Table F.16. Continued
Dependent Variable
Discussion Section Type
(I)
Discussion Section Type
(J)
Mean Difference
(I-J) Std. Error Sig. 95% Confidence Interval
Lower Bound
Upper Bound
Class Grade
Pass CPE Practice Exams -8.94084(*) 1.97224 .000 -11.4638 -4.1158
PLTL -10.5154(*) 2.53592 .000 -14.1446 -4.5842 Learn Star -9.35782(*) 2.47122 .000 -12.8600 -3.5535 Practice
Exams Pass CPE 8.94084 (*) 1.97224 .000 4.1158 11.4638
PLTL -1.57459 2.18350 .469 -5.8398 2.6906 Learn Star -.41698 2.10074 .843 -4.5394 3.7055 PLTL Pass CPE 10.5154 (*) 2.53592 .000 4.5842 14.1446 Practice
Exams 1.57459 2.17350 .469 -2.6906 5.8398
Learn Star 1.15762 2.61563 .658 -3.9752 6.2905 Learn Star Pass CPE 9.35782 (*) 2.47122 .000 3.5535 12.8600 Practice
Exams .41698 2.10074 .843 -3.7055 4.5394
PLTL -1.15762 2.61563 .658 -6.2905 3.9752* The mean difference is significant at the .05 level.
247

Table F.17. Descriptive Statistics for Student Performance by Lecture Section in General Chemistry Spring 2004
Descriptive Statistics N Mean
Std. Deviation Std. Error
95% Confidence Interval for Mean
Lower Bound
Upper Bound
Exam 1 Sec. 1 92 68.8261 16.86182 1.75797 65.3341 72.3181 Sec. 2 60 77.8667 16.37636 2.11418 73.6362 82.0971 Sec. 3 273 78.6374 15.75421 .95349 76.7602 80.5145 Sec. 4 266 83.3835 14.95590 .91700 81.5779 85.1890 Sec. 5 92 75.7283 12.20058 1.27200 73.2016 78.2549 Sec. 6 181 75.0619 13.15711 .97796 73.1321 76.9916 Total 964 78.0137 15.48075 .49860 77.0352 78.9922 Exam 2 Sec. 1 92 62.4348 17.32895 1.80667 58.8461 66.0235 Sec. 2 59 65.5593 21.74481 2.83093 59.8926 71.2261 Sec. 3 268 65.2537 18.60397 1.13642 63.0163 67.4912 Sec. 4 258 70.4651 16.39021 1.02041 68.4557 72.4745 Sec. 5 91 52.9275 14.02017 1.46971 50.0076 55.8473 Sec. 6 176 71.0528 16.33905 1.23160 68.6221 73.4835 Total 944 66.3154 18.04426 .58729 65.1628 67.4679 Exam 3 Sec. 1 91 67.0769 16.99231 1.78128 63.5381 70.6157 Sec. 2 52 77.6923 19.35989 2.68473 72.3025 83.0821 Sec. 3 241 79.1867 15.77559 1.01619 77.1849 81.1885 Sec. 4 240 81.4833 15.58885 1.00626 79.5011 83.4656 Sec. 5 87 62.5230 17.03410 1.82625 58.8925 66.1534 Sec. 6 155 76.5948 15.17229 1.21867 74.1874 79.0023 Total 866 76.3230 17.20796 .58475 75.1753 77.4707 Final Sec. 1 85 71.8118 16.74351 1.81609 68.2003 75.4233 Sec. 2 50 70.3400 16.17240 2.28712 65.7439 74.9361 Sec. 3 218 71.8757 13.03112 .88258 70.1362 73.6152 Sec. 4 229 75.4961 11.93653 .78879 73.9418 77.0503 Sec. 5 85 59.6271 11.30659 1.22637 57.1883 62.0658 Sec. 6 141 81.0298 12.97597 1.09277 78.8693 83.1903 Total 808 73.1089 14.36250 .50527 72.1171 74.1007 Class Grade Sec. 1 96 63.8448 20.65504 2.10810 59.6597 68.0299 Sec. 2 65 61.9738 28.86630 3.58042 54.8211 69.1266 Sec. 3 276 66.6091 22.69436 1.36604 63.9198 69.2983 Sec. 4 274 67.2292 23.50283 1.41986 64.4339 70.0245 Sec. 5 94 57.5234 17.40231 1.79491 53.9591 61.0877 Sec. 6 184 68.1630 24.03309 1.77174 64.6674 71.6587 Total 989 65.6335 23.15357 .73624 64.1887 67.0782
248

Table F.18. Test of Homogeneity of Variances for Student Performance
by Lecture Section in General Chemistry Spring 2004
Levene Statistic df1 df2 Sig.
Exam 1 2.146 5 958 .058 Exam 2 4.689 5 938 .000 Exam 3 2.244 5 860 .048 Final 4.926 5 802 .000 Class Grade 5.551 5 983 .000
Table F.19. ANOVA for Student Performance by Lecture Section in General Chemistry Spring 2004
Sum of Squares df Mean Square F Sig.
Between Groups 17600.969 5 3520.194 15.819 .000Within Groups 213185.590 958 222.532
Exam 1
Total 230786.559 963 Between Groups 26424.604 5 5284.921 17.666 .000Within Groups 280611.743 938 299.160
Exam 2
Total 307036.347 943 Between Groups 32824.234 5 6564.847 25.282 .000Within Groups 223314.419 860 259.668
Exam 3
Total 256138.653 865 Between Groups 26458.877 5 5291.775 30.312 .000Within Groups 140010.219 802 174.576
Final
Total 166469.096 807 Between Groups 9498.108 5 1899.622 3.590 .003Within Groups 520156.694 983 529.152
Class Grade
Total 529654.802 988
249

Table F.20. Post Hoc Tests for Student Performance by Lecture Section in General Chemistry Spring 2004
LSD Multiple Comparisons
Dependent Variable
General Chemistry Section (I)
General Chemistry Section (J)
Mean Difference
(I-J) Std. Error Sig. 95% Confidence Interval
Lower Bound
Upper Bound
Exam 1 Section 1 Sec. 2 -9.04058(*) 2.47542 .000 -13.8984 -4.1827 Sec. 3 -9.81128(*) 1.79832 .000 -13.3404 -6.2822 Sec. 4 -14.55737(*) 1.80428 .000 -18.0982 -11.0166 Sec. 5 -6.90217(*) 2.19947 .002 -11.2185 -2.5858 Sec. 6 -6.23579(*) 1.91005 .001 -9.9842 -2.4874 Section 2 Sec. 1 9.04058(*) 2.47542 .000 4.1827 13.8984 Sec. 3 -.77070 2.12697 .717 -4.9448 3.4034 Sec. 4 -5.51679(*) 2.13201 .010 -9.7007 -1.3329 Sec. 5 2.13841 2.47542 .388 -2.7195 6.9963 Sec. 6 2.80479 2.22223 .207 -1.5562 7.1658 Section 3 Sec. 1 9.81128(*) 1.79832 .000 6.2822 13.3404 Sec. 2 .77070 2.12697 .717 -3.4034 4.9448 Sec. 4 -4.74610(*) 1.28519 .000 -7.2682 -2.2240 Sec. 5 2.90910 1.79832 .106 -.6200 6.4382 Sec. 6 3.57548(*) 1.42989 .013 .7694 6.3816 Section 4 Sec. 1 14.55737(*) 1.80428 .000 11.0166 18.0982 Sec. 2 5.51679(*) 2.13201 .010 1.3329 9.7007 Sec. 3 4.74610(*) 1.28519 .000 2.2240 7.2682 Sec. 5 7.65520(*) 1.80428 .000 4.1144 11.1960 Sec. 6 8.32158(*) 1.43737 .000 5.5008 11.1423 Section 5 Sec. 1 6.90217(*) 2.19947 .002 2.5858 11.2185 Sec. 2 -2.13841 2.47542 .388 -6.9963 2.7195 Sec. 3 -2.90910 1.79832 .106 -6.4382 .6200 Sec. 4 -7.65520(*) 1.80428 .000 -11.1960 -4.1144 Sec. 6 .66638 1.91005 .727 -3.0820 4.4147 Section 6 Sec. 1 6.23579(*) 1.91005 .001 2.4874 9.9842 Sec. 2 -2.80479 2.22223 .207 -7.1658 1.5562 Sec. 3 -3.57548(*) 1.42989 .013 -6.3816 -.7694 Sec. 4 -8.32158(*) 1.43737 .000 -11.1423 -5.5008 Sec. 5 -.66638 1.91005 .727 -4.4147 3.0820
250

Table F.20. Continued
Dependent Variable
General Chemistry Section (I)
General Chemistry Section (J)
Mean Difference
(I-J) Std. Error Sig. 95% Confidence Interval
Lower Bound
Upper Bound
Exam 2 Section 1 Sec. 2 -3.12454 2.88483 .279 -8.7860 2.5369 Sec. 3 -2.81895 2.08998 .178 -6.9205 1.2826 Sec. 4 -8.03033(*) 2.10030 .000 -12.1522 -3.9085 Sec. 5 9.50731(*) 2.55719 .000 4.4888 14.5258 Sec. 6 -8.61806(*) 2.22520 .000 -12.9850 -4.2511 Section 2 Sec. 1 3.12454 2.88483 .279 -2.5369 8.7860 Sec. 3 .30559 2.48732 .902 -4.5758 5.1870 Sec. 4 -4.90579(*) 2.49600 .050 -9.8042 -.0074 Sec. 5 12.63185(*) 2.89102 .000 6.9582 18.3055 Sec. 6 -5.49352(*) 2.60197 .035 -10.5999 -.3872 Section 3 Sec. 1 2.81895 2.08998 .178 -1.2826 6.9205 Sec. 2 -.30559 2.48732 .902 -5.1870 4.5758 Sec. 4 -5.21138(*) 1.50858 .001 -8.1720 -2.2508 Sec. 5 12.32626(*) 2.09851 .000 8.2079 16.4446 Sec. 6 -5.79911(*) 1.67811 .001 -9.0924 -2.5058 Section 4 Sec. 1 8.03033(*) 2.10030 .000 3.9085 12.1522 Sec. 2 4.90579(*) 2.49600 .050 .0074 9.8042 Sec. 3 5.21138(*) 1.50858 .001 2.2508 8.1720 Sec. 5 17.53764(*) 2.10879 .000 13.3991 21.6761 Sec. 6 -.58772 1.69095 .728 -3.9062 2.7308 Section 5 Sec. 1 -9.50731(*) 2.55719 .000 -14.5258 -4.4888 Sec. 2 -12.63185(*) 2.89102 .000 -18.3055 -6.9582 Sec. 3 -12.32626(*) 2.09851 .000 -16.4446 -8.2079 Sec. 4 -17.53764(*) 2.10879 .000 -21.6761 -13.3991 Sec. 6 -18.12537(*) 2.23321 .000 -22.5080 -13.7427 Section 6 Sec. 1 8.61806(*) 2.22520 .000 4.2511 12.9850 Sec. 2 5.49352(*) 2.60197 .035 .3872 10.5999 Sec. 3 5.79911(*) 1.67811 .001 2.5058 9.0924 Sec. 4 .58772 1.69095 .728 -2.7308 3.9062 Sec. 5 18.12537(*) 2.23321 .000 13.7427 22.5080
251
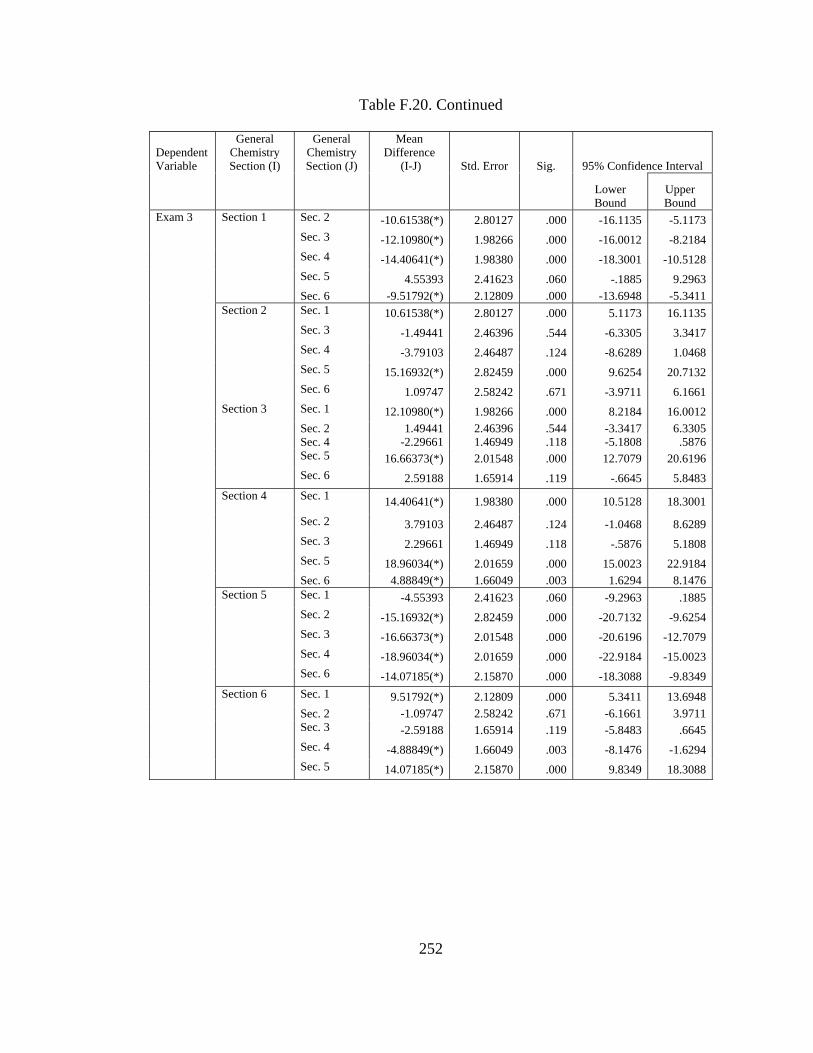
Table F.20. Continued
Dependent Variable
General Chemistry Section (I)
General Chemistry Section (J)
Mean Difference
(I-J) Std. Error Sig. 95% Confidence Interval
Lower Bound
Upper Bound
Exam 3 Section 1 Sec. 2 -10.61538(*) 2.80127 .000 -16.1135 -5.1173 Sec. 3 -12.10980(*) 1.98266 .000 -16.0012 -8.2184 Sec. 4 -14.40641(*) 1.98380 .000 -18.3001 -10.5128 Sec. 5 4.55393 2.41623 .060 -.1885 9.2963 Sec. 6 -9.51792(*) 2.12809 .000 -13.6948 -5.3411 Section 2 Sec. 1 10.61538(*) 2.80127 .000 5.1173 16.1135 Sec. 3 -1.49441 2.46396 .544 -6.3305 3.3417 Sec. 4 -3.79103 2.46487 .124 -8.6289 1.0468 Sec. 5 15.16932(*) 2.82459 .000 9.6254 20.7132 Sec. 6 1.09747 2.58242 .671 -3.9711 6.1661 Section 3 Sec. 1 12.10980(*) 1.98266 .000 8.2184 16.0012 Sec. 2 1.49441 2.46396 .544 -3.3417 6.3305 Sec. 4 -2.29661 1.46949 .118 -5.1808 .5876 Sec. 5 16.66373(*) 2.01548 .000 12.7079 20.6196 Sec. 6 2.59188 1.65914 .119 -.6645 5.8483 Section 4 Sec. 1 14.40641(*) 1.98380 .000 10.5128 18.3001
Sec. 2 3.79103 2.46487 .124 -1.0468 8.6289 Sec. 3 2.29661 1.46949 .118 -.5876 5.1808 Sec. 5 18.96034(*) 2.01659 .000 15.0023 22.9184 Sec. 6 4.88849(*) 1.66049 .003 1.6294 8.1476 Section 5 Sec. 1 -4.55393 2.41623 .060 -9.2963 .1885 Sec. 2 -15.16932(*) 2.82459 .000 -20.7132 -9.6254 Sec. 3 -16.66373(*) 2.01548 .000 -20.6196 -12.7079 Sec. 4 -18.96034(*) 2.01659 .000 -22.9184 -15.0023 Sec. 6 -14.07185(*) 2.15870 .000 -18.3088 -9.8349 Section 6 Sec. 1 9.51792(*) 2.12809 .000 5.3411 13.6948 Sec. 2 -1.09747 2.58242 .671 -6.1661 3.9711 Sec. 3 -2.59188 1.65914 .119 -5.8483 .6645 Sec. 4 -4.88849(*) 1.66049 .003 -8.1476 -1.6294 Sec. 5 14.07185(*) 2.15870 .000 9.8349 18.3088
252

Table F.20. Continued
Dependent Variable
General Chemistry Section (I)
General Chemistry Section (J)
Mean Difference
(I-J) Std. Error Sig. 95% Confidence Interval
Lower Bound
Upper Bound
Final Section 1 Sec. 2 1.47176 2.35486 .532 -3.1507 6.0942 Sec. 3 -.06392 1.68957 .970 -3.3804 3.2526 Sec. 4 -3.68431(*) 1.67815 .028 -6.9784 -.3902 Sec. 5 12.18471(*) 2.02674 .000 8.2064 16.1630 Sec. 6 -9.21802(*) 1.81438 .000 -12.7795 -5.6565 Section 2 Sec. 1 -1.47176 2.35486 .532 -6.0942 3.1507 Sec. 3 -1.53569 2.07180 .459 -5.6025 2.5311 Sec. 4 -5.15607(*) 2.06249 .013 -9.2046 -1.1076 Sec. 5 10.71294(*) 2.35486 .000 6.0905 15.3354 Sec. 6 -10.68979(*) 2.17478 .000 -14.9587 -6.4209 Section 3 Sec. 1 .06392 1.68957 .970 -3.2526 3.3804 Sec. 2 1.53569 2.07180 .459 -2.5311 5.6025 Sec. 4 -3.62038(*) 1.25026 .004 -6.0746 -1.1662 Sec. 5 12.24863(*) 1.68957 .000 8.9321 15.5651 Sec. 6 -9.15410(*) 1.42791 .000 -11.9570 -6.3512 Section 4 Sec. 1 3.68431(*) 1.67815 .028 .3902 6.9784 Sec. 2 5.15607(*) 2.06249 .013 1.1076 9.2046 Sec. 3 3.62038(*) 1.25026 .004 1.1662 6.0746 Sec. 5 15.86901(*) 1.67815 .000 12.5749 19.1631 Sec. 6 -5.53372(*) 1.41438 .000 -8.3100 -2.7574 Section 5 Sec. 1 -12.18471(*) 2.02674 .000 -16.1630 -8.2064 Sec. 2 -10.71294(*) 2.35486 .000 -15.3354 -6.0905 Sec. 3 -12.24863(*) 1.68957 .000 -15.5651 -8.9321 Sec. 4 -15.86901(*) 1.67815 .000 -19.1631 -12.5749 Sec. 6 -21.40273(*) 1.81438 .000 -24.9642 -17.8412 Section 6 Sec. 1 9.21802(*) 1.81438 .000 5.6565 12.7795 Sec. 2 10.68979(*) 2.17478 .000 6.4209 14.9587 Sec. 3 9.15410(*) 1.42791 .000 6.3512 11.9570 Sec. 4 5.53372(*) 1.41438 .000 2.7574 8.3100 Sec. 5 21.40273(*) 1.81438 .000 17.8412 24.9642
253

Table F.20. Continued
Dependent Variable
General Chemistry Section (I)
General Chemistry Section (J)
Mean Difference
(I-J) Std. Error Sig. 95% Confidence Interval
Lower Bound
Upper Bound
Class Grade
Section 1 Sec. 2 1.87095 3.69497 .613 -5.3800 9.1219
Sec. 3 -2.76427 2.72566 .311 -8.1130 2.5845 Sec. 4 -3.38441 2.72823 .215 -8.7382 1.9694 Sec. 5 6.32139 3.33786 .059 -.2288 12.8715 Sec. 6 -4.31825 2.89618 .136 -10.0016 1.3651 Section 2 Sec. 1 -1.87095 3.69497 .613 -9.1219 5.3800 Sec. 3 -4.63521 3.17144 .144 -10.8588 1.5884 Sec. 4 -5.25535 3.17364 .098 -11.4832 .9725 Sec. 5 4.45044 3.71081 .231 -2.8316 11.7325 Sec. 6 -6.18920 3.31913 .063 -12.7026 .3242 Section 3 Sec. 1 2.76427 2.72566 .311 -2.5845 8.1130 Sec. 2 4.63521 3.17144 .144 -1.5884 10.8588 Sec. 4 -.62014 1.96174 .752 -4.4698 3.2295 Sec. 5 9.08565(*) 2.74709 .001 3.6948 14.4765 Sec. 6 -1.55399 2.18930 .478 -5.8502 2.7423 Section 4 Sec. 1 3.38441 2.72823 .215 -1.9694 8.7382 Sec. 2 5.25535 3.17364 .098 -.9725 11.4832 Sec. 3 .62014 1.96174 .752 -3.2295 4.4698 Sec. 5 9.70579(*) 2.74963 .000 4.3100 15.1016 Sec. 6 -.93385 2.19250 .670 -5.2364 3.3687 Section 5 Sec. 1 -6.32139 3.33786 .059 -12.8715 .2288 Sec. 2 -4.45044 3.71081 .231 -11.7325 2.8316 Sec. 3 -9.08565(*) 2.74709 .001 -14.4765 -3.6948 Sec. 4 -9.70579(*) 2.74963 .000 -15.1016 -4.3100 Sec. 6 -10.63964(*) 2.91635 .000 -16.3626 -4.9166 Section 6 Sec. 1 4.31825 2.89618 .136 -1.3651 10.0016 Sec. 2 6.18920 3.31913 .063 -.3242 12.7026 Sec. 3 1.55399 2.18930 .478 -2.7423 5.8502 Sec. 4 .93385 2.19250 .670 -3.3687 5.2364 Sec. 5 10.63964(*) 2.91635 .000 4.9166 16.3626
* The mean difference is significant at the .05 level.
254

Table F.21. Descriptive Statistics for Participation and Performance in Introductory Chemistry
Mean Std. Deviation N Grade 73.7793 16.10442 1231 Student Participation 80.6156 20.77092 1231
Student Performance 153.3541 40.41287 1231
Table F.22. Correlations for Participation and Performance in Introductory Chemistry
Grade Parttotal HomeDisc Grade 1.000 .763 .784 Student Participation .763 1.000 .970
Pearson Correlation
Student Performance .784 .970 1.000
Grade . .000 .000 Student Participation .000 . .000
Sig. (1-tailed)
Student Performance .000 .000 .
Grade 1231 1231 1231 Student Participation 1231 1231 1231
N
Student Performance 1231 1231 1231
Table F.23. Model Summary for Participation and Performance in Introductory Chemistry
Model R R2 Adjusted R2 Std. Error of the
Estimate 1 .784(a) .615 .614 10.00609
Change Statistics R2
Change F Change df1 df2 Sig. F Change
.615
979.075 2 1228 .000
255
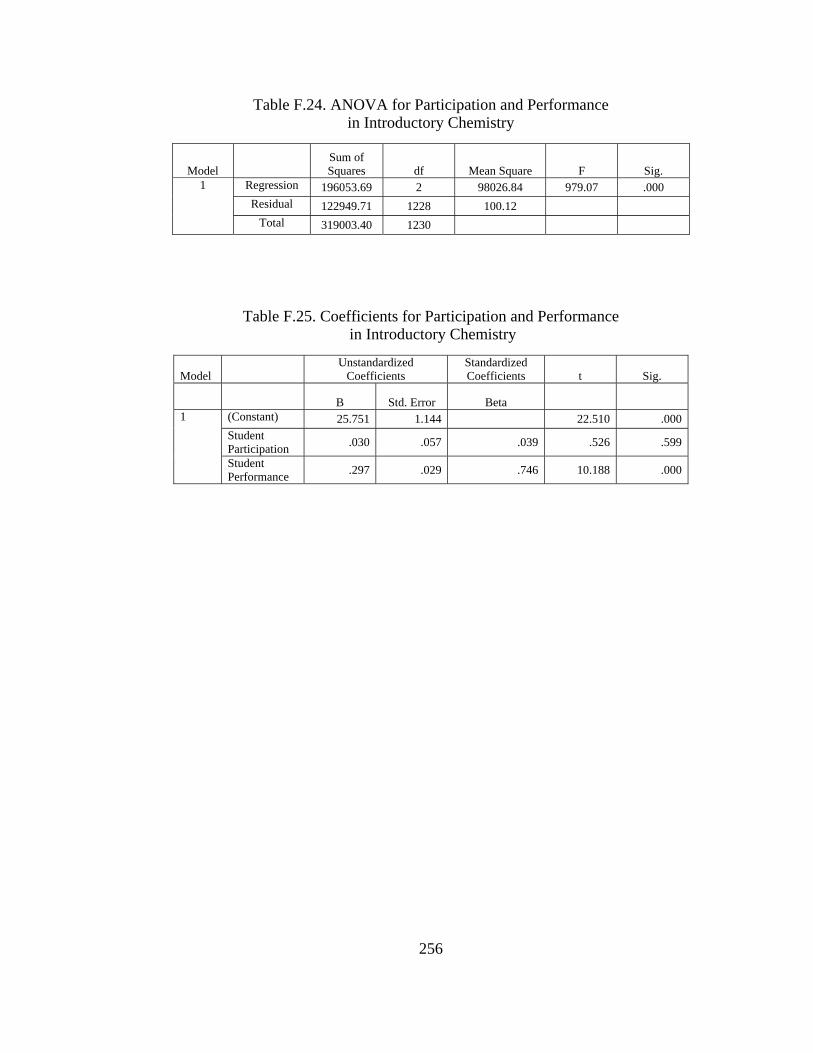
Table F.24. ANOVA for Participation and Performance in Introductory Chemistry
Model Sum of Squares df Mean Square F Sig.
Regression 196053.69 2 98026.84 979.07 .000 Residual 122949.71 1228 100.12
1
Total 319003.40 1230
Table F.25. Coefficients for Participation and Performance in Introductory Chemistry
Model Unstandardized
Coefficients Standardized Coefficients t Sig.
B Std. Error Beta 1 (Constant) 25.751 1.144 22.510 .000 Student
Participation .030 .057 .039 .526 .599
Student Performance .297 .029 .746 10.188 .000
256

Table F.26. Descriptive Statistics for Participation and Performance in Practice Exam Groups in Introductory Chemistry
Mean Std. Deviation N Grade 73.6512 16.35510 734 Student Participation 80.4982 20.58958 734
Student Performance 153.6563 39.52794 734
Table F.27. Correlations for Participation and Performance in Practice Exam Groups in Introductory Chemistry
Grade Parttotal HomeDisc Grade 1.000 .780 .796 Student Participation l .780 1.000 .971
Pearson Correlation
Student Performance .796 .971 1.000
Grade . .000 .000 Student Participation .000 . .000
Sig. (1-tailed)
Student Performance .000 .000 .
Grade 734 734 734 Student Participation 734 734 734
N
Student Performance 734 734 734
Table F.28. Model Summary for Participation and Performance in Practice Exam Groups in Introductory Chemistry
Model R R2 Adjusted R2 Std. Error of the
Estimate 1 .796 .634 .633 9.90312
Change Statistics
R2 Change F Change df1 df2 Sig. F Change
.634
634.123 2 731 .000
257

Table F.29.ANOVA for Participation and Performance in
Practice Exam Groups in Introductory Chemistry
Model Sum of Squares df Mean Square F Sig.
Regression 124379.205 2 62189.603 634.123 .000(a)Residual 71690.488 731 98.072
1
Total 196069.694 733
Table F.30. Coefficients for Participation and Performance in Practice Exam Groups in Introductory Chemistry
Model Unstandardized
Coefficients Standardized Coefficients t Sig.
B Std. Error Beta 1 (Constant) 22.771 1.483 15.357 .000 Student
Participation .099 .074 .124 1.341 .180
Student Performance .279 .038 .675 7.277 .000
258

Table F.31. Descriptive Statistics for Participation and Performance in Peer Led Team Learning in Introductory Chemistry
Mean Std. Deviation N Grade 75.3728 15.61013 224 Student Participation 78.6259 19.23779 224
Student Performance 157.2107 38.45772 224
Table F.32. Correlations for Participation and Performance in Peer Led Team Learning in Introductory Chemistry
Grade Parttotal HomeDisc
Grade 1.000 .796 .796 Student Participation .796 1.000 1.000
Pearson Correlation
Student Performance .796 1.000 1.000
Grade . .000 .000 Student Participation .000 . .000
Sig. (1-tailed)
Student Performance .000 .000 .
Grade 224 224 224 Student Participation 224 224 224
N
Student Performance 224 224 224
Table F.33. Model Summary for Participation and Performance in Peer Led Team Learning in Introductory Chemistry
Model R R2 Adjusted R2 Std. Error of the
Estimate 1 .796 .634 .632 9.94646
Change Statistics
R2 Change F Change df1 df2 Sig. F Change
.634
384.615 1 222 .000
259

Table F.34. ANOVA for Participation and Performance in Peer Led Team Learning in Introductory Chemistry
Model Sum of Squares df Mean Square F Sig.
Regression 34453.328 1 34453.328 384.615 .000(a)Residual 19886.456 222 89.579
1
Total 54339.784 223
Table F.35. Coefficients for Participation and Performance in Peer Led Team Learning in Introductory Chemistry
Model Unstandardized
Coefficients Standardized Coefficients t Sig.
B Std. Error Beta 1 (Constant) 24.561 2.667 9.210 .000 Student
Performance .323 .016 .796 19.612 .000
Table F.36. Excluded Variables for Participation and Performance in Peer Led Team Learning in Introductory Chemistry
Model Beta In t Sig. Partial
Correlation 1 Student
Participation 17.747(a) .632 .528 .042
260

Table F.37. Descriptive Statistics for Participation and Performance in Learn Star in Introductory Chemistry
Mean Std. Deviation N Grade 72.8161 15.78344 273 Student Participation 82.5641 22.31584 273
Student Performance 149.3773 43.97619 273
Table F.38. Correlations for Participation and Performance in Learn Star in Introductory Chemistry
Grade Parttotal HomeDisc
Grade 1.000 .724 .749 Student Participation .724 1.000 .981
Pearson Correlation
Student Performance .749 .981 1.000
Grade . .000 .000 Student Participation .000 . .000
Sig. (1-tailed)
Student Performance .000 .000 .
Grade 273 273 273 Student Participation 273 273 273
N
Student Performance 273 273 273
Table F.39. Model Summary for Participation and Performance in Learn Star in Introductory Chemistry
Model R R2 Adjusted R2 Std. Error of the
Estimate 1 .751 .564 .560 10.46381
Change Statistics
R2 Change F Change df1 df2 Sig. F Change
.564
174.430 2 270 .000
261
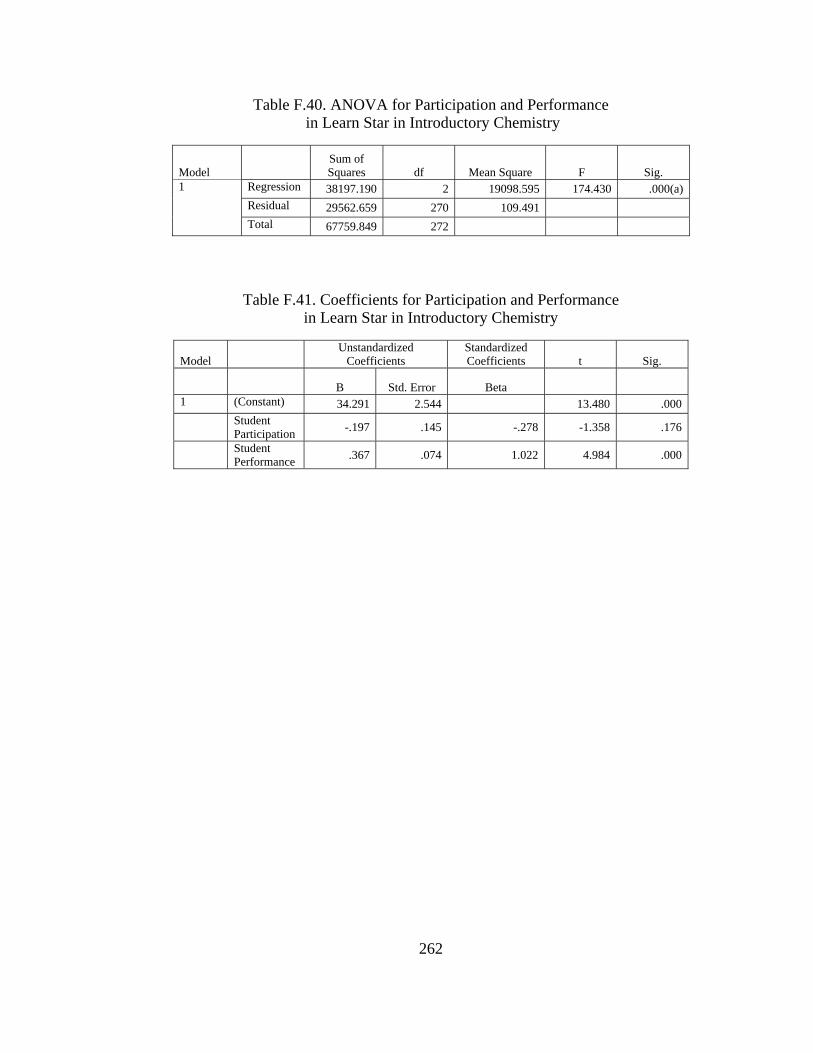
Table F.40. ANOVA for Participation and Performance in Learn Star in Introductory Chemistry
Model Sum of Squares df Mean Square F Sig.
Regression 38197.190 2 19098.595 174.430 .000(a)Residual 29562.659 270 109.491
1
Total 67759.849 272
Table F.41. Coefficients for Participation and Performance in Learn Star in Introductory Chemistry
Model Unstandardized
Coefficients Standardized Coefficients t Sig.
B Std. Error Beta 1 (Constant) 34.291 2.544 13.480 .000 Student
Participation -.197 .145 -.278 -1.358 .176
Student Performance .367 .074 1.022 4.984 .000
262