Perfluorinated chemicals in blood of residents in Catalonia (Spain) in relation to age and gender: A...
8
Perfluorinated chemicals in blood of residents in Catalonia (Spain) in relation to age and gender: A pilot study Ingrid Ericson a , Mercedes Gómez b , Martí Nadal b , Bert van Bavel a , Gunilla Lindström a , José L. Domingo b, ⁎ a Man-Technology-Environment (MTM) Research Center, Department of Natural Sciences, Örebro University, SE-701 82 Örebro, Sweden b Laboratory of Toxicology and Environmental Health, School of Medicine, “Rovira i Virgili” University, San Lorenzo 21, 43201 Reus, Spain Received 16 October 2006; accepted 3 January 2007 Available online 6 February 2007 Abstract Fluorinated organic compounds (FOCs) are a group of chemicals widely used as surfactants, lubricants, polymers, and fire-fighting foams. Recent studies have shown the ubiquitous distribution of FOCs in the environment, wildlife, and humans. We here report the results of a pilot study conducted to provide preliminary data on the levels of 13 FOCs in the blood of 48 residents in Catalonia, Spain, in relation to gender and age (25 ± 5 and 55 ± 5 years). The highest mean concentration was obtained for perfluorooctane sulfonate (PFOS, 7.64 ng/ml), followed by perfluorohexane sulfonate (PFHxS, 3.56 ng/ml) and perfluorooctanoic acid (PFOA, 1.80 ng/ml). Four other FOCs showed mean levels between 0.30 and 0.44 ng/ml, whereas those of the remaining 6 compounds were below the detection limit. Regarding gender, the blood levels of PFHxS and PFOA were significantly higher ( p b 0.05) in men than in women, while differences according to age were only noted for PFHxS ( p b 0.05) and perfluorooctane sulfonamide (PFOSA) ( p b 0.001), for which the levels were higher in the younger (25 ± 5 years) group of subjects. A significant correlation between PFOS levels and those of the remaining detected FOCs (except PFDA) was found. In general terms, the current FOC concentrations were lower than those found in recent studies concerning levels of these chemicals in human blood and serum of subjects from different countries. © 2007 Elsevier Ltd. All rights reserved. Keywords: Perfluorinated compounds; Biomonitoring; Whole blood; General population 1. Introduction Fluorinated organic compounds (FOCs) form a diverse group of chemicals with surface-active properties, which have been manufactured for over 50 years. Because of their unique properties of repelling both water and oil, FOCs have been widely used as surfactants and surface protectors in carpets, leather, paper, food containers, fabric, and upholstery (US EPA, 2000; Giesy and Kannan, 2002; Beach et al., 2006). These compounds have also been used in fire-fighting-foams, floor polishes, and shampoos (US EPA, 2000). Although FOCs have been manufactured for over 50 years, research investigating the potential toxicity and the environmental fate of these chemicals has been quantitatively less important than that concerning chlorinated and brominated organic compounds. Because much of the FOCs were incorporated into polymers, they were perceived as more biologically inert and therefore, less likely to have an impact on human health or the environment (Giesy and Kannan, 2001). Among the different classes of FOCs, in recent years perfluorooctanesulfonate (PFOS) and perfluorooctanoic acid (PFOA), especially PFOS, have received worldwide attention, being the subject of a number of investigations. PFOS is the end product of degradation of various sulfonated fluorochemicals. It is stable in the environment and resists hydrolysis, photolysis and biodegradation, and it has been widely found in environ- mental samples and wildlife tissues (Giesy and Kannan, 2001, 2002; Kannan et al., 2001; 2002; Taniyasu et al., 2003; Martin et al., 2004; So et al., 2004; Holmström et al., 2005). PFOA, as well as other FOCs such as perfluorhexanesulfonate (PFHS), or perfluorooctanesulfonamide (PFOSA) has also been found in Environment International 33 (2007) 616 – 623 www.elsevier.com/locate/envint ⁎ Corresponding author. Tel.: +34 977 759380; fax: +34 977 759322. E-mail address: [email protected] (J.L. Domingo). 0160-4120/$ - see front matter © 2007 Elsevier Ltd. All rights reserved. doi:10.1016/j.envint.2007.01.003
-
Upload
independent -
Category
Documents
-
view
3 -
download
0
Transcript of Perfluorinated chemicals in blood of residents in Catalonia (Spain) in relation to age and gender: A...

07) 616–623www.elsevier.com/locate/envint
Environment International 33 (20
Perfluorinated chemicals in blood of residents in Catalonia (Spain) in relationto age and gender: A pilot study
Ingrid Ericson a, Mercedes Gómez b, Martí Nadal b, Bert van Bavel a,Gunilla Lindström a, José L. Domingo b,⁎
a Man-Technology-Environment (MTM) Research Center, Department of Natural Sciences, Örebro University, SE-701 82 Örebro, Swedenb Laboratory of Toxicology and Environmental Health, School of Medicine, “Rovira i Virgili” University, San Lorenzo 21, 43201 Reus, Spain
Received 16 October 2006; accepted 3 January 2007Available online 6 February 2007
Abstract
Fluorinated organic compounds (FOCs) are a group of chemicals widely used as surfactants, lubricants, polymers, and fire-fighting foams.Recent studies have shown the ubiquitous distribution of FOCs in the environment, wildlife, and humans. We here report the results of a pilotstudy conducted to provide preliminary data on the levels of 13 FOCs in the blood of 48 residents in Catalonia, Spain, in relation to gender and age(25±5 and 55±5 years). The highest mean concentration was obtained for perfluorooctane sulfonate (PFOS, 7.64 ng/ml), followed byperfluorohexane sulfonate (PFHxS, 3.56 ng/ml) and perfluorooctanoic acid (PFOA, 1.80 ng/ml). Four other FOCs showed mean levels between0.30 and 0.44 ng/ml, whereas those of the remaining 6 compounds were below the detection limit. Regarding gender, the blood levels of PFHxSand PFOA were significantly higher ( pb0.05) in men than in women, while differences according to age were only noted for PFHxS ( pb0.05)and perfluorooctane sulfonamide (PFOSA) ( pb0.001), for which the levels were higher in the younger (25±5 years) group of subjects. Asignificant correlation between PFOS levels and those of the remaining detected FOCs (except PFDA) was found. In general terms, the currentFOC concentrations were lower than those found in recent studies concerning levels of these chemicals in human blood and serum of subjectsfrom different countries.© 2007 Elsevier Ltd. All rights reserved.
Keywords: Perfluorinated compounds; Biomonitoring; Whole blood; General population
1. Introduction
Fluorinated organic compounds (FOCs) form a diverse groupof chemicals with surface-active properties, which have beenmanufactured for over 50 years. Because of their uniqueproperties of repelling both water and oil, FOCs have beenwidely used as surfactants and surface protectors in carpets,leather, paper, food containers, fabric, and upholstery (US EPA,2000; Giesy and Kannan, 2002; Beach et al., 2006). Thesecompounds have also been used in fire-fighting-foams, floorpolishes, and shampoos (US EPA, 2000). Although FOCs havebeen manufactured for over 50 years, research investigating thepotential toxicity and the environmental fate of these chemicalshas been quantitatively less important than that concerning
⁎ Corresponding author. Tel.: +34 977 759380; fax: +34 977 759322.E-mail address: [email protected] (J.L. Domingo).
0160-4120/$ - see front matter © 2007 Elsevier Ltd. All rights reserved.doi:10.1016/j.envint.2007.01.003
chlorinated and brominated organic compounds. Because muchof the FOCs were incorporated into polymers, they wereperceived as more biologically inert and therefore, less likely tohave an impact on human health or the environment (Giesy andKannan, 2001).
Among the different classes of FOCs, in recent yearsperfluorooctanesulfonate (PFOS) and perfluorooctanoic acid(PFOA), especially PFOS, have received worldwide attention,being the subject of a number of investigations. PFOS is the endproduct of degradation of various sulfonated fluorochemicals. Itis stable in the environment and resists hydrolysis, photolysisand biodegradation, and it has been widely found in environ-mental samples and wildlife tissues (Giesy and Kannan, 2001,2002; Kannan et al., 2001; 2002; Taniyasu et al., 2003; Martinet al., 2004; So et al., 2004; Holmström et al., 2005). PFOA, aswell as other FOCs such as perfluorhexanesulfonate (PFHS), orperfluorooctanesulfonamide (PFOSA) has also been found in

617I. Ericson et al. / Environment International 33 (2007) 616–623
the environment, although at lower concentrations and frequen-cies than those of PFOS (Kannan et al., 2005). The environ-mental persistence, the potential for long-term environmentaleffects, as well as the finding of PFOS in blood of non-occupationally exposed humans, raised a notable concern aboutPFOS and related compounds (US EPA, 2000). As a directconsequence, the main producer of PFOS-derived chemicals,3M Company (USA), announced in May 2000 that they wouldphase out the production of these substances, which ceased at theend of 2002 (Lau et al., 2003). However, other markets stillcontinue with the production, whereas PFOA remains also inproduction by other manufacturers.
Studies concerning toxicity of FOCs in mammals have beenmainly focused on PFOS and PFOA. The toxic potentials of thesecompounds were recently reviewed (3M, 2003; Kennedy et al.,2004). Subchronic exposure to PFOS led to effects on cell-to-cellcommunication and cellular energetic metabolism, disruptingmitochondrial metabolism, and inducing peroxisomal prolifera-tion (Berthiaume and Wallace, 2002). In turn, PFOA has thepotential to induce peroxisomal β-oxidation in the liver of malerats (Berthiaume andWallace, 2002; Lau et al., 2004). Moreover,developmental toxicity of both PFOS and PFOA has beendescribed in rodent models (Lau et al., 2004; Fuentes et al., 2006).
Although accumulation and trends of FOCs are largely un-known, it is evident that unlike the classical more lipophilicpersistent organic pollutants such as dioxins and furans (PCDD/PCDFs), or PCBs, FOCs do not typically accumulate in lipids. Inhumans, exposure levels and pathways leading to the presence ofFOCs can be better characterized by monitoring these chemicalsin blood. In recent years, information concerning the levels ofvarious FOCs in human blood has been reported for a number ofcountries (Kannan et al., 2004; Calafat et al., 2006a,b; Kärrmanet al., 2006a,b; Harada et al., 2007; Yeung et al., 2006). Thepresent study has been the first monitoring survey of FOCs in aSpanish population. The aim of this investigation was todetermine the levels and prevalence of 13 FOCs in whole bloodof residents in Catalonia (NE Spain). The results were comparedwith those previously reported in other countries. The influenceof age and gender on the blood levels of FOCs was also assessed.
Table 1Perfluorinated chemicals included in the selected ion monitoring method including
Compound Abbreviation Molecular fo
Perfluorobutanesulfonate PFBuS C4F9SO3−
Perflurohexanesulfonate PFHxS C6F13SO3−
Perfluorooctanesulfonate PFOS C8F17SO3−
13C4-perfluorooctanesulfonate13C4-PFOS 1,2,3,4-13C-C
1H,1H,2H,2H-perfluorooctanesulfonic acid THPFOS C8F13H4SO3
Perfluorodecanesulfonate PFDS C10F21SO3−
Perfluorohexanoic acid PFHxA C5F11CO2HPerfluoroheptanoic acid PFHpA C6F13CO2HPerfluorooctanoic acid PFOA C7F15CO2H13C4-perfluorooctanoic acid
13C4-PFOA 1,2,3,4-13C-CPerfluorononanoic acid PFNA C8F17CO2H13C5-perfluorononanoic acid
13C5-PFNA 1,2,3,4,5-13CPerfluorodecanoic acid PFDA C9F19CO2HPerfluoroundecanoic acid PFUnDA C10F21CO2HPerfluorotetradecanoic acid PFTDA C13F27CO2HPerfluorooctanesulfonamide PFOSA C8F17SO2NH
2. Materials and methods
2.1. Sampling
Forty-eight samples of whole blood corresponding to healthy adult indi-viduals living in Tarragona County (Catalonia, Spain) for at least the last 5 years,were obtained from out-patient departments of the Hospital “Joan XXIII”(Tarragona). All participants were over 20 years old. Twenty-four men and 24women were included in the study. Each gender group was divided into twosubgroups according to age: 25±5 and 55±5 years. Sampling period was May2006. Blood samples of about 5 ml were collected (in EDTA) from each subjectby venipuncture and kept into thoroughly cleaned polypropylene (PP) tubes. ThePP tubes and their tops were previously rinsed with methanol. All samples wereimmediately frozen at −20 °C until analyzed.
2.2. Chemicals
Ammonium acetate (N99%, p.a. for HPLC) was purchased from Fluka(Steinheim, Germany), formic acid (98–100%) from Scharlau (Barcelona, Spain),and methanol (HPLC) from Labscan (Dublin, Ireland). Laboratory produced ultrapure water was used. Ammonium hydroxide (25% in water) and sodium acetatewere purchased from E.Merck (Darmstadt, Germany). Perfluorobutane sulfonates(PFBuS) tetrabutylammonium salt (N98%), perfluorooctane sulfonates (PFOS)potassium salt (N98%), perfluorodecanoic acid (PFDA, N97%), and perfluor-ohexanoic acid (PFHxA N97%) were purchased from Fluka. Perfluoroheptanoicacid (PFHpA, 99%), perfluorononanoic acid (PFNA, 97%) perfluorooctanoic acid(PFOA, 96%), perfluorodecane sulfonate (PFDS) ammonium salt (25 wt.% in 2-butoxyethanol (37%) in water), perfluoroundecanoic acid (PFUnDA, 95%), andperfluorotetradecanoic acid (PFTDA, 97%) were purchased from Aldrich(Steinheim, Germany and Milwaukee, WI, USA). Perfluorooctane sulfonamide(PFOSA, 97%) and 7H-PFHpA (98%) were purchased from ABCR (Karlsruhe,Germany). 1H,1H,2H,2H-PFOS (THPFOS, purity unknown), and perfluorohex-ane sulfonates (PFHxS, 98%) were purchased from Interchim (Montlucon,France). 13C4-labeled PFOA, 13C4-labeled PFOS, and 13C5-PFNA were fromWellington Laboratories (Guelph, Ontario, Canada).
2.3. Analyses
Whole blood samples were extracted using weak anion exchange, solid-phase extraction (Waters Oasis® WAX), based on Taniyasu et al. (2005).Extraction standards (13C4-PFOA and 13C4-PFOS) and 2 ml formic acid/water(1:1) were added to 0.5 ml whole blood. The solution was sonicated for 15 minand centrifuged at 30000 ×g for 30 min. The supernatant was extracted on aWAXcolumn (200mg/2ml) previously conditionedwith 2mlmethanol and 2mlwater. FOCs were eluted with 1 ml 2% ammonium hydroxide in methanol, afterwashing the column with 2 ml 40% methanol. Extracts were filtered using a
quantification ion and fragmentation
rmula Quantification ion (m/z) Fragmentation voltage (V)
299 95399 130499 150
4F17SO3− 503 150
H 427 110599 150269 65319 70369 75
3F15CO2H 372 75419 75
-C3F17CO2H 423 75469 83519 85669 93
2 498 113

Table 2Individual concentrations (ng/ml) of 13 perfluorinated chemicals in whole blood of subjects living in Tarragona County (Catalonia, Spain)
ID Sex Age PFBuS PFHxA PFHpA PFHxS THPFOS PFOA PFNA PFOS PFOSA PFDA PFUnDA PFDS PFTDA
1 Male 26 ND ND ND 3.68 ND 1.58 ND 11.6 0.36 ND ND ND ND2 Male 25 ND ND ND 3.33 ND 1.09 ND 4.36 0.34 ND ND ND ND3 Male 24 ND ND ND 6.58 ND 1.48 ND 3.68 0.25 ND ND ND ND4 Male 23 ND ND ND 1.05 ND 1.06 ND 0.88 ND ND ND ND ND5 Male 23 ND ND ND 3.93 ND 1.84 ND 7.40 0.32 ND ND ND ND6 Male 27 ND ND ND 7.29 ND 3.13 0.72 8.15 ND 0.7 ND ND ND7 Male 28 ND ND ND 5.94 ND 2.27 0.68 13.9 0.78 0.71 0.78 ND ND8 Male 23 ND ND ND 3.24 ND 1.76 0.43 9.04 0.26 ND ND ND ND9 Male 23 ND ND ND 7.14 ND 1.02 ND 10.8 0.32 ND ND ND ND10 Male 24 ND ND ND 20.0 ND 2.33 ND 16.2 0.53 ND ND ND ND11 Male 22 ND ND ND 5.27 ND 1.85 ND 8.68 0.29 ND ND ND ND12 Male 20 ND ND ND 5.51 ND 2.35 0.58 6.10 ND ND ND ND ND13 Male 54 ND ND ND 3.32 ND 1.97 ND 8.47 0.53 ND 0.74 ND ND14 Male 56 ND ND ND 2.30 ND 1.27 ND 5.73 0.46 ND ND ND ND15 Male 56 ND ND ND 2.03 ND 1.56 ND 6.85 0.88 ND ND ND ND16 Male 60 ND ND ND 2.89 ND 3.11 0.81 9.82 0.37 0.71 0.53 ND ND17 Male 57 ND ND ND 1.21 ND 3.06 0.51 2.71 0.20 ND ND ND ND18 Male 57 ND ND ND 1.98 ND 2.72 0.68 11.6 0.29 0.65 0.54 ND ND19 Male 50 ND ND ND 3.47 ND 2.19 0.41 13.4 0.47 ND 0.46 ND ND20 Male 56 ND ND ND 3.28 ND 0.87 ND 4.10 0.23 ND ND ND ND21 Male 50 ND ND ND 3.25 ND 1.76 1.29 7.73 0.64 0.57 0.51 ND ND22 Male 60 ND ND ND 2.63 ND 2.80 ND 6.66 0.33 ND ND ND ND23 Male 51 ND ND ND 7.85 ND 2.93 0.72 13.7 0.77 0.61 0.66 ND ND24 Male 53 ND ND ND 2.77 ND 2.58 0.83 12.0 0.91 ND 0.41 ND ND25 Female 26 ND ND ND 3.85 ND 1.17 0.53 8.84 0.47 ND 0.84 ND ND26 Female 28 ND ND ND 1.12 ND 1.36 ND 0.76 0.23 0.44 ND ND ND27 Female 24 ND ND ND 5.12 ND 2.43 0.52 7.23 0.41 0.62 ND ND ND28 Female 20 ND ND ND 1.70 ND 1.42 0.42 6.62 0.50 ND ND ND ND29 Female 23 ND ND ND 5.16 ND 1.92 0.49 3.03 0.17 ND ND ND ND30 Female 26 ND ND ND 3.08 ND 2.28 0.48 7.21 ND ND 0.40 ND ND31 Female 23 ND ND ND 2.51 ND 0.99 ND 3.34 0.25 ND ND ND ND32 Female 30 ND ND ND 3.48 ND 1.40 0.42 5.04 0.38 ND ND ND ND33 Female 23 ND ND ND 2.33 ND 1.31 ND 2.00 ND ND ND ND ND34 Female 26 ND ND ND 2.41 ND 1.39 ND 6.09 0.39 ND ND ND ND35 Female 27 ND ND ND 4.28 ND 1.57 1.49 9.19 ND ND 0.53 ND ND36 Female 27 ND ND ND 3.74 ND 1.24 0.57 9.24 0.18 ND 0.64 ND ND37 Female 59 ND ND ND 0.65 ND 1.63 0.38 7.74 0.33 ND 0.48 ND ND38 Female 51 ND ND ND 2.44 ND 1.19 ND 9.27 0.61 ND ND ND ND39 Female 52 ND ND ND 1.82 ND 0.99 0.81 3.99 0.32 ND ND ND ND40 Female 52 ND ND ND 1.58 ND 1.23 0.47 5.26 1.10 ND ND ND ND41 Female 55 ND ND ND 1.54 ND 0.79 ND 5.16 0.54 ND ND ND ND42 Female 50 ND ND ND 1.68 ND 2.00 0.64 8.81 0.65 ND 0.50 ND ND43 Female 54 ND ND ND 2.96 ND 1.28 ND 7.47 0.24 ND 0.48 ND ND44 Female 53 ND ND ND 2.84 ND 1.58 0.8 12.0 0.31 ND 0.60 ND ND45 Female 54 ND ND ND 0.99 ND 1.71 ND 7.98 0.42 ND 0.48 ND ND46 Female 59 ND ND ND 2.54 ND 3.09 0.45 9.67 1.35 ND 0.43 ND ND47 Female 54 ND ND ND 1.26 ND 2.03 ND 4.91 0.76 ND ND ND ND48 Female 55 ND ND ND 2.13 ND 1.67 0.49 12.6 0.60 ND 0.60 ND NDLOD 0.73 1.00 0.78 0.14 1.10 0.66 0.41 0.09 0.16 0.48 0.40 0.58 0.44Mean ND ND ND 3.56 ND 1.80 0.44 7.64 0.42 0.30 0.34 ND NDSD – – – 2.97 – 0.66 0.29 3.54 0.27 0.15 0.19 – –Median – – – 2.92 – 1.65 0.41 7.60 0.35 0.24 0.20 – –Min. – – – 0.65 – 0.79 ND 0.76 ND ND ND – –Max. – – – 20.0 – 3.13 1.49 16.2 1.35 0.71 0.84 – –
ND: Not detected.
618 I. Ericson et al. / Environment International 33 (2007) 616–623
0.2 μm PP-filter and the final volume was adjusted to 500 μl. A syringe standard,13C5-PFNA, was immediately added before injection.
Analyses were performed using an Agilent 1100 HPLC system (Agilent,Waldbronn, Germany) coupled to an HP 1100 mass spectrometric detector (MSD,Waldbronn, Germany) with an atmospheric electrospray interface operating innegative ion mode. Separation was performed on a Discovery HS C18 (50 mmlength, 2.1 mm i.d., 3 μm particles, 120 Å pore size) column with a guard column
of the same material (20 mm length, 2.1 mm i.d., 3 μm particles, 120 Å pore size)(Supelco, Bellefonte, PA, USA). Both columns were kept at 40 °C. An extra guardcolumn (HyperCarb graphitic carbon, 4 mm length, 10 mm i.d., 5 μm particle size)(Termo Hypersil-Keystone, Bellefonte, PA, USA) was inserted between the pumpand the injector to remove any fluorochemicals originated from the HPLC system.Injection volume was 10 μl and the flow rate was set to 300 μl/min. The mobilephases consisted of 2 mM ammonium acetate in methanol and 2 mM ammonium

Table 3Mean concentrations (ng/ml) of 13 perfluorinated chemicals in whole blood ofsubjects living in Tarragona County (Catalonia, Spain) classified according totwo age groups
Age 25±5 years Age 55±5 years p
PFBuS ND NDPFHxA ND NDPFHpA ND NDPFHxS 4.65±3.70 2.48±1.39 b0.05THPFOS ND NDPFOA 1.68±0.55 1.92±0.74 NSPFNA 0.41±0.29 0.47±0.30 NSPFOS 7.06±3.86 8.23±3.15 NSPFOSA 0.29±0.18 0.55±0.18 b0.001PFDA 0.30±0.15 0.31±0.15 NSPFUnDA 0.30±0.19 0.39±0.18 NSPFDS ND NDPFTDA ND ND
ND: not detected. NS: not statistically significant ( pN0.05).
Table 4Mean concentrations (ng/ml) of 13 perfluorinated chemicals in whole blood ofsubjects living in Tarragona County (Catalonia, Spain) classified according togender
Men Women p
PFBuS ND NDPFHxA ND NDPFHpA ND NDPFHxS 4.58±3.80 2.55±1.23 b0.05THPFOS ND NDPFOA 2.02±0.71 1.57±0.52 b0.05PFNA 0.43±0.30 0.45±0.29 NSPFOS 8.47±3.90 6.81±2.98 NSPFOSA 0.41±0.24 0.44±0.31 NSPFDA 0.34±0.19 0.26±0.09 NSPFUnDA 0.33±0.19 0.36±0.19 NSPFDS ND NDPFTDA ND ND
ND: not detected. NS: not statistically significant ( pN0.05).
619I. Ericson et al. / Environment International 33 (2007) 616–623
acetate in water. The mobile phase gradient started at 35%methanol followed by a20 min ramp to 90%, a 2 min hold followed by a 3 min washing sequence with100% methanol, and then reverting to initial conditions allowing 7 minstabilization time. The MS settings were as follows: nitrogen nebulizer gastemperature 350 °C, nebulizer gas pressure 20 psi, nitrogen drying gas flow 13 ml/min, and capillary voltage 3500 V. Selected ion monitoring (SIM) was used tomeasure the ions at fragmentation voltage (Table 1).
2.4. Quantification and quality assurance
Quantification was performed using the internal standard method. Standardsdissolved in 35% methanol in water were used to calculate relative responsefactors (RRFs). 13C4-PFOS was used as an extraction standard for the sulfonatesand PFOSA, whereas 13C4-PFOA was used for the carboxylates. The syringestandard, 13C5-PFNA, was used to monitor the recovery of the extractionstandards. Recoveries of 74–111% and 76–102% were achieved for 13C4-PFOAand 13C4-PFOS respectively. Recovery experiments showed similar recoveries forthe extraction standards (84–87%) and the target compounds (86–110%), exceptfor PFOSA. The method validation using 13C-labelled standards has been recentlyreported (Kärrman et al., in press). The limit of detection (LOD)was determined asthree times the signal to noise ratio of the lowest concentration of a 5–7 pointcalibration curve. Procedural blank level trace was found only for PFOA, at aconcentration below the limit of detection. Ion suppression was examined bycalculating the ratio between a standard solution and the same standard solutionadded to extracted blood. All ratios were between 0.94–1.18 indicating no ionenhancement or suppression for all compounds except PFOSA. External qualityassurance was performed by successful participation (z-scores b2) in the 1st and2nd interlaboratory study on perfluorinated chemicals (van Leeuwen et al., inpress).
2.5. Data analysis
Statistical significance of the data was computed by the Student's t test. TheLevene proof was previously executed to determine whether the data followed anormal distribution. A probability of 0.05 or less ( pb0.05) was considered assignificant. Pearson's correlation coefficients were used to evaluate the relation-ships among the analyzed FOCs. Statistical analysis was carried out using theSPSS-12.0 Statistical Software Package.
To establish pattern similarities among the different analyzed FOCs, a self-organizing map (SOM) was applied to the whole blood samples. This is a kind ofunsupervised artificial neural network, originally created by Kohonen (1982).SOM is a powerful “data-mining”-based chemometric tool generally used toclassify large amounts of data (Nadal et al., 2004a). The basis for data treatmentand analysis were recently reported (Ferré-Huguet et al., 2006). The Kohonenneural network consists of two layers: the input layer, connected to a vectorcorresponding to the data set, and the output layer (or map), which is an array of
node (also called neurons). The map can be also divided into so many c-planes(component planes) as data variables, representing the variable contribution toeach node in the map. In the present study, the Kohonen map was a 48 unit(8×6) rectangular grid.
3. Results and discussion
The concentrations of 13 fluorinated organic compounds in wholeblood from subjects living in Tarragona County (Catalonia, Spain) aresummarized in Table 2. Among the 13 FOCs analyzed, sevencompounds were found above the detection limit. However, onlyPFHxS (range: 0.65–19.96 ng/ml), PFOA (range: 0.79–3.13 ng/ml),and PFOS (range: 0.76–16.17 ng/ml) could be detected in all samples.The maximum PFHXs and PFOS levels corresponded to the sameindividual (ID: 10), a 24 years-old male. At the current detection limits,PFNA, PFOSA, PFDA and PFUnDA were only detected in 54.1%,87.5%, 16.6% and 39.6% of the samples, respectively. The highestconcentrations corresponded to PFOS, followed by PFHxS and PFOA.
In recent years, interest in human exposure to FOCs has led to theirmeasurement in whole blood, plasma and serum. Recently, Ehresmanet al. (in press) compared human whole blood, serum, and plasma of 18voluntary participants for the determination of 4 FOCs. The resultscorroborated that whole blood concentrations of PFHS, PFOS, andPFOA are approximately half that of plasma or serum, whereas serumto plasma ratios for PFOS, PFHS and PFOAwere 1:1, being the ratiosindependent of the level of concentrations measured. It was concludedthat successful analysis of FOCs could be performed in any of the threeblood matrices.
Table 3 summarizes the mean concentrations of the 13 FOCs for all48 subjects divided according to two age groups. In general terms, forthe seven detected compounds the FOC levels were higher in the groupof 55±5 years. However, a significant difference was only found forPFOSA ( pb0.001). In contrast, PFHxS concentrations were signifi-cantly higher ( pb0.05) in the group of 25±5 years. On the other hand,the influence of gender on the concentrations of FOCs was alsoexamined (Table 4). Significant differences were only found for PFHxSand PFOA, with males showing higher levels than females ( pb0.05).Although the difference was not statistically significant ( pN0.05),PFOS had a similar behavior. The current findings concerning genderare in agreement with the results reported by Kannan et al. (2004) inhuman blood from several countries. Similarly, no gender-relateddifferences in the concentrations of PFOS and PFOAwere reported by

Fig. 1. Significant correlations found among a series of FOCs. From a to f: pb0.01; from g to j: pb0.05.
620 I. Ericson et al. / Environment International 33 (2007) 616–623
621I. Ericson et al. / Environment International 33 (2007) 616–623
Olsen et al. (2003) in the serum of American Red Cross adult blooddonors. The lack of clear sex-related differences noted in this study isdifferent from the trend observed for lipophilic contaminants such asPCBs, for which concentrations in adult females are usuallysignificantly lower than those found in adult males. Kannan et al.(2004) suggested that it could be due to the transfer of these pollutants tooffspring via parturition and lactation, which would not occur withFOCs. However, in a recent study in which we determined the levels ofPCDD/PCDFs in plasma samples of subjects living in the same area ofthe present survey (Tarragona County), the mean PCDD/PCDFconcentration in females was lower than that found in males.Notwithstanding, the level of statistical significance was not reached(Agramunt et al., 2005). This difference was thought to be due to a lowerPCDD/PCDF dietary intake by females of that area (Llobet et al., 2003).Kannan et al. (2004) suggested that the few (or even the lack of) age-and gender-related accumulation patterns of FOCs in humans might berelated to the affinity of these compounds for lipoproteins rather than forneutral lipids (Luebker et al., 2002).
With respect to the relationships among the seven detected FOCs,Pearson's test showed a significant correlation of PFOS concentrationswith those of PFHxS, PFOA and PFUnDA at pb0.01, and with those ofPFNA and PFOSA at pb0.05. Only PFDA levels were not significantlycorrelated with those of PFOS. Other significant correlations amongFOC levels corresponded to PFOA and PFDA ( pb0.01), PFNA andPFDA ( pb0.01), PFNA and PFUnDA ( pb0.01), PFOA and PFNA( pb0.05), and PFDA and PFUnDA ( pb0.05). The regression analysisof the associations between Pearson's correlated FOC concentrations inblood samples of 48 individuals from Tarragona County is depicted inFig. 1.
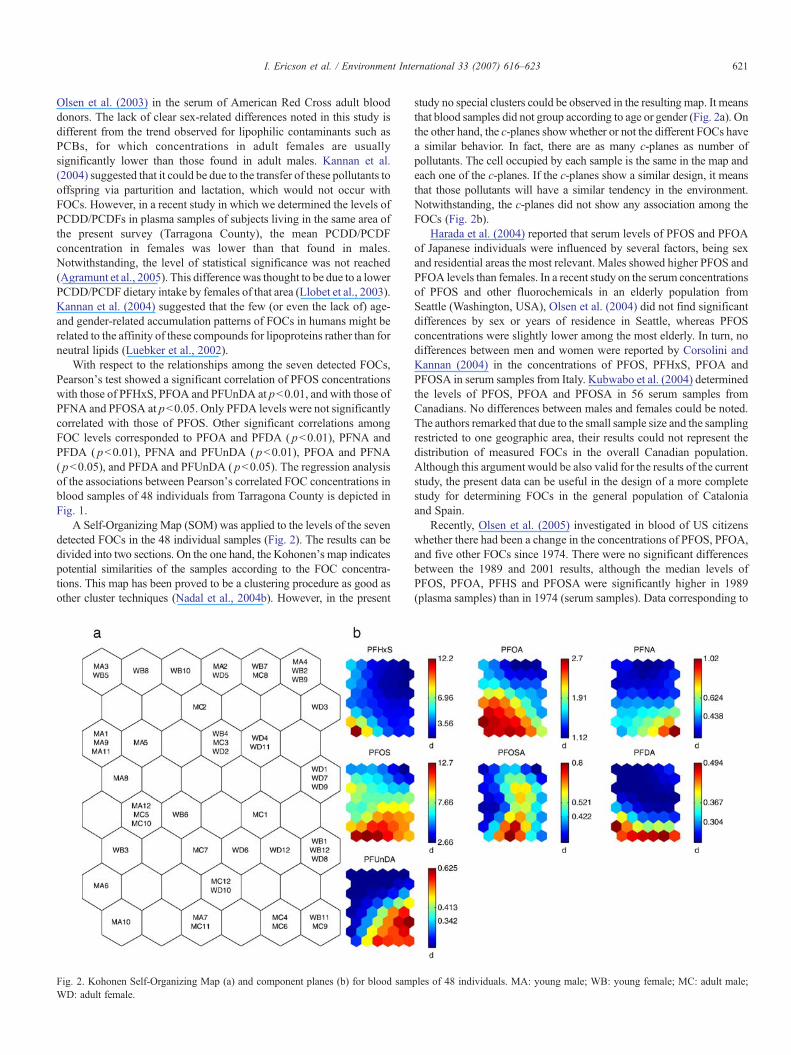
A Self-Organizing Map (SOM) was applied to the levels of the sevendetected FOCs in the 48 individual samples (Fig. 2). The results can bedivided into two sections. On the one hand, the Kohonen's map indicatespotential similarities of the samples according to the FOC concentra-tions. This map has been proved to be a clustering procedure as good asother cluster techniques (Nadal et al., 2004b). However, in the present
Fig. 2. Kohonen Self-Organizing Map (a) and component planes (b) for blood samWD: adult female.
study no special clusters could be observed in the resulting map. It meansthat blood samples did not group according to age or gender (Fig. 2a). Onthe other hand, the c-planes showwhether or not the different FOCs havea similar behavior. In fact, there are as many c-planes as number ofpollutants. The cell occupied by each sample is the same in the map andeach one of the c-planes. If the c-planes show a similar design, it meansthat those pollutants will have a similar tendency in the environment.Notwithstanding, the c-planes did not show any association among theFOCs (Fig. 2b).
Harada et al. (2004) reported that serum levels of PFOS and PFOAof Japanese individuals were influenced by several factors, being sexand residential areas the most relevant. Males showed higher PFOS andPFOA levels than females. In a recent study on the serum concentrationsof PFOS and other fluorochemicals in an elderly population fromSeattle (Washington, USA), Olsen et al. (2004) did not find significantdifferences by sex or years of residence in Seattle, whereas PFOSconcentrations were slightly lower among the most elderly. In turn, nodifferences between men and women were reported by Corsolini andKannan (2004) in the concentrations of PFOS, PFHxS, PFOA andPFOSA in serum samples from Italy. Kubwabo et al. (2004) determinedthe levels of PFOS, PFOA and PFOSA in 56 serum samples fromCanadians. No differences between males and females could be noted.The authors remarked that due to the small sample size and the samplingrestricted to one geographic area, their results could not represent thedistribution of measured FOCs in the overall Canadian population.Although this argument would be also valid for the results of the currentstudy, the present data can be useful in the design of a more completestudy for determining FOCs in the general population of Cataloniaand Spain.
Recently, Olsen et al. (2005) investigated in blood of US citizenswhether there had been a change in the concentrations of PFOS, PFOA,and five other FOCs since 1974. There were no significant differencesbetween the 1989 and 2001 results, although the median levels ofPFOS, PFOA, PFHS and PFOSA were significantly higher in 1989(plasma samples) than in 1974 (serum samples). Data corresponding to
ples of 48 individuals. MA: young male; WB: young female; MC: adult male;

622 I. Ericson et al. / Environment International 33 (2007) 616–623
1974 showed that PFOS and PFHS levels in serum were significantlyhigher in males than in females, which was also noted for 1989 plasmasamples. Concentrations of some FOCs increased with age in both the1974 and 1989 data. The authors indicated that comparison with otherregional data collected in 2001 did not suggest a continued increase inconcentrations since 1989 (Olsen et al., 2005). Guruge et al. (2005)determined concentrations and accumulation of 13 FOCs in humanserum and seminal plasma in urban and rural tea worker populationsfrom Sri Lanka. PFOS, PFHxS, PFUnA, PFDA, PFNA and PFOAweredetected in all serum samples. Although these six compounds, togetherwith PFOSA, were also detected in the current study, there werenotable differences in the results. The mean PFOS and PFOA serumlevels in Sri Lanka were 3.8 and 6.4 ng/ml, respectively. In TarragonaCounty, mean whole blood levels were 7.6 and 1.8 ng/ml, respectively,or presented on a serum basis (by multiplying whole blood con-centrations by a factor of 2) (Kannan et al., 2004), 15.2 (PFOS) and 3.6(PFOA) ng/ml.
During 2006, the results of various studies over the world have beenreported. Calafat et al. (2006a) measured 11 FOCs in 23 pooled serumsamples collected in the USA between 1990 and 2002, and in serumsamples collected in 2003 from 44 residents in Trujillo (Peru). PFOS andPFOA were detected in all the pooled samples with median concentra-tions of 31.1 and 11.6 ng/ml, respectively. The frequencies of detection,and the concentration ranges of FOCs, were much lower in the samplesfrom Peru. The same group (Calafat et al., 2006b) measured the serumconcentrations of PFOS, PFOA, and 8 other FOCs in 54 pooled serumsamples collected from 1832 participants of the 2001–2002 NationalHealth and Nutrition Examination Survey (USA). Participants were12 years of age and older. The pools represented three major racialgroups/ethnicities (non-Hispanic blacks, non-Hispanic whites, andMexican Americans), four age categories (12–19 years, 20–39 years,40–59 years, and 60 years and older), and both genders. Theconcentrations of most FOCs were similar among the four age groups.The authors remarked the importance of conducting research to identifythe environmental sources and pathways of human exposure to FOCs, asdifferent patterns of human exposure were found among the populationgroups examined. On the other hand, Fromme et al. (2007) determinedthe levels of PFOS and PFOA in 356 human plasma samples collectedfrom an adult population in Germany in 2005. Both compounds could bedetected in all samples, being their concentrations significantlycorrelated. Median values were 12.2 and 5.3 ng/ml for PFOS andPFOA, respectively. The authors remarked that their results were inagreement with those of other recent studies in Europe, which aregenerally lower than those corresponding to USA and Canadianpopulations. Our results are also in accordance with these findings. Inanother recent German study, Midasch et al. (2006) determined the levelsof PFOS and PFOA in plasma of 105 non-smokers adults. Median PFOSand PFOA concentrations were respectively 22.3 and 6.8 ng/ml. In 85whole blood samples belonging to subjects living in nine cities (8provinces) from China, Yeung et al. (2006) measured the levels of 10FOCs. Only 3 compounds could not be detected. As in most recentstudies, PFOS showed the highest concentrations (3.72–79.2 ng/ml). Noage-related differences were found in PFOS, PFHxS, PFOA and PFOSA,whereas gender-related differences were noted in PFOS and PFHxS(males had higher levels than females), and in PFUnDA (females hadhigher concentrations thanmales). In turn, in a recent studyKärrman et al.(2006a) determined the levels of various FOCs in 40 pooled samples of3802 Australian subjects. PFOS, PFHxS, PFOA, PFNA and PFOSAcould be detected in all samples. Once more, PFOS was the compoundshowing the highestmean concentration (20.8 ng/ml), followed byPFOA(7.6 ng/ml) and PFHxS (6.2 ng/ml). An increase in PFOS concentrationswith increasing agewas observed in both genders. Themale pool levels of
some of the age groups compared to females were higher for PFOS,PFOA, and PFHxS, while in contrast, PFNA concentrations were higherin female pools. The same research group measured also the levels of 12FOCs in whole blood samples from Sweden. The median PFOS andPFOA concentrations were 17.1 and 2.5 ng/ml (Kärrman et al., 2006b).These authors noted that Swedish residents were exposed to a largenumber of FOCs to the same extent than in the countries where data arecurrently available. However, in contrast to the results of Ehresman et al.(in press), it was indicated that the comparison of FOC levels determinedin plasma with those measured in whole blood should be made withcaution, as plasma/whole blood ratios between 1.1. and 1.4 were foundfor 4 FOCs, and a ratio of 0.2 was found for PFOSA (Kärrman et al.,2006b). Recently, Harada et al. (2007) measured the PFOS and PFOAconcentrations in historically recorded human serum samples collected inKyoto and other 10 locations throughout Japan. The historical samplescollected from 1983 to 1999 demonstrated that the PFOA concentrationsin males and females from Kyoto increased 4.4-fold and 4.3-fold at a rateof increase of 0.49 ng/ml/year and 0.42 ng/ml/year, respectively. Incontrast, serum concentrations of PFOS reached a plateau in the late1980s. As in our study inwhole blood, the serum concentrations of PFOSand PFOAwere higher in males than in females.
The present study was not intended as an epidemiologicalinvestigation, but rather its purpose was to use whole blood as a matrixto evaluate the body burden of various FOCs in a non-occupationallyexposed population of Catalonia. We found that the current FOC levelsare similar or even lower than the concentrations of FOCs recentlyreported for those European countries for which currently data areavailable. As with other European studies, FOC concentrations arelower than those corresponding to North America.
Acknowledgement
This study was supported by the Direcció General de SalutPública, Departament de Salut, Generalitat de Catalunya, Spain.
References
3MCompany. Health and environmental assessment of perfluorooctane sulfonicacid and its salts. St. Paul, MN: 3M Company; 2003. US EPA docket AR-226-1486.
Agramunt MC, Schuhmacher M, Hernandez JM, Domingo JL. Levels of dioxinsand furans in plasma of nonoccupationally exposed subjects living near ahazardous waste incinerator. J Expo Anal Environ Epidemiol 2005;15:29–34.
Beach SA, Newsted JL, Coady K, Giesy JP. Ecotoxicological evaluation ofperfluorooctanesulfonate (PFOS). Rev Environ Contam Toxicol 2006;186:133–74.
Berthiaume J, Wallace KB. Perfluorooctanoate, perflourooctanesulfonate, andN-ethyl perfluorooctanesulfonamido ethanol; peroxisome proliferation andmitochondrial biogenesis. Toxicol Lett 2002;129:23–32.
Calafat AM, Needham LL, Kuklenyik Z, Reidy JA, Tully JS, Aguilar-VillalobosM, et al. Perfluorinated chemicals in selected residents of the Americancontinent. Chemosphere 2006a;63:490–6.
Calafat AM, Kuklenyik Z, Caudill SP, Reidy JA, Needham LL. Perfluor-ochemicals in pooled serum samples from United States residents in 2001and 2002. Environ Sci Technol 2006b;40:2128–34.
Corsolini S, Kannan K. Perfluorooctanesulfonate and related flurochemicals inseveral organisms including humans from Italy. Organohalog. Compd.2004;66: 4079–85.
Ehresman DJ, Froehlich JW, Olsen GW, Chang SC, Butenhoff J.L. Comparisonof human whole blood, plasma, and serum matrices for the determination ofperfluorooctanesulfonate (PFOS), perfluorooctanoate (PFOA), and otherfluorochemicals. Environ Res (in press).
Ferré-Huguet N, Nadal M, Schuhmacher M, Domingo JL. Environmentalimpact and human health risks of polychlorinated dibenzo-p-dioxins and

623I. Ericson et al. / Environment International 33 (2007) 616–623
dibenzofurans in the vicinity of a new hazardous waste incinerator: a casestudy. Environ Sci Technol 2006;40:61–6.
Fromme H, Midasch O, Twardella D, Angerer J, Boehmer S, Liebl B.Occurrence of perfluorinated substances in an adult German population insouthern Bavaria. Int Arch Occup Environ Health 2007;80:313–9.
Fuentes S, Colomina MT, Rodriguez J, Vicens P, Domingo JL. Interactions indevelopmental toxicology: concurrent exposure to perfluorooctane sulfonate(PFOS) and stress in pregnant mice. Toxicol Lett 2006;164:81–9.
Giesy JP, Kannan K. Global distribution of perfluorooctane sulfonate in wildlife.Environ Sci Technol 2001;35:1339–42.
Giesy JP, Kannan K. Perfluorochemical surfactants in the environment. EnvironSci Technol 2002;36:146A–52A.
Guruge KS, Taniyasu S, Yamashita N, Wijeratna S, Mohotti KM, SeneviratneHR, et al. Perfluorinated organic compounds in human blood serum andseminal plasma: a study of urban and rural tea worker populations in SriLanka. J Environ Monit 2005;7:371–7.
Harada K, Saito N, Inoue K, Yoshinaga T, Watanabe T, Sasaki S, et al. Theinfluence of time, sex and geographic factors on levels of perfluorooctanesulfonate and perfluorooctanoate in human serum over the last 25 years.J Occup Health 2004;46:141–7.
Harada K, Koizumi A, Saito N, Inoue K, Yoshinaga T, Date C, et al. Historicaland geographical aspects of the increasing perfluorooctanoate and perfluor-ooctane sulfonate contamination in human serum in Japan. Chemosphere2007;66:193–301.
Holmström KE, Jarnberg U, Bignert A. Temporal trends of PFOS and PFOA inguillemot eggs from the Baltic Sea, 1968–2003. Environ Sci Technol2005;39:80–4.
Kannan K, Franson JC, Bowerman WW, Hansen KJ, Jones PD, Giesy JP.Perfluorooctane sulfonate in fish-eating water birds including bald eaglesand albatrosses. Environ Sci Technol 2001;35:3065–70.
Kannan K, Corsolini S, Falandysz J, Oehme G, Focardi S, Giesy JP.Perfluorooctanesulfonate and related fluorinated hydrocarbons in marinemammals, fishes, and birds from coasts of the Baltic and the MediterraneanSeas. Environ Sci Technol 2002;36:3210–6.
KannanK, Corsolini S, Falandysz J, FillmannG,KumarKS,LoganathanBG, et al.Perfluorooctanesulfonate and related fluorochemicals in human blood fromseveral countries. Environ Sci Technol 2004;38:4489–95.
Kannan K, Tao L, Sinclair E, Pastva SD, Jude DJ, Giesy JP. Perfluorinatedcompounds in aquatic organisms at various trophic levels in a Great Lakesfood chain. Arch Environ Contam Toxicol 2005;48:559–66.
Kärrman A,Mueller JF, van Bavel B, Harden F, Toms LM, LindstromG. Levels of12 perfluorinated chemicals in pooled Australian serum, collected 2002–2003,in relation to age, gender, and region. Environ Sci Technol 2006a;40:3742–8.
Kärrman A, van Bavel B, Jarnberg U, Hardell L, Lindstrom G. Perfluorinatedchemicals in relation to other persistent organic pollutants in human blood.Chemosphere 2006b;64:1582–91.
Kärrman A, Ericson I, van Bavel B, Darnerud P-O, Aune A, Glynn A, Lignell S,Lindström G. Exposure to perfluorinated chemicals through lactation —matched human milk and serum levels and a temporal trend, 1996–2004, inSweden. Environ Health Perspect (in press).
Kennedy Jr GL, Butenhoff JL, Olsen GW, O'Connor JC, Seacat AM, Perkins RG,et al. The toxicology of perfluorooctanoate. Crit Rev Toxicol 2004;34:351–84.
Kohonen T. Self-organizing formation of topologically correct feature maps.Biol Cybern 1982;43:59–69.
Kubwabo C, Vais N, Benoit FM. A pilot study on the determination ofperfluorooctanesulfonate and other perfluorinated compounds in blood ofCanadians. J Environ Monit 2004;6:540–5.
Lau C, Thibodeaux JR, Hanson RG, Rogers JM, Grey BE, Stanton ME, et al.Exposure to perfluorooctane sulfonate during pregnancy in rat and mouse.II: postnatal evaluation. Toxicol Sci 2003;74:382–92.
Lau C, Butenhoff JL, Rogers JM. The developmental toxicity of perfluoroalkylacids and their derivatives. Toxicol Appl Pharmacol 2004;198:231–41.
Llobet JM, Domingo JL, Bocio A, Casas C, Teixidó A, Müller L. Humanexposure to dioxins through the diet in Catalonia, Spain: carcinogenic andnon-carcinogenic risk. Chemosphere 2003;50:1193–200.
Luebker DJ, Hansen KJ, Bass NM, Butenhoff JL, Seacat AM. Interactions offluorochemicals with rat liver fatty acid-binding protein. Toxicology 2002;176:175–85.
Martin JW, Whittle DM, Muir DC, Mabury SA. Perfluoroalkyl contaminants ina food web from Lake Ontario. Environ Sci Technol 2004;38:5379–85.
Midasch O, Schettgen T, Angerer J. Pilot study on the perfluorooctanesulfonateand perfluorooctanoate exposure of the German general population. Int JHyg Environ Health 2006;209:489–96.
Nadal M, Schuhmacher M, Domingo JL. Metal pollution of soils and vegetationin an area with petrochemical industry. Sci Total Environ 2004a;321:59–69.
Nadal M, Espinosa G, Schuhmacher M, Domingo JL. Patterns of PCDDs andPCDFs in human milk and food and their characterization by artificial neuralnetworks. Chemosphere 2004b;54:1375–82.
Olsen GW, Church TR, Miller JP, Burris JM, Hansen KJ, Lundberg JK, et al.Perfluorooctanesulfonate and other fluorochemicals in the serum of AmericanRed Cross adult blood donors. Environ Health Perspect 2003;111:1892–901.
Olsen GW, Church TR, Larson EB, van Belle G, Lundberg JK, Hansen KJ, et al.Serum concentrations of perfluorooctanesulfonate and other fluorochemicalsin an elderly population from Seattle, Washington. Chemosphere 2004;54:1599–611.
Olsen GW, Huang HY, Helzlsouer KJ, Hansen KJ, Butenhoff JL, Mandel JH.Historical comparison of perfluorooctanesulfonate, perfluorooctanoate, andother fluorochemicals in human blood. Environ Health Perspect 2005;113:539–45.
So MK, Taniyasu S, Yamashita N, Giesy JP, Zheng J, Fang Z, et al.Perfluorinated compounds in coastal waters of Hong Kong, South China,and Korea. Environ Sci Technol 2004;38:4056–63.
Taniyasu S, Kannan K, Horii Y, Hanari N, Yamashita N. A survey ofperfluorooctane sulfonate and related perfluorinated organic compounds inwater, fish, birds, and humans from Japan. Environ Sci Technol 2003;37:2634–9.
Taniyasu S, Kannan K, So MK, Gulkowska A, Sinclair E, Okazawa T, et al.Analysis of fluorotelomer alcohols, fluorotelomer acids, and short- and long-chain perfluorinated acids in water and biota. J Chromatogr A 2005;1093:89–97.
US EPA (United States Environmental Protection Agency). Perfluorooctylsulfonates: Proposed significant new use rule; 2000. Available at: http://www.epa.gov/oppt/chemtest/pubs/snur49.pdf (accessed October 13, 2006).
van Leeuwen SPJ, Kärrman A, van Bavel B, de Boer J, Lindström G. Strugglefor quality in determination of perfluorinated contaminants in environmentaland human samples. Environ Sci Technol (in press).
Yeung LW, So MK, Jiang G, Taniyasu S, Yamashita N, Song M, et al.Perfluorooctanesulfonate and related fluorochemicals in human bloodsamples from China. Environ Sci Technol 2006;40:715–20.