1-Aryl-3-alkyl-1,4,5,6-tetrahydro- pyrimidinium Salts. Part 2. Reactions with Nucleophiles
Upload
khangminh22Category
view
0download
0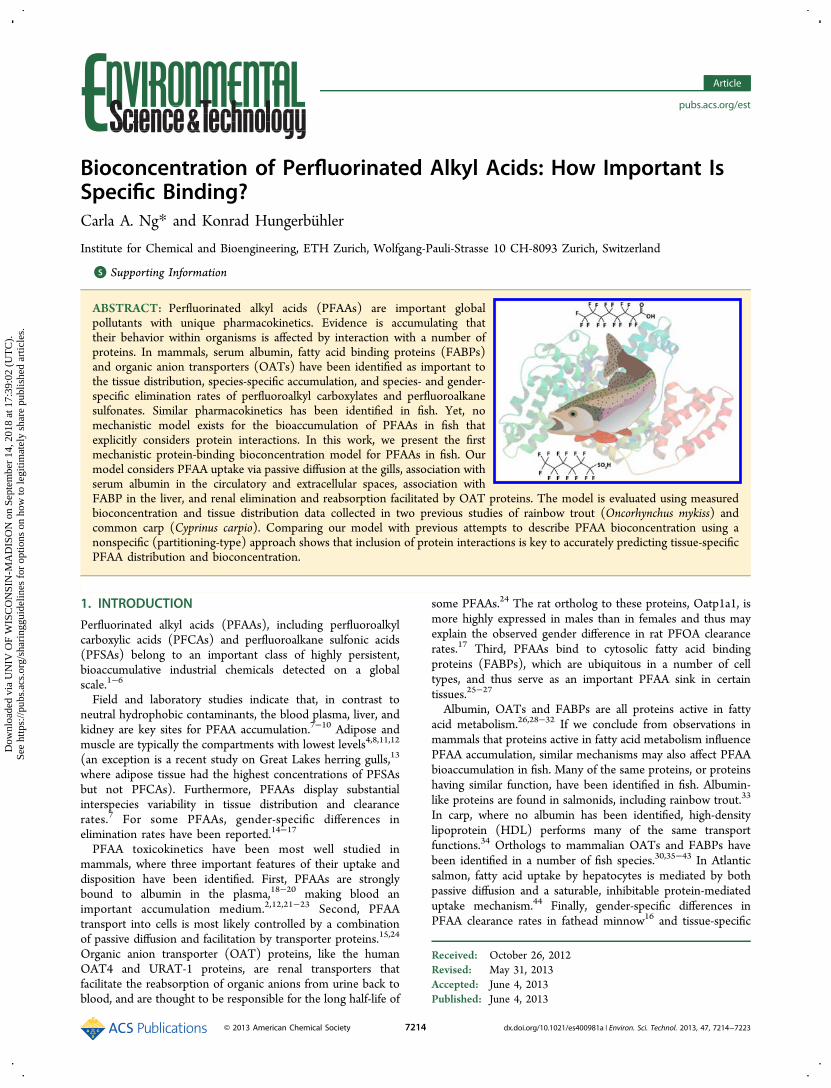
Bioconcentration of Perfluorinated Alkyl Acids: How Important IsSpecific Binding?Carla A. Ng* and Konrad Hungerbuhler
Institute for Chemical and Bioengineering, ETH Zurich, Wolfgang-Pauli-Strasse 10 CH-8093 Zurich, Switzerland
*S Supporting Information
ABSTRACT: Perfluorinated alkyl acids (PFAAs) are important globalpollutants with unique pharmacokinetics. Evidence is accumulating thattheir behavior within organisms is affected by interaction with a number ofproteins. In mammals, serum albumin, fatty acid binding proteins (FABPs)and organic anion transporters (OATs) have been identified as important tothe tissue distribution, species-specific accumulation, and species- and gender-specific elimination rates of perfluoroalkyl carboxylates and perfluoroalkanesulfonates. Similar pharmacokinetics has been identified in fish. Yet, nomechanistic model exists for the bioaccumulation of PFAAs in fish thatexplicitly considers protein interactions. In this work, we present the firstmechanistic protein-binding bioconcentration model for PFAAs in fish. Ourmodel considers PFAA uptake via passive diffusion at the gills, association withserum albumin in the circulatory and extracellular spaces, association withFABP in the liver, and renal elimination and reabsorption facilitated by OAT proteins. The model is evaluated using measuredbioconcentration and tissue distribution data collected in two previous studies of rainbow trout (Oncorhynchus mykiss) andcommon carp (Cyprinus carpio). Comparing our model with previous attempts to describe PFAA bioconcentration using anonspecific (partitioning-type) approach shows that inclusion of protein interactions is key to accurately predicting tissue-specificPFAA distribution and bioconcentration.
1. INTRODUCTION
Perfluorinated alkyl acids (PFAAs), including perfluoroalkylcarboxylic acids (PFCAs) and perfluoroalkane sulfonic acids(PFSAs) belong to an important class of highly persistent,bioaccumulative industrial chemicals detected on a globalscale.1−6
Field and laboratory studies indicate that, in contrast toneutral hydrophobic contaminants, the blood plasma, liver, andkidney are key sites for PFAA accumulation.7−10 Adipose andmuscle are typically the compartments with lowest levels4,8,11,12
(an exception is a recent study on Great Lakes herring gulls,13
where adipose tissue had the highest concentrations of PFSAsbut not PFCAs). Furthermore, PFAAs display substantialinterspecies variability in tissue distribution and clearancerates.7 For some PFAAs, gender-specific differences inelimination rates have been reported.14−17
PFAA toxicokinetics have been most well studied inmammals, where three important features of their uptake anddisposition have been identified. First, PFAAs are stronglybound to albumin in the plasma,18−20 making blood animportant accumulation medium.2,12,21−23 Second, PFAAtransport into cells is most likely controlled by a combinationof passive diffusion and facilitation by transporter proteins.15,24
Organic anion transporter (OAT) proteins, like the humanOAT4 and URAT-1 proteins, are renal transporters thatfacilitate the reabsorption of organic anions from urine back toblood, and are thought to be responsible for the long half-life of
some PFAAs.24 The rat ortholog to these proteins, Oatp1a1, ismore highly expressed in males than in females and thus mayexplain the observed gender difference in rat PFOA clearancerates.17 Third, PFAAs bind to cytosolic fatty acid bindingproteins (FABPs), which are ubiquitous in a number of celltypes, and thus serve as an important PFAA sink in certaintissues.25−27
Albumin, OATs and FABPs are all proteins active in fattyacid metabolism.26,28−32 If we conclude from observations inmammals that proteins active in fatty acid metabolism influencePFAA accumulation, similar mechanisms may also affect PFAAbioaccumulation in fish. Many of the same proteins, or proteinshaving similar function, have been identified in fish. Albumin-like proteins are found in salmonids, including rainbow trout.33
In carp, where no albumin has been identified, high-densitylipoprotein (HDL) performs many of the same transportfunctions.34 Orthologs to mammalian OATs and FABPs havebeen identified in a number of fish species.30,35−43 In Atlanticsalmon, fatty acid uptake by hepatocytes is mediated by bothpassive diffusion and a saturable, inhibitable protein-mediateduptake mechanism.44 Finally, gender-specific differences inPFAA clearance rates in fathead minnow16 and tissue-specific
Received: October 26, 2012Revised: May 31, 2013Accepted: June 4, 2013Published: June 4, 2013
Article
pubs.acs.org/est
© 2013 American Chemical Society 7214 dx.doi.org/10.1021/es400981a | Environ. Sci. Technol. 2013, 47, 7214−7223
Dow
nloa
ded
via
UN
IV O
F W
ISC
ON
SIN
-MA
DIS
ON
on
Sept
embe
r 14
, 201
8 at
17:
39:0
2 (U
TC
).
See
http
s://p
ubs.
acs.
org/
shar
ingg
uide
lines
for
opt
ions
on
how
to le
gitim
atel
y sh
are
publ
ishe
d ar
ticle
s.

bioaccumulation in male and female zebrafish45 indicate thatsome interactions between PFAAs and fatty acid transportersare conserved from mammals to fish. Yet, only one study todate has specifically addressed PFAA−protein interactions infish.46 No mechanistic models exist to assess the impact ofprotein interactions on PFAA accumulation in fish.In this work, we construct a novel protein-binding model for
the bioconcentration of PFAAs in fish. The model explicitlyconsiders binding of PFAAs to serum albumin in blood andinterstitial fluids, binding to FABP in the liver, and renalclearance facilitated by organic anion transporters (OATs).Given the lack of fish-specific data, the model utilizes allavailable protein interaction data collected for a variety ofspecies, primarily mammals. We test whether the bioaccumu-lation patterns the model predicts are consistent with what hasbeen measured in bioconcentration experiments with rainbowtrout (Oncorhynchus mykiss)11 and common carp (Cyprinuscarpio).47 The performance of our model is also discussed inthe context of the only other models currently available forbioconcentration of PFAAs in fish: namely, the models ofWebster and Ellis (2011)48 and Armitage et al. (2013),49 whichboth take an equilibrium partitioning approach.
2. MATERIALS AND METHODS
2.1. Model Structure. The model consists of 10 compart-ments (Figure 1): blood (B), adipose interstitial fluid (AF),adipose tissue (AT), muscle interstitial fluid (MF), muscletissue (MT), liver interstitial fluid (LF), liver tissue (LT),kidney interstitial fluid (KF), kidney tissue (KT), and urine(Ur). The blood and interstitial fluid (extracellular) compart-ments contain albumin and thus PFAA−albumin binding canoccur in these five compartments. The liver tissue compartmentcontains liver fatty acid binding protein (FABP) and thusPFAA−FABP binding can occur in this compartment.PFAAs bind to albumin with rate constant bon and dissociate
with rate constant boff. The kinetics are defined by the albumin
equilibrium association constant, KAAlb, as described in Section
2.2, below. Within the liver tissue, PFAAs bind to and dissociatefrom liver fatty acid binding proteins (FABP) according to theequilibrium association constant, KA
FABP.Facilitated transport is included in the kidneys, where we
model two competing protein-mediated processes: PFAAremoval from the kidneys to urine (with rate constant bclear)and reabsorption from the urine back to the kidneys (with rateconstant breab). For transport between any other pair ofcompartments, i and j, we consider passive diffusion only, withrate constant bi−j. Passive diffusion is possible only for free(unbound) PFAA. Clearance occurs by advection with urine(with rate QUrCUr) or via passive diffusion at the gills (with rateconstant bB−W).Because no data are available for PFAA fecal egestion, it is
currently not included in our model. The relative importance ofrenal to fecal excretion of PFAAs is unknown in fish. In miceand rats PFCAs are eliminated in urine and only much moreslowly in feces.50,51 For longer-chained PFCAs (C9 andgreater), where renal excretion is low, fecal excretion may bemore important.50
2.2. Rate Constants for Protein Interactions. Todescribe binding to albumin (Alb) or to liver fatty acid bindingprotein (FABP), we utilize published equilibrium associationconstants (KA
Alb or KAFABP, respectively). These equilibrium
constants are ratios of individual association and dissociationrate constants.19,20,52−56
=K k k/AP P p
on off (1)
The association rate constant for a protein p, konp , is a second-
order rate constant in units of M−1s−1, because the associationrate it describes depends both on the mass of substrate (PFAA)that is binding to the protein and on the concentration ofavailable binding sites.57,58 The dissociation rate constant, onthe other hand, is a first-order rate constant in units of s−1, andis multiplied by the mass of bound PFAA to determine the
Figure 1. Model schematic indicating protein interactions in blood (B), interstitial fluid (AF, MF, LF, KF) and liver tissue (LT) compartments.Intercompartment exchange occurs via passive diffusion (all compartments) and active renal clearance (bclear) and reabsorption (breab) facilitated byOAT proteins in kidney tissue (KT).
Environmental Science & Technology Article
dx.doi.org/10.1021/es400981a | Environ. Sci. Technol. 2013, 47, 7214−72237215

dissociation rate in units of mol/s. The concentration ofavailable binding sites in relevant compartments is calculatedthrough six population balances: for blood, liver fluid, livertissue, kidney fluid, muscle fluid, and adipose fluid. All take thegeneral form
= −c
tk C k C C
d
dpi
p i ppi i
,unocc
off bound on,unocc
free (2)
Cpi,unocc is the concentration of available (unoccupied) binding
sites of protein p in compartment i. The dissociation rateconstant for protein p is koff
p , and the association rate constant is
konp . The concentration of PFAA bound to protein incompartment i is Cbound
i and the concentration of free PFAAis Cfree
i In each of these balances, the initial concentration ofavailable binding sites in a compartment is the totalconcentration of protein in the compartment multiplied bythe number of binding sites per protein molecule, which can bePFAA-specific (see Table 2).Using the concentration of available binding sites we can
calculate a PFAA binding rate constant in compartment i, boni ,
in units of s−1:
Table 1. PFAA Mass Balances
mass balancea
blood (B)b
∑ ∑= − − +
− +
− − − −Mt
b C b M b M b M
b M b M
dd i i
freeB
W BfreeW B W
freeB B iF
freeB iF B
freeiF
onB
freeB
offB
boundB
= −M
tb M b M
ddboundB
onB
freeB
offB
boundB
adipose fluid (AF)= + − + −
+
− − − −Mt
b M b M b b M b M
b M
dd
( )freeAF
B AFfreeB AT AF
freeAT AF B AF AT
freeAF
onAF
freeAF
offAF
boundAF
= −M
tb M b M
ddboundAF
onAF
freeAF
offAF
boundAF
adipose tissue (AT)= −− −M
tb M b M
dd
freeAT
AF ATfreeAF AT AF
freeAT
muscle fluid (MF)= + − +
− +
− − − −Mt
b M b M b b M
b M b M
dd
( )freeMF
B MFfreeB MT MF
freeMT MF B MF MT
freeMF
onMF
freeMF
offMF
boundMF
= −M
tb M b M
ddboundMF
onMF
freeMF
offMF
boundMF
muscle tissue (MT)= −− −M
tb M b M
dd
freeMT
MF MTfreeMF MT MF
freeMT
liver fluid (LF)= + − + −
+
− − − −Mt
b M b M b b M b M
b M
dd
( )freeLF
B LFfreeB LT LF
freeLT LF B LF LT
freeLF
onLF
freeLF
offLF
boundLF
= −M
tb M b M
ddboundLF
onLF
freeLF
offLF
boundLF
liver tissue (LT)= − − +− −M
tb M b M b M b M
dd
LTfree
LF LTfreeLF LT LF
freeLT
onLT
freeLT
offLT
boundLT
= −M
tb M b M
ddboundLT
onLT
freeLT
offLT
boundLT
kidney fluid (KF)= + − + −
+
− − − −Mt
b M b M b b M b M
b M
dd
( )freeKF
B KFfreeB KT KF
freeKT KF B KF KT
freeKF
onKF
freeKF
offKF
boundKF
= −M
tb M b M
ddboundiF
onKF
freeKF
offKF
boundKF
kidney tissue (KT)= − + + −
+
− − − −Mt
b M b b M b M b M
b M
dd
( )freeKT
KF KTfreeKF KT KF KT Ur
freeKT Ur KT
freeUr
clear freeKT
reab freeUr
urine (Ur)= − + − −− −M
tb M b M b M b M
Q
VM
dd
freeUr
KT UrfreeKT Ur KT
freeUr
clear freeKT
reab freeUr Ur
Ur freeUr
aMfree refers to unbound PFAA, which is free to move between compartments, while Mbound is chemical bound to albumin or, in the liver tissue,FABP. bIn summation expressions, i = A (adipose), M (muscle), L (liver), and K (kidney).
Environmental Science & Technology Article
dx.doi.org/10.1021/es400981a | Environ. Sci. Technol. 2013, 47, 7214−72237216

=b k Ci ppi
on on,unocc
(3)
The PFAA dissociation rate constant in compartment i, boffi ,
is the first order dissociation rate constant for protein p, koffp ,
with units of s−1:
=b ki poff off (4)
Only the equilibrium constant, KAp , is available from literature.
No studies currently exist that specifically measure theindividual association and dissociation rate constants (kon
p andkoffp ) for PFAAs with either albumin or FABPs. However, in thiswork we focus on the steady-state results, which depend onlyon KA
p and on the total concentration of protein p incompartment i, Cp
i , but not on the individual association anddissociation constants, as shown in the Supporting Information(SI) (Section S4-2).2.3. PFAA Mass Balance Equations. In addition to the
protein site balances, there are 16 PFAA mass balances thatdescribe the PFAA−protein interactions and exchange betweeneach of the model compartments depicted in Figure 1: there aretwo for blood (one for free chemical and one for chemicalbound to albumin); two each for the liver, kidney, muscle, andadipose interstitial fluid compartments (for free and albumin-bound chemical); one each for the muscle and adipose tissuecompartments, where no binding occurs; two for the liver tissuecompartment (one for free chemical and one for chemicalbound to FABP); one for the kidney tissue compartment andfinally one for urine. These mass balances are listed in Table 1.A glossary of all model parameters is provided in the SI(Section S1). All first-order rate constants for transport amongcompartments are described in detail in the SI, Sections S3-2and S4-1.2.4. Model Parameterization. Fish Physiology. Our
model represents a generic 8 g fish (similar to the size ofrainbow trout used in the experiment of Martin et al. (2003)),11
for which we need corresponding compartment volumes (Vi),areas for intercompartment exchange (Ai−j), albumin concen-trations in blood serum and interstitial fluid compartments(CAlb
i ) and an estimate of the FABP concentration in liver tissue(CFABP
LT ).In SI section S2-1 we explain how compartment volumes are
derived using the work of Barron et al. (1987), Gingerich et al.(1987) and Bushnell et al. (1988).59−61 Compartment volumesare summarized in SI Tables S1 and S2. Areas forintercompartment exchange are estimated by assuming asimplified capillary geometry and scaled according to organ-specific blood volumes, based on the work of Soldatov (2006)and Gingerich et al. (1987),60,62 as detailed in SI Section S2-1and summarized in Table S3. In SI Section S2-3 we describe
how blood, water and urine flow rates were estimated for our 8-g fish. These values are summarized in SI Table S4.Albumin concentrations are estimated based on both fish and
mammalian literature. Manera and Britti33 provide an estimateof CAlb
B for rainbow trout serum. For the interstitial fluidcompartments, no fish-specific data were available. However, astudy on human subjects provided estimates of concentrationsin muscle and adipose interstitial fluid relative to serum levels;63
additional mammalian studies have shown that albuminconcentrations in interstitial fluids of the liver are about halfthat in plasma, and we assume a similar level for the kidney.28,64
We assume tissue compartments contain no albumin. Finally,we estimate the concentration of FABP in liver tissues asapproximately 50 μM, following Londraville (1996).65 Allprotein concentrations used in the model are summarized in SITable S5.
PFAA Properties. We consider six PFAAs for which sufficientbioconcentration and protein interaction data exist to assess ourmodel performance: perfluorooctanoic acid (PFOA), perfluor-odecanoic acid (PFDA), perfluoroundecanoic acid (PFUnA),perfluorododecanoic acid (PFDoA), perfluorohexane sulfonate(PFHxS), and perfluorooctane sulfonate (PFOS). Theirstructures are shown in SI Figure S2.For uptake from water to blood, we use measured passive
PFAA diffusion rates in different types of cells.15,17,24 Fromthese rates we calculate effective membrane permeabilities foreach PFAA, which are then used to calculate the rate constantsfor passive diffusion to and from the blood via the gills (bW−B
and bB−W, respectively, see SI Sections S3-2 and S4-1 fordetails).Two types of protein interaction data are needed: binding
and transport. The model uses equilibrium associationconstants to describe binding to albumin in the blood andinterstitial fluid compartments (KA
Alb), and to FABPs in the livertissue compartment (KA
FABP). In the kidney tissue, rate constantsare needed to describe clearance (bclear) and reabsorption (breab)via OAT-facilitated transport.For the equilibrium association constant with albumin (KA
Alb),data are largely restricted to interactions with bovine andhuman serum albumin. We compile data from five recentstudies: Han et al. (2003),52 Chen et al. (2009),18 Hebert et al.(2010),19 MacManus-Spencer et al. (2010),20 Bischel et al.(2010),54 and Qin et al. (2010).53 From these studies, whichestimated KA
Alb using a variety of techniques, we extract theminimum (low) and maximum (high) values reported for sixPFAAs (Table 2). Most of the low values are found in theHebert et al. (2010) study, which uses fluorescence spectros-copy, whereas Bischel et al. (2010), using equilibrium dialysis,and Chen et al. (2009), who used site-specific fluorescence,
Table 2. Summary of Association Constants (KA) and Binding Sites (n) for PFAA Binding to Albumin (Alb) and Fatty AcidBinding Protein (FABP), with Their Sources
KAAlb (M−1) source KA
FABP (M−1) source
low high low high
PFOA 3.7 × 10³ (n = 7.5) 1.4 × 10⁶ (n = 1.4) Han (2003)52 Bischel (2010)54 5.6 × 10⁴ (n = 1)a Woodcroft (2010)56
PFDA 4.7 × 10⁴ (n = 2.3) 4.4 × 10⁵ (n = 1)a Hebert (2010)19 Qin (2010)53 6.4 × 10⁵ (n = 1)a,b PFUnA 4.3 × 10⁴ (n = 2.4) 3.0 × 10⁵ (n = 1)a MacManus-Spencer (2010)20 2.2 × 10⁶ (n = 1)a,b PFDoA 1.2 × 10⁶ (n = 1)a Chen (2009)18 7.4 × 10⁶ (n = 1)a,b PFHxS 1.2 × 10⁴ (n = 1.65) Hebert (2010)19 1.7 × 10⁴ (n = 1)a,b PFOS 8.9 × 10³ (n = 2.1) 7.6 × 10⁶ (n = 1)a Chen (2009)18 1.9 × 10⁵ (n = 1)a,b
aValue refers to primary binding site. bWoodcroft et al. (2010) provide values for C5−C9 PFCAs. We use their data to extrapolate values for all ourPFAAs as explained in SI Section S3-4.
Environmental Science & Technology Article
dx.doi.org/10.1021/es400981a | Environ. Sci. Technol. 2013, 47, 7214−72237217

provide the highest values. In the case of PFHxS and PFDoA,only one binding constant for each was available. For PFHxSthe value is from the Hebert et al. (2010) study; we assume thisis a lower bound. For PFDoA, the value from the Chen et al.(2009) study is among the highest reported for any PFAA. Weassume this to represent a higher-end estimate.Although FABPs are ubiquitous in many tissues and have
been identified in zebrafish,40 striped bass,42 Atlanticsalmon,30,39 and rainbow trout,41 no data are currently availablefor association constants of PFAAs with FABPs in fish. Theinteractions of C5−C9 PFAAs with FABPs have been measuredin rat hepatocytes by Woodcroft et al. (2010).56 We use theirstudy to extrapolate equilibrium binding constants betweenPFAAs and FABPs in the liver for C8−C12 PFCAs and assumePFSA−FABP binding strengths are equal to those for PFCAs ofequivalent perfluorinated carbon chain length (see SI SectionS3-4).Fatty acid transport proteins, of which OATs are a class, have
been identified as active in fatty acid transport in fish heart,adipose, brain, gills, and intestine.35,39 However, data for PFAAinteraction with these transporter proteins are completelylacking for fish and in the mammalian literature are largelyrestricted to hepatocyte uptake15 or renal transport.17,24 Ofthese studies, only the renal OAT study by Weaver et al.(2010)17 considers multiple PFAAs. We thus derive rateconstants for facilitated clearance and reabsorption in thekidney using the Weaver et al. study, as described in SI SectionS3-3 and Table S7.2.5. Model Assessment. In all, the model includes 35
independent parameters (SI Tables S9 and S10). However,there are no fitted parameters. Due to lack of data for PFAA−protein interactions in fish, many of these values are based onliterature studies for mammals (primarily rats and humans).Thus a favorable comparison between our model results andmeasured tissue distribution and bioconcentration data for fishis not only an assessment of our model, but also of theplausibility of parallels in PFAA-protein interactions betweenmammals and fish. In section S3-5 and Table S8 of the SI wediscuss the species-specific origin of protein parameters used inthe model. We also perform a sensitivity analysis (SI SectionS5) to identify all parameters to which our model is mostsensitive.
3. RESULTS3.1. Tissue Distributions. We first compare the tissue
distributions predicted by our model to the data from Martin etal. (2003)11 (Figure 2) for PFOA, PFDA, PFUnA, PFDoA,PFHxS, and PFOS. In order to predict concentrations forcomparison with these data, we ran the model for each PFAAusing the exposure concentration given by Martin et al. In theirpaper, they note PFDoA concentrations in water were belowthe limit of detection (LOD) of 0.4 μg/L, and in their Table 1list the water concentration of PFDoA as 0.2 μg/L, or 1/2 thelimit of detection. In our model runs, we take both values (0.2and 0.4 μg/L) and show the predicted range in Figure 2 using adotted line.Where more than one value for the equilibrium association
constant with albumin (KAAlb) was available for a single PFAA,
we show the range of predictions obtained using the lowest andhighest values (Figure 2, black lines). The height of the barindicates the average between low and high predictions wheretwo KA
Alb values were available or the single value predictedwhen only one KA
Alb was available.
Two features can be assessed here: the distribution of PFAAsacross different compartments, and the concentrations ofdifferent PFAAs in each compartment. The tissue distributionpredicted by our model (blood ≈ liver > kidney > muscle ≈adipose) is similar to that measured by Martin et al. (blood >liver ≈ kidney > muscle ≈ adipose). However, our modelgenerally under-predicts levels in the kidney and blood andoverpredicts them (to a smaller extent) in adipose. In allcompartments except the kidney the model-predicted meanconcentrations follow the same chain length dependence as thedata for the PFCAs: PFDoA > PFUnA > PFOA. For thePFSAs, the model correctly predicts that PFOS > PFHxS, butbecause PFHxS is under-predicted in liver, blood and adiposecompartments, they do not show the same PFCA to PFSApattern as the data.In the liver compartment, for which we include both albumin
and FABP interactions, values for all PFAAs are within a factorof 2 of measured concentrations, except for PFHxS, which isunderestimated by a factor of 20. For PFOA and PFDoA, themeasured concentration lies within the prediction range.In the kidney, predictions for PFDA and PFOS are within a
factor of 1.5, and both PFOA and PFHxS measuredconcentrations overlap our prediction ranges. However, themodel substantially underestimates concentrations for PFUnAand PFDoA, one of the largest deviations observed (a factor of25). Furthermore, the distribution in the kidney compartmentdoes not follow the same pattern as the other compartments.This is due to the effect of competing clearance andreabsorption processes, which also follow a chain-length-dependence but not in a uniform way (for example,reabsorption increases with chain length more rapidly thanclearance).17
In the blood compartment, both PFOS and PFOA data arewithin the prediction range. PFDoA and PFDA are bothunderestimated but within a factor of 4 of the measured data.PFUnA, on the other hand, is underestimated by nearly anorder of magnitude, and PFHxS by a factor of 30.In the muscle compartment, all prediction ranges except for
PFDA fall within the range of measured values, and PFDA isoverestimated by only about a factor of 1.4. Finally, predictionsfor the adipose compartment are all within about a factor of 1.5
Figure 2. PFAA tissue distribution. Model predictions (bars) andvalues measured by Martin et al. (2003)11 (red circles, one standarderror indicated by red line). Prediction ranges for PFOA, PFDA,PFUnA, and PFOS based on reported KA
Alb ranges (see Table 2) areindicated by black lines. The black dotted line for PFDoA predictionsis based on exposure concentrations of 0.2 and 0.4 μg/L (1/2 the limitof detection and the limit of detection in the Martin et al. study,respectively).
Environmental Science & Technology Article
dx.doi.org/10.1021/es400981a | Environ. Sci. Technol. 2013, 47, 7214−72237218

of the measured data except for PFHxS, which is under-predicted by a factor of 11.A clear strength of our model is the ability to predict PFAA
concentrations well within an order of magnitude acrossdifferent compartments that are characterized as having both ahigh degree of protein interaction (e.g., liver, blood) andrelatively little protein interaction (muscle, adipose). However,PFHxS is substantially under-predicted in liver, muscle andadipose compartments. As noted in the section on PFAAproperties, we expect the single value for KA
Alb available for thischemical is likely a lower bound. In the kidney compartment,the PFAA distribution pattern predicted by our model was notobserved in the rainbow trout data of Martin et al. (2003)11 andthere were large deviations for PFUnA and PFDoAconcentrations. Thus, it is likely that the active clearance andreabsorption processes we modeled based on rat data do notoperate in the same way or to the same extent in fish.3.2. Tissue-Specific Bioconcentration Factors. We next
evaluate our model performance in predicting PFAAbioconcentration factors (BCF). In this case, because theBCF relates the concentration in the tissue to that in thesurrounding water, we run all model calculations assuming thesame concentration in water (1 × 10⁻⁶ mol/m3). We compareour predictions to data for rainbow trout from Martin et al.(2003)11 and common carp from Inoue et al. (2012).47
For rainbow trout, BCF data were available for carcass(which Martin et al. suggest are within 80−90% of a wholebody value), blood and liver. In common carp, data wereavailable for whole body, viscera, integument, and “remaining
parts”.47 We compare rainbow trout blood data to modelpredictions for the blood compartment. We compare rainbowtrout liver and common carp viscera data to model predictionsfor the liver compartment. For the whole body BCF, we sumthe steady-state mass of PFAAs predicted by our model over allof our compartments and divide by the exposure concentration.We compare this to rainbow trout carcass and common carpwhole body data.In cases where a range of KA
Alb values was used, a range ofpredicted BCFs is indicated. In addition, we plot thepredictions of our model with binding to albumin and FABPremoved to illustrate the model run with only nonspecific(passive diffusion) interactions considered (Figure 3).Predicted BCFs (Figure 3) are within one log unit of
measured BCFs in all compartments and for every PFAAconsidered except for PFHxS and, in the whole bodycompartment, PFUnA (both Martin et al. and Inoue et al.data sets) and PFDoA (Martin et al. data set only). PFHxS isunder-predicted in all compartments, by a factor of 20 in thewhole body (where the least overall binding is expected due toinclusion of the muscle and adipose compartments) and afactor of 130 in the liver (where the most bindingto bothalbumin and FABPis included).In the blood compartment (Figure 3a), the range of
predicted BCFs for PFOA and PFOS encompasses themeasured data. The model-predicted BCF of PFDA is withina factor of 3 of the data, the BCF of PFDoA is within a factor of4, and the predicted BCF of PFUnA is within a factor of 8.
Figure 3. Comparison of predicted and measured bioconcentration factors (BCF) for PFCAs (solid symbols) and PFSAs (hollow symbols) in (a)blood, (b) liver, and (c) whole body. Ranges are indicated for predictions derived using low and high values for the albumin association constant(KA
Alb). Solid line is 1:1 line indicating perfect agreement with data; dotted lines indicate ±1 log unit. Data are from Martin et al. (2003)11 (circles)and Inoue et al. (2012)47 (diamonds). Model predictions without considering specific protein binding are also shown ( × for PFCAs, + for PFSAs).
Environmental Science & Technology Article
dx.doi.org/10.1021/es400981a | Environ. Sci. Technol. 2013, 47, 7214−72237219

In the liver compartment (Figure 3b), the predicted BCFrange of PFOA encompasses the measured data. The BCFs ofPFDA, PFUnA and PFDoA are all within a factor of 3 of themeasured BCFs. The model-data agreement is by far the best inthe liver compartment, where both albumin and FABP bindingare included in the model.Measured PFOA BCFs from both the Martin et al. and Inoue
et al. data sets are within the range of predicted whole-bodyBCFs (Figure 3c). The predicted BCF of PFOS is within afactor of 3 of the measured data. As stated above, the predictedBCFs of PFUnA, PFDoA (for the Martin et al. data set), andPFHxS fall outside a factor of 10 of the data. In general themodel under-predicts BCFs in the whole body.For all three BCFs (blood, liver and whole body), when the
model is run without protein binding none of the predictionsfor any PFAA are within a factor of 10 of the measured data.The only exception is PFOA in the whole body and the liver.Most BCFs are under-predicted by close to 2 log units, or afactor of 100. Thus the inclusion of protein binding is essentialto the predictive power of the model.3.3. Sensitivity Analysis. In order to probe the effect of
parameter uncertainties on model predictions, we performed afactor-at-a-time sensitivity analysis over all independent modelparameters (see SI Section S5). The analysis revealed that outof the 35 independent model parameters, most important arethe equilibrium association constants for binding to albumin(KA
Alb) and the availability of binding sites, as described by theconcentration of albumin in a given compartment (CAlb
i ) andthe number of binding sites per albumin molecule (n). Secondmost important are parameters related to passive diffusion atthe gills, namely the effective membrane permeability (Peff), thesteady-state concentration ratio (CRSS
C−W) that describes theback-diffusion mass transfer coefficient (see SI Section S3-2)and the area for blood-water exchange (AB−W, the gill area).Finally, the ratio of interstitial fluid to tissue subcompartmentvolumes, though less important than either the binding or thediffusion parameters, affects predictions of compartment-specific BCFs.
4. DISCUSSIONThe tissue distributions and bioconcentration factors predictedby our model are in good agreement with observations inrainbow trout and common carp, except for the substantialunder-estimation of PFHxS. Model performance is best in theliver, which is also the most well characterized compartment interms of protein binding, since both albumin and liver FABPbinding data were available.18−20,52−54,56 Model performance isalso good in the blood, where the albumin concentration, andthus the fraction of bound PFAA, is highest. Like the liver, theblood compartment is relatively well characterized; there was atrout-specific measured concentration of albumin available,33
and KAAlb values for all modeled PFAAs (see Table 2).
Model performance was not as strong in the whole body,where PFAA BCFs were generally under-predicted. This maybe explained by the lack of FABP binding in othercompartments where no data were available, although it isknown that other fish tissues also contain FABPs.42 The modelalso relies on empirical estimates of membrane permeabilityand includes active uptake only in the kidney; it is possible thateither passive diffusion was under-predicted or that activeuptake should be included in more compartments.The most poorly predicted PFAA, in all compartments, was
PFHxS. As previously noted, only one value of KAAlb for PFHxS
was available from the literature,19 and we expect that this valuerepresents a lower bound. The general pattern observed in thedata suggests that sulfonic acids behave differently fromcarboxylic acids and that their protein binding strengths maybe stronger than indicated by their perfluorinated carbon chainlengths. The measured BCFs of PFOS in all compartments arebetween those of PFDA and PFUnA, whereas PFOS has thesame number of perfluorinated carbons as PFNA. This isfurther supported by the high value of KA
Alb estimated forPFOS,18 which gives the best BCF predictions in our model.Similarly, the measured BCF of PFHxS is consistently higherthan that of PFOA, despite PFOA having an additionalperfluorinated carbon. If this pattern follows for all proteininteractions, higher binding strengths with FABPs, which havenot yet been measured for PFSAs, should be expected.This work is the first fish bioconcentration model that
explicitly considers PFAA−protein interactions. Only two otherfish-specific PFAA bioconcentration models have beenpublished to date. The first, by Webster and Ellis (2010),48 isa partitioning-based model that assumes that only the neutralfraction of the chemical is available for uptake. They argue thatequilibrium partitioning is sufficient to explain whole-body BCFvalues for PFAAs, based on an assumed pKa for perfluorinatedacids of 3.8 and using the KOW of the neutral fraction (adjustedby the fraction of neutral chemical at biological pH) to predictthe BCF. However, the weight of evidence from currentresearch points to a pKa value for most PFCAs of about 1.0 orlower.66−69 Using this more realistic value, their model wouldunder-predict PFAA BCFs by several orders of magnitude. Ourmodel, which has a much higher degree of biological fidelityand does not rely on such assumptions about thephysicochemical properties of PFAAs, can successfully predictthe amount and tissue-specific distribution of these chemicals infish.More recently, Armitage et al. (2013) developed a
bioconcentration model for ionizable organic chemicals infish.49 It focuses on two parameters: an octanol−waterdistribution coefficient, DOW, for interaction of both neutraland charged species with neutral (storage) lipids, and amembrane−water distribution coefficient DMW, which charac-terizes the interaction of both neutral and ionized species withmembrane phospholipids. Because of the partially chargednature of phospholipids, the DMW does not decrease as rapidlywith degree of ionization as the DOW and thus the model canhelp to explain higher than expected accumulation of ionizablecompounds in fish. The authors apply this model to a numberof PFAAs. However, results are only compared to the Martin etal. (2003) carcass BCFs, and no information is given for howthe model might be parametrized for other organs. Given thatblood serum and liver are important for PFAA accumula-tion,8,9,13 the performance of a PFAA bioconcentration modelfor these compartments is key. Although we agree thatnonspecific membrane partitioning may play a part in PFAAaccumulation, our model results illustrate that it cannot providethe full picture.Our model includes some important features that have not
previously been implemented in fish bioconcentration models.These include PFAA interactions with albumin in serum andinterstitial fluid compartments and with FABPs in the livertissue. The inclusion of active renal clearance and reabsorptiondriven by interactions with OATs led to a mismatch betweenour model predictions in the kidney and available tissuedistribution data. This suggests that renal transport may not be
Environmental Science & Technology Article
dx.doi.org/10.1021/es400981a | Environ. Sci. Technol. 2013, 47, 7214−72237220

as important in fish as it is in mammals, or that active transportrates differ substantially from mammals to fish. The lack ofagreement for this particular compartment reinforces the needfor fish-specific studies of protein interactions. To date, thework of Jones et al. (2003)46 is the only one that looks at theinteraction of PFAAs with fish serum proteins. However, theoverall success of our model to predict patterns of tissuedistribution and bioconcentration in both trout and carpsuggests that parallels do exist between fish and mammaliansystems in the way proteins interact with PFAAs. Given thatour model is based on parameters measured for a variety ofspecies and that there are no fitted parameters, the agreementbetween model predictions and measured data seemsremarkable.The wide ranges found in the literature for values of KA
Alb forsingle PFAAs indicate that uncertainty in binding strength isstill high. Given the importance of these parameters, ashighlighted by our sensitivity analysis, more comprehensivestudies are needed to measure protein interactions for a widerrange of proteins and PFAAs at environmentally relevant PFAAconcentrations. Importantly, different techniques lead tosubstantially different estimates; more systematic testing ofthese techniques is warranted.Our model holds promise for the prediction of tissue-specific
bioconcentration in fish, and may be useful as a tool toinvestigate further gaps in our knowledge regarding how theseimportant chemicals operate within organisms. Of particularimportance is the move by industry away from long-chainPFAAs. Not only are shorter-chain PFAAs being produced inincreasing amounts, but the diversity of structures is alsoincreasing. If the bioaccumulation potential of PFAAs is tied totheir similarities with fatty acids, will that similarity hold fordifferent structures such as branched chemicals? Can bulkiermolecules occupy the same hydrophobic pockets exploited byfatty acids and linear perfluoroalkyl acids,70 or do proteininteractions with branched structures differ in important ways?Further protein interaction and bioaccumulation studies ondifferent perfluorinated structures are clearly needed.
■ ASSOCIATED CONTENT
*S Supporting InformationDetails of model parametrization and a model sensitivityanalysis are available in the Supporting Information (SI). Thismaterial is available free of charge via the Internet at http://pubs.acs.org.
■ AUTHOR INFORMATION
Corresponding Author*E-mail: [email protected].
NotesThe authors declare no competing financial interest.
■ REFERENCES(1) Martin, J.; Whittle, D.; Muir, D.; Mabury, S. Perfluoroalkylcontaminants in a food web from Lake Ontario. Environ. Sci. Technol.2004, 38, 5379−5385.(2) Houde, M.; Martin, J.; Letcher, R.; Solomon, K.; Muir, D.Biological monitoring of polyfluoroalkyl substances: A review. Environ.Sci. Technol. 2006, 40, 3463−3473.(3) Karrman, A.; Langlois, I.; Bavel, B.; Lindstrom, G.; Oehme, M.Identification and pattern of perfluorooctane sulfonate (PFOS)isomers in human serum and plasma. Environ. Int. 2007, 33, 782−788.
(4) Conder, J. M.; Hoke, R. A.; Wolf, W.; Russell, M. H.; Buck, R. C.Are PFCAs bioaccumulative? A critical review and comparison withregulatory criteria and persistent lipophilic compounds. Environ. Sci.Technol. 2008, 42, 995−1003.(5) Schenker, U.; Scheringer, M.; Macleod, M.; Martin, J. W.;Cousins, I. T.; Hungerbuhler, K. Contribution of volatile precursorsubstances to the flux of perfluorooctanoate to the Arctic. Environ. Sci.Technol. 2008, 42, 3710−3716.(6) Kannan, K. Perfluoroalkyl and polyfluoroalkyl substances:Current and future perspectives. Environ. Chem. 2011, 8, 333−338.(7) Verreault, J.; Houde, M.; Gabrielsen, G. W.; Berger, U.; Haukas,M.; Letcher, R. J.; Muir, D. C. G. Perfluorinated alkyl substances inplasma, liver, brain, and eggs of glaucous gulls (Larus hyperboreus)from the Norwegian Arctic. Environ. Sci. Technol. 2005, 39, 7439−7445.(8) Ahrens, L.; Siebert, U.; Ebinghaus, R. Total body burden andtissue distribution of polyfluorinated compounds in harbor seals(Phoca vitulina) from the German Bight. Mar. Pollut. Bull. 2009, 58,520−525.(9) Yoo, H.; Guruge, K. S.; Yamanaka, N.; Sato, C.; Mikami, O.;Miyazaki, S.; Yamashita, N.; Giesy, J. P. Depuration kinetics and tissuedisposition of PFOA and PFOS in white leghorn chickens (Gallusgallus) administered by subcutaneous implantation. Ecotox. Environ.Safe. 2009, 72, 26−36.(10) Vestergren, R.; Cousins, I. T. Tracking the pathways of humanexposure to perfluorocarboxylates. Environ. Sci. Technol. 2009, 43,5565−5575.(11) Martin, J.; Mabury, S.; Solomon, K.; Muir, D. Bioconcentrationand tissue distribution of perfluorinated acids in rainbow trout(Oncorhynchus mykiss). Environ. Toxicol. Chem. 2003, 22, 196−204.(12) Shi, Y.; Wang, J.; Pan, Y.; Cai, Y. Tissue distribution ofperfluorinated compounds in farmed freshwater fish and humanexposure by consumption. Environ. Toxicol. Chem. 2012, 31, 717−723.(13) Gebbink, W. A.; Letcher, R. J. Comparative tissue and bodycompartment accumulation and maternal transfer to eggs ofperfluoroalkyl sulfonates and carboxylates in Great Lakes herringgulls. Environ. Pollut. 2012, 162, 40−47.(14) Ohmori, K.; Kudo, N.; Katayama, K.; Kawashima, Y.Comparison of the toxicokinetics between perfluorocarboxylic acidswith different carbon chain length. Toxicology 2003, 184, 135−140.(15) Han, X.; Yang, C.-H.; Snajdr, S. I.; Nabb, D. L.; Mingoia, R. T.Uptake of perfluorooctanoate in freshly isolated hepatocytes frommale and female rats. Toxicol. Lett. 2008, 181, 81−86.(16) Lee, J. J.; Schultz, I. R. Sex differences in the uptake anddisposition of perfluorooctanoic acid in fathead minnows after oraldosing. Environ. Sci. Technol. 2009, 44, 491−496.(17) Weaver, Y. M.; Ehresman, D. J.; Butenhoff, J. L.; Hagenbuch, B.Roles of rat renal organic anion transporters in transportingperfluorinated carboxylates with different chain lengths. Toxicol. Sci.2010, 113, 305−314.(18) Chen, Y.; Guo, L. Fluorescence study on site-specific binding ofperfluoroalkyl acids to human serum albumin. Arch. Toxicol. 2009, 83,255−261.(19) Hebert, P.; Macmanus-Spencer, L. A. Development of afluorescence model for the binding of medium- to long-chainperfluoroalkyl acids to human serum albumin through a mechanisticevaluation of spectroscopic evidence. Anal. Chem. 2010, 82, 6463−6471.(20) Macmanus-Spencer, L. A.; Tse, M. L.; Hebert, P. C.; Bischel, H.N.; Luthy, R. G. Binding of perfluorocarboxylates to serum albumin: Acomparison of analytical methods. Anal. Chem. 2010, 82, 974−981.(21) Taniyasu, S.; Kannan, K.; Horii, Y.; Hanari, N.; Yamashita, N. Asurvey of perfluorooctane sulfonate and related perfluorinated organiccompounds in water, fish, birds, and humans from Japan. Environ. Sci.Technol. 2003, 37, 2634−2639.(22) Ankley, G.; Kuehl, D.; Kahl, M.; Jensen, K.; Linnum, A.; Leino,R.; Villeneuve, D. Reproductive and developmental toxicity andbioconcentration of perfluorooctanesulfonate in a partial life-cycle test
Environmental Science & Technology Article
dx.doi.org/10.1021/es400981a | Environ. Sci. Technol. 2013, 47, 7214−72237221
with the fathead minnow (Pimephales promelas). Environ. Toxicol.Chem. 2005, 24, 2316−2324.(23) Kelly, B. C.; Ikonomou, M. G.; Blair, J. D.; Surridge, B.; Hoover,D.; Grace, R.; Gobas, F. A. P. C. Perfluoroalkyl contaminants in anArctic marine food web: Trophic magnification and wildlife exposure.Environ. Sci. Technol. 2009, 43, 4037−4043.(24) Yang, C.-H.; Glover, K. P.; Han, X. Characterization of cellularuptake of perfluorooctanoate via organic anion-transporting polypep-tide 1A2, organic anion transporter 4, and urate transporter 1 for theirpotential roles in mediating human renal reabsorption of perfluor-ocarboxylates. Toxicol. Sci. 2010, 117, 294−302.(25) Luebker, D. J.; Hansen, K. J.; Bass, N. M.; Butenhoff, J. L.;Seacat, A. M. Interactions of fluorochemicals with rat liver fatty acid-binding protein. Toxicology 2002, 176, 175−185.(26) Weisiger, R. A. Mechanisms of intracellular fatty acid transport:Role of cytoplasmic-binding proteins. J. Mol. Neurosci. 2007, 33, 42−44.(27) Hickey, N. J.; Crump, D.; Jones, S. P.; Kennedy, S. W. Effects of18 perfluoroalkyl compounds on mRNA expression in chicken embryohepatocyte cultures. Toxicol. Sci. 2009, 111, 311−320.(28) Peters Jr., T. All about Albumin: Biochemistry, Genetics, AndMedical Applications; Academic Press: New York, 1995.(29) Van Der Vusse, G. J. Albumin as fatty acid transporter. DrugMetab. Pharmacokinet. 2009, 24, 300−307.(30) Jordal, A.-E. O.; Hordvik, I.; Pelsers, M.; Bernlohr, D. A.;Torstensen, B. E. FABP3 and FABP10 in Atlantic salmon (Salmo salarL.)-General effects of dietary fatty acid composition and life cyclevariations. Comp. Biochem. Phys. B 2006, 145, 147−158.(31) Ahn, S.-Y.; Nigam, S. K. Toward a systems level understandingof organic anion and other multispecific drug transporters: A remotesensing and signaling hypothesis. Mol. Pharmacol. 2009, 76, 481−490.(32) Riedmaier, A. E.; Nies, A. T.; Schaeffeler, E.; Schwab, M.Organic anion transporters and their implications in pharmacotherapy.Pharmacol. Rev. 2012, 64, 421−449.(33) Manera, M.; Britti, D. Assessment of blood chemistry normalranges in rainbow trout. J. Fish Biol. 2006, 69, 1427−1434.(34) De Smet, H.; Blust, R.; Moens, L. Absence of albumin in theplasma of the common carp Cyprinus carpio: Binding of fatty acids tohigh density lipoprotein. Fish Physiol. Biochem. 1998, 19, 71−81.(35) Popovic, M.; Zaja, R.; Smital, T. Organic anion transportingpolypeptides (OATP) in zebrafish (Danio rerio): Phylogenetic analysisand tissue distribution. Comp. Biochem. Phys. A 2010, 155, 327−335.(36) Aslamkhan, A. G.; Thompson, D. M.; Perry, J. L.; Bleasby, K.;Wolff, N. A.; Barros, S.; Miller, D. S.; Pritchard, J. B. The flounderorganic anion transporter fOat has sequence, function, and substratespecificity similarity to both mammalian Oat1 and Oat3. Am. J.Physiol.: Regul., Integr. Comp. Physiol. 2006, 291, R1773−R1780.(37) Meier-Abt, F.; Hammann-Hanni, A.; Stieger, B.; Ballatori, N.;Boyer, J. The organic anion transport polypeptide 1d1 (Oatp1d1)mediates hepatocellular uptake of phalloidin and microcystin intoskate liver. Toxicol. Appl. Pharmacol. 2007, 218, 274−279.(38) Boaru, D. A.; Dragos, N.; Schirmer, K. Microcystin-LR inducedcellular effects in mammalian and fish primary hepatocyte cultures andcell lines: A comparative study. Toxicology 2006, 218, 134−148.(39) Torstensen, B.; Nanton, D.; Olsvik, P.; Sundvold, H.; Stubhaug,I. Gene expression of fatty acid-binding proteins, fatty acid transportproteins (cd36 and FATP) and β-oxidation-related genes in Atlanticsalmon (Salmo salar L.) fed fish oil or vegetable oil. Aquacult. Nutr.2009, 15, 440−451.(40) Liu, R.; Denovan - Wright, E. M.; Wright, J. M. Structure,linkage mapping and expression of the heart-type fatty acid-bindingprotein gene (fabp3) from zebrafish (Danio rerio). Eur. J. Biochem.2003, 270, 3223−3234.(41) Ando, S.; Xue, X.-H.; Tibbits, G. F.; Haunerland, N. H. Cloningand sequencing of complementary DNA for fatty acid binding proteinfrom rainbow trout heart. Comp. Biochem. Phys. B 1998, 119, 213−217.(42) Londraville, R. L.; Sidell, B. D. Cold acclimation increases fattyacid-binding protein concentration in aerobic muscle of striped bass,Morone saxatilis. J. Exp. Zool. 1996, 275, 36−44.
(43) Di Pietro, S. M.; Dell’Angelica, E. C.; Veerkamp, J. H.; Sterin-Speziale, N.; Santome, J. A. Amino acid sequence, binding propertiesand evolutionary relationships of the basic liver fatty-acid-bindingprotein from the catfish Rhamdia sapo. Eur. J. Biochem. 1997, 249,510−517.(44) Zhou, J.; Stubhaug, I.; Torstensen, B. E. Trans-membraneuptake and intracellular metabolism of fatty acids in Atlantic salmon(Salmo salar L.) hepatocytes. Lipids 2010, 45, 301−311.(45) Zhang, W.; Zhang, Y.; Zhang, H.; Wang, J.; Cui, R.; Dai, J. Sexdifferences in transcriptional expression of FABPs in zebrafish liverafter chronic perfluorononanoic acid exposure. Environ. Sci. Technol.2012, 46, 5175−5182.(46) Jones, P.; Hu, W.; De, C., W; Newsted, J.; Giesy, J. Binding ofperfluorinated fatty acids to serum proteins. Environ. Toxicol. Chem.2003, 22, 2639−2649.(47) Inoue, Y.; Hashizume, N.; Yakata, N.; Murakami, H.; Suzuki, Y.;Kikushima, E.; Otsuka, M. Unique physicochemical properties ofperfluorinated compounds and their bioconcentration in common carpCyprinus carpio L. Arch. Environ. Con. Tox. 2012, 62, 672−680.(48) Webster, E.; Ellis, D. Equilibrium modeling: A pathway tounderstanding observed perfluorocarboxylic and perfluorosulfonic acidbehavior. Environ. Toxicol. Chem. 2011, 30, 2229−2236.(49) Armitage, J.; Arnot, J.; Wania, F.; Mackay, D. Development andevaluation of a mechanistic bioconcentration model for ionogenicorganic chemicals in fish. Environ. Toxicol. Chem. 2013, 32, 115−128.(50) Kudo, N.; Suzuki, E.; Katakura, M.; Ohmori, K.; Noshiro, R.;Kawashima, Y. Comparison of the elimination between perfluorinatedfatty acids with different carbon chain length in rats. Chem. Biol.Interact. 2001, 134, 203−216.(51) Gannon, S.; Johnson, T.; Nabb, D.; Serex, T.; Buck, R.;Loveless, S. Absorption, distribution, metabolism, and excretion of[14C]-perfluorohexanoate ([14C]-PFHx) in rats and mice. Toxicology2011, 283, 55−62.(52) Han, X.; Snow, T. A.; Kemper, R. A.; Jepson, G. W. Binding ofperfluorooctanoic acid to rat and human plasma proteins. Chem. Res.Toxicol. 2003, 16, 775−781.(53) Qin, P.; Liu, R.; Pan, X.; Fang, X.; Mou, Y. Impact of carbonchain length on binding of perfluoroalkyl acids to bovine serumalbumin determined by spectroscopic methods. J. Agric. Food Chem.2010, 58, 5561−5567.(54) Bischel, H.; Macmanus-Spencer, L. A.; Luthy, R. Noncovalentinteractions of long-chain perfluoroalkyl acids with serum albumin.Environ. Sci. Technol. 2010, 44, 5263−5269.(55) Han, X.; Nabb, D. L.; Russell, M. H.; Kennedy, G.; Rickard, R.Renal elimination of perfluorocarboxylates (PFCAs). Chem. Res.Toxicol. 2012, 25, 35−46.(56) Woodcroft, M.; Ellis, D.; Rafferty, S.; Burns, D.; March, R.;Stock, N.; Trumpour, K.; Yee, J.; Munro, K. Experimental character-ization of the mechanism of perfluorocarboxylic acids’ liver proteinbioaccumulation: The key role of the neutral species. Environ. Toxicol.Chem. 2010, 29, 1669−1677.(57) Foy, B.; Frazier, J. Incorporation of protein-binding kinetics andcarrier-mediated membrane transport into a model of chemicalkinetics in the isolated perfused rat liver. Toxicol. Mech. Methods2003, 13, 53−75.(58) Robinson, P.; Rapoport, S. Kinetics of protein-bindingdetermine rates of uptake of drugs by brain. Am. J. Physiol. 1986,251, R1212−R1220.(59) Barron, M.; Tarr, B.; Hayton, W. Temperature-dependence ofcardiac output and regional blood flow in rainbow trout Salmogairdneri Richardson. J. Fish Biol. 1987, 31, 735−744.(60) Gingerich, W.; Pityer, R.; Rach, J. Estimates of plasma, packedcell and total blood-volume in tissues of the rainbow-trout (Salmogairdneri). Comp. Biochem. Phys. A 1987, 87, 251−256.(61) Bushnell, P. G.; Conklin, D. J.; Duff, D.; Olson, K. Tissue andwhole-body extracellular, red blood cell and albumin spaces in therainbow trout as a function of time: A reappraisal of the volume of thesecondary circulation. J. Exp. Biol. 1998, 201, 1381−1391.
Environmental Science & Technology Article
dx.doi.org/10.1021/es400981a | Environ. Sci. Technol. 2013, 47, 7214−72237222

(62) Soldatov, A. Organ blood flow and vessels of microcirculatorybed in fish. J. Evol. Biochem. Physiol. 2006, 42, 243−252.(63) Ellmerer, M.; Schaupp, L.; Brunner, G. A.; Sendlhofer, G.;Wutte, A.; Wach, P.; Pieber, T. R. Measurement of interstitial albuminin human skeletal muscle and adipose tissue by open-flow micro-perfusion. Am. J. Physiol.: Endocrinol. Metab. 2000, 278, E352−E356.(64) Levitt, D. The pharmacokinetics of the interstitial space inhumans. BMC Clin. Pharmacol. 2003, 3, 3.(65) Londraville, R. Intracellular fatty acid-binding proteins: Puttinglower vertebrates in perspective. Braz. J. Med. Biol. Res. 1996, 29, 707.(66) Moroi, Y.; Yano, H.; Shibata, O.; Yonemitsu, T. Determinationof acidity constants of perfluoroalkanoic acids. Bull. Chem. Soc. Jpn.2001, 74, 667−672.(67) Lo pez-Fontan, J. L.; Sarmiento, F.; Schulz, P. C. Theaggregation of sodium perfluorooctanoate in water. Colloid Polym.Sci. 2005, 283, 862−871.(68) Goss, K. U. The pKa values of PFOA and other highlyfluorinated carboxylic acids. Environ. Sci. Technol. 2008, 42, 456−458.(69) Cheng, J.; Psillakis, E.; Hoffmann, M.; Colussi, A. Aciddissociation versus molecular association of perfluoroalkyl oxoacids:Environmental implications. J. Phys. Chem. A 2009, 113, 8152−8156.(70) D’Eon, J. C.; Simpson, A.; Kumar, R.; Baer, A.; Mabury, S.Determining the molecular interactions of perfluorinated carboxylicacids with human sera and isolated human serum albumin usingnuclear magnetic resonance spectroscopy. Environ. Toxicol. Chem.2010, 29, 1678−1688.
Environmental Science & Technology Article
dx.doi.org/10.1021/es400981a | Environ. Sci. Technol. 2013, 47, 7214−72237223
Copyright © 2022 FDOKUMEN