
Residents' Satisfaction with Residential Property Management ...
226
Environmental Technology & Science Journal Vol. 8 No. 2 December 2017 1 Residents’ Satisfaction with Residential Property Management Services in Abuja, Nigeria Shien S. Kuma Department of Estate Management and Valuation, School of Environmental Technolgy, Federal University of Technology, Minna, Nigeria [email protected] Abstract This study evaluates the satisfaction of residents with residential property management services in Kubwa, a residential neighbourhood in Abuja, Nigeria. To achieve this, the study measures the levels of satisfaction of residents with their dwelling units (buildings) and management service delivery. It also analysed the relationship between residential satisfaction and residents’ willingness to remain in their current dwellings over a period of time. Data was collected mainly through a structured questionnaire survey distributed to 330 residents with a response rate of 68%. The analysis was made with the use of descriptive statistics, residential satisfaction index and linear regression technique. Findings revealed that residents are moderately satisfied with their overall residential dwellings which include buildings and management service components (63.2%). However, between the two residential components, they were highly satisfied with their buildings (76.2%) but expressed rather very low satisfaction with the quality of management services provided. It was also found that the residents’ overall level of satisfaction did not influence significantly their decision to continue to stay in their residential dwellings (R 2 =.123). The study recommends adoption of satisfaction evaluation as part of property management routine feedback; will enable the property managers to improve the quality of service delivery. Keywords: Dwelling unit, Property Management Services, Residents, Satisfaction; Introduction A residential property is a product with physical, social and economic values which exert influence on a user’s wellbeing and utility optimisation. As a home, a typical residential dwelling unit is expected to satisfy an occupant’s physical, physiological and psychological needs or requirements. However, for these expected satisfaction to be met appropriately, Ibem, Opoko, Adeboye and Amole (2013) emphasised that requisite expertise knowledge of professionals as well as established government regulations and standards becomes pertinent. Satisfaction with a residential dwelling as explained by McCary and Day (1977), is the degree or level of contentment experienced by an occupant with regards to their current residential environment. The level of contentment experienced and expressed by the occupants/users relates significantly to the overall performance of such residential dwelling. According to Abolade, Omirin and Dugeri (2013), a product’s performance is the most important factor for satisfaction. This means that the higher the performance of a product, the more satisfaction consumers tend to derive from its consumption. Hence for occupants to attain a level of satisfaction with the use of a residential property, its quality in term of performance must be at its optimum and tended towards meeting their requirements.
-
Upload
khangminh22 -
Category
Documents
-
view
6 -
download
0
Transcript of Residents' Satisfaction with Residential Property Management ...

Environmental Technology & Science Journal Vol. 8 No. 2 December 2017
1
Residents’ Satisfaction with Residential
Property Management Services in Abuja,
Nigeria
Shien S. Kuma Department of Estate Management and Valuation, School of Environmental Technolgy,
Federal University of Technology, Minna, Nigeria [email protected]
Abstract This study evaluates the satisfaction of residents with residential property management
services in Kubwa, a residential neighbourhood in Abuja, Nigeria. To achieve this, the study
measures the levels of satisfaction of residents with their dwelling units (buildings) and
management service delivery. It also analysed the relationship between residential
satisfaction and residents’ willingness to remain in their current dwellings over a period of
time. Data was collected mainly through a structured questionnaire survey distributed to 330
residents with a response rate of 68%. The analysis was made with the use of descriptive
statistics, residential satisfaction index and linear regression technique. Findings revealed
that residents are moderately satisfied with their overall residential dwellings which include
buildings and management service components (63.2%). However, between the two
residential components, they were highly satisfied with their buildings (76.2%) but expressed rather very low satisfaction with the quality of management services provided. It
was also found that the residents’ overall level of satisfaction did not influence significantly
their decision to continue to stay in their residential dwellings (R2=.123). The study
recommends adoption of satisfaction evaluation as part of property management routine
feedback; will enable the property managers to improve the quality of service delivery.
Keywords: Dwelling unit, Property Management Services, Residents, Satisfaction;
Introduction A residential property is a product with
physical, social and economic values which
exert influence on a user’s wellbeing and
utility optimisation. As a home, a typical
residential dwelling unit is expected to
satisfy an occupant’s physical,
physiological and psychological needs or requirements. However, for these expected
satisfaction to be met appropriately, Ibem,
Opoko, Adeboye and Amole (2013)
emphasised that requisite expertise
knowledge of professionals as well as
established government regulations and
standards becomes pertinent.
Satisfaction with a residential dwelling as
explained by McCary and Day (1977), is
the degree or level of contentment
experienced by an occupant with regards to
their current residential environment. The
level of contentment experienced and
expressed by the occupants/users relates
significantly to the overall performance of
such residential dwelling. According to
Abolade, Omirin and Dugeri (2013), a
product’s performance is the most
important factor for satisfaction. This
means that the higher the performance of a
product, the more satisfaction consumers tend to derive from its consumption. Hence
for occupants to attain a level of
satisfaction with the use of a residential
property, its quality in term of performance
must be at its optimum and tended towards
meeting their requirements.

Shien S. Kuma Residents’ Satisfaction with Residential Property Management Services in Abuja, Nigeria
2
Multi-tenanted residential dwellings/
environment sometimes provides for the
use of common spaces, facilities and
services which in a large number of cases,
is inevitable. Where this is the case, two
basic requirements become evident; first is the requirement for expertise residential
service delivery to enhance the
comfortability and satisfaction of
occupants (Olanrele & Thontteh, 2014).
The second being the requirement for
financial resources to continue to deliver
such management services (Priemus, 1999;
Tawal et al., 2011). For the latter, however,
the sources for such type of finance usually
come through the determination and
collection of service charge which is paid
by tenants aside from their prescribed rents. Therefore, to ensure efficiency in property
management by experts, efforts towards
assessing users’ levels of satisfaction at a
certain point in time is pertinent. This
assessment according to Thontteh and
Olanrele (n.d) will provide an
understanding of customers’ expectation
that will help in the identification of gaps
in the quality of service delivery. Thus, in
filling these gaps, it will also contribute
significantly towards the efficient and effective manner in which property
management services are provided for the
benefit of both the occupants (user) and the
landlord (Jeffres & Dobos, 1995; Liias,
1998).
The concept of utility under the theory of
consumer behaviour explains utility simply
as the ability of a good or service to yield
satisfaction to the consumer. It also refers
to the amount of satisfaction derived from
the consumption or use of a commodity at a particular time which forms the major
determinant of consumers demand for such
goods/services and their willingness to
continue to pay for same (Menger, 2007).
However, the practice of residential
property management in Nigeria often
presents quite the opposite of this utility
concept. For instance, Thontteh and
Olanrele (n.d) observed that property
managers are most time engrossed in the
income being generated from buildings much to the disadvantage of its satisfaction
to the tenants. Ironically, tenants
sometimes do not react effectively to the
dissatisfactory manner these services are
delivered even when they specifically paid
for such. Although, Abolade et al. (2013)
noted that, sometimes tenants are more satisfied with the buildings meeting their
personal needs or requirements than the
services provided. In this wise, they will
continue to pay for the occupation of such
properties that do not provide them with
the optimum utility.
Stemming from the above, the study aims
at evaluating the levels of tenants’
satisfaction with their residential buildings
and management services. Also to assess
the relationship between satisfaction levels of residential dwelling units and residential
management services as well as attempts to
ascertain if tenants willingness to stay in
their residential dwellings can be
influenced significantly by their level of
residential satisfaction.
Literature Review
Residential Satisfaction Evaluation:
Conceptual Issues Satisfaction generally can be referred to as that state of mind that explains an
individual’s fulfilment of a need or desire.
It is the intrinsic relationship shared
between man and his object of value
expressed through sentimental or rational
responses or both. Thus in explaining
tenant’s evaluation of a dwelling unit
especially residential, the foremost
consideration here is how they respond to
their residential environment. Ajzen and
Fishbein (1981) provided a trilogy conceptual model in explaining people’s
general responses to their residential
environment. These are; Affective
responses (which deals with occupant’s
feelings or emotional state of mind),
Cognitive responses, referring to an
occupant’s moral conviction or belief/logic,
and Behavioural which deals with physical,
attitude/character.
Among the early studies that made use of this trilogy conceptual model were those of

Environmental Technology & Science Journal Vol. 8 No. 2 December 2017
3
Francescato, Weidemann, Anderson and
Chenoweth (1974), and Marans and Rogers
(cited in Weidemann & Anderson, 1985).
They adopted two of the three elements in
the model which were the affective and
cognitive responses while evaluating residential satisfaction. Francescato et al.
(1974) idealised satisfaction of a residential
unit as a function of different variables
which are categorised into affect; residents’
characteristics such as age, sex, income,
previous housing experience etc and
cognitive; the physical residential
environment, management and other
occupants. The outcome from their study
following this model indicates that
information from previous occupants,
socio-economic characteristics and relationship with others (attitude) within
the residential area will significantly
influence the emotional state of mind of an
individual hence a positive or negative
response.
The third element in the trilogy conceptual
model is ‘Behaviour’. This explains the
fact that person’s behaviour is influenced
by satisfaction, perception as well as an
assessment of the objective residential environment attributes and the objective
attributes of the environment itself
(Weidemann & Anderson, 1985). Newman
and Duncan (1979) also consider
residential satisfaction as a predictor of
behaviour, inferring that the more satisfied
an individual or persons are with their
residential unit, the positive their attitude
towards such residential environment and
vice versa. Thus this attitude (behaviour) as
resulting from residential dissatisfaction
according to Jiboye (2012), could lead to an adjustment in form of relocation or
intention to relocate. However, Fishbein
and Ajzen (1975) contended that behaviour
intentions are seen as mediating between
one’s affective responses and actual
behaviour and as such, an occupant/tenant
may have negative feelings towards their
home probably due to dissatisfaction with
certain attributes, they may not have the
intention to leave or move out. Intention or
willingness to move is also supported by the socio-economic status of residents and
not just their level of satisfaction (Hui &
Yu, 2009). Sometimes the length of stay,
social bonds and other residents attitude
influence decision to stay despite low
satisfaction with dwelling unit (Galster &
Hesser, 1981).
Therefore, to understand the well-being of
occupants within their residential
environment, a measure of their affective
and cognitive responses to either of their
dwelling units or management components
becomes imperative (Adriaanse, 2007).
Amole (2009) and Mohit et al. (2010) also
opined that for an effective residential
satisfaction evaluation, the analysis should
be made of the affective response variables
which are basically subjective. These includes the physiological and
psychological state of an occupant that
deals with perception, emotions and
aspirations. Also, the cognitive response
variables which are the objective
environment variables and includes the
physical characteristics of the residential
environment as well as facilities and
services (Theodori, 2001). Quite a
substantial number of studies on residential
satisfaction in Nigeria has operationalised a combination of two or three elements of the
trilogy concept. They either adopt the
measure of the entire residential
components (Waziri et al., 2013; Jiboye,
2013; Ibem et al., 2013), or a selected
components often relating to residential
service delivery (Olanrele & Thontteh,
2014). The choice of evaluation of
dwelling components and management
service were adopted by Ilesanmi (2010)
and Tawil et al. (2011).
Users’ Satisfaction with Residential
Building and Management Services Buildings are one of the key elements or
components required in the overall
residential satisfaction evaluation. Like any
other economic product, residential
buildings are designed and constructed to
meet the expectations and aspirations of the
developer, investor and occupants in
various ways (Parker & Matthews, 2001).
It has been shown in some studies that the

Shien S. Kuma Residents’ Satisfaction with Residential Property Management Services in Abuja, Nigeria
4
affective response to building satisfaction
is a major predictor of behaviour (Priemus,
1986; Ibem & Amole, 2012). Thus, in the
assessment or measurement of users’
satisfaction with a particular dwelling unit,
a breakdown of the residential building unit into subunits such as the living area (sitting
room), bedrooms sizes, kitchen spaces,
windows, finishes, toilets/bathrooms
becomes necessary. This will provide a
statistical evidence on those components
that contributes significantly to the overall
satisfaction of the dwelling units (see
Ukoha & Beamish, 1997; Salleh, 2008).
Further, Karstein (2006) and Adriannse
(2007) asserted that satisfaction levels of
the dwelling unit at a particular point in
time can be explained by the characteristics of the households which includes
composition, age, sex and income. A
household’s size may not increase in terms
of numbers but as the family grows, some
members of the family may require more
space for privacy and so on. Hence,
number of rooms and their sizes become
essential to the overall satisfaction of the
dwelling unit. Ibem et al. (2013) relate the
personal characteristics of users versus
those of the physical characteristics of the dwellings in their study. Their findings
revealed 3 most important dimension in the
variables construct that contribute
significantly to the overall residential
satisfaction. These were location, aesthetic
appearance of buildings and sizes of its
components.
Another component aside from building
that contributes to the overall residential
satisfaction is the management service
delivery. Very few literature focusing specifically on the assessment of occupants
satisfaction with quality residential
management service delivery exist in
Nigeria. Olanrele and Thontteh (2014) is
one of the few and comprehensive studies
in this regard. Others adopt a combination
of dwelling units, environmental subsystem
and management services. (see Ilesanmi,
2010; Clement & Kayode, 2012; Jiboye,
2013). Most of the items of the
management service components evaluated by the aforementioned studies include;
security, water supply, waste disposal,
cleaning of common areas, general repairs
and quality of maintenance work as well as
the lighting of common areas. Findings
from these studies indicate significantly
low satisfaction levels among occupants with residential management service
delivery in public and private estates. The
study of Ukoha and Beamish (1997) in
Abuja revealed that residents expresses
higher satisfaction with their residential
environment attributes but expressed
dissatisfaction with their dwelling units and
management services provided. The study
of Waziri et al. (2013) which uses another
residential neighbourhood in Abuja made a
similar finding, although Jiboye (2013)
found residents to be highly satisfied with their dwelling units and environment
attributes but were dissatisfied with the
delivery of management services. Liu
(1999) in Hong Kong observed a higher
dissatisfaction with the level of
maintenance and cleanliness of common
areas among the measured variables in his
study. Elsewhere in Kuala Lumpur, the
studies of Mohit, Ibrahim and Rashid
(2010) and Tawil et al. (2011) also show
that occupants were dissatisfied with management services provided. Infact
Tawil et al. (2011) also found that
occupants adjudged the amount paid for
services to be quite higher relative to the
actual quality of services provided.
Evidence from literature thus far has shown
a pattern of poor management service
delivery to residents as expressed in their
levels of dissatisfaction compared to levels
of satisfaction mostly with the residential
dwelling units and environment attributes.
Methodology
Data sources and collection A survey of Kubwa, a satellite residential
precinct in Abuja was carried out covering
Phase I Site I (FHA), Phase II Site I and II.
This neighbourhood has a significant
number of residential accommodation
types ranging from single units (self-
contained) one bedroom flats to semi-
detached and detached 4-bedroom
accommodations. It is also home to a wide

Environmental Technology & Science Journal Vol. 8 No. 2 December 2017
5
category of income households
comparatively. Following the record
obtained from Abuja Electricity
Distribution Company (AEDC) office, a
total estimated residential units of 2,373 in
the area was obtained. In determining the appropriate sample size (Ss) that will be
statistically significant for the survey, the
following formula was used:
Ss =
Z = Standardised normal value (confidence
level) of 95% (1.96), P is the estimated rate
(47%) and C is the confidence interval
(5%). Thus a sample size of approximately
330 residential units was arrived at. Hence
a set of 330 questionnaires were distributed
to purposively selected residents in the area
who were leaseholders and also paying for
some management services (service
charge). A total of 236 (72%) were retrieved, however, only 207 (88%) of the
returned questionnaires were properly
filled and valid for analysis. The structured
questionnaire used contained three (3)
sections, the first section required
information on respondents’ socio-
economic characteristics. The second
section measures residents’ satisfaction
levels with the dwelling unit component
and management services, while the third
measured respondents’ willingness to
continue to stay in their residential dwelling units over a given period of time.
A 5-point Likert scale with Very Low
Satisfaction (1), Low Satisfaction (2),
Moderately Satisfied (3), High Satisfaction
(4) and Very High Satisfaction (5) was
adopted and some of the variables used in
the study construct were generated from
earlier literature with modifications to align
with the research concept (see Ukoha &
Beamish, 1997; Ebiaribe & Umeh, 2015).
A total of 20 items were generated comprising 10 subunits each of the
dwelling unit and management services
components respectively. On the
measurement of respondents’ willingness
or intention to stay, a period of 5 years
interval effective from the date of the
survey was used. The options were; (a)
next 5 Years (≤ 5years), (b) 6-10years, (c)
11-15years, and (d) 16years and above and
a scale of 1 to 4 was provided for the
respondents. These are; 1=Not Willing,
2=Uncertain, 3=Willing and 4=Very
Willing.
Reliability analysis of the measured
variables Following the nature of data obtained and scale of measurement used, the reliability
of the measured responses from the items
was tested using the Cronbach’s alpha (α)
technique. This provides a reliable estimate
that simultaneously considers all possible
ways of splitting the test items into the
inter-item correlational matrix (Adriaanse,
2007). The test was conducted on the
dwelling units and management services
components comprising of 10 variables
respectively and was performed using the
formula (1) below:
α =
(1)
Where is the loading value of each
measurement item and = 1–
The outcome shows that the variables in
the dwelling unit construct has an alpha
coefficient of .678 while .776 for the management services component. This is
considered an acceptable level of reliability
which is above the minimum recommended
level of .60 for social sciences researches
(Sekaran, 2003; Park, Heo & Rim, 2008).
The test result suggests that the tenants
were more consistent in evaluating their
satisfaction with management service
delivery than the dwelling units
component.
Determination of Satisfaction Index
(SI) Satisfaction index (SI) for a particular unit
of a residential component say a, is
measured as; SIa =
[∑
(2)
Where SIa is the Satisfaction Index for
Unit a of the Residential Component;

Shien S. Kuma Residents’ Satisfaction with Residential Property Management Services in Abuja, Nigeria
6
indicates the values
representing levels of satisfaction scaled
while represents the actual
score by respondents on the variable,
is the maximum possible score that
variable could have on the scale used,
while N is the number of respondents under
a. Further, Residential Satisfaction Index (RSI) which is the sum total of the
component satisfaction indices (Mohit et
al., 2010), is measured in this study based
on Dwelling (D) and Management Services
(M) components. It was determined using
the following equation;
RSIDM =
[∑(
(3)
Where RSIDM is the residential satisfaction
index of tenants with components D and M,
and are the total weighted
frequencies for D and M components,
= are the total number of
respondents under the D and M
components,
= represents the number of
variables being scaled under the D and M
components,
For a better understanding of the analysis
on satisfaction levels, a scale is required as a benchmark to aid the interpretation of the
outcomes. Bello and Ajayi (2010) provided
a justifiable scale as modified from
Onibokun (1974) which adopted and used
for this study. It provides that the
maximum value the RSI can attain is 100%
while 25% is the minimum value. Thus the
scale is as follows;
1. 0 ≤ 50% = Very
Low level of satisfaction
2. 51 – 59% = region
of Low satisfaction
3. 60 – 69% = region
of satisfaction
4. 70 & above = region
of high level satisfaction.
Finally, a regression analysis was
conducted to determine the relationship
between the level of residential satisfaction
and residents willingness to stay. This is
also meant to ascertain if residents’
satisfaction with their residential
environment has a significant influence on
their decision to continue to stay.
Results and Discussion
Socio-economic data of respondents
The outcome of the survey shows the
predominance of married residents within
the modal age range of 45 – 55 years. They
are mostly under government employment
which accounted for 44.9% and closely
followed by those under the employment of
the organised private sector with 41.5%.
Also, the majority of the respondents earn between N2.5 and N4.0 million annually
(37.7%) and 10.1% earned between N6.0
million and above. Despite their income
levels, a substantial number of the
respondents have a high preference for 2
and 3 bedroom apartments which
constituted 39.1% and 38.2% respectively.
The least being those occupying 4 bedroom
apartments with 14.0%.
Table 2 shows data on respondents’
residential satisfaction with their dwelling units and management services in the study
area.

Environmental Technology & Science Journal Vol. 8 No. 2 December 2017
7
Table 1. Socio-economic status of respondents
Items Category Freq %
Age of Respondents (Years) 25 – 35 21 10.1
36 – 45 56 27.1
46 – 55 67 32.4
56 – 65 45 21.7
66 + years 18 8.7
Marital Status Married 151 72.9
Divorced 17 8.2
Widowed 11 5.3
Single 28 13.5
Occupational Sectors Public Servant 93 44.9
Private employee 86 41.5
Self-employed 28 13.6
Income Levels (N’million) 0.5 - 2.0 71 34.3
(Annual) 2.5 - 4.0 78 37.7
4.5 – 6.0 37 17.9
6.5 & above 21 10.1
Accommodation Type One Bedroom 18 8.7
Two Bedroom 81 39.1
Three Bedroom 79 38.2
Four Bedroom & above 29 14.0
Total 207

Shien S. Kuma Residents’ Satisfaction with Residential Property Management Services in Abuja, Nigeria
8
Table 2: Respondents’ measure of residential satisfaction
Component Component Subunit 1 2 3 4 5
Wfx
Mean
Dwelling Unit (Building)
Interior Wall Finishes 0 14 54 93
46 792
3.826
Floor Finishing 0 9 76 85
37 771
3.725
Ceiling Type 0 5
62
115
25 781
3.773
Room Sizes 0 5
65 89
48 801
3.870
Kitchen Size 0 4 72 93
38 786
3.797
Sitting room size 0 0
58
103
46 816
3.942
External wall finishing 0 4
75 95
33 778
3.758
Window types/sizes 0 13
35
117
42 809
3.908
Landscape/walk ways 0 7
75 89
36 775
3.744
Toilet/Bathrooms 0 6
7
9 83
3
9 776
3.74
9
Management Services
Cleanliness of common areas 34 72 52 36
13 543
2.623
Fire safety equipment 17 60 76 36
18 599
2.894
Water provision 36 85
36 37
13 527
2.546
Security services 40 95 29 33
10 499
2.411
Generating set 30 94
75 8 0 475
2.295
Prompt response to defects 29 98
43 30 7 509
2.459
Waste disposal 34 75
57 30
11 530
2.560
Quality of maintenance work done 35 87
42 33
10 517
2.498
Security Lighting 40 79
4
8 32 8 510
2.46
4
Amount paid in relation to service delivery 16 98
93 0 0 491
2.372
1 = Very Low satisfaction, 2 = Low Satisfaction, 3 =Moderately Satisfied, 4 = High Satisfaction, 5 = Very High Satisfaction Wfx = Total Weighted frequency

Environmental Technology & Science Journal Vol. 8 No. 2 December 2017
9
A measure of the residents’ willingness to
stay in their dwelling units over a given
period of time as shown in Table 3 below
reveals a mean response of 3.609 for those
willing to stay within the next 5 years.
Those who indicated their desire to stay for up to between 6 years and 10 years
followed closely with a mean response of
3.488. However, the responses for 11 – 15
years and 16 years and above diminishes
respectively indicating that some of the
residents may not be keen to continue to
stay in their present dwelling units.
The results from the overall residential
satisfaction with both dwelling units and
management services RSIDM indicates .632
(63.2%) which depicts that residents of the
study area are satisfied. The satisfaction
level as expressed by the residents is found
to be considerably higher with the dwelling
units component than the management
services provided. This is shown by a satisfaction index RSID of .762
representing 76.2% for dwelling unit
component which is also found to
contribute most significantly to the overall
residential satisfaction in the study area.
However, the residents expressed a low
level of satisfaction with the management
services as shown by a satisfaction index
RSIM of .502 which indicates 50.2% thus
contributing least to the overall residential
satisfaction in the study area
Table 3: Respondents’ willingness to stay in their residential dwellings
1 2 3 4 Sum Wfx Mean
Next 5 years 4 9 51 143 207 747 3.609
6 - 10 years 6 8 72 121 207 722 3.488
11 - 15 years 6 38 102 61 207 632 3.053
16 + years 33 94 69 11 207 472 2.280
1 = Not Willing, 2 = Uncertain, 3 = Willing, 4 = Very Willing
Table 4: Residential Satisfaction Index
Component Index Level (%)
RSIDM .632 63.2
RSID .762 76.2
RSIM .502 50.2
RSIDM = Overall Residential Satisfaction Index (Dwelling & Management Components) RSID = Residential Satisfaction Index for Dwelling unit Component, RSIM = Residential Satisfaction Index for Management Component,
Results of the unit by unit analysis of the
satisfaction levels is presented in Tables 5
and 6 below. This shows the satisfaction
index of each subunit of the dwelling and
management services components
respectively and is arranged in a
descending order of significance.
The units analysis results of residential
satisfaction has shown that, the sitting
room (78.84%), window types/sizes
(78.16%), bedroom sizes (77.39%), interior
wall finishes (76.52%) and kitchen sizes
(75.94%) contributes most significantly to
the overall satisfaction level of the
dwelling units. On the items in the
management services provided (see Table
5), the provision of fire services (57.87%), cleanliness of common areas (52.46%),
waste disposal (51.21%) and water
provision (50.92%) are the items tenants
expresses satisfaction levels above 50%.
Table 5: Satisfaction index for subunits of Dwelling component
Dwelling Component Wfx Mean StDev RSI SIa
Sitting room size 816 3.942 .708 .788 78.84

Shien S. Kuma Residents’ Satisfaction with Residential Property Management Services in Abuja, Nigeria
10
Window Type/sizes 809 3.908 .786 .782 78.16
Bedroom sizes 801 3.870 .793 .774 77.39
Interior Wall finishes 792 3.826 .853 .765 76.52
Kitchen size 786 3.797 .755 .759 75.94
Ceiling type 781 3.773 .684 .755 75.46
Exterior Wall finishes 778 3.758 .737 .752 75.17
Toilet/Bathrooms 776 3.749 .791 .750 74.98
Landscape/walk ways 775 3.744 .780 .749 74.88
Floor finishing 771 3.725 .804 .745 74.49
Wfx = Weighted Frequency, RSI = Residential Satisfaction Index, SIa = Satisfaction Level of a subunits
Table 6: Satisfaction index for Management Services
Management Services Wfx Mean StDev RSI SIa
Fire safety equipment 599 2.894 1.065 .579 57.87
Cleanliness of common areas 543 2.623 1.138 .525 52.46
Waste disposal 530 2.560 1.091 .512 51.21
Water provision 527 2.546 1.156 .509 50.92
Quality of maintenance work done 517 2.498 1.097 .500 49.95
Security Lighting 510 2.464 1.087 .493 49.28
Prompt response to defects 509 2.459 1.013 .492 49.18
Security services 499 2.411 1.115 .482 48.21
Amount paid in relation to service delivery 491 2.372 .625 .474 47.44
Generating Set 475 2.295 .760 .459 45.89
However, they expressed significant low
levels of satisfaction with 6 out of the 10
items of management services measured,
indicating satisfaction level below 50%.
They are mostly not satisfied with the quality of maintenance work being carried,
security lighting, promptness of managing
firms response to defects reported, security
services and alternative power provision.
They also consider the amount they are
paying currently as service charge quite
high in relation to the quality of services
being provided. Further, the outcome of the
regression analysis shows the R2 = .123
indicating that only 12.3% of the variation
in residents’ willingness to continue to stay
in their residential dwellings is explained
by their levels of satisfaction (RSIDM).
The P-value of .0001 is less than the α =
.05 indicating that there is a significant difference between residential satisfaction
and willingness to stay. This result also
infers that the model has a good predictive
ability for the level of residents’
willingness to stay hence, a 1% increase in
their satisfaction with their residential
environment, increases their willingness to
stay by 3.2%. The Beta value of .351
indicates that not much influence can be
exerted on residents’ willingness to stay by
their level of residential satisfaction

Environmental Technology & Science Journal Vol. 8 No. 2 December 2017
11
implying that the relationship is weak significantly
Table 7: Regression of Willingnes to Stay Vs Residential Satisfaction
Model Summary R = .351 R2 = .123 Adjusted
R2 = .119 P < .000
Unstandardized Coefficients
Standardized Coefficients t-value Sig.
B Std. Error Beta
1 (Constant) 7.075 1.005 7.042 .000
RSIDM .169 .032 .351 5.36 .000
a Dependent Variable: Willingness to Stay
.
Thus, the study findings revealed residents’
significant levels of satisfaction with their
residential dwelling units (buildings) which
includes unit spaces, aesthetics and
functional components. It shows an
obvious indication that the buildings are
meeting their needs and expectations. This
finding relates with those of Jiboye (2009)
and Ibem et al. (2013) respectively. Although the studies of Ukoha and
Beamish (1997) and Waziri et al. (2013)
that uses other residential precincts within
Abuja found otherwise. Further, the
residents expressed rather very low
satisfaction with the delivery of residential
management services by the property
managers. They are mostly not satisfied
with the delay in response to complaints
made on repairs, security arrangements and
generator services as well as the quality of maintenance work carried out. These
findings also aligned with those of Liu
(1999), Mohit et al. (2010) and Olanrele
and Thorntteh (2014) that also found
residents to be dissatisfied with
management services in their residential
dwellings.
Finally, the residents’ willingness to
remain in their residential dwellings over a
period of time is not substantially
influenced by their overall residential satisfaction. The results of the regression
analysis show a significantly weak
relationship explaining only 12.3%. This
outcome to a certain extent has confirmed
Hui and Yu (2009) position that intention
to move or stay is not exclusively
dependent on satisfaction but also the
socio-economic status of residents.
Sometimes due to the huge cost involved in
residential property development, people
tend to develop their homes on incremental
basis hence may be willing to remain in the current residential environment until they
have completed theirs.
Conclusion and Recommendation The study has evaluated residents’
satisfaction with their dwelling units and
management service components of their
residential environment. To achieve this,
residential satisfaction indices were
determined to measure their levels of
satisfaction with the dwelling components
as well as determine if the residents’
satisfaction has a significant influence on
their willingness to remain in their
respective dwelling units over a given period of time. The outcome shows that the
quality of residential property management
service delivery is significantly low
whereas, the dwelling units (buildings)
have continued to meet residents’ needs
and expectations hence they expressed high
satisfaction. Although despite their level of
satisfaction, it does not influence
significantly their decision to continue to
stay in their current dwelling environment.

Shien S. Kuma Residents’ Satisfaction with Residential Property Management Services in Abuja, Nigeria
12
Hence, the study recommends here that, as
a way forward for property managers to
improve their professional task, evaluation
of the quality of service delivery should be
part of property management routine and
results (indices developed) could be used as a basis for future assessment or
evaluation.
References Abolade A. O., Omirin M. M. & Dugeri, T.
T. (2013). An Evaluation of User’s
Satisfaction with Property
Management Services in Commercial
Properties in Lagos, Nigeria. ATBU
Journal of Environmental
Technology, 6(1) 66-76.
Adriannse, C. C. M. (2007). Measuring
Residential Satisfaction: a residential
environmental satisfaction scale
(RESS). Journal of Housing and Built
Environment. 2007(22) 287-304. http://dx.doi.org/10.1007/s10901-007-
9082-9
Ajzen, I., & Fishbein, M. (1981).
Understanding attitudes and
predicting social behaviour.
Englewood Cliffs, New Jersey:
Prentice-Hall.
Amole, D. (2009). Residential Satisfaction
in Students Housing. Journal of
Environmental Psychology, 29, 76-
85. Anderson, J.R. & Weidemann, S. (1985). A
conceptual framework for residential
satisfaction. In I. Altman & C. W.
Werner (Eds). Home
Environments.(Pp.153-181).New
York: Plenum Press.
Bello, V. A. & Ajayi, C. A. (2010).
Occupants’ Satisfaction and Rent paid
for residential properties close to
waste dump sites in Nigeria. Journal
of Sustainable Development, 3(1), 98-
103. Clement, O. I., & Kayode, O. (2012),
Public housing provision and user
satisfaction in Ondo State, Nigeria.
British Journal of Art and Social
Sciences, 8(1), 103-111.
Ebiaride, E. C. & Umeh, O. L. (2015),
Factors influencing users’ satisfaction
in public and private estates in Lagos,
Nigeria. ATBU Journal of
Environmental Technology, 8(2), 30-
41.
Francescato, G., Weidemann, S. &
Anderson, J. R. (1989). Evaluating
the built Environment from the Users’ Point of View: An Attitudinal Model
of Residential Satisfaction. In W.F.E.
Preiser (Ed). Building Evaluation,
(pp.181-198) New York: Plenum
Press.
Galster, G., & Hesser, G. W. (1981).
Residential satisfaction:
compositional and contextual
correlates. Environment and
Behaviour, 13, 735–758.
Hui, E. C. M. & Yu, K. H. (2009).
Residential mobility and ageing population in Hong Kong, Habitat
International, 33, 10-14.
Ibem, E. O., & Amole, D. (2012),
Residential satisfaction in public core
housing in Abeokuta, Ogun State,
Nigeria. Social Indicators Research.
http://dx.doi.org/10.1007/s11205-012-
0111-z
Ibem, E. O., Opoko, A. P., Adeboye, A. B.,
& Amole, D. (2013), Performance
evaluation of residential buildings in public housing estates in Ogun State,
Nigeria: Users’ satisfaction
perspective. Frontiers of
Architectural Research (2013) 2, 178
– 190.
http://dx.doi.org/10.1016/j.foar.2013.
02.001
Ilesanmi, A. O. (2010), Post-occupancy
evaluation and residents’ satisfaction
with public housing in Lagos,
Nigeria. Journal of Building
Appraisal. 6(2), 153-169.http://dx.doi.org/10.1057/jba.201
0.20
Jeffres, L. W., & Dobos, J. (1995).
Separating Peoples' Satisfaction with
Life and Public Perception of the
Quality of Life in the Environment.
Social Indicators Research, 34, 181–
211.
http://dx.doi.org/10.1007/BF0107919
6
Jiboye, A. D. (2009), Evaluating tenants’ satisfaction with public housing in

Environmental Technology & Science Journal Vol. 8 No. 2 December 2017
13
Lagos, Nigeria. Town Planning and
Architecture, 33(4); 239-247
Jiboye, A. D. (2012), Post-occupancy
evaluation of residential satisfaction
in Lagos, Nigeria: Feedback for
residential improvement. Frontiers of Architectural Research (2012) 1, 236
– 243.
http://dx.doi.org/10.1016/j.foar.2012.
08.001
Liias, R. (1998). Housing stock: the
facilities for future development.
Journal of Facilities, 16(11), 285-
294.
Liu, A.M.M. (1999) Residential
satisfaction in housing estates: A
Hong Kong perspective. Automation
in Construction, 8(4): 511 – 524. McCray, J. W., & Day, S. S. (1977),
Housing values, aspirations and
satisfaction as indicators of housing
needs. Home Economics, 5(4), 244-
254.
Menger, C. (2007). Principles of
Economics. Auburn, Alabama:
Ludwig von Mises Institute
Mohammed-Tamil, N., Che-Ani, A. I.,
Zain, M. F. M., Zaharim, A. & Jamil,
M. (2009). Owners’ satisfaction towards service charge collection of
high-rise residential in Kuala Lumpur,
Malaysia. Proceedings of the 4th
IASME/WSEAS International
conference on energy and
environment. EE, 2009. Pp. 328-331.
Mohit, M. A., Ibrahim, M. & Rashid, Y. R.
(2010). Assessment of residential
satisfaction in newly designed public
low-cost housing in Kuala Lumpur,
Malaysia. Habitat International,
34(1), 18-37, http://dx.doi.org/10.1016/j.habitatint.2
009.04.002
Newman, S. J., & Duncan, G. J. (1979).
Residential problems, dissatisfaction,
and mobility. Journal of the American
Planning Association, 45, 154–166.
Olanrele, O. O. & Thontteh, E. O. (2014).
FM Service Delivery and quality
service measurement in public high-
rise residential buildings in Nigeria.
The use of SERVIQUAL and Satisfaction index. Journal of
Management and Sustainability, 4(3),
145-156. URL:
http://dx.doi.org/10.5539/jms.v4n3p1
45 Accessed on July 28th, 2016
Parker, C., & Mathew, B. P. (2001).
Customer satisfaction: contrasting academic and consumers’
interpretations. Marketing
Intelligence and Planning. 19, 38-46.
Park, Y., Heo, P. & Rim, M. (2008).
Measurement of a Customer
Satisfaction Index for Improvement
of Mobile RFID Services in Korea.
ETRI Journal, 30 (5), 634-643.
Priemus, H. (1986). Housing as a social
adaptation process. A conceptual
scheme. Environment and Behaviour,
18, 109–131. Priemus, H. (1999). Social housing
management: concerns about
effectiveness and efficiency in the
Netherlands. Journal of Housing and
Built Environment. 18(3). 269-279.
Salleh, A. G. (2008): Neighbourhood
Factors in Private Low-cost Housing
in Malaysia. Habitat International 32,
485-493.
Sekaran, U. (2003), Research Methods for
Business, 4th Ed., John Wiley & Sons, New York, NY.
Tawil, N.M., Che-Ani, A.I., Ramly, A.,
Daud, M.N., & Abdullah, N.A.G.
(2011). Service charge issues in
Malaysian high-rise residential
management: An analysis using a
fuzzy conjoint model. International
Journal of the Physical Sciences.
6(3), 441-447. DOI:
http://dx.doi.org/10.5897/IJPS10.293
Theodori, G.I., (2001), Examining the
effects of community satisfaction and attachment on individual well-being.
Rural Sociology. 4(66), 618 – 628.
Thontteh, E.O., & Olanrele, O.O. (n.d).
Customer-Driven Service Quality
Designs and Standards: A catalyst for
Effective Property Management.
Retrieved on 18/11/2016 from
www.unilag.edu.ng/opendoc.php?sno
=27350&doctype=doc&docname
Ukoha, O., & Beamish, J.O. (1997).
Assessment of resident’s satisfaction with public housing in Abuja,

Shien S. Kuma Residents’ Satisfaction with Residential Property Management Services in Abuja, Nigeria
14
Nigeria. Habitat International, 21(4),
445-460.
http://dx.doi.org/10.1016/S0197-
3975(97)00017-9
Waziri, A.G., Yusuf, N., & Salleh, A.G.
(2011), Residential satisfaction with private housing estates development
in Abuja. Alan Cipta. 6(2), 3-12.
Weidemann, S., & Anderson, J. R. (1985).
A conceptual framework for
residential satisfaction. In I. Altman
& C. H. Werner (Eds.), Home
Environments. New York: Plenum
Press.


Environmental Technology & Science Journal Vol. 8 No. 2 December 2017
14
Spatial Growth in a Traditional Urban
Settlement of Ile-Ife, Nigeria: A Spatio-
Temporal Approach for Sustainable
Development
*Tunji Akinlotan; *Omotosho B. O. **Odegbenro F.J. and
***Okubena Modupeola R *Department of Urban and Regional Planning, The Oke-Ogun Polytechnic,
Saki Oyo State Nigeria **Center for Human Settlement and Urban Development (CHSUD),
Federal University of Technology, Minna ***Abraham Adesanya Polytechnic, Ijebu-Igbo Ogun State Nigeria
Abstract The desire for development of any human settlement is as important as the safety of its environment for both economic growth and development without which any growth cannot be
said to be sustainable. The paper analyzed the rate and trend of urban development in the last thirty years with a view to predicting the future rate and trend of development in Ile-Ife which
could serve as a veritable planning tool for a sustainable development. Primary and secondary data were used. The primary data was obtained, using GPS receiver to obtain the geographic
coordinates of strategic locations for the purpose of geo-referencing. The secondary dataset includes the use of Landsat imageries of 30m resolution, (1986, 1996 and 2006) and SPOT V
imagery of 5m resolution was used to map the land use land cover of the study area, the major roads, minor roads and major landmarks. The land use-land cover maps were created for different
identified land use classes as well as attribute tables for each spatial entity. GIS analyses in form of spatial and non-spatial queries were carried out to determine the rate, trend and magnitude of
urban development. In addition to this, the future rate and trend was also predicted using Cellular Automation within the GIS, the map output shows the trend of urban development. The results
showed that there is physical expansion of the Ile-Ife with a land consumption rate of 0.024 in the 1980’s, 0.026 in the 1990’s, 0.029 in 2000’s and an increased land absorption coefficient from
0.029 to 0.034 in the last three decades. This is evident in a positive change trend rate for the
major (0.8) and minor (0.4) urban centre while both disturbed forest (-0.8) and intensive agriculture (-0.4) has negative change trend rate. Besides, the trend of urban development to the
year 2020 was predicted with the major and minor urban centre still leading with a positive change trend of 1.7 and 0.9 respectively. The study concluded that with such an increase in land
consumption rate and land absorption in Ile-Ife, there are needs for development control, land readjustment and appropriate regulations in growth development, in order to maintain a balance
between preventing urban sprawl and providing land for sustainable housing development, without jeopardizing the future need.
Keywords: Urban growth pattern, Land-use/cover, GIS and remote sensing, Ile-Ife, Nigeria
Introduction Urbanization has been a universal and
important social and economic
phenomenon taking place all around the
world. This process, with no sign of
slowing down, could be the most powerful and visible anthropogenic force that has
brought about fundamental changes in land
cover and landscape pattern around the
world (Krishna, 2009). As a result, cities
and towns are growing faster than ever,
being a huge center for residence, industry,
trade and investment, communications,
infrastructure and social services among

Akinlotan; Omotosho,Odegbenro & Okubena Spatial Growth in a Traditional Urban Settlement of Ile-Ife, Nigeria: A Spatio-Temporal Approach for Sustainable
Development
15
others. However, this growth also triggers
numerous problems, environmental
pollution and degradation, increased
environmental hazards such as flooding,
population explosion, insufficient
sanitation and water supply, transport problems, poor housing conditions, rising
cost of living and wealth inequality, and
increase in crime, and loss of fertile
agricultural and wetlands are some of the
most prominent negative effects of rapid
urbanization and urban growth (UN-
Habitat 2011). If not managed properly,
these may intimidate sustainable
development of cities in the long run
(Dubovyk et. al. 2011).
Urban growth patterns are characteristics of spatial changes that take place in
metropolitan areas, the spatial
configuration and the dynamics of urban
growth are important topics of analysis in
the contemporary urban studies. Several
methods and techniques have been
developed and applied to quantify and
characterise the urban growth processes
and patterns. Traditionally, visual
interpretations of high resolution aerial
photographs were used to acquire comprehensive information for mapping of
urban areas. This mapping technique is
expensive and time consuming for the
estimation of urban growth. However, with
the gradual advancement and availability of
high temporal and spatial resolution remote
sensing imagery, the possibilities of
monitoring urban problems with a better
accuracy have become more promising.
Hence, accurate mapping of urban
environments and monitoring urban growth
is becoming increasingly important at the global level. Statement of Problem Rapid urban growth is normally accompanied by high population growth,
dramatic land use/cover change and social
transformations. Such rapid demographic
and environmental changes in the past
decades have resulted in environmental
degradation, haphazard physical
development, informal developments on
wetlands, and poor land use planning
practices (Jiboye 2005). Urban area is a
social, economic and natural compound
ecosystem with human activity at the
centre and with the speeding up of the
development of modern industry and
urbanization, as the core of regional system, the population of this area increase
quickly and urban size also grows.
Basically, according to Klosterman (1999),
planning and management of urban spaces
requires a comprehensive knowledge of the
development process and physical
dimension of cities. Most literature on the
analysis of the spatial characteristics of
cities growths highlight the temporal
dynamics, meanwhile Seto (2005) argue
that, most of these studies focus on cities in
the USA. Recently though, few studies have been conducted in Europe and some
Asian countries, however, less is studied in
relatively fast growing cities of Africa
using remote sensing and GIS techniques.
Thus it is worthwhile to expand the
application of GIS and remote sensing to
traditional fast growing African cities. This
study therefore filled this gap with a
detailed and comprehensive attempt,
adopted to evaluate growth rate in the study
area as it changes over time with a view to detecting the land consumption rate and
also make attempt to predict same and the
possible changes that may occur in the
future for its sustainability.
Study Area The study area, Ile-Ife as a developing city
has being experiencing the gradual
transformation that is taking it from been a
regional cultural centre, through a
secondary-urban-centre status, to a city displaying the hallmarks of progressive
urbanization and which, in recent times,
has being rapidly modernizing (Osasona et
al. 2006). Ile-Ife covers the whole of Ife
Central Local Government Area, few parts
of Ife North and most parts of Ife East
Local Government Area of Osun State,
Nigeria. Ile-Ife is located between latitude
70311N and 70341N of the equator and
between longitude 40301E and 40341E of
the prime meridian. The study area is bounded in the North by Atakumosa West

Environmental Technology & Science Journal Vol. 8 No. 2 December 2017
16
Local Government Area, in the North West
by the Ede South Local Government Area,
in the East by Atakumosa West Local
Government Area, in the West by Ife North
Local Government Area and in the South
by Ife North and South Local Government
Areas.
Fig. 1. Ile-Ife in the regional setting
Literature Review Human intervention and natural processes
are responsible for the constant change in
land cover all over the world. Land cover
change is determined by the interaction in
space and time between biophysical and
human influences. Land use and land cover
is dynamic in nature and is an important
factor for the comprehension of the
interaction and relationship of
anthropogenic activities with the
environment. Knowledge of the nature of land use and land cover change and their
configuration across spatio-temporal scales
is consequently indispensable for
sustainable environmental management and
development (Turner, 1994). Accordingly,
Long et.al (2008) stress that urban
landscapes are exemplified by the large
concentration of population, and fast
expansion of urban zones which lead to
alteration in the land use and land cover
configuration that consequently impact the
landscape. Remote sensing technology is
principally appropriate for mapping
environmental phenomena such as land use change and land cover as field-based
mapping is practically difficult. Remote
sensing observations provide continuous
monitoring across varied spatial and
temporal scales (Gibson, 2000). The
spatial, temporal and spectral
characteristics of the remote sensing data
are effectively used in land use and land
cover change mapping, hence helping in
decision making for sustainable land
resource management Berlanga-Robles,
(2002). Remote sensing and Geographic Information Science (GIS) technologies
have been utilised productively to detect
and quantify changes in the landscape and
the consequential environmental impacts.
Long (2008) observed that studies have
utilised remote sensed data to examine
urban land changes in modern times with

Akinlotan; Omotosho,Odegbenro & Okubena Spatial Growth in a Traditional Urban Settlement of Ile-Ife, Nigeria: A Spatio-Temporal Approach for Sustainable
Development
17
conclusions showing varying degree of
different patterns of urban expansion and
development in which could be associated
with specific environmental factors. A
review show that Prakasam (2010) studied
the land use and land cover change in Kodaikanal region of Western Ghats in
Tamilnadu State of India and observed
changes during a span of 40 years from
1969 to 2008. Using Landsat satellite data
and performing supervised classification
techniques, he found that 70% of the region
was covered in forests in 1969 but has
decreased to 33% in 2008. The built-up
lands also increased from 3% to 21%
showing that the region is affected by rapid
urbanisation which is leading to adverse
environmental effects for the identified bio-diversity rich region of Kodaikanal.
Meanwhile, Krishna (2009) utilised
Landsat TM imageries to study the land use
change in Bombay (Mumbai), India, which
is the highest populated metropolis of India
and found a remarkable increase in built-up
land by 300% and a reduction in forests by
55%, due to the increasing pressure of
urban expansion to cope up with the
population rise. He carried out a study
using land use maps for 1925 and 1967 and compared them with Landsat imagery in
1994 to quantify a change spanning from
1925 to 1994.
Zubair (2006) utilised remote sensing and
GIS technologies to detect the land use and
land cover changes in Ilorin, Nigeria from
1972 to 2001 through Landsat TM images
of 1972, 1986, and 2001, using Maximum
likelihood algorithm of supervised
classification method to delineate five land
use and land cover classes for the study, namely: farmland, wasteland, forest, built-
up and water-bodies from the imageries.
He concluded that there is likely going to
be denseness brought by compactness in
Ilorin in the very near future.
Many scientists, resource managers, and
planners agree that, the future development
and management of urban areas entail
comprehensive knowledge about the on-
going processes and patterns. As a result,
understanding the urban growth patterns, dynamic processes, and their relationships
and interactions is a key objective in the
contemporary urban studies as quoted by
Long (2008). Remote sensing is helpful
tool to better understand the spatiotemporal
trends of urbanization and monitor the
spatial pattern of urban landscape compared to traditional socioeconomic
indicators such as population growth,
employment shifts. However, Zubair
(2006) opined the availability of multi-
temporal data is important to analyse the
dynamics of land cover change over time
and space.
Methodology The data used for this work were obtained
from both primary and secondary sources.
The primary data were collected through
field observation with the use of GPS
receiver to collect co-ordinates of places and landmarks in the study area which was
integrated into the GIS environment for the
user requirement survey and analysis. The
study period covered thirty (30) years from
1983 – 2013 and the satellite imageries
over the study area were obtained and
analysed. The method of processing and
analysis was a multi-stage approach. The
first stage involved determining the trend
and pattern (land use/land cover) of urban
development in Ile-Ife between 1983 and 2013. The data used were mainly the
Landsat imageries for different time
periods and the road map of Ile-Ife,
creating 3 epochs of ten years interval
(1983-1992, 1993-2002, and 2003-2013).
The second stage entailed the use of
processed data from the first to forecast the
trend of change in the land use for 2020.
Markov Chain and Cellular Automata
Analysis were used for predicting the
change. This was achieved by developing a transition probability matrix of land use
change in between epochs, which showed
the nature of change and also served as the
basis for projecting to a later time period of
2020 .The transition probability may be
accurate on a per category basis, but there
is no knowledge of the spatial distribution
of occurrences within each land use
category. Hence, Cellular Automata (CA)
Environmental Technology & Science Journal Vol. 8 No. 2 December 2017
18
was used to add spatial character to the
model.
Results and Discussion
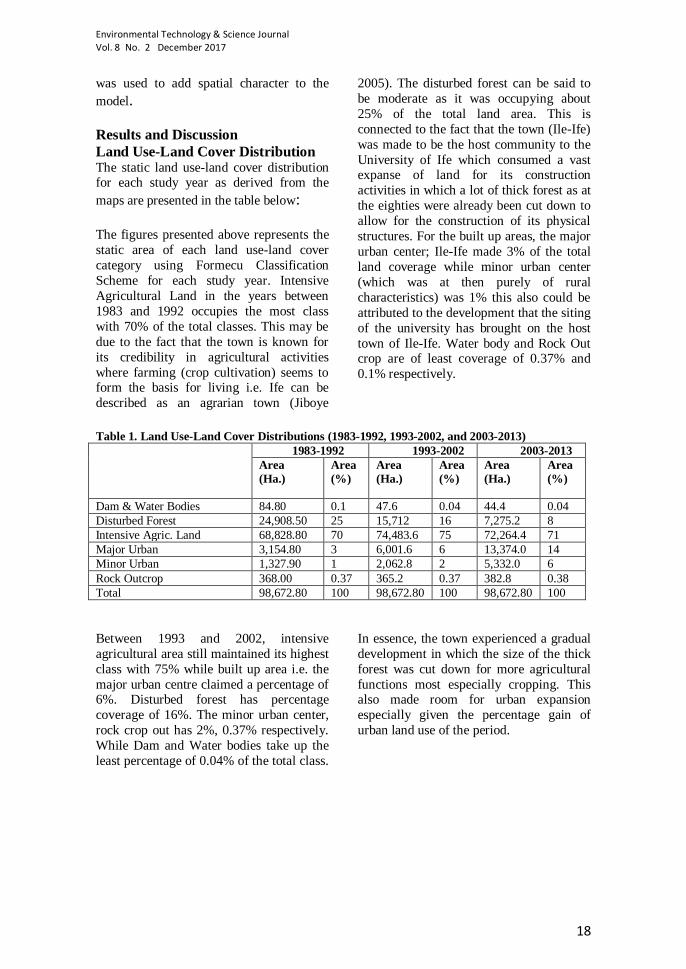
Land Use-Land Cover Distribution The static land use-land cover distribution for each study year as derived from the
maps are presented in the table below:
The figures presented above represents the
static area of each land use-land cover
category using Formecu Classification
Scheme for each study year. Intensive
Agricultural Land in the years between
1983 and 1992 occupies the most class
with 70% of the total classes. This may be
due to the fact that the town is known for
its credibility in agricultural activities
where farming (crop cultivation) seems to form the basis for living i.e. Ife can be
described as an agrarian town (Jiboye
2005). The disturbed forest can be said to
be moderate as it was occupying about
25% of the total land area. This is
connected to the fact that the town (Ile-Ife)
was made to be the host community to the
University of Ife which consumed a vast expanse of land for its construction
activities in which a lot of thick forest as at
the eighties were already been cut down to
allow for the construction of its physical
structures. For the built up areas, the major
urban center; Ile-Ife made 3% of the total
land coverage while minor urban center
(which was at then purely of rural
characteristics) was 1% this also could be
attributed to the development that the siting
of the university has brought on the host
town of Ile-Ife. Water body and Rock Out crop are of least coverage of 0.37% and
0.1% respectively.
Table 1. Land Use-Land Cover Distributions (1983-1992, 1993-2002, and 2003-2013)
1983-1992 1993-2002 2003-2013
Area
(Ha.) Area
(%) Area
(Ha.) Area
(%) Area
(Ha.) Area
(%)
Dam & Water Bodies 84.80 0.1 47.6 0.04 44.4 0.04
Disturbed Forest 24,908.50 25 15,712 16 7,275.2 8
Intensive Agric. Land 68,828.80 70 74,483.6 75 72,264.4 71
Major Urban 3,154.80 3 6,001.6 6 13,374.0 14
Minor Urban 1,327.90 1 2,062.8 2 5,332.0 6
Rock Outcrop 368.00 0.37 365.2 0.37 382.8 0.38
Total 98,672.80 100 98,672.80 100 98,672.80 100
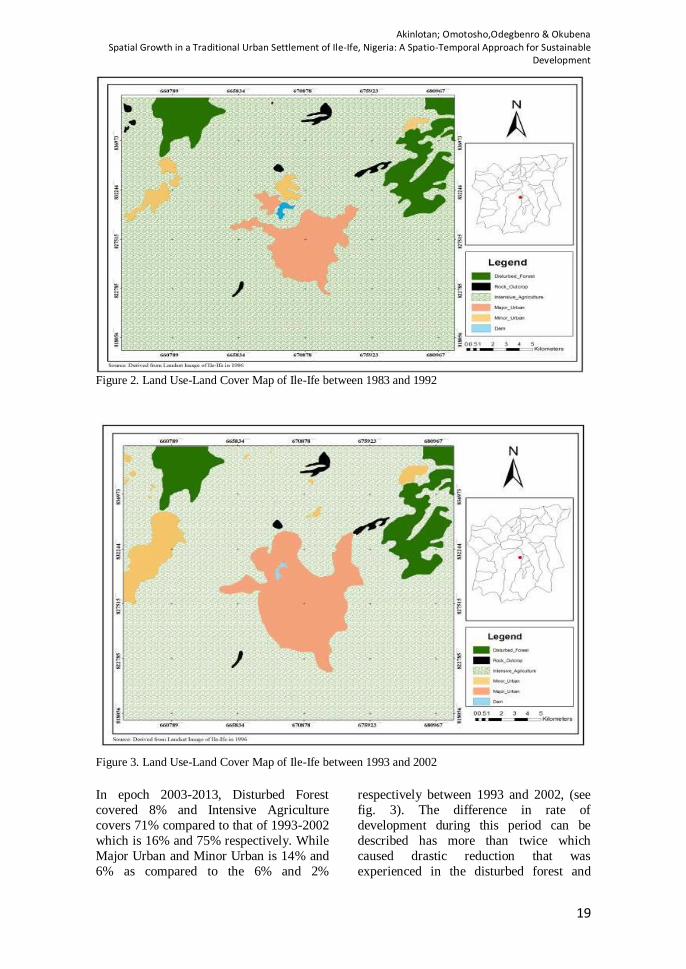
Between 1993 and 2002, intensive
agricultural area still maintained its highest
class with 75% while built up area i.e. the
major urban centre claimed a percentage of 6%. Disturbed forest has percentage
coverage of 16%. The minor urban center,
rock crop out has 2%, 0.37% respectively.
While Dam and Water bodies take up the
least percentage of 0.04% of the total class.
In essence, the town experienced a gradual
development in which the size of the thick
forest was cut down for more agricultural
functions most especially cropping. This also made room for urban expansion
especially given the percentage gain of
urban land use of the period.
Akinlotan; Omotosho,Odegbenro & Okubena Spatial Growth in a Traditional Urban Settlement of Ile-Ife, Nigeria: A Spatio-Temporal Approach for Sustainable
Development
19
Figure 2. Land Use-Land Cover Map of Ile-Ife between 1983 and 1992
Figure 3. Land Use-Land Cover Map of Ile-Ife between 1993 and 2002
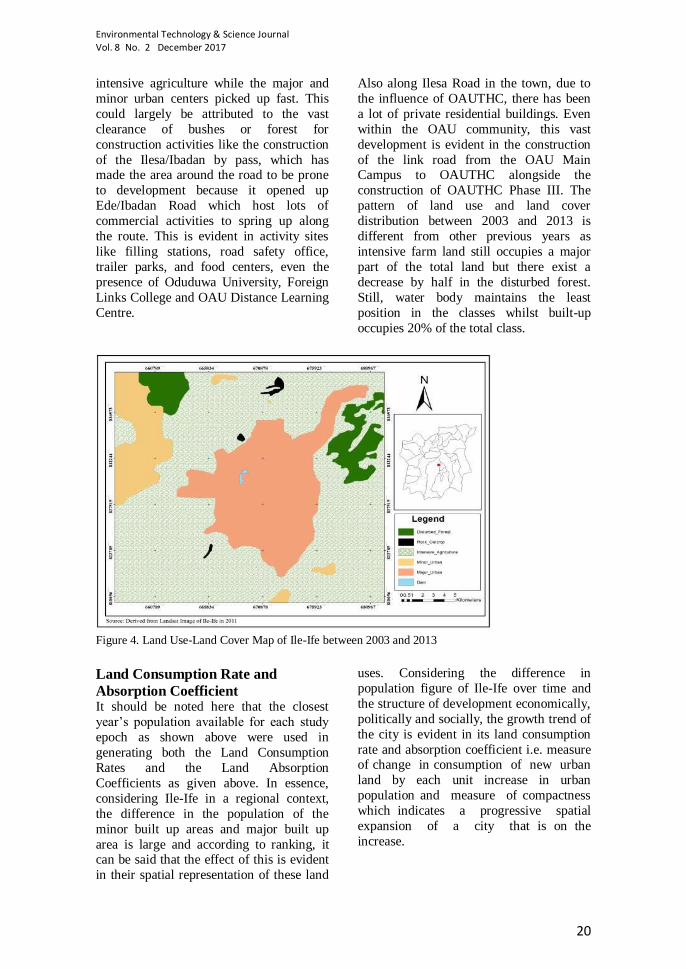
In epoch 2003-2013, Disturbed Forest
covered 8% and Intensive Agriculture
covers 71% compared to that of 1993-2002
which is 16% and 75% respectively. While
Major Urban and Minor Urban is 14% and
6% as compared to the 6% and 2%
respectively between 1993 and 2002, (see
fig. 3). The difference in rate of
development during this period can be
described has more than twice which
caused drastic reduction that was
experienced in the disturbed forest and
Environmental Technology & Science Journal Vol. 8 No. 2 December 2017
20
intensive agriculture while the major and
minor urban centers picked up fast. This
could largely be attributed to the vast
clearance of bushes or forest for
construction activities like the construction
of the Ilesa/Ibadan by pass, which has made the area around the road to be prone
to development because it opened up
Ede/Ibadan Road which host lots of
commercial activities to spring up along
the route. This is evident in activity sites
like filling stations, road safety office,
trailer parks, and food centers, even the
presence of Oduduwa University, Foreign
Links College and OAU Distance Learning
Centre.
Also along Ilesa Road in the town, due to
the influence of OAUTHC, there has been
a lot of private residential buildings. Even
within the OAU community, this vast
development is evident in the construction
of the link road from the OAU Main Campus to OAUTHC alongside the
construction of OAUTHC Phase III. The
pattern of land use and land cover
distribution between 2003 and 2013 is
different from other previous years as
intensive farm land still occupies a major
part of the total land but there exist a
decrease by half in the disturbed forest.
Still, water body maintains the least
position in the classes whilst built-up
occupies 20% of the total class.
Figure 4. Land Use-Land Cover Map of Ile-Ife between 2003 and 2013
Land Consumption Rate and
Absorption Coefficient It should be noted here that the closest
year’s population available for each study
epoch as shown above were used in
generating both the Land Consumption
Rates and the Land Absorption
Coefficients as given above. In essence,
considering Ile-Ife in a regional context,
the difference in the population of the
minor built up areas and major built up
area is large and according to ranking, it can be said that the effect of this is evident
in their spatial representation of these land
uses. Considering the difference in
population figure of Ile-Ife over time and
the structure of development economically,
politically and socially, the growth trend of
the city is evident in its land consumption
rate and absorption coefficient i.e. measure of change in consumption of new urban
land by each unit increase in urban
population and measure of compactness
which indicates a progressive spatial
expansion of a city that is on the
increase.
Akinlotan; Omotosho,Odegbenro & Okubena Spatial Growth in a Traditional Urban Settlement of Ile-Ife, Nigeria: A Spatio-Temporal Approach for Sustainable
Development
21
Table 2. Land Consumption Rate and Absorption Coefficient
Year Land Consumption
Rate
Year Land Absorption
Coefficient
1980’s 0.024 1983-1992/1993-2002 0.034
1990’s 0.026 1993-2002/2003-2013 0.029
2000’s 0.029
Table 3. Population figure of Ile-Ife in the 1980’s, 1990’s and 2000’s
Year Population figure Source
1984 185,975 Encyclopedia Americana 1984
1991 289,500 National Population Council 1991
2006 644,373 National Population Council 2006
Land Use-Land Cover Change:
Trend, Rate and Magnitude There seems to be a negative change i.e. a
reduction in disturbed forest and a positive
change in intensive agriculture between
1983-1992 and 1993-2002. This can be
said to be largely due to increase development in the city during these
epochs, there was more influx of people
attributed to better job opportunity in OAU
and OAUTHC but there was a general
hardship imposed by the Nigerian Military
Government in the country which made
people to use subsistence farming to
complement their means of livelihood.
During this period a lot of civil servants
had a farm to sustain their family alongside
their job. Teachers are well known for their
strike action during this period on the
government owing them their wages.
The period between 1993-2002 and 2003-
2013 witnessed a drop in the rate of
intensive agriculture practice.
Table 4. Land Use-Land Cover Change: Trend, Rate and Magnitude
Trend of Change Annual Rate
of Change 1980’s and 1990’s 1990’s and 2000’s
Area
(Ha.) Percent
age
Change
Area
(Ha.) Percent
age
Change
80’s –
90’s
90’s -
2000’s
Dam and Water Bodies
-37.2 -0.06 -3.2 0 44.4 0
Disturbed Forest -9196.0 -9 -8436.8 -8 7,275.2 -0.8
Intensive Agric. Land 5654.8 6 -2219 -4 72,264.4 -0.4
Major Urban 2846.8 3 7372.4 8 13,374.0 0.8
Minor Urban 734.9 1 3269.2 4 5,332.0 0.4
Rock Outcrop -2.8 0 17.6 0.01 382.8 0.001
Transition Probability Matrix The transition probability matrix records the probability that each land cover
category will change to the other category.
This matrix is produced by the
multiplication of each column in the
transition probability matrix be the number
of cells of corresponding land use in the
later image.
For the 5 by 5 matrix table presented below, the rows represent the older land
cover categories and the column represents
the newer categories. Although this matrix

Environmental Technology & Science Journal Vol. 8 No. 2 December 2017
22
can be used as a direct input for
specification of the prior probabilities in
maximum likelihood classification of the
remotely sensed imagery, it was however
used in predicting land use land cover of
2020.
Row categories represent land use-land
cover classes in 2013 whilst column
categories represent 2020 classes. As seen
from the table, disturbed forest has 0.8360
of remaining disturbed forest while it has a
0.8878 of changing to intensive agricultural land in 2020. This therefore shows an
undesirable change (reduction) in forest,
with a probability of change which is much
higher than stability. Intensive agricultural
land during this period will change to
major urban area with a probability of
0.1344; there are tendencies of expansion
of the town at the edge of major urban area cutting down the intensive agricultural
lands. Minor urban area has high
tendencies of becoming a major urban area
with a probability of 0.6871 which signifies
a lot of growth in the surrounding suburban
areas or minor urban areas. Major urban
land also has a probability 0.4021 to
remain as built-up land in 2020 which
signifies stability.
Table 5. Transitional Probability table derived from the land use-land cover map
of 1983 and 2013
Classes Dam Disturbed
Forest
Intensive
agric.
land
Major
Urban
Minor
Urban
Rock
Outcrop
Dam 0.6074 0.0000 0.0000 0.3926 0.0000 0.0000
Disturbed
forest
0.0000 0.8360 0.8878 0.0000 0.0296 0.0000
Intensive
Agricultural
land
0.0001 0.0030 0.0621 0.1344 0.0469 0.0001
Major urban 0.0000 0.0000 0.0000 0.4021 0.0000 0.0000
Minor urban 0.0000 0.0000 0.0038 0.6871 0.3092 0.0000
Rock outcrop 0.0000 0.0000 0.0318 0.1936 0.0000 0.7745
Land Use-Land Cover Projection
For 2020 The Table 6 shows the statistic of land use-
land cover projection for 2020. Comparing
the percentage representations, there exist
similarities in the observed distribution
particularly like it has been expected. For
the Dam reduced with a difference of
0.02%. The intensive agriculture,
experienced a little change of just 1%,
suggesting no growth in the intensive
farming with a lot of development in the
major and minor urban, this is also evident
in the transition probability matrix.
Agriculture maintains the highest position
in the class whilst dam retains its least
position. Major Urban takes up the next
position, followed by Minor Urban and
finally, Disturbed Forest and Rock-out
Crop. There is no likelihood that there will be compactness in Ile-Ife by 2020 but
instead the town continues to expand until
the major and minor urban areas get to
their expansion limit before compactness
sets in, which by then might be due to
crowdedness because of the rate at which
influx of people to the town is increasing
Table 6. Projected land use-land cover for 2020
Land Use Land
Cover Classes
Dam Disturbe
d Forest
Intensive
Agriculture
Major
Urban
Minor
Urban
Rock
Out
Crop
Area in
Hectares
24.4 3,338.0 69,888.4 16,864 8,370.4 187.6

Akinlotan; Omotosho,Odegbenro & Okubena Spatial Growth in a Traditional Urban Settlement of Ile-Ife, Nigeria: A Spatio-Temporal Approach for Sustainable
Development
23
Area In
Percentage
0.02 3 70 17 9 0.98
Figure 5. Projected Land use-Land Cover of Ile-Ife by 2020
Conclusion The paper demonstrates the ability of GIS and Remote Sensing in capturing spatial-
temporal data. Attempt was made to
capture as accurate as possible six land use
land cover classes as they change through
time. The six classes were distinctly
produced for each study year but with more
emphasis on major urban land as it is a
combination of anthropogenic activities
that make up this class; and indeed, it is
one that affects the other classes. In
achieving this, Land Consumption Rate and Land Absorption Coefficient were
introduced into the work to determine the
compactness form of development in the
study area. It was observed that change by
2020 will follow the trend in 2003/2013
accompanied by continuous increase in city
expansion following the past and present
trend. The work has revealed the direction
and trend of growth for the city, which will
serve as a viable prospect for the town
planners to ensure adequate development
control measures, and become a major input in the development of a working
master plan for the city. Measures to curb
abrupt encroachments into the green areas
(intensive agriculture and disturbed forest)
should be put in place, in order to maintain
a balance between preventing sprawl and
providing sufficient land for housing
development.
References Berlanga-Robles, C., and Ruiz-Luna,
A.,(2002): Land Use Mapping and
Change Detection in Coastal Zone of
Northwest Mexico using Remote Sensing Techniques: Journal of
Coastal Research, 18(3), p.514 –522:
Available from
http://www.jstor.org/stable/4299098
[Accessed 03/09/2010]
Dubovyk, O., Sliuzas, R., and Flacke, J.
(2011). Spatio-temporal analysis of
ISs development: A case study of
Istanbul, Turkey. ISPRS Journal of
Photogrammetry and Remote sensing,
66 (2), 234-246
Gibson, P., and Power, C., (2000): Introductory Remote Sensing: Digital
Image Processing and Applications,
Routledge, p. 92 – 112
Jiboye A. P. (2005) Globalization and the
Urban Growth Process in Nigeria In:
Fadare et.al editors. Globalization,
Culture and Nigerian Built
Environment. Faculty of
Environmental Design and
Management, OAU, Ile-Ife, Nigeria.
2, 342 – 345.
Environmental Technology & Science Journal Vol. 8 No. 2 December 2017
24
Klosterman, Richard (1999). “The What if?
Collaborative Planning Support
System.” Environment and Planning,
B: Planning and Design. 26(1999):
393-408
Krishna V.B. (2009) Determinants of the Patterns of Settlements in the
Province of Tarlac. U. P. School of
Urban and Regional Planning.
Long, H., Wu, X., Wang, W., and Dong,
G., (2008): Analysis of Urban-Rural
Land Use Change during 1995-2006
and its Policy Dimensional Driving
Forces in Chongqing, China, Sensors
2008(8) Available from
http://www.mdpi.com/1424-
8220/8/2/681/pdf [Accessed
03/09/2010] Longley, P., Donnay, J., Barnsley, M.,
(eds.) 2001; RemoteSensing and
Urban Analysis Taylor and Francis,
London, p.117
Osasona, C. O. and Hyland, A. D. C.
(2006). Colonial Architecture in Ile-
Ife, Nigeria.
Osasona, Lee O. Cordelia O. Ogunshakin
and David A. Jiboye (2009). Ile-Ife:
“A Cultural Phenomenon in the
Throes of Transformation.” The African Inner City, African
Perspectives 2009.
Prakasam, C. (2010): Land use and land
cover change detection through
remote sensing approach: A case
study of Kodaikanal Taluk,
Tamilnadu. International Journal of
Geomatics and Geosciences, 2010,
Vol. 1, No. 2, p 150-158: Available
from
ipublishing.co.in/jggsvol1no12010/EI
JGGS1015.pdf [Accessed
03/09/2010] Seto K. C., Fragkias M. (2005).
Quantifying spatiotemporal patterns
of urban land-use in four cities of
China with time series landscape
metrics. Landscape Ecology
20(7):871-888
Turner, B.L. II and B.L. Meyer,
(1994):"Global Land Use and Land
Cover Change: An Overview." In
Changes in Land Use and Land
Cover: A Global Perspective, eds.
W.B. Meyer and B.L. Turner II, 3-10. Cambridge: Cambridge University
Press.
UN-Habitat. (2011). World Population
Prospects: The 2008 revision
methodology of the United Nations
population estimates and projections.
New York
Zubair, A., (2006): Change Detection in
Land Use and Land Cover using
Remote Sensing Data and GIS: A
Case Study of Ilorin and its Environs in Kwara State: GIS Development
Journal: Available from
http://www.gisdevelopment.net/thesis
/OpeyemiZubair_ThesisPDF.pdf
[Accessed 03/09/2010]

Environmental Technology & Science Journal Vol. 8 No. 2 December 2017
25
Mainstreaming Information Communication
Technology (ICT) in Real Estate Practice in
Nigeria: Ms Excel for Valuation and
Investment Advice
Olatunji I.A., Udoekanem, N.B., Ojetunde, I. &Kuma, S.S. Dept of Estate Management and Valuation, Federal University of Technology, Minna.
Abstract Recent study revealed that firms in Minna are not inclined to using MS Excel for Valuation
and investment advice. A purposive case study of recent lease of Obasanjo Shopping Mall
by Niger State Development Company, (NSDC) was undertaken to demonstrate and
illustrate the use of MS Excel for the valuation of freehold and leasehold interests. Marshal’s
equated yield /DCF hybrid valuation model was adopted on MS Excel worksheet platform to
carry out the valuation using data obtained from the NSDC and prospective leaseholders as
well as property market. Two growth factor charts were constructed for varied and regular
review patterns in MS Excel Spreadsheet based on equated yield 13%, with 2% mark-up on
gilts, all risks yield 6.5% and other pertinent valuation data. Intelligent variations and
reviews of rents, made possible in MS Excel, coupled with other valuation parameters were applied to arrive at higher capital values of N148.20Million and N87.1Million respectively
for the NSDC and the prospective Leaseholder as against N102Million and N66.40Million
from regular review pattern. The result formed the basis of an agreement under which the
30-year lease of the commercial property was secured. The conclusion is that MS Excel is a
versatile tool for accurate Valuation and investment advice and it is recommended that
valuers should seek to be trained and retrained to use various versions available.
Keywords: Real Estate Practice, MS Excel, Valuation, Spreadsheet, Equated yield.
Introduction Since Kakulu (2003), little had been added
to emphasize the critical nature and
relevance of Information Communication
Technology, ICT to real estate practice in Nigeria. This fact was re-established and
accentuated by the 1st and 2nd Train-the-
Trainer Workshops organized by NIESV
Learning Centre in collaboration with
ESVARBON in Port Harcourt and Minna
in 2014 and 2015 respectively. Valuation
and Investment Appraisal is an area of
Estate Surveying and Valuation practice
that could be greatly facilitated and
enhanced through the use of ICT.
Academics and Practitioners in real estate
are an integral part of the growing global
users of special computer software
applications and programmes including
Word perfect, Excel, Powerpoint and
others. This trend is obvious, as a visitor to
these offices would effortlessly observe hi-
tech computers conspicuously displayed
from simple ones to sophisticated
hardware. It can be reasonably inferred that estate firms are equipped with ICT
assistive tools for 21st century real estate
practice.
As clients and users of ESV services are
becoming increasingly sophisticated,

Olatunji, Udoekanem, Ojetunde &Kuma, Mainstreaming Information Communication Technology (ICT) in Real Estate Practice in Nigeria: Ms Excel for
Valuation and Investment Advice
26
demanding more complex professional
advices, it is incumbent on ESVs to break
new grounds in service delivery. Accuracy
and timely supply of valuation advice are
common demands by banks and financial
institutions, governments or non-government agencies. (Babawale and
Omirin,2012; Charles-Afolabi and
Olatunji, 2016). Therefore, timelines,
accuracy, reliability and dependability
guaranteed by the use of modern
technologies are good reasons why the
study will be of benefits to both the
providers and users of valuation services
alike.
ICT in property valuation Jenkins (2002) had echoed a rhetoric
question: in what form would the valuation
profession survive in the 21st century? Same question was earlier posed by
Appraisal Institute (2001). These questions
are germane because new software
packages that purport to do valuation and
Appraisals have been, and are being
developed.
These software packages do not
sufficiently address emerging needs and the
complex legal relationships involved in the
valuation of property rights. It is therefore important for Valuers to be trained on how
to realign valuation with the needs of
clients, with dexterity and flexibility as
French (2008) has proposed. Aluko (2010)
asserts quite rightly that valuation should
be so fashioned towards the clients’
specific needs. Several desktop based
applications are available. These include
MS Word for word processing useful for
report writing and other documentations,
MS Powerpoint for presentation. Others are
PDF for protection and preservation of data
integrity and MS-Excel – for quantitative
and statistical analysis.
Surveyors who wish to be competitive in
the global practice will find out that in
particular, MS-Excel package is a software
application without which any practice will
find it difficult if not impossible to survive
in the 21st Century.
Strengths and Weaknesses of ICT
Use ICT has its strengths and weaknesses. The
weaknesses include cyber security
challenges, frustration from data loss, data
theft, identity theft, password loss or
leakage, hacking and Data storage
challenges (Barnat, 1994). The general
global concerns on Cyber Security brought
up some home truths about the dangers
inherent in the use of cyber space. All these
are dangers associated with ICT either in
Offline or Online usages. These
weaknesses notwithstanding, the global relevance and utility of ICT use has not
been diminished in any significant sense as
more and more uses are being made of it.
So, Bender (1994) had asserted that
generally the world must rely on
Technology to solve environmental
problems. One of such possibilities is in
Valuation.
MsEXCEL in Real Estate
Education and Practice First among the prime computer
applications is the MS Excel which offers a means of quantitative analysis as well as
Statistical Analysis in spreadsheet formats.
By these two features, MS Excel becomes
an indispensable working tool for
Valuation and Investment Appraisal in
spreadsheet format as demonstrated by
French (2008, 2013 and 2015). Olatunji
(2010) also applied the worksheet format to
establish that medium-term property rights
have values that can be assessed. There are
many new software packages that perform
some Valuation functions; Present Value of N1 (PV), Amount of N1 (A), Years
Purchase (YP) calculations are some of
these functions; Parry’s Valuation Table
containing millions of calculations is now
available in soft form with Equated Yield,
IRR and other capabilities. It was noted by
Davidson (1982), that the use of valuation
tables, (and by extension valuation
software applications) is not to replace the
work of the Valuer; rather it is to save the
valuer’s time from distraction by intricate mathematical problems.
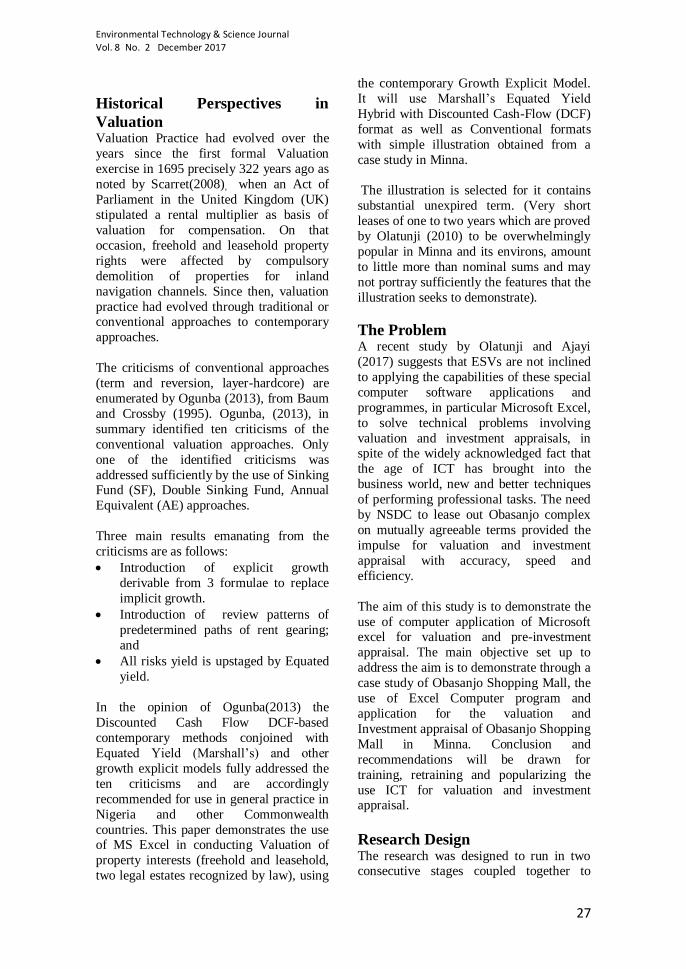
Environmental Technology & Science Journal Vol. 8 No. 2 December 2017
27
Historical Perspectives in
Valuation Valuation Practice had evolved over the
years since the first formal Valuation
exercise in 1695 precisely 322 years ago as
noted by Scarret(2008), when an Act of
Parliament in the United Kingdom (UK)
stipulated a rental multiplier as basis of
valuation for compensation. On that
occasion, freehold and leasehold property
rights were affected by compulsory
demolition of properties for inland
navigation channels. Since then, valuation
practice had evolved through traditional or conventional approaches to contemporary
approaches.
The criticisms of conventional approaches
(term and reversion, layer-hardcore) are
enumerated by Ogunba (2013), from Baum
and Crossby (1995). Ogunba, (2013), in
summary identified ten criticisms of the
conventional valuation approaches. Only
one of the identified criticisms was
addressed sufficiently by the use of Sinking Fund (SF), Double Sinking Fund, Annual
Equivalent (AE) approaches.
Three main results emanating from the
criticisms are as follows:
Introduction of explicit growth
derivable from 3 formulae to replace
implicit growth.
Introduction of review patterns of
predetermined paths of rent gearing;
and
All risks yield is upstaged by Equated
yield.
In the opinion of Ogunba(2013) the
Discounted Cash Flow DCF-based
contemporary methods conjoined with
Equated Yield (Marshall’s) and other
growth explicit models fully addressed the
ten criticisms and are accordingly
recommended for use in general practice in
Nigeria and other Commonwealth
countries. This paper demonstrates the use of MS Excel in conducting Valuation of
property interests (freehold and leasehold,
two legal estates recognized by law), using
the contemporary Growth Explicit Model.
It will use Marshall’s Equated Yield
Hybrid with Discounted Cash-Flow (DCF)
format as well as Conventional formats
with simple illustration obtained from a
case study in Minna.
The illustration is selected for it contains
substantial unexpired term. (Very short
leases of one to two years which are proved
by Olatunji (2010) to be overwhelmingly
popular in Minna and its environs, amount
to little more than nominal sums and may
not portray sufficiently the features that the
illustration seeks to demonstrate).
The Problem A recent study by Olatunji and Ajayi
(2017) suggests that ESVs are not inclined
to applying the capabilities of these special
computer software applications and
programmes, in particular Microsoft Excel,
to solve technical problems involving
valuation and investment appraisals, in spite of the widely acknowledged fact that
the age of ICT has brought into the
business world, new and better techniques
of performing professional tasks. The need
by NSDC to lease out Obasanjo complex
on mutually agreeable terms provided the
impulse for valuation and investment
appraisal with accuracy, speed and
efficiency.
The aim of this study is to demonstrate the
use of computer application of Microsoft excel for valuation and pre-investment
appraisal. The main objective set up to
address the aim is to demonstrate through a
case study of Obasanjo Shopping Mall, the
use of Excel Computer program and
application for the valuation and
Investment appraisal of Obasanjo Shopping
Mall in Minna. Conclusion and
recommendations will be drawn for
training, retraining and popularizing the
use ICT for valuation and investment appraisal.
Research Design The research was designed to run in two consecutive stages coupled together to

Olatunji, Udoekanem, Ojetunde &Kuma, Mainstreaming Information Communication Technology (ICT) in Real Estate Practice in Nigeria: Ms Excel for
Valuation and Investment Advice
28
illustrate the use of MS Excel for valuation.
The ascertainment stage, split into two
objectives to ascertain the form,
composition, and relevance of ICT
hardwares acquired by ESVs and establish
the frequency and level of use of these expensive equipments, was carried out by
Olatunji (2017) as a prior research work.
This paper constitutes the demonstration
stage which entails the use of transaction
data from the lease of Obasanjo
Commercial Complex in Minna as an
illustration of the application of Microsoft
Excel, to solve a specific ESV practice
problem that is, Valuation and Investment
advice.
Research Methodology The study is based on primary and
secondary data with special emphasis on
the analysis of a specific case study to
illustrate the application of Microsoft Excel
in Valuation. Primary data was obtained
from ESV firms in Minna. Questionnaires
were purposively administered on all estate
firms operating in the study area; 15 firms responded. A special but brief interview-
enquiry was conducted on Niger State
Development Company and the private
estate firm involved in the Valuation of
Obasanjo Shopping Complex to obtain
basic leasing terms and conditions and
valuation details. The bulk of data was
presented in tables; bar charts and graphs
were also used for analysis and
interpretation of field data.
Data Presentation and Analyses Applied valuation requires an intelligent
deployment of valuation theories,
principles and concepts to solve real time problems, Olatunji (n.d.). Real time
business decisions are subject to privacy
and confidentiality, but the identities of the
firms that supplied information could not
be revealed without compromising their
privacies. They are however treated with
serial identities, and this is considered
sufficient for the purpose of analysis of
vital facts and data supplied by them.
The Case Study Over the years of its existence as a State
since 1976, Niger State Government had acquired vast landed properties, in various
locations. In particular, choice locations
were acquired for commercial
developments, among which is Obasanjo
Commercial Complex.
Figure 1. Obasanjo Shopping Complex, Minna
Source: Google-enabled locational map, 2015

Environmental Technology & Science Journal Vol. 8 No. 2 December 2017
29
The site, seen in Fig.1 was originally used,
up till 1996, as Kasuwan Dare but was
transformed to a complex comprising 49
lock-up shops, directly run by Niger State
Urban Development Board from 1998.
However, subsequent authorities took the bold step to set up the Niger State
Development Company,(NSDC) with a
mandate to develop and manage all landed
properties in and outside the State. As part
of NSDC strategic management plan,
Obasanjo Complex was to be leased to a
private firm at a rent to be negotiated
around N5,000,000 p.a. Market evidence
supports the expectation of N7,500,000 p.a.
Thus emerged an Investment Valuation
Appraisal scenario to determine the values
of the interests of both prospective lessee and lessor and offer them advice
accordingly.
The central management strategy was to
free the State Government of the burden of
direct property management, by allowing a
nominated private Estate Firm to handle
that aspect. As a guide the Federal
Government bonds was adopted as reliable
basis of investment comparison. Through a
tripartite, partnership, the role of the Valuer is to advise the parties as to the value of
their respective interests regarding the
proposed scenarios. It was adjudged to be a
valuation problem involving NSDC as
Freeholder, and the Private Estate Firm as
prospective Leaseholder. At stake was a
lease term of 30years in favour of the
Estate Firm under specified lease
agreement.
The Valuation Variables The variables in the valuation process must
be clearly understood and analyzed. In this
case study, the Valuer was in a position to
determine the all-risks yield (k) from
property market experience and Analysis of
Sales (ANOSA). Hence, rather than mere
rental forecasts, it was possible to derive
market-driven rental growth rate, (g). The
leaseholder-investor in this case was
contented with a margin of 2% above the
Federal Government Bonds. It was
reasonable to consider a rental review pattern, attractive to both parties since rent
review is a permanent feature of the
commercial property market. Two options
were put forward : constant review and
variable reviews with a predetermined path
of rent gearing.
The objective of valuation was to
determine the value of incentives granted
to the leaseholder under a long term
leasehold agreement contracted for an unexpired term of 30 years. From Baum
and Crosby (1995), Ajayi(1998),
Ogunba(2013), all following on Marshal
(1986), the implied growth rate, g, is
obtainable from any of the three formulae:
Theoretically, if the valuer is able to obtain
or derive e, k and t, he could deduce the
rate of growth associated with rental
income from any of equations 1 to 3. From
this, the table of implied growths was
constructed as in Table 1. The Microsoft
Excel Worksheet or Kingsoft excel worksheets are very versatile platforms to
perform these calculations.
g = {(e-k)*[((1+e)^t-1)/e]+1}^1/t - 1
……….1
Where the variables are defined as:
e equated yield deduced from gilt+2per cent risk premium,
k
all risks yield capitalization rate obtained from comparables or ANOSA
t rent review pattern/interval
g implied growth
A Growth Factor
OR (1+g)^t Equals YP perp @ k - YPt yrs @ e ………..2

Olatunji, Udoekanem, Ojetunde &Kuma, Mainstreaming Information Communication Technology (ICT) in Real Estate Practice in Nigeria: Ms Excel for
Valuation and Investment Advice
30
YP perp @ k X PVt yrs @ e
OR k =
e-(ASF@e){(1+g)^t-1}
………..3
The Inputting Procedure An excel worksheet is opened showing its
network of rows and columns to be
designated as Sheet 1, for easy reference. In column 1 are the successive years of the
lease term, designated as n, which in this
case runs from 1 to 30 years, presented in
30 rows. To obtain e, data on gilt edged
securities within the economy is needed. In
Nigeria, the FG bonds and CBN Treasury
Bills are often taken as the perfect risk-free
yields, equivalent to a gilt, with a current
rate of about 11.0% for 2018 maturing
bonds, in Column 2. All other investment
platforms in Nigeria can only have higher
rates commensurate with their comparative risk contents. A mark-up of 2% in Column
3 is adopted for the property type in this
case study. The all risks yield, k, is the
market capitalization rate obtained from
recent transaction analysis of sales,
ANOSA. Taking due cognizance of
valuation rules respecting comparables, k
was found to be 6.5% p.a. A rent review
pattern must be inferred, in Column 6, if
not available. Rental evidence in Minna
point to 2 to 3 years and 4- 5 years of
gearing for residential and commercial
properties respectively. Five yearly interval
is adopted here and this is well supported
in practice and by the property market. The
growth rate implied within this set-up is derived from Marshall’s DCF/Equated
Yield hybrid, and it produces a growth
factor; both are presented respectively in
columns 11 and 12.
Table 1 is the shortened growth factor table
constructed on the basis of constant rent
reviews in 5 yearly intervals. This option is
in alignment with the property market,
consistent with practice experiences in
Minna and acceptable to the parties in this
Case study. However it is not by any means the only option. Varying and variable
review patterns are not uncommon
.
TABLE 1: Table Of Implied Growth And Growth Factor With Regular/Constant Review Pattern
1 2 3 4 5 6 7 8 9 10 11 12.
N Gilt Mp E K T e-k (1+e)^t
(((1+e)^t)-
1)/e) 1/t G
Growth
factor,
A
1-5 0.11 0.02 0.13 0.065 5 0.065 1.842435 7.480271 0.2 0.072833 1.072833
6-10 0.11 0.02 0.13 0.065 5 0.065 1.842435 7.480271 0.2 0.072833 1.524729
11-
15 0.11 0.02 0.13 0.065 5 0.065 1.842435 7.480271 0.2 0.072833 2.166972
16-
20 0.11 0.02 0.13 0.065 5 0.065 1.842435 7.480271 0.2 0.072833 3.079738
21-
25 0.12 0.02 0.14 0.065 5 0.075 1.925415 7.610104 0.2 0.083858 5.42522
26-
30 0.125 0.02 0.145 0.065 5 0.08 1.968011 7.675935 0.2 0.089355 9.255545
Source: Author, 2015
To capture this possibilities, a table of
Varying rent review pattern is constructed.
(Table 2). The growth factor is based on
the Amount of N1 table,
A = (1+g)n,
where g is the implied growth rate and n is
the number of years of growth.

Environmental Technology & Science Journal Vol. 8 No. 2 December 2017
31
By mutual agreement an alternative plan of
growth was proposed in a step-wise format:
5-yearly rent review for the first 10 years;
3-yearly rent review for the next 10years
and 2-yearly rent review for the last 10
years. This is amply reflected in column 6
of Table
2.
TABLE 2: Implied Growth And Growth Factor With Varied Review Patterns
1 2 3 4 5 6 7 8 9 10 11 12.
N Gilt
Margi
n E K T e-k (1+e)^t
(((1+e)^t
) -1)/e) 1/t G
Growth
factor
A=(1+g)^
n
1 0.11 0.02 0.13
0.06
5 5
0.06
5
1.84243
5
7.48027
1 0.2
0.07283
3 1.072833
1
2 0.11 0.02 0.13
0.06
5 3
0.06
5
1.44289
7 4.4069
0.33333
3
0.06895
2 2.225874
1
4 0.11 0.02 0.13
0.06
5 3
0.06
5
1.44289
7 4.4069
0.33333
3
0.06895
2 2.543416
1
5 0.11 0.02 0.13
0.06
5 3
0.06
5
1.44289
7 4.4069
0.33333
3
0.06895
2 2.718791
1
8 0.11 0.02 0.13
0.06
5 3
0.06
5
1.44289
7 4.4069
0.33333
3
0.06895
2 3.320863
1
9 0.11 0.02 0.13
0.06
5 3
0.06
5
1.44289
7 4.4069
0.33333
3
0.06895
2 3.549845
2
0 0.12 0.02 0.14
0.06
5 1
0.07
5 1.2996 3.14 0.5
0.07726
5 4.430487
2
1 0.12 0.02 0.14
0.06
5 2
0.07
5 1.2996 3.14 0.5
0.07726
5 4.772809
2
2 0.12 0.02 0.14
0.06
5 2
0.07
5 1.2996 3.14 0.5
0.07726
5 5.14158
2
3 0.12 0.02 0.14
0.06
5 2
0.07
5 1.2996 3.14 0.5
0.07726
5 5.538844
2
4 0.12 0.02 0.14
0.06
5 2
0.07
5 1.2996 3.14 0.5
0.07726
5 5.966804
2
5
0.12
5 0.02
0.14
5
0.06
5 2 0.08
1.31102
5 3.145 0.5
0.08240
5 7.240058
2
6
0.12
5 0.02
0.14
5
0.06
5 2 0.08
1.31102
5 3.145 0.5
0.08240
5 7.836673
2
7
0.12
5 0.02
0.14
5
0.06
5 2 0.08
1.31102
5 3.145 0.5
0.08240
5 8.482452
2
8
0.12
5 0.02
0.14
5
0.06
5 2 0.08
1.31102
5 3.145 0.5
0.08240
5 9.181446
2
9
0.12
5 0.02
0.14
5
0.06
5 2 0.08
1.31102
5 3.145 0.5
0.08240
5 9.938041
3
0
0.12
5 0.02
0.14
5
0.06
5 2 0.08
1.31102
5 3.145 0.5
0.08240
5 10.75698
Source: Author, 2015 **Shortened to reflect varying pattern
Results and Discussions Freehold Interest under Constant
Rent Review Patterns The value of the Freehold interest under a regular 5-yearly review pattern is derived
in Table 3 through 9 columns. For clarity
and ease of reference, the columns are
numbered 1 to 9. The rent is receivable
annually, and the valuation process is performed row by row representing
successive years or periods of lease. The
growth factor is taken from the growth
factor table and applied on the rent
received to derive the projected rent in

Olatunji, Udoekanem, Ojetunde &Kuma, Mainstreaming Information Communication Technology (ICT) in Real Estate Practice in Nigeria: Ms Excel for
Valuation and Investment Advice
32
Column 6. The PV of freehold interest in
column 9 is derived from product of
Columns 6, 7 and 8. Although rents are
payable in advance in Minna, the
appropriate payment plan agreed between
the parties was worked into the
programme.
The resulting capital value of the Freehold
interest is N102.00 million. Notionally, it is
assumed that the Freeholder will sell off his
interest after the holding period of 30
years. This is to prevent inconveniently
lengthy cash flows, consolidated and
designated as period 31+ years.
Table 3: NSDC’s Freehold Interest under Regular Rent Review Patterns
1 2 3 4 5 6 7 8 9
Years T
n,
def"rd
yrs Rent Growth
Projected
rent YP 5yrs PV for PV of
review Review
Received Factor Rent @ e
defered
yrs Freehold
Pattern Years
N'000
N'000
@ e
1 to 5 5 0 5 1.072833 5.364165 3.974471 1 21.31972
6 to 10 5 5 5 1.524729 7.623645 3.974471 0.54276 16.4456
11 to15 5 10 5 2.166972 10.83486 3.974471 0.294588 12.68581
16 to 20 5 15 5 3.079738 15.39869 3.974471 0.159891 9.78558
21 to 25 5 20 5 5.42522 27.1261 3.974471 0.086782 9.356165
26 to 30 5 25 5 9.255545 46.27773 3.974471 0.047102 8.663438
31+
30 7.5 14.1987 106.4902 8.69231 0.025565 23.66419
n=30
∑ PV 101.9205
n=1
Source: Author's Case Study, 2015
NSDC’s Freehold Interest under
Varied Rent Review Patterns Under a varied rent review pattern, the
calculation of freeholder’s interest is
slightly different. Rows have to be
structured in accordance with different
terms or intervals of rent gearing. The
columns are also extended to allow the
serial review and years of review distinctively
.
Table 4:Freehold Valuation With Varied Rent Review Patterns
1 2 3 4 5 6 7 8 9
Years
T Rent Growth
Projected Rent
Yp T Years Pv For Pv Of
Review
Received Factor Rent @ E
Def 'Rd
Yrs Freehold

Environmental Technology & Science Journal Vol. 8 No. 2 December 2017
33
Pattern
N Million
N Million
@ E
N Million
1st
10yrs
1 To 5 0 5 1.072833 5.364165 3.517231 1 5.754853
6 To
10 5 5 1.524729 7.623645 3.517231 0.54276 6.309038
2nd 10 Yrs
11to13 10 5 2.225874 11.12937 2.361153 0.294588 7.297714
14to16 13 5 2.718791 13.59395 2.361153 0.204165 7.54574
17to19 16 5 3.320863 16.60432 2.361153 0.141496 7.802196
20 19 5 4.772809 23.86404 0.884956 0.098064 11.16934
3rd 10yrs
21-22 20 5 5.14158 25.7079 1.668102 0.086782 11.47082
23-24 22 5 5.966804 29.83402 1.668102 0.067963 12.09839
25-26 24 5 7.836673 39.18336 1.668102 0.053225 16.34372
27-28 26 5 9.181446 45.90723 1.668102 0.041683 17.56923
29-30 28 5 10.75698 53.78491 1.668102 0.032644 18.88663
30+ 30+ 30 7.5 11.64341 87.32556 15.38462 0.025565 25.99371
N=30
∑ Pv N=1 148.2414
Source: Author's Case Study, 2015
Private Firm’s Leasehold Interest
under Constant Rent Review Pattern The value of the private Estate firm’s
leasehold interest under a regular 5-yearly
review pattern is derived in Table 5
through 10 columns. For clarity and ease of reference, the columns are numbered 1 to
10 reflecting the relative complexity of
computing leasehold interests. The rent is
receivable annually, and the valuation
process is performed row by row
representing successive years or periods of
lease. The growth factor is taken from the
growth factor table and applied on the rent
received to derive the projected rent in
Column 5. The PV of freehold interest in
column 10 is derived from the product of
Columns 7, 8 and 9; the summation is
N66.40Million representing the leasehold
value.
TABLE 5: LEASEHOLD VALUATION WITH CONSTANT RENT REVIEW PATTERN
1 2 3 4 5 6 7 8 9 10
Years
t Rent Growth
Projecte
d rent
Fixed
rent
Profit
rent YP 5yrs PV for PV of
review
Receive
d Factor Rent
@ e
defered
yrs
Leasehol
d
pattern
N
Million
N
Million
NMillio
n
N
Million
@ e N Million
1 to 5 0 7.5
1.07283
3
8.04624
7 5
3.04624
7
3.51723
1 1 10.7144
6 to 10 5 7.5
1.52472
9
11.4354
7 5
6.43546
8
3.51723
1 0.54276 12.2854
11
to15 10 7.5
2.16697
2
16.2522
9 5
11.2522
9
3.51723
1
0.29458
8 11.6589
16 to
20 15 7.5
3.07973
8
23.0980
4 5
18.0980
4
3.51723
1
0.15989
1 10.1778
21 to
25 20 7.5 5.42522
40.6891
5 5
35.6891
5
3.51723
1
0.08678
2 10.8935
26 to
30 25 7.5
9.25554
5
69.4165
9 5
64.4165
9
3.51723
1
0.04710
2 10.6718
n=30 Σ
∑ PV 66.4018
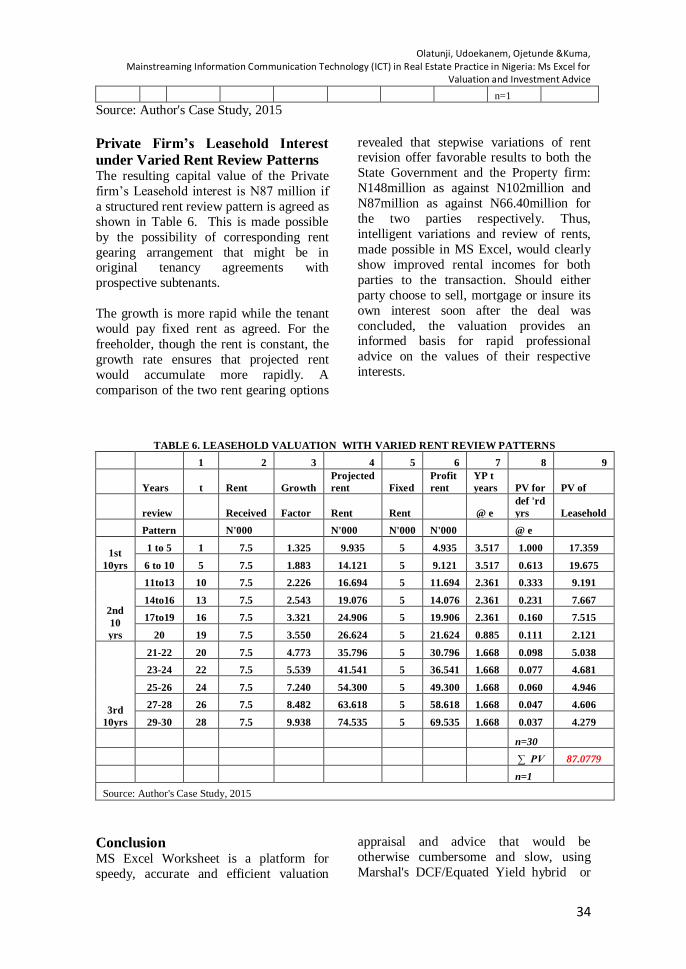
Olatunji, Udoekanem, Ojetunde &Kuma, Mainstreaming Information Communication Technology (ICT) in Real Estate Practice in Nigeria: Ms Excel for
Valuation and Investment Advice
34
n=1
Source: Author's Case Study, 2015
Private Firm’s Leasehold Interest
under Varied Rent Review Patterns The resulting capital value of the Private
firm’s Leasehold interest is N87 million if
a structured rent review pattern is agreed as
shown in Table 6. This is made possible
by the possibility of corresponding rent
gearing arrangement that might be in original tenancy agreements with
prospective subtenants.
The growth is more rapid while the tenant
would pay fixed rent as agreed. For the
freeholder, though the rent is constant, the
growth rate ensures that projected rent
would accumulate more rapidly. A
comparison of the two rent gearing options
revealed that stepwise variations of rent revision offer favorable results to both the
State Government and the Property firm:
N148million as against N102million and
N87million as against N66.40million for
the two parties respectively. Thus,
intelligent variations and review of rents,
made possible in MS Excel, would clearly
show improved rental incomes for both
parties to the transaction. Should either
party choose to sell, mortgage or insure its
own interest soon after the deal was
concluded, the valuation provides an informed basis for rapid professional
advice on the values of their respective
interests.
TABLE 6. LEASEHOLD VALUATION WITH VARIED RENT REVIEW PATTERNS
1 2 3 4 5 6 7 8 9
Years
t Rent Growth
Projected
rent Fixed
Profit
rent
YP t
years PV for PV of
review
Received Factor Rent Rent
@ e
def 'rd
yrs Leasehold
Pattern
N'000
N'000 N'000 N'000
@ e
1st
10yrs
1 to 5 1 7.5 1.325 9.935 5 4.935 3.517 1.000 17.359
6 to 10 5 7.5 1.883 14.121 5 9.121 3.517 0.613 19.675
2nd
10
yrs
11to13 10 7.5 2.226 16.694 5 11.694 2.361 0.333 9.191
14to16 13 7.5 2.543 19.076 5 14.076 2.361 0.231 7.667
17to19 16 7.5 3.321 24.906 5 19.906 2.361 0.160 7.515
20 19 7.5 3.550 26.624 5 21.624 0.885 0.111 2.121
3rd
10yrs
21-22 20 7.5 4.773 35.796 5 30.796 1.668 0.098 5.038
23-24 22 7.5 5.539 41.541 5 36.541 1.668 0.077 4.681
25-26 24 7.5 7.240 54.300 5 49.300 1.668 0.060 4.946
27-28 26 7.5 8.482 63.618 5 58.618 1.668 0.047 4.606
29-30 28 7.5 9.938 74.535 5 69.535 1.668 0.037 4.279
n=30
∑ PV 87.0779
n=1
Source: Author's Case Study, 2015
Conclusion MS Excel Worksheet is a platform for
speedy, accurate and efficient valuation
appraisal and advice that would be
otherwise cumbersome and slow, using
Marshal's DCF/Equated Yield hybrid or

Environmental Technology & Science Journal Vol. 8 No. 2 December 2017
35
any other Valuation approach . Numerous
dimensions and complexities expected to
be interpreted through valuation and
appraisal can effectively be facilitated by
MS Excel. The basic requirements are to
convert all arguments into numerical or quantitative language and then, appropriate
functions in excel could be found to
compute the resulting figures.
More specifically, much valuation data and
corresponding information were provided
and displayed for visual and analytical
purposes while growth is constructed more
explicitly and efficiently than in
conventional formats. The discount rate
that represents investors' target rate, termed
equated yield, was distinguished from the growth implicit all risks yield.
The equated yield enabled a cross-
investment comparison between different
forms of property rights for a more direct
investment advice. Special circumstances
or problems of cashflow were structured
into the valuation process on Excel
platform. For instance, 3-year rent review
pattern under 10 years will leave a residual
term of 1 year which was conveniently and distinctly calculated as year 20 in Table 4
and Table 6 for NSDC and the Private firm
respectively.
The main weakness of DCF technique lies
with the infinitely long cashflow
projections, possible for freehold
calculation or leasehold with long
unexpired term. This was easily overcome
by assuming a holding period, (which in
the case study coincides with the lease-term of 30 years) after which the
investment was anticipatorily outrightly
sold. Specific problems affecting cashflow
were factored in and the results seen
instantly, giving room for iterations where
necessary. The application of MS Excel
empowered the ESV to scrutinize a range
of intelligent variations and reviews of
rents that would result in improved rental
incomes for both parties to the transaction.
It could be concluded that the MS Excel is
quite helpful to the Estate Surveyor and
Valuer for Valuation and investment
analysis. It is therefore recommended that
Surveyors should endeavor to be further
trained in the spreadsheet MS Excel applications and other compatible
capabilities.
ReferenceS Ajayi, C.A.(1998). Property Investment
Valuation and Analysis. PTF Low
Price Edition; Ibadan. De Ayo
Publications. Pp127-163
Aluko, B.T. (2010). Unpublished Lecture
Notes on Property Valuation.
Department of Estate Management
and Valuation, Federal University of
Technology, Minna
Appraisal Institute (2001). Appraisal of
Real Estate. 12th Edition. Chicago.
Appraisal Institute, pp29-43, 239-274 Babawale, G. K., and Omirin, M. (2012).
An assessment of the relative impact
of factors influencing inaccuracies in
valuation. International Journal of
Housing Markets and Analysis, 5 ( 2),
1 - 1.
Barnatt, C. (1994). The Computers in
Business Blueprint. Oxford OX41JF;
Blackwell Publishers pp96-97
Baum A and Crosby, N (1995). Property
Investment Appraisal. London, Routledge, pp7, 25-28, 127-191
Bender, S. (1994). The Role of Technology
in Sustainable Development.
Technology and Society, Vol. 13(4)
accessed at
https://www.how.edu.auction/sharon
p14.
Charles-Afolabi, C.Y., Olatunji,
I.A.(2016). Examination of Factors
affecting Accuracy of Valuation for
Secured Lending in Abuja , Nigeria.
Paper accepted for presentation at the School of Environmental Technology
international Conference, 2016, held
at the School of Environmental
Technology complex , on 10th-12th
May, 2016.
Davidson, A.W.(1982). Parry’s Valuation
and Investment Tables. London, The
Estate Gazette.

Olatunji, Udoekanem, Ojetunde &Kuma, Mainstreaming Information Communication Technology (ICT) in Real Estate Practice in Nigeria: Ms Excel for
Valuation and Investment Advice
36
French, N. (2015). Spreadsheets for
Valuations 50 Worked Examples
Using Microsoft Excel 2010. Journal
of Property Investment and Finance
33(2) . Emerald Group Publishing
Limited. pp205, 206. French, N. (2013) The Discounted
Cashflow Model for Properrty
Valuations: quarterly in advance
cashflows. Journal of Property
Investment and Finance, 3(16)
pp610-614.
French, N. (2008). Reversionary Freehold
Valuations by Spreadsheets:
Introducing Flexibility. Journal of
Property Investment and Finance, .
Emerald Group Publishing Limited.
26(3) pp 105-114. Jenkins, D. (2002). Residential Valuation
Theory and Practice. London, Estate
Gazette, pp25-39, 63-70
Kakulu (2003). A Computerized Approach
to Real Estate Practice in Nigeria.
Port Hacourt, IBK Publications. pp
53-92.
Ogunba, A.O. (2013). Principles and
Practice of Property Valuation in
Nigeria. Ibadan. Atlantis Books.
Pp125-134, 160-161 Olatunji, I.A, Ajayi, M.T.A., Udoekanem,
N.B.(2016). Mainstreaming
Information Communication
Technology in Real Estate Practice in
Nigeria: The Acquisition-Use Gap of
MS Excel (In Press)
Olatunji I.A.2014. Residential Choices and
Utility Optimization in Minna and Abuja. Unpublished PhD. Thesis
submitted to the Postgraduate School,
Federal University of Technology,
Minna, Nigeria.
Olatunji, I.A.(2010). Medium-term
Property Rights and Urban Poverty in
Minna. International Journal of
Housing Markets and Analysis. 3(3)
2010. Emerald Group Publishing
Limited, 1753-8270
Olatunji, I.A.(n.d.). Unpublished Lecture
Notes series on Applied Valuation, ETM 521 in the Department of Estate
Management and Valuation, Federal
University of Technology, Minna,
Nigeria.
Reed Business School and the University
College of Estate Management,
Reading(2009). Parry’s Valuation and
Investment Calculator. London,
Estate Gazette
Scarret, D.2008. Property Valuation: The
Five Methods 2nd Edition. London and New York. Routledge pp1, 53, 97

Environmental Technology & Science Journal Vol. 8 No. 2 December 2017
37
Evaluation of Diversification Strategies of
Construction Consultancy Firms
M. Abdulrazaq, R. Maiturare & Y. M. Ibrahim Department of Quantity Surveying, Faculty of Environmental Design,
Ahmadu Bello University, Zaria [email protected]
Abstract Research has shown that in today’s competitive world, firms need to embrace several
strategies in order to survive. The fluctuation in workload (availability of jobs) makes survival of the firms more difficult. For the firms to survive, diversification as a strategy has
been emphasised in literature. Despite the advantages offered by diversification, there are
few studies on the relative benefits associated with diversification strategies of construction
consultancy firms (CCFs). The aim of this research is to compare the diversification
strategies of the CCFs within the construction industry. The data used for this research was
collected with the aid of a semi-structured questionnaire. A total of 250 questionnaires were
distributed to construction consultancy firms within Kaduna, Abuja and Kano, out of which
154 questionnaires were retrieved. The feedback from the questionnaires was analysed using
descriptive statistics. The study concluded that the CCFs diversify into similar activities
such as contracting, construction management, project management, building and supply of
materials. Majority of the CCFs adopt internal business expansion as their mode of diversification. The study recommended that internal expansion of business should be a
major motivation for diversification of consultancy firms. Keywords: Diversification, Strategies, Construction, Consultancy Firms, Survival
Introduction In today’s competitive world, survival of
construction consultancy firms is very
essential for the sustenance of qualitative
outputs. The fluctuation in workload (i.e. the firms cannot forecast future demands
for their services or products) makes
survival of the firms more difficult. For the
firms to survive, they must adopt some
kind of strategies and one of these
strategies is diversification. There is a
need to understand the appropriate
combination of company strength and
analysis of potential markets for a company
to survive and keep up with its competitors
(Yee & Cheah, 2006). Hillebrandt and Canon (1990) defined diversification as
“the process by which firms extend their
business outside those in which they are
currently engaged”. This diversification is
viewed in two perspectives: (i) geographic
diversification and (ii) product
diversification.
Geographic diversification is concerned
with location of firms. Firms tend to move
from one market place to another to render
their services. Sometimes they go
international. Product diversification on the
other hand is concerned with the kind of services firms render or produce. Firms
diversify in their production and service
operation in order to survive. In this regard,
firms may choose to diversify into area that
related to their core business or into areas
that are completely unrelated to their core
business.
Researchers have studied diversification
and its impact on the performance of
construction firms. For example, Ibrahim
and Kaka (2007) studied the impact of diversification on the performance of
construction firms in the United Kingdom
and found that focused firms outperform
both moderately and highly diversified

Environmental Technology & Science Journal Vol. 8 No. 2 December 2017
38
firms based on return on total assets
(ROTA) and profit margin (PM). However,
other studies (e.g. Abdul, 2010) reveal no
significant performance difference between
undiversified and moderately and highly
diversified firms. Furthermore, Oyewobi, Windapo & Cattel (2013) found that, in
South Africa, construction companies
registered with the Construction Industry
Development Board (CIDB) contractor’s
register perform and diversify more in their
services/products than the non-registered
contractors. The result also indicated that
there are no statistically significant
differences in the performance of
diversified and undiversified firms.
Most researchers focused on professional service firms such as business, law,
marketing, management firms’ etc. while
other researchers focused on construction
firms. Very few researchers such as Carol
Roger and Lu (2014) studied construction
consultancy firms (CCFs). They found five
key factors that have influence on the scope
and scale of construction professional
service firms (CPSFs): the importance of
growth as a driver; the influence of the
ownership of the firm on the decision for growth in scope and scale; the optimization
of resources and capabilities; the need to
serve changing clients’ needs; and the
importance of localization. Chung and
Charles (2006) studied the
interrelationships among profitability, firm
size, and generic strategies and found out
the following: (i) The profitability of an
Engineering and Construction (E & C) firm
has no relation to its size, (ii) Profitability
is significantly related to generic strategies
(iii) Generic strategies are significantly related to company size. According to
Abdul (2010), Quantity Surveying (QS)
firms in Nigeria diversify to ensure
steadiness of earning and as a survival
strategy.
While the results of the previous studies are
not all in agreement, they suggest that
diversification offers some advantages to
the firm. Construction and consultancy
firms operate under the same general economic conditions. However, most of the
studies reported did not consider the
diversification relationship amongst
consultancy firms in the construction
industry.
The fluctuation in workload makes it necessary for firms to know the right
business mix (Ibrahim and Kaka, 2007).
Ibrahim and Kaka, 2007 observed that the
way forward is for the firm to diversify into
areas where opportunities exist for
responding to the changing environment.
Despite the advantages offered by
diversification, there does not seem to be
studies on the relative benefit associated
with diversification strategies of
consultancy firms.
Yee and Cheah (2006) observed that what
makes the subject of movement
(diversification) so important now is that in
construction, current workloads do not
guarantee future workloads due to
fluctuating demands. For any existing
business, survival is the main concern.
Businesses try to build their strategies for
survival so as not to collapse. The need for
this study is to provide an opportunity for
learning among the consultancy firms.
The aim of this research is to compare the
reasons for diversification by Consultancy
firms within the Nigerian construction
industry.
Diversification Diversification is defined as the act or
practice of manufacturing a variety of products, investing in a variety of
securities, selling a variety of merchandise
etc. so that failure in or an economic slump
affecting one of them will not be disastrous
(Yee and Cheah, 2006). Diversification is a
risk management technique that mixes a
wide variety of investments within a
portfolio. It’s also means having different
lines of business, product or services (Dhir
& Dhir, 2015). Diversification strives to
smoothen out unsystematic risk events in a
portfolio so that the positive performance of some investment will neutralize the
negative performance of others
(|Hillebrandt and Canon, 1990).

Abdulrazaq, Maiturare & Ibrahim
Evaluation of Diversification Strategies of Construction Consultancy Firms
39
Review of Related Works On
Diversification Omokolade Akinsomi, Pahad, Nape, and
Margolis (2015) argued that,
Diversification of property portfolios into
emerging markets like those found in
Africa has not been explored to any great
depth. Recorded historical performance of
emerging markets has resulted in the gross
generalization that these markets, overall,
are volatile and that they offer
diversification prospects for global investors. With regard to real estate
investment performance, there is little
evidence as to whether these investments in
emerging markets offer significant
diversification prospects for international
investors.
Chung and Cheah (2006) argued that
strategic management theories are slowly
gaining recognition in the construction
industry with incremental efforts to apply concepts such as competitive positioning to
the industry, but empirical findings relating
these theories to the performance of E&C
firms remain lacking. The study adopted
fundamental analysis as the research
method which is commonly used in the
field of finance and economics. The
research was also able to study the recent
growth trends of the construction industry
which the result point at: a synchronized
global trends of the construction industry is
absent, and the industry is still very much cyclical in nature.
Kim and Reinschmidt (2011) reported that
the diversification by the largest US
contractors. The research method used for
this study was quantitative approach. The
findings of the study identified, (i) cross-
correlations between construction market
sector, (ii) overall and detailed
diversification patterns of the largest US
contractors, (iii) significance of contractors’ diversification activities based
on the frequency of market entries, (iv)
different strategies: apparently risk-
oriented, and (v) different firm
performances in the areas of business
stability and growth.
Chung and Cheah (2006) in their other
study of interactions between business and
financial strategies of large engineering and
construction confirmed that a firm which
internationalises would be inclined to
increase the level of asset liquidity in order to cushion any adverse impact arising from
the move.
Choi and Russell (2004) showed that the
performance of construction merger and
acquisitions (M&A) was positive at an
insignificant level, as measured by equity
market returns.
In the UK, Ibrahim and Kaka (2007)
revealed that there are no difference in
performance of undiversified, moderately diversified and highly diversified firms.
Cole and Karl (2016) argued that a
considerable amount of uncertainty exists
regarding how the implementation of the
new law with regards to diversification,
will influence the financial performance of
health insurers. Furthermore, their study
found that using both firm- and
conglomerate-level diversification may
magnify the costs or benefits of
diversification on the financial performance of a conglomerate. This
suggests a positive relation between health
insurer financial performance and the use
of both product line diversification
methods.
Sugheir, Phan, and Hasan (2012) argued
that early articles proposed a positive
relationship, while subsequent research
supported a negative influence on
innovation from product diversification
based on observable reductions in research and development expenditures. Such
findings also suggest a negative influence
on absorptive capacity from increasing
product diversification. The findings
supported the notion that diversification
beyond certain limits is value-destroying.
According to Su and Tsang (2015)
secondary stakeholders, as represented by
various non-profit or non-governmental
organizations, serve as agents mitigating the external constraints embedded within

Environmental Technology & Science Journal Vol. 8 No. 2 December 2017
40
socio-political environments. Firms should
therefore maintain relationships with
different secondary stakeholder scopes
commensurate with their product
diversification levels in order to enhance
financial performance.
Zhang, Su, Sun, Zhang and Shen (2015)
are of the opinion that it is necessary to
investigate the business diversification of
Chinese firms from the perspective of the
specific mechanisms in and institutional
environment of the country in which they
operate. Their result showed the
diversification level of politically
connected firms to be significantly higher
than that of their non–politically connected
counterparts.
Anderson, Benefield and Hurst (2015)
found that risk-adjusted performance
measure is derived in a very
straightforward manner. Therefore, the
study suggested that the positive impact of
diversification on return on assets is due to
significant shielding against property-type
specific risk. Furthermore, it suggested
that the benefit to return on equity from
diversification is due to the availability of a larger investment opportunity set that
allows managers to choose the most highly
performing properties.
Li (2014) showed that Combining labour
mobility/spill-offs, friendship ties,
professional gatherings and competitive
interaction, a horizontal framework of
clusters is developed as an alternative way
to interpret local and external learning
processes.
Qiu (2014) stated that despite the findings
in previous literature, how product
diversification affects firm market value in
a global marketplace with diverse cultural
values remains unknown. The findings
demonstrate that uncertainty avoidance and
power distance significantly affect product
diversification and that product
diversification leads to better market value
of large international firms. The findings
show that uncertainty avoidance has a significant positive impact on the product
diversification of large international firms.
The findings highlight the notion that high
uncertainty avoidance should be a strategic
guideline for global marketers if product
diversification is on the firm’s strategic
agenda.
Baysinger and Hoskisson (1989) stressed
that questions concerning the performance
implications of corporate diversification
strategies and the way they are
implemented, especially with respect to
research and development spending,
remain unsettled in the strategy literature.
The firms providing data for this study
were drawn from the industrial
corporations included in the COMPUSTAT
Services data base. This study provides empirical evidence that choice of
diversification strategy systematically
affects R&D intensity in large multiproduct
firms. Research and development intensity
in dominant-business firms was found to be
significantly higher than in related- and
unrelated- business firms and was also
higher in related-business firms than in
unrelated-business firms. The paper
isolated all manufacturing firms in the data
base reporting research and development expenditures in the 1980-82 period for
whom archival data on other relevant
organizational and financial attributes were
available. This make the findings to be
limited to a class of firms.
Lu, and Jewell (2014) studied the dilemma
of scope and scale for construction
professional service firms. The study
investigated the key factors impacting on
the growth in scope and scale for large CPS
firms. The study argued that existing theories of firms’ growth in scope and scale
mostly focus on the manufacturing sector,
without considering the characteristics of
service firms. Lu et al (2014) further
asserted that there has been little work done
on services, and, in particular, on CPS
firms. The study is therefore exploratory in
nature, where qualitative data from the
interviews were underpinned by secondary
data from CPS firms’ annual reports and
analysts’ findings. The research provided valuable insights into the growth strategies

Abdulrazaq, Maiturare & Ibrahim
Evaluation of Diversification Strategies of Construction Consultancy Firms
41
of international CPS firms. A major finding
of the research is the influence of
ownership on CPS firms’ growth strategies
which has not been highlighted in previous
research.
Research Method This study was carried out within Abuja
(the Federal Capital Territory) and two
states (Kaduna and Kano) states located in
the North-west Geo-political Zone of
Nigeria. The target population for this
study is Construction Professional Firms
(CPSF), particularly Quantity Surveying,
Architectural and Engineering Firms (and the target respondents are focused is the
Top Managers). Quantitative approach was
used to gather and analyse data.
According to the NIQS report, 396 firms
are legally recognized in Nigeria. The
Architects Registration Council of Nigeria
(ARCON) gives a list of registered
architectural firms in Nigeria as at 2013 as
849. Vconnect (2016) listed 7543 civil
engineering companies, and 3472
mechanical engineering companies. All the firms are, by law allowed to operate in
the study area
The sample size was computed using the
formula established by (Yamani 1986). The
formula is: n= N/1+N(e²).
Where
n is required sample
N is population size &
e is error in percentage (5%)
The sample size for this study is 320
The data used for this research was collected with the aid of a semi-structured
questionnaire that was divided into two
sections. Section A sought general
information of the respondents while
section B focused on the identified reasons
for diversification which was obtained
from literature. Section B also contained
questions on mode of diversification
adopted and nature of business undertaken
by the respondents. Numerical values of 1-
5 was assigned to respondents’ rating with
1-not important, 2-less important, 3-
important, 4-more important, and 5-very
important. This is done to facilitate the analysis and ranking exercise. 250
questionnaires were distributed within
Kaduna and Abuja, 152 were retrieved.
The data obtained from the questionnaire
survey were of numerical nature. The
numerical data were compiled and entered
into the Statistical Package for Socials
(IBMSPSS version 21) Software.
The analysis of the data involved
descriptive statistical operations available in the SPSS software. The quantitative data
were analysed and results of descriptive
statistics obtained include measures of
central tendency (means) and standard
deviation.
Findings The data obtained for the research is
presented using Tables. The results of the analysis form the basis for discussion
conclusion.
Below is the presentation of data used for
this research.
Table 1 shows the different categories of
respondents. The categories of
respondents are construction consultancy
firms (CCFs). The CCFs are Quantity
Surveying firms with 27.3%, Architectural
firms with 20.8%, Civil Engineering with 19.5%, Electrical Engineering with 16.2%,
Mechanical Engineering with 14.9%, and
others 1.3. This implies a close balance of
representation of the various professions
involved in construction works.

Environmental Technology & Science Journal Vol. 8 No. 2 December 2017
42
Table 1: Types of Firms
Frequency Percent Valid Percent Cumulative Percent
Quantity Surveying 42 27.3 27.3 27.3
Architecture 32 20.8 20.8 48.1
Civil Engineering 30 19.5 19.5 67.5
Electrical Engineering 25 16.2 16.2 83.8
Mechanical Engineering 23 14.9 14.9 98.7
Others 2 1.3 1.3 100.0
Total 154 100.0 100.0
Table 2 shows the period of practice for the
different categories of firms. A total of 43
firms have been in practice for less than 5
years (27.9% of firms under study). A total
of 55 firms have been in practice for less 5-
10 years (35.7%). Twenty-two (22) firms
have been in practice for 10-15 years (14.3%), while 34 (22.1%) firms have been
in practice for over 15 years. This
distribution means that the quality of data
will be reliable as all categories of firms,
by years of experience, are evenly
represented.
Table 3 shows the size of firm and it was
classified based on the number of
employees. The Table shows that 42.2% of
the firms are small with less than 10
employees, 33.8% are medium with 11 to
30 employees and 23.4% are large with
over 30 employees. This implies that majority of the firms
studied are small. This may skew the
findings of the research towards the small
firms.
Table 1: Period of Practice
Frequency Percent Valid Percent Cumulative Percent
Less than 5 Years 43 27.9 27.9 27.9
Between 5-10 Years 55 35.7 35.7 63.6
Between 10-15 Years 22 14.3 14.3 77.9
Above 15 Years 34 22.1 22.1 100.0
Total 154 100.0 100.0
Table 2: Size of Firms
Frequency Percent Valid Percent Cumulative Percent
Less than 10 65 42.2 42.5 42.5
Between 11-30 52 33.8 34.0 76.5 Greater than 30 36 23.4 23.5 100.0
Total 153 99.4 100.0
Missi
ng
System 1 .6
Total 154 100.0

Abdulrazaq, Maiturare & Ibrahim
Evaluation of Diversification Strategies of Construction Consultancy Firms
1
Table 4 gives the states of diversification of
the respondents. 38 (24.7%) respondents said no, which means their firms do not
diversify. While the remaining 116 (75.3%)
said yes, i.e. their firms diversify.
Table 5 above shows the reasons why firms
diversify. The major reason is “To Achieve
Faster Growth for Your Business” with the
highest mean and standard deviation of
3.91 and 1.077 respectively. Next is “To
Ensure Steadiness of Earning “with 3.91 as
mean and 1.127 as standard deviation. The
table shows this information in descending order, which is from the highest to the
lowest respectively. The lowest ranked
reasons for diversifying is ‘to provide
greater sense of job security” with 3.48 as
mean and 1.195 as the mean deviation.
Table 6 shows the frequency of the types of
businesses the consultancy firms diversify
into. Majority of Quantity Surveying firms
diversify into Contracting services and
Project management services with frequencies of 22 and 22 respectively.
Majority of the Architectural firms
diversify into Building services and Construction management services with
frequencies of 15 and 15 respectively.
Civil Engineering firms diversify majorly
into Contracting and Construction
Management services with the respective
means of 15 and 15 respectively. Electrical
Engineering firms mostly diversify into
Project Management services and supply of
construction materials. Majority of
Mechanical Engineering firms diversify
into Contracting services and Supply of construction materials.
Table 3: State of Diversification
Frequency
Percent
Valid Percent
Cumulati
ve Percent
No 38 24.7 24.7 24.7
Yes 116 75.3 75.3 100.0
Tot
al 154 100.0 100.0
Table 4: Reason Why CCFs Diversify
N Range Minimum Maximum Mean Std. Deviation
To Achieve Faster Growth for their Business 114 4 1 5 3.91 1.077 To Ensure Steadiness of Earning 116 4 1 5 3.91 1.127 To Increase Market Share and Market Profitability 115 4 1 5 3.81 0.936 As a Survival Strategy 115 4 1 5 3.77 1.06
To Limit the Effect of Unstable Market 114 4 1 5 3.75 1.003
As an Escape Route for Declining and
Low Profitability in Business 113 4 1 5 3.73 1.052 To Improved Depth Capacity and Reduced the Chance of Bankruptcy 116 4 1 5 3.6 1.07
To Increase the Economies of Scale and Growth 114 4 1 5 3.59 1.071 To Reduce Exposure to Business Risk 113 4 1 5 3.58 1.025

Environmental Technology & Science Journal Vol. 8 No. 2 December 2017
44
To Provide Greater Sense of Job Security 115 4 1 5 3.48 1.195 Valid N (list wise)
105
Table 6: Types of Businesses CCFs Diversify into TYPES OF BUSINESSES QS ARC CE EE ME OT
Quantity Surveying Services 0 7 7 9 1 0 Architectural Services 10 0 5 1 1 0 Electrical Engineering Services 2 5 6 0 6 1 Civil Engineering Services 5 7 0 2 3 1
Mechanical Engineering Services 3 4 8 5 0 1
Contracting Services 22 13 12 8 8 0 Construction Management Services 17 15 11 8 5 0 Building Services 12 15 10 3 3 0
Project Management Services 22 10 9 13 4 0 Mining 0 2 1 2 1 1
Quarry 2 3 3 0 0 1 Petrochemical Engineering Services 0 0 0 0 0 1
Aeronautical Engineering Services 0 0 1 0 1 0 Supply of Construction Materials 9 12 8 12 7 0
Others 1 9 5 5 0 0
Table 7 shows that internal business expansion has the highest frequency
followed by merger and acquisition.
Table 8 shows the mean and standard
deviation of each reason why firms
diversify based on types of the businesses.
Below are the presentation of each
category.
Table 7: Mode of Diversification
Case Number
Internal Business Expansion Merger Acquisition
1 1 79 49 21

Abdulrazaq, Maiturare & Ibrahim
Evaluation of Diversification Strategies of Construction Consultancy Firms
45
Table 8: Reason Why CCFs firms Diversify
Type of
Business
As a
Survival
Strategy
To Limit the
Effect of
Unstable
Market
To Achieve
Faster
Growth for
Your
Business
To Increase
the Economies
of Scale and
Growth
To Improved
Depth Capacity
and Reduced the
Chance of
Bankruptcy
To Reduce
Exposure to
Business
Risk
To Provide
Greater
Sense of
Job
Security
To Increase
Market Share
and Market
Profitability
As an Escape Route
for Declining and
Low Profitability in
Business
QS Mean
3.55 3.61 3.52 2.91 3.67 3.35 3.33 3.45 3.73
Std. Dev 1.063 1.029 1.121 1.156 0.957 1.092 1.291 0.905 1.232
Arc
Mean 3.96 4.04 4.16 3.96 3.54 3.5 3.88 4 3.65
Std. Dev 0.978 0.871 0.688 0.79 1.029 1.03 0.952 0.748 0.832
CE
Mean 3.8 3.4 3.85 3.37 3.3 3.45 3.45 3.7 3.5
Std. Dev 1.105 1.046 1.348 0.955 1.129 0.999 1.099 1.129 1
EE
Mean 4.1 4.21 4.38 4.29 4 3.89 3.10 4.3 4.1
Std. Dev 1.091 0.976 0.921 0.956 1.14 1.15 1.373 0.923 1.091
ME
Mean 3.57 3.29 4 3.79 3.5 3.77 3.71 3.71 3.79
Std. Dev 1.089 0.825 0.784 0.699 1.225 0.725 0.914 0.726 0.975
OT
Mean 3 4.5 1 3.5 3 3.5 3.00 4 3
Std. Dev 0 0.707
0.707 0 0.707 2.828 1.414 0
Total
Mean 3.77 3.75 3.91 3.59 3.6 3.58 3.48 3.81 3.73
Std. Dev 1.06 1.003 1.077 1.071 1.07 1.025 1.195 0.936 1.052

Environmental Technology & Science Journal Vol. 8 No. 2 December 2017
46
Quantity Surveying firms Quantity surveying firms rate “as an escape
route for declining and low profitability in
business to increase depth capacity” as the most important reason why they diversify
into other businesses with a mean and
standard deviation of 3.73 and 1.232
respectively. “To increase the economics of
scale and growth” is rate as the least reason
with 2.91 and 1.121 as mean and standard
deviation respectively.
Architectural firms The Table shows that Architectural firms
rated “to achieve faster growth of their
businesses” as the most important reason
they diversify into other businesses with
4.16 and .666 as mean and standard
deviation respectively. “To reduce
exposure to business risk” with 3.50 mean
and 1.030 standard deviation was rated as
the least important reason why they
diversify into other businesses.
Electrical Engineering firms Electrical engineering rated “to achieve
faster growth of their businesses” as the
most important reason they diversify into
other businesses with 4.38 .921. “To
provide greater sense of job security” with
3.10 mean and 1.373 standard deviation as
the least important reason why they
diversify into other businesses.
Mechanical Engineering firms Mechanical engineering firms rated “to
achieve faster growth of their businesses”
as the most important reason they diversify
into other businesses with 4.00 .784 as
mean and standard deviation. And “to limit
the effect of unstable market” with 3.29
mean and .825 standard deviation is rated as the least important reason why they
diversify.
Civil Engineering firms Civil Engineering firms rated “to ensure
steadiness of earning” as the most
important reason why they diversify with a
mean of 4.00 and standard deviation of
1.026. The CE firms rate “to improve depth capacity and reduces the chances of
bankruptcy” as the least important reason
why they diversify with a mean score of
3.30 and standard deviation of 1.129.
Other firms rate “to limit the effect of
unstable market” as the most important
reason why they diversify into other businesses with mean and standard
deviation of 4.50 and .707. It also rate “to
achieve faster growth for their business” as
d least important reason with 1.00 mean.
Discussion of Results The general overview of the above results
show that most of the firms diversify into
other businesses while few do not. The percentages of firms that diversify and
those that do not are 75.3% and 24.7%
respectively. Also the results shows that
most of the firms that diversify adopt
internal business expansion followed by
merger and lastly acquisition. The result
indicate that the majority of the firms are
small in size (with less than 10 employees)
with 42.2%. Next in line is the medium
size (between 11-30 employees) with
33.8%, and lastly the large size firms (with
over 30 employees) with 23.4%.
The result also shows that the most
important reason why firms diversify is “to
achieve faster growth for their business”
with mean & standard deviation of 3.91
and 1.077 respectively. Next is “to ensure
steadiness of earning” with 3.91 and 1.127
as mean and standard deviation. The
reasons are listed in descending order, from
the most important reason to the least
important reason in table 5. A similar result was reported by Abdul (2010), though the
study was only carried out on Quantity
Surveying (Q.S) firms.
The comparative result shows that majority
of the Q.S firms find “as an escape route
for declining & low profitability in
business to increase depth capacity” as the
most important reason why they diversify.
This finding disagree with the finding of
Abdul (2010) which reported that “to
ensure steadiness of earning” as the most important reason why Q.S firms diversify.
The finding also shows that Architectural,
Electrical Engineering (EE) and

Abdulrazaq, Maiturare & Ibrahim
Evaluation of Diversification Strategies of Construction Consultancy Firms
47
Mechanical Engineering (ME) rate “to
achieve faster growth of their businesses”
as the most important reason they diversify.
Majority of Civil Engineering (CE) firms
consider “to ensure steadiness of earning”
as the most important reason they diversify. This finding is similar to that of Kim and
Reinschmidt (2011) who reported that
diversified contractors live longer since
they have more establishment in multiple
sectors.
“To increase the economy of scale and
growth” is rated as the least reason why
Q.S firms diversify. While Architectural,
CE, EE, and ME firms shows “to reduce
exposure to business risk”, “to improve
depth capacity and reduced the chance of bankruptcy”, “to provide greater sense of
job security”, and “to limit the effect of
unstable market” respectively are rated as
the least important reason why they
diversify.
The result also shows areas where CCFs
diversify into. The CCFs mostly diversify
into construction related services such as
project management services, contracting
services, construction management services, supply of construction materials
etc. This was highly expected because the
CCFs have some knowledge on
construction related services. The Q.S
firms mostly diversify into project
management services and contracting
services, this is because they have a basic
knowledge of the above mentioned
services. Although the findings disagreed
with that of (Abdul 2010).
Conclusion This study investigated the reasons
Construction Consultancy Firms diversify
into other businesses. Most of these firms
diversify into construction related services
such as mining, quarry contracting, project
management, construction management,
building services and supply of
building/construction materials.
Architectural, EE, and ME firms share common most important reason why they
diversify as “to achieve faster growth for
their businesses”. The Q.S firms have “as
an escape route for declining and low
profitability in business to increase depth
of capacity” as the main reason for
diversifying. Based on reasons for
diversifying, Architectural, EE, and ME
firms have similarities.
The CCFs diversify into similar activities
such contracting, construction
management, project management,
building and supply of materials activities.
Majority of the CCFs adopt internal
business expansion as their mode of
diversification.
Recommendations The following recommendations can be
drawn from the study:
i. Firms should adopt internal mode
of diversification as strategies for
diversification
ii. Achieving faster growth for
businesses should be the main
focus of firms for diversifying.
iii. Further studies should be carried
out on Consultancy firms’ success
as a result of diversification.
References Abdul, P. O. (2010). An Investigation into
the Diversification Strategies used by
Quantity Surveying Firms in Nigeria.
A B U,, Department of Quantity Surveying, Zaria.
Anderson, R. I., Benefield, J. D., & Hurst,
M. E. (2015). Property-type
diversification and REIT
performance: an analysis of operating
performance and abnormal returns.
Journal of Economics and Finance,
39, 48–74.
Baysinger, B., & Hokisson, R. E. (1989).
Diversification Strategy and R&D
Intensity in Multiproduct Firms.
Academy of Management, 32(2), 310-332.
Carol, J., Roger, F., & Lu, a. W. (2014).
The dilemma of scope and scale for
construction professional service
firms. Construction Management and
Economics, 32(5), 473–486.
Chung, Y. & Charles, Y. J. (2006).
Fundamental analysis of profitability
Environmental Technology & Science Journal Vol. 8 No. 2 December 2017
48
of large engineering and consrtruction
firms. Journal of Management in
Engineering, 22(4), 42–59.
Choi, J., & Russell, J. S. (2004). Economic
Gains Around Mergers and
Acquisitions in the Construction Industry of the United States of
America. Journalof Civil Engineering,
31, 513-525.
Cole, C. R., & Karl, J. B. (2016). The
effect of product diversification
strategies on the performance of
health insurance conglomerates.
Journal of Applied Economics, 48(3),
190-202.
Dhir, S., & Dhir, S. (2015). Diversification:
Literature Review and Issues. Journal
of Strategic Change, 24(10), 569-588. Hilebrandt, P. M., & Cannon, J. (1990).
The Modern Construction Firms.
Macmillan Publishers, USA.
Ibrahim, Y. M., & Kaka, A. P. (2007). The
impact of diversification on the
performance of UK construction
firms. Journal of Finacial
Management of Property and
Construction, 12(2), 73–86.
Kim, H.-J. & Reinschmidt, K. F. (2011).
Diversification of the Largest US Contractors. Journal of Civil
Engineering, 38, 800-810.
LI, P.-F. (2014). Horizontal versus Vertical
Learning: Divergence and
Diversification of Lead Firms in the
Hangji Toothbrush Cluster, China.
Journal of Regional Studies, 48(7),
1227–1241.
Lu, W., Ye, K., , R., & Jewel, C. (2014).
Nexus between Contracting and
Construction Professional Service
Businesses: Empirical Evidence from International Market. Journal of
Construction Engineer- ing and
Management, 9, 1-9.
Oyewobi, L. O., Windapo, A. O & Cattell,
K. S. (2013). Impact of diversification
on South African construction
companies’ corporate performance.
Journal of Finacial Management of
Property and Construction, 18(2),
110–127.
Omokolade, A., Radiyya, P., & Joshua, N.
L. (2015). Geographic Diversification Issues in Real Market Estate in
Africa. Journal of Real Estate
Literature, 23(2), 261-295.
Qiu, T. (2014). Product Diversification and
Market Value of Large International
Firms: A Macroenvironmental
Perspective. Journal of International
Marketing, 22(4), 86-107.
Su, W., & Tsang, E. W. (2015). Product
Diversification and Financial
Performance: The Moderating Role of
Secondary Stakeholders. Academy of Management Journal, 58(4), 1128–
1148.
Sugheir, J., Phan, P. H., & Hasan, I.
(2012). Diversification and
Innovation Revisited: An Absorptive
Capacity View of Technological
Knowledge Creation. Journal of IEEE
Transaction on Engineering
Management, 59(4), 530-539.
VConnect. (2016, May 6). Retrieved from
Opera: file:///C:/Users/User/Desktop/Listf%2
0Civil%20Engineering%20Firm,%20
Company%20&%20Courses%20Abu
ja%20_%20VConnect™.html
Yee, C. Y., & Cheah, C. Y. (2006).
Interactions between Business and
Financial Strategies of Large
Engineering Firms. Journal of
Management in Engineering, 22(3),
148-155.
Zhang, M., Su, J., Sun, Y., Zhang, W., &
Shen, N. (2015). Political Connections and Corporate
Diversification: An Exploration of
Chinese Firms. Journal of Emerging
Markets Finance & Trade, 51, 234–
246.

Environmental Technology & Science Journal Vol. 8 No. 2 December 2017
49
Assessing the Status of E-Procurement
System in Nigerian Construction Industry
Yusuf Joe Gandu, Haruna Musa, Peter Chindo Gangas & Abdu, A. Ali
Department of Quantity Surveying, Ahmadu Bello University, Zaria Nigeria [email protected]
Abstract The term E-Procurement refers to the process of using electronic technology to acquire
goods and services. Various countries have adopted the technology at diverse levels in the
procurement of construction projects. Previous studies showed that e-procurement (e-P) has
the ability to improve economic performance if properly implemented in construction
procurement; yet the developing countries lag behind in implementation. Very little is
therefore known of e-P used in the construction sector of Africa. It is still unclear whether
the concept, benefits and level of adoption of e-procurement is known in which this work
sets to fill the gap. The aim of this paper therefore is to assess the status of e-
Procurement system in Nigeria. Key parameters of the assessment are the understanding of
the tool, level of application and barriers impeding the adoption. Data was collected using
structured questionnaire through a purposive sampling of Quantity surveyors in Kaduna and Abuja Nigeria. Descriptive statistical tool was used to analyse the data. Findings
showed that respondents have limited understanding of the components of e-procurement
tools. Only e-tendering is well understood and adopted by the respondents. Respondents
are o n l y aware of the common aspects of t h e b e n e f i t o f e-procurement
implementation to the economy and are not aware of its benefits in terms of improvement
of team work, payment efficiencies, quality management and marketing strategy. The result
also showed that other than poor understanding of various tools of the technology, security
and legal concerns still pose significant impediments to extended adoption of e-
procurement in construction business. The general level of implementation of e-
procurement is found to be low a n d s l o w , therefore t h e associated benefits not
fully exploited. The concerns identified herein, create opportunity for the understanding of the right direction in the efforts by stakeholders to improve the level of adoption and
strategy. More training and education is required in the sector to improve the awareness
level and to motivate a wider implementation of e-Procurement in Nigeria becomes
necessary at this level. The research therefore suggests an aggressive enlightenment
programs to be directed on client organizations, on all professional consultants,
contractors and relevant government agencies on the benefits of adopting e- Procurement
in the construction industry.
Keywords: E-procurement; Construction; technology, Quantity Surveyors, stakeholders
Introduction The web or internet has changed the
traditional functions of computers from
data storage, processing and
data/information retrieval to include
reducing distance barrier in business
transactions (Bello & Iyagba, 2013). E-
procurement (e-P) which uses the web, has been changing the way in which
organizations acquire goods and services
(Hassan, Tretiakov, Whiddett & Adon,
2014). The technology has many tools
that can achieve activities like advertising
tenders, acquiring and returning tenders

Environmental Technology & Science Journal Vol. 8 No. 2 December 2017
50
electronically, electronic ordering,
internet sourcing via third parties, email
communications between buyers and
sellers, email communications related to
contract management, and the integration
of procurement within financial and inventory systems (Bakar, Peszynski,
Azizan, & Sundram, 2016) with
associated value. E-Procurement adoption
refers to the actual use of web-based
technologies, tools or processes to
support the execution of some or all
aspects of construction procurement
activities (Ibem, Aduwo, Tunji-Olayeni,
Ayo-Vaughan & Uwakonye, 2016).
Previous studies show that better value
for money in the construction sector has
been achieved in countries that adopted e-P (Hashim, Said & Idris, 2013; Adzroe
& Ingirige, 2014). Studies have also
demonstrated the potentials of the
technology to improving performance in
firms (Hashim, Said and Idris, 2014).
Invariably, findings have put it that
developing nations are lagging behind in
adopting the technology (Egbu, 2003 cited
in Ateto et al., 2013; Aduwo, Ibem,
Uwakony, Tunji-Olayeni, & Ayo-Vuaghan,
2016). Ibem and Laryea, (2015) found that e-P technology is still at its infancy in
Africa while Hassan et al. (2014) opined
that t h e complex nature of the e-P
practice is contributory. This complex
nature has the construction projects
characteristics playing major role.
Other research works conducted at different
locations attempted to avail other key
barriers impeding e-P adoption in th e
African continent (Ateto, Hosndieki, &
Okibo, 2013, Chilipunde 2013, Adebayo &
Evans, 2016, Aduwo et al., 2016). Yet it is believed that very little is still known of e-
P use in the construction sectors due to
several barriers in developing countries
like Africa (Ibem & Laryea, 2015). This
assertion suggests that more research work
is still required in this field apart from the
necessity to progressively monitor
performance and the level of the impact of
the identified barriers. Arising from the
dismal description of the situation, it
is doubtful if the concept of e-P, its varying tools and technologies or
benefits is well understood in Africa,
which becomes a subject for inquest.
It is pertinent to make clear first the
concept of e-P within the construction
domain. This paper was therefore set to
assess the status of e-Procurement system in the Nigerian construction sector. The
objectives of which are to:
i. articulate the e-P concept within
the construction domain
ii. assess the level of understanding
of varying components, tools and technologies and also the level of
application of these tools and
technologies in the construction
sector
iii. appraise the understanding of the
benefits of e-P to the economy
and to practicing firms and
iv. identify prominent barriers still impeding the rapid adoption of
e-Technology
E-Procurement Concept in
the Construction Sector Procurement is not a unique case for the
construction industry, rather a core activity
in every business processes in all
organizations. E-P fundamentally supports
the way all organizations conduct
traditional procurement activities, and it
automates and simplifies many business
processes and transactions (Aduwo et al.,
2016). However, construction differs
significantly from other industries
(Eadie, Perera, Heaney and Carlisle, 2007), as such, it is important to understand e-
P within construction context. Proper
conceptualization of e-P in construction
perspective will facilitate the right
implementation strategy and derive home
optimum value associated. Proper
conceptualisation allows optimum response
to flow inefficiencies in acquisition
processes.
Some distinct characteristics of
construction, according to Eadie et al. (2007) are that it is a stationary product,
the production line keeps changing
locations, its complexity and the

Gandu, Musa, Chindo Gangas & Abdu
Assessing the Status of E-Procurement System in Nigerian Construction Industry
51
economic value essentially differing from
other industries. Dowsett and Harty,
(2013) identified some characteristics
as highly fragmented design and
production process, differentiated
stakeholders with discerned behaviours or approaches to issues, specific goals, and
diverse influences or needs among others.
Laryea and Ibem (2014) added that
construction procurement process
involves several steps, activities, people
and organizations and yet, takes a long
time, in most cases, to accomplish. The
nature of construction is unique, the
technology to adopt must therefore be
relevant to its nature (Harty, 2005). It cause
the industry to face different kinds of
complex challenges (Eduwo et al., 2016). Thus, suggesting why the construction e-P
is not only unique but complex (Hassan et
al., 2014). E-P in construction has six
basic activities namely: establish the
need, strategise, solicit for offers,
evaluate offers, award contract and then
monitor implementation (Laryea & Ibem,
2014). The scholars then identified the
pattern of technology involved in e- P
relevant to construction in line with the six
activities identified.
Bakar et al. (2016) found differences in
the scope and details in the definitions of
e-P after various definitions by diverse
scholars were reviewed. While a single
definition of e-P hardly reflects
completely the complex array of
activities in construction procurement, it
can be conceptualized as the use of
web-based technology to execute all or
part of the phases of construction projects
business transactions.
The E-P tools/technology The pattern of e-P technology relevant at
varying stages of the construction process
was assessed by Laryea and Ibem (2014).
The technology can be in form of
processes or products which may include
engineering and scientific concepts, new
products, processing systems, production processes, physical equipment or tools
(Laryea & Ibem, 2014). Similarly,
McConnell (2009), Kamaruzamana and
Mohamed (2013) and Bakar et al. (2016)
identified and discussed the varying
relevan t tools or aspects of e-P in
construction to incl ude but not
l imited t o E-Informing/E-notification,
E-Sourcing, E-Tendering: E-Reverse
auctioning, E-Awarding, E-Contract
Management, E-Ordering, E-Markets, E-
MRO (Maintenance, Repair and Operations) and Web based ERP
(Enterprise Resource Planning), E-
Invoicing, E-cataloguing, E-purchasing, E-
negotiation. Table 1 listed and explained
key tools or aspects of e-P.
Table 1: Tools of e-Procurement Tools Definition
1 E-informing/E-
notification
Process of gathering and distributing purchasing information both from and to
internal and external parties
2 E-sourcing Process of identifying potential new suppliers for a specific category of
purchasing requirements
3 E-tendering Concerns the process of sending requests for information and prices to suppliers,
and receiving responses from suppliers using Internet technologies
4 E-reverse
auctioning
Internet technology that enables purchasing companies to buy goods and
services that either have the lowest price, or a combination of the lowest price
and other conditions
5 E-Awarding Involves secure tender opening (being able to only open tenders that have been
submitted by closing date and time), tender evaluation and tender award.
Typically this is facilitated using similar systems to those used for e-notification
and e-tendering.

Environmental Technology & Science Journal Vol. 8 No. 2 December 2017
52
6 E- Contract
Management
Use of information technology for improving the efficiency and effectiveness of
contracting processes of companies. As a result of the e-notification, e-tendering
and e-awarding stages agreement can be established with the suppliers. Unlike
conventional auction where the prices generally increases, e-auction are
commonly referred to as reverse auction as the price quoted by suppliers
generally decreases
7 E-Ordering, The use of Internet to facilitate operational purchasing process, including
ordering (requisitioning), order approval, order receipt and payment process. This
involves an organization raising orders of agreed contracts or catalogue
(following on from the stages above) and the transmission and acceptance of this
by suppliers
8 E-Markets Meeting venues for component suppliers and purchasers, who use exchange
mechanism to electronically support the procurement process. Early e-
procurement solution focused on this aspect of e-procurement (e.g. electronic
data interchange, e-catalogue and e-marketplaces) as this was perceived as the era
where maximum efficiency could be achieved since it has a direct link with e-
ordering.
9 E-MRO
(Electronic
Maintenance
Repair and
Operation) and
Web-based
ERP(Enterprise
Resource
Planning)
E-MRO focuses on the process of creating and approving purchasing requisitions,
placing orders and receiving goods or services ordered using system software
based on Internet technology. The system involves the use of electronic
infrastructure to transfer purchase orders, invoices, payments and other relevant
information for indirect products and services. While,
Web-based ERP system involves the procurement of direct goods/product related
items (goods that are directly used to produce finished products) and any related
transactions such as purchase order, invoices, payments and other necessary
documentation via online
10 E-Invoicing A situation where an organization electronically receives invoices from suppliers
and following electronic matching (e.g. against the purchase and goods received
notes), making electronic payment via a Bank Automated Clearing system
(BAC). This electronic payment of suppliers has been identified by many
organizations as a quick win in relation to e-procurement, given the processes and
activities. E-invoicing is performed alongside E-MRO and ERP.
11 E-cataloguing Refers to the electronic presentation of information regarding the products and
services of an organization.
12 E-purchasing A series of tools used to help procurement professionals and end-users undertake
more efficient processes, and receive more accurate order details. The tools
include purchase-to-pay systems, purchasing cards and invoicing solutions
13 E- negotiation refers to a mechanism that allows for a recursive interaction between a buyer and
supplier, thereby allowing the resolution of a good deal
14 Web-based
Electronic
Data Interchange
(Web-based E
Web-based EDI systems are a cost-effective way to automate the exchange of
structured documents on business arrangements between trading partners as all
transactions are done electronically. The system enables companies to replace
expensive EDI communication with less costly web communication and provides
them real time information about market conditions.
15 Electronic Auction
(e-auction)
E-auction is the process of bidding products over the Internet and the auction is
most often traded in real time. E-auction enables companies to purchase goods or
services from suppliers who offer the lowest price or a combination of the lowest
price and other aspects.
Adapted from: McConnell (2009), Kamaruzamana and Mohamed, (2013), Bakar et al. (2016)
Ateto et al. (2013) noted that as the ICT
society continue to develop, there is the
need to understand e-P practices and
adopt it in the construction sector.
Particularly, t h e study noted that its
application in construction generally lags
behind when compared with other
industries. Considering the apparent shift from traditional to electronic procurement
environment, Bakar et al. (2016) abridged
the understanding of the traditional
procurement and e-procurement. Various
definitions of e-procurement were
appraised, and the tools and benefits
identified. Laryea and Ibem (2014),
through an evidence-based literature
review identified and analysed three
patterns of technological innovations in the use of E-P in construction. The
patterns of technological innovation

Environmental Technology & Science Journal
Vol. 8 No. 2 December 2017
53
were a l s o linked to the nature of
construction procurement process. The
research concluded that the industry is
gradually moving towards fully computer-
based virtual procurement method
characterised by a high degree of integration and collaboration across the
entire construction procurement lifecycle.
However, the innovative use of e-P
technologies in Africa manifested more
at tendering and administration stages than
in the other stages of construction
procurement process (Laryea and Ibem,
2014). The benefits of e-tendering in
construction were outlined b y
Chilipunde (2013). Earlier,
Baladhandayutham and Venkatesh (2012)
developed a list aimed at identifying how the benefits of e-P influence its adoption
in the construction industry. The study
b y Baladhandayutham and Venkatesh
(2012) did not specifically focused on
the value propositions; instead it focused
more on its influence on the decision to
adopt e-P. Then, Hashim et al. (2013)
explored the values with e-P in the
Malaysian construction industry. More
recently, Chebii (2016) made an inquest
into determinants for successful implementation of e-procurement in the
Kenyan public sector. Technology,
government support, and supply chain
responsiveness were found important.
Similar study was carried out in
Mombasa by Mohammed and Milimu
(2016), the objectives of which were to
determine the influence of technology on
progress of e-procurement in the county
government, to assess how organizational
culture affects the implementation of e-
procurement and to establish how environment influences the use of e-
procurement system. The researchers
found a strong correlation between the use
of e-P and cost minimization, efficiency
and organizational culture, and that there is
a strong advocacy in favour of e-
procurement. Chilipunde (2013) studied
the drivers and barriers to e-tendering in
Malawi. Acknowledging that e-tendering is
just an aspect of e-procurement, the
researcher found that there was ignorance in the benefits of e-tendering systems. This
ignorance cannot guarantee motivation for
the quick adoption of the technology
In South Africa, findings reveal that only
four categories of e-Procurement namely:
e-mail, static websites, web.2.0 technologies and portals that have
capabilities of supporting the execution
of functions limited to intra and inter
firm communication and exchange of
project information and data were used.
Only between 11 and 12 percent of the
respondents used these e-Procurement
technologies for communication of
information, exchange of bill of
quantities, CAD drawings and project
specifications (Ibem & Laryea 2015).
In Nigeria, several research works
have also been conducted along the
e-P development. Oladapo (2005)
surveyed the use of information and
communication technology (ICT) in
the Nigerian construction industry. The
study identified and grouped factors that
significantly impact the level of ICT use.
The groups constitute those that are
internal and those external to the
industry. The internal factors significantly correlated with the level of
ICT use in the industry, while none of
the external factors significantly
correlated with the level of ICT use. Five
main constraints to the use of ICT
identified by Oladapo (2005) were
insufficient/irregular power supply, high
cost of ICT software and hardware, low
job order for firms, fear of virus attacks
and high rate of obsolescence of ICT
software and hardware. Usman et al.
(2012) in effort to conceptually synthesize the attitude of quantity
surveyors towards ICT acceptance for
construction cost management in Nigerian
reviewed the causes and impact in the
usage of information and communication
devices. Array of impediments were
identified which were related to economy,
technology, motivation, ethics and
bureaucracy. The researchers
recommended for a more holistic
investigation into impediments by practicing quantity surveyors while

Gandu, Musa, Chindo Gangas & Abdu
Assessing the Status of E-Procurement System in Nigerian Construction Industry
54
putting into consideration all relevant
factors, so that a better solution can
emerge to solve the identified challenges.
Aduwo et al. (2016) became concerned
about slow and low uptake of e-P in
developing countries when compared with the developed, and sought to avail
the barriers against e-P uptake in Nigeria.
Through a set of questionnaires the
researcher surveyed professionals in
consulting firms, contracting and client’s
organisations, and government
establishments. The most adverse effects
to the uptake similarly related to both
economic, technical, political, social and
cultural issues.
Ibem et al. (2016) sought to identify the factors influencing the adoption of e-P in
the Nigerian building industry and
included the external influence of other
industries on the adoption of e-
Procurement technologies and tools in
the research, an aspect deficient in
similar previous research works. Three
factors with the highest influence on
the decision to adopt e- Procurement by
organizations were- the benefits of e-
Procurement in enhancing efficiency in job delivery, eliminating geographic
barriers to participation in construction
procurement activities and effective
communication among project team
members. Also, Oyediran and Akintola
(2011) surveyed the state of arts in e-
tendering through a set of questionnaires
and established different impediments
to the adoption of e-tendering in the
Nigerian construction industry. Findings
also showed only fair level of knowledge
about the process, lack of necessary facilities, minimal level of proficiency in
its use, non-existence of a sound legal
backing and low support from
government. The scholars conceded that
the obstacles are significant and the level
of adoption still low, yet the prospect of
e-tendering in the industry is high.
Furthermore, there is lack of evidence of
the benefits of e-P use in the Nigerian
building industry. The researchers
recommended a concerted effort for
effective uptake of the technology in
Nigeria.
From the literature reviewed, it can be
deduced that more work has focused on
benefits, enablers and impediments to e-P adoption in Nigeria. There is less
attention on w h e t h e r s t a k e h o l d e r
who are expected to adopt the technology
actually understand its concept and
components, possibly accounts for the
reason most researchers find poor state of
implementation. It is possible that poor
understanding impedes the zeal to fully
adopt e-P which should become a point of
focus to improve adoption level. As
innovations in the technology progresses,
it is pertinent for practitioners in Africa to update their knowledge so as to adopt
various innovations more appropriately.
This calls for an inquest on how much
stakeholders understand the concept and
tools for implementing e-P. This research
therefore identified various tools or
technologies of e-P and test the level of
understanding of the Nigerian quantity
surveyors among other objectives.
Research Method Eadie, Perera and Heaney (2010) assert
that the quantity surveying discipline is
the likely proponents of e-P due to the
procurement and cost management
nature of their work. Quantity surveyors
also administer the tender process and
play major role in the entire procurement
activities, thus, stand to benefit much if
the technology is fully adopted. Therefore, to achieve the objectives of
this research, Quantity Surveyors
irrespective of the organization they work
were targeted for the research. A
quantitative research approach was
adopted involving the use of
questionnaires survey as the primary data
collection strategy. Questionnaires have
been used by some previous researchers
to achieve similar research works (Eadie,
Perera & Heaney, 2011, Ibem & Laryea,
2015; Aduwo et al., 2016). The questions for response in the questionnaire were
drafted based on findings from relevant
literature reviewed. The first part of the

Environmental Technology & Science Journal
Vol. 8 No. 2 December 2017
55
questionnaire informed the profile of the
respondents like the qualification, years
of experience, and position in the place of
work, while the second part addressed the
research objectives. A stratified sampling
technique was used to identify respondents. A focus group comprising
experienced quantity surveyors was
subject for a purposive sampling. In
order to control and hasten the response
process, the questionnaires were self-
delivered to respondents. Seventy
seven (77) questionnaires were
distributed in Kaduna and Abuja, and a
total of 65 were returned while 59 sorted
and used for analysis.
In order to assess the level of understanding of the e-P tools among
respondents, a list of the e-P components
were identified from literature, the
relevancy of an item having based on the
opinion of most researchers. The
respondents assessed the tools by ticking
a box against each tool, frequencies were
generated and mean values computed.
Further, a list of the benefits of e-P to the
economy was similarly generated. The list
of benefits were classified according to
recommendation from literature. The
same list was used to assess the relevance of the items in the performance of the
professional quantity surveying practice.
The assessment by respondents was done
through the ranking of the items using a
Likert scale of 1-5. The scale of 1 = to
very low benefit, 2 = low benefit, 3=
average benefit, 4 = high benefit and 5
= very high benefit was used. Lastly, a
list of impediments against the adoption
of e-P was collated from literature also.
Respondents assessed the question using
similar Likert Scale. Where the Likert Scale was used in the assessment the
relative index value method of
computation was adopted to compute the
mean values scored by each factor. The
relative index value (RIV) was computed
as follows:
RIV = (n1*w1 + n2*w2 +n3*w3 +n4*w4 +n5*w5)/ (5*N)
RIV = relative index value, n = number of respondents that ticked w, w =
Likert’s Scale from 1-5, N-total number of respondents.
The highest mean value in this case is 1.0,
therefore values that fall between 0.10
and 0.49 were categorised a s low,
0.50-0.69 categorised as moderate and 0.70
and above high.
Report on the Results Profile of respondents Table 2 bel ow presents the profile of
respondents that participated in the
research an d indicates that quantity
surveyors at different management
levels participated.
However, most respondents fall within
the middle managerial levels in their
organisations. Over 93% are either
principal or senior quantity surveyors. To
affirm this, respondents were between 5-
15 years of experience in the quantity
surveying profession. The implication is
that the respondents are within a
relatively young (76.27%) category.
Therefore, having emerged within the
era of the challenge and knowledge of e-
technology, it is expected that they have
acquired the knowledge o f e - P in one
way or another within their educational
carrier. A s s u c h , are expected to
better be ready and zealous to either
adopt or agitate for and influence the adoption of the technology in their places
of primary responsibilities. On the level
of their qualifications, only 3.39 percent
had national diploma (ND). All other
respondents in T a bl e2 were either
qualified at BSc. l e v e l , its equivalent
or above. Respondents therefore,
possess relevant training to understand
and respond adequately to the research
demand.


Gandu, Musa, Chindo Gangas & Abdu
Assessing the Status of E-Procurement System in Nigerian Construction Industry
55
Table 2: Respondent’s profile
Description
Position of respondent in the firm Frequency Percentage
1 Chief QS 1 1.69
2 Principal Qs 11 18.64
3 Senior Qs 44 74.58
4 Resident Qs 2 3.39
5 Others 1 1.69
Total 59 100.00
Qualification of respondents
1 PhD - -
2 M.sc 10 16.95
3 B.sc 26 44.07
4 HND 21 35.59
5 ND 2 3.39
Total 59 100.00
Job experience
1 1-5yrs 14 23.73
2 5-10yrs 35 59.32
3 10-15yrs 10 16.95
4 15-20yrs - -
5 Above 20 yrs. - -
Total 59 100
Involvement of
respondents in e-
Procurement practice Respondents were first asked if they are involved in e-P practice in their
organisations. While 74.58% affirm to
have been involved, up to 25.42% still
responded in the negative, (see Fig.1).
This finding is in contrast to the
finding of Aduwo et al. (2016) where
only 34% of diverse professionals
surveyed in Nigeria responded to have
participated in projects involving the use
of e-P and (52%) majority never got
involved. Ibem and Laryea (2015)
documented similar result in South
Africa w h e r e only about 12% out
of 603 professionals have used e-
Procurement systems and applications to receive or disseminate information on
tender opportunities, and only around 11
percent have engaged in the exchange
and submission of construction project
information and data electronically.

Environmental Technology & Science Journal
Vol. 8 No. 2 December 2017
57
Figure 1: Organisations involved in e-procurement practice (Source: Field survey)
The level of awareness of e-P tools Awareness is the first step in the
adoption of any new technology (Aduwo
et al., 2016). Participants were therefore
asked to identify the tools or aspects of e-
P they are familiar with by simply ticking
the box provided against each. The level of
familiarity should suggest the extent of
adoption in projects procurement delivery.
Eight (8) did not participate in this
question, possibly not being familiar
with the aspects in question especially
having earlier showed willingness to participate in the research. Table 3
r e p or t s findings which indicate that
most respondents are only aware of e-
tendering (89.09%). It contrast Oyediran
and Akintola (2011) who found a low level
of knowledge of the e-tendering process
among respondents. It is suggestive that
there is slight progress in the adoption of
the technology in the tendering process.
Table 3: Level of awareness of various tools of E-procurement
E-P aspects Number of respondents
Percentage
Level
E-Informing/E-notification 2
0
36.36 Low
E-Sourcing 1
1
20.00 Low
E-Tendering 49
89.09 Very high
E-Reverse auctioning 4 7.27 Very low
E-Awarding 13
23.64 Low
E-Contract Management 8 14.55 Very low
E-Ordering 10
18.18 Very low
E-Markets 9 16.36 Very low
E-MRO and Web based ERP - - Very low
E-Invoicing 10
18.18 Very low
Total number of respondents 5
1
(Source: Field survey)
74.58%
25.42%
%


Gandu, Musa, Chindo Gangas & Abdu
Assessing the Status of E-Procurement System in Nigerian Construction Industry
58
Respondents only indicate slight degree of
awareness level of E-information/e-
notification, e- sourcing and e-awarding
with 36.36%, 20% and 23.64%
respectively. The awareness levels on the
5 other aspects are below 20%. No respondent however demonstrated any
knowledge of E-MRO and Web-Based
Enterprise Resource Planning (ERP). The
possibility is that the 74.58% respondents
in Figure1 do apply the technology
mainly on e-tendering but resort to the
traditional form of procurement process
instead of the e n t i r e e-P process. This
finding supports (Laryea & Ibem, 2014).
Length of time involved in
e-P practice Respondents were asked to indicate how
long they have adopted the aspects of e-P
in their organizations. Table 4 reports the
results of the findings which indicate that
most respondents (about 91%) adopted an
aspect of e-P in their firms only about
five years ago. About 7% adopted it between 5 to 10 years and only about 2%
adopted between 10 to 15 years.
It can be concluded that the adoption of the
technology in the quantity surveying
practice in Nigeria is not long, even
though the result could have been
influenced by the young age bracket of the
respondents. It however confirms the
findings by (Ibem & Laryea, 2015) who
observed that it is particularly evident in
African countries that e-Procurement
adoption in construction related areas
appears to be at its nascent stage.
Benefits of e-P On whether respondents are quite aware of
the benefits of the technology to the
economy as well as to their basic
responsibilities become important at this
level. The level of awareness of the benefit
expects to motivate higher level of
adoption. Therefore, deriving from the previous sections that finds the low level
of awareness and application of e-P in
construction business, it becomes
imperative to find out if respondents
know the benefits of e-P to the national
economy and to their basic professional
practicing responsibilities. Some benefits
of e- Technology to the national
economy were first identified and
grouped into three sections under
strategic, tactical and operational values
for the survey-the grouping which was based on the reviewed of literature.
Using the relative index values the mean
of each item was computed and the result
reported in Table 5 below.
Table 4: Period involved with e-procurement
Years Number Percentage
1-5yrs 40 90.91
5-10yrs 3 6.82
10-15yrs 1 2.27
15-20yrs - -
Above 20yrs - -
Total 44 100.00
(Source: Field survey)

Environmental Technology & Science Journal
Vol. 8 No. 2 December 2017
59
Table 5: Benefits of e-procurement to the national economy
Variables Level of importance No. of resp
.
Σfx RIV Rank Remarks
1 2 3 4 5 Strategic values
Reduced marketing cost. 1 2 9 22 10 44 170 0.773 1 High
Increased ability to control cash flow. 0 9 14 18 3 44 147 0.668 2 Moderate
Improving organizational and process flexibility
8 6 6 17 7 44 141 0.641 3 Moderate
Improved firm growth and success. 4 11 14 11 4 44 132 0.6 4 Moderate
Reduced and eliminate problems with suppliers.
4 16 12 11 1 44 121 0.55 5 Moderate
Realizing market leadership. 6 20 9 8 1 44 110 0.5 6 Moderate
Pooled mean of strategic value
0.621
Moderate
Tactical values
Lower procurement cost. 0 4 5 17 18 44 181 0.823 1 High
Reduced time required to collect tenders 0 2 7 24 11 44 176 0.800 2 High
Faster payment process. 1 3 7 20 13 44 173 0.786 3 High
Improved teamwork. 3 9 22 10 44 171 0.777 4 High
Increased quality service 1 3 11 19 10 44 166 0.755 5 High
Improved contract administration. 0 4 14 22 4 44 158 0.718 6 High
Improving integration between different business functions
3 6 14 13 8 44 149 0.677 7 Moderate
Improved control and monitoring. 2 10 8 18 6 44 148 0.673 8 Moderate
Reduced time of preparing cost plans. 2 13 8 16 5 44 141 0.641 9 Moderate
Ability to search product/supplier more effective.
7 9 15 6 7 44 129 0.586 10 Moderate
Promoting a proactive culture. 10 7 14 10 3 44 121 0.55 11 Moderate
Information received about supplier more
accurate.
11 6 15 10 2 44 118 0.536 12 Moderate
Pooled mean of tactical values
0.695
Moderate
Operational values
Improved communication 0 2 3 8 32 44 205 0.932 1 High
Reduced paperwork. 0 2 2 9 31 44 201 0.913 2 High
Improved data management 0 2 1 17 24 44 195 0.886 3 High
Reduced bottlenecks. 0 1 6 23 14 44 182 0.827 4 High
Reduced operational costs. 1 3 2 22 16 44 181 0.823 5 High
Improved response time to queries. 0 0 5 29 10 44 181 0.823 6 High
Improved procurement process. 0 1 10 21 12 44 176 0.800 7 High
Order process more efficient. 1 6 11 22 4 44 154 0.700 8 Medium
Increased ability to control and forecasting. 4 1 17 21 1 44 146 0.664 9 Moderate
Reduced lead time on financial planning. 5 10 10 16 3 44 134 0.609 10 Moderate
Improved partnership with suppliers. 7 6 11 19 1 44 133 0.604 11 Moderate
Improved supplier performance. 6 11 10 15 2 44 128 0.582 12 Moderate
Pooled mean of operational values
0
.764
High
The findings in Table 5 (concerning the
level of awareness of the benefits) were
further classified into low, moderate and
high levels of awareness. Out of 30
benefits surveyed, 14 were ranked with high level of awareness (0.70 and above),
the rest 16 factors were ranked with
moderate values ranging from 0.50 to
0.699. It means that respondents agreed
that all the factors are either highly
beneficial or moderately beneficial to
national economy. None of the factors
identified was ranked as having low level of benefit to the national economy.
The highest ranked in each of the three
categories, namely strategic values,
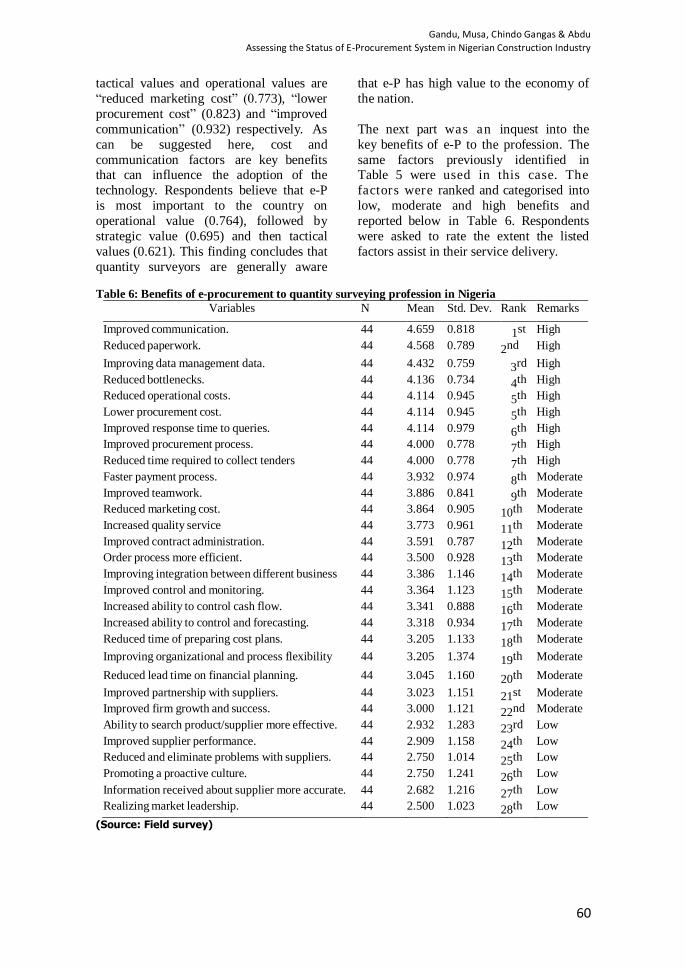
Gandu, Musa, Chindo Gangas & Abdu
Assessing the Status of E-Procurement System in Nigerian Construction Industry
60
tactical values and operational values are
“reduced marketing cost” (0.773), “lower
procurement cost” (0.823) and “improved
communication” (0.932) respectively. As
can be suggested here, cost and
communication factors are key benefits that can influence the adoption of the
technology. Respondents believe that e-P
is most important to the country on
operational value (0.764), followed by
strategic value (0.695) and then tactical
values (0.621). This finding concludes that
quantity surveyors are generally aware
that e-P has high value to the economy of
the nation.
The next part was an inquest into the
key benefits of e-P to the profession. The
same factors previously identified in Table 5 were used in this case. The
factors were ranked and categorised into
low, moderate and high benefits and
reported below in Table 6. Respondents
were asked to rate the extent the listed
factors assist in their service delivery.
Table 6: Benefits of e-procurement to quantity surveying profession in Nigeria
Variables N Mean Std. Dev. Rank Remarks
Improved communication. 44 4.659 0.818 1st High
Reduced paperwork. 44 4.568 0.789 2nd High
Improving data management data. 44 4.432 0.759 3rd High
Reduced bottlenecks. 44 4.136 0.734 4th High
Reduced operational costs. 44 4.114 0.945 5th High
Lower procurement cost. 44 4.114 0.945 5th High
Improved response time to queries. 44 4.114 0.979 6th High
Improved procurement process. 44 4.000 0.778 7th High
Reduced time required to collect tenders 44 4.000 0.778 7th High
Faster payment process. 44 3.932 0.974 8th Moderate
Improved teamwork. 44 3.886 0.841 9th Moderate
Reduced marketing cost. 44 3.864 0.905 10th Moderate
Increased quality service 44 3.773 0.961 11th Moderate
Improved contract administration. 44 3.591 0.787 12th Moderate
Order process more efficient. 44 3.500 0.928 13th Moderate
Improving integration between different business functions
44 3.386 1.146 14th Moderate
Improved control and monitoring. 44 3.364 1.123 15th Moderate
Increased ability to control cash flow. 44 3.341 0.888 16th Moderate
Increased ability to control and forecasting. 44 3.318 0.934 17th Moderate
Reduced time of preparing cost plans. 44 3.205 1.133 18th Moderate
Improving organizational and process flexibility 44 3.205 1.374 19th Moderate
Reduced lead time on financial planning. 44 3.045 1.160 20th Moderate
Improved partnership with suppliers. 44 3.023 1.151 21st Moderate
Improved firm growth and success. 44 3.000 1.121 22nd Moderate
Ability to search product/supplier more effective. 44 2.932 1.283 23rd Low
Improved supplier performance. 44 2.909 1.158 24th Low
Reduced and eliminate problems with suppliers. 44 2.750 1.014 25th Low
Promoting a proactive culture. 44 2.750 1.241 26th Low
Information received about supplier more accurate. 44 2.682 1.216 27th Low
Realizing market leadership. 44 2.500 1.023 28th Low
(Source: Field survey)


Gandu, Musa, Chindo Gangas & Abdu
Assessing the Status of E-Procurement System in Nigerian Construction Industry
60
Mean values were used in this case to
analyse and rank the importance of each
beneficial factor. Six factors were found
to be of low importance, 15 factors were
of moderate importance and nine factors
were highly important. With 5.0 as the highest mean score, the highest ranked
are, improved communications (4.659),
reduced paper work (4.568), improved
data management (4.432) and reduced
bottlenecks (4.136). This finding confirms
what Hashim et al. (2013) similarly found,
that the greatest positive value of e-
Procurement is on issues related to
communication and work process. More
than two-thirds of the respondents
surveyed by Hashim et al. (2013)
perceived the implementation of e-Procurement as positively affecting
communication and work process. Also
ranked high in this research are three
factors, n a m e l y -reduced operational
cost, lower procurement cost and
improved response time to queries, each
having m e a n value of 4.114. It can be
deduced that the understanding of the
benefit of e-P in this work is limited
more to office management and traditional
cost and time values which has not improved much since 2013. Quantity
surveyors only moderately understand
that the more complex advantage like
improved team work, payment
efficiencies, quality management etc. can
a l s o be derived. The items “supply
performance management, improved
proactive culture and market leadership
advantage” were ranked low. Therefore,
this understanding which limits e-P to the
traditional services improvement i s p oor
a n d might have also influenced poorly
the zeal to adopting the e- Technology in
a more complex undertaking.
Impediments to the adoption of the
e-technology What other challenges facing the adoption
of e-P was also enquired. The factors
identified from literature were
categorised into cultural, knowledge,
reliability, security, legal and cost related
factors in line with suggestions from
literature. These factors have also been found relevant in influencing e-P in
different ways. The result is reported in
Table 7 below as follows.
Security (0.738) and legal (0.832) related
factors are still the main challenges t o
e - P w h i c h i s in line with findings by
(Laryea and Ibem, 2016). Cultural
(0.599), knowledge (0.577), cost (0.595)
and reliability (0.686) were lower.
However, all the categories scored above average (above 0.50) which suggests that
all of them remain significant impediments
to e-P adoption. Five challenges ranked
first from each category in Table 6 that
highly affect the adoption of e-P are- lack
of legal control (0.832); authenticity of
documents submitted (0.832);
interoperability issue, (0.805); original
hard copies of documents wanted not
electronic copies ( 0.773) and the lack of
IT infrastructure (0.700). Generally, the
challenges in Table 6 are still severe to the adoption of e- Technology in Nigeria
which must be reduced to enhance speedy
adoption.
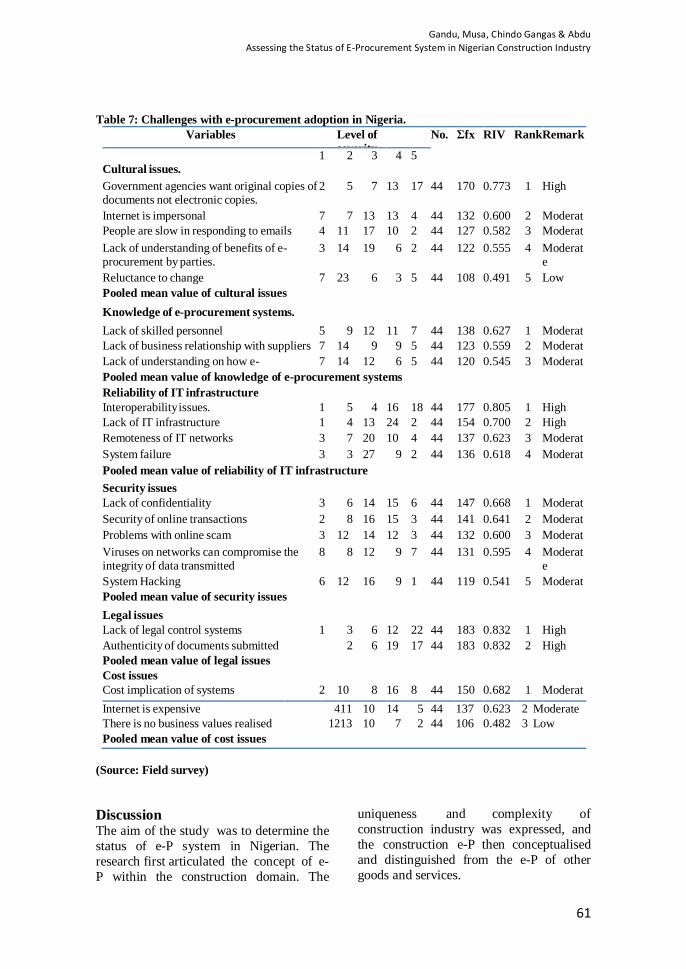
Gandu, Musa, Chindo Gangas & Abdu
Assessing the Status of E-Procurement System in Nigerian Construction Industry
61
Table 7: Challenges with e-procurement adoption in Nigeria.
Variables Level of
severity
No. Σfx RIV Rank Remark
1 2 3 4 5 Cultural issues.
Government agencies want original copies of documents not electronic copies.
2 5 7 13 17 44 170 0.773 1 High
Internet is impersonal 7 7 13 13 4 44 132 0.600 2 Moderat
e People are slow in responding to emails 4 11 17 10 2 44 127 0.582 3 Moderate Lack of understanding of benefits of e-
procurement by parties. 3 14 19 6 2 44 122 0.555 4 Moderat
e
Reluctance to change 7 23 6 3 5 44 108 0.491 5 Low
Pooled mean value of cultural issues 0.599 Moderate
Knowledge of e-procurement systems.
Lack of skilled personnel 5 9 12 11 7 44 138 0.627 1 Moderat
e Lack of business relationship with suppliers 7 14 9 9 5 44 123 0.559 2 Moderate Lack of understanding on how e-
procurement works 7 14 12 6 5 44 120 0.545 3 Moderat
e Pooled mean value of knowledge of e-procurement systems 0.577 Moderate
Reliability of IT infrastructure
Interoperability issues. 1 5 4 16 18 44 177 0.805 1 High
Lack of IT infrastructure 1 4 13 24 2 44 154 0.700 2 High
Remoteness of IT networks 3 7 20 10 4 44 137 0.623 3 Moderate System failure 3 3 27 9 2 44 136 0.618 4 Moderate Pooled mean value of reliability of IT infrastructure 0.686 Moderate
Security issues
Lack of confidentiality 3 6 14 15 6 44 147 0.668 1 Moderate Security of online transactions 2 8 16 15 3 44 141 0.641 2 Moderate Problems with online scam 3 12 14 12 3 44 132 0.600 3 Moderate Viruses on networks can compromise the
integrity of data transmitted 8 8 12 9 7 44 131 0.595 4 Moderat
e
System Hacking 6 12 16 9 1 44 119 0.541 5 Moderate Pooled mean value of security issues 0.738 High
Legal issues
Lack of legal control systems 1 3 6 12 22 44 183 0.832 1 High
Authenticity of documents submitted 2 6 19 17 44 183 0.832 2 High
Pooled mean value of legal issues 0.83 High
Cost issues
Cost implication of systems 2 10 8 16 8 44 150 0.682 1 Moderat
e Internet is expensive 4 11 10 14 5 44 137 0.623 2 Moderate
There is no business values realised 12 13 10 7 2 44 106 0.482 3 Low
Pooled mean value of cost issues 0.595 Moderate
(Source: Field survey)
Discussion The aim of the study was to determine the
status of e-P system in Nigerian. The
research first articulated the concept of e-
P within the construction domain. The
uniqueness and complexity of
construction industry was expressed, and
the construction e-P then conceptualised
and distinguished from the e-P of other
goods and services.

Gandu, Musa, Chindo Gangas & Abdu
Assessing the Status of E-Procurement System in Nigerian Construction Industry
62
The second issue addressed relates to the
level of awareness of the concept and the
adoption of varying tools of the e-P
technology. Understanding a new concept
is the first step to its adoption. The first question was if respondents practice e-P in
their organizations. Majority of
respondents impressively affirmed such.
When asked to identify the e-P tools or
aspects they are aware of, the result shows
that out of 10 aspects surveyed, only e-
Tendering is widely known. Other
aspects like the e-information/e-
notification, e- sourcing and e-awarding
only indicated a low level of awareness
among quantity surveyors in Nigeria which
is in line with the findings of Laryea and Ibem (2014).
On the benefits of the e-P, earlier s tudies
have shown that the decision to adopt e-
Procurement was influenced by the
perceived direct and indirect benefits like
time and cost savings, increased quality,
efficiency and effective communication,
reduction in paperwork and increased
productivity among others (Rankin, Chen
& Christian, 2006; Ibem et al., 2016). Despite that Table 3 indicates respondents
bei n g aware that adopting e-P
technology in its fullest form will benefit
the economy of the nation and their
professional functions, the level of
adoption is still low and slow. This is a
mismatch where the adoption is low and
slow, yet respondents believe that all the
thirty (30) benefits surveyed are of high
benefit to the economy. It can be explained
that the understanding of the benefit is still
within the context of the basic computer application. For example, two key benefits
identified are -t h e lowering of
procurement and marketing cost of
projects and the improved
communications. Regards the benefit to the
firms that adopt the technology, eight out
of the 30 benefits are highly important,
among which are cost, management and
communication related factors. Fifteen
factors were found to be moderately
important while the other 6 were of low
importance. Factors like improved team
work, improved control and monitoring
payment efficiencies, promoting proactive
culture and realising market leadership
which are advancement of the traditional
use of computers were ranked lower. Therefore the understanding of the benefits
of e-P among quantity surveyors still tends
towards the traditional understanding of
computer applications. As such, even with
the knowledge of the benefit to the
economy and to the improved performance
of the firms, the adoption of the technology
is still low and slow. Other factors earlier
identified to dampen the rate of adopting e-
P was also a subjected to investigation.
Twenty-three ( 2 3 ) other inhibiting
factors to the adoption documented in literature were investigated and the key
ones identified include- Governments
agencies needing hard copies of
documents instead of soft copies, lack of
skilled personnel in the handling of the
process, interoperability issue, lack of
confidentiality, lack of legal control
systems and t h e i n i t i a l cost
implication of the systems respectively.
T h e legal and security concerns are still
issues to address also.
Conclusion and Recommendations This study assessed the status of e-P
system among Quantity Surveyors in
Nigeria. The choice of quantity surveying
was informed by the view that their
traditional role will most likely influence
quick adoption of e-P. Therefore the
researchers expected a high level of understanding and adoption in the industry.
While there are some levels of adoption of
the e-technology in the construction
business, its adoption is rather slow and
low. The e-P concept and tools are still not
fully understood among Nigerian Quantity
Surveyors which could have influenced the
slow and low level of adoption.
Respondents are foun d t o be more
familiar with e-tendering leaving out nine
other tools studied. Th us , th e tools n ot
un d er s t ood are not widely applied in the procurement of construction projects.
Respondents are however aware of the

Environmental Technology & Science Journal
Vol. 8 No. 2 December 2017
63
benefits of e-P to the performance of their
work and to the national economy in
general, yet no significant improvement in
the adoption since previous studies. Legal
and security challenges are still important
concern to the adoption of e-P. The findings in this study present a
number of implications. For example, if
quantity surveyors who are expected to
pioneer e-P are still lacking in the
understanding of the concept, then other
professions may present worse situation.
While noting that procurement is a
teamwork involving all professionals at a
time, poor adoption by Quantity Surveyors
could imply poor adoption by other
professionals also. Therefore, Nigeria still
has much to do to raise the level of adoption of e-P in the construction sector
of her economy. To improve the level of
adoption of e-P in Nigeria, there is need
to focus efforts on educating and
upda t in g stakeholders i n t h e se ct or
on all the relevant tools and their benefits
in construction procurement. The kind of
training in higher institutions and in the
continued professional development after
graduation should focus on e-P to a greater
extent. There is also the need to appraise the existing laws and security matters on e-
P to allay the fears of stakeholders on
legal and security concerns. The relevance
and adequacy of the legal framework to
address these concerns could be reviewed
and made available to the public. This may
create confidence and trust on the e- P
technology, and will enhance its quick
acceptance and adoption in Nigeria.
This research has contributed to
knowledge by availing the level of understanding of the concept, benefits and
adoption of e-P among Nigerian Quantity
Surveyors. Findings avail point of focus by
stakeholders in the efforts to enhancing its
adoption towards better economic
performance. Further research should
quantify the value of adopting e-P as
against the traditional procurement method
to avail the financial benefit so as to
convince sceptics that e-P is actually
significantly beneficial financially.
References:
Adebayo, V. O. & Evans, R. E. (2016).
Adoption of e-procurement systems in developing countries: a Nigerian
public sector perspective.
International Journal of
Mechatronics, Electrical and
Computer Technology (IJMEC).
6(20), 2820-2828. DOI:
649123/10198.
Aduwo, E. B., Ibem, E. O., Uwakony, O.,
Tunji-Olayeni, P and Ayo-Vuaghan,
E. K. (2016). Barriers to the
uptake of e-procurement in the Nigerian building industry. Journal of
Theoretical and Applied
Information Technology. 89 (1) 133-
147.
Adzroe, E. K & B. Ingirige., 2014. E-
Business used in the Ghanaian
construction industry: the drivers.
Retrieved from
www.cib2014.org/proceedings/files/p
apers/664/pdf.
Adzroe, E. K. & Ingirige, B. (2013).
Exploring e-Business technology to support improvement in the
infrastructure procurement process in
the Ghanaian construction industry.
In: Proceedings of 11th International
Postgraduate Research Conference
8- 10 April 2013 University of
Salford.
Ateto, M. D., Hosndieki, N. S. and Okibo,
W. (2013). The effect of e-P practice
on effective procurement in public
hospitals. A case of Kisii Level 5 hospital. American international
journal of contemporary research,
3(8):103-111.
Bakar, N. A., Peszynski, K., Azizan, N.
& Sundram, V. P. K. (2016).
Abridgment of traditional
procurement and e-procurement:
definitions, tools and benefits.
Journal of Emerging Economies and
Islamic Research, vol4, no. 1 page 1-
18. Available at www.jeeir.com.
Baladhandayuthan, T and Venkatesh, D. S. (2012). Construction industry in
Kuwait: An analysis on e-
Gandu, Musa, Chindo Gangas & Abdu
Assessing the Status of E-Procurement System in Nigerian Construction Industry
64
procurement adoption with respect
to supplier’s perspective.
International Journal of Management
Research and Development (IJMRD),
2(1):1-17.
Bello, W.A & Iyaba., R . O . A . ( 2013). Comparative analysis of
barriers to e-procurement among
quantity surveyors in UK and
Nigeria. Scottish Journal of arts,
social sciences and scientific studies,
14(2):175-187. Available at
http://scottishjournal.co.uk.
Chebii, L. D. (2016). Determinants of
successful implementation of E-
procurement in public institutions in
Kenya. International Journal of
Economics, Commerce and Management United Kingdom 4(4),
Available at http://ijecm.co.uk/
Chilipunde, R. L. (2013). Electronic
tendering in the Malawian
construction industry: the dilemmas
and benefits. Journal of modern
education review. 3(10)791-800.
Available at
http://www.academicstar.us
Dowsett, R. M. & Harty, C. F. (2013).
Evaluating the benefits of BIM for sustainable design: a review in:
Smith, S.D and Ahiaga-Dagbui, D.D
(Eds) Procs 29th Annual ARCOM
Conference, 2- 4 September 2013,
Reading, UK, Association of
Researchers in Construction
Management, 13-23.
Eadie, R., Perera, S., Heaney, G. &
Carlisle, J. (2007). Drivers and barriers to public sector e-
procurement within Northern
Ireland’s construction industry.
Journal of Information Technology in
Construction (ITcon) 12:103.
Available at http://itcon.org/2007/6/
Eadie, R., Perera, S. and Heaney, G.
(2010). Identification of e-
procurement drivers and barriers for
UK construction organisations and
ranking of these from the perspective of the quantity surveyors. Journal of
Information Technology in
construction (ITcon), 15: 23-43.
Eadie, R., Perera, S. & Heaney, G. (2011).
Analysis of the use of E-Procurement in
the public and private sector in the UK
construction industry. Journal of
Information Technology in
construction (ITcon), 16: 669-686. Harty, C. ( 2005). Innovation in
construction: a sociology of
technology approach. Building
Research & Information, 33(6):512-
522.
Hashim, N., Said, I. & Idris, N. H.
(2013). Exploring e-procurement
value for construction companies in
Malaysia. Procedia Technology,
9:836-845.
Hashim, N., Said, I. & Idris., N . H .
( 2014). E-procurement implementation in Malaysian
construction i n d u s t r y . Australian
Journal of Basic and Applied
Sciences, 8(6):231-238. Available at
www.ajbasweb.com.
Hassan, H., Tretiakov, A., Wh i ddet t , T.
& Adon, I. (2014). Extent of e-
procurement use in SMEs: A
descriptive study. International
Conference on Accounting Studies
2014, ICAS 2014, 18-19 August 2014, Kuala Lumpur, Malaysia.
Procedia - Social and Behavioral
Sciences 164: 264-270.
Ibem, E. O., & Laryea, S. ( 2015). E-
Procurement use in the South
African construction industry.
Journal of Information Technology
in Construction (ITcon), 20: 364-
384. Available at
http://www.itcon.org/2015/23.
Ibem, E. O., Aduwo, E. B., Tunji-
Olayeni, P., Ayo-Vaughan, E. A. & Uwakonye, U. O. (2016). Factors
influencing e-Procurement adoption
in the Nigerian building industry.
Construction Economics and
Building, 16(4):54-67.
Ingirige, B. (2014). E-business used in
Ghanaian construction industry: the
drivers. Available at
www.cib2014.org/proceedings/files/p
apers/664/pdf.

Environmental Technology & Science Journal
Vol. 8 No. 2 December 2017
65
Kamaruzamana, N. H., & Mohamed, Z.
(2013). Application of e-Procurement
Technologies for
Selecting Suppliers of Agro-Based
SMEs in Malaysia. Int. Journal of
Economics and Management 7(1): 45 – 66 (2013).
Laryea, S. & Ibem. E. O. (2014).
Patterns of technological innovation
in the use of e- procurement in
construction. Journal of Information
Technology in Construction (ITcon),
19:104-125, available at
http://www.itcon.org/2014/6
McConnel, D. J., (2009). An analysis of
the factors affecting the uptake of the
application of e- procurement within
the UK public sectors. Published Doctoral Thesis.
Mohamed, K. A. & Milimu, C. (2016).
Factors contributing to adoption of E-
Procurement in County Governments
(A Case Study of County
Government of Mombasa). Imperial
Journal of Interdisciplinary Research
(IJIR), 2(10):1178-1204. Available
at http://www.onlinejournal.
Oladapo, A. A. ( 2005). An investigation into the use of ICT in the Nigerian
construction industry. Journal of
Information Technology in
Construction (ITcon), 12:261
Oyediran, O. S. & Akintola, A. A. (2011).
A survey of state of the art e-
tendering in Nigeria. Journal of
Information Technology in
Construction (ITcon), 16:557-576.
Rankin, J. H., Chen, Y. & Christian, A. J.
(2006). E-Procurement in the
Atlantic Canadian AEC industry. International Journal of Information
Technology in Construction (ITcon),
11:75-87.
Gandu, Musa, Chindo Gangas & Abdu
Assessing the Status of E-Procurement System in Nigerian Construction Industry
66
Infill Development in Nigeria: A Sustainable
Development Strategy?
Abubakar Siddiq Usman1*, Muhammad Ali Chiroma 2,
Adamu Harir Isa 2 & Farouk Umar Yaya 1
1 Department of Urban and Regional Planning, Faculty of Environment Design, Ahmadu
Bello University, Zaria, Nigeria 2 Department of Urban and Regional Planning, Abubakar Tafawa Balewa University,
Bauchi, Nigeria
Abstract Sustainability has increasingly become an important aspect of consideration by planners and
urban managers since the publication of Brundtland report of 1987 and the Rio Earth
Summit of 1992. It is considered as one of the greatest challenges facing urban planners in
the 21st century, especially for cities of the developing countries like Nigeria with an
extraordinarily high growth rate; which was projected to be the third globally by 2050.
Recent arguments have been in favour of compact city model as the most effective solution
in achieving sustainable urban development. In an attempt to achieve sustainable
urbanisation and urban development, Nigerian government in the late 1980s adopted the
infill development as a strategy for sustainable urban development. This paper examines the application of infill development strategy as a tool for sustainable urban development in
Nigeria and explores how it can contribute towards sustainable neighbourhood planning and
development. For purpose of this study, Ibrahim Taiwo Housing neighbourhood, Maiduguri
was selected as a case study. Data were collected using mixed methods involving
questionnaire survey, interviews, personal observation, and document search with
descriptive analysis as the main method of analysis. The study indicates that the absence of
public facilities such as green open spaces due to infill, coupled with the changes made to
the original neighbourhood plan lead to disappointing results. This appears to be due to a
number of factors: the lack of adherence to neighbourhood sustainability development
criteria; the increased in number of households, the relative scarcity of public open spaces
such as schools and green areas, the conversion of the only primary school into secondary schools, and the increased in number of vehicle ownership per households. Nevertheless; the
study concludes that for a city to achieve sustainability, its urban neighbourhoods, the
component parts of the city must be sustainable.
Keywords: Sustainability, Urban Neighbourhood, Infill Development, Sustainable
Neighbourhood Criteria, Nigeria.
Introduction According to the United Nations (UN), with prevailing population trend, two-thirds
of the world population would be urban by
2050. This trend in urban population
dynamics is more pronounced in cities of
the developing countries (Heilig, 2012).
Efforts at achieving sustainable urban
development have thus become one of the
key challenges for urban policy makers,
managers, and planner in developing
countries like Nigeria, where population
growth rate is extraordinarily high at 5%; and currently the 7th largest country in the
world and projected to be the 3rd largest
country in the world by 2050 (United

Usman, Chiroma, Isa & Yaya
Infill Development in Nigeria: A Sustainable Development Strategy?
67
Nation, 2015). According to UN (2014)
“Managing urban areas has become one of
the most important development challenges
of the 21st century. Our success or failure
in building sustainable cities will be a
major factor in the success of the post-2015 UN development agenda.” Sustainable
development has, therefore, become an
important aspect of consideration in urban
planning and design in the 21st century
(Porter, & Hunt, 2005).
Although sustainability is mostly
considered at the city level rather than the
neighbourhoods, nevertheless infill
development as a sustainable strategy
mostly takes place at the neighbourhood
level (Choguill, 2008). Therefore, achieving city sustainability requires that
its component parts - the urban
neighbourhoods must be sustainable,
(Luederitz, Lang, & Von Wehrden, 2013).
Interestingly, the last two decades have
witnessed a greater concern toward
neighbourhoods’ sustainability within the
research community (Choguill, 2008;
Luederitz et al., 2013). Numerous
approaches exist that define principles for
guiding sustainable development processes of urban neighbourhoods (Hamedani, &
Huber, 2012).
Several approaches from different
perspectives highlighted aspects that are
considered fundamental for the
development of sustainable urban
neighbourhoods (Luederitz et al., 2013).
These range from social aspects (Ahmed,
2012), to ecological issues (Li, Wang,
Paulussen, & Liu, 2005), the cultural
dimension (Joubert, 2004), and economic circumstances (Jones, 2009). Other
approaches point to economic and social
determinants (Kauko, 2011). Common to
all these approaches is the desire for the
attainment of sustainable urban
neighbourhoods, through the development
and redevelopment (Turcu, 2012) of new
and existing neighbourhoods. However,
recent arguments have been in favour of
compact city model as the most effective
solution in achieving sustainable urban development (Williams, 2004).
Compact city is generally defined as a
relatively high-density; mixed-use that
encourages walking and cycling with
clearly defined boundaries (Williams,
Burton, & Jenks, 2000). It is an urban redevelopment process, whereby existing
buildings, vacant land and open spaces are
developed or redeveloped at higher
densities, otherwise known as urban
‘intensification’, ‘consolidation’ or
‘densification’ (Sultana, 2008). The
compact city concept was developed to
improve the quality of life without expense
to the next generation, (Dantzig, & Saaty,
1973) which is in line with current
principles of sustainability (Lee, Kurisu,
An, & Hanaki, 2015). The major arguments in favour of the compact city model are
that; compact cities are judged to be
environmentally sustainable in terms of
transportation. The argument is that high
population densities and mixed-use allow
people to live in close proximity to work,
commercial and recreational facilities.
Thus, it is expected that it will encourage
walking and cycling thereby reducing the
overall demand for vehicle travel. This will
ensure efficient use of energy that will therefore promote environmental
sustainability (Williams et al., 2000;
Williams, 2004). It is also believed to be
environmentally sustainable in preserving
rural land through the reduction of sprawl
development (Williams, 2004; Sultana,
2008).
In terms of social sustainability; it is argued
that as cities grew to be more compact with
mixed uses, people of varied socio-cultural
background comes together, (Dempsey, Bramley, Power, & Brown, 2011). This it
is argued create diversity, social cohesion,
and cultural development (Williams, 2004;
Sharifi, & Murayama, 2013). It is also
believed to be equitable in terms of
accessibility to social facilities and services
(Bramley, Dempsey, Power, & Brown,
2006; 2007). Economically, the model
supports local employment opportunities
through the provision of services and
businesses. In addition, the compact city model, it was argued is cost effective as it

Environmental Technology & Science Journal
Vol. 8 No. 2 December 2017
68
reduces the cost per capita of infrastructure
provisions, such as roads, drainages, water
supply, electricity and street lighting.
Also the United Nation, Department of
Economic and Social Affairs (UN, DESA) in 2014, state inter alia: “Providing public
transportation, as well as housing,
electricity, water and sanitation for a
densely settled urban population, is
typically cheaper and less environmentally
damaging than providing a similar level of
services to a dispersed rural population.”
(UN, DESA, 2014).
Nigeria like many other African countries
is already facing numerous developmental
challenges in meeting the needs of its growing urban population. Since
independence, in spite of the limited
success, the successive Nigerian
governments and its urban community have
invented alternative systems (formal and
informal) in dealing with these challenges.
These include but not limited to, the
development of open space and vacant
land, more intensive use and conversions of
existing development through the sub-
divisions, infill development, and land use change or conversion (Olotuah &
Bobadoye, 2009; Adetokunbo & Emeka,
2015). Infill developments were initially
limited Government Residential Areas
(GRA). These GRAs were designed as low
density with plots sizes of 2000 square
meters (100m x200m), or more with
abundant open space and recreational areas
(Jiboye, 2011). The hitherto serene GRA
housing environment thus become medium
and high density with high concentration of
road traffic leading to a decline in the residents’ quality of life (Ayotamuno,
Gobo, & Owei, 2010). It was not until the
oil boom period of the 1980s that the infill
developments becomes widespread
extending to institutional staff quarters and
government low-cost housing estates of
medium and high density (Ayotamuno et
al., 2010). This is due to the pressure on
the available urban land resources and the
inability of government to provide serviced
layouts to its teeming population at the urban fringes.
In Nigeria, however, the adaptation of the
infill development strategy had been
extensively carried out in all Nigerian
urban centres from independence to the
present date. Consequently, the new town planning agenda become associated with
compact development. Therefore, this
study was instigated by the fact that infill
development is vital planning tool for
achieving sustainable urban development
through compact development.
The objective of this paper is to assess the
infill development programme in
promoting sustainable urban
neighbourhood in Nigeria, against a set of
sustainable neighbourhood’s criteria. The study, therefore, seeks to examine the
impacts of infill development in a planned
residential neighbourhood and its
implications for urban neighbourhood
sustainability.
Research Method For purpose of this study, Ibrahim Taiwo
residential neighbourhood, Maiduguri was selected as a case study. The choice of
Ibrahim Taiwo residential neighbourhood
was based on the following reasons; firstly,
it was a plan urban residential
neighbourhood of medium and high
density; and secondly, it was a planned
infill development. Data were collected
using mixed methods involving
questionnaire survey, interviews, personal
observation, and document analysis. The
data were analysed using descriptive statistical tools as the main method of
analysis. The study included a set of
primary surveys ranging from household
surveys to mapping. For the household
survey, a stratified random sampling was
adopted using housing typologies as the
criteria for selecting samples. Efforts have
been made to ensure that the selected
samples are uniformly distributed
throughout the neighbourhoods. Factors
such as travel patterns, vehicle ownership;
income; density and use; household type and size that are considered relevant to
urban sustainability, were included in the
household survey. Since the study explores
Usman, Chiroma, Isa & Yaya
Infill Development in Nigeria: A Sustainable Development Strategy?
69
one case study with no ‘control’ case study,
therefore evidence from which conclusions
were drawn is limited.
Sustainable Urban Neighbourhood Although the importance of sustainable
urban neighbourhood in contributing to
the overall city sustainability has now
been emphasised, there is no consensus
as to what constitutes an urban
neighbourhood. The lack of consensus at
defining urban neighbourhood is because
of various criterions that are considered fundamental to the concept of urban
neighbourhood. Several definitions that
are considered essential to understanding
the concept of the urban neighbourhood
have been suggested. Yet, in none of
these, is the population size and function
of the neighbourhood specified.
Ironically, the basic concern of
sustainability is to provide urban
neighbourhoods with specific functions
that promote sustainable lifestyles (Choguill, 2008). There are four major
criteria that are fundamental to the
concept of sustainable urban
neighbourhood, viz ‘economic’, ‘social’,
‘environmental’, and ‘technical’
(Choguill, 2008). These criteria are
similar to those used in sustainability
analysis at the city level (Luederitz et al.,
2013).
Neighbourhood Sustainability
Criteria The neighbourhood sustainability criteria
are fundamental to the attainment of the
sustainable urban neighbourhood.
However, these criteria are interrelated
and are not mutually exclusive.
Economic sustainability as a criterion
refers to the actual economic benefit both
in terms of reduction of transport and
infrastructure cost, and employment
opportunity within the neighbourhood.
The ability to walk to a central focal
point is basic to the neighbourhood and
would eliminate many daily vehicle trips.
The neighbourhood population should be
sufficient enough not only to support
neighbourhood shops, for local shopping
but also provide employment for
neighbourhood residents. Similarly, the
environmentally sustainable criterion,
which refers the existence green open
spaces within the neighbourhood, augmented by schools and other
neighbourhood amenities, serve as a
forum where neighbourhood members
both old and young meet, thus
encouraging social interaction.
The next criterion is social sustainability,
which is generally concerned with the
level of social cohesion within the
neighbourhood as a result of personal
interaction among residents (Hirschfield
& Bowers, 1997). Thus encouraging public participation is a matter of
concern to the neighbourhood
sustainability. The central locations of
shops and other supporting services
provide an avenue for community social
interaction. The fourth and final
criterion; technical sustainability, this
refers to the relationship within
neighbourhoods and between
neighbourhoods and the city.
Neighbourhoods with defined boundaries, enhances social interaction,
while minimised through fare improved
security, especially children's’ safety,
which is “an essential prerequisite for a
stable and sustainable neighbourhood”
(Shaftoe, 2000; 2012).
The Study Area Location Maiduguri (Yerwa), the capital of Borno state is located in the north-eastern part of
Nigeria within the Sudan Savannah of the
Sahel region, at latitude 11.85o N and
Longitude 13.05o E, with an altitude of
about 300 meters above sea level. It lies on
a relatively flat undulating plain that slopes
gently toward Lake Chad. Its landform is
characterised by the Bama Ridge (the
shoreline of the ancient Lake Chad), River
Ngadda, and its tributary River Ngaddabul.
Maiduguri apart from being an important
centre of Kanuri culture and Islamic scholarship is also the principal trading hub
for north-eastern Nigeria. This coupled
with its strategic position make it a
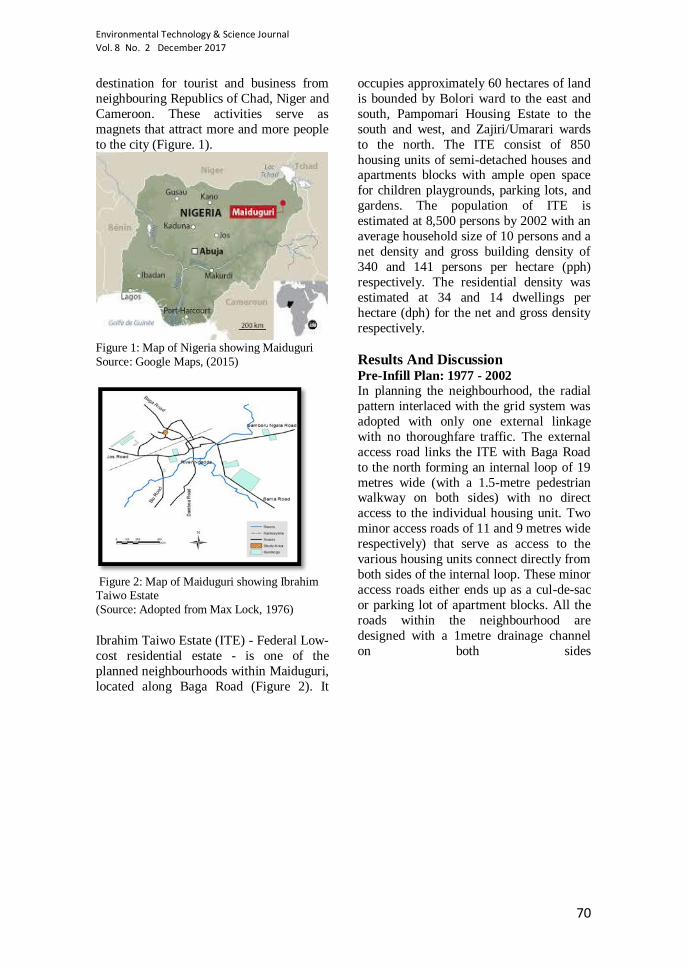
Environmental Technology & Science Journal
Vol. 8 No. 2 December 2017
70
destination for tourist and business from
neighbouring Republics of Chad, Niger and
Cameroon. These activities serve as
magnets that attract more and more people
to the city (Figure. 1).
Figure 1: Map of Nigeria showing Maiduguri
Source: Google Maps, (2015)
Figure 2: Map of Maiduguri showing Ibrahim Taiwo Estate
(Source: Adopted from Max Lock, 1976)
Ibrahim Taiwo Estate (ITE) - Federal Low-
cost residential estate - is one of the
planned neighbourhoods within Maiduguri,
located along Baga Road (Figure 2). It
occupies approximately 60 hectares of land
is bounded by Bolori ward to the east and
south, Pampomari Housing Estate to the
south and west, and Zajiri/Umarari wards
to the north. The ITE consist of 850
housing units of semi-detached houses and apartments blocks with ample open space
for children playgrounds, parking lots, and
gardens. The population of ITE is
estimated at 8,500 persons by 2002 with an
average household size of 10 persons and a
net density and gross building density of
340 and 141 persons per hectare (pph)
respectively. The residential density was
estimated at 34 and 14 dwellings per
hectare (dph) for the net and gross density
respectively.
Results And Discussion Pre-Infill Plan: 1977 - 2002
In planning the neighbourhood, the radial
pattern interlaced with the grid system was
adopted with only one external linkage
with no thoroughfare traffic. The external
access road links the ITE with Baga Road
to the north forming an internal loop of 19
metres wide (with a 1.5-metre pedestrian walkway on both sides) with no direct
access to the individual housing unit. Two
minor access roads of 11 and 9 metres wide
respectively) that serve as access to the
various housing units connect directly from
both sides of the internal loop. These minor
access roads either ends up as a cul-de-sac
or parking lot of apartment blocks. All the
roads within the neighbourhood are
designed with a 1metre drainage channel
on both sides

Usman, Chiroma, Isa & Yaya
Infill Development in Nigeria: A Sustainable Development Strategy?
71
Figure 3: Pre-Infill Plan: 1977 – 2002
Source: Adapted Google earth satellite imagery/ Field Survey 2013, 2002
In terms of land use both the primary
school, playground and a central mosque
were centrally located to serve as a focal
point, while other public uses such as
police station, estate office, church, and
post office were distributed within the
neighbourhood (Figure 3). The only
commercial land use within the ITE neighbourhood is a small shopping
complex located at the intersection of the
external access road and the loop. Although
no study has been conducted on the
sustainability of ITE neighbourhood, the
neighbourhood seems to exhibit certain
sustainable urban neighbourhood attributes
in its planning and design. Thus, the
planning and design of the ITE
neighbourhood prior to the infill can be
said to adhere to sustainable
neighbourhood criteria.
Post-Infill Plan: 2002 - 2013 In other to accommodate the growing
number of urban populace, the Borno
State Government in 2002 adopted the
infill development as a strategy for the redevelopment of the ITE residential
neighbourhood. A total of about 10.3 ha
made up of 208 plots (183 residential and
25 commercial) of various sizes were
introduced as infill plots (Figure 4, table
1). As shown in Table 2, there is an
increase of about 10.3429 (17.5%) and
0.5599 (0.78%) for residential and
commercial uses respectively. The
survey indicates a drastic decrease in
LEGEND
Schools
Mosque
Church
Police Station
Post Office
Estate Dept Office
Shops
Open Space

Environmental Technology & Science Journal
Vol. 8 No. 2 December 2017
72
open spaces from 16.5 to 5.5 ha, a
decrease of 66% in real terms and 18% in
the land budget. It is interesting to note
that the only public primary school
within the neighbourhood have been
converted into a secondary school,
leaving the neighbourhood with only a
private primary school.
Figure 4: Post-Infill Plan: 2002 – 2013 Source: Adapted Google earth satellite imagery/ Field Survey 2013 In terms of density (both population and
building) show an appreciable increase
the survey reveals. In 2013 the estimated
population of ITE neighbourhood stands at 12,450 persons – an increase of 3,950
persons. This gives the neighbourhood a
population density of 207pph (post-infill)
from 141pph (pre-infill) and a gross
building density of 14 dph (pre-infill),
21dph (post-infill), and a net building
density of 34dph and 36dph for pre-infill
and post infill respectively as table 2
indicate. The study indicates that the increase in population density is much
higher than that of the building density.
This might not be unconnected with the
household size and number of households
per house as shown in table 3.
LEGEND
Schools
Church
Police Station
Post Office
Estate Dept Office Shops
Mosque
Open Space

Environmental Technology & Science Journal
Vol. 8 No. 2 December 2017
74
Table 1: Comparision between Pre and Post-Infill Land Use in ITE Neighbourhood
S/No Land Uses
Pre-Infill Plan
1977 - 2002 Post-Infill Plan
2002 - 2013 Difference (Ha)
Difference (%)
Ha % Ha %
1 Residential 24.6028 40.00 34.9457 57.488 +10.3429 +17.50
2 Commercial 0.0900 0.14 0.5599 0.92 +0.4699 +0.78
3 Public Use
a School 3.5364 5.80 3.1749 5.55 -0.3615 -0.60
Primary School 3.5364 5.80 - -
Secondary Schools - - 3.1749 5.55
b Police Station 0.7913 1.30 0.7913 1.30 0 0
c Post Office 0.2460 0.40 0.2460 0.40 0 0
d Estate Office 0.2940 0.50 0.1200 0.20 -0.1740 -0.30
e Mosque 1.5035 2.50 1.7590 2.90 +0.2555 +0.40
f Church 0.8750 1.40 0.8750 1.40 0 0
Sub total 7.2462 11.9 6.9662 11.75 - 0.2800 - 0.50
4 Open Spaces 16.5594 27.00 5.5065 9.00 -11.0529 -18.00
5 Circulation
a Road Network 10.3839 17.00 11.1260 18.00 +0.4721 +1.00
b Drainage 1.6983 2.80 1.6102 2.60 -0.0881 - 0.20
c Utilities 0.2067 0.34 0.0726 0.11 -0.1341 - 0.23
Sub total 12.2889 20.14 12.8088 20.71 +0.2499 + 0.57
TOTAL 60.7873 100.00 60.7873 100.00 - -
Source: Field Survey, 2013
The study also shows an increase of
about 1% in road network as more access
roads were needed for the infill plots,
thereby obstructing the existing system
of pedestrian walkways (Figure 4, table
1). This, in turn, encourages car use,
especially for short trips, increased
traffic congestion, and thus contributing
to air pollution the planned infill
development can thus be criticized for lack of sustainable neighbourhood
development criteria in its planning and
design. Another access road that links the
neighbourhood with Pampomari to the
south was provided, thus creating
thoroughfare traffic. This not only leads
to a considerably increased in vehicular
traffic but also traffic congestion and
conflicts.
Though the study shows a significant
difference between the pre and post infill
in their land use composition as shown in
Table 1, however the land use mix
entropy for both pre and post infill of
0.37 and 0.48 respectively is less than
half (Table 2). This indicates that the
land use composition is below a desirable
level as the closer to 1 the land use mix
entropy is the better the composition (Soltani & Bosman 2005). The
availability of diverse housing types
makes it possible for households of
different background to live together.
The study shows that 62% of housing
types for post infill are single-family
apartment type houses, made up of one,
two and three-bedroom apartment type
(Table 2). According to Katz (1994):

Environmental Technology & Science Journal Vol. 8 No. 2 December 2017
75
Table 2: Urban Form Features
Variable/Factor Description Pre Infill Post Infill
Urban form features
Mixed Uses Land use mix entropy 0.37 0.48
Population Density Person per area (per/ha) 141 207
Building Density Gross Density 14 21 Net Density 34 36
Residential Net
Density
Person per residential area
(per/ha) 348 360
Housing Type (%)
3 bedroom Semi-detached 18.8 15.5 2 bedroom Semi-detached 27.6 22.6 3 bedroom Apartment - 15.8 2 bedroom Apartment 26.8 24.0 1 bedroom Apartment 26.8 22.1
Source: Field Survey, 2013
“Within neighbourhoods, a broad range
of housing types and price levels can
bring people of diverse ages, races, and
incomes into daily interactions,
strengthening the personal and civic
bonds essential to an authentic community.” It is therefore expected that
a wide-ranging housing type will more
likely lead to sustainable urban
neighbourhood by accommodating
household of different socio-economic
background. This is not the case with the
post infill development as the study
indicates.
In term of density, population, building,
and residential density are higher for post
infill than the pre infill era. Though the
study indicates increases in both building and residential density due to infill
development, however, there are no
significant differences between pre and
post infill development. This is attributed
to the conversion of open space to
residential (10.3429 ha) and commercial
(0.4699 ha) uses during infill
development (Table 2).
It has been suggested that public facilities
and services located in central areas with
good mix use and access make public
transport more reliable, encourages multi-
purposes trips, thus leading to a reduction
in both length and frequency of trips
(Burton, 2002). Accordingly, mixed-use
development provides an opportunity for a more diverse, high population and sizable
commercial activity in close proximity to
each other to facilitate viable public transit,
cycling and walking (Appleyard, 19800.
This enhances the viability, vitality and the
perceived community security by attracting
more people onto the street. A good mixed-
use is one that offers a full range of human
activities such as living, learning, working,
recreation, and worship within the same
neighbourhood and vice versa.
The study also shows that car dependency is more with 64% of households owning
two or more vehicles with 72% being
private cars (Table 3). These partly explain
the reliance on private cars for both work
and non-work trip (Table 3). Trip
frequency is put at 6.3 with local trips
within the neighbourhood and short trips of
less than 2km accounting for 31% and 45%
of total trip respectively (Table 3).

Environmental Technology & Science Journal
Vol. 8 No. 2 December 2017
76
Table 3: Socio-economic Characteristics and Travel Pattern
Factor Description in (%) Post Infill
Income Level per month
Less than N 50,000 65 Higher than N 50,000 but less than N 250,000 31 Higher than N 250,000 04
Primary Employment
Govt/administration 52 Commerce 24 Agriculture 09 Others 15
Household size
Four or fewer persons 17 Five or six persons 35 Seven or more persons 48
Households per house
One household 10
Two or three households 68 Four or more households 22
Travel pattern Vehicle Ownership (%)
Without a vehicle 07 With one vehicle 29 With two or more 64
Type of Vehicle
Ownership (%)
Private Car 71 Tricycle 05
Motorcycle 08 Bicycle 16
Journey to work (%)
Public transport - Mini Bus 05 Public transport - Tricycle 06 Private car 77 Cycling /walking 12
Non-work trips (%)
Public transport - Mini Bus 06 Public transport – Tricycle 02 Private car 81
Cycling /walking 11
Trip frequency (number of trips per adult per day) 6.3 Local trips within the neighbour (%) 31 Short trips of less than 2km (%) 45 Short trips of more than 2km (%) 24
Source: Field Survey, 2013
Findings/Inferences The promotion of compact mixed-use,
through infill strategy within the ITE
neighbourhood, is expected to reduce transport cost thereby promoting economic
sustainability. Although the increase in
commercial activities within the ITE
neighbourhood has to a certain extent
improve the neighbourhood’s economic
sustainability by providing employment,
car dependency for the daily trip rather
than decreased as expected has been on the
increase. Two main reasons can be
attributed; first, the lack of efficient and
effective public transport system; and second the conversion of the only public
primary school into secondary school as
parents are forced to take their children to a
school outside the neighbourhood.
Excessive car usage is regarded as the
major cause of greenhouse emission that causes global warming. In ITE
neighbourhood in addition to increasing
dependence on private car usage as earlier
mentioned, the introduction of additional
access to the south has turned the
neighbourhood into a thoroughfare, thereby
attracting more vehicular traffic into the
neighbourhood. This is not in tune with
sustainability as a reduction in vehicular
usage is a critical requirement for the
attainment of urban neighbourhood

Environmental Technology & Science Journal Vol. 8 No. 2 December 2017
77
sustainability. Secondly, the drastic
reduction in open spaces as the study
reveals is not inconsonant with the idea of
environmental sustainability.
Community interaction, social networks, and participation within these social
networks are keys to attaining social
sustainability at the urban neighbourhood
level in particular and the city level in
general. Shared public space such as
school, children playground, places of
worship, shopping areas, spaces in front of
buildings etc plays a greater role in this
regard. These shared spaces in most part
are not available, and where available is
restricted. For instances, the mosque,
school, and their open spaces (for the playground) are closed after official hours
and virtually impracticable to be utilised
during the official period. Another issue
that is of relevance to social sustainability
is the wall around the building. These
building walls apart from taking over the
spaces in front of buildings, also limit
children's play within the various
compounds. Therefore in terms of social
sustainability criterion, the infill strategy
has failed in promoting sustainability.
The ITE neighbourhood has performed
though with few exception relatively better
in terms of technical sustainability. The
neighbourhood fits relatively well into the
larger city. Secondly, the building of walls
around individual properties, though not in
tune with social sustainability as earlier
indicated, excluded vehicular traffic from
building blocks. The resultant cul-de-sacs
as a consequent of this enhance children's’
safety and therefore an indications towards technical sustainability.
Conclusion The study examines whether compact
development through infill strategy leads to
a sustainable urban neighbourhood in Nigeria. It reveals that, though there were a
number of issues with the adoption of infill
as an urban sustainable development
strategy, the infill, if properly handle will
lead to sustainable urban development. The
paper argues that the policy thrust of the
government lacks any conscious effort at
improving urban sustainability at
neighbourhood level. Rather the infill
development policies were aimed at
accommodating the rapid population
growth.
It posits that, though city sustainability is
incidentally dependent on the sustainability
of its neighbourhoods, for the
neighbourhoods to be sustainable requires
the cooperation of the city. The paper
suggests that for a city to achieve
sustainability, its urban neighbourhoods,
the component parts of the city must be
sustainable.
In conclusion, the paper suggested that future planning and design of urban
neighbourhoods in Nigeria should include
sustainable neighbourhood criteria if
sustainable urban development is to be
achieved. This is believed will lead to a
more pedestrian-friendly and reduced
traffic, thus creating a sustainable urban
neighbourhood with better air quality. It,
therefore, calls for further research into the
incorporation of these criteria into our
planning and design of urban neighbourhoods.
References Adetokunbo, I., & Emeka, M. (2015).
Urbanization, housing, homelessness
and climate change adaptation in
Lagos, Nigeria: Lessons from Asia. Journal of Design and Built
Environment, 15(2), 15-28.
Ahmed, K. G. (2012). Urban social
sustainability: A study of the Emirati
local communities in Al Ain. Journal
of Urbanism: International Research
on Placemaking and Urban
Sustainability, 5(1), 41-66.
Appleyard, D. (1980). Livable streets:
protected neighborhoods?. The
ANNALS of the American Academy of Political and Social Science, 451(1),
106-117.
Ayotamuno, A., Gobo, A. E., & Owei, O.
B. (2010). The impact of land use
conversion on a residential district in
Usman, Chiroma, Isa & Yaya Infill Development in Nigeria: A Sustainable Development Strategy?
78
Port Harcourt, Nigeria. Environment
and Urbanization, 22(1), 259-265.
Barton, H. (1998). Eco-neighbourhoods: A
review of projects. Local
Environment, 3(2), 159 - 177
Bramley, G., Dempsey, N., Power, S., & Brown, C. (2006, April). What is
‘social sustainability’, and how do our
existing urban forms perform in
nurturing it. In Sustainable
Communities and Green Futures’
Conference, Bartlett School of
Planning, University College London,
London.
Bramley, G., Brown, C., Dempsey, N., &
Power, S. (2007, April). ``Social
sustainability and urban form:
measuring and calibrating the relationship''. In Planning Research
Conference, Heriot-Watt University,
Edinburgh, April.
Breheny, M. J. (Ed.). (1992). Sustainable
development and urban form (Vol. 2).
London: Pion.
Burton, E. (2002). Measuring urban
compactness in UK towns and cities.
Environment and Planning B:
Planning and Design, 29(2), 219-250.
Choguill, C. L. (2008). Developing sustainable neighbourhoods. Habitat
International, 32(1), 41-48.
Dantzig, G. B., & Saaty, T. L. (1973).
Compact city: a plan for a liveable
urban environment. WH Freeman.
Dempsey, N., Bramley, G., Power, S., &
Brown, C. (2011). The social
dimension of sustainable
development: Defining urban social
sustainability. Sustainable
development, 19(5), 289-300.
Grant, J. (2006). Planning the good community: new urbanism in theory
and practice (Vol. 9). Taylor &
Francis.
Hamedani, A. Z., & Huber, F. (2012). A
comparative study of DGNB, LEED
and BREEAM certificate systems in
urban sustainability. The Sustainable
City VII: Urban Regeneration and
Sustainability, 1121.
Heilig, G. K. (2012). World urbanization
prospects: the 2011 revision. United Nations, Department of Economic
and Social Affairs (DESA),
Population Division, Population
Estimates and Projections Section,
New York.
Hirschfield, A., & Bowers, K. J. (1997).
The effect of social cohesion on levels of recorded crime in
disadvantaged areas. Urban Studies,
34(8), 1275-1295.
Jabareen, Y. R. (2006). Sustainable urban
forms: Their typologies, models, and
concepts. Journal of planning
education and research, 26(1), 38-52
Jenks, M. (2000). Achieving sustainable
urban form. Taylor & Francis. E &
FN Spon, 11 New Fetter Lane,
London EC4P 4EE.
Jenks, M., Williams, K., & Burton E. (1996). The compact city: A
sustainable urban form? E & FN
Spon, 11 New Fetter Lane, London
EC4P 4EE.
Jones, C., Leishman, C., & MacDonald, C.
(2009). Sustainable urban form and
residential development viability.
Environment and planning A, 41(7),
1667-1690.
Joubert, L. (2004). Creative communities:
the arts, social responsibility and sustainable planning and
development. WIT Transactions on
Ecology and the Environment, 72
Katz, P., Scully, V., & Bressi, T. W.
(1994). The new urbanism: Toward
an architecture of community (Vol.
10). New York: McGraw-Hill.
Kauko, T. (2011). An evaluation of the
sustainability of inner city residential
projects. Housing, Theory and
Society, 28(2), 144-165
Lee, J., Kurisu, K., An, K., & Hanaki, K. (2015). Development of the compact
city index and its application to
Japanese cities. Urban Studies, 52(6),
1054-1070.
Li, F., Wang, R., Paulussen, J., & Liu, X.
(2005). Comprehensive concept
planning of urban greening based on
ecological principles: a case study in
Beijing, China. Landscape and urban
planning, 72(4), 325-336.
Luederitz, C., Lang, D. J., & Von Wehrden, H. (2013). A systematic

Environmental Technology & Science Journal Vol. 8 No. 2 December 2017
79
review of guiding principles for
sustainable urban neighborhood
development. Landscape and Urban
Planning, 118, 40-52.
Olotuah, A. O., & Bobadoye, S. A. (2009).
Sustainable housing provision for the urban poor: a review of public sector
intervention in Nigeria. The Built and
Human Environment Review, 2, 51-
63.
Porter, L., & Hunt, D. (2005).
Birmingham's Eastside story: Making
steps towards sustainability?. Local
Environment, 10(5), 525-542.
Roo, G. D. (1997). Jenks, M., Burton, E.
and Williams, K.(eds)," The Compact
City: A Sustainable Urban
Form?"(Book Review). Town Planning Review, 68(2), 279.
Scheurer, J. (2007). Compact city policy:
How Europe rediscovered its history
and met resistance. The Urban
Reinventors, 2.
Scheurer, J., Curtis, C., & Porta, S. (2008).
Spatial Network Analysis of
Multimodal Transport Systems:
Developing a Strategic Planning Tool
to Assess the Congruence of
Movement and Urban Structure: a Case Study of Perth Before and After
the Perth-to-Mandurah Railway.
GAMUT, Australasian Centre for the
Governance and Management of
Urban Transport, University of
Melbourne.
Shaftoe, H. (2012). Convivial urban
spaces: Creating effective public
places. Earthscan
Shaftoe, H. (2000). Community safety and
actual neighbourhoods. Sustainable
Communities: The Potential for Eco-neighbourhoods Ed. H Barton
(Earthscan, London) chapter, 15
Sharifi, A., & Murayama, A. (2013).
Changes in the traditional urban form
and the social sustainability of
contemporary cities: A case study of
Iranian cities. Habitat International,
38, 126-134.
Soltani, A., & Bosman, C. (2005).
Evaluating Sustainable Urban Form:
Comparing Two Neighbourhood
Development Patters in Adelaide
(Doctoral dissertation, Griffith
University). Sultana, S. (2008). Spatial Planning, Urban
Form and Sustainable Transport–
Edited by Katie Williams. Growth
and Change, 39(2), 380-382.
Thomas, L., & Cousins, W. (1996). The
compact city: a successful, desirable
and achievable urban form. The
compact city: A sustainable urban
form, 53-65.
Turcu, C. (2012). Local experiences of
urban sustainability: Researching
Housing Market Renewal interventions in three English
neighbourhoods. Progress in
planning, 78(3), 101-150.
United Nations, Department of Economic
and Social Affairs, Population
Division (2015). World Urbanization
Prospects: 2015 Revision.
United Nations, Department of Economic
and Social Affairs, Population
Division (2014). World Urbanization
Prospects: The 2014 Revision, Highlights (ST/ESA/SER A/352).
Urbanism, S. (2008). Urban Design with
Nature. Doug Farr.
Williams, K. (Ed.). (2017). Spatial
planning, urban form and sustainable
transport. Routledge
Williams, K. (2004). Can urban
intensification contribute to
sustainable cities? An international
perspective. City Matters: Official
Electronic Journal of Urbanicity
Williams, K., Burton, E., & Jenks, M. (2000). Achieving sustainable urban
form: an introduction. Achieving
sustainable urban form, 1-5.
Williams, K., & Lindsay, M. (2007). The
extent and nature of sustainable
building in England: An analysis of
progress. Planning Theory & Practice,
8(1), 31-49.

Environmental Technology & Science Journal Vol. 8 No. 2 December 2017
80
User’s Cultural Specific Spatial Needs in the
Internally Displaced Persons (IDP) Camps in
Abuja, Nigeria
Edem-Nse Yakno Gift Isa Bala Muhammad & Sani Ajanaku Momoh
1Department of Architecture, Federal University of Technology, Minna, Niger State.
Abstract Shelter constitutes one of the primary needs of displaced persons who seek refuge because
of natural and human orchestrated crisis in which their initial shelters have been destroyed.
Accordingly, different actors such as NGOs, internationals organizations and Governments
of different nations actively sought to provide shelter for the displaced persons. Due to the
rise in terrorism since 2012 in Nigeria, there has been a dire need of shelter provision for internally displaced persons, with the focus of these institutions being mostly on the decision
for these shelters to either be temporary or permanent. However, little study exists in the
understanding of cultural specific spatial needs of the internally displaced persons. This
research thus qualitatively understudied the perception of internally displaced person about
their shelter in Abuja Nigeria. In carrying out the research, three camps were purposively
selected using interviews and participant observations as instruments for data collection.
The content analysis of the data shows the emergence of unique spatial architectural
character of the culture sensitive residents of the internally displaced person’s (IDP) camps.
Most importantly is that the findings have implications in the planning of refugee camps,
especially the accommodative facilities for these campers which aligns more to the
communal system of living as opposed to individualistic spaces that are generally obtainable
in IDP camps
Keywords: Architecture, Design, IDP Refugee, Perception, Space
Introduction Refuge is sought globally from either
natural disaster as showcased in China, America, Philippines, Indonesia and India
(Kinghorn), 2015 or from terrorism as seen
in countries in the Middle East, Asia and
Africa (Dudley, 2016). These include
Syria, Columbia, Iraq, Sudan, Nigeria and
Pakistan as outlined by the United Nations
High Commission on Refugees (UNHCR,
2015). This has resulted in thousands of
individuals and families fleeing from their
homes, to settle in other locations within
the country or in neighbouring countries.
Each year, UNHCR provides shelter for displaced person around the globe
(Alloush, Taylor, Gupta, Rojas Valdes, &
Gonzalez-Estrada, 2017). The shelter
provided are supposed to be temporary,
however, over time they become almost a
permanent abode for the displaced persons,
even though they are not intended to be so
(Ramadan, 2013). This is because some of
these displaced persons are found to stay in
the temporary camps for long periods so
much so that they are not ready to return to their homes (Sliwa & Wiig, 2016). This is
because, situations that drove the refugees
away from their homes persists for a long
time. It thus suggests that these refugee
camps should be planned to accommodate
the cultural needs of the campers. More
also is that one of the essential needs of
settlements such as the IDP camp is the
integration of culture specific spatial need
of the settlers. It is common knowledge
that culture plays a great influence on the spatial needs and values of the people
(Muhammad, 2017). This therefore means
that, a prototype design template for all

Edem-Nse, Muhammad & Sani User’s Cultural Specific Spatial Needs in the Internally Displaced Persons (IDP) Camps in Abuja, Nigeria
81
IDP camps will be inappropriate due to the
diverse cultural heritage available within a
country. In existence is the United Nations
minimum standards for IDP camps, though
it is also possible to have a regional
community based cultural infusion in the planning of these camps (Oesch, 2017).
Mostly, government agencies are
concerned with what they consider as a
minimum standard for displaced persons
and their spatial needs, not putting into
consideration the actual needs of the end
users of the camps. Few studies exist on the
behavioural spatial mapping, as well as
people’s perception of displaced people’s
camp in Nigeria except few (Nwagbo &
Gerald, 2015; Okanlawon, Anene, & Reeves, 2010). Consequently, this paper
seeks to fill this gap through the study of
internally displaced person’s camps in the
Federal Capital Territory, Abuja, Nigeria.
This is because it became one of the most
favourable place of refuge for the internally
displaced persons, especially those that flee
from the Boko Haram insurgence from the
North-Eastern parts of Nigeria (Adibe,
2012; Agbiboa, 2013). This is perhaps due
to the location of donor agencies which are
mostly situated in the country’s capitals.
Overview of Emergency Settlement
in IDP Camps Emergency settlement, such as IDP camps
is constructed to meet up with the basic
needs of the displaced persons (Liu, Ruan
& Shi, 2011). Due to the increasing number
of internally displaced persons,
governments of nations in collaboration
with the United Nations High Commission
for Refugees in its submissions have made provisions in most parts of the world to
accommodate these displaced persons
(UNHCR, 2015).
Furthermore, UNHCR in 2015 stated that
‘out of the twenty-four countries with the
highest ratio of refugees to the population,
ten are members of the African Union’.
Similarly, the Norvarian Refugee Council
(NRC) in 2015 reported that in the past
decade (2006-2015), over 23.8 million persons have been displaced. The Figure 1
shows at a glance the number of persons
displaced globally from 2006-2015.
Figure 1 Number of Persons Displaced Globally, over the Last Decade Source: Norvarian Refugee Council (2015)
This thus showcases the global
importance of displaced persons’
camp. More also is that it is evident
that it will be difficult to completely
put an end to the unpleasant
circumstances that forces people to
become displaced, which also
necessitates the need for attention to
be paid to shelter, health care and
education (NRC, 2015).
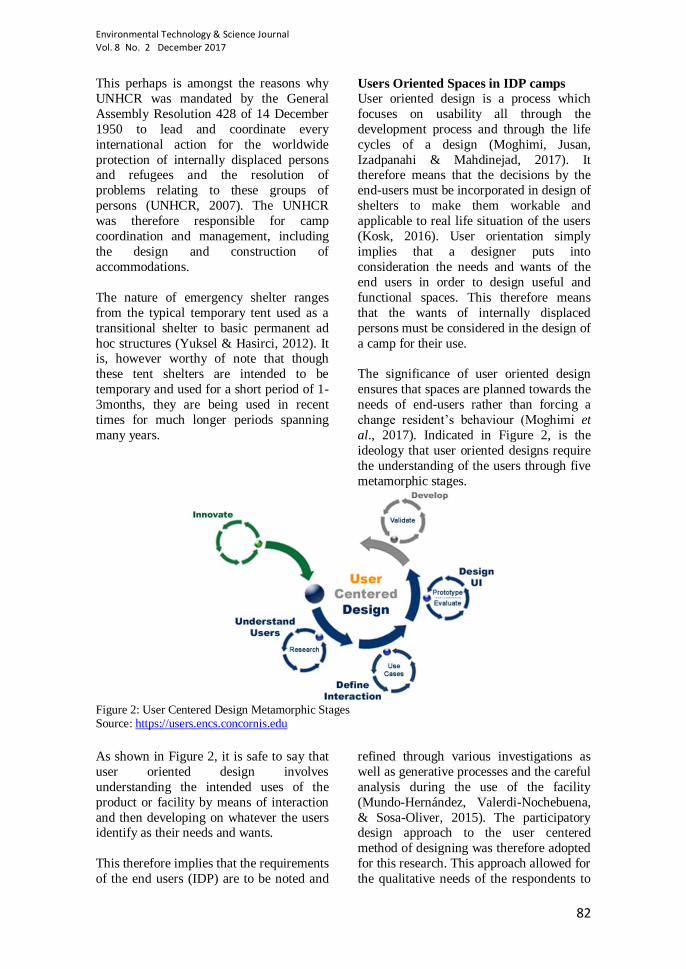
Environmental Technology & Science Journal Vol. 8 No. 2 December 2017
82
This perhaps is amongst the reasons why
UNHCR was mandated by the General
Assembly Resolution 428 of 14 December
1950 to lead and coordinate every
international action for the worldwide
protection of internally displaced persons and refugees and the resolution of
problems relating to these groups of
persons (UNHCR, 2007). The UNHCR
was therefore responsible for camp
coordination and management, including
the design and construction of
accommodations.
The nature of emergency shelter ranges
from the typical temporary tent used as a
transitional shelter to basic permanent ad
hoc structures (Yuksel & Hasirci, 2012). It is, however worthy of note that though
these tent shelters are intended to be
temporary and used for a short period of 1-
3months, they are being used in recent
times for much longer periods spanning
many years.
Users Oriented Spaces in IDP camps
User oriented design is a process which
focuses on usability all through the
development process and through the life
cycles of a design (Moghimi, Jusan,
Izadpanahi & Mahdinejad, 2017). It therefore means that the decisions by the
end-users must be incorporated in design of
shelters to make them workable and
applicable to real life situation of the users
(Kosk, 2016). User orientation simply
implies that a designer puts into
consideration the needs and wants of the
end users in order to design useful and
functional spaces. This therefore means
that the wants of internally displaced
persons must be considered in the design of
a camp for their use.
The significance of user oriented design
ensures that spaces are planned towards the
needs of end-users rather than forcing a
change resident’s behaviour (Moghimi et
al., 2017). Indicated in Figure 2, is the
ideology that user oriented designs require
the understanding of the users through five
metamorphic stages.
Figure 2: User Centered Design Metamorphic Stages Source: https://users.encs.concornis.edu
As shown in Figure 2, it is safe to say that
user oriented design involves
understanding the intended uses of the
product or facility by means of interaction
and then developing on whatever the users identify as their needs and wants.
This therefore implies that the requirements
of the end users (IDP) are to be noted and
refined through various investigations as
well as generative processes and the careful
analysis during the use of the facility
(Mundo-Hernández, Valerdi-Nochebuena,
& Sosa-Oliver, 2015). The participatory design approach to the user centered
method of designing was therefore adopted
for this research. This approach allowed for
the qualitative needs of the respondents to
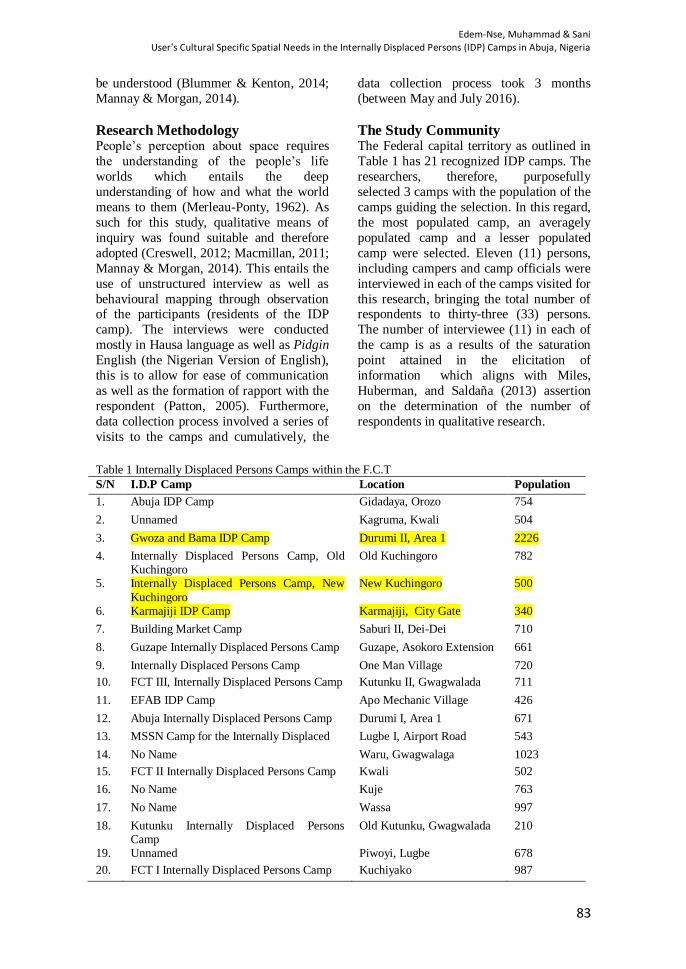
Edem-Nse, Muhammad & Sani User’s Cultural Specific Spatial Needs in the Internally Displaced Persons (IDP) Camps in Abuja, Nigeria
83
be understood (Blummer & Kenton, 2014;
Mannay & Morgan, 2014).
Research Methodology People’s perception about space requires
the understanding of the people’s life
worlds which entails the deep
understanding of how and what the world
means to them (Merleau-Ponty, 1962). As
such for this study, qualitative means of
inquiry was found suitable and therefore
adopted (Creswell, 2012; Macmillan, 2011;
Mannay & Morgan, 2014). This entails the
use of unstructured interview as well as
behavioural mapping through observation of the participants (residents of the IDP
camp). The interviews were conducted
mostly in Hausa language as well as Pidgin
English (the Nigerian Version of English),
this is to allow for ease of communication
as well as the formation of rapport with the
respondent (Patton, 2005). Furthermore,
data collection process involved a series of
visits to the camps and cumulatively, the
data collection process took 3 months
(between May and July 2016).
The Study Community The Federal capital territory as outlined in
Table 1 has 21 recognized IDP camps. The
researchers, therefore, purposefully
selected 3 camps with the population of the
camps guiding the selection. In this regard,
the most populated camp, an averagely
populated camp and a lesser populated
camp were selected. Eleven (11) persons,
including campers and camp officials were
interviewed in each of the camps visited for
this research, bringing the total number of respondents to thirty-three (33) persons.
The number of interviewee (11) in each of
the camp is as a results of the saturation
point attained in the elicitation of
information which aligns with Miles,
Huberman, and Saldaña (2013) assertion
on the determination of the number of
respondents in qualitative research.
Table 1 Internally Displaced Persons Camps within the F.C.T
S/N I.D.P Camp Location Population
1. Abuja IDP Camp Gidadaya, Orozo 754
2. Unnamed Kagruma, Kwali 504
3. Gwoza and Bama IDP Camp Durumi II, Area 1 2226
4. Internally Displaced Persons Camp, Old Kuchingoro
Old Kuchingoro 782
5. Internally Displaced Persons Camp, New
Kuchingoro
New Kuchingoro 500
6. Karmajiji IDP Camp Karmajiji, City Gate 340
7. Building Market Camp Saburi II, Dei-Dei 710
8. Guzape Internally Displaced Persons Camp Guzape, Asokoro Extension 661
9. Internally Displaced Persons Camp One Man Village 720
10. FCT III, Internally Displaced Persons Camp Kutunku II, Gwagwalada 711
11. EFAB IDP Camp Apo Mechanic Village 426
12. Abuja Internally Displaced Persons Camp Durumi I, Area 1 671
13. MSSN Camp for the Internally Displaced Lugbe I, Airport Road 543
14. No Name Waru, Gwagwalaga 1023
15. FCT II Internally Displaced Persons Camp Kwali 502
16. No Name Kuje 763
17. No Name Wassa 997
18. Kutunku Internally Displaced Persons Camp
Old Kutunku, Gwagwalada 210
19. Unnamed Piwoyi, Lugbe 678
20. FCT I Internally Displaced Persons Camp Kuchiyako 987
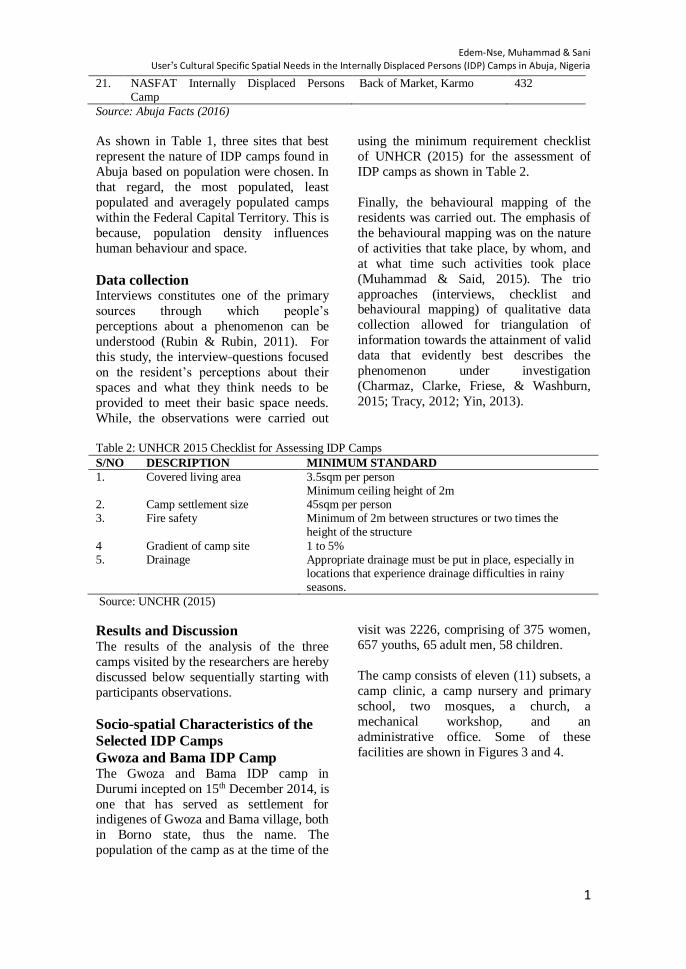
Edem-Nse, Muhammad & Sani User’s Cultural Specific Spatial Needs in the Internally Displaced Persons (IDP) Camps in Abuja, Nigeria
1
21. NASFAT Internally Displaced Persons Camp
Back of Market, Karmo 432
Source: Abuja Facts (2016)
As shown in Table 1, three sites that best
represent the nature of IDP camps found in
Abuja based on population were chosen. In
that regard, the most populated, least
populated and averagely populated camps
within the Federal Capital Territory. This is
because, population density influences
human behaviour and space.
Data collection Interviews constitutes one of the primary
sources through which people’s
perceptions about a phenomenon can be
understood (Rubin & Rubin, 2011). For
this study, the interview questions focused
on the resident’s perceptions about their
spaces and what they think needs to be
provided to meet their basic space needs.
While, the observations were carried out
using the minimum requirement checklist
of UNHCR (2015) for the assessment of
IDP camps as shown in Table 2.
Finally, the behavioural mapping of the
residents was carried out. The emphasis of
the behavioural mapping was on the nature
of activities that take place, by whom, and
at what time such activities took place
(Muhammad & Said, 2015). The trio
approaches (interviews, checklist and behavioural mapping) of qualitative data
collection allowed for triangulation of
information towards the attainment of valid
data that evidently best describes the
phenomenon under investigation
(Charmaz, Clarke, Friese, & Washburn,
2015; Tracy, 2012; Yin, 2013).
Table 2: UNHCR 2015 Checklist for Assessing IDP Camps
S/NO DESCRIPTION MINIMUM STANDARD
1. Covered living area 3.5sqm per person Minimum ceiling height of 2m
2. Camp settlement size 45sqm per person 3. Fire safety Minimum of 2m between structures or two times the
height of the structure
4 Gradient of camp site 1 to 5% 5. Drainage Appropriate drainage must be put in place, especially in
locations that experience drainage difficulties in rainy seasons.
Source: UNCHR (2015)
Results and Discussion The results of the analysis of the three
camps visited by the researchers are hereby
discussed below sequentially starting with
participants observations.
Socio-spatial Characteristics of the
Selected IDP Camps
Gwoza and Bama IDP Camp The Gwoza and Bama IDP camp in
Durumi incepted on 15th December 2014, is
one that has served as settlement for indigenes of Gwoza and Bama village, both
in Borno state, thus the name. The
population of the camp as at the time of the
visit was 2226, comprising of 375 women,
657 youths, 65 adult men, 58 children.
The camp consists of eleven (11) subsets, a
camp clinic, a camp nursery and primary
school, two mosques, a church, a
mechanical workshop, and an
administrative office. Some of these
facilities are shown in Figures 3 and 4.

Edem-Nse, Muhammad & Sani User’s Cultural Specific Spatial Needs in the Internally Displaced Persons (IDP) Camps in Abuja, Nigeria
85
Figure 3: Gwoza and Bama Camp School, picture taken in 2016
Figure 4: Gwoza and Bama Camp accommodation, image captured in 2016
The accommodation in the camp is
constructed using wooden support
columns, covered with sack bags and tarpaulin. They are arranged in no order on
the camp site and are not durable and so do
not protect their occupants from harsh
weathers. The school in the camp is a
structure constructed using wood and
galvanized roofing sheets.
The clinic, Figure 5, in the IDP Camp is a
single room and toilet. The single room
serves as a male and a female ward, doctors
consultation room and store for medical
equipment and medicines. A tank provides water, while a generator powers the clinic.
As such the camp clinic is inadequate to
meet the needs of the residents of the camp.
Figure 5: The Clinic building in Durumi IDP camp, Abuja
IDP Camp, New Kuchingoro, Abuja The internally displaced persons camp
located in the Kuchingoro area of Abuja
and which began operation on the 5th of
December 2014 is one that has served has a
home to internally displaced persons who
had to flee from their village, which is
Gwoza in Borno State of Nigeria. Although
a small percentage of camp resides are
indigenes of other parts of Borno State and
the northeast in general, 90% of them are from Gwoza. The camp comprises of 500
campers (230 women, 240 men, 30
children), with 4 officials in control of the
campers. The people relocated in the year
2014 and have settled extensively on the
piece of land they found fallow in
Kuchingoro. The camp, therefore, evolved
and is purpose built. The men and women
are basically farmers who go as far as
Nyanya and Mararaba areas of Nassarawa
state to farm. It was observed that the
residents of the camp travel as far as 10 kilometers for farming and the produce of
the farms are sold to meet their family
needs.
One of the distinctive physical characters
of the camp is that it is unplanned and
consists of structures made of cartons,
tarpaulin, sacks and cement bags, anchored
by wooden support. As such, nearly all the
structures such as the accommodation, a
camp office, a school, a church, a mosque, a skill acquisition centre and a relaxation
joint are made up of temporary materials as
shown in Figures 6 and 7. Figure 6: Sleeping Tent Erected Using Polythene Cover. Image Captured in 2016
Plate III Gwoza and Bama Camp Clinic
Source: Field Survey (2016)
Plate IV New Kuchingoro Camp Accommodation
Source: Field Survey (2016)

Environmental Technology & Science Journal Vol. 8 No. 2 December 2017
86
Figure 7: Kuchingoro Camp Rooms Interior. Image Captured in 2016
The accommodation in the camp consists
of single rooms measuring 2 x 2m. The
buildings are constructed using tarpaulin covers on wooden column supports.
IDP Camp, Karmajiji, Abuja The FCT internally displaced persons camp
is located on the Lugbe- Airport road axis in FCT Abuja. The camp was established
on the 26th of June 2013 by Muslim
Women’s Association of Nigeria
(MWAN). Sited in Karmajiji, it is one that
has accommodated 340 (170 women, 160
men and 10 children) internally displaced
persons from Borno and Adamawa states
of Nigeria. The camp, unlike others in the
Federal Capital could be seen to have some
of the accommodations built as permanent
structures.
The men amongst the residents of this
camp are basically engaged as labourers on
construction sites while some of the
women stay back as teachers for the
children. Similarly, some of the men and
women are also seen engaged in farming in
which the products of the farm are sold to
earn a living. Aside from these, Non-
Governmental organisations such as the
Muslim Women Association of Nigeria (MWAN) as well as other religious bodies
who see to the needs of the internally
displaced persons in the camp.
The gradual development of the camp by
the residents into permanent structures as
shown in Figure 8, showcases the
integration of cultural spatial norms. This
is because, the rooms are built together in compound settings, having courtyards in
the middle. A kitchen and toilet are placed
at the extreme ends of the buildings. This
suggests that the residents are linked to
their cultural roots in the development of
their spaces in a new location.
Figure 8: Karmajiji camp Accommodation, built as a permanent structure. Picture taken in 2016
Cumulatively, it can be deduced that, none
of the camps meet the required minimum
standards being laid down by the United
Nations for the establishment of internally
displaced persons camps. Furthermore, the state in which the IDP camps in
comparison to the UNHCR minimum
requirements are summarized in Table 3.
Table 3: Analysis of Physical Condition of Sampled Camps using UNHCR Spatial requirement
Camp Covered
Living Area
Camp
Settlement
Fire Safety Gradient of
Camp Site
Drainage
Gwoza and Bama IDP Camp
1.2sqm per person and 1.8m ceiling
3.0 sqm per camper (IA)
900mm between structures
4% (A) Presence of free-flowing Gutters to
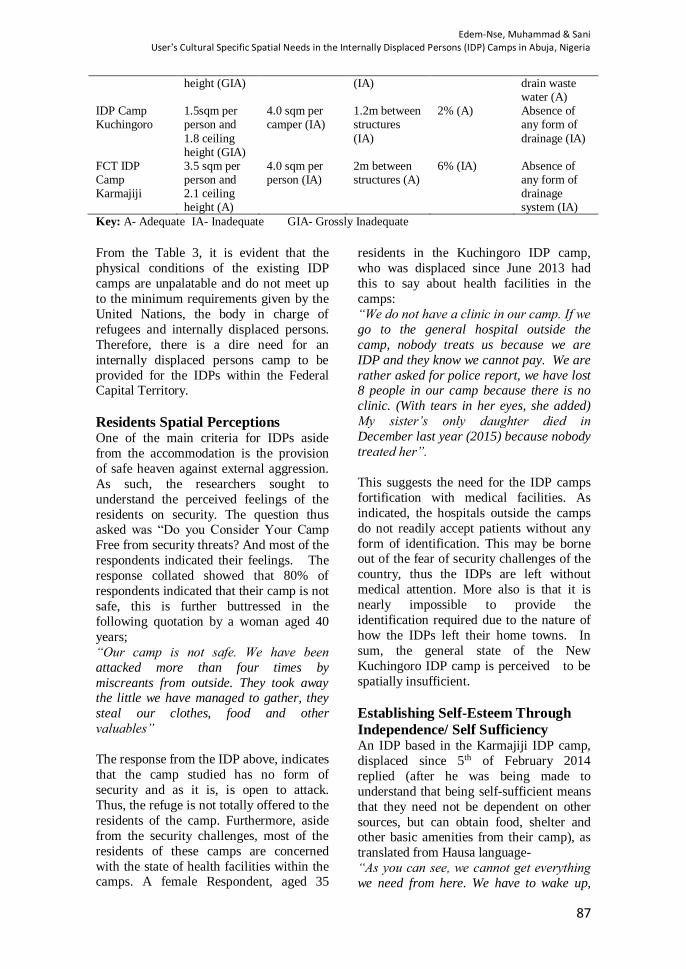
Edem-Nse, Muhammad & Sani User’s Cultural Specific Spatial Needs in the Internally Displaced Persons (IDP) Camps in Abuja, Nigeria
87
height (GIA) (IA) drain waste water (A)
IDP Camp Kuchingoro
1.5sqm per person and
1.8 ceiling height (GIA)
4.0 sqm per camper (IA)
1.2m between structures
(IA)
2% (A) Absence of any form of
drainage (IA)
FCT IDP Camp Karmajiji
3.5 sqm per person and 2.1 ceiling height (A)
4.0 sqm per person (IA)
2m between structures (A)
6% (IA) Absence of any form of drainage system (IA)
Key: A- Adequate IA- Inadequate GIA- Grossly Inadequate
From the Table 3, it is evident that the
physical conditions of the existing IDP
camps are unpalatable and do not meet up
to the minimum requirements given by the
United Nations, the body in charge of
refugees and internally displaced persons.
Therefore, there is a dire need for an
internally displaced persons camp to be
provided for the IDPs within the Federal Capital Territory.
Residents Spatial Perceptions One of the main criteria for IDPs aside
from the accommodation is the provision
of safe heaven against external aggression.
As such, the researchers sought to
understand the perceived feelings of the
residents on security. The question thus asked was “Do you Consider Your Camp
Free from security threats? And most of the
respondents indicated their feelings. The
response collated showed that 80% of
respondents indicated that their camp is not
safe, this is further buttressed in the
following quotation by a woman aged 40
years;
“Our camp is not safe. We have been
attacked more than four times by
miscreants from outside. They took away the little we have managed to gather, they
steal our clothes, food and other
valuables”
The response from the IDP above, indicates
that the camp studied has no form of
security and as it is, is open to attack.
Thus, the refuge is not totally offered to the
residents of the camp. Furthermore, aside
from the security challenges, most of the
residents of these camps are concerned
with the state of health facilities within the camps. A female Respondent, aged 35
residents in the Kuchingoro IDP camp,
who was displaced since June 2013 had
this to say about health facilities in the
camps:
“We do not have a clinic in our camp. If we
go to the general hospital outside the
camp, nobody treats us because we are
IDP and they know we cannot pay. We are
rather asked for police report, we have lost 8 people in our camp because there is no
clinic. (With tears in her eyes, she added)
My sister’s only daughter died in
December last year (2015) because nobody
treated her”.
This suggests the need for the IDP camps
fortification with medical facilities. As
indicated, the hospitals outside the camps
do not readily accept patients without any
form of identification. This may be borne out of the fear of security challenges of the
country, thus the IDPs are left without
medical attention. More also is that it is
nearly impossible to provide the
identification required due to the nature of
how the IDPs left their home towns. In
sum, the general state of the New
Kuchingoro IDP camp is perceived to be
spatially insufficient.
Establishing Self-Esteem Through
Independence/ Self Sufficiency An IDP based in the Karmajiji IDP camp,
displaced since 5th of February 2014
replied (after he was being made to
understand that being self-sufficient means
that they need not be dependent on other
sources, but can obtain food, shelter and other basic amenities from their camp), as
translated from Hausa language-
“As you can see, we cannot get everything
we need from here. We have to wake up,

Environmental Technology & Science Journal Vol. 8 No. 2 December 2017
88
leave our camps and hustle daily for
survival. We have no land to farm, no
animals to rear, we have nothing. We came
here with nothing; we thank God for
sparing our life. Some of our women go all
the way to Keffi road almost every day to farm corn and yam. They bring some home
and sell some in Orange market.”
The respondent above states that the camp
in which they are housed are not self-
sufficient. They must fend for themselves
by going long distances to trade. A camp
facility ideally should be self-sufficient and
be able to provide basic needs of campers
(UNHCR, 2015). However, within the
context of Nigeria, the residents of the IDP
camps would not mind fending for themselves if the enabling environment is
provided. That is why the researchers
observed that in some of the IDP camps
plots of farmland were seen being
cultivated by campers. This is not different
from the results obtained in Congo refugee
camp where the cash aids were seen to
upgrade the economic status of the
refugees rather than in kind aids (Alloush,
Taylor, Gupta, Rojas, et al., 2017). This is
because the refugee would be able to invest in their area of interest and Specialty. In the
context of this scenario, the refugees would
invest in Farm inputs.
From the above, the Karmajiji camp is the
most adequate and sufficient in terms of
accommodation size, social amenities and
circulation, however, the residents will like
to have farm lands. None of the camps
have secondary schools, but the New
Kuchingoro camp has a skill acquisition
ground where campers acquire skills in leatherworks. The church also doubles as a
sewing and weaving workshop where
campers learn the skill for a fare as
organized by a private NGO.
In summary, the residents of the IDP
camps are not satisfied with the facilities
found at the camp. Consequently, the
respondents advocated for the need of a
standard health care facility, the need for
school and skill acquisition facilities. Additionally, there were also some cultural
specific spatial needs which is to have a
camp that has a traditional communal
compound setting. This is in contrast with
the individual single rooms that were found
in the IDP Camps which happened to be
individualistic in terms of social transactions. Similarly, the respondents
perceived an IDP camp to be that which
can offer them the opportunity to practice
their main occupation, farming. Other
needs of the campers also include
relaxation facilities, religious buildings and
sporting facilitates.
Conclusions The research did set out to understudy the
culture specific spatial needs of the IDP
camps in Nigeria. Aside from the minimum
requirement stipulated by UNHCR, it is
expected that the spatial need could be
contextual. The findings of this research
show that the needs of the IDPs who are
mainly from the North-Eastern States of
Nigeria are culturally sensitive in their
perception of what is required in an IDP
camp. These needs aside from the
minimum standard of the UNHCR include the setting of the camp in a compound like
structure, the provision of privacy for the
female members and the provision of
secured places for farming. This thus
suggests that, the planning of IDP camps
aside from the socio-cultural needs, the
profession of the displaced person must be
considered to make the camps users
oriented. This finding is potentially
important for IDP policies that need to
include cultural spatial needs of IDPs in the planning of IDP camps (Alloush et al.,
2017).
References Adibe, J. (2012). Boko Haram: One sect,
conflicting narratives. African
Renaissance, 9(1), 47-64.
Agbiboa, D. E. (2013). Why Boko Haram
exists: The relative deprivation
perspective. African Conflict &
Peacebuilding Review, 3(1), 144-157. Alloush, M., Taylor, J. E., Gupta, A.,
Rojas, V., Ruben, I., & Gonzalez-
Estrada, E. (2017). Economic Life in

Edem-Nse, Muhammad & Sani User’s Cultural Specific Spatial Needs in the Internally Displaced Persons (IDP) Camps in Abuja, Nigeria
89
Refugee Camps. World Development,
95, 334-347. doi:
http://dx.doi.org/10.1016/j.worlddev.2
017.02.030
Blummer, B., & Kenton, J. M. (2014). 12 -
Methodology: the data analysis Improving Student Information
Search (pp. 125-136): Chandos
Publishing.
Charmaz, K. C., Clarke, A. E., Friese, C.,
& Washburn, R. (2015). Situational
analysis in practice: Mapping
research with grounded theory.
London: Left Coast Press.
Creswell, J. W. (2012). Educational
Research Planning, Conducting and
Evaluating Quantitative and
Qualitative Research (P. A. Smith Ed. 4th ed.). Boston: pearson Education
Inc.
Dudley, D. (2016). The Ten Countries
Most Affected by Terrorism. doi:
https://www.forbes.com/sites/dominic
dudley/2016/11/18/countries-most-
affected-by-terrorism/#49e05af530d9
Facts, A. (2016). Handbook on The Events
and Happenstances Within the
Federal Capital Territory (pp. 2-16).
Kinghorn, J. (2015). Five Countries Most Frequently Hit by Natural Disasters.
doi: http://www.air-
worldwide.com/Blog/Five-Countries-
Most-Frequently-Hit-by-Natural-
Disasters/
Kosk, K. (2016). Social Participation in
Residential Architecture as an
Instrument for Transforming Both the
Architecture and the People Who
Participate in It. Procedia
Engineering, 161, 1468-1475. doi:
http://dx.doi.org/10.1016/j.proeng.2016.08.612
Liu, Q., Ruan, X., & Shi, P. (2011).
Selection of emergency shelter sites
for seismic disasters in mountainous
regions: Lessons from the 2008
Wenchuan Ms 8.0 Earthquake, China.
Journal of Asian Earth Sciences,
40(4), 926-934.
Macmillan, R. (2011). Seeing things
differently? The promise of
qualitative longitudinal research on the third sector.
Mannay, D., & Morgan, M. (2014). Doing
ethnography or applying a qualitative
technique? Reflections from the
‘waiting field’. Qualitative Research,
1468794113517391.
Merleau-Ponty, M. (1962). Phenomenology of perception (C.
Smith, Trans.) Humanities Press. New
York.
Miles, M. B., Huberman, A. M., &
Saldaña, J. (2013). Qualitative data
analysis: A methods sourcebook:
SAGE Publications, Incorporated.
Moghimi, V., Jusan, M. B. M., Izadpanahi,
P., & Mahdinejad, J. (2017).
Incorporating user values into
housing design through indirect user
participation using MEC-QFD model. Journal of Building Engineering, 9,
76-83. doi:
http://dx.doi.org/10.1016/j.jobe.2016.
11.012
Muhammad, I. B. (2017). Cultural
Landscape Transactions and Values
of a Nupe Community in Central
Nigeria. Delaware ,United States:
Vernon Press.
Muhammad, I. B., & Said, I. (2015).
Behavioral use of courtyard in a Nupe cultural landscape of Nigeria
Interdisciplinary Behavior and Social
Sciences (pp. 227-232): CRC Press.
Mundo-Hernández, J., Valerdi-
Nochebuena, M. C., & Sosa-Oliver, J.
(2015). Post-occupancy evaluation of
a restored industrial building: A
contemporary art and design gallery
in Mexico. Frontiers of Architectural
Research, 4(4), 330-340. doi:
http://dx.doi.org/10.1016/j.foar.2015.
09.003 NRC (2015). Internal Displacement
Monitoring Centre (NRC/IDMC).
Global Overview 2014: people
internally displaced by conflict and
violence-Democratic Republic of the
Congo, 14.
Nwagbo, O., & Gerald, O. (2015). Identity
and Language Attitudes Among
Liberian Refugees in Oru Camp,
Ogun State, Nigeria. Procedia -
Social and Behavioral Sciences, 212, 106-110. doi:

Environmental Technology & Science Journal Vol. 8 No. 2 December 2017
90
http://dx.doi.org/10.1016/j.sbspro.201
5.11.306
Oesch, L. (2017). The refugee camp as a
space of multiple ambiguities and
subjectivities. Political Geography,
60, 110-120. doi: http://dx.doi.org/10.1016/j.polgeo.201
7.05.004
Okanlawon, K., Anene, O., & Reeves, M.
(2010). Sexual History, Condom Use
and STDs among Refugee Men in
Oru refugee camp, Nigeria. Journal of
Men's Health, 7(3), 304. doi:
http://dx.doi.org/10.1016/j.jomh.2010
.09.074
Patton, M. Q. (2005). Qualitative research:
Wiley Online Library.
Ramadan, A. (2013). Spatialising the refugee camp. Transactions of the
Institute of British Geographers,
38(1), 65-77.
Rubin, H. J., & Rubin, I. S. (2011).
Qualitative interviewing: The art of
hearing data: Sage.
Sliwa, M., & Wiig, H. (2016). Should I
stay or should I go: The role of
Colombian free urban housing
projects in IDP return to the
countryside. Habitat International,
56, 11-19. doi:
http://dx.doi.org/10.1016/j.habitatint.2
016.01.003
Tracy, S. J. (2012). Qualitative research methods: Collecting evidence,
crafting analysis, communicating
impact: John Wiley & Sons.
UNHCR, R. (2007). Handbook for
Emergencies: Geneva.
UNHCR, (2015). United Nations
Guidelines for the Establishment of
Refugee Camps and IDP Camps:
http://www.unhcr.org/news/latest/201
6/6/5763b65a4/global-forced-
displacement-hits-record-high.html
Yin, R. K. (2013). Case study research: Design and methods: Sage
Publications. Washington DC
Yuksel, B., & Hasirci, D. (2012). “An
Analysis of Physical and
Psychological Expectations of
Earthquake Victims from Temporary
Shelters: A Design Proposal.” METU
JFA 29:225-40

Edem-Nse, Muhammad & Sani User’s Cultural Specific Spatial Needs in the Internally Displaced Persons (IDP) Camps in Abuja, Nigeria
91
Socio-Economic and Psychological Impacts
of Land Use Conflicts on Herdsmen and
Local Communities in Kogi State, Nigeria
Adebayo Michael Adedayo and Ojo Babajide Department of Estate Management, Federal University of Technology, Akure, Nigeria.
[email protected] or [email protected]
Abstract The importance of land resources to mankind has brought with it a lot of competition
amongst its uses and users. This has led to series of conflicts and litigations such as the crisis
between Fulani herdsmen and the local community farmers in the middle belt region and the
northern states of Nigeria being reported by the media almost on daily basis. The
consequences of these incessant conflicts are becoming worrisome and a threat to national
security. It is on this basis that this study was carried out to assess the socio-economic and
psychological effects of such conflicts amongst Fulani herdsmen and local community
farmers in Kogi State of Nigeria. A total of 293 farmers from Alloma, Okula and Iboko villages and 56 herdsmen from Gaa Ofolikpa, Gaa Iboko and Gaa Efekpe were selected for
this study. Structured questionnaire were administered on the sampled respondents to obtain
data on their losses and gains from such conflicts. Descriptive and inferential statistical
techniques were used to analyse the data. The study revealed that both parties suffered
untold hardships ranging from destruction of crops, herds, houses, bush burning to loss of
lives. Others include raping, food insecurity and sleepless nights. In order to forestall these
hardships, it is recommended that both herdsmen and community farmers be properly
educated and sensitized on living together in harmony for peace to reign. Moreover, policy
makers should create ranches where the herdsmen could feed their cattle without moving to
community farmlands.
Keywords: Community farmers, Fulani herdsmen, land use conflict, psychological, socio-economic.
Introduction The competition between farmers and
herdsmen has often times turned into
serious overt and covert manifestation of
hostilities and social friction in many parts
of Nigeria. The conflicts have
demonstrated high potential to exacerbate
the insecurity of life and properties
particularly in rural communities where
most of the conflicts are localized, with
reverberating consequences nationwide (Adisa, 2011). In fact, incidences of crises
between farmers and herdsmen in the
northern states were being reported almost
every week (Ofuoku, 2010). Nweze (2005)
stated that many farmers and herders have
lost many lives and herds, while others
have experienced dwindling productivity in
their herds. This was supported by Ajuwon,
(as cited in Nweze, 2005) in his
observation that in Imo State for instance
between 1996 and 2005, nineteen (19) people died and forty-two (42) people were
injured in this rising incident of farmers-
herders conflict and the violence that often
accompanies such conflict is an issue that
can be regarded as being of national
concern. These conflicts were threats to
both state and national stability. It also has
implication for tribal coexistence, Nigeria
being a multi-ethnic and a multi tribal
nation (Ingawa, 1999). Conflict in resource
use is not uncommon and perhaps not
unnatural in human ecosystems. Ekong (2003) opined that conflict may have
positive and negative effects. In positive

Environmental Technology & Science Journal Vol. 8 No. 2 December 2017
92
effect, people may not know that certain
nagging issues exist. Thus conflict leads to
clear definition of issue. Once such issues
have been identified, they can then be
amicably resolved. Moore (2005) noted
that conflict per se, is not bad: it is perhaps a necessity in the evolution and
development of human organizations. But
when conflicts degenerate to violent,
destructive clashes, they become not only
unhealthy but also counterproductive and
progress-threatening. Nyong and Fiki
(2005) pointed out that resource-related
conflicts are responsible for over 12
percent declines in per capita food
production in sub- Saharan Africa.
Many researches have been carried out on
conflict resolution and management, especially on conflicts between the Fulani
herdsmen and local farmers in Nigeria.
While most of these studies focus on the
causes of the conflicts (Adisa, 2007;
Ajuwon, 2009; Ibrahim, 2009; Olabode,
2010; Abbas, 2011; Adisa, 2011b;
Alawode, 2013; Okoli & Chukwuma,
2014), others like Tenuche and Ifatimehin
(2009), Oladele and Oladele (2011) dwell
on the effects of such conflicts. However,
more expansion of frontiers of knowledge in this area of national concern cannot be
unjustifiable; hence, the aim of this study is
to examine the socio- economic and
psychological effects of the incessant
conflicts between the Fulani herdsmen and
the local farming communities in Kogi
State of Nigeria with a view to finding a
lasting solution to identified bitter
consequences of such conflicts.
Review of Related Literature Whatever the causes of farmer-herdsmen
conflicts are, it is evident that the conflicts
have been of great negative effects. These
range from economic effects (such as loss
of income/resources/yield) to physical
(such as home/farm destruction, bodily
injury or death of family member) and
socio-psychological effects such as
emotional exhaustion, job dissatisfaction,
etc, (Adisa, 2011a). The manifestations of the conflicts ranged from mere altercations
to violent skirmishes resulting in loss of
livestock, crops, lives and valuable
property. Categorically, the economic
effects include loss of yield, reduction in
income, loss of household resources, loss
of man-hours and security expenses. Also,
the physical effects of conflict include
home destruction, bodily injury and death of household member while the socio-
psychological effect also involves
declining quality of children’s education,
sleepless nights, anger/anxiety/emotional
exhaustion, reduction in family food
quality/quantity and job dissatisfaction
(Adisa, 2011b). Ajuwon (2009), in
determining the effects of Fulani-farmers
conflicts in Bauchi state discovered that
between 1994 and 2002, 28 villages were
affected and recorded loss of lives, crops,
livestock and properties while between 1995 and 1997, in 8 out of the 28 villages
affected, it was reported that 31 farmers, 66
herdsmen and 4 policemen were killed.
Also 44 farmers and 2 herdsmen were
injured (Bauchi State Agricultural
Development Programme, 1997). Between
1997 and 2002 in Gombe state, a woman
was abducted for some days and another
was amputated, 366 people were seriously
injured, two herdsmen were apprehended
by the police, 20 people lost their lives, a number of cattle were killed and some
houses were burnt. Also some valuables
were lost, rainy season crops were
prematurely harvested and there were
delays in starting dry season farming as a
result of the conflicts. Between 1996 and
2002, 27 persons were injured and 17
persons lost their lives. Crops estimated at
over a million of were reportedly damaged
in Kogi State. In Imo State, there were loss
of lives, properties, animals and farm
produce. Between 1996 and 2002, nineteen (19) people died and forty two (42) persons
were injured. One hundred and ninety one
(191) animals valued at ₦233,000 and
crops worth over ₦334, 000 were
destroyed during the conflict (Okoli et al,
2014). The herdsmen live in fear of attacks
on their cattle and themselves (Adisa,
2011b). Accordingly, Okoli, et al (2014)
asserted that conflicts have resulted in dire
humanitarian, social, economic, and socio-
economic consequences. For instance, herder/farmer conflicts in Nasarawa State
Adebayo & Ojo Socio-Economic and Psychological Impacts of Land Use Conflicts on Herdsmen and Local Communities in Kogi
State, Nigeria
93
have led to loss of lives, population
displacements, human injury and livelihood
crisis. According to a source credited to the
National Orientation Agency (NOA
Nasarawa State Pulse Report, 2013), the
conflicts have led to the killing of not fewer than one hundred and thirty (130)
persons between 2011 and 2013. This is in
addition to scores of people who have been
rendered morbid, homeless, displaced and
destitute by the conflicts. Psychologically,
the conflicts have created an atmosphere of
mental siege and terror among the populace
in such a manner that threatens public
peace and tranquility. The conflicts have
also led to tense and volatile inter-group
relations amongst the various peoples of
Nasarawa, Plateau, Benue, Kogi and some other states in the northern part of Nigeria
(Ofuoku, 2010). This manifests in mutual
mistrust and animosity which are often
misplaced. The pastoralists see the settled
farmers as enemies of their collective
survival and destiny, and vice versa. This
creates an ambience of mutual suspicion
and perpetual tension that threatens
peaceful coexistence, security and stability of the society.
On the whole, the conflicts have been
engendered untoward outcomes that
impede sustainable societal peace and
development. As pointed out by Nchi
(2003) “these rounds of strife disrupt
community life and solidarity and destroy
local and national economies with negative
consequences on general social and
economic development”. Sunday Trust of
1st September, (2013), reported cases of Fulani/Farmer Clashes in Nigeria with their
respective date, place of incidence and the
number of deaths recorded as follows.
Table 1: Cases of Fulani/Farmer Clashes in Nigeria
Date Place of Incidents No. of Casualties
January 1 Jukun /Fulani clash in Taraba State 5 January 15 Farmers/Fulani clash in Nasarawa State 10 January 20 Farmers/Fulani clash in Nasarawa State 25 January 24 Fulani/Farmers clash in Plateau State 9
February 7 Fulani/Eggon clash in Nassarawa State 30 March 20 Clashes between Fulani an Tarok, Jos, Plateau State 18 March 28 Clashes between Fulani and Farmers in Riyon,
B/Ladi, Jos, Plateau State 28
March 29/30 Clashes between Fulani and Natives in Bokkos areas of Bokkos LGA Jos, Plateau State
18
March 30 Police killings in clashes between farmers and Fulani 6 April 3 Farmers/Fulani clashes in Guma LGA, Benue State 3
April 10 Clash between Fulani and Tiv farmers 28 April 23 Fulani/Egbe Farmers clash in Kogi State 5 May 4 Fulani/Farmers clash in Plateau State 13 May 4 Jukun/Fulani clash in Wukari, Taraba State 39 May 13 Fulani/Agatu clash in Benue State 50 May 20 Tiv/Fulani clash at Benue-Nasarawa boarder 23
Source: Sunday Trust, 2013.
Empirical studies on socio-economic effects of herdsmen/farmers’ conflicts
include Ajuwon (2009) on conflicts in
Fadama communities in Nigeria. Using
descriptive statistics, the study identified
the effects as destruction of lives and
properties on the people of Bauchi, Kebbi,
Nassarawa, Gombe, Benue and Plateau
states. Ibrahim (2009) researched into
access to and conflict on farm and grazing
lands in semi-arid areas of Nigeria with
particular reference to Yusufari Local Government Area of Yobe State. While
these two studies have done much on the
subject matter, they were carried out,
outside Kogi State, hence the necessity to
replicate it in the State due to social and
geographical differences. Tenuche and
Ifatimehin (2009) examined resource
conflict among farmers and Fulani
herdsmen and the implication on resource
sustainability. The study described the
Environmental Technology & Science Journal Vol. 8 No. 2 December 2017
94
traditional relationship between farmers
and Fulani herdsmen in the incessant
resource conflict witnessed in Kogi State as
strained and of consequential effects on
resource sustainability of the communities.
However, Oladele and Oladele (2011) studied the effects of pastoralist-farmers
conflicts on access to resources in Savanna
area of Oyo State and found that the
conflicts did not significantly hinder the
agro-pastoralists access to resources. As it
were, the study did not address the holistic
impact of conflict on the psychological,
social and economic life of the
communities which this study is out to take
care of.
The Study Area Kogi State is located between latitude
6o30’N and 8o51’N and longitude 5°51’E
and 8°00’E. The State is structured into 21
Local Governments Areas with a total
landmass area of about 30,354.74 km2 and
a population of 3,278,487 (NPC, 2006). It has an average temperature of 28°C.
Annual rainfall ranges from 1016mm to
1524 mm and humidity is 69%. The State
is endowed with both human and physical
resources. It hosts the confluence of the
two largest rivers in Nigeria-Rivers Niger
and Benue.
The study area comprises Alloma, Okula,
and Iboko, all in Ofu Local Government
Area, Kogi State, Nigeria. The total
population of the people in the study area is
about 53,725 (NPC, 2006) and most of the inhabitants are predominantly farmers. This
area is located within 8o50’N and 8o20’E of
the equator. The study communities located
within Ofu Local Government Area share
boundaries with Ajaokuta in the West, Idah
in the South and Dekina in the North.
The climate in the study areas in particular
permits the growing of arable and
permanent crops. They grow crops like
yam, cassava, maize, millet, beans etc. Due
to the abundance of palm trees in the areas,
most women engage in palm oil
processing. Annually, the area is subjected
to extensive bush burning in the dry season
and flooding in the rainy season. Poultry,
sheep and goats are also kept in small
scale. The vegetation is savanna type,
hence the area is also good for grazing. There are two distinct seasons – wet and
dry. The wet season is normally from April
to October, with the highest amount of
rainfall between June and September. Most
of the vegetation however has been
destroyed by man through cultivation and
grazing, as a result of which the present
vegetation is a secondary type.
Research Method The target population for this study
comprised of Farmers and Herdsmen in
Alloma, Okula, and Iboko farming
communities and Fulani camps consisting
of Gaa Ofolikpa, Gaa Efekpe and Gaa Iboko. The sampling frame and size for the
study are presented in Tables 2 and 3.
Table 2: Sampling frame and size (Farmers).
Farming
Communities
Sampling frame
Sample Size
Alloma Okula Iboko
270 165 158
151 117 113
Total 593 391
Source: Author’s computation, 2015
Table 3: Sampling frame and size (Fulani herdsmen)
Fulani Herdsmen Sampling Frame
Sample Size
Ofolikpa
Iboko Efekpe
25
18 20
25
18 20
Adebayo & Ojo Socio-Economic and Psychological Impacts of Land Use Conflicts on Herdsmen and Local Communities in Kogi
State, Nigeria
1
Total 63 63
Source: Author’s computation, 2015.
To obtain the sample size, the formula by
Yamane (1967) was chosen for this study
for the fact that the population is finite; the
formula is given as follows:
n = N - - - - - - - - - - (i)
1+N (e)2
n= sample size
e = accepted error (the precision) taken
as ±0.05
N = population
The application of this formula gives a
sample size of 391. Isreal (2003) suggests
that the census method should be applied
for a population less than 200. Hence the
sample size for the Fulani herdsmen was
63. For the purpose of this study
proportional random sampling was used for
the farming communities. This is necessary because the three villages were not of the
same population. Structured questionnaires
were administered on both farmers and
herdsmen to elicit relevant information, on
the socio-economic and psychological
effects of conflicts in the study areas. The
questionnaires were designed in simple
forms to enable the respondents to answer
appropriately by ticking either yes or no.
Moreover, the questionnaires were
interpreted to the respondents in their local
languages by trained field officers.
Results and Discussion Tables 4 to 6 show the socio-economic and
psychological effects of conflict in the study area.
Table 4 indicates that loss of income had
the highest frequency (91%) among
farmers, followed by loss of yield (85%),
household resources (23.5%) and stored
products (23%). On the part of herdsmen,
losses whether material or not were
minimal. Indeed, 14.3%, 8.9%, 7.1%, and
3.8% of herdsmen claimed to have suffered
losses in respect of their, income, yield, stored products and household resources
respectively. However, concerning non-
material resources, 30%, 20%, and 13% of
herdsmen suffered losses in respect of job
status, self-esteem, and quality of
relationship respectively. These figures in
respect of herdsmen were generally far less
than those for farmers. This implies that
farmers experienced more losses than the
herdsmen. It also means that farmers
suffered loss of material and non-material
resources than the herdsmen.
Table 4: Socio-economic effects (loss) of conflicts on farmers and herdsmen.
Loss of
Resources Farmers Percentage (%) Herdsmen Percentage (%)
Yield 249 85.0 5 8.9 Household resources 70 23.5 2 3.6 Social support 13 4.4 2 3.6 Stored products 66 22.5 4 7.1
Job status 162 55.6 17 30.3 Self esteem 154 52.9 11 19.6 Income 266 90.8 8 14.3 Family/personal health 40 13.9 9 16.1 Quality of relationship 72 24.6 12 12.5
Source: Field Survey (2015).
Environmental Technology & Science Journal Vol. 8 No. 2 December 2017
96
Table 5: Socio-economic effects (gain) of land use conflict on farmers and herdsmen.
Gain of
Resources Farmers Percentage (%) Herdsmen Percentage (%)
Yield 0 0.0 0 0.0 Household resources 0 0.0 .0 0.0
Social support 78 30 10 17.9
Stored products 0 0.0 0 0.0
Job status 0 0.0 0 0.0
Self esteem 0 0.0 0 0.0
Income 0 0.0 0 0.0
Family/personal health 0 0.0 0 0.0
Quality of relationship 0 0.0 0 0.0
Source: Field Survey ( 2015).
Table 5 shows that the only item that
constituted a ‘gain’ for both parties were in
areas of social supports and quality of
relationship, although the figures were very
low; 4.1% for farmers and 5.4% for
herdsmen. This implies that both farmers
and the herdsmen were assisted in the areas
of provision of relieve materials from the
Government and NGOs like foods, clothing and other necessary materials.
Table 6 shows the result of the
psychological effect of mutual conflict on
the quality of their respective lives in the
aspects of the quality of their children
education, physical exhaustion, sleepless
night, reduced interest in family matters,
reduction in food quality and quantity,
staying more away from home and
farm/job abandonment. All the adduced
psychological effects of conflict have t-cal.
< t-tab. except in the aspect of the quality
of children education with the t-cal. > t-tab. This means that of all the factors
considered, decline in quality of children’s
education is the only factor that is
significant at 0.05 levels.
Table 6: Result of t-test of variables of socio-psychological effects of the conflicts
Effects
Mean scores Df t-calc. t-
crit.
Decisio
n Farmers Herdsmen
Decline in quality of children education
3.55
1.05
348
5.71
1.645
S**
Physical exhaustion
3.75
2.15
348
1.47
1.645
NS
Sleepless night
3.85
3.56
348
1.56
1.645
NS
Reduced interest in family matters
1.40
1.25
348
1.07
1.645
NS
Reduction in food quality and quantity
3.95
1.50
348
1.11
1.645
NS
Farm/job abandonment
1.35
1.15
348
1.52
1.645
NS
Staying more away from home
1.38
1.05
348
1.60
1.645
NS
Adebayo & Ojo Socio-Economic and Psychological Impacts of Land Use Conflicts on Herdsmen and Local Communities in Kogi
State, Nigeria
1
Source: Field survey, 2015 **significant at 0.05 level
Findings and Implications Mostly, farmers suffered various socio-
economic effects than the herdsmen as a result of the conflict between the farmers
and herdsmen. There is reduction in output
and income of farmers through destruction
of crops by cattle and through
indiscriminate bush burning by the
herdsmen. This reduces yield which
translate into low income on the part of the
farmers who take farming as major
occupation.
The study found that both farmers and herdsmen reported a few non-material
gains. Both farmers and the herdsmen
gained social support as a result of mutual
conflict. Social supports for the farmers
and herdsmen were in the form of non-
tangible and tangible or instrumental
supports such as money and housekeeping.
Sometimes, Governments and NGOs come
to their aid by providing food items,
clothing materials and shelter.
The farmers and herdsmen experienced socio-psychological effect of conflict on
the quality of their family lives. From the
findings, there was significant difference in
the effect of the conflict between the
farmers and herdsmen in terms of the
quality of children education. Farmer-
herdsmen conflicts affected the proper
education of children as many farmers
claimed to experience difficulties in paying
school fees, textbooks and other school
materials. The findings confirm the outcome of studies such as Ortega, et
al(1994), Coelcho (2000), and Bosch
(2003) that work related stress have
negative socio-psychological effects on
family lives among farmers. During crises,
school buildings were burnt down, teachers
posted to these communities ran away for
their dear lives. This evidently, does not
augur well for the development of the
affected children, and is capable of creating
further social problems in the future if not
timely checked. The farmers suffer this
most because the Fulani herdsmen do not
disposed favourably to western education.
Conclusion and Recommendations The study has examined the socio-
economic and psychological effects of land
use conflicts on the Fulani herdsmen and
local community farmers in Kogi State
Nigeria. It identified the major losses and
gains resulting from the conflicts on both
sides. It also further identified the psychological effects suffered especially by
farmers as truncated children education,
physical exhaustion, sleepless nights and
farm abandonment among others. The
study can unequivocally conclude that both
herdsmen and farmers have suffered huge
losses as a result of the incessant conflicts
between them.
Following the result of this study, it is
hereby recommended that farmers and
herdsmen alike should be educated and sensitized on the need for peace and mutual
co-existence. Moreover, policy makers are
advised to create ranches where the
herdsmen could feed their cattle without
moving to community farmlands.
References Abbas, I. M.(2010). “No Retreat, No
surrender: Conflict for survival between Fulani pastoralists and
farmers in Northern Nigeria”.
European Scientific Journal. 8(1),
331-346.
Adisa, R. S. (2011a). Management of
Farmer-Herdsmen Conflicts in
Nigeria: Implications for
collaboration between Agricultural
Extension Service and Other
Stakeholders. Journal of International
Agricultural and Extension Education, 18(1), 60-72

Adebayo & Ojo Socio-Economic and Psychological Impacts of Land Use Conflicts on Herdsmen and Local Communities in Kogi
State, Nigeria
98
Adisa, R. S. (2011b). Patterns of Conflict
and Socio-psychological Coping
Strategies among Natural Resource
User-groups in Tourism Communities
of the Nigerian Savannah. The
Journal of Tourism and Peace Research, 1 (3), 1-15.
Ajuwon, S. S. (2004) Case Study: Conflict
in Fadama Communities. In
Managing Conflict in Community
Development. Session 5, Community
Driven Development.
Ajuwon, S.S. (2009). Managing Conflicts
of Interests In Community
Development: Conflict in
Fadama Communities – Case study on
Fadama Conflicts Issue
http:info.worldbank.org/etools/docs/library/39228/Conflict%20managemen
t.doc. file// local
host/f:Conflicts%20in%fadama%20A
reas%20srpeache.htm
Atelhe G. A, Okoli,A. C and Chukwuma
A. (2014) ‘Nomads against Natives:
A Political Ecology of Herder/Farmer
Conflicts in Nasarawa State, Nigeria’.
American International Journal of
Contemporary Research, 4 (2), 17-25.
Ekong, E. E. (2003): An Introduction to Rural Sociology. 2nd Ed. Dove of
Educational Publishers, Uyo, Nigeria,
(1),140-145
Ingawa, S. A; Ega, L. A; and Erhabor, P.
O. (1999). Farmer-Pastoralist
Conflict in Core-states of the National
Fadama Project, FACU, Abuja.
Isreal, G. D. (2003). Determining Sample
Size, Programme Evaluation and
Organisational Development. IFAS,
University of Florida.
Moore, K. M. (2005). Conflict, Social
Capital and Managing Resources: A
West African Case Study. CABI
Publishing, Cambridge, USA. (1), 44-53.
Nchi, S.I. (2003). Religion and politics in
Nigeria: The constitutional issues.
Jos: Greenworld
Nyong, A and Fiki, C. (2005). “Droughts-
Related Conflicts, Management and
Resolution in the West African
Sahel.” Human Security and Climate
change International Workshop. Oslo;
GECHS, CICERO and PR20. (1)5-16.
Ofuoku A.U, Isife B.I. (2010) Causes,
Effects And Resolution Of Farmers-Nomadic Cattle Herders Conflict
In Delta State, Nigeria, Asaba
Campus,Asaba,Nigeria
Olabode A.D, and Ajibade, L.T. (2010)
Environment Induced Conflict and
Sustainable Development a case of
fulani-farmers’ conflict in Oke-Ero
lgas, Kwara state, Nigeria. Journal of
Sustainable Development in Africa
(12, No.5, 2010) ISSN: 1520-5509
Oladele O.T, Oladele O.I.(2011) ‘Effect of Pastoralist-Farmers Conflict on
Access to Resources in Savanna Area
of Oyo State, Nigeria’. Life Science
Journal, 2011; 8(2)
http://www.lifesciencesite.com
Yamane T. (1967). Statistics: An
Introductory Analysis, 2nd edition,
Harper and Row, New York.

Environmental Technology & Science Journal Vol. 8 No. 2 December 2017
99
Analysis of Residential Property Rental
Values Trends in Abaji City, F.C.T Nigeria
Sule, Abass Iyanda Department of Estate Management & Valuation, Federal University of Technology, Minna
Abstract This paper examined the residential property rental values and demographic trends of Abaji
City in order to uncover the housing market dynamics in Abaji area council. It is aimed to
study rental performance so as to serve as a guide for potential investors in the study area.
The rental values were obtained with the aid of questionnaire from ten ‘Care takers’ (Estate
agents) for the period of 2003 – 2013, while population data was obtained from National Population Census and National Bureau of Statistics archives. The data collected were
analyzed using trend analysis with simple linear regression models of Microsoft Excel,
population projection and growth rate matrix. The study findings revealed an exponential
increase in the residential rental values over the years, there is positive relationships between
the rental values and time, given coefficients of determination R2 as 0.9594, 0.8971 and
0.9115 for three, two and one bedroom houses respectively. Also, it revealed the potential
investment opportunity in the residential sector of the study area. This study therefore,
recommends among others that the local planning authority of the Abaji area council should
be more proactive about development control so as to curb urban sprawl as the area is a
potential destination for real estate investors and developers.
Keywords: Rental value, Residential properties, Demographic, Trends
Introduction Growth in cities is accelerated by the
readiness of the citizens and government to
alienate land for development purposes.
Land alienation is high in Abaji- the seat of Abaji Area Council of FCT-Nigeria leading
to a fast pace of development especially in
residential sector. As cities develop from
the core to the countryside like the ocean
waves on a beach, the land on the urban
periphery be it farmland, grassland or
forest is alienated for functional urban uses.
The prices of land in periphery of cities in
most Nigeria cities are very unstable,
expensive and suspicious. The
unpredictability of the land prices in Nigeria cities is a function of population
aggregate and pressure occasioning high
demand. Land appears to be significantly
inelastic in price while demand remains
high (Fasakin, et.al, 2006). Ajayi (1998)
observes that, as economically efficient
cities expand, pressure on land is reflected
in high prices throughout the city. Again,
the demand for land in cities especially in
the periphery is a derived demand from that of product or services such as residential
units which in turn is derived from
demographic aggregate dynamics and
profiles. The use of demographic
information has been predominantly
restricted to household population forecast
considered essential when estimating future
demand in a given area for which the
demographic data is ideally suited
(Runnels, 1989; Reed, 2001). However,
when property valuers and analyst are
looking towards the future in relation to housing and investment, demographic
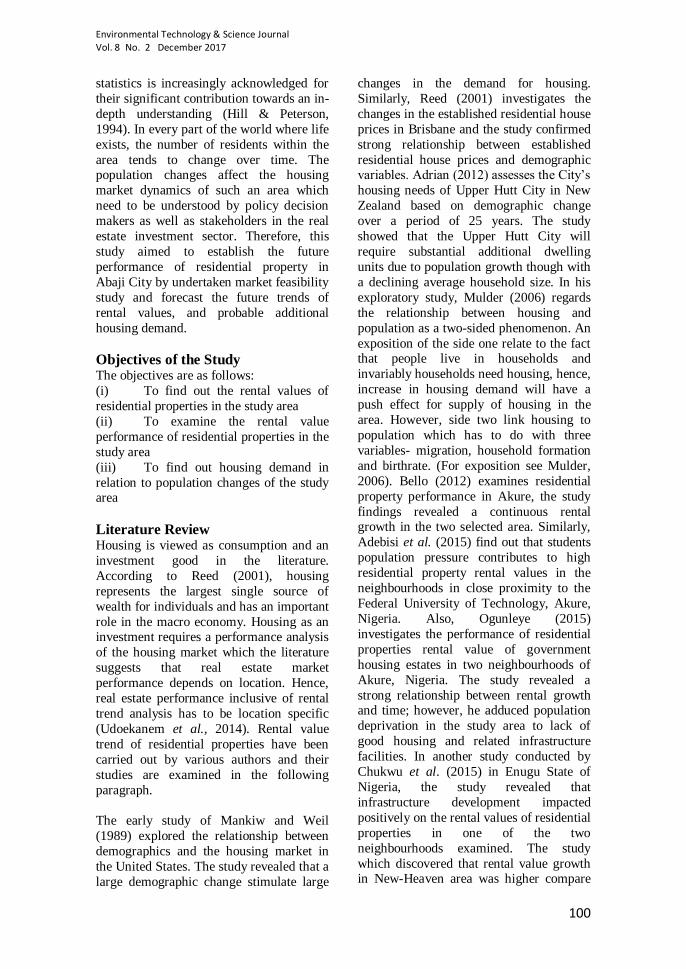
Environmental Technology & Science Journal Vol. 8 No. 2 December 2017
100
statistics is increasingly acknowledged for
their significant contribution towards an in-
depth understanding (Hill & Peterson,
1994). In every part of the world where life
exists, the number of residents within the
area tends to change over time. The population changes affect the housing
market dynamics of such an area which
need to be understood by policy decision
makers as well as stakeholders in the real
estate investment sector. Therefore, this
study aimed to establish the future
performance of residential property in
Abaji City by undertaken market feasibility
study and forecast the future trends of
rental values, and probable additional
housing demand.
Objectives of the Study The objectives are as follows:
(i) To find out the rental values of
residential properties in the study area
(ii) To examine the rental value
performance of residential properties in the
study area
(iii) To find out housing demand in
relation to population changes of the study area
Literature Review Housing is viewed as consumption and an
investment good in the literature.
According to Reed (2001), housing
represents the largest single source of
wealth for individuals and has an important
role in the macro economy. Housing as an investment requires a performance analysis
of the housing market which the literature
suggests that real estate market
performance depends on location. Hence,
real estate performance inclusive of rental
trend analysis has to be location specific
(Udoekanem et al., 2014). Rental value
trend of residential properties have been
carried out by various authors and their
studies are examined in the following
paragraph.
The early study of Mankiw and Weil
(1989) explored the relationship between
demographics and the housing market in
the United States. The study revealed that a
large demographic change stimulate large
changes in the demand for housing.
Similarly, Reed (2001) investigates the
changes in the established residential house
prices in Brisbane and the study confirmed
strong relationship between established
residential house prices and demographic variables. Adrian (2012) assesses the City’s
housing needs of Upper Hutt City in New
Zealand based on demographic change
over a period of 25 years. The study
showed that the Upper Hutt City will
require substantial additional dwelling
units due to population growth though with
a declining average household size. In his
exploratory study, Mulder (2006) regards
the relationship between housing and
population as a two-sided phenomenon. An
exposition of the side one relate to the fact that people live in households and
invariably households need housing, hence,
increase in housing demand will have a
push effect for supply of housing in the
area. However, side two link housing to
population which has to do with three
variables- migration, household formation
and birthrate. (For exposition see Mulder,
2006). Bello (2012) examines residential
property performance in Akure, the study
findings revealed a continuous rental growth in the two selected area. Similarly,
Adebisi et al. (2015) find out that students
population pressure contributes to high
residential property rental values in the
neighbourhoods in close proximity to the
Federal University of Technology, Akure,
Nigeria. Also, Ogunleye (2015)
investigates the performance of residential
properties rental value of government
housing estates in two neighbourhoods of
Akure, Nigeria. The study revealed a
strong relationship between rental growth and time; however, he adduced population
deprivation in the study area to lack of
good housing and related infrastructure
facilities. In another study conducted by
Chukwu et al. (2015) in Enugu State of
Nigeria, the study revealed that
infrastructure development impacted
positively on the rental values of residential
properties in one of the two
neighbourhoods examined. The study
which discovered that rental value growth in New-Heaven area was higher compare

Sule, Analysis of Residential Property Rental Values Trends in Abaji City, F.C.T Nigeria
101
to Achara Layout area up to the year 2009,
reported that massive infrastructure
development thereafter by the government
in the latter reduced the gap drastically.
From the foregoing, apart from Mankiw
and Weil (1989), Reed (2001), Adrian (2012) and Mulder (2006) who had
examined the relationship between
demographic and housing market. Other
studies especially from Nigeria seem not
inquiring in this area and therefore, this
study fills the gap.
Methodology Data for this study came from both primary
and secondary data sources. The primary
data mainly consist of rental value data of
residential properties in the study area.
These include a range of annual rental
values paid for 3, 2 and 1bedroom flats for
the period of 2003 – 2013, from which the average rental values for each category of
residential property type was arrived at
through Microsoft Excel function. The
rental values were obtained from ten (10)
‘Care takers’ as popularly known in the
study area with aid of questionnaire, ‘Care
takers’ became the source of information
due to nonexistence of registered estate
firm in the study area. ‘Care takers’ are
estate agents who practice estate agency
but not registered with either the Nigerian Institution of Estate Surveyors and Valuers
(NIESV) or Estate Surveyors and Valuers
Registration Board of Nigeria
(ESVARBON). Secondary data for the
study is mainly population data sourced
from National Population Census (NPC)
and National Bureau of Statistics
documents. The data collected were
presented in tables and the analysis was
done with simple linear regression models
of Microsoft Excel. This was used to depict
the trends in rental values and to compute
the growth rate in the rental values of the
residential properties in the study area. The
second analysis conducted was on the population growth rate based on the
population data of the study area obtained
from NPC (2006) and NBS (2012) as well
as population projection for short term
period (2011 – 2016) and (2016 - 2021).
The population growth rate was calculated
with the formula:
r = [(P2/P1)1/t - 1] × 100 …………… (1)
Where
r = growth annual rate (in %)
P1 = population at the beginning of the census period
P2 = population at the end of the census
period
t = number of years of census period
For the population projection is
Pt = Po * (1 + r/100)1/t …………… . (2)
Where
t = number of years of census period
Pt = population after t years
Po = population at the start
r = growth annual rate (in %)
Analysis and Findings
Assessment of rental values
progression of the study area From the average rental values of one, two
and three bedrooms obtained in Senior and
Junior Quarters of Abaji, the trends in the
rental values between the year 2003 and
2013 is graphically illustrated as shown in
Figure 1.

Environmental Technology & Science Journal Vol. 8 No. 2 December 2017
0
Figure 1: Rental values (N) trends in Senior and Junior Quarters Area of Abaji
Figure 1 shows an upward trend positive
relationship between rents and time. Also,
it revealed the exponential growth of rents
in the area especially for the two and three
bedrooms houses. The rent passing on the 2
and 3 bedrooms residential property in the
area increase exponentially in the year 2009 compared to 1 bedroom residential
property. However, the rent passing on the
2 and 3 bedrooms residential property
remain stable till 2013 while 1 bedroom
residential property has gain a little
increase in 2012.
The average rental values of one, two and
three bedrooms as obtained in Sabon-Tasha
Area of Abaji are as reported in Table 1.
The trends in the property values of the
area are graphically illustrated as shown in
Figure 2.
Figure 2 shows the average rent passing on
1, 2 and 3 bedrooms residential property in
Sabon-Tasha Area of Abaji. The rent
passing on all the three types of residential properties in the area increase
astronomically in the year 2009. The
average growth rate of rent passing in the
area as at 2009 stood at 1.67, 2.25 and 2.22
per cent for 3 bedrooms, 2 bedrooms and 1
bedroom respectively. However, the rent
passing on the 2 and 3 bedrooms residential
property remain stable till 2013 while 1
bedroom residential property has gain a
little increase in the average growth rate of
rent passing of 1.25 per cent as at 2012.
Table 1: Average rental values (N) in Sabon-Tasha Area of Abaji
House
types
2003 2004 2005 2006 2007 2008 2009 2010 2011 2012 2013
One
Bedroo
m
18,00
0
18,00
0
24,00
0
24,00
0
36,000 36,000 36,000 80,000 80,000 100,00
0
100,00
0
Two
Bedroo
m
24,00
0
24,00
0
36,00
0
36,00
0
80,000 80,000 80,000 180,00
0
180,00
0
180,00
0
180,00
0
Three
Bedroo
m
36,00
0
36,00
0
65,00
0
65,00
0
120,00
0
120,00
0
120,00
0
200,00
0
200,00
0
200,00
0
200,00
0
Source: Authors’ Field Survey, 2013

Environmental Technology & Science Journal Vol. 8 No. 2 December 2017
102
Figure 2: Rental values (N) trends in Sabon-Tasha Area of Abaji
Table 2: Average rental values (N) in Pipeline Area of Abaji
House
types
2003 2004 2005 2006 2007 2008 2009 2010 2011 2012 2013
One
Bedroo
m
18,00
0
18,00
0
24,00
0
24,00
0
36,00
0
36,00
0
60,00
0
60,00
0
80,00
0
80,00
0
80,00
0
Two
Bedroo
m
36,00
0
36,00
0
60,00
0
60,00
0
80,00
0
80,00
0
120,0
00
120,0
00
120,0
00
120,0
00
120,0
00
Three
Bedroo
m
60,00
0
60,00
0
100,0
00
100,0
00
150,0
00
150,0
00
150,0
00
200,0
00
200,0
00
200,0
00
200,0
00
Source: Authors’ Field Survey, 2013
Table 2 presents the average rental values
of one, two and three bedrooms as obtained
in Pipeline Area of Abaji during the field
survey. Subsequently, the trend in the
property values of the area is as shown in
Figure 3.
The rent passing on all the residential
properties in Pipeline area of Abaji shows a
linear pattern since 2003 to 2013 (Figure
3). The average growth rate of rent passing
in the area depicts a steady pattern of
growth. The highest increase gain attracted
by the properties in the area was in 2009
with 0.67 per cent and 0.5 per cent for one
and two bedrooms respectively while the
three bedrooms gained 0.5 per cent
increase in the year 2007 and 2010.
Table 3 presents the average rental values
of one, two and three bedrooms as obtained
in Kekeshi Area of Abaji during the field
survey. Next is the trend in the property
rental values of the area as shown in figure
4 below.

Environmental Technology & Science Journal Vol. 8 No. 2 December 2017
104
Figure 3: Rental values (N) trends in Pipeline Area of Abaji
Table 3: Average rental values (N) in Kekeshi Area of Abaji
House
types
2003 2004 2005 2006 2007 2008 2009 2010 2011 2012 2013
One
Bedroo
m
12,00
0
12,00
0
18,00
0
18,00
0
30,000 30,000 42,000 42,000 50,000 50,000 50,000
Two
Bedroo
m
30,00
0
30,00
0
45,00
0
45,00
0
60,000 60,000 100,00
0
100,00
0
100,00
0
100,00
0
100,00
0
Three
Bedroo
m
50,00
0
50,00
0
80,00
0
80,00
0
120,00
0
120,00
0
120,00
0
150,00
0
150,00
0
150,00
0
150,00
0
Source: Authors’ Field Survey, 2013
Figure 4: Rental values (N) trends in Kekeshi Area of Abaji
Figure 4 shows the steady pattern of rental
growth in Kekeshi Area of Abaji. The average rent passing on one and two
bedrooms residential property in the area
gained its highest increase of 0.67 per cent
in 2007 and 2009 respectively. While three
bedrooms residential property gained an
increase of 0.5 per cent as at 2007.
However, residential properties rental
values in the area continue to show a
positive relationship with time.
Again from Table 4, all the three
residential property types shows and
upward increase in rental value. The data in
the table 5 is graphically illustrated below (Figure 5) to show clearly the trend in the
rental flow.
Table 4: Average rental values (N) in Tundun Wada Area of Abaji
House
types
2003 2004 2005 2006 2007 2008 2009 2010 2011 2012 2013

Sule, Analysis of Residential Property Rental Values Trends in Abaji City, F.C.T Nigeria
1
One
Bedroo
m
12,00
0
12,00
0
12,00
0
12,00
0
18,00
0
18,00
0
18,000 18,000 70,000 70,000 70,000
Two
Bedroo
m
18,00
0
18,00
0
18,00
0
18,00
0
24,00
0
24,00
0
24,000 100,00
0
100,00
0
100,00
0
100,00
0
Three
Bedroo
m
30,00
0
30,00
0
60,00
0
60,00
0
80,00
0
80,00
0
120,00
0
120,00
0
200,00
0
200,00
0
200,00
0
Source: Authors’ Field Survey, 2013
Figure 5: Rental values (N) trends in Tundun Wada Area of Abaji
Figure 5 shows the rental values of one and
two bedrooms in the Tundun Wada area of
Abaji was almost at par between the year
2003 and 2009. The difference in the rental
values of these residential properties at that
period was insignificant as can be seen from the figure 5. However, in 2010 there
was an unimaginable rise in the rental
value of two bedrooms residential
properties in the area which gained about
316 per cent increase in rent. Furthermore,
the three bedrooms in the area in 2011
attracted an increase in rental value of up to
67 per cent.
In Table 5, all the three residential property
types shows and steady increase in rental value. The data in the table 6 is graphically
illustrated below (Figure 6) to show clearly
the trend in the rental flow.
Similarly, the rental value trends in
Abbattior area of Abaji show a similar
pattern of rental growth in the year under review. In the Figure 6 above, the rental
values of one and two bedrooms in the
Abbattior area of Abaji was almost at par
between the year 2003 and 2009. The
difference in the rental values of these
residential properties at that period was
insignificant. On the other hand, in 2010
there was rental value growth of 316 per
cent for two bedrooms residential
properties in the area. Besides, the three
bedrooms residential property rental values in the area rise by 67 per cent in 2011.
Table 5: Average rental values (N) in Abbattior Area of Abaji
House
types
2003 2004 2005 2006 2007 2008 2009 2010 2011 2012 2013
One
Bedroo
m
12,00
0
12,00
0
12,00
0
12,00
0
18,00
0
18,00
0
18,000 18,000 70,000 70,000 70,000
Two
Bedroo
m
18,00
0
18,00
0
18,00
0
18,00
0
24,00
0
24,00
0
24,000 100,00
0
100,00
0
100,00
0
100,00
0
Three
Bedroo
m
30,00
0
30,00
0
60,00
0
60,00
0
80,00
0
80,00
0
120,00
0
120,00
0
200,00
0
200,00
0
200,00
0
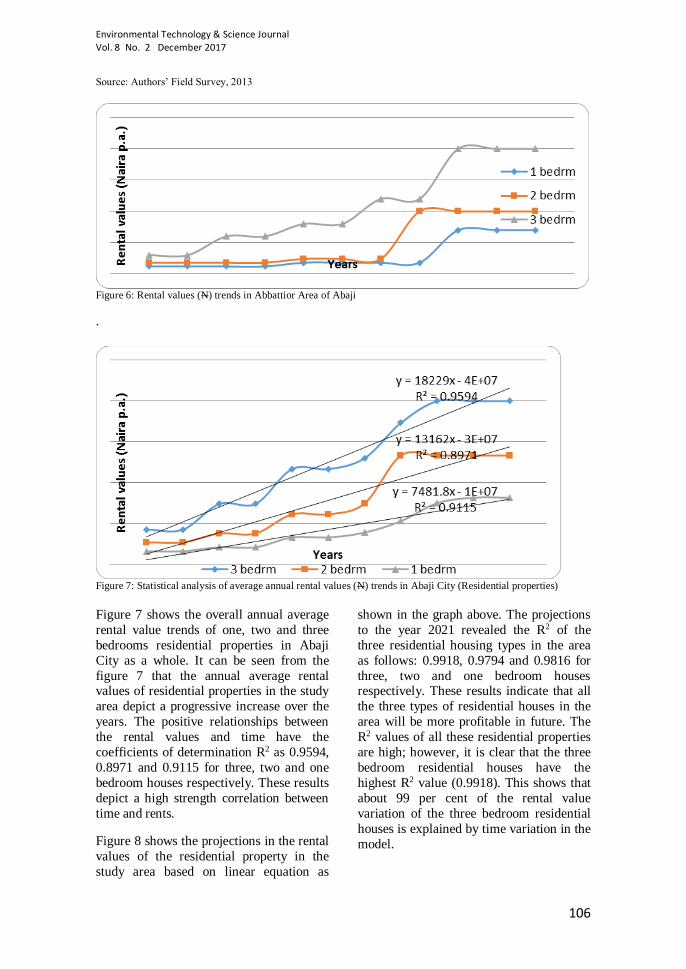
Environmental Technology & Science Journal Vol. 8 No. 2 December 2017
106
Source: Authors’ Field Survey, 2013
Figure 6: Rental values (N) trends in Abbattior Area of Abaji
.
Figure 7: Statistical analysis of average annual rental values (N) trends in Abaji City (Residential properties)
Figure 7 shows the overall annual average
rental value trends of one, two and three
bedrooms residential properties in Abaji
City as a whole. It can be seen from the
figure 7 that the annual average rental values of residential properties in the study
area depict a progressive increase over the
years. The positive relationships between
the rental values and time have the
coefficients of determination R2 as 0.9594,
0.8971 and 0.9115 for three, two and one
bedroom houses respectively. These results
depict a high strength correlation between
time and rents.
Figure 8 shows the projections in the rental
values of the residential property in the
study area based on linear equation as
shown in the graph above. The projections
to the year 2021 revealed the R2 of the
three residential housing types in the area
as follows: 0.9918, 0.9794 and 0.9816 for
three, two and one bedroom houses respectively. These results indicate that all
the three types of residential houses in the
area will be more profitable in future. The
R2 values of all these residential properties
are high; however, it is clear that the three
bedroom residential houses have the
highest R2 value (0.9918). This shows that
about 99 per cent of the rental value
variation of the three bedroom residential
houses is explained by time variation in the
model.


Environmental Technology & Science Journal Vol. 8 No. 2 December 2017
0
Figure 8: Statistical analysis of projected average annual rental values (N) trends in Abaji City (Residential
properties)
Analysis of population growth of
the study area According to the National Population
Census (NPC) conducted in Nigeria during the year 1981, 1991 and 2006, the
population of Abaji is as shown in Table 6.
However, National Bureau of Statistics
(2012) document revealed a projected
population of Abaji from the year 2006 to
2011 as shown with asterisk in Table 6.
The projected population growth of 2016
(Table 6) is based on the established
population census of 2006 and the
projected population of 2011 by National
Bureau of Statistics (2012). As such, the projections are a conservative estimate of
the increase in population between 2006
and 2011 (see Table 6 & 7).
Over the last decade (2006 - 2016), Abaji
has experienced population growth of 0.15
percent per annum. Focusing on the next 5
years, if the recent trends were to continue
based on the annual average growth rate of
projected population of 2011 to 2016
which stood at 0.09 percent per annum to 2021. Hence, the change in population
indicates 88,047 people will need to be
accommodated by the year 2021 (Table 7).
Furthermore, the projected population
figures are converted to an estimate of
required dwelling units using the
anticipated average number of residents per
household in Abuja which is 4.5 (NBS, 2012 p110). Therefore, on the
aforementioned scenario, the required
housing units for the population of 88,047
on the average basis of 4.5 numbers of
persons per household will result to 19,566
units of housing as other things are held
constant.
Conclusion This study has shown that, the rental value
of residential properties in Abaji City has
grown over the years, and the future
projected rental value of the residential
properties in the area revealed an
exponential growth rate. Although all the
three types of residential properties
examined in this study have very high R2
values which are practically and statistically significant, however, the 3-
bedroom residential houses have the
highest R2 value of (0.9918). Besides, the
projected housing need or requirement of
the City based on medium term (2016 -
2021) according to assumptions as
described in the analysis suggest that there
will be sufficient demand. Evidently, an
addition of about 3, 913 housing units are
required annually to cater for the ever
increasing population of the study area.
Hence, Abaji City in Abaji Area Council is a destination for potential real estate

Environmental Technology & Science Journal Vol. 8 No. 2 December 2017
108
investors and developers for optimal
investment returns. However, this study
recommends that the local planning
authority of the Abaji area council should
be more proactive about development
control so as to prevent sprawl formation in
the area. Furthermore, this study
recommends that demographic trend
should be given attention as this influence
cities growth.
Table 6: Trend in population growth of Abaji
Years 1981 1991 2006 2008 2009 2010 2011
Population 3,360 21,081 58,642 70,630* 77,513* 85,068* 93,359*
Sources: National Population Census (2006) & *Projected Population by NBS (2012) Table 7: Projected population growth, at an average growth rate of 0.097 percent p.a.
Years
2006
2011
2016
2021
Change in population 2016 to 2021
Population 58,642 93,359 148,655 236,702 88,047
References Adebisi, O. S., Ezeokoli, N. B., Oletubo, A.
A. and Alade, T. J., 2015. Rental
Analysis of Residential Properties in Close Proximity to the Federal
University of Technology, Akure,
Nigeria. Journal of Economics and
Sustainable Development, Vol.6,
No.10.
Adrian, S., 2012. Analysis of
Demographic Trends and Housing
Demand in Upper Hutt City. Business
and Economic Research Limited,
BERL House, wellington, New
Zealand Ajayi, C.A., 1998. Property investment
valuation and analysis. Ibadan: De
Ayo Publication, Bodija Ibadan.
Bello, V.A., 2012. Performance of Rental
Values of Residential Properties in
Selected areas in Akure, Nigeria
between 2001 and 2011.
Mediterranean Journal of Social
Sciences, 3(3), 531 – 536.
Chukwu, A.C., Aniagolu, C.O., and
Obodo, C.M., 2016. Trends in Rental
Values of Residential Properties in Enugu, Nigeria; A Comparative Study
between New Haven and Achara
Layouts. Journal of Multidisciplinary
Engineering Science and Technology
(JMEST) Vol. 3 Issue 2.
Fasakin, J.O. and Ogunmakin, O.T., 2006.
Some characteristic of Alienated
Land for Residential Development in
Akure, Nigeria (1999-2003) in Social
Sciences 1(1):72-76.
Hill, J.K. and Petersen, D.M., 1994.
‘Demographics and the Long-Term Outlook for Housing Investment’ in
Economic Review, First Quarter.
Mankiw, N.G., Weil, D.N., 1989. The baby
boom, the baby bust, and the housing
market. Regional science and urban
economics 19(2): 235-58
Mulder, C.H., 2006. Population and
housing: A two-sided relationship.
Demographic Research: Vol. 15,
Article 13. Published by the Max
Planck Institute for Demographic Research Konrad-Zuse Str. 1, D-
18057 Rostock GERMANY
NBS, 2012. Quarterly Statistical Report,
Abuja: National Bureau of Statistics
National Population Census, 2006.
National Population Commission
http://www.nigerianstat.gov.ng/pdfupl
oads/annual_abstract_2012.pdf.
(Accessed on 8th August 2016)
Ogunleye, B. M., 2015. Analysis of
Investment Performance of
Residential Property in Government Housing Estates in Akure, Nigeria.

Environmental Technology & Science Journal Vol. 8 No. 2 December 2017
108
Journal of Emerging Trends in
Economics and Management Sciences
(JETEMS) 6(3):193-201.
Reed, R., 2001. The significance of social
influences and Established Housing
Values, The Appraisal Journal, 69 (4), 56 – 61.
Runnels, J.A., 1989. Projecting Housing
Demand from Demographics. Real
Estate Issues, 14-20.
Udoekanem, N.B., Ighalo, J.I. and Nuhu,
M. B., 2014. Determinants of
Commercial Property Rental Growth in Minna, Nigeria. EUL Journal of
Social Sciences (V: I) LAÜ Sosyal
Bilimler Dergisi June 2014 Haziran
Attributes and Patterns of Mixed-Use
Buildings in Ikeja Model City Planned
Corridors Lagos, Nigeria
Shakirat Folashade Salami, Abubakar Danladi Isah,
Stella Nonyelum Zubairu
Department of Architecture, Federal University of Technology Minna, Nigeria [email protected]
Abstract Several developed countries are comprised of planned cities that support and sustain the
needs of their inhabitants. In the 21st century it is almost impossible to find a thriving city
without mixed-use developments or buildings. The concept of mixed-use has long been
incorporated into our building developmental practices spontaneously. However, planning
laws and developmental processes are now emerging to standardize the kinds of mixed-use
that are permissible within the built environment. It therefore suggests that mixed-use
buildings are indispensable in a metropolitan city due to increasing urbanity. Meanwhile
debates abound on what constitute mixed-use as generalization is difficult because localities
and socio-cultural dynamics affect the development of mixed-use structures. Mixed-use
buildings are notable because they are characterized with combining several functions, and it is also part of the compact city and new urbanism developmental strategy. Mixed-use
attributes promote strong relationships and opportunities between residents, and provides
varied job while supporting integration. In aligning with other megacities across the world,
and to deal with the haphazard development as well as conversion of uses in urban areas
prompted the development of Model City Plans (MCPs) for different areas in Lagos State,
Nigeria. The goal of this paper is to examine the attributes of mixed-use buildings in Ikeja
Model City Plan through focused observation in order to determine the emerging pattern of
mixed-use for the area and its implications. After eighteen mixed-use buildings were

Environmental Technology & Science Journal Vol. 8 No. 2 December 2017
109
purposely observed, the study concluded that a well-integrated mix of use is achievable in
corridors due to density. But the compliance with the maximum number of floors would take
a while due to the level of income of the inhabitants of the area. The study perceived the
need for attitudinal change in cultural lifestyle of continual property ownership without
means to sustain it, especially in city centers. Similarly, infrastructural developments are
also very imperative for the sustainability of mixed-use. Therefore, unless there are special platforms the government could use to ease implementation, the specified maximum heights
by the MCP for mixed-use corridors in Ikeja is yet to be achieved due to income level of
inhabitants of the area.
Keywords: Attribute, Ikeja, Mix-Use Building, Model City Plan, Patterns
Introduction According to United Nations Population
Fund, it is estimated that by 2030 about
61% of the world total population would
live in the cities (UNFPA, 2001). This
shows a continual growth in global
population of urban residents with a
resultant effect on the infrastructures and
physical development that will cater for the
upsurge. In view of this rise in population
of urban residents, the Sustainable
Development Goals (SDG) of the United Nations advocates for the creation of
sustainable cities and communities (Ban,
2014). In creating these sustainable cities,
built environment is a huge consumer of
resources such as land and energy; thus an
important entity that needs attention.
Furthermore, mixed-use buildings are
significant urban physical developments of
the built environment commonly practiced
that have thrived into the twentieth century
majorly at transit and intersection
(Artscape, 2013: Arizona, 2013). It re-emerged in 1960 and 70s as a tool for
urban revitalization (Rowley, 1996).
Mixed-use buildings are notable because
they accommodate multiple functions. The
most referenced classification of what
constitute mixed-use according to Gentin
(2009) and Wardner (2014) was
championed by Urban Land Institute (ULI)
that described mixed-use as a structure
where uses are integrated and pedestrian
oriented. Besides, according to Metropolitan Area Planning Council,
Boston mixed-use building that conforms
to the minimum development standard
promotes strong relationships between
residents, contributes access to health
living, varied job opportunities and
regional interaction which sustains the
society (MAPC, 2010). Hence in
investigating the attributes of mixed-use building, it is important to also analyze its
progress toward sustainability usually
credited to mixed-use.
However, the development of mixed-use
and high density houses in a lot of urban
centres is confronted with challenges due
to zoning laws (Kellett & Tipple, 2000).
Land use zoning is basically used to control
physical developments. Prior to the modern
zoning law and land-use policies, the most
prevalent method of zoning was Euclidean (Arizona, 2013). This practice clearly has
consequences and effect on the
development of mixed-use buildings
(Herndon, 2011). Because it zones land use
into residential, industrial and commercial
with each use having its own sub-
categorization. Meanwhile, Foster (2003)
and Herndon (2011) asserts that the
ensuing effect of such zoning is urban
sprawl, increase in commuting time,
pollution and traffic congestion. This therefore suggests the need for flexibility in
zoning laws where people’s participation is
highly essential (Otubu, 2012). Although
zoning is practiced generally in Nigeria in
accordance with the National Building
Code (NBC, 2006)., however in Lagos
State land use policies accommodate
mixed-land use practices as well.
Lagos State is the fastest growing urban
city in Nigeria with persistent rapid growth
in population (Adeleke et al, 2016). As a result of this there are continual demands
for basic infrastructure which necessitate
the development of Model City Plans

Environmental Technology & Science Journal Vol. 8 No. 2 December 2017
110
(MCPs) by the Ministry of Physical
Planning and Urban Development. These
plans are aimed towards creating a livable,
greenery and sustainable city. The plan
stipulates ordering of land-use, smart
development, compact city through high density development and mixed use
building in order to create functional
environment that reduces urban problems
(Isidore & Adedapo, 2014). The plan for
redevelopment of Lagos State has five
MCPs and three master plans. The MCPs
include Ikoyi-Victoria Island Model City
Plan, Ikeja Model city plan, Apapa Model
city plan, Lagos Island Model City Plan,
Mainland Central Model city plan and
Alimosho model city plan. While the three
master plans are; Badagry master plan, Lekki Penisula master plan and Ikorodu
master plan (Mainland Model City Plan,
2011-2033). Moreover, the Lagos State
Development Plan (2015-2025) which
specifies the provision of infrastructure and
basic services at every 15 minutes walking
distance (1000 meters) in settlement
habited by low income earners, indicates
embracement of mixed-use development
(Adeleke et al, 2016). In line with this,
Coupland (1997) opined that mixed-use is an approach towards providing functional
urban spaces at different levels of
development, and this has been part of
developmental pattern overtime (Herndon,
2011).
The MCPs in Lagos administrative
precincts include the Ikeja Model City
Plans. Ikeja was the political capital of
Nigeria before the relocation of the capital
to Abuja in 1986 due to reasons among
which is traffic congestion in Lagos State (Filan, 2012). Amazingly, Lagos State
which is the most populous state in Nigeria
has the smallest land area of about
385.9m2. Consequently, the Model City
Plan for Lagos tends towards verticality in
terms of building development and higher
density (Mainland Model City Plan, 2011-
2033. The Ikeja Model City Plan proposed
corridors for mixed-use building and High
Street due to haphazard development and
illegal conversion of building uses. These corridors are meant to legally control the
haphazardness in building development
with specification which varies in terms of
maximum building height, percentage of
mix, building density and setback. Thus,
this study seeks to investigate the attribute
and pattern of mixed-use building in Ikeja as well as their implication on the
corridors. This is necessary in order to
ascertain the attributes peculiar to Ikeja in
order to facilitate the necessary
development for sustainable mixed-use
building in Lagos, Nigeria.
The Renaissance of Mixed-use
development Scholars have often referred to Jacob
(1996) when discussing the renaissance of
mixed-use development (Grant, 2002,
Hoppenbrouwer & Louw, 2005; Rabianski
et al., 2009; Rowley, 1996). The study
opined that mixed-use is formed by a fine-
grained mix of uses; preferably two uses and should be pedestrian oriented.
Brundtland’s report according to Walker,
(1997) reawakened the concept of mixed-
use development because its principles are
in line with the new urbanism, Smart
Growth and the compact city concept, and
are all aimed towards improving the built
environment (Herndon, 2011). Universally
there is a lack of generally accepted
delineation of what constitutes mixed-use
development (Coupland, 1997; Grant, 2002; Hoppenbrouwer, 2005; Rabianski et
al., 2007). In line with this Rowley (1996)
asserts that mixed-use development cannot
be detached from cultural priorities and
lifestyle. Similarly, Dave (2010) re-
established Rapoport (1997) idea that
location and socio-cultural factors in
developing countries are factors that inhibit
the generalization of attributes of mixed-
housing, which are sometimes referred to
as mixed development or neighbourhood.
However, Angotti and Hanhardt (2001) opined that over time development of a
community has never exclusively been
single use or mixed-use. It thus suggests
that mixed-use building attributes might
vary depending on location and
inhabitants’ socio-cultural needs.
Salami, Isah & Zubairu l Attributes and Patterns of Mixed-Use Buildings in Ikeja Model City Planned Corridors Lagos, Nigeria
111
Classification and Conceptualization
of mixed-use Developments There are various classifications of what
constitute mixed-use. For instance, Urban
Land Institute (ULI) describes
development as mixed-use when mutually
supporting functions co-exist (Joost, 2008;
Herndon, 2011). Another classification was
done in 2006 by cross-sections of
associations’ bodies, in a study to identify
the major feature of mixed-use
development (Niemira, 2007). In sum, the
two studies describe mixed-use as a well-planned structure that maximize available
land with functions or uses that could be
well incorporated with one another, and
each use should be adequate and enough to
attract demand (Niemira, 2007). Despite
these, there are deliberations as to what
constitute mixed-use development, so also
its conceptualization but the most cited
concepts are (Rowley, 1996), and
(Hoppenbrouwer & Louw, 2005).
Therefore the variables used in this study were adapted from these two concepts.
Although the variables specifically address
mixed-use development or mixed-use
buildings at neighbourhood level, it was
adapted to look at mixed-use at building
level because MCPs in Lagos were based
on regeneration of an urban area, where
focus was on mixed-use building in
specified corridors. The parameters that
were operationalized to examine Ikeja
mixed-use corridors are grouped into
tripartite factors. Firstly are the physical attributes that include building dimension,
number of floors for vertical development,
accessibility and building location.
Secondly are the functional patterns with
variables that include nature of combined
functions, number of functions combined
in a building, arrangement of activities,
building texture /intensity of mix i.e. grain
and density. Thirdly are the property
market (demand), and public policy and
regulation. These factors are necessary because they are essential to the success of
any given mixed-use building.
The Ikeja Model City Plan
The emergence of Model city plans
(MCPs) in Lagos was largely informed by
the disorderliness in development and lack
of infrastructure to cope with the ever
increasing population in Lagos. The Ikeja
model city plan identified corridors for mixed-use buildings; these corridors are
largely along major transport routes. The
MCPs specified maximum height for the
corridors. Ikorodu road, Anthony-Oshodi
express way, Lagos-Ibadan Express way,
Mobolaji Bank Anthony Way, Obafemi
Awolowo Way and Kodesoh/Oba-Akran
Way are mixed-use corridors of maximum
height of fifteen floors; Lateef Jakande-
Ogba-Isheri Road, Kudirat Abiola Way
(Oregun road), Allen-Avenue/Opebi Road,
Opebi link, LASUTH to Oba Ogunjobi leading to fomer Kingsway stores,
Adekunle Fajuyi, Joel Ogunnaike and Isaac
John are mixed-use corridor of maximum
height of ten floors; while ACME Road,
WEMPCO and Billings Way, Toyin Street,
Ikosi road, Mobolaji Johnson Avenue,
Oregun link bridge/Osho and Olowu Street
are mixed-use corridors of maximum
height of six floors (Mainland Model City
Plan, 2011-2033). Ikeja is significant
because despite the movement of Nigeria’s Federal Capital, it is still thriving in
commercial and industrial activities
scattered all over the area. Ikeja still
accommodates the seat of government in
Lagos State therefore Ikeja is indispensable
when it comes to the development process
in Lagos State.
Methodology This study utilized case study strategies
(Yin, 2003) as it considers and focuses on
mixed use pattern and attributes as both a
phenomenon and relevant contemporary
issue due to its benefit of aiding the
understanding of ideas clearly
(Stake,2010). Thus the study area
comprises of mixed-use corridors within
Ikeja Model City Plan (MCPs) with limitation to corridors located within Ikeja.
The study espoused exploratory approach
and is part of an ongoing research on
sustainability in mixed-use building
development in Lagos, Nigeria. Although,
there are emphases on the development of

Environmental Technology & Science Journal Vol. 8 No. 2 December 2017
112
mixed-use corridors in Lagos State, it was
visibly not yet part of the mainstream
development strategy which makes sample
frame difficult to attain. However, utilizing
the case study research approach the study
extended consultation to stakeholders involved in urban development process in
Lagos State in addition to the review of
MCPs and follow up leads from experts.
Meanwhile, the variables adopted in
examining the phenomenon were
investigated using an observation checklist
developed from the concepts of (Rowley,
1996), and (Hoppenbrouwer & Louw,
2005). Subsequently, eighteen (18)
buildings that met the criteria of multiple
functions, vertical development and
situated along the mixed-use corridors were purposively selected and considered fit to
provide the required data. These buildings
are chosen as a representative sample of
identified mixed-use buildings in order to
target illustrative tendencies of the mix-use
patterns and attributes rather than
generalize the outcome. The selections
were made from the following mixed-use
corridors; Mobolaji Bank Anthony,
Kodesho / Oba- Akran, Ikorodu road,
Obafemi Awolowo way, and Allen-Avenue / Opebi road. Further still the selection was
done one after the other until saturation
was attained. Thereafter the data obtained
were analyzed using descriptive method by
means of content analysis. Results are
presented in figures as implicit findings
were deduced to project explicit mix-use
pattern in the study area guided by the
ideals of Miles et al., (2014) for generating
meaning and confirming findings.
Intuitively, recurring mixed-use patterns
and themes (attributes) emerged from the data through the consideration of options
enshrined in the factors as frequent
phenomena.
Results and Discussion
The Ikeja area of Lagos State is a developed urban setting with residents
comprising of moderately high and
medium income earners. Nevertheless,
the study discovered relatively high density in the area and continual
increase in population growth. After
subjecting the data derived from the
evaluation of the eleven (11) variables to descriptive statistics, the study
recorded the following significant
outcomes.
Physical Attributes Component Building Location
The location of mixed- use buildings
observed were a functions of specifications in Ikeja Model City Plan. Meanwhile, four
major urban neighborhood distributions
that include Central Business District
(CBD), Main city, Old city and Fringes
were identified. Figure 1a present the
summary of mixed-use building in these
quadrille locations. Twelve (12) of the
buildings observed were located in the
main city area while six (6) were in the
Central Business District (CBD). These
two areas are located within the urban
center which is the nucleus of the city, thus supporting continual change in terms of
demand. Therefore, this result indicates the
reason as to why corridors designated for
mixed-use building in Ikeja are neither in
the fringes nor in the old city.
Accessibility to buildings
Access road to majority of the buildings
studied are shared by different functions as summed up in Figure 1b, this perhaps is
because the idea of mixed-use building are
usually not conceived from the initial
design stage. Meanwhile mixed-use
building with shared premises has separate
access roads which tend to also reflect on
the provision of parking spaces. Yet there
are no distinguishing parking spaces for the
various functions, as only functions with
separate access have separate parking
spaces. The implication is manifests when the issue of shared parking spaces found
not to resonate well with the users.

Salami, Isah & Zubairu l Attributes and Patterns of Mixed-Use Buildings in Ikeja Model City Planned Corridors Lagos, Nigeria
1
a. b.
Figure 1: Location and Accessibility of Mixed-Use Buildings
Building Dimension
All the mixed-use buildings studied are
vertical in dimension as illustrated in
Figure 2a and was found to be common
across the neighborhoods. Lagos State is a
state of aquatic splendor with limited land
area compared to other states. The scarcity
of land in Ikeja for instance is responsible
for vertical building design practiced by
developers. Although among the mixed-use buildings studied, there are four that are in
shared premises, the building dimension in
such cases is a combination of shared
premises with verticality. Thus, the urban
nature of Ikeja suggests that the horizontal
dimension of mixed-use building
development is inappropriate for the area
as indicated by the outcome of observed
buildings that is recorded in Figure 2b.
Number of floors for vertical development
The Ikeja MCP specified fifteen (15), ten
(10) and six (6) floors for maximum height
of mixed-use building. In Figure 2c, the
result shows that four floors were common
while just three out of the eighteen
buildings studied had more than five floors.
This is due to the fact that mixed-use
building is not yet well accommodated into
the mainstream of building development in
the area. Additionally, the larger
percentage of the residents belong to the
low and middle income earners’ group that could not afford the cost of higher numbers
of floors as specified by the MCP. Thus,
this has an impact on the nature of mixed-
use building within the corridors and the
demand for the scarce spaces due to limited
number of floors which is definitely
resulting into high rental charges. Hence, it
implies that there is a need for increase in
the number of vertical floors as rightly
proposed by the MCP.
a. Typical Verical buildings

Salami, Isah & Zubairu l Attributes and Patterns of Mixed-Use Buildings in Ikeja Model City Planned Corridors Lagos, Nigeria
1
b. Corridor building dimension c. Number of Floors
Figure 2: Vertical building development along Ikeja MCP corridors.
Functional Patterns Combination of Functions in a Building The breakdown presented in Figure 3a
shows the types of functions commonly
combined in mixed-use buildings. In all the
nine different categories of functions
identified were observed to have been
combined. And all the categories do not
have more than four types of functions
housed in a building. This shows that the
users and residents of Ikeja could cope with
three to four functions combined in a
building. Administrative and Commercial category (combination) is more prominent
along the corridors, an indication that users
do not have problem with such
combination because they have similarities
in terms of their day to day operational
process. Residential, Administrative and
Commercial category (combination) is also
conspicuous in all the corridors studied
with Administrative and Commercial mix-
use having their peak period of services
during the day while the residential part
keeps the building functioning in the night when residents have retired after the day’s
activities. This has great impact on the
corridor giving the buildings 24 hours
operation duration. Therefore, in corridors
for mixed-use building in Ikeja and Oshodi
MCP, Administrative/Commercial and Residential/Commercial/Administrative
functions are combinations that require
consideration at the design stage.
Number of functions combined in a
building
All the building observed had one or more
functions combined which is an attribute of
mixed-use development. It was observed
that buildings with two functions combined
are most recurring as reported in Figure 3b.
This could possibly be linked to the upgraded building laws in the corridor
where building in those areas are
recommended for higher numbers of floors
and mix of use by the provision of the
MCPs. However, five functions were
observed as the highest number combined
in a building. Although such category is
very minimal, it indicates the possibilities
of having such combination in a well-
planned mix-use building.

Environmental Technology & Science Journal Vol. 8 No. 2 December 2017
1
a.
b.
Figure 3: Nature and distribution of functions in Mixed-use buildings. Density of functions nature
Density here implies the frequency of
occurrence of functions located within a
mixed-use building. It signifies the amount
of space or number of units of a function
contained within a building and is a measure of the intensity of functions
occurrence as shown in Figure 4a. The
purpose of this is to establish functions that
are more prominent and possibly
patronized based on high, medium and low
categories. Majority of the buildings
observed recorded the administrative
function towards a high density pattern;
this suggests that it is the most frequently
needed by the inhabitants. However the
aggregate numbers of medium and low density for commercial use are more than
that of administrative uses. This implies
that some factors are inhibiting frequency
of commercial uses. These factors might
include level of income of the resident and
high rental rate among others. Therefore,
administrative and commercial uses are
suggested functions that should be most
considered for developments in the area.
Arrangement of functions By arrangement commercial activities are
usually located on the ground floors and in
some cases first and second floors as
summarized in Figure 4b. This is because
ground floors in particular and lower floors
in general are more suitable for circulation
and movement of customers therefore more
peculiar to commercial activities.
Administrative activities tend to be more
formal, thus majority of the offices are
located at the higher floors. Although administrative offices like banks are also
on the ground floor, this is to ease access
for customers. Most of the residential
functions are located on higher floors
especially on the last floors. This is
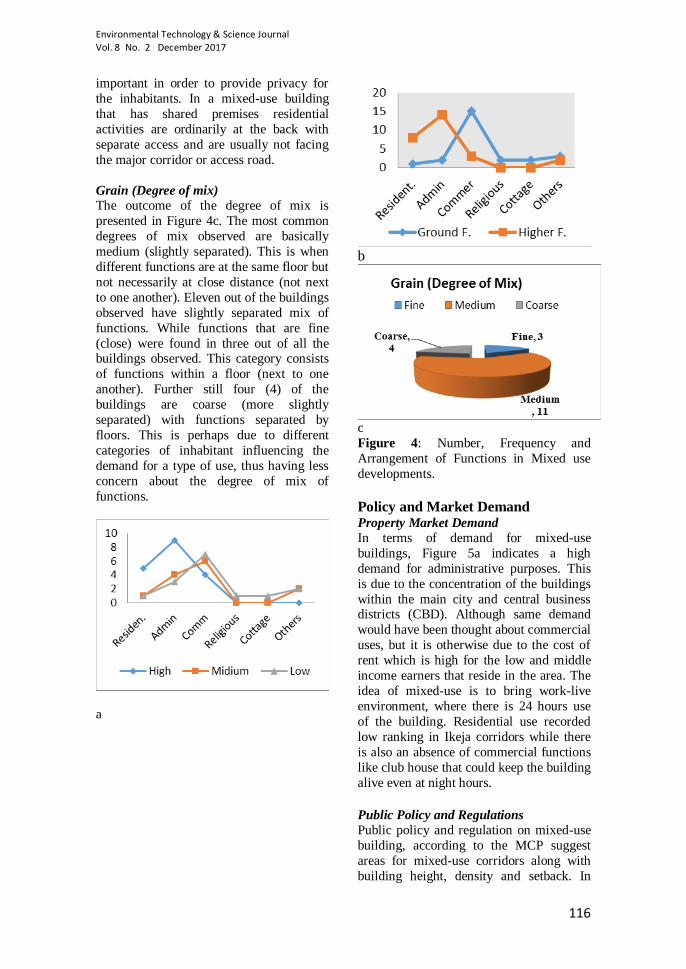
Environmental Technology & Science Journal Vol. 8 No. 2 December 2017
116
important in order to provide privacy for
the inhabitants. In a mixed-use building
that has shared premises residential
activities are ordinarily at the back with
separate access and are usually not facing
the major corridor or access road.
Grain (Degree of mix)
The outcome of the degree of mix is
presented in Figure 4c. The most common
degrees of mix observed are basically
medium (slightly separated). This is when
different functions are at the same floor but
not necessarily at close distance (not next
to one another). Eleven out of the buildings
observed have slightly separated mix of
functions. While functions that are fine
(close) were found in three out of all the buildings observed. This category consists
of functions within a floor (next to one
another). Further still four (4) of the
buildings are coarse (more slightly
separated) with functions separated by
floors. This is perhaps due to different
categories of inhabitant influencing the
demand for a type of use, thus having less
concern about the degree of mix of
functions.
a
b
c
Figure 4: Number, Frequency and
Arrangement of Functions in Mixed use
developments.
Policy and Market Demand Property Market Demand
In terms of demand for mixed-use
buildings, Figure 5a indicates a high
demand for administrative purposes. This
is due to the concentration of the buildings
within the main city and central business districts (CBD). Although same demand
would have been thought about commercial
uses, but it is otherwise due to the cost of
rent which is high for the low and middle
income earners that reside in the area. The
idea of mixed-use is to bring work-live
environment, where there is 24 hours use
of the building. Residential use recorded
low ranking in Ikeja corridors while there
is also an absence of commercial functions
like club house that could keep the building
alive even at night hours.
Public Policy and Regulations
Public policy and regulation on mixed-use
building, according to the MCP suggest
areas for mixed-use corridors along with
building height, density and setback. In

Salami, Isah & Zubairu l Attributes and Patterns of Mixed-Use Buildings in Ikeja Model City Planned Corridors Lagos, Nigeria
117
Figure 5b, it is noticeable that there is
mixed-use building outside the corridors
dedicated to it. Although, all the buildings
observed are in line with previously
approved setback. This will change when
the owner and developer start erecting mixed-use buildings according to the
maximum height specified by the MCP,
which varied from 6 floors, 10 floors to 15
floors depending on corridor. Density
would also definitely change as the height
increases.
Identifying Attributes and Patterns. The evaluation of the parameters provided an insight into the inherent findings where
inferences were deduced that subsequently
revealed the mixed-use attributes and
patterns practiced along Ikeja MCP
corridors. The outcome shows that
verticality of mixed-use building
dimension is a foremost practiced pattern
in Ikeja with isolated cases of shared
premises. This phenomenon is common in
cities particularly where land constrain is
common as the case of Lagos state,
Nigeria. In Ikeja Mixed-use buildings are commonly located in the main city and the
central business districts (CBD). The most
popular combinations found are
Administrative and Commercial functions
while a combination of Administrative,
Commercial and Residential functions are
likely patterns that may be valued in these
corridors as there exist mixed-use buildings
with such combinations. Meanwhile, the functions that are distributed horizontally
and vertically across the mixed-use
buildings are usually closely related with
compatibility of functions as a determinant
of the degree of mix. Most often
Commercial functions are at the lower
floors while Administrative and Residential
functions are sited on higher floors. In
shared premises provision for access and
parking are usually separated. The ordering
of the density of functions that coincides
with the demand is usually patterned- Administrative, Commercial, and
Residential in ranking. Existing regulations
advocates compliance and conformity with
MCPs’ building height, density and set
back as long term plan towards ensuring
sustainable development which requires
attitudinal change in property ownership. A
matrix of evolutional emergence of
attribute and patterns is presented in Table
1 and illustrated in Figure 6.
a. b.
Figure 5: Residents’ Demand and Policy Regulation on Functions.
Table 1: Explicit and Implicit outcome- Derivation of Attributes and Patterns
Parameters Explicit Findings Implicit Inferences Emerging Attribute/
Pattern
1. Building dimensions Relatively high density and scarcity of land.
Verticality & shared development is practiced.
Verticality (shared premises)
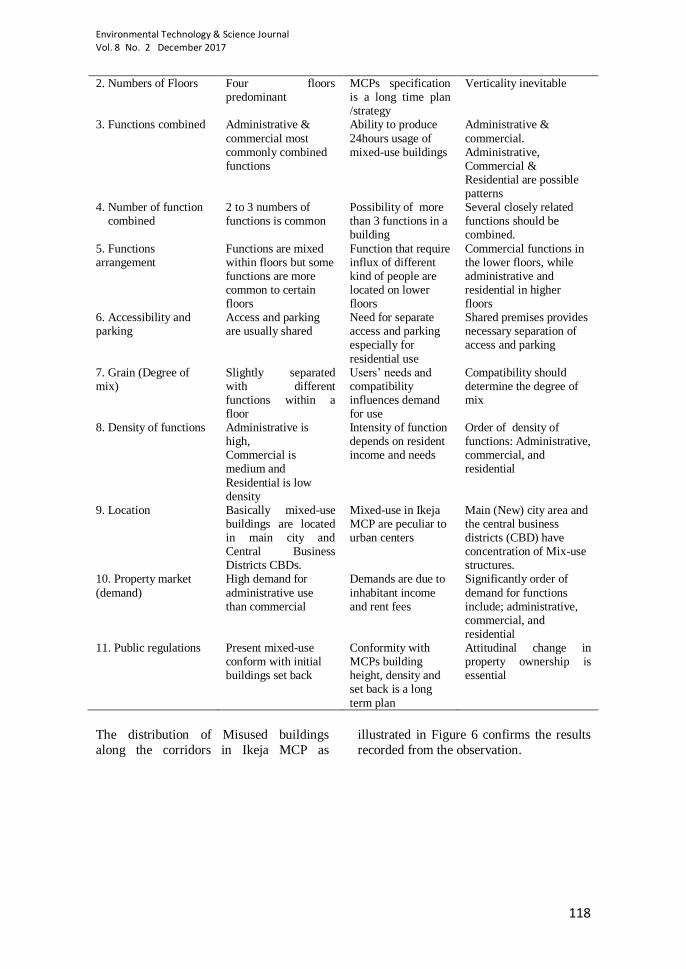
Environmental Technology & Science Journal Vol. 8 No. 2 December 2017
118
2. Numbers of Floors Four floors predominant
MCPs specification is a long time plan /strategy
Verticality inevitable
3. Functions combined Administrative &
commercial most commonly combined functions
Ability to produce
24hours usage of mixed-use buildings
Administrative &
commercial. Administrative, Commercial & Residential are possible patterns
4. Number of function combined
2 to 3 numbers of functions is common
Possibility of more than 3 functions in a building
Several closely related functions should be combined.
5. Functions arrangement
Functions are mixed within floors but some functions are more common to certain floors
Function that require influx of different kind of people are located on lower floors
Commercial functions in the lower floors, while administrative and residential in higher floors
6. Accessibility and parking
Access and parking are usually shared
Need for separate access and parking especially for
residential use
Shared premises provides necessary separation of access and parking
7. Grain (Degree of mix)
Slightly separated with different functions within a floor
Users’ needs and compatibility influences demand for use
Compatibility should determine the degree of mix
8. Density of functions Administrative is high, Commercial is medium and
Residential is low density
Intensity of function depends on resident income and needs
Order of density of functions: Administrative, commercial, and residential
9. Location Basically mixed-use buildings are located in main city and Central Business Districts CBDs.
Mixed-use in Ikeja MCP are peculiar to urban centers
Main (New) city area and the central business districts (CBD) have concentration of Mix-use structures.
10. Property market
(demand)
High demand for
administrative use than commercial
Demands are due to
inhabitant income and rent fees
Significantly order of
demand for functions include; administrative, commercial, and residential
11. Public regulations Present mixed-use conform with initial buildings set back
Conformity with MCPs building height, density and set back is a long
term plan
Attitudinal change in property ownership is essential
The distribution of Misused buildings
along the corridors in Ikeja MCP as
illustrated in Figure 6 confirms the results
recorded from the observation.
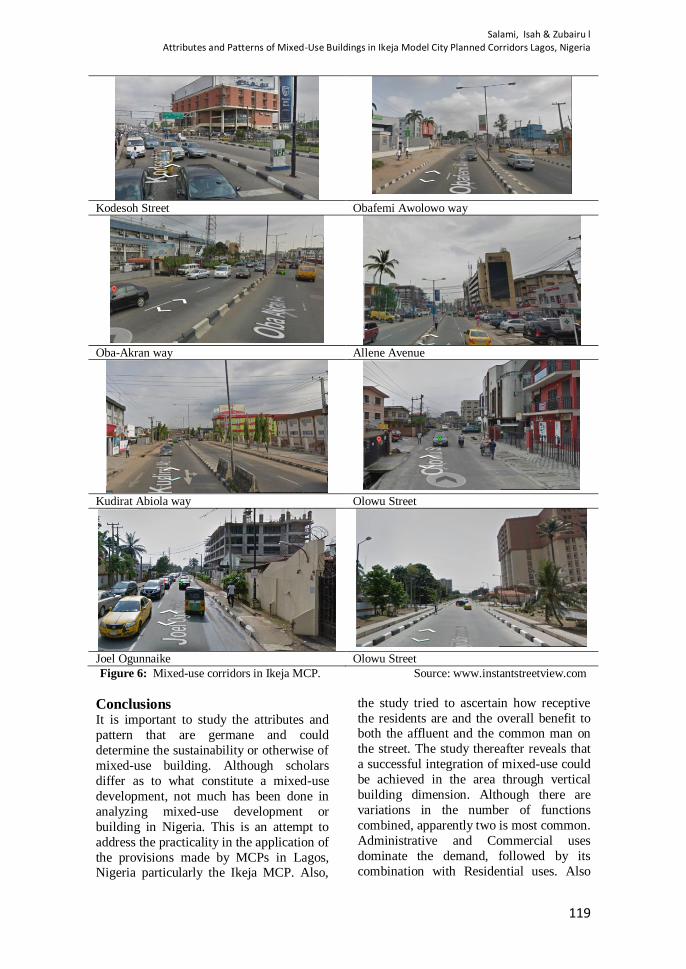
Salami, Isah & Zubairu l Attributes and Patterns of Mixed-Use Buildings in Ikeja Model City Planned Corridors Lagos, Nigeria
119
A. Kodesoh Street B. Obafemi Awolowo way
C. Oba-Akran way D. Allene Avenue
E. Kudirat Abiola way F. Olowu Street
G. Joel Ogunnaike H. Olowu Street
Figure 6: Mixed-use corridors in Ikeja MCP. Source: www.instantstreetview.com
Conclusions It is important to study the attributes and
pattern that are germane and could
determine the sustainability or otherwise of
mixed-use building. Although scholars
differ as to what constitute a mixed-use
development, not much has been done in
analyzing mixed-use development or
building in Nigeria. This is an attempt to
address the practicality in the application of
the provisions made by MCPs in Lagos, Nigeria particularly the Ikeja MCP. Also,
the study tried to ascertain how receptive
the residents are and the overall benefit to both the affluent and the common man on
the street. The study thereafter reveals that
a successful integration of mixed-use could
be achieved in the area through vertical
building dimension. Although there are
variations in the number of functions
combined, apparently two is most common.
Administrative and Commercial uses
dominate the demand, followed by its
combination with Residential uses. Also

Environmental Technology & Science Journal Vol. 8 No. 2 December 2017
120
for mixed-use in the area to be successful,
the general pattern desirable is mixed-use
with commercial and retail on lower floor
and residential on higher floors.
Nonetheless the sharing of access road in
majority of the corridors as practised now is not sustainable. To achieve sustainable
development access routes should be
separated, especially for residential users.
The grain of mixed-use building is medium
(slightly separated) because it is clearly
difficult to presume the kind of use within
and between floors. Administrative
function, followed by commercial and
residential perhaps should be the order of
function provision due to demand and the
fact that all the corridors are located within
the urban area, then other functions like eatery could also be incorporated, It is
concluded that a well-Integrated mix of use
is achievable in corridors due to density,
but the compliance with the maximum
number of floors would take a while due to
the level of income of the inhabitants of the
area.
References Angotti, T. & Hanhardt, E. (2001). Problems
and Prospects for Healthy Mixed-use Communities in New York City
Planning Practice and Research, 16, 145-154.
Arizona, (2013). Complete Neighborhoods for healthy, safe and affordable living,
unpublished course outline pup 544, spring semester Arizona state
university. Artscape DIY, Resources (2013). Approaches
to Creative Place Making. Retrieved
from www.artscapediy.org/ on 15th
September 2017 by 9.06pm. Ban, Ki Moon (2014). “The Road to Dignity
by 2030: Ending Poverty, Transforming All Lives and Protecting the Planet.”
Synthesis Report of the Secretary-General on the Post-2015 Agenda. New
York, United Nations. Available at www.un.org/disabilities/documents/rep
orts/SG_Synthesis_Report_Road_to_Dignity_by_2030.pdf (last accessed
December 24, 2014). Coupland, A. (Ed.). (1997). Reclaiming the
city: Mixed Use Development. London, Taylor and Francis.Dave, S. (2010).
High urban densities in developing
countries: A sustainable solution. Built environment, 36(1), 9-27.
Filani, M. O. (2012). The changing face of Lagos: From vision to reform and
transformation. Report funded by Foundation for Development and
Environmental Initiatives (Nigeria), and Cities Alliance.
Foster, N. (2003). Architecture and Sustainability, retrieved from
www.fosterandpartners.com/media/546486/essay13.pdf on 15th September,
2016. Gentin, M. (2009) All Mixed up - A Critical
Analysis of Mixed Use, Unpublished thesis submitted to UNSC Australia for
the award of Bachelor of Planning. Retrieved from https://www.be.unsw.
edu.au/sites/default/files/upload/pdf/schools.../5A3_28.pdf
Grant, J. (2002). Mixed Use in Theory and Practice: Canadian Experience with
Implementing a Planning Principle. Journal of the American Planning
Association 68(1), 71 – 84. Habitat, U. N. (2013). State of the World’s
Cities 2012/2013, Prosperity of cities Nairobi/ New York: Routledge.
Herndon J. D. (2011) Mixed-Use
Development in Theory and Practice: Learning from Atlanta’s Mixed
Experiences. Hoppenbrouwer, E. & Louw, E. (2005).
Mixed-Use Development: Theory and practice in Amsterdam's Eastern
Docklands, European Planning Studies. 13(7), 967-983.
Isidore E. & Adedapo O. (2014). Densification as Sustainable Urban
Policy: The Case of Ikoyi, Lagos, Nigeria. Proceedings of the CIB W107
International Conference, Lagos, Nigeria, 28th-30th January, 2014.
Jacobs, J. (1961). The Death and Life of Great American Cities, New York,
Random House. Kellett, P. & Tipple, A. G. (2000). The Home
as Workplace: A Study of income-generating activities within the
domestic setting. Environment and Urbanization, 12(1), 203-214.
Kofo A., Ebere A., Soji A., Aro I., Lookman O., & Tao S., (2016). Urban Planning
Process in Lagos: Policies, Laws, Planning instruments, strategies and

Salami, Isah & Zubairu l Attributes and Patterns of Mixed-Use Buildings in Ikeja Model City Planned Corridors Lagos, Nigeria
121
actors of urban projects, urban
development, and urban services in Africa’s largest city, Ed. Monika U. and
Heinrich B., Switzerland and Nigeria, Heinrich böll stiftung Nigeria and
Fabulous Urban. Landman, K. & Du Toit, J. (2014).
Residents’ perceptions of the importance of outdoor spaces and
neighborliness for medium-density Mixed-housing in South Africa. Town
and Regional Planning, 65, 23-34. Landman, K., Matsebe, G.& Mmonwa, M.
(2009). Assessing the Physical characteristics of medium density
Mixed-housing in South Africa Town and Regional Planning, 54, 15-26.
Miles, M. B., Huberman, A. M., & Saldana, J. (2014). Qualitative data analysis: A
method sourcebook. CA, US: Sage Publications.
MAPC, (2010). Mixed use zoning, A planners’ guide by Metropolitan Area
Planning Council Boston with support from the Minuteman advisory group on
inter local coordination and the commonwealth’s priority development
retrieved from http:www.mapc.org/sites/default/files/m
ixed-use.planners_Toolkit.pdf.
MPPUD, (2011a). Ikeja and Oshodi Model City Plan, 2011-2033. Ministry of
Physical Planning and Urban Development, Regional and Master
Plan Department, Lagos State Government.
MPPUD, (2011b). Mainland Model City Plan, 2011-2033: Ministry of Physical
Planning and Urban Development, Regional and Master Department,
Lagos State Government. NBC, (2006) National Building Code of
Federal Republic of Nigeria. Niemira, M. P. (2007). The Concept and
Drivers of Mixed-use Development: Insights from a Cross-organizational
membership survey, Research Review, 4(1), 53-56.
Otubu, A. K., (2012). Conceptualizing
Zoning within the Lagos Megacity Project: A Prognosis, Journal of
Environment and Earth Science, 2(10), 36-44.
Rabianski, J. & Clements, J. (2007). Mixed-Use Development: A Review of
Professional Literature. The National Association of Industrial and Office,
Properties Research Foundation. Rapoport, A. (2016). Human aspects of urban
form: towards a man—environment approach to urban form and Design,
Elsevier. Rapoport, A. Human Aspects of Urban Form.
Towards a Man-Environment Approach to Urban Form and Design. Pergamon
Press, Oxford, 1977 Rowley, A. (1996). Mixed-use Development:
ambiguous concept, simplistic analysis and wishful thinking. Planning Practice
and Research, 11(1), 85-98. Rowley, A., (1998). Planning Mixed use
development; issues and practice, Research report founded by Royal
Institute of Chartered Surveyors, UK. Stake, R. E. (2010). Qualitative Research:
Studying how things work, New York, The Gulford Press.
United Nations Population Fund. (2001). The
State of World Population 2001, United Nations: New York, retrieved from
http://www.unfpa.org/publications/state-world-population-2001.
Van Den Hoek, J. W. (2008). The MXI
(Mixed-use Index) as Tool for Urban Planning and Analysis. Corporations
and Cities: Envisioning Corporate Real Estate in the Urban Future, Brussels.
Wardner, P. A. M. E. L. A. (2014, May). Explaining mixed-use developments: A
critical realist’s perspective. In 20th Annual Pacific-Rim Real Estate Society
Conference (19-22 January 2014), Christchurch, New Zealand. Retrieved
(Vol. 27). Yin, R. (2003). Case Study Research Design
and Methods, London, Sage Publications.

Environmental Technology & Science Journal Vol. 8 No. 2 December 2017
122
Digital Mapping of Cholera in Parts of
Kaduna State, Nigeria
Bello Z.Y.1, A. Isah
2 and H. G. Dikko
1
1Department of Statistics, Ahmadu Bello University, Zaria 2Department of Statistics, Federal University of Technology, Minna
Abstract The focus of this paper is to analyze the spatial patterns and clusters of cholera epidemic in
five local government areas (LGAs) of Kaduna State. To achieve this goal, inventories were
obtained from Kaduna State Ministry of health on cholera epidemic. The K-function method
was used to determine the spatial heterogeneity of cholera epidemic. The identification of
clusters and mapping were achieved through the use of digitized and google earth image
2016. The result shows that four among the five local governments were clustered with the
exception of Kaduna North for which the disease pattern is random. Moreover, the result
revealed that the overall spatial pattern of cholera epidemic in the study area is clustered,
and the overall cholera disease risk was more concentrated in Igabi and Kaduna North LGA.
Key words: Spatial Pattern, Cholera, Digitized, K-function and Cluster.
Introduction Cholera is endemic in Nigeria (Falade &
Lawoyin, 1999). Nigeria reported an
outbreak of cholera in May 2013. Since then and up until October 2014, a total of
40,608 suspected cholera cases have been
reported. There have been 898 deaths,
giving a case fatality rate (CFR) of 1.95%.
The outbreak has experienced a strong
upsurge since early 2014, with more than
34,000 cases and 664 deaths reported from
January 2014 to October 2014. Suspected
cholera cases were recorded in 19 of the
country’s 36 states (51%). The states
affected include; Bauchi, Kaduna, Plateau, Kano, Borno, Adamawa, Katsina, Kebbi
and Zamfara States (WHO, 2013).
The threat of cholera rampaging through
Nigeria has been a concern. Recent global
health reports show a continual
vulnerability of large populations to
infectious diseases in relation to our
environment. Cholera is one of the
deadliest disease in Africa (WHO 1993),
within 2-3 hours of unset symptoms a
previously healthy person may severely become dehydrated and if not treated may
die within 24hours (WHO 2010). Cholera
is an epidemic and infectious disease which
is of global and public health significance,
hence the need of this research to recognize
and address it accordingly with the aid of
geospatial techniques.
Nigeria is a prime area to study spatial patterns associated with diseases because it
is a country where millions of people live
in close proximity not only to other people
but also to open and unsafe water sources.
It is also a country that is actively engaged
in alteration of its aquatic ecosystems, a
process often associated with changed
disease ecologies (WHO, 1993).
Spatial statistics is the process of extracting
or creating new information about a set of
geographic features to perform routine examination, assessment, evaluation,
analysis or modeling of data in a
geographic area based on pre-established
and computerized criteria and standards.
Spatial analysis is a technique for
analyzing spatial data mostly on human
scale. Complex issues arise in spatial
analysis, many of which are neither clearly
defined nor completely resolved. The most
fundamental of these is the problem of
defining the spatial location of the entities being studied (Scott & Getis, 2008).

Bello, Isah & Dikko Digital Mapping of Cholera in Parts of Kaduna State, Nigeria
123
Geographic Information System (GIS) and
epidemiological approaches are helpful
tools to control the disease spatially and
temporally. GIS is a computer system for
capturing, storing, querying, analyzing, and
displaying geospatial data (Chang, 2008). The general functions of GIS in health
studies are disease mapping and modeling,
spatio-temporal changes analysis and risk
assessment, public health care and hospital
management. GIS has the capabilities of
analyzing the spatial patterns, cluster and
distribution of disease and its influential
environments towards creating an
innovative cholera control plan in the
country. Spatial epidemiology is an
essential approach in understanding of
spatial disease risk transmission and pattern particularly, disease mapping and
descriptive analysis (Chin-Lai, 2009).
Several approaches have been used to
study the incidence of cholera. Notably
among them are (Osei & Duker 2008) who
used spatial regression models to explore
the spatial dependency of cholera
prevalence on an important local
environmental factor (open-space refuse
dumps) in kumasi, Ghana. Inhabitants with high density of refuse dumps were
observed to their cholera prevalence than
those with lower density of refuse dumps.
Ali et al, (2001,2002a, 2002b) utilized
logistics regression , simple and multiple
regression models to study the spatial
epidemiology of cholera in an endemic
area of Bangladesh. Akyala et al,(2014)
,investigated cholera outbreak in an urban
north central Nigerian community. They
employed descriptive statistics, active case search and un-matched case control study.
Diego et al,(2010) examined the spatial
clustering of cholera outbreaks using
Ripley’s K and L indices and bootstrapping
methods to evaluate the occurrence of the
clustering in the cases during outbreaks
using different temporal windows. The
spatial location of cases was also against
the spatial clustering.
Frank and Alfred (2008) conducted a research on spatial and demographic
patterns of cholera in Ashanti region –
Ghana. A GIS based spatial analysis and
statistical analysis were carried out to
determine clustering of cholera, and the
result showed that high cholera rates are
clustered around Kumasi metropolis.
This study present the application of K-
function method to determine the spatial
heterogeneity of cholera epidemic in parts
of Kaduna State by generating eminent spatial patterns in the data through spatial
maps, evaluate the degree of spatial
clusters of points and disease risks and
creating an inventive cholera control plan
by exploring spatial analysis toolset in
ArcGIS software for cholera mapping and
pattern analysis in the study area.
The Study Area The study area is Kaduna state and lies
between latitudes 10o20’0”N and
11o10’0”N of the equator and between
longitudes 7°10‘0”E and 8°0’0”E East of
Greenwich Meridian. The state shares
boundary with Zamfara, Katsina , kano in
the North, Bauchi, Plateau in the Eastern
part of the Nigeria and to the western part
lies Niger state. The state has a projected population of 7, 205,354 with twenty three
local government areas. Five Local
Government Areas with higher cholera
cases were chosen for this research namely;
Igabi, Kaduna North, Kaduna South,
Sabon-Gari and Zaria (see Figure 1). These
Areas were selected because based on the
data collected, they have re-occurrence of
cholera outbreak.
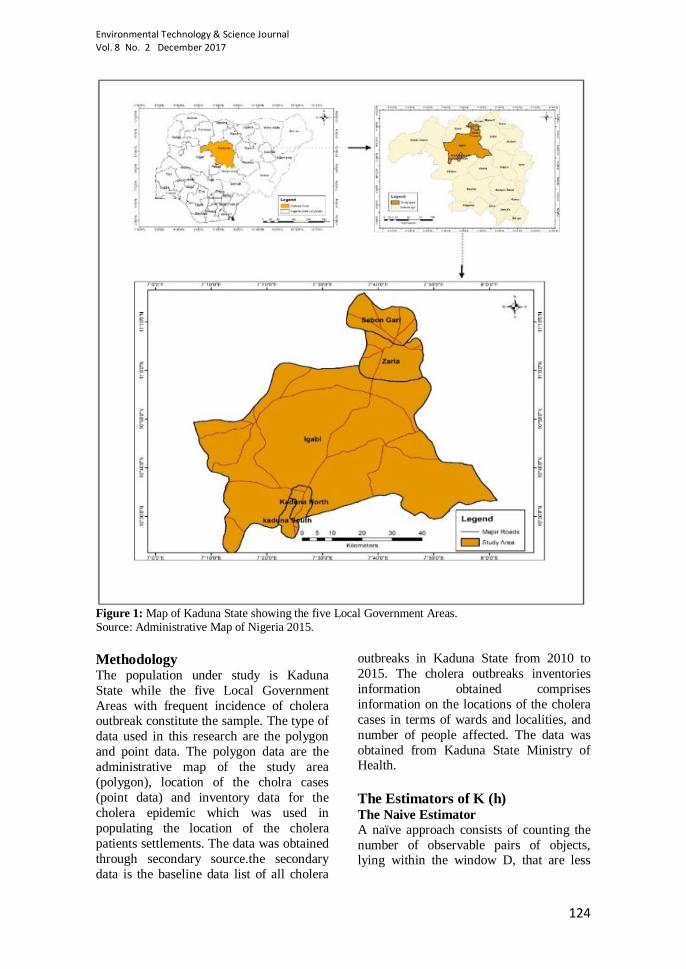
Environmental Technology & Science Journal Vol. 8 No. 2 December 2017
124
Figure 1: Map of Kaduna State showing the five Local Government Areas. Source: Administrative Map of Nigeria 2015.
Methodology The population under study is Kaduna
State while the five Local Government
Areas with frequent incidence of cholera outbreak constitute the sample. The type of
data used in this research are the polygon
and point data. The polygon data are the
administrative map of the study area
(polygon), location of the cholra cases
(point data) and inventory data for the
cholera epidemic which was used in
populating the location of the cholera
patients settlements. The data was obtained
through secondary source.the secondary
data is the baseline data list of all cholera
outbreaks in Kaduna State from 2010 to
2015. The cholera outbreaks inventories
information obtained comprises
information on the locations of the cholera
cases in terms of wards and localities, and
number of people affected. The data was
obtained from Kaduna State Ministry of Health.
The Estimators of K (h) The Naive Estimator
A naïve approach consists of counting the
number of observable pairs of objects, lying within the window D, that are less
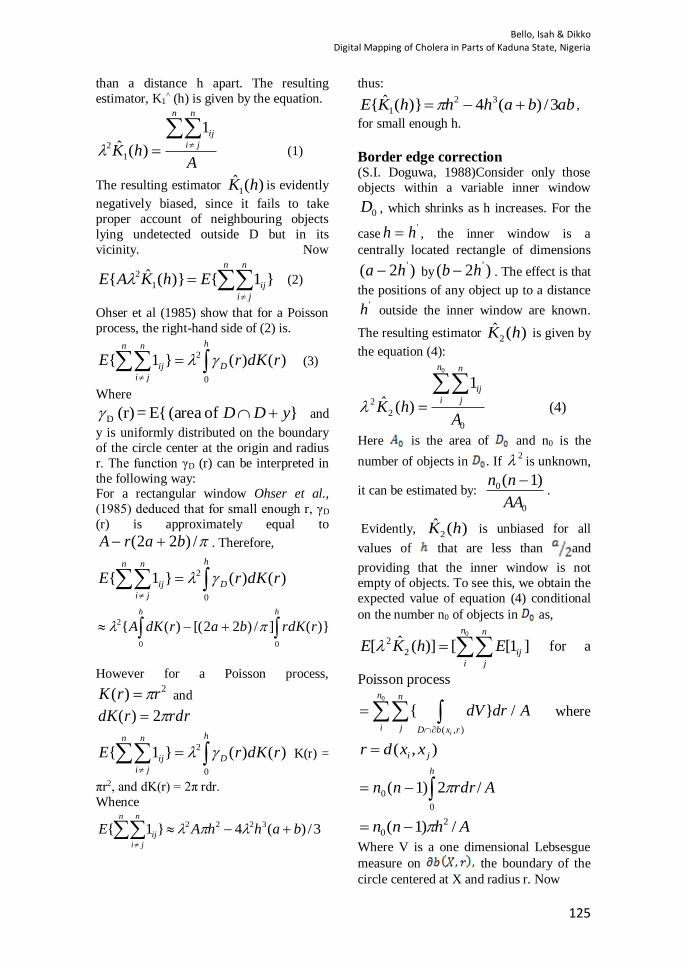
Bello, Isah & Dikko Digital Mapping of Cholera in Parts of Kaduna State, Nigeria
125
than a distance h apart. The resulting
estimator, K1^ (h) is given by the equation.
AhK
n n
ji
ij
1
)(ˆ1
2 (1)
The resulting estimator )(ˆ1 hK is evidently
negatively biased, since it fails to take
proper account of neighbouring objects
lying undetected outside D but in its
vicinity. Now
}1{)}(ˆ{ 1
2
n n
ji
ijEhKAE (2)
Ohser et al (1985) show that for a Poisson
process, the right-hand side of (2) is.
h
D
n n
ji
ij rdKrE0
2 )()(}1{ (3)
Where
} of(area E{= (r) D yDD and
y is uniformly distributed on the boundary
of the circle center at the origin and radius
r. The function γD (r) can be interpreted in
the following way: For a rectangular window Ohser et al.,
(1985) deduced that for small enough r, γD
(r) is approximately equal to
/)22( barA . Therefore,
h
D
n n
ji
ij rdKrE0
2 )()(}1{
h h
rrdKbardKA0 0
2 )}(]/)22[()({
However for a Poisson process, 2)( rrK and
rdrrdK 2)(
h
D
n n
ji
ij rdKrE0
2 )()(}1{ K(r) =
πr2, and dK(r) = 2π rdr.
Whence
3/)(4}1{ 3222 bahhAEn n
ji
ij
thus:
abbahhhKE 3/)(4)}(ˆ{ 32
1 ,
for small enough h.
Border edge correction (S.I. Doguwa, 1988)Consider only those
objects within a variable inner window
0D , which shrinks as h increases. For the
case'h h , the inner window is a
centrally located rectangle of dimensions
)2( 'ha by )2( 'hb . The effect is that
the positions of any object up to a distance 'h outside the inner window are known.
The resulting estimator )(ˆ2 hK is given by
the equation (4):
0
2
2
0
1
ˆ ( )
n n
ij
i jK h
A
(4)
Here is the area of and n0 is the
number of objects in . If 2 is unknown,
it can be estimated by:
0
0 )1(
AA
nn .
Evidently, )(ˆ2 hK is unbiased for all
values of that are less than and
providing that the inner window is not
empty of objects. To see this, we obtain the
expected value of equation (4) conditional
on the number n0 of objects in as,
0
2
2ˆ[ ( )] [ [1 ]
n n
ij
i j
E K h E for a
Poisson process
0
( , )
{ } /
i
n n
i j D b x r
dV dr A
where
),( ji xxdr
h
Ardrnn0
0 /2)1(
Ahnn /)1( 2
0
Where V is a one dimensional Lebsesgue
measure on the boundary of the
circle centered at X and radius r. Now
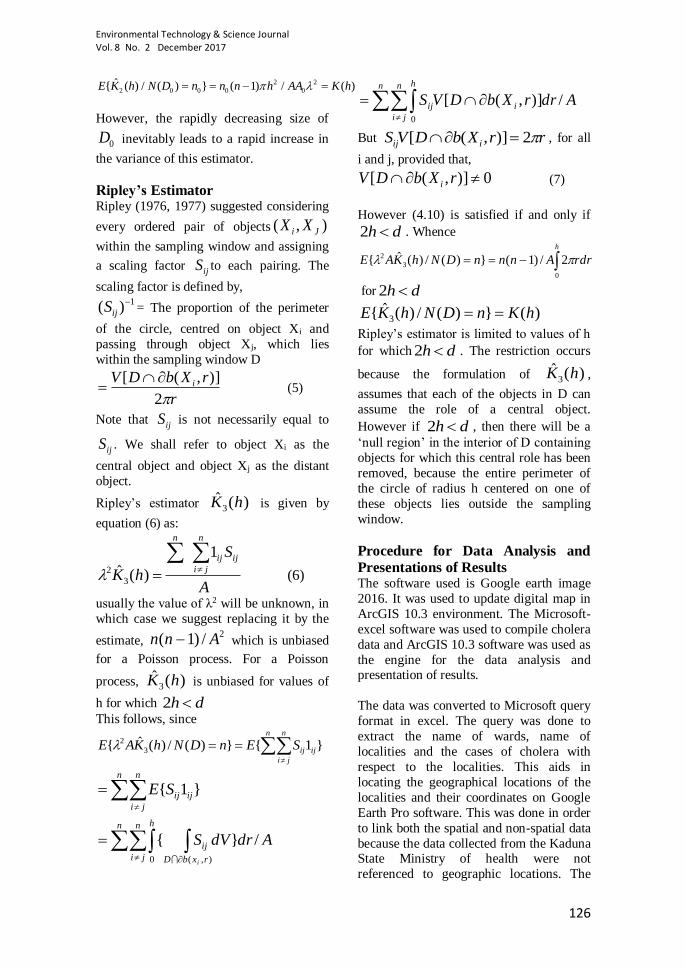
Environmental Technology & Science Journal Vol. 8 No. 2 December 2017
126
2 2
2 0 0 0 0ˆ{ ( ) / ( ) } ( 1) / ( )E K h N D n n n h AA K h
However, the rapidly decreasing size of
0D inevitably leads to a rapid increase in
the variance of this estimator.
Ripley’s Estimator Ripley (1976, 1977) suggested considering
every ordered pair of objects ),( Ji XX
within the sampling window and assigning
a scaling factor ijS to each pairing. The
scaling factor is defined by, 1)(
ijS = The proportion of the perimeter
of the circle, centred on object Xi and
passing through object Xj, which lies
within the sampling window D
r
rXbDV i
2
)],([ (5)
Note that ijS is not necessarily equal to
ijS . We shall refer to object Xi as the
central object and object Xj as the distant
object.
Ripley’s estimator )(ˆ3 hK is given by
equation (6) as:
A
S
hK
n
ji
ijij
n
1
)(ˆ3
2 (6)
usually the value of λ2 will be unknown, in
which case we suggest replacing it by the
estimate, 2/)1( Ann which is unbiased
for a Poisson process. For a Poisson
process, )(ˆ3 hK is unbiased for values of
h for which dh 2
This follows, since
}1{})(/)(ˆ{ 3
2
n n
ji
ijijSEnDNhKAE
}1{
n n
ji
ijijSE
n n
ji
h
rxbD
ij AdrdVS
i
/}{0 ),(
n n
ji
i
h
ij AdrrXbDVS /)],([0
But rrXbDVS iij 2)],([ , for all
i and j, provided that,
0)],([ rXbDV i (7)
However (4.10) is satisfied if and only if
dh 2 . Whence
h
rdrAnnnDNhKAE0
3
2 2/)1(})(/)(ˆ{
for dh 2
)(})(/)(ˆ{ 3 hKnDNhKE
Ripley’s estimator is limited to values of h
for which dh 2 . The restriction occurs
because the formulation of )(ˆ3 hK ,
assumes that each of the objects in D can
assume the role of a central object.
However if dh 2 , then there will be a
‘null region’ in the interior of D containing
objects for which this central role has been
removed, because the entire perimeter of
the circle of radius h centered on one of
these objects lies outside the sampling
window.
Procedure for Data Analysis and
Presentations of Results The software used is Google earth image
2016. It was used to update digital map in
ArcGIS 10.3 environment. The Microsoft-
excel software was used to compile cholera
data and ArcGIS 10.3 software was used as
the engine for the data analysis and presentation of results.
The data was converted to Microsoft query
format in excel. The query was done to
extract the name of wards, name of
localities and the cases of cholera with
respect to the localities. This aids in
locating the geographical locations of the
localities and their coordinates on Google
Earth Pro software. This was done in order
to link both the spatial and non-spatial data
because the data collected from the Kaduna State Ministry of health were not
referenced to geographic locations. The

Bello, Isah & Dikko Digital Mapping of Cholera in Parts of Kaduna State, Nigeria
127
data was then analyzed using the
ArcCatalog window which is an ArcGIS
software extension. The Spatial Analysis
tool and K-Function was used for the
spatial analysis of cholera epidemics. For
each of the analysis conducted, a report was generated and the output of the results
were presented in form of Figures, Maps
and ArcMap documents.
The analysis of data consist of calculation
the Euclidean distance between one point
and the other point, using the Ripley’s
estimator as an estimator of spatial pattern
of points.
Results and Discussion Spatial Distribution
Figure 2 shows the location of the five
selected local government areas that were
highly affected by the cholera epidemic
and the locations of the cholera cases in the
areas. The five local Government areas are
namely; Igabi, Kaduna North, Kaduna South, Sabon Gari and Zaria.
Figure 2 shows the total 187 locations with
cholera incidence between the years 2010
to 2015. Five local government areas were
highly affected with Igabi LGA having 53
locations affected by the cholera incidence, Kaduna North has 16 locations, while
Kaduna South has 28 locations, Sabon Gari
has 19 locations and with Zaria LGA
having 71 locations. On the reported cases
across the LGAs under study, 1363 cases
were reported in Igabi LGA, 378 and 447
cases were reported in Kaduna North and
South respectively, while 301 cases were
reported in Sabon Gari LGA and 217 cases
in Zaria LGA. The disease mapping
provides a rapid visual summary of
complex geographic information as supported by Goovaert and Jacquez (2004).
The results show the advantages of
advances in technology that allows
disease and spatial distribution of
disease mapping.
Figure 2: Location of the Cholera Epidemic in the Study Area

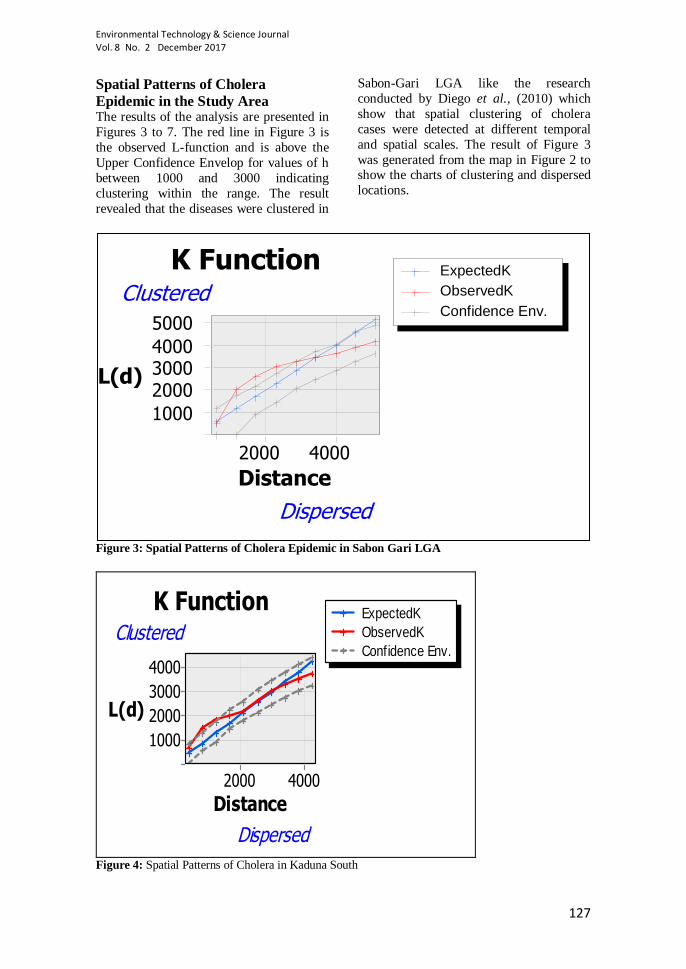
Environmental Technology & Science Journal Vol. 8 No. 2 December 2017
127
Spatial Patterns of Cholera
Epidemic in the Study Area The results of the analysis are presented in
Figures 3 to 7. The red line in Figure 3 is
the observed L-function and is above the
Upper Confidence Envelop for values of h
between 1000 and 3000 indicating
clustering within the range. The result
revealed that the diseases were clustered in
Sabon-Gari LGA like the research
conducted by Diego et al., (2010) which
show that spatial clustering of cholera
cases were detected at different temporal
and spatial scales. The result of Figure 3
was generated from the map in Figure 2 to show the charts of clustering and dispersed
locations.
Figure 3: Spatial Patterns of Cholera Epidemic in Sabon Gari LGA
ExpectedK
ObservedK
Confidence Env.
K FunctionClustered
Dispersed
Distance40002000
L(d)
4000
3000
2000
1000
Figure 4: Spatial Patterns of Cholera in Kaduna South
ExpectedK
ObservedK
Confidence Env.
K Function
Clustered
Dispersed
Distance
4000 2000
L(d)
5000
4000
3000
2000
1000

Environmental Technology & Science Journal Vol. 8 No. 2 December 2017
128
Also from Figure 4, the red line revealed
that the observed L(d) is above the
Confidence level for values of h between
800 to 1100 indicating clustered pattern of
spread of Cholera disease.
It was found from the result on Figure 5,
that the spatial pattern of cholera disease in
Kaduna North is random as shown from the
red line that the observed L(d) is roughly
within the Confidence Envelops. This
finding also contradicted the research
conducted by Diego et al., (2010) which
showed that spatial clustering of cholera
cases was detected at different temporal and spatial scales and cases relative to
water sources also exhibit spatial
clustering.
Figure 5: Spatial Patterns of Cholera in Kaduna North
ExpectedK
ObservedK
Confidence Env.
K FunctionClustered
Dispersed
Distance100005000
L(d)
15000
10000
5000
Figure 6: Spatial Patterns of Cholera in Zaria
The spatial pattern of cholera disease in
Zaria is clustered. As indicated in Figure 6,
the red line is constantly above the Upper
Confidence Envelop as in the research

Environmental Technology & Science Journal Vol. 8 No. 2 December 2017
130
finding of Ruiz-Moreno et al (2007) which
observed that clustering of cholera in
Bangladesh occur at different spatial
scales. This result confirmed the outbreak
reported in Zaria in the Kaduna state with
192 cases recorded in two weeks as at 2015 United nations children’s fund (UNICEF,
2015). However, according to WHO (2013)
the cholera outbreaks are attributed to the
fact that Cholera is most likely to be found
and spread in places with inadequate water
treatment, poor sanitation, and inadequate
hygiene.
Moreover, the observed red line in Figure 7
is above the Upper Confidence Envelop for
values of h between 0 and 7000 indicating
clustering pattern of cholera spatial distribution in Igabi LGA. The situation in
Igabi LGA was as a result of
socioeconomic and demographic factors
because most of the people living in that
area are farmers and fishermen and it has
been reported (Ali et al 2002a, 2002b;
Borroto and Martinez-Piedra 2000; Sasaki
et al 2008) that socioeconomic and
demographic factors significantly enhance
the vulnerability of a population to infection and contribute to epidemic spread
of cholera.
Degree of Spatial Clustering of
Points and Disease Risks The result for the degree of spatial cluster
of Cholera locations and disease risks are
presented in Figures 8 to 11. The point
density was used to calculate a magnitude
per unit area from point features that fall
within a neighborhood around each cell in
the study area. In evaluating the degree of
spatial cluster, only the points that fall
within the neighborhood were considered
in calculating the density.
Figure 7: Spatial Patterns of Cholera in Igabi LGA
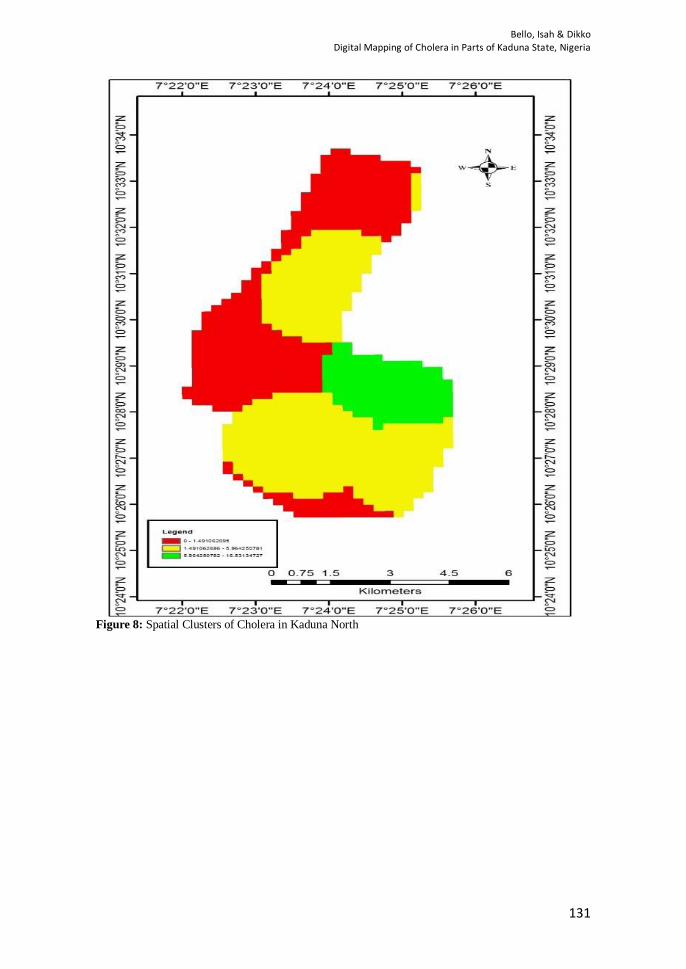
Bello, Isah & Dikko Digital Mapping of Cholera in Parts of Kaduna State, Nigeria
131
Figure 8: Spatial Clusters of Cholera in Kaduna North

Environmental Technology & Science Journal Vol. 8 No. 2 December 2017
132
Figure 9: Spatial Clusters of Cholera in Kaduna South
From Figure 8, the result show that the yellow color constitute higher cluster
which ranges from 5 to 15, red moderate
cluster (0 to 5) and green (15 to 25) with
lowest spatial cluster respectively. The
spatial cluster in Kaduna North LGA
ranges from high to low cluster. From
Figure 9, the result shows that the yellow color constitute higher cluster which ranges
from 1.4 to 5.9, red indicates moderate
cluster (0.1 to 1.4) and green (5 to 16)
indicates low spatial cluster. This shows
that Spatial Cluster in Kaduna South LGA
ranges from high to low cluster
.

Bello, Isah & Dikko Digital Mapping of Cholera in Parts of Kaduna State, Nigeria
133
Figure 10: Spatial Clusters of Cholera in Igabi

Environmental Technology & Science Journal Vol. 8 No. 2 December 2017
134
Figure 11: Spatial Clusters of Cholera in Sabongari and Zaria
From Figure 10, the result show that the
green color constitute higher cluster which
ranges from 0 to 10, followed by yellow
(10 to 20) and red indicates moderate
cluster (20 to 31) with low spatial cluster. The result shows that spatial clusters in
Igabi LGA has low cluster. From Figure
11, the result shows that the green color
constitute higher cluster which ranges from
0 to 10 with low spatial cluster. Sabon-gari
and Zaria LGAs has low cluster.
It was generally found that the degree of
cholera spatial cluster is Highest in Igabi, followed by Kaduna North, and Kaduna
South and low in Sabon Gari and Zaria
LGAs.

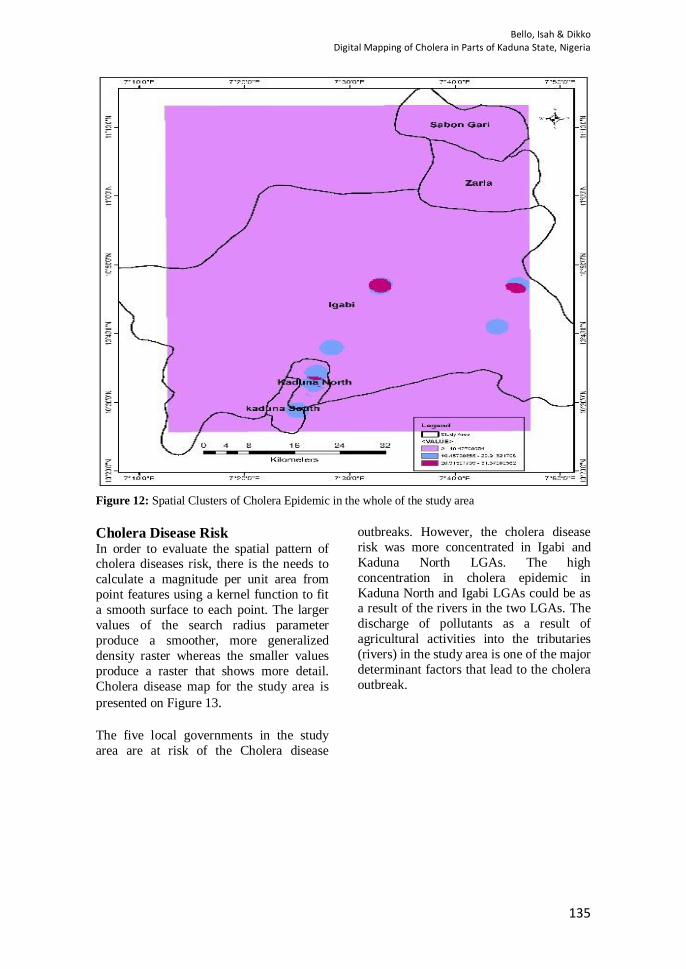
Bello, Isah & Dikko Digital Mapping of Cholera in Parts of Kaduna State, Nigeria
135
Figure 12: Spatial Clusters of Cholera Epidemic in the whole of the study area
Cholera Disease Risk In order to evaluate the spatial pattern of cholera diseases risk, there is the needs to
calculate a magnitude per unit area from
point features using a kernel function to fit
a smooth surface to each point. The larger
values of the search radius parameter
produce a smoother, more generalized
density raster whereas the smaller values
produce a raster that shows more detail.
Cholera disease map for the study area is
presented on Figure 13. The five local governments in the study
area are at risk of the Cholera disease
outbreaks. However, the cholera disease
risk was more concentrated in Igabi and
Kaduna North LGAs. The high
concentration in cholera epidemic in
Kaduna North and Igabi LGAs could be as a result of the rivers in the two LGAs. The
discharge of pollutants as a result of
agricultural activities into the tributaries
(rivers) in the study area is one of the major
determinant factors that lead to the cholera
outbreak.

Environmental Technology & Science Journal Vol. 8 No. 2 December 2017
136
Figure 13: Cholera Disease Risk in the whole of the study area
Inventive Cholera Control Plan Figures 8 to 11, has revealed that Igabi,
Kaduna North and Kaduna South LGAs
should be given priority for cholera control
measures. The areas that are vulnerable to
the disease risk are shown in Figures 12 to
16 and should be used as a decision making guide for cholera control plans in the study
area especially. Finally, the GIS interface is
an inventive cholera control decision
making tool because the integration of GIS
and epidemiological approaches are helpful
tools to control the disease spatially and
temporally as pointed out by Chang (2008).
As such the outcome of this research serve
as an innovative cholera control plan in
five local government areas of Kaduna
State as supported by Chin-Lai (2009). These intervention includes;
1. Case Management,
2. Surveillance of the outbreak
including laboratory analysis and data
management,
3. The WASH activities such as
hygiene promotion, safe burial, household
disinfection, water treatment etc
4. Community mobilization,
5. Possible oral- cholera vaccine
(OCV) campaigns.
Conclusion The study reveals that GIS is a useful tool
to epidemiologists to visualize, manage,
and analyze large volumes of data. It can help to better define populations exposures
with perhaps better specificity. The results
shows the advantages of advances in
technology that allows not only disease
mapping but also the application of spatial
statistical methods such as cluster analysis.
The study determined the presence and
extent of clustering in the study area. The
spatial pattern of cholera mirror the spatial
pattern of the population at risk. The
association between population density and environmental exposure was established.
Recommendation It is recommended that surveillance should
be intensified in Igabi and Kaduna North
LGAs that has high incidence of cholera
epidemic most especially during wet seasons. A further study can be carried out
on the effects of socioeconomic and

Bello, Isah & Dikko Digital Mapping of Cholera in Parts of Kaduna State, Nigeria
137
environmental factors on the pattern and
risks of cholera.
References
Ali, M., Emch, M. & Sack, R. (2002);
identifying environmental risk factor for epidemic cholera; a raster GIS-
apporoach. Health place ,(8), 201-
210.
Ali M., Emch, M., Donnay J. P, Yunus M.
and Sack R. B. (2002): Identifying
environmental risk factors for
endemic cholera: a raster GIS
approach. Health Place 8, 201–210.
Borroto and Martinez, P. (1996);
Geographical pattern of cholera in
Mexico (1991-1996); international
Journal for epidemiology 29(4)764-2000.
Chang, K. T. (2008). Introduction to
Geographic Information Systems
(New York: The MaGraw Hill
Companies, Inc). p. 1-418.
Chin-Lai P, Mun-So, F. & Wing, C.
(2009). Spatial Epidemiological
Approaches in Disease Mapping and
Analysis (USA:CRC Press). P.35-49
Dickson, S. N., Julius, A., Peter, N. F.,
Elvis, A. T., Charlotte, W. A. & Odette, D. K.(2015). Assessing the
risk factors of cholera epidemic in the
Buea Health District of Cameroon.
BMC Public Health (2015) 15:1128.
Diego, R., Mercedes, P., Michael, E. &
Mohammad, Y. (2010). Spatial
clustering in the spatio-temporal
dynamics of endemic cholera.
BioMed Central Infectious Diseases,
International Journal of Health
Geographics, 10:51.
Falade & Lawoyin, W. (1999). The uses of spatial analysis in medical geography:
a review. Soc Sci Med 1986;23:963-
73.
Frank, B. O. & Alfred, A. D. (2008).
Spatial and demographic patterns of
Cholera in Ashanti region –Ghana.
BioMed Central. International
Journal of Health Geographics, 7:44.
Google Earth Image (2016).
Luque, F. M. A., Schomaker, M., &
Mason, P.R. (2012). Elevation and cholera: an epidemiological spatial
analysis of the cholera epidemic in
Harare Zimbabwe. BMC Health, 12:
442.doi:10.1186/1471-2458-12-442.
National Population Commission. (2006).
Population and Housing Census:
Class Size of Household. Abuja, Nigeria.
Ohser, J. & Stoyan, D. and Ripley, B.D.
(1981 - 1985). On the efficiency of
edge correction for spatial point
processes. Biometrical Journal 23,
522-533.
Osei, F. B. & Duker, A. (2010). Spatial
dependency of cholera prevalence on
potential reservoir in an urban area,
Kumasi Ghana; international of
applied earth observation and geo
information. Ripley B.D. (1976). The second order
analysis of stationary point process.
Journal of applied probability, 13,
255-266.
Ripley B.D. (1977). Modelling spatial
patterns (with discussion). Journal of
the Royal statistical Society B 29,
172-212.
Ripley, B.D. & Kelly, F.P. (1977). Markov
Point processes. Journal of the
London Mathematical Society 15, 188-192
Riyan K. J. (2004). MedSical Biology.
Mcgraw Hil 2004
Ruiz-Moreno D., Pascual M., Emch, M. &
Yunus, M. (2010): Spatial clustering
in the spatio-temporal dynamics of
endemic cholera. BMC Infect Dis
2010,10:51.
Scott L, Getis A. (2008) Spatial statistics.
In Kemp K (ed) Encyclopedia of
geographic information. Sage,
Thousand Oaks, CA. S.I. Doguwa (1988): Statistical Analysis of
Mapped Point Patterns, http:
Kubanni.abu.edu.ng
UNICEF (2015). Cholera outbreak in the
West and Central Africa: Regional
Update, 2015 - WEEK 37.
http://reliefweb.int/report/nigeria/chol
era-outbreak-west-and-central-africa-
regional-update-2015-week-37-enfr.
Generated on 11 November, 2016.
Utsalo S.J, Eko F.O, Antia-Obong O.E, (1991). Cholera and Vibrio

Environmental Technology & Science Journal Vol. 8 No. 2 December 2017
138
parahaemolyticus diarrhoea
endemicity in Calabar, Nigeria. W.
Afr. J. Med., 10(2): 175-80.
WHO,(1993): Guidelines for cholera
control. World Health Organisation,
Geneva. http:/www./helid.desastres.net/en/d/jw
ho.90e/. last accessed 5 November,
2010
WHO, (2010): Outbreak news. Cholera,
Haiti - update. Wkly Epidemiol Rec
2010,85:489–490.
WHO,(2013).
http://www.who.int/csr/don/archive/
disease/cholera/en/. Generated on 11
November, 2016.
Xueying, W. and Jin, W. (2014). Analysis
of cholera epidemics with bacterial growth and spatial movement.
Journal of Biological Dynamics,
2015, 9; 233–261.

Bello, Isah & Dikko Digital Mapping of Cholera in Parts of Kaduna State, Nigeria
139
Construction Worker’s Perceptions of the
Effectiveness of Health and Safety Training
Practices of Construction Firms in Abuja,
Nigeria
I.U. Shehu, Y.M. Ibrahim & M. Abdulrazaq
Department of Building, Faculty of Environmental Sciences, Federal University Birnin-Kebbi, Kebbi-State.
Abstract The effectiveness of safety training practices is an important part of safety management on a
construction site. Construction workers’ ability to identify and assess risks and hazards is
acquired through training and experience and is among the key factors that determine their
behaviour and thus their safety. Yet researchers have questioned the effectiveness of health
and safety training practices in construction. This research explored construction workers’ perceptions of the effectiveness of safety training practices of construction firms based on
two objective outcomes namely: reaction on safety training design and delivery; and
learning in safety training. The study involved the conduct of a survey using self-
administered questionnaires with both closed and open-ended questions to obtain data. The
self-administered questionnaire was presented to 150 medium and large construction firms
which were purposively sampled from 245 construction firms registered with Corporate
Affairs Commission (CAC). Descriptive statistics specifically, frequency tables, mean and
standard deviation were used to gain an overview of the effectiveness of safety training
practices of construction firms, while independent sample t-test was used to test for
significance in the difference between mean scores of respondents. The results of the study
revealed that construction workers in civil engineering firms are more satisfied with their firm’s safety training practices than their counterparts in building construction firms in terms
of safety training design and delivery components that corresponds to workers’ safety needs;
and learning strategies that aid worker learning of safety knowledge, skills and attitudes in
safety training. It was therefore recommended that construction firms and practicing
professionals should pay special attention to the key components of safety training design
and delivery that yield better safety outcomes in terms learning of safety knowledge, skills,
and attitudes by workers. The contribution of this study is that it reports the views of
construction workers about the effectiveness of health and safety training practices of
construction firms in developing countries.
Keywords: Construction safety, Safety training, Safety management, Training method, Training delivery, Training reaction, Worker learning.
Introduction Every year, more than 60,000 fatalities are
reported from construction projects around
the world (Lingard 2013). In the United
States, the Bureau of Labor Statistics
reported 908 fatal injuries and more than
200,000 nonfatal injuries in 2014 (BLS, 2015). Despite significant advances in
safety management research and practice,
unacceptable injury rates in construction
continue to be a worldwide pattern. Apart
from emotional and physical distress, the
annual cost of these injuries exceed 48
billion dollars in terms of litigations in the
United States (Ahmed, Azhar & Forbes,
2006) and adversely impact profit margins

Environmental Technology & Science Journal Vol. 8 No. 2 December 2017
140
and project success (Zou & Sunindijo,
2015).
Given the high proportion of fatal and non-
fatal accidents occurring in the construction
industry, construction companies constantly seek different and novel
strategies to reduce the number of work-
related accidents. The construction safety
literature shows that researchers mostly
focus on safety performance on
construction sites and on ways to minimize
the number and severity of accidents.
Among others, human factors have
received much recent attention. For
example, Hinze (2006) and Haslam et al.
(2005) found that more than 70% of
construction injuries involve unsafe worker actions. Tixier et al. (2014) explain that
such unsafe worker actions are not
deliberate safety violations; but are rather
outcomes resulting from poor hazard
recognition and safety risk perception. In
another study, Huang and Hinze (2003)
investigated construction worker falls and
found that falls represent a high proportion
of construction accidents that result in
fatalities. Esmaeil et al. (2012) developed a
framework to investigate the effectiveness of fall protection systems in roofing
projects.
As evidenced by these few examples and
many others, in general, the literature
highlights the importance of the
development of effective strategies in
preventing work accidents in the
construction industry. One such strategy
that is mentioned often in the literature is
formal, well organized and effective safety
training. Effective safety training may lower accident rates, but there are several
challenges associated with safety training
that need to be overcome by construction
firms. Among these challenges is the extent
to which workers' learning experiences are
affected in safety training sessions and the
extent to which workers learn safe
practices in training sessions. Furthermore,
the prevalent use of ineffective,
unengaging, and poorly designed training
programmes is a major factor that significantly impede training efforts. In
fact, Li et al. (2012) argue that a positive
correlation does not exist between
traditional safety training and safety
performance. Not surprisingly, workers
lack essential safety knowledge despite
having received substantial safety training (Haslam et al., 2005).
For effective training, employers must
adopt training practices that will yield
maximum benefits. However, there is a
dearth of research in construction that
explores perceptions of construction
workers about the effectiveness of safety
training practices of construction firms in
terms of design and delivery and about
worker learning in safety training. The aim
of this study is to explore safety training
practices of construction firms based on the perceptions of construction workers on two
(2) objective outcomes of safety training
namely: reaction of workmen on safety
training design and delivery; and worker
learning in safety training.
Construction Safety Training Safety training is one of the most widely
adopted interventions to improve
workplace safety. Each year, organizations
invest millions of dollars to train their
workforce on safety issues including
hazards recognition, hazard management,
and safe work practices. For example,
safety training is provided to promote the
proper use of personal protective
equipment (PPE) and to encourage the
implementation of effective injury prevention strategies. Not surprisingly,
hundreds of research articles emphasize the
importance of safety training, and many
others have established causal relationships
between safety training and safety
performance (Cohen et al. 1998;
Lingard2002; Ruttenberg, 2013).
In view of these potential benefits, safety
regulations require that employers provide
their workers with safety and hazard recognition training (Occupational Safety
and Health Administration, 2010). Despite
these efforts, however, research has
revealed that workers still lack essential
safety skill and knowledge. In fact,
examination of accident reports has
Shehu, Ibrahim & Abdulrazaq Construction Worker’s Perceptions of the Effectiveness of Health and Safety Training Practices of Construction
Firms in Abuja, Nigeria
141
identified deficits in safety knowledge as a
principal contributing factor in a
disproportionate number of injuries
(Haslam et al., 2005). According to Haslam
et al. (2005), more than 70% of accidents
in construction projects are associated with poor safety knowledge. These deficits in
safety knowledge and skills have
traditionally been attributed to industry
barriers for effective training. For example,
the transient nature of the workforce
discourages some employers from adopting
innovative, sophisticated, and resource-
intensive training programs (Goldenhar et
al., 2001). Other common barriers to
effective training include schedule
constraints in time-sensitive projects,
unavailability of funds and resources, lack of interest among workers, and the
uncertainty and difficulty of quantifying
training benefits (Wang et al., 2008).
Apart from these barriers, several training
programmes fail because of common
design flaws including unorganized
material, ineffective trainers, and an
insensitivity to effective instructional
methods (Bunch, 2007). Most training
programmes are delivered based on the naïve assumption that knowledge transfer
can easily occur when conventional
classroom instructional techniques are
adopted. However, Haslam et al. (2005)
argues that these passive instructional
methods do not sufficiently engage
workers, and that they can instill negative
attitudes among workers towards safety
issues. Similarly, Wilkins (2011) suggests
that pedagogical and classroom
instructional methods must be replaced
with andragogical approaches that encourage participation and are more
suitable for adult learners. More recently,
Burke et al. (2011) argued that engaging
safety training methods that facilitate
dialogue, feedback, and action can result in
higher learning gains.
Learning as an Objective Outcome
of Safety Training Some examples of research work that
involves “learning” in safety training
include the following. Han et al. (2008)
state that low skill levels, inadequate
technical knowledge, and a steep learning
curve are the factors that affect the safety
performance of construction workers in a
negative manner. Porteous (1997) states
that safety knowledge, skills and abilities could be improved by well-generated
learning theories. The Occupational Safety
and Health Administration specifically
requires that safety proficiency be
evaluated and documented by the use of a
written assessment and a skill
demonstration to evaluate the knowledge
and individual skills developed in the
course of training (OSHA, 2012).
Kirkpatrick (1998) suggests that the
effectiveness of learning could be tested by
observing the differences between a control group that does not receive training and a
trained group. Furnham (2005) argues that
individuals learn best when they encounter
an obstacle or an intellectual challenge that
is of interest to them. According to
Furnham (2005), the best way to help
people learn is to explain the abstract of the
situation and provide varied examples over
an effective learning period. Furnham
(2005) also states that people learn by
modeling others' skills. In addition, Furnham's (2005) study also indicates that
safety learning might be achieved by
computer-aided tools since it has the
benefit of being self-paced.
Business Legal Reports (2007) asserts that
three basic learning styles exist, including
visual learning, auditory learning, and
hands-on learning. Workers learn things in
different ways and at their own pace. For
example, visual learners learn best by
seeing, while auditory learners like to listen, and hands-on learners learn best
through practical instruction. The BLR
(2007) report suggests using more visual
aids in safety training sessions. Dudley
(2010) defines two teaching styles
commonly used by trainers, namely
andragogical and pedagogical styles. In the
andragogical style, the learner is self-
directed and is responsible for his/her own
learning. Contrastingly, in the pedagogical
style, the trainer takes the full responsibility in how the material is

Environmental Technology & Science Journal Vol. 8 No. 2 December 2017
142
learned and the trainer evaluates learning.
In the andragogical style, learners are
internally motivated, display self-esteem,
recognition, and confidence, while in the
pedagogical style, learners are externally
motivated by competition for performance and the negative consequences of failure.
It is to be noted that safety training is
negatively affected by factors such as
economic downturns, limited training
budgets, and unpredictable product and
technical innovations (Furnham, 2005).
Additionally, the efficiency of safety
training programs depends on
organizational, feedback, content, process,
and worker-related issues.
Organizational issues consist of the firm's structure, middle management's
commitment to safety, and the
effectiveness of safety trainers in
improving the quality of training sessions.
Bontis et al. (2002), Sicilia and Lytras
(2005), and Pham and Swierczek (2006)
assert that a supportive firm structure
results in knowledge transfer and motivates
workers to learn quickly and capture the
necessary information in an effective
manner in safety training sessions. According to Jaselskis et al. (1996), and
O'Toole (2002), middle management's
commitment to safety training results in
experiencing lower injury rates and helps
with improving a company's safety culture.
Concerning the qualifications of a trainer,
occupation safety and health administration
standards mandate that a trainer is
considered to be qualified if he/she has
previously completed a training program
on the subject to be instructed.
Furthermore, these trainers are expected to possess relevant academic credentials and
teaching experience (OSHA, 2013).
Feedback issues play an important role in
improved safety performance. Indeed,
according to Furnham (2005), safety
performance is enhanced by accurate and
timely feedback because feedback
reinforces safety learning. Also,
Loosemore (1998) conducted research
about the psychological mechanisms that cause poor safety performance in
construction companies and found that
feedback should be continuous to achieve
actual safety performance that is aligned
with planned performance. Therefore,
feedback issues deserve special attention in
conducting safety training.
Issues related to the content of training
sessions consist of goal setting before
conducting safety training and developing
the safety training content with respect to
worker needs and interests. A well-
designed content that addresses worker
needs and interests results in higher
efficiency during training sessions as
workers start with different levels of
knowledge (Tam & Fung, 2012).
Therefore, designing safety training content requires an in-depth analysis of the
materials, methods and processes that are
perceived by workers to be of importance
to safety.
Issues related to the training process may
have significant impact on the effectiveness
of safety training. The use of visual aids in
the training session deserves special
attention. Miller et al. (2012) emphasize
that the use of 4D and 5D visualization tools helps to increase the knowledge
gained in training sessions. Also, observing
worker practices after training sessions
could indicate how much workers learned
in the training session.
Worker-related issues include encouraging
worker awareness about safety issues,
promoting pride in work completed without
accidents, and motivating workers through
frequent and effective training meetings.
Workers who are part of an effectively trained team take pride in their firm if
projects are completed with a great safety
record (Bontis et al. 2002). Han et al.
(2008) studied critical factors and possible
solutions to motivate foreign construction
workers and found that one of the measures
to be taken to motivate foreign construction
workers was training for better
communication. In a more recent study,
Wanberg et al. (2013) asserts that the
promotion of safety and quality can be achieved through strategies such as

Shehu, Ibrahim & Abdulrazaq Construction Worker’s Perceptions of the Effectiveness of Health and Safety Training Practices of Construction
Firms in Abuja, Nigeria
143
assigning resources to preplanning,
motivating leadership at workplace, and
motivating workers to take pride in their
work. The literature appears to support the
idea that a good safety record can be
achieved if workers are motivated through effective training.
There are several methods that can be used
to train workers in construction safety.
Kraiger (2003) highlighted four methods,
namely computer-based training which is
flexible, cheap and allows easy-access;
team training which aims to practice with
other teammates' tasks, roles and
responsibilities in order to increase
understanding; cross-cultural training
which helps with enhancing sensitivity and flexibility towards cultural differences; and
corporate training which consists of
distance learning and specialized courses.
McMahan et al. (2010) encourage the use
of virtual environments as a strategy in
worker training because they found that
virtual environment applications improve
worker training in pre-inspections of haul
trucks and operational procedures of
conveyer systems. In another study, Chen
et al. (2013) proposed a virtual system that consists of a BIM/2D model developed to
enhance safety awareness by the careful
consideration of hazard types and safety
issues along with the testing of users'
ability to resolve problems, hence offering
a “learning by doing” technique to better
recognize site hazards and gain awareness
about the severity of accidents.
Reaction of trainees on key
components of training as an
objective outcome of safety training Emotional reaction refers to the attitudes of participants at the end of safety training.
An employee who has considerably gained
safety skill and knowledge from the
training will be willing to apply it on the
job environment, thus bring positive
reaction (Kirkpatrick, 1976). This could be
a barometer for measuring employee’s
general attitude, expectations and
motivation. Although subjective, reaction
also provides feedback on training style
and content (Mohammed & Norsiah,
2013). Measurement is useful in fostering
management support for the training
programme.
Post training questionnaire can be used to measure emotional reaction (Kirkpatrick,
1998). According to Bates (2004),
questionnaire should be directed towards
measuring the training attitudes as regards
content, process (presentation style),
definition of course objectives, attainment
of course objectives and overall course
value. The focus of the type of
measurement is to investigate the attitudes
toward the training material provided
during safety training and obtain feedback
from the trainees (workers). The post training questionnaire methods have also
received several criticisms in terms of their
accuracy and bias, also regarding forms ad
type of questions included in the
questionnaire can largely influence the
answer provided in the questionnaire
(Bates, 2004). Attempt at improving both
pre and post training questionnaires have
been made with accuracy and bias issue in
mind (Kirkpatrick, 2006). The issue of
quantification of measuring believes cannot be totally devoid of bias (Kirkpatrick,
2006).
At reaction level, employee (workers)
reactions are understood to show their
perceived and subjective evaluation of the
relevance and quality of the safety training
programme. According to Kirkpatrick
(2006), training program should at least
first be evaluated at this level to help
improve the conceptualization and design
of the safety training programme for use in future. Employee (worker) reaction at this
level measured satisfaction derived from
evaluation categories of training such as
safety training program objectives, course
materials and relevance, facilitator
knowledge, facilitator delivery, program
evaluation and training facility.
Methodology This study adopted a quantitative research
approach. As defined by Hughes (2006),
quantitative research is concerned with the

Environmental Technology & Science Journal Vol. 8 No. 2 December 2017
144
collection and analysis of data in numeric
form. The study involved the conduct of a
survey using self-administered
questionnaires with both closed and open-
ended questions which were used to
explore the safety training practices of construction firms based on the perceptions
of construction workers. The self-
administered questionnaire was designed to
have two sections (sections A and B).
Section A of the questionnaire was
designed to get respondent’s demographic
information, while section B of the
questionnaire was designed to seek views
of workmen employed by medium and
large construction firms in Abuja (FCT)
based on two questions. Question 1 was
designed to gauge reactions of workmen on the key components of safety training
design and delivery of construction firms.
It asked “what is the level of your
agreement with the following statements on
key components of safety training design
and delivery based on the safety training
practices of your firm?” Question 2 sought
to explore information on the strategies
used by construction firms to achieve
worker learning in safety training. It asked
“how does your firm achieve worker learning in safety training?” For question 1,
sixteen key components of health and
safety training design and delivery were
identified from the literature and
respondents were asked to indicate their
level of agreement with each component on
a scale rating of 1-5, where 1= strongly
disagree, 2= disagree, 3= neither disagree
nor agree, 4= agree and 5= strongly agree.
Similarly, question 2 was assessed through
fifteen strategies that facilitate worker
learning in safety training identified from detailed literature review. Respondents
were then requested to indicate the extent
to which construction firms employ each
strategy to ensure learning in safety
training on a rating scale of 1-5, where 1=
never, 2= seldom, 3= sometimes, 4= often
and 5= always. The self-administered
questionnaire was distributed to 150
medium and large construction firms which
were purposively sampled from the 245
medium and large construction firms registered with Corporate Affairs
Commission (CAC) in Abuja, Nigeria. The
sample size was computed based on
Watson (2001) formula for getting a
representative sample size from a large
population. Out of the 150 questionnaires
distributed, 130 were returned and found useful for analysis, thereby giving a good
response rate of 86.7%. The study
employed the use of descriptive statistics
specifically, frequency tables, mean and
standard deviation were used to analyse the
collected data in order to achieve the aim
of the study. Furthermore, the independent
samples t-test was performed in order to
see if the differences between the groups
are statistically significant at α = 0.05. All
these statistical analyses were undertaken
using the statistical package for social science (SPSS) for Windows version
Results and Discussion Results of Demographic Features
The results revealed that most of the
respondents (86%) have had between 1 and
15 years of experience at the construction
firm and remaining (14%) have years of
experience between 20 years and above. In the light of this, the respondents are
discovered to be suitable to provide
accurate answers to the questions in the
research questionnaire.
It was also revealed that majority of the
respondents (52.6%) have been involved in
building construction works while the
remaining (47.4%) are involved in civil
engineering works. It thus, can be
concluded that the majority of respondents that took part in this study were involved in
building construction works. In terms of
health and safety training practice,
respondents were requested to indicate
whether or not their firm practice health
and safety training. Results revealed that
majority (87.6%) of the respondents
indicated yes, while the remaining (12.4%)
indicated no. This result shows that the
majority of construction firms that
participated in this study consider health
and safety training as a strategy for improving safety on construction sites and
therefore, are qualified enough to provide
accurate data for the study. In addition,
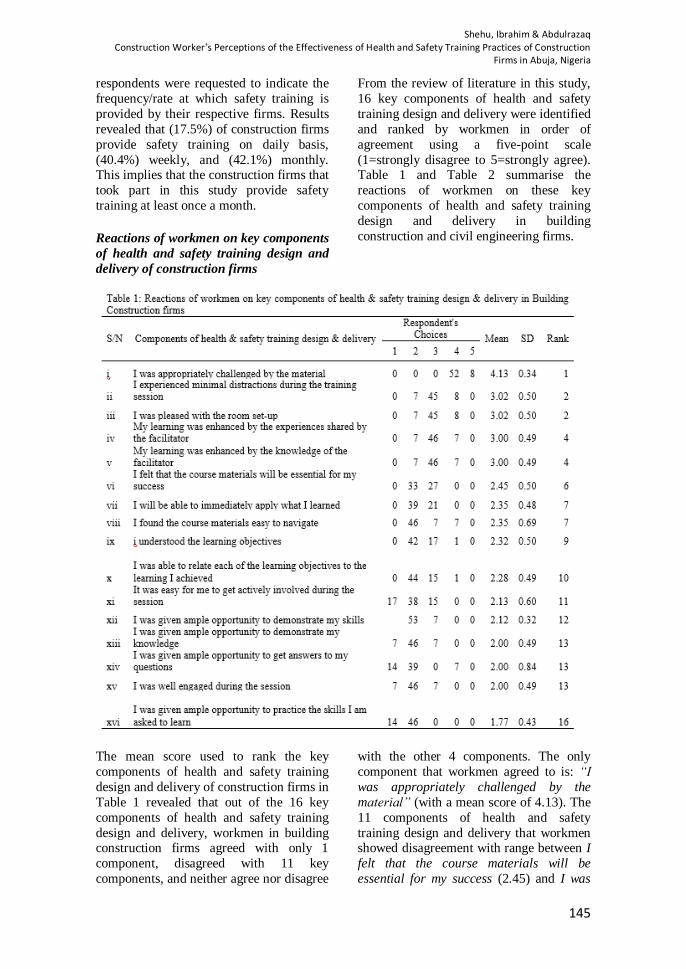
Shehu, Ibrahim & Abdulrazaq Construction Worker’s Perceptions of the Effectiveness of Health and Safety Training Practices of Construction
Firms in Abuja, Nigeria
145
respondents were requested to indicate the
frequency/rate at which safety training is
provided by their respective firms. Results
revealed that (17.5%) of construction firms
provide safety training on daily basis,
(40.4%) weekly, and (42.1%) monthly. This implies that the construction firms that
took part in this study provide safety
training at least once a month.
Reactions of workmen on key components
of health and safety training design and
delivery of construction firms
From the review of literature in this study,
16 key components of health and safety
training design and delivery were identified
and ranked by workmen in order of
agreement using a five-point scale
(1=strongly disagree to 5=strongly agree). Table 1 and Table 2 summarise the
reactions of workmen on these key
components of health and safety training
design and delivery in building
construction and civil engineering firms.
The mean score used to rank the key
components of health and safety training
design and delivery of construction firms in
Table 1 revealed that out of the 16 key
components of health and safety training
design and delivery, workmen in building construction firms agreed with only 1
component, disagreed with 11 key
components, and neither agree nor disagree
with the other 4 components. The only
component that workmen agreed to is: “I
was appropriately challenged by the
material” (with a mean score of 4.13). The
11 components of health and safety
training design and delivery that workmen showed disagreement with range between I
felt that the course materials will be
essential for my success (2.45) and I was
Environmental Technology & Science Journal Vol. 8 No. 2 December 2017
146
given ample opportunity to practice the
skills I am asked to learn (1.77). The other
4 components that workmen showed
neither agreement nor disagreement with
range between I experienced minimal
distractions during the training session (3.02) and my learning was enhanced by
the knowledge of the facilitator (3.00).
Respondent’s assessments on the key
components of health and safety training
design and delivery (Table 1) showed that
workmen are mostly dissatisfied with the
way building construction firms design and
deliver health and safety training.
Table 2 shows respondents’ assessments in
civil engineering firms on the key components of health and safety training
design and delivery. The mean score used
to rank the key components revealed that
workmen disagreed with only 1 component
out of the 16 components of health and
safety training design and delivery
identified. According to the results in Table
2, respondents disagreed with the statement
“I was appropriately challenged by the
material” with a mean score of 2.30. Also,
workmen showed agreement with the
remaining 15 key components. These key
components range between I found the
course materials easy to navigate (4.22)
and my learning was enhanced by the
knowledge of the facilitator (3.59). Results
in Table 2 indicated that workmen are mostly satisfied with the way civil
engineering firms design and deliver health
and safety training. Indeed, trainees who
are satisfied with the health and safety
training practices of their firms tend to be
more motivated to learn safe practices than
those who are dissatisfied.
Additionally, Independent Samples Test
was carried out to compare the mean scores
of the respondent’s assessments on the key
components of health and safety training
design and delivery between building construction and civil engineering firms in
order to ascertain if significant differences
exist. Results in Table 3 show that
(p<0.001) which is less than p-value= 0.05
and thus it can be concluded that there was
a statistically significant difference in mean
scores between building construction and
civil engineering firms as regards key
components of health and safety training
design and delivery.

Environmental Technology & Science Journal Vol. 8 No. 2 December 2017
147
Table 3: Results of independent samples t-test of key components of training design & delivery
between building construction & civil engineering firms
Levene's Test for
Equality of Variances t-test for Equality of Means
95%
Confidence Interval of the
Difference
F Sig
. T df
Sig. (2-
tailed)
Mean Differen
ce
Std. Error
Difference Lower
Upper
Type of constructi
on firm
Equal varianc
es assumed
1.979
.170
-
6.842
30 .000 -
1.29000 .18854
-
1.67505
-
.90495
Equal variances not assumed
-
6.842
28.051
.000 -
1.29000 .18854
-1.676
17
-.9038
3

Environmental Technology & Science Journal Vol. 8 No. 2 December 2017
0
Results of strategies employed by
construction firms to ensure/achieve
worker learning in safety training
From the review of literature in this study,
15 worker learning strategies in health and
safety training were identified and ranked by workmen based on level of
implementation using a five-point scale
(from 1=never to 5=always). Tables 4 and
5 show the respondent’s assessments in
building construction and civil engineering
firms respectively.
Results in Table 4 revealed the mean score
used to rank the strategies mostly practiced
in building construction firms to achieve
learning in safety training. According to the
respondents, only 2 out of the 15 learning
strategies are implemented in building
construction firms. Respondents indicated
that the safety related behaviours of
workers are observed is the most critical
issue in achieving learning in safety training with a mean score of 3.62.
The second learning strategy cited by
respondents in safety training involves
encouraging experienced workers to share
their safety knowledge with the
inexperienced workers (3.62). This means
that building construction firms mostly
perform health and safety training in an
environment where experience sharing
does occur.

Environmental Technology & Science Journal Vol. 8 No. 2 December 2017
148
Results in Table 5 revealed the mean score
used to rank the strategies mostly practiced
in civil engineering firms to achieve
learning in safety training. According to the
respondents, 8 out of the 15 learning
strategies in safety training have been
implemented in civil engineering firms.
Respondents indicated that organisational
structure encourages safety training (4.35),
qualified safety trainers are employed
(4.24), safety goals are set before safety training (4.22), content of safety training is
designed to satisfy workers’ needs/interests
(4.22), experienced workers are
encouraged to share their safety knowledge
with the inexperienced workers (4.19),
questions and answers are encouraged in
safety training (4.00), workers are
motivated to follow safety rules (4.00), and
the safety related behaviours of workers
are observed (3.93). According to the
respondents, the other 7 learning strategies
in safety training which are yet to be
implemented in civil engineering firms
range between workers are aware of the
critical safety issues (2.65) and exams are
administered to workers during or after
safety training (2.06).
Furthermore, Independent Samples Test
was carried out to compare the mean scores
of the respondent’s assessments on the
worker learning strategies’ implementation between building construction and civil
engineering firms in order to see if
significant differences exist. Results in
Table 6 show that (p<0.01) which is to less
than p-value= 0.05 and thus it can be
concluded that there was a statistically
significant difference in mean scores of the
worker learning strategies between
building construction and civil engineering
firms.
Table 6: Results of independent samples test of learning strategies in safety training between
building construction & civil engineering firms
Levene's Test for
Equality of Variances t-test for Equality of Means

Environmental Technology & Science Journal Vol. 8 No. 2 December 2017
1
95% Confidence
Interval of the Difference
F Sig
. t df
Sig.
(2-tailed)
Mean Differen
ce
Std.
Error Differen
ce Lower Uppe
r
Type of construction firm
Equal variances assumed
4.845
.036
-2.72
4 28 .011 -.90867 .33361
-1.592
04
-.2253
0
Equal variances not assumed
-
2.724
27.411
.011 -.90867 .33361 -
1.59270
-.2246
3
Discussion of Results
Reaction of workmen on key
components of health and safety
training design and delivery The descriptive results in section 3.1.2
revealed that workmen in civil engineering
firms are more satisfied than their
counterparts in building construction firms
with the key components of health and safety training design and delivery of their
construction firm. The results therefore,
imply that construction firms that majorly
carry out civil engineering works are more
likely than their counterparts that carry out
building construction works to design and
deliver health and safety training practices
that suit the safety needs of workmen. The
result of the study carried out by Wilkins
(2011) is evident to the findings discussed
above because it revealed that construction workers in The US showed dissatisfaction
with the ways in which health and safety
training is designed and delivered. Wilkins
highlighted the needs for safety training to
cover content relevant to the lives of the
trainees, for presentation by a trainer
knowledgeable about the subject, and for
supplementing training with tangible
materials that are understandable.
Strategies employed by construction
firms to ensure/achieve worker
learning in safety training The descriptive results in section 3.1.3
revealed that building construction firms
achieve worker learning in safety training
through 2 strategies which are: the safety
related behaviours of workers are observed
and experienced workers are encouraged to
share their safety knowledge with
inexperienced workers. The findings of this
study are supported by the findings of
David and Sevilay (2015) that revealed that companies that perform building works
monitor workers’ safety related behaviours
more closely than companies that are
involved in civil engineering works,
because building works involve a large
number of activities with a multitude of
trades compared to civil works that are
generally composed of fewer trades. Also,
Rowlinson (2004) mentions that building
works are more labor intensive and
repetitive than civil works, hence providing the opportunity to observe safety related
behaviours of workers more consistently.
The findings of this study also revealed that
civil engineering firms employ 8 strategies
to achieve worker learning in safety
training which are: organisational
structure encourages safety training,
qualified safety trainers are employed,
safety goals are set before safety training,
content of safety training is designed to
satisfy workers’ needs/interests, experienced workers are encouraged to
share their safety knowledge with the
inexperienced workers, questions and
answers are encouraged in safety training,
workers are motivated to follow safety
rules, and the safety related behaviours of
workers are observed. The results therefore
Environmental Technology & Science Journal Vol. 8 No. 2 December 2017
150
imply that workers in civil engineering
firms are more likely than their
counterparts in building construction firms
to learn/acquire safety knowledge, skills
and attitudes in safety training. The
findings of this study are supported by Demirkesen and Arditi’s (2015) study that
states that companies that perform mostly
civil works design the content of training
sessions more in line with workers’ needs
and interests, because civil works may
include many diverse types of construction
such as highways, bridges, railroads, dams,
etc., each requiring a tailor made training
program.
Conclusion This study explored safety training
practices of construction firms based on the
perceptions of construction workers on two
(2) objective outcomes of safety training
namely: reaction of workmen on safety
training design and delivery; and worker
learning in safety training. For each
objective outcome, questions were asked to
find out the actual practices of construction
firms on each of the two objective outcomes of safety training used. The
findings of the study revealed that
workmen in building construction and civil
engineering firms have contrasting
opinions on the key components of health
and safety training design and delivery. In
building construction firms, workmen are
dissatisfied with the majority (15) out of
the 16 key components of health and safety
training. Conversely, workmen in civil
engineering firms are satisfied with the majority (15) out of the 16 key components
of health and safety training design and
delivery.
It was also established that building
construction firms achieve worker learning
in safety training through two strategies.
The two strategies are; observing workers’
safety-related behaviours and encouraging
experienced workers to share their safety
knowledge with the inexperienced workers.
On the other hand, civil engineering firms use eight (8) strategies to achieving worker
learning in safety training. The 8 strategies
are; setting up organizational structure that
supports safety training, employing
qualified safety trainers, setting goals
ahead of safety training, designing safety
training content to satisfy worker
needs/interests, encouraging questions and
answers in safety training sessions, allowing experienced workers to transfer
safety knowledge to less experienced
workers, motivating workers to follow
safety rules and observing workers’ safety-
related behaviours.
Based on the findings of the study, the
study thus, concludes that construction
workers in civil engineering firms are more
satisfied with their firm’s safety training
practices than their counterparts in building
construction firms in terms of safety training design and delivery components
that corresponds to workers’ safety needs;
and learning strategies that aid worker
learning of safety knowledge, skills and
attitudes in safety training. This therefore,
means that civil engineering firms consider
effective health and safety training as a
company strategy for better safety
outcomes more than building construction
firms.
Recommendation In view of the conclusion from the research
findings, it was therefore recommended
that construction firms and practicing
professionals should pay special attention
to the key components of safety training
design and delivery that yield better safety
outcomes in terms learning of safety
knowledge, skills, and attitudes by workers.
It should be noted that this study explored
the effectiveness of health and safety
training practices of construction firms
based on two objective outcomes namely:
reactions of workmen on health and safety
training design and delivery and worker
learning in safety training. Further studies
can be conducted by identifying additional
objective outcomes of health and safety
training such as hazard recognition, return
on investment and safety risk perception. It would also be interesting to directly
measure in future research how much

Shehu, Ibrahim & Abdulrazaq Construction Worker’s Perceptions of the Effectiveness of Health and Safety Training Practices of Construction
Firms in Abuja, Nigeria
151
safety knowledge workers actually learn
and implement in training sessions.
References Ahmed, S. M., Azhar, S., and Forbes, L. H.
(2006). Costs of injuries/illnesses and
fatalities in construction and their
impact on the construction economy.
CIB W99, International Conference
on Global Unity for Safety and Health
in Construction, Beijing.
Bates, R. A. (2004), A critical analysis of
evaluation practice: the Kirkpatrick model and the principle of
beneficence’, Evaluation and Program
Planning, 27, 341–7.
BLR, (2007). 50 tips for more effective
safety training. Special Report,
Business. Legal Reports. Inc.,
Nashville, T.N., Bontis, N., Crossan,
M.M., Hulland, J., (2002). Managing
an organizational learning system by
aligning stocks and flows. Journal of
Management. Studies. 39 (4), 437–469.
BLS (Bureau of Labor Statistics). (2015).
National census of fatal occupational
injuries in 2014.
⟨http://www.bls.gov/news.release/cfoi
.nr0.htm⟩ (Nov. 15, 2016).
Bunch, K. J. (2007). Training failure as a
consequence of organizational
culture. Human Resource
Development Review. 6(2), 142–163. Burke, L.A., Hutchins, H.M., (2008). A
study of best practices in training
transfer and proposed model of
transfer. Human Resource
Development. 19 (2), 107–128.
http://dx.doi. org/10.1002/hrdq.
Chen, A., Golparvar-Fard, M., Kleiner, B.,
(2013). Design and development of
SAVES: a construction safety training
augmented virtuality environment for
hazard recognition and severity
identification. Proc., International Conference on Computing in Civil
Engineering. ASCE, Los Angeles,
CA, pp. 841–848.
Cohen, A., Colligan, M. J., Sinclair, R.,
Newman, J., and Schuler, R. (1998).
Assessing occupational safety and
health training: A literature review.
National Institute for Occupational
Safety and Health, Cincinnati.
Dudley, L., 2010. Andragogy vs. pedagogy
in training.
http://managementhelp.org/blogs/trai
ning-and-development/2010/03/30/andragogy-
vs-pedagogyin-training/ (Mar. 30,
2010).
Esmaeil, B., Hallowell, M., Roucheray, M.,
(2012). Developing a framework for
measuring the effectiveness of
common fall prevention/protection
practices. Proceedings of
International Conference on
Sustainable Design, Engineering, and
Construction. (ASCE), Fort Worth,
TX, pp. 719–726. Furnham, A., (2005). The Psychology
Behavior at Work: The Individual in
the Organization. Second Edition.
Taylor & Francis Group, New York,
NY.
Goldenhar, L. M., Moran, S. K., and
Colligan, M. (2001). Health and
safety training in a sample of open-
shop construction companies. Journal
of Safety Resource. 32(2), 237–252.
Han, H.S., Park, H.S., Jin, J.E., Kim, H., Seong, K.Y., (2008). Critical issues
and possible solutions for motivating
foreign construction workers. Journal
of Management Engineering. 24,
217–226.
Haslam, R. A., et al. (2005). Contributing
factors in construction accidents.
Applied Ergonomics, 36(4), 401–415.
Hinze, J. (2005). Concealing the
Occurrence of Construction Injuries.
In: The W99 Triennial Conference,
Rethinking and Revitalizing Construction Safety, Health,
Environment and Quality (edited by
Haupt, T. C. and Smallwood, J.).
Construction Research Education and
Training Enterprises, Port Elizabeth,
714-727.
Huang, X., Hinze, J., (2003). Analysis of
construction worker fall accidents.
Journal of Construction Engineering
and Management 129 (3), 262–271.
Jaselskis, E., Anderson, S., Russell, J., (1996). Strategies for achieving
Environmental Technology & Science Journal Vol. 8 No. 2 December 2017
152
excellence in construction safety
performance. Journal of Construction
Engineering and Management 122
(1), 61–70.
Kirkpatrick, D. L. (1976). Evaluation of
training. In R. L. Craig (Ed.), Training and development handbook:
A guide to human resource
development. New York: McGraw
Hill. Kirkpatrick, D. L. (1959).
Techniques for evaluating training
programs. Journal of American
Society for Training and
Development, 11, 1–13.
Kirkpatrick, D. L. and Kirkpatrick, J. D.
(1998), Evaluating Training
Programs: The Four Levels, 3rd
edition (San Francisco, CA: Berrett-Koehler).
Kirkpatrick, D. L. and Kirkpatrick, J. D.
(2006), Evaluating Training
Programs: The Four Levels, 3rd
edition (San Francisco, CA: Berrett-
Koehler).
Kraiger, K., (2003). Perspectives on
training and development. In:
Borman, W.C., Ilgen, D.R., Klimoski,
R.J. (Eds.), Handbook of Psychology.
John Wiley & Sons, Inc., Hoboken, NJ, pp. 171–192.
Li, H., Chan, G. and Skitmore, M. (2012).
Visualizing safety assessment by
integrating the use of game
technology. Automation in
Construction, 22, 498–505.
Lingard, H. (2002). The effect of first aid
training on Australian construction
workers’ occupational health and
safety motivation and risk control
behavior. Journal of Safety
Resources, 33(2), 209–230. Lingard, H. (2013). Occupational health
and safety in the construction
industry. Construction Management
and Economics, 31(6), 505–514.
Loosemore, M., (1998). Psychology of
accident prevention in the
construction industry. Journal of
Construction Engineering and
Management, 14 (3), 50–56.
McMahan, R., Schafrik, S., Bowman, D.,
Karmis, M., (2010). Virtual environments for surface mining
powered haulage training. Extracting
the science: a century of mining
research. In: Brune, J. (Ed.). The
Society for Mining, Metallurgy and
Exploration, pp. 520–528.
Miller, G., Dawood, N., Kassem, M., (2012). Building an emergent learning
environment for construction health
and safety by merging serious games
and 4D planning. Proceedings,
International Conference on
Computing in Civil Engineering.
(ASCE), Clearwater Beach, FL, pp.
129–136.
Mohammed, S.A., and Norsiah, B.M.,
(2013). Evaluation of the
effectiveness of training and
development: The Kirkpatrick model. Asian Journal of Business and
Management Science.
OSHA (Occupational Safety and Health
Administration). (2010). OSHA
training standards policy statement.
Washington, DC.
OSHA (Occupational Safety and Health
Administration). (2013). Top 10 most
frequently cited standards.
⟨https://www.osha.gov/Top_Ten
_Standards.html⟩ (Oct. 15, 2015).
O'Toole, M., (2002). The relationship
between employees' perceptions of
safety and organizational culture.
Journal of Safety Resources 332,
231–243.
Pham, N.T., Swierczek, F.W., (2006).
Facilitators of organizational learning
in design. The Learning,
Organization. 132, pp. 186–201.
Porteous, M., (1997). Occupational Psychology. Prentice Hall, London,
UK. OSHA, (2012). Occupational
safety and health administration
regulations.
http://www.osha.gov/pls/oshaweb/ow
asr h.search_fo m?p_doc_type=
STANDARDS&p_toc_level=1&p_key
value=1910 (Apr. 26, 2011).
Rowlinson, S., (2004). Construction Safety
Management Systems. Taylor and
Francis Inc., New York, NY.
Ruttenberg, R. (2013). The economic and social benefits of OSHA-10 training
in the building and construction

Shehu, Ibrahim & Abdulrazaq Construction Worker’s Perceptions of the Effectiveness of Health and Safety Training Practices of Construction
Firms in Abuja, Nigeria
153
trades. Center for Construction
Research and Training (CPWR),
Silver Spring, MD.
Sicilia, M., Lytras, M., (2005). The
semantic learning organization.
Learning Organisation 12 (5), 402–410.
Tam, V., Fung, I., (2012). Behavior,
attitude, and perception toward safety
culture from mandatory safety
training course. Journal of
professional Issues in Engineering
and Education Practice 138 (3), 207–
213.
Tixier, A. J., Hallowell, M. R., Albert, A.,
van Boven, L., and Kleiner, B. M.
(2014). Psychological antecedents of
risk-taking behavior in construction. Journal of Construction Engineering
Management,
10.1061/(ASCE)CO.1943-
7862.0000894, 04014052.
Wanberg, J., Harper, C., Hallowell, M.,
Rajendran, S., (2013). Relationship
between construction safety and
quality performance. J. Constr. Eng.
Manag. 139 (10), 04013003.
Wang, Y., Goodrum, P. M., Haas, C. T.,
and Glover, R. W. (2008). Craft
training issues in American industrial and commercial construction. Journal
of Construction Engineering
Management, 10.1061/(ASCE)0733-
9364(2008)134:10(795), 795–803.
Watson, J. (2001). How to Determine
Sample Size: Tip sheet #60,
University Park, P.A: University
Cooperative Extension, Pennsylvania
State University.
Wilkins, J. R. (2011). Construction
workers’ perceptions of health and
safety training programmes. Construction Management and
Economics, 29(10), 1017–1026.
Zou, P., and Sunindijo, R. Y. (2015).
Strategic safety management in
construction and engineering, Wiley,
Hoboken, NJ.


Environmental Technology & Science Journal Vol. 8 No. 2 December 2017
154
Effect of Household Head’s Gender on
Crowding in Government-Built Multifamily
Apartments in Lagos
Anthony C. O. Iweka and Anthony K. Adebayo Department of Architecture, Faculty of Environmental Sciences,
University of Lagos, Akoka-Yaba, Lagos, Nigeria [email protected]
Abstract The inclusion of gender perspectives is highlighted globally by planners, architects and
policy makers in tackling the built-environment developmental issues. Living arrangements
in multifamily apartments and exposure to housing stress are influenced by household
demographic factors such as gender. Access to reliable data on household crowding which
recognizes and understands gender-specific patterns is cherished by governments and policy
makers across the globe. Exploring the gender differences in the experiences of crowding is
one of the areas that has not attracted adequate research attention in multifamily apartments
owned and operated by the Lagos State Development and Property Corporation (LSDPC) in
Lagos, Nigeria. This study aimed to assess the differing degrees of crowding experience in
households headed by men and households headed by women. A case study of four large
housing estates belonging to LSDPC was employed. The study sample frame was 7,764 out of which a sample of 7.5% (582) was randomly selected using stratification and systematic
techniques. A pre-test questionnaire was used to collect relevant gender disaggregated data
from household heads. Descriptive statistical analyses were used to compare the crowding
experiences faced by households headed by males and females in the study area. The results
showed that in all the six apartment types investigated across four locations, the gender of
household head had no significant effect on apartment crowding. It is therefore
recommended that planning, design and policy inclination towards crowding in LSPDC’s
multifamily apartments should be based on gender neutrality.
Keywords: crowding, gender, household head, multifamily apartment
Introduction The question of gender differences in
housing occupancy and housing utilization
is a complex, controversial and contentious
one, notwithstanding that gender is widely
acknowledged as a developmental issue.
Although reliable data on household crowding is essential to analysis and
housing issues, the problem of how this
crowding phenomenon is expressed in
male-headed and female-headed
households is an under-researched
question. Ngaiza (2010) acknowledges that
research on urban planning and housing
has for the most part failed to incorporate
gender analysis of apartment crowding.
In Nigeria the matching of household
head’s gender with crowding levels in
public housing multifamily apartments has
not attracted adequate research attention
among scholars of housing demography
despite the fact that demographic
characteristics and features are frequently
used to explain housing behaviour. All
these have implications for multifamily
housing design. Hence it is important to apply gender-based analysis of crowding
experiences in existing apartments to
determine whether households headed by
women have higher risks of crowding than
households headed by men. Presently,
housing policies and programmes in
Nigeria and many other countries are
described as gender-neutral. However,

Iweka & Adebayo Effect of Household Head’s Gender on Crowding in Government-Built Multifamily Apartments in Lagos
155
traditional ideas about gender, masculinity
and femininity still create an imbalance in
the housing field.
Gender as a construct refers to economic
and socio-cultural attributes, values and opportunities associated with being a man
or a woman (UN-Habitat, 2008).
Researches by Dimitri (2008) and UNFPA
(2014) have attempted to clarify the
difference between gender and sex. They
contend that sex is defined by the
circumstances of birth which classify
people as male or female based on
biological and physiological
characteristics. In this sense, sex
characteristics are fairly constant and
universal whereas gendered ideas could vary across locations and across times.
Focusing on gender (the socio-cultural
construct) rather than sex (the biological
marker) reveals that access to housing is
not only gendered but varies according to
factors such as whether or not household
includes children and other occupants.
Therefore the recognition of gender
diversity in household living experiences is
essential in terms of housing delivery, urban planning and governance. Ignoring
gender implies that assumptions about the
household structure may end up being
incorrect, especially in urban locations that
have a growing preponderance of female-
headed households.
Thus, manifestation of gender diversity in
the area of crowding poses a big challenge
for city planners and policy makers, and
constitutes a research gap. This gap appears
evident in Lagos, Nigeria, where an empirical study of gender-segregated
objective crowding experiences of
households is rare. In Lagos state, most of
the multifamily apartments developed by
Lagos State Development and Property
Corporation (LSDPC) were built with
male-dominance mentality. Further,
LSDPC apparently saw housing problems
in terms of the demand for family housing
and so did not emphasize the need to
deliver housing that is suitable for different genders.
LSDPC needs to be clear about the
volumes of housing suitable for different
genders. One way to achieve this is to
investigate how living arrangements for
different genders impact on household crowding. The question is whether or not
there is a disparity in objective crowding
levels, based on the gender of the
household head. Knowledge of this can
elicit new approaches that could change
LSDPC’s housing delivery models. The
outcome could provide supporting
information to justify whether or not there
will be a need for larger range of
innovative housing options or models in
LSDPC.
Literature Review Historically, most traditional gender
ideologies and cultural norms legitimize
households and housing systems in which
men are assigned dominant roles and
women subordinate roles (Tester, 2007;
Ngaiza, 2010; Bammeke, 2010). Based on
this historical legacy and cultural
prescriptions, household headship is associated with men to the extent that some
women who, in fact, head households may
not name themselves as such. Gender
scholars have demonstrated that the
stereotypical roles and responsibilities
assigned to men and women create
disadvantages in the housing arena (Tester,
2007).
Internationally recognized definitions and
concepts have been developed to respond to these biased orientations. Accordingly,
gender roles are now shifting in the
direction of more flexibility that do not
rigidly correspond to any specific form of
gender expectations.
Thus, the household head is now
recognized as the person within the
household who retains the ultimate
authority for decision-making and
allocation of resources about the affairs of
the apartment (Ngaiza, 2010; Blank, 2013).
Such authority covers a number of variables like the person who owns the
apartment, or who supports the people that
reside in it.

Environmental Technology & Science Journal Vol. 8 No. 2 December 2017
156
Shift towards gender balance in
housing experiences in Nigeria Scholars have been unequivocal about the
need and necessity to accommodate the
differences between men and women in
planning at the level of the household
(Moser, 1987; Ibem & Azuh, 2013;
Asiyambola, 2013; Agbola, 1990).
Previous tilt towards male superiority and
dominance in Nigeria’s housing sector is gradually changing in line with
international definitions and concepts. This
shift found expression in the 1991 census
of the Federal Republic of Nigeria which
defined a household in terms of co-
residence (common living arrangements for
multi-person households), common
cooking arrangements and the recognition
of one person as the household head. This
unbiased definition of household head
makes it imperative to empirically investigate the interlink in the housing
needs, housing decisions and housing
experiences between genders. In Nigeria,
one of the noticeable constraints is the
dearth of empirical evidence of women’s
actual experience of housing,
notwithstanding the fact that women
constitute about 49% of Nigeria’s
population (Federal Republic of Nigeria,
2007; Olotua & Ajayi, 2008). It has also
been revealed that female-headed households in Nigeria’s urban areas
constitute 19% (Bammeke, 2010; NPC
(Nig.) 2000). Only a few gender-based
studies are available in Nigeria and these
mainly address the issues concerning
women as a disadvantaged group in
accessing urban housing and social
services, (Agboola, 1990; Asiyambola &
Filani, 2007; Ibem & Azuh, 2013).
In Lagos, government-built housing
apartments have been in existence for several decades. The largest part of
available units are owned and operated (or
leased) by LSDPC without a clear evidence
of gender-based experiences in the area of
objective crowding. Such a focus on
gender-induced demographic changes
could influence housing consumption in
such a way as to change LSDPS’s housing
delivery models.
Methodology This study was designed to be comparative,
involving male-headed households and
female-headed households in government-
built multifamily apartments, using LSDPC
as a case study. The aim was to explore
whether gender roles would predict
objective crowding levels in LSDPC’s
multifamily apartments. Thus the approach
was to compare the crowding experiences faced by households headed by males and
females. There is no one international
standard definition of crowding. However,
in this study, the issue in focus is the
number of persons in the apartment, based
on objective statistical measures of density
and does not incorporate people’s
perception of crowding (Iweka, 2013).
Hence, household crowding was
summarized using a continuous variable
called people-per-room, calculated by the number of residents divided by number of
rooms.
The “Adult-equivalent” concept was
applied as a key crowding measure using
combinations of criteria such as age, sex
and relationships, to follow the approved
number of people per room. This
measurement provided an indication of
room occupancy in LSDPC’s multifamily
apartments based on household head’s
gender. This approach has been used in
Australia, Canada and the United Kingdom. The Canadian National
Occupancy Standard (CNOS) and the
Equivalized Crowding Index (ECI) were
applied in determining what constitutes an
adult-equivalent occupant. In applying
these indexes, each individual who is in a
marital relationship was rated as one-half,
as well as children aged less than 10 years.
Children under one year were not taken
account of, while children of one year old
and above, but less than 18 years of age were counted as one-half. Other apartment
occupants who are 18 years and above
were counted as one. The outcome gives
the equivalized number of people living in
the apartment. (Basavarajappa, 1998;
Schuluter, Carter & Kokaua, 2007;

Iweka & Adebayo Effect of Household Head’s Gender on Crowding in Government-Built Multifamily Apartments in Lagos
157
Australian Bureau of Statistics 2008;
Iweka, Adebayo & Igwe, 2009; Iweka,
2012).
In the current study, it was assumed that
there is no difference between ownership
and headship. Also joint headships and contested household headship situations
were assumed to be non-existent.
Household size was used as a proxy to
statistically measure crowding levels in
LSDPS’s multifamily apartments.
Research design The case study approach was applied in
this research to provide in depth details for
objective assessment of crowding levels
differentiated by household head’s gender
in LSDPC’s multifamily apartments. A
survey research component provided an
indication of the prevalence of over-
crowding or under-crowding in the selected
multifamily apartments.
Out of the forty residential public housing
estates belonging to LSDPC, there are twelve that contain multifamily apartments
comprising nine in the low income
category and three in the medium income
category (Iweka, 2012). The estates in the
low income category are Abesan, Amuwo
Odofin, Anikantamo, Dairy Farm/Ijaiye,
Dolphin II, Iba, Iponri, Isolo and Ojokoro.
The medium income estates are Ebute-
Metta, Femi Okunnu and Ijaiye. The total
number of apartments in these twelve
estates is 17,679, and this constituted the
study population. For this study, three housing estates in the low income category
(Abesan, Dolphin II and Iba) and one estate
in the medium income category (Ebute-
Metta) were purposively selected.
Sample selection and data collection The study sample frame was 7,764
multifamily apartments classified into two-
bedrooms, three-bedrooms and four-bedrooms. These apartments are located in
the four estates purposively chosen for in-
depth investigation of effect of household
heads’ gender on apartment crowding. Of
this figure, 7.5% was selected through
stratified and systematic random sampling
method. Consequently, 582 apartments
consisting of 135, two-bedrooms, 447 three bedrooms and 40 four-bedroom were
chosen for questionnaire administration.
Out of the 582 questionnaires distributed to
household heads who were the respondents
only 184 (that is, 32% effective response
rate) were subsequently retrieved for data
analysis. Although the number of responses
seemed low for such a study, nonetheless,
considering the time and resource
constraints, low public awareness and
education as well as the prevailing situation
in which people were reluctant to share information, the response rate was
considered sufficient to interpret this
research objective. Five out of all the
returned questionnaires were defective and
could not be used for further analysis. The
data were analyzed using descriptive
statistics.
Findings The crowding levels, based on the gender
of household head in the different
categories of LSDPC’s multifamily
apartments investigated in this study were
computed using the adult-equivalent model
of occupants per apartment.
Group measure was applied to interpret the
crowding level experienced during
habitation by the male-headed households
and female-headed households. Three
groups were subsequently employed. These
are (a) households that harboured one to
two adult-equivalent occupants, (b)
households that harboured three to five
adult-equivalent occupants, and (c)
households that harboured six or more
adult-equivalent occupants. The results from these three groups are represented in
Table 1.

Environmental Technology & Science Journal Vol. 8 No. 2 December 2017
158
Table 1 Grouped Measures of Crowding Levels, Based on Gender in Different Apartment Types
Apartment
type
Gender 1 – 2
Occupants
(%)
3 – 5
Occupants
(%)
6 occupants
& above
(%)
Total
(%)
Type 1
2-bedroom
Abesan
Male-headed household 16.6 50.0 5.6 72.2
Female-headed household
- 27.8 - 27.8
TOTAL 16.6 77.8 5.6 100
Type 2
2-bedroom
Dolphin
Male-headed household 6.7 60.0 26.7 93.3
Female-headed household
- 6.7 - 6.7
TOTAL 6.7 66.7 26.6 100
Type 3
3-bedroom
Abesan
Male-headed household 16.2 51.5 5.9 73.5
Female-headed household
8.8 14.7 2.9 26.5
TOTAL 25 66.2 8.8 100
Type 4
3-bedroom
Iba
Male-headed household 28.7 50 7.1 85.8
Female-headed
household
- 7.1 7.1 14.2
TOTAL 28.7 57.1 14.2 100
Type 5
3-bedroom
Dolphin
Male-headed household 13.0 65.3 21.7 100
Female-headed household
- - - -
TOTAL 13.0 65.3 21.7 100
Type 6
4 bedroom
Ebute-Metta
Male-headed household 21.2 48.5 6.1 75.8
Female-headed household
3.0 21.2 - 24.2
TOTAL 24.2 69.7 6.1 100
Apartments where the crowding
level is one to two occupants Female-headed households were very few
among apartments containing one to two
occupants. Among the six apartment types
investigated, female-headed households
could not be found in four types. These are
Type 1 (two-bedroom) at Abesan, Type 2
(two-bedroom) at Dolphin, Type 4 (three-
bedroom) at Iba and Type 5 (three-
bedroom) at Dolphin. Thus the two
apartment types harbouring one to two
occupants are Type 3 (three-bedroom) at
Abesan (8.8%) and Type 6 (four-bedroom) at Ebute-Metta (3.0%).
On the contrary, male-headed households
harbouring one to two occupants were
found in all the six apartment types
investigated, ranging from 6.7% to 28.7%.
Overall, the results revealed that
apartments where the crowding level was
one to two occupants constitute the second
most dominant group after the group
containing three to five persons group.
Apartments where the crowding
level is three to five occupants Table 1 reveals that male-headed
households containing three to five adult
equivalent persons were found in all
apartment types and were most dominant in
all of them. Type 5 (three-bedroom) at
Dolphin ranked highest with 65.3% of the
respondents belonging to this group of three to five occupants in male-headed
households. On the
Other hand, Type 6 (four-bedroom) at
Ebute-Metta ranked lowest for male-
headed households, with 48.5% of the

Iweka & Adebayo Effect of Household Head’s Gender on Crowding in Government-Built Multifamily Apartments in Lagos
159
respondents belonging to this group of
three to five occupants.
In the case of female-headed households,
this group of three to five occupants were
also the most dominant, though to a lesser
degree than the results obtained from male-headed households. There were no female-
headed households among the respondents
in Type 5 (three-bedroom) at Dolphin. In
the other four types of apartment,
households headed by females and
harbouring three to five occupants range
from 6.7% to 27.8%. It was also observed
that the highest record of 27.8% for
female-headed households was far less than
the lowest record of 48.5% for male-
headed households.
Apartments where the crowding
level is six or more occupants The results for female-headed households
containing six or more persons were very
similar to, though less dominant than
female-headed apartments containing one to two occupants. Female headed
households did not exist in four apartment
types namely Type 1 (2-bedroom) at
Abesan, Type 2 (2-bedroom) at Dolphin,
Type 5 (three-bedroom) at Dolphin, and
Type 6 (four-bedroom) at Ebute-Metta.
Even in the two apartment types where
female-headed households existed, the
figure was significantly low (2.9% to
7.1%).
The situation with apartments containing
six or more occupants for male-headed households was not very different from
female-headed households even though the
male-headed households can be found in
all the six apartment types. The crowding
level ranged from 5.6% in Type 1 (2-
bedroom) at Abesan to 26.7% in Type 2 (2-
bedroom) at Dolphin.
Statistical test of gender effect on
crowding levels in the six apartments
investigated. A chi-square test was carried out to establish the effect of gender on crowding
levels in the six apartments investigated.
The results are shown in Table 2. The
statistical level of significance for
acceptance or rejection was set at 95%
confidence interval. Thus P-Value (that is,
T tabulated) represents the effect of gender
on crowding levels. The decision rule is
that at the same degree of freedom, if the
P-Value is less than 0.05, the effect of
gender on crowding levels is classified as “significant”. This implies that at the same
degree of freedom, if the P-Value is higher
than 0.05, the effect of gender on crowding
levels is classified as “not significant”. The
inference from Table 2 shows that in all the
six apartment types investigated, the
gender of household head had no
significant effect on crowding levels, at
95% confidence level. Therefore, whether
the household head is a male or female is
not likely to be relevant in formulating an occupancy policy for LSDPC’s multifamily
apartments in the future.
Table 2 Effect of Gender on Crowding Levels
Apartment type Chi-square Value
X2
D.F.
P-Value
(T-
tabulated)
Remarks
Type one (two-bedroom), Abesan 1.978 2 0.372 Gender has no
significant effect on crowding level in all apartment types
Type two (two-bedroom), Dolphin II
0.536 2 0.765
Type three (three-bedroom), Abesan;
1.242 2 0.537
Type four (three-bedroom), Iba 2.771 2 0.250
Type five (three-bedroom),
Dolphin CONSTANT
Type six (four-bedroom), Ebute-Metta
1.721 2 0.423
Conclusion and Recommendation This research aimed to access whether
gender-based factors affect crowding in
LSPDC’s multifamily apartments in Lagos,
to an extent that it could influence the
agency’s disposition to deliver multifamily
apartments that are suitable for different genders to occupy and utilize.

Iweka & Adebayo Effect of Household Head’s Gender on Crowding in Government-Built Multifamily Apartments in Lagos
160
The results showed that for female-headed
households, apartments containing 3-5
occupants constitute the most dominant.
This result was replicated in all the male-
headed households investigated, where it was found that multi-family apartments
harbouring 3-5 occupants were most
dominant. The trend is the same as the case
of 1-2 persons crowding levels and in the
case of six persons or more crowding
levels. Since the trend is the same for each
of the three group measures adopted in this
research, it suggests that the effect of
gender on crowding levels was negligible.
Furthermore the inference from statistical
validation confirms that all the six apartment types, the gender of household
head had no significant effect on apartment
crowding. This finding tends to diffuse the
potential conflict of interests on the effects
of crowding on men’s and women’s
housing experience in the study area. It can
thus be argued that the outcome of this
research confirms that previously held
assumptions regarding male and female
gender differences in housing experience
do not extend to multifamily apartment crowding in LSPDC’s estates.
Nevertheless, the study found that in each
of the three categories of crowding level,
female-headed households were scanty and
figures obtained were proportionally very
low compared to male headed households.
It is hereby recommended that planning,
design and policy inclination towards
crowding in LSPDC’s multifamily
apartments should be based on gender
neutrality.
References Agbola, T. (1990). The nature of women’s
involvement in housing development:
A survey of the literature. African
Urban Quarterly, 5(3&4), 178-185. Asiyanbola, R. A. (2013). Urban housing
experience and gender: An empirical
study in Ibadan, Nigeria. Journal of
Geography and Geology, 5(1), 45-57.
Asiyanbola, R. A. & Filani, M. O. (2007).
Perception and involvement of
women in housing development in
Nigeria, Journal of Environment and
Culture, 4(2), 1-22.
Australian Bureau of Statistics, (2008).
Housing utilization. Year Book
Australia, 2008. Bammeke, F. (2010). Gender, household
headship and children’s educational
performance in Nigeria: Debunking
the myth of poor performance in
female-headed households. African
Population Studies, 24(1&2), 26-41.
Basavarajappa, K. G. (1998). Living
arrangements and residential
overcrowding: The situation of older
immigrants in Canada 1991. The
Analytical Studies Branch Research
paper Series No. 115, Statistics Canada, September.
Blank, S. (2013). An historical and
contemporary overview of gendered
Caribbean Relations Journal of Arts
and Humanities (JAH), 2 (4-May).
Dimitri, S. (2008). Addressing gender
issues through the production and use
of gender-sensitive information. The
African statistical Journal 7, 101-124.
Federal Republic of Nigeria, (2007).The
Nigerian Statistical fact Sheets on Economic and Social Development.
National Bureau of Statistics, Abuja.
Ibem, E. O. & Azuh D. E. (2013).
Satisfaction with public housing
among urban women in Ogun State,
Nigeria. Covenant Journal of
Research in the Built Environment
(CJRBE) 1(2), 67-90.
Iweka, A. C. O. (2013). Marital status and
crowding intensity: The case of
multifamily apartments in Lagos,
Nigeria. International Journal of Architecture and Urban Development
3(4), 35 – 40.
Iweka, A. C. O. (2012). A post-occupancy
evaluation of dwelling density in
multifamily apartments in public
housing estates in Lagos
(Unpublished doctoral dissertation).
University of Lagos.
Iweka, A. C. O., Adebayo, A. K., & Igwe,
J. M. (2009). Millennium development
goals and slum alleviation in developing nations: The challenge of

Environmental Technology & Science Journal Vol. 8 No. 2 December 2017
161
sufficient living area for households.
Paper presented at the International
Conference on Millennium
Development Goals and the Built
Environment, Obafemi Awolowo
University, Ile-Ife. Moser, C. (1987). Women, human
settlements and housing: a conceptual
framework for analysis and policy-
making. In C. Moser & L. Peake,
(eds). Women, human settlement, and
housing. London. Tavistock
Publications.
National Population Commission (Nigeria),
2000. Nigeria Demographic and
Health Survey 1999.
Ngaiza, M. K. (2010). Challenges of
gender mainstreaming with a male perspective: experiences from
Tanzania. In: M. Tadesse and A.
Daniel (eds.) Gender mainstreaming
experiences from Eastern and
Southern Africa. Addis Ababa:
Organization for Social Science
Research in Eastern and Southern
Africa (OSSREA) - Eastern Books
Collective
Olotua, A. O. & Ajayi, M. A. (2008).
Repositioning women in housing
development in Nigeria. Indian
Journal of Gender Studies, 15(1),
101-113.
Schluter, P., Carter, S., & Kokaua, J. (2007). Indices and perception of
crowding in pacific households
domicile within Auckland New
Zealand: Findings from the pacific
islands families study. The New
Zealand Medical Journal, 120(1248),
1-12.
Tester, G. M. (2007). The relational and
status foundation of gender
discrimination in housing. Doctoral
Dissertation. The Graduate School of
Ohio State University. UN-HABITAT, (2008). State of the
world’s cities 2008/2009 harmonious
cities. London: Earthscan.
United Nations Population Fund (UNFPA),
(2014). Methodological guidelines for
the gender analysis of national
populations and housing census data.
Technical Division of the United
Nations Population Fund (UNFPA)

Environmental Technology & Science Journal Vol. 8 No. 2 December 2017
1


Environmental Technology & Science Journal Vol. 8 No. 2 December 2017
162
Assessment of Skill Acquisition Techniques
for Architectural Training Using Students
Industrial Work Experience Scheme in
Kaduna Polytechnic-Nigeria.
Ryal-Net Marcus Balah 1; Obaje Juliet Azuka 2;
Boumann Ephraim Sule3
1&3 Department of Architecture, Kaduna Polytechnic, Kaduna.
Abstract Over the years, industries and the general public have expressed concern on the low capacity
of graduates in exhibiting the requisite skill for life of work after their training. This paper assessed the use of Students Industrial Work Experience Scheme (SIWES) towards
enhancing skill acquisition techniques for architectural training and practice. The
methodology adopted for the research was qualitative which included the use of interviews
and structured questionnaires for data collection, while the SPSS statistical tool was used for
the descriptive analysis of data collected. The population comprised of SIWES institutional
and industry supervisors and graduates from department of architecture Kaduna polytechnic.
The research established that enhancing skill acquisition technique for architectural training
and practice using the Students Industrial Work Experience Scheme in Kaduna Polytechnic
has a slightest mean response of 2.72 and 3.29 as the significant mean respond. The research
finding amongst others has implication on the effect of SIWES on skill acquisition in the
Department of Architecture in Kaduna Polytechnic. This is with respect to financing SIWES
trainee, management/office procedure, good work ethics and score in and the need for enhanced entrepreneur appetite by trainees including tools and facilities applications. The
paper concludes that enhancing skill acquisition techniques for architectural training and
practice using Students Industrial Work Experience Scheme in Kaduna Polytechnic is
significant and quite relevant to employability and real life of work in architecture.
Keywords: Architectural Training, Industrial Experience, Kaduna Polytechnic, Practice,
Skill Acquisition.
Introduction The opportunity provided to students of
higher learning through the Student Work Experience Scheme (SIWES), a mode of
industrial skill acquisition and a training
avenue for the seamless transition to work
life is quite central to employability of
graduates of all fields; particularly
Technical and Vocational Education and
Training (TVET) base courses (Aswaju,
1972; Abubakar & Mohammed, 1999;
Abubakar, 2001; Industrial Training Fund,
2002; Bukar, 2011; Dangana, 2011; Nse
2012). For accelerated development in Africa to occur, pragmatic technical and
technological base education must lead the
way rather than the idealist education style
that has been the trend (Bukar, 2011; Dangana, 2011; Umar, 2011).
Ugwuanyi and Ezema (2010) asserted that
practical knowledge relates to doing, and
that practical knowledge is learning
without which mastery of an area of
knowledge may be too difficult to achieve.
However, it is obvious that no society can
achieve meaningful progress, without
encouraging its youth to acquire necessary
practical skills and it is such skills that enable them to harness available resources

Ryal-Net, Obaje & Boumann Assessment of Skill Acquisition Techniques for Architectural Training Using Students Industrial Work Experience
Scheme in Kaduna Polytechnic-Nigeria.
163
towards meeting the needs of society.
Therefore, against this background SIWES
otherwise referred to as Industrial Training
(IT), was introduced in Nigerian tertiary
institutions. SIWES being a skill
development program was designed to prepare students of universities,
polytechnics/monotechnics, and colleges of
education for switch from the school
environment to the field of labour
(Akerejola 2008). Oyedele (1990) and
Ugwuanyi and Ezema (2010) also did
affirm that work experiences are
educational programs in which students
participate in work activities while
attending school.
The Student Industrial Work Experience Scheme (SIWES) therefore, is a central
part to the basic training requirement of
architectural technicians and technologists
in the Nigerian Polytechnic (as cited in
National Board for Technical Education
[NBTE], 2009). Essentially SIWES serves
as a medium to enhance a seamless
transition from training to work. A careful
observation seems to suggest that students’
rated performance during SIWES training
is not really a direct reflection of aptitudes being demonstrated by the students on
graduation or when employed (Wodi &
Dokubo, 2009; Okolocha & Okolocha,
2012). This state of affairs is creating a
great deal of concern as variously asserted
by (Wodi & Dokubo, 2009).
The problem of trained architectural
graduates’ capacity in the industry based
on acquired skill and actual work
competency demonstrated is a cause for
serious concern. Once this challenge is tackled frontally there would be a
momentous impact on the general world of
learning and the quality of trained
graduates of Architectural Technology
specifically. The various architectural firms
and construction companies will also gain
quality workforce and the nation would be
better developed.
The paper essentially identifies required
skills for architectural training and practice; established suitable techniques for skill
acquisition in architectural training and
practice through establishing whether
SIWES training enhances TVET skill
acquisition techniques in the Department of
Architecture, Kaduna Polytechnic and
making recommendation for skill acquisition in architectural training and
practice through industry based
collaboration.
Student Industrial Work Experience
Scheme (SIWES) Traditional education system emphasised dignity of labour, hard work, moral
instruction including emphasis on
traditions, culture, beliefs, attitudes and
peoples’ religion (Katola, 2014). Dangana
(2011) and Umar (2011) did affirm that
apart from the traditional educational
system, there are several other factors that
affected teaching and learning in Nigeria
that include, the Islamic, Christian
missionaries’ influences and then the
colonial heritage from the British.
According United Nations Conference on
Trade and Development [UNCTAD]
(2012), Nigeria educational systems have
been laden with internal/societal economic
imbalances considering the dynamics of
growth, development and change.
Therefore, for proper economic
development in the country our educational
component must include; requirement for
economic growth and socio-cultural
development, resource supplies of the economy, long production cycle of
education and educational change cum
quality for entrepreneurship (Wheeler,
1968; Asiwaju, 1972; Fabunmi, 2005;
Dangana, 2011; Umar, 2011; Azike, 2013).
The lack of adequate practical skills
preparatory for employment in industries
by Nigerian graduates of tertiary
institutions informed the establishment of
SIWES by the ITF in 1973 (SIWES, 2002). The scheme allows students to gain
industry based skills necessary for
transition from classroom to the world of
work and affords them the opportunity of
being familiarised and experienced in
handling machinery and equipment (ITF,
Environmental Technology & Science Journal Vol. 8 No. 2 December 2017
164
2002; Chodozie, 2009). It can be adduced
from Mafe (2009) that there are two basic
forms of learning; education and training,
both of which are indispensable to the
productive world of work and the
functioning of society today.
Skill Acquisition and Productive
Performance in Technical Vocational
Education and Training (TVET) Skill acquisition is a process of utilising one’s cognitive skills (thinking) alongside
physical abilities to learn how to execute
actions that were previously unknown in a
gradual developmental process (Huitt,
2011). TVET is concerned with acquisition
of knowledge and skills for the world of
work to increase opportunities for
productive work, sustainable livelihoods,
personal empowerment and socio-
economic development in knowledge
economics. Contemporary needs for employment requires meeting demands of
societies, thus the need for a combination
of knowledge, practical and social skills
that includes positive attitudes and the
ability to adopt to rapidly changing work
environments (Amasa, 1995; Krönner,
2006; Dangana, 2011; Nse 2012). There is
need to examine important matters relating
to changing world of work; the extent of
appraisal process effectiveness and the
relationship of the rating tools to the specific field of study/vocation being
trained for post-graduation assimilation (as
cited in UNESCO, 2004).
Technical Vocational Education and
Training (TVET) Skill Acquisition in
Architectural Training and its
Relevance. Professionally, an architect's decisions
affect public safety, and thus an architect or
architect technologist must undergo
specialised training consisting of advanced
education and a practicum (or internship)
for practical experience to earn a license to practice architecture at whatever level of
proficiency. The practical, technical and
academic requirements for becoming an
architect vary by jurisdiction (Architect
Act, 2006;). For this research, it is the place
of technical-practical skills on academic
learning environment that is the desire of
this inquiry.
The definition of Architecture according to
the Architects Registration Council of Nigeria (ARCON) amended decree section
13 of 1990 states:
“Architecture as the art and science in
theory and practice of design, erection,
commissioning, maintenance, management
and coordinating of allied professionals
thereto of buildings or parts thereof and
the layout and master plan of such building
or groups of building forming a
comprehensive institution establishment or
any other neighbourhood as well as any
other organized space, enclosed or opened, required for human and other activities.”
(as cited in Federal Government of Nigeria
[FGN], 1990).
Architecture does not only involve teaching
theory, but it is a verb ‘doing word’ which
requires training to apply the assumptions
being taught. Historically and from the
definitions above, it is clear that the
training of architects is centred on
demonstration of the trainee’s practical competency in actual work environment
and not only the acquisitions of certificates
as has been variously affirmed (FGN,
1990; Doshu, 2005;).
The strategic place of Technical Vocational
Education and Training (TVET) for
National development cannot be attained
without an appropriate curriculum
(Abubakar & Mohammed, 1999;
Abubakar, 2001; Maigida, et al., 2013).
NBTE (2009) further clearly stated that curriculum of all National Diploma (ND)
and Higher National Diploma (HND)
programmes are consisting of four main
components that include; General
Studies/Education, Foundation Courses,
Professional Courses and Supervised
Industrial Work Experience Scheme, this is
however being currently reviewed. TVET
is a concept that has reassessed the blooms
taxonomy of learning from its noun to verb
form where more active form of thinking is emphasised (Harrow, 1972; Krathwohl, et

Ryal-Net, Obaje & Boumann Assessment of Skill Acquisition Techniques for Architectural Training Using Students Industrial Work Experience
Scheme in Kaduna Polytechnic-Nigeria.
165
al., 1973; Huitt, 2011). It has set the basics
for review of the current curriculum on
architectural technological training under
NBTE guidance.
The architectural technologist is supposed to be complimentary to the university
graduates and not competing or struggling
in a conflicting role definition. It is quite
important to establish possible variance in
required training skill depending on the
institutional objectives. Specifically, these
greatly determine the nature and form of
the SIWES experience required of each
trainee accordingly. Polytechnic trained
graduates in architecture are supposed to
acquire practical skills in drafting, model
making, perspective drawing and data collection, while having an understanding
of organisational pattern and functional
system of an architectural-based
establishment. They should also be familiar
with general office procedures in the
establishment, appreciate basic building
site organisation and operations, including
production of a technical report on the
specific experience during the SIWES
(adapted from NBTE, 2009:150). Currently
there are no definite differences in assessment of university and polytechnic or
colleges of education trainees; this greatly
negates the individual institutions mandates
and their specific objectives.
The current observed skill capacity of most
polytechnic graduates and above all the
attitudes of those that have successfully
undergone SIWES training in addition to
the other relevant educational requirements
has become a source for concern. The
scored performance of the generality of students does not seem to be a reflection of
the exact reality of the competency
acquired by the individual after the
requisite training. It has been variously
demonstrated that most of the firms have in
place requisite equipment and qualified
industry base supervisors to expose the
students on methods and techniques in
handling equipment and machinery in the
industry (Doshu, 2005). The challenge of
this study is the appropriateness and effectiveness of rating of activities vice-a-
vice, the high scores and the constant
public and professional concern on the
poor skill acquired by graduates of
architecture at all levels. In other words,
how the rating of SIWES does during
architectural attachment relates to actual meaning and essence of architecture as
defined by ARCON.
SIWES and indeed TVET based programs
have to be responsive to the emerging
needs, concerns and issues for
employment, since without TVET being
relevant and responsive to skills needs in
the workplace, there is the danger of
learners completing their education and
training without employable skills and
knowledge. Hence, it is common practice in a number of countries to undertake
periodic reviews of their TVET system
(Adapted from Vocational Education
Research [VOCED], 2012). It is in this
light that current efforts by NBTE to
review curriculum of all courses to
conform to broad and specific goals needs
that can guarantee true competency is
commendable.
Strategies for Enhanced
Performance of SIWES Skill
Acquisition Techniques on TVET
Programs. In recent years there seems to be a
paradigm shift towards practical skills
training and also craving for innovation,
hence the need to make TVET more
attractive, effective and efficient (Abban &
Quarshie, 1996; Bhuwanee, 2006; Anaele,
2014). According to African Union (2007)
it is expected that TVET will promote skill
acquisition through competency-based
training. Hence the strategic place of trainees’ proficiency in any particular
chosen field of endeavour. TVET system
and programmes need to remain relevant
therefore should continually be renewed to
the changing demands of the workplace
and adaptable to the contemporary
challenges of training in the relevant field
of studies. Also the technological
innovations and dynamics of employment
must always be at the centre of all

Environmental Technology & Science Journal Vol. 8 No. 2 December 2017
166
strategies for enhanced performance
(Aswaju, 1972; Chidozie, 2009; Dasmani,
2011). While evaluating makes judgments
about the values of ideas or materials;
creating that is advocated by TVET builds
a structure or pattern from diverse elements. This diversity is the current crux
of thinking, innovation and change in all
fields globally (Pohl, 2000). This concept
being central to TVET should be adapted
into our education and training of
Architecture technologist.
“While education is the key to any
development process, TVET is the ‘Master
Key’ that can transform the world of work
and the economy, alleviate poverty, save
the environment and improve the quality of
life” (UNESCO, 2009).
Whatever policy and practice changes are
adopted for TVET, the following
comments seem pertinent because TVET
institutions, like others, cannot be operated
in isolation: Recognising that the vast
majority of the worldwide labour force,
including knowledge workers, require
technical and vocational skills throughout
life; the skills development leading to age-
appropriate TVET are integral to education at all levels, and can no longer be regarded
as optional or marginal. It is especially
important to integrate skills development in
Education for All (EFA) programmes and
to satisfy TVET demand created by
learners completing basis education.
The Relevance of SIWES to TVET
Programs and Architectural
Training and Practice. Practical skill acquisition can be hampered
by inadequate supply of instructional
materials, large class size, inadequate
training facilities and the glaring weak
linkage of training institutions with local
industries for hands-on-experience for both instructors and the trainees. This had
entrenched the ineffective and inefficient
training of students on TVET programs,
thereby leading to more emphasis on
passing final exams only (Dasmani, 2011).
Basically there are available various
training options for TVET programs, that
may include, ministry or agency supervised
institutions, workplace based training and
currently most suitable the combined
multiple type training that includes
sandwich and dual systems. Monitoring
and evaluating TVET performance and identifying the possibilities for improving
its quality and coverage require an
understanding of the nature of TVET, its
functions, goals including key
characteristics. This is where the SIWES
clearly comes to play and a suitable
adaptation in all sectors of TVET will be
most advisable for a guarantee
development.
Methodology
The research adopted the use of historical
and descriptive survey designs, this is
because both past researches and the
opinion of people on the subject under
study was required (Awotunde &
Ugoduluwa, 2004; Bukar, 2005; Centre for
Innovation in Research & Teaching
[CIRT], 2012). The study was conducted at
the Department of Architecture College of
Environmental Studies, Kaduna Polytechnic, Barnawa-Kaduna. The
College of Environmental Studies is one of
the five colleges in Kaduna Polytechnic,
made up of two schools namely the School
of Environmental Design and School of
Geodesy and Land Administration with
total of eight departments in all.
Department of Architecture is one of the
four departments in the School of
Environmental Design.
The major subject or respondents of this
study included the National Diploma (ND)
students in the Department of Architecture
of Kaduna Polytechnic which is about 247
(ND2-85; HND1-78; HND2-84) from
(Departmental Admission and Registration
Records, 2014), the institutional
(departmental) supervisors that are thirty
two (32) from staff disposition list of the
department and 15 industry/firm base
supervisors within Kaduna metropolis that
had supervised some ND students or graduates from the Department of
Architecture during their SIWES
programme.

Ryal-Net, Obaje & Boumann Assessment of Skill Acquisition Techniques for Architectural Training Using Students Industrial Work Experience
Scheme in Kaduna Polytechnic-Nigeria.
167
The study adopted the stratified random
sampling to collect data from the three
major strata of the students that have
undergone SIWES program at various
levels, academic staff that have supervised SIWES students and the industry base
supervisors from building industry firms
that are within Kaduna metropolis and had
supervised ND architectural technology
students from Kaduna Polytechnic. This
sampling technique was adopted to allow
proportionate representation from each of
the groups being studied (Awotunde &
Ugodulunwa, 2004; Bell, 2010). According
to Barttett (2001) assuming a confidence
level of ninety-five percent (95%) and
confidence interval of five percent (5%) the sample size for the student’s respondents to
be used is one hundred and thirty two (132)
respondents. However, considering the
limited number of the population of the
institutional and industry base supervisors,
about half of them were used as the sample
towards ensuring adequate and varied
responses. It is worthy to state here that
only industries where these Kaduna
Polytechnic students of Architecture had
undergone SIWES training under their supervision were considered amongst the
firms/industries within Kaduna metropolis.
Structured questionnaire was used for the
research and it clearly covered the various
effects of TVET skills acquisition
techniques adapted during SIWES training;
suitable techniques for skill acquisition in
architectural training and practice. Personal
experiences and discussion with industry
base supervisors, SIWES unit of the
institution and departmental SIWES officer also formed part of data collected. The
modified Likert scale of four points was
used and preferred towards ensuring
specific response that are explicit and
illuminating (Dallas, 2006:292).
The research instrument was validated first
on its face value with respect to the SIWES
component and general appropriateness
with the SIWES unit of the Polytechnic and
the departmental SIWES officer. The specific content validity of the
questionnaire was by experience experts in
the field of architectural training and
practice including a competent and
experienced statistician respectively. The
research used the reliability coefficient of
0.7 or more as basis to confirm the
instruments reliability. In administering the
research instrument, research assistants
were employed and liaised with
accordingly, right from the commencement
of the research study up until when the data was collected. All data collected from the
study was analysed using descriptive
statistical analysis through tables and chart
with the aid of the Excel package and
Statistical Package for Social Science
(SPSS) package 20. The four-point rating
scale was used which shows that response
1 is Highly Insignificant, 2-Insignificant, 3-
Significant and 4-Higly Significant.
Findings From Table 1 it was identified by most
respondents with respect to General Skills
that SIWES enhances Good Work Ethics
at significant mean response of 3.36 while
the least influenced of TVET skill
acquisition techniques during SIWES is
particularly Basic Literacy being at a
significant mean response of 2.97. Both the
least and highest mean responses showed that the identified parameters on TVET
skill acquisition stated above which were
enhanced using SIWES are mostly
considered as being significant.

Environmental Technology & Science Journal Vol. 8 No. 2 December 2017
168
Table 1: Mean Response on Enhancing General Skill Acquisition Techniques Using SIWES
General Skills Aspects N Sum Mean
Basic Literacy 100 297 2.97 Basic Oral Communication Skills 100 306 3.06 Numeracy Skills 99 305 3.08
ICT Skills 100 324 3.24 Honesty and Integrity 100 328 3.28 Good Work Ethics 100 336 3.36 Punctuality 100 325 3.25 Adaptability and Flexibility 100 303 3.03 Team Working Spirit 99 309 3.12 Etiquettes and Good Manners 100 315 3.15 Self Confidence 100 322 3.22 Appropriate Dressing 100 304 3.04
Networking Skills 100 303 3.03 Valid N (list wise) 98
Table 2 shows that Management Training
and Office Procedures Skill Acquisition
Techniques is being improved majorly in
an observed definite management and
organisational pattern of the industry/firm at 3.06 mean response and least enhanced
during SIWES in an observed deficient
skill acquisition of architectural and project
management services delivery during
tendering and award stage at 2.81 mean
response. Both the least considerable and
the most considerable parameters with
respect to Management Training and being
familiar with Office Procedures are here
considered as significant by most
respondents.
In Table 3 the mean response of 2.82 least
importance was computed as response for
model making skills acquired during
SIWES in terms of drawing, cutting and
assemblage; while the most enhanced skill acquisition techniques was considered as
design/drafting skill acquired using
computer during SIWES at 3.29 mean
responses. Considering the overall
responses, it can be adduced that
practical/technological employability skill
in acquiring practical skill on tools
application was adjudged as being
significant by most respondents.
Table 2: Mean Response Enhancing Management Training /Office Procedures Skill Acquisition
Techniques Using SIWES
Management Training /Office procedures Aspects N Sum Mean
Organogram that outlines hierarchy in management of the industry/firm
100 291 2.91
Observed definite management and organisational pattern in the industry/firm during SIWES
100 306 3.06
Perception of the functional management system of the architectural-based establishment during SIWES
100 296 2.96
There was observed deficient skill acquisition of architectural and project management services delivery at design stage during SIWES
100 300 3.00
There was observed deficient skill acquisition of architectural and project management services delivery at tendering and award stage during SIWES
100 281 2.81
There was observed deficient skill acquisition of architectural and project management services delivery at post construction period
100 291 2.91

Ryal-Net, Obaje & Boumann Assessment of Skill Acquisition Techniques for Architectural Training Using Students Industrial Work Experience
Scheme in Kaduna Polytechnic-Nigeria.
169
during SIWES There was observed deficient skill acquisition of architectural and project management services delivery at post construction period
during SIWES.
100 289 2.89
Valid N (list wise) 100
Table 3: Mean Respondent Enhancing Practical/Technological Employability Skill Acquisition
Techniques Using SIWES (Acquired Practical Skills in Tools Application).
Practical/Technological employability skill: Acquired practical skills in Tools Application.
N Sum Mean
Design/drafting skill acquired using computer during SIWES 100 289 2.89 Design/drafting skill acquired using computer during SIWES 100 329 3.29 Model-making skills acquired during SIWES (drawing, cutting and assemblage).
100 282 2.82
Perspective drawing/3-D computer modelling skills acquired during SIWES.
100 311 3.11
Data collection skill and analysis technique in case studies for
specific design was attained during SIWES. 100 309 3.09
Data collection skill and analysis for specific design and report purposes (literature reviews and relevant sketches) during SIWES.
100 301 3.01
SIWES as an integral component of architectural training program curriculum.
100 315 3.15
Valid N (list wise) 100
From Table 4 the computed mean response
of 2.72 was the least with respect to extent of perceived aptitudes in terms of
carpentry/woodwork activities and or
workshop usage during SIWES. The work
out figure however that was most
considerate base on respondents mean
response was 3.21, as being significant.
From the least and most considerate response, it can be adduced that the mean
response with respect to
practical/technological employability skills
is generally considered as significant by
most respondents.
Table 4: Mean Response on Enhancing Practical/Technological Employability Skill Acquisition
Techniques Using SIWES (Perceived Utilization of Critical Training Facilities).
Practical/Technological employability skills: perceived utilization of critical training facilities during SIWES
N Sum Mean
Extent of perceived aptitude in terms of structures and materials laboratories usage during SIWES
100 273 2.73
Extent of perceived aptitudes in terms of modelling activities and or workshop usage during SIWES.
100 282 2.82
Extent of perceived aptitudes in terms of carpentry/wood activities and or workshop usage during SIWES.
100 272 2.72
Extent of perceived aptitudes in terms of block laying and concrete activities and or workshop usage during SIWES.
100 285 2.85
Extent of perceived aptitudes in terms of mechanical/electrical activities and or workshop usage during SIEWS.
100 291 2.91
Extent of perceived aptitudes in terms of architectural/computer studio activities during SIWES (using various BIM tools, i.e.
AutoCAD, Revit, etc.).
100 321 3.21
Extent of perceived aptitudes in terms of photographic studio activities during SIWES (using cameras and processing the prints).
100 301 3.01
Extent of perceived aptitudes in terms of jury presentation involvement during SIWES (using traditional methods and contemporary IT tools, i.e. PPP, projector, etc.).
100 278 2.78
Extent of perceived aptitudes in terms of architectural/surveying equipment activities and or during SIWES.
100 280 2.80
Extent of perceived aptitudes in terms of duplicating/printing 100 277 2.77

Ryal-Net, Obaje & Boumann Assessment of Skill Acquisition Techniques for Architectural Training Using Students Industrial Work Experience
Scheme in Kaduna Polytechnic-Nigeria.
1
facilities usage during SIWES.
Valid N (list wise) 100
Source: Authors Field Survey (2015)
The four variables administered on
enhancing TVET Skill Acquisition
Techniques with respect to General Skills,
Management Training, Office Procedures, Tools and Facilities Application during
SIWES did indicate a mean response level
as being significant by most respondents
considering all parameters.
Discussions (a) The most noteworthy aspect/factor
TVET skill acquisition techniques based on
general skills during SIWES was
considered as Good Work Ethics, with the least important effect as Basic Literacy.
(b) The least improved TVET skill
acquisition techniques during SIWES with
regard to management training and office
procedures is in the observed deficient skill
acquisition of architectural and project
management services delivery during
tendering and award stage. However, the
most considerable aspect is in the observed
definite management and organisational pattern of the industry/firm.
(c) The least important enhanced TVET
skill acquisition techniques in
practical/technological employability skill
for tool application was in model making
skills acquired during SIWES in terms of
drawing, cutting and assemblage; while the
most important effect was considered as
design/drafting skill acquired using
computer during SIWES.
(d) The enhanced TVET skill acquisition
techniques in practical/technological
employability in terms of perceived
utilization of critical training facilities
during SIWES was most momentous in the
extent of perceived aptitudes in terms of
architectural/computer studio activities. It
was however least considerate in the
perceived aptitudes in terms of
carpentry/wood work activities and
workshop usages.
Conclusion TVET skill acquisition techniques base on
general skills during SIWES was
considered most noteworthy in good work
ethics, while for management and office
procedures was most considerable in the
management and organisational pattern of
the industry/firm. Furthermore skill for tool
application has most important effect in
design/drafting skill acquired using
computer during SIWES and perceived
utilization of critical training facilities
during SIWES was most momentous in the observed extent of perceived aptitudes in
terms of architectural/computer studio
activities by all respondents. In similar
vein, Maigida, et al. (2013) as well as
Abdullahi and Mohammed (1999) did
appropriated enhancement of TVET
training to adapting relevant component
units of activities. Also Harrow (1972),
Krathwohl ‘et al’, (1973) and Huitt (2011)
advocates TVET building structures or
pattern for various elements.
Recommendations The government should prioritize
giving jobs to the indigenous
industries so that these industries will
have the willingness, opportunity,
manpower and courage to accommodate students for Industry
Training (IT).
Adopt and implement policy
frameworks that will foster innovation
in the building sector, supporting and
enabling sustainable training and
practice in TVET orientated courses.
Industries should foster changes in
their production pattern and educate
the students on the new
methods/techniques and the benefits to ensure long-term performance and
passage of the knowledge or ideas.
The industries should help boost the
practice by providing placements for
Environmental Technology & Science Journal Vol. 8 No. 2 December 2017
.
171
students to participate and carry out
trainings.
Well thought and mapped out
objectives and training plan/goals
should be provided by the industries
on the training for the students in liaison with ITF for better skill
acquisition technique amongst trainee.
The polytechnic and architecture
education regulator bodies that is
National Board for Technical
Education (NBTE), Nigeria Institute of
Architects (NIA) and Architects
Registration Council of Nigeria
(ARCON) should ensure that the
curriculum of architectural training are
updated to match with international
best practices, the world of work and to include leadership training and
management capabilities abilities.
Institutions should ensure that the
students participate in the industrial
training by paying visits to the places
of attachment since the effective
training of the students during those
periods aids teaching and learning
process. This in turn is beneficial to
the student who is placed in a better
pedestal for self-reliance, the institution having better products that
are ready for employment and general
development of the nation.
The students should be mandated to go
for SIWES on relevant skill training
and should be effectively monitored
and assessed by both the institutions
and industries.
References Abban, C., & Quarshie, J. (1996).
Integrated skills training for self-
employment: The case of Ghana. In
Grierson, J.P. & Mckenzie I. (Eds):
Training for self-employment through
vocational training institutions. Turin,
Italy: ILO International Training
Centre.
Abubakar, M.S. (2001). Curricullum
design in technical and vocational
education. A paper Presented During the First Curriculum Review
Workshop Organised under the
UNESCO-Nigeria Project on the
Revitalisation of Technical and
Vocational Education in Nigeria.
Held at Excellence Hotel, Lagos from
25th June to 6th July, 2001.
Abubakar, M.S. & Mohammed, M. B.
(1999). Curriculum in the polytechnic sector: accreditation and beyond.
Being a paper presented at the
International Conference on
Challenges of Polytechnics in Africa
in the Next Millennium and the Way
Forward. Held at the Kaduna
Polytechnic from 9th to 11th
November, 1999.
African Union (2007). Strategy to
revitalize technical and vocational
education and training (TVET)
in Africa. Addis Ababa: Final Draft. Bureau of the Conference of
Ministers of Education of the
African Union (COMEDAF II+)
Akerejola, O. (2008). Information and
guidelines for students industrial
work experience scheme. Retrieved
on 23rd March, 2012 from
http://www.itf-nigeria.org/docs/siwes-
op-guide.pdf
Amasa, G. D. (1995). Strategies for
improving partnership between industries and technical institutions
for effective vocational training.
Unpublished M.Ed. Thesis,
Department of Vocational Teacher
Education, University of Nsukka.
Anaele, E. O., Adelakun, O. A., Olumoko,
B. O., & Kanu, J. A. (2014).
Strategies for empowering individuals
for self-employment through
technical, vocational education and
training (TVET) in Nigeria.
International Journal of Education Learning and Development, 2(3),
pp.1-9. Retrieved on from
http://www.eajournals.org/wp-
content/uploads/Strategies-for-
Empowering-Individuals-for-Self-
employment-through-Technical-
Vocational-Education-and-Training-
TVET-in-Nigeria.-Recovered.pdf
Architect Act (2006). An act respecting the
practice of architecture. Bill N0.115
as passed with Amendments. Nova Scotia, Canada.

Ryal-Net, Obaje & Boumann Assessment of Skill Acquisition Techniques for Architectural Training Using Students Industrial Work Experience
Scheme in Kaduna Polytechnic-Nigeria
172
Asiwaju, A.I. (1972). Ashby revisited: A
review of Nigeria’s educational
growth, 1961-1971. JSTOR: African
Studies Review, 15(1):1-16.
Awotunde, P. O. & Ugodulunwa, C. A.
(2005). Research methods in education. Jos: Fab Anieh (Nig)
limited.
Azike, A. A. (2013). Historical analysis of
constitutional provision for education
in Nigeria (1976 -2011): Implication
for educational administration.
Journal of Social Sciences and
Humanities, 4(3). Retrieved on
15/09/2013 from
http://www.savap.org.pk/journals/AR
Int./Vol.4(3)/2013(4.3-40).pdf
Barttett, J. (2001). Research methods in education. Bolden Tyne and Wear,
Great Britain: Wearset Limited: 48-
49.
Bell, J. (2010). Doing your research
project: A guide for first time
researchers. (5th ed.). Milton Keynes,
United Kingdom: Open University
Press.
Bhuwanee, T. (2006). Reforming technical
and vocational education in Sub-
Saharan Africa: Case studies of Ghana - Mauritius - Tanzania and
Zimbabwe. Dakar, Senegal: BREDA.
Bukar, B. (2011). History of TVE: Early
development of technical education in
Nigeria. Lecture Notes for History of
Technical Vocational Education and
Training (EDT. 603). Post Graduate
Diploma in Technical Education
(Special), Kaduna Polytechnic,
Kaduna.
Centre for Innovation in Research &
Teaching [CIRT] (2012). Basic research designs. Retrieved on
12/03/2013 from
https://cirt.gcu.edu/research/developm
entresources/tutorials/researchdesigns
Chidozie, O. K. (2009). A report on the students’
industrial work experience scheme
(SIWES) carried out at atiteco Nigeria
limited. Prepared for Human Resources
Department Telnet Nigeria Limited, Victoria
Island,Lagos, Lagos State.
Dallas, M. F. (2006).Value and risk management: A guide to best
practice. Oxford, UK: Blackwell
Publishing.
Dangana, D. M. (2011). Factors that
Influence the system of TVET
education in Nigeria. Lecture Notes
on Curriculum Development in Technical Education Vocational
Education and Training (TVET-
EDT.609). Post Graduate Diploma in
Technical Education (Special),
Kaduna Polytechnic, Kaduna.
Dasmani, A. (2011). Challenges facing
technical institute graduates in
practical skills acquisition in
the upper east region of Ghana. Asia
Pacific Journal of Cooperative
Education 12(2): 67-77.
Doshu, R.G. (2005). A Follow-up Study on the Performance of HND (Arch.)
Graduates of Kaduna Polytechnic in
Kaduna State. PGDE Research
project, Kaduna Polytechnic, Kaduna
,2005).
Fabunmi, M. (2005). Historical analysis of
educational policy in Nigeria:
Implication for educational planning
and policy. International Journal of
African and African American
Studies. IV(2):1-7. Federal Government of Nigeria [FGN]
(1990). Architects Registration
Council of Nigeria (ARCON)
Amended Decree. Lagos: Federal
Government of Nigeria [FGN] Press.
Federal Government of Nigeria [FGN]
(2004). National policy on education.
Lagos: Nigeria Educational Research
and Development Council (NERC).
Harrow, A. (1972). Taxonomy of
psychomotor Domain: A Guide for
Developing Behavioural Objectives. New York: David McKay.
Huitt, W. (2011). Bloom et al.'s taxonomy
of the cognitive domain. Educational
Psychology Interactive. Retrieved
[date], from
http://www.edpsycinteractive.org/topi
cs/cogsys/bloom.html [pdf]
Industrial Training Fund [ITF], (2002).
Information and guideline for student
industrial work experience scheme.
Retrieved on 25th March, 2012 from
Environmental Technology & Science Journal Vol. 8 No. 2 December 2017
.
173
http://odich.com/itfnig/docs/siwes-op-
guide.pdf
Katola, M. T. (2014). Incorporation of
traditional African cultural values in
the formal education system for
development, peace building and good governance. European Journal
of Research in Social Sciences, 2(3).
Retrieved on 21/03/2015 from
http://www.idpublications.org/wp-
content/uploads/2014/07/incorporatio
n-of-traditional-african-cultural-
values-in-the-formal-education-
system-for-development-peace-
building-and-good-governance.pdf
Krathwohl, D. R., Bloom, B. S., & Masia,
B. B. (1973). Taxonomy of
educational objectives, the classification of educational goals.
Handbook II: Affective Domain. New
York: David McKay Co.,Inc.
Krathwohl, D. (2002). A revision of
Bloom's taxonomy: An overview.
Theory into Practice, 41(4), 212-218.
Retrieved on 23/03/2011
fromhttp://www.unco.edu/cetl/sir/stati
ng_outcome/documents/Krathwohl.pd
f
Krönner, H. (2006). National workshop on technical and vocational education
and training. Pyongyang Democratic
People’s Republic of Korea 30
August to 01 September 2006.
Retrieved on 15-05-12 from
http://www.intervoc.de/DPRK/DPRK
-TVET-Module_2.pdf
Mafe, O. A. T. (2009). Effectiveness of
SIWES with respect to chemical
engineering. European Journal of
Social sciences. 7(3).
National Board for Technical Education [NBTE] (2009). Curriculum for
technical colleges and polytechnics.
Kaduna: National Board for
Technical Education (NBTE).
Nse, J. (2012). Evaluation of student
industrial work experience scheme
(SIWES) in library school: the federal
polytechnic Nekede experience.
Journal of Library Philosophy and
Practice. Retrieved on 17th May,
2013 from http://unillib.unl.edu/LPP/
Maigida, J.F., Sada, T.M., & Namkere J. U.
(2013). Entrepreneurial skills in
technical vocational education and
training as a strategic approach for
achieving youth empowerment in
Nigeria. International Journal of Humanities and Social Science, 3(5).
Okolocha, C. C. & Okolocha, C. B. (2012).
Students' entrepreneurial skill
acquisition through SIWES in
Nigeria: An Analytical Approach.
International Journal of Independent
Research and Studies. 1(3), 97-105.
Oyedele, J. P. (1990). Co-operative work
experience programme for youths in
business education. Business
Education Journals 2: 30-53.
Pohl, M. (2000). Learning to think. thinking to learn: models and
strategies to develop a classroom
culture of thinking. Chelternham, Vic:
Hawker Browlow.
Students Industrial Work Experience
Scheme [SIWES], (2002).
Information and guidelines for SIWES
review. Pp1.41.
Ugwuanyi, C. F. & Ezema, J. U. (2010).
Challenges of students’ industrial
work experience scheme (SIWES) in library and information science in the
ict environment. Library Philosophy
and Practice (e-journal). Paper 401.
Retrieved on 24th March, 2012 from
http://digitalcommons.unl.edu/libphil
prac/401
Umar, L. K. K. (2011). History of
curriculum development efforts in
Nigeria. Lecture Notes on Curriculum
Development (EDU. 209). Post
Graduate Diploma in Technical
Education (Special), Kaduna Polytechnic, Kaduna.
United Nations Conference on Trade and
Development [UNCTAD] (2012).
Economic development in Africa
report 2012: Structural
transformation and sustainable
development in Africa. United
Nations Conference on Trade and
Development. Retrieved on from
http://unctad.org/en/PublicationsLibra
ry/aldcafrica2012_embargo_en.pdf

Ryal-Net, Obaje & Boumann Assessment of Skill Acquisition Techniques for Architectural Training Using Students Industrial Work Experience
Scheme in Kaduna Polytechnic-Nigeria
174
United Nations Educational, Scientific and
Cultural Organisation [UNESCO]
(2004). TVET for Sustainability of
human kind. Bonn Declaration on
Learning for work, Citizenship and
Sustainability at UNESCO Conference.
United Nations Educational, Scientific and
Cultural Organisation [UNESCO]
(2009). Bonn Declaration. UNESCO
World Conference on Education for
Sustainable Development held in
Bonn, Germany on 31 March to 2
April 2009. Retrieved on 24th March,
2012 from
http://www.esd‐world‐conference‐200
9.org/fileadmin/download/ESD2009_BonnDeclaration080409.pdf
Vocational Education Research [VOCED]
(2012). Development of TVET systems
and strengthening of national
research and development
capabilities. a guide for managers of
TVET. Adelaide, South Australia: National Centre for Vocational
Education Research. Retrieved on
December, 13th 2011 from VOCED:
http://www.ncver.edu.au/voced.htm
Wheeler, A. C. R. (1968). The organisation
of educational planning in Nigeria.
Paris, France: UNESCO.
Wodi, S.W. & Dokubo, A. (2009).
Appraisal of students work
experience scheme (SIWES) in five
tertiary institutions in Rivers State
Nigeria. European Journal of Social Sciences. 7(3). Pp42-51
.
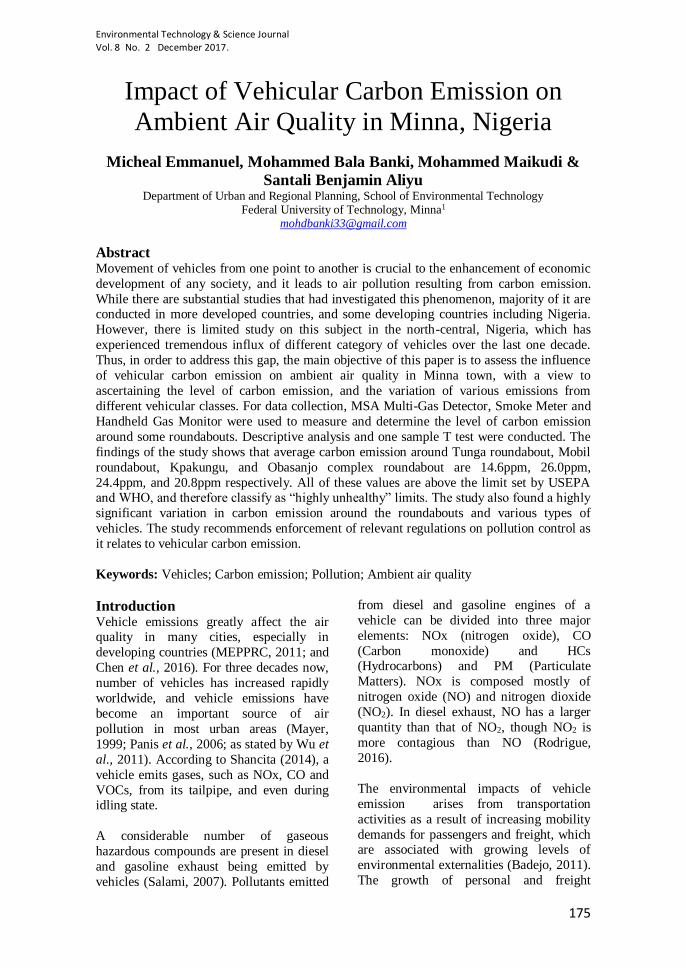
Environmental Technology & Science Journal Vol. 8 No. 2 December 2017.
175
Impact of Vehicular Carbon Emission on
Ambient Air Quality in Minna, Nigeria
Micheal Emmanuel, Mohammed Bala Banki, Mohammed Maikudi &
Santali Benjamin Aliyu Department of Urban and Regional Planning, School of Environmental Technology
Federal University of Technology, Minna1 [email protected]
Abstract Movement of vehicles from one point to another is crucial to the enhancement of economic
development of any society, and it leads to air pollution resulting from carbon emission.
While there are substantial studies that had investigated this phenomenon, majority of it are conducted in more developed countries, and some developing countries including Nigeria.
However, there is limited study on this subject in the north-central, Nigeria, which has
experienced tremendous influx of different category of vehicles over the last one decade.
Thus, in order to address this gap, the main objective of this paper is to assess the influence
of vehicular carbon emission on ambient air quality in Minna town, with a view to
ascertaining the level of carbon emission, and the variation of various emissions from
different vehicular classes. For data collection, MSA Multi-Gas Detector, Smoke Meter and
Handheld Gas Monitor were used to measure and determine the level of carbon emission
around some roundabouts. Descriptive analysis and one sample T test were conducted. The
findings of the study shows that average carbon emission around Tunga roundabout, Mobil
roundabout, Kpakungu, and Obasanjo complex roundabout are 14.6ppm, 26.0ppm,
24.4ppm, and 20.8ppm respectively. All of these values are above the limit set by USEPA and WHO, and therefore classify as “highly unhealthy” limits. The study also found a highly
significant variation in carbon emission around the roundabouts and various types of
vehicles. The study recommends enforcement of relevant regulations on pollution control as
it relates to vehicular carbon emission.
Keywords: Vehicles; Carbon emission; Pollution; Ambient air quality
Introduction Vehicle emissions greatly affect the air quality in many cities, especially in
developing countries (MEPPRC, 2011; and
Chen et al., 2016). For three decades now,
number of vehicles has increased rapidly
worldwide, and vehicle emissions have
become an important source of air
pollution in most urban areas (Mayer,
1999; Panis et al., 2006; as stated by Wu et
al., 2011). According to Shancita (2014), a
vehicle emits gases, such as NOx, CO and
VOCs, from its tailpipe, and even during idling state.
A considerable number of gaseous
hazardous compounds are present in diesel
and gasoline exhaust being emitted by
vehicles (Salami, 2007). Pollutants emitted
from diesel and gasoline engines of a
vehicle can be divided into three major
elements: NOx (nitrogen oxide), CO
(Carbon monoxide) and HCs (Hydrocarbons) and PM (Particulate
Matters). NOx is composed mostly of
nitrogen oxide (NO) and nitrogen dioxide
(NO2). In diesel exhaust, NO has a larger
quantity than that of NO2, though NO2 is
more contagious than NO (Rodrigue,
2016).
The environmental impacts of vehicle
emission arises from transportation
activities as a result of increasing mobility
demands for passengers and freight, which are associated with growing levels of
environmental externalities (Badejo, 2011).
The growth of personal and freight

Emmanuel, Banki, Maikudi & Santali Impact of Vehicular Carbon Emission on Ambient Air Quality in Minna, Nigeria
176
mobility in recent decades have expanded
the role of transportation as a source of
emission of pollutants and their multiple
impacts on the environment (Rodrigue et
al., 2016).
The adverse effects of vehicular carbon
emission is heavily documented in the
literature, and while the dominance of this
kind of study is on many cities and towns
in developed countries and some
developing countries, very few have been
conducted on cities and towns in Nigeria.
There is clearly a dearth of this nature of
study in Nigeria north-central region,
which is currently experiencing increasing
influx of vehicles of various categories.
Therefore, in addressing this gap, the main objective of this paper is to assess the
influence of vehicular carbon emission on
ambient air quality in Minna town with the
view to ascertaining the level of carbon
emission and variation of various emissions
from different vehicular classes. .
Study Area Minna lies at latitude 9o 37’ North and
longitude 6o 33’ East on a geography base
of undifferentiated Basement Complex of
mainly gneiss and magmatite. The Town
has a mean annual precipitation of
1300mm, taken from an exceptionally long
record of 50 years. The highest mean
monthly rainfall is in September with almost 3000mm. The raining season starts
on average between the 11th -20th April,
and lasts between 190 and 200 days.
Temperature rarely falls below 22o C. The
peaks are 40o C (February-March) and 35o
C (November-December). Minna City is
both the administrative headquarters of
Niger State and Chanchaga Local
Government Area. The City has 2017
estimated population of 489,351. It covers
approximately 1000Ha (Maxlock, 1980).
According to the Niger State Board of Internal Revenue (BIR) (2017), a total of
13,729 vehicles were registered in Minna
from September, 2013-December 2016.
This includes motorcycles, tricycles, cars,
buses, light and heavy trucks. Figure 1.1
shows street guide map of Minna showing
major roundabouts, while figure 1.2 shows
selected traffic light points.
Figure 1.1: Street Guide Map of Minna Showing Major Roundabouts

Environmental Technology & Science Journal Vol. 8 No. 2 December 2017.
177
Figure 1.2: Street Guide Map of Minna Showing Major Junctions
Literature Review
Transportation and Greenhouse Gas
Emission Transportation is the major contributor of
air pollution accounting for over 80 percent
of total air pollutants (UN Habitat’s State
of the World Cities 2008/2009). According
to USEPA (2014), greenhouse gas
emissions from transportation accounted
for about 26 percent of total U.S.
greenhouse gas emissions, making it the
second largest contributor of U.S. greenhouse gas emissions after
the electricity sector. US Environmental
Protection Agency (EPA) (2014) indicates
that the transportation sector includes the
movement of people and goods by cars,
trucks, trains, ships, airplanes, and other
vehicles. Majority of greenhouse gas
emissions from transportation are carbon
monoxide (CO), carbon dioxide (CO2),
sulphur dioxide (SO2) and nitrogen oxide
(NOx) emissions resulting from the combustion of petroleum-based products,
such as gasoline, internal combustion
engines. Fossil fuel usage is the primary
source of CO2. The transportation sector
directly accounted for about 28 percent of
total U.S. GHG emissions in 2006, making
it the second largest source of GHG
emissions after electricity generation (UN
Habitat’s State of World Cities 2008/2009).
NESREA (2014) noted that air pollution
can occur inside homes, schools, and
offices; in cities; and across continents.
Major air pollutants which can be experienced at any given time include:
Oxides of Nitrogen (NOX), Oxides of
Sulphur (SOX), Carbon monoxide (CO),
Ozone (O3), Hydrogen sulphide (H2S),
Methane (CH4), Total Non-methane
Hydrocarbon (TNMHC), Particulate Matter
(PM) and Volatile Organic
Chemicals/Compounds (VOCs).Vlieger et
al.,(2010) stated that the largest sources of
transportation GHGs in 2006 were
passenger cars (34%) and light duty trucks, which include sport utility vehicles, pickup
trucks, and minivans (28%). Together with
motorcycles, these light-duty vehicles
made up about 63% of transportation GHG
emissions. The next largest sources were
freight trucks (20%) and commercial
aircraft (7%), along with other non-road
sources, which combined totalled about
7%. These figures include direct emissions
from fossil fuel combustion, as well as

Emmanuel, Banki, Maikudi & Santali Impact of Vehicular Carbon Emission on Ambient Air Quality in Minna, Nigeria
178
HFC emissions from mobile air
conditioners and refrigerated transport
allocated to these vehicle types.
In Nigeria, little attention is given to
pollution caused by mobile transportation which is a source of air pollution according
to Abam (2009) and Nwachukwu (2012).
The situation of increased pollution from
mobile transportation source is as a result
of increase in private and public vehicle
ownership, thus resulting in high road
congestion in cities and towns in Nigeria,
and increase in the concentration of
pollutants in the air, resulting in increased
health risk of human population (Odotong,
2015). Studies conducted in Kaduna and
Abuja cities show higher values of CO2concentration in heavily congested
areas: 1840ppm was recorded for Sabo in
Kaduna city, 1780ppm for Stadium
roundabout in Kaduna city, and 1530ppm
for A.Y.A in Abuja city, 1160ppm for
Asokoro in Abuja city (Hassan et al.,
2012).
Materials and Methods Instrument for Data Collection:
The following instruments were used:
Digital Camera, Hand held GPS (Garmin,
etrex10 model), and the MSA Altair 5X
Multi-gas Detector. The MSA Altair 5X
Multi-gas Detector of version SW 1.27.06.50 is a portable hand held device
used to measure the concentration of gases
in the environment. The device monitors
gases in ambient air, and is available with a
maximum of four sensors, which can
display readings for five separate gases
(one Dual Toxic Sensor provides both CO
and H2S sensing capabilities in a single
sensor), Oxygen (O2) and 2 combustible
gases including Pentane. For the purpose of
this research, 7 of out of the 13
roundabouts in Minna were considered for the study. They are: Tunga roundabout,
Kpakungu roundabout, Mobile roundabout,
Obasanjo Complex roundabout, Maitumbi
roundabout, Minna City-Gate roundabout,
and Paiko roundabout. The factors
considered for selection include; volume of
traffic generated, hierarchy of the road,
activities along/ adjacent the route, and
busy nature of the roads. Also, 3 of the
major traffic junctions out of the 7
junctions identified were selected for the
research due to the traffic generated and
clustered nature of the roads. The ambient air monitoring procedure was adopted
using the description made by Harrop
(2002) and Robert (2004).
During the atmospheric measurement, air
samples were measured in part per million
(ppm) at a height of 1 metres above the
ground level at each of the graded distances
of 1 metres from the road. An approximate
distance of 0.27 metres from the tail pipe of
idling vehicles was adopted for the second
strategy. This measurement was done at the windward direction. Carbon emission
levels at the roundabouts were taken at
three distinct period of the day; 8am-10am,
12pm-2pm, and 4pm-6pm and the
collection of air samples was measured on
site. Second by second measurement with
an interval of 2-3 seconds was adopted.
The second by second emission data
provides a better method for the
development of models for estimating
vehicular emission. A GPS receiver was used to record the positional status of all
the major roundabouts and junctions. The
collected data was analysed using SPSS 22,
where descriptive analysis and one sample
T test was conducted. The results of
analysis are presented in charts and tables.
Results and Discussion
Average Level of Carbon Emission
at Selected Roundabouts in Minna The average daily carbon emission at the
selected roundabouts in Minna ranges from
14.6ppm at Tunga roundabout to as high as
26.0ppm at Mobile roundabout. This is
presented in Table 4.1. The result shows
that the average carbon emission around selected roundabouts in the city is
19.7ppm. Mobile roundabout recorded the
highest average carbon emission of
26.0ppm, followed by Kpakungu and
Obasanjo Complex with 24.4ppm and
20.8ppm values respectively. These three
(3) Roundabouts recorded higher carbon

Environmental Technology & Science Journal Vol. 8 No. 2 December 2017.
179
emission than Minna City-Gate
roundabout. The average carbon emission
at Minna City-Gate roundabout is 18.3ppm,
Paiko roundabout recorded 17.6ppm,
Maitumbi roundabout recorded 16.3ppm,
while the lowest value (14.6ppm) was recorded at Tunga roundabout.
The United States Environmental
Protection Agency (USEPA, 2015)
identified six levels of carbon emission,
and their health implication. Going by their
standard, six (6) out of the seven (7)
selected roundabouts recorded carbon
emission that falls under the very unhealthy
level (see table 4.1). Carbon emission value
recorded at Tunga roundabout is unhealthy
for sensitive group of people (Asthmatic).
Therefore, majority of the roundabouts in
Minna experiences high concentration of
CO2 that is harmful to man. Excessive
concentration of CO2 in the atmosphere
according Bascom, et al (1996) can reduce
the oxygen carrying capacity of blood which might affect the sensitive organs of
the human body such as the heart and
brain. Similarly, USEPA (2015) reveals
that acute exposure to vehicles’ emission
over a period of time reduces lung
function. Furthermore, Balogun (2015)
noted that vehicle that produces excessive
smoke (smoke could be gray, blue, white or
black depending on the engine’s state) on
the road can affect visibility, thereby
causing Road Traffic Crash (RTC).
Figure 4.1: Vehicular Emission around Selected Roundabouts in Minna
Table 4.1 Daily Average Carbon Emissions at Selected Roundabouts in Minna
Roundabout
Location
Daily Average Carbon Emission Remark
Tunga 14.6 Unhealthy for sensitive groups
Kpakungu 24.4 Highly Unhealthy
Mobile 26.0 Highly Unhealthy
Obasanjo 20.8 Highly Unhealthy
Maitumbi 16.3 Highly Unhealthy
City Gate 18.3 Highly Unhealthy
Paiko 17.6 Highly Unhealthy
City Mean 19.7 Highly Unhealthy
Note that: 0-4.4ppmc = Good, 4.5-9.4ppmc = Moderate, 9.5-12.4ppm = Unhealthy for Sensitive groups,
12.5-15.4ppm = Unhealthy, 15.5-30.4ppm = Highly unhealthy, 30.5-50.4ppm = Hazardous (USEPA, 2015)
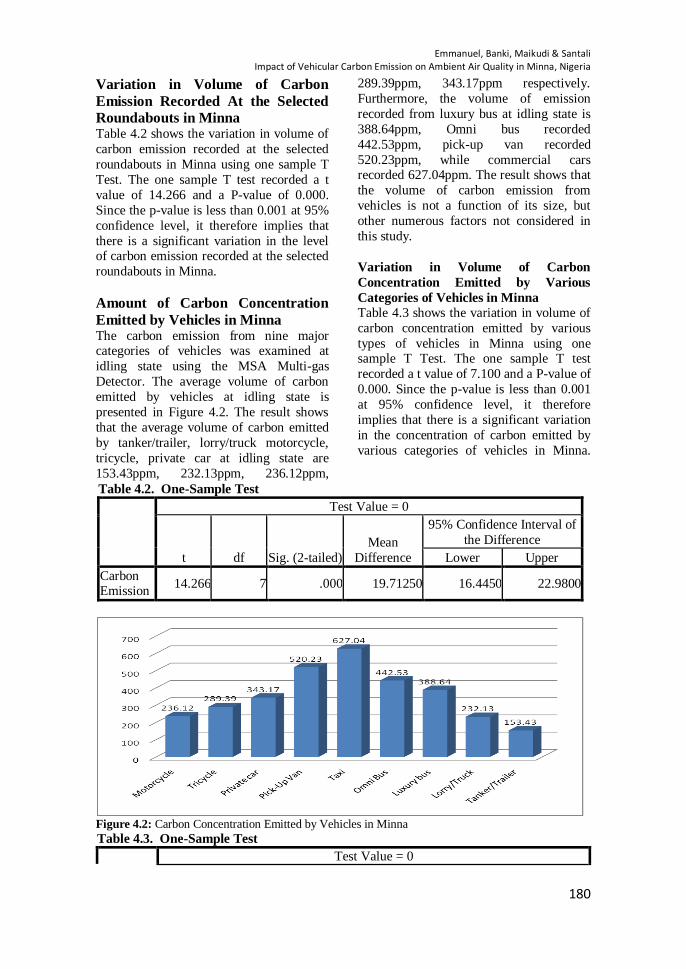
Emmanuel, Banki, Maikudi & Santali Impact of Vehicular Carbon Emission on Ambient Air Quality in Minna, Nigeria
180
Variation in Volume of Carbon
Emission Recorded At the Selected
Roundabouts in Minna Table 4.2 shows the variation in volume of
carbon emission recorded at the selected
roundabouts in Minna using one sample T
Test. The one sample T test recorded a t
value of 14.266 and a P-value of 0.000.
Since the p-value is less than 0.001 at 95%
confidence level, it therefore implies that
there is a significant variation in the level of carbon emission recorded at the selected
roundabouts in Minna.
Amount of Carbon Concentration
Emitted by Vehicles in Minna The carbon emission from nine major categories of vehicles was examined at
idling state using the MSA Multi-gas
Detector. The average volume of carbon
emitted by vehicles at idling state is
presented in Figure 4.2. The result shows
that the average volume of carbon emitted
by tanker/trailer, lorry/truck motorcycle,
tricycle, private car at idling state are
153.43ppm, 232.13ppm, 236.12ppm,
289.39ppm, 343.17ppm respectively.
Furthermore, the volume of emission
recorded from luxury bus at idling state is
388.64ppm, Omni bus recorded
442.53ppm, pick-up van recorded
520.23ppm, while commercial cars recorded 627.04ppm. The result shows that
the volume of carbon emission from
vehicles is not a function of its size, but
other numerous factors not considered in
this study.
Variation in Volume of Carbon
Concentration Emitted by Various
Categories of Vehicles in Minna
Table 4.3 shows the variation in volume of
carbon concentration emitted by various
types of vehicles in Minna using one sample T Test. The one sample T test
recorded a t value of 7.100 and a P-value of
0.000. Since the p-value is less than 0.001
at 95% confidence level, it therefore
implies that there is a significant variation
in the concentration of carbon emitted by
various categories of vehicles in Minna.
Table 4.2. One-Sample Test
Test Value = 0
t df Sig. (2-tailed)
Mean
Difference
95% Confidence Interval of
the Difference
Lower Upper
Carbon Emission
14.266 7 .000 19.71250 16.4450 22.9800
Figure 4.2: Carbon Concentration Emitted by Vehicles in Minna
Table 4.3. One-Sample Test
Test Value = 0
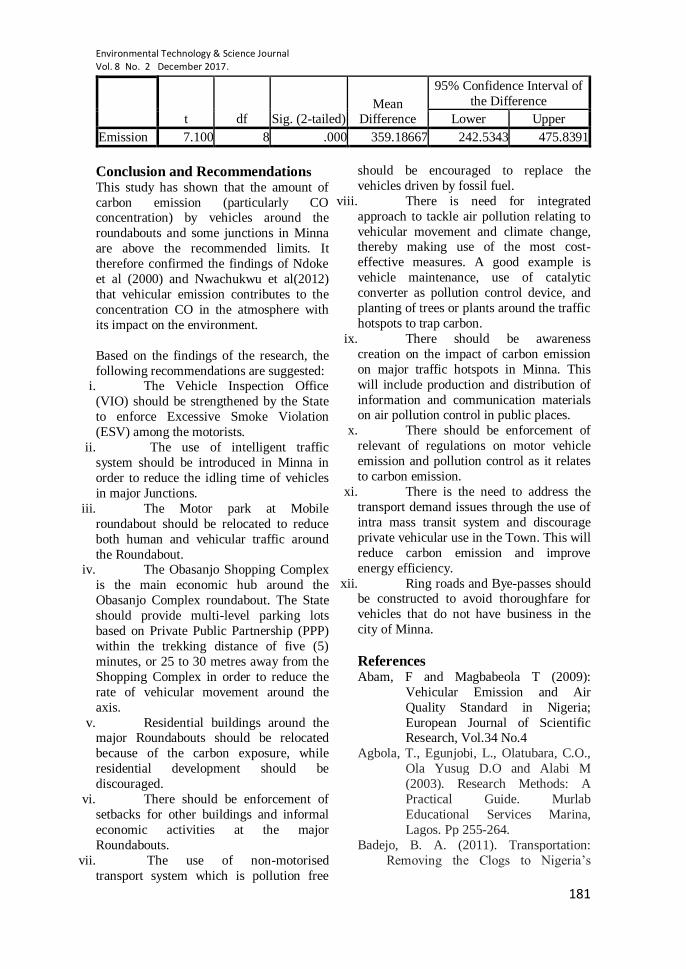
Environmental Technology & Science Journal Vol. 8 No. 2 December 2017.
181
t df Sig. (2-tailed) Mean
Difference
95% Confidence Interval of
the Difference
Lower Upper
Emission 7.100 8 .000 359.18667 242.5343 475.8391
Conclusion and Recommendations
This study has shown that the amount of
carbon emission (particularly CO concentration) by vehicles around the
roundabouts and some junctions in Minna
are above the recommended limits. It
therefore confirmed the findings of Ndoke
et al (2000) and Nwachukwu et al(2012)
that vehicular emission contributes to the
concentration CO in the atmosphere with
its impact on the environment.
Based on the findings of the research, the
following recommendations are suggested: i. The Vehicle Inspection Office
(VIO) should be strengthened by the State
to enforce Excessive Smoke Violation
(ESV) among the motorists.
ii. The use of intelligent traffic
system should be introduced in Minna in
order to reduce the idling time of vehicles
in major Junctions.
iii. The Motor park at Mobile
roundabout should be relocated to reduce
both human and vehicular traffic around
the Roundabout. iv. The Obasanjo Shopping Complex
is the main economic hub around the
Obasanjo Complex roundabout. The State
should provide multi-level parking lots
based on Private Public Partnership (PPP)
within the trekking distance of five (5)
minutes, or 25 to 30 metres away from the
Shopping Complex in order to reduce the
rate of vehicular movement around the
axis.
v. Residential buildings around the major Roundabouts should be relocated
because of the carbon exposure, while
residential development should be
discouraged.
vi. There should be enforcement of
setbacks for other buildings and informal
economic activities at the major
Roundabouts.
vii. The use of non-motorised
transport system which is pollution free
should be encouraged to replace the
vehicles driven by fossil fuel.
viii. There is need for integrated
approach to tackle air pollution relating to
vehicular movement and climate change, thereby making use of the most cost-
effective measures. A good example is
vehicle maintenance, use of catalytic
converter as pollution control device, and
planting of trees or plants around the traffic
hotspots to trap carbon.
ix. There should be awareness
creation on the impact of carbon emission
on major traffic hotspots in Minna. This
will include production and distribution of
information and communication materials on air pollution control in public places.
x. There should be enforcement of
relevant of regulations on motor vehicle
emission and pollution control as it relates
to carbon emission.
xi. There is the need to address the
transport demand issues through the use of
intra mass transit system and discourage
private vehicular use in the Town. This will
reduce carbon emission and improve
energy efficiency.
xii. Ring roads and Bye-passes should be constructed to avoid thoroughfare for
vehicles that do not have business in the
city of Minna.
References Abam, F and Magbabeola T (2009):
Vehicular Emission and Air
Quality Standard in Nigeria;
European Journal of Scientific Research, Vol.34 No.4
Agbola, T., Egunjobi, L., Olatubara, C.O.,
Ola Yusug D.O and Alabi M
(2003). Research Methods: A
Practical Guide. Murlab
Educational Services Marina,
Lagos. Pp 255-264.
Badejo, B. A. (2011). Transportation:
Removing the Clogs to Nigeria’s
Emmanuel, Banki, Maikudi & Santali Impact of Vehicular Carbon Emission on Ambient Air Quality in Minna, Nigeria
182
Development. Anchorage Press and
Publishers, Lagos. Pp 67-89
Balogun, S., A (2015). Introduction to
Road Traffic Crash Investigation. A
paper delivered during SRC-CRC
Course at FRSC Academy Udi, Enugu.
Balogun, S., A (2011). Road Safety
Practice in Nigeria; BOAAS
Resource Publishers Nig. Ltd, Abuja,
2nd Edition.
Bascom, R., Bromberg, P., Costa, D.,
Delvin, R., Dockery, D., Frampton,
M., Lambert, W., Samet, J., Speizer,
F. and Utel, M. (1996), “Health
effects of outdoor air pollution: Parts
I and II”, American Journal of
Respiratory Critical Care Medicine, Vol. 153, pp. 477-498
Chandioa, I. A., Brohi, K. M., & Memon,
M. A. (2010). Managing road traffic
noise pollution, through sustainable
planning approach. International
Journal of Chemical and
Environmental Engineering, 1(2).
Chen, J., Li, C., Ristovski, Z., Milic, A.,
Gu, Y., Islam, M. S., & Guo, H.
(2016). A review of biomass burning:
Emissions and impacts on air quality, health and climate in China. Science
of the Total Environment.
Environmental Protection and Disaster
Risk Reduction (2012). A school
guide, UN/SDR Africa Educational
Series, 4, 3.
Faiz, A. (1993). Automotive Emissions in
Developing Countries- Relative
Implication for Global Warming,
Acidification and Urban Air Quality.
Transport Research A, 27, 167-186.
Frank, M (2009): Control of Motor emission-the US Experience. Critical
Review on Environmental Control.
Available at
http://dx.doi.org/10.1080/1064338919
9.388423
Good, P., Gosling, S. N., Bernie, D.,
Caesar, J., Warrens, R., Arnell, N.
W., & Lowe, J. A. (2010). An
updated review of developments in
climate science research since the
IPCC Fourth Assessment Report.
Han, X. and Naeher, L. P. (2006), “A
review of traffic-related air pollution
exposure assessment studies in the
developing world”, ENVIRONMENTAL
INTERNATIONAL, Vol. 32, pp. 106 –
120. Harrop D.O (2002). Air Quality
Assessment and Management . An
online publication.
Hassan, S. M., & Abdullahi, M. E. (2012).
Evaluation of Pollutants in Ambient
Air: A Case Study of Abuja-
Nigeria. Int. J. Sci. and
Research, 2(12), 1-9.
Kolawole, P. (2012). Global Warming and
Food Engineering Emissions.
Mac Kinnon, M., Shaffer, B., Carreras-
Sospedra, M., Dabdub, D., Samuelsen, G. S., & Brouwer, J.
(2016). Air quality impacts of fuel
cell electric hydrogen vehicles with
high levels of renewable power
generation. International Journal of
Hydrogen Energy, 41(38), 16592-
16603.
Mastrandrea, M. D., Heller, N. E., Root, T.
L., & Schneider, S. H. (2010).
Bridging the gap: linking climate-
impacts research with adaptation planning and management. Climatic
Change, 100(1), 87-101.
Maxlock (1980). Minna Master Plan
MEPPRC (2014). The Interaction Between
China’s Economic Growth, Energy
Production and Consumption and the
related Air Emission During 2000-
2011. Ecological Indicator,Vol 46
Ndoke P.N. and Jimoh O.D. (2000). Impact
of Traffic Emission on Air Quality in
a Developing City of Nigeria.
Leonardo Electronic Journal of Practices and Technologies. 6 (9): 88-
92.
NESREA (2014). Air Pollution Control: A
Strategy in Environmental Protection.
Module 6. A NESREA Publications
Nigeria Highway Code (2016). Federal
Road Safety Commission, 4th Edition,
Detail Work Publishers Ltd, 110-120.
Nwachukwu, A. N., Chukwuocha, E. O., &
Igbudu, O. (2012). A survey on the
effects of air pollution on diseases of

Environmental Technology & Science Journal Vol. 8 No. 2 December 2017.
183
the people of Rivers State,
Nigeria. African Journal of
Environmental Science and
Technology, 6(10), 371-379.
Okunola, O. J., Uzairu, A., Gimba, C. E., &
Ndukwe, G. I. (2012). Assessment of gaseous pollutants along high traffic
roads in kano, Nigeria. International
Journal of Environment and
Sustainability, 1(1).
Olagunju, K (2011): Road Sense, 1st
Edition, Veragap Publishers Nigeria
Limited.
Qu, L., Li, M., Chen, D., Lu, K., Jin, T., &
Xu, X. (2015). Multivariate analysis
between driving condition and vehicle
emission for light duty gasoline
vehicles during rush hours. Atmospheric
Environment, 110, 103-110.
Robert, B (2004). The Vehicle Emission
and Performance Monitoring System:
Analysis of Tailpipe Emission and
Vehicle’s Performance. Centre for
Transport Studies, Department of
Civil and Environmental Engineering,
Imperial College London, London
SWT2AZ
Rodrigue, J. P., Comtois, C., & Slack, B. (2016). The geography of transport
systems. Taylor & Francis.
Salami, K., A (2007): Emission Control
Technology by Automotive Industry:
Trend and Challenges; Inaugural
Lecture Series 10, Federal University
of Technology, Minna, Nigeria.
Shancita, I., Masjuki, H. H., Kalam, M. A.,
Fattah, I. R., Rashed, M. M., &
Rashedul, H. K. (2014). A review on
idling reduction strategies to improve
fuel economy and reduce exhaust
emissions of transport
vehicles. Energy conversion and
management, 88, 794-807.
Stephens, R. D., & Cadle, S. H. (1991).
Remote sensing measurements of
carbon monoxide emissions from on-road vehicles. Journal of the Air &
Waste Management
Association, 41(1), 39-46.
Udotong, J. I. R. (2015). Air quality
Assessment at Traffic Control Points
in Uyo Metropolis. Nigeria–
International Journal of Engineering
and Technical Research (IJETR), 3,
325-331.
United States Environmental Protection
Agency (2014). Global Greenhouse
Gas Emissions. Data. Available at https://www.epa.gov/ghgemissions/gl
obal-greenhouse-gas-emissions-data
United States Environmental Protection
Agency (2015). US Greeenhouse Gas
Inventory Report; 1990-2014.
Published April, 2015
UN Habitat’s State of the World Cities
(2008/2009) Harmonious Cities:
Earthscan Publishers. London.
Sterling.
Vlieger, J (2010). Impact of Eco-driving on Passenger Use and Greenhouse Gas
Emission. Technical Document,
California Environmental Protection
Agency, Air Resource Board.
Wu, J., Xie L., Li Q and Chen, D (2011).
Association Control for vehicular Wi-
Fi Access: Pursuing Efficiency and
Fairness. IEEE Transaction on
parallel and Distribution System. Vol
22, No 6, 2011
Environmental Technology & Science Journal Vol. 8 No. 2 December 2017.
184
Effects of Desertification on Rural Resources
in Machina Local Government Area, Yobe
State
Duchi, Fidelis Christopher and Habila, Sunday Kazahshii Department of Urban and Regional Planning, Faculty of Environmental Design,
Ahmadu Bello University, Zaria-Nigeria. [email protected],
Abstract This study examines the effects of desertification on the rural resources (livestock, crops and
vegetation) of Machina Local Government Area of Yobe state. Data were collected from the
Nigerian Meteorological Agency (NiMet)Makia Yobe state, on rainfall, temperature and
relative humidity and outcomes of desertification effects from the Ministry of agriculture
and Natural Yobe state. Data on the vegetal cover for a period of three (3) years was
retrieved from the U.S Geological Survey (2012-2014) to show the vegetal degradation in
the study are. The data were analyzed using descriptive statistics in understanding the causes
and effects of desertification on the rural resources of the study area. The research revealed
that there is a drastic drop in rainfall distribution from 750.6mm in year 2000 to 365.5mm in
year 2009, increasing temperatures of 34.2oC to 36.0oC in (2000 and 2009) and decreasing
average relative humidity of 40% to 37.7%. The foresaid climatic variability necessitates the depleting outcomes on local resources of Machina LGA in livestock production with a
shortfall of 5,620 cattle, 9,380 goats and 2,072 sheep between years 2007 to 2010 were
recorded. Decreasing natural vegetation was observed and on the verge of extinction within
the period of year 2006-2014. Recommendations were made to control and reverse the
process of desertification in other to increase productivity, maintain the functional base of
the environment, reduce crop failure, death of livestock, loss of settlement and decrease in
poverty level of the populace.
Keywords: Degradation, Desertification, Environment, Environmental effects, Resources.
Introduction Desertification is a significant global
ecological and environmental problem that
results to permanent decrease in biological
productivity of dryland areas (Geist, 2006).
It is a type of land degradation in which a
relatively dry area of land becomes
increasingly arid typically losing its bodies
of water as well as vegetation and wildlife
(Geist, 2017). World Ecology Report
(2009), revealed that drylands comprise 41% of the earth’s land area and are home
to roughly 2 billion people, or 34% of the
earth’s population. currently, over 250
million people in more than 100 countries
are directly affected by desertification and
more are at risk and the situation is most
severe in Africa, where 66% of the total
land area is arid or semi-arid.
Desertification is closely related to
drought. Drought is also associated with desert condition. It is an aspect of the
widespread deterioration of eco-systems
and has diminished the biological potential
of the land, such as plant and animal
production, for multiple use purposes at a
time when increased productivity is needed
to support growing populations in quest of
development (UNEP, 2003).
United Nations Convention to Combat
Desertification (2016), defined desertification as “land degradation in arid,
semi-arid, and dry sub-humid regions
resulting from various factors, including
climatic variations and human activities”.
On this basis, Adams and Mortimore
(1997) also defined desertification as a
Duchi & Habila Effects of Desertification on Rural Resources in Machina Local Government Area, Yobe State
185
process that causes land degradation due to
some prevailing climatic conditions and
human activities such that it resulted into
the inability of the environment to sustain
the demands being made upon it by socio-
economic systems at existing levels of technology and economic development.
Desertification has played a significant role
in human history, contributing to the
collapse of several large empires, such as
Carthage, Greece and the Roman Empire,
as well as causing displacement of local
Populations (Geist, 2006; Geist, 2013).
Desertification is a major serious challenge
and threat facing sustainable development
in northern Nigeria and other African
countries. Dry lands occur on all continents
except Antarctica (United Nations, 2006). The problem has an adverse effect on
human health, food security, economic
activity, physical infrastructure, natural
resources, and the environment, both
national and global security is also affected
by desertification (United Nations
Economic and Social Council (UNECSC),
2007). As depicted in the report of United
Nations Conference on Desertification
(UNEP, 2003) which states that
“desertification is the diminution or destruction of the biological potential of
the land, and can lead ultimately to desert-
like conditions. It is an aspect of the
widespread deterioration of eco-systems
and has diminished the biological potential
of the land, i.e. plant and animal
production, for multiple use purposes at a
time when increased productivity is needed
to support growing populations in quest of
development”.
The United Nations Convention to Combat Desertification revealed the following
figures in relation to livelihoods on
degraded dry lands, that more than 1.5
billion people in the world depend on
degrading land, and 74% of them are poor.
Poor people spend between 50% and 80%
of their income on food. Meanwhile,
Agricultural yields could fall by up to 50%
in some African countries if production
practices are not changed, while 52% of the
land under agriculture is moderately or severely degraded and 12 million hectares
of productive land become barren every
year due to desertification and drought
alone, which is a lost opportunity to
produce 20 million tons of grain (UNCCD,
2014).
Mayell (2001), revealed in his study of the
Global desertification map, that the Lake
Chad located in the North-eastern part of
Nigeria has been shrunk by 94% between
1960’s and 2001, and this is the same
climatic region with Machina Local
Government Area, Yobe State. Medugu
(2009), observed that a good number of
policies and programmes have been
implemented by Nigerian government to
combat desertification, yet the problem is
rather aggravating due to numerous issues including but not limited to handling the
problem as a sectoral issue instead of an
integrated approach that will bridge the gap
between the formation of policy and
strategies of combating drought and
desertification. In the light of the foresaid,
the study intends to examine the effects of
desertification on the rural resources of
Machina Local Government Area of Yobe
State with the view to suggesting ways in
improving / ameliorating the adverse outcomes of the phenomena. This will be
achieved through these objectives:
i. Reviewing the causes of
desertification and environmental
management approaches in controlling
desertification.
ii. Examining the effects of
desertification on rural resources in the
study area and recommending ways of
controlling desertification in Machina
Local Government area.
Study Area
Machina Local Government Area is
geographically situated in the north-west of
Yobe state (Figure 1). Its headquarter is in
the town of Machina at 13°08´ 11´´ N and
10°02´ 57´´ E. It has an area of 1,213km2,
with a total Population of 61,606 persons
according to the NPC census, 2006. It is
307km away from Damaturu and it is
bordered to the north by Niger Republic, to
the south and west by Jigawa state and to

Environmental Technology & Science Journal Vol. 8 No. 2 December 2017.
186
the east by Nguru Local Government area of Yobe state (Fig. 1).
Figure 1: Map of Yobe state showing Machina Local Government Area Source: Wikipedia Encyclopedia, and modified by Author, 2017.
Causes of Desertification Desertification is caused by concomitant of
natural (climatic) and Human factors
discussed below:
Natural (Climatic) Factors The natural factor is basically on the Shift in the Inter Tropical Discontinuity (ITD). A
supposedly climate trend may in fact be
part of a climatic cycle (Ayoade, 2004). It
is noted that when the Inter Tropical
Discontinuity shifts, for Instance, toward
the equator, the incursion of rain bringing
south-west trade wind is restricted to the
coastal areas, this means a southern shift of
climatic belt, resulting in lack of rain in
areas north of the ITD (Ayoade, 2004).
Increase in Atmospheric Carbon Dioxide Content; Carbon dioxide prevents the
escape of earth reaching sun heat from
escaping back into the atmosphere. The
increase in CO2 far above the natural
volume means that its heat preservation
will be higher; creating what is called
greenhouse effect, thus this result in
increase in temperature and global
warming (retrieved from
https://history.aip.org/climate/co2.htm).
Increase in albedo; Albedo is the rate of
emission of ground reaching heat from the
sun. Bare land surface emits more heat than
soft and vegetation covered surface.
Increase in albedo means the warming of
the lower layer of the atmosphere. Increase
in Atmospheric dust; A part of CO2, other
gases and dust are said to be on the
increase. This is said to create warm
inversion layers and to suppress convection
rising of humid surface air (Ayoade, 2004).
During the course of the 20th century, the
average temperature has risen between
0.3°C and 0.6°C. This is probably due to
the effects of industrialization that has
increased greenhouse gas emissions. The
general rise in temperature has increased
the rate of evapotranspiration leading to a
drop in soil humidity and an increase in the
condition of top soil, particularly in the dry
lands, is a consequence of temperature
variation, rainfall and soil humidity that exacerbate the process of desertification.
Onyeanusi and Otegbeye (2012), showed
that Nigeria is not excluded from the
impacts of climatic variability and global
warming with prominent localized effects
in the highly industrialized cities and

Duchi & Habila Effects of Desertification on Rural Resources in Machina Local Government Area, Yobe State
187
Northern Nigeria which has resulted into
the observed environmental degradations.
Increased temperature of the average 1.1°C
and decreased rainfall of average 81mm.
Human Factor Overgrazing removes the vegetation cover
that protects soil from erosion (UNCCD,
2011) and degrades natural vegetation that
leads to desertification and decrease in the
quality of rangelands. Livestock population
in Nigeria has been estimated to consist of
16 million cattle, about 13.5 million sheep,
some 26 million goats, approximately 2.2
and 150 million pigs and poultry respectively (Gadzama, 1995). The dry
lands of Nigeria are said to support much
of the country’s livestock economy,
hosting about 90 % of the cattle population.
In the Sudan and Sahel zones, which carry
most of the livestock population, nomadic
herdsmen graze their livestock throughout
the area and are constantly in search of
suitable pastures. Additional pressure is
also put on pasture resources by livestock
from neighboring countries, notably
Cameroon, Chad and Niger respectively (www.greenfacts.org). Nneji (2013) also,
attributed rapid economic growth and
urbanization as causal factors of
desertification. The problem is more severe
and complicated in developing world.
Clearing of lands to accommodate the
increasing population and accommodate
the necessary infrastructure in northern is
commonly done without adequate
environmental consideration; this has led to
the removal of vegetation cover in the area and as such, making the area desertified.
There is a negative impact of the energy
sector on forest and other vegetation cover
and land productivity globally. This is why
Biomass constitutes 30% of the energy
used in Africa and over 80% used in many
sub-Saharan countries such as Burundi
(91%), Rwanda and Central Africa
Republic (90%), Mozambique (89%),
Burkina Faso (87%), Benin (86%), with
Madagascar and Niger (85%) (Africa
Regional Review, 2005). Urbanization in Kano City for instance has been estimated
to be increasing rapidly at the rate of
between 5 to 10% per annum (Federal
Ministry of Environment of Nigeria, 1994).
At least, 20,000 ha of land are cleared
annually for construction. Cultivation of
marginal lands: In periods of higher than
normal rainfall, people tend to extend farming activities into the marginal areas.
When the years of plenty are followed by
dry years, exposed land with very little
vegetal cover is at the mercy of the winds.
The fine clays and silts are carried away as
dust, and the sand drifts into dunes. The
effect of this could be irreversible except
through carefully planned rehabilitation
programme.
Effects of Desertification According to the United Nations Economic
Commission for Africa report (2008), the
impacts of drought and desertification are
among the costliest events and processes in
Africa. The widespread poverty, the fact
that a large share of Africa’s economies
depends on climate-sensitive sectors
mainly rain fed agriculture, poor
infrastructure, heavy disease burdens, high
dependence on and unsustainable exploitation of natural resources, and
conflicts render the continent especially
vulnerable to impacts of drought and
desertification. The effects of
desertification are far-reaching and diverse.
All aspects of human lives are either
directly or indirectly impacted wherever
the phenomenon exists. It ranges from food
insecurity, water scarcity, and
socioeconomic hardship to political unrest.
Food insecurity: Crop failure and death of
animals means shortage of food supply for
people which eventually results to famine.
Water Scarcity: Shortage of water makes
life become unbearable and people are
forced to leave their settlement. The
scarcity of water leads to dryness of surface
water and absence of natural recharge for
ground water. This intensifies aridity
condition and contributes to human
sufferings.

Environmental Technology & Science Journal Vol. 8 No. 2 December 2017.
188
Control of Desertification
Nwokocha (2015) identified the following
Environmental management practices
evolved over time to combat
desertification. Various ancient and modem
environmental management practices have been developed under a great diversity of
socio-economic and ecological conditions.
These practices can be categorized as:
1. Water management
2. Plant management
3. Soil management
Water Management: This can be achieved
through, water conservation, improved
irrigation methods, dependable water
supplies, salinity control, run off
management and flood control. Each has various technological methods that could
improve productivity, halt desertification,
reverse the process and reclaim extremely
degraded areas.
Plant Management: This can be achieved
through plant conservation, plant
establishment and plant production
(Agricultural, Rangeland and forestry). The
most promising and effective technologies
to halt desertification or to reclaim deteriorated areas are. Re-vegetation,
Rotational grazing, deferred grazing,
rotational pasture, crop rotation, fuel wood
control, wind breaks shelterbelts and
fencing.
Soil Management: The main aim of soil
management is to halt desertification. Soil
conservation, Soil moisture conservation,
salinity control, drainage and measures of
improving soil fertility are applied to solve
problems of soil degradation. Various technologies are applied in each of the
above.
Materials And Methodology The data required for the study includes
rainfall, temperature, relative humidity for
the period of ten (10) years (2000-2009)
and were obtained from the Nigerian
Meteorological Agency (NiMet) Yobe
state. The data helped to show climatic
variability that explains the desertification
conditions of the study area. Available data
on livestock and agricultural production
were collected from the Ministry of Agriculture which revealed the impact of
desertification on local resources such as
farm produce for a period of four years
(2007-2010) and data on the vegetal cover
over for a period of three (3) years was
retrieved from the U.S Geological Survey
(2012-2014) to show the vegetal
degradation in Machina Local Government
Area, Yobe State. The information derived
from the data aforementioned were useful
in drawing inferences on the subject matter.
Results and Discussion
Rainfall Figure 2.0 shows that Rainfall in Machina
LGA has been decreasing since 2000 to
2006 and then there was a rise in 2007
which was recorded to be 483.1mm. Between 2007- 2009 rainfall has been
inconsistent with a fall in 2008 (320.3mm)
and a slight rise in 2009 (366.5mm). The
amount of annual rainfall over the years
reveals the location of study area as Sahel
region of Nigeria. The fluctuation in
amount of rainfall between years 2007,
2008 and 2009 clearly indicates uncertainty
of rainfall distribution in the area. The
uncertainty of rainfall distribution, in
addition to the fact that rainy season in the
Sahelian region of Nigeria only last for three to four months (Geography of Nigeria
retrieved from www.wikipedia.org on the
5th December, 2017) will in turn has
adverse consequences on farming
activities, livestock production and general
livelihood of the people. By extension,
Rainfall is highly irregular which makes
farming activities difficult since small
differences in the amount and timing of
rain received at the area may determine the
success or failure of critical stages in vegetal growth and development.

Duchi & Habila Effects of Desertification on Rural Resources in Machina Local Government Area, Yobe State
189
Figure 2: Average rainfall in Machina Local Government Area Source: Nigerian Meteorological Agency, Yobe State (2012).
Temperature By the records of the NiMet (2012) Makia
Yobe, the mean temperature is about 37°C,
the highest is about 42°C normally
experienced in April and the minimum is
about 30°C normally experienced in December. Fig. 3 shows that the highest
temperature was recorded in 2009 with a
mean minimum and maximum temperature
of 21.7°C and 36.0°C respectively. Over
the years temperature has been on the
increase with a slight fall in 2002 and 2003
which was 33.7oC and 32.8oC, this
indicates increase in the heating condition
which is an indicator of the advancement of
desert like condition. It can be inferred that
there has been intense heating of the ground surface and also the temperature
exceeding the limit to which plants can
survive.
Relative Humidity
Records from NiMet (2012), shows that
relative humidity is high during the rainy
season and low during the dry season.
Figure 4, revealed that over the years high
relative humidity is associated with the
morning hours because of the high
moisture content and relatively low during
the afternoon hours, because air moisture
content has reduced this is in consonance
with the relative humidity of the Sahelian region as seen in Literature. In 2004 there
was a sudden rise in relative humidity of
42.4. % and then a sudden decline in 2009
with 37.7% relative humidity. This
fluctuation depicts the climatic variability
posed by climate change factor and the
decline in moisture content of air means
low moisture content that could encourage
more rains in the region. It can be inferred
that low relative humidity in Machina
explains the decrease in the amount of rainfall due to light burdened (dry air)
predominant in the region. This in turn has
adverse effect on the general livelihood of
Machina and environs
.

Environmental Technology & Science Journal Vol. 8 No. 2 December 2017.
190
Figure 3 Showing mean annual temperature in oC Source: Nigerian Meteorological Agency (2012)
Figure 4: mean relative humidity (%).
Source: Nigerian Meteorological Agency (2012)
Effects of Desertification on
Principal Rural Resources in
Machina Local Government Area LIVESTOCK: Livestock farming is one of
the major activities that take place in most
of the rural settlements in Machina LGA.
The major livestock that are being reared
include goats, cattle, and sheep and a few
rear camels which are mostly used for
transportation. Other livestock that are
being reared on a smaller scale include
poultry, ducks etc which are mainly meant
for domestic consumption. There has been
a decrease in the number of livestock over
the years (Table 5), due to insufficient feed
as a result of low and unpredictable rainfall

Duchi & Habila Effects of Desertification on Rural Resources in Machina Local Government Area, Yobe State
191
distribution, high temperature and Low
relative humidity which encourages
desertification. Machina known as an
agricultural Local Government area with
this revelation means an economic down
turn and loss of livelihood to many residents, because so many households
raises livestock for the sake of sustenance
of their families, with the foresaid so many
families are said to be experiencing
economic hardship. To a large extent it
affects the Gross Domestic Product (GDP)
of the area and even the state at large.
NATURAL VEGETATION: The
vegetation of the study area is located
within the Sahel (dry) Savannah belt which
means that trees and shrubs are sparsely distributed (Plate 1). Figures 5, 6 and 7
reveals an appalling information on the
depleting trend and loss of vegetal cover
from years 2006-2008, 2009-2011, and
2012-2014 respectively. This is in
agreement with the increasing temperatures
as discussed in figure 3. that is harsh for
plant survival, decreasing amount of rainfall and its uncertainty alongside short
period of fall explains this depleting
circumstance of the vegetal cover. In
addition, the rural dwellers in Machina
LGA depend on the scares and depleting
vegetation resource for their source of fuel
wood (Plate 2) and feeding of livestock
which has resulted in the decrease of the
scanty vegetation cover that cannot be
replenished with the very little amount of
rainfall. Over the years’ tree felling for
either domestic or commercial purposes, clearing of land for farming purposes has
become very intense.
Table 5: Showing mean number of livestock produced
Livestock 2007 2008 2009 2010
Cattle 45,400 43,380 40,400 39,780
Goat 23,587 17,117 16620 14,207
Sheep 20,722 19.724 19,151 18,650
Source: Ministry of Agriculture, Yobe state (2016)
Figure 5: Vegetal cover of Machina LGA (2006-2008) Source: United States Geological Survey (2016)
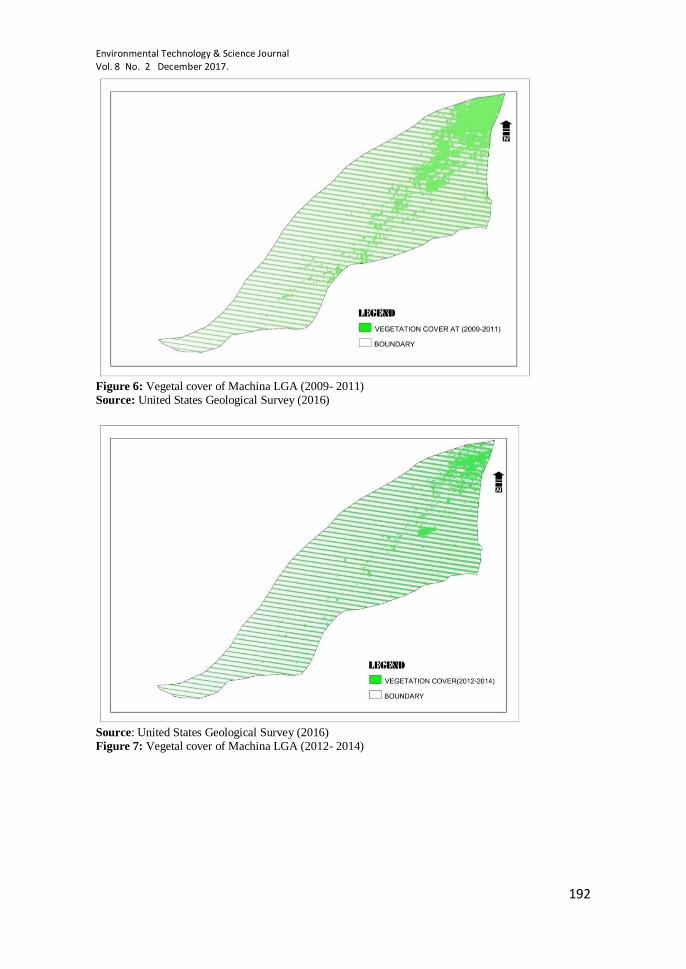
Environmental Technology & Science Journal Vol. 8 No. 2 December 2017.
192
Figure 6: Vegetal cover of Machina LGA (2009- 2011) Source: United States Geological Survey (2016)
Source: United States Geological Survey (2016) Figure 7: Vegetal cover of Machina LGA (2012- 2014)

Duchi & Habila Effects of Desertification on Rural Resources in Machina Local Government Area, Yobe State
193
Plate. 1: Scattered trees plantings
Plate 2: Wood gathered by a hut
.
CROPS FARMING: Table 6. Shows that
Crop farming is the predominant
occupation of the rural dweller, either as
source of income or source of food. The major crops that are being produced
include beans, millet, guinea corn, maize. It
revealed a declining crop yield per hectare
for Beans the crop yield per hectare in
2007 was 1.25 but declined to 1.12 in 2010,
maize 0.95 in 2007 to 0.75, and Millet 4.25
in 2007 to 3.91 in 2010. This again is bad
revelation to the threat of livelihood of the
Machina community because hunger/ food crises and economic hardship is already
being experienced in the area. In addition,
with the rapid rate of unemployment in
Nigeria, many heads of household may
depend on the sale of their produce so as to
be able to meet up with some domestic
needs of the household. As desertification
increases, crop production reduces making
it difficult for some of the rural dwellers to
have food for themselves and also get
income from sale of produce.
Conclusion The study has established that the causes of
desertification in the study area includes
Inadequate and uncertain rainfall
distribution / amount, increasing mean
annual minimum and Maximum
Temperatures by the years and decreasing
relative humidity. This in turn reverts,
negative influence on the output of average crop yield per hectare, depleting vegetation
cover, and decreasing livestock production
in Machina Local Government area.
Table 6: showing average crop yield per hectare
Crops 2007 2008 2009 2010
Beans 1.25 1.21 1.17 1.12
Maize 0.95 0.86 0.83 0.75
Millet 4.25 4.10 4.05 3.91
Source: Ministry of Agriculture, Yobe state (2016)
Recommendation Based on the findings of this the following
are recommendations on ameliorating the effects of desertification on the principal
rural resources (vegetation, crop production
and livestock) of Machina Local
Government Area.
Vegetation
1. The use of pampers should be
encouraged for planting of seedlings
because of its high-water retention
capacity due to presence of high
temperatures that encourages evapo-
transpiration.
2. The establishment of shelterbelts is
good, but that alone cannot guarantee
the success of natural vegetation cover restoration without the involvement of
the communities located close to the
project sites. Therefore, it is strongly
recommended that efforts be geared
towards enlightening the local
communities on the need for
conservation. Government and Non-

Environmental Technology & Science Journal Vol. 8 No. 2 December 2017.
194
Governmental Organizations should as
well encourage the foresaid.
3. Drought resistant grasses, shrubs and
trees (such as gum Arabic seedlings)
with high forage values should be used
in rangelands and farmlands. 4. Discourage the indiscriminate felling
of trees, by introducing the use of
efficient wood burning stove which
cooks faster and consumes little
quantity of wood. and encourage the
use of kerosene stoves to those that
can afford.
Crop production
1. Promoting sustainable agricultural
practices using drought-resistant crops
such as drought tolerant, early
maturing and high yielding crop varieties should be provided by the
Ministry of Agriculture.
2. The use of Farm Yard manure and
compost should be encouraged so as to
add nutrient to the soil which aids in
the early maturity of crops.
3. All water for irrigation purposes
should be examined to establish the
PH level that is conducive and devoid
of low level of salt that may be have
negative effects on crop production as well as ensuring a good drainage
system.
Livestock
1. Strengthening of livestock extension
services to deliver qualitative
Veterinary services should be provided
by the ministry of agriculture.
2. Rain water harvest and storage should
be provided in all grazing/ rangelands
so that rain water can be collected and
used for animals feeding.
Reference Adams W. M., & Mortimore, M. J., (1997).
"Agricultural Intensification and
Flexibility in the Nigerian Sahel”. The
Geographical Journal of
Environmental Transformations in
Developing Countries: 150-60.
Africa Regional Review (2005). Report on
Energy for Sustainable Development. Ayoade, J.O. (2004). Introduction to
Climatology for The Tropics.
Spectrum Books Limited (2nd ed.)
Ibadan.
Federal Ministry of Environment (FMEnv)
(1994). A report on National Action
Programme to Combat Desertification
in Nigeria. Gadzama, N.M. (1995) Sustainable
Development in the Arid zone of
Nigeria. Monograph Series No. 1
32pp, Centre for Arid Zone Studies,
University of Maiduguri, Nigeria
Geist, H. (2006). Dry land Ecohydrology.
Springer Science and Business Media.
Retrieved from
tps//books.google.com.ng
Geist, H. (2017). The causes and
Progression of Desertification.
Ashgate studies in environmental policy and practices. Taylor and
Francis publishers Limited, United
Kingdom.
Geography of Nigeria (2017) retrieved
from www.wikipedia.org on the 5th
December, 2017.
Manuel, A.G. (1977): Technology and
Desertification. United Nations
Conference on desertification.
Nairobi, 29 August- 9 September
1977 (Nairobi: UNEP). Mayell, H. (2001) Shrinking African Lake
offers Lesson on Finite Resources.
Retrieved from
National Geographic News on the 21st
June, 2011.
Medugu, I.N. (2007) A Comprehensive
Approach to Addressing Drought and
Desertification in Nigeria
Ministry of Agriculture and Natural
Resources, Yobe state (2016).
Unpublished records from the
Ministry of Agriculture and Natural Resources.
Musa, M. A. (2016): Assessment of the
Effects of Desertification on Rural
Resources in Machina Local
Government Area, Yobe State. An
unpublished Bachelor of Urban and
Regional Planning Dissertation,
Department of urban and regional
planning, Ahmadu Bello University
Zaria, Nigeria.
Duchi & Habila Effects of Desertification on Rural Resources in Machina Local Government Area, Yobe State
195
Nneji, L.M. (2013). A Review of the
Effects of Desertification on Food
Security. Representative Opine.
5(10): 27-33
Nigerian Meteorological Agency, MAKIA,
Yobe state (2012). Nwokocha, C. (2015). Effects of
desertification on Environmental
Management in Northern Nigeria.
Arabian Journal of Business
Management Vol. 3. No.6 retrieved
from www.arabianjbmr.com
Onyeanusi, A.E and Otegbeye, G.O (2012).
The impact of Deforestation on Soil
Erosion and on the Socio-economic
Life of Nigerians. Sustainable
Environmental Management in
Nigeria, Book Builders publisher, Nigeria. pp. 315-331.
U.S Geological Survey
(2016).https://www.usgs.gov/science-
explorer results. Machina +
vegetation
UNEP, (2003). Desertification. United
Nations Environmental Programme,
Nairobi, Kenya.
United Nations Convention to Combat
Desertification (2016) retrieved from
www.unccd.int on the 21st June
2016).
United Nations Convention to Combat
Desertification (UNCCD) (2014): a
carrying pillar in the global combat
against land degradation and food insecurity. Background paper for the
San Rossore meeting ‘Climate
change: a new global vision’ Pisa,
Italy.
United Nations Economic and Social
Council (2007). Africa Review
Report on drought and desertification,
Fifth Meeting of the Africa
Committee on Sustainable
Development (ACSD-5), Regional
Implementation Meeting (RIM) for
CSD-16, Addis Ababa, 22-25. United Nations, (2006). International Year
of Deserts and Desertification,
retrieved February
2006, http://www.iydd.org/
World Ecology Report (2009):
Desertification: Its Effects on People
and Land. spring 2009 vol.XX1
No.1Special Focus.

Environmental Technology & Science Journal Vol. 8 No. 2 December 2017.
196
Perspective of Neighbourhood Preference: A
Study of Ilorin City, Nigeria
Abdulraheem Maimuna O.1, Olorunfemi Jacob F.2, Ajibade Lanre T.2
& Agava Yusuf H.3 1Department of Urban and Regional Planning, University of Ilorin, Nigeria.
2Department of Geography and Environmental Management, University of Ilorin, Ilorin, Nigeria. 3Department of Estate Management, University of Ilorin, Ilorin, Nigeria.
Abstract Previous studies have long-established a strong relationship between the neighbourhood and
the kind of environment to which an individual has been exposed and life chances available
to him. Attributes of neighbourhoods and the experiences provided have been found to affect
people’s capabilities in terms of their ideas, achievements in life, as well as their socio-economic development. This has made studies on neighbourhood preferences attractive.
This paper is an attempt to identify the category of and preference for neighbourhoods by
residents in Ilorin metropolis, Kwara State, Nigeria. Data used were collected through a
systematic random sampling of 334 households with the aid of structured questionnaire.
Descriptive analysis was used to analyse and present data. Findings of the study revealed
that 38% of the households had preference for the high income residential neighbourhoods
irrespective of ethnic background or level of income. That neighbourhood preference is not
dependent on socio-economic status or background of individuals but on perception of the
attribute of a neighbourhood. However, the study confirmed that the actual ability to reside
in the preferred residential zone is highly determined by socio-economic factors such as the
level of income. The study recommends re-creating the kind of layouts that exist in the high
income residential zones in all other neighbourhoods within the city by stakeholders. However in the course of recreation, government should endeavour to embark on urban
renewal projects in the core traditional area housing most of the low income
neighbourhoods, though citizens participation must be garnered to ensure that government
projects are supported by the ultimate end users.
Keywords: Environment, Neighbourhood, Preference, Residential zones, Urban.
Introduction The importance of neighbourhood to city dwellers cannot be overemphasized. Where
people live affects their health, economic,
social and mental well-being.
Abdulraheem, Olorunfemi and
Muhammad-Lawal (2014) noted that the
choice of a place of residence is an
important marker of a person’s social
status. There is an increasing concern about
the quality of life in modern towns and
cities around the world hence, the
increasing interest among built environment professionals and
policymakers on how to measure those
factors that influence neighbourhood
choice by residents. Abdulraheem et al.
(2014) further asserted that individuals
with a varied cultural background may live
in a neighbourhood and yet share similar views regarding environmental features.
Some urban researchers such as James,
Lisa, and Stafanie (2002) have argued that
residents’ preferences and evaluation of
their neighbourhood vary as a result of the
diversity in their senses of judgment as
well as their individual lifestyles.
Universally, improving the residential
environment has become one of the
fundamental goals of urban planners and
policy makers, hence a motive for this research.

Abdulraheem, Olorunfemi, Ajibade & Agava Perspective of Neighbourhood Preference: A Study of Ilorin City, Nigeria
197
Whereas residential mobility and
neighbourhood preferences impact on
urban growth and change, neighbourhoods
do not share the same level of
infrastructure and environmental quality as
well as the residents who reside in them (Julius & Ojeifo, 2007). Rapid urbanization
coupled with the expansion of towns and
cities in Nigeria has brought about
continuing competition among people for
the most desired locations. However,
everyone cannot live where they would
prefer to live due to several limiting
factors. Nevertheless, availability of
information on preference for
neighbourhood and residential types has a
lot of implication for planning and urban
management. This study aims at examining neighbourhood characteristics and
preference among the residents of Ilorin
metropolis, Kwara state, Nigeria.
The objective of the Study is to identify
and evaluate the available and preferred
residential types and neighbourhood by
households in Ilorin.
The Study Area The location of Ilorin, Kwara State capital
is on the intercept of Latitudes 80 30’ and
80 50’ North of the Equator and Longitudes
40 20’ and 40 35’ East of the Greenwich
Meridian. The city serves as the link
between the Northern and Southern parts of
Nigeria. Oyebanji (1994) described Ilorin
as the socio-cultural, religious and political
meeting point of Nigeria. Bounded by
Niger State to the North and Ifelodun L.G.A to the West, Ilorin shares a
boundary with Oyo State on the Southern
end (Fig.1). Situated 500km from Abuja
the city has an approximate land mass of
about 100sq km and is populated by
diverse people with different cultural
backgrounds (Kwara State Gazette, 1991)
e.g. Yorubas, Nupawas, Baribas, Hausas,
Gwaris, Kemberis and Fulanis. However,
the population of the Igbos and people
from the Eastern part of Nigeria has
increased drastically in recent times. Indeed, tribal heterogeneity and cultural
diversity are well pronounced in the state,
to an extent that Ilorin can aptly be referred
to as a microcosm of Nigeria (Unilorin
Bulletin, 2012). The cultural plurality of
Ilorin makes it easy for many Nigerians to
find a niche within this dynamic city
without much stress.

Environmental Technology & Science Journal Vol. 8 No. 2 December 2017.
198
Literature Review
Defining Neighbourhood Neighbourhood is a term often used to
describe the sectors of urban or rural places such as cities, towns and villages. Berk
(2005) defined a neighbourhood simply as
the vicinity in which people live. The
motives for communal living are usually
for economic, sociological and
psychological reasons. Jørgensen,
Knudsen, Arp and Skov (2016) revealed
that social differences seem to be
connected to different types of attachment
to neighbouhood, that the individuals in the
highest and lowest socioeconomic
positions display the strongest connection to neighbourhoods, and the strongest
preference for neighbour relations and local
community. Indeed Neighbourhoods
usually have some specific social or
physical characteristics distinguishing them
from the rest of the settlement, while they
vary in population and density. According
to Duany et al. (as cited in Bender, 2015),
the size of a neighbourhood is limited, so
that majority of the population is within
walking distance of its centre where needs of daily life are easily satisfied.
Tunde (2013) reiterated that
neighbourhoods offer facilities for transit
stops, work places, police posts, retail
community events and leisure activities in
addition to providing places for primary
and post primary education. The streets
provide alternate routes to most
destinations for both vehicles and
pedestrians (Duany et al., 2003). Furthermore, the development of
neighbourhood is often incremental in form
or pattern and therefore one finds a mixture
of large and small houses, shops,
restaurants, offices, informal activities and
so on. Civic buildings such as schools,
multipurpose halls, museums, mosques,
and churches are often placed at the open
playground while parks are also provided
for the residents’ use. James et al. (2002)
affirmed that life chances of individuals
and families can be influenced greatly by the condition of the neighbourhoods. The
attributes of, and experiences provided by a
neighbourhood, have profound effects on a
person’s capability and his idea about what
can be accomplished (Yusuff, 2016).
Indeed, it has been stated that
neighbourhoods where poor people
concentrate isolate their residents from the
resources and networks they require to

Abdulraheem, Olorunfemi, Ajibade & Agava Perspective of Neighbourhood Preference: A Study of Ilorin City, Nigeria
199
attain their full potentials. This, by
extension deprives the larger community of
the human capital resource of such
neighbourhoods. A good neighbourhood
should create a better environment for
safety, health, aesthetics, comfort and general welfare of the inhabitants.
Impact of Neighbourhood
Environment on Residents The quality of life of residents of any given
neighbourhood depends on socio-
economic, environmental and cultural factors, as well as physical conditions and
spatial characteristics of such
neighbourhood. Mohammad, Michal, Tiina
and Marketta (2015) revealed that
inhabitants of neighbourhoods with a larger
percentage of green surroundings had a
greater perception of neighbourhood
stability than did the residents of
neighbourhoods with a smaller percentage
of green surroundings. However, Okusipe
(as cited in Yusuff, 2016) reported that the urban physical environment of cities in
Nigeria has been shaped continually by
land use planning, zoning and development
control without adequate concern for
sustainability and environmental quality.
City layout and aesthetics, land use
patterns, population and building densities,
transportation and ease of access of
residents to basic goods, services and
infrastructures affect the liveability of
settlements. Results of a research
conducted by Adamu (2012) revealed that environmental quality and condition of
many Nigerian urban areas is below
desirable standard and by implication,
greater number of households in those
areas lack good quality houses, clean and
safe neighbourhoods that provide amenities
which ameliorate the stress of urban living.
Nevertheless, it has been confirmed that
provision of good housing has profound
influence on the health, efficiency and
wellbeing of any community (Onokerhoraye, 1984). Parks and green
spaces are aspect of the environment that
makes it attractive likewise the presence of
peaceful, crime-free and clean
surroundings. Studies have revealed that
the conditions of any given neighbourhood
go a long way in shaping individual
outcomes (Tunde, 2013). The fact is that
people want to live in decent
neighbourhoods and to have their children
grow up in a safe environment because growing up in an unhealthy neighbourhood
could reduce the life chances of those
children (Clark et al., as cited in Daramola,
2016). Consequently, attention to the
environmental quality of neighbourhoods
and the impact it might have on the
wellbeing and health of residents is
increasing.
Factors that Influence
Neighbourhood Desirability The decision of a household on whether to
move or not, the choice of a suitable
destination within affordability and the
ability to actually relocate are the primary
issues that often govern residential location
or relocation. Mohammad et al. (2015) in
their study verified a close association between the characteristics of built
environment (i.e., density, destination
accessibility, and green area) and the
preferences residents had for their
neighbourhood. Residing in a good
residential neighbourhood has several
advantages, but it is uncommon to have a
neighbourhood that has all the good
characteristics, and this explains why
different people choose different kinds of
neighbourhoods to live in (Adamu, 2012).
It has been argued that the choice of a particular neighbourhood is majorly the
result of the desire to live in a specific type
of dwelling, taking into account its tenure,
size and price (Lina Bergstrom, Maarten
Van Ham & David Manley, 2010). Mixed
ethnic neighbourhoods are seen crucial for
achieving social cohesion (Phillips 2006;
Brown as cited in Susanne & Brit 2015).
Social cohesion refers to the bonds or the
‘glue’ that hold people together in society,
particularly in the context of cultural diversity. In line with spatial assimilation
theory, there seems to be a widespread
belief that people interact with those living
nearby (Park 1926; Peach as cited in
Susanne & Brit 2015). Nowadays most

Environmental Technology & Science Journal Vol. 8 No. 2 December 2017.
200
people are concerned with the safety of
their home and family when choosing of
where to live, because of the high crime
rate in many cities. A good neighbourhood
to such homes must have lower incidences
of thefts, burglaries etc. Neighbourhoods that are characterized by improved
accessibility, proximity to means of public
transportation, shopping, places of worship,
recreational areas and schools are often in
demand. According to Galster (as cited in
Fajimi, 2011) the closer a resident is to an
unwholesome neighbourhood; the more
likely it is that he will be affected by it. The
study further established that there are push
and pull factors that determine the reason
why residents live in a certain
neighbourhood. The choice of neighbourhood can also be a function of,
but not limited to, availability of
employment, business opportunities, access
to education, cultural or recreational
opportunities and microeconomic factors
such as disposable income, and access to
finance. People also prefer associating with
natural and aesthetically appealing
environment. Lina et al. (2010) in their
work observed that the choice of a
particular neighbourhood is equally influenced by the desire to live in a specific
type of dwelling. Neighbourhood
characteristics such as reputation, status,
population composition and location are
also important factors that residents take
into consideration in making
neighbourhood choices.
Materials and Method Data was gathered from both the primary
and secondary sources. The study adopts a
survey investigation approach. Oshungade
(2013) recommended that surveys should
be based on random sampling and not on
judgment or purposive sampling. While
noting that random sampling is based on
sampling theory, detailed planning and
execution of sample survey, he also
confirmed that parameters obtained from
random sampling with adequate sample
size are close representation of the target population.
Four field assistants and one facilitator
were employed to assist the researcher in
the administration, collection and collation
of questionnaire forms. This was however
done sequel to the proper training of the
assistants who were recruited on the strength of their educational qualification
and knowledge of the locality. Two of the
field assistants hold the Higher National
Diploma degree while two had Ordinary
National Diploma degree. However, the
facilitator had a Master’s degree (all in the
social sciences). The training of the field
assistants took two days.
A reconnaissance survey of the selected
neighbourhoods was conducted in order to
gather firsthand information on the peculiar characteristics of the neighborhoods,
familiarize the field assistants and
researcher with the study area and make
visual observations that would assist during
the main field work. Using the facts
gathered during the reconnaissance survey,
the entire study area was sub-divided into
four zones. Criteria used were proximity of
one neighborhood to the other, income
level of the inhabitants in each zone,
internal homogeneity of the areas, the residential types and neighborhood
characteristics. The zones carved out as
study area by the researcher were labeled
as:
A. Zone H - High Income Earners
Residential Area Fate, Agba Dam,
Mandate Estate, Adewole Estate, Central
Bank of Nigeria (C.B.N.) Quarters,
Government Reserved Area (GRA)
B. Zone M- Medium Income
Earners Residential Area Niger Street, Taiwo, Harmony Estate, Gaa-Akanbi,
Agbo-Oba, Offa Garage, Unity, Post
Office, Irewolede Estate, Oloje Estate
C. Zone L - Low Income Earners
Residential Area Abayawo, Zango,
Baboko, Agbaji, Adangba, Pakata, Eruda,
Isalekoto, Ita Merin, Ita Amo, Ode - Alfa
Nda, Popo – Giwa, Alagbado, Kuntu, Idi –
Ape, Kulende Estate

Abdulraheem, Olorunfemi, Ajibade & Agava Perspective of Neighbourhood Preference: A Study of Ilorin City, Nigeria
201
D. Zone C - Combined (Mixed)
Income Residential Area Asa-Dam, Oko-
Erin, Sabo-Oke, Osere, Tanke, Basin
Minimum Sample Size In gathering relevant information for the
purpose of this research work, Census data
and figures would have been the most
useful but it was not available in the
detailed chronological presentation that
would be valuable for this study. An
alternative means of gathering reliable and
relevant data was thus employed in the
form of structured questionnaire. To
validated the questionnaire and determine the minimum sample size for the study, it
became very necessary to carry out a pilot
survey.
The pilot survey conducted to test the
research instrument and determine the
minimum sample size for the study
involved a total of 80 copies of the
questionnaire forms and a survey which
lasted for 5 consecutive days. Based on the
result of the pilot survey, a minimum
sample size was determined using the formula proposed by Snedecor and
Cochran (1967 adopted by Jimoh 1988).
The pilot survey provided an opportunity to
test the research instrument, familiarize
more with the study area. It made the
researcher to become aware of the likely
future challenges in the course of the major
survey. In addition, it helped to highlight
some ambiguous questions which the
researcher had to recast while it enabled the
researcher know more about the disposition
of residents in each neighbourhood zone.
Most importantly, the researcher was able
to determine a basis for calculating an
appropriate sample size for the entire study area.
Many well-known formulas, using either
the z-distribution (Snedecor & Cochran
1989) or the t-distribution (Sokal & Rohlf
1995) are available for calculating sample
size at different levels of statistical power
when testing differences in means with two
independent samples. The simplest formula
to use is based on the z-distribution
(Gerow, 2009). In order to determine the
minimum sample size for the purpose of investigation, the formula proposed by
Snedecor and Cochran (1967), Jimoh,
1988) was applied to the five days reading
from pilot survey.
The Snedecor and Cochran formula
(1967) adopted by Jimoh (1988):
L = 2 σ √n (n= size of preliminary survey)
n = (4σ2/L2 at 95% level of probability).
n = (6.6σ2/L 2 at 99% level of probability).
Where;
n = minimum sample size. σ= standard deviation.
L = limit of accuracy of estimated
mean.
The reading from the pilot survey is
summarized below:
Zone Limit of Accuracy of Estimated Mean Minimum Sample Size Estimated No of Questionnaire
H L = 2 X0.748/ 16 = 0.374 n = 6.6 x 0.562 / 0.3742 15
M L = 2 X 0.92 / 16 = 0.46 n = 6.6 x 0.922 / 0.462 26
L L = 2 X 0.4 / 14 = 0.213 n = 6.6 x 0.42 / 0.2132 24
C L = 2 X 2.06 / 17 = 0.999 n = 6.6 x 2.062 / 0.9992 28
TOTAL = 93 Questionnaire forms /per day
The Snedecor and Cochran’s formula was
applied to determine the minimum sample
size and in order to calculate the
appropriate number of days that would be
ideal for the major survey based on the
minimum sample size, we arrived at
approximately 18 days.
H L = 2 X 0.748/V5 = 0.669 n = 6.6 x 0.75/ 0.669 8.30

Environmental Technology & Science Journal Vol. 8 No. 2 December 2017.
202
M L = 2 X 0.92 /V5 = 2.24 n = 6.6 x 0.92 /2.24 1.11
L L = 2 X 0.4 /V 5 = 0.667 n = 6.6 x 0.4/ 0.667 8.30
C L = 2 X 2.06 /V 5 = 3.685 n = 6.6 x 2.06 / 3.69 0.32
TOTAL 18.03 Days
Based on this number of days, the mathematical formula of direct proportion
was employed to finally arrive at a total
number of 334 copies of the questionnaire
which was prepared, representing the
appropriate minimum sample size for this
research. 303 copies of the questionnaire
forms were successfully administered
through the systematic random sampling
survey method while 31 copies were
returned uncompleted out of a total of 334.
An oral interview was also conducted at
random where there was need to confirm some statements or answers supplied on the
questionnaire forms.
Analysis of data on socioeconomic and
demographic characteristics of the
respondents was done through the use of
descriptive statistics such as graphs,
frequency analysis and tables and charts.
Among data gathered in order to achieve
the desired research objectives included
data on socio-economic profile of household heads, family size, types of
residence and categories of
neighbourhoods available to households.
Neighborhood Types in Ilorin The neighbourhoods within the study area
were categorized based on observations
made by the researcher during the
reconnaissance survey. The population density of each zone could also have been
used as criteria for categorization, but the
researcher chose the level of income
because it was observed that most
inhabitants reside in neighbourhoods where their income could sustain annual rent paid
on apartments or rooms in such areas. For
ease of understanding, the major
characteristics of each of the zones are as
detailed below;
(a) Zone H – Residential Zones: The very highly educated civil servants,
politicians and business men who are high income earners and wealthy enough to
afford most of the basic comforts and
luxuries of life reside in this zone. These
residential areas are clean and quite with
adequate green covers and are generally
owner – occupier. Lush trees, shrubs and
beautiful flowers are abundant in this area
in comparison with other zones in the city.
Houses here are built on large and spacious
compounds with tall fence cordoning them.
The areas are well planned with adequate
infrastructure, site and services and absence of open gutters and refuse dumps.
Architectural designs of buildings are very
modern and can be compared to those
present in other developed nations. The
road network and refuse disposal methods
are modern and good. This area includes
the exclusive Government Reserved Area
(G.R.A.), which initially housed the
colonial masters but later converted to
residence for the high class government
workers and the wealthy families (See Plates 1.1 to 1.2).

Abdulraheem, Olorunfemi, Ajibade & Agava Perspective of Neighbourhood Preference: A Study of Ilorin City, Nigeria
203
Figure 3.1: Subdivision of Residential Zones in Ilorin According to Income Level.
Plate 1.1: Wall Fence around Private
Residence H
Plate 1.2: Good Road Network in Zone H
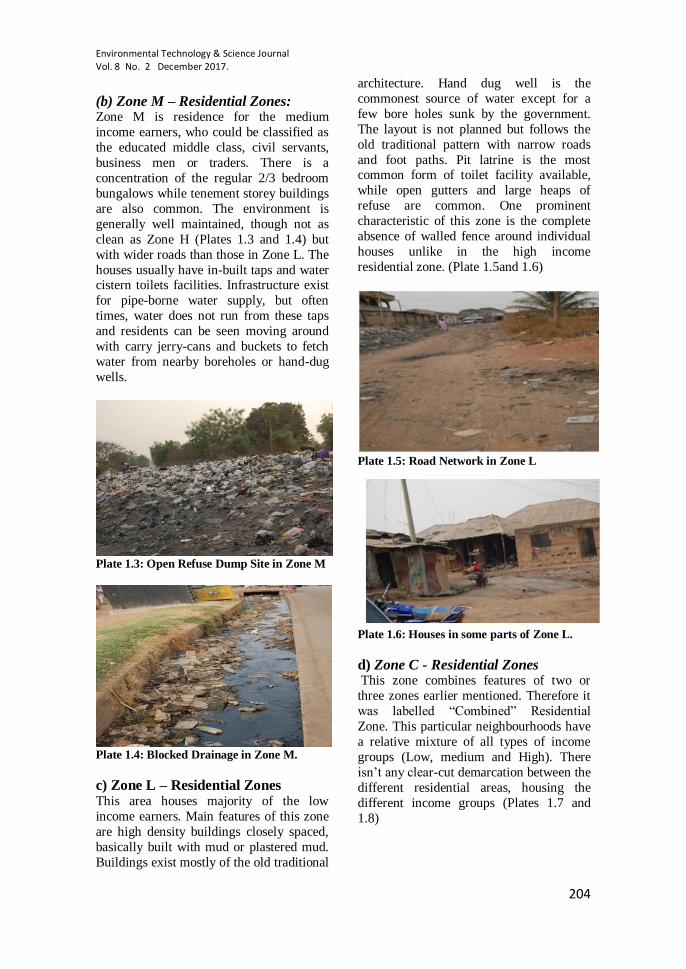
Environmental Technology & Science Journal Vol. 8 No. 2 December 2017.
204
(b) Zone M – Residential Zones: Zone M is residence for the medium
income earners, who could be classified as
the educated middle class, civil servants,
business men or traders. There is a
concentration of the regular 2/3 bedroom
bungalows while tenement storey buildings
are also common. The environment is
generally well maintained, though not as
clean as Zone H (Plates 1.3 and 1.4) but
with wider roads than those in Zone L. The
houses usually have in-built taps and water cistern toilets facilities. Infrastructure exist
for pipe-borne water supply, but often
times, water does not run from these taps
and residents can be seen moving around
with carry jerry-cans and buckets to fetch
water from nearby boreholes or hand-dug
wells.
Plate 1.3: Open Refuse Dump Site in Zone M
Plate 1.4: Blocked Drainage in Zone M.
c) Zone L – Residential Zones This area houses majority of the low
income earners. Main features of this zone
are high density buildings closely spaced,
basically built with mud or plastered mud.
Buildings exist mostly of the old traditional
architecture. Hand dug well is the
commonest source of water except for a
few bore holes sunk by the government.
The layout is not planned but follows the
old traditional pattern with narrow roads
and foot paths. Pit latrine is the most common form of toilet facility available,
while open gutters and large heaps of
refuse are common. One prominent
characteristic of this zone is the complete
absence of walled fence around individual
houses unlike in the high income
residential zone. (Plate 1.5and 1.6)
Plate 1.5: Road Network in Zone L
Plate 1.6: Houses in some parts of Zone L.
d) Zone C - Residential Zones This zone combines features of two or
three zones earlier mentioned. Therefore it
was labelled “Combined” Residential
Zone. This particular neighbourhoods have
a relative mixture of all types of income
groups (Low, medium and High). There
isn’t any clear-cut demarcation between the
different residential areas, housing the
different income groups (Plates 1.7 and
1.8)

Abdulraheem, Olorunfemi, Ajibade & Agava Perspective of Neighbourhood Preference: A Study of Ilorin City, Nigeria
205
Plate 1.7: Residential Type in Zone C.
Plate 1.8: Road Network in Zone C
Field Survey During the main field survey, each field
assistant was assigned to a particular zone.
Administration of questionnaire took place
between 5pm - 6pm daily, because based
on knowledge of the study area and
previous pilot survey result; the researcher
knew that was the most probable time for
most household heads to have returned
home from their various places of work or
other outside engagements. Once the 1
hour time period was accomplished, the interview stopped to continue the following
day. The experience gathered through the
pilot survey assisted in the successful
conduct of the main field survey. The
systematic random sampling method was
used. (Burton, 1970) recommended a one
in fifteen household for an urban centre of
comparable size as Ilorin, and his was used
along the main streets of the entire study
area. The first house was picked at random
along the designated street. Thereafter
every fifteen household was sampled in a
systematic manner. Out of a total of 334
households that were selected for this study, 303 households provided useful
data. Simple percentage distribution was
adopted in the analysis relating to
investigations of neighbourhood
preferences in Ilorin. The data gathered for
the 18-day survey period for all the zones
was then collated for further analysis.
Results and Discussion
Gender of household Heads Eighty-two percent of household heads are
male while eighteen percent are female as
in cases of widows, divorcees and
separated couples (Table 4.1). This finding
also affirms the popular believe that in
Africa, a man is always the head of the
household since the male folks also form
the largest percentage of the household heads in Ilorin.
Table 4.1: Gender of Household Heads.
Gender Frequency %
Male 247 81.5
Female 56 18.5
Total 303 100.0
Level of Education Research result indicates that more than
half, precisely 51.2% of the respondents
possess either a Bachelor of Arts degree
(B.A.), Bachelor of Science degree (B.Sc.)
or Higher National Diploma (HND), in
addition to about 29% who possess either a
National Certificate of Education (NCE),
or Ordinary National Diploma (OND) certificates. Out of the remaining 10%,
about 6% possess only Quranic education
while 4% are holders of a Master of
Science, Arts or Doctor of Philosophy
Degree. (Figure 4.3
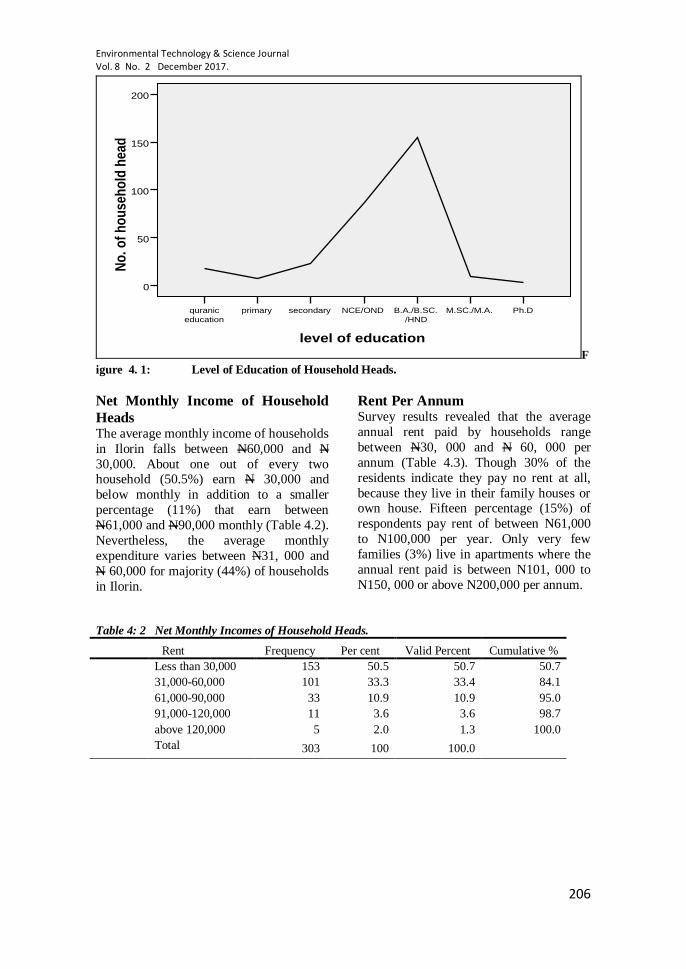
Environmental Technology & Science Journal Vol. 8 No. 2 December 2017.
206
level of education
Ph.DM.SC./M.A.B.A./B.SC.
/HND
NCE/ONDsecondaryprimaryquranic
education
No
. of
ho
use
ho
ld h
ead
200
150
100
50
0
F
igure 4. 1: Level of Education of Household Heads.
Net Monthly Income of Household
Heads The average monthly income of households
in Ilorin falls between N60,000 and N
30,000. About one out of every two household (50.5%) earn N 30,000 and
below monthly in addition to a smaller
percentage (11%) that earn between
N61,000 and N90,000 monthly (Table 4.2).
Nevertheless, the average monthly
expenditure varies between N31, 000 and
N 60,000 for majority (44%) of households
in Ilorin.
Rent Per Annum Survey results revealed that the average
annual rent paid by households range
between N30, 000 and N 60, 000 per
annum (Table 4.3). Though 30% of the
residents indicate they pay no rent at all,
because they live in their family houses or own house. Fifteen percentage (15%) of
respondents pay rent of between N61,000
to N100,000 per year. Only very few
families (3%) live in apartments where the
annual rent paid is between N101, 000 to
N150, 000 or above N200,000 per annum.
Table 4: 2 Net Monthly Incomes of Household Heads.
Rent Frequency Per cent Valid Percent Cumulative %
Less than 30,000 153 50.5 50.7 50.7
31,000-60,000 101 33.3 33.4 84.1
61,000-90,000 33 10.9 10.9 95.0
91,000-120,000 11 3.6 3.6 98.7
above 120,000 5 2.0 1.3 100.0
Total 303 100 100.0
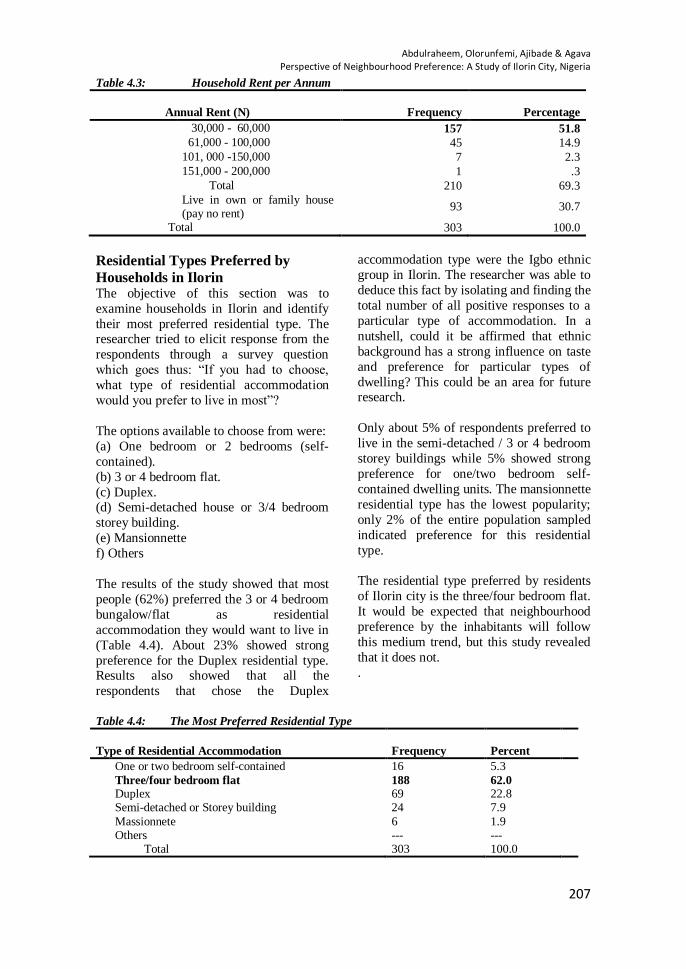
Abdulraheem, Olorunfemi, Ajibade & Agava Perspective of Neighbourhood Preference: A Study of Ilorin City, Nigeria
207
Table 4.3: Household Rent per Annum
Annual Rent (N)
Frequency Percentage
30,000 - 60,000 157 51.8
61,000 - 100,000 45 14.9
101, 000 -150,000 7 2.3
151,000 - 200,000 1 .3
Total 210 69.3
Live in own or family house (pay no rent)
93 30.7
Total 303 100.0
Residential Types Preferred by
Households in Ilorin The objective of this section was to
examine households in Ilorin and identify
their most preferred residential type. The researcher tried to elicit response from the
respondents through a survey question
which goes thus: “If you had to choose,
what type of residential accommodation
would you prefer to live in most”?
The options available to choose from were:
(a) One bedroom or 2 bedrooms (self-
contained).
(b) 3 or 4 bedroom flat.
(c) Duplex. (d) Semi-detached house or 3/4 bedroom
storey building.
(e) Mansionnette
f) Others
The results of the study showed that most
people (62%) preferred the 3 or 4 bedroom
bungalow/flat as residential
accommodation they would want to live in
(Table 4.4). About 23% showed strong
preference for the Duplex residential type. Results also showed that all the
respondents that chose the Duplex
accommodation type were the Igbo ethnic
group in Ilorin. The researcher was able to
deduce this fact by isolating and finding the
total number of all positive responses to a
particular type of accommodation. In a
nutshell, could it be affirmed that ethnic
background has a strong influence on taste
and preference for particular types of
dwelling? This could be an area for future research.
Only about 5% of respondents preferred to
live in the semi-detached / 3 or 4 bedroom
storey buildings while 5% showed strong
preference for one/two bedroom self-
contained dwelling units. The mansionnette
residential type has the lowest popularity;
only 2% of the entire population sampled
indicated preference for this residential
type.
The residential type preferred by residents
of Ilorin city is the three/four bedroom flat.
It would be expected that neighbourhood
preference by the inhabitants will follow
this medium trend, but this study revealed
that it does not.
.
Table 4.4: The Most Preferred Residential Type
Type of Residential Accommodation Frequency Percent
One or two bedroom self-contained 16 5.3 Three/four bedroom flat 188 62.0 Duplex 69 22.8 Semi-detached or Storey building 24 7.9
Massionnete 6 1.9 Others --- --- Total 303 100.0
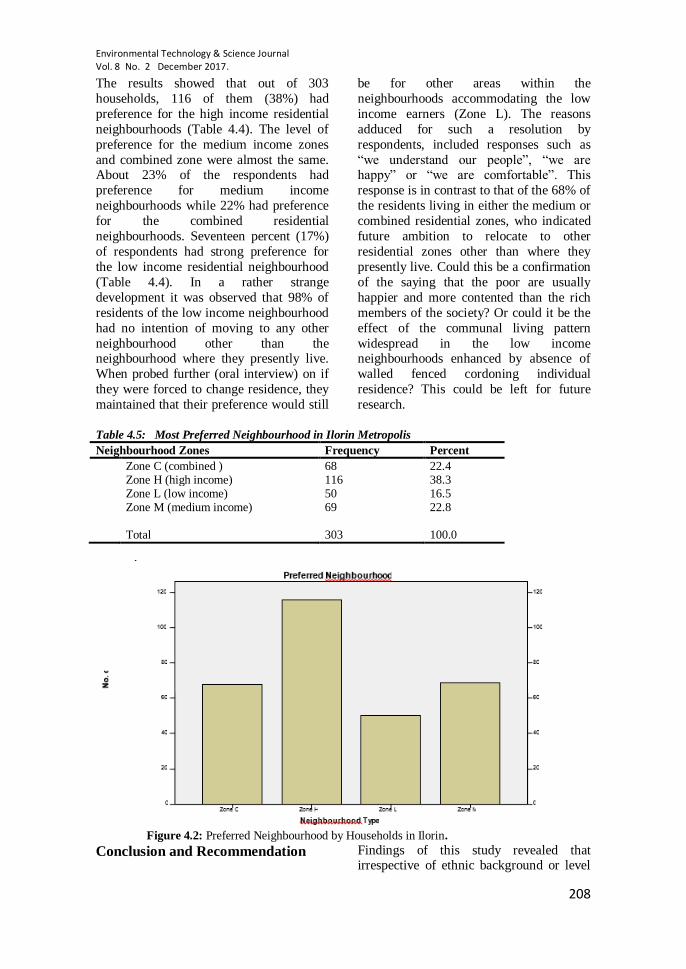
Environmental Technology & Science Journal Vol. 8 No. 2 December 2017.
208
The results showed that out of 303
households, 116 of them (38%) had
preference for the high income residential
neighbourhoods (Table 4.4). The level of
preference for the medium income zones
and combined zone were almost the same. About 23% of the respondents had
preference for medium income
neighbourhoods while 22% had preference
for the combined residential
neighbourhoods. Seventeen percent (17%)
of respondents had strong preference for
the low income residential neighbourhood
(Table 4.4). In a rather strange
development it was observed that 98% of
residents of the low income neighbourhood
had no intention of moving to any other
neighbourhood other than the neighbourhood where they presently live.
When probed further (oral interview) on if
they were forced to change residence, they
maintained that their preference would still
be for other areas within the
neighbourhoods accommodating the low
income earners (Zone L). The reasons
adduced for such a resolution by
respondents, included responses such as
“we understand our people”, “we are happy” or “we are comfortable”. This
response is in contrast to that of the 68% of
the residents living in either the medium or
combined residential zones, who indicated
future ambition to relocate to other
residential zones other than where they
presently live. Could this be a confirmation
of the saying that the poor are usually
happier and more contented than the rich
members of the society? Or could it be the
effect of the communal living pattern
widespread in the low income neighbourhoods enhanced by absence of
walled fenced cordoning individual
residence? This could be left for future
research.
Table 4.5: Most Preferred Neighbourhood in Ilorin Metropolis
Neighbourhood Zones Frequency Percent
Zone C (combined ) 68 22.4 Zone H (high income) 116 38.3 Zone L (low income) 50 16.5 Zone M (medium income)
69 22.8
Total 303 100.0
Figure 4.2: Preferred Neighbourhood by Households in Ilorin.
Conclusion and Recommendation Findings of this study revealed that irrespective of ethnic background or level

Abdulraheem, Olorunfemi, Ajibade & Agava Perspective of Neighbourhood Preference: A Study of Ilorin City, Nigeria
209
of income, the high income residential
neighbourhood is the preferred place to live
by majority of residents. In other words,
environments close to nature, clean and
beautiful, home that is spacious surrounded
with adequate green cover in the form of trees, shrubs, lawns, flowers and green
areas. This is how neighbourhoods in zone
H appear. More importantly, the study also
revealed that neighbourhood preference is
not dependent on socio-economic status but
on perception of the environmental
attributes and quality of a neighbourhood.
The following actions are hereby
recommended;
Concerted efforts should be made
government and stakeholders to re-create the kind of layouts existing in the high
income residential zones in all other
neighbourhoods within the city especially
areas that are being newly developed.
In the course of recreating, urban
renewal projects should be embarked upon
by the government targeting the low
income neighbourhoods in the core
traditional areas, but efforts should be
made to preserve the traditional character
of this area, since the natural and cultural heritages are great features that must be
preserved for the sustainability of renewal
projects. In addition, citizen participation in
these projects should be encouraged via
massive campaign and sensitizations of the
populace by government and non -
governmental organization, to ensure that
projects implemented are supported by the
ultimate end users and not abandoned or to
wrong.
Creation of green open spaces and
enforcement of urban planning standards is needed to replicate the high income
residential neighbourhood type in all parts
of the city. This offers a means of peaceful
getaway to residents from the bustle of city
life. It would may reduce the incidences of
violence, insecurity and youth unrest which
has gradually infiltrated daily existence in
the once peaceful traditional area of Ilorin.
References
Abdulraheem M. O., Olorunfemi J. F. &
Muhammad-Lawal A. (2014).
Residential MobilityBehaviour of
Households in Developing Nations: A
Case Study of Ilorin, Kwara State,
Nigeria. Journal of Sustainable Development in Africa 16 (8), 88-98.
Adamu, M.K. (2012). Comparative
Analysis of Housing Need and
Housing Demand. The Case of
Metropolitan Minna. Nigeria Journal
of Sustainable Development. 4(2),
107-122.
Andersen, H. S. (2016). Spatial
assimilation? The development in
Immigrants’ Residential Career with
Duration of Stay in Denmark. Journal
of Housing and the Built Environment. 31(2),297-320.
Bender, T. (2015). Residence and the city.
New York, Oxford University Press.
Berk, M. G. (2005). The Concept of
Neighbourhood in Contemporary
Residential Environment: An
Investigation of Occupants’
Perception. Conference paper
“Doing, thinking, feeling home: the
mental geography of residential
environments”, Delft, The Netherlands; 2005.
Brown, K. J. (2013). “A Neo-Rawlsian
Approach to Residential Integration”.
Social Inclusion 1(1), 72–83.
Clark, W. A. V. Duerloo R.C. & Dieleman
F. M. (2004). Residential Mobility
and Neighborhood Careers. In
:Goetgeluk R. and Musterd S.(eds.)
Beyond Residential Mobility: Linking
Residential Choice and Urban
Change.Open House International.
23(3), 35-47. Daramola, T. A. (2016). Assessment of
Environmental Quality Impacts on
Property Value inAkure. Unpublished
Dissertation, Federal University of
Technology, Akure, Nigeria.
Fajimi, F.A. (2011). The Urban Poor and
Home Ownership Quest in Ilorin.
African Research Review. 5(3), 98-
119.
Gbakeji J. O. (2006). The Structure of
Intra-Urban Residential Mobility and

Environmental Technology & Science Journal Vol. 8 No. 2 December 2017.
210
Neighbourhood Preferences in the
Warri Metropolis Delta State,
Nigeria. Ph.D. Thesis (Unpublished)
Ekpoma: Ambrose Alli University.
Gerow, K. G. (2009). Power and Sample
Size Estimation Techniques for Fisheries Management:
Assessment and a New
Computational Tool. North American
Journal of Fisheries Management.
27(3), 397–404.
James, E. R, Lisa, R. & Stafanie, D.
(2002). How do Places Matter? The
Geography of Opportunity, Self –
Efficacy and a Look inside the Black
Box of Residential Mobility. Housing
Studies. 17(1), 71-82.
Jimoh, H. I. (1997). Individual Rainfall Events and Sediment Generation on
Different Surfaces in Ilorin, Nigeria.
Ph. D. Thesis University of Ilorin.
Jørgensen, A., Knudsen, L., Arp, M., &
Skov, H. (2016). Zones of Belonging
- Experiences from a Danish Study on
Belonging, Local Community and
Mobility. GEOFORUM PERSPEKTIV.
15(29) 223-234.
doi:10.5278/15.29.1450
Julius, O.G. & Ojeifo, M.O. (2007). Aspect of Residential and Neighbourhood
Preferences in the Warri Metropolis,
Delta State, Nigeria. Research Gate.
[Retrieved on 4th January 2015], from
https://www.researchgate.net/publicat
ion.
Kwara State of Nigeria (1985-1991).
Official Gazette. Government Press.
Lina Bergström, Maarten van Ham &
Manley David (2010).
Neighbourhood Choice
andNeighbourhood Reproduction. [Retrieved on 23rd July 2016] from
http://ftp.iza.org/dp5238.pdf
Mohammad H., Michal C., Tiina L. &
Marketta K. (2015). Neighbourhood
preferences, Active Travel
Behaviour, and Built Environment:
An Exploratory Study. Elsevier
Transportation Research Part F (29)
57–69
Onokerhoraye, A. G. (1984). Urbanisation
and Social Services in Nigeria. Paper
presented at Two-day Policy Seminar
on Migration, Urbanisation and
Living Conditions in Nigerian Cities,
at the University of Benin, Benin City.
April 4 - 7, 1984.
Oshungade, I.O. (2013). The art of everyday sampling – 121st Inaugural
Lecture of University of Ilorin,
Library and Publication Committee,
University of Ilorin Nigeria.
Oyebanji, J. O. (1994). “Kwara State”. In
Udo, R. K and Mamman. A. B (eds.)
Nigeria, Giant in the Tropics. State
Surveys. 0012. Lagos: Gabumo
Publishing Co. Ltd. 283-289.
Peach, C. (2005). “The Ghetto and the
Ethnic Enclave.” In Desegregating the
City, edited by D. P. Varadi, 31–48. Albany: State University of New
York.
Phillips, D. (2006). “Parallel Lives?
Challenging Discourses of British
Muslim Self-
segregation.”Environment and
Planning D: Society and Space. 24
(1), 25–40.
Phillips, D. (2010). “Minority Ethnic
Segregation, Integration and
Citizenship: A EuropeanPerspective.” Journal of Ethnic and Migration
Studies. 36 (2), 209–225.
Rohlf, F. J. & Sokal, R. R. (1995).
Statistical tables. New York,
Macmillan Publishers Ltd.
Schmidt, G. (2017). Going beyond
Methodological Presentism:
Examples from a Copenhagen
Neighbourhood 1885–2010.
Immigrants & Minorities, 35(1), 40-
58.
Susanne S. & Brit L. (2015): Do Immigrants’ Preferences for
Neighbourhood QualitiesContribute
to Segregation? The Case of Oslo,
Journal of Ethnic and Migration
Studies. [Retrieved on 28th of
November 2017] from
http://dx.doi.org/10.1080/ 1369183X.
2015.1054795
Tunde, O.D.(2013). Issue of Homelessness
in Metropolitan Lagos. Housing
Studies. 24(4), 14-24.

Abdulraheem, Olorunfemi, Ajibade & Agava Perspective of Neighbourhood Preference: A Study of Ilorin City, Nigeria
211
Unilorin Bulletin (2012). The Alma Mater:
Ilorin as a Model. Article featured on
Monday, 2nd July, 2012.
Yusuff, A.H. (2016). Residence Choices
among Inner-city Dwellers: The case
of Lagos City.Unpublished M. Sc.
Thesis, Ahmadu Bello University,
Zaria, Nigeria.

Environmental Technology & Science Journal Vol. 8 No. 2 December 2017.
212