Perceptual Learning on Inspection Time and Motion Perception
30
Perceptual learning on inspection time 1 Running head: INDIVIDUAL DIFFERENCES ON PERCEPTUAL LEARNING Perceptual learning on inspection time and motion perception Nicholas R. Burns, Ted Nettelbeck and Jason McPherson University of Adelaide, Australia Lazar Stankov University of Sydney, Australia.
Transcript of Perceptual Learning on Inspection Time and Motion Perception
Perceptual learning on inspection time 1
Running head: INDIVIDUAL DIFFERENCES ON PERCEPTUAL LEARNING
Perceptual learning on inspection time and motion perception
Nicholas R. Burns, Ted Nettelbeck and Jason McPherson
University of Adelaide, Australia
Lazar Stankov
University of Sydney, Australia.

Perceptual learning on inspection time 2
Abstract
Perceptual learning on simple perceptual tasks is interpreted as plasticity of neuronal
populations in sensory cortex (Fahle, M. & Poggio, T., 2002). This paper examines
individual differences on perceptual learning for two tasks, inspection time (IT), and a
motion direction discrimination task instantiated as random dot kinematograms. The main
questions were whether individual differences in perceptual learning were consistent across
the two tasks; and whether perceptual learning correlated with cognitive abilities test scores.
N = 56 young adults completed 16 threshold estimations on one of two orthogonal versions of
each task. Two further threshold estimations were then made for the untrained, orthogonal
version. Participants also completed a battery of six cognitive abilities tests measuring fluid
ability (Gf) and perceptual speed (Gs). Perceptual learning was demonstrated for both tasks
but the degree of learning across tasks was not characteristic of the individual. Learning on
IT correlated with Gs (r = .35) but learning on the motion direction discrimination task was
unrelated to cognitive ability. Correlations of IT with cognitive measures were stable over the
training period. IT was correlated with both the motion direction discrimination task (r = -
.39) and with an unmasked line length judgment task (r = -.31). We concluded that perceptual
learning on IT correlates with cognitive abilities test scores, that correlations of IT with
cognitive abilities test scores are stable as task performance improves with practice, and that
the IT task is psychologically complex.
Keywords: Perceptual learning; Inspection time; Motion perception; Cognitive ability
Perceptual learning on inspection time 3
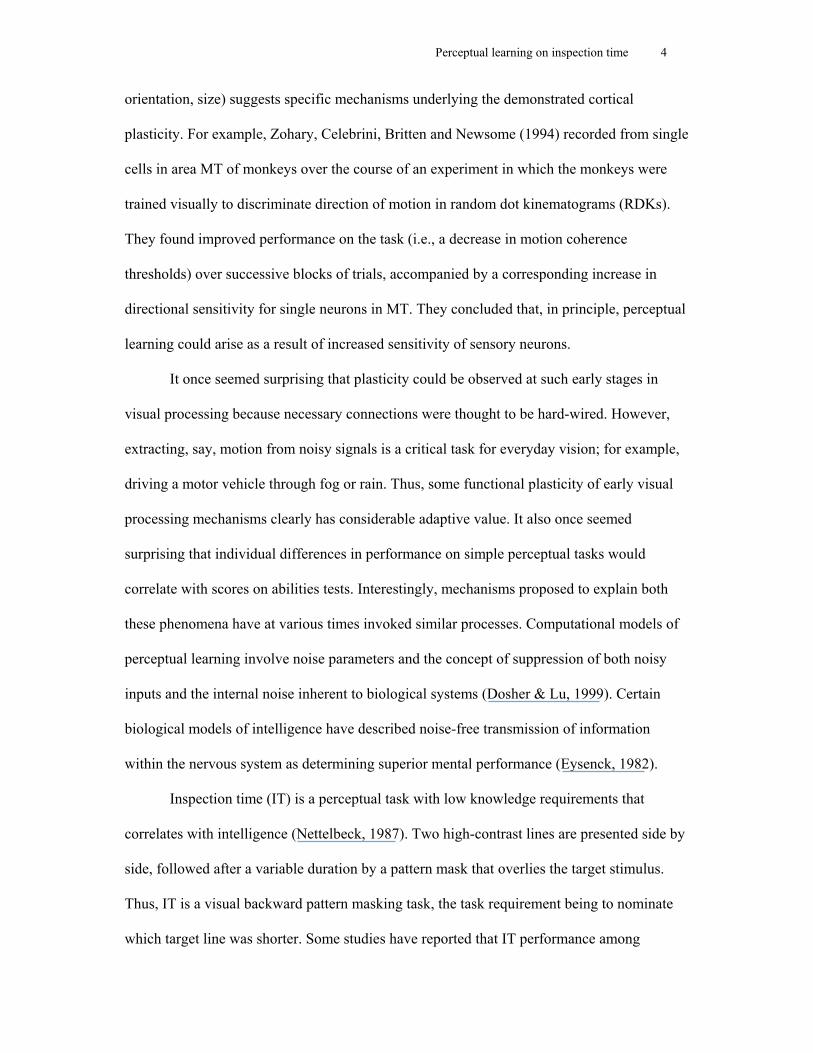
Perceptual learning on inspection time and motion perception
In the search for biological correlates of individual differences in human intelligence,
the net has been cast widely. Thus, Vernon’s (1993) edited volume contained chapters on, for
example, cerebral glucose metabolism, biochemical correlates, EEG and evoked potential
studies, and physical correlates. However, a recurrent theme in Deary’s (2000) book on
intelligence was that establishing such correlations needs ultimately to be accompanied by
well-formulated explanations for mechanisms causing correlations. At present it is difficult to
link psychological level explanations with biological level accounts. This is particularly the
case when considering individual differences in complex behaviors required to solve items
from an intelligence test. Nonetheless, since Spearman’s (1927) suggestion of mental energy
as the basis for general ability (i.e., g), many such explanatory proposals have been made.
Recently, a general property of the brain suggested as a candidate for explaining superior
cognitive performance is neural plasticity (e.g., Garlick, 2002; Simonton, 2003).
It is clear that the brain exhibits remarkable plasticity over multiple different scales
and time frames. The reorganization of somatosensory cortex seen in amputees and studied
extensively in animal models is an astonishing example (Ramachandran & Hirstein, 1998).
Less spectacular but more accessible to study is the phenomenon known to psychophysicists
as perceptual learning. Perceptual learning refers to stimulus specific improvement in the
ability to perform simple perceptual tasks (Ball & Sekuler, 1987; Fiorentini & Berardi, 1980;
Karni & Sagi, 1993; Poggio, Fahle, & Edelman, 1992; Ramachandran & Braddick, 1973).
This has been interpreted as demonstrating plasticity at early stages in the cortical
information processing hierarchy because, as Zanker (1999, p.1293) noted, “improvement is
not just a consequence of getting acquainted with an experimental setting in a general sense,
nor does it result from a slow understanding of the task.” Indeed, the specificity of perceptual
learning on visual tasks to certain stimulus parameters (e.g., direction of motion, motion type,
Perceptual learning on inspection time 4
orientation, size) suggests specific mechanisms underlying the demonstrated cortical
plasticity. For example, Zohary, Celebrini, Britten and Newsome (1994) recorded from single
cells in area MT of monkeys over the course of an experiment in which the monkeys were
trained visually to discriminate direction of motion in random dot kinematograms (RDKs).
They found improved performance on the task (i.e., a decrease in motion coherence
thresholds) over successive blocks of trials, accompanied by a corresponding increase in
directional sensitivity for single neurons in MT. They concluded that, in principle, perceptual
learning could arise as a result of increased sensitivity of sensory neurons.
It once seemed surprising that plasticity could be observed at such early stages in
visual processing because necessary connections were thought to be hard-wired. However,
extracting, say, motion from noisy signals is a critical task for everyday vision; for example,
driving a motor vehicle through fog or rain. Thus, some functional plasticity of early visual
processing mechanisms clearly has considerable adaptive value. It also once seemed
surprising that individual differences in performance on simple perceptual tasks would
correlate with scores on abilities tests. Interestingly, mechanisms proposed to explain both
these phenomena have at various times invoked similar processes. Computational models of
perceptual learning involve noise parameters and the concept of suppression of both noisy
inputs and the internal noise inherent to biological systems (Dosher & Lu, 1999). Certain
biological models of intelligence have described noise-free transmission of information
within the nervous system as determining superior mental performance (Eysenck, 1982).
Inspection time (IT) is a perceptual task with low knowledge requirements that
correlates with intelligence (Nettelbeck, 1987). Two high-contrast lines are presented side by
side, followed after a variable duration by a pattern mask that overlies the target stimulus.
Thus, IT is a visual backward pattern masking task, the task requirement being to nominate
which target line was shorter. Some studies have reported that IT performance among

Perceptual learning on inspection time 5
children improves with practice (Nettelbeck & Wilson, 1985; Nettelbeck & Vita, 1992).
Among adults, Chaiken (1993) found improvement on IT over two estimations separated by
about two hours but mainly at short rather than longer SOAs. Sadler and Deary (1996)
reported strong learning effects on IT over five days of testing and the effect was present at
all SOAs across fully characterized psychometric functions. Stokes and Bors (2001) also
reported strong learning effects over five days on an IT task that used letters rather than lines
as the target stimuli. Nettelbeck, Rabbitt, Wilson and Batt (1996) reported a statistically
significant practice effect on IT among elderly participants across 18-20 months. Perceptual
learning has been demonstrated for some visual masking tasks (Dorais & Sagi, 1997) but
there are no reports of perceptual learning on IT.
Interestingly, much debate on the nature of IT and its correlation with intelligence has
centered on what perceptual processes determine performance on the task. The original task
was framed in terms of the comparison of the length of two lines (Vickers, Nettelbeck, &
Willson, 1972). More recently, it has been speculated that performance depends on the
detection of motion cues generated when the target figure is replaced by the mask figure
(Burns, Nettelbeck, & White, 1998; White, 1996). Perceptual learning for the detection of
motion and discrimination of motion direction has been demonstrated by Ball and Sekuler
(1987) using sparse dot RDKs and by Zanker (1999) using dense dot RDKs. The primary
finding was that perceptual learning was for direction of motion. Thus, learning transferred to
directions close to the trained orientation but not to other directions. Some research has
examined the detection and discrimination of motion direction in relation to individuals with
very low levels of intelligence compared to normal controls (Carlin, Hobbs, Bud, & Soraci,
1999). These researchers reported improvement on motion direction discrimination with
practice on the task even for participants with intellectual disabilities. However, such
individuals required detailed instruction and feedback during training. Investigation of

Perceptual learning on inspection time 6
perceptual learning on IT thus may shed light on the mechanisms underlying performance on
the task and on its relationship with intelligence.
This paper reports an experiment in which participants were trained on either one of
two versions of IT (the traditional version with two vertical lines, or an orthogonal version
consisting of two horizontal lines). For both versions the task was to nominate which line was
shorter; left or right for the former, top or bottom for the latter. Participants were also trained
on either one of two versions of a motion direction discrimination task (motion was in a
vertical plane or a horizontal plane). For both versions the task was to nominate the direction
of motion; up or down for the former, left or right for the latter. After a training phase,
participants were tested on the alternative untrained, orthogonal version of each task.
Evidence for perceptual learning is an improvement of performance during the training
phase, accompanied by a decrement in performance on the untrained, orthogonal version of
each task, relative to the level attained during training. A question we address in the current
paper, then, is whether there is perceptual learning on IT. Consistent with previous research,
we expected to demonstrate perceptual learning on the motion direction discrimination task.
Of interest was the extent of individual differences on perceptual learning for both tasks and
whether it was characteristic of the individual. We asked whether perceptual learning on
either task correlates with intelligence test scores, the expectation being that magnitude of
improvement would correlate positively with test scores. The inference would be that degree
of neural plasticity was related to superior mental performance. We also examined the pattern
of correlations of IT with intelligence test scores during the course of training; the literature
is equivocal on this issue, with some reports that correlations increase in magnitude as
experience with IT increases but other reports of just the opposite. Finally, we explored IT in
terms of putative components, specifically, line length judgment and the detection of motion
signals generated by the backward masking procedure used in the IT task. Does superior

Perceptual learning on inspection time 7
performance on an unmasked line length judgment task, or on the motion direction
discrimination task, or on both of them, determine IT?
Method
Participants
There were N = 56 participants (23 males; mean age = 24.2, SD = 6.6 years) recruited
via an advertisement placed with the University employment service. Most were students and
all were paid A$50 at completion of the study.
Apparatus and materials
For both the inspection time and motion direction discrimination tasks stimuli were
displayed at a viewing distance of 1 m on a high-resolution monitor (1024 x 768 pixels, 100
Hz vertical refresh rate) driven by a digital stimulus generator (VSG 2/3; Cambridge
Research Systems).
Inspection time. For the traditional IT task, hereafter referred to as ‘Vertical IT’, the
target figure consisted of two vertical lines, one subtending a visual angle of 2.1 deg and the
other 2.5 deg and joined at the top by a horizontal line subtending an angle of 1.2 deg. The
shorter line appeared on the left or right equiprobably. Each trial involved the following
sequence of events. The target figure was preceded by a warning beep. Following exposure
of the target figure for the relevant stimulus onset asynchrony (SOA, see below), it was
immediately replaced by a “flash” mask (Evans & Nettelbeck, 1993) of 300 ms duration and
consisting of two vertical lines subtending a visual angle of 3.3 deg and shaped as lightning
bolts (see Figure 1). For the orthogonal version of the IT task, hereafter referred to as
‘Horizontal IT’, details were the same as for Vertical IT but the target figure consisted of two
horizontal lines joined at the left by a vertical line; the shorter line appeared on the top or
bottom equiprobably. The participant indicated the location of the shorter line in the target

Perceptual learning on inspection time 8
figure by pressing the appropriate button on the computer mouse, the orientation of which
was changed to suit the Vertical IT and Horizontal IT tasks.
Motion direction discrimination. There were two versions of this task, hereafter
referred to as ‘Vertical Motion’ and ‘Horizontal Motion’, respectively, and instantiated as
dense dot RDKs (see Figure 1). For both versions the stimulus field was 256 pixels x 256
pixels (10.8 x 10.3 deg). Within a dynamic noise background consisting of black and white
dots, a 16 x 16 pixels square group of black and white dots was either displaced up or down,
for Vertical Motion; or displaced left or right, for Horizontal Motion (direction of motion was
equiprobable). This motion-defined object was shifted by one pixel between frames (motion
at about 3 deg/sec) and its starting position was randomized within an area of 32 x 32 pixels
centered on the middle of the stimulus field. On any trial, a proportion of dots within the
motion-defined square was inverted between frames (black pixels replaced by white and vice
versa; inverted dots were randomly chosen with the proportion determined by the estimation
algorithm, see below). This manipulation allowed the signal-to-noise ratio of the motion-
defined object to be systematically varied in steps of 10% noise from 0-to-100% noise. When
the proportion of dots exchanged becomes high the object is no longer perceived against the
dynamic noise background (where the probability of any dot being black or white on any
frame is 0.5). Each trial commenced with the appearance of 12 frames of the dynamic noise
background, followed, after a brief beep, by the 12 frame stimulus sequence and ended with
another set of 12 noise frames. For the Vertical Motion task, participants indicated whether
the square moved up or down and for the Horizontal Motion task, whether it moved left or
right, by pressing the appropriate button on the computer mouse, which was oriented so that
the keys aligned with left-right or up-down configurations.
Psychometric tests. Fluid ability (Gf) was assessed using two tests from the
Woodcock-Johnson Psycho-Educational Battery-Revised (WJ-R; Woodcock & Johnson,

Perceptual learning on inspection time 9
1989), Analysis-Synthesis, which involves solving for the missing components of an
incomplete logic problem, and Concept Formation, a test of categorical reasoning. General
processing speed (Gs) was assessed using Visual Matching and Cross Out, also from the WJ-
R and both measuring clerical speed. Broad visualization ability (Gv) was assessed using two
computerised tests from Stankov’s Tests of Cognitive Ability (STOCA), a battery used for
the selection of train drivers in New South Wales (Australia). In the Line Length test, five
vertical lines are presented on the screen in a staggered fashion. The task is to indicate which
line is longer than the remaining four. The length of the odd line differs from the rest by from
one to five pixels. In the Letter Spotting test, a set of ten letters is presented on the screen for
800 msec, followed by another set of ten letters, and so on, until ten sets of letters have been
presented. Some of these letter sets contain a designated letter (e.g., the letter “o”). The task
is to count the number of times this letter appeared on the screen. For tests from WJ-R, W-
scores (Rasch-scaled scores, centered on 500) were used; for tests from STOCA, scores were
percentage items correct.
Procedure. Participants attended five sessions in the laboratory spread over a period
of at least one week but no more than two weeks. The first session lasted about 90 min and
subsequent sessions lasted about 60 min. At the first session, participants were assigned to
one of the four possible combinations of the two psychophysical tasks. Task requirements
were explained using unmasked stimuli for IT and zero noise stimuli for motion direction
discrimination. Once participants understood task requirements, including the instruction that
accuracy not speed of response was important, threshold estimations commenced. To
determine psychophysical threshold we used an adaptive stair case algorithm (Wetherill &
Levitt, 1965) that returned an estimate of the 79% correct performance level. Thus, we used a
three-up, one-down rule for determining the SOA (or noise level) presented on any trial. That
is, three correct responses were required before reducing the SOA by 10 ms (or increasing the

Perceptual learning on inspection time 10
noise level by 10%) but SOA was increased by 10 ms (or noise level decreased by 10%) after
each incorrect response. For each estimation, the initial trial had an SOA of 250 ms (or noise
level 0%). Estimated threshold was the average of 12 reversals on the staircase. Two
estimations for each task were completed at this first session. Following this, all
psychometric testing was completed. At the next three sessions, four estimations for each
psychophysical task were completed (estimations for each task were completed alternately).
At the final session, two estimations for each task were made. Then, two further estimations
were completed but on the orthogonal orientation to that for which previous estimations had
been made. Thus, a participant who had completed 16 estimations for Vertical IT and
Horizontal Motion now completed two estimations each on Horizontal IT and Vertical
Motion.
Results
Figure 2 shows mean threshold performance for each task at each of the 18 separate
staircase estimates. The metric for the dependent variable was different for the IT tasks and
the motion direction discrimination tasks. For the former, SOA (in msec) was the dependent
variable and for the latter it was the proportion of noise (percentage noise) added to the
square group of dots moving against the dynamic noise background. Thus, the two tasks were
analyzed separately using repeated measures analysis of variance where the successive
threshold estimations during the training phase of the experiment were the 16 levels of the
independent variable. There was also a between-subjects factor with two levels; that is, the
version of the task used during the training phase of the experiment (Vertical or Horizontal).
We note here that we adopted the multivariate approach to repeated measures analysis of
variance. This approach treats the set of repeated measures together and has a major
advantage over the traditional approach in that it makes no assumptions on the sphericity of
the variance-covariance matrix. This multivariate approach is marginally less powerful than

Perceptual learning on inspection time 11
the traditional approach but this disadvantage is outweighed because fewer assumptions are
made (see e.g., Howell, 2002).
For IT, the ANOVA showed that there was no effect of training group membership,
F(1, 54) = 2.29, p = .14. The training group by staircase estimate interaction was also not
statistically significant, F(15, 40) = 1.44, p = .18, but the effect of training was, F(15, 40) =
8.84, p < .001, partial η2 = .77. Thus, performance on both Vertical and Horizontal versions
of IT improved over the 16 estimates of the training phase (i.e., IT estimates became shorter).
This improvement encompassed statistically significant linear, F(1, 54) = 62.6, p < .001,
partial η2 = .54, and quadratic, F(1, 54) = 8.87, p = .004, partial η2 = .14, components.
To establish whether perceptual learning can be claimed on IT, it remains to be
demonstrated that there was a decrement in performance when participants were tested on the
orientation orthogonal to that for the training phase. The thresholds for the first and last two
staircase estimates in the training phase (hereafter Initial and Final) and the two estimates
from the test phase (hereafter Test) were averaged. These mean estimates are shown in Table
1. A repeated measures ANOVA, with time of testing now having three levels and with the
between-subjects factor as before, was conducted. The ANOVA showed that there was no
effect of training group membership, F(1, 54) = 0.14, p = .71. However, the training group by
time of testing interaction was statistically significant, F(2, 53) = 13.1, p < .001, partial η2 =
.33, as was the effect of time of testing, F(2, 53) = 39.9, p < .001, partial η2 = .60. The
interaction arises because of between group performance differences at Initial and Test (see
Figure 2 and Table 1). The effect for time of testing, along with the means shown in Table 1,
establishes perceptual learning for IT.
For motion direction discrimination, the ANOVA, conducted as for IT, showed that
there was no effect of training group membership, F(1, 54) = 0.19, p = .66. The training
group by staircase estimate interaction was also not statistically significant, F(15, 40) = 0.96,

Perceptual learning on inspection time 12
p = .52 but the effect of training was, F(15, 40) = 7.96, p < .001, partial η2 = .75. Thus,
performance on both Vertical and Horizontal versions of IT improved over the 16 estimates
of the training phase (i.e., noise level estimates improved). This improvement encompassed
statistically significant linear, F(1, 54) = 85.3, p < .001, partial η2 = .61, and quadratic, F(1,
54) = 14.2, p < .001, partial η2 = .21, components.
To establish whether perceptual learning can be claimed on motion direction
discrimination, the same procedure was followed as for IT. Mean estimates for Initial, Final
and Test are shown in Table 1. The ANOVA showed that there was no effect of training
group membership, F(1, 54) = 0.08, p = .78, and the training group by time of testing
interaction was also not statistically significant, F(2, 53) = 2.02, p = .14. The effect of time of
testing was statistically significant, F(2, 53) = 32.6, p < .001, partial η2 = .55. The effect for
time of testing, along with the means shown in Table 1, establishes perceptual learning for
IT.
Examination of individual data showed clear differences across participants in their
patterns of learning for both tasks. However, quantifying the extent of this learning was
difficult because of variability within individuals across both estimations within sessions and
across sessions. In an attempt to capture the extent of learning across the training phase, data
were smoothed via a three-point moving average procedure. Improvement was then
quantified as the change in performance between the first datum point and the last datum
point expressed as a percentage of the first datum point. Individuals trained on Horizontal IT
improved more than those trained on Vertical IT (29.9% (SD = 31.6) and 20.0% (SD = 18.0,
respectively) but this difference was not statistically significant (Welch’s t(adjusted df = 42)
= 1.44, p = .16, d = 0.42). Individuals trained on Horizontal Motion improved more than
those trained on Vertical Motion (19.3% (SD = 17.0) and 12.9% (SD = 15.7) but again this
difference was not statistically significant (Welch’s t(adjusted df = 53) = 1.46, p = .15, d =

Perceptual learning on inspection time 13
.39). Correlations between learning on the two tasks, whether considered for the sample as a
whole, or for subsets defined by training direction, were near zero and not statistically
significant. Thus, there is no learning parameter for each individual that applied across the IT
and Motion tasks. This outcome was replicated when various functions were fitted to
individual learning curves for both tasks.
Turning now to correlations of perceptual learning with different cognitive ability test
scores. First, a principal components analysis of the six abilities measures was performed.
The first component accounted for 34% of variance and the second component accounted for
a further 26% of variance; these components were the only two with eigen values greater
than unity. An oblique rotation (promax) of these two components was easily interpretable.
One component was Gf, loaded by Analysis-Synthesis and Concept Formation. The other
was loaded by the remaining four tests and is clearly Gs. It seems that in this sample
visualization ability was too homogeneous to enable definition of a separate Gv component.
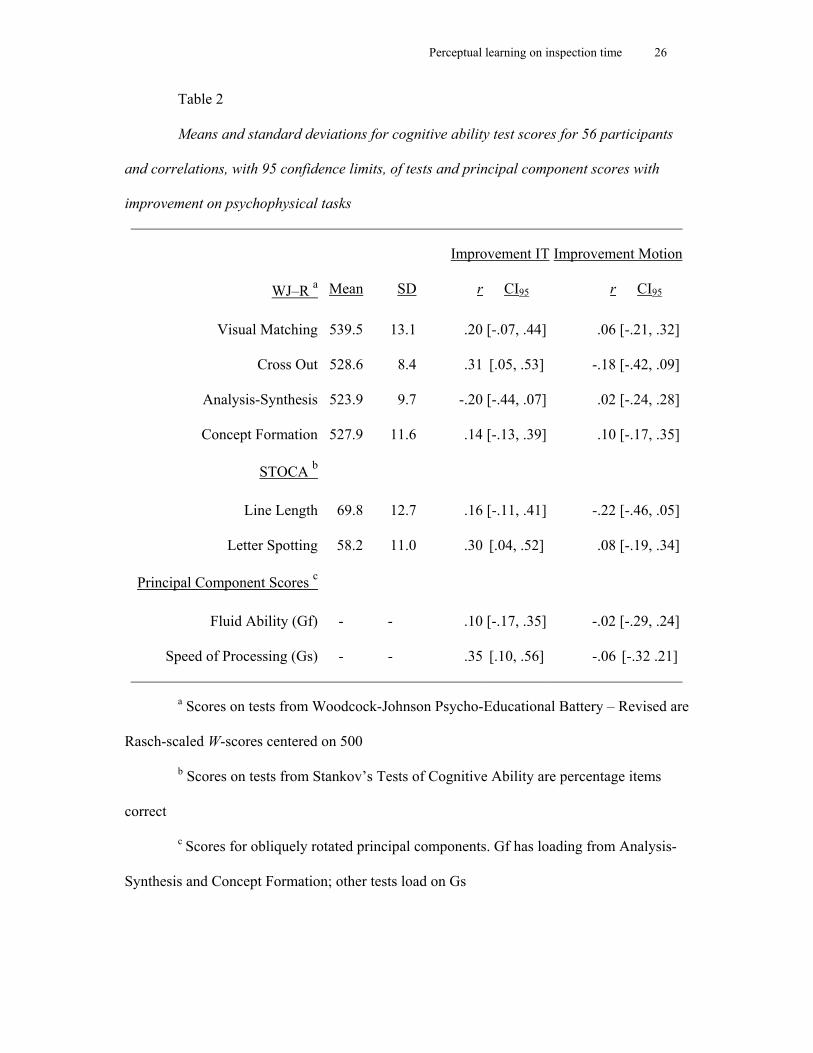
Table 2 shows the descriptive statistics for the cognitive abilities data, along with the
correlation of each test, and of the component scores for Gf and Gs, with the improvement on
each task. These data are for the sample as a whole and we noted that there were no
statistically significant differences on cognitive ability test scores for any of the tests across
the four training groups. The only correlations of note were between learning on the IT task
and Cross Out from WJ-R and Letter Spotting from STOCA. These indicate a positive
correlation between improvement on the IT task and performance on tests of Gs.
Table 3 shows the correlations between Vertical IT and Horizontal IT and Gs and Gf,
as defined above, at each staircase estimate during the training phase. For Vertical IT,
correlations were consistent with expectations. That is, correlations were all negative and of
greatest magnitude for Gs. Unexpectedly, however, the correlations for Horizontal IT were
not statistically significant. For Vertical IT, the correlations with Gs do not appear to change

Perceptual learning on inspection time 14
reliably over the training period. The correlation of Vertical IT with Gf is largest at the first
three staircase estimates and then becomes close to zero as the training phase progresses.
There are no discernible patterns in the correlations for Horizontal IT.
The final issue addressed concerns whether performance on IT is accounted for by
performance on the motion direction discrimination task, or the unmasked line length
judgment task from STOCA, or both of them. The data considered are for the sample as a
whole and for the average of the first two staircase estimates for IT and the motion
discrimination task (IT Initial and Motion Initial, see above). The correlation between IT and
Motion was r = -.39, p = .003, CI95 = [-.59, -.14] and the correlation between IT and Line
Length was r = -.31, p = .021, CI95 = [-.53, -.05]. The partial correlation between IT and
Motion, controlling for Line Length, was -.36, p = .007; the partial correlation between IT
and Line Length, controlling for Motion, was -.26, p = .053. Thus, both motion direction
discrimination performance and accuracy of unmasked line length judgment make
independent contributions to variance in IT. This pattern of correlations held when Vertical
IT and Horizontal IT were analyzed separately, and if other estimates than the initial two
staircases were considered. It was also of interest whether partialling Motion and Line Length
from IT affected correlations of IT with ability test scores. We assessed this only for Vertical
IT because Horizontal IT did not correlate with Gs or Gf. In short, the zero-order correlations
of Vertical IT (average of first two threshold estimates) with Gs and Gf were -.32 and -.34,
respectively. Residualized Vertical IT correlated with Gs and Gf, -.25 and -.38, respectively.
That is, the correlations scarcely changed suggesting the correlation of IT with ability test
scores does not depend on either line length discrimination or motion discrimination.
Discussion
We have demonstrated perceptual learning on both IT and the motion direction
discrimination tasks. The latter finding confirmed previous research (Ball & Sekuler, 1987;

Perceptual learning on inspection time 15
Zanker, 1999) but the former is novel. The evidence for perceptual learning on IT was
stronger for the traditional version of the task, that is, the target with two vertical lines.
Participants initially found a different version of the task where the target was two horizontal
lines more difficult but, by the end of the training phase, performances on both versions were
identical. Then, a greater degree of transfer of learning to the untrained orientation was
observed for those in the Horizontal IT training group. This outcome meant that the
Horizontal IT group did not show as large a decrement in performance when tested on the
Vertical IT task as did the Vertical IT group when they were tested on Horizontal IT.
Previous research on IT which reported improvement with practice did not consider the
possibility that this improvement represented perceptual learning. That is, an implication of
our finding is that improvement in performance on the IT task arises due to changes in
perceptual mechanisms very early in the visual processing hierarchy. We discuss this point
further below when considering changes in correlations between IT and cognitive ability test
scores as IT performance becomes practiced.
We observed substantial individual differences in degree of improvement in
performance on both IT and the motion direction discrimination tasks. However, there was no
intraindividual consistency in degree of improvement across the two tasks. This null finding
should be viewed in the context of the fact that we have used only two visual tasks to study
perceptual learning from an individual differences perspective. Moreover, in this study we
sampled mainly university students, a group restricted in range on all cognitive abilities
dimensions. We therefore suggest that our study could be extended to a more representative
sample and that a range of simple perceptual tasks, including sensory modalities other than
visual, be used in an effort to quantify perceptual learning as a parameter that may represent
more general cortical plasticity. Such a parameter may at least partially define a general
intelligence factor.

Perceptual learning on inspection time 16
In the current study, improvement on the two tasks was difficult to quantify in a
refined way, with both tasks showing variability in performance both within sessions and
across sessions. This was particularly so for IT, with variability in mean performance for this
task, expressed as a proportion of mean performance, being much higher than for the motion
direction discrimination task. This suggests the possibility that IT is a more complex
perceptual task than the motion perception task, perhaps offering more variety of possibilities
to resolve the task, both perceptual and strategic. Certainly, IT was estimated reliably here
(median for one-back lagged correlations, that is, test-retest reliability over 16 estimations
were .79 and .80, for Vertical and Horizontal IT, respectively). Contrary to predictions based
on a strong version of the plasticity hypothesis, correlations of learning with cognitive
abilities test scores were generally low. However, for learning on IT, we did establish a
correlation with Gs of r = .35; and given the crudity of the learning measure adopted here,
this may be enough to encourage an attempt to refine the procedures we used. The lack of
correlation with learning on the motion direction discrimination tasks is plausibly due to
restricted variance on these tasks and their lack of reliability (median for one-back lagged
correlations, that is, test-retest reliability over 16 estimations were .50 and .57, for Vertical
and Horizontal Motion, respectively).
Previous evidence on the question of whether correlations of IT with intelligence test
scores change as performance on IT becomes more practiced is contradictory. Some
researchers have reported that practice on the task reduces correlations with intelligence test
scores (e.g., Nettelbeck & Vita, 1992). Stokes and Bors (2001) reported that with their
version of IT (actually a pattern backward masking task with two letters as targets and a
same-different discrimination), performance improved over five sessions where IT was tested
once each session. They also reported that the correlation between IT and a short version of
the Raven APM was .41 on Day 1 but decreased to .15, .18, .25, and .11, on the successive

Perceptual learning on inspection time 17
four days. However, the small sample size (N = 39) and consequent wide confidence intervals
for these correlations make it difficult to discern whether the correlations decreased reliably
with practice. Similarly, Bors, Stokes, Forrin and Hodder (1999) using a two lines IT task,
reported that performance improved over three sessions where IT was tested once each
session. Correlations between IT and Raven APM were -.43, -.15, and -.07, over the three
sessions, respectively. However, on an N = 17, these correlations are not statistically different
from each other. Chaiken (1993), on the other hand, reported that correlations of IT with the
Cattell Culture Fair Test increased from .35 to .50 across two estimations made about two
hours apart. Even with a much larger sample (N = 163), 95% confidence intervals around
these correlations overlap to such an extent that whether the correlation increased reliably is
doubtful. On balance, the conclusion we draw from these studies is that the correlation of IT
with intelligence test score may be unaffected by practice. Moreover, these studies used
measures of Gf or an IQ proxy but recent research points to IT measuring Gs and being
independent of Gf (Burns & Nettelbeck, 2003; Burns, Nettelbeck, & Cooper, 1999;
Crawford, Deary, Allan, & Gustafsson, 1998; Mackintosh & Bennett, 2002). For the current
study, Vertical IT showed correlations with Gs (mean r = -.39) that were remarkably stable
over 16 staircase estimates. Again, although not statistically different from each other, the
correlations with Gf (mean r = -.22) were highest for the initial staircase estimates. This latter
outcome, at least, is consistent with Stokes and Bors and Bors et al. We can offer no
explanation for the finding that Horizontal IT had near zero correlations with Gs (mean r = -
.02) and Gf were near zero (mean r = .03).
The final issue we addressed in this study concerned the nature of perceptual
processes involved in resolving the IT task. It was noted that performance on both motion
direction discrimination and unmasked line length judgment contributed to performance on
IT. However, for Vertical IT, partialling these measures from IT did not substantially affect

Perceptual learning on inspection time 18
correlations with Gs or Gf. Thus, at least two perceptual processes, line length judgment and
motion discrimination, contribute to IT performance; however, neither separately, nor
together, do they account for total covariance between IT and Gs or Gf.
To summarize, perceptual learning, which is taken to represent a form of plasticity at
early stages of the cortical processing hierarchy (see Fahle & Poggio, 2002), was observed
for both IT and motion direction discrimination. There were substantial individual differences
in the extent of perceptual learning but this was not characteristic of individuals across the
two tasks. Perceptual learning on IT correlated with Gs but perceptual learning on motion
direction discrimination did not correlate with cognitive ability test scores. Because we
demonstrated that improvement on IT arises due to perceptual learning, we can infer that
improvement on the task arises, at least in part, due to changes in neuronal populations very
early in the visual processing stream. This inference, coupled with the observation that the
correlation of IT with intelligence test scores is stable even though performance on IT
improves, has at least two possible interpretations. First, the locus of the correlation of IT
with IQ is later in the cortical processing hierarchy than the early visual processing stages
where line orientation perception and motion perception are localized. Second, the degree of
change in early visual stages responsible for learning on IT may be highly correlated with
whatever processes underlie the correlation of IT with intelligence. This second possibility
receives some support from the observation that learning on IT correlates with intelligence
test scores. Finally, the perceptual processes involved in IT are complex, involving both line
length judgment and the detection of motion. Many researchers have invested time in
attempting to reduce the strength of apparent movement cues available in IT when the mask
replaces the target (Burns et al., 1998; Chaiken & Young, 1993; Evans & Nettelbeck, 1993;
Knibb, 1992; Stough, Bates, Mangan, & Colrain, 2001). This may well be impossible and, in
any case, the detection of motion in the environment is an ability with such adaptive value

Perceptual learning on inspection time 19
that it is something that humans do, whether they report the use of such a strategy to resolve
the task, or not. Motion detection is likely an intrinsic part of IT and other pattern backward
masking tasks but might not be central to the correlation between IT and IQ.
Perceptual learning on inspection time 20
References
Ball, K., & Sekuler, R. (1987). Direction-specific improvement in motion discrimination.
Vision Research, 27, 953-965.
Bors, D. A., Stokes, T. L., Forrin, B., & Hodder, S. L. (1999). Inspection time and
intelligence: Practice, strategies, and attention. Intelligence, 27, 111-129.
Burns, N. R., & Nettelbeck, T. (2003). Inspection time in the structure of cognitive abilities:
Where does IT fit? Intelligence, 31, 237-255.
Burns, N. R., Nettelbeck, T., & Cooper, C. J. (1999). Inspection time correlates with general
speed of processing but not with fluid ability. Intelligence, 27, 37-44.
Burns, N. R., Nettelbeck, T., & White, M. (1998). Testing the interpretation of inspection
time as a measure of speed of sensory processing. Personality and Individual
Differences, 24, 25-39.
Carlin, M. T., Hobbs, K. L., Bud, M. J., & Soraci, S. A. (1999). Detection of motion-defined
forms by individuals with mental retardation and autism: Evidence of modifiability.
Intelligence, 27, 141-156.
Chaiken, S. R. (1993). Two models for an inspection time paradigm: Processing distraction
and processing speed versus processing speed and asymptotic strength. Intelligence,
17, 257-283.
Chaiken, S. R., & Young, R. K. (1993). Inspection time and intelligence: Attempts to
eliminate the apparent movement strategy. American Journal of Psychology, 106,
191-210.
Crawford, J. R., Deary, I. J., Allan, K. M., & Gustafsson, J. E. (1998). Evaluating competing
models of the relationship between inspection time and psychometric intelligence.
Intelligence, 26, 27-42.

Perceptual learning on inspection time 21
Deary, I. J. (2000). Looking down on human intelligence: From psychometrics to the brain.
Oxford: OUP.
Dorais, A., & Sagi, D. (1997). Contrast masking effects change with practice. Vision
Research, 37, 1725-1733.
Dosher, B. A., & Lu, Z. L. (1999). Mechanisms of perceptual learning. Vision Research, 39,
3197-3221.
Evans, G., & Nettelbeck, T. (1993). Inspection time: A flash mask to reduce apparent
movement effects. Personality and Individual Differences, 15, 91-94.
Eysenck, H. J. (Ed.) (1982). A model for intelligence. NY: Springer-Verlag.
Fahle, M. & Poggio, T. (Eds.) (2002). Perceptual learning. Cambridge, MA: The MIT Press.
Fiorentini, A., & Berardi, N. (1980). Perceptual learning specific for orientation and spatial
frequency. Nature, 287, 43-44.
Garlick, D. (2002). Understanding the nature of the general factor of intelligence: The role of
individual differences in neural plasticity as an explanatory mechanism.
Psychological Review, 109, 116-136.
Howell, D.C. (2002). Statistical methods for psychology (5th ed.). Pacific Grove CA:
Duxbury.
Karni, A., & Sagi, D. (1993). The time course of learning a visual skill. Nature, 365, 250-
252.
Knibb, K. (1992). A dynamic mask for inspection time. Personality and Individual
Differences, 13, 237-248.
Mackintosh, N. J., & Bennett, E. S. (2002). IT, IQ and perceptual speed. Personality and
Individual Differences, 32, 685-693.
Nettelbeck, T. (1987). Inspection time and intelligence. In P.A. Vernon (Ed.), Speed of
information processing and intelligence (pp. 295-346). Norwood, NJ: Ablex.

Perceptual learning on inspection time 22
Nettelbeck, T. & Vita, P. (1992). Inspection time in two childhood age cohorts: A constant or
a developmental function? British Journal of Developmental Psychology, 10, 189-
197.
Nettelbeck, T. & Wilson, C. (1985). A cross-sequential analysis of developmental differences
in speed of visual information processing. Journal of Experimental Child Psychology,
40, 1-22.
Nettelbeck, T., Rabbitt, P. M. A., Wilson, C., & Batt, R. (1996). Uncoupling learning from
initial recall: The relationship between speed and memory deficits in old age. British
Journal of Psychology, 87, 593-607.
Poggio, T., Fahle, M., & Edelman, S. (1992). Fast perceptual learning in visual hyperacuity.
Science, 256, 1018-1021.
Ramachandran, V. S., & Braddick, O. (1973). Orientation-specific learning in stereopsis.
Perception, 2, 371-376.
Ramachandran, V. S., & Hirstein, W. (1998). The perception of phantom limbs: The D. O.
Hebb lecture. Brain, 121, 1603-1630.
Sadler, A. J., & Deary, I. J. (1996). Cerebral asymmetries in inspection time?
Neuropsychologia, 34, 283-295.
Simonton, D. K. (2003). Genius and g: Intelligence and exceptional achievement. In H.
Nyborg (Ed.), The scientific study of general intelligence: Tribute to Arthur R Jensen
(pp. 229-245). Kidlington, Oxford: Pergamon.
Spearman, C. (1927). The abilities of man: Oxford: Macmillan.
Stokes, T. L., & Bors, D. A. (2001). The development of a same-different inspection time
paradigm and the effects of practice. Intelligence, 29, 247-261.

Perceptual learning on inspection time 23
Stough, C., Bates, T. C., Mangan, G. L., & Colrain, I. (2001). Inspection time and
intelligence: Further attempts to eliminate the apparent movement strategy.
Intelligence, 29, 219-230.
Vernon, P. A. (Ed.). (1993). Biological approaches to the study of human intelligence.
Norwood, NJ: Ablex.
Vickers, D., Nettelbeck, T., & Willson, R. J. (1972). Perceptual indices of performance: The
measurement of "inspection time" and "noise" in the visual system. Perception, 1,
263-295.
Wetherill, G. B., & Levitt, H. (1965). Sequential estimation of points on a psychometric
function. British Journal of Mathematical and Statistical Psychology, 18, 1-10.
White, M. (1996). Interpreting inspection time as a measure of the speed of sensory
processing. Personality and Individual Differences, 20, 351-363.
Woodcock, R. W., & Johnson, M. B. (1989). Woodcock-Johnson Psycho-Educational
Battery-Revised. Allen, TX: DLM Teaching Resources.
Zanker, J. M. (1999). Perceptual learning in primary and secondary motion vision. Vision
Research, 39, 1293-1304.
Zohary, E., Celebrini, S., Britten, K. H., & Newsome, W. T. (1994). Neuronal plasticity that
underlies improvement in perceptual performance. Science, 263, 1289-1292.

Perceptual learning on inspection time 24
Author Note
Nicholas R Burns, Ted Nettelbeck and Jason McPherson, Department of Psychology,
University of Adelaide, Australia. Lazar Stankov, University of Sydney, Australia.
Lazar Stankov is now at Center for New Constructs, Educational Testing Services,
Princeton, NJ.
This research was supported by a Faculty of Health Sciences B3 Grant awarded to the
first author. Preparation of the manuscript was supported by an Australian Research Council
Discovery Grant DP0211113 awarded to the first two authors. We thank Dr Nathan Brody
and Dr Timothy Bates for helpful comments on earlier versions of this paper.
Correspondence concerning this article should be addressed to Nicholas Burns,
Department of Psychology, University of Adelaide, South Australia, 5005, Australia. E-mail:

Perceptual learning on inspection time 25
Table 1
Means and 95% confidence intervals for threshold estimates averaged across the
first two (Initial) and last two (Final) staircase estimates from the training phase and the two
staircase estimates from the test phase (Test)for Vertical IT, Horizontal IT, Vertical Motion
and Horizontal Motion tasks
Vertical IT
(msec)
Horizontal IT
(msec)
Vertical Motion
(% noise)
Horizontal Motion
(%noise)
Mean CI95 Mean CI95 Mean CI95 Mean CI95
Initial
a
51.4 44.9, 57.9 64.8 57.8, 71.8 .54 .51, .56 .51 .48, .55
Finalb 40.8 34.2, 47.4 41.6 34.6, 48.6 .59 .57, .61 .61 .58, .63
Testc 55.6 48.1, 63.0 46.1 39.2, 53.0 .54 .52, .57 .56 .53, .59
a Initial is the average of the first two threshold estimates of the training phase for
each task
b Final is the average of the last two threshold estimates of the training phase for
each task
c Test is the average of the two threshold estimates of the test phase for each task.
Thus participants trained on Vertical IT were tested on Horizontal IT, and so on
Perceptual learning on inspection time 26
Table 2
Means and standard deviations for cognitive ability test scores for 56 participants
and correlations, with 95 confidence limits, of tests and principal component scores with
improvement on psychophysical tasks
Improvement IT Improvement Motion
WJ–R a Mean SD r CI95 r CI95
Visual Matching 539.5 13.1 .20 [-.07, .44] .06 [-.21, .32]
Cross Out 528.6 8.4 .31 [.05, .53] -.18 [-.42, .09]
Analysis-Synthesis 523.9 9.7 -.20 [-.44, .07] .02 [-.24, .28]
Concept Formation 527.9 11.6 .14 [-.13, .39] .10 [-.17, .35]
STOCA b
Line Length 69.8 12.7 .16 [-.11, .41] -.22 [-.46, .05]
Letter Spotting 58.2 11.0 .30 [.04, .52] .08 [-.19, .34]
Principal Component Scores c
Fluid Ability (Gf) - - .10 [-.17, .35] -.02 [-.29, .24]
Speed of Processing (Gs) - - .35 [.10, .56] -.06 [-.32 .21]
a Scores on tests from Woodcock-Johnson Psycho-Educational Battery – Revised are
Rasch-scaled W-scores centered on 500
b Scores on tests from Stankov’s Tests of Cognitive Ability are percentage items
correct
c Scores for obliquely rotated principal components. Gf has loading from Analysis-
Synthesis and Concept Formation; other tests load on Gs

Perceptual learning on inspection time 27
Table 3
Correlations of Vertical IT and Horizontal IT with Gs and Gf at each staircase
estimate
Staircase Estimate Vertical IT Horizontal IT
Gs Gf Gs Gf
1 -0.250 -0.370 0.142 -0.009
2 -0.349 -0.282 0.119 -0.021
3 -0.526 -0.415 0.037 0.099
4 -0.268 -0.087 -0.243 -0.091
5 -0.411 -0.201 -0.130 -0.269
6 -0.459 -0.325 -0.160 0.008
7 -0.342 -0.283 -0.046 0.079
8 -0.396 -0.271 0.067 0.059
9 -0.298 -0.155 -0.074 0.024
10 -0.279 -0.135 -0.008 0.019
11 -0.300 -0.129 0.173 0.278
12 -0.463 -0.322 0.128 0.203
13 -0.471 -0.302 0.198 0.172
14 -0.564 -0.163 -0.019 -0.020
15 -0.443 -0.155 -0.287 -0.101
16 -0.451 -0.089 -0.154 0.059
17 -0.346 -0.284 -0.220 -0.214
18 -0.294 -0.169 -0.192 -0.132
Note. An absolute correlation of .37 is statistically significant at p = .05 level for N =
28 in each group.

Perceptual learning on inspection time 28
Figure Captions
Figure 1. (Top) Two alternative IT target figures (center), and lightning mask (right) for the
inspection time (IT) task. Shown is the Vertical IT task; the Horizontal IT task used identical
stimuli rotated 90 deg anticlockwise. (Bottom) Random dot kinematogram (RDK) stimulus at
one instant of time. The dots within the white square are displaced coherently in the direction
of the white arrow from frame-to-frame. The background dots are black or white with equal
probability in any one frame of the animation and their state is uncorrelated from frame-to-
frame. Note that the black and white borders of the square and background do not appear in
the actual stimuli, the object is defined by its motion against the dynamic noise background
which is presented on a background of the same mean luminance as the RDK.
Figure 2. (Top) Mean 79% estimates for threshold SOA for Vertical IT and Horizontal IT
(msec) at each staircase estimate. Note, the legend refers to training groups (estimates 1-16);
at estimates 17 and 18 each group’s legend remains the same but participants have completed
the orthogonal version of the task. (Bottom) Mean 79% threshold estimates for Vertical
Motion and Horizontal Motion (% noise) at each staircase estimate. As for IT, above, the
legend refers to training groups and at estimates 17 and 18 each group completed the
orthogonal task. Error bars are SEM.

Perceptual learning on inspection time 29
Figure 1 Burns et al.

Perceptual learning on inspection time 30
0
10
20
30
40
50
60
70
80
0 1 2 3 4 5 6 7 8 9 10 11 12 13 14 15 16 17 18
Sequence of estimates
IT (m
sec)
Vertical ITHorizontal IT
0
0.1
0.2
0.3
0.4
0.5
0.6
0.7
0.8
0 1 2 3 4 5 6 7 8 9 10 11 12 13 14 15 16 17 18
Sequence of estimates
Noi
se (%
)
Vertical MotionHorizontal Motion
Figure 2 Burns et al.