
Oracle GoldenGate Microservices Architecture with Oracle ...
Upload
khangminh22Category
view
1download
0
PeopleTools 8.54: PerformanceMonitor
November 2016

PeopleTools 8.54: Performance MonitorCDSKUCopyright © 1988, 2016, Oracle and/or its affiliates. All rights reserved.
License Restrictions Warranty/Consequential Damages DisclaimerThis software and related documentation are provided under a license agreement containing restrictionson use and disclosure and are protected by intellectual property laws. Except as expressly permittedin your license agreement or allowed by law, you may not use, copy, reproduce, translate, broadcast,modify, license, transmit, distribute, exhibit, perform, publish, or display any part, in any form, or by anymeans. Reverse engineering, disassembly, or decompilation of this software, unless required by law forinteroperability, is prohibited.
Warranty DisclaimerThe information contained herein is subject to change without notice and is not warranted to be error-free.If you find any errors, please report them to us in writing.
Restricted Rights NoticeIf this is software or related documentation that is delivered to the U.S. Government or anyone licensing iton behalf of the U.S. Government, then the following notice is applicable:
U.S. GOVERNMENT END USERS: Oracle programs, including any operating system, integratedsoftware, any programs installed on the hardware, and/or documentation, delivered to U.S. Governmentend users are "commercial computer software" pursuant to the applicable Federal Acquisition Regulationand agency-specific supplemental regulations. As such, use, duplication, disclosure, modification,and adaptation of the programs, including any operating system, integrated software, any programsinstalled on the hardware, and/or documentation, shall be subject to license terms and license restrictionsapplicable to the programs. No other rights are granted to the U.S. Government.
Hazardous Applications NoticeThis software or hardware is developed for general use in a variety of information managementapplications. It is not developed or intended for use in any inherently dangerous applications, includingapplications that may create a risk of personal injury. If you use this software or hardware in dangerousapplications, then you shall be responsible to take all appropriate fail-safe, backup, redundancy, andother measures to ensure its safe use. Oracle Corporation and its affiliates disclaim any liability for anydamages caused by use of this software or hardware in dangerous applications.
Trademark NoticeOracle and Java are registered trademarks of Oracle and/or its affiliates. Other names may be trademarksof their respective owners.
Intel and Intel Xeon are trademarks or registered trademarks of Intel Corporation. All SPARC trademarksare used under license and are trademarks or registered trademarks of SPARC International, Inc.AMD, Opteron, the AMD logo, and the AMD Opteron logo are trademarks or registered trademarks ofAdvanced Micro Devices. UNIX is a registered trademark of The Open Group.
Third Party Content, Products, and Services DisclaimerThis software or hardware and documentation may provide access to or information about content,products, and services from third parties. Oracle Corporation and its affiliates are not responsible for andexpressly disclaim all warranties of any kind with respect to third-party content, products, and servicesunless otherwise set forth in an applicable agreement between you and Oracle. Oracle Corporation and itsaffiliates will not be responsible for any loss, costs, or damages incurred due to your access to or use ofthird-party content, products, or services, except as set forth in an applicable agreement between you andOracle.
Documentation AccessibilityFor information about Oracle's commitment to accessibility, visit the Oracle Accessibility Programwebsite at http://www.oracle.com/pls/topic/lookup?ctx=acc&id=docacc.
Access to Oracle SupportOracle customers that have purchased support have access to electronic support through My OracleSupport. For information, visit http://www.oracle.com/pls/topic/lookup?ctx=acc&id=info or visit http://www.oracle.com/pls/topic/lookup?ctx=acc&id=trs if you are hearing impaired.

Copyright © 1988, 2016, Oracle and/or its affiliates. All rights reserved. v
Contents
Preface..........................................................................................................................................................xiUnderstanding the PeopleSoft Online Help and PeopleBooks............................................................. xi
PeopleSoft Hosted Documentation................................................................................................. xiLocally Installed Help..................................................................................................................... xiDownloadable PeopleBook PDF Files............................................................................................xiCommon Help Documentation...................................................................................................... xiiField and Control Definitions........................................................................................................ xiiTypographical Conventions............................................................................................................xiiISO Country and Currency Codes................................................................................................xiiiRegion and Industry Identifiers.................................................................................................... xiii
Using and Managing the PeopleSoft Online Help.............................................................................. xivPeopleTools Related Links.................................................................................................................. xivContact Us............................................................................................................................................xivFollow Us.............................................................................................................................................xiv
Chapter 1: Getting Started with Performance Monitor........................................................................17Performance Monitor Overview........................................................................................................... 17Performance Monitor Implementation..................................................................................................17
Installation-Level Steps.................................................................................................................. 17Post Installation-Level Steps..........................................................................................................17
Chapter 2: Understanding Performance Monitor..................................................................................19Performance Monitor............................................................................................................................ 19Performance Monitor Architecture....................................................................................................... 20
The Monitored System................................................................................................................... 21The Monitoring System..................................................................................................................23
Implementation Options........................................................................................................................25Self-Monitoring Monitoring System.............................................................................................. 25Production Monitoring System...................................................................................................... 26
Performance Monitor Instrumentation..................................................................................................26Understanding PMUs..................................................................................................................... 26Understanding Events.....................................................................................................................27
Performance Integration with Third Party Systems............................................................................. 27Usage Monitor.......................................................................................................................................27Performance Monitor Data................................................................................................................... 28Scope of the Performance Monitor...................................................................................................... 29
Chapter 3: Setting Up the Performance Monitor.................................................................................. 31Configuration of the Performance Monitor..........................................................................................31Enabling the Required Elements on the Monitoring System............................................................... 31
Setting Up the Performance Monitor Database............................................................................. 31Setting Up the Application Server.................................................................................................32Setting Up the Web Server for the Monitoring System.................................................................33Creating a PPMI User ID.............................................................................................................. 34Specifying the PPMI URL and PPMI User ID............................................................................. 35Specifying the Integration Gateway URL......................................................................................36Setting Up the Process Scheduler Server for the Monitoring System........................................... 36
Enabling the Required Elements on the Monitored System................................................................ 37Setting Up the Database of the Monitored System....................................................................... 37Specifying the Monitor URL......................................................................................................... 37

Contents
vi Copyright © 1988, 2016, Oracle and/or its affiliates. All rights reserved.
Setting Up the Web Server of the Monitored System................................................................... 38Setting Up the Application Server.................................................................................................39Enabling the Usage Monitor.......................................................................................................... 39Setting Up the Process Scheduler Server...................................................................................... 40
Chapter 4: Administering the Performance Monitor............................................................................ 43Performance Monitor Administration...................................................................................................43
Performance Monitor Administration............................................................................................ 43Setting Global System Options............................................................................................................ 44Setting System Definition Defaults...................................................................................................... 47Modifying System Definitions..............................................................................................................49Viewing Agent Definitions................................................................................................................... 53Setting Agent Filter Options.................................................................................................................55Scheduling the Reaper Program........................................................................................................... 57Scheduling Performance Data Archiving............................................................................................. 57
Running the Performance Data Archiving Program......................................................................58Working with Aborted Program Runs........................................................................................... 58
Populating Performance Monitor Lookup Tables................................................................................ 58Working with Performance Monitor Tables......................................................................................... 59Disabling Performance Monitor Agents...............................................................................................60Working with Performance Monitor Web Profile Properties............................................................... 60Tracing Performance Monitor Agents.................................................................................................. 61
Enabling Tracing on the Application Server or Process Scheduler Server....................................61Enabling Tracing on the Web Server.............................................................................................61
Tracing the Monitor and PPMI Servlets.............................................................................................. 61Configuring Performance Monitoring Sampling Rate......................................................................... 62Viewing Monitor Servlet Diagnostics.................................................................................................. 62
Monitoring Agents..........................................................................................................................63Monitoring PPMI Clients............................................................................................................... 63
Setting Up Monitor Clusters.................................................................................................................65Using Performance Monitor Data Mover Scripts................................................................................ 66Estimating Your Performance Database Size....................................................................................... 67
Estimating Your Performance Database Size Overview................................................................67Estimating Space Requirements for Event Data............................................................................68Estimating Space Requirements for PMU Data............................................................................ 70Calculating Space Requirements....................................................................................................71
Chapter 5: Working with the Performance Trace................................................................................. 73Understanding the Performance Trace................................................................................................. 73Enabling a Performance Trace..............................................................................................................73Running a Performance Trace.............................................................................................................. 74Viewing Performance Trace Information............................................................................................. 75
Chapter 6: Monitoring System Performance..........................................................................................77System Performance Monitoring.......................................................................................................... 77
Monitoring System Performance....................................................................................................77Using the System Performance Home Page.........................................................................................77Viewing Web Server Performance........................................................................................................83Viewing Application Server Domain Performance.............................................................................. 87
Viewing Analytic Server Information............................................................................................91Viewing Process Scheduler Server Performance..................................................................................91Viewing Master Scheduler Performance.............................................................................................. 95Viewing Open PMUs............................................................................................................................97Viewing Open PMU Trees................................................................................................................. 100

Contents
Copyright © 1988, 2016, Oracle and/or its affiliates. All rights reserved. vii
Viewing Current User Sessions.......................................................................................................... 101Viewing Recycled Processes Diagnosis............................................................................................. 102Monitoring Resource Usage............................................................................................................... 102
Working with Event 150 (JVM Status)....................................................................................... 103Working with Event 151 (Network Status)..................................................................................103Working with Event 200 (Resources Per Process)...................................................................... 103Working with Event 300 (Host Resource Status)........................................................................ 105Working with Event 301 (Tuxedo "pq Rows)............................................................................. 108Working with Event 302 (Tuxedo "psr" Rows)...........................................................................108
Chapter 7: Analyzing Historical Performance Data............................................................................109Historical Performance Data...............................................................................................................109
Understanding Historical Performance Data................................................................................109Viewing Completed PMUs................................................................................................................. 109
Entering Search Criteria............................................................................................................... 109Working with Completed PMUs..................................................................................................112Completed PMU Status................................................................................................................115The PMU Details Page.................................................................................................................116
Viewing Event History........................................................................................................................116Entering Search Criteria............................................................................................................... 116Working with Event History Information.................................................................................... 118
Viewing User Session History............................................................................................................120Entering Search Criteria............................................................................................................... 120Working with User History Information......................................................................................121
Viewing Concurrent Signon Information........................................................................................... 122Understanding Concurrent Signon Information...........................................................................122Maintaining Chart Data................................................................................................................122Viewing The Concurrent Signon Chart........................................................................................124
Chapter 8: Working with Performance Monitor Charts and Analytics............................................ 127Performance Monitor Charts and Analytics....................................................................................... 127
Understanding Performance Monitor Charts and Analytics........................................................ 127Common Elements Used in Performance Monitor Charts and Analytics....................................127
Viewing User Request Analytics........................................................................................................127The User Requests Chart............................................................................................................. 129The Request Time vs. Think Time Chart.................................................................................... 130User Request Details.................................................................................................................... 131
Viewing Component Trace Information............................................................................................. 135Viewing Component Statistics............................................................................................................139Viewing Portal Statistics.....................................................................................................................143Viewing PIA Statistics........................................................................................................................ 144Viewing Top Portal Content Requests................................................................................................146Viewing Top PeopleCode Events....................................................................................................... 148Viewing Top PeopleCode Executions................................................................................................ 150Viewing Top PeopleCode SQL Statements........................................................................................151Viewing Top Components...................................................................................................................153
Chapter 9: Performance Monitor Security Considerations................................................................ 157Setting Up PSPPMSRV Authentication............................................................................................. 157Firewall Considerations...................................................................................................................... 157
Agent Communication with the Monitor Servlet........................................................................ 157PSPPMSRV Communication with the Monitor Servlet...............................................................158Monitor Cluster Members............................................................................................................ 159
Setting Up SSL................................................................................................................................... 159

Contents
viii Copyright © 1988, 2016, Oracle and/or its affiliates. All rights reserved.
Setting Up SSL Between Agents and Performance Monitor.......................................................159Setting Up SSL Between Performance Monitor and PSPPMSRV and Monitor ClusterMembers....................................................................................................................................... 159
Setting Up SSL Client Authentication............................................................................................... 160Protecting the Performance Monitor Servlets.................................................................................... 162
Chapter 10: Performance Monitor Meta-Data.....................................................................................163Performance Monitor Meta-Data Definitions.....................................................................................163Metric Definitions............................................................................................................................... 164Event Definitions................................................................................................................................ 166Context Definitions............................................................................................................................. 167PMU Definitions................................................................................................................................. 167
Appendix A: PMU Definition Reference............................................................................................... 169PMU 100 Portal Request....................................................................................................................169PMU 101 PIA Request....................................................................................................................... 170PMU 102 Compression Request.........................................................................................................171PMU 106 PIA Request From Portal.................................................................................................. 172PMU 108 User Session Ended........................................................................................................... 172PMU 109 User Session Began........................................................................................................... 173PMU 113 Authenticate....................................................................................................................... 174PMU 114 Attach File Request............................................................................................................175PMU 115 JOLT Request.....................................................................................................................176PMU 116 Redirect after Login...........................................................................................................177PMU 117 Get Content........................................................................................................................ 178PMU 400 Tuxedo Service PCode and SQL.......................................................................................179PMU 401 ICPanel...............................................................................................................................180PMU 402 Modal Level 1................................................................................................................... 181PMU 403 Modal Level 2................................................................................................................... 182PMU 404 PeopleCode Program Execution........................................................................................ 183PMU 406 PeopleCode SQL Execute..................................................................................................184PMU 407 PeopleCode BuiltIn SQL Execute..................................................................................... 185PMU 408 PeopleTools SQL Execute................................................................................................. 186PMU 409 Explicit Commit.................................................................................................................187PMU 410 ICScript.............................................................................................................................. 188PMU 411 ICQuery..............................................................................................................................189PMU 412 Tuxedo Service Summary..................................................................................................189PMU 413 GetCertificate..................................................................................................................... 191PMU 414 SQL Fetch Summary......................................................................................................... 192PMU 415 PortalRegistry.....................................................................................................................193PMU 416 ICWorklist.......................................................................................................................... 193PMU 417 FTP Request.......................................................................................................................194PMU 418 PSBusComp....................................................................................................................... 195PMU 419 BI GetInterlink...................................................................................................................196PMU 420 BI Execute......................................................................................................................... 197PMU 421 BI BulkExecute..................................................................................................................197PMU 422 LDAP Bind........................................................................................................................ 198PMU 423 LDAP Search..................................................................................................................... 199PMU 424 Call AppEngine..................................................................................................................199PMU 425 Implicit Commit.................................................................................................................200PMU 426 RemoteCall Built-in...........................................................................................................201PMU 427 Deserialization....................................................................................................................202PMU 428 Serialization........................................................................................................................203
Contents
Copyright © 1988, 2016, Oracle and/or its affiliates. All rights reserved. ix
PMU 439 Workflow PCode Summary...............................................................................................204PMU 440 Usage Monitoring.............................................................................................................. 205PMU 500 SavePreChange PCode Summary......................................................................................206PMU 501 SavePostChange PCode Summary.................................................................................... 207PMU 502 SaveEdit PCode Summary.................................................................................................208PMU 503 SaveEdit PCode Summary.................................................................................................209PMU 504 RowSelect PCode Summary..............................................................................................210PMU 505 RowInsert PCode Summary.............................................................................................. 211PMU 506 RowDelete PCode Summary............................................................................................. 212PMU 507 FieldChange PCode Summary...........................................................................................213PMU 508 FieldEdit PCode Summary................................................................................................ 214PMU 509 FieldDefault PCode Summary...........................................................................................215PMU 510 PrePopup PCode Summary................................................................................................216PMU 511 ItemSelected PCode Summary.......................................................................................... 217PMU 512 SearchInit PCode Summary...............................................................................................218PMU 513 SearchSave PCode Summary............................................................................................ 219PMU 514 Active PCode Summary.................................................................................................... 220PMU 515 PreBuild PCode Summary.................................................................................................221PMU 516 PostBuild PCode Summary............................................................................................... 222PMU 700 PPMI Servlet......................................................................................................................223PMU 800 Monitor Servlet Request....................................................................................................223
PMU 801 Analytic Server Request..............................................................................................225Filter Level................................................................................................................................... 225PMU 802 Synchronize/Read Data from Data Cache Summary.................................................. 225PMU 803 Synchronize/Write Data to Data Cache Summary...................................................... 226PMU 804 Synchronize/Read Data from Data Cache Details...................................................... 227PMU 805 Synchronize/Write Data to Data Cache Details.......................................................... 228PMU 806 Load ACE Model Trees Summary............................................................................. 229PMU 807 Load ACE Model Trees Details..................................................................................230PMU 808 Recalculate ACE Model Summary............................................................................. 230PMU 809 Recalculate ACE Model Details................................................................................. 231PMU 810 ACE Model Get Data..................................................................................................232PMU 811 ACE Model Set Data.................................................................................................. 233
Appendix B: Event Definition Reference.............................................................................................. 235Event 150............................................................................................................................................ 235Event 151............................................................................................................................................ 235Event 152............................................................................................................................................ 236Event 153............................................................................................................................................ 237Event 200............................................................................................................................................ 238Event 300............................................................................................................................................ 239Event 301............................................................................................................................................ 239Event 302............................................................................................................................................ 240Event 350............................................................................................................................................ 241Event 351............................................................................................................................................ 241Event 354............................................................................................................................................ 242Event 355............................................................................................................................................ 243Event 356............................................................................................................................................ 243Event 500............................................................................................................................................ 244Event 600............................................................................................................................................ 244Event 601............................................................................................................................................ 245Event 701............................................................................................................................................ 246

Contents
x Copyright © 1988, 2016, Oracle and/or its affiliates. All rights reserved.
Event 702............................................................................................................................................ 246Event 703 PPMI Notify Cancel Interest.............................................................................................247Event 704 PPMI Notify Agent Change..............................................................................................247Event 705 PPMI Notify Monitor Change.......................................................................................... 248Event 801............................................................................................................................................ 248Event 802 Monitoring Server Client Lost..........................................................................................249Event 803 Monitoring Server Data Lost............................................................................................ 249Event 900 Agent Buffer Overrun....................................................................................................... 250Event 901 Agent Init Notification......................................................................................................250Event 902 Agent Configuration Ack..................................................................................................251Event 903 Agent Contact Notification............................................................................................... 251Event 904 Analytic Server Status.......................................................................................................252Event 905 Analytic Server Load Event..............................................................................................253Event 906 Out of Analytic Servers.................................................................................................... 253Event 907 Analytic Server Recycle Event......................................................................................... 254
Appendix C: PeopleSoft Performance Monitor Diagnostic Plug-in................................................... 255Understanding Performance Monitor Diagnostic Plug-in.................................................................. 255Running Performance Monitor Diagnostics....................................................................................... 255Reviewing Diagnostic Information.....................................................................................................256
Appendix D: Working With Usage Monitor.........................................................................................259Enabling Usage Monitor.....................................................................................................................259Verifying Usage Monitor Data Collection..........................................................................................259Associating Test Names and Test Cases With Usage Monitor Data.................................................. 259Viewing Usage Monitor Data.............................................................................................................261Integrating Usage Monitor Data with Lifecycle Management Tools................................................. 261

Copyright © 1988, 2016, Oracle and/or its affiliates. All rights reserved. xi
Preface
Understanding the PeopleSoft Online Help and PeopleBooks
The PeopleSoft Online Help is a website that enables you to view all help content for PeopleSoftApplications and PeopleTools. The help provides standard navigation and full-text searching, as well ascontext-sensitive online help for PeopleSoft users.
PeopleSoft Hosted DocumentationYou access the PeopleSoft Online Help on Oracle’s PeopleSoft Hosted Documentation website, whichenables you to access the full help website and context-sensitive help directly from an Oracle hostedserver. The hosted documentation is updated on a regular schedule, ensuring that you have access to themost current documentation. This reduces the need to view separate documentation posts for applicationmaintenance on My Oracle Support, because that documentation is now incorporated into the hostedwebsite content. The Hosted Documentation website is available in English only.
Note: Only the most current release of hosted documentation is updated regularly. After a new release isposted, previous releases remain available but are no longer updated.
Locally Installed HelpIf your organization has firewall restrictions that prevent you from using the Hosted Documentationwebsite, you can install the PeopleSoft Online Help locally. If you install the help locally, you have morecontrol over which documents users can access and you can include links to your organization’s customdocumentation on help pages.
In addition, if you locally install the PeopleSoft Online Help, you can use any search engine for full-text searching. Your installation documentation includes instructions about how to set up Oracle SecureEnterprise Search for full-text searching.
See PeopleTools Installation for your database platform, “Installing PeopleSoft Online Help.” If you donot use Secure Enterprise Search, see the documentation for your chosen search engine.
Note: Before users can access the search engine on a locally installed help website, you must enable theSearch portlet and link. Click the Help link on any page in the PeopleSoft Online Help for instructions.
Downloadable PeopleBook PDF FilesYou can access downloadable PDF versions of the help content in the traditional PeopleBook format.The content in the PeopleBook PDFs is the same as the content in the PeopleSoft Online Help, but it hasa different structure and it does not include the interactive navigation features that are available in theonline help.

Preface
xii Copyright © 1988, 2016, Oracle and/or its affiliates. All rights reserved.
Common Help DocumentationCommon help documentation contains information that applies to multiple applications. The two maintypes of common help are:
• Application Fundamentals
• Using PeopleSoft Applications
Most product families provide a set of application fundamentals help topics that discuss essentialinformation about the setup and design of your system. This information applies to many or allapplications in the PeopleSoft product family. Whether you are implementing a single application, somecombination of applications within the product family, or the entire product family, you should be familiarwith the contents of the appropriate application fundamentals help. They provide the starting points forfundamental implementation tasks.
In addition, the PeopleTools: Applications User's Guide introduces you to the various elements of thePeopleSoft Pure Internet Architecture. It also explains how to use the navigational hierarchy, components,and pages to perform basic functions as you navigate through the system. While your application orimplementation may differ, the topics in this user’s guide provide general information about usingPeopleSoft Applications.
Field and Control DefinitionsPeopleSoft documentation includes definitions for most fields and controls that appear on applicationpages. These definitions describe how to use a field or control, where populated values come from, theeffects of selecting certain values, and so on. If a field or control is not defined, then it either requiresno additional explanation or is documented in a common elements section earlier in the documentation.For example, the Date field rarely requires additional explanation and may not be defined in thedocumentation for some pages.
Typographical ConventionsThe following table describes the typographical conventions that are used in the online help.
Typographical Convention Description
Key+Key Indicates a key combination action. For example, a plus sign (+) between keys means that you must hold down the first keywhile you press the second key. For Alt+W, hold down the Altkey while you press the W key.
. . . (ellipses) Indicate that the preceding item or series can be repeated anynumber of times in PeopleCode syntax.
{ } (curly braces) Indicate a choice between two options in PeopleCode syntax. Options are separated by a pipe ( | ).
[ ] (square brackets) Indicate optional items in PeopleCode syntax.
Preface
Copyright © 1988, 2016, Oracle and/or its affiliates. All rights reserved. xiii
Typographical Convention Description
& (ampersand) When placed before a parameter in PeopleCode syntax, an ampersand indicates that the parameter is an alreadyinstantiated object.
Ampersands also precede all PeopleCode variables.
⇒ This continuation character has been inserted at the end of aline of code that has been wrapped at the page margin. Thecode should be viewed or entered as a single, continuous lineof code without the continuation character.
ISO Country and Currency CodesPeopleSoft Online Help topics use International Organization for Standardization (ISO) country andcurrency codes to identify country-specific information and monetary amounts.
ISO country codes may appear as country identifiers, and ISO currency codes may appear as currencyidentifiers in your PeopleSoft documentation. Reference to an ISO country code in your documentationdoes not imply that your application includes every ISO country code. The following example is acountry-specific heading: "(FRA) Hiring an Employee."
The PeopleSoft Currency Code table (CURRENCY_CD_TBL) contains sample currency code data. TheCurrency Code table is based on ISO Standard 4217, "Codes for the representation of currencies," andalso relies on ISO country codes in the Country table (COUNTRY_TBL). The navigation to the pageswhere you maintain currency code and country information depends on which PeopleSoft applicationsyou are using. To access the pages for maintaining the Currency Code and Country tables, consult theonline help for your applications for more information.
Region and Industry IdentifiersInformation that applies only to a specific region or industry is preceded by a standard identifier inparentheses. This identifier typically appears at the beginning of a section heading, but it may also appearat the beginning of a note or other text.
Example of a region-specific heading: "(Latin America) Setting Up Depreciation"
Region IdentifiersRegions are identified by the region name. The following region identifiers may appear in the PeopleSoftOnline Help:
• Asia Pacific
• Europe
• Latin America
• North America
Preface
xiv Copyright © 1988, 2016, Oracle and/or its affiliates. All rights reserved.
Industry IdentifiersIndustries are identified by the industry name or by an abbreviation for that industry. The followingindustry identifiers may appear in the PeopleSoft Online Help:
• USF (U.S. Federal)
• E&G (Education and Government)
Using and Managing the PeopleSoft Online Help
Click the Help link in the universal navigation header of any page in the PeopleSoft Online Help to seeinformation on the following topics:
• What’s new in the PeopleSoft Online Help.
• PeopleSoft Online Help acessibility.
• Accessing, navigating, and searching the PeopleSoft Online Help.
• Managing a locally installed PeopleSoft Online Help website.
PeopleTools Related Links
Oracle's PeopleSoft PeopleTools 8.54 Documentation Home Page (Doc ID 1664613.1)
"PeopleTools Product/Feature PeopleBook Index" (PeopleTools 8.54: Getting Started with PeopleTools)
PeopleSoft Information Portal
My Oracle Support
PeopleSoft Training from Oracle University
PeopleSoft Video Feature Overviews on YouTube
Contact Us
Send us your suggestions Please include release numbers for the PeopleTools and applications that youare using.
Follow Us
Get the latest PeopleSoft updates on Facebook.

Preface
Copyright © 1988, 2016, Oracle and/or its affiliates. All rights reserved. xv
Follow PeopleSoft on Twitter@PeopleSoft_Info.


Copyright © 1988, 2016, Oracle and/or its affiliates. All rights reserved. 17
Chapter 1
Getting Started with Performance Monitor
Performance Monitor Overview
The Performance Monitor enables you to view real-time and historical performance data of yourPeopleSoft systems. The Performance Monitor provides the information that you need to solve immediateperformance issues and analyze trends in system performance.
By default, the Performance Monitor is disabled on a new PeopleSoft installation. To enable thePerformance Monitor, follow the configuration instructions in this PeopleBook.
When you have a PeopleSoft application environment running and you have set up the PerformanceMonitor, you can begin to capture and analyze PeopleSoft performance data.
Performance Monitor Implementation
Before using the Performance Monitor, you need to perform some implementation and configurationtasks, in addition to standard PeopleSoft installation and implementation tasks.
Related LinksConfiguration of the Performance MonitorGetting Started with PeopleTools
Installation-Level StepsComplete the following steps during installation.
Step Reference
Install PeopleTools. See PeopleTools 8.54 Installation for your platform.
Install one or more PeopleSoft applications. See Installation documentation for your applications.
Post Installation-Level StepsTo enable the Performance Monitor complete these steps.

Getting Started with Performance Monitor Chapter 1
18 Copyright © 1988, 2016, Oracle and/or its affiliates. All rights reserved.
Step Reference
Configure appropriate access to the menu items that are underthe PeopleTools, Performance Monitor menu.
System administrators will need access to these pagesto configure the system and view the pages displayingperformance information.
See Security Administration.
Configure the monitoring system. See Enabling the Required Elements on the MonitoringSystem.
Configure one or more monitored systems. See Enabling the Required Elements on the MonitoredSystem.

Copyright © 1988, 2016, Oracle and/or its affiliates. All rights reserved. 19
Chapter 2
Understanding Performance Monitor
Performance Monitor
Performance Monitor helps system administrators monitor PeopleSoft performance data and, ifwanted, share the data with third-party monitoring tools. Performance Monitor is a diagnostic utilityfor monitoring the performance of the main elements of your PeopleSoft system, such as web servers,application servers, and Process Scheduler servers. You can monitor real-time performance and analyzehistorical data.
Performance Monitor reports:
• Durations and key metrics of PeopleTools runtime execution, such as SQL statements andPeopleCode events.
• Key resource metrics, such as host CPU use and web server execution threads.
See Performance Monitor Instrumentation.
The metrics that are provided by Performance Monitor enable system administrators to:
• Monitor real-time system performance.
• Identify poorly performing tiers, hosts, domains, servers, application code, and SQL in a PeopleSoftenvironment.
• Identify performance trends.
• Address and isolate performance bottlenecks.
Note: Performance Monitor enables you to isolate and identify the causes of performance issues;however, it does not provide automatic solutions to performance issues.
Understanding Performance Monitor Chapter 2
20 Copyright © 1988, 2016, Oracle and/or its affiliates. All rights reserved.
Performance Monitor Architecture
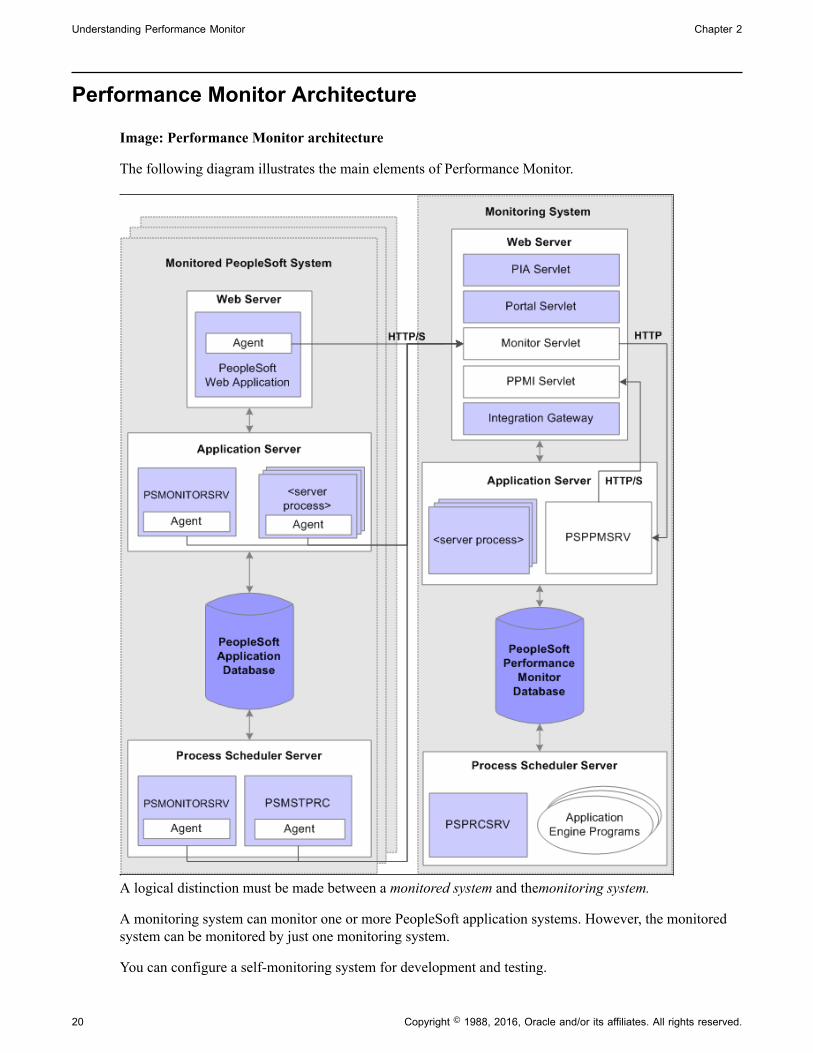
Image: Performance Monitor architecture
The following diagram illustrates the main elements of Performance Monitor.
A logical distinction must be made between a monitored system and themonitoring system.
A monitoring system can monitor one or more PeopleSoft application systems. However, the monitoredsystem can be monitored by just one monitoring system.
You can configure a self-monitoring system for development and testing.

Chapter 2 Understanding Performance Monitor
Copyright © 1988, 2016, Oracle and/or its affiliates. All rights reserved. 21
The Monitored SystemThe monitored system comprises the following main elements:
• PeopleSoft application database.
• Application server.
• Web server.
• Process Scheduler server.
Note: An application server is also known as a business logic server in some PeopleSoft materials.However, in this PeopleBook, only the term application server appears.
Performance Monitor agents reside on each main element of the monitored system. Agents run on theservers to gather and report performance information. An agent is a small piece of code operating fromwithin an existing process. It collects performance data and uses a dedicated thread to send the data to themonitoring system. Agent threads report data to the monitoring system's monitor servlet, which in turnreports XML formatted performance data to the PSPPMSRV server processes in the monitoring system'sapplication server.
Two types of agents exist:
• Process instrumentation agents that report data about the specific server activities.
• Domain resource agents that report resource usage statistics about the process and server, such asCPU usage.
PeopleSoft Application DatabaseThe database being monitored is the database for your PeopleSoft application, such as the Human CapitalManagement database or the Customer Relationship Management database.
Note: Performance Monitor does not monitor the performance of the RDBMS or the server on which itruns.
Application ServerThe application server domain for the monitored system contains the following elements that are relatedto Performance Monitor:

Understanding Performance Monitor Chapter 2
22 Copyright © 1988, 2016, Oracle and/or its affiliates. All rights reserved.
Performance Monitor Element Description
Server process agents One agent exists for each of the following server processesrunning within an application server domain:
• PSAPPSRV
• PSQCKSRV
• PSQRYSRV
• PSMONITORSRV
• PSSAMSRV
• PSANALYTICSRV
Domain Monitor (PSMONITORSRV) The domain monitor runs in the PSMONITORSRV applicationserver process. It monitors:
• Host resource usage.
• Tuxedo performance metrics.
Note: The domain monitor also monitors its own resourceconsumption.
Web ServerThe web server contains the following elements that are related to the Performance Monitor:
Performance Monitor Element Description
Web server agents Reports performance metrics from the instrumented code. Thesystem starts a web server agent for a site after the site getsaccessed for the first time.
Domain Monitor Reports resource events that related to the web server usage. One resource monitor exists for each system that is hosted ineach web application on each web server.
Process Scheduler ServerThe Process Scheduler for the monitored system contains the following elements that are related toPerformance Monitor:

Chapter 2 Understanding Performance Monitor
Copyright © 1988, 2016, Oracle and/or its affiliates. All rights reserved. 23
Component Description
Server process agent On the Process Scheduler server, only the Master Schedulerprocess, PSMSTPRC, has a server process agent recordingperformance data. The PSMSTPRC agent reports batchsummary metrics, such as the number of and types of queuedtasks.
Note: Performance information of this type is available only ifa Master Scheduler is configured to run on the system.
Domain Monitor (PSMONITORSRV) The domain monitor runs in the PSMONITORSRV serverprocess. It monitors:
• Host resource usage.
• Tuxedo performance metrics.
Note: The domain monitor also monitors its own resourceconsumption.
The Monitoring SystemLike the monitored system, the monitoring system includes the following elements:
• Performance Monitor database.
• Application server.
• Web server.
• Process Scheduler server.
Performance Monitor DatabaseThe database for the monitoring system requires at least the PeopleTools System database (PTSYS) thatyou create during an initial PeopleSoft installation. This database contains all of the necessary PeopleSoftobjects and definitions that are required to store and display PeopleSoft performance data.
Note: The space that is required to store performance data requires increased tablespace sizes, especiallyin PSIMGR and the associated index tablespace.
Note: Any PeopleSoft system can act as a monitor for any other PeopleSoft system or for itself.
See Implementation Options.
Application ServerThe application server on the monitoring system contains the following elements that are related toPerformance Monitor.
Understanding Performance Monitor Chapter 2
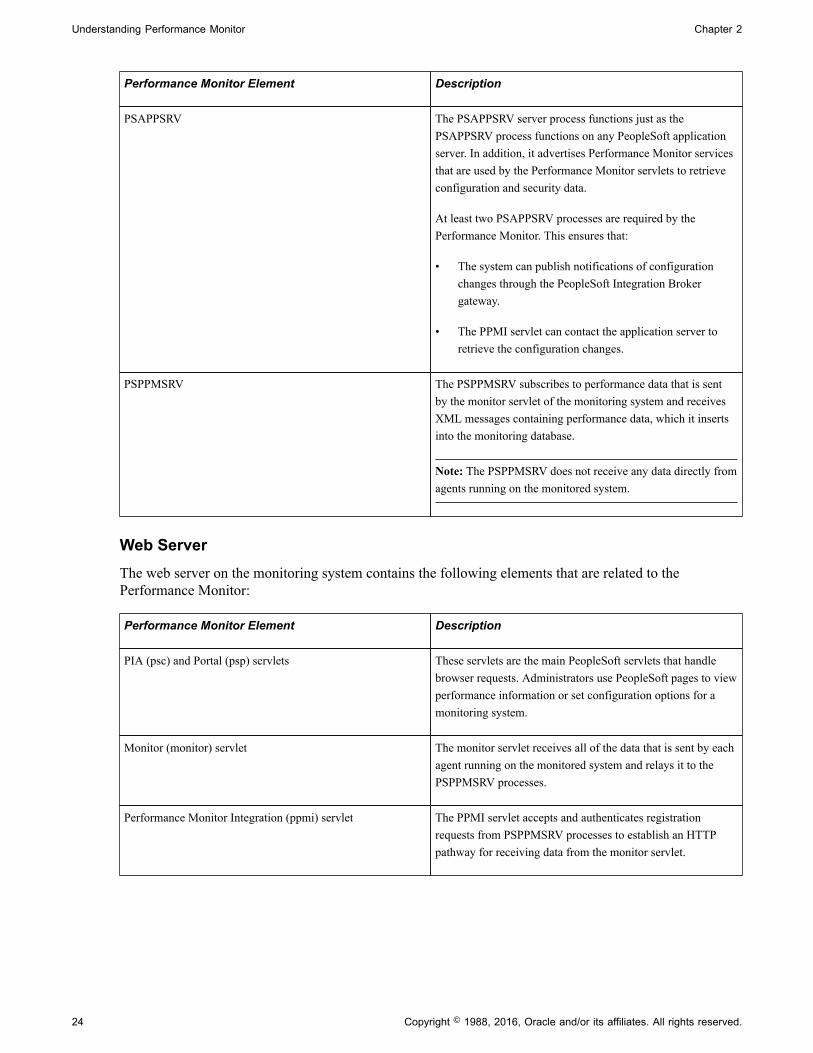
24 Copyright © 1988, 2016, Oracle and/or its affiliates. All rights reserved.
Performance Monitor Element Description
PSAPPSRV The PSAPPSRV server process functions just as thePSAPPSRV process functions on any PeopleSoft applicationserver. In addition, it advertises Performance Monitor servicesthat are used by the Performance Monitor servlets to retrieveconfiguration and security data.
At least two PSAPPSRV processes are required by thePerformance Monitor. This ensures that:
• The system can publish notifications of configurationchanges through the PeopleSoft Integration Brokergateway.
• The PPMI servlet can contact the application server toretrieve the configuration changes.
PSPPMSRV The PSPPMSRV subscribes to performance data that is sentby the monitor servlet of the monitoring system and receivesXML messages containing performance data, which it insertsinto the monitoring database.
Note: The PSPPMSRV does not receive any data directly fromagents running on the monitored system.
Web ServerThe web server on the monitoring system contains the following elements that are related to thePerformance Monitor:
Performance Monitor Element Description
PIA (psc) and Portal (psp) servlets These servlets are the main PeopleSoft servlets that handlebrowser requests. Administrators use PeopleSoft pages to viewperformance information or set configuration options for amonitoring system.
Monitor (monitor) servlet The monitor servlet receives all of the data that is sent by eachagent running on the monitored system and relays it to thePSPPMSRV processes.
Performance Monitor Integration (ppmi) servlet The PPMI servlet accepts and authenticates registrationrequests from PSPPMSRV processes to establish an HTTPpathway for receiving data from the monitor servlet.

Chapter 2 Understanding Performance Monitor
Copyright © 1988, 2016, Oracle and/or its affiliates. All rights reserved. 25
Performance Monitor Element Description
Integration Broker gateway (PeopleSoftListeningConnector)servlet
The gateway servlet is used to notify the monitor servlet of anyconfiguration changes. The monitor servlet, in turn, notifiesthe agents that are running on the monitored system of anyconfiguration changes the next time the agents interact withthe monitor servlet.
Note: This is the same servlet that is used by PeopleSoftIntegration Broker to handle integrations.
Process Scheduler ServerThe Process Scheduler server for the monitoring system has the following function:
Performance Monitor Element Description
PeopleSoft Application Engine You can schedule or invoke a variety of PeopleSoftApplication Engine programs that maintain the data in yourmonitoring database.
See Performance Monitor Administration.
Implementation Options
Two options are available for implementing the Performance Monitor:
• Self-monitoring system.
• Production monitoring system.
Self-Monitoring Monitoring SystemIn a self-monitoring system, the same database that serves the PeopleSoft application is also being used tostore the performance data. By default, all the elements that are required for the Performance Monitor areinstalled during the PeopleSoft server installations. So implementing the self-monitoring system requiresno additional installation steps.
While this system may require less hardware, the potential impact to your online applications must beconsidered. Keep in mind that the same database engine is being used to store and retrieve performancedata, and the same web server and application server may be used to monitor and collate performancedata.
Note: The self-monitoring configuration is not supported for a production environment. The self-monitoring configuration is not designed for a production environment as it affects online transactionprocessing and overall system performance.
Typically, the self-monitoring system is used in development, testing, or training.

Understanding Performance Monitor Chapter 2
26 Copyright © 1988, 2016, Oracle and/or its affiliates. All rights reserved.
Note: The Performance Monitor has been designed so that a monitoring system does not encounter aninfinite loop in a self-monitoring configuration.
Production Monitoring SystemWith a production monitoring system, you configure a separate PeopleSoft system complete with webserver, application server, and database server to act solely as a performance monitoring system. Thisis the recommended configuration for monitoring your production systems. Any PeopleTools systemdatabase that is delivered with PeopleSoft contains the appropriate database definitions to store andretrieve all Performance Monitor data.
With the separate monitoring system, you can monitor a single PeopleSoft system, such as yourPeopleSoft Human Capital Management system, or you can configure it to monitor multiple PeopleSoftsystems.
Note: Performance Monitor can monitor any PeopleSoft system running on PeopleTools 8.44 or above.Always consult PeopleTools Release Notes and PeopleBooks to become aware of any exceptions orunsupported features between release levels.
Performance Monitor Instrumentation
This section explains the terminology that is associated with the Performance Monitor instrumentation.Instrumentation refers to the modifications that are made to internal PeopleSoft programming code thatenables the system to report performance data to a monitor. Selected areas of PeopleTools runtime sourcecode are instrumented.
When the system runs instrumented code, it generates time-stamped performance metrics that arerelevant to that section of code. Agents running on the monitored system send the performance data to thePerformance Monitor.
Instrumentation generates performance measurement units (PMUs) and events.
Understanding PMUsA PMU is a unit of measure that reflects the execution of a section of code. The system starts and stopsa PMU at specific code locations, and the system may update a PMU anytime between the start andstop times. PeopleTools has defined a set of PMU types, and each type of PMU corresponds to theinstrumentation at a specific code location, such as a SQL Execute in PSAPPSRV or a Jolt Request in theweb server.
Each PMU includes:
• PMU Type.
• Instance identifier (a unique identifier for a specific PMU instance).
• Start time.
• Stop time.
Chapter 2 Understanding Performance Monitor
Copyright © 1988, 2016, Oracle and/or its affiliates. All rights reserved. 27
• Status.
• Metrics (such as number of SQL fetches or buffer size used in a Jolt response).
See PMU Definitions.
Open PMUs are those that are currently being processed. These are PMUs for which a "stop" has not yetbeen received. Completed PMUs are those for which a "stop" has been received.
PMUs can assume a parent-child relationship. Child-PMUs start within a parent-PMU. Child-PMUs arelinked to their parent by the parent instance ID. You can view PMUs within a tree structure that revealsthe hierarchy of parent-child PMUs and indicates the processing times at each level.
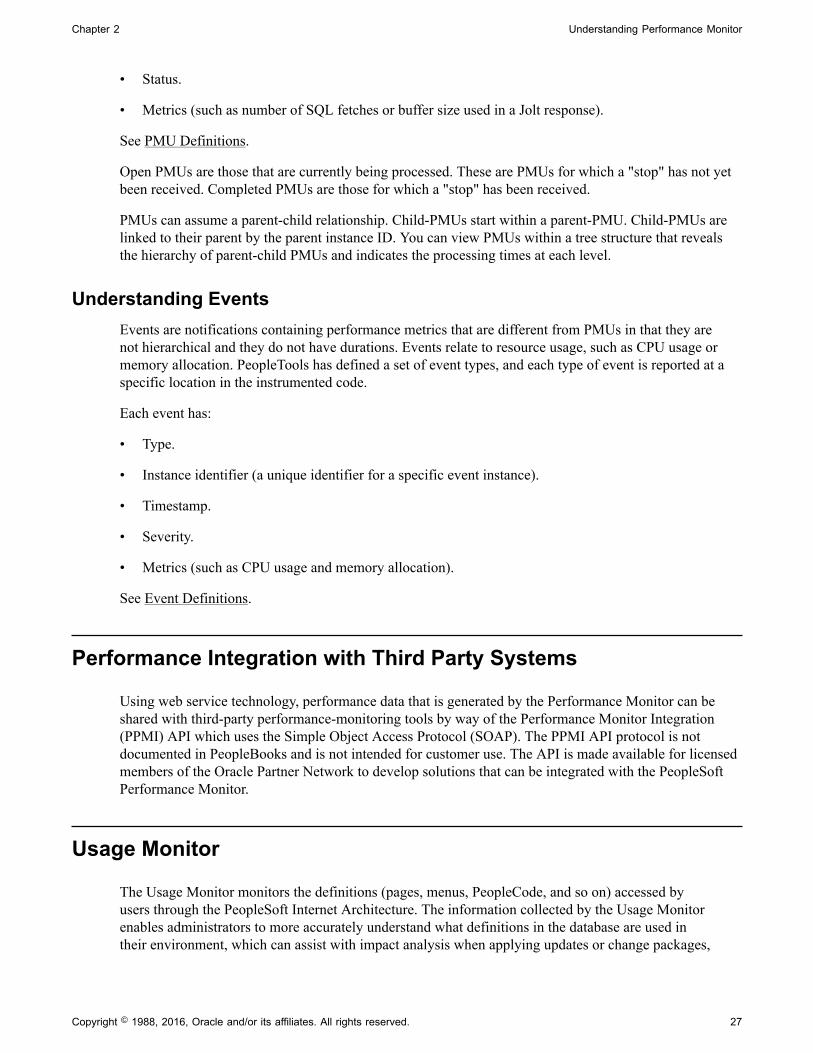
Understanding EventsEvents are notifications containing performance metrics that are different from PMUs in that they arenot hierarchical and they do not have durations. Events relate to resource usage, such as CPU usage ormemory allocation. PeopleTools has defined a set of event types, and each type of event is reported at aspecific location in the instrumented code.
Each event has:
• Type.
• Instance identifier (a unique identifier for a specific event instance).
• Timestamp.
• Severity.
• Metrics (such as CPU usage and memory allocation).
See Event Definitions.
Performance Integration with Third Party Systems
Using web service technology, performance data that is generated by the Performance Monitor can beshared with third-party performance-monitoring tools by way of the Performance Monitor Integration(PPMI) API which uses the Simple Object Access Protocol (SOAP). The PPMI API protocol is notdocumented in PeopleBooks and is not intended for customer use. The API is made available for licensedmembers of the Oracle Partner Network to develop solutions that can be integrated with the PeopleSoftPerformance Monitor.
Usage Monitor
The Usage Monitor monitors the definitions (pages, menus, PeopleCode, and so on) accessed byusers through the PeopleSoft Internet Architecture. The information collected by the Usage Monitorenables administrators to more accurately understand what definitions in the database are used intheir environment, which can assist with impact analysis when applying updates or change packages,

Understanding Performance Monitor Chapter 2
28 Copyright © 1988, 2016, Oracle and/or its affiliates. All rights reserved.
for example. Usage Monitor information can also be used in conjunction with the PeopleSoft TestFramework.
When setting up the Performance Monitor system, there are a few additional settings that must be enabledif Usage Monitor data collection is required.
Related LinksConfiguration of the Performance MonitorEnabling Usage MonitorTest Framework
Performance Monitor Data
After the Performance Monitor is configured to retrieve and store data in the performance database tables,you can view the performance data using a variety of PeopleSoft pages that:
• Provide a summary of performance data.
• Present raw performance data.
• Display information in charts.
You can access all of the pages that are related to Performance Monitor using the PeopleToolsPerformance Monitor menu. Some performance information appears in grids.
Image: Viewing grids
This example illustrates the fields and controls on the Viewing grids.
Chapter 2 Understanding Performance Monitor
Copyright © 1988, 2016, Oracle and/or its affiliates. All rights reserved. 29
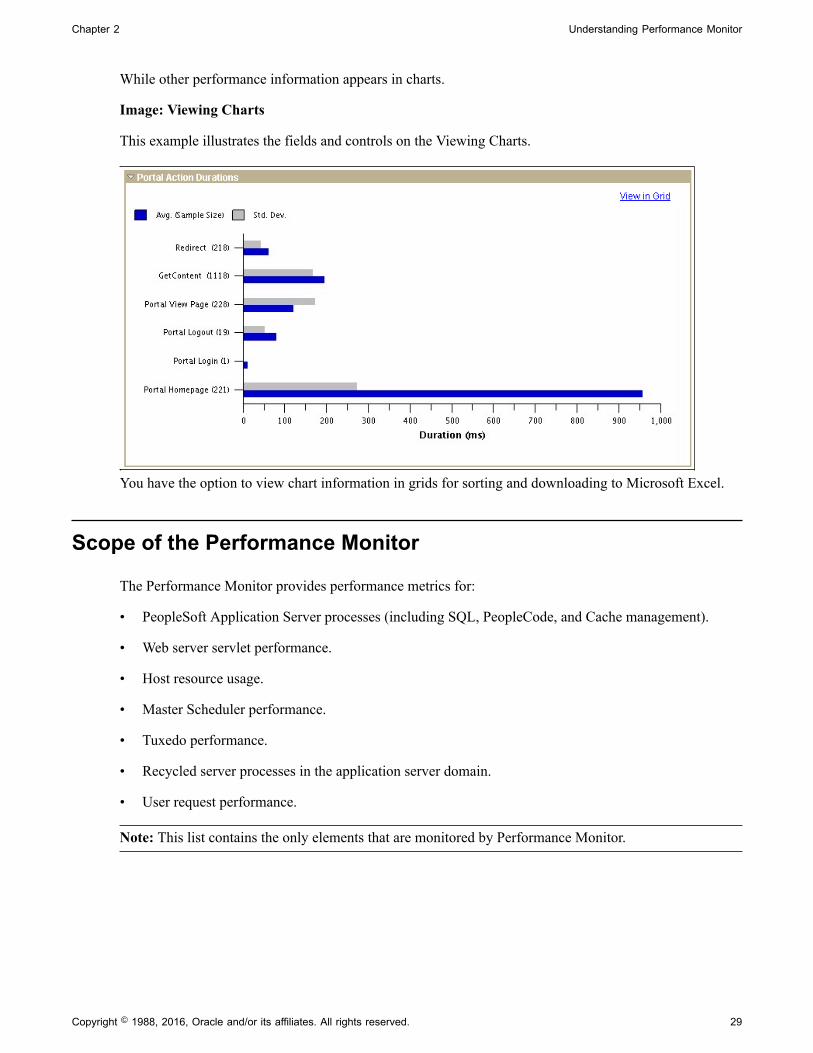
While other performance information appears in charts.
Image: Viewing Charts
This example illustrates the fields and controls on the Viewing Charts.
You have the option to view chart information in grids for sorting and downloading to Microsoft Excel.
Scope of the Performance Monitor
The Performance Monitor provides performance metrics for:
• PeopleSoft Application Server processes (including SQL, PeopleCode, and Cache management).
• Web server servlet performance.
• Host resource usage.
• Master Scheduler performance.
• Tuxedo performance.
• Recycled server processes in the application server domain.
• User request performance.
Note: This list contains the only elements that are monitored by Performance Monitor.

Copyright © 1988, 2016, Oracle and/or its affiliates. All rights reserved. 31
Chapter 3
Setting Up the Performance Monitor
Configuration of the Performance Monitor
The configuration of the Performance Monitor involves enabling the required elements on the monitoredsystem and the monitoring system.
When you have installed the PeopleTools CD and transferred the appropriate files to your web server,application server, and Process Scheduler server, all of the required elements are in place. You do not needto install additional modules for the Performance Monitor.
Note: If you are setting up a self-monitoring system, the monitored system and the monitoring systemreside on the same host machine.
Note: In most cases, you will only require a self-monitoring system for the Usage Monitor.
Note: If you are setting up the Usage Monitor, in some sections of the setup instructions you willneed to set additional settings. These additional settings are identified specifically for Usage Monitorconfiguration. If you are not setting up the Usage Monitor, you may skip the settings.
Enabling the Required Elements on the Monitoring System
This section covers the configuration of your monitoring system, which includes:
• Setting up the Performance Monitor database.
• Setting up the application server.
• Setting up the web server for the monitoring system.
• Creating a PPMI user ID.
• Specifying the PPMI URL and PPMI user ID.
• Specifying the Integration Gateway URL.
Setting Up the Performance Monitor DatabaseThis step applies to:
Product Step Required?
Performance Monitor Yes

Setting Up the Performance Monitor Chapter 3
32 Copyright © 1988, 2016, Oracle and/or its affiliates. All rights reserved.
Product Step Required?
Usage Monitor Yes
The monitoring database requires the use of at least the PeopleTools System (PTSYS) database for theproduction monitoring system. Set this database up using the instructions in the PeopleTools InstallationGuide.
Note: For the self-monitoring configuration, use the application database for your system. The applicationmust be running on at least PeopleTools 8.44 for Performance Monitor and on at least PeopleTools 8.51for Usage Monitor.
See the product documentation for PeopleTools Installation for your database platform.
Setting Up the Application ServerThis step applies to:
Product Step Required?
Performance Monitor Yes
Usage Monitor Yes
The application server on the monitoring system requires that the following server processes be enabled:
• Typical application server processes included in a default configuration.
• PSPPMSRV.
Default Server ProcessesA typical default application server configuration is suitable for Performance Monitor activity.
The PSAPPSRV server process is the main server process of the PeopleSoft Application Server.
At least two PSAPPSRV server processes must be enabled. This ensures that the monitoring system canpublish notifications of configuration changes through the PeopleSoft Integration Broker gateway. Youcan enable more PSAPPSRVs to meet increased demand.
PSPPMSRVThe PSPPMSRV process receives the performance data from the monitor servlet and inserts it into themonitoring database.
The following table describes the ways that you can enable this server process using the PeopleSoftServer Administration interface (PSADMIN).
Chapter 3 Setting Up the Performance Monitor
Copyright © 1988, 2016, Oracle and/or its affiliates. All rights reserved. 33
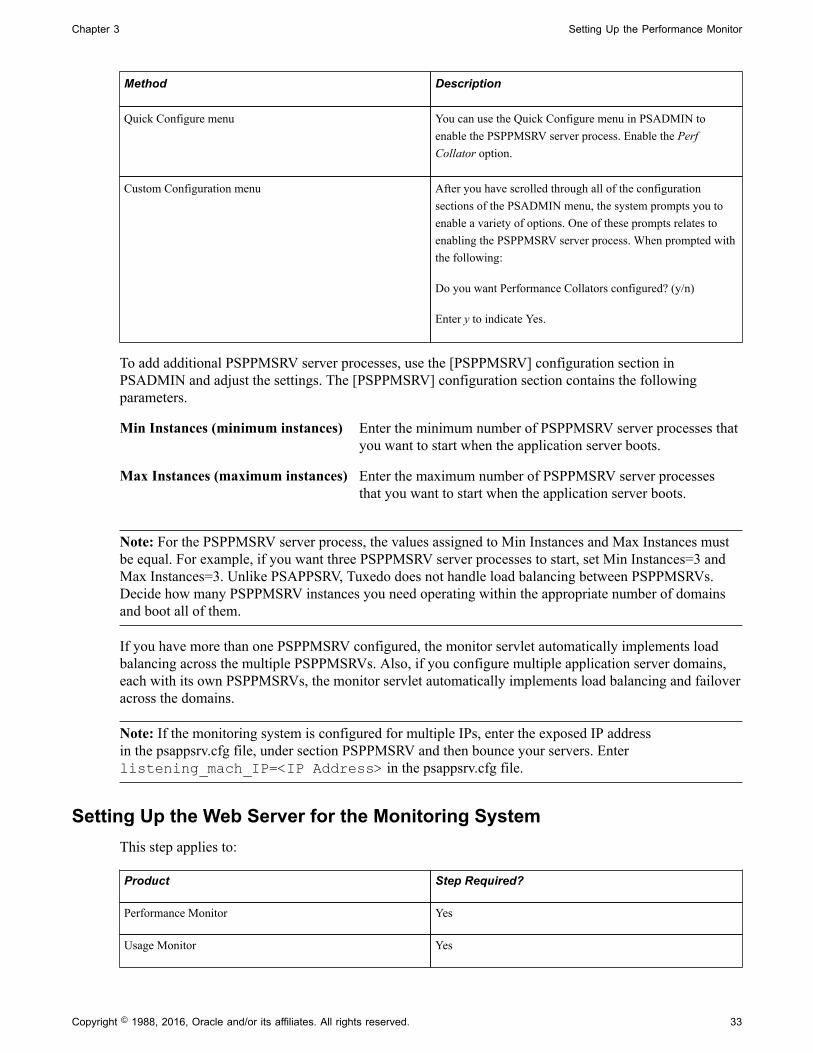
Method Description
Quick Configure menu You can use the Quick Configure menu in PSADMIN toenable the PSPPMSRV server process. Enable the PerfCollator option.
Custom Configuration menu After you have scrolled through all of the configurationsections of the PSADMIN menu, the system prompts you toenable a variety of options. One of these prompts relates toenabling the PSPPMSRV server process. When prompted withthe following:
Do you want Performance Collators configured? (y/n)
Enter y to indicate Yes.
To add additional PSPPMSRV server processes, use the [PSPPMSRV] configuration section inPSADMIN and adjust the settings. The [PSPPMSRV] configuration section contains the followingparameters.
Min Instances (minimum instances) Enter the minimum number of PSPPMSRV server processes thatyou want to start when the application server boots.
Max Instances (maximum instances) Enter the maximum number of PSPPMSRV server processesthat you want to start when the application server boots.
Note: For the PSPPMSRV server process, the values assigned to Min Instances and Max Instances mustbe equal. For example, if you want three PSPPMSRV server processes to start, set Min Instances=3 andMax Instances=3. Unlike PSAPPSRV, Tuxedo does not handle load balancing between PSPPMSRVs.Decide how many PSPPMSRV instances you need operating within the appropriate number of domainsand boot all of them.
If you have more than one PSPPMSRV configured, the monitor servlet automatically implements loadbalancing across the multiple PSPPMSRVs. Also, if you configure multiple application server domains,each with its own PSPPMSRVs, the monitor servlet automatically implements load balancing and failoveracross the domains.
Note: If the monitoring system is configured for multiple IPs, enter the exposed IP addressin the psappsrv.cfg file, under section PSPPMSRV and then bounce your servers. Enterlistening_mach_IP=<IP Address> in the psappsrv.cfg file.
Setting Up the Web Server for the Monitoring SystemThis step applies to:
Product Step Required?
Performance Monitor Yes
Usage Monitor Yes

Setting Up the Performance Monitor Chapter 3
34 Copyright © 1988, 2016, Oracle and/or its affiliates. All rights reserved.
By completing the internet portion of the PeopleSoft Multi-Platform Installer program, you have installedall of the elements that Performance Monitor requires on the web server. No additional installationprocedures are required.
Performance Monitor servlets are not activated unless PSPPMSRVs register with them. Agentconnections to a monitor are rejected until a PSPPMSRV on the monitoring system registers.
The Performance Monitor servlets that run on the web server of the monitoring system are:
• Monitor servlet.
• PPMI servlet.
Note: Make note of the URL of the web server for the monitoring system. On the monitored system, youneed to specify the appropriate URL to which to send performance data.
Note: If you elect to implement a production monitoring system, you should set up the monitoring systemitself in self-monitoring mode so that you can detect alarm events that are generated from the monitoringweb server. That is, while the monitoring system monitors one or more PeopleSoft application systems, italso monitors itself.
If you need to configure multiple web servers for scalability and failover, you need to configure a cluster.
Note: If you notice communication errors in the log files, even though the agents have registeredsuccessfully, check the keep-alive setting on the monitoring web server. The keep-alive timeout in themonitoring web server may need to be increased to 660 or higher to resolve these issues. After changingthis setting, restart the web server.
Related LinksSetting Global System Options
Creating a PPMI User IDThis step applies to:
Product Step Required?
Performance Monitor Yes
Usage Monitor Yes
The PSPPMSRV application server process acts as the PPMI client when you record PeopleSoftperformance data. To register as a client, the PSPPMSRV requires the appropriate permissions inPeopleTools Security.
Warning! Setting up PSPPMSRV authentication is required.
To set up PPMI authentication:
1. Create a user profile with the name of your choice using PeopleTools Security.

Chapter 3 Setting Up the Performance Monitor
Copyright © 1988, 2016, Oracle and/or its affiliates. All rights reserved. 35
2. Add the delivered PeopleTools Perfmon Client role to the user profile.
The PeopleTools Perfmon Client role contains the PTPMCLNT permission list.
3. Select PeopleTools, Performance Monitor, Administration, Global Administration and enter theuser profile that you created and the associated password in thePPMI User ID andPPMI Password textboxes.
Specifying the PPMI URL and PPMI User IDThis step applies to:
Product Step Required?
Performance Monitor Yes
Usage Monitor Yes
PSPPMSRV processes must register with the PPMI servlet using the PPMI URL. The PSPPMSRVprocesses use the PPMI URL that is stored in the monitoring system's database to locate the PPMI servletfor registration.
The PSPPMSRV servers periodically read the PPMI value to determine the PPMI URL. When it is set toNONE, the monitoring system is disabled, which means that the PSPPMSRVs do not insert performancedata into the monitoring database.
The PPMI user ID is required to authenticate the PSPPMSRV so that it can subscribe to performance data.
To specify the PPMI URL and PPMI user ID:
1. Make sure that you have created a PPMI user ID with the appropriate permissions (as described in theprevious section).
2. Select PeopleTools, Performance Monitor, Administration, Global Administration.
3. On the Global Administration page, enter the appropriate value in the PPMI URL edit box.
The format is: http://host[:port]/ppmi/[site]/
For example: http://server1.peoplesoft.com/ppmi/ps/.
Where ps is the name of the PeopleSoft site.
4. Specify the PPMI user ID and password.
5. Click Save.
6. Click Ping Test to ensure that the URL that you entered is valid and the URL is available.
Related LinksSetting Up PSPPMSRV Authentication

Setting Up the Performance Monitor Chapter 3
36 Copyright © 1988, 2016, Oracle and/or its affiliates. All rights reserved.
Specifying the Integration Gateway URLThis step applies to:
Product Step Required?
Performance Monitor Yes
Usage Monitor Yes
A gateway URL needs to be specified so that the monitoring system can notify the monitor servlet ofconfiguration changes. The monitoring servlet in turn notifies the monitored agents of these changes whenthey next communicate with the servlet. This communication uses the gateway, which you specify in theIntegration Broker administration pages.
When specifying the gateway URL:
• Select LOCAL gateway.
• Enter this URL in the following format: http://host[:port]/PSIGW/PeopleSoftListeningConnector.
Related Links"Administering Integration Gateways" (PeopleTools 8.54: Integration Broker Administration)
Setting Up the Process Scheduler Server for the Monitoring SystemThis step applies to:
Product Step Required?
Performance Monitor Yes
Usage Monitor No
To invoke Performance Monitor Application Engine programs to maintain the performance data, set up aProcess Scheduler server that connects to your monitoring database.
To set up a Process Scheduler server, follow the instructions that are provided in your PeopleToolsInstallation Guide.
See the product documentation for PeopleTools Installation for your database platform.
The delivered PeopleSoft Application Engine programs that you schedule to run as part of PerformanceMonitor administration enable you to:
• Maintain the current PMU table (the PSPM_REAPER program).
• Archive or delete historical performance data (the PSPM_ARCHIVE program).
• Manage the lookup tables in the Performance Monitor interface (the PSPM_LOOKUP program).
See the product documentation for PeopleTools Installation for your database platform.

Chapter 3 Setting Up the Performance Monitor
Copyright © 1988, 2016, Oracle and/or its affiliates. All rights reserved. 37
Related LinksPerformance Monitor Administration
Enabling the Required Elements on the Monitored System
This section covers enabling the required elements on the monitored system, which is the system forwhich you intend to collect performance data. A monitored system requires the following items to be inplace:
• PeopleSoft application database.
• Web server agent.
• Application server domain manager and agents.
• Process Scheduler server domain manager and agents.
• Valid monitor servlet URL value.
Setting Up the Database of the Monitored SystemThis step applies to:
Product Step Required?
Performance Monitor Yes
Usage Monitor Yes
As long as your PeopleSoft application is running against your PeopleSoft database, no further databaseconfiguration is required for the Performance Monitor.
Note: The database must be running on PeopleTools 8.44 or higher.
Note: The database must be running on PeopleTools 8.51 or higher for Usage Monitor.
Specifying the Monitor URLThis step applies to:
Product Step Required?
Performance Monitor Yes
Usage Monitor Yes
Specifying a monitor URL enables the Performance Monitor agents and identifies the monitor servlet.
The agents on the monitored system check the monitor URL value periodically. When the monitor URLvalue is set to NONE, the Performance Monitor components on the monitored system are disabled.

Setting Up the Performance Monitor Chapter 3
38 Copyright © 1988, 2016, Oracle and/or its affiliates. All rights reserved.
The monitor URL value must reflect the URL of the monitor servlet that is running on the monitoringsystem.
To specify the monitor URL:
1. Select PeopleTools, Performance Monitor, Administration, Specify Monitor.
2. On the Specify Monitor page, enter the appropriate value in the Monitor URL edit box.
The format of the URL is http[s]://host[:port]/monitor/[site]/orNONE.
For example, enter http://server2.domain.com/monitor/ps/.
Where ps is the name of the PeopleSoft site.
3. Click Ping Test to ensure that you entered a valid URL and that the URL is available.
4. Click Save and Ping PPM to save the URL into the URL catalog, and to ensure that the associatedagents are registered and able to share data with PPMI URL.
If the URL you enter is different than the previous value, the system saves the new value to the URLcatalog, performs registration, and displays status of the registered agents.
In the case of a new registration, you must wait at least the duration of the Agent Heartbeat Interval.
If the agents have successfully registered, the PPMConsole (a new browser window) displays a list ofall registered agents along with the agent configuration information. If no agents have registered, nolist appears.
Note: In order for the new browser window (PPMConsole) to appear, the PPMConsole needs to beenabled on the Global Administration page.
See Viewing Monitor Servlet Diagnostics.
See Setting Global System Options.
Setting Up the Web Server of the Monitored SystemThis step applies to:
Product Step Required?
Performance Monitor Yes
Usage Monitor Yes
No additional installation procedure is required.
When the monitor URL value is supplied, agents on every PeopleSoft site automatically become activeand begin relaying performance data to the monitoring system.
Note: Ensure that the Enable PPM Agents option is selected on the General tab of the appropriate webprofile. By default, this option is enabled.

Chapter 3 Setting Up the Performance Monitor
Copyright © 1988, 2016, Oracle and/or its affiliates. All rights reserved. 39
Note: If you start the web server in safe mode, then the monitoring agents in the web server are disabled.
Setting Up the Application ServerThis step applies to:
Product Step Required?
Performance Monitor Yes
Usage Monitor Yes
The following components run and are monitored on the application server of the monitored system:
• Domain monitor: PSMONITORSRV.
• PSAPPSRV agents.
• PSQCKSRV agents.
• PSQRYSRV agents.
• PSSAMSRV agents.
• PSANALYTICSRV.
No installation or configuration procedures are required.
When the monitored system is enabled, agents in every instrumented server process automatically becomeactive and begin relaying performance data to the monitoring system.
Note: Ensure that the EnablePPM Agent parameter in the [PSTOOLS] section of PSADMIN is set to 1(enabled). If the EnablePPM Agent parameter is commented out or set to 0, then the agents are disabledfor this server domain.
Additional Usage Monitor Application Server SettingsMake sure that the Usage Monitoring State parameter is set correctly for the application server domain.
See "Usage Monitoring State" (PeopleTools 8.54: System and Server Administration).
Enabling the Usage MonitorThis step applies to:
Product Step Required?
Performance Monitor No
Usage Monitor Yes

Setting Up the Performance Monitor Chapter 3
40 Copyright © 1988, 2016, Oracle and/or its affiliates. All rights reserved.
Select the Enable Usage Monitoring check box on the System Defaults page (PeopleTools, PerformanceMonitor, Administration, System Defaults).
To Verify the Usage Monitor Configuration:
1. On the System Defaults page, set the Buffer Size to 50.
Note: Until the Buffer Size value is reached, no Usage Monitor data will be written to the database.
Important! This buffer value of 50 is only for verifying the Usage Monitor configuration, ensuringthat data will be quickly written to the Usage Monitor tables. When you are using the Usage Monitor,you need to increase the Buffer Size value to a more appropriate "production" value. The default is2500. Refer to the System Defaults page documentation for further details on the Buffer Size field.
Note: For Usage Monitor data collection, the Agent Filter Level does not need to be set to a particularvalue. Usage Monitor data will be collected with the level set to 01-Stanbdby, as long as the EnableUsage Monitor check box is selected. Setting the Agent Filter Level value to 01-Standby is therecommended setting for a Usage Monitor-only monitoring system.
2. Shutdown and restart the application server domain and the PeopleSoft Internet Architecture.
3. Login to that application with your browser and navigate through a few pages and menus in theapplication.
4. With your SQL query tool, submit the following query on the monitoring database:
SELECT * FROM PSPMTRANS35_VW
5. Verify that data is present in the view and that the timestamps correspond to the time you verified theUsage Monitor configuration.
6. Repeat the previous steps when setting the Buffer Size value to your production value.
Related LinksSetting System Definition Defaults
Setting Up the Process Scheduler ServerThis step applies to:
Product Step Required?
Performance Monitor Yes
Usage Monitor No
The following components run and are monitored on the Process Scheduler server of the monitoredsystem:
• Domain monitor (PSMONITORSRV).
• PSMSTPRC agents.
Chapter 3 Setting Up the Performance Monitor
Copyright © 1988, 2016, Oracle and/or its affiliates. All rights reserved. 41
No installation or configuration procedures are required.
When the monitored system is enabled, agents in instrumented server processes automatically becomeactive and begin relaying performance data to the monitoring system.
Note: Ensure that the EnablePPM Agent parameter in the [PSTOOLS] section of PSADMIN is set to 1(enabled). By default, it is set to 1 (enabled) in the delivered domain templates. If the EnablePPM Agentparameter is commented out or set to 0, then the agents are disabled for this server domain.


Copyright © 1988, 2016, Oracle and/or its affiliates. All rights reserved. 43
Chapter 4
Administering the Performance Monitor
Performance Monitor Administration
This section discusses Performance Monitor administration and lists the pages used for PerformanceMonitor administration.
Performance Monitor AdministrationPerformance Monitor administration includes:
• Specifying global settings.
• Viewing performance definitions such as those related to systems, agents, metrics, and so on.
• Setting system defaults.
• Scheduling batch programs that maintain performance data.

Administering the Performance Monitor Chapter 4
44 Copyright © 1988, 2016, Oracle and/or its affiliates. All rights reserved.
Setting Global System Options
Access the Global Administration page (PeopleTools, Performance Monitor, Administration, GlobalAdministration).
Image: Global Administration page
This example illustrates the fields and controls on the Global Administration page. You can finddefinitions for the fields and controls later on this page.
PPMI URL The PPMI URL that is stored in the monitoring system'sdatabase is used by PSPPMSRV processes to locate the PPMIservlet with which to register.
The format of the URL is: http[s]://<host[:port]>/ppmi/<site_name>/
For example,
http://server1.peoplesoft.com/ppmi/ps/
After you specify this URL value, it is stored in the URL catalogunder the ID PPM_PPMI.
Chapter 4 Administering the Performance Monitor
Copyright © 1988, 2016, Oracle and/or its affiliates. All rights reserved. 45
Note: If you select HTTPS, then the PSPPMSRVs use SSLencryption when sending the PPMI user ID and password tothe PPMI servlet, but performance data sent from the PPMIservlet to PSPPMSRV is not encrypted. Because the data isnot encrypted, the PSPPMSRV and the monitor servlet shouldreside in a secure network environment.
Note: Use the Ping Test button to verify that you have entered avalid URL and that the URL is available.
PPMI User ID The PSPPMSRV server processes pass this user ID andpassword to the PPMI servlet. The servlet verifies that the userID and password are valid, and that the user has permission toaccess the PPMI servlet.
The user ID that you specify must have a permission list withPerformance Monitor PPMI Access selected in its PeopleToolspermissions. PeopleTools recommends using the PTPMCLNTpermission list, which is shipped expressly for this purpose.
Note: The PPMI User ID andPPMI Password values arerequired.
See Setting Up PSPPMSRV Authentication.
PPMI Password The password associated with the PPMI user ID.
Archive: Clear PMUs & Events Indicates to the archive program to delete all of the performancehistory data that is currently stored in the monitoring database. This is in the form of an unqualified DELETE on the historytables, or for those platforms for which it is supported, the tablesare truncated.
Note: If you select this option, the delivered archive programdeletes all of the performance history data for every monitoredsystem.
Note: Deleting and truncating performance data may cause thecurrent user count to appear artificially low. The system basesthe count on events that are found in the PSPMEVENTHISTtable, and rows from this table may be deleted during thearchive process.
Note: This option overrides any archive mode option that is seton the System Definition page.
See Modifying System Definitions.
Collator Row Limit Limits the amount of data that can be inserted into thePerformance Monitor tables. Collators (PSPPMSRVs)periodically count the number of rows in each of
Administering the Performance Monitor Chapter 4
46 Copyright © 1988, 2016, Oracle and/or its affiliates. All rights reserved.
the performance tables. If the total count of rowsin PSPMTRANSHIST, PSPMTRANSCURR, andPSPMEVENTHIST is higher than this value, the PSPPMSRVdoes not insert any more rows into these tables until the numberof rows deleted (by the archive program, the reaper program, manual intervention, or any combination of the three) bringsthe row count below this limit. If you set this value to 0, thePSPPMSRVs do not check for a row limit.
Note: If the row limit is reached, the System Performance pagewill report that the agents on the monitored system have staleagent data.
Search Row Limit Limits the number of rows that are returned and displayed insearches that are initiated from Performance Monitor pages. Thesystem imposes this limit on all users who access the monitoringsystem.
Performance Monitor Cluster To provide failover and scalability, performance monitorservlets on multiple web servers can be configured as acluster. Entering the cluster information in the PerformanceMonitor Cluster grid enables the load-balanced monitor andPPMI servlets to share client registration information sothat PSPPMSRV instances need not be aware of the clusterconfiguration.
The format of the cluster member URL is http://host[:port]/ppmi/<site_name>/, where the host name is the actual webserver machine.
Click Save and Notify Cluster to notify the cluster if you haveadded or removed a cluster member.
Click Ping Test to verify that you have entered a valid URL andthat the URL is available.
See Setting Up Monitor Clusters.
PPMConsole Settings The PPMConsole settings control the display of thePPMConsole, which is an interface in a separate browserwindow that displays information related to servers, servlets, and agents. Click Enable PPMConsole to enable access to thisinterface.
To enable password security for accessing the PPMConsole, enter a password in the Password field. If you have provided apassword, any system administrator who would need to accessthe PPMConsole will need to be aware of the password.
Note: After making any changes to the PPMConsole settings,you must restart the web server.
See Specifying the Monitor URL.
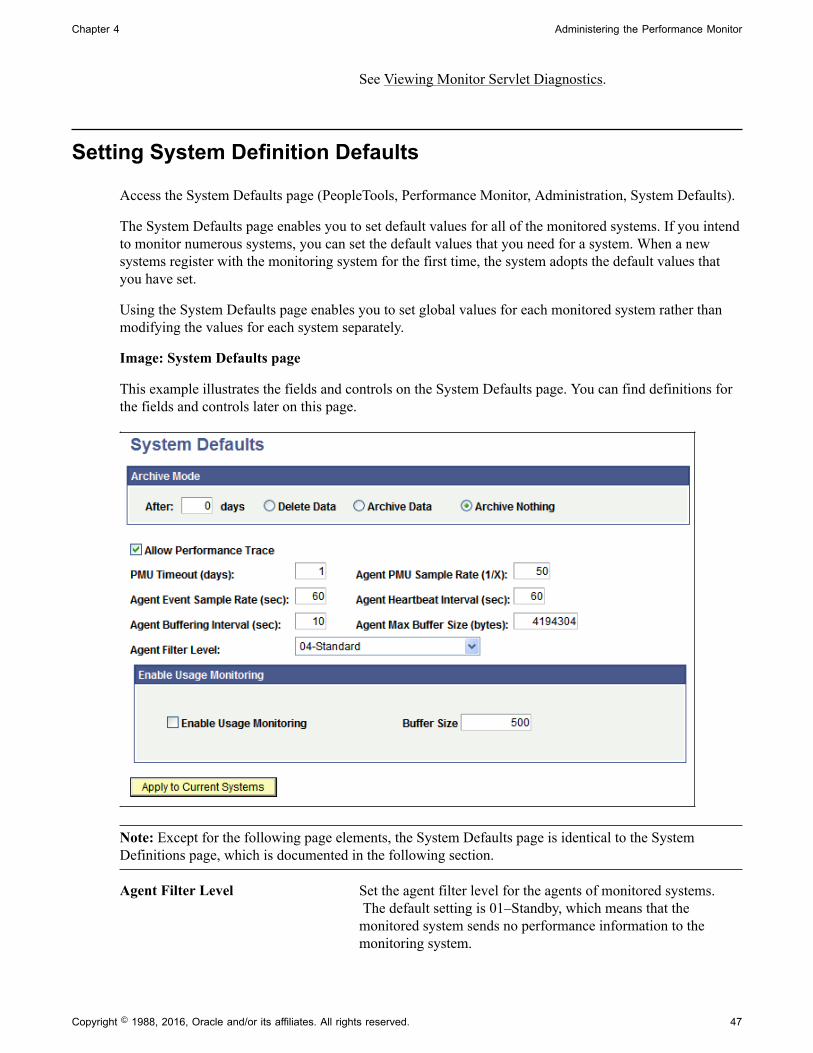
Chapter 4 Administering the Performance Monitor
Copyright © 1988, 2016, Oracle and/or its affiliates. All rights reserved. 47
See Viewing Monitor Servlet Diagnostics.
Setting System Definition Defaults
Access the System Defaults page (PeopleTools, Performance Monitor, Administration, System Defaults).
The System Defaults page enables you to set default values for all of the monitored systems. If you intendto monitor numerous systems, you can set the default values that you need for a system. When a newsystems register with the monitoring system for the first time, the system adopts the default values thatyou have set.
Using the System Defaults page enables you to set global values for each monitored system rather thanmodifying the values for each system separately.
Image: System Defaults page
This example illustrates the fields and controls on the System Defaults page. You can find definitions forthe fields and controls later on this page.
Note: Except for the following page elements, the System Defaults page is identical to the SystemDefinitions page, which is documented in the following section.
Agent Filter Level Set the agent filter level for the agents of monitored systems. The default setting is 01–Standby, which means that themonitored system sends no performance information to themonitoring system.
Administering the Performance Monitor Chapter 4
48 Copyright © 1988, 2016, Oracle and/or its affiliates. All rights reserved.
See Setting Agent Filter Options.
Enable Usage Monitoring Select to enable the Usage Monitor so that system usage datacan be collected for analysis and for incorporation with thePeopleSoft Testing Framework.
Buffer Size (Applies only to Usage Monitor data collection). Set the bufferlimit which determines how much data should be collected inthe buffer before storing the data in the database. Dependingon the pages that are accessed and your testing needs, you canarrive at an optimum buffer size for your usage pattern.
The Buffer Size value affects the performance of the system. Setting the value too low will increase the number ofbuffer writes to the database and increase the amount ofdata aggregation required. A Buffer Size value of 2500 is a"minimum" production value. The actual value you set fora particular system should be based on a variety of factors, including:
• number of users.
• whether the monitoring is being recorded anonymously orby user ID.
• number of objects accessed in the database during UsageMonitor tests.
• amount of available system memory that can be allocated tothe Usage Monitor buffers.
Setting the value too high prevents the buffers from beingflushed, with no data being written to the database.
Note: To flush a partially full Usage Monitor buffer, theapplication server and the PeopleSoft Internet Architecture needto be shutdown.
Apply to Current Systems Notifies the agents that are running in existing systems of theglobal configuration changes. When the agents of the existingmonitored systems are notified, the existing systems adopt thenew, default values.
Related LinksModifying System Definitions
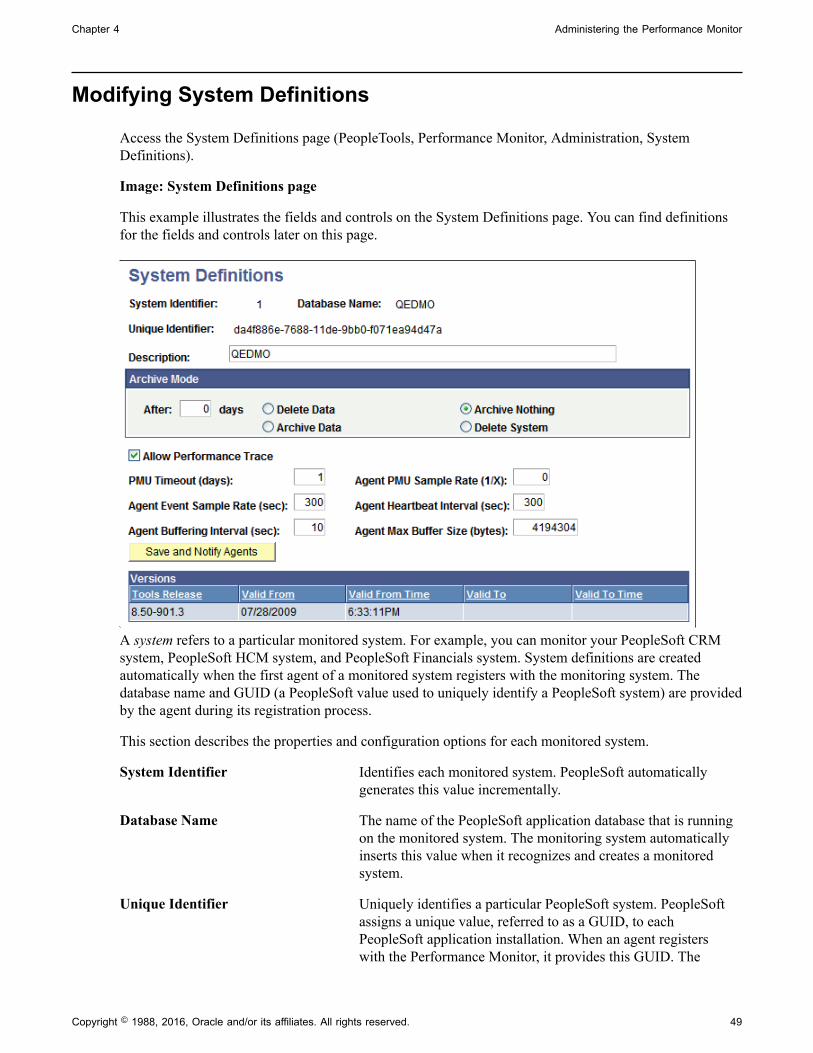
Chapter 4 Administering the Performance Monitor
Copyright © 1988, 2016, Oracle and/or its affiliates. All rights reserved. 49
Modifying System Definitions
Access the System Definitions page (PeopleTools, Performance Monitor, Administration, SystemDefinitions).
Image: System Definitions page
This example illustrates the fields and controls on the System Definitions page. You can find definitionsfor the fields and controls later on this page.
A system refers to a particular monitored system. For example, you can monitor your PeopleSoft CRMsystem, PeopleSoft HCM system, and PeopleSoft Financials system. System definitions are createdautomatically when the first agent of a monitored system registers with the monitoring system. Thedatabase name and GUID (a PeopleSoft value used to uniquely identify a PeopleSoft system) are providedby the agent during its registration process.
This section describes the properties and configuration options for each monitored system.
System Identifier Identifies each monitored system. PeopleSoft automaticallygenerates this value incrementally.
Database Name The name of the PeopleSoft application database that is runningon the monitored system. The monitoring system automaticallyinserts this value when it recognizes and creates a monitoredsystem.
Unique Identifier Uniquely identifies a particular PeopleSoft system. PeopleSoftassigns a unique value, referred to as a GUID, to eachPeopleSoft application installation. When an agent registerswith the Performance Monitor, it provides this GUID. The

Administering the Performance Monitor Chapter 4
50 Copyright © 1988, 2016, Oracle and/or its affiliates. All rights reserved.
first time the monitoring system receives information from amonitored system, it detects the GUID. For each new GUIDthat is detected, the monitoring system creates a new monitoredsystem definition.
Note: When copying databases, you should delete the GUID inthe new (copied) database. If the new database is monitored bythe same instance of the Performance Monitor that is monitoringthe source database, the monitor assumes that the agents forboth systems belong to the same system. This not only doublesthe data that is being stored for a particular system, but alsomakes it unreliable. To resolve this, set the value of the GUIDfield in the PSOPTIONS table to <space> in the new database. The next time an application server connects to the database, the system generates a new, unique GUID. You insert the blankvalue in the PSOPTIONS table using the SQL tool at your site.
Note: After cloning a database and before booting the webserver and application server, you should set the PPMI andmonitor URL to NONE in the cloned database. This willprevent the agents of the cloned database from reporting into themonitoring system that was used previously. To reset the URLs,update the URL field to NONE in the PSURLDEFN table wherethe URL_ID field is'PPM_MONITOR or PPM_PPMI.
Description A description of the monitoring system to assist recognition. The default value is the database name.
Archive Mode The archive mode that you set specifies how the archiveprogram (PSPM_ARCHIVE) should process the performancedata that is stored in the monitoring database. The default valueis set to archive nothing after zero days.
The options are:
• After N days. If you selectArchive Data orDelete Data, thenyou must specify a retention period, which determines thenumber of days during which performance data remains inthe tables of the online monitoring system.
Performance data that is older than the specified value getsarchived or deleted (depending on your selection) when thearchive program runs.
• Delete Data. If this option is select, the next time the archiveprogram runs, the program deletes performance history datathat is older than the retention period.
• Archive Data. If this option is selected, the next time thearchive program runs, the program archives performancehistory data that is older than the retention period.

Chapter 4 Administering the Performance Monitor
Copyright © 1988, 2016, Oracle and/or its affiliates. All rights reserved. 51
The archive program moves history tables (PSPMTRANSHIST and PSPMEVENTHIST) to the archivetables (PSPMTRANSARCH and PSPMEVENTARCH).
• Archive Nothing. Disables performance data archiving forthis monitored system.
• Delete System. If this option is selected, the next time thearchive program runs, it deletes the system definition and itsperformance data.
Keep in mind that deleting a system does not prevent themonitored system from continuing to send performancedata. You must set theMonitor URL value on the monitoredsystem toNONE to disable monitoring.
Note: If the Archive: Clear PMUs & Events option is enabled inthe Global Administration page, the archive settings are ignored.
See Schedule Archive section.
Allow Performance Trace Enables authorized users who are connected to this monitoredsystem to launch the Performance Trace Console. By default, this option is enabled on a new monitored system unless youadjust the system defaults on the System Defaults page.
See Understanding the Performance Trace.
PMU Timeout Indicates the interval in which an open PMU is consideredtimed out. PMU timeouts are measured in days. The PMUTimeout value can't be set to zero.
After the specified interval, the system assumes that a PMU thathas not finished encountered an error and should no longer beconsidered open. The PeopleSoft Application Engine reaperprogram (PSPM_REAPER) moves timed out PMUs from thecurrent PMU tables to the history PMU tables and sets the statusto Reaper Timed Out.
Note: When a PMU starts, the application server agents specifyan override timeout that is equal to the Tuxedo service timeoutof the domain. In such cases, the reaper program uses theoverride value instead of the PMU Timeout that is specifiedhere.
Agent Event Sample Rate Specifies the rate (in seconds) that agents collect resourcemetrics, such as CPU usage. The default is 300 seconds (fiveminutes). To disable event sampling, set the value to zero.
Administering the Performance Monitor Chapter 4
52 Copyright © 1988, 2016, Oracle and/or its affiliates. All rights reserved.
Note: Smaller sampling rate intervals will provide morefrequent updates of machine and process resource utilization onyour monitored systems. However, consider that by decreasingthe sampling rate interval, you increase the volume of data thatis sent to and stored in the performance database. This increasesthe overall impact of performance monitoring.
Agent Buffering Interval Specifies the rate (in seconds) at which an agent sendsperformance data to the monitoring system.
This value can't be set to zero.
A smaller interval decreases the delay between the time whenthe monitored system generates performance data and the timethat it is displayed on the monitoring system.
Larger intervals enable more efficient transmission ofperformance data across the network because the system canconsolidate the data into packets. The larger the interval, thegreater the Agent Max Buffer size should be set.
The default is 10 seconds.
Agent PMU Sample Rate Enables you to reduce the amount of PMU data that is generatedby monitoring just 1 of every N server trips.
Sampling does not affect PMUs that are initiated in aperformance trace.
See Configuring Performance Monitoring Sampling Rate.
Agent Heartbeat Interval This is the interval at which agents that do not have anyperformance data to report or that are in standby mode connectto the monitor servlet to be notified of any configurationchanges. If agents post data to the monitoring system beforethis interval expires, they will be notified of any configurationchanges and the timer will be reset.
The lower the number, the greater the responsiveness of theagents to configuration changes, but the greater the networktraffic.
This value can't be set to zero.
The default value is 300.
Agent Max Buffer Size Determines the maximum size of the buffer containingperformance data. This enables you to cap the amount of datathat is being stored by the agent on the monitored system andthe amount of data that is sent across your network. If this limitis reached, the agent automatically discards new performancedata until the current data has been posted to the monitor servlet.

Chapter 4 Administering the Performance Monitor
Copyright © 1988, 2016, Oracle and/or its affiliates. All rights reserved. 53
The agent posts an alarm to the monitoring if the buffer sizethreshold is exceeded.
The default is 4194304 bytes (4 MB). The minimum must be10240 bytes (10 KB).
Save and Notify Agents Notifies the monitor servlet of configuration changes madeon this page. First, the system saves the changes to thedatabase. Notification of the monitor servlets occurs throughthe PeopleSoft Integration Broker gateway. The monitorservlet notifies the agents of changes when the agents nextcommunicate with the monitor.
A delay occurs in publishing changes to the monitored systems. The maximum delay is the agent heartbeat interval.
Note: The Integration Broker Gateway must be configuredcorrectly; otherwise, you will see an error message indicatingthat the agents were not notified of system changes.
Versions PeopleToolsmonitoringversion history
Enables you to view a history of the PeopleTools versions thatare installed on a monitored system.
The Tools Release column reveals the version numbers.
The Valid From columns indicate the date and time that an agenton a particular version first communicated with the monitoringsystem.
The Valid To columns indicate the date and time that an agenton a particular version last communicated with the monitoringsystem.
Viewing Agent Definitions
Access the Agent Definitions page (PeopleTools, Performance Monitor, Administration, AgentDefinitions).
Agent definitions enable you to view the details about the agents in monitored systems, and deactivatespecific agents, if needed.
System ID Identifies each monitored system. The PeopleSoft systemautomatically generates this value incrementally. Systemdefinitions are created automatically when the first agent of amonitored system registers with the monitoring system.
Database Name The name of the PeopleSoft application database that is runningon the monitored system. The monitoring system automaticallyinserts this value when it recognizes and creates a monitoredsystem.
Administering the Performance Monitor Chapter 4
54 Copyright © 1988, 2016, Oracle and/or its affiliates. All rights reserved.
Agent ID Uniquely identifies an agent within a system. This isautomatically generated by the monitor the first time an agentregisters with it.
Domain Name The name of the domain (application server or web server) inwhich the agent operates.
Agent Type Indicates the type of server process the agent is monitoring.
Domain Type Indicates whether the domain is an application server, a webserver, or a Process Scheduler server domain.
Domain Monitor Displays as Yes orNo. IfYes, then this agent is responsible forsending resource events for its host or domain to the monitor atthe specified sampling rate for the monitored system.
Server Instance This number is specific to Tuxedo servers and corresponds tothe Tuxedo instance number.
Domain Host/Port The name or IP address of the server on which the domainresides, including the port number to which the domain listensfor requests.
Note: Web server agents register with both the HTTP and theHTTPS ports. The application server agents register with theJolt Server Listener (JSL) port. Process Schedulers do not haveports.
Domain Directory The directory in which the domain is installed on the server.
Inactive Agent If this box is selected, the agent is considered inactive. That is, the agent's events and PMUs do not appear in the PerformanceMonitor pages showing current information. You can still viewinformation about events and PMUs that are sent by inactiveagents using the pages that display historical information.
To reactivate an agent, clear the check box, and click Save.
To deactivate an agent, select the check box, and click Save.

Chapter 4 Administering the Performance Monitor
Copyright © 1988, 2016, Oracle and/or its affiliates. All rights reserved. 55
Setting Agent Filter Options
Access the Agent Filters page (PeopleTools, Performance Monitor, Administration, Agent Filters).
Image: Agent Filters page
This example illustrates the fields and controls on the Agent Filters page. You can find definitions for thefields and controls later on this page.
Agent filters determine the amount of performance data that is generated and sent to the monitoringsystem. Depending on the situation, different levels of performance data may be needed to assist in yourperformance-related decisions. The levels range from no information to extremely detailed information.
Each type of PMU and event is associated with a filter level, which is the lowest level at which the systemgenerates performance data for that PMU or event.
System ID Identifies each monitored system. The PeopleSoft systemautomatically generates this value incrementally. Systemdefinitions are created automatically when the first agent of amonitored system registers with the monitoring system.
Database Name The name of the PeopleSoft application database that is runningon the monitored system. The monitoring system automaticallyinserts this value when it recognizes and creates a monitoredsystem.
Reset All Filters Enables you to uniformly adjust the agent filter levels across anentire system. Select the desired level and click Apply.
Agent Filters The Agent Type column displays the types of agents that arecurrently known to the monitoring system.
The Last Update User ID column and Last Update Date/Timecolumn display the user ID that last updated the filtering level
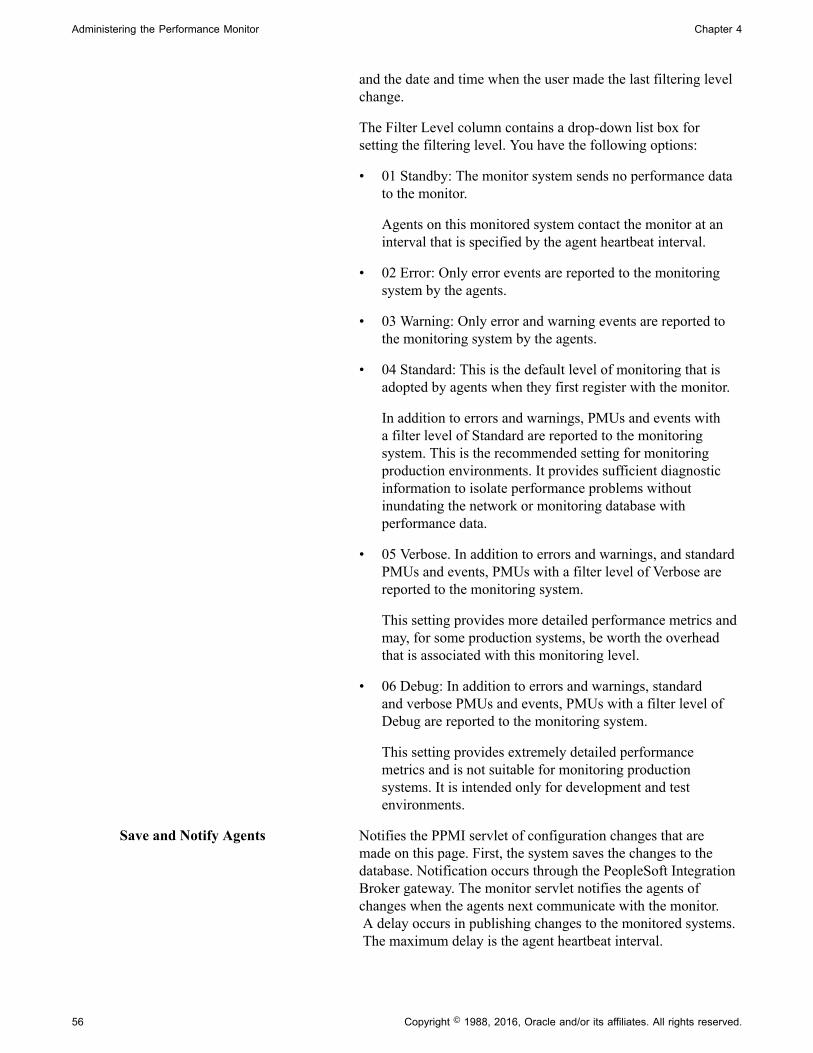
Administering the Performance Monitor Chapter 4
56 Copyright © 1988, 2016, Oracle and/or its affiliates. All rights reserved.
and the date and time when the user made the last filtering levelchange.
The Filter Level column contains a drop-down list box forsetting the filtering level. You have the following options:
• 01 Standby: The monitor system sends no performance datato the monitor.
Agents on this monitored system contact the monitor at aninterval that is specified by the agent heartbeat interval.
• 02 Error: Only error events are reported to the monitoringsystem by the agents.
• 03 Warning: Only error and warning events are reported tothe monitoring system by the agents.
• 04 Standard: This is the default level of monitoring that isadopted by agents when they first register with the monitor.
In addition to errors and warnings, PMUs and events witha filter level of Standard are reported to the monitoringsystem. This is the recommended setting for monitoringproduction environments. It provides sufficient diagnosticinformation to isolate performance problems withoutinundating the network or monitoring database withperformance data.
• 05 Verbose. In addition to errors and warnings, and standardPMUs and events, PMUs with a filter level of Verbose arereported to the monitoring system.
This setting provides more detailed performance metrics andmay, for some production systems, be worth the overheadthat is associated with this monitoring level.
• 06 Debug: In addition to errors and warnings, standardand verbose PMUs and events, PMUs with a filter level ofDebug are reported to the monitoring system.
This setting provides extremely detailed performancemetrics and is not suitable for monitoring productionsystems. It is intended only for development and testenvironments.
Save and Notify Agents Notifies the PPMI servlet of configuration changes that aremade on this page. First, the system saves the changes to thedatabase. Notification occurs through the PeopleSoft IntegrationBroker gateway. The monitor servlet notifies the agents ofchanges when the agents next communicate with the monitor. A delay occurs in publishing changes to the monitored systems. The maximum delay is the agent heartbeat interval.
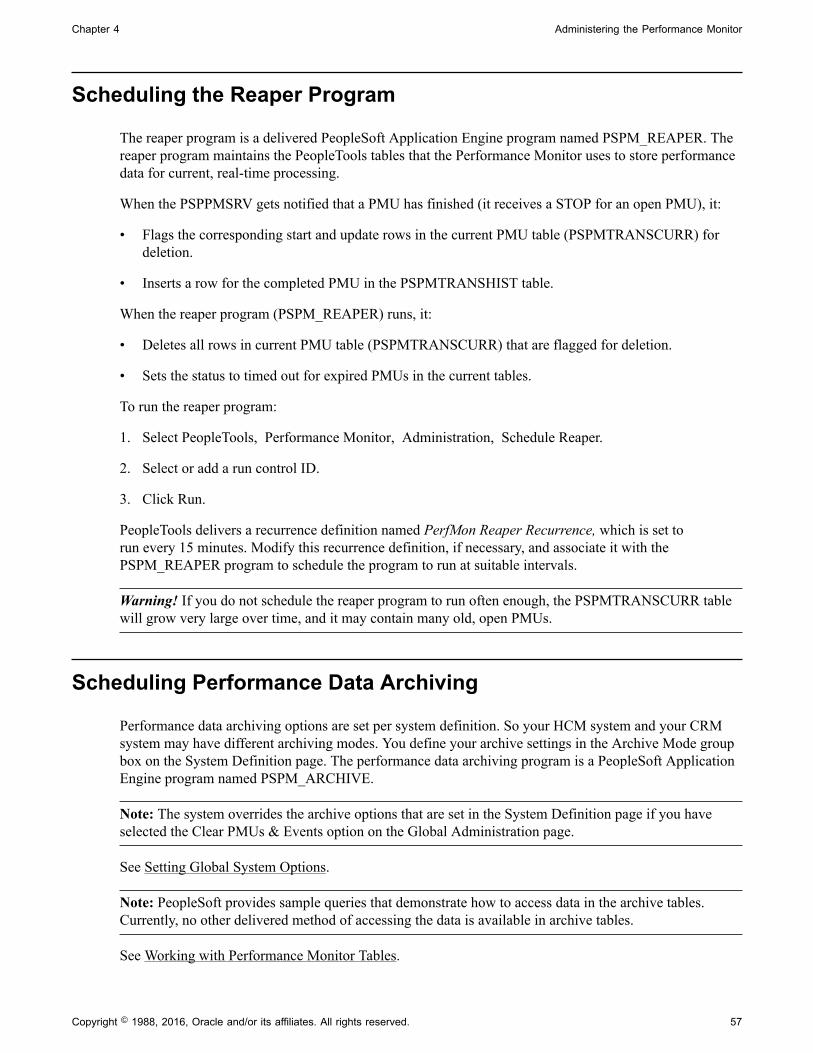
Chapter 4 Administering the Performance Monitor
Copyright © 1988, 2016, Oracle and/or its affiliates. All rights reserved. 57
Scheduling the Reaper Program
The reaper program is a delivered PeopleSoft Application Engine program named PSPM_REAPER. Thereaper program maintains the PeopleTools tables that the Performance Monitor uses to store performancedata for current, real-time processing.
When the PSPPMSRV gets notified that a PMU has finished (it receives a STOP for an open PMU), it:
• Flags the corresponding start and update rows in the current PMU table (PSPMTRANSCURR) fordeletion.
• Inserts a row for the completed PMU in the PSPMTRANSHIST table.
When the reaper program (PSPM_REAPER) runs, it:
• Deletes all rows in current PMU table (PSPMTRANSCURR) that are flagged for deletion.
• Sets the status to timed out for expired PMUs in the current tables.
To run the reaper program:
1. Select PeopleTools, Performance Monitor, Administration, Schedule Reaper.
2. Select or add a run control ID.
3. Click Run.
PeopleTools delivers a recurrence definition named PerfMon Reaper Recurrence, which is set torun every 15 minutes. Modify this recurrence definition, if necessary, and associate it with thePSPM_REAPER program to schedule the program to run at suitable intervals.
Warning! If you do not schedule the reaper program to run often enough, the PSPMTRANSCURR tablewill grow very large over time, and it may contain many old, open PMUs.
Scheduling Performance Data Archiving
Performance data archiving options are set per system definition. So your HCM system and your CRMsystem may have different archiving modes. You define your archive settings in the Archive Mode groupbox on the System Definition page. The performance data archiving program is a PeopleSoft ApplicationEngine program named PSPM_ARCHIVE.
Note: The system overrides the archive options that are set in the System Definition page if you haveselected the Clear PMUs & Events option on the Global Administration page.
See Setting Global System Options.
Note: PeopleSoft provides sample queries that demonstrate how to access data in the archive tables.Currently, no other delivered method of accessing the data is available in archive tables.
See Working with Performance Monitor Tables.
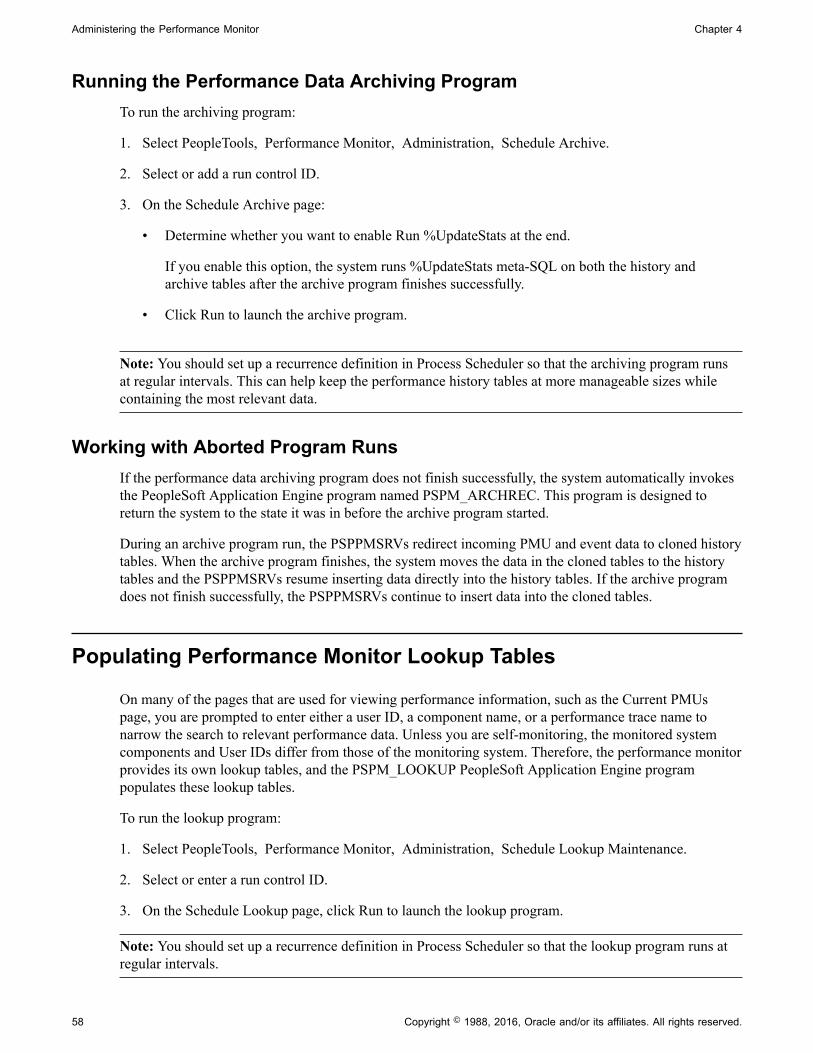
Administering the Performance Monitor Chapter 4
58 Copyright © 1988, 2016, Oracle and/or its affiliates. All rights reserved.
Running the Performance Data Archiving ProgramTo run the archiving program:
1. Select PeopleTools, Performance Monitor, Administration, Schedule Archive.
2. Select or add a run control ID.
3. On the Schedule Archive page:
• Determine whether you want to enable Run %UpdateStats at the end.
If you enable this option, the system runs %UpdateStats meta-SQL on both the history andarchive tables after the archive program finishes successfully.
• Click Run to launch the archive program.
Note: You should set up a recurrence definition in Process Scheduler so that the archiving program runsat regular intervals. This can help keep the performance history tables at more manageable sizes whilecontaining the most relevant data.
Working with Aborted Program RunsIf the performance data archiving program does not finish successfully, the system automatically invokesthe PeopleSoft Application Engine program named PSPM_ARCHREC. This program is designed toreturn the system to the state it was in before the archive program started.
During an archive program run, the PSPPMSRVs redirect incoming PMU and event data to cloned historytables. When the archive program finishes, the system moves the data in the cloned tables to the historytables and the PSPPMSRVs resume inserting data directly into the history tables. If the archive programdoes not finish successfully, the PSPPMSRVs continue to insert data into the cloned tables.
Populating Performance Monitor Lookup Tables
On many of the pages that are used for viewing performance information, such as the Current PMUspage, you are prompted to enter either a user ID, a component name, or a performance trace name tonarrow the search to relevant performance data. Unless you are self-monitoring, the monitored systemcomponents and User IDs differ from those of the monitoring system. Therefore, the performance monitorprovides its own lookup tables, and the PSPM_LOOKUP PeopleSoft Application Engine programpopulates these lookup tables.
To run the lookup program:
1. Select PeopleTools, Performance Monitor, Administration, Schedule Lookup Maintenance.
2. Select or enter a run control ID.
3. On the Schedule Lookup page, click Run to launch the lookup program.
Note: You should set up a recurrence definition in Process Scheduler so that the lookup program runs atregular intervals.

Chapter 4 Administering the Performance Monitor
Copyright © 1988, 2016, Oracle and/or its affiliates. All rights reserved. 59
Working with Performance Monitor Tables
As with any PeopleTool or PeopleSoft application, the underlying application definitions and applicationdata reside in a collection of database tables that are designed using Application Designer. Although mostPeopleSoft applications provide data models that show the relationships between the database entities,typically, for PeopleTools, knowledge of the underlying database tables is not required.
However, with the Performance Monitor, knowledge of the underlying database tables may be required.For example, the Performance Monitor interface provides numerous options to use when you are viewingperformance data, such as viewing by time range, viewing by user, viewing by component, and so on.In some cases, you may want a more customized view of your performance data than what the interfaceoffers.
You can use PeopleSoft Query or your SQL tool of choice to build queries that run against thePerformance Monitor tables and return the specific information that you require.
To assist you in creating custom queries, the Performance Monitor data model appears in the form of anentity relationship diagram (ERD) that is posted on My Oracle Support. Refer to the PeopleTools ReleaseNotes for this release for the current location of the Performance Monitor ERD.
See Performance Monitor Database Schema and Use Cases on My Oracle Support.
Note: The Performance Monitor database schema may change in future releases.
To view the results of sample queries running against the Performance Monitor tables, select PeopleTools,Performance Monitor, History, Sample Queries. To view the definitions and SQL of these samplequeries, use PeopleSoft Query Manager. The sample queries attempt to show a realistic query while usingall of the tables that you may want to include in similar queries.
The sample query definitions are:
Query Description
PPM_COMP_BUILD_CACHE This query returns all application server requests for a specificsystem that had to retrieve metadata from the database asopposed to the cache. It also shows the file cache and memorycache for comparison. This query returns information from thePMU history table.
PPM_COMP_BUILD_CACHE_ARCH This query is similar to PPM_COMP_BUILD_CACHE, except that it returns information from the PMU archive table.
PPM_TIMEOUT_SQL_REQ This query returns information from the PMU history tablewhile joining information that is stored in the event table. Thisquery retrieves all PMU 400s (Tuxedo Service PCode andSQL) that were running SQL statements when an Event 500(Jolt Service Exception) was received. It is assumed that thisexception occurred because of a timeout, but it could also havebeen due to an application server outage or a Jolt error.
PPM_TIMEOUT_SQL_REQ_ARCH This query is similar to PPM_TIMEOUT_SQL_REQ, exceptthat it returns information from the PMU and Event archivetables.
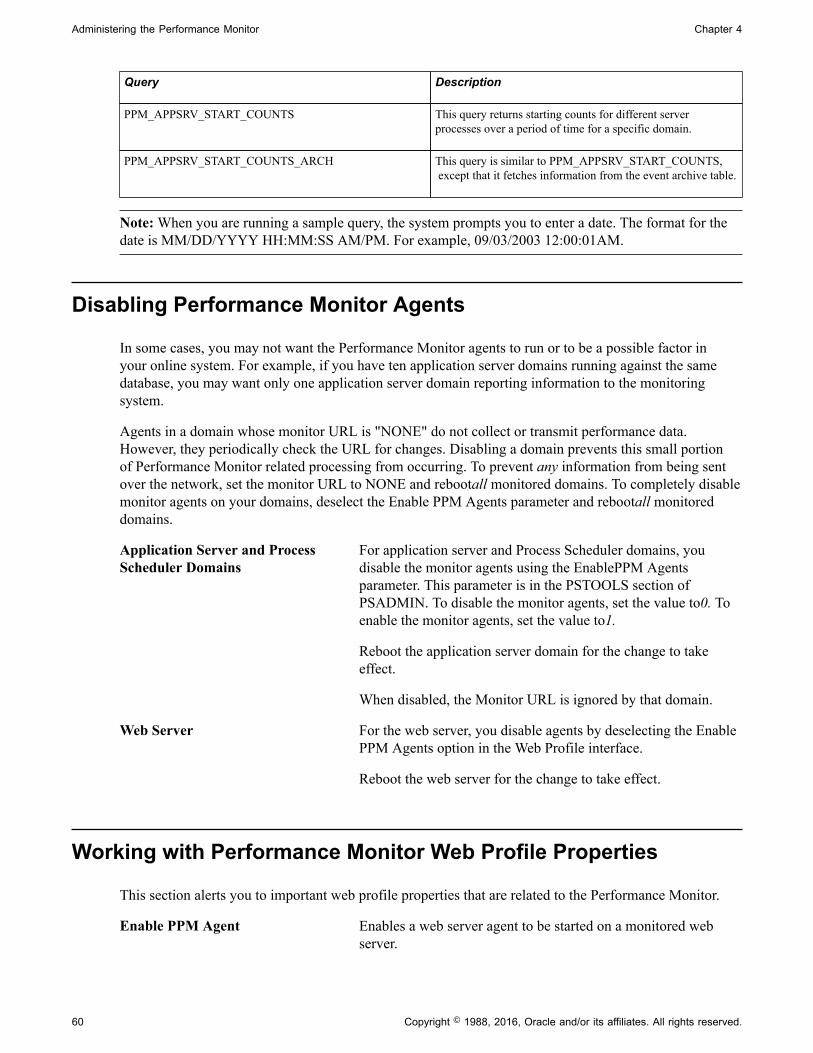
Administering the Performance Monitor Chapter 4
60 Copyright © 1988, 2016, Oracle and/or its affiliates. All rights reserved.
Query Description
PPM_APPSRV_START_COUNTS This query returns starting counts for different serverprocesses over a period of time for a specific domain.
PPM_APPSRV_START_COUNTS_ARCH This query is similar to PPM_APPSRV_START_COUNTS, except that it fetches information from the event archive table.
Note: When you are running a sample query, the system prompts you to enter a date. The format for thedate is MM/DD/YYYY HH:MM:SS AM/PM. For example, 09/03/2003 12:00:01AM.
Disabling Performance Monitor Agents
In some cases, you may not want the Performance Monitor agents to run or to be a possible factor inyour online system. For example, if you have ten application server domains running against the samedatabase, you may want only one application server domain reporting information to the monitoringsystem.
Agents in a domain whose monitor URL is "NONE" do not collect or transmit performance data.However, they periodically check the URL for changes. Disabling a domain prevents this small portionof Performance Monitor related processing from occurring. To prevent any information from being sentover the network, set the monitor URL to NONE and rebootall monitored domains. To completely disablemonitor agents on your domains, deselect the Enable PPM Agents parameter and rebootall monitoreddomains.
Application Server and ProcessScheduler Domains
For application server and Process Scheduler domains, youdisable the monitor agents using the EnablePPM Agentsparameter. This parameter is in the PSTOOLS section ofPSADMIN. To disable the monitor agents, set the value to0. Toenable the monitor agents, set the value to1.
Reboot the application server domain for the change to takeeffect.
When disabled, the Monitor URL is ignored by that domain.
Web Server For the web server, you disable agents by deselecting the EnablePPM Agents option in the Web Profile interface.
Reboot the web server for the change to take effect.
Working with Performance Monitor Web Profile Properties
This section alerts you to important web profile properties that are related to the Performance Monitor.
Enable PPM Agent Enables a web server agent to be started on a monitored webserver.

Chapter 4 Administering the Performance Monitor
Copyright © 1988, 2016, Oracle and/or its affiliates. All rights reserved. 61
PPM Monitor Buffer Size Sets the maximum buffer size for the buffer that is used by themonitor servlet for incoming performance data. The defaultsize is 51200 KB (50 MB). If you notice in servlet trace files orother warnings that you regularly see buffer overflows, you mayconsider increasing this value.
Trace Monitoring Server Located on the Debugging tab. Enables you to trace the ppmiservlet and the monitor servlet. The system writes the traceinformation to the web server log file.
Trace PPM Agent Located on the Debugging tab. Enables you to trace web serveragents on a monitored system. You enable this option on theweb server of the monitored system.
Tracing Performance Monitor Agents
You can set up tracing on the:
• Application server and Process Scheduler servers.
• Web server.
Enabling Tracing on the Application Server or Process Scheduler ServerTo enable tracing of the monitor agents on application server and Process Scheduler domains, usethe TracePPM parameter in PSADMIN on the application server running on the monitored system.SetTracePPM to1. To disable, set to0.
When enabled, the agents write debug information on monitored systems to a log file in the applicationserver LOGS directory. To view the information, open TRACEPPM_mmdd.LOG. The LogFence settingfor application server logs has no effect on this file. Error messages (such as those that are created whenthe monitor URL can't be reached) go directly to the APPSRV_mmdd.LOG.
Enabling Tracing on the Web ServerTo enable tracing of the monitor agents on the web server, select Trace PPM Agent on the Debugging tabin the appropriate web profile on the monitored system.
The agents write tracing information to the web server log file.
Tracing the Monitor and PPMI Servlets
In some cases, you may want to view the activity of the monitor and PPMI servlets that are running on theweb server on the monitoring system.
To enable tracing for the Performance Monitor servlets, you select the Trace Monitoring Server option onthe Debugging tab in the appropriate web profile. The system writes the trace results to the web server logfile.
Administering the Performance Monitor Chapter 4
62 Copyright © 1988, 2016, Oracle and/or its affiliates. All rights reserved.
Configuring Performance Monitoring Sampling Rate
To reduce the overhead that is incurred by monitoring performance, you may not want to monitor everyrequest that is submitted to your system. You can set a sampling rate for your monitored systems so thatonly one out of every N server requests generate PMUs. For the Nth request, all PMUs are generatedat the filter level that is set for each agent type involved in processing the request. Examples of serverrequests would be browser requests to a web server or Application Designer requests to an applicationserver (when running in a three-tier configuration). You set the sampling rate for PMUs using the AgentPMU Sample Rate option on the System Definitions page.
Note: This sampling rate applies only to PMUs, not events.
For example, if you set the sampling rate to 1/10, the system monitors the first PIA request, but does notmonitor another request until the 11th request arrives at the system.
Some PMUs are always monitored regardless of the sampling rate. The PMUs that are never ignoredare those that have the Enable Sampling optioncleared on the PMU Definitions page. Examples of suchPMUs are those related to users signing on, signing off, and being redirected to other sites.
Note: Setting the sampling rate to 0 (zero) disables sampling.
The web server and the application server maintain separate counters. The web server counts all browserrequests, and the application server counts all requests that are submitted directly to the application server,such as component interfaces or Microsoft Windows workstations running Application Designer.
Related LinksPMU DefinitionsModifying System Definitions
Viewing Monitor Servlet Diagnostics
You can view diagnostic information that is related to the monitor servlet by accessing the servlet usingthe following URLs.
URL Description
http://<host>/monitor/<site>/?cmd=agents Reveals additional statistics about the agents sending data tothe monitor servlet.
http://<host>/monitor/<site>/?cmd=ppmiclients Reveals additional statistics about the PPMI clients receivingdata from the monitor servlet.
Note: To provide access to this interface, you must enable the PPMConsole on the Global Administrationpage.
See Setting Global System Options.

Chapter 4 Administering the Performance Monitor
Copyright © 1988, 2016, Oracle and/or its affiliates. All rights reserved. 63
Monitoring AgentsAgents refers to the agents on various monitored systems that send performance data to the currentmonitor servlet.
The system retrieves the agent information from the monitor's cache. If an administrator has changed anyagent settings and clicked Save and Notify Agents on the System Definitions page, the agent informationtemporarily disappears in the Agents grid. Updated agent settings appear in the Agents grid after the agentcommunicates with monitor servlet.
Note: You identify the monitored system, using the system ID (PeopleSoft GUID) appearing just aboveeach grid. To identify the agents, you need to map the system GUID and agent ID with the definitions inthe monitoring database.
Note: Agents appear in the grid if they have successfully registered. The appearance of an agent does notimply that data from the agent is being successfully inserted into the monitoring database.
The following information appears in the Agents grid.
ID The agent ID that uniquely identifies an agent within amonitored system.
Last Comm The last time the agent contacted the monitor servlet.
Filter The current agent filter level.
Buf-Size (buffer size) The current maximum buffer size for the agent that is specifiedin the system definition.
Send-Itvl (send interval) The current agent buffering interval.
Heartbeat The current agent heartbeat interval
Sample-Itvl (sample interval) The current agent event sample rate.
User Trace Indicates whether performance trace is allowed for this agent.
Sampling Rate The current PMU sample rate.
Sampling Filter This column is reserved for future use.
Monitoring PPMI ClientsPPMI clients refer to the PSPPMSRV server processes that interact with the monitor servlet. The Clientsgrid shows all known PPMI clients.
The following information appears in the Clients grid.
Group The system's unique identifier (PeopleSoft GUID).
ID The internal ID assigned to this PSPPMSRV.
URL The IP address of the PSPPMSRV.
Administering the Performance Monitor Chapter 4
64 Copyright © 1988, 2016, Oracle and/or its affiliates. All rights reserved.
Queue Length The number of PMUs and events not yet sent to thisPSPPMSRV.
Estimated Queue Size The estimated size in bytes of the PMUs and events not yet sentto this PSPPMSRV.
Item Processed The number of PMUs and events sent across this PSPPMSRVconnection.
Estimated Bytes Processed The estimated size in bytes of the PMUs and events sent acrossthis PSPPMSRV connection.
Max Size The maximum buffer size in bytes for the PMU and event queuereached in the lifetime of this connection.
Running Avg Size (running averagesize)
The running average of the estimated size in bytes of the PMUsand events not yet sent to this PSPPMSRV.
Limit The maximum buffer size in bytes for the PMU and eventqueue. Data is discarded when this limit is reached.

Chapter 4 Administering the Performance Monitor
Copyright © 1988, 2016, Oracle and/or its affiliates. All rights reserved. 65
Setting Up Monitor Clusters
Image: Monitor cluster elements
The following diagram depicts the relationship between the elements involved in a monitor cluster.
When implementing a monitor cluster, keep these items in mind:
• A cluster must be accessed through an external third party load balancer.
• The web servers in a monitor cluster share PSPPMSRV registration information using HTTP/S.
• Each monitor servlet (one in each web server) load balances performance information across allPSPPMSRVs.
• The host and port of the PPMI URL for a clustered environment need to be set to reflect the host andport of the load balancer.
Administering the Performance Monitor Chapter 4
66 Copyright © 1988, 2016, Oracle and/or its affiliates. All rights reserved.
Note: External load balancers should ensure that performance information that is related to one agent isalways sent to the same monitoring servlet. When sending performance data to the monitor, agents addtheir agent ID to the monitor URL. For example, for agent 8, the URL appears as http://host1/monitor/ps/8. The system administrator should set up a "sticky rule" on the load balancer so that requests from thesame agent are always directed to the same web server, when available. If the sticky rule is not in place,a PMU stop time may be inserted into the monitoring database before the corresponding start time. Thiscreates misleading open PMU information and more work for the reaper program.
See Setting Up PSPPMSRV Authentication.
Note: If a cluster member shuts down, all performance data that is currently queued on that clustermember for transmission to a PSPPMSRV is lost.
To set up a performance monitor cluster:
1. In the monitoring system, use the host and port of the load balancer in the PPMI URL on the GlobalAdministration page.
2. In the monitoring system, enter the URLs of each load-balanced host in the Performance MonitorCluster grid on the Global Administration page.
The format of the Member Servlet URL is:
http[s]://host/ppmi/ps
Where ps is the name of your PeopleSoft site, and host is the real host and port of the host on whichyour cluster member is running. Even though you enterppmi as the servlet name, failover andscalability are implemented for both the PPMI and the monitor servlets from each site.
3. In the monitored system, use the host and port of the load balancer in the monitor URL on the SpecifyMonitor page.
Related LinksSetting Global System OptionsSpecifying the Monitor URL
Using Performance Monitor Data Mover Scripts
PeopleSoft delivers a set of PeopleSoft Data Mover scripts for use in the administration of thePerformance Monitor. The scripts are located in the following directory:
PS_HOME\scripts
The delivered scripts are described below.
perfmondataexport.dms Enables you to export data from your monitoring database.
The data can be exported based on a specific system ID, between specific dates and times, or based on a specificperformance trace. The default export is based on a specificsystem ID. The dat file that is created is named perfdata.dat.
Chapter 4 Administering the Performance Monitor
Copyright © 1988, 2016, Oracle and/or its affiliates. All rights reserved. 67
If you need to export performance data from a specific dateand time, a performance trace, or information on all monitoredsystems, then open the script and edit the script as described inthe comments within the script.
perfmondataimport.dms Enables you to import data from perfdata.dat, which is createdby the perfmondataexport.dms script, into your monitoringdatabase.
Warning! Do not run this file on a live monitoring systembecause current data may be lost. The script contains theREPLACE_DATA * command.
PerfmonPurgeAll.dms Enables you to purge all Performance Monitor tables in themonitoring database.
Note: This script deletes both system definitions and allperformance data that are associated with any monitored system.
Warning! Shut down the monitoring system before running thisscript.
Estimating Your Performance Database Size
This section provides an overview of estimating your performance database size overview and discusseshow to:
• Estimate space requirements for event data.
• Estimate space requirements for PMU data.
• Calculate space requirements.
Estimating Your Performance Database Size OverviewBecause performance monitoring can store a significant amount of data in your performance database,you may want to estimate the amount of data to be stored in your performance database so that you have,or are able to provide, the appropriate amount of space.
Performance database sizing estimates are based on the sum of space requirements for events andperformance measurement unit (PMU) performance data. Event data resides in the PSPMEVENTHISTtable. PMU data resides in the PSPMTRANSHIST and PSPMTRANSCURR tables.
This section presents formulas that you can use to estimate the potential size of your performancedatabase.
These formulas incorporate the following assumptions and considerations:
• Performance Monitor is set to Standard agent filter mode.

Administering the Performance Monitor Chapter 4
68 Copyright © 1988, 2016, Oracle and/or its affiliates. All rights reserved.
• Estimates do not include space required for Verbose or Debug agent filter mode.
• Index overhead is included in the estimate.
• Performance history data is purged after a number of days (see parameter D in the following section).
• The archive mode of a monitored system is set to Delete Data after N days and the performance dataarchive program is scheduled to run daily.
• The reaper program is scheduled to run at least once a day.
• No performance data is stored in the archive tables (PSPMTRANSARCH and PSPMEVENTARCH).
• The calculation formulas use only the parameters that are presented in this section to calculate theestimates. In all cases, the numbers are conservative. For example, the exact formula may use (App –1) but we choose to round up and use App instead.
Estimating Space Requirements for Event DataThis section discusses two formulas that are used for estimating event data space requirements (inkilobytes).
• Standard formula: Use the standard formula if the application server domain configuration is based onPeopleSoft-delivered small, medium, or large template.
• Customized formula: Use the customized formula if the configuration is different from the templates.
This table describes the variables that are used in the formulas.
Notation Description Performance MonitorDefault Value
Navigation
A Performance Monitor agentevent sampling rate.
300 seconds PeopleTools, PerformanceMonitor, Administration, System Definitions
N Number of PeopleSoftsystems that are monitored byPerformance Monitor. Thisis the number of PeopleSoftdatabases appearing on theSystem Definitions searchpage.
NA PeopleTools, PerformanceMonitor, Administration, System Definitions
D Performance history retentionperiod in days. This is thevalue that is set for the AfterN days option.
NA PeopleTools, PerformanceMonitor, Administration, System Definitions
W Number of web serverdomains for a monitoredsystem. This is the totalnumber of web serversappearing on the SystemPerformance page.
NA PeopleTools, PerformanceMonitor, System Monitor, System Performance

Chapter 4 Administering the Performance Monitor
Copyright © 1988, 2016, Oracle and/or its affiliates. All rights reserved. 69
Notation Description Performance MonitorDefault Value
Navigation
P Number of application serverdomains for a monitoredsystem. This is the totalnumber of application serversappearing on the SystemPerformance page.
NA PeopleTools, PerformanceMonitor, System Monitor, System Performance
App Number of server processesrunning in an applicationserver domain for a monitoredsystem. This is the number ofprogram names appearing onfor Server Status.
Use the following numberper domain template that youchoose:
• Large = 60
• Medium = 40
• Small = 20
PSADMIN, ApplicationServer, Administer a domain,Domain, Domain statusmenu, Server status
S Number of monitoredPeopleSoft Process Schedulerdomains for a monitoredsystem. This is the totalnumber of Process Schedulerdomains appearing on theSystem Performance page.
NA PeopleTools, PerformanceMonitor, System Monitor, System Performance
Prcs Number of server processesrunning in a PeopleSoftProcess Scheduler domain fora monitored system. This isthe number of program namesappearing for Server status.
8
Increase this number if morethan three Application Engineprocesses are configured.
PSADMIN, ProcessScheduler, Show Status ofa Process Scheduler Server, Domain, Domain statusmenu, Server status
MPrcs Number of Master Schedulerfor a monitored system.
1 NA
E Number of KB per event rowin the table.
Refer to the value in thefollowing table for the targetdatabase.
NA
The following table helps you to determine the appropriate value for E (Number of KB per event row inthe table).
Parameter ANSI/Unicode Oracle Microsoft SQLServer
DB2 UDB DB2/390
E ANSI .4 .4 .5 .6
E Unicode .7 .7 .9 1.1
Using the Standard FormulaThe formula that you use differs depending on the template used in the application server configuration.
Large N x D x [8 x W + 180 x P + 16 x S + 1] x 86400 / A x E
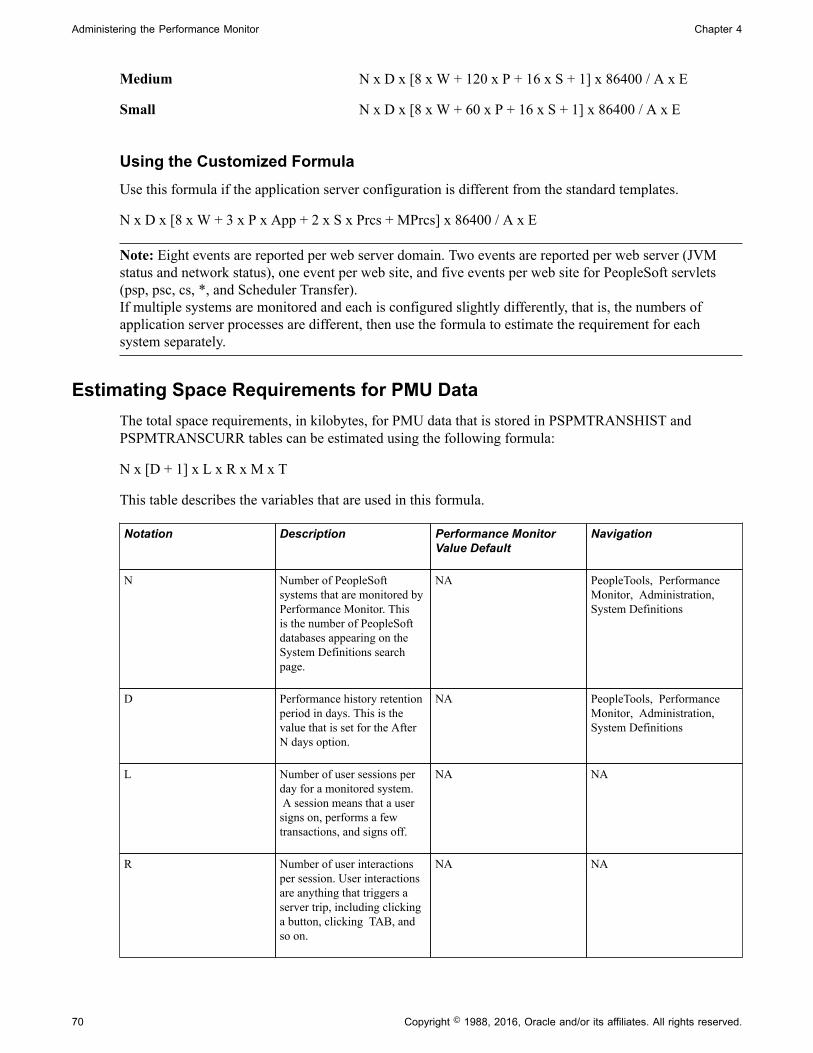
Administering the Performance Monitor Chapter 4
70 Copyright © 1988, 2016, Oracle and/or its affiliates. All rights reserved.
Medium N x D x [8 x W + 120 x P + 16 x S + 1] x 86400 / A x E
Small N x D x [8 x W + 60 x P + 16 x S + 1] x 86400 / A x E
Using the Customized FormulaUse this formula if the application server configuration is different from the standard templates.
N x D x [8 x W + 3 x P x App + 2 x S x Prcs + MPrcs] x 86400 / A x E
Note: Eight events are reported per web server domain. Two events are reported per web server (JVMstatus and network status), one event per web site, and five events per web site for PeopleSoft servlets(psp, psc, cs, *, and Scheduler Transfer).If multiple systems are monitored and each is configured slightly differently, that is, the numbers ofapplication server processes are different, then use the formula to estimate the requirement for eachsystem separately.
Estimating Space Requirements for PMU DataThe total space requirements, in kilobytes, for PMU data that is stored in PSPMTRANSHIST andPSPMTRANSCURR tables can be estimated using the following formula:
N x [D + 1] x L x R x M x T
This table describes the variables that are used in this formula.
Notation Description Performance MonitorValue Default
Navigation
N Number of PeopleSoftsystems that are monitored byPerformance Monitor. Thisis the number of PeopleSoftdatabases appearing on theSystem Definitions searchpage.
NA PeopleTools, PerformanceMonitor, Administration, System Definitions
D Performance history retentionperiod in days. This is thevalue that is set for the AfterN days option.
NA PeopleTools, PerformanceMonitor, Administration, System Definitions
L Number of user sessions perday for a monitored system. A session means that a usersigns on, performs a fewtransactions, and signs off.
NA NA
R Number of user interactionsper session. User interactionsare anything that triggers aserver trip, including clickinga button, clicking TAB, andso on.
NA NA

Chapter 4 Administering the Performance Monitor
Copyright © 1988, 2016, Oracle and/or its affiliates. All rights reserved. 71
Notation Description Performance MonitorValue Default
Navigation
M Number of PMU rows that arecaptured per user interaction.
9 NA
T Number of KB per PMU rowin the table.
Refer to the value in thefollowing table for the targetdatabase.
NA
The following table helps you to determine the value for T.
Parameter ANSI/Unicode Oracle Microsoft SQLServer
DB2 UDB DB2/390
T ANSI 1.3 1.4 1.8 2.1
T Unicode 2.4 2.6 3.3 3.8
Calculating Space RequirementsThis section presents an example of using the formulas to estimate the performance database size for afictitious organization.
Company ABC uses Performance Monitor to monitor two PeopleSoft Applications, Financials andHCM (N=2). Both applications use DB2 UDB Unicode databases. The company has decided that theperformance history data will be kept for a 7-day period (D=7). Each system has two web server domains(W=2), two application server domains (P=2), and two PeopleSoft Process Scheduler domains (S=2). Theimplementation team decides to use the medium application server configuration for both domains. OneMaster Scheduler exists for each of the systems (MPrcs=1).
It is estimated, on the average, that 10,000 user sessions (L=10000) will be logged per day in each of thesystems. During each session, 50 user interactions (clicking buttons, tab to next field or page, and so on)will occur (R=50).
This is the sample calculation for event data space (using the standard formula for a mediumconfiguration):
N x D x [8 x W + 120 x P + 16 x S + 1] x 86400 / A x E
= 2 x 7 x [8 x 2 + 120 x 2 + 16 x 2 + 1] x 86400 / 300 x E
= 1,165,248 rows x 0.9 KB per row
= 1,024 MB
This is the sample calculation for PMU data space:
N x [D + 1] x L x R x M x T
= 2 x [7 + 1] x 10000 x 50 x 9 x T
= 72,000,000 rows x 3.3 KB per row

Administering the Performance Monitor Chapter 4
72 Copyright © 1988, 2016, Oracle and/or its affiliates. All rights reserved.
= 232,032 MB
This is the formula for space requirement for storing performance data on a DB2 UDB Unicode database:
1,024 MB + 232,032 MB = 233,056 MB
Company ABC decides to add a 1 TB disk.
Business is going well for ABC Company. The demand for the Financial application increased by 50percent. The IT department decided to add new web server, application server, and PeopleSoft ProcessScheduler domains for the Financials application (N=1). According to the system administrator, whenthe application server domain is booted, a “22 processes started” message appears (App=22), andthe PeopleSoft Process Scheduler domain shows a “12 processes started” message (Prcs=12). The ITdepartment needs to estimate whether enough disk space is available to store additional performance data.
Use the customized formula to calculate the space requirement for event data that is generated by the newconfiguration.
N x D x [8 x W + 3 x P x App + 2 x S x Prcs + MPrcs] x 86400 / A x E
= 1 x 7 x [8 x 1 + 3 x 1 x 22 + 2 x 1 x 12] x 86400 / 300 x E
= 153,216 rows x 3.3 KB per row
= 494 MB
System usage increased by 50 percent for the Financials application, so the total space requirement is:
233,056 MB + 494 MB + [233,032 MB/2 x 50%]
= 291,558 MB
The IT department concludes that enough space is available to store the performance data.

Copyright © 1988, 2016, Oracle and/or its affiliates. All rights reserved. 73
Chapter 5
Working with the Performance Trace
Understanding the Performance Trace
The Performance Monitor enables you to monitor and record performance information for all activityon PeopleSoft systems. However, times occur when you need to monitor the performance of a specificbusiness process or the performance issues that are reported by a specific user. In these cases, you can usea performance trace.
The Performance Trace enables you to:
• Group PMUs across server requests.
• Display PMUs from multiple systems.
• Override default agent filter levels.
A user starts and stops a performance trace from the Performance Trace console. While a performancetrace is in effect, the system associates the trace name with each PMU that is created during that user'ssession. The trace name may then be used in the Performance Monitor pages to search for performancedata that is created during the performance trace.
The trace can override the current agent filter level for PMUs that are created during the trace. Theoverride applies to that user session only.
Performance traces are effective across multiple systems that report to the same monitor. For example, if aportal displays content from another monitored system, traces that are started from the portal also apply tothe displayed content.
Note: The Performance Trace Console needs to be launched from an end user's browser.
Note: A performance trace is not affected by the PMU sample rate.
Enabling a Performance Trace
Systems that are configured to allow performance traces have a Performance Trace link appearing in theUniversal Navigation Header on each PeopleSoft page.
Note: In the following procedure, be sure to notice where each step needs to be completed: on themonitoring system or themonitored system.
To enable a performance trace:

Working with the Performance Trace Chapter 5
74 Copyright © 1988, 2016, Oracle and/or its affiliates. All rights reserved.
1. On the monitoring system, select PeopleTools, Performance Monitor, Administration, SystemDefinitions and then select the appropriate system definition.
2. On the monitoring system, make sure Allow Performance Trace is selected on the System Definitionspage.
Note: If a business process includes multiple systems, each system in the business process needs tohave the system configured to allow performance traces.
3. On the monitoring system, click Save and Notify Agents.
4. On the monitored system, make sure the users who will run the performance trace have theWEBLIB_PPM web library specified in at least one of their permission lists.
Note: If you don't want a user to see the Performance Trace link, you need to remove the web libraryWEBLIB_PPM from that user's permission lists. Without access to WEBLIB_PPM, the PerformanceConsole link does not appear in the Universal Navigation Header.
Running a Performance Trace
The Performance Trace Console launches in a small, separate window.
Image: Performance Trace Console
This example illustrates the fields and controls on the Performance Trace Console.
To run a performance trace:
1. If the Performance Trace link does not appear in the Universal Navigation Header, click Sign out tosign off the system, and then clear the browser's cache (remove temporary Internet files).
Note: Clearing browser cache varies depending on which supported browser you use. Refer to yourbrowser's documentation for details.

Chapter 5 Working with the Performance Trace
Copyright © 1988, 2016, Oracle and/or its affiliates. All rights reserved. 75
2. Sign on to the PeopleSoft system.
3. Navigate to the page where you want to begin the performance trace.
4. Click the Performance Trace link, which is located in the Universal Navigation Header.
This launches the Performance Trace Console.
5. In the Performance Trace Name edit box, enter a name to identify the trace results.
Remember the name that you enter because you need to enter this name in the search criteria whenyou intend to view the trace results. You can accept the default name, if one appears.
6. In the Filter Level group box, set the filter level options.
You have the following options:
Keep Current Settings The system continues to record performance informationaccording to the current agent filter settings.
Override With Standard Changes the current filter level to Standard for the currentuser's session.
Override With Verbose Changes the current filter level to Verbose for the currentuser's session.
Override With Debug Changes the current filter level to Debug for the currentuser's session.
7. When the appropriate filter levels have been set, click Start Trace.
8. Complete the business process that you need to monitor.
9. Click Stop Trace.
Viewing Performance Trace Information
To view performance trace information:
1. Make note of the performance trace name that was entered by the user.
2. Navigate to the Performance Monitor page that displays the desired performance information.
You can use the performance trace name to view.
• Open PMUs.
• Completed PMUs.
• All of the performance charts.
3. In the search criteria for the page that you are on, enter the name of the performance that is trace in thePerformance Trace Name edit box.

Working with the Performance Trace Chapter 5
76 Copyright © 1988, 2016, Oracle and/or its affiliates. All rights reserved.
4. Enter any additional search criteria required.
5. Click Search.

Copyright © 1988, 2016, Oracle and/or its affiliates. All rights reserved. 77
Chapter 6
Monitoring System Performance
System Performance Monitoring
This section contains an overview of monitoring system performance and lists the pages that are used tomonitor system performance.
Monitoring System PerformanceThe activities that are related to monitoring system performance are primarily for viewing and analyzingthe most recent performance data that is received from agents in a monitored system.
PeopleSoft provides a collection of use cases in the form of flow charts for you to use as a framework forlearning how to use Performance Monitor to detect performance issues. These flow charts do not appearin this PeopleBook; they are posted on My Oracle Support. Refer to the PeopleTools Release Notes forthe current location of these flow charts.
See Performance Monitor Database Schema and Use Cases on My Oracle Support
Note: The information that is presented in the System Performance pages is as current as the last pagerefresh.
Note: The Standard Deviation (Std. Dev.) is provided on many pages. The standard deviation is astatistic that tells you how tightly all the values that are used to compute the average are clustered aroundthe average. Large standard deviations warn that the averages appearing in the chart are not a reliableindicator of response times that are experienced by individual users.
Using the System Performance Home Page
Access the System Performance page (PeopleTools, Performance Monitor, System Monitor, SystemPerformance).
The System Performance page provides various health indices as well as a high-level view of theperformance of your web servers, application servers, and Process Scheduler server domains. It acts as the"home page" for system performance.
Note: A Status field appears at the top of the page only if the monitoring system detects stale data, whichis data that is older than the specified event sampling rate. For example, if your event sample rate is 300seconds, and no events have been received from a specific domain in over five minutes, then that domainis considered stale. Stale data could indicate an outage on the monitored system or that the monitoredsystem's agent filters are set to 01–Standby. If a domain has been shut down permanently and you don'twant it to appear with a stale data warning, go to the Agent Definitions page and set its domain monitor toinactive.

Monitoring System Performance Chapter 6
78 Copyright © 1988, 2016, Oracle and/or its affiliates. All rights reserved.
Viewing Performance IndicesUser Sessions Displays the number of users who have signed onto the system
within the last 12 hours and have not signed off.
Shows all PMU 109s (User Session Began) that do not have anassociated 108 PMU (User Session Ended). These PMUs areassociated by the session ID (Context 1). The User Sessionsvalue includes only users who have signed on in the last12 hours and only those users that have signed on since thelast time the web server agent sent an Event 901 (AgentInitialization).
For details on individual users, click the Current User Sessionslink.
Note: If users do not click the Sign out link on a PeopleSoftpage and instead close the browser or navigate to another site, then the system displays them as current users until the web-server time-out value is reached.
Tuxedo Request Queued Displays the number of requests queued on all applicationservers on the monitored system.
The value is the sum of all the metric 5s (Total pq) for Event300s (Host Resource Status) that are sent by all active agentsfor the current system that are domain monitor agents of typeapplication server. The value includes all Event 300 data that isgenerated within the defined sampling interval.
PMUs in Past Hour Displays the number of PMUs that have run in the past hour. This is an indication of the load on the monitored system, thelevel of monitoring, and whether the monitored system agentsare currently communicating with the monitor.
The value is the sum of the rows that are inserted into thePSPMTRANSHIST table within the last hour.
For more details, click the Open PMUs and theCompletedPMUs link.
Alarms in Past Hour Displays the number of error and warning events that wereposted by the monitored system's active agents in the past hour.
This is the count of all events with filter levels of error andwarning inserted into the PSPMEVENTHIST table in the lasthour.
For more details, click the Alarm History link.
Batch Jobs in Process Displays the number of Process Scheduler jobs that are currentlyrunning on all the Process Scheduler servers belonging to thatmonitored system.

Chapter 6 Monitoring System Performance
Copyright © 1988, 2016, Oracle and/or its affiliates. All rights reserved. 79
The value is the sum of all metric 1s for Event 350 (MasterScheduler Status).
For more details, click the Master Scheduler link.
Note: If a Master Scheduler is not configured for the monitoredsystem, this value is zero.
Batch Jobs in Queue Displays the number of Process Scheduler jobs that are currentlywaiting to be assigned by the Master Scheduler.
The value is the sum of all metric 2s for Event 350 (MasterScheduler Status).
Note: If a Master Scheduler is not configured for the monitoredsystem, this value is zero.
Today's AveragesThe Today's Averages chart displays the average duration of various performance factors within yourPeopleSoft system. The data applies only to the current day, which refers to all data that has beencollected since midnight.
If progress slows in the system anywhere, this chart enables you to identify which tier is affected andenables you to monitor Tuxedo queueing.
Image: Today's Averages chart
This example illustrates the fields and controls on the Today's Averages chart. You can find definitions forthe fields and controls later on this page.
User Response Displays the average amount of time that end users waited forserver round trips to finish. A user is waiting for a server roundtrip to finish when Processing appears in the upper, right-handcorner of a PeopleSoft page.

Monitoring System Performance Chapter 6
80 Copyright © 1988, 2016, Oracle and/or its affiliates. All rights reserved.
Note: This average does not include network latency. It is theaverage duration of all top-level PMU 101s (PIA Request) thatthe monitoring system has received since midnight.
Jolt Request Displays the average and standard deviation of all PMU 115s (Jolt Request) received since midnight.
Application Server Displays the average and standard deviation of the duration ofall PMU 400s (Tuxedo Service PeopleCode and SQL Summary)received since midnight.
SQL Displays the average and standard deviation for the time spentrunning SQL statements that were initiated from PeopleCode ina single application server request. This value includes the timethat was required for SQL Prepare, Execute, Fetch, and Commit.
PeopleCode SQL statements are run by application code that iswritten using PeopleCode and submitted to the database by wayof SQLEXECs or SQL Objects.
This value is derived from metrics 2, 3, and 4 from PMU 400 (Tuxedo Service PeopleCode and SQL Summary). Namely, thisvalue includes PeopleCode SQL, PeopleCode Built-in SQL, andPeopleTools SQL.
Note: This is the average time spent for running all SQLstatements of these types in a single application server request. The system calculates this value using all data that has beenreceived since midnight.
Web Server DomainsThe Web Server Domains grid contains a row for each active domain-monitor web-server agent. Themetric information is derived from Event 150 (JVM status) and Event 151 (Network Status). The systemretrieves only the most recent event for each agent. If the most recent event’s monitor date and time isolder than the system’s event sample rate, the Stale Data icon appears in the grid row and at the top of thepage.
Note: Web server agents do not report performance data until the first user connects to that web server.
Name Displays the PeopleSoft web-server domain name that is beingmonitored.
Click the name to go to the Web Server page for that web server. It's the same page that you access when you select PeopleTools,Performance Monitor, System Monitor, Web Server andchoose that domain.
Host/Port Identifies the web-server domain host name and listening portnumbers for HTTP and HTTPS.

Chapter 6 Monitoring System Performance
Copyright © 1988, 2016, Oracle and/or its affiliates. All rights reserved. 81
Filter Level Appears on pages displaying current performance informationthat is related to servers, such as application servers, webservers, and so on. Displays the current agent filter level.
The colors indicate the following filter levels:
• Blue: Standby, Error, and Warning.
• Green: Standard.
• Orange: Verbose.
• Red: Debug.
Move the cursor over the icon to show a pop-up messagedisplaying the agent filter level in text format.
Sessions in Web App Displays the number of servlet sessions in the portal webapplication.
%JVM Memory Free A Java Virtual Machine (JVM) has a specific amount ofmemory allocated to it. This metric displays the percentage ofthe allocated memory that is available.
Execute Threads The number of threads that are used by the web application toservice incoming requests.
Established Sockets The number of sockets in a connected state. This is a measure ofthe number of active users.
Jolt Traffic Displays the per second amount (in bytes) of Jolt traffic betweenthe web server and the application server.
Application Server Domains/Process Scheduler Server DomainsThe application server and Process Scheduler Server grids contain a row for each active domain monitoragent that is running on the application server or Process Scheduler server. The metric information oneach row is derived from Event 300 (Host Resource Status). The system retrieves only the most recentevent for each agent. If the most recent event’s monitor date or time is older than the system’s eventsample rate, the Stale Data icon appears in the grid row and at the top of the page.
Note: When first booted, an active server may have a stale data warning until a full sampling interval haspassed.
Domain Name Displays the names of the domains that are being monitored.
Click the domain name to access the Application Serveror the Process Scheduler page for additional details on aparticular domain. It's the same page that you access when youselect PeopleTools, Performance Monitor, System Monitor, Application Server or Process Scheduler and choose thatdomain.
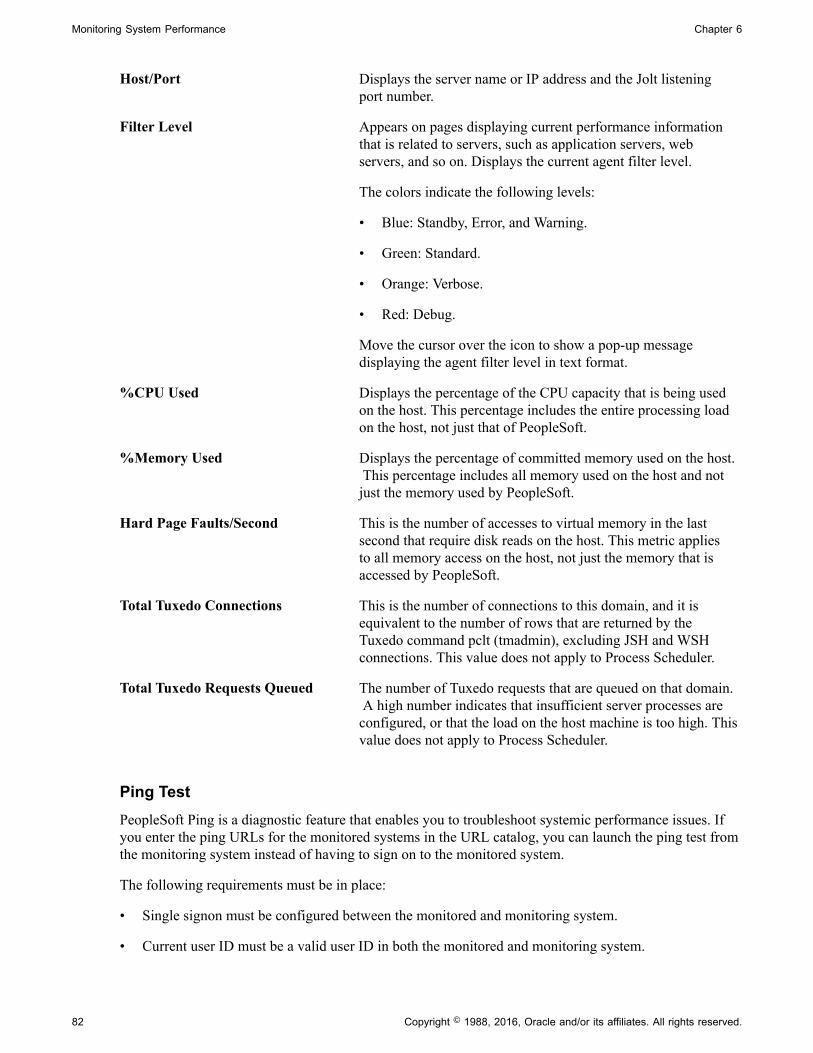
Monitoring System Performance Chapter 6
82 Copyright © 1988, 2016, Oracle and/or its affiliates. All rights reserved.
Host/Port Displays the server name or IP address and the Jolt listeningport number.
Filter Level Appears on pages displaying current performance informationthat is related to servers, such as application servers, webservers, and so on. Displays the current agent filter level.
The colors indicate the following levels:
• Blue: Standby, Error, and Warning.
• Green: Standard.
• Orange: Verbose.
• Red: Debug.
Move the cursor over the icon to show a pop-up messagedisplaying the agent filter level in text format.
%CPU Used Displays the percentage of the CPU capacity that is being usedon the host. This percentage includes the entire processing loadon the host, not just that of PeopleSoft.
%Memory Used Displays the percentage of committed memory used on the host. This percentage includes all memory used on the host and notjust the memory used by PeopleSoft.
Hard Page Faults/Second This is the number of accesses to virtual memory in the lastsecond that require disk reads on the host. This metric appliesto all memory access on the host, not just the memory that isaccessed by PeopleSoft.
Total Tuxedo Connections This is the number of connections to this domain, and it isequivalent to the number of rows that are returned by theTuxedo command pclt (tmadmin), excluding JSH and WSHconnections. This value does not apply to Process Scheduler.
Total Tuxedo Requests Queued The number of Tuxedo requests that are queued on that domain. A high number indicates that insufficient server processes areconfigured, or that the load on the host machine is too high. Thisvalue does not apply to Process Scheduler.
Ping TestPeopleSoft Ping is a diagnostic feature that enables you to troubleshoot systemic performance issues. Ifyou enter the ping URLs for the monitored systems in the URL catalog, you can launch the ping test fromthe monitoring system instead of having to sign on to the monitored system.
The following requirements must be in place:
• Single signon must be configured between the monitored and monitoring system.
• Current user ID must be a valid user ID in both the monitored and monitoring system.
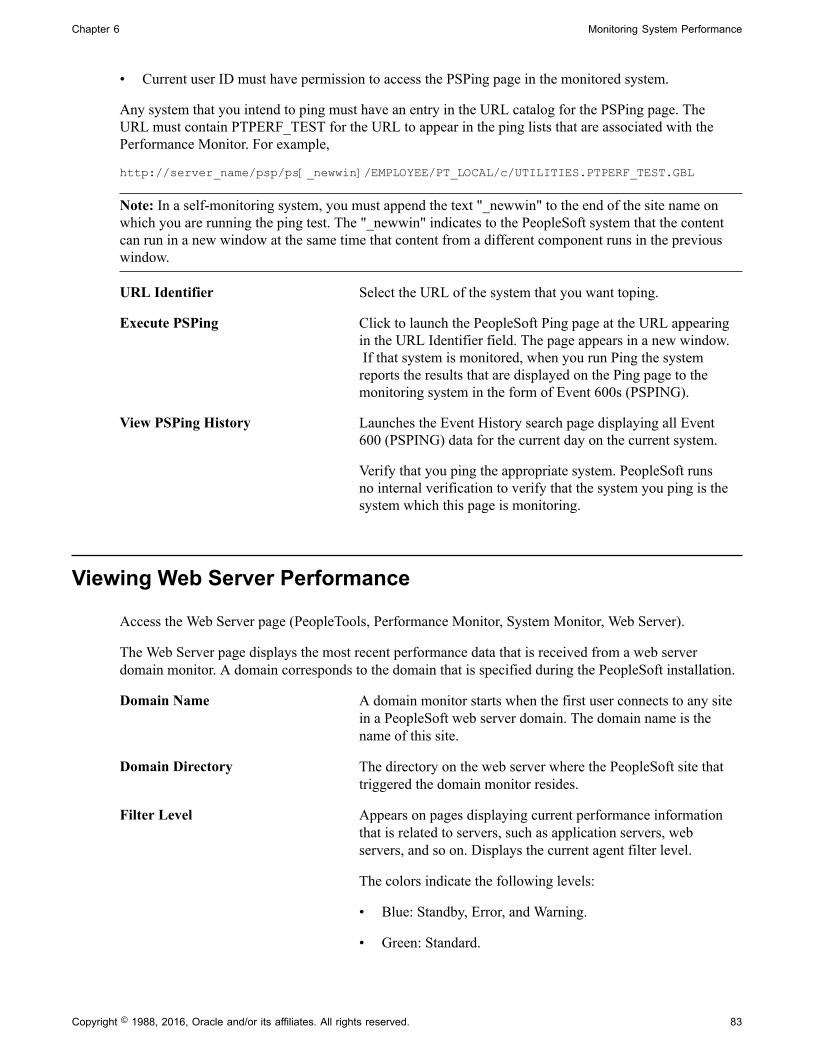
Chapter 6 Monitoring System Performance
Copyright © 1988, 2016, Oracle and/or its affiliates. All rights reserved. 83
• Current user ID must have permission to access the PSPing page in the monitored system.
Any system that you intend to ping must have an entry in the URL catalog for the PSPing page. TheURL must contain PTPERF_TEST for the URL to appear in the ping lists that are associated with thePerformance Monitor. For example,
http://server_name/psp/ps[_newwin]/EMPLOYEE/PT_LOCAL/c/UTILITIES.PTPERF_TEST.GBL
Note: In a self-monitoring system, you must append the text "_newwin" to the end of the site name onwhich you are running the ping test. The "_newwin" indicates to the PeopleSoft system that the contentcan run in a new window at the same time that content from a different component runs in the previouswindow.
URL Identifier Select the URL of the system that you want toping.
Execute PSPing Click to launch the PeopleSoft Ping page at the URL appearingin the URL Identifier field. The page appears in a new window. If that system is monitored, when you run Ping the systemreports the results that are displayed on the Ping page to themonitoring system in the form of Event 600s (PSPING).
View PSPing History Launches the Event History search page displaying all Event600 (PSPING) data for the current day on the current system.
Verify that you ping the appropriate system. PeopleSoft runsno internal verification to verify that the system you ping is thesystem which this page is monitoring.
Viewing Web Server Performance
Access the Web Server page (PeopleTools, Performance Monitor, System Monitor, Web Server).
The Web Server page displays the most recent performance data that is received from a web serverdomain monitor. A domain corresponds to the domain that is specified during the PeopleSoft installation.
Domain Name A domain monitor starts when the first user connects to any sitein a PeopleSoft web server domain. The domain name is thename of this site.
Domain Directory The directory on the web server where the PeopleSoft site thattriggered the domain monitor resides.
Filter Level Appears on pages displaying current performance informationthat is related to servers, such as application servers, webservers, and so on. Displays the current agent filter level.
The colors indicate the following levels:
• Blue: Standby, Error, and Warning.
• Green: Standard.

Monitoring System Performance Chapter 6
84 Copyright © 1988, 2016, Oracle and/or its affiliates. All rights reserved.
• Orange: Verbose.
• Red: Debug.
Move the cursor over the icon to show a pop-up messagedisplaying the agent filter level in text format.
Agent Date/Time The date and time according to the agent clock that the domainmonitor used when it last sent performance data to the monitor.
Note: The date and the time appearing on this page alwaysapply to the system on which the agent runs. Keep this in mindif you are monitoring systems in other time zones.
Status Appears only if the system detects stale data. Performance datais stale if no status events have been reported in the last sampleinterval for the system. For example, Status shows stale data ifthe web server is not booted.
Host/Port The host of the web server and the listening ports for HTTP andHTTPS.
Monitor Date/Time The date and time that the monitoring system inserted the row ofperformance data into the monitoring database according to thedatabase clock.
Last Page Refresh Indicates the most recent time that the system refreshed the pageeither by loading the page into the browser or as a result of auser clicking the Refresh button.
Web Server Snapshot This link enables you to view historical information snapshotsfor the current agent. By clicking this link, you see a list of allthe domain agent timestamps for the current domain monitoragent Event 150 (JVM Status). After you select a particulartimestamp, the system displays the Web Server page containingweb server performance information for that particular time.When you are viewing snapshot information, a message appearsat the top of the page reminding you that the page containshistorical performance data. You can view numerous snapshotsusing the same method.
Note: While viewing snapshots, the Refresh button is notavailable. To view the most current web server information, youmust access the Web Server page using the menu.
System Performance This link accesses the System Performance page (the home pagefor system monitoring).
JVM StatusThe JVM status applies to the status of the JVM in which the site runs. Multiple web sites within the samePeopleSoft domain can run within the same JVM.
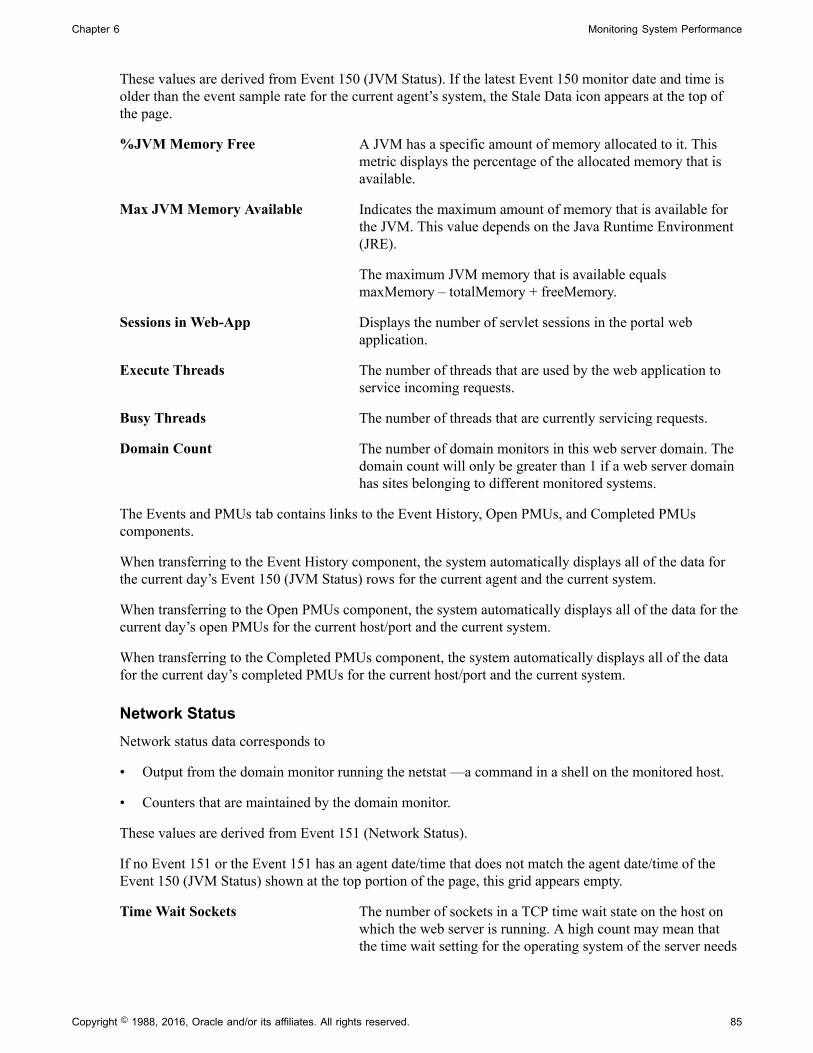
Chapter 6 Monitoring System Performance
Copyright © 1988, 2016, Oracle and/or its affiliates. All rights reserved. 85
These values are derived from Event 150 (JVM Status). If the latest Event 150 monitor date and time isolder than the event sample rate for the current agent’s system, the Stale Data icon appears at the top ofthe page.
%JVM Memory Free A JVM has a specific amount of memory allocated to it. Thismetric displays the percentage of the allocated memory that isavailable.
Max JVM Memory Available Indicates the maximum amount of memory that is available forthe JVM. This value depends on the Java Runtime Environment(JRE).
The maximum JVM memory that is available equalsmaxMemory – totalMemory + freeMemory.
Sessions in Web-App Displays the number of servlet sessions in the portal webapplication.
Execute Threads The number of threads that are used by the web application toservice incoming requests.
Busy Threads The number of threads that are currently servicing requests.
Domain Count The number of domain monitors in this web server domain. Thedomain count will only be greater than 1 if a web server domainhas sites belonging to different monitored systems.
The Events and PMUs tab contains links to the Event History, Open PMUs, and Completed PMUscomponents.
When transferring to the Event History component, the system automatically displays all of the data forthe current day’s Event 150 (JVM Status) rows for the current agent and the current system.
When transferring to the Open PMUs component, the system automatically displays all of the data for thecurrent day’s open PMUs for the current host/port and the current system.
When transferring to the Completed PMUs component, the system automatically displays all of the datafor the current day’s completed PMUs for the current host/port and the current system.
Network StatusNetwork status data corresponds to
• Output from the domain monitor running the netstat —a command in a shell on the monitored host.
• Counters that are maintained by the domain monitor.
These values are derived from Event 151 (Network Status).
If no Event 151 or the Event 151 has an agent date/time that does not match the agent date/time of theEvent 150 (JVM Status) shown at the top portion of the page, this grid appears empty.
Time Wait Sockets The number of sockets in a TCP time wait state on the host onwhich the web server is running. A high count may mean thatthe time wait setting for the operating system of the server needs
Monitoring System Performance Chapter 6
86 Copyright © 1988, 2016, Oracle and/or its affiliates. All rights reserved.
to be decreased, or it may just mean that a very high load is onthat server.
Close Wait Sockets The number of sockets in a TCP close wait state on the host onwhich the web server is running. A high count means that TCPclients are not closing connections and may indicate network orsoftware configuration issues.
Established Sockets The number of sockets in a connected state. This is a measure ofthe number of users who are connected.
Jolt Traffic Displays in bytes per second the amount of Jolt traffic betweenthe web server and the application server.
Note: The Jolt traffic value is zero unless compression isenabled.
HTTP Indicates the HTTP traffic in bytes per second that is generatedby this web server.
The Events and PMUs tab contains links to the associated Event History, Open PMUs, and CompletedPMUs.
When transferring to the Event History component, the system automatically displays all of the data forthe current day’s Event 151 (Network Status) rows for the current agent and the current system.
When transferring to the Open PMUs component, the system automatically displays all of the data for thecurrent day’s open PMUs for the current host/port and the current system.
When transferring to the Completed PMUs component, the system automatically displays all of the datafor the current day’s completed PMUs for the current host/port and the current system.
SitesThe information on this grid applies to all sites on this web server even if they are not monitored sites.
These values are derived from Event 152 (Web Site Status).
If no Event 152 or the Event 152 rows have an agent date/time that does not match the agent date/time ofthe Event 150 (JVM Status), the grid appears empty.
Site Path Indicates the directory on the web server where the site resides.
Requests to all Servlets Indicates the number of requests that have been submitted to allof the servlets running within the site.
Servlet Requests (last minute) Indicates the number of servlet requests that were submitted tothe site in the last minute.
Avg. Request Time (last minute) Indicates the average duration of the servlet requests that weresubmitted to the site in the last minute.
Time in all Servlets Indicates the sum of durations of the servlet requests that weresubmitted to the site since the web server was last booted.

Chapter 6 Monitoring System Performance
Copyright © 1988, 2016, Oracle and/or its affiliates. All rights reserved. 87
Current Sessions The number of sessions that are active within the site. Activesessions are those that are currently waiting for a request to beprocessed. In most cases, this value is 0. However, if your site isrunning slowly or a transaction has a long duration, this value isgreater than 0.
The Events and PMUs tab contains links to the associated Event History, Open PMUs, and CompletedPMUs.
When transferring to the Event History component, the system automatically displays all of the data forthe current day’s Event 152 (Web Site Status) rows for the current agent and the current system.
When transferring to the Open PMUs component, the system automatically displays all of the data for thecurrent day’s open PMUs for the current agent and the current system.
When transferring to the Completed PMUs component, the system automatically displays all of the datafor the current day’s completed PMUs for the agent and the current system.
Active ServletsActive servlets are all servlets that are running in the portal web application.
These values are derived from Event 153 (Web Servlet Status).
Servlet Name Identifies the name of a particular servlet.
Requests to this Servlet Indicates the number of requests that were submitted to aparticular servlet.
Servlet Requests (last minute) Indicates the number of requests that were submitted to aparticular servlet within the last minute.
Avg. Request Time (last minute) The average duration of the requests that were handled by theservlet in the last minute.
Time in this Servlet The sum of durations of requests that were handled by thisservlet since the web server was last booted.
Viewing Application Server Domain Performance
Access the Application Server Domain page (PeopleTools, Performance Monitor, System Monitor,Application Server).
The Application Server Domain page displays the most recent performance data that was received from:
• An application server domain monitor.
• Each active application server agent within that application server domain.
Domain Name Identifies the name of the current Tuxedo domain.
Domain Directory Identifies the directory in which the domain is installed.
Monitoring System Performance Chapter 6
88 Copyright © 1988, 2016, Oracle and/or its affiliates. All rights reserved.
Agent Date/Time The date and time according to the agent clock that the domainmonitor used when it last sent performance data to the monitor.
Note: The date and the time appearing on this page alwaysapplies to the system on which the agent runs. Keep this in mindif you are monitoring systems in other time zones.
Status Appears only if the system detects stale data. Data is stale ifno status events have been reported in the last sample intervalfor the system. For example, Status shows stale data if theapplication server is not booted.
Host/Port Identifies the machine name and Jolt listening port of theapplication server domain.
Application Server Snapshots This link enables you to view historical information snapshotsfor the current agent. By clicking this link, you see a list of allthe domain agent timestamps for the current agent’s Event 300 (Host Resource Status). After you select a particular timestamp, the system displays the Application Server page containingperformance information for that particular time. When youare viewing snapshot information, a message appears at thetop of the page reminding you that the page contains historicalperformance data. You can view numerous snapshots using thesame method.
Note: While viewing snapshots, the Refresh button is notavailable. To view the most current information, you mustaccess the Application Server page using the menu.
Monitor Date/Time The date and time that the monitoring system inserted the row ofperformance data into the monitoring database according to thedatabase clock.
Last Page Refresh Indicates the most recent time that the system refreshed the pageeither by loading the page into the browser or as a result of auser clicking the Refresh button.
See Monitoring Resource Usage.
Host Resource StatusThe Metrics tab presents the same values that also appear on the System Performance page. The metricsshow current resource utilization on the entire host machine, not just the resources that PeopleSoft uses.
The system derives these metrics from the most recent Event 300 (Host Resource Status) for the domainmonitor process of that domain.
If the latest Event 300 monitor date or time is older than the event sample rate for the current agent’ssystem, the Stale Data icon appears at the top of the page.

Chapter 6 Monitoring System Performance
Copyright © 1988, 2016, Oracle and/or its affiliates. All rights reserved. 89
%CPU Used Displays the percentage of the CPU capacity being utilized onthe host machine.
%Memory Used Displays the percentage of committed memory used on the host. This percentage includes all memory used on the host and notjust the memory used by PeopleSoft.
Hard Page Faults/Second This is the number of accesses to virtual memory in the lastsecond that require disk reads.
Total Tuxedo Connections This is the number of connections to this domain, and it isequivalent to the number of rows that are returned by theTuxedo command pclt (tmadmin), excluding JSH and WSHconnections.
Total Tuxedo Requests Queued The number of Tuxedo requests that are queued on that demand. A high number indicates that insufficient server processes areconfigured, or that the load on the host machine is too high.
The Events and PMUs tab presents links to the Event History, Open PMUs, and Completed PMUs pages.
When transferring to the Event History component, the system displays all of the data for the current day'sEvent 300 (Host Resource Status) rows for the current agent and the current system.
When transferring to the Open PMUs component, the system displays all of the data for the current day’sopen PMUs for the current host and port and the current system.
When transferring to the Completed PMUs component, the system displays all of the data for the currentday’s completed PMUs for the current host and port and the current system.
PQ Event RowsThis section presents the results of the tmadmin pq command (print queue). It enables you to viewinformation that is related to the Tuxedo queues that are used by the server processes running within adomain.
The grid displays all Event 301 (Tuxedo "pq" Row) rows for the current agent with the same agent date ortime appearing in the top portion of the page as the Event 300 (Host Resource Status).
Queue Name Identifies the Tuxedo queue that is associated with a serverprocess.
Server Name Indicates the server process that is servicing a particular queue.
Server Count Indicates the number of a particular server process type thatare currently running. For example, it indicates that threePSAPPSRV server processes are currently running.
Queue Length Indicates the current length of the queue, which is measuredby the number of requests waiting to be processed. High queuelengths may indicate that more server processes need to beconfigured to run.

Monitoring System Performance Chapter 6
90 Copyright © 1988, 2016, Oracle and/or its affiliates. All rights reserved.
PSR Event RowsThis section presents the results of the tmadmin psr command (print server processes). This commandenables you to view information that is related to all the server processes (monitored and unmonitored)running within a domain.
The grid displays all Event 302 (Tuxedo "psr" Row) rows for the current agent with the same agent dateor time appearing at the top of the page as the Event 300 (Host Resource Status).
Server Name Indicates the name of the server process, such as PSAPPSRV, PSMONITORSRV, and so on.
Server Instance ID This is the instance ID that is assigned by Tuxedo to each serverprocess. This number remains constant across recycles. Even ifthe PID changes, the instance ID remains constant.
PID Indicates the operating system process ID on the server.
Total Requests Indicates the total number of requests that a server process hasprocessed. Tuxedo continues to increment this number for aserver instance even if the server recycles.
Current Service Indicates whether the server process is idle or currently handlinga request.
Monitored ServersThis section enables you to view information about the resources that are consumed by the monitoredserver processes running within a domain.
The grid displays an entry for each active application server agent within the same system and samehost and port, and domain directory as the domain monitor agent. For each agent, the system retrievesthe latest Event 200 (Resources Per Process) and its metrics are displayed. If no Event 200 exists for aparticular agent, the system displays zeros.
The Metrics tab contains the following information.
Server Identifies the server process being monitored.
Server Instance This is the instance ID that is assigned by Tuxedo to each serverprocess. This number remains constant across recycles. Even ifthe PID changes, the instance ID remains constant.
PID The process ID that is assigned by the server operating system.
Agent Date/Time The date and time according to the agent clock that the domainmonitor used when it last sent performance data to the monitor.
Note: The date and the time appearing on this page alwaysapplies to the system on which the agent runs. Keep this in mindif you are monitoring systems in other time zones.
%CPU Used Indicates the percentage of the CPU capacity that a particularserver process is using.
Chapter 6 Monitoring System Performance
Copyright © 1988, 2016, Oracle and/or its affiliates. All rights reserved. 91
CPU Time The amount of CPU time that the process has consumed.
VM Indicates the amount of virtual memory that each server processis consuming.
The Events and PMUs tab contains links to the Event History, Open PMUs, and Completed PMUs pages.
When transferring to the Event History component, the system displays all data for the current day’sEvent 200 (Resources Per Process) rows for the current agent and the current system.
When transferring to the Open PMUs component, the system displays all data for the current day’s openPMUs for the current agent and the current system.
When transferring to the Completed PMUs component, the system displays all data for the current day’scompleted PMUs for the agent and the current system.
Viewing Analytic Server InformationThe Analytic Server Summary section in the monitored Application Server Domain page provides genericperformance and status information of the analytic Servers running in the application server domain.
Total Configured Servers The current maximum number of configured analytic servers inthe application server domain.
Number Started Servers The current number of analytic servers, started up and loadedwith analytic instances.
Number Free Servers The current number of analytic servers, started up and free.
Number Loaded Instances Today Today's total number of analytic instances loaded.
Number Recycled Servers Today's total number of analytic servers recycled for reuse.
Number Out Servers Today Today's total number of times that the monitored domainruns out of analytic servers. Each time a client asks to loadan analytic instance, a free analytic server gets assigned anddedicated to the analytic instance.
Viewing Process Scheduler Server Performance
Access the Process Scheduler Server page (PeopleTools, Performance Monitor, System Monitor, ProcessScheduler).
The Process Scheduler Server page displays the most recent performance data that is received from:
• A Process Scheduler server domain agent.
• Each active Process Scheduler server agent within this Process Scheduler domain.
Domain Name Identifies the name of the current domain.
Domain Directory Identifies the directory in which the domain is installed.

Monitoring System Performance Chapter 6
92 Copyright © 1988, 2016, Oracle and/or its affiliates. All rights reserved.
Agent Date/Time The date and time according to the agent clock that the domainmonitor used when it last sent performance data to the monitor.
Note: The date and the time appearing on this page alwaysapplies to the system on which the agent runs. Keep this in mindif you are monitoring systems in other time zones.
Status Appears only if the system detects stale data. Data is stale if nostatus events have been reported in the last sample interval forthe system. For example, Status shows stale data if the ProcessScheduler is not booted.
Host/Port Identifies the machine name of the Process Scheduler serverdomain.
Process Scheduler Snapshots This link enables you to view historical information snapshotsfor the current agent. By clicking this link, you see a list ofall the domain monitor timestamps for the current agent’sEvent 300 (Host Resource Status). After selecting a particulartimestamp, the system displays the Process Scheduler Serverpage containing performance information for that particulartime. When you are viewing snapshot information, a messageappears at the top of the page reminding you that the pagecontains historical performance data. You can view numeroussnapshots using the same method.
Note: While you are viewing snapshots, the Refresh button isnot available. To view the most current information, you mustaccess the Process Scheduler Server page using the menu.
Monitor Date/Time The date and time that the monitoring system inserted the row ofperformance data into the monitoring database according to thedatabase clock.
Last Page Refresh Indicates the most recent time that the system refreshed the pageeither by loading the page into the browser or as a result of auser clicking the Refresh button.
See Monitoring Resource Usage.
Host Resource StatusThe Metrics tab presents the values that also appear on the System Performance page.
If the latest Event 300 (Host Resource Status) monitor date and time is older than the event sample ratefor the current agent’s system, the Stale Data icon appears at the top of the page.
%CPU Used Displays the percentage of the Central Processing Unit capacitybeing utilized on the host machine.

Chapter 6 Monitoring System Performance
Copyright © 1988, 2016, Oracle and/or its affiliates. All rights reserved. 93
%Memory Used Displays the percentage of committed memory used on the host. This percentage includes all memory used on the host and notjust the memory used by PeopleSoft.
Hard Page Faults/Second The number of accesses to virtual memory in the last secondthat require disk reads.
Total Tuxedo Connections This number is always zero for a Process Scheduler domain.
Total Tuxedo Requests Queued The number of Tuxedo requests that are queued on that demand. A high number indicates that insufficient server processes areconfigured, or that the load on the host machine is too high.
The Events and PMUs tab presents links to the Event History, Open PMUs, and Completed PMUs pages.
When transferring to the Event History component, the system displays all of the data for the currentday’s Event 300 (Host Resource Status) rows for the current agent and the current system.
When transferring to the Open PMUs component, the system displays all of the data for the current day’sopen PMUs for the current host or port and the current system.
When transferring to the Completed PMUs component, the system displays all of the data for the currentday’s completed PMUs for the current host port and the current system.
PQ Event RowsThis section presents the results of the tmadmin pq command (print queue). It enables you to viewinformation that is related to the queues that are used by the server processes running within a domain.
The performance data displays all Event 301 (Tuxedo "pq" Row) rows for the current agent with the sameagent date and time appearing in the top portion of the page as the Event 300 (Host Resource Status).
Queue Name Identifies the Tuxedo queue that is associated with a serverprocess.
Server Name Indicates the server process that is servicing a particular queue.
Server Count Indicates the number of a particular server process type that arecurrently running. For example, it indicates that three PSAESRVserver processes are currently running.
Queue Length Indicates the current length of the queue, which is measured bythe number of requests that are waiting to be processed.
PSR Event RowsThis section presents the results of the tmadmin psr command (print server processes). This enables youto view information that is related to all the server processes (monitored and unmonitored) running withina domain.
The grid displays all Event 302 (Tuxedo "psr" Row) rows for the current agent with the same agent dateand time appearing at the top of the page as the Event 300 (Host Resource Status).

Monitoring System Performance Chapter 6
94 Copyright © 1988, 2016, Oracle and/or its affiliates. All rights reserved.
Server Name Indicates the name of the server process, such as PSAESRV, PSMONITORSRV, and so on.
Server Instance ID This is the instance ID that is assigned by Tuxedo to each serverprocess. This number remains constant across recycles. Even ifthe PID changes, the instance ID remains constant.
PID Indicates the operating system process ID on the server.
Total Requests Indicates the total number of requests that a server process hasprocessed.
Current Service Indicates whether the server process is idle or currently handlinga request.
Monitored ServersThis section enables you to view information about the resources that are consumed by the monitoredserver processes running within a domain.
Note: Currently, only PSMONITORSRV and PSMSTPRC are monitored.
The grid displays an entry for each active application server agent within the same system and same hostor port and domain directory as the domain monitor agent. For each agent, the system retrieves the latestEvent 200 (Resources Per Process) and its metrics are displayed. If no Event 200 exists for a particularagent, the system displays zeros.
The Metrics tab contains the following information.
Server Identifies the server process that is being monitored.
Server Instance This is the instance ID that is assigned by Tuxedo to each serverprocess. This number remains constant across recycles. Even ifthe PID changes, the instance ID remains constant.
PID The process ID that is assigned by the server operating system.
Agent Date/Time The date and time according to the agent clock that the domainmonitor used when it last sent performance data to the monitor.
Note: The date and the time appearing on this page alwaysapply to the system on which the agent runs. Keep this in mindif you are monitoring systems in other time zones.
%CPU Used Indicates the percentage of the CPU capacity that a particularserver process is using.
CPU Time The amount of CPU time that the process has consumed.
VM Indicates the amount of virtual memory that each server processis consuming.
The Events and PMUs tab contains links to the Event History, Open PMUs, and Completed PMUs pages.

Chapter 6 Monitoring System Performance
Copyright © 1988, 2016, Oracle and/or its affiliates. All rights reserved. 95
When transferring to the Event History component, the system displays all data for the current day’sEvent 200 (Resources Per Process) rows for the current agent and the current system.
When transferring to the Open PMUs component, the system displays all data for the current day’s openPMUs for the current agent and the current system.
When transferring to the Completed PMUs component, the system displays all data for the current day’scompleted PMUs for the agent and the current system.
Viewing Master Scheduler Performance
Access the Master Scheduler page (PeopleTools, Performance Monitor, System Monitor, MasterScheduler).
This page displays the most recent performance data received from a Master Scheduler agent.
Note: The Performance Monitor displays Master Scheduler performance data only if a Master Schedulerhas been configured.
System ID Identifies each monitored system. The PeopleSoft systemautomatically generates this value incrementally. Systemdefinitions are created automatically when the first agent of amonitored system registers with the monitoring system.
Database Name Reveals the name of the PeopleSoft application database thatis running on the monitored system. The monitoring systemautomatically inserts this value when it recognizes and creates amonitored system.
Agent Date/Time The date and time according to the agent clock that the domainmonitor used when it last sent performance data to the monitor.
Note: The date and the time appearing on this page alwaysapply to the system on which the agent runs. Keep this in mindif you are monitoring systems in other time zones.
Status Appears only if the system detects stale data. Data is stale if itis older than the sample rate for that system. Data is stale if nostatus events have been reported in the last sample interval forthe system. For example, Status shows stale data if the ProcessScheduler is not booted.
Monitor Date/Time The date and time that the monitoring system inserted the row ofperformance data into the monitoring database according to thedatabase clock
Last Page Refresh Indicates the most recent time that the system refreshed the pageeither by loading the page into the browser or as a result of auser clicking the Refresh button.

Monitoring System Performance Chapter 6
96 Copyright © 1988, 2016, Oracle and/or its affiliates. All rights reserved.
Process SummaryThis process displays the status of the processes that are being managed by the Master Scheduler runningon the selected system.
The data in this grid is derived from Event 350 (Master Scheduler Status).
Active Processes The number of Process Scheduler jobs that are currentlyprocessing in this monitored system.
Unused Process Slots The number of available slots that this Master Scheduler can useto run process requests.
Blocked Processes A process can be blocked for two reasons:
• The process is "mutually exclusive" with another process, and the other process is currently running.
• The process is dependent on a file that another process hasyet to create.
Queued Processes The number of Process Scheduler jobs that are currently waitingto be handled by an available Process Scheduler server.
ServersThe Servers grid contains performance metrics for individual Process Scheduler servers that are runningunder the Master Scheduler.
This grid displays all Event 351 (Master Scheduler Detail) rows for all active Process Scheduler serversunder the current system with the same agent date and time as the latest Event 350 (Master SchedulerStatus). The system groups the data by server name and the metrics are accumulated.
Note: If the monitor date and time for an Event 351 is older than the current system’s event sample rate, aStale Data icon appears at the top of the page.
Server Name The name of the Process Scheduler server, such as PSNT, PSUNIX, and so on.
The server name is a hyperlink that launches a Server Activitysecondary page for that particular server type. The ServerActivity page displays all of the individual Event 351 (MasterScheduler Detail) rows. Use the Refresh button on this page torefresh the Processes grid.
Active Processes The number of jobs that are currently being handled by aProcess Scheduler server.
Queue DetailsThe Queue grid displays the status of the processes that are queued to be processed by the MasterScheduler.
Chapter 6 Monitoring System Performance
Copyright © 1988, 2016, Oracle and/or its affiliates. All rights reserved. 97
The data is generated from Event 354 (Batch Queue Details) rows for all active Process Scheduler agentsin the current system with the same agent date and time as the latest Event 350 (Master Scheduler Status).
Process Type Displays the type of process that are queued, such as SQR, Application Engine, COBOL, and so on.
Queued Processes Displays the number of processes that are queued per processtype.
Blocked Processes A process can be blocked for two reasons:
• The process is "mutually exclusive" with another process, and the other process is currently running.
• The process is dependent on a file that another process hasyet to create.
Viewing Open PMUs
Access the Open PMUs page (PeopleTools, Performance Monitor, System Monitor, Open PMUs).
An open PMU is a PMU that started but has not finished prior to an agent reporting performance metricsto the monitor. Information regarding open PMUs are stored in the PSPMTRANSCURR table. Whenthe PMU finishes, the PSPPMSRV flags the PMU for deletion and inserts a matching row into thePSPMTRANSHIST table, which stores completed PMU data.
See Scheduling the Reaper Program.
If an end user is reporting that a PeopleSoft page is slow (displays the "Processing...." message), use theOpen PMU page to see where the request has stalled. Search for that user's name to see the current state ofthat user's open PMUs.
Before you view current PMU details, you need to enter search criteria. If you don't specify criteria, thepage displays all of the open PMUs for the selected system.
User ID If you want information per user, enter the user ID of the userfor which you want to track current PMUs.
The user ID prompts against the PSPMOPRDEFN table, whichis populated by the Lookup Application Engine program.
Performance Trace Name You enter the performance trace name to search on currentlyopen PMUs running within a particular trace.
If a user has launched a performance trace in the PerformanceConsole, the system labels every PMU that is generated in abusiness process with a performance trace name.
The performance trace name prompts against thePSPMPERFTRACE table, which is populated by the LookupApplication Engine program.
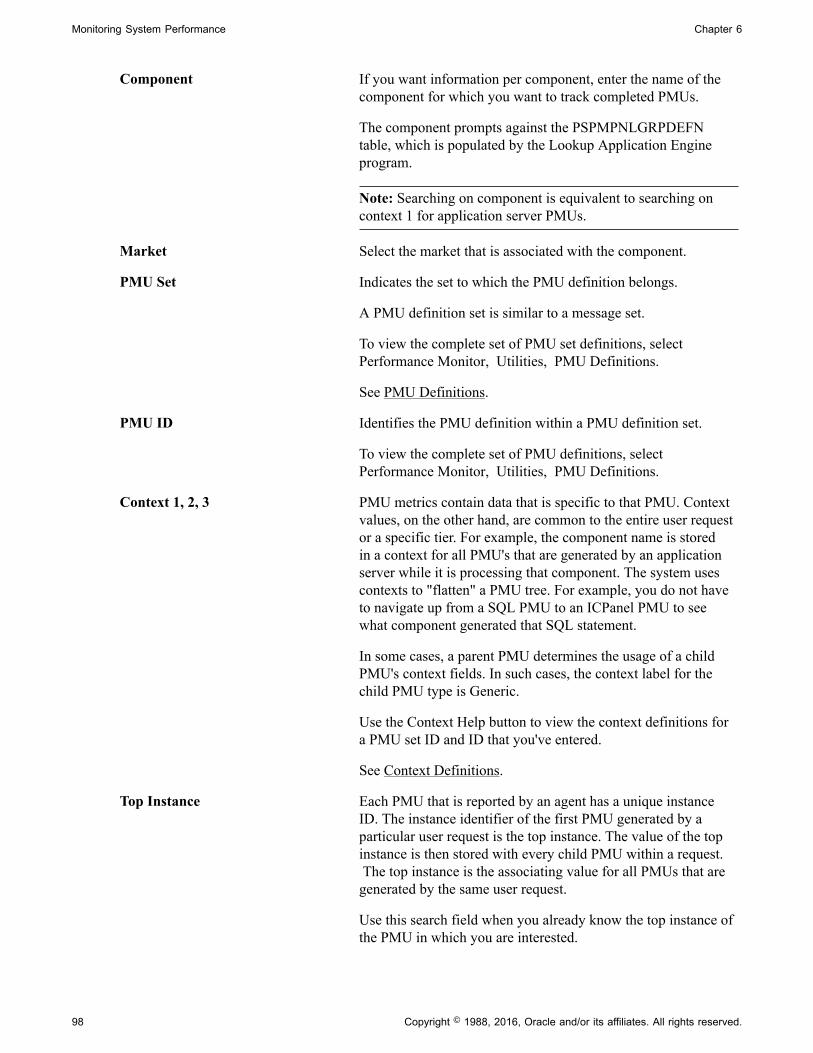
Monitoring System Performance Chapter 6
98 Copyright © 1988, 2016, Oracle and/or its affiliates. All rights reserved.
Component If you want information per component, enter the name of thecomponent for which you want to track completed PMUs.
The component prompts against the PSPMPNLGRPDEFNtable, which is populated by the Lookup Application Engineprogram.
Note: Searching on component is equivalent to searching oncontext 1 for application server PMUs.
Market Select the market that is associated with the component.
PMU Set Indicates the set to which the PMU definition belongs.
A PMU definition set is similar to a message set.
To view the complete set of PMU set definitions, selectPerformance Monitor, Utilities, PMU Definitions.
See PMU Definitions.
PMU ID Identifies the PMU definition within a PMU definition set.
To view the complete set of PMU definitions, selectPerformance Monitor, Utilities, PMU Definitions.
Context 1, 2, 3 PMU metrics contain data that is specific to that PMU. Contextvalues, on the other hand, are common to the entire user requestor a specific tier. For example, the component name is storedin a context for all PMU's that are generated by an applicationserver while it is processing that component. The system usescontexts to "flatten" a PMU tree. For example, you do not haveto navigate up from a SQL PMU to an ICPanel PMU to seewhat component generated that SQL statement.
In some cases, a parent PMU determines the usage of a childPMU's context fields. In such cases, the context label for thechild PMU type is Generic.
Use the Context Help button to view the context definitions fora PMU set ID and ID that you've entered.
See Context Definitions.
Top Instance Each PMU that is reported by an agent has a unique instanceID. The instance identifier of the first PMU generated by aparticular user request is the top instance. The value of the topinstance is then stored with every child PMU within a request. The top instance is the associating value for all PMUs that aregenerated by the same user request.
Use this search field when you already know the top instance ofthe PMU in which you are interested.
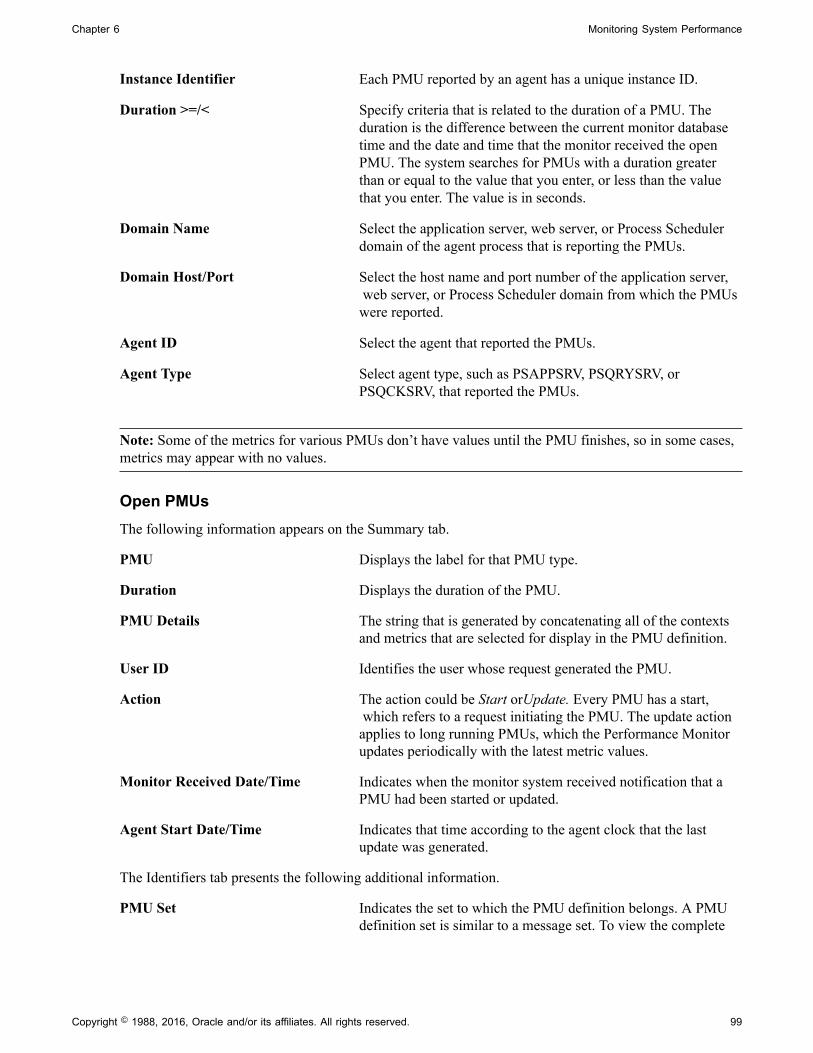
Chapter 6 Monitoring System Performance
Copyright © 1988, 2016, Oracle and/or its affiliates. All rights reserved. 99
Instance Identifier Each PMU reported by an agent has a unique instance ID.
Duration >=/< Specify criteria that is related to the duration of a PMU. Theduration is the difference between the current monitor databasetime and the date and time that the monitor received the openPMU. The system searches for PMUs with a duration greaterthan or equal to the value that you enter, or less than the valuethat you enter. The value is in seconds.
Domain Name Select the application server, web server, or Process Schedulerdomain of the agent process that is reporting the PMUs.
Domain Host/Port Select the host name and port number of the application server, web server, or Process Scheduler domain from which the PMUswere reported.
Agent ID Select the agent that reported the PMUs.
Agent Type Select agent type, such as PSAPPSRV, PSQRYSRV, orPSQCKSRV, that reported the PMUs.
Note: Some of the metrics for various PMUs don’t have values until the PMU finishes, so in some cases,metrics may appear with no values.
Open PMUsThe following information appears on the Summary tab.
PMU Displays the label for that PMU type.
Duration Displays the duration of the PMU.
PMU Details The string that is generated by concatenating all of the contextsand metrics that are selected for display in the PMU definition.
User ID Identifies the user whose request generated the PMU.
Action The action could be Start orUpdate. Every PMU has a start, which refers to a request initiating the PMU. The update actionapplies to long running PMUs, which the Performance Monitorupdates periodically with the latest metric values.
Monitor Received Date/Time Indicates when the monitor system received notification that aPMU had been started or updated.
Agent Start Date/Time Indicates that time according to the agent clock that the lastupdate was generated.
The Identifiers tab presents the following additional information.
PMU Set Indicates the set to which the PMU definition belongs. A PMUdefinition set is similar to a message set. To view the complete
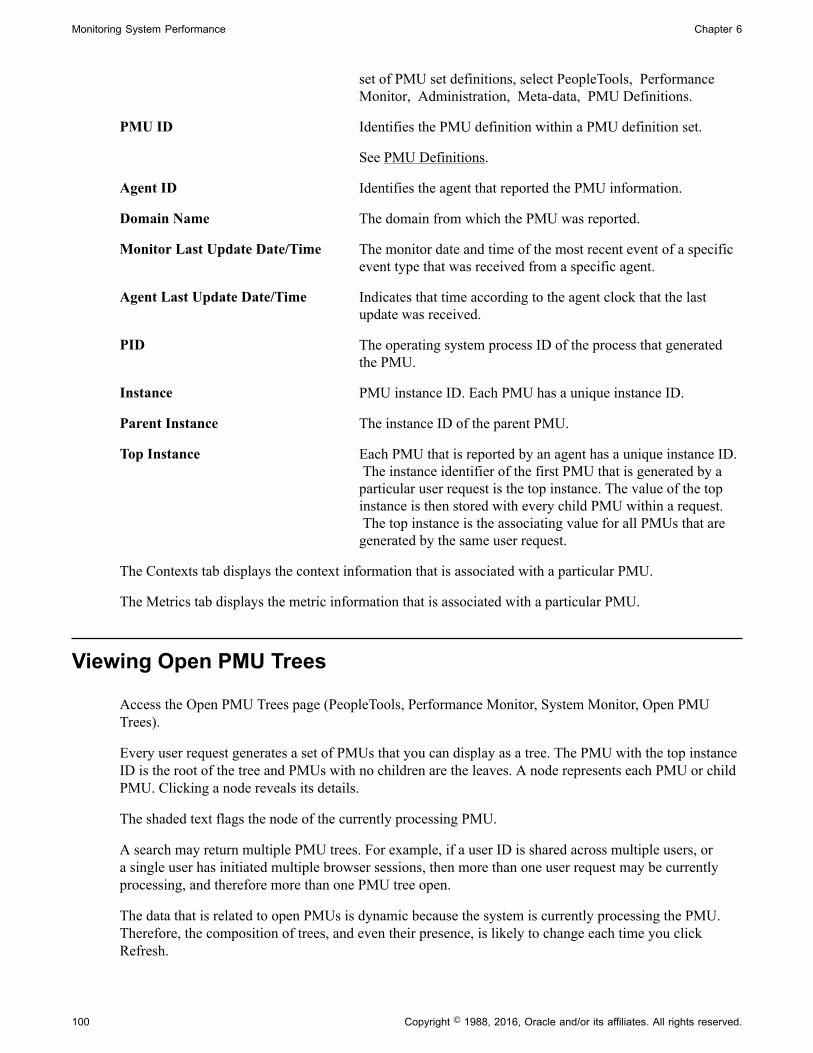
Monitoring System Performance Chapter 6
100 Copyright © 1988, 2016, Oracle and/or its affiliates. All rights reserved.
set of PMU set definitions, select PeopleTools, PerformanceMonitor, Administration, Meta-data, PMU Definitions.
PMU ID Identifies the PMU definition within a PMU definition set.
See PMU Definitions.
Agent ID Identifies the agent that reported the PMU information.
Domain Name The domain from which the PMU was reported.
Monitor Last Update Date/Time The monitor date and time of the most recent event of a specificevent type that was received from a specific agent.
Agent Last Update Date/Time Indicates that time according to the agent clock that the lastupdate was received.
PID The operating system process ID of the process that generatedthe PMU.
Instance PMU instance ID. Each PMU has a unique instance ID.
Parent Instance The instance ID of the parent PMU.
Top Instance Each PMU that is reported by an agent has a unique instance ID. The instance identifier of the first PMU that is generated by aparticular user request is the top instance. The value of the topinstance is then stored with every child PMU within a request. The top instance is the associating value for all PMUs that aregenerated by the same user request.
The Contexts tab displays the context information that is associated with a particular PMU.
The Metrics tab displays the metric information that is associated with a particular PMU.
Viewing Open PMU Trees
Access the Open PMU Trees page (PeopleTools, Performance Monitor, System Monitor, Open PMUTrees).
Every user request generates a set of PMUs that you can display as a tree. The PMU with the top instanceID is the root of the tree and PMUs with no children are the leaves. A node represents each PMU or childPMU. Clicking a node reveals its details.
The shaded text flags the node of the currently processing PMU.
A search may return multiple PMU trees. For example, if a user ID is shared across multiple users, ora single user has initiated multiple browser sessions, then more than one user request may be currentlyprocessing, and therefore more than one PMU tree open.
The data that is related to open PMUs is dynamic because the system is currently processing the PMU.Therefore, the composition of trees, and even their presence, is likely to change each time you clickRefresh.

Chapter 6 Monitoring System Performance
Copyright © 1988, 2016, Oracle and/or its affiliates. All rights reserved. 101
If you have an open PMU tree that was captured using the standard agent filter mode, you can drill downto the detail of PMU 400 (Tuxedo Service PCode and SQL). The Current SQL statement shows whathas been submitted to the application server. This can aid in troubleshooting long-running SQL or ahung query without increasing the agent filter and asking users to repeat the process. If the open PMUfinishes, then the PMU row is marked for deletion by the reaper program. You can't access the currentSQL statement if the PMU has finished.
Note: So that the presentation of PMU information is readable and manageable, if a PMU is older than aday, the system displays the date that the PMU ran, not its duration in milliseconds.
Note: For each PMU in the tree, the duration value represents the period of time that has elapsed since themonitoring system received the start timestamp for each PMU. In some cases, the display may indicatethat a child PMU is "older" than its parent. For example, if the application server sent PMU informationbefore the web server sent PMU information, the child PMUs that are running on the application serverwill display a smaller duration than the associated parent PMUs that are running on the web server.
User ID Enter the user ID of the user who is initiating the PMUs. Youmust specify a user ID to view open PMU trees.
Total Trees received The number of currently open PMU trees for the user. Corresponds to the number of open requests for this user.
Currently displaying Indicates the PMU tree that is currently displayed on the page, providing orientation in a list of returned PMU trees.
Previous Tree/Next Tree Enables you to navigate within a list of PMU trees.
Open PMU Tree You can expand or collapse PMU trees by using the folder iconto the left. Click a node to view details regarding that PMU.
Use the Left andRight links to navigate within a single treewhen the tree is 20 nodes deep.
Viewing Current User Sessions
Access the Current User Sessions page (PeopleTools, Performance Monitor, System Monitor, CurrentUser Sessions).
A row appears for every PMU 109 (user session began) that was received in the last 12 hours for which amatching PMU 108 (user session ended) has not been received.
Note: If you recycle the web server during this time, the user session is considered closed.
The Session tab contains the following information.
User ID Identifies the user.
Session ID Indicates the open session on the web server that is associatedwith the user.

Monitoring System Performance Chapter 6
102 Copyright © 1988, 2016, Oracle and/or its affiliates. All rights reserved.
Monitor Received Date/Time The date and time that the monitoring system inserted the row ofperformance data into the monitoring database.
User History Accesses the User History page.
See Viewing User Session History.
The Details tab contains the following additional information.
The latency and user agent data is derived from PMU 116 (redirect after login) with the same session ID(context 1) as the associated PMU 109 (user session began).
IP Address Indicates the IP address of the machine that the user is using toconnect to the PeopleSoft system.
User Agent The Mozilla user-agent string specification for the user'sbrowser.
Latency The duration of PMU 116 (redirect after login). The latencyvalue enables you to infer the network latency for a userconnection.
Viewing Recycled Processes Diagnosis
Access the Recycled Processes Diagnosis page (PeopleTools, Performance Monitor, System Monitor,Recycled Processes Diagnosis).
The Recycled Processes Diagnosis page is used to determine the causes of application server recycles.Specifically, it can determine what kind of server request was received by application server processesbefore a restart occurred.
Monitoring Resource Usage
This section provides additional information that may help you to interpret the information thatPerformance Monitor provides that is related to the events reporting resource usage on host machines.These events are:
• Event 150 (JVM Status).
• Event 151 (Network Status).
• Event 200 (Resources Per Process).
• Event 300 (Host Resource Status).
• Event 301 (Tuxedo "pq" Row).
• Event 302 (Tuxedo "psr" Row).
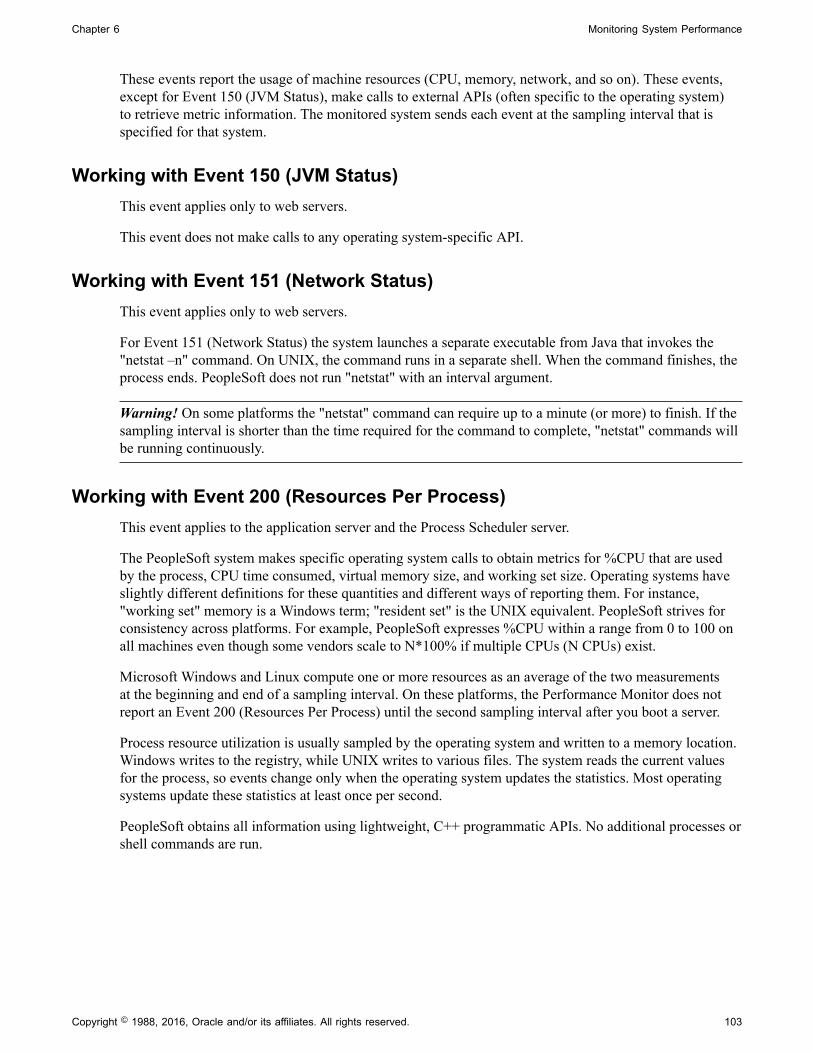
Chapter 6 Monitoring System Performance
Copyright © 1988, 2016, Oracle and/or its affiliates. All rights reserved. 103
These events report the usage of machine resources (CPU, memory, network, and so on). These events,except for Event 150 (JVM Status), make calls to external APIs (often specific to the operating system)to retrieve metric information. The monitored system sends each event at the sampling interval that isspecified for that system.
Working with Event 150 (JVM Status)This event applies only to web servers.
This event does not make calls to any operating system-specific API.
Working with Event 151 (Network Status)This event applies only to web servers.
For Event 151 (Network Status) the system launches a separate executable from Java that invokes the"netstat –n" command. On UNIX, the command runs in a separate shell. When the command finishes, theprocess ends. PeopleSoft does not run "netstat" with an interval argument.
Warning! On some platforms the "netstat" command can require up to a minute (or more) to finish. If thesampling interval is shorter than the time required for the command to complete, "netstat" commands willbe running continuously.
Working with Event 200 (Resources Per Process)This event applies to the application server and the Process Scheduler server.
The PeopleSoft system makes specific operating system calls to obtain metrics for %CPU that are usedby the process, CPU time consumed, virtual memory size, and working set size. Operating systems haveslightly different definitions for these quantities and different ways of reporting them. For instance,"working set" memory is a Windows term; "resident set" is the UNIX equivalent. PeopleSoft strives forconsistency across platforms. For example, PeopleSoft expresses %CPU within a range from 0 to 100 onall machines even though some vendors scale to N*100% if multiple CPUs (N CPUs) exist.
Microsoft Windows and Linux compute one or more resources as an average of the two measurementsat the beginning and end of a sampling interval. On these platforms, the Performance Monitor does notreport an Event 200 (Resources Per Process) until the second sampling interval after you boot a server.
Process resource utilization is usually sampled by the operating system and written to a memory location.Windows writes to the registry, while UNIX writes to various files. The system reads the current valuesfor the process, so events change only when the operating system updates the statistics. Most operatingsystems update these statistics at least once per second.
PeopleSoft obtains all information using lightweight, C++ programmatic APIs. No additional processes orshell commands are run.

Monitoring System Performance Chapter 6
104 Copyright © 1988, 2016, Oracle and/or its affiliates. All rights reserved.
Operating System Description
Windows Performance Monitor uses Performance Data Helper (PDH)to read registry counters. The information is identical to theWindows Performance Monitor tool. When multiple copies ofa process, such as PSAPPSRV, are running, registry countersare assigned arbitrarily. For example, counter 1 and counter 2can reverse their process assignment when a process reboots. Performance Monitor corrects for this.
• CPU utilization is "% Processor Time," defined as thefraction of time that the process spends in kernel + userduring the last PDH sampling interval (typically onesecond).
• Process time is kernel + user, accurate to 1 millisecond.
• Virtual memory is "Virtual Bytes."
• Working set memory is "Working Set," which is thesame as "Mem Usage," displayed by the Windows TaskManager.
AIX Performance Monitor reads the psinfo files, which is the samesource of information that AIX uses for its "ps" command.
• CPU utilization is the same as "ps -o pcpu" or the %CPUfrom "ps v". AIX defines it as a lifetime average: totalCPU time that is consumed by the process divided bytotal time that the process has been running.
• Process time is system + user, excluding children. Accurate to 10 milliseconds.
• Virtual memory is the same as "ps -o vsz", or the 1024 *SIZE field from "ps v".
• Resident set memory is the same as the 1024 * RSS fieldfrom "ps v".
HPUX Performance Monitor reads pst_status using pstat_getproc.
• CPU utilization is the same as "top" divided by thenumber of CPUs (on HPUX "top" shows utilization of asingle CPU).
• Process time is system + user, excluding children.
• Virtual memory is the same as the SIZE field from "top".
• Resident set memory is the same as the RES field from"top".

Chapter 6 Monitoring System Performance
Copyright © 1988, 2016, Oracle and/or its affiliates. All rights reserved. 105
Operating System Description
Linux Performance Monitor reads ps information from /proc files.
• CPU utilization is the same as "top" divided by thenumber of CPUs (on Linux "top" shows utilization ofa single CPU). It is the average utilization over the lastsample period.
• Process time is system + user, excluding children, andaccurate to 10 milliseconds. The times for all threads inthe process are added together.
Warning! Linux kernel 2.4 tracks only the process timeof each thread. PeopleSoft searches the /proc directory tofind all threads and report the total time of the process. However, on a production system with thousands ofthreads, accumulating this information may take up to asecond of CPU time.
• Virtual memory is the same as "ps -o vsz" (not visible in"top"). According to the man pages, it counts just text, data, and stack.
• Resident set memory is the same as "ps -o rss" (not visiblein "top"). This value includes just text, data, and stack.
Solaris Performance Monitor reads psinfo files, which is the samesource of information that Solaris uses for its "ps" command.
• CPU utilization is the same as "top". Solaris computes amoving average with exponential weighting.
• Process time is system + user, excluding children, andaccurate to 10 milliseconds.
• Virtual memory is the same as "ps -o vsz" or the SIZEfield from "top".
• Resident set memory is the same as "ps -o rss" or the RESfield from "top". On Solaris, shared libraries are countedin RES but not in SIZE.
OS/390 The only metric that is supported in the current release isProcess Time.
Working with Event 300 (Host Resource Status)This event applies to the application server and the Process Scheduler server.
Performance Monitor makes specific operating system calls to obtain metrics for %CPU use on thehost machine, %Memory use, and the hard page fault rate. Operating systems have slightly differentdefinitions for these quantities, and they have different ways of reporting them. In most cases, PeopleSoftexpresses %Memory use to reflect utilization of physical memory.
Performance Monitor programmatically queries the Tuxedo management information base (MIB) for totalJolt connections and total requests queued. All platforms compute one or more resources as an average
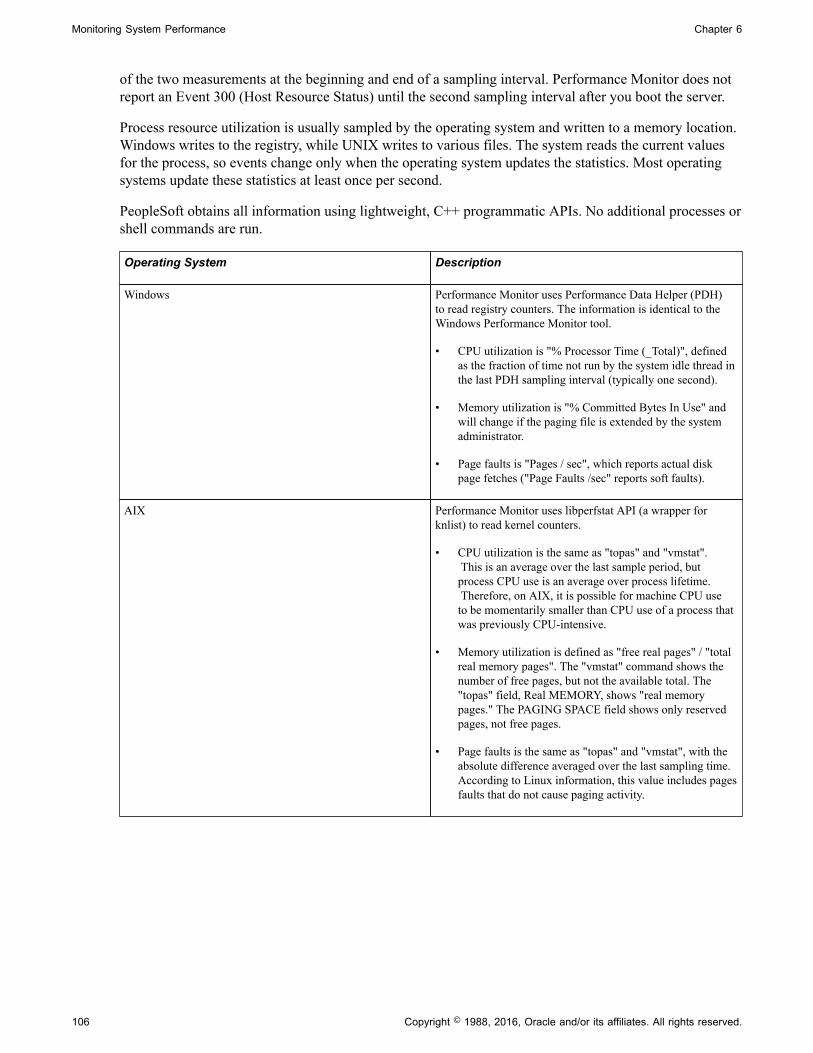
Monitoring System Performance Chapter 6
106 Copyright © 1988, 2016, Oracle and/or its affiliates. All rights reserved.
of the two measurements at the beginning and end of a sampling interval. Performance Monitor does notreport an Event 300 (Host Resource Status) until the second sampling interval after you boot the server.
Process resource utilization is usually sampled by the operating system and written to a memory location.Windows writes to the registry, while UNIX writes to various files. The system reads the current valuesfor the process, so events change only when the operating system updates the statistics. Most operatingsystems update these statistics at least once per second.
PeopleSoft obtains all information using lightweight, C++ programmatic APIs. No additional processes orshell commands are run.
Operating System Description
Windows Performance Monitor uses Performance Data Helper (PDH)to read registry counters. The information is identical to theWindows Performance Monitor tool.
• CPU utilization is "% Processor Time (_Total)", definedas the fraction of time not run by the system idle thread inthe last PDH sampling interval (typically one second).
• Memory utilization is "% Committed Bytes In Use" andwill change if the paging file is extended by the systemadministrator.
• Page faults is "Pages / sec", which reports actual diskpage fetches ("Page Faults /sec" reports soft faults).
AIX Performance Monitor uses libperfstat API (a wrapper forknlist) to read kernel counters.
• CPU utilization is the same as "topas" and "vmstat". This is an average over the last sample period, butprocess CPU use is an average over process lifetime. Therefore, on AIX, it is possible for machine CPU useto be momentarily smaller than CPU use of a process thatwas previously CPU-intensive.
• Memory utilization is defined as "free real pages" / "totalreal memory pages". The "vmstat" command shows thenumber of free pages, but not the available total. The"topas" field, Real MEMORY, shows "real memorypages." The PAGING SPACE field shows only reservedpages, not free pages.
• Page faults is the same as "topas" and "vmstat", with theabsolute difference averaged over the last sampling time.According to Linux information, this value includes pagesfaults that do not cause paging activity.

Chapter 6 Monitoring System Performance
Copyright © 1988, 2016, Oracle and/or its affiliates. All rights reserved. 107
Operating System Description
HPUX Performance Monitor uses pstat_getdyamic (pstat) to readkernel counters.
• CPU utilization is the same as "top" and "vmstat". This isan average over the last sample period, but process CPUuse is an average over a longer time period. Therefore, it is possible on HPUX for machine CPU use to bemomentarily smaller than CPU use of a process that waspreviously CPU-intensive.
• Memory utilization is defined as "real memory + textpages / physical memory." Neither of these quantities areexposed with vmstat.
• Page faults is the same as "vmstat -s, zero fill page faults", with the absolute difference averaged to a rate over thelast sampling time.
Linux Performance Monitor reads kernel statistics from files in /proc.
• CPU utilization is the same as "top", averaged over allprocessors. This is an average over the last sample period.
• Memory utilization is the same as "top", or the "free"command "Mem used / (av)ailable" field. It measuresphysical memory utilization. The "used" field is actually"available - free". The "M" and "K" units of "top" are1024 * 1024 bytes and 1024 bytes, respectively.
• Page faults is the first "page" kernel counter from /proc/stat (pages swapped in from disk), with the absolutedifference averaged to a rate over the last sampling time.
Solaris Performance Monitor uses the Kernel Statistics API (kstat) toread kernel counters.
• CPU utilization is the same as "top, user + kernel". Thisis an average over the last sample period, but processCPU use is a weighted average over a longer time period. Therefore, it is possible on Solaris for machine CPU useto be momentarily smaller than CPU use of a process thatwas previously CPU-intensive.
• Memory utilization is defined as the "used / used+ available" fields from "swap -s". This is only anapproximation because of allocated but unreserved RAM. See the Sun web site for more information.
• Page faults is the same as major page faults from "vmstat-s", with the absolute difference averaged to a rate overthe last sampling time.

Monitoring System Performance Chapter 6
108 Copyright © 1988, 2016, Oracle and/or its affiliates. All rights reserved.
Operating System Description
OS/390 Performance Monitor uses the ERBSMFI and CVT APIs toreport resource use on the logical partition. Higher priorityjobs on other partitions can "steal" resources and not appear inthese metrics.
• CPU utilization is the same as RMF "TOTAL/AVERAGELPAR BUSY TIME PERC" field.
• Memory utilization is defined from the RMF"AVAILABLE" versus RMF "TOTAL FRAMES" fields.
• Page faults is not supported for this release.
Working with Event 301 (Tuxedo "pq Rows)This event applies to the application server and the Process Scheduler server.
The system programmatically queries the Tuxedo management information base (MIB) for the status ofeach queue.
Working with Event 302 (Tuxedo "psr" Rows)This event applies to the application server and the Process Scheduler server.
The system programmatically queries the Tuxedo management information base (MIB) for the status ofeach server. Only PeopleSoft servers appear as Performance Monitor events; the BBL is not reported.

Copyright © 1988, 2016, Oracle and/or its affiliates. All rights reserved. 109
Chapter 7
Analyzing Historical Performance Data
Historical Performance Data
This section provides an overview of historical performance data and lists the pages used to analyzehistorical performance data.
Understanding Historical Performance DataThe system stores historical data from the moment a PMU finishes processing or an event occurs. Whenthe archive program runs (PSPM_ARCHIVE), it either deletes the historical data or moves it to thearchive tables.
Analyzing historical data can help you:
• Identify trends.
By comparing historical data, you can spot upward and downward performance trends.
• Investigate past user complaints.
For example, a user may complain that performance was slow during the previous week. You searchhistorical performance data to find the PMUs that were generated by the user at a specific time a weekago.
Viewing Completed PMUs
Access the Completed PMUs page (PeopleTools, Performance Monitor, History, Completed PMUs).
Note: The search result of completed PMUs includes history information collected by agents even if theyare currently marked inactive.
Note: If a "clone table" warning appears at the top of the page, the archive program is either currentlyrunning or has abnormally terminated. If this is the case, all new incoming information that is being sentto the monitoring system is currently being inserted into the clone tables. New performance data is notinserted into the current data tables until the archive program finishes successfully.
Note: When a process recycles or crashes, there may be a slight loss in data until the agent registers again.
Entering Search CriteriaBefore you can view information about completed PMUs, you need to enter criteria so that you can locatethe appropriate completed PMUs.

Analyzing Historical Performance Data Chapter 7
110 Copyright © 1988, 2016, Oracle and/or its affiliates. All rights reserved.
Use the Advanced Search link to expose all search criteria.
The maximum rows that are returned by the search depends on the value in the Search Row Limit field onthe Global Administration page.
See Setting Global System Options.
System ID Identifies each monitored system. PeopleSoft automaticallygenerates this value incrementally. System definitions arecreated automatically when the first agent of a monitored systemregisters with the monitoring system.
Database Name The name of the PeopleSoft application database running on themonitored system. The monitoring system automatically insertsthis value when it recognizes and creates a monitored system.
User ID If you want information for a particular user, enter the user ID ofthe user for which you want to track completed PMUs.
This field prompts against the PSPMOPRDEFN table.
Process ID Enables you to search completed PMUs by the process ID.
Performance Trace Name If a user has launched a performance trace in the PerformanceTrace Console, the system labels every PMU that is generatedin a business process with a performance trace name. Select theappropriate trace name to view its results.
The Performance Trace Name field prompts against thePSPMPERFTRACE table, which the Lookup program (PSPM_LOOKUP) populates.
Component If you want information for a particular component, enter thename of the component for which you want to track completedPMUs.
This field prompts against the PSPMPNLGRPDEFN table.
Note: Searching on a component is equivalent to searching onContext 1 for application server PMUs.
Market Enter the market that is associated with the component.
PMU Definition Set Indicates the set to which the PMU definition belongs. A PMUdefinition set is similar to a message set.
This is required if you want to generate metric and durationcharts.
PMU Identifier Identifies the PMU definition within a PMU definition set.
This is required if you want to generate metric and durationcharts.
Chapter 7 Analyzing Historical Performance Data
Copyright © 1988, 2016, Oracle and/or its affiliates. All rights reserved. 111
Context 1, 2, 3 PMU metrics contain data that is specific to that PMU. Contextvalues, on the other hand, are common to the entire user requestor a specific tier. For example, the component name is storedin a context. The system uses contexts to "flatten" a PMU tree. For example, you do not have to navigate up from a SQL PMUto an ICPanel PMU to see what component generated that SQLstatement. In some cases, PMU types are shared across differentuser request types. In such cases, the label for the PMU willbe generic. Use the Context Help button to view the contextdefinitions for a PMU set ID and ID that you've entered.
PMU Status Displays the PMU status.
See Completed PMU Status.
Top Instance Each PMU that is reported by an agent has a unique instanceID. The instance identifier of the first PMU generated by aparticular user request is the top instance. The value of the topinstance is then stored with every child PMU within a request. The top instance is the associating value for all PMUs that aregenerated by the same user request.
Statement Number This search field applies only when you are searching forPeopleCode SQL PMUs, which are PMU 406 (PeopleCode SQLExecute) and PMU 407 (PeopleCode BuiltIn SQL Execute). The Context 2 field contains the PeopleCode program nameandMetric 2 contains the statement number in the PeopleCodewhere the SQL was executed.
To search by statement number, you must enter the followingsearch criteria: PMU Definition Set = 1, PMU ID = 406 or 407, and Context 2 must have the name of a PeopleCode program.
From Date/Time To Date/Time Specify a range of time in which the system should search forcompleted PMUs.
The system searches on the monitor date and time, not the agentdate and time.
Duration Specify criteria that is related to the duration of a PMU inmilliseconds.
Domain Name Select the application server domain to generate the PMUs.
Domain Host/Port Select the name and port number of the server machine onwhich the domain that generated the PMU resides.
Agent Identifier Identify the specific agent that monitored a PMU.
Agent Type Identify the type of agent that monitored a PMU.
Search The Search button performs a search based on the search criteriathat is defined on the page. If you want to view the most currentinformation, use theRefresh button after running the initial

Analyzing Historical Performance Data Chapter 7
112 Copyright © 1988, 2016, Oracle and/or its affiliates. All rights reserved.
search. If you clickSearch repeatedly, the system returns thesame results from the same time range for each search.
Refresh Updates the value in the To Time field to equal the currenttime and performs a search. This enables you to view the mostcurrent results of a search.
Working with Completed PMUsAt the bottom of the Completed PMUs page, the Completed PMUs grid contains the information that isrelated to the PMUs that are retrieved by your search criteria. The tabs in the Completed PMUs page arediscussed in the following sections.
SummaryPMU Indicates the name of the PMU. Click the PMU name to view
the PMU Details page.
Duration Indicates the duration of the PMU from start to finish inmilliseconds.
Complete Tree Click the tree icon to view the complete PMU tree, including allancestor and descendant PMUs.
PMU Details Provides further description of the PMU.
The details comprise contexts and metrics that are helpful foridentifying the PMU. Each type of PMU displays a different setof details.
User Indicates the user whose request triggered the PMU.
PMU Status Displays the PMU status.
See Completed PMU Status.
Monitor Received Date/Time Indicates when the monitor system received notification that aPMU had been started or updated.
Agent Start Date/Time Indicates that time according to the agent clock that the lastupdate was received.
Domain Name Indicates the domain that handled the request that is associatedwith the PMU.
IdentifiersThe Identifiers tab presents the following additional information.
PMU Set Identifies the set to which the PMU ID belongs.
PMU ID Identifies a PMU definition within a PMU set.

Chapter 7 Analyzing Historical Performance Data
Copyright © 1988, 2016, Oracle and/or its affiliates. All rights reserved. 113
Agent ID Identifies the agent that reported the PMU.
Process ID The operating system process ID of the process that generatedthe PMU.
Instance A unique identifier that is generated by the system for eachPMU.
Parent Instance The PMU that produced the PMU in this grid row.
Top Instance Each PMU that is reported by an agent has a unique instance ID. The instance identifier of the first PMU that is generated by aparticular user request is the top instance. The value of the topinstance is then stored with every child PMU within a request. The top instance is the value that associates all PMUs that aregenerated by the same user request.
ContextsThe Contexts tab reveals the context definition and value that is associated with each PMU in the grid. Toview the details of the contexts in a PMU, examine the context and PMU definitions.
This Description column shows data for the additional description value that is part of the incomingPMU. The description stores large character values and generally stores information that exceeds the 128–character limit of Metric 7 and the 254–character limit of the contexts.
See Context Definitions.
MetricsThe Metrics tab presents the metric values for all of the metrics that are defined for each PMU in the grid.
Metric information appears in a raw format. The values reflect exactly what is stored in the database.
See Metric Definitions.
TreesThe Trees tab enables you to view the PMU within the context of a PMU tree.
View Ancestors Shows all parent PMUs for the selected PMU. This may beuseful in determining the call tree of a child PMU.
Only direct ancestors appear; sibling PMUs do not appear.
View Descendants Shows all child PMUs for the selected PMU. This may be usefulin determining where the time is spent for a PMU.
Complete Tree Displays the entire tree representing the user request. If verboseor debug filters are set, this tree may contain a large number ofnodes and may take a significant amount of time to load.
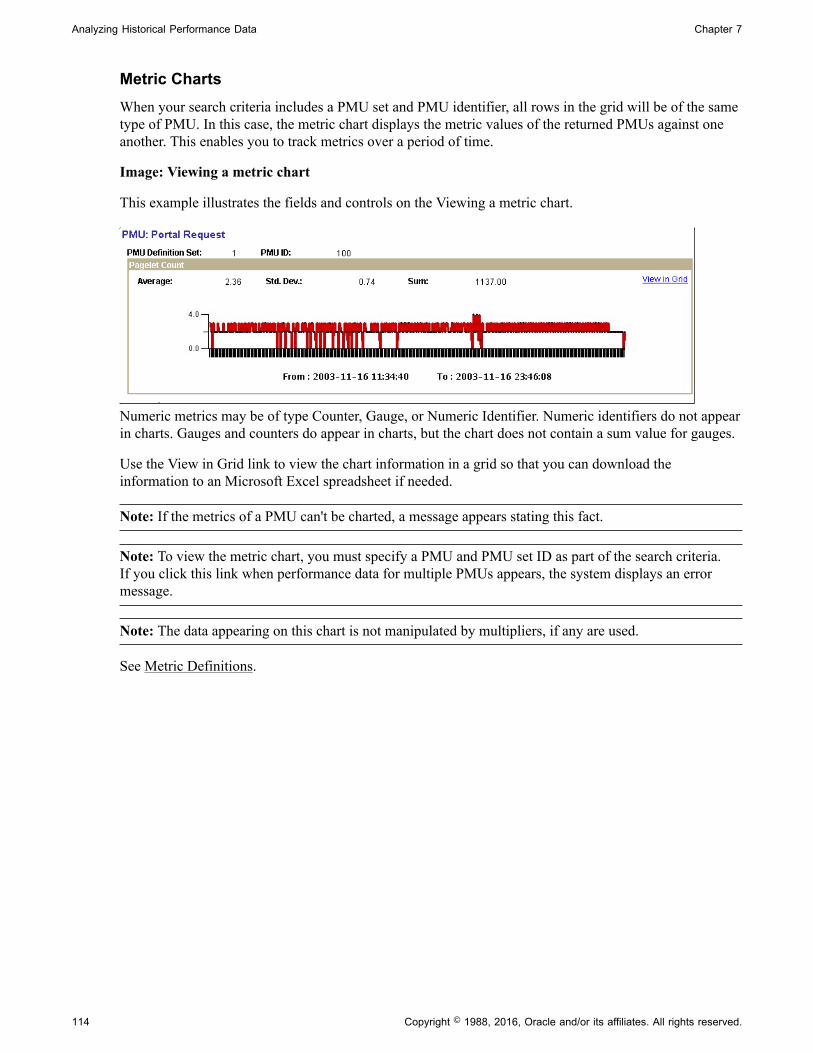
Analyzing Historical Performance Data Chapter 7
114 Copyright © 1988, 2016, Oracle and/or its affiliates. All rights reserved.
Metric ChartsWhen your search criteria includes a PMU set and PMU identifier, all rows in the grid will be of the sametype of PMU. In this case, the metric chart displays the metric values of the returned PMUs against oneanother. This enables you to track metrics over a period of time.
Image: Viewing a metric chart
This example illustrates the fields and controls on the Viewing a metric chart.
Numeric metrics may be of type Counter, Gauge, or Numeric Identifier. Numeric identifiers do not appearin charts. Gauges and counters do appear in charts, but the chart does not contain a sum value for gauges.
Use the View in Grid link to view the chart information in a grid so that you can download theinformation to an Microsoft Excel spreadsheet if needed.
Note: If the metrics of a PMU can't be charted, a message appears stating this fact.
Note: To view the metric chart, you must specify a PMU and PMU set ID as part of the search criteria.If you click this link when performance data for multiple PMUs appears, the system displays an errormessage.
Note: The data appearing on this chart is not manipulated by multipliers, if any are used.
See Metric Definitions.

Chapter 7 Analyzing Historical Performance Data
Copyright © 1988, 2016, Oracle and/or its affiliates. All rights reserved. 115
Duration ChartsThe duration charts show all durations for all PMUs appearing in the grid. The chart is time-based.
Image: Viewing a duration chart
This example illustrates the fields and controls on the Viewing a duration chart. You can find definitionsfor the fields and controls later on this page.
Use the View in Grid link to view the chart information in a grid so that you can download theinformation to an Microsoft Excel spreadsheet if needed.
Note: To view the duration chart, you must specify a PMU and PMU set ID as part of the search criteria.If you click this link when performance data for multiple PMUs appears, the system displays an errormessage.
Completed PMU StatusA completed PMU can be assigned one of the following statuses:
Status Description
Success The PMU finished successfully.
Failed The PMU finished unsuccessfully.
Abort Instrumentation code terminated a PMU due to an unexpectedcondition.
Unknown Assigned in situations when an agent closes a child PMU if thetop-level PMU closes out of sequence.
Timeout Instrumentation code timed out the PMU.
Reaper Timeout Long running PMU closed by the Reaper.
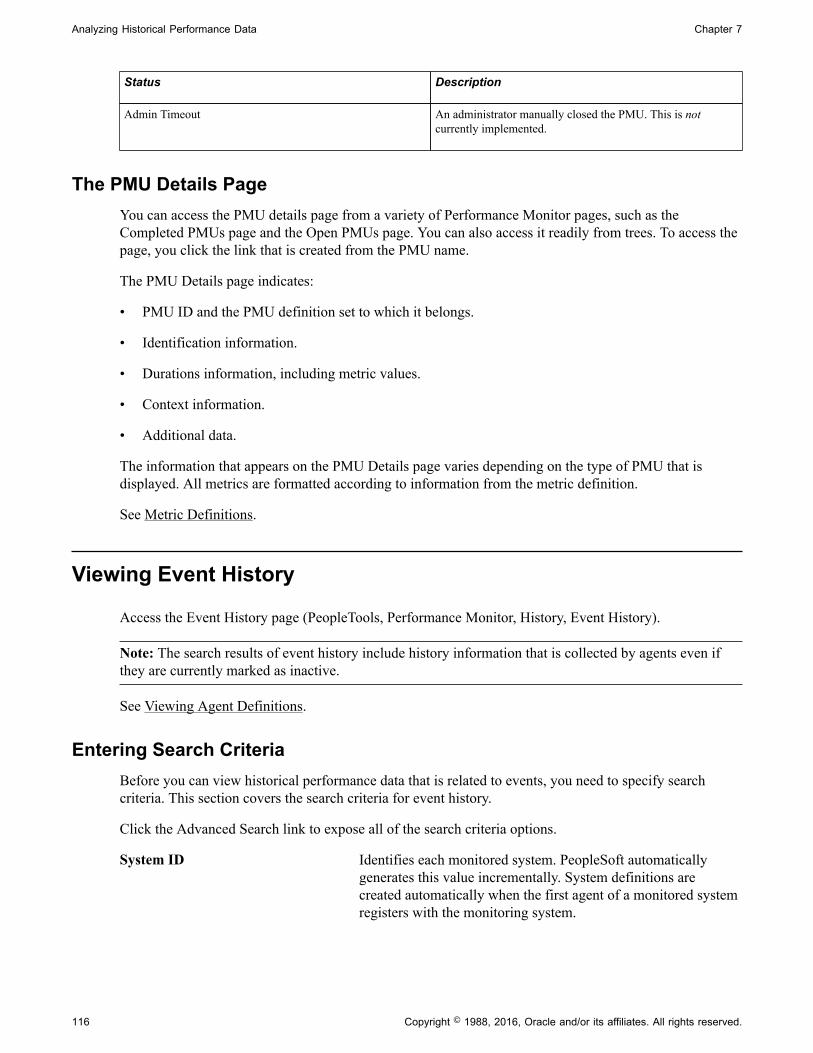
Analyzing Historical Performance Data Chapter 7
116 Copyright © 1988, 2016, Oracle and/or its affiliates. All rights reserved.
Status Description
Admin Timeout An administrator manually closed the PMU. This is notcurrently implemented.
The PMU Details PageYou can access the PMU details page from a variety of Performance Monitor pages, such as theCompleted PMUs page and the Open PMUs page. You can also access it readily from trees. To access thepage, you click the link that is created from the PMU name.
The PMU Details page indicates:
• PMU ID and the PMU definition set to which it belongs.
• Identification information.
• Durations information, including metric values.
• Context information.
• Additional data.
The information that appears on the PMU Details page varies depending on the type of PMU that isdisplayed. All metrics are formatted according to information from the metric definition.
See Metric Definitions.
Viewing Event History
Access the Event History page (PeopleTools, Performance Monitor, History, Event History).
Note: The search results of event history include history information that is collected by agents even ifthey are currently marked as inactive.
See Viewing Agent Definitions.
Entering Search CriteriaBefore you can view historical performance data that is related to events, you need to specify searchcriteria. This section covers the search criteria for event history.
Click the Advanced Search link to expose all of the search criteria options.
System ID Identifies each monitored system. PeopleSoft automaticallygenerates this value incrementally. System definitions arecreated automatically when the first agent of a monitored systemregisters with the monitoring system.
Chapter 7 Analyzing Historical Performance Data
Copyright © 1988, 2016, Oracle and/or its affiliates. All rights reserved. 117
Database Name The name of the PeopleSoft application database running on themonitored system. The monitoring system automatically insertsthis value when it recognizes and creates a monitored system.
Event Definition Set Enter the event definition set to which the event definitionbelongs.
Currently, only one definition set exists, and it is reserved forPeopleSoft development.
Event ID Select a particular event that you want to monitor, such as event300, Host Resource Status.
Process ID Specify the process ID for which you want to locate eventhistory.
From/To Date/Time Specify the range of time during which you want to locate eventhistory.
The system searches the monitor date and time, not agent dateand time.
Domain Host/Port If you want to monitor events on a particular server, select theserver name/IP address and port number on which the domainruns.
Domain Name If you want to monitor events pertaining to a particular domain, select the application server, web server, or Process Schedulerdomain for which you want to view event information.
Agent ID Enter specific agent information if wanted.
Identifies an agent within a domain. This is automaticallygenerated by the monitor the first time an agent registers with it.
Agent Type Specify the type of server process the agent is monitoring, suchas PSAPPSRV, PSQRYSRV, PSQCKSRV, and so on.
Filter Level To view only the information that is returned of a specific filterlevel, select the desired filter level. For example, if you want toview only Error alarms, select Error, and the system returns onlyevent information of type Error.
Each event definition has a filter level that is set to one ofthe following levels: error, warning, standard, verbose, ordebug. Error and warning levels are associated with alarms, while standard, verbose, and debug levels are associated withinformational performance data.
The icon that is associated with each category of filter level (alarm or informational) appears in the grid, enabling you torecognize event information easily.

Analyzing Historical Performance Data Chapter 7
118 Copyright © 1988, 2016, Oracle and/or its affiliates. All rights reserved.
Metric Chart The system creates a metric chart only when you have selected asingle event in the search criteria. The metrics that appear in thecharts vary depending on the event definition.
Search The Search button performs a search based on the search criteriathat is defined on the page. If you want to view the most currentinformation, use theRefresh button after running the initialsearch. If you clickSearch repeatedly, the system returns thesame results from the same time range for each search.
Refresh Updates the value in the To Time field to equal the current timeand performs a search. Enables you to view the most currentresults of a search.
Working with Event History InformationThe Completed Events section contains the results of your event history search.
Note: If a "clone table" warning appears at the top of the page, the archive program is either currentlyrunning or has abnormally terminated. If this is the case, all new incoming information that is being sentto the monitoring system is currently being inserted into the clone tables. New performance data is notinserted into the current data tables until the archive program finishes successfully.
See Scheduling Performance Data Archiving.
SummaryThe Summary tab displays the name of the event as well as the monitor date and time and agent date andtime.
The maximum number of rows that are returned by the search is determined by the Search Row Limit onthe Global Administration page.
See Setting Global System Options.
Event Displays the name of the event reported.
Click the event name to view the Event Details page, whichprovides:
• Identification information to ensure that you can locate theexact source of the event.
• Metric information containing the metrics that are measuredby a particular event and the current assigned values.
• Additional information, depending on the event definition.
Note: The Event Details page displays all metrics accordingto the metric definition.

Chapter 7 Analyzing Historical Performance Data
Copyright © 1988, 2016, Oracle and/or its affiliates. All rights reserved. 119
Monitor Date/Time The date and time that the monitoring system inserted the row ofperformance data into the monitoring database according to thedatabase clock.
Agent Date/Time The date and time according to the agent clock that the domainmonitor used when it last sent performance data to the monitor.
Note: The date and the time appearing on this page alwaysapplies to the system on which the agent runs. Keep this in mindif you are monitoring systems in other time zones.
IdentifiersThe Identifiers tab displays information to help further identify the event and a particular event's origin.
Event Set The event definition set to which the event definition belongs.
Event ID The ID for a particular event definition, such as 300 for HostResource Status.
PID The operating system process ID of the process that generatedthe PMU.
Agent ID The ID of the specific agent sending the event information.
Domain Name The name of the domain in which the agent operates.
Instance The system-generated identifier for a specific row of eventinformation.
Filter Level The filter level that is associated with an event definition.
Description If applicable according to the event definition, a descriptionappears to place the event in context. For example, with theEvent 301 (Tuxedo "pq" Row) the description contains the nameof the server process that is associated with a particular queue, such as PSAPPSRV, JSL, PSSAMSRV, and so on.
The information corresponds to the Additional Data attributethat is part of the event definition. It stores data that exceeds the128–character limitation of Metric 7.
MetricsThe Metrics tab displays the metric values of the event definition for a specific reported event. Onlymetrics that are specified in an event definition contain values. For example, event 300 (Host ResourceStatus) does not assign values to metric 6 or 7; therefore, those metrics appear on the Metrics page as0.0000.
Metric information appears in raw form.
See Metric Definitions.
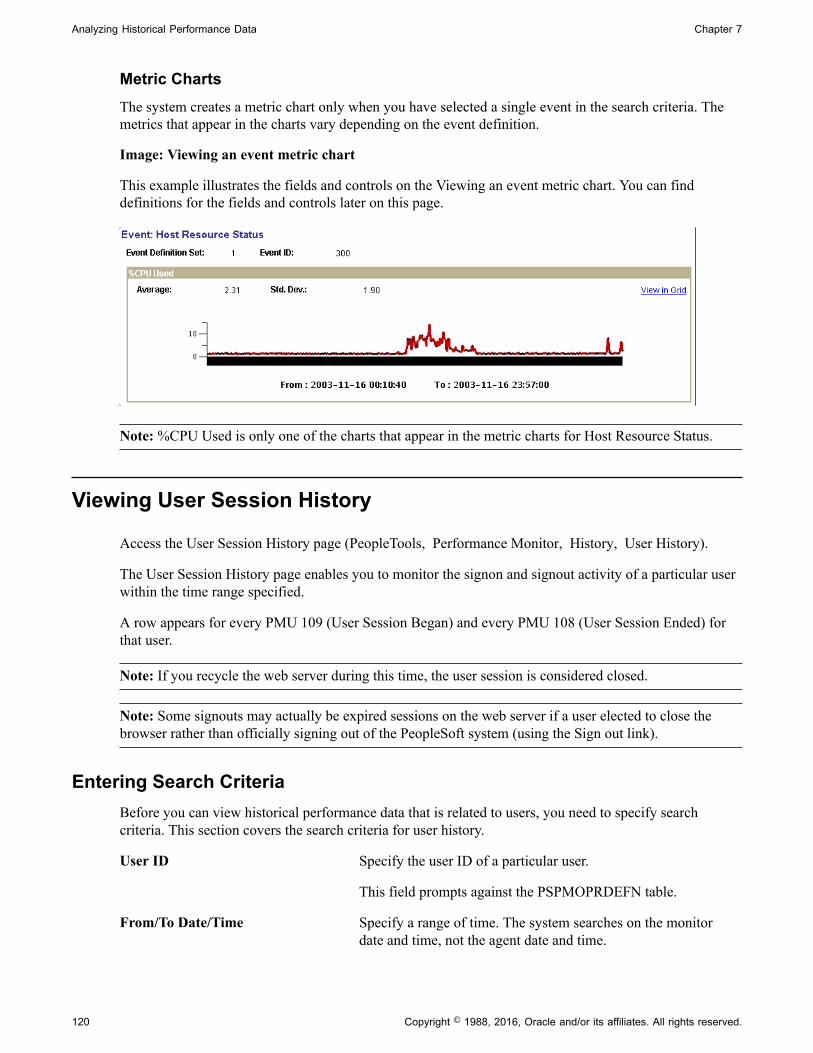
Analyzing Historical Performance Data Chapter 7
120 Copyright © 1988, 2016, Oracle and/or its affiliates. All rights reserved.
Metric ChartsThe system creates a metric chart only when you have selected a single event in the search criteria. Themetrics that appear in the charts vary depending on the event definition.
Image: Viewing an event metric chart
This example illustrates the fields and controls on the Viewing an event metric chart. You can finddefinitions for the fields and controls later on this page.
Note: %CPU Used is only one of the charts that appear in the metric charts for Host Resource Status.
Viewing User Session History
Access the User Session History page (PeopleTools, Performance Monitor, History, User History).
The User Session History page enables you to monitor the signon and signout activity of a particular userwithin the time range specified.
A row appears for every PMU 109 (User Session Began) and every PMU 108 (User Session Ended) forthat user.
Note: If you recycle the web server during this time, the user session is considered closed.
Note: Some signouts may actually be expired sessions on the web server if a user elected to close thebrowser rather than officially signing out of the PeopleSoft system (using the Sign out link).
Entering Search CriteriaBefore you can view historical performance data that is related to users, you need to specify searchcriteria. This section covers the search criteria for user history.
User ID Specify the user ID of a particular user.
This field prompts against the PSPMOPRDEFN table.
From/To Date/Time Specify a range of time. The system searches on the monitordate and time, not the agent date and time.
Chapter 7 Analyzing Historical Performance Data
Copyright © 1988, 2016, Oracle and/or its affiliates. All rights reserved. 121
Search The Search button performs a search based on the search criteriathat is defined on the page. If you want to view the most currentinformation, use theRefresh button after running the initialsearch. If you clickSearch repeatedly, the system returns thesame results from the same time range for each search.
Refresh Updates the value in the To Time field to equal the current timeand performs a search. Enables you to view the most currentresults of a search.
Working with User History InformationThe following information appears at the bottom of the User History page after you have completed asearch.
ActivityThe activity tab presents the following information.
User ID Identifies a particular user.
User Activity Shows the signon and signoff activity of the user within therange of time that is specified in the search criteria.
Session The session ID on the web server.
This value is derived from context 1 from PMU 108 (UserSession Ended) and PMU 109 (User Session Began).
Monitor Received Date/Time Indicates when the monitor system received notification that aPMU had been started or updated
DetailsThe Details tab presents the following additional information.
IP Address The IP address of the computer from which the user accessedthe PeopleSoft system.
User Agent The Mozilla user-agent string specification for the user'sbrowser.
This value is derived from metric 7 of PMU 116 (Redirect afterLogin).
Latency The duration of PMU 116 (Redirect After Login). The latencyvalue enables you to infer the network latency for a userconnection.
Note: The values in both the User Agent andLatency fields appear only in the rows reflecting logged onuser activity.
Analyzing Historical Performance Data Chapter 7
122 Copyright © 1988, 2016, Oracle and/or its affiliates. All rights reserved.
Viewing Concurrent Signon Information
This section provides an overview and discusses:
• Maintaining chart data.
• Viewing the concurrent signon chart.
Understanding Concurrent Signon InformationIn some situations, it is necessary to be able to track and monitor the number of users that sign on tothe system concurrently. For example, if your site has implemented a cost-per-user access agreement,system administrators need a method to determine usage, and to ensure compliance with any service-levelagreements. The Performance Monitor enables you to capture and store concurrent user information anddisplay a graphical view of the number of users signed on to your system at a given time. The concurrentsignon information is extracted from existing Performance Monitor user signon information, summarized,and stored separately for concurrent signon monitoring.
Maintaining Chart DataAccess the Maintain Chart Data page (PeopleTools, Performance Monitor, History Concurrent SignonChart, Maintain Chart Data).
The Maintain Chart Data enables you to set the criteria by which you purge and extract the concurrentsignon user data. Once your criteria has been set, click Run to launch the PSPMCSOSUM ApplicationEngine program, which extracts summary information for PMU 108 (user session ended) and PMU 109(user session began) from Performance Monitor PMU tables.

Chapter 7 Analyzing Historical Performance Data
Copyright © 1988, 2016, Oracle and/or its affiliates. All rights reserved. 123
Note: When the PSPMCSOSUM Application Engine program runs, it does not manipulate or alterexisting data for PMU 108 and PMU 109. It extracts the previously stored PMU 108 and PMU 109 datarequired by concurrent signon monitoring and inserts the data into tables used by concurrent signonmonitoring. When you purge concurrent signon information, you do not delete stored PMU data—onlythe summary data stored for concurrent signon monitoring is purged.
Image: Maintain Chart Data page
This example illustrates the fields and controls on the Maintain Chart Data page. You can find definitionsfor the fields and controls later on this page.
Run Control ID Because this page should only have limited access, the runcontrol is not saved by user ID. A universal run control, Chart_Data_Process, exists for the PSPMCSOSUM ApplicationEngine program.
Chart Data Exists Up To Displays how current the signon data is. This the last time thePSPMCSOSUM Application Engine program ran.

Analyzing Historical Performance Data Chapter 7
124 Copyright © 1988, 2016, Oracle and/or its affiliates. All rights reserved.
Oldest Date Displays the oldest date of stored signon summary data.
Total Instances Displays the number of rows of extracted PMU summaryinformation stored in the concurrent signon tables.
Purge Instances Older Than To reduce the number of rows of stored PMU summaryinformation, specify the date of the older rows that are no longerneeded.
Chart Begin Date Displays the date of the oldest rows being stored for theconcurrent signon chart.
Chart Instances Shows the number of rows of signon data being stored fordisplaying the concurrent signon chart.
Purge Instances Older Than To reduce the number of rows of chart data, specify the date ofthe older rows that are no longer needed.
Instances To Purge After specifying the chart data purge date, Instances to Purgedisplays the number of rows that will be deleted, showing thespace you will reclaim.
Bypass Chart Data Extract Select if you only need to run the purge functions of thePSPMCSOSUM Application Engine program. In this case, only the specified information will be purged, and no newinformation will be added to the chart data.
Bring Chart Up To Date (Default) Extracts all concurrent signon information to updatethe chart data.
Rebuild Chart Data Starting Select to build the chart using data starting after the date youspecify.
Exempt OPRID's To make specific user IDs exempt from appearing in chart data, add those IDs to this grid. For example, exempt IDs mightinclude those used by administrators or consultants, not actuallypart of the user base or the service contract.
Exempt IP Addresses To make logins from specific workstations exempt fromappearing in chart data, add either the IP address or theworkstation name to this grid.
Viewing The Concurrent Signon ChartAccess the Concurrent Signon Chart page (PeopleTools, Performance Monitor, History ConcurrentSignon Chart, Maintain Chart Data).

Chapter 7 Analyzing Historical Performance Data
Copyright © 1988, 2016, Oracle and/or its affiliates. All rights reserved. 125
Use this page to filter and view the concurrent signon chart.
Image: Concurrent Signon Chart page
This example illustrates the fields and controls on the Concurrent Signon Chart page. You can finddefinitions for the fields and controls later on this page.
If you are not updating the existing chart table (PSPMCSO_CHART) and changing the parametersof AE program through concurrent signon page, then truncate PS_PSPMCSOAETEMP andPSPMCSO_CHART table before re-running the AE for correct results.
Minimum Concurrent Users Specify the minimum amount of concurrent users to track. Anyrecord of current usage below this limit will not be included inthe chart content.
Show Only Duplicate OPRID's Disables the Minimum Concurrent Users field and overrides itssetting to 2. The chart content will be refreshed with only thoseinstances where the same user ID was signed on to the systemmore than once in the given hour.
Maximum Instances to Display Use this setting to control how much information to display onthe chart at a time. When viewing a chart with 100 instances (rows of data), details can become obscured, and the drill downcapability becomes less effective. The chart can display amaximum of 999 bars.
Refresh To End Date Specify a particular date to position the chart so the very lastdata point for that day will be the last bar of the graph. This
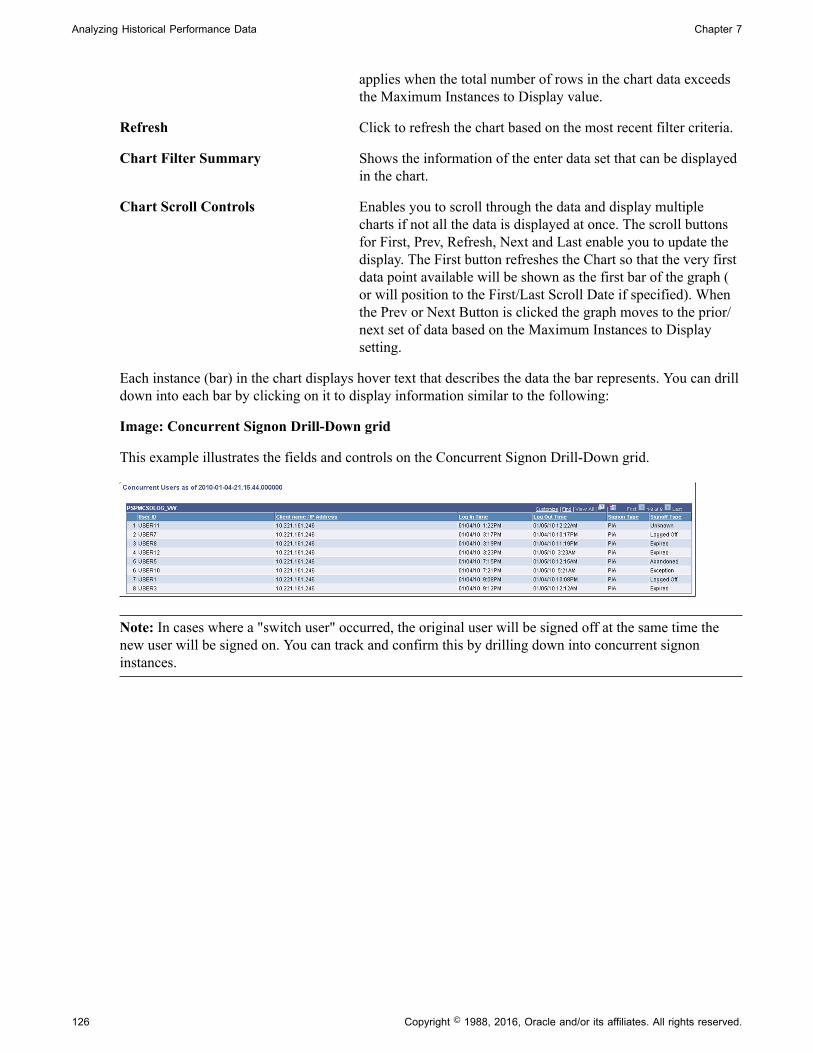
Analyzing Historical Performance Data Chapter 7
126 Copyright © 1988, 2016, Oracle and/or its affiliates. All rights reserved.
applies when the total number of rows in the chart data exceedsthe Maximum Instances to Display value.
Refresh Click to refresh the chart based on the most recent filter criteria.
Chart Filter Summary Shows the information of the enter data set that can be displayedin the chart.
Chart Scroll Controls Enables you to scroll through the data and display multiplecharts if not all the data is displayed at once. The scroll buttonsfor First, Prev, Refresh, Next and Last enable you to update thedisplay. The First button refreshes the Chart so that the very firstdata point available will be shown as the first bar of the graph (or will position to the First/Last Scroll Date if specified). Whenthe Prev or Next Button is clicked the graph moves to the prior/next set of data based on the Maximum Instances to Displaysetting.
Each instance (bar) in the chart displays hover text that describes the data the bar represents. You can drilldown into each bar by clicking on it to display information similar to the following:
Image: Concurrent Signon Drill-Down grid
This example illustrates the fields and controls on the Concurrent Signon Drill-Down grid.
Note: In cases where a "switch user" occurred, the original user will be signed off at the same time thenew user will be signed on. You can track and confirm this by drilling down into concurrent signoninstances.
Copyright © 1988, 2016, Oracle and/or its affiliates. All rights reserved. 127
Chapter 8
Working with Performance Monitor Chartsand Analytics
Performance Monitor Charts and Analytics
This section contains an overview of Performance Monitor charts and analytics, list common elements,and lists the pages used to view user request analytics.
Understanding Performance Monitor Charts and AnalyticsPerformance Monitor charts enable you to view charts and graphs that help you analyze and communicateperformance information.
This information is derived from completed PMU data that is stored in the historic performance datatables.
Note: This interface is not designed to assist you in diagnosing real-time, current user issues, such as astalled user request.
Note: The Standard Deviation (Std. Dev.) is provided on many pages. The standard deviation is astatistic that tells you how tightly all the values that are used to compute the average are clustered aroundthe average. Large standard deviations warn that the averages appearing in the chart are not a reliableindicator of response times experienced by individual users.
Common Elements Used in Performance Monitor Charts and AnalyticsChart Legends Many of the charts use color to differentiate performance data.
Always use the labels and the legend to make sure that youinterpret the charts correctly.
View in Grid Enables you to view chart information in a grid format forsorting and downloading to Microsoft Excel.
Viewing User Request Analytics
Access the User Requests page (PeopleTools, Performance Monitor, Analytics, User Requests).
This page shows top-level, completed PMUs that were initiated by a specific user ID. A top-level PMU isa PMU with no parent PMU. Auser request is a set of PMUs that together make up a complete request tothe monitored system.

Working with Performance Monitor Charts and Analytics Chapter 8
128 Copyright © 1988, 2016, Oracle and/or its affiliates. All rights reserved.
Note: All rows in the User Request chart appear in ascending order by agent start date and time. Read thechart from the bottom to the top. If the date is the same between two adjacent rows, the system hides thedate and shows only the time. If two rows have identical dates and times, the system adds a number (#x)to the label to differentiate the two bars. The charting tool requires the labels of the bars to be distinct.
You must enter either the user ID or the performance trace name as part of the search criteria.
System ID Identifies each monitored system. System definitions are createdautomatically when the first agent of a monitored systemregisters with the monitoring system.
Database Name The name of the PeopleSoft application database running on themonitored system. The monitoring system automatically insertsthis value when it recognizes and creates a monitored system.
User ID The user ID of the user who generated the request.
The User ID field prompts against the PSPMOPRDEFN table, which is populated by the lookup program (PSPM_LOOKUP). When searching on a user ID, generally, the system attemptsto match a value that is stored in the OPRID (user ID) fieldof the PMU history table. However, because some top-levelPMUs have "_unknown_" as the OPRID, the system attempts asecond match. If the top-level PMU contains "_unknown_" asthe OPRID, the system searches for a PMU 113 (Authenticate)in the same PMU set (same top instance ID) where PMU 113contains the given user in the OPRID field.
Performance Trace Name You enter the performance trace name to search on PMUswithin a particular performance trace. If a user has launcheda performance trace in the Performance Console, the systemlabels every PMU that is generated in a business process with aperformance trace name.
Performance Trace Name prompts against thePSPMPERFTRACE table, which is populated by the lookupprogram (PSPM_LOOKUP).
Note: When searching using a performance trace name, thesearch ignores all agent IDs, so the current system ID is notrelevant.
From/To Date/Time Specify a range of time. The system searches on the monitordate and time, not the agent date and time. If you do not specifya time range, by default, the system displays information for thecurrent day, starting at midnight (12:00 AM).
Static Scale Enables you to choose the scale of the X-axis in the UserRequests chart that is generated from the search results. Thesearch results appear in result sets, which are groups of 10. Select this option to view a static scale.

Chapter 8 Working with Performance Monitor Charts and Analytics
Copyright © 1988, 2016, Oracle and/or its affiliates. All rights reserved. 129
Note: After you select this option, you can't clear Static Scaleuntil you refresh the page from the browser or reenter the page.
The system behavior for each type of scale is:
• Dynamic scale.
The system scales the X-axis according to the longestduration in the current result set.
• Static scale.
A static scale displays the same scale for the X-axis acrossall of the result sets. A static scale is based on the largestduration, or bar, that exists among all of the result sets.
Search The Search button performs a search based on the search criteriathat is defined on the page. If you want to view the most currentinformation, use theRefresh button after running the initialsearch. If you clickSearch repeatedly, the system returns thesame results from the same time range for each search.
Refresh Updates the To Time value to equal the current time beforeperforming a search. This enables you to view the most currentresults of a search.
The User Requests ChartThe User Requests chart reveals the time that a user initiated a specific request and its duration. Thesystem displays user requests in sets of 10.

Working with Performance Monitor Charts and Analytics Chapter 8
130 Copyright © 1988, 2016, Oracle and/or its affiliates. All rights reserved.
A single user request is represented by a bar within the bar chart. You can click any bar in the graph toview the associated User Request Detail component, which enables you to drill down into the details of auser request.
Image: User Requests chart
This example illustrates the fields and controls on the User Requests chart.
On this chart, the View in Grid hyperlink displays the chart information in a grid for downloading andcustomized sorting. The grid contains a hyperlink that accesses the User Request Details page.
The rows on the chart contain pop-up messages that appear when you move the cursor over the bar. Themessages are:
• For PMU 100 (Portal Request), the message reads Portal: [action] Duration (secs): yyy.
• For PMU 101 (PIA Request), the message reads PIA: [action] Duration (secs): yyy.
• For PMU 102 (Compression Request), the message reads Compression Request: [content type]Duration (secs): yyy.
• All other PMUs show the PMU label followed by the duration.
See User Request Details.
The Request Time vs. Think Time ChartThe Request Time vs. Think Time pie chart reveals the ratio of the amount of time that is required for thesystem to process the requests in the result set against the amount of network latency and user think time.This measurement is based on the time range that you entered in the search criteria.
This chart illustrates the impact that response time has on the productivity of users in the monitoredsystem.

Chapter 8 Working with Performance Monitor Charts and Analytics
Copyright © 1988, 2016, Oracle and/or its affiliates. All rights reserved. 131
User Request DetailsThe User Request Detail page appears only after you click a bar in the User Requests chart on the UserRequests page. No PeopleSoft portal navigation exists for this page.
User requests are the set of PMUs that together make up a complete server round trip. All of the PMUs ina user request have the same top instance ID.
This page displays additional information for every user request that appears within the User Requestschart.
Duration The duration of the top-level PMU instance for the current userrequest.
Agent Start Date/Time The date and time that the top-level PMU began according tothe clock on the monitored system.
Monitor Received Date/Time The date and time that the monitoring system insertedperformance information related the top-level PMU into themonitoring database.
PMU Details This link accesses the completed PMU component where thesystem automatically loads all the PMUs with the same topPMU instance into this grid.
Application Server TotalsApplication Server Time The total time spent in the application server.
Serialization Time The time spent serializing data.
Deserializtaion Time The time spent deserializing data.
Total Cache Misses The total number of application server cache misses for thisuser request. Cache misses occur when the system must retrievemetadata from the database as opposed to the application servercache. This value is the sum of metric 1 from all PMU 412 (Tuxedo Service Summary PMU) rows with the same top PMUinstance.
Note: Continued high cache misses or file hits indicate cacheproblems that should be investigated.
Total Cache File Hits The total number of application server cache memory hits forthis user request. Cache memory hits occur when the systemretrieves metadata from the application server cache file. It isthe sum of metric 2 from all Tuxedo Service Summary PMU412 (Tuxedo Service Summary) rows with the same top PMUinstance.
SQL Total Time The total time that is spent processing SQL for this user request.
SQL Exec Count The total number of SQL statements that were run in this userrequest. This value is the sum of metric 6 from all PMU 400 (

Working with Performance Monitor Charts and Analytics Chapter 8
132 Copyright © 1988, 2016, Oracle and/or its affiliates. All rights reserved.
Tuxedo Service PCode and SQL PMU) rows with the same topPMU instance.
SQL Fetch Count The total number of SQL fetches that were run in this userrequest. This value is the sum of metric 5 from all PMU 400 (Tuxedo Service PCode and SQL PMU) rows with the same topPMU instance.
Global Variable Size The amount of memory that is used to store PeopleCode globalvariables. This is the sum of metric 6 from all the PMU 412(Tuxedo Service Summary) rows with the same top PMUinstance.
The greater the amount of data and memory that is required forglobal variables, the greater the overhead that is associated witha request.
Total Cache Memory Hits The metric that is associated with the PMU 412 (Tuxedo ServiceSummary). Cache memory hits occur when the system retrievesmetadata from the application server memory, not the cache fileor the database.
Component PMUsThis section displays these PMUs that are associated with a user request:
• PMU 401 (ICPanel): The ICPanel request.
Clicking the ICPanel link launches a new browser window, which contains the component statisticsfor that component default from midnight to the current time.
• PMU 402 (Modal Level 1): The first modal level if one exists.
The first modal level is triggered by think-time PeopleCode, such as DoModal, DoCancel, and so on.
• PMU 403 (Modal Level 2): The second modal level if one exists.
The second modal level contains the modal components that are called from the first modal level,such as secondary pages or lookup pages.
PMU The PMU label that is defined in the PMU definition.
Click this link to go to the Component Statistics page forthe current component so that you can compare historicalperformance data for that component.
Name The name of the component containing the page that is runningthe request.
Page The name of the page running the request.
Action The component action string, passed from the web server to theapplication server, such as Save, Search, and so on.

Chapter 8 Working with Performance Monitor Charts and Analytics
Copyright © 1988, 2016, Oracle and/or its affiliates. All rights reserved. 133
Duration Duration of the PMU on that line in the grid.
Component Buffer Size The component buffer size metric in PMU 401 (ICPanel), 402 (Modal Level 1), and 403 (Modal Level 2).
The component buffer must be deserialized by the applicationserver when it is received from the web server, and thenserialized when it is sent back to the web server. The larger thebuffer, the greater the impact is of serialization overhead on themonitored system.
Queries and ScriptsThis section displays the metrics of these PMUs that are associated with the user request:
• PMU 410 (ICScript): metrics that are related to invoking an ICScript.
• PMU 411 (ICQuery): metrics that are related to invoking an ICQuery.
PMU The type of PMU: ICScript or ICQuery.
Name Name of the ICScript or ICQuery.
Action The action string, passed from the web server to the applicationserver.
Duration The duration of the ICScript or ICQuery.
Tuxedo Service InformationThis section displays the metrics of all PMU 400s (Tuxedo Service PCode and SQL) that are associatedwith the current user request.
Duration Duration of PMU 400 (Tuxedo Service PCode and SQL).
Tuxedo Service Name The name of the Tuxedo service that was run.
Server Name The name of the server process on the application server that isrunning the request.
Host/Port The name of the server and the JSL port.
User Request DurationsThe User Request Durations summarizes how time was spent servicing the user request. For example, itmight show that the most time was spent in SQL.
Portal Time The total time that was spent in the portal servlet for thisrequest, including waits for calls to other servers. The sumof the duration of the PMU 100s (Portal Request) that areassociated with the request.
PIA Time The total time that was spent in the PIA servlet. It is a subset ofthe portal time if the PIA request originated from Portal. The
Working with Performance Monitor Charts and Analytics Chapter 8
134 Copyright © 1988, 2016, Oracle and/or its affiliates. All rights reserved.
sum of the duration of the PMU 100s (Portal Request) and PMU106s (PIA Request From Portal) that are associated with therequest.
Tuxedo Service Time The total time that was spent in the application server. It is asubset of the PIA time for a PIA request. A large differencebetween the duration of the PIA bar and the Tuxedo barindicates that the request spent time on the web server or wasqueued by Tuxedo. The value is equal to the sum of the durationof the PMU 400 (Tuxedo Service PCode and SQL) rows.
PeopleCode Exec Time The total time that was spent by the application server runningPeopleCode, including any SQL that was triggered from withinthe PeopleCode. It is a subset of the Tuxedo Service Time. Thevalue is equal to the sum of metric 1 of the PMU 400 (TuxedoService PCode and SQL) rows that are associated with therequest.
PeopleCode SQL Time This is the total time that was spent by the application serverrunning SQLExecs and SQL objects that were triggered fromwithin the PeopleCode. It is a subset of the PeopleCode ExecTime. The value is equal to the sum of metric 2 of the PMU 400(Tuxedo Service PCode and SQL) rows that are associated withthe requests.
PeopleCode Built-in SQL Time This is the total time that was spent by the application serverrunning SQL that was triggered from within PeopleCode built-in functions such as GetNextNumber(). It is a subset of thePeopleCode Exec Time. The value is equal to the sum of metric3 of the PMU 400s (Tuxedo Service PCode and SQL) that areassociated with the requests.
PeopleTools SQL Exec Time This is the total time that was spent by the application serverrunning SQL that was triggered by the PeopleTools runtime. Itis a subset of the Tuxedo Service Time. It may overlap with thePeopleCode Exec time. The value is equal to the sum of metric4 of the PMU 400 (Tuxedo Service PCode and SQL) rows thatare associated with the requests.
Note: The number of bars appearing in the graph vary per request type.
PeopleCode DurationsThis chart is a summary showing which PeopleCode event types (such as SavePreChange,SavePostChange) were triggered for this user request, how many times each type was triggered, and howmuch time was spent in running PeopleCode for each event type.
The PeopleCode Durations chart contains data only if a user accessed a component or ran an iScript whilethe filter level was set at verbose. The data is derived from PMUs 500–516.
These PMUs contain metrics for the cumulative execution count and execution time at the record field,component record, page, and component-level for each PeopleCode event type.
Chapter 8 Working with Performance Monitor Charts and Analytics
Copyright © 1988, 2016, Oracle and/or its affiliates. All rights reserved. 135
The number of times that a particular PMU ran appears in parenthesis.
All charts have a View in Grid hyperlink to show the chart information in a grid. This enables you to sortthe information and download the information to Excel spreadsheets.
Viewing Component Trace Information
Access the Component Trace page (PeopleTools, Performance Monitor, Analytics, Component Trace).
To view the Component Trace page, a user must have completed a performance trace. This page enablesyou to isolate the component performance information within a particular performance trace. Theinformation presented appliesonly to component processing.
Note: To gain the most performance data and a clearer insight into component activity, you should run theperformance trace that is generating the trace information in debug or verbose mode.
Performance Trace Name Displays the name of the trace, which is typically the end user'suser ID, but can be whatever name was entered by the end userin the Performance Trace Name edit box on the PerformanceTrace Console.
Monitor Start Date and Time Displays the date and time that the monitor began receivingperformance information for a particular performance trace.
First Component Identifies the first component that is accessed during theperformance trace.
Component Cache Status Enables you to determine whether the objects that are associatedwith a component were accessed from the application servercache or retrieved from the database during the performancetrace.
Server Round Trips Displays the number of server round trips that are related tocomponent processing that were completed during a particularperformance trace.
SQL Executes Displays the number of SQL programs that were run duringcomponent processing.
SQL Fetches Displays the number of SQL fetches that were run duringcomponent processing.
PeopleCode Program Executions Displays the number of PeopleCode programs that were runduring component processing.
Email XML File Enables you to email the data from the Component Trace pagein an XML format so that you can share the information withcolleagues or PeopleSoft consultants.
Working with Performance Monitor Charts and Analytics Chapter 8
136 Copyright © 1988, 2016, Oracle and/or its affiliates. All rights reserved.
WarningsThe Warnings section contains any warnings that may alert you to situations in the trace that may causediscrepancies in or misunderstandings of the trace results. For example, if particular component objectswere not fully cached at the time of the trace, a warning appears notifying you of this. Production systemsusually cache all frequently accessed objects for better performance. Objects that are not cached can skewresults because after an object is fully cached, performance when accessing that object typically increasesdramatically. The Description column provides details of the warning and provides considerations orremedies where appropriate.
A warning message appears if the performance trace is not run in debug mode.
Duration SummaryYou see a duration summary if the user ran the performance trace with standard or higher filter level.
The Duration section contains information regarding the duration of the entire performance trace as wellas other elements of the performance trace, such as the time spent processing SQL and the time spentprocessing PeopleCode. For example, the duration information may show that the time for the total tracewas 50 seconds, and 22 seconds were spent processing SQL while 15 seconds were spent processingPeopleCode.
Note: The duration total is not a sum of the measurements appearing here. The PeopleSoft system doesnot instrument every aspect of the runtime, and these areas that are not instrumented account for thedifference between the total duration and the total of the measurements that are displayed here.
Measurement Displays the measurement appearing in the row, such as SQL, PeopleCode, or Total Trace.
Duration Displays the total time that was consumed by each element ofa performance trace. For example, it may show the total traceconsuming 50 seconds and 22 seconds were attributed to SQL.
% of Total Displays the percentage of the total trace value that eachelement of the trace consumed. For example, if the total tracevalue is 50 seconds and the SQL value is 22 seconds, the % oftotal value is 44.
Server Round TripsThe Server Round Trip section contains information for each server round trip that was completed duringa particular performance trace. It contains two tabs: Durations and PeopleTools State Management.
You see a duration summary if the user ran the performance trace with standard or higher agent filterlevel.
The Durations tab contains the following information:
Seq (Sequence) Displays the sequential order in which the server roundtrips were run, with 1 indicating the first round trip of theperformance trace.

Chapter 8 Working with Performance Monitor Charts and Analytics
Copyright © 1988, 2016, Oracle and/or its affiliates. All rights reserved. 137
Action Displays the action that was completed during the server roundtrip, such as Load Page/Search Page, Load Search Result, ClickPeopleCode Command Button for field FUNCLIB <table.field>.
This column is a hyperlink that launches the Round Trip Detailspage.
Component Displays the component from which the user invoked the action.
Page Displays the page within the component from which the userinvoked the action.
Duration Displays the amount of time that each action, or server roundtrip, consumed.
% of Total Trace Displays the percentage of the total performance trace durationthat each server round trip consumed. For example, if the totaltrace value is 50 seconds and a particular action consumes 3.5seconds, the % of total trace is 7.
The PeopleTools State Management tab contains the following additional information:
Pack/Unpack Time Reflects the time that was required for serialization (pack) anddeserialization (unpack). The value is derived as follows:
PMU 427 + 428 duration - (time spent performing SQL in 427and 428)
The value reflects the serialization duration plus thedeserialization duration minus any time spent performing SQLas part of serialization and deserialization.
Component Buffer Size The component buffer size, metric 1, in PMU 401 (ICPanel). The component buffer has to be deserialized by the applicationserver when it is received from the web server, and thenserialized when it is sent back to the web server.
The larger the buffer, the greater is the impact of serializationoverhead on the monitored system.
PeopleCode Global Size This is the size of the memory that is used for PeopleCodeglobal variables, which are sent to and from the applicationserver during a Jolt request. This is included in the send buffersize and receive buffer size.
This is metric 5 for all PMU 412 (Tuxedo Service Summary)rows.
SQL SummaryThe SQL Summary section contains additional details regarding the SQL activity during componentprocessing. It contains two tabs: SQL Executes and SQL Fetches.
You see a SQL summary if the user ran the performance trace with verbose or higher agent filter level.

Working with Performance Monitor Charts and Analytics Chapter 8
138 Copyright © 1988, 2016, Oracle and/or its affiliates. All rights reserved.
The SQL Executes tab contains the following information:
Seq (Sequence) The system orders the rows by total duration. The sequence inthis case is a ranking of total duration.
SQL Operation and Tables Displays the SQL operation and tables (such as UPDATE PS_QUERY_RUN_QRYVW).
SQL Type Reflects the type of source code making the SQL call. The SQLtypes are:
• PeopleTools (PMU 408).
• Inline PeopleCode (PMU 406).
• PeopleCode Built-In (PMU 407).
Execution Count Displays the number of times that the SQL was run during theperformance trace.
Total Duration The total time required by all executions.
Total Duration Average The average execution duration, as in Total Duration / ExecutionCount.
The SQL Fetches tab contains the following additional information for each SQL statement that was run:
Fetch Count The total count of all SQL fetches that were run duringcomponent processing within a particular performance trace.
Fetch Count Average The average number of fetches per SQL Execute.
Fetch Duration The sum total of all durations for SQL fetches.
Fetch Duration Average The system average for SQL fetch durations during componentprocessing.
PeopleCode SummaryThe PeopleCode Summary section contains additional details regarding the PeopleCode activity duringcomponent processing. These values relate to PMU 404 (PeopleCode Program Execution).
You see a PeopleCode summary only if the user ran the performance trace in debug mode.
The following metrics apply only to the performance information that was collected during theperformance trace.
Seq (Sequence) The system orders the rows by .
PeopleCode Program Displays the name of the PeopleCode program that was run.
Execution Count Displays the number of times this program has been run.
Duration Total Displays the sum of all durations of the PeopleCode program.
Duration Average Displays the average duration of the PeopleCode program.

Chapter 8 Working with Performance Monitor Charts and Analytics
Copyright © 1988, 2016, Oracle and/or its affiliates. All rights reserved. 139
Duration Maximum Displays the longest duration of this PeopleCode program.
Duration Minimum Displays the shortest duration of this PeopleCode program.
Round Trip DetailsThe Round Trip Details page contains a subset of the performance data that appears on the ComponentTrace page. It enables you to drill down into a specific round trip to gather duration, SQL, andPeopleCode information. The data that is presented in the page is similar to the data in the PerformanceTrace page. The PMU Details link accesses the completed PMU page with all PMUs that were captured inthis action.
Viewing Component Statistics
Access the Component Statistics page (PeopleTools, Performance Monitor, Analytics, ComponentStatistics).
The Component Statistics page enables you to gather performance information that is related to a specificPeopleSoft component.
System ID Identifies each monitored system. PeopleSoft automaticallygenerates this value incrementally. System definitions arecreated automatically when the first agent of a monitored systemregisters with the monitoring system.
Database Name The name of the PeopleSoft application database that is runningon the monitored system. The monitoring system automaticallyinserts this value when it recognizes and creates a monitoredsystem.
User ID The user ID of the user who generated the request.
The user ID field prompts against the PSPMOPRDEFN table, which is populated by the Lookup program (PSPM_LOOKUP).
Performance Trace Name You enter the performance trace name to search on PMUswithin a particular performance trace. If a user has launcheda performance trace in the Performance Console, the systemlabels every PMU that is generated in a business process with aperformance trace name.
Performance Trace Name prompts against thePSPMPERFTRACE table, which is populated by the Lookupprogram (PSPM_LOOKUP).
Note: When searching using a performance trace name, thesearch ignores all agent IDs, so the current system ID is notrelevant.
From/To Date/Time Specify a range of time. The system searches on the monitordate and time, not the agent date and time. If you do not specify
Working with Performance Monitor Charts and Analytics Chapter 8
140 Copyright © 1988, 2016, Oracle and/or its affiliates. All rights reserved.
a time range, by default, the system displays information for thecurrent day, starting at midnight (12:00 AM).
Component Select the component name.
Market Select the market to which the component belongs.
Search The Search button performs a search based on the search criteriathat is defined on the page. It should be pressed only onceper search. If you want to view the most current information, use theRefresh button after running the initial search. If youclickSearch repeatedly, the system returns the same results fromthe same time range for each search.
Refresh Updates the To Time value to equal the current time. Thisenables you to view the most current results of a search.
Component Execution Count The number of times that a component was accessed within thespecified time period.
This value is calculated by selecting the count of PMU 400 (Tuxedo Service PCode and SQL) rows that were found with thecurrent search results.
Component AveragesThe Component Averages section displays the average and standard deviation of the following metrics.
Duration The average duration of the PMU 400 (Tuxedo Service PCodeand SQL) rows that were run from this component.
SQL Fetch Count The average number of SQL fetches that were run for thiscomponent.
The value is the average of metric 5 from all PMU 400 (TuxedoService PCode and SQL) rows with Context 1 equal to thiscomponent's name.
SQL Execute Count The average number of SQL statements that were run for thiscomponent. The average of metric 6 from all PMU 400 (TuxedoService PCode and SQL) rows with Context 1 equal to thiscomponent's name.
Component SizesThe Component Sizes chart displays the average and standard deviation of the component buffer sizes.
Receive Buffer Size The average size of the data that the application server receivedfrom the web server during a JOLT request.
This is metric 2 for PMU 115 (JOLT Request).
Send Buffer Size Size of the data that was sent from the web server to theapplication server during a JOLT request.
Chapter 8 Working with Performance Monitor Charts and Analytics
Copyright © 1988, 2016, Oracle and/or its affiliates. All rights reserved. 141
This is metric 1 for PMU 115 (JOLT Request).
Component Buffer Size This is the average component buffer size (metric 1) in PMU401 (ICPanel).
The component buffer has to be deserialized by the applicationserver when it is received from the web server, and thenserialized when it is sent back to the web server.
PeopleCode Global Size This is the average size of the memory that is used forPeopleCode global variables, which are sent to and from theapplication server during a JOLT request. This is included in thesend buffer size and receive buffer size.
This is metric 6 for all PMU 412 (Tuxedo Service Summary)rows.
Component DurationsThis chart shows the average and the standard deviation of these metrics:
Portal Time The average time that was spent in the portal servlet for thiscomponent, including waits for calls to other servers. The valueis the duration of the PMU 100 (Portal Request) rows that areassociated with requests that are accessing this component.
PIA Time The average time that was spent in the PIA servlet for thiscomponent. The value is the duration of the PMU 100 (PortalRequest) rows and PMU 106 (PIA Request From Portal) rowsthat are associated with the request accessing this component.
Tuxedo Service Time The average time that was spent in the application server forthis component. The value is the duration of the PMU 400 (Tuxedo Service PCode and SQL) rows that are associated withthe request that is accessing this component.
PeopleCode Exec Time The average time that was spent by the application serverrunning PeopleCode, including any SQL that was triggered fromwithin the PeopleCode.
The value is the average of metric 1 of the PMU 400 (TuxedoService PCode and SQL) rows that are associated with thecomponent.
PeopleCode SQL Time This is the average time that was spent by the application serverrunning SQLExecs and SQL objects that were triggered fromwithin the PeopleCode. It is a subset of the PeopleCode ExecTime.
The value is equal to the average of metric 2 of the PMU 400 (Tuxedo Service PCode and SQL) rows that are associated withthe requests.
Working with Performance Monitor Charts and Analytics Chapter 8
142 Copyright © 1988, 2016, Oracle and/or its affiliates. All rights reserved.
Note: This is the average time that was spent for running allSQL statements of this type in a single application serverrequest, not the average duration of one SQL statement of thistype.
PeopleCode Built-in SQL Time This is the average time that was spent by the application serverrunning SQL that was triggered from within PeopleCode built-in functions such as GetNextNumber(). It is a subset of thePeopleCode Exec Time.
The value is the average of metric 3 of the PMU 400 (TuxedoService PCode and SQL) rows that are associated with therequests.
Note: This is the average time that was spent for running allSQL statements of this type in a single application serverrequest, not the average duration of one SQL statement of thistype.
PeopleTools SQL Exec Time This is the average time that was spent by the application serverrunning SQL that was triggered by the PeopleTools runtime. Itis a subset of the Tuxedo Service Time. This value may overlapwith the PeopleCode Exec time.
The value is the average of metric 4 of the PMU 400 (TuxedoService PCode and SQL) rows that are associated with therequests.
Note: This is the average time that was spent for running allSQL statements of this type in a single application serverrequest, not the average duration of one SQL statement of thistype.
PeopleCode DurationsThe PeopleCode Durations chart contains data only if a user accessed a component while the monitoringlevel was set at verbose. The data is derived from PMUs 500–516.
This chart is a summary showing:
• Which PeopleCode event types (such as SavePreChange and SavePostChange) were triggered for thiscomponent at the record field, component record, page, and component levels.
• The average time that was spent running each event instance.
• The sample count that was used to calculate these averages.
The standard deviation is not calculated for this chart.

Chapter 8 Working with Performance Monitor Charts and Analytics
Copyright © 1988, 2016, Oracle and/or its affiliates. All rights reserved. 143
Viewing Portal Statistics
Access the Portal Statistics page (PeopleTools, Performance Monitor, Analytics, Portal Statistics).
This page enables you to view the performance of the portal servlet. All charts have a View in Gridhyperlink to show the chart information in a grid. This enables you to sort the information and todownload to Microsoft Excel spreadsheets.
The chart on this page is generated from all Portal Request PMUs 100 (Portal Request) rows grouped byaction (login, logout, homepage, target page, error), all PMU 117 (GetContent) rows, and all PMU 116(Redirect after Login) rows.
Before you view the charts, you must enter search criteria.
System ID Identifies each monitored system. PeopleSoft automaticallygenerates this value incrementally. System definitions arecreated automatically when the first agent of a monitored systemregisters with the monitoring system.
Database Name The name of the PeopleSoft application database running on themonitored system. The monitoring system automatically insertsthis value when it recognizes and creates a monitored system.
User ID The user ID of the user who generated the request.
The User ID field prompts against the PSPMOPRDEFN table, which is populated by the Lookup program (PSPM_LOOKUP).
Performance Trace Name You enter the performance trace name to search on PMUswithin a particular performance trace. If a user has launcheda performance trace in the Performance Console, the systemlabels every PMU that was generated in a business process witha performance trace name.
Performance Trace Name prompts against thePSPMPERFTRACE table, which is populated by the Lookupprogram (PSPM_LOOKUP).
Note: When searching using a performance trace name, thesearch ignores all agent IDs, so the current system ID is notrelevant.
From/To Date/Time Specify a range of time. The system searches on the monitordate and time, not the agent date and time. If you do not specifya time range, by default, the system displays information for thecurrent day, starting at midnight (12:00 AM).
Search The Search button performs a search based on the search criteriathat is defined on the page. It should be pressed only onceper search. If you want to view the most current information, use theRefresh button after running the initial search. If you

Working with Performance Monitor Charts and Analytics Chapter 8
144 Copyright © 1988, 2016, Oracle and/or its affiliates. All rights reserved.
clickSearch repeatedly, the system returns the same results fromthe same time range for each search.
Refresh Updates the To Time value to equal the current time. Thisenables you to view the most current results of a search.
Portal Action DurationsThis chart reveals the average and standard deviation of the durations of the following metrics. Thesample size that is used to derive the average appears in parentheses to the right of the bar label.
Redirect The time that was required for the browser to load a page that isrequested by way of a URL redirection.
Get Content The time that was required for the system to display targetcontent.
Portal View page The time that was spent to assemble a portal page, excluding thehomepage.
Portal login The time that was spent on processing a login request.
Portal Homepage The time that was spent assembling the homepage.
Portal error The time that was spent assembling the error reporting page.
Portal Expire The time that was spent processing a portal page expiration.
Portal Logout The time that was spent on processing a logout request.
Portal Refresh Pagelet The time that was spent refreshing a pagelet. A pagelet refreshgets triggered by the refresh button on a pagelet from thehomepage.
Viewing PIA Statistics
Access the PIA Statistics page (PeopleTools, Performance Monitor, Analytics, PIA Statistics).
This page enables you to view the performance of the PIA servlet.
All charts have a View in Grid hyperlink to show the chart information in a grid. This also enables usersto sort the information and to download to Microsoft Excel spreadsheets.
System ID Identifies each monitored system. The PeopleSoft systemautomatically generates this value incrementally. Systemdefinitions are created automatically when the first agent of amonitored system registers with the monitoring system.
Database Name The name of the PeopleSoft application database running on themonitored system. The monitoring system automatically insertsthis value when it recognizes and creates a monitored system.
Chapter 8 Working with Performance Monitor Charts and Analytics
Copyright © 1988, 2016, Oracle and/or its affiliates. All rights reserved. 145
User ID The user ID of the user who generated the request.
The User ID field prompts against the PSPMOPRDEFN table, which is populated by the Lookup program (PSPM_LOOKUP).
Performance Trace Name You enter the performance trace name to search on PMUswithin a particular performance trace. If a user has launcheda performance trace in the Performance Console, the systemlabels every PMU that is generated in a business process with aperformance trace name.
Performance Trace Name prompts against thePSPMPERFTRACE table, which is populated by the Lookupprogram (PSPM_LOOKUP).
Note: When searching using a performance trace name, thesearch ignores all agent IDs, so the current system ID is notrelevant.
From/To Date/Time Specify a range of time. The system searches on the monitordate and time, not the agent date and time. If you do not specifya time range, by default, the system displays information for thecurrent day, starting at midnight (12:00 AM).
Search The Search button performs a search based on the search criteriathat is defined on the page. It should be pressed only onceper search. If you want to view the most current information, use theRefresh button after running the initial search. If youclickSearch repeatedly, the system returns the same results fromthe same time range for each search.
Refresh Updates the To Time value to equal the current time. Thisenables you to view the most current results of a search.
PIA Action DurationsThe average time for a PIA servlet to handle a direct request from a browser (PIA View Page), and handlea request from a Portal.
The data is generated from PMU 101 (PIA Request), and the data is grouped by context 3, which is action(login, logout, homepage, target page, error). Additional performance data is generated from PMU 102(Compression Request), PMU 106 (PIA Request From Portal), and PMU 114 (Attach File Request).
PIA Action Response SizesThe average size of the content sent to a browser when fulfilling a PIA request for the same rows of datathat appear in the PIA Action Durations chart.
The data is generated from the metric 1 values for PMU 101 (PIA Request), metric 1 values for 106 (PIARequest from Portal), metric 1 values for PMU 114 (Attach File Request), and metric 1 values for PMU102 (Compression Request).

Working with Performance Monitor Charts and Analytics Chapter 8
146 Copyright © 1988, 2016, Oracle and/or its affiliates. All rights reserved.
Viewing Top Portal Content Requests
Access the Top Portal Content Requests page (PeopleTools, Performance Monitor, Analytics, Top PortalContent Requests).
This page enables you to identify, view, and rank the performance data that is associated with individualrequests for content through the PeopleSoft portal. The charts enable you to identify content requests thatare both popular and performing poorly.
All charts have a View in Grid hyperlink to show the chart information in a grid. This enables you to sortthe information and to download to Microsoft Excel spreadsheets.
Before you can view portal content requests, you must first enter search criteria.
System ID Identifies each monitored system. PeopleSoft automaticallygenerates this value incrementally. System definitions arecreated automatically when the first agent of a monitored systemregisters with the monitoring system.
Database Name The name of the PeopleSoft application database running on themonitored system. The monitoring system automatically insertsthis value when it recognizes and creates a monitored system.
User ID The user ID of the user who generated the request.
The User ID field prompts against the PSPMOPRDEFN table, which is populated by the Lookup program (PSPM_LOOKUP).
Performance Trace Name Enter the performance trace name to search on PMUs withina particular performance trace. If a user has launched aperformance trace in the Performance Console, the systemlabels every PMU that is generated in a business process with aperformance trace name.
Performance Trace Name prompts against thePSPMPERFTRACE table, which is populated by the Lookupprogram (PSPM_LOOKUP).
Note: When searching using a performance trace name, thesearch ignores all agent IDs, so the current system ID is notrelevant.
From/To Date/Time Specify a range of time. The system searches on the monitordate and time, not the agent date and time. If you do not specifya time range, by default, the system displays information for thecurrent day, starting at midnight (12:00 AM).
Search The Search button performs a search based on the search criteriathat is defined on the page. It should be pressed only onceper search. If you want to view the most current information, use theRefresh button after running the initial search. If you

Chapter 8 Working with Performance Monitor Charts and Analytics
Copyright © 1988, 2016, Oracle and/or its affiliates. All rights reserved. 147
clickSearch repeatedly, the system returns the same results fromthe same time range for each search.
Number to Retrieve The number of top ranked statistics to be displayed on thecharts.
Refresh Updates the To Time value to equal the current time. Enablesyou to view the most current results of a search.
Top Portal Content RequestsThis chart indicates the most popular content that is requested by users through the portal.
The chart shows the top counts of content reference instances for PMU 117 (GetContent) that wereaccessed within the search period specified. The instances are grouped by context 3, which assumes oneof the following values:
• Portal CREF ID of the content.
• Pagelet (appears when the template references the pagelet by URL rather than by CRED ID).
• Menu (the CREF ID of the menu pagelet).
• DEFAULT_TEMPLATE (the CREF ID of the default template CREF).
• Homepage Tab <tab name>.
• Target content (appears when the content is unregistered target content).
• Logout (appears when a portal issues a logout request to another portal).
Top Cumulative DurationsThis chart shows the portal content references that in total consumed the most time on the Portal servletand their request counts. The system selects the top duration sums for PMU 117 (GetContent) grouped byContext3 (Portal CREF ID) that were accessed within the search period specified.
Duration AveragesThis chart shows the portal content references that on average consumed the most time on the Portalservlet and their request counts. The system selects the top duration averages for PMU 117 (GetContent)grouped by Context3 (Portal CREF ID) that were accessed within the search period specified.
Top Cumulative Response SizesThis chart indicates the largest cumulative response sizes. A response size refers to the size, in bytes, ofthe HTML response that the system sends to the browser when fulfilling a user request.
The data is generated from metric 1 in PMU 117 (GetContent).
Top Average Response SizesThis chart indicates the top average of all of the response sizes. A response size refers to the size, in bytes,of the HTML response that the system sends to the browser when fulfilling a user request.

Working with Performance Monitor Charts and Analytics Chapter 8
148 Copyright © 1988, 2016, Oracle and/or its affiliates. All rights reserved.
The data is generated from metric 1 in PMU 117 (GetContent).
Viewing Top PeopleCode Events
Access the Top PeopleCode Events page (PeopleTools, Performance Monitor, Analytics, Top PeopleCodeEvents).
These charts show the PeopleCode events that have highest durations and execution counts, groupedby component and event type. Durations and counts are summed across levels (record field, componentrecord, page and component) for each component and event type.
All charts have a View in Grid hyperlink to show the chart information in a grid. This also enables usersto sort the information and to download to Microsoft Excel spreadsheets.
Note: Performance data must be captured in verbose agent filter mode or higher to be displayed.
Before you can view PeopleCode events, you must first enter search criteria.
System ID Identifies each monitored system. PeopleSoft automaticallygenerates this value incrementally. System definitions arecreated automatically when the first agent of a monitored systemregisters with the monitoring system.
Database Name The name of the PeopleSoft application database running on themonitored system. The monitoring system automatically insertsthis value when it recognizes and creates a monitored system.
User ID The user ID of the user who generated the request.
The User ID field prompts against the PSPMOPRDEFN table, which is populated by the Lookup program (PSPM_LOOKUP).
Performance Trace Name You enter the performance trace name to search on PMUswithin a particular performance trace. If a user has launcheda performance trace in the Performance Console, the systemlabels every PMU that is generated in a business process with aperformance trace name.
Performance Trace Name prompts against thePSPMPERFTRACE table, which is populated by the Lookupprogram (PSPM_LOOKUP).
Note: When searching using a performance trace name, thesearch ignores all agent IDs, so the current system ID is notrelevant.
Component Select the component name.
Market Select the market to which the component belongs.
From/To Date/Time Specify a range of time. The system searches on the monitordate and time, not the agent date and time. If you do not specify

Chapter 8 Working with Performance Monitor Charts and Analytics
Copyright © 1988, 2016, Oracle and/or its affiliates. All rights reserved. 149
a time range, by default, the system displays information for thecurrent day, starting at midnight (12:00 AM).
Search The Search button performs a search based on the search criteriathat is defined on the page. It should be pressed only onceper search. If you want to view the most current information, use theRefresh button after running the initial search. If youclickSearch repeatedly, the system returns the same results fromthe same time range for each search.
Number to Retrieve The number of top ranked statistics to be displayed on thecharts.
Refresh Updates the To Time value to equal the current time. Enablesyou to view the most current results of a search.
Note: If the filter level of the PSAPPSRV agent type is set to a level that is lower than the level of PMU500–516 (Verbose), a warning message appears at the top of the page indicating that information forthe current component may not be available. This data is available only in the following situations: theagent filters on the application server are set to verbose or debug, or performance traces were run with afilter level set to debug or verbose. A small, yellow triangle appears at the top of the page alerting you ifapplication servers for that system are currently at a higher filter level than verbose. This, however, doesnot mean that you would not see data; PMUs may exist from performance traces or lower filter levelsfrom past monitoring.
Top PeopleCode EventsThis chart indicates the PeopleCode events that are run most often.
It shows the highest counts for all PMU 500–516. The counts consist of adding metrics 1, 3, and 5. Thedata is grouped by component and event name (contexts 1 and 2).
See Setting Agent Filter Options.
Top Cumulative DurationsThis chart reveals the largest sum of all the durations of a specific PeopleCode event.
It shows the top sum of PMU 500–516 durations. The duration is not the duration of the PMU; theduration is the sum of metrics 2, 4, and 6. The data is grouped by component and event name (contexts 1and 2).
Duration AveragesThis chart shows the components with event types that on average consume the most time in applicationserver requests.
Duration averages are the averages and standard deviations of the sum of durations of PMU 500–516.The duration is not the duration of the PMU; the duration is the sum of metrics 2, 4, and 6. The data isgrouped by component and event name (contexts 1 and 2). The sample count that is used to calculatethese averages is not the execution counts of the events (metrics 1, 3 and 5) but the number of times thiscomponent reported that event type.

Working with Performance Monitor Charts and Analytics Chapter 8
150 Copyright © 1988, 2016, Oracle and/or its affiliates. All rights reserved.
Viewing Top PeopleCode Executions
Access the Top PeopleCode Executions page (PeopleTools, Performance Monitor, Analytics, TopPeopleCode Executions).
This page enables you to identify the PeopleCode programs that the system runs the most and theperformance of the PeopleCode programs.
The data on this page is generated from PMU 404 (PeopleCode Program Execution), and it is based on allPeopleCode function calls and all calls to application packages.
All charts have a View in Grid hyperlink to show the chart information in a grid. This enables you to sortthe information and to download to Microsoft Excel spreadsheets.
Note: Performance data must be captured in debug agent filter mode to be displayed in this chart.
Before you can view top PeopleCode executions, you must first enter search criteria.
System ID Identifies each monitored system. PeopleSoft automaticallygenerates this value incrementally. System definitions arecreated automatically when the first agent of a monitored systemregisters with the monitoring system.
Database Name The name of the PeopleSoft application database running on themonitored system. The monitoring system automatically insertsthis value when it recognizes and creates a monitored system.
User ID The user ID of the user who generated the request.
The User ID field prompts against the PSPMOPRDEFN table, which is populated by the Lookup program (PSPM_LOOKUP).
Performance Trace Name You enter the performance trace name to search on PMUswithin a particular performance trace. If a user has launcheda performance trace in the Performance Console, the systemlabels every PMU that is generated in a business process with aperformance trace name.
Performance Trace Name prompts against thePSPMPERFTRACE table, which is populated by the lookupprogram (PSPM_LOOKUP).
Note: When searching using a performance trace name, thesearch ignores all agent IDs, so the current system ID is notrelevant.
Component Select the component name.
Market Select the market to which the component belongs.
From/To Date/Time Specify a range of time. The system searches on the monitordate and time, not the agent date and time. If you do not specify

Chapter 8 Working with Performance Monitor Charts and Analytics
Copyright © 1988, 2016, Oracle and/or its affiliates. All rights reserved. 151
a time range, by default, the system displays information for thecurrent day, starting at midnight (12:00 AM).
Search The Search button performs a search based on the search criteriathat is defined on the page. It should be pressed only onceper search. If you want to view the most current information, use theRefresh button after running the initial search. If youclickSearch repeatedly, the system returns the same results fromthe same time range for each search.
Number to Retrieve The number of top ranked statistics to be displayed on thecharts.
Refresh Updates the To Time value to equal the current time. Enablesyou to view the most current results of a search.
Note: This data is available only when the agent filters on the application server are set to debug, orperformance traces were run with a filter level set to debug. A small, yellow triangle appears at the top ofthe page alerting you if application servers for that system are currently at a higher filter level than debug.This, however, does not mean that you would not see data; PMUs may exist from performance traces orlower filter levels from past monitoring.
Top PeopleCode ExecutionsIndicates the PeopleCode programs that the system runs the most.
Top PeopleCode executions refers to the highest counts for all PMU 404 (PeopleCode ProgramExecution) rows. The data is grouped by component and program name (contexts 1 and 2).
Top Cumulative DurationsIdentifies the PeopleCode programs with the longest cumulative durations. The duration of eachexecution of a particular PeopleCode program is recorded and added to the sum total to create acumulative duration value.
The data is generated from the sum of PMU 404 (PeopleCode Program Execution) durations, and the datais grouped by component and program name (contexts 1 and 2).
Duration AveragesIdentifies the PeopleCode programs with the highest average duration in the system.
The data is generated from the sum of PMU 404 (PeopleCode Program Execution) durations, and the datais grouped by component and program name (contexts 1 and 2).
Viewing Top PeopleCode SQL Statements
Access the Top PeopleCode SQL page (PeopleTools, Performance Monitor, Analytics, Top PeopleCodeSQL).
Working with Performance Monitor Charts and Analytics Chapter 8
152 Copyright © 1988, 2016, Oracle and/or its affiliates. All rights reserved.
The data for this page is generated from the sum of all PMU 406 (PeopleCode SQL Execute) rows, andthe data relates to the SQL that PeopleCode programs run.
The bars on the chart are links that you can click to access the Completed PMU history component. Thesystem automatically populates the search criteria with values derived from the Top PeopleCode SQLStatements page. For example, PMU Identifier is set to406, and theContext 2 andStatement Numbervalues are set appropriately.
All charts have a View in Grid hyperlink to show the chart information in a grid. This also enables you tosort the information and to download to Microsoft Excel spreadsheets.
System ID Identifies each monitored system. PeopleSoft automaticallygenerates this value incrementally. System definitions arecreated automatically when the first agent of a monitored systemregisters with the monitoring system.
Database Name The name of the PeopleSoft application database running on themonitored system. The monitoring system automatically insertsthis value when it recognizes and creates a monitored system.
User ID The user ID of the user who generated the request.
The User ID field prompts against the PSPMOPRDEFN table, which is populated by the Lookup program (PSPM_LOOKUP).
Performance Trace Name You enter the performance trace name to search on PMUswithin a particular performance trace. If a user has launcheda performance trace in the Performance Console, the systemlabels every PMU that is generated in a business process with aperformance trace name.
Performance Trace Name prompts against thePSPMPERFTRACE table, which is populated by the Lookupprogram (PSPM_LOOKUP).
Note: When searching using a performance trace name, thesearch ignores all agent IDs, so the current system ID is notrelevant.
Component Select the component name.
Market Select the market to which the component belongs.
From/To Date/Time Specify a range of time. The system searches on the monitordate and time, not the agent date and time. If you do not specifya time range, by default, the system displays information for thecurrent day, starting at midnight (12:00 AM).
Search The Search button performs a search based on the search criteriathat is defined on the page. It should be pressed only onceper search. If you want to view the most current information, use theRefresh button after running the initial search. If you

Chapter 8 Working with Performance Monitor Charts and Analytics
Copyright © 1988, 2016, Oracle and/or its affiliates. All rights reserved. 153
clickSearch repeatedly, the system returns the same results fromthe same time range for each search.
Number to Retrieve The number of top ranked statistics to be displayed on thecharts.
Refresh Updates the To Time value to equal the current time. Enablesyou to view the most current results of a search.
Top SQL StatementsThis chart indicates the PeopleCode SQL statements that the system runs the most.
SQL statements are identified by PeopleCode locations, such as PeopleCode Program and PeopleCodeStatement Number (context 2 and metric 2).
Top Cumulative DurationsIdentifies the PeopleCode SQL statements with the longest cumulative durations.
SQL statements are identified by PeopleCode locations, such as PeopleCode Program and PeopleCodeStatement Number (context 2 and metric 2).
Duration AveragesIdentifies the PeopleCode SQL statements with the longest average durations.
SQL statements are identified by PeopleCode locations, such as PeopleCode Program and PeopleCodeStatement Number (context 2 and metric 2).
Note: This data is available only when the agent filters on the application server are set to verbose ordebug, or performance traces were run with a filter level set to debug or verbose. A small, yellow triangleappears at the top of the page alerting you if application servers for that system are currently at a higherfilter level than verbose. This, however, does not mean that you would not see data; PMUs may exist fromperformance traces or lower filter levels from past monitoring.
Viewing Top Components
Access the Top Components page (PeopleTools, Performance Monitor, Analytics, Top Components).
All charts have a View in Grid hyperlink to show the chart information in a grid. This enables you to sortthe information and to download to Microsoft Excel spreadsheets.
The data on this page is generated from PMU 401 (ICPanel), and it is grouped by action, as in ICSave.The system passes the "action" to the application server as part of an ICPanel service request specifyingthe reason for the request.
On this page, the charts are grouped by action. The "action" refers to the action of a user in a component.The following are examples of how the actions appear:
• "#KEY" translates into Load Component.
Working with Performance Monitor Charts and Analytics Chapter 8
154 Copyright © 1988, 2016, Oracle and/or its affiliates. All rights reserved.
• "#ICPanel1" translates into "Tab to Page."
• Launch Page/Search Page.
• Click PeopleCode Command Button for Field DERIVED_PSPM.PM_FILTERCHANGE.
• Switch to Add Action Mode.
• Launch Secondary Page.
• Change Drop Down List Value for Field PRCSRQSTDLG_WRK.RECURNAME.
• Click OK or Save to Save Secondary Page.
• Click Cancel on Secondary Page.
• Save Component.
• Select Row0 From Search Result.
• Select Row1 From Search Result.
• Sort Column on Grid.
• Tab to Next Page.
• View Page.
Before viewing top components, you must first enter search criteria.
System ID Identifies each monitored system. PeopleSoft automaticallygenerates this value incrementally. System definitions arecreated automatically when the first agent of a monitored systemregisters with the monitoring system.
Database Name The name of the PeopleSoft application database running on themonitored system. The monitoring system automatically insertsthis value when it recognizes and creates a monitored system.
User ID The user ID of the user who generated the request.
The User ID field prompts against the PSPMOPRDEFN table, which is populated by the Lookup program (PSPM_LOOKUP).
Performance Trace Name You enter the performance trace name to search on PMUswithin a particular performance trace. If a user has launcheda performance trace in the Performance Console, the systemlabels every PMU that is generated in a business process with aperformance trace name.
Performance Trace Name prompts against thePSPMPERFTRACE table, which is populated by the Lookupprogram (PSPM_LOOKUP).
Chapter 8 Working with Performance Monitor Charts and Analytics
Copyright © 1988, 2016, Oracle and/or its affiliates. All rights reserved. 155
Note: When searching using a performance trace name, thesearch ignores all agent IDs, so the current system ID is notrelevant.
Component Select the component name.
Market Select the market to which the component belongs.
From/To Date/Time Specify a range of time. The system searches on the monitordate and time, not the agent date and time. If you do not specifya time range, by default, the system displays information for thecurrent day, starting at midnight (12:00 AM).
Search The Search button performs a search based on the searchcriteria defined on the page. It should be pressed only onceper search. If you want to view the most current information, use theRefresh button after running the initial search. If youclickSearch repeatedly, the system returns the same results fromthe same time range for each search.
Number to Retrieve The number of top ranked statistics to be displayed on thecharts.
Refresh Updates the To Time value to equal the current time. Thisenables you to view the most current results of a search.
Top ComponentsThis chart indicates the components that users access and use the most.
The data is grouped by component, page, and action (contexts 1, 2, and 3).
Top Cumulative DurationsIdentifies the component PMUs with the longest cumulative durations.
The data is grouped by component, page, and action (contexts 1, 2, and 3).
Duration AveragesThis chart displays the average duration and standard deviation of the PMUs that are associated with aparticular component.
The data is grouped by component, page, and action (contexts 1, 2, and 3).

Copyright © 1988, 2016, Oracle and/or its affiliates. All rights reserved. 157
Chapter 9
Performance Monitor SecurityConsiderations
Setting Up PSPPMSRV Authentication
The PSPPMSRV application server process acts as the PPMI client when you record PeopleSoftperformance data. To register as a client, the PSPPMSRV requires the appropriate permissions inPeopleTools Security.
Warning! Setting up PSPPMSRV authentication is required.
To set up PPMI Client Authentication:
1. Create a user profile using PeopleTools Security.
2. Add the PeopleTools Perfmon Client role to the user profile.
The PeopleTools Perfmon Client role contains the PTPMCLNT permission list.
3. Select PeopleTools, Performance Monitor, Administration, Global Administration and enter theuser profile that you created and the associated password in thePPMI User ID andPPMI Password textboxes.
Firewall Considerations
When setting up firewalls in a Performance Monitor environment, consider:
• Agent communication with the monitor servlet.
• PSPPMSRV communication with the monitor servlet.
• Monitor cluster members.
Agent Communication with the Monitor ServletIf you require a forward proxy to create a "bridge" for a firewall residing between the monitored systemand the monitoring system, configure your web server, application server, and Process Scheduler serveraccordingly.
Web ServerThe process varies depending on which web server you use.
To set up a forward proxy on WebLogic:

Performance Monitor Security Considerations Chapter 9
158 Copyright © 1988, 2016, Oracle and/or its affiliates. All rights reserved.
1. Open the setenv.cmd file.
2. Set HTTP_PROXY_HTTPHOST and HTTP_PROXY_HTTPPORT, or HTTP_PROXY_HTTPSHOST and HTTP_PROXY_HTTPSPORT.
3. Restart the application server and Process Scheduler domain.
To set up a forward proxy on WebSphere:
1. Open WebSphere Administration console at http://<machine-name>:9090/admin and login.
2. Expand Servers, Application Servers, server1, Process Definition, JavaVirtualMachine,CustomProperties.
3. Click New Key,Value pair and add the following new pairs:
• Key="http.proxyHost", Value="<forward proxy hostname>"
• Key="http.proxyPort", Value="<forward proxy HTTP port>"
• Key="https.proxyHost", Value="<forward proxy hostname>"
• Key="https.proxyPort", Value="<forward proxy HTTPS port>"
4. Save the configuration changes and logout.
5. Restart WebSphere.
Application ServerTo configure forward proxy on the application server:
1. Open the PSAPPSRV.CFG file.
2. Complete the Proxy Host and Proxy Port under the [PSTOOLS] section.
3. Restart the application server and Process Scheduler domain.
Note: The agents do not use the Proxy Host settings in the PSAPPSRV.CFG file.
Process SchedulerTo configure forward proxy on the Process Scheduler server:
1. Open the PSPRCS.CFG file.
2. Enter the Proxy Host and Proxy Port under the [PSTOOLS] section.
Note: The agents do not use the Proxy Host settings in the PSPRCS.CFG file.
PSPPMSRV Communication with the Monitor ServletYou can't have a firewall between the PSPPMSRV processes and the monitoring web server. WhenPSPPMSRV starts, it binds to the next free port that is allocated by the operating system. As such, nostatic port exists. This saves configuring ports for multiple PSPPMSRVs.
Chapter 9 Performance Monitor Security Considerations
Copyright © 1988, 2016, Oracle and/or its affiliates. All rights reserved. 159
Monitor Cluster MembersThe monitor cluster members communicate with each other on their allotted ports. If the cluster membersare on different sides of a firewall, then these port numbers need to remain open for HTTP/S.
Setting Up SSL
This section discusses how to:
• Set up SSL between the agents and the Performance Monitor.
• Set up SSL between the Performance Monitor and PPMI clients.
Note: Setting up SSL encryption is optional.
Setting Up SSL Between Agents and Performance MonitorThis configuration encrypts data that is sent from the agents to the Performance Monitor.
To set up SSL between agents and Performance Monitor:
1. Install a digital root certificate on the web server.
A digital root certificate from a trusted certificate authority (CA) must be installed on the web serverthat is hosting the monitor URL.
Note: If the root certificate that is installed on your monitoring web server is from a nonstandard CA,then a copy of that certificate must be installed in the application server key store for the monitoreddatabases. The agents load this certificate when they start.
2. Specify https for the Monitor URL.
• Select PeopleTools, Performance Monitor, Administration, Specify Monitor.
• Enter the URL that is specified for the Monitor URL beginning with https.
Setting Up SSL Between Performance Monitor and PSPPMSRV and MonitorCluster Members
This configuration encrypts the PPMI user ID and password when it is passed to the monitor andcommunication between monitor cluster members. Performance data that is published by the monitor isnot encrypted.
To set up SSL between Performance Monitor and PSPPMSRV and between cluster members:
1. Install a digital root certificate on the web server.
A digital root certificate from a trusted CA must be installed on the web server that is hosting themonitor URL.

Performance Monitor Security Considerations Chapter 9
160 Copyright © 1988, 2016, Oracle and/or its affiliates. All rights reserved.
2. Specify HTTPS for the PPMI URL.
• Select PeopleTools, Performance Monitor, Administration, Global Administration.
• Enter the URL that is specified for the PPMI URL beginning with https. If you elect to usePSPPMSRV as the PPMI client, only the communication from the PSPPMSRV to the PPMIservlet is encoded.
3. Specify HTTPS for the member servlet URLs in the Global Administration page.
Note: If the root certificate that is installed on your monitoring web server is from a nonstandard CA,then a copy of that certificate must be installed in the application server key stores for the monitoringdatabases.
Setting Up SSL Client Authentication
SSL client authentication validates that the client is trusted by the server.
Note: Setting up SSL client authentication is optional.
To set up SSL client authentication:
1. Set up SSL (as described in the previous section).
2. Set up your own certificate authority.
Remove all other certificate authorities from the monitoring web server's key store. All certificatesthat are signed by this authority will be trusted by the monitoring web server.
3. Configure the monitoring web server so that client authentication is required and HTTP requests aredisabled.
Note: This configuration prevents web browser connections to the web server unless the browser hasloaded the client certificate. In particular, the Ping buttons that you use when you set up the PPMIURL and the Monitor URL require the browser to have a trusted client certificate loaded.
4. Configure Client Authentication on all elements that must access the monitoring system throughHTTPS.
The following internal elements must have client certificates in their key stores. Each of thesecertificates must be signed by your certificate authority. The client authentication ensures that the datathat an element receives is authentic in that no third-party could have inserted any incorrect data.
Element Description
Agents Configuring client authentication ensures that performanceinformation that is sent between agents and the monitoringsystem is authentic.
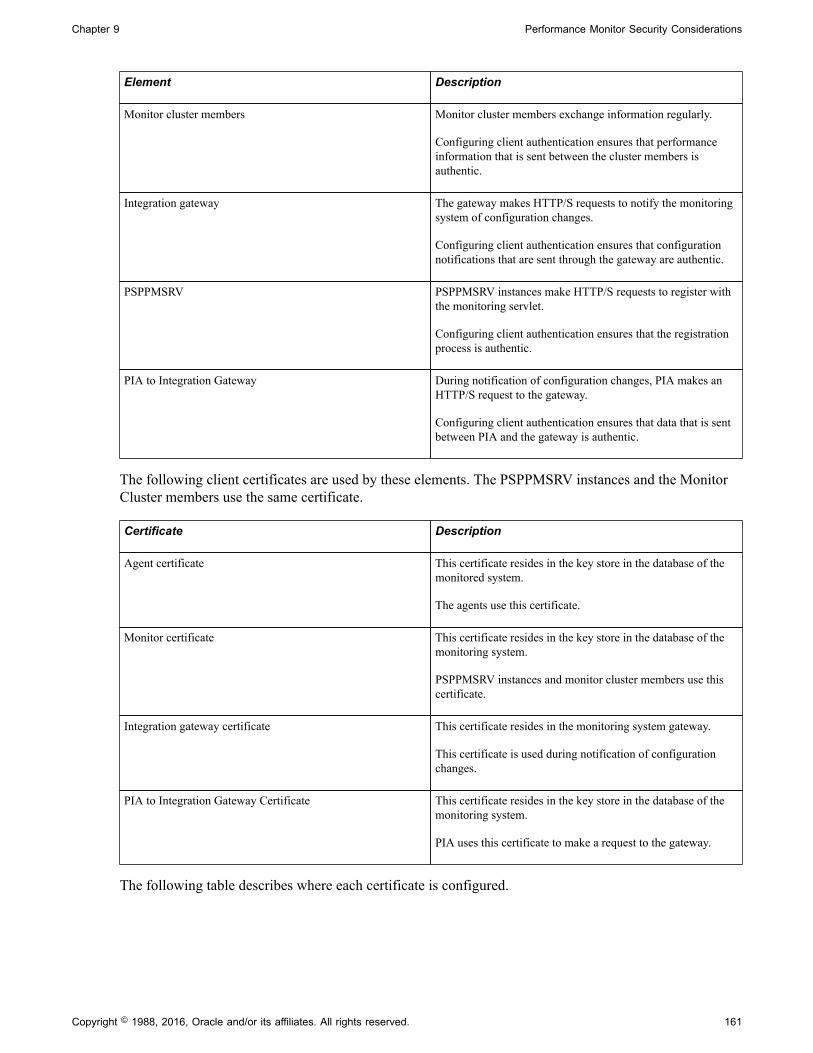
Chapter 9 Performance Monitor Security Considerations
Copyright © 1988, 2016, Oracle and/or its affiliates. All rights reserved. 161
Element Description
Monitor cluster members Monitor cluster members exchange information regularly.
Configuring client authentication ensures that performanceinformation that is sent between the cluster members isauthentic.
Integration gateway The gateway makes HTTP/S requests to notify the monitoringsystem of configuration changes.
Configuring client authentication ensures that configurationnotifications that are sent through the gateway are authentic.
PSPPMSRV PSPPMSRV instances make HTTP/S requests to register withthe monitoring servlet.
Configuring client authentication ensures that the registrationprocess is authentic.
PIA to Integration Gateway During notification of configuration changes, PIA makes anHTTP/S request to the gateway.
Configuring client authentication ensures that data that is sentbetween PIA and the gateway is authentic.
The following client certificates are used by these elements. The PSPPMSRV instances and the MonitorCluster members use the same certificate.
Certificate Description
Agent certificate This certificate resides in the key store in the database of themonitored system.
The agents use this certificate.
Monitor certificate This certificate resides in the key store in the database of themonitoring system.
PSPPMSRV instances and monitor cluster members use thiscertificate.
Integration gateway certificate This certificate resides in the monitoring system gateway.
This certificate is used during notification of configurationchanges.
PIA to Integration Gateway Certificate This certificate resides in the key store in the database of themonitoring system.
PIA uses this certificate to make a request to the gateway.
The following table describes where each certificate is configured.
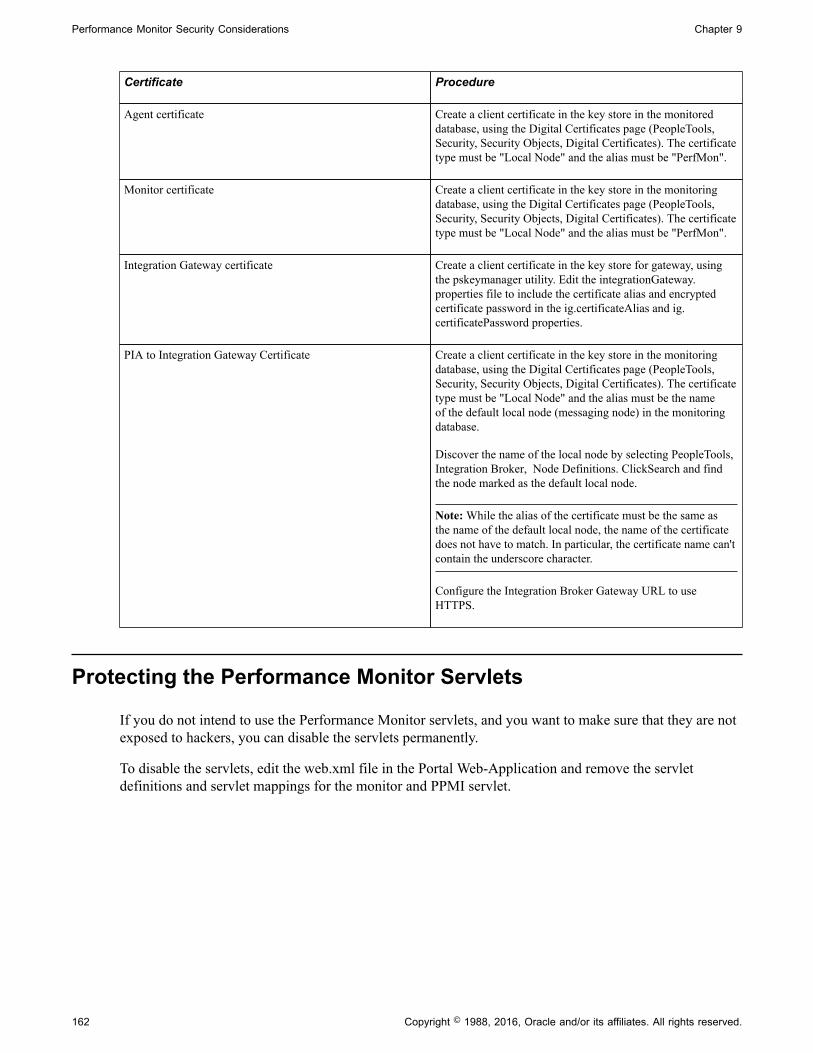
Performance Monitor Security Considerations Chapter 9
162 Copyright © 1988, 2016, Oracle and/or its affiliates. All rights reserved.
Certificate Procedure
Agent certificate Create a client certificate in the key store in the monitoreddatabase, using the Digital Certificates page (PeopleTools,Security, Security Objects, Digital Certificates). The certificatetype must be "Local Node" and the alias must be "PerfMon".
Monitor certificate Create a client certificate in the key store in the monitoringdatabase, using the Digital Certificates page (PeopleTools,Security, Security Objects, Digital Certificates). The certificatetype must be "Local Node" and the alias must be "PerfMon".
Integration Gateway certificate Create a client certificate in the key store for gateway, usingthe pskeymanager utility. Edit the integrationGateway.properties file to include the certificate alias and encryptedcertificate password in the ig.certificateAlias and ig.certificatePassword properties.
PIA to Integration Gateway Certificate Create a client certificate in the key store in the monitoringdatabase, using the Digital Certificates page (PeopleTools,Security, Security Objects, Digital Certificates). The certificatetype must be "Local Node" and the alias must be the nameof the default local node (messaging node) in the monitoringdatabase.
Discover the name of the local node by selecting PeopleTools, Integration Broker, Node Definitions. ClickSearch and findthe node marked as the default local node.
Note: While the alias of the certificate must be the same asthe name of the default local node, the name of the certificatedoes not have to match. In particular, the certificate name can'tcontain the underscore character.
Configure the Integration Broker Gateway URL to useHTTPS.
Protecting the Performance Monitor Servlets
If you do not intend to use the Performance Monitor servlets, and you want to make sure that they are notexposed to hackers, you can disable the servlets permanently.
To disable the servlets, edit the web.xml file in the Portal Web-Application and remove the servletdefinitions and servlet mappings for the monitor and PPMI servlet.

Copyright © 1988, 2016, Oracle and/or its affiliates. All rights reserved. 163
Chapter 10
Performance Monitor Meta-Data
Performance Monitor Meta-Data Definitions
The Performance Monitor uses the following meta-data definitions:
• Metrics.
• Events.
• Contexts.
• PMUs.
MetricsPerformance Monitor agents send PMUs and events to the monitor. Each PMU and event contains one ormore metrics. Each metric has a unique identifier. Metric definitions are the building blocks for creatingPMUs and events. PMUs and events comprise up to six numeric values and one string metric value. Onemetric definition can appear in multiple event and PMU definitions.
EventsEvents are notifications containing performance metrics that are different from PMUs in that they are nothierarchical, and they do not have durations. PeopleTools has defined a set of event types, and each typeof event is reported at a specific location in the instrumented code.
Each event has:
• Type.
• Instance identifier (a unique identifier for a specific event instance).
• Timestamp.
• Severity.
• Metrics (such as CPU usage and memory allocation).
Event definitions group as many as seven metrics to measure the intended performance data. Some eventsdo not have metrics.
ContextsA context definition applies only to PMU definitions. Contexts provide additional information so thatPMU performance data can be displayed and searched more effectively. For example, a context definitionenables you to group and sort numeric values, such as an execute count, by page name. Contexts enable

Performance Monitor Meta-Data Chapter 10
164 Copyright © 1988, 2016, Oracle and/or its affiliates. All rights reserved.
the system to assign the data to various elements such as pages, components, service calls, and so on.Without contexts, you have only numeric data in no understandable grouping.
PMU metrics contain data that is specific to that PMU. Context values, on the other hand, are common tothe entire user request or a specific tier. The system uses contexts to "flatten" a PMU tree. For example,you do not have to navigate up from a SQL PMU to an ICPanel PMU to see what component generatedthat SQL statement.
PMUsA PMU is a unit of measure that reflects the execution of a section of code. The system starts and stopsa PMU at specific code locations, and the system may update a PMU anytime between the start andstop times. PeopleTools has defined a set of PMU types, and each type of PMU corresponds to theinstrumentation at a specific code location, such as a SQL Execute in PSAPPSRV or a Jolt Request in theweb server.
Each PMU includes:
• PMU Type.
• Instance identifier (a unique identifier for a specific PMU instance).
• Start time.
• Stop time.
• Status.
• Metrics (such as number of SQL fetches or buffer size that is used in a Jolt response).
A PMU represents a section of code that is bracketed by calls to an internal instrumentation API thatsignal the start and stop of that logical unit of code.
PMU definitions group as many as seven metrics to measure the intended performance data. Some PMUsdo not have metrics.
Metric Definitions
This section discusses the attributes of a metric definition.
Note: Only PeopleSoft should modify metric definitions. Modifying metric definitions at your site couldcause unexpected results.
Metric Identifier A numeric value acting as the unique identifier, or key, for ametric definition.
Metric Type Displays the type of the metric definition. Metric types are:
• Counter: A counter metric is designed to enable sums ofvalues from a specific time range to be calculated.
Examples are bytes printed and records written. The valuescan also be averaged, maximums and minimums can be

Chapter 10 Performance Monitor Meta-Data
Copyright © 1988, 2016, Oracle and/or its affiliates. All rights reserved. 165
calculated, and other kinds of statistical calculations can beperformed
• Gauge: A gauge metric is designed to be used instead of acounter when it is not meaningful to calculate sum valuesthat are recorded within a time range.
Calculations that are performed on gauge metrics include:average, standard deviation, median, maximum value, andminimum value. For example, the amount of memory thatis used on a server is a gauge metric type. If you measurethe amount of memory that is used over 20 transactionsin a time range, the sum of the memory that is used is notnecessarily useful. However, the average, median, andstandard deviation provide insight into usage per transaction.
• Numeric Identifier: A numeric identifier is a numeric valuethat is used as an identifier, not as a measurement value.
Creating sums and averages, or manipulating these values inany arithmetic way is not meaningful. For example, messagenumbers and error codes are numeric identifier metric types.
• String: Used with metric definition attributes that need to berepresented as text, not a numeric value.
Arithmetic operations are not performed on string metrictypes. For example, descriptive attributes, such as site path, file name, and so on, are string metric types.
Metric Label This metric label appears on any page that displays a metric todescribe the metric value.
Description Displays a more detailed description of the purpose of themetric.
Metric Multiplier Enables you to manipulate metric values using a multiplier.
The multiplier determines how the metrics appears on aPeopleSoft page. For example, if a metric is in milliseconds andyou want to change it to display in seconds, you would specify amultiplier of 1000.
If the value does not need to be manipulated (increased ordecreased), the multiplier is 1.0.
Display Metric As an Integer Metrics can appear as a real number (with decimals) or integers(without decimals).
For example, an average duration appears as a real number, while a sum of SQL Statement executions must appear as aninteger.

Performance Monitor Meta-Data Chapter 10
166 Copyright © 1988, 2016, Oracle and/or its affiliates. All rights reserved.
To display the metric as an integer, select this check box. Todisplay the metric as a real number, clear this check box.
User Defined Display TextThis section provides flexibility when you are defining metrics. For example, you can assign labels toparticular values that are returned by functions. Based on a particular return value, the system displaysvarious label values. Typically, this would be used in the case of Boolean values, such as the case withmetric 23, Is this a Pagelet. If a 0 is returned, the system displaysNo. If a 1 is returned, the systemdisplaysYes.
Display Value/Label Enables you to determine what appears on the pages displayinga metric.
These options are mutually exclusive.
Select Display Value to display the actual value. SelectDisplayLabel to display the label describing the metric value.
Metric Value The actual value of a user-defined metric value.
Metric Value Label The label that is associated with a user-defined metric value.
Event Definitions
This section describes the attributes of an event definition.
Event Definition Set Event definitions belong to a particular set. This is similarto message definitions in the message catalog belonging to amessage set.
Note: Currently, only one set exists, set 1, which is reserved forinternal PeopleSoft development.
Description Explains the purpose of a particular event definition set.
DefinitionsEvent ID Identifies an event definition within an event set.
Event Label The name of the event definition. This value appears withany event metric values on the pages displaying the eventinformation.
Description Provides additional identification, if needed.
Additional Data Label If the optional long character field is populated for this eventtype, it requires a display label.
Chapter 10 Performance Monitor Meta-Data
Copyright © 1988, 2016, Oracle and/or its affiliates. All rights reserved. 167
Filter Level Sets the level at which the system begins recording data about aparticular event definition. The level of the overall monitoringsystem must equal or exceed the level of the event filter levelbefore the system records the event data. For example, if theoverall system filter level is set to Standard, the system recordsinformation from event definitions with a filter level set toStandard,Warning, andError.
Metrics An event comprisesup to six, predefined numeric metrics andone string metric.
Select the metric to include using the lookup button.
See Metric Definitions.
Context Definitions
This section discusses the attributes of a context definition.
Context Identifier A numeric value that uniquely identifies a specific contextdefinition.
Context Label The label that appears on any page displaying the contextdefinition to identify it.
Description A more detailed explanation of the context definition, if needed.
PMU Definitions
This section describes the attributes of PMU definition.
PMU Definition Set PMU definitions belong to a particular set. This is similar tomessage definitions in the message catalog belonging to amessage set.
Note: Currently, only one set exists, set 1, which is reserved forinternal PeopleSoft development.
Description Explains the purpose of a particular PMU definition set.
DefinitionsPMU ID Identifies a PMU definition within an event set.
PMU Label The name of the PMU definition. This value appears with anymetric values on the pages displaying the PMU information.
Performance Monitor Meta-Data Chapter 10
168 Copyright © 1988, 2016, Oracle and/or its affiliates. All rights reserved.
Description Provides additional identification, if needed.
Additional Data Label Every PMU has an optional long data field for additionalinformation or labeling. The system displays this label only ofthis field is populated.
Filter Level Sets the level at which the system begins recording data about aparticular PMU definition. The level of the overall monitoringsystem must equal or exceed the level of the PMU filter levelbefore the system records the event data. For example, ifthe overall system filter level is set to Verbose, the systemrecords information from event definitions with a filter level settoStandard andVerbose, but it does not record information that isrelated to PMU definitions with a filter level set toDebug.
See Setting Agent Filter Options.
Enable Sampling Some PMUs that are associated with a user connection arealways monitored regardless of the sampling rate. The PMUsthat are never ignored are those that have the Enable Samplingoption cleared. Examples of such PMUs are those that arerelated to users signing on, signing off, and being redirected toother sites.
See Configuring Performance Monitoring Sampling Rate.
Contexts 1, 2, 3 A PMU has up to three context fields.
See Context Definitions.
Note: If the contents of a context field vary according to the"parent" PMU, then the system uses Context 14 "Generic."For example, Context 1 of a SQL PMU such as PMU 407 (PeopleCode Built-In SQL Execute) is the component name foran ICPanel request or an iScript name for an ICScript request.
Metrics A PMU comprises up to six, predefined numeric metrics andone string metric.
Select the metric to include using the lookup button.
Display Select this option if you intend to display the metric label, thevalue, or both on a PeopleSoft page.
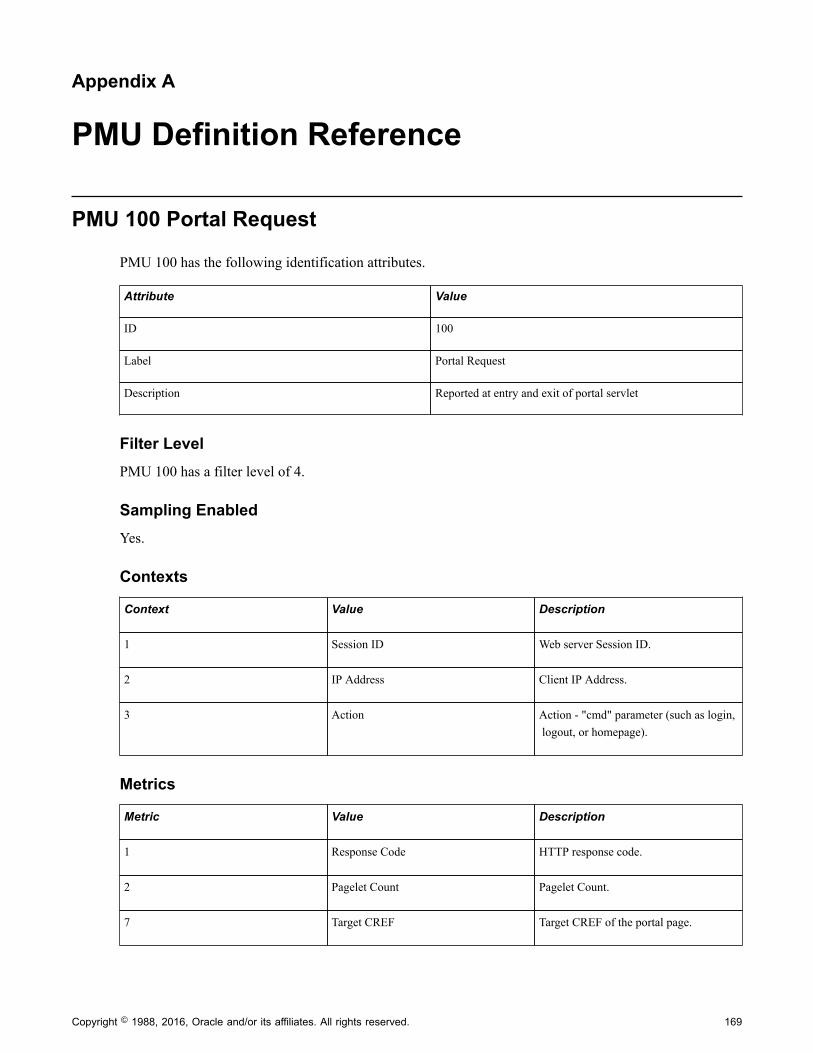
Copyright © 1988, 2016, Oracle and/or its affiliates. All rights reserved. 169
Appendix A
PMU Definition Reference
PMU 100 Portal Request
PMU 100 has the following identification attributes.
Attribute Value
ID 100
Label Portal Request
Description Reported at entry and exit of portal servlet
Filter LevelPMU 100 has a filter level of 4.
Sampling EnabledYes.
Contexts
Context Value Description
1 Session ID Web server Session ID.
2 IP Address Client IP Address.
3 Action Action - "cmd" parameter (such as login, logout, or homepage).
Metrics
Metric Value Description
1 Response Code HTTP response code.
2 Pagelet Count Pagelet Count.
7 Target CREF Target CREF of the portal page.
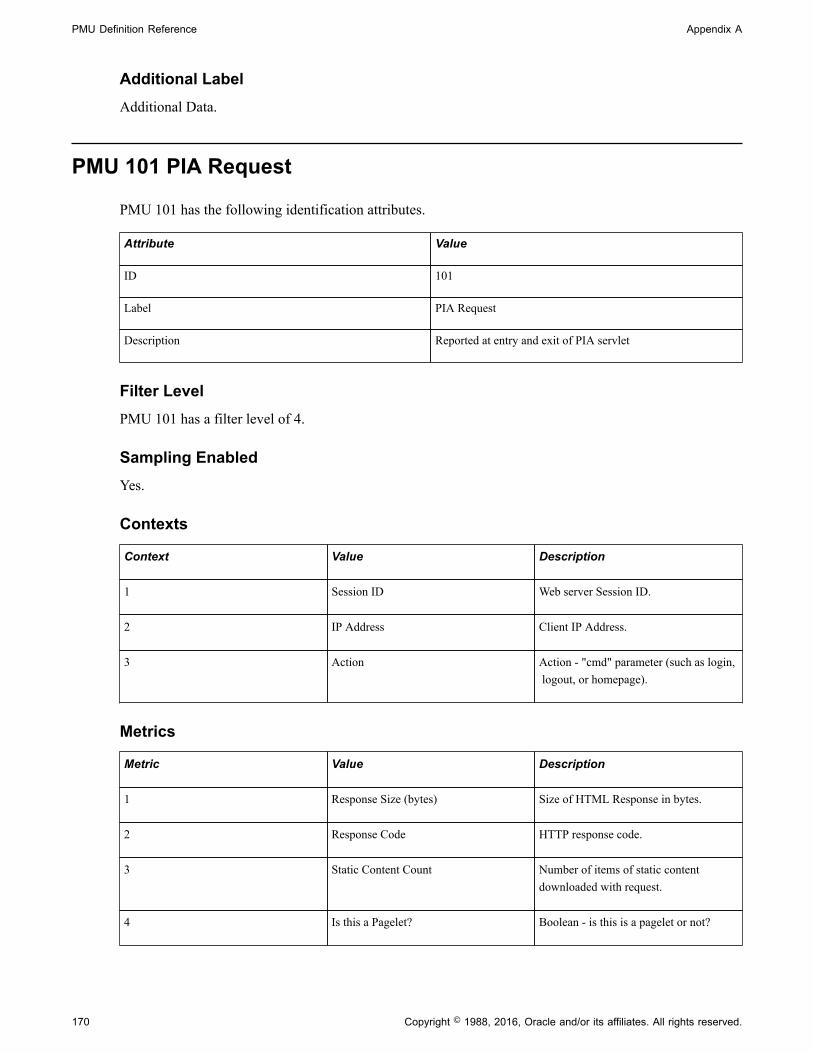
PMU Definition Reference Appendix A
170 Copyright © 1988, 2016, Oracle and/or its affiliates. All rights reserved.
Additional LabelAdditional Data.
PMU 101 PIA Request
PMU 101 has the following identification attributes.
Attribute Value
ID 101
Label PIA Request
Description Reported at entry and exit of PIA servlet
Filter LevelPMU 101 has a filter level of 4.
Sampling EnabledYes.
Contexts
Context Value Description
1 Session ID Web server Session ID.
2 IP Address Client IP Address.
3 Action Action - "cmd" parameter (such as login, logout, or homepage).
Metrics
Metric Value Description
1 Response Size (bytes) Size of HTML Response in bytes.
2 Response Code HTTP response code.
3 Static Content Count Number of items of static contentdownloaded with request.
4 Is this a Pagelet? Boolean - is this is a pagelet or not?

Appendix A PMU Definition Reference
Copyright © 1988, 2016, Oracle and/or its affiliates. All rights reserved. 171
Additional LabelAdditional Data.
PMU 102 Compression Request
PMU 102 has the following identification attributes.
Attribute Value
ID 102
Label Compression Request
Description Compression servlet run when the browser requests content
Filter LevelPMU 102 has a filter level of 5.
Sampling EnabledYes.
Contexts
Context Value Description
1 Session ID Web server Session ID.
2 IP Address Client IP Address.
3 Content Type Content Type of Response.
Metrics
Metric Value Description
1 Response Size (bytes) Size of HTML Response in bytes.
2 Response Code HTTP response code.
3 Compression Ratio Compression ratio.
4 Compressed? Boolean - was the file compressed?
Additional LabelAdditional Data.

PMU Definition Reference Appendix A
172 Copyright © 1988, 2016, Oracle and/or its affiliates. All rights reserved.
PMU 106 PIA Request From Portal
PMU 106 has the following identification attributes.
Attribute Value
ID 106
Label PIA Request From Portal
Description Reported at Entry and Exit when Portal calls PIA directly
Filter LevelPMU 106 has a filter level of 4.
Sampling EnabledYes.
Contexts
Context Value Description
1 Session ID Web server Session ID.
2 IP Address Client IP Address.
Metrics
Metric Value Description
1 Response Size (bytes) Size of HTML Response in bytes.
2 Response Code HTTP Response Code.
3 Static Content Count Number of items of static contentdownloaded with request.
4 Is this a Pagelet? Boolean - is this is a pagelet or not?
PMU 108 User Session Ended
PMU 108 has the following identification attributes.
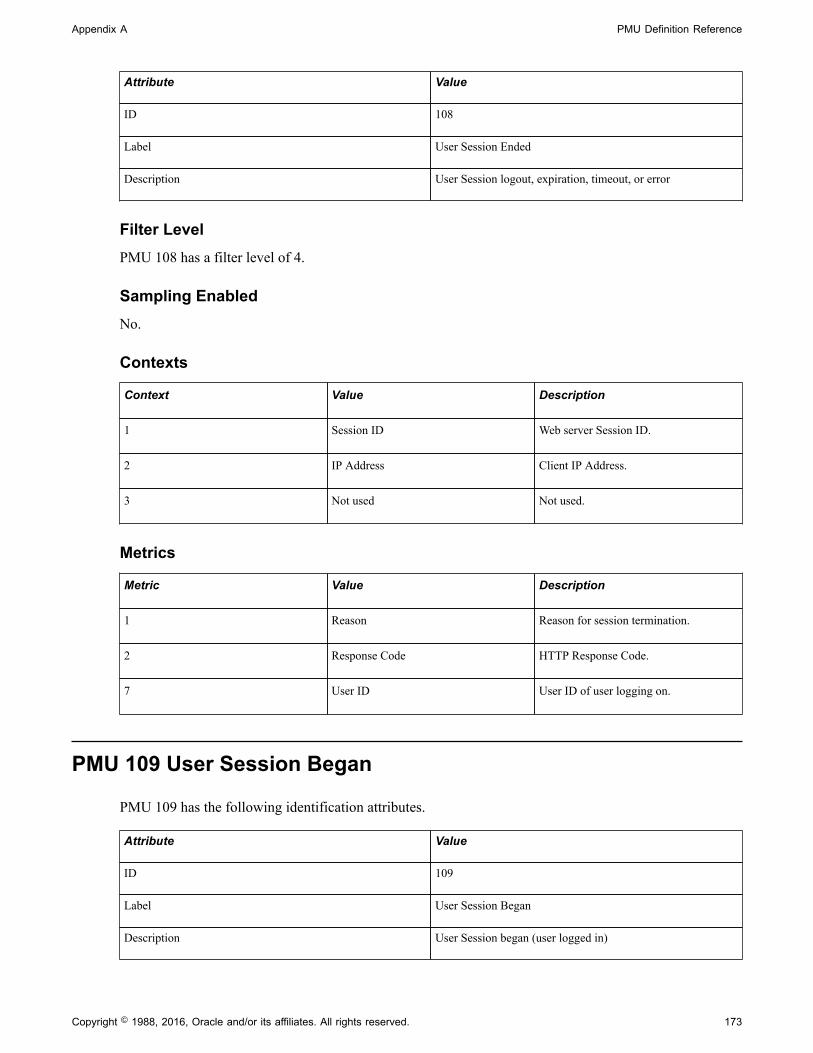
Appendix A PMU Definition Reference
Copyright © 1988, 2016, Oracle and/or its affiliates. All rights reserved. 173
Attribute Value
ID 108
Label User Session Ended
Description User Session logout, expiration, timeout, or error
Filter LevelPMU 108 has a filter level of 4.
Sampling EnabledNo.
Contexts
Context Value Description
1 Session ID Web server Session ID.
2 IP Address Client IP Address.
3 Not used Not used.
Metrics
Metric Value Description
1 Reason Reason for session termination.
2 Response Code HTTP Response Code.
7 User ID User ID of user logging on.
PMU 109 User Session Began
PMU 109 has the following identification attributes.
Attribute Value
ID 109
Label User Session Began
Description User Session began (user logged in)

PMU Definition Reference Appendix A
174 Copyright © 1988, 2016, Oracle and/or its affiliates. All rights reserved.
Filter LevelPMU 109 has a filter level of 4.
Sampling EnabledNo.
Contexts
Context Value Description
1 Session ID Web server Session ID.
2 IP Address Client IP Address.
3 Not used Not used.
Metrics
Metric Value Description
7 User ID User ID of user logging on.
PMU 113 Authenticate
PMU 113 has the following identification attributes.
Attribute Value
ID 113
Label Authenticate
Description Entry and Exit for application server authentication (GetCertificate)
Filter LevelPMU 113 has a filter level of 4.
Sampling EnabledYes.

Appendix A PMU Definition Reference
Copyright © 1988, 2016, Oracle and/or its affiliates. All rights reserved. 175
Contexts
Context Value Description
1 Session ID Web server Session ID.
2 IP Address Client IP Address.
3 Not used Not used.
Metrics
Metric Value Description
1 Bypass Signon? Boolean - logging in with a guest ID?
2 Authtoken Cookie Present? Boolean - is the Authtoken Cookie in therequest?
7 User ID User ID of user logging on.
Additional LabelPreviously logged in user.
PMU 114 Attach File Request
PMU 114 has the following identification attributes.
Attribute Value
ID 114
Label Attach File Request
Description Entry and Exit for file upload from browser client
Filter LevelPMU 114 has a filter level of 4.
Sampling EnabledYes.
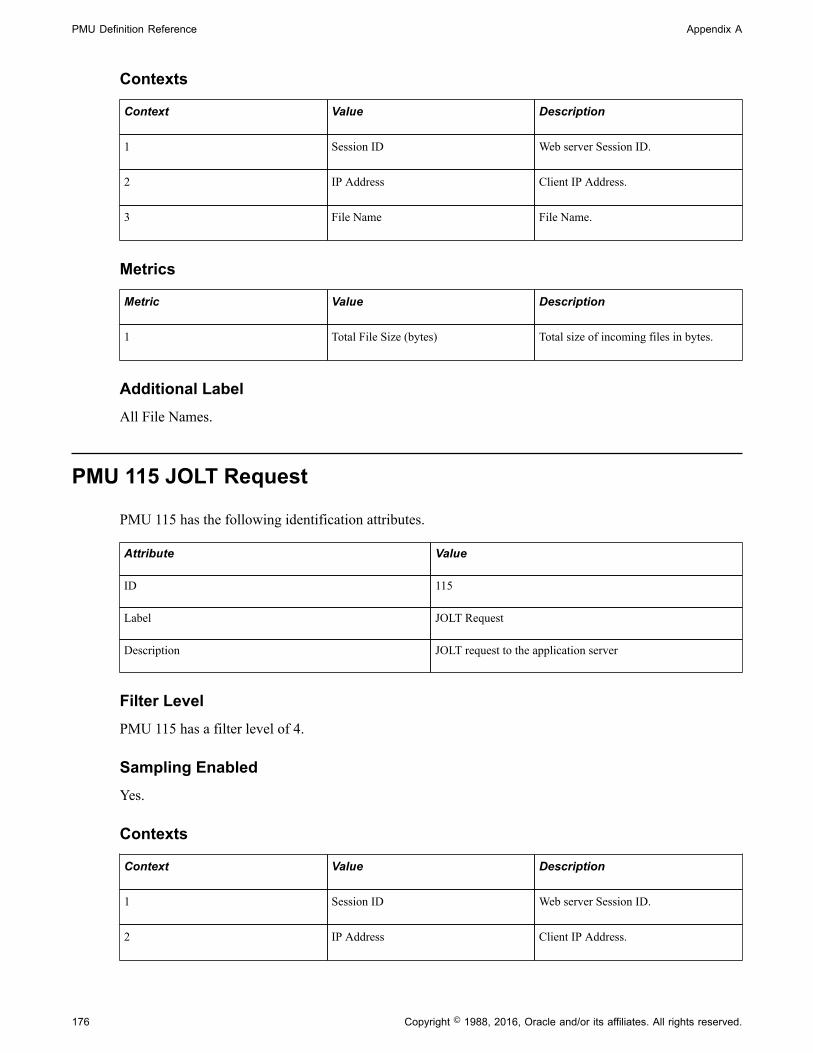
PMU Definition Reference Appendix A
176 Copyright © 1988, 2016, Oracle and/or its affiliates. All rights reserved.
Contexts
Context Value Description
1 Session ID Web server Session ID.
2 IP Address Client IP Address.
3 File Name File Name.
Metrics
Metric Value Description
1 Total File Size (bytes) Total size of incoming files in bytes.
Additional LabelAll File Names.
PMU 115 JOLT Request
PMU 115 has the following identification attributes.
Attribute Value
ID 115
Label JOLT Request
Description JOLT request to the application server
Filter LevelPMU 115 has a filter level of 4.
Sampling EnabledYes.
Contexts
Context Value Description
1 Session ID Web server Session ID.
2 IP Address Client IP Address.

Appendix A PMU Definition Reference
Copyright © 1988, 2016, Oracle and/or its affiliates. All rights reserved. 177
Context Value Description
3 Tuxedo Service Name Tuxedo Service Name, such as ICPanel, ICScript, and so on.
Metrics
Metric Value Description
1 JOLT SendBuf Size (bytes) Size in bytes of the buffer sent to theapplication server.
2 JOLT RecvBuf Size Size in bytes of the buffer received fromthe application server.
3 JOLT Return Code JOLT Return Code.
4 JOLT Request Retried JOLT Request Retried.
Additional LabelError Status Code.
PMU 116 Redirect after Login
PMU 116 has the following identification attributes.
Attribute Value
ID 116
Label Redirect after Login
Description Redirected round trip time (network latency)
Filter LevelPMU 116 has a filter level of 4.
Contexts
Context Value Description
1 Session ID Web server session ID.
2 IP Address Client IP address.

PMU Definition Reference Appendix A
178 Copyright © 1988, 2016, Oracle and/or its affiliates. All rights reserved.
Context Value Description
3 URL redirected to URL redirected to, after logon.
Metrics
Metric Value Description
7 User Agent. User Agent.
PMU 117 Get Content
PMU 117 has the following identification attributes.
Attribute Value
ID 117
Label Get Content
Description Portal requests for content or pagelet
Filter LevelPMU 117 has a filter level of 4.
Sampling EnabledYes.
Contexts
Context Value Description
1 Session ID Web server session ID.
2 IP Address Client IP address.
3 Portal CREF ID Portal CREF ID of this content.
Metrics
Metric Value Description
1 Response Size (bytes) Size of HTML Response in bytes.

Appendix A PMU Definition Reference
Copyright © 1988, 2016, Oracle and/or its affiliates. All rights reserved. 179
Metric Value Description
2 Is this a Pagelet? Boolean - is this is a pagelet or not?
3 Cookie Count Number of cookies received in theresponse.
7 Target CREF Target CREF of the portal page.
Additional LabelURL for which request issued.
PMU 400 Tuxedo Service PCode and SQL
PMU 400 has the following identification attributes.
Attribute Value
ID 400
Label Tuxedo Service PCode and SQL
Description Current SQL and PeopleCode and SQL summary metrics
Filter LevelPMU 400 has a filter level of 4.
Sampling EnabledYes.
Contexts
Context Value Description
1 Generic Generic - Varies based upon server andservice request.
2 Server Name Server Name (such as PSAPPSRV, PSQRYSRV, PSSAMSRV).
3 Tuxedo Service Name Tuxedo Service Name (such as ICPanel, ICScript, and so on).

PMU Definition Reference Appendix A
180 Copyright © 1988, 2016, Oracle and/or its affiliates. All rights reserved.
Metrics
Metric Value Description
1 PeopleCode Exec Time (ms) PeopleCode execution time (milliseconds).
2 PeopleCode SQL Time (ms) Execution Time for SQLExec and SQLobject (milliseconds).
3 PCode BuiltIn SQL Time (ms) Total PeopleCode BuiltIn SQLExecution Time(milliseconds).
4 PeopleTools SQL Time (ms) SQL time excluding PeopleCode andBuiltIn SQL (milliseconds).
5 SQL Fetch Count Total number of rows fetched from thedatabase.
6 SQL Execute Count SQL Execute Count.
7 Trace Level SQL, PeopleCode, and ComponentProcessor trace levels.
Additional LabelCurrent SQL statement.
PMU 401 ICPanel
PMU 401 has the following identification attributes.
Attribute Value
ID 401
Label ICPanel
Description Entry and exit for component search and processing onapplication server
Filter LevelPMU 401 has a filter level of 4.
Sampling EnabledYes.

Appendix A PMU Definition Reference
Copyright © 1988, 2016, Oracle and/or its affiliates. All rights reserved. 181
Contexts
Context Value Description
1 Component Component name.
2 Page Page name.
3 Action Request Action (such as #ICSave) fromweb server to application server
Metrics
Metric Value Description
1 Component Buffer Size (bytes) Size of the component buffer (bytes).
2 Component/Page Deferred Modes Component and Page Processing Modesfor this Request. For example, Off, PageOnly, Component Only, and so on.
3 Field set to Interactive Mode. Boolean - field disallows DeferredProcessing for the Page?
4 Deferred Field Edit Count Number of deferred field edits processedin this request.
7 Action String String passed by web server (such as QE_ABSENCE_HIST$new$0$$0).
Additional LabelComponent Key.
PMU 402 Modal Level 1
PMU 402 has the following identification attributes.
Attribute Value
ID 402
Label Modal Level 1
Description Triggered by Think-Time PeopleCode (DoModal, DoCancel, and so on).
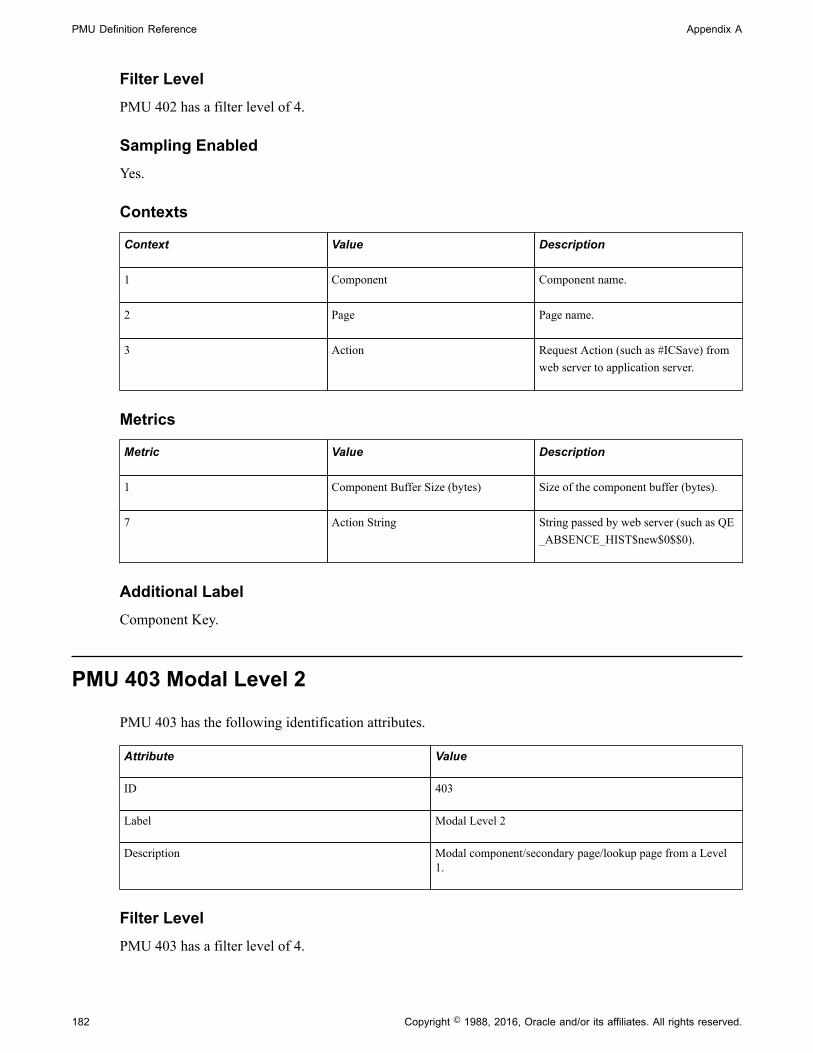
PMU Definition Reference Appendix A
182 Copyright © 1988, 2016, Oracle and/or its affiliates. All rights reserved.
Filter LevelPMU 402 has a filter level of 4.
Sampling EnabledYes.
Contexts
Context Value Description
1 Component Component name.
2 Page Page name.
3 Action Request Action (such as #ICSave) fromweb server to application server.
Metrics
Metric Value Description
1 Component Buffer Size (bytes) Size of the component buffer (bytes).
7 Action String String passed by web server (such as QE_ABSENCE_HIST$new$0$$0).
Additional LabelComponent Key.
PMU 403 Modal Level 2
PMU 403 has the following identification attributes.
Attribute Value
ID 403
Label Modal Level 2
Description Modal component/secondary page/lookup page from a Level1.
Filter LevelPMU 403 has a filter level of 4.

Appendix A PMU Definition Reference
Copyright © 1988, 2016, Oracle and/or its affiliates. All rights reserved. 183
Sampling EnabledYes.
Contexts
Context Value Description
1 Component Component name.
2 Page Page name.
3 Action Request Action (such as #ICSave) fromweb server to application server.
Metrics
Metric Value Description
1 Component Buffer Size (bytes) Size of the component buffer (bytes).
7 Action String String passed by web server (such as QE_ABSENCE_HIST$new$0$$0).
Additional LabelComponent Key.
PMU 404 PeopleCode Program Execution
PMU 404 has the following identification attributes.
Attribute Value
ID 404
Label PeopleCode Program Execution
Description PeopleCode Events, External Function Calls and ApplicationClass Methods
Filter LevelPMU 404 has a filter level of 6.
Sampling EnabledYes.

PMU Definition Reference Appendix A
184 Copyright © 1988, 2016, Oracle and/or its affiliates. All rights reserved.
Contexts
Context Value Description
1 Generic Generic - Varies based upon server andservice request.
2 PeopleCode Program PeopleCode Program Name.
Additional LabelComponent Key.
PMU 406 PeopleCode SQL Execute
PMU 406 has the following identification attributes.
Attribute Value
ID 406
Label PeopleCode SQL Execute
Description Execution of PeopleCode SQLExec and SQL Objects
Filter LevelPMU 406 has a filter level of 5.
Sampling EnabledYes.
Contexts
Context Value Description
1 Generic Generic - Varies based upon server andservice request.
2 PeopleCode Program PeopleCode Program name.
3 SQL Origin SQLExec or SQL Object.
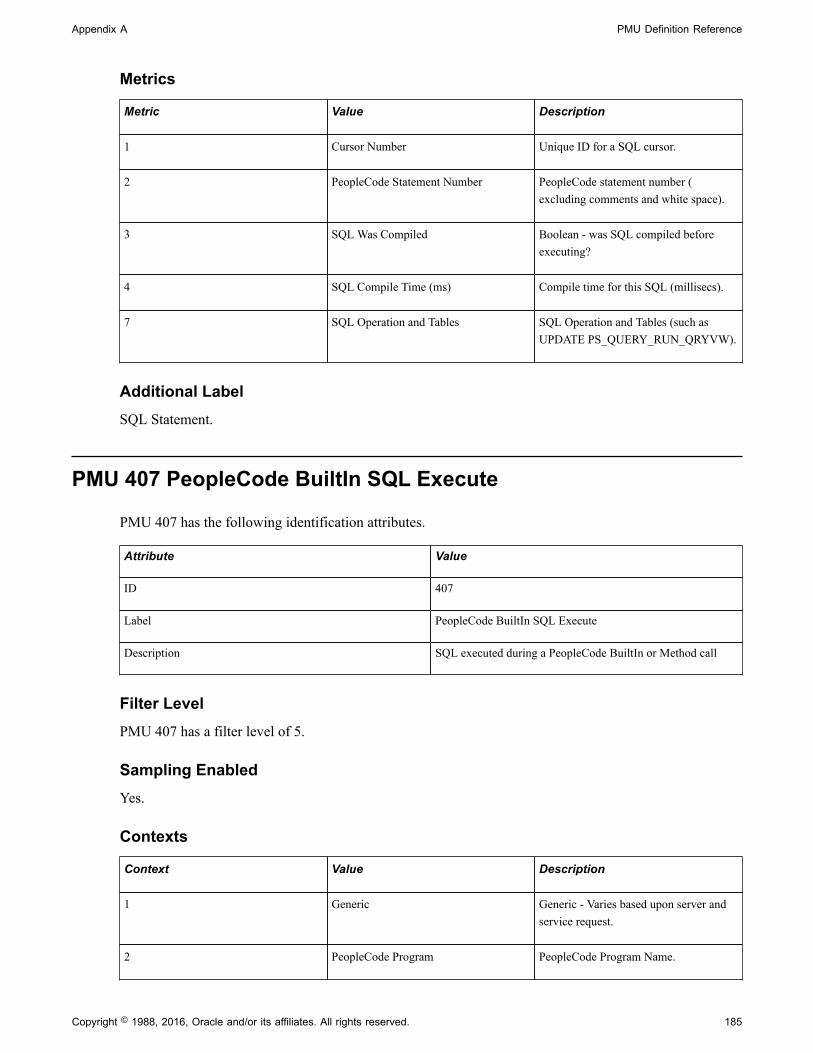
Appendix A PMU Definition Reference
Copyright © 1988, 2016, Oracle and/or its affiliates. All rights reserved. 185
Metrics
Metric Value Description
1 Cursor Number Unique ID for a SQL cursor.
2 PeopleCode Statement Number PeopleCode statement number (excluding comments and white space).
3 SQL Was Compiled Boolean - was SQL compiled beforeexecuting?
4 SQL Compile Time (ms) Compile time for this SQL (millisecs).
7 SQL Operation and Tables SQL Operation and Tables (such asUPDATE PS_QUERY_RUN_QRYVW).
Additional LabelSQL Statement.
PMU 407 PeopleCode BuiltIn SQL Execute
PMU 407 has the following identification attributes.
Attribute Value
ID 407
Label PeopleCode BuiltIn SQL Execute
Description SQL executed during a PeopleCode BuiltIn or Method call
Filter LevelPMU 407 has a filter level of 5.
Sampling EnabledYes.
Contexts
Context Value Description
1 Generic Generic - Varies based upon server andservice request.
2 PeopleCode Program PeopleCode Program Name.

PMU Definition Reference Appendix A
186 Copyright © 1988, 2016, Oracle and/or its affiliates. All rights reserved.
Context Value Description
3 PeopleCode Builtin PeopleCode Built-In Name (such asGetNextNumber).
Metrics
Metric Value Description
1 Cursor Number Unique ID for a SQL cursor.
2 PeopleCode Statement Number PeopleCode statement number (excluding comments and white space).
3 SQL Was Compiled Boolean - was SQL compiled beforeexecuting?
4 SQL Compile Time (ms) Compile time for this SQL (millisecs).
7 SQL Operation and Tables SQL Operation and Tables (such asUPDATE PS_QUERY_RUN_QRYVW).
Additional LabelSQL Statement.
PMU 408 PeopleTools SQL Execute
PMU 408 has the following identification attributes.
Attribute Value
ID 408
Label PeopleTools SQL Execute
Description All SQL calls excluding PMUs 406 and 407
Filter LevelPMU 408 has a filter level of 5.
Sampling EnabledYes.
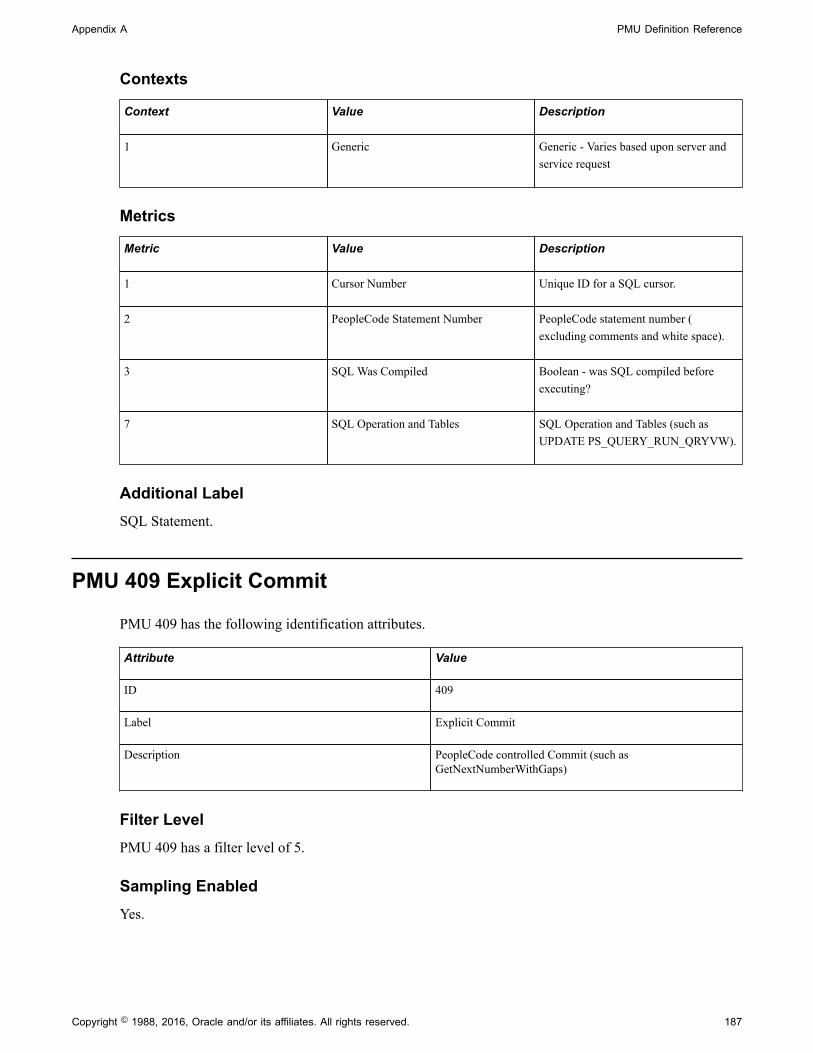
Appendix A PMU Definition Reference
Copyright © 1988, 2016, Oracle and/or its affiliates. All rights reserved. 187
Contexts
Context Value Description
1 Generic Generic - Varies based upon server andservice request
Metrics
Metric Value Description
1 Cursor Number Unique ID for a SQL cursor.
2 PeopleCode Statement Number PeopleCode statement number (excluding comments and white space).
3 SQL Was Compiled Boolean - was SQL compiled beforeexecuting?
7 SQL Operation and Tables SQL Operation and Tables (such asUPDATE PS_QUERY_RUN_QRYVW).
Additional LabelSQL Statement.
PMU 409 Explicit Commit
PMU 409 has the following identification attributes.
Attribute Value
ID 409
Label Explicit Commit
Description PeopleCode controlled Commit (such asGetNextNumberWithGaps)
Filter LevelPMU 409 has a filter level of 5.
Sampling EnabledYes.

PMU Definition Reference Appendix A
188 Copyright © 1988, 2016, Oracle and/or its affiliates. All rights reserved.
Contexts
Context Value Description
1 Generic Generic - Varies based upon server andservice request.
2 PeopleCode Program PeopleCode Program name.
3 PeopleCode Builtin PeopleCode BuiltIn Name (such asGetNextNumber).
Metrics
Metric Value Description
1 PeopleCode Statement Number PeopleCode statement number (excluding comments and white space).
2 Cursor Number Unique ID for a SQL cursor.
PMU 410 ICScript
PMU 410 has the following identification attributes.
Attribute Value
ID 410
Label ICScript
Description Entry and exit for IScript execution on the application server
Filter LevelPMU 410 has a filter level of 4.
Sampling EnabledYes.
Contexts
Context Value Description
1 ICScript URL ICScript URL.
2 PeopleCode Program PeopleCode Program name.

Appendix A PMU Definition Reference
Copyright © 1988, 2016, Oracle and/or its affiliates. All rights reserved. 189
PMU 411 ICQuery
PMU 411 has the following identification attributes.
Attribute Value
ID 411
Label ICQuery
Description Entry and exit for "Run to HTML" queries on the applicationserver.
Filter LevelPMU 411 has a filter level of 4.
Sampling EnabledYes.
Contexts
Context Value Description
1 Query Query name.
2 Action. Request Action (such as #ICSave) fromweb server to the application server.
Metrics
Metric Value Description
1 SQL Fetch Count Total number of rows fetched from thedatabase.
2 Prompt Count How many prompts the query defines asits criteria.
PMU 412 Tuxedo Service Summary
PMU 412 has the following identification attributes.
Attribute Value
ID 412
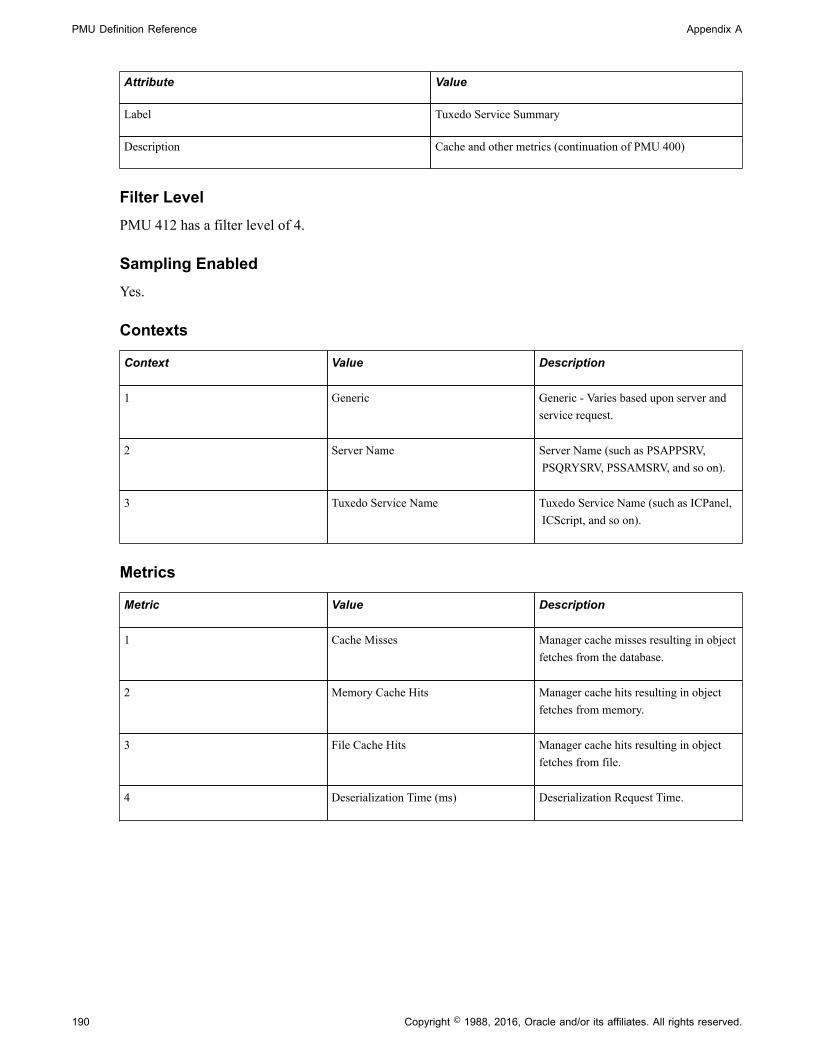
PMU Definition Reference Appendix A
190 Copyright © 1988, 2016, Oracle and/or its affiliates. All rights reserved.
Attribute Value
Label Tuxedo Service Summary
Description Cache and other metrics (continuation of PMU 400)
Filter LevelPMU 412 has a filter level of 4.
Sampling EnabledYes.
Contexts
Context Value Description
1 Generic Generic - Varies based upon server andservice request.
2 Server Name Server Name (such as PSAPPSRV, PSQRYSRV, PSSAMSRV, and so on).
3 Tuxedo Service Name Tuxedo Service Name (such as ICPanel, ICScript, and so on).
Metrics
Metric Value Description
1 Cache Misses Manager cache misses resulting in objectfetches from the database.
2 Memory Cache Hits Manager cache hits resulting in objectfetches from memory.
3 File Cache Hits Manager cache hits resulting in objectfetches from file.
4 Deserialization Time (ms) Deserialization Request Time.

Appendix A PMU Definition Reference
Copyright © 1988, 2016, Oracle and/or its affiliates. All rights reserved. 191
Metric Value Description
5 Serialization Time (ms) Serialization Reply Time.
Serialization time includes HTMLgeneration, building state blob, andsending of the blob to the web server.
• HTML generation.
• Building state blob.
• Sending of the blob to the webserver.
6 PeopleCode Global Size (bytes) Size of serialized global and componentvariables (bytes).
PMU 413 GetCertificate
PMU 413 has the following identification attributes.
Attribute Value
ID 413
Label GetCertificate
Description Metrics for application server user authentication service
Filter LevelPMU 413 has a filter level of 4.
Sampling EnabledYes.
Contexts
Context Value Description
1 Tuxedo Service Name Tuxedo Service Name (such as ICPanel, ICScript, and so on).
2 Reason Reason for Service Request.
3 Not used Not used.

PMU Definition Reference Appendix A
192 Copyright © 1988, 2016, Oracle and/or its affiliates. All rights reserved.
Metrics
Metric Value Description
1 Authenticated? Boolean - Authentication succeeded?
7 Timestamp Timestamp.
PMU 414 SQL Fetch Summary
PMU 414 has the following identification attributes.
Attribute Value
ID 414
Label SQL Fetch Summary
Description Metrics for all SQL fetches for parent SQL (406, 407, 408)
Filter LevelPMU 414 has a filter level of 5.
Sampling EnabledYes.
Contexts
Context Value Description
1 Generic Generic - Varies based upon server andservice request.
2 PeopleCode Program PeopleCode Program name.
3 SQL Fetch Origin SQL Fetch Origin.
Note: Context 2 and Context 3 are populated only for PeopleCode and SQL built-in functions.
Metrics
Metric Value Description
1 SQL Fetch Time (ms) SQL fetch time.

Appendix A PMU Definition Reference
Copyright © 1988, 2016, Oracle and/or its affiliates. All rights reserved. 193
Metric Value Description
2 Cursor Number Unique ID for a SQL cursor.
3 SQL Fetch Count Total number of rows fetched from thedatabase.
7 SQL Operation and Tables SQL Operation and Tables (such asUPDATE PS_QUERY_RUN_QRYVW).
PMU 415 PortalRegistry
PMU 415 has the following identification attributes.
Attribute Value
ID 415
Label PortalRegistry
Description Metrics for Portal registry service call on the application server
Filter LevelPMU 415 has a filter level of 5.
Sampling EnabledYes.
Contexts
Context Value Description
1 Portal Generic - Varies based upon server andservice request.
2 Portal Command Portal Command (such asEPortalCRefByURL).
PMU 416 ICWorklist
PMU 416 has the following identification attributes.

PMU Definition Reference Appendix A
194 Copyright © 1988, 2016, Oracle and/or its affiliates. All rights reserved.
Attribute Value
ID 416
Label ICWorklist
Description Metrics for CICWorkListService::DoService()
Filter LevelPMU 416 has a filter level of 4.
Sampling EnabledYes.
Contexts
Context Value Description
1 Component Component name.
2 Page Page name.
3 Action Request Action (such as #ICSave) fromthe web server to the application server.
PMU 417 FTP Request
PMU 417 has the following identification attributes.
Attribute Value
ID 417
Label FTP Request
Description Metrics for file transfer between application server and FTPserver
Filter LevelPMU 417 has a filter level of 4.
Sampling EnabledYes.
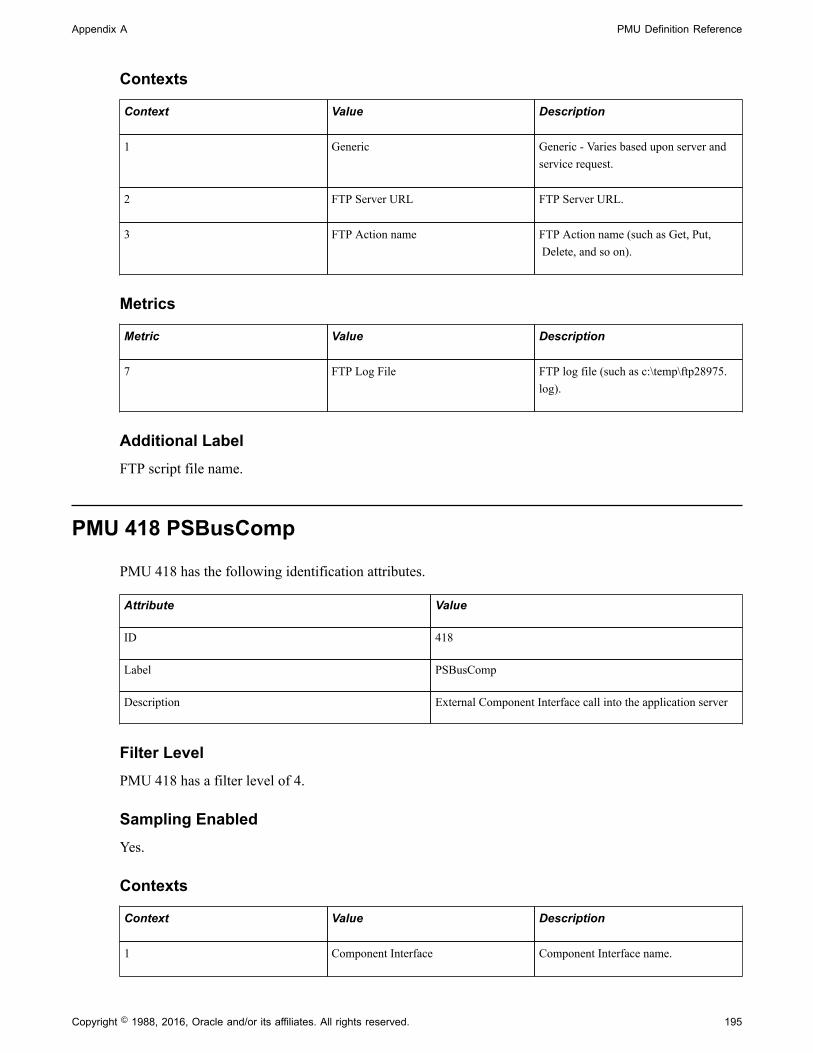
Appendix A PMU Definition Reference
Copyright © 1988, 2016, Oracle and/or its affiliates. All rights reserved. 195
Contexts
Context Value Description
1 Generic Generic - Varies based upon server andservice request.
2 FTP Server URL FTP Server URL.
3 FTP Action name FTP Action name (such as Get, Put, Delete, and so on).
Metrics
Metric Value Description
7 FTP Log File FTP log file (such as c:\temp\ftp28975.log).
Additional LabelFTP script file name.
PMU 418 PSBusComp
PMU 418 has the following identification attributes.
Attribute Value
ID 418
Label PSBusComp
Description External Component Interface call into the application server
Filter LevelPMU 418 has a filter level of 4.
Sampling EnabledYes.
Contexts
Context Value Description
1 Component Interface Component Interface name.

PMU Definition Reference Appendix A
196 Copyright © 1988, 2016, Oracle and/or its affiliates. All rights reserved.
Context Value Description
2 CI Method Name Component Interface method name.
Metrics
Metric Value Description
1 Component Buffer Size (bytes) Size of the component buffer (bytes).
PMU 419 BI GetInterlink
PMU 419 has the following identification attributes.
Attribute Value
ID 419
Label BI GetInterlink
Description PeopleCode Business Interlink GetInterlink call.
Filter LevelPMU 419 has a filter level of 5.
Sampling EnabledYes.
Contexts
Context Value Description
1 Generic Generic - Varies based upon server andservice request.
2 BI Name Business Interlink Name (such as PT_GETSTOCKQUOTE).
Metrics
Metric Value Description
1 Component Buffer Size (bytes) Size of the component buffer (bytes).

Appendix A PMU Definition Reference
Copyright © 1988, 2016, Oracle and/or its affiliates. All rights reserved. 197
PMU 420 BI Execute
PMU 420 has the following identification attributes.
Attribute Value
ID 420
Label BI Execute
Description PeopleCode Business Interlink GetInterlink call
Filter LevelPMU 420 has a filter level of 5.
Sampling EnabledYes.
Contexts
Context Value Description
1 Generic Generic - Varies based upon server andservice request.
2 BI Name Business Interlink Name (such as PT_GETSTOCKQUOTE).
PMU 421 BI BulkExecute
PMU 421 has the following identification attributes.
Attribute Value
ID 421
Label BI BulkExecute
Description PeopleCode Business Interlink BulkExecute call
Filter LevelPMU 421 has a filter level of 5.
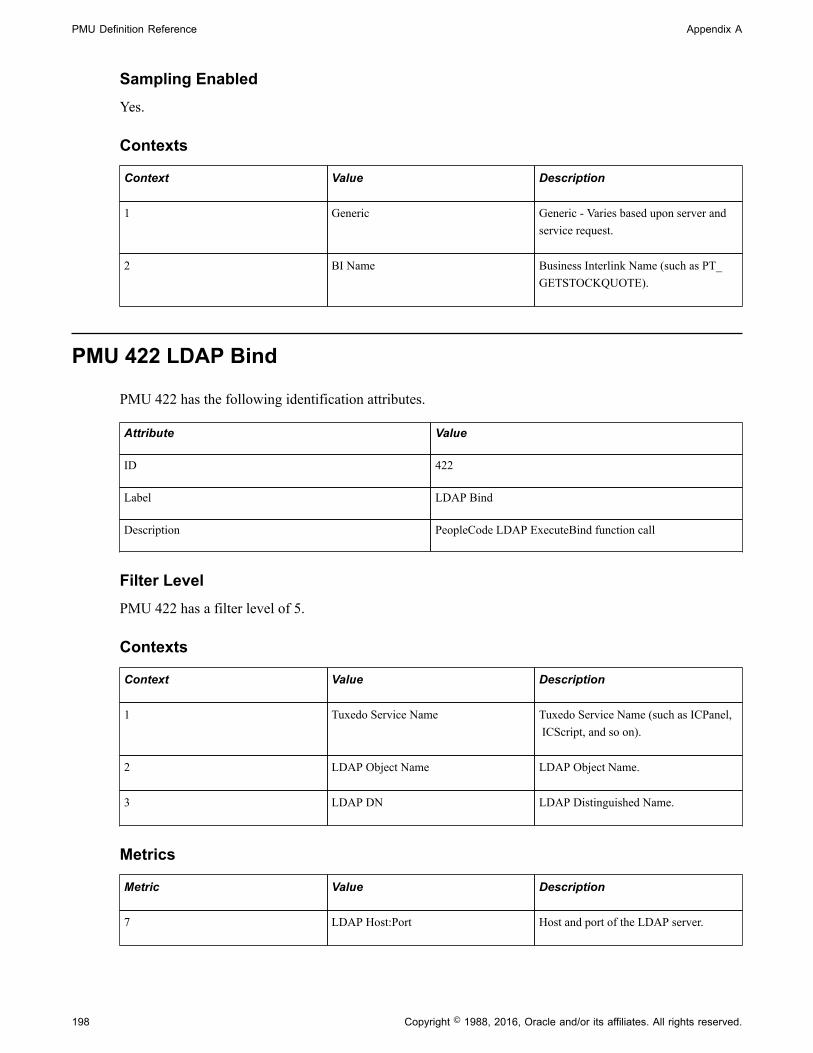
PMU Definition Reference Appendix A
198 Copyright © 1988, 2016, Oracle and/or its affiliates. All rights reserved.
Sampling EnabledYes.
Contexts
Context Value Description
1 Generic Generic - Varies based upon server andservice request.
2 BI Name Business Interlink Name (such as PT_GETSTOCKQUOTE).
PMU 422 LDAP Bind
PMU 422 has the following identification attributes.
Attribute Value
ID 422
Label LDAP Bind
Description PeopleCode LDAP ExecuteBind function call
Filter LevelPMU 422 has a filter level of 5.
Contexts
Context Value Description
1 Tuxedo Service Name Tuxedo Service Name (such as ICPanel, ICScript, and so on).
2 LDAP Object Name LDAP Object Name.
3 LDAP DN LDAP Distinguished Name.
Metrics
Metric Value Description
7 LDAP Host:Port Host and port of the LDAP server.
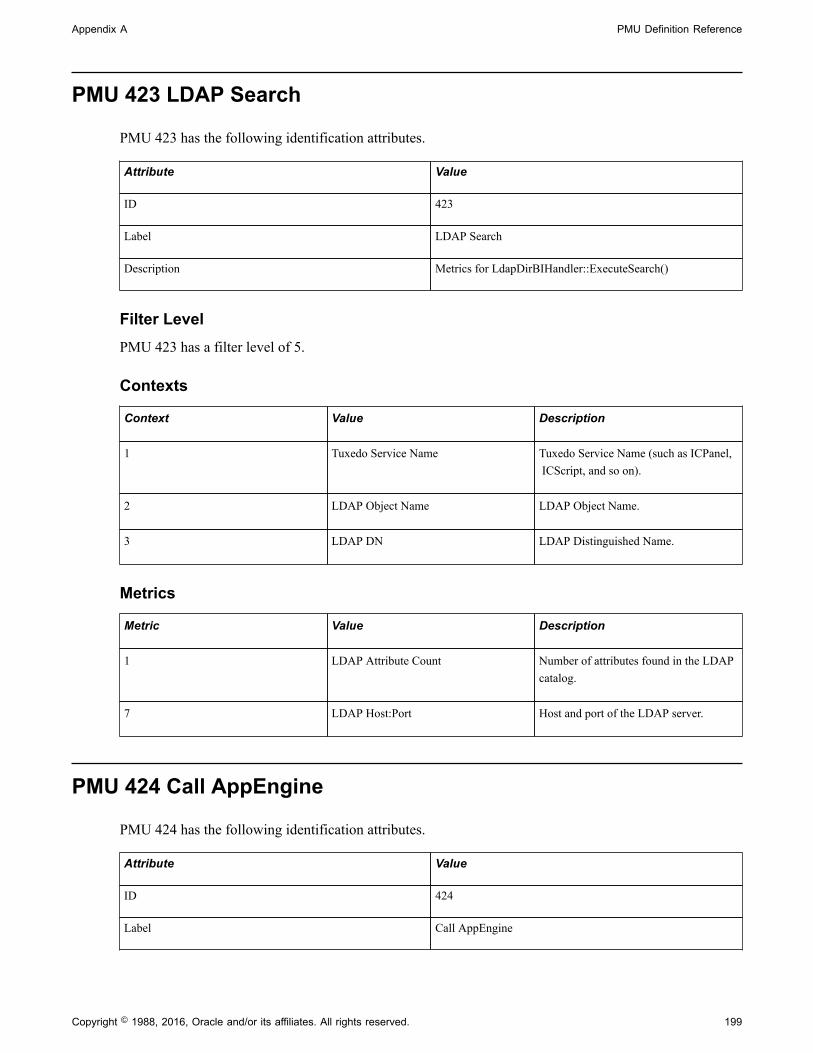
Appendix A PMU Definition Reference
Copyright © 1988, 2016, Oracle and/or its affiliates. All rights reserved. 199
PMU 423 LDAP Search
PMU 423 has the following identification attributes.
Attribute Value
ID 423
Label LDAP Search
Description Metrics for LdapDirBIHandler::ExecuteSearch()
Filter LevelPMU 423 has a filter level of 5.
Contexts
Context Value Description
1 Tuxedo Service Name Tuxedo Service Name (such as ICPanel, ICScript, and so on).
2 LDAP Object Name LDAP Object Name.
3 LDAP DN LDAP Distinguished Name.
Metrics
Metric Value Description
1 LDAP Attribute Count Number of attributes found in the LDAPcatalog.
7 LDAP Host:Port Host and port of the LDAP server.
PMU 424 Call AppEngine
PMU 424 has the following identification attributes.
Attribute Value
ID 424
Label Call AppEngine

PMU Definition Reference Appendix A
200 Copyright © 1988, 2016, Oracle and/or its affiliates. All rights reserved.
Attribute Value
Description PeopleCode CallAppEngine Builtin call
Filter LevelPMU 424 has a filter level of 5.
Sampling EnabledYes.
Contexts
Context Value Description
1 Generic Generic - Varies based upon server andservice request.
2 PeopleCode Program PeopleCode program name.
Metrics
Metric Value Description
7 AppEngine Program Name Application Engine program name.
PMU 425 Implicit Commit
PMU 425 has the following identification attributes.
Attribute Value
ID 425
Label Implicit Commit
Description PeopleTools-controlled SQL commit
Filter LevelPMU 425 has a filter level of 5.
Sampling EnabledYes.
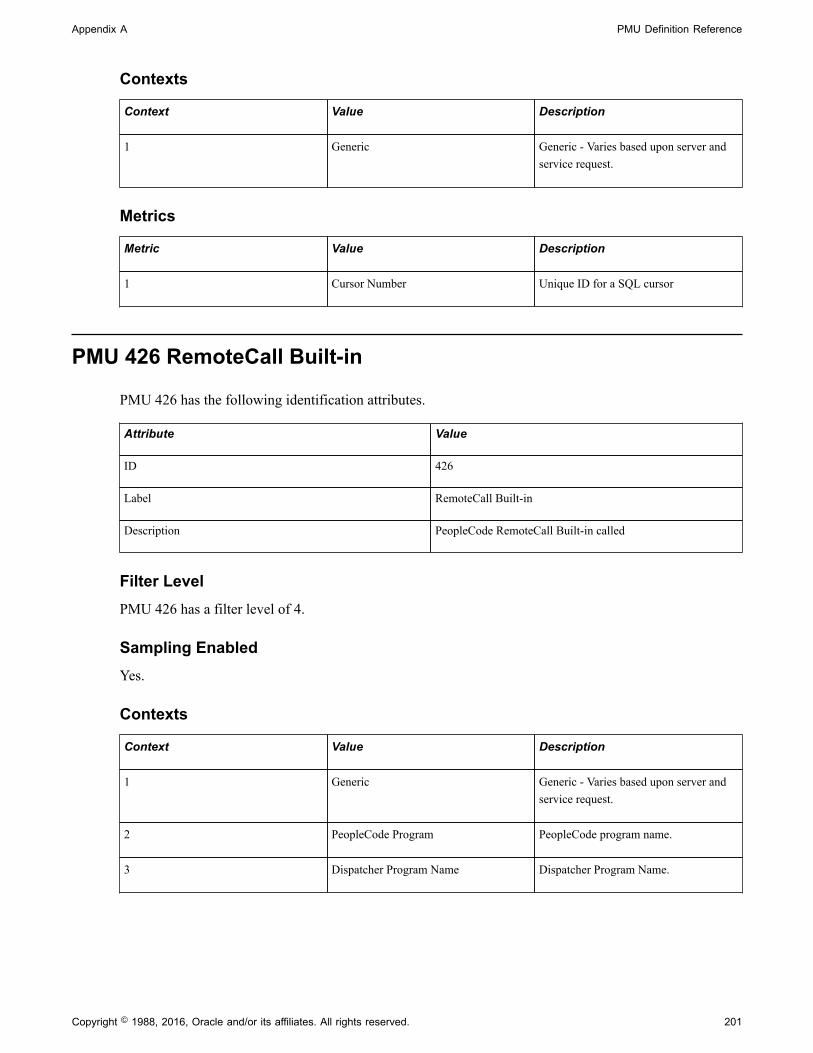
Appendix A PMU Definition Reference
Copyright © 1988, 2016, Oracle and/or its affiliates. All rights reserved. 201
Contexts
Context Value Description
1 Generic Generic - Varies based upon server andservice request.
Metrics
Metric Value Description
1 Cursor Number Unique ID for a SQL cursor
PMU 426 RemoteCall Built-in
PMU 426 has the following identification attributes.
Attribute Value
ID 426
Label RemoteCall Built-in
Description PeopleCode RemoteCall Built-in called
Filter LevelPMU 426 has a filter level of 4.
Sampling EnabledYes.
Contexts
Context Value Description
1 Generic Generic - Varies based upon server andservice request.
2 PeopleCode Program PeopleCode program name.
3 Dispatcher Program Name Dispatcher Program Name.
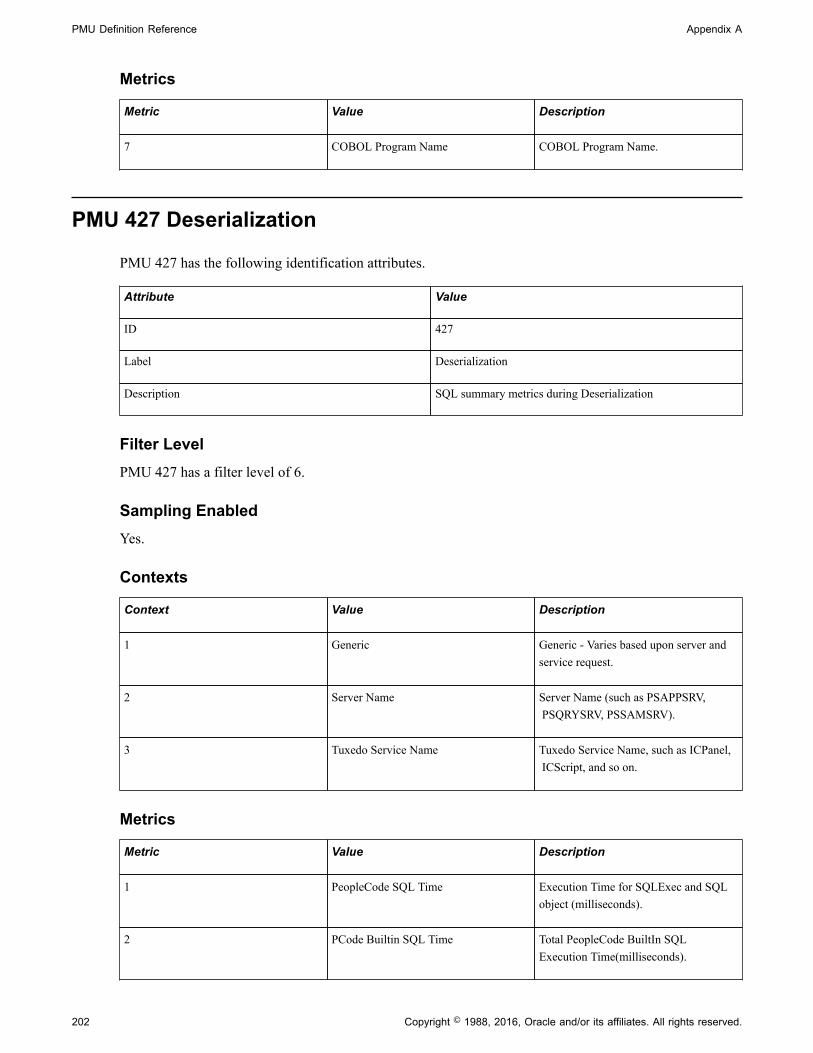
PMU Definition Reference Appendix A
202 Copyright © 1988, 2016, Oracle and/or its affiliates. All rights reserved.
Metrics
Metric Value Description
7 COBOL Program Name COBOL Program Name.
PMU 427 Deserialization
PMU 427 has the following identification attributes.
Attribute Value
ID 427
Label Deserialization
Description SQL summary metrics during Deserialization
Filter LevelPMU 427 has a filter level of 6.
Sampling EnabledYes.
Contexts
Context Value Description
1 Generic Generic - Varies based upon server andservice request.
2 Server Name Server Name (such as PSAPPSRV, PSQRYSRV, PSSAMSRV).
3 Tuxedo Service Name Tuxedo Service Name, such as ICPanel, ICScript, and so on.
Metrics
Metric Value Description
1 PeopleCode SQL Time Execution Time for SQLExec and SQLobject (milliseconds).
2 PCode Builtin SQL Time Total PeopleCode BuiltIn SQLExecution Time(milliseconds).

Appendix A PMU Definition Reference
Copyright © 1988, 2016, Oracle and/or its affiliates. All rights reserved. 203
Metric Value Description
3 PeopleTools SQL Time SQL time excluding PeopleCode andBuiltIn SQL (milliseconds).
4 SQL Fetch Count Total number of rows fetched from thedatabase.
5 SQL Execute Count SQL Execute Count.
PMU 428 Serialization
PMU 428 has the following identification attributes.
Attribute Value
ID 428
Label Serialization
Description SQL summary metrics during serialization
Filter LevelPMU 428 has a filter level of 6.
Sampling EnabledYes.
Contexts
Context Value Description
1 Generic Generic - Varies based upon server andservice request.
2 Server Name Server Name (such as PSAPPSRV, PSQRYSRV, PSSAMSRV).
3 Tuxedo Service Name Tuxedo Service Name, such as ICPanel, ICScript, and so on.

PMU Definition Reference Appendix A
204 Copyright © 1988, 2016, Oracle and/or its affiliates. All rights reserved.
Metrics
Metric Value Description
1 PeopleCode SQL Time Execution Time for SQLExec and SQLobject (milliseconds).
2 PCode Builtin SQL Time Total PeopleCode BuiltIn SQLExecution Time(milliseconds).
3 PeopleTools SQL Time SQL time excluding PeopleCode andBuiltIn SQL (milliseconds).
4 SQL Fetch Count Total number of rows fetched from thedatabase.
5 SQL Execute Count SQL Execute Count.
PMU 439 Workflow PCode Summary
PMU 439 has the following identification attributes.
Attribute Value
ID 439
Label Workflow PCode Summary
Description Component, Component Record and Record Field Events
Filter LevelPMU 439 has a filter level of 5.
Sampling EnabledYes.
Contexts
Context Value Description
1 Generic Generic - Varies based upon server andservice request.
2 PeopleCode Event PeopleCode Event (such asSavePreChange).

Appendix A PMU Definition Reference
Copyright © 1988, 2016, Oracle and/or its affiliates. All rights reserved. 205
Metrics
Metric Value Description
1 Record Field PCode Exec Count Execution count for record field levelPeopleCode.
2 Record Field PCode Exec Time Total execution time for record field-level PCode (ms).
5 Component PCode Exec Count Execution count for component-levelPeopleCode.
6 Component Level PCode Time Total execution time for component-levelPeopleCode (ms).
7 Not used Not used.
Additional LabelNone.
PMU 440 Usage Monitoring
PMU 440 has the following identification attributes.
Attribute Value
ID 440
Label Usage Monitoring
Description Usage Monitoring data
Filter LevelPMU 440 is collected at all filter levels if Usage Monitoring is enabled, otherwise PMU 440 informationis not collected.
Sampling EnabledYes.
ContextsDetermined by PeopleSoft Test Framework (PTF).
Note: Usage Monitor information is intended to be viewed only within the context of PTF reports.
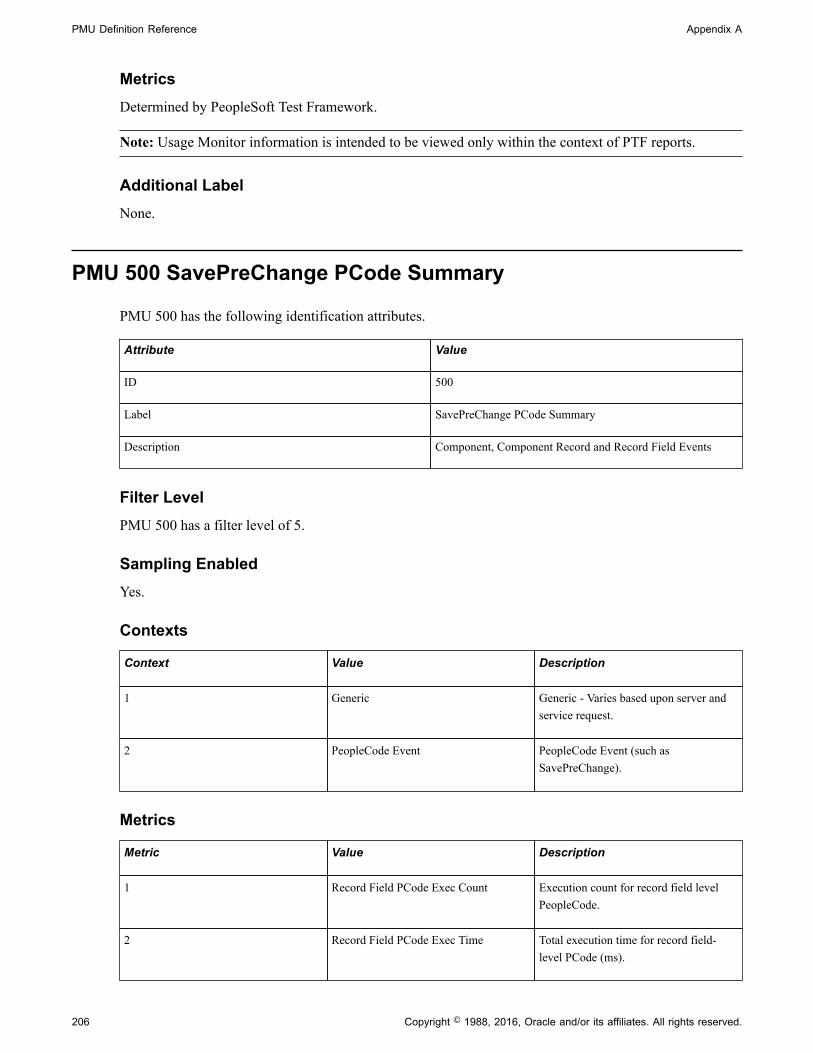
PMU Definition Reference Appendix A
206 Copyright © 1988, 2016, Oracle and/or its affiliates. All rights reserved.
MetricsDetermined by PeopleSoft Test Framework.
Note: Usage Monitor information is intended to be viewed only within the context of PTF reports.
Additional LabelNone.
PMU 500 SavePreChange PCode Summary
PMU 500 has the following identification attributes.
Attribute Value
ID 500
Label SavePreChange PCode Summary
Description Component, Component Record and Record Field Events
Filter LevelPMU 500 has a filter level of 5.
Sampling EnabledYes.
Contexts
Context Value Description
1 Generic Generic - Varies based upon server andservice request.
2 PeopleCode Event PeopleCode Event (such asSavePreChange).
Metrics
Metric Value Description
1 Record Field PCode Exec Count Execution count for record field levelPeopleCode.
2 Record Field PCode Exec Time Total execution time for record field-level PCode (ms).

Appendix A PMU Definition Reference
Copyright © 1988, 2016, Oracle and/or its affiliates. All rights reserved. 207
Metric Value Description
3 Component Rec PCode Exec Count Execution count for component record-level PeopleCode.
4 Component Rec PCode Exec Time Total execution time for componentrecord PeopleCode (ms).
5 Component PCode Exec Count Execution count for component-levelPeopleCode.
6 Component Level PCode Time Total execution time for component-levelPeopleCode (ms).
PMU 501 SavePostChange PCode Summary
PMU 501 has the following identification attributes.
Attribute Value
ID 501
Label SavePostChange PCode Summary
Description Component, Component Record and Record Field Events
Filter LevelPMU 501 has a filter level of 5.
Sampling EnabledYes.
Contexts
Context Value Description
1 Generic Generic - Varies based upon server andservice request.
2 PeopleCode Event PeopleCode Event (such asSavePreChange).
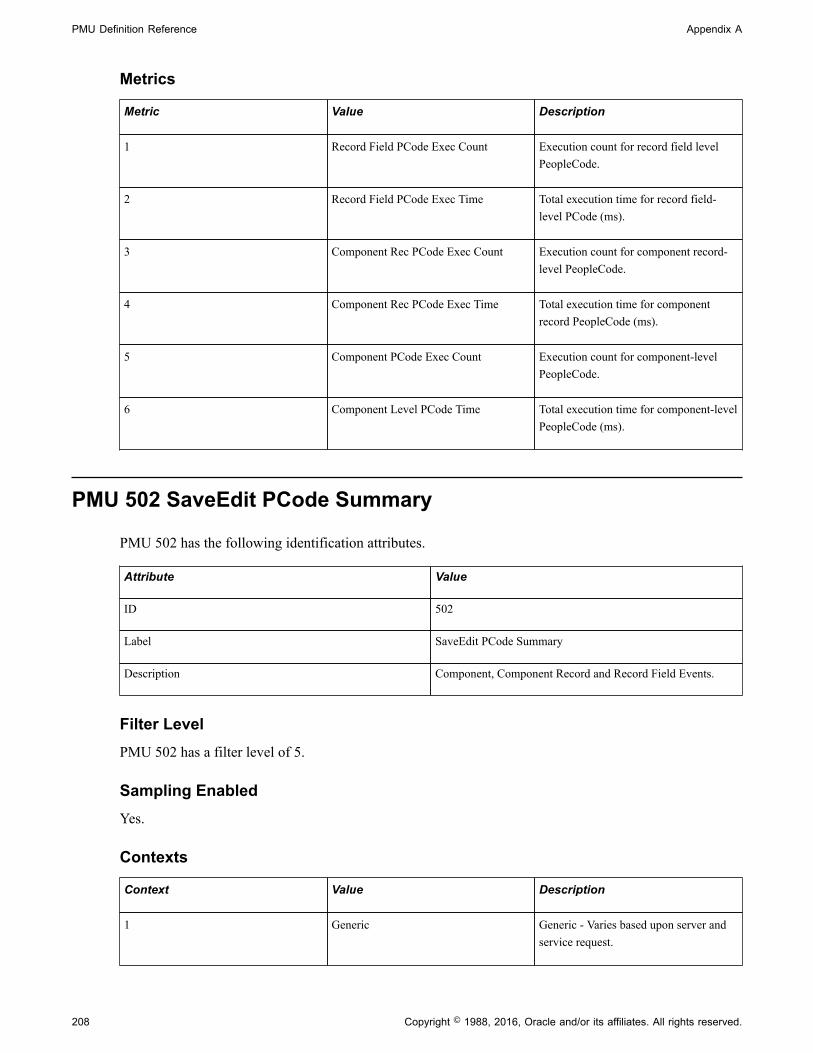
PMU Definition Reference Appendix A
208 Copyright © 1988, 2016, Oracle and/or its affiliates. All rights reserved.
Metrics
Metric Value Description
1 Record Field PCode Exec Count Execution count for record field levelPeopleCode.
2 Record Field PCode Exec Time Total execution time for record field-level PCode (ms).
3 Component Rec PCode Exec Count Execution count for component record-level PeopleCode.
4 Component Rec PCode Exec Time Total execution time for componentrecord PeopleCode (ms).
5 Component PCode Exec Count Execution count for component-levelPeopleCode.
6 Component Level PCode Time Total execution time for component-levelPeopleCode (ms).
PMU 502 SaveEdit PCode Summary
PMU 502 has the following identification attributes.
Attribute Value
ID 502
Label SaveEdit PCode Summary
Description Component, Component Record and Record Field Events.
Filter LevelPMU 502 has a filter level of 5.
Sampling EnabledYes.
Contexts
Context Value Description
1 Generic Generic - Varies based upon server andservice request.

Appendix A PMU Definition Reference
Copyright © 1988, 2016, Oracle and/or its affiliates. All rights reserved. 209
Context Value Description
2 PeopleCode Event PeopleCode Event (such asSavePreChange).
Metrics
Metric Value Description
1 Record Field PCode Exec Count Execution count for record field levelPeopleCode.
2 Record Field PCode Exec Time Total execution time for record field-level PCode (ms).
3 Component Rec PCode Exec Count Execution count for component record-level PeopleCode.
4 Component Rec PCode Exec Time Total execution time for componentrecord PeopleCode (ms).
PMU 503 SaveEdit PCode Summary
PMU 503 has the following identification attributes.
Attribute Value
ID 503
Label SaveEdit PCode Summary
Description Component Record and Record Field Events
Filter LevelPMU 503 has a filter level of 5.
Sampling EnabledYes.
Contexts
Context Value Description
1 Generic Generic - Varies based upon server andservice request.
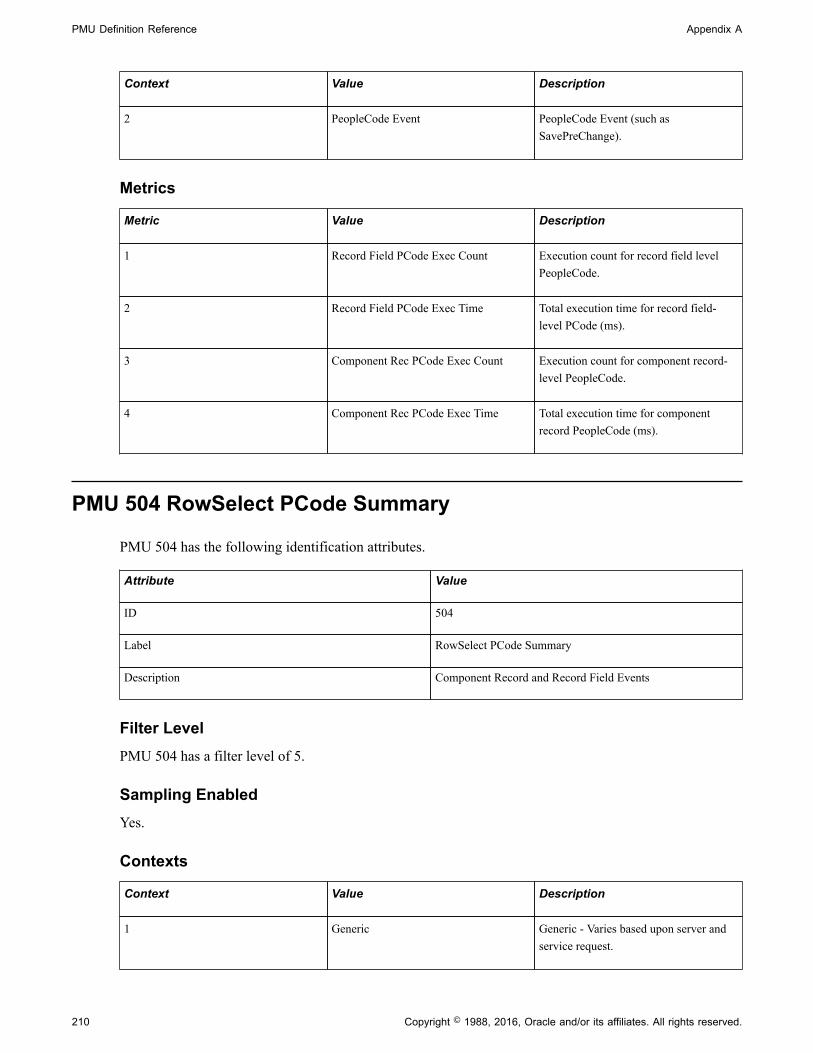
PMU Definition Reference Appendix A
210 Copyright © 1988, 2016, Oracle and/or its affiliates. All rights reserved.
Context Value Description
2 PeopleCode Event PeopleCode Event (such asSavePreChange).
Metrics
Metric Value Description
1 Record Field PCode Exec Count Execution count for record field levelPeopleCode.
2 Record Field PCode Exec Time Total execution time for record field-level PCode (ms).
3 Component Rec PCode Exec Count Execution count for component record-level PeopleCode.
4 Component Rec PCode Exec Time Total execution time for componentrecord PeopleCode (ms).
PMU 504 RowSelect PCode Summary
PMU 504 has the following identification attributes.
Attribute Value
ID 504
Label RowSelect PCode Summary
Description Component Record and Record Field Events
Filter LevelPMU 504 has a filter level of 5.
Sampling EnabledYes.
Contexts
Context Value Description
1 Generic Generic - Varies based upon server andservice request.

Appendix A PMU Definition Reference
Copyright © 1988, 2016, Oracle and/or its affiliates. All rights reserved. 211
Context Value Description
2 PeopleCode Event PeopleCode Event (such asSavePreChange).
Metrics
Metric Value Description
1 Record Field PCode Exec Count Execution count for record field levelPeopleCode.
2 Record Field PCode Exec Time Total execution time for record field-level PCode (ms).
3 Component Rec PCode Exec Count Execution count for component record-level PeopleCode.
4 Component Rec PCode Exec Time Total execution time for componentrecord PeopleCode (ms).
PMU 505 RowInsert PCode Summary
PMU 505 has the following identification attributes.
Attribute Value
ID 505
Label RowInsert PCode Summary
Description Component Record and Record Field Events
Filter LevelPMU 505 has a filter level of 5.
Sampling EnabledYes.
Contexts
Context Value Description
1 Generic Generic - Varies based upon server andservice request.

PMU Definition Reference Appendix A
212 Copyright © 1988, 2016, Oracle and/or its affiliates. All rights reserved.
Context Value Description
2 PeopleCode Event PeopleCode Event (such asSavePreChange).
Metrics
Metric Value Description
1 Record Field PCode Exec Count Execution count for record field levelPeopleCode.
2 Record Field PCode Exec Time Total execution time for record field-level PCode (ms).
3 Component Rec PCode Exec Count Execution count for component record-level PeopleCode.
4 Component Rec PCode Exec Time Total execution time for componentrecord PeopleCode (ms).
PMU 506 RowDelete PCode Summary
PMU 506 has the following identification attributes.
Attribute Value
ID 506
Label RowDelete PCode Summary
Description Component Record and Record Field Events
Filter LevelPMU 506 has a filter level of 5.
Sampling EnabledYes.
Contexts
Context Value Description
1 Generic Generic - Varies based upon server andservice request.

Appendix A PMU Definition Reference
Copyright © 1988, 2016, Oracle and/or its affiliates. All rights reserved. 213
Context Value Description
2 PeopleCode Event PeopleCode Event (such asSavePreChange).
3 Not used Not used.
Metrics
Metric Value Description
1 Record Field PCode Exec Count Execution count for record field levelPeopleCode.
2 Record Field PCode Exec Time Total execution time for record field-level PCode (ms).
3 Component Rec PCode Exec Count Execution count for component record-level PeopleCode.
4 Component Rec PCode Exec Time Total execution time for componentrecord PeopleCode (ms).
PMU 507 FieldChange PCode Summary
PMU 507 has the following identification attributes.
Attribute Value
ID 507
Label FieldChange PCode Summary
Description Component Record and Record Field Events
Filter LevelPMU 507 has a filter level of 5.
Sampling EnabledYes.
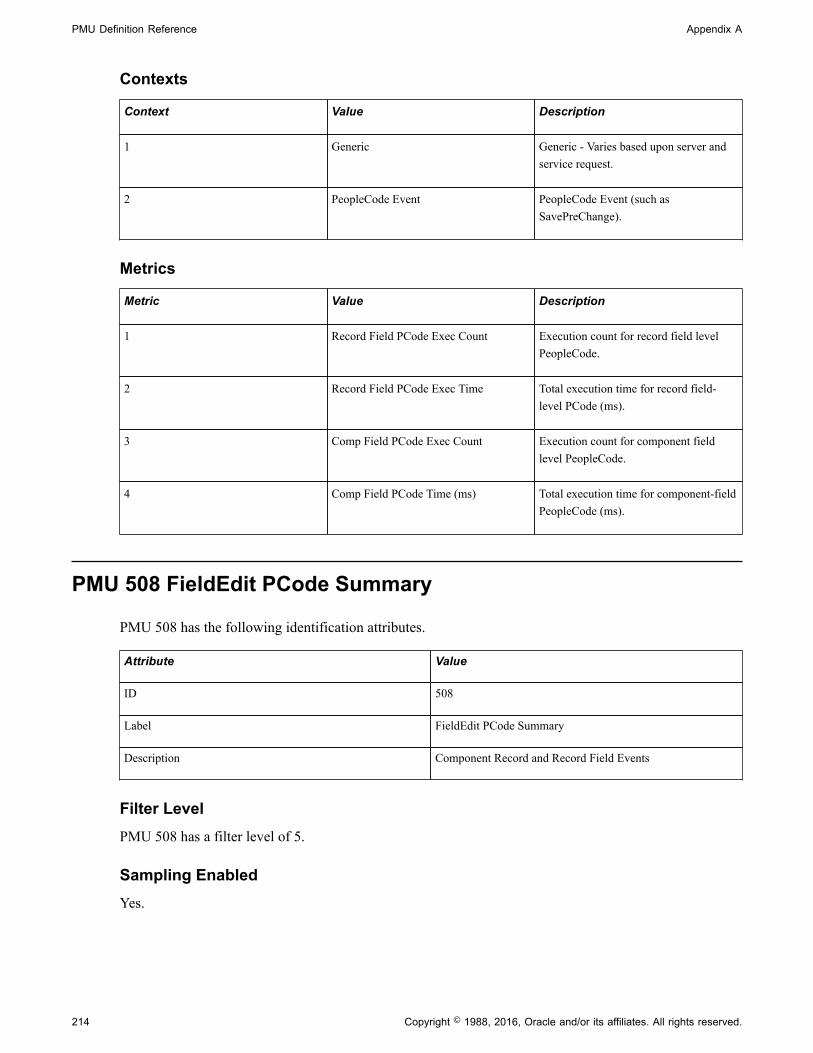
PMU Definition Reference Appendix A
214 Copyright © 1988, 2016, Oracle and/or its affiliates. All rights reserved.
Contexts
Context Value Description
1 Generic Generic - Varies based upon server andservice request.
2 PeopleCode Event PeopleCode Event (such asSavePreChange).
Metrics
Metric Value Description
1 Record Field PCode Exec Count Execution count for record field levelPeopleCode.
2 Record Field PCode Exec Time Total execution time for record field-level PCode (ms).
3 Comp Field PCode Exec Count Execution count for component fieldlevel PeopleCode.
4 Comp Field PCode Time (ms) Total execution time for component-fieldPeopleCode (ms).
PMU 508 FieldEdit PCode Summary
PMU 508 has the following identification attributes.
Attribute Value
ID 508
Label FieldEdit PCode Summary
Description Component Record and Record Field Events
Filter LevelPMU 508 has a filter level of 5.
Sampling EnabledYes.

Appendix A PMU Definition Reference
Copyright © 1988, 2016, Oracle and/or its affiliates. All rights reserved. 215
Contexts
Context Value Description
1 Generic Generic - Varies based upon server andservice request.
2 PeopleCode Event PeopleCode Event (such asSavePreChange).
Metrics
Metric Value Description
1 Record Field PCode Exec Count Execution count for record field levelPeopleCode.
2 Record Field PCode Exec Time Total execution time for record field-level PCode (ms).
3 Comp Field PCode Exec Count Execution count for component fieldlevel PeopleCode.
4 Comp Field PCode Time (ms) Total execution time for component-fieldPeopleCode (ms).
PMU 509 FieldDefault PCode Summary
PMU 509 has the following identification attributes.
Attribute Value
ID 509
Label FieldDefault PCode Summary
Description Component Record and Record Field Events
Filter LevelPMU 509 has a filter level of 5.
Sampling EnabledYes.

PMU Definition Reference Appendix A
216 Copyright © 1988, 2016, Oracle and/or its affiliates. All rights reserved.
Contexts
Context Value Description
1 Generic Generic - Varies based upon server andservice request.
2 PeopleCode Event PeopleCode Event (such asSavePreChange).
Metrics
Metric Value Description
1 Record Field PCode Exec Count Execution count for record field levelPeopleCode.
2 Record Field PCode Exec Time Total execution time for record field-level PCode (ms).
3 Comp Field PCode Exec Count Execution count for component fieldlevel PeopleCode.
4 Comp Field PCode Time (ms) Total execution time for component-fieldPeopleCode (ms).
PMU 510 PrePopup PCode Summary
PMU 510 has the following identification attributes.
Attribute Value
ID 510
Label PrePopup PCode Summary
Description Component Record and Record Field Events
Filter LevelPMU 510 has a filter level of 5.
Sampling EnabledYes.
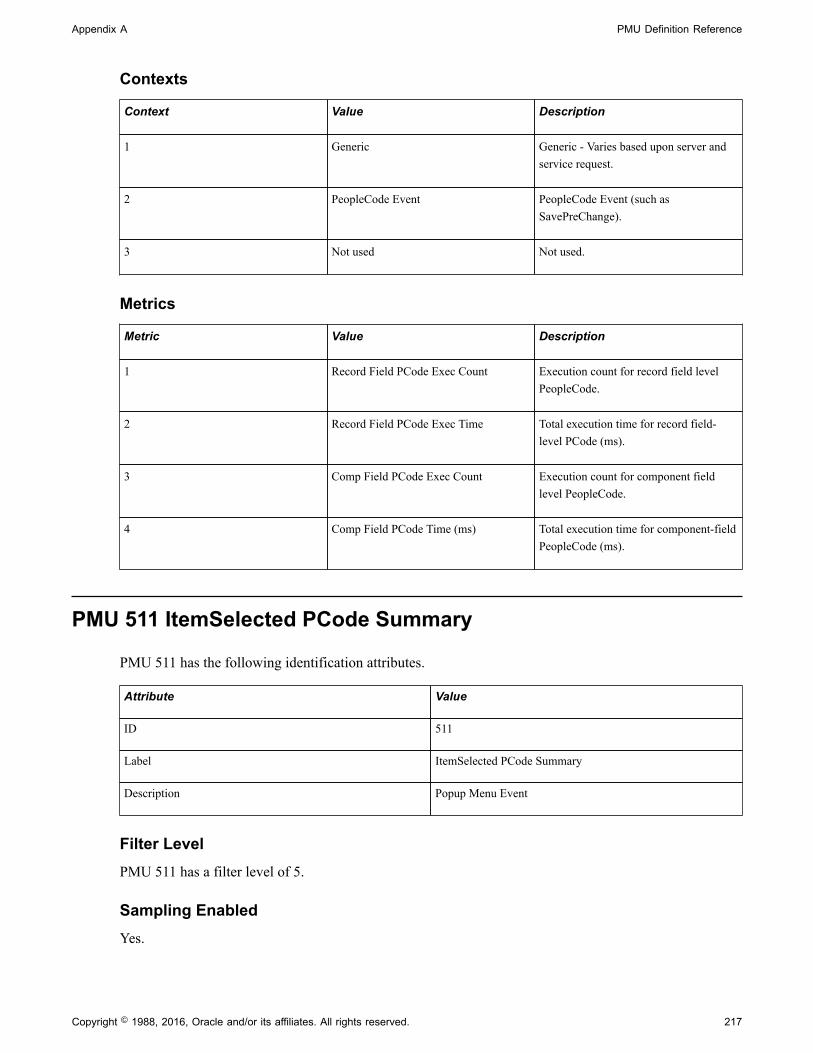
Appendix A PMU Definition Reference
Copyright © 1988, 2016, Oracle and/or its affiliates. All rights reserved. 217
Contexts
Context Value Description
1 Generic Generic - Varies based upon server andservice request.
2 PeopleCode Event PeopleCode Event (such asSavePreChange).
3 Not used Not used.
Metrics
Metric Value Description
1 Record Field PCode Exec Count Execution count for record field levelPeopleCode.
2 Record Field PCode Exec Time Total execution time for record field-level PCode (ms).
3 Comp Field PCode Exec Count Execution count for component fieldlevel PeopleCode.
4 Comp Field PCode Time (ms) Total execution time for component-fieldPeopleCode (ms).
PMU 511 ItemSelected PCode Summary
PMU 511 has the following identification attributes.
Attribute Value
ID 511
Label ItemSelected PCode Summary
Description Popup Menu Event
Filter LevelPMU 511 has a filter level of 5.
Sampling EnabledYes.
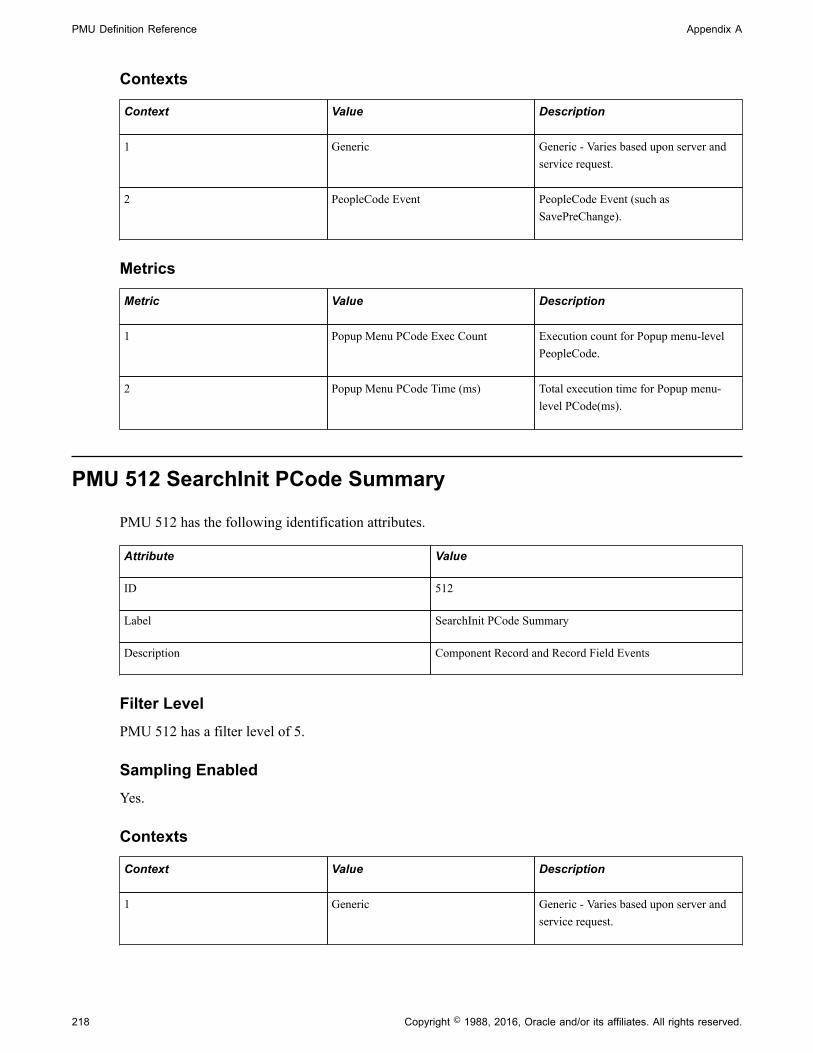
PMU Definition Reference Appendix A
218 Copyright © 1988, 2016, Oracle and/or its affiliates. All rights reserved.
Contexts
Context Value Description
1 Generic Generic - Varies based upon server andservice request.
2 PeopleCode Event PeopleCode Event (such asSavePreChange).
Metrics
Metric Value Description
1 Popup Menu PCode Exec Count Execution count for Popup menu-levelPeopleCode.
2 Popup Menu PCode Time (ms) Total execution time for Popup menu-level PCode(ms).
PMU 512 SearchInit PCode Summary
PMU 512 has the following identification attributes.
Attribute Value
ID 512
Label SearchInit PCode Summary
Description Component Record and Record Field Events
Filter LevelPMU 512 has a filter level of 5.
Sampling EnabledYes.
Contexts
Context Value Description
1 Generic Generic - Varies based upon server andservice request.
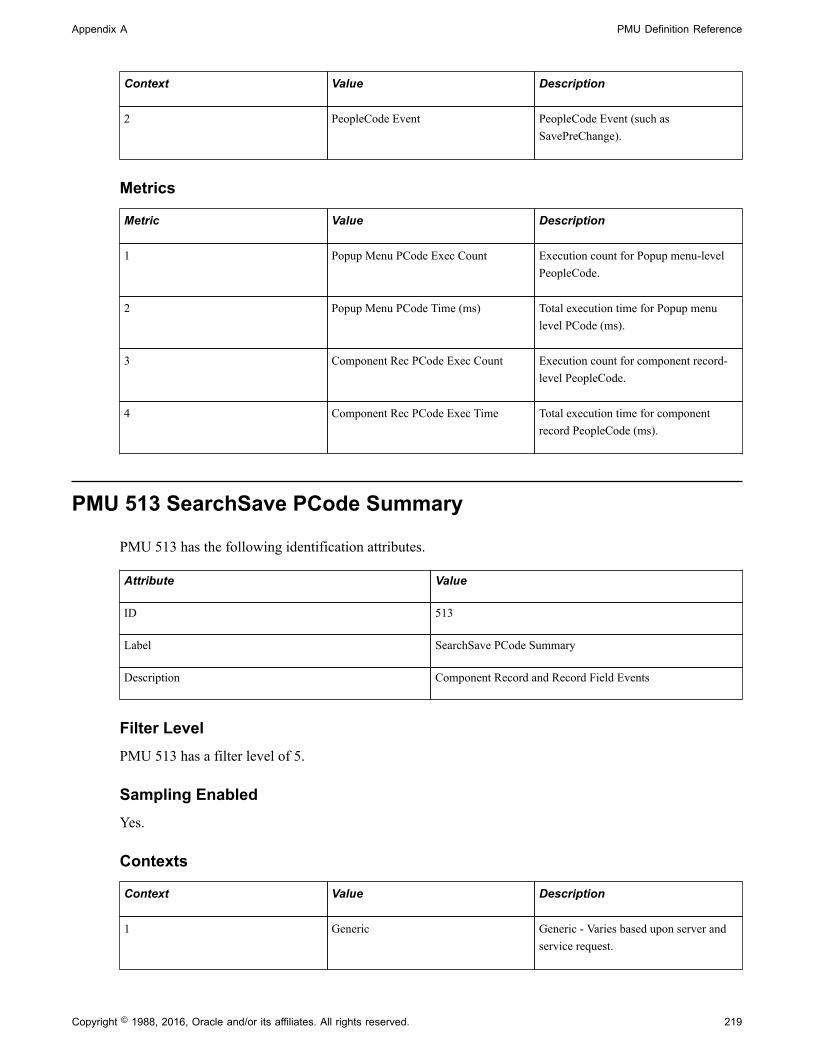
Appendix A PMU Definition Reference
Copyright © 1988, 2016, Oracle and/or its affiliates. All rights reserved. 219
Context Value Description
2 PeopleCode Event PeopleCode Event (such asSavePreChange).
Metrics
Metric Value Description
1 Popup Menu PCode Exec Count Execution count for Popup menu-levelPeopleCode.
2 Popup Menu PCode Time (ms) Total execution time for Popup menulevel PCode (ms).
3 Component Rec PCode Exec Count Execution count for component record-level PeopleCode.
4 Component Rec PCode Exec Time Total execution time for componentrecord PeopleCode (ms).
PMU 513 SearchSave PCode Summary
PMU 513 has the following identification attributes.
Attribute Value
ID 513
Label SearchSave PCode Summary
Description Component Record and Record Field Events
Filter LevelPMU 513 has a filter level of 5.
Sampling EnabledYes.
Contexts
Context Value Description
1 Generic Generic - Varies based upon server andservice request.

PMU Definition Reference Appendix A
220 Copyright © 1988, 2016, Oracle and/or its affiliates. All rights reserved.
Context Value Description
2 PeopleCode Event PeopleCode Event (such asSavePreChange).
3 Not used Not used.
Metrics
Metric Value Description
1 Record Field PCode Exec Count Execution count for record field levelPeopleCode.
2 Record Field PCode Exec Time Total execution time for record field-level PCode (ms).
3 Component Rec PCode Exec Count Execution count for component record-level PeopleCode.
4 Component Rec PCode Exec Time Total execution time for componentrecord PeopleCode (ms).
Additional LabelNone.
PMU 514 Active PCode Summary
PMU 514 has the following identification attributes.
Attribute Value
ID 514
Label Active PCode Summary
Description Page Events
Filter LevelPMU 514 has a filter level of 5.
Sampling EnabledYes.

Appendix A PMU Definition Reference
Copyright © 1988, 2016, Oracle and/or its affiliates. All rights reserved. 221
Contexts
Context Value Description
1 Generic Generic - Varies based upon server andservice request.
2 PeopleCode Event PeopleCode Event (such asSavePreChange).
3 Not used Not used.
Metrics
Metric Value Description
1 Page PCode Exec Count Execution count for page-levelPeopleCode.
2 Page PCode Time (ms) Total execution time for page-levelPeopleCode (ms).
PMU 515 PreBuild PCode Summary
PMU 515 has the following identification attributes.
Attribute Value
ID 515
Label PreBuild PCode Summary
Description Component Events
Filter LevelPMU 515 has a filter level of 5.
Sampling EnabledYes.
Contexts
Context Value Description
1 Generic Generic - Varies based upon server andservice request.
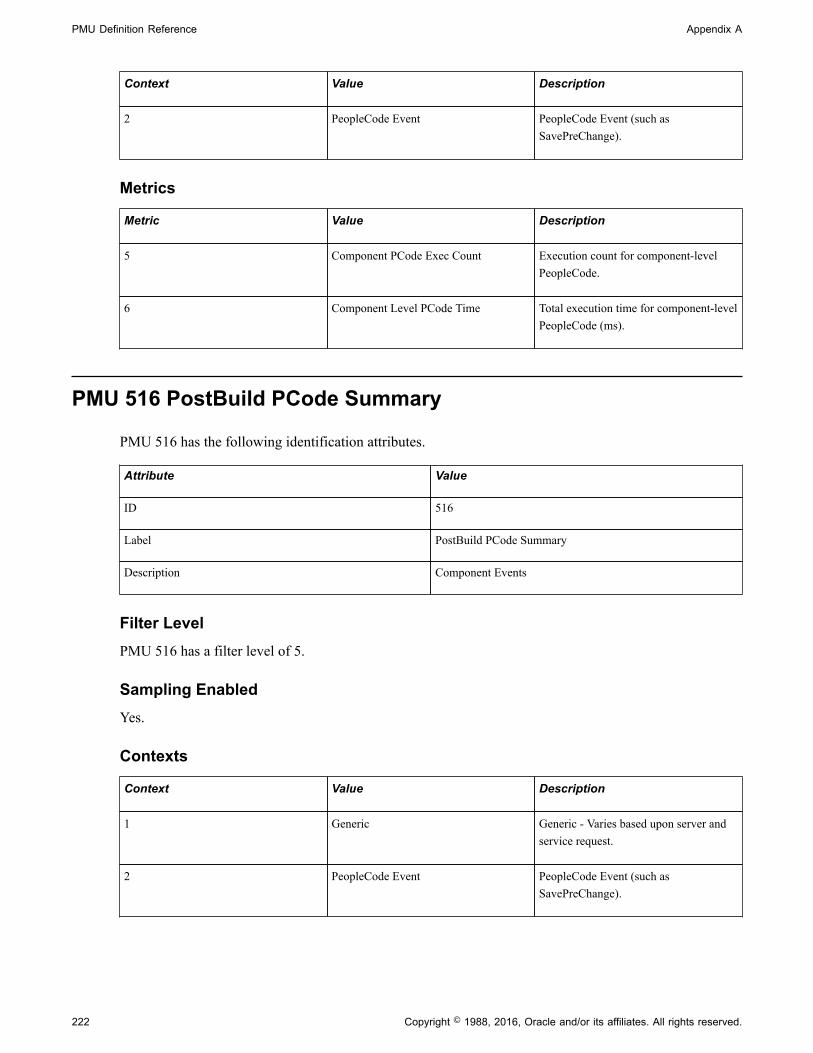
PMU Definition Reference Appendix A
222 Copyright © 1988, 2016, Oracle and/or its affiliates. All rights reserved.
Context Value Description
2 PeopleCode Event PeopleCode Event (such asSavePreChange).
Metrics
Metric Value Description
5 Component PCode Exec Count Execution count for component-levelPeopleCode.
6 Component Level PCode Time Total execution time for component-levelPeopleCode (ms).
PMU 516 PostBuild PCode Summary
PMU 516 has the following identification attributes.
Attribute Value
ID 516
Label PostBuild PCode Summary
Description Component Events
Filter LevelPMU 516 has a filter level of 5.
Sampling EnabledYes.
Contexts
Context Value Description
1 Generic Generic - Varies based upon server andservice request.
2 PeopleCode Event PeopleCode Event (such asSavePreChange).

Appendix A PMU Definition Reference
Copyright © 1988, 2016, Oracle and/or its affiliates. All rights reserved. 223
Metrics
Metric Value Description
5 Component PCode Exec Count Execution count for component-levelPeopleCode.
6 Component Level PCode Time Total execution time for component-levelPeopleCode (ms).
PMU 700 PPMI Servlet
PMU 700 has the following identification attributes.
Attribute Value
ID 700
Label PPMI Servlet
Description Reported at entry and exit of PPMI servlet
Filter LevelPMU 700 has a filter level of 5.
Sampling EnabledYes.
Contexts
Context Value Description
1 Session ID Web server session ID.
2 IP Address Client IP address.
PMU 800 Monitor Servlet Request
PMU 800 has the following identification attributes.
Attribute Value
ID 800

PMU Definition Reference Appendix A
224 Copyright © 1988, 2016, Oracle and/or its affiliates. All rights reserved.
Attribute Value
Label Monitoring Servlet Request
Description Monitoring Servlet Incoming Buffer from Agent
Filter LevelPMU 800 has a filter level of 6.
Sampling EnabledYes.
Contexts
Context Value Description
1 Session ID Web server session ID.
2 IP Address Client IP address.
3 Agent ID PeopleSoft Performance Monitor AgentID.
Metrics
Metric Value Description
1 Monitor Buffer Size (bytes) Number of data objects (Events &PMUs) in incoming buffer.
2 Collator Group Count Number of collator groups to whichevents were reported.
3 Agent Version Agent version number.
4 Not used Not used
5 Not used Not used
6 Not used Not used
7 Not used Not used
Additional LabelNone.

Appendix A PMU Definition Reference
Copyright © 1988, 2016, Oracle and/or its affiliates. All rights reserved. 225
PMU 801 Analytic Server RequestPMU 801 has the following identification attributes.
Attribute Value
ID 801
Label Analytic Server Request
Description Request to Analytic Server
Filter LevelPMU 801 has a filter level of 5.
Contexts
Context Value Description
1 Analytic Instance Analytic instance describing the request.
2 Request Name Describes the specific request code. Forexample, Load Analytic Instance —LOAD INSTANCE.
3 Analytic Model If available, the analytic model for whichthe request was made.
Metrics
Metric Value Description
1 VM Bytes at Request Start Total virtual memory consumed by theprocess at the start of the request.
2 Working Set (bytes) at Request Start Amount of physical memory consumedby the process at the completion of therequest.
3 VM Bytes at Request End Total virtual memory consumed by theprocess at completion of the request.
4 Working Set (bytes) at Request End Amount of physical memory consumedat the completion of the request.
PMU 802 Synchronize/Read Data from Data Cache SummaryPMU 802 has the following identification attributes.

PMU Definition Reference Appendix A
226 Copyright © 1988, 2016, Oracle and/or its affiliates. All rights reserved.
Attribute Value
ID 802
Label Analytic Data Cache Read Request Summary
Description Read data request to the Analytic Server Data Cache Summary
Filter LevelPMU 802 has a filter level of 5 (Verbose).
Contexts
Context Value Description
1 Analytic Instance Analytic instance describing the request.
2 Transaction Name Optimization/ACE (Analytic CalculationEngine) transaction.
Metrics
Metric Value Description
1 Total Records Read Total number of records read.
2 Total Rows Read Total number of rows read.
PMU 803 Synchronize/Write Data to Data Cache SummaryPMU 803 has the following identification attributes.
Attribute Value
ID 803
Label Analytic Data Cache Write Request Summary
Description Write data request to Analytic Server Data Cache Summary
Filter LevelPMU 803 has a filter level of 5 (Verbose).

Appendix A PMU Definition Reference
Copyright © 1988, 2016, Oracle and/or its affiliates. All rights reserved. 227
Contexts
Context Value Description
1 Analytic Instance Analytic instance describing the request.
2 Transaction Name Optimization/ACE (Analytic CalculationEngine) transaction.
Metrics
Metric Value Description
1 Total Records Written Total number of records written to thedatabase.
2 Total Rows Written Total number of rows written to thedatabase.
PMU 804 Synchronize/Read Data from Data Cache DetailsPMU 804 has the following identification attributes.
Attribute Value
ID 804
Label Analytic Data Cache Read Request Details.
Description Read data request to Analytic Server Data Cache Details.
Filter LevelPMU 804 has a filter level of 6 (Debug).
Contexts
Context Value Description
1 Analytic Instance Analytic instance describing the request.
2 Transaction Name Optimization/ACE transaction.
3 Record Name Name of the record to be read from theData Cache.
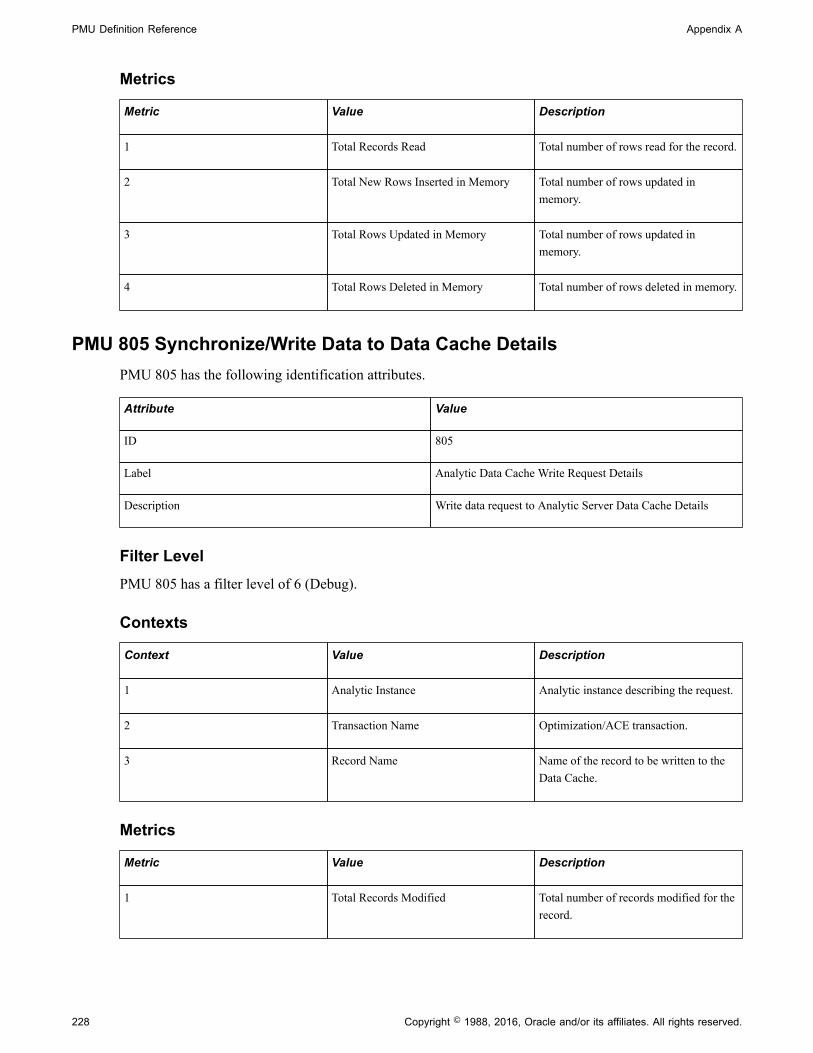
PMU Definition Reference Appendix A
228 Copyright © 1988, 2016, Oracle and/or its affiliates. All rights reserved.
Metrics
Metric Value Description
1 Total Records Read Total number of rows read for the record.
2 Total New Rows Inserted in Memory Total number of rows updated inmemory.
3 Total Rows Updated in Memory Total number of rows updated inmemory.
4 Total Rows Deleted in Memory Total number of rows deleted in memory.
PMU 805 Synchronize/Write Data to Data Cache DetailsPMU 805 has the following identification attributes.
Attribute Value
ID 805
Label Analytic Data Cache Write Request Details
Description Write data request to Analytic Server Data Cache Details
Filter LevelPMU 805 has a filter level of 6 (Debug).
Contexts
Context Value Description
1 Analytic Instance Analytic instance describing the request.
2 Transaction Name Optimization/ACE transaction.
3 Record Name Name of the record to be written to theData Cache.
Metrics
Metric Value Description
1 Total Records Modified Total number of records modified for therecord.

Appendix A PMU Definition Reference
Copyright © 1988, 2016, Oracle and/or its affiliates. All rights reserved. 229
Metric Value Description
2 Total New Rows Inserted into the DataCache
Total number of new rows inserted intothe Data Cache.
3 Total Rows Updated in the Data Cache Total number of rows updated in theData Cache.
4 Total Rows Deleted in the Data Cache Total number of rows deleted in the DataCache.
PMU 806 Load ACE Model Trees SummaryPMU 806 has the following identification attributes.
Attribute Value
ID 806
Label Load ACE Model Trees Summary
Description Load ACE Model Trees Summary
Filter LevelPMU 806 has a filter level of 5 (Verbose).
Contexts
Context Value Description
1 Analytic Instance Analytic instance describing the request.
2 Analytic Model Analytic Model Name.
Metrics
Metric Value Description
1 Total ACE Trees Loaded Total number of ACE trees loaded.
2 Total Number of Nodes Read Total number of tree nodes read.
3 Total Number of Tree Node OverrideValues
Total number of tree node overridevalues read.
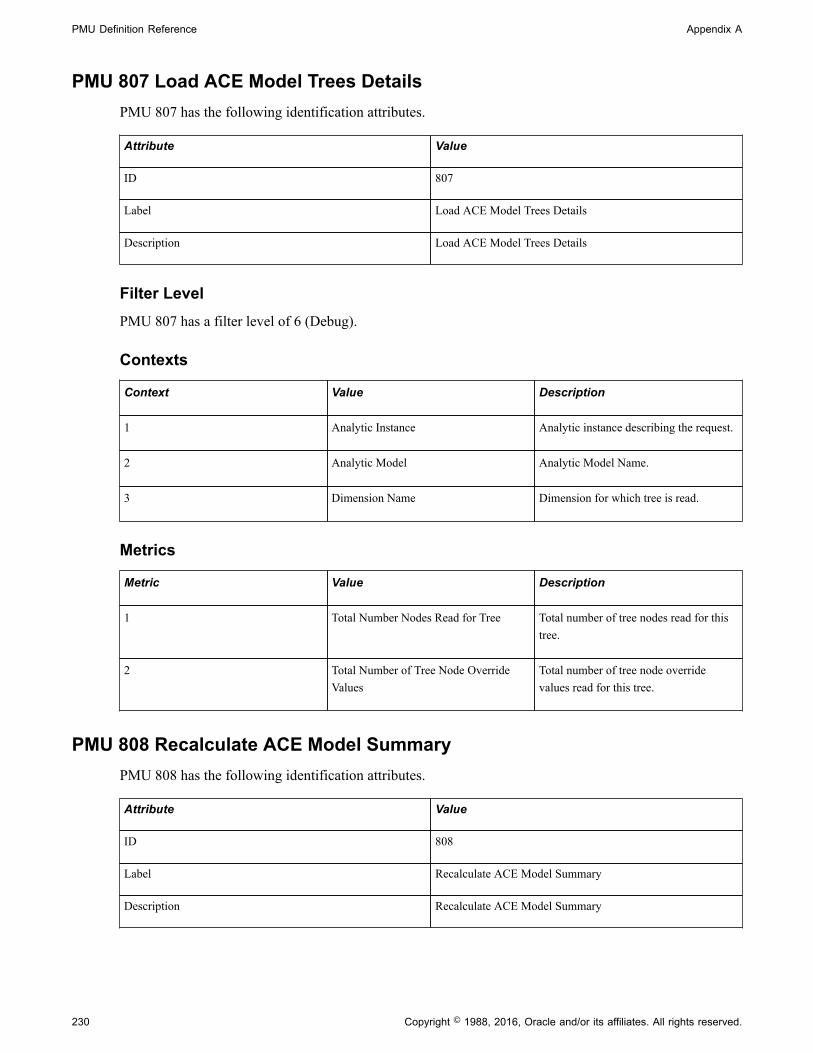
PMU Definition Reference Appendix A
230 Copyright © 1988, 2016, Oracle and/or its affiliates. All rights reserved.
PMU 807 Load ACE Model Trees DetailsPMU 807 has the following identification attributes.
Attribute Value
ID 807
Label Load ACE Model Trees Details
Description Load ACE Model Trees Details
Filter LevelPMU 807 has a filter level of 6 (Debug).
Contexts
Context Value Description
1 Analytic Instance Analytic instance describing the request.
2 Analytic Model Analytic Model Name.
3 Dimension Name Dimension for which tree is read.
Metrics
Metric Value Description
1 Total Number Nodes Read for Tree Total number of tree nodes read for thistree.
2 Total Number of Tree Node OverrideValues
Total number of tree node overridevalues read for this tree.
PMU 808 Recalculate ACE Model SummaryPMU 808 has the following identification attributes.
Attribute Value
ID 808
Label Recalculate ACE Model Summary
Description Recalculate ACE Model Summary
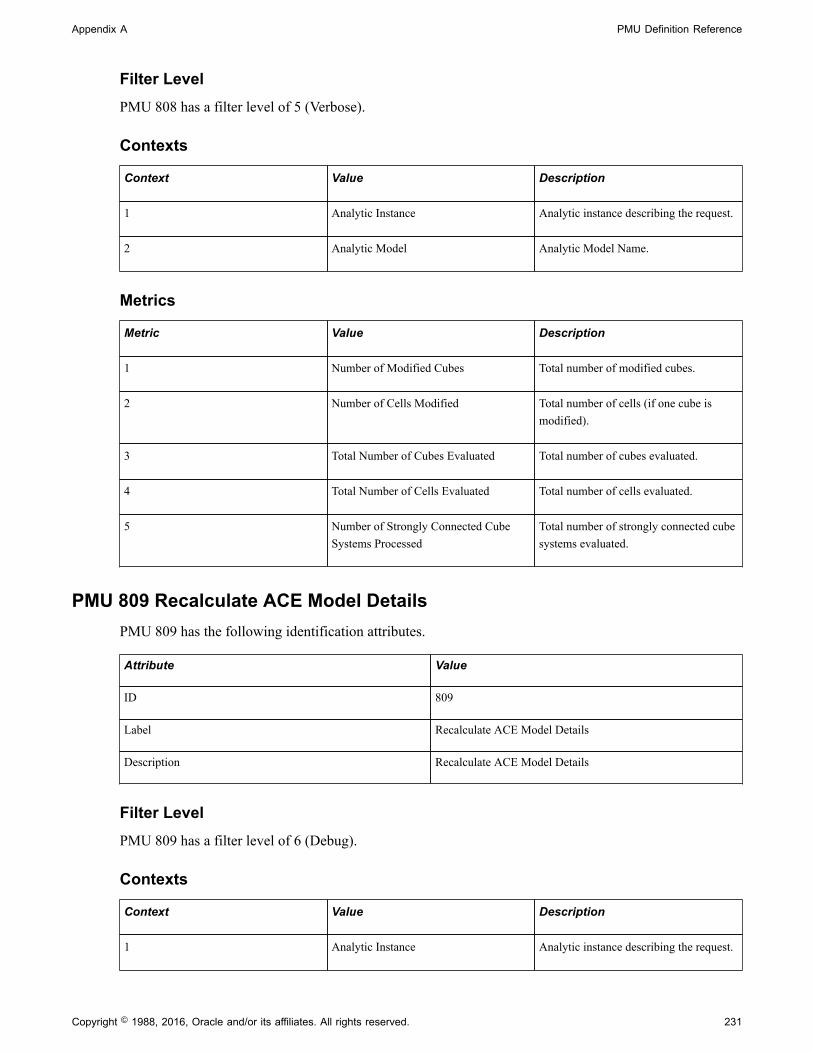
Appendix A PMU Definition Reference
Copyright © 1988, 2016, Oracle and/or its affiliates. All rights reserved. 231
Filter LevelPMU 808 has a filter level of 5 (Verbose).
Contexts
Context Value Description
1 Analytic Instance Analytic instance describing the request.
2 Analytic Model Analytic Model Name.
Metrics
Metric Value Description
1 Number of Modified Cubes Total number of modified cubes.
2 Number of Cells Modified Total number of cells (if one cube ismodified).
3 Total Number of Cubes Evaluated Total number of cubes evaluated.
4 Total Number of Cells Evaluated Total number of cells evaluated.
5 Number of Strongly Connected CubeSystems Processed
Total number of strongly connected cubesystems evaluated.
PMU 809 Recalculate ACE Model DetailsPMU 809 has the following identification attributes.
Attribute Value
ID 809
Label Recalculate ACE Model Details
Description Recalculate ACE Model Details
Filter LevelPMU 809 has a filter level of 6 (Debug).
Contexts
Context Value Description
1 Analytic Instance Analytic instance describing the request.

PMU Definition Reference Appendix A
232 Copyright © 1988, 2016, Oracle and/or its affiliates. All rights reserved.
Context Value Description
2 Analytic Model Analytic Model Name.
3 First Cube in Strongly Connected Cubes First cube in strongly connected cubesrepresenting the evaluation unit.
Metrics
Metric Value Description
1 Total Number of Cubes Evaluated Total number of cubes evaluated.
2 Total Number of Cells Evaluated Total number of cells evaluated.
3 Number of Iterations of a StronglyConnected Cube System
Total number of iterations on thestrongly connected cube system.
PMU 810 ACE Model Get DataPMU 810 has the following identification attributes.
Attribute Value
ID 810
Label ACE Model Get Data
Description ACE Model Get Data
Filter LevelPMU 810 has a filter level of 5 (Verbose).
Contexts
Context Value Description
1 Analytic Instance Analytic instance describing the request.
2 Analytic Model Analytic model name.
3 Cube Collection Name Cube collection for which the data isread.
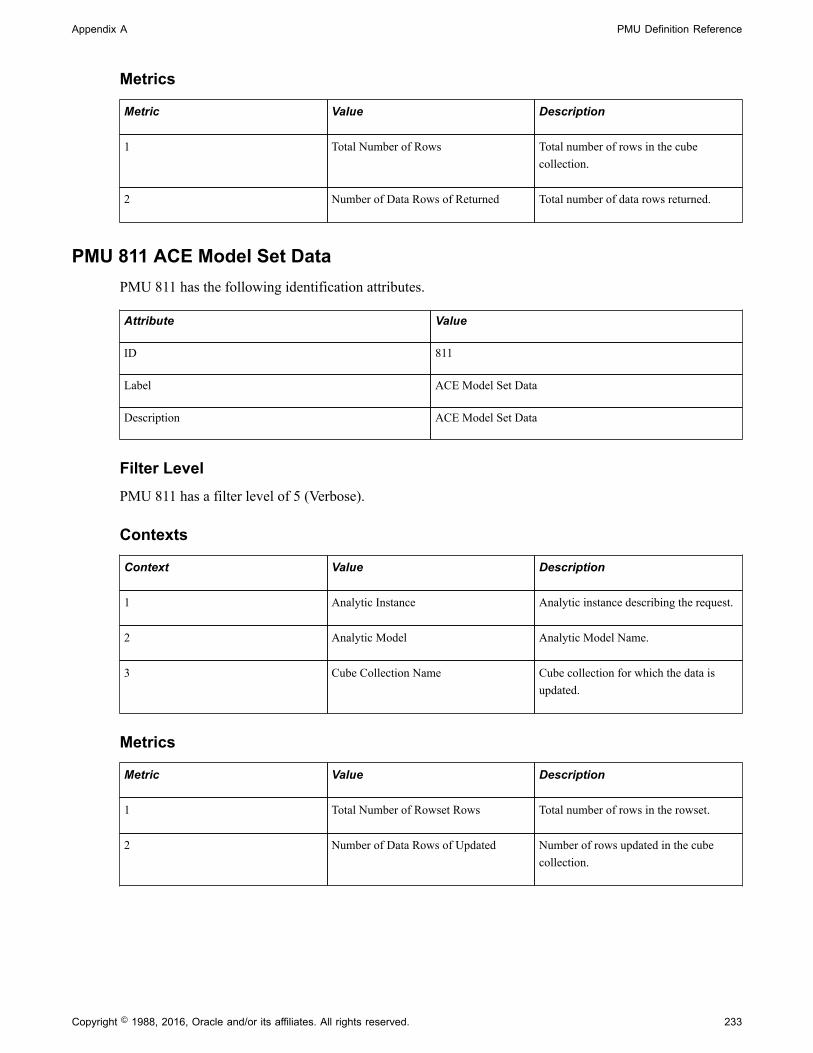
Appendix A PMU Definition Reference
Copyright © 1988, 2016, Oracle and/or its affiliates. All rights reserved. 233
Metrics
Metric Value Description
1 Total Number of Rows Total number of rows in the cubecollection.
2 Number of Data Rows of Returned Total number of data rows returned.
PMU 811 ACE Model Set DataPMU 811 has the following identification attributes.
Attribute Value
ID 811
Label ACE Model Set Data
Description ACE Model Set Data
Filter LevelPMU 811 has a filter level of 5 (Verbose).
Contexts
Context Value Description
1 Analytic Instance Analytic instance describing the request.
2 Analytic Model Analytic Model Name.
3 Cube Collection Name Cube collection for which the data isupdated.
Metrics
Metric Value Description
1 Total Number of Rowset Rows Total number of rows in the rowset.
2 Number of Data Rows of Updated Number of rows updated in the cubecollection.


Copyright © 1988, 2016, Oracle and/or its affiliates. All rights reserved. 235
Appendix B
Event Definition Reference
Event 150
Event 150 has the following identification attributes.
Attribute Value
ID 150
Label JVM Status
Description JVM Status
Filter LevelEvent 150 has a filter level of 4.
Metrics
Metric Value Description
1 %JVM Memory Free JVM % of available memory.
2 Max JVM Memory Available JVM Max bytes available.
3 Sessions in Web-App JVM Number of sessions in WebApplication.
4 Execute Threads JVM Number of execute threads.
5 Busy Threads JVM Number of busy threads.
6 Domain Count Number of domains on the web server.
Event 151
Event 151 has the following identification attributes.
Attribute Value
ID 151

Event Definition Reference Appendix B
236 Copyright © 1988, 2016, Oracle and/or its affiliates. All rights reserved.
Attribute Value
Label Network Status
Description Netstat socket counts and other network traffic metrics
Filter LevelEvent 151 has a filter level of 4.
Metrics
Metric Value Description
1 Time_Wait Sockets Number of sockets in Time_Wait statereported by Netstat.
2 Close_Wait Sockets Number of sockets in Close_Wait statereported by Netstat.
3 Established Sockets Number of sockets in Established statereported by Netstat.
4 JOLT Traffic (bytes/sec) Network Status - Jolt bytes per sec.
5 HTTP (bytes/sec) Network Status - HTTP bytes per sec.
Event 152
Event 152 has the following identification attributes.
Attribute Value
ID 152
Label Web Site Status
Description Web site status reported by web server Domain Monitor
Filter LevelEvent 152 has a filter level of 4.

Appendix B Event Definition Reference
Copyright © 1988, 2016, Oracle and/or its affiliates. All rights reserved. 237
Metrics
Metric Value Description
1 Requests to all Servlets Total requests to all servlets (web serverDomain Monitor).
2 Servlet Requests (last minute) Servlet requests in last minute (webserver Domain Monitor).
3 Avg Request Time (last minute) Average request time in last minute (webserver Domain Monitor).
4 Time in all Servlets (ms) Total servlet request time (web serverDomain Monitor).
5 Current Sessions Current number of sessions (web serverDomain Monitor).
7 Site Path Site Path.
Event 153
Event 153 has the following identification attributes.
Attribute Value
ID 153
Label Web Servlet Status
Description Web servlet status reported by Web Server Domain Monitor
Filter LevelEvent 153 has a filter level of 4.
Metrics
Metric Value Description
1 Requests to all Servlets Total requests to this servlet (Web ServerDomain Monitor).
2 Servlet Requests (last minute) Servlet requests in last minute (WebServer Domain Monitor).

Event Definition Reference Appendix B
238 Copyright © 1988, 2016, Oracle and/or its affiliates. All rights reserved.
Metric Value Description
3 Avg Request Time (last minute) Average request time in last minute (WebServer Domain Monitor).
4 Time in this Servlet (ms) Total time in this servlet (Web ServerDomain Monitor).
7 Servlet Name Servlet name for reported event (WebServer Domain Monitor).
Additional Data LabelServlet Path
Event 200
Event 200 has the following identification attributes.
Attribute Value
ID 200
Label Resources Per Process
Description Machine resource utilization metrics from C++ processes
Filter LevelEvent 200 has a filter level of 4.
Metrics
Metric Value Description
1 %CPU Used %CPU currently consumed.
2 CPU Time (secs) Total User Time - CPU time consumedby this process (secs).
3 VM (bytes) Total Virtual Memory consumed byprocess.
4 Working Set (bytes) Amount of physical memory consumedby the process.
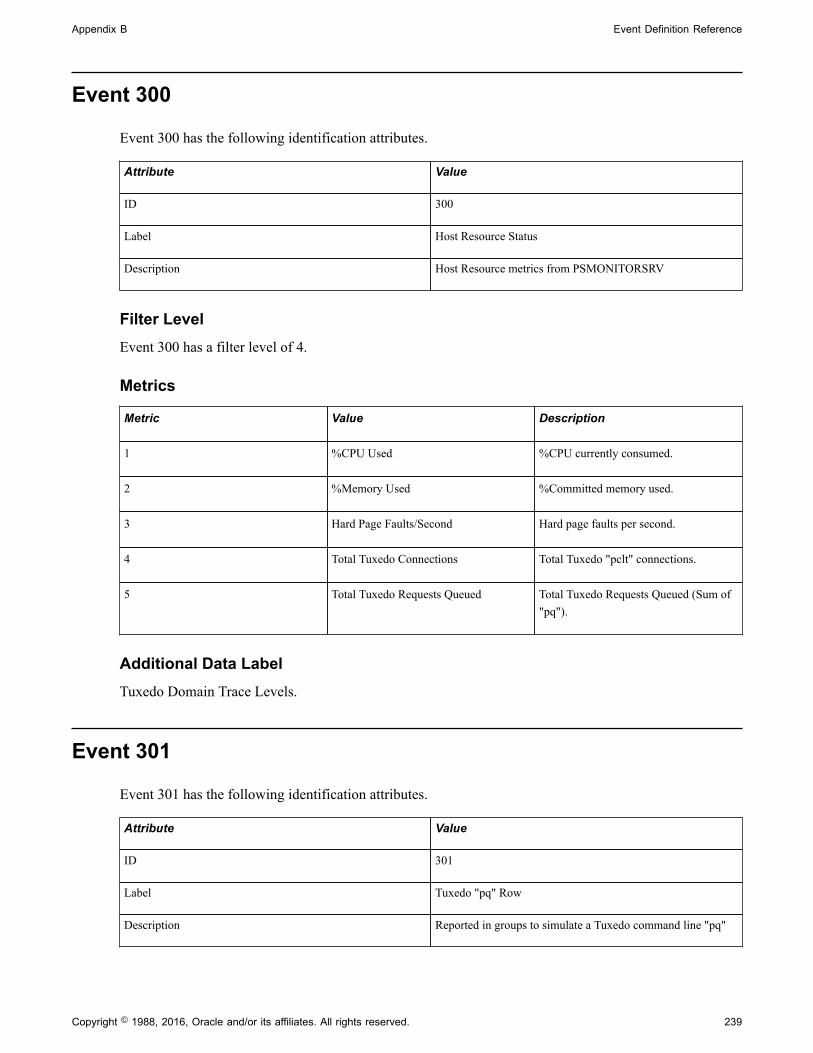
Appendix B Event Definition Reference
Copyright © 1988, 2016, Oracle and/or its affiliates. All rights reserved. 239
Event 300
Event 300 has the following identification attributes.
Attribute Value
ID 300
Label Host Resource Status
Description Host Resource metrics from PSMONITORSRV
Filter LevelEvent 300 has a filter level of 4.
Metrics
Metric Value Description
1 %CPU Used %CPU currently consumed.
2 %Memory Used %Committed memory used.
3 Hard Page Faults/Second Hard page faults per second.
4 Total Tuxedo Connections Total Tuxedo "pclt" connections.
5 Total Tuxedo Requests Queued Total Tuxedo Requests Queued (Sum of"pq").
Additional Data LabelTuxedo Domain Trace Levels.
Event 301
Event 301 has the following identification attributes.
Attribute Value
ID 301
Label Tuxedo "pq" Row
Description Reported in groups to simulate a Tuxedo command line "pq"
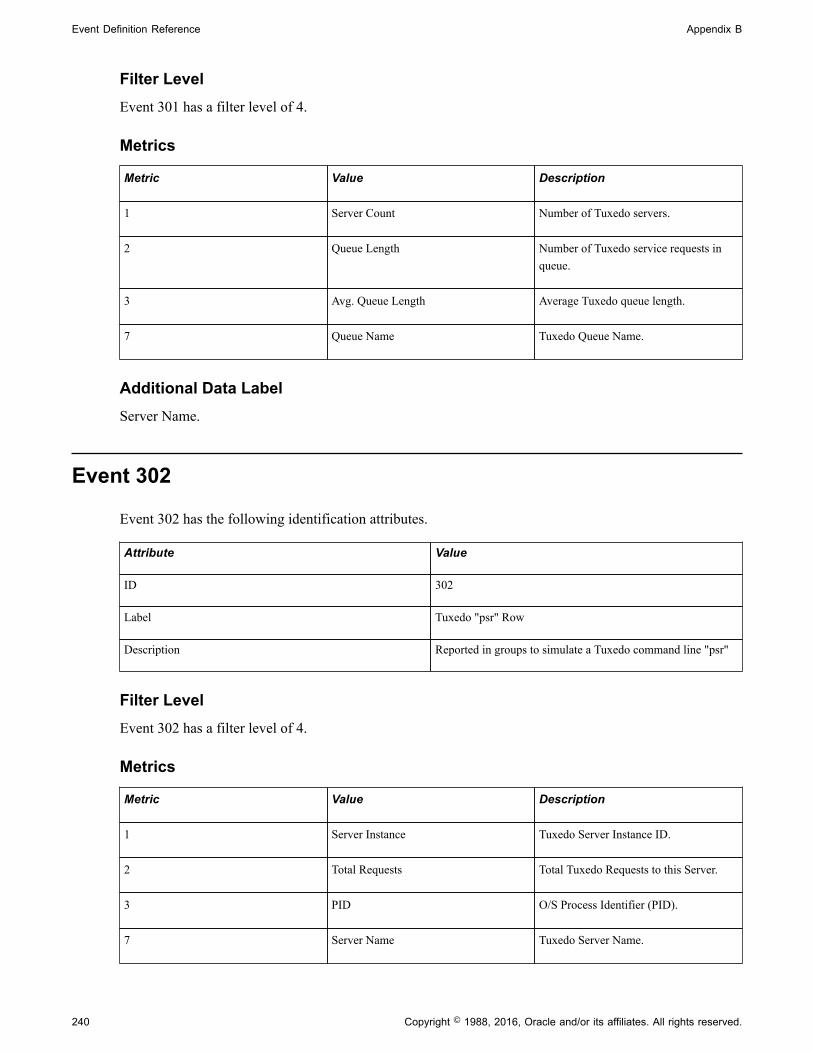
Event Definition Reference Appendix B
240 Copyright © 1988, 2016, Oracle and/or its affiliates. All rights reserved.
Filter LevelEvent 301 has a filter level of 4.
Metrics
Metric Value Description
1 Server Count Number of Tuxedo servers.
2 Queue Length Number of Tuxedo service requests inqueue.
3 Avg. Queue Length Average Tuxedo queue length.
7 Queue Name Tuxedo Queue Name.
Additional Data LabelServer Name.
Event 302
Event 302 has the following identification attributes.
Attribute Value
ID 302
Label Tuxedo "psr" Row
Description Reported in groups to simulate a Tuxedo command line "psr"
Filter LevelEvent 302 has a filter level of 4.
Metrics
Metric Value Description
1 Server Instance Tuxedo Server Instance ID.
2 Total Requests Total Tuxedo Requests to this Server.
3 PID O/S Process Identifier (PID).
7 Server Name Tuxedo Server Name.

Appendix B Event Definition Reference
Copyright © 1988, 2016, Oracle and/or its affiliates. All rights reserved. 241
Additional Data LabelCurrent Service.
Event 350
Event 350 has the following identification attributes.
Attribute Value
ID 350
Label Master Scheduler Status
Description Master Scheduler Process Status
Filter LevelEvent 350 has a filter level of 4.
Metrics
Metric Value Description
1 Active Processes Process Scheduler - Number of processesrunning.
2 Queued Processes Process Scheduler - Number of processesqueued.
3 Blocked Processes Process Scheduler - Blocked Processes.
4 Unused Process Slots Process Scheduler - Available ProcessSlots.
Event 351
Event 351 has the following identification attributes.
Attribute Value
ID 351
Label Master Scheduler Detail
Description Master Scheduler Details per Process Scheduler Server

Event Definition Reference Appendix B
242 Copyright © 1988, 2016, Oracle and/or its affiliates. All rights reserved.
Filter LevelEvent 351 has a filter level of 4.
Metrics
Metric Value Description
1 Active Processes Process Scheduler - Number of processesrunning
4 Unused Process Slots Process Scheduler - Available ProcessSlots
7 Server Name Server Name
Additional Data LabelProcess Type.
Event 354
Event 354 has the following identification attributes.
Attribute Value
ID 354
Label Batch Queue Details
Description Master Scheduler Queue Details per Process Type
Filter LevelEvent 354 has a filter level of 4.
Metrics
Metric Value Description
1 Queued Processes Process Scheduler - Number of processesqueued.
2 Blocked Processes Process Scheduler - Blocked Processes.
7 Process Type Process Scheduler - Process type.
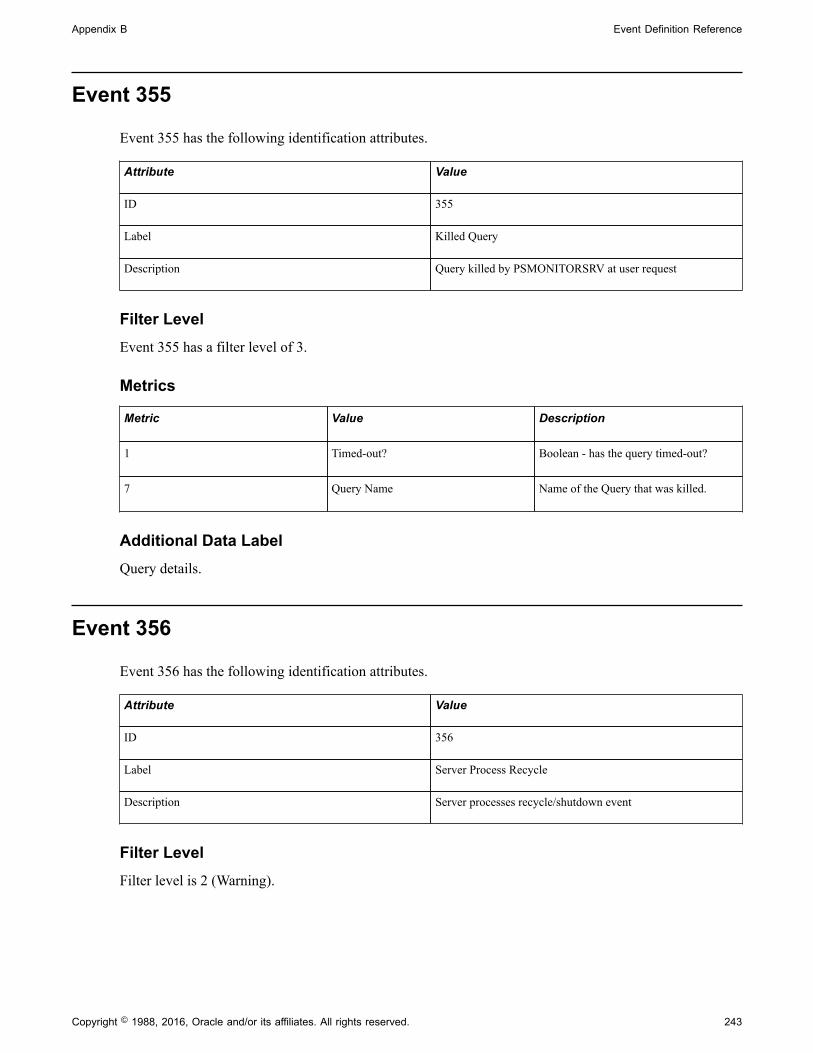
Appendix B Event Definition Reference
Copyright © 1988, 2016, Oracle and/or its affiliates. All rights reserved. 243
Event 355
Event 355 has the following identification attributes.
Attribute Value
ID 355
Label Killed Query
Description Query killed by PSMONITORSRV at user request
Filter LevelEvent 355 has a filter level of 3.
Metrics
Metric Value Description
1 Timed-out? Boolean - has the query timed-out?
7 Query Name Name of the Query that was killed.
Additional Data LabelQuery details.
Event 356
Event 356 has the following identification attributes.
Attribute Value
ID 356
Label Server Process Recycle
Description Server processes recycle/shutdown event
Filter LevelFilter level is 2 (Warning).

Event Definition Reference Appendix B
244 Copyright © 1988, 2016, Oracle and/or its affiliates. All rights reserved.
Metrics
Metric Value Description
1 167 Service timeout setting.
2 168 Recycle counts setting.
3 169 Allowed consecutive service failure.
4 170 Recycle reason.
5 Normal shutdown.
Event 500
Event 500 has the following identification attributes.
Attribute Value
ID 500
Label JOLT Service Exception
Description JOLT Service Exception (for example, an application serverservice timeout)
Filter LevelEvent 500 has a filter level of 3.
Metrics
Metric Value Description
1 PMU instance affected PMU instance effected.
2 JOLT Error Number JOLT Error Number.
7 Jolt Error Detail Jolt Error Detail
Event 600
Event 600 has the following identification attributes.

Appendix B Event Definition Reference
Copyright © 1988, 2016, Oracle and/or its affiliates. All rights reserved. 245
Attribute Value
ID 600
Label PSPING
Description PSPING metrics forwarded from browser
Filter LevelEvent 600 has a filter level of 3.
Metrics
Metric Value Description
1 Network Latency (ms) PSPING - Network latency (millisecs).
2 WebServer Latency (ms) PSPING - Web Server latency (millisecs).
3 AppServer Latency (ms) PSPING - application server latency (millisecs).
4 DB Latency (millisecs) PSPING - database latency (millisecs).
7 IP Address
Additional Data LabelOPRID (user ID), JSessionID.
Event 601
Event 601 has the following identification attributes.
Attribute Value
ID 601
Label User Monitoring Level Override
Description Performance Trace user override of filter level
Filter LevelEvent 601 has a filter level of 4.
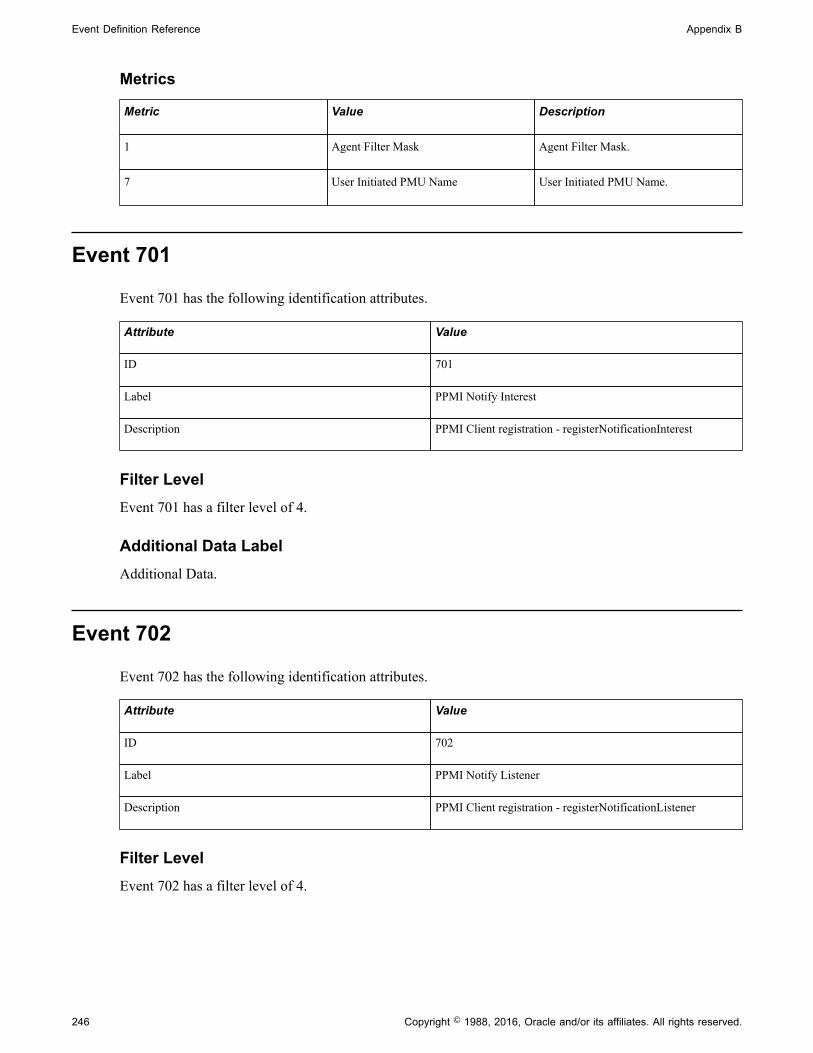
Event Definition Reference Appendix B
246 Copyright © 1988, 2016, Oracle and/or its affiliates. All rights reserved.
Metrics
Metric Value Description
1 Agent Filter Mask Agent Filter Mask.
7 User Initiated PMU Name User Initiated PMU Name.
Event 701
Event 701 has the following identification attributes.
Attribute Value
ID 701
Label PPMI Notify Interest
Description PPMI Client registration - registerNotificationInterest
Filter LevelEvent 701 has a filter level of 4.
Additional Data LabelAdditional Data.
Event 702
Event 702 has the following identification attributes.
Attribute Value
ID 702
Label PPMI Notify Listener
Description PPMI Client registration - registerNotificationListener
Filter LevelEvent 702 has a filter level of 4.
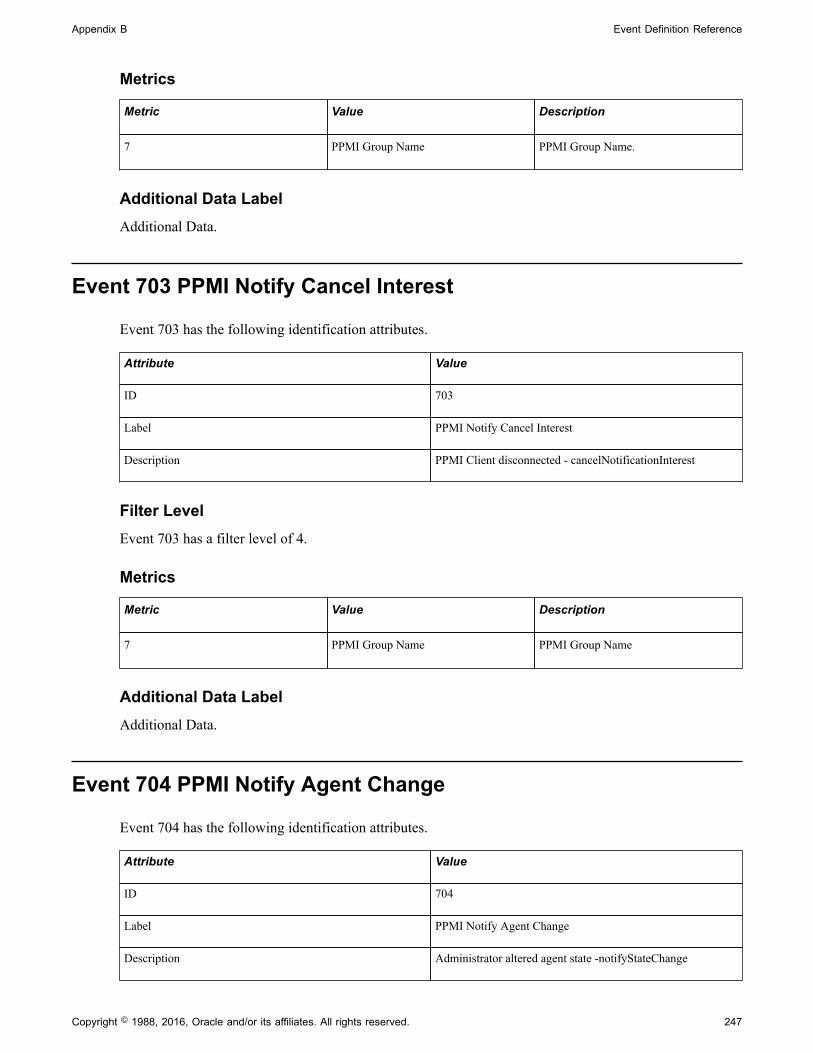
Appendix B Event Definition Reference
Copyright © 1988, 2016, Oracle and/or its affiliates. All rights reserved. 247
Metrics
Metric Value Description
7 PPMI Group Name PPMI Group Name.
Additional Data LabelAdditional Data.
Event 703 PPMI Notify Cancel Interest
Event 703 has the following identification attributes.
Attribute Value
ID 703
Label PPMI Notify Cancel Interest
Description PPMI Client disconnected - cancelNotificationInterest
Filter LevelEvent 703 has a filter level of 4.
Metrics
Metric Value Description
7 PPMI Group Name PPMI Group Name
Additional Data LabelAdditional Data.
Event 704 PPMI Notify Agent Change
Event 704 has the following identification attributes.
Attribute Value
ID 704
Label PPMI Notify Agent Change
Description Administrator altered agent state -notifyStateChange

Event Definition Reference Appendix B
248 Copyright © 1988, 2016, Oracle and/or its affiliates. All rights reserved.
Filter LevelEvent 704 has a filter level of 4.
Event 705 PPMI Notify Monitor Change
Event 705 has the following identification attributes.
Attribute Value
ID 705
Label PPMI Notify Monitor Change
Description Administrator altered cluster state - notifyStateChange
Filter LevelEvent 705 has a filter level of 4.
Event 801
Event 801 has the following identification attributes.
Attribute Value
ID 801
Label Monitor Server Buffer Overrun
Description Monitoring Server Alarm - Buffer Overrun
Filter LevelEvent 801 has a filter level of 3.
Metrics
Metric Value Description
1 Dropped Items Number of objects that were droppedfrom the buffer.
7 PPMI Client URL URL of PPMIClient.

Appendix B Event Definition Reference
Copyright © 1988, 2016, Oracle and/or its affiliates. All rights reserved. 249
Event 802 Monitoring Server Client Lost
Event 802 has the following identification attributes.
Attribute Value
ID 802
Label Monitoring Server Client Lost
Description Monitoring Server Alarm - Unable to Contact PPMIClient
Filter LevelEvent 802 has a filter level of 3.
Metrics
Metric Value Description
7 PPMI Client URL URL of PPMIClient.
Event 803 Monitoring Server Data Lost
Event 803 has the following identification attributes.
Attribute Value
ID 803
Label Monitoring Server Data Lost
Description Monitor Server Alarm - Data lost due to PPMI Client error
Filter LevelEvent 803 has a filter level of 3.
Metrics
Metric Value Description
7 PPMI Client URL URL of PPMIClient.
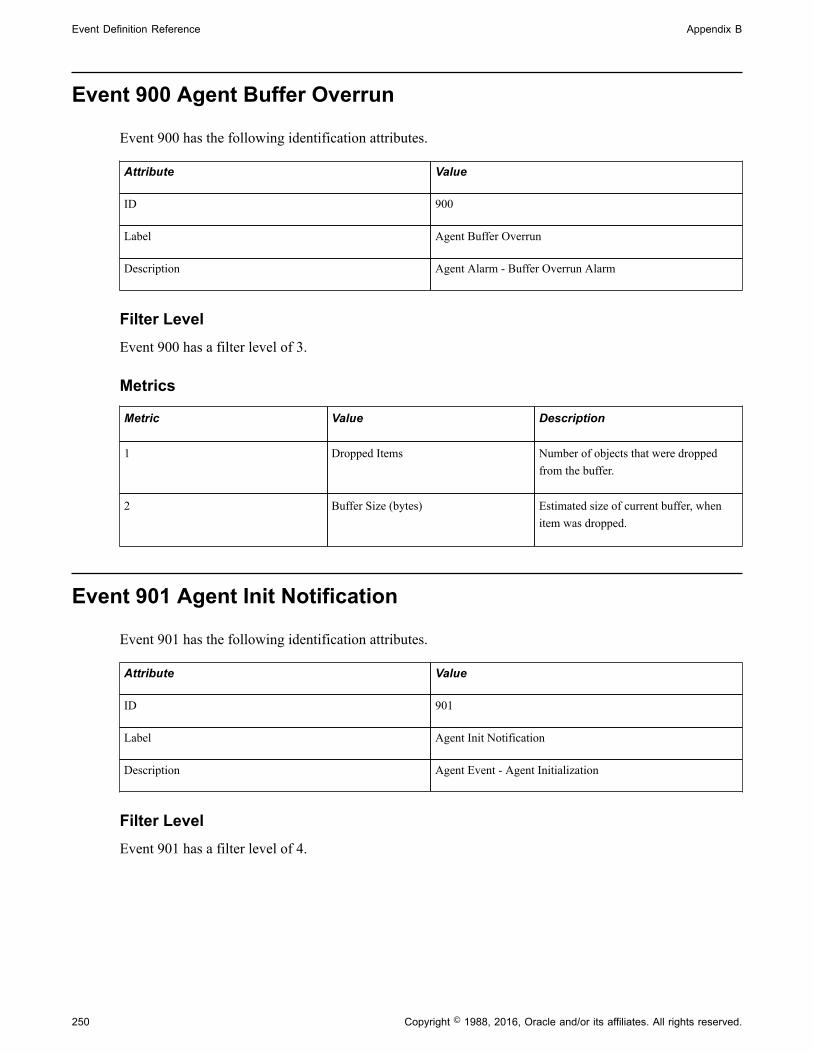
Event Definition Reference Appendix B
250 Copyright © 1988, 2016, Oracle and/or its affiliates. All rights reserved.
Event 900 Agent Buffer Overrun
Event 900 has the following identification attributes.
Attribute Value
ID 900
Label Agent Buffer Overrun
Description Agent Alarm - Buffer Overrun Alarm
Filter LevelEvent 900 has a filter level of 3.
Metrics
Metric Value Description
1 Dropped Items Number of objects that were droppedfrom the buffer.
2 Buffer Size (bytes) Estimated size of current buffer, whenitem was dropped.
Event 901 Agent Init Notification
Event 901 has the following identification attributes.
Attribute Value
ID 901
Label Agent Init Notification
Description Agent Event - Agent Initialization
Filter LevelEvent 901 has a filter level of 4.
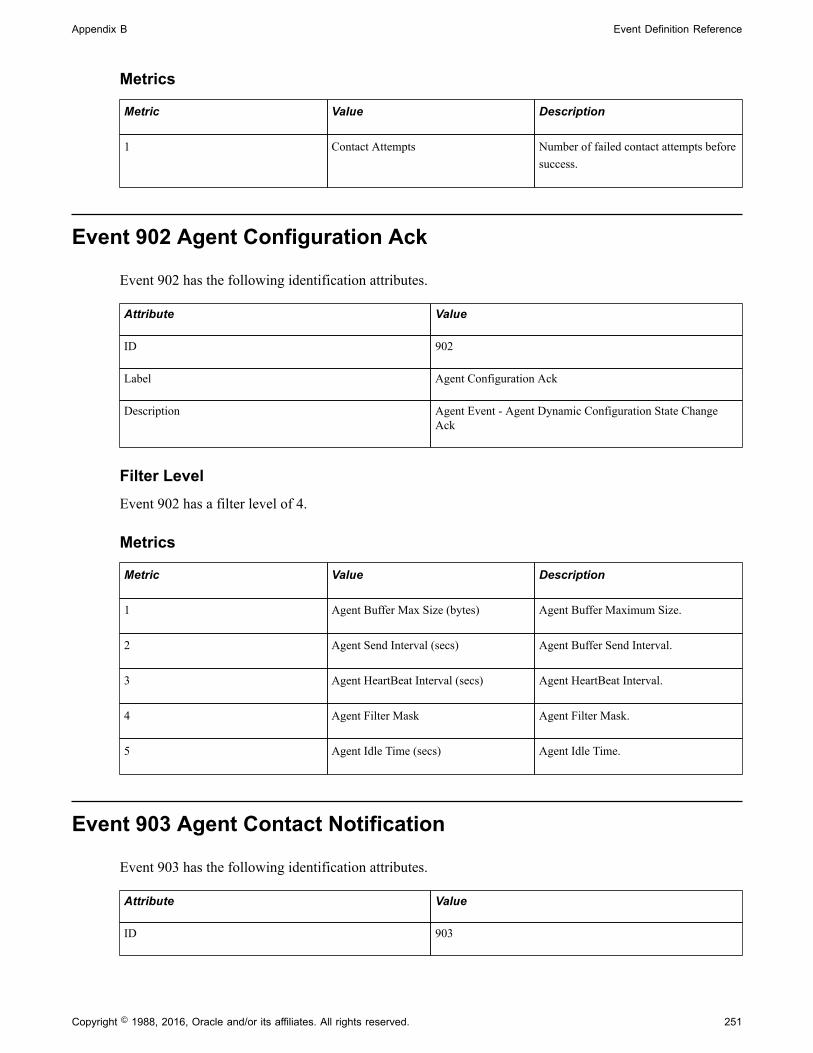
Appendix B Event Definition Reference
Copyright © 1988, 2016, Oracle and/or its affiliates. All rights reserved. 251
Metrics
Metric Value Description
1 Contact Attempts Number of failed contact attempts beforesuccess.
Event 902 Agent Configuration Ack
Event 902 has the following identification attributes.
Attribute Value
ID 902
Label Agent Configuration Ack
Description Agent Event - Agent Dynamic Configuration State ChangeAck
Filter LevelEvent 902 has a filter level of 4.
Metrics
Metric Value Description
1 Agent Buffer Max Size (bytes) Agent Buffer Maximum Size.
2 Agent Send Interval (secs) Agent Buffer Send Interval.
3 Agent HeartBeat Interval (secs) Agent HeartBeat Interval.
4 Agent Filter Mask Agent Filter Mask.
5 Agent Idle Time (secs) Agent Idle Time.
Event 903 Agent Contact Notification
Event 903 has the following identification attributes.
Attribute Value
ID 903

Event Definition Reference Appendix B
252 Copyright © 1988, 2016, Oracle and/or its affiliates. All rights reserved.
Attribute Value
Label Agent Contact Notification
Description Agent Event - Contact Initiated with Monitoring Server
Filter LevelEvent 903 has a filter level of 6.
Metrics
Metric Value Description
1 Contact Attempts Number of failed contact attempts beforesuccess.
Event 904 Analytic Server Status
Event 904 has the following identification attributes.
Attribute Value
ID 904
Label Analytic Server Status
Description Analytic Server Usage Status
Filter LevelEvent 904 has a filter level of 3.
Metrics
Metric Value Description
1 Total Number of Analytic Servers Total number of configured analyticservers.
2 Total Number of Started AnalyticServers
Number of started analytic servers.
3 Number Of Free Analytic Server Number of Analytic Servers, started up, but free.

Appendix B Event Definition Reference
Copyright © 1988, 2016, Oracle and/or its affiliates. All rights reserved. 253
Event 905 Analytic Server Load Event
Event 905 has the following identification attributes.
Attribute Value
ID 905
Label Analytic Server Load Event
Description Analytic Instance loading in a Analytic Server
Filter LevelEvent 905 has a filter level of 3.
Metrics
Metric Value Description
1 VM Bytes Total Virtual Memory Consumed by theprocess after the load.
2 Working Set(bytes) Amount of physical memory consumedby the process after the load.
Additional Data LabelAnalytic Instance Name.
Event 906 Out of Analytic Servers
Event 906 has the following identification attributes.
Attribute Value
ID 906
Label Out of Analytic Servers
Description Out of Analytic Servers Alarm
Filter LevelEvent 906 has a filter level of 3.
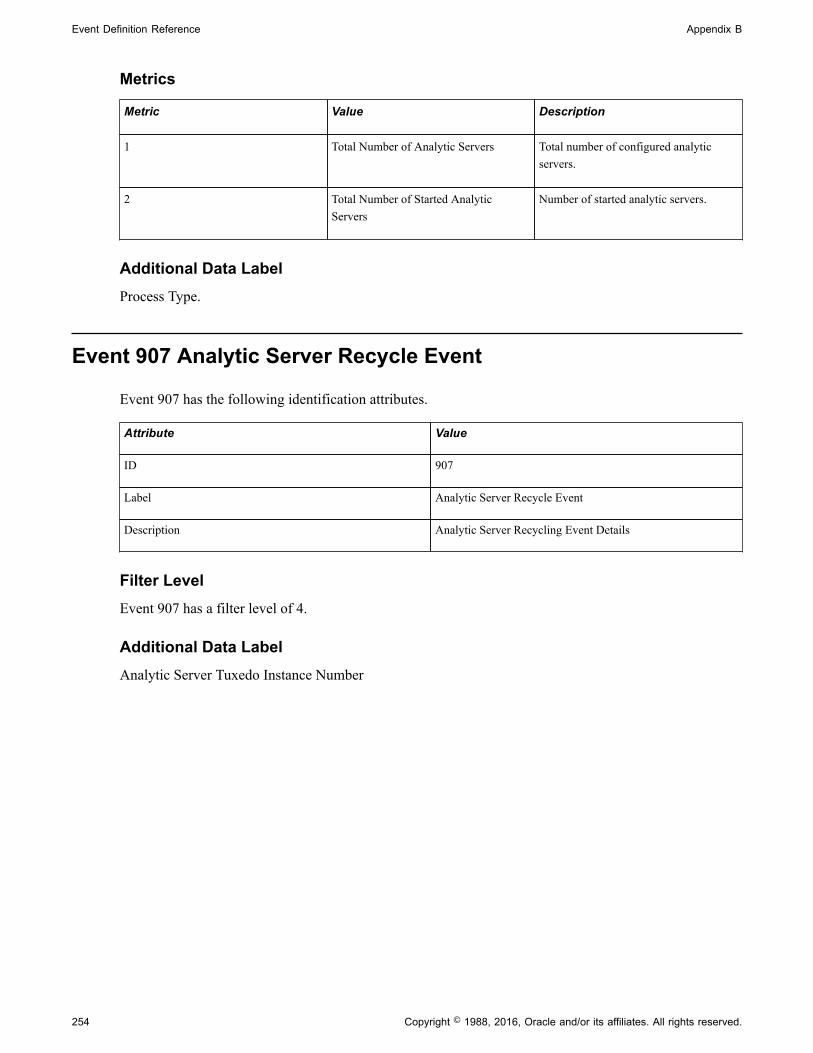
Event Definition Reference Appendix B
254 Copyright © 1988, 2016, Oracle and/or its affiliates. All rights reserved.
Metrics
Metric Value Description
1 Total Number of Analytic Servers Total number of configured analyticservers.
2 Total Number of Started AnalyticServers
Number of started analytic servers.
Additional Data LabelProcess Type.
Event 907 Analytic Server Recycle Event
Event 907 has the following identification attributes.
Attribute Value
ID 907
Label Analytic Server Recycle Event
Description Analytic Server Recycling Event Details
Filter LevelEvent 907 has a filter level of 4.
Additional Data LabelAnalytic Server Tuxedo Instance Number

Copyright © 1988, 2016, Oracle and/or its affiliates. All rights reserved. 255
Appendix C
PeopleSoft Performance Monitor DiagnosticPlug-in
Understanding Performance Monitor Diagnostic Plug-in
When configuring the Performance Monitor, you are required to specify or verify a variety of field values,on multiple PeopleTools pages, within several PeopleTools administrative interfaces, including:
• Performance Monitor pages.
• Integration Broker pages.
• Web Profile pages.
• Security pages.
If troubleshooting is ever required, or you need to review your system settings, the system administratorneeds to access all of these settings in various locations. To view Performance Monitor settings in a singlereport, PeopleTools provides the Performance Monitor Diagnostic Plug-in. This enables you to view allthe key settings in a central location to determine any necessary modifications or corrections.
Note: The Performance Monitor Diagnostic Plug-in generates a read-only report. It does not physicallyaggregate the settings in a central location for modification. If settings need to be modified, you need tonavigate to the appropriate administrative interface to make changes.
Related Links"Understanding Diagnostics Framework" (PeopleTools 8.54: Data Management)"Understanding Diagnostic Plug-In Development" (PeopleTools 8.54: Data Management)
Running Performance Monitor Diagnostics
To run the Performance Monitor diagnostic plug-in:
1. Register the Performance Monitor diagnostic plug-in.
Navigate to Application Diagnostics, Register Diagnostics, and use the Plug-in Name drop-down listto select DF_PT_PPMDIAGNOSTICS.
2. Select Application Diagnostics, Launch Diagnostics.
3. Select the check box next to DF_PT_PPMDIAGNOSTICS.
4. Specify how you want the report delivered:

PeopleSoft Performance Monitor Diagnostic Plug-in Appendix C
256 Copyright © 1988, 2016, Oracle and/or its affiliates. All rights reserved.
• Email report: delivers the report to the specified email address(s). SMTP must be configured forthis option to succeed.
• Display report in browser: delivers the report in a separate browser window.
5. Click Generate Diagnostics.
Reviewing Diagnostic Information
The generated report appears similar to the following:
Image: Sample Performance Monitor diagnostic plug-in output
This example illustrates the fields and controls on the Sample Performance Monitor diagnostic plug-inoutput.
The Performance Monitor diagnostic report displays the following settings, grouped by where they appearin the PeopleTools interface.

Appendix C PeopleSoft Performance Monitor Diagnostic Plug-in
Copyright © 1988, 2016, Oracle and/or its affiliates. All rights reserved. 257
Diagnostic Report Section Configuration Parameters Displayed
Global Administration Parameters PPMI URL
PPMI USER ID
Archive - Clear PMUs and Events
Collator Row Limit
Search Row limit (number of rows returned)
System Default Parameters Archive Mode Duration
Action after Archive Duration
Performance Trace Settings
PMU Timeout (in days)
Agent Event Sample Rate (sec)
Agent Buffering Interval (sec)
Agent Filter level
Agent PMU sample rate (1/X)
Agent Heartbeat Interval (sec)
Agent Maximum Buffer size (bytes)
System Definitions Database Name
Tools release
Archive Mode Duration (days)
Archive Mode Operation
Performance Trace Settings
PMU Timeout (in days)
Agent Event Sample Rate (sec)
Agent Buffering Interval (sec)
Agent PMU sample rate (1/X)
Agent Heartbeat Interval (sec)
Agent Maximum Buffer size (bytes)
Agent Filter Levels (Server/Filter Level)
Specify Monitor Monitor URL
IB Information (Integration Broker) IB Gateway URL
Number of IB Gateway Connectors
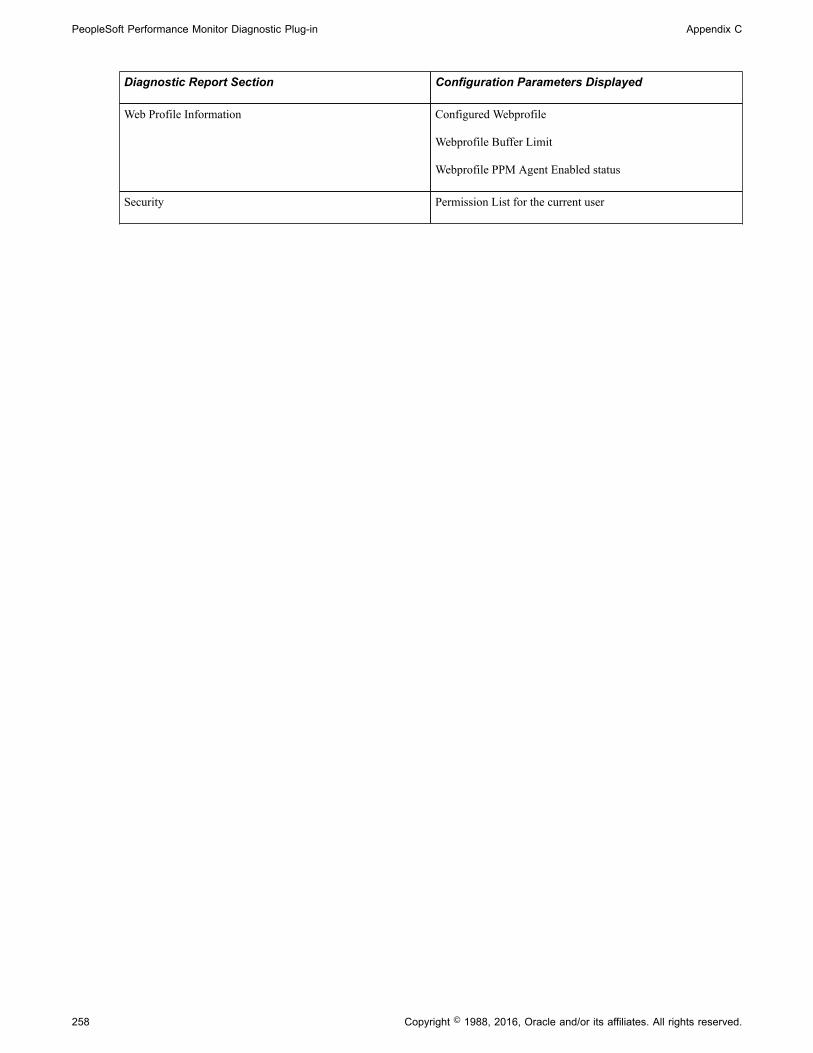
PeopleSoft Performance Monitor Diagnostic Plug-in Appendix C
258 Copyright © 1988, 2016, Oracle and/or its affiliates. All rights reserved.
Diagnostic Report Section Configuration Parameters Displayed
Web Profile Information Configured Webprofile
Webprofile Buffer Limit
Webprofile PPM Agent Enabled status
Security Permission List for the current user

Copyright © 1988, 2016, Oracle and/or its affiliates. All rights reserved. 259
Appendix D
Working With Usage Monitor
Enabling Usage Monitor
To enable Usage Monitor, Performance Monitor must first be set up according to the steps described inthis PeopleBook.
See Configuration of the Performance Monitor.
If Performance Monitor is already set up, to set up Usage Monitor data collection, you need to verify thatthe following additional settings are set appropriately on your system.
• Make sure that the Usage Monitoring State parameter is set correctly for the applicationserver domain.
See "PSTOOLS Options" (PeopleTools 8.54: System and Server Administration).
• Select the Enable Usage Monitoring check box on the System Defaults page (PeopleTools,Performance Monitor, Administration, System Defaults).
See Setting System Definition Defaults.
Verifying Usage Monitor Data Collection
To verify that Performance Monitor is collecting Usage Monitor data, run the following query using yourSQL query tool:
SELECT * FROM PSPMTRANS35_VW;
Note: Performance Monitor stores the Usage Monitor data as PMU 440. However, viewing the UsageMonitor data in the Performance Monitor interface (viewing PMU 440) is not the primary interfacefor the Usage Monitor data. It is recommended to use PSPMTRANS35_VW to verify Usage Monitorinformation.
Associating Test Names and Test Cases With Usage Monitor Data
When the Usage Monitor is enabled and collecting usage data, the information is stored associated with auser ID or anonymously, depending on the options selected for the Usage Monitoring State parameter inthe application server domain configuration. To associate a test name and test case with usage monitoringdata, use the Usage Monitoring page, which you access by using the Usage Monitoring top-level menu
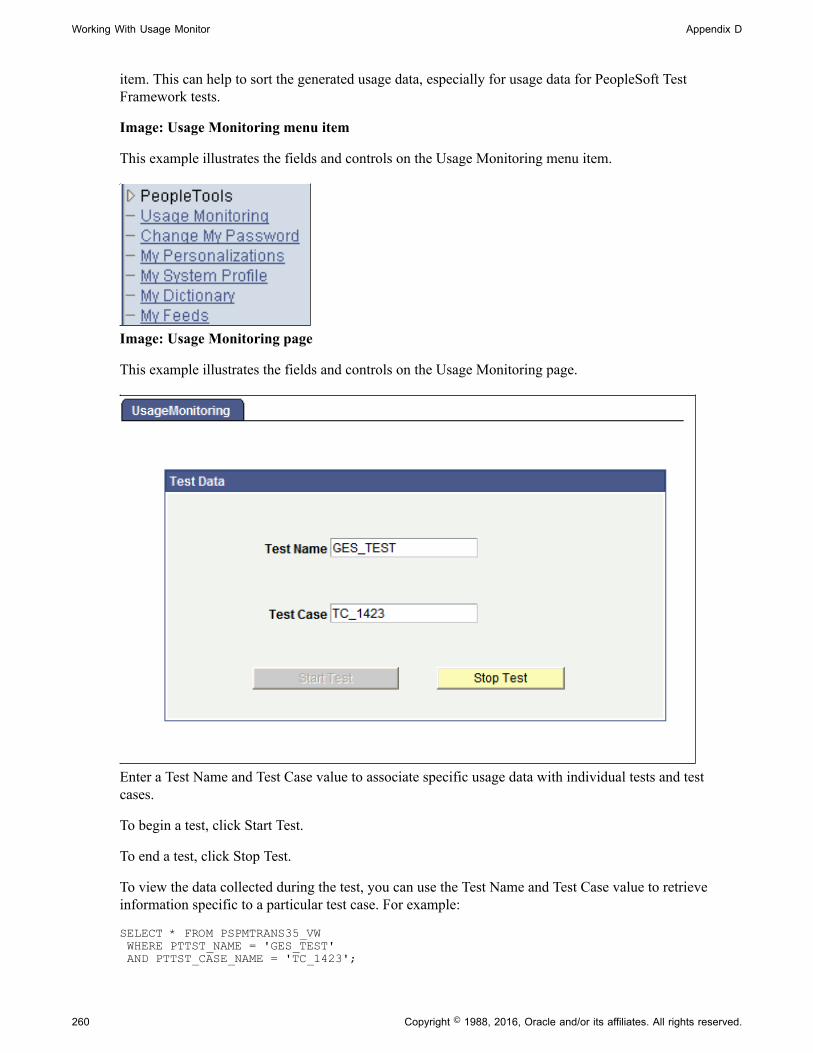
Working With Usage Monitor Appendix D
260 Copyright © 1988, 2016, Oracle and/or its affiliates. All rights reserved.
item. This can help to sort the generated usage data, especially for usage data for PeopleSoft TestFramework tests.
Image: Usage Monitoring menu item
This example illustrates the fields and controls on the Usage Monitoring menu item.
Image: Usage Monitoring page
This example illustrates the fields and controls on the Usage Monitoring page.
Enter a Test Name and Test Case value to associate specific usage data with individual tests and testcases.
To begin a test, click Start Test.
To end a test, click Stop Test.
To view the data collected during the test, you can use the Test Name and Test Case value to retrieveinformation specific to a particular test case. For example:
SELECT * FROM PSPMTRANS35_VW WHERE PTTST_NAME = 'GES_TEST' AND PTTST_CASE_NAME = 'TC_1423';

Appendix D Working With Usage Monitor
Copyright © 1988, 2016, Oracle and/or its affiliates. All rights reserved. 261
Where PTTST_NAME is the Test Name value, and PTTST_CASE_NAME is the Test Case value.
Viewing Usage Monitor Data
After you have generated the desired usage data, it is recommended that before analyzing the information,you run the Usage Monitor Aggregator (PTUMAGR) Application Engine program. This takes the datastored in PSPMTRANS35_VW and inserts it into the PSPTUMPMTAGR table. This aggregated data ismore suitable for analysis, including the analysis performed by way of the PeopleSoft Test Framework.
Integrating Usage Monitor Data with Lifecycle Management Tools
The Usage Monitor provides additional information for analysis when determining test coverage with thePeopleSoft Test Framework . In the PeopleSoft Test Framework (PTF), a test coverage report correlatesPeopleTools project data with PTF test metadata to identify components, menus, pages, records and fieldsthat are referenced in PTF tests. When used in conjunction with Usage Monitor, test coverage correlationscan be extended to include information on all definitions (including PeopleCode, Application Engineprograms, and so on) from a usage perspective. A test coverage report identifies which objects includedin the change project are referenced by which PTF test. Definitions included in the change project thatare not referenced in the PTF test metadata or Usage Monitor data appears in the report identified as acoverage gap.

Copyright © 2022 FDOKUMEN