PENSION CONTRIBUTIONS AND NATIONAL SAVINGS IN GHANA; TRENDS, PROSPECTS AND CHALLENGES
112
PENSION CONTRIBUTIONS AND NATIONAL SAVINGS IN GHANA; TRENDS, PROSPECTS AND CHALLENGES BY MENSAH CHARLES (10362196) THIS THESIS IS SUBMITTED TO THE UNIVERSITY OF GHANA, LEGON IN PARTIAL FULFILLMENT FOR THE AWARD OF MASTER OF PHILOSOPHY DEGREE IN ECONOMICS DEPARTMENT OF ECONOMICS FACULTY OF SOCIAL STUDIES UNIVERSITY OF GHANA, LEGON JULY 2013 University of Ghana http://ugspace.ug.edu.gh
Transcript of PENSION CONTRIBUTIONS AND NATIONAL SAVINGS IN GHANA; TRENDS, PROSPECTS AND CHALLENGES

PENSION CONTRIBUTIONS AND NATIONAL SAVINGS IN GHANA; TRENDS,
PROSPECTS AND CHALLENGES
BY
MENSAH CHARLES
(10362196)
THIS THESIS IS SUBMITTED TO THE UNIVERSITY OF GHANA, LEGON IN
PARTIAL FULFILLMENT FOR THE AWARD OF MASTER OF PHILOSOPHY
DEGREE IN ECONOMICS
DEPARTMENT OF ECONOMICS
FACULTY OF SOCIAL STUDIES
UNIVERSITY OF GHANA, LEGON
JULY 2013
University of Ghana http://ugspace.ug.edu.gh
i
DECLARATION
This is to certify that this thesis is the result of research undertaken by CHARLES MENSAH
towards the award of a Master of Philosophy (M.PHIL) degree in the department of Economics,
University of Ghana.
…………………………
CHARLES MENSAH
( CANDIDATE)
………………………… ………………………………….
PROF. PETER QUARTEY DR. WILLIAM BEKOE
(SUPERVISOR) (SUPERVISOR)
University of Ghana http://ugspace.ug.edu.gh

ii
ABSTRACT
World Bank report (2010) clearly reported a continuous increase in old age dependency ratio and
a sharp decline in fertility rate. The disparity of child birth between the early 1960s and the
2000s has caused many people to be found in the old age group. Now, the kind of pension
scheme operating in Ghana is the Pay as you go scheme (PAYG) and the sustainability of the
scheme depends on increasing working population. The problem is how the fewer young people
under the PAYG scheme can take care of the many old generation without breaking down the
scheme
Meanwhile, studies suggest that mandatory pension scheme increases savings but we have
recorded decreases in Ghana’s national savings though SSNIT operates the mandatory pension
scheme.
The objectives of the study are; to examine the trends in pension contributions and national
savings in Ghana, to establish the relationship between pension contributions and national
savings, and to identify the prospects and challenges in the pension industry.
The Overlapping generation model used in the study. The study employed the Ordinary Least
Squares to establish the linear relationship and the Vector Error Correction Model as the
estimation technique.
Results from the study indicated that one of the predominant challenges facing the scheme are
insufficient monthly benefit. Also from the secondary data results, interesting findings like a
percentage unit increase in financial deepening will cause a decrease in national savings and a
positive correlation between pension contribution and savings. It was suggested from the
findings that SSNIT should increase the monthly benefits of pensioners, so that consumption will
be smoothened during the days of retirement.
University of Ghana http://ugspace.ug.edu.gh

iii
DEDICATION
This thesis is dedicated firstly to God, then to my parents: Mr. Francis Kingsley Mensah-
Aborampah and Mrs. Philomena Buadoo. The thesis is also dedicated to Mr. Osu-Tei, a manager
at SSNIT pension house, and to the National Pensioners Association, Ghana.
University of Ghana http://ugspace.ug.edu.gh

iv
ACKNOWLEDGEMENT
I am grateful to God, the Creator and Protector of all mankind and to whom I owe my very
existence. His direction, care and love kept me throughout the entire M.PHIL programme.
This research study could not have been successful without the help from the following; First, I
extend a warm gratitude to the Department of Economics, University of Ghana, Legon for
providing me with superb lecturers who have time for students.
Second, my Supervisors, Professor Peter Quartey and Dr. William Bekoe, for providing me
insights that guided and challenged my thinking, and this helped to improve this thesis work.
Third, I am grateful to the entire staff of the department for providing me with assistance in
various forms that helped in the fruition of my study.
I will also like to acknowledge a lecturer and mentor from the Department of Economics, Mr.
Theophilus Antwi-Asare, for all his fatherly advice and being a wonderful lecturer through out
the MPhil programme. I am also indebted to the SSNIT staff at the pension house, especially the
Public Relations Departments for giving me data for my study. To my friends and the entire
MPhil. Economics class of 2011-2013, I say God richly bless you with all the support and
encouragement throughout this programme.
University of Ghana http://ugspace.ug.edu.gh

v
TABLE OF CONTENTS
Title Page
DECLARATION ............................................................................................................................. i
ABSTRACT .................................................................................................................................... ii
DEDICATION ............................................................................................................................... iii
ACKNOWLEDGEMENT ............................................................................................................. iv
TABLE OF CONTENTS ................................................................................................................ v
LIST OF TABLES ......................................................................................................................... ix
LIST OF FIGURES ........................................................................................................................ x
CHAPTER ONE ............................................................................................................................. 1
1.1 Background of the Study ...................................................................................................... 1
1.2 Problem statement ................................................................................................................. 3
1.3 Objectives ............................................................................................................................. 5
1.4 Significance of the study ....................................................................................................... 5
1.5 Organization of the study ...................................................................................................... 6
CHAPTER TWO ............................................................................................................................ 7
2.1 Introduction ........................................................................................................................... 7
2.2 The History Of Pension Plans In Ghana ........................................................................... 7
2.3 Institutions Of The National Pension Scheme .................................................................... 15
2.3.1 The National Pensions Regulations Authority (NPRA) .................................................. 15
University of Ghana http://ugspace.ug.edu.gh

vi
2.4 Chapter Summary ............................................................................................................... 28
CHAPTER THREE ...................................................................................................................... 29
LITERATURE REVIEW ............................................................................................................. 29
3.1 Introduction ......................................................................................................................... 29
3.2 Theoretical literature ........................................................................................................... 30
3.2.1 Definitional Issues ....................................................................................................... 30
3.2.2 Models and theories related to pensions and saving .................................................... 32
3.3 Empirical literature ............................................................................................................. 38
3.3.1Time Series Evidence ................................................................................................... 40
3.3.2 Cross country evidence ................................................................................................ 42
CHAPTER FOUR ......................................................................................................................... 45
THEORETICAL FRAMEWORKS AND METHODOLOGY .................................................... 45
4.1 Introduction ......................................................................................................................... 45
4.2 The Overlapping Generation Model ................................................................................... 45
4.3 Model Specification ............................................................................................................ 49
4.4 Definition and expected signs of variables ......................................................................... 50
4.4.1 National savings ........................................................................................................... 50
4.4.2 Pension ......................................................................................................................... 50
4.4.3 Old age dependency ratio ............................................................................................. 51
4.4.4 Young Dependency Ratio ............................................................................................ 52
University of Ghana http://ugspace.ug.edu.gh

vii
4.4.5 Growth of Income ........................................................................................................ 52
4.4.6 Real interest rate .......................................................................................................... 53
4.4.7 Inflation ........................................................................................................................ 54
4.4.8 Financial deepening ..................................................................................................... 54
4.5 Estimation Techniques ........................................................................................................ 55
4.6 Justification for using OLS and Vector Error Correction Model (VECM) ........................ 58
4.7 Data types and source ......................................................................................................... 58
4.8 Primary Data Section .......................................................................................................... 59
PRESENTATION AND DISCUSSION OF RESULTS .............................................................. 62
5.0 Introduction ......................................................................................................................... 62
5.1 Discussion of results from survey ....................................................................................... 62
5.1.1 Socioeconomic Features Of Respondents .................................................................... 62
Field survey (2013) ............................................................................................................... 69
5.2.2 Administrator’s view ................................................................................................... 70
5.3.1 Unit Root and Stationarity Test ....................................................................................... 71
5.3.2 Selecting The Number of Lags ........................................................................................ 72
CHAPTER SIX ............................................................................................................................. 79
SUMMARY, CONCLUSION AND RECOMMENDATIONS ................................................... 79
6.1 Introduction ......................................................................................................................... 79
6.2 Summary and conclusion of the study ................................................................................ 79
University of Ghana http://ugspace.ug.edu.gh
viii
6.3 Recommendations for Policy implementation and further studies ..................................... 82
6.4 Limitations of the study ...................................................................................................... 82
REFERENCES ............................................................................................................................. 83
APPENDIX 1 ................................................................................................................................ 89
APPENDIX 2 ................................................................................................................................ 93
University of Ghana http://ugspace.ug.edu.gh

ix
LIST OF TABLES
Table 1: Functions of NPRA......................................................................................................... 16
Table: 2 Arreas Position as at December 2012 ............................................................................. 19
Table 3: The Pension Institutions And Their Main Objective In Ghana ...................................... 20
Table 4; ADF Test for Stationarity ............................................................................................... 72
Table 5; LR, FPE, HQIC and SBIC Tests for optimum Lag ........................................................ 73
Table 6; LM Test for Autocorrelation .......................................................................................... 77
Table 7; Jarque- Bera Normal Distribution Test........................................................................... 78
University of Ghana http://ugspace.ug.edu.gh

x
LIST OF FIGURES
Figure 1 SSNIT Pension contribution :1980 -2010 ...................................................................... 23
Figure 2 : Trend In Membership ................................................................................................... 24
Figure 3 : Sector contribution to SSNIT scheme .......................................................................... 25
Figure 4: Savings trends in Ghana ................................................................................................ 27
Figure 5: Gender of respondents ................................................................................................... 63
Figure 6: Age statistics.................................................................................................................. 64
Figure 7: Educational status of respondents ................................................................................. 65
Figure 8: Challenges faced by pensioners .................................................................................... 66
Figure 9: Whether Pensioners Get Quality Health Care Under NHIS Scheme? .......................... 67
Figure 10: Pension benefit received .............................................................................................. 68
Figure 11: Ability to save the pension benenfit ............................................................................ 69
Figure 12: Level of satisfaction with the scheme ......................................................................... 70
University of Ghana http://ugspace.ug.edu.gh

xi
University of Ghana http://ugspace.ug.edu.gh

1
CHAPTER ONE
INTRODUCTION
1.1 Background of the Study
Human beings generally seek means to enhance their economic security. One main cause of
economic insecurity is the probable reduction of an individual’s earning power at an advanced
age (Allen et al. 1966). The issue of old-age security has become an issue of great universal
concern affecting richer and poorer countries across the globe. Across the globe, the pension
system in many countries has come under pressure. In most dramatic cases, there has been an
effective default of pension promises, throwing many older people into poverty (Valdes-prieto,
1997).
Population statistics in Ghana have shown a continuous rise in the old-age dependency ratio. The
2010 population census indicated that the old age dependency ratio in Ghana was 6.62 which
indicated the gradual rise from 5.18 since 1967 (World bank report,2010). The steady but not
steeply rise is as a result of the continuous growth in population of the old-aged dependents.
Fertility rates have also been declining over the years with people giving birth to fewer children
as compared to the baby-boom age in the 1960s. This baby-boom cohorts have now reached
their old age with smaller cohort of the working class to cater for them. With this increasing
frequency, there are concerns that most of the population will enter retirement with inadequate
resources (Gustman et al.1998). As the long-term consequences of population aging have
become known and more widely discussed, the financing of entitlement programs in public
social insurance systems has received considerable attention (Samwick, 1999).
University of Ghana http://ugspace.ug.edu.gh

2
The early pensions program in Ghana (Cap 30) which was a form of loyalty rewarding
programme has been reformed several times to the present pension programme, the three- tier
pension scheme. The collapse of the traditional extended family system where the aged was
catered for was due to economic hardships leading people to migration to the urban areas.. This
consequence has led to the government introducing pensions programmes to cater for the old.
In Ghana, the public pensions programme has evolved around the two basic types of pensions;
Defined Contribution and Defined Benefits. The former is a type of pension scheme where the
firm (employer) contributes into an established savings account for the employee as pension
benefit when the employee retires. An example of the Defined Contribution in Ghana is the Cap
30 where the government contributed into an account for its European and non-European
workers. On the other hand, a Defined Benefit is a type of pension scheme where the employer is
obliged to provide specified annual retirement benefits that are based on a formulae that takes
into account years of service and the level of salary or wage. An example from Ghana’s
experience is the Social Security. Out of this two basic types of pension schemes are various
kinds of pension programmes namely; Fully funded scheme, Pay-as-you-go(PAYG) schemes,
Buffer fund, Means tested fund and Universal pension. The PAYG scheme is where the current
working class pays payroll taxes to finance the current pension retirees.
However, in Ghana, the pensions system has evolved around the PAYG and the Fully Funded
schemes. The Social Security and National Insurance Trust collected a total of GHS 576.833
million in contributions for 2010. This shows a decline of 13.60% over the figure collected in the
preceeding which was GHS 667.60 million. The decline is attributed to the challenges that
accompanied the introduction of the New Act and the new Business process that improved the
University of Ghana http://ugspace.ug.edu.gh

3
quality of data information received which employers were slow to comply with (SSNIT
report,2010).
Though the Social Security Scheme was designed to be a PAYG scheme, the contributions of the
current workers in that scheme was not totally consummed by the current pensioneers, rather part
of if were invested into products like equities, fixed incomes,real estates, Ecobank Trans-national
Incorporated (ETI) and others. This from the 2010 SSNIT report has caused the fund to grow
from 0.88% in 2004 to 2.99% in 2010. Due to the diversification of investments practised by
SSNIT, there is a need to look at the savings vehicles through which an individual can save and
invest in Ghana.
1.2 Problem statement
The pension sector performs very useful roles in the economy of Ghana. In the pursuance of its
social insurance functions, it tends to raise the levels of investments in the economy and also
raise national savings through the partial Pay as you go (PAYG) system that is run in the
country. Funds are mobilized from the working class and channel them to the economy as
investments and benefits to the aged. By so doing, they encourage mandatory saving and ensure
that that the aged in the country do not become a burden to the community but an asset.
World Bank staff estimates (2010) reports that, Ghana population statistics have continuously
shown an increase old-age dependency ratio and defined old age dependency ratio as the ratio of
population with ages 65 and above to the total population of Ghana. Fertility rates in Ghana have
also been declining greatly over the years with people giving birth to fewer kids as compared to
University of Ghana http://ugspace.ug.edu.gh

4
the early years of Ghana’s independence. The disparity of child birth between the early 1960s
and the 2000s has caused many people to be found in the old age group. Now, with the kind of
pension scheme operating in Ghana (PAYG), the sustainability of the scheme depends on
increasing working population.
The problem is how the fewer young people under the PAYG scheme can take care of the many
old generation without breaking down the scheme. Therefore, we need to know how we would
grow our pension contributions through investments in order to sustain the scheme and also give
a comfortable retirement.
Savings in developing nations have some common characteristics of low performance even
though economic activities like mining, oil drilling and farming in dorminant. For the past three
decades, savings has reduced drastically in Sub-sahara Africa and Latin America although it has
doubled in Eastern Asia and other developed nations during that same period (Nwachukwu and
Odigie, 2009). This is of a major concern since there is a strong correlation between savings and
economic growth (Bremang, 2012). In Ghana, a third of all households own savings accounts,
and out of this, two-fifth of these savings accounts are owned by the urban households whiles
only twenty two (22%) of these accounts are owned by the rural folks (Ghana Statistical Service,
2008)
Determinants of savings like real interest rate, foreign savings, pensions, and so on, have existed
as components of savings in Ghana. Murphy and Musalem (2004) suggests that increases in
pension funds increase national savings when pension funds are the result of a mandatory
pension programme. So a question now arises are ;
What is the trends in pension contribution in Ghana?
University of Ghana http://ugspace.ug.edu.gh

5
What is the effect of pension funds on national savings?
What are the prospects and challenges of the pension scheme in Ghana?
Knowing the trends in the pension contributions will help us know and project the trend of
investment by Ghana’s major investor, Social Security and National Insurance Trust (SSNIT).
Also if we know the relationship between the pension contributions and national savings, it will
inform policy makers on policies that deals with pensions and promote national savings.
1.3 Objectives
The main objective for the study is to examine how pension contributions affect national
savings in Ghana.
The specific objectives are as follows;
To examine the trends in pension contributions and national savings in Ghana
To establish the relationship between pension contributions and national savings.
To identify the prospects and challenges in the pension industry.
1.4 Significance of the study
Murphy and Musalem (2004) conducted an empirical research on the effect of the accumulation
of pension fund on national savings and found out that, this depends on whether the fund is
mandatory or voluntary. It is suggested that increases in pension funds financial assets increase
national saving when pension funds are the result of a mandatory pension program (Murphy and
Musalem, 2004). There have been contradictory conclusions about the relationship between
pension and savings.
University of Ghana http://ugspace.ug.edu.gh

6
Feldstein (1996) reports that the total effect of the pay as you go programme was to reduce
personal savings by approximately $484 billion. Boyle and Murray (1979)researched on Canada
and considered the relationship between pension and savings, and finds a negative relationship.
Yamada (1992) did a similar research on Japan, whiles Makowski and Palmer (1979) researched
using data of Sweden and found a negative relationship between savings and pension.
On the other hand, Kune (1981), Kopits and Gotur (1981) used data of Netherlands and fourteen
Organisation for Economic Co-operation and Development (OECD) nations respectively and
found a positive relationship between savings and pension.
Therefore the study seeks to find the relationship between pension fund and national savings in
Ghana’s context since its operates a mandatory kind of public pension scheme.
Also, there are few literature on the relationship between pension and national savings in Sub-
Sahara Africa and this study tends to contribute to broaden the literature base in this respect.
1.5 Organization of the study
The study will be organized into six chapters. The first chapter highlights on the background of
study, problem statement, objectives and significance of the study. Chapter two illuminates on
the overview of the pension systems in Ghana. A critical review of the literature is carried out in
chapter three which comprises of both theoretical literature and empirical literature. Out of this
extensive literature review, the theoretical framework will be established for the research in
chapter four. The fifth chapter of this research study elaborates on the presentation and
discussion of results from this study. The final chapter will give vivid summary, conclusion and
recommendations.
University of Ghana http://ugspace.ug.edu.gh

7
CHAPTER TWO
OVERVIEW OF THE NATIONAL PENSIONS SCHEMES AND SAVINGS IN GHANA
2.1 Introduction
In the previous chapter, several types and kinds of pensions were highlighted. This has generated
major evolutions in the industry. This chapter will give a brief overview of the pensions systems
in Ghana, that is, the history of pension contributions in Ghana. The chapter also expatiates on
reasons why the pension industry always keeps growing. Also, the institutions responsible for
pensions in Ghana were mentioned and their activities outlined.
2.2 The History Of Pension Plans In Ghana
In the past, Ghana had a rich history of the traditional system of social security which existed
among the rural folks long before independence. This ensured that the extended family had a
responsibility of taking care of the aged, the infirm and the finances that arise as a result of the
demise of contributor or a pensioner of the scheme. The advent of modern society that is highly
migratory and the introduction of social security have greatly disrupted the extended family
system of pension plan(Dei, 1997). The gap created is that some people who are not formally
employed by government and have migrated from their rural inhabitants to the city fall between
the traditional extended family system of pensions and the social security offered by government.
In Ghana, majority of our population fall in the informal sector of the economy and the challenge
is to design schemes to cater for the needs of this broader sector of the population. The
introduction of formal pensions in Ghana dates back in the colonial era when the British
University of Ghana http://ugspace.ug.edu.gh
8
government introduced pensions for a select group of civil servants who were known as
pensionable officers.
Kpessa (2010) finds that, “the first program was designed as a means of encouraging loyalty and
efficiency within the colonial civil service”. This retirement benefit was not one that was carved
from deferred incomes by the retiree but rather it was seen and considered as a reward for people
who served the Queen and the colony diligently till their old age. Thus, public servants had no
entitlement to such programs unless they were judged by colonial administrators as meeting
eligibility requirement of loyalty (Government of Ghana, 2006). The income protection policy
was introduced to only urban dwellers who were Europeans and some few Africans in the
colonial Bureaucracy (Asamoah and Nortey, 1987). The Old age income protection policy that
was working during the colonial era was accompanied with the introduction of the Colonial
Development and Welfare Act in 1940s (Darkwa, 1997).
Later, a Pension Ordinance was enacted by the British government to replace and unify the
Pensions (European Officer) Ordinance (CAP-29, 1936) and the pensions (Non-European
Officer) Ordinance(CAP-30. 1936) into a single non-discriminatory pensions scheme that
offered equal benefits to both expatriates and local workers during this era (Government of
Ghana, 2006). In its unified form, the scheme was referred to as CAP-30. This name was
derived from chapter 30 of the 1950 Pension Ordinance (Kumado and Gockel, 2003). Because
this scheme was seen as one that did not involve any contribution, it was meant for workers who
have been loyal to their work and without blemish for at least ten years in service. With the
CAP-30, employee could take a voluntary retirement at age forty-five or a compulsory retirement
University of Ghana http://ugspace.ug.edu.gh
9
at age fifty. This scheme created a lot of inconvenience for the British government since it was
fully financed by the government.
Due to the financial burdens inherent in the scheme, policy makers in the immediate post
independence years opted for the establishment of a new and different pension scheme known as
Provident funds in 1965 for all categories of workers that were not covered by the CAP 30
scheme (Kpessa, 2010). Government established a more improved national scheme to cover all
workers for both the private and public sector of the economy.
The term provident fund refers to a pension plan under which retiring workers received lump
sum benefits in the form of financial assets build up over a period of time through membership
contributions and investment returns (Dixon, 1989, 1993, 2000). This was a type of defined
contribution since the employer (government) contributes funds to the scheme, but the employee
bears all the risk of the fund’s investment performance. Under this arrangement “an individual’s
pension is annuity whose size, at any given life expectancy and rate of interest, is determined
only by the size of his or her lifetime pension accumulation” (Barr, 2002). The Provident Fund
provides a lump sum payment for old age, invalidity and survivors benefits. During this period,
the funds generated from the contributions were invested in special government bonds with very
low interest rates and very long maturity periods.
Mkandawire (2001) argued that between the late 1950s and the early 1970s, the state was a
developmental one in the sense that it was unified; it demonstrated autonomy from social forces,
and prioritized human welfare over digitally measured growth by harnessing domestic resources
University of Ghana http://ugspace.ug.edu.gh

10
for development. Madavo (2005) also noted in the 1960s, economies in Africa including Ghana
witnessed robust growth, and infrastructure, education and health were given maximum priority.
Between the mid 1970s and 1982, the rate of domestic savings fell from 12% to 3%, the rate of
investment fell from 14% to 2% of GDP, the government deficit increased from 0.4% to 14.6%
of total government spending, the volume of import fell by two-thirds, real export earnings did
not only drop by one-half, the ratio of Ghana’s export to GDP fell from 21% to a low of 4%,
income per capita dropped by 30%, and real wages by 80% (Boafo-Arthur, 2001). The joint
economic losses that struck the nation at that time led to a hyperinflation of about 123% in 1983.
(Dorkenoo, 2006; Konadu-Agyemang ,2001).
As a result of low interest rates and the rising inflation at the time, the lump sum benefits due to
retiring beneficiaries were meaningless. “Following the negative impact of the economic crisis
on the provident funds, the labor unions demanded the conversion of the provident funds to pay-
as-you-so (PAYG) social insurance that to pay regular monthly benefits to retirees”.(Kpessa,
2010).
Later in the 1990s, government converted the problematic provident fund to a social insurance
that enabled pensioners to receive monthly installments instead of the lump sum. (Government of
Ghana, 1982). Under this new scheme, workers were asked to contribute at least 240 months (20
years) to the scheme to qualify for retirement benefits. “Individuals who retire before the
mandatory retirement age are paid reduced benefits”. (Darkwa, 1997; Government of Ghana,
2006; Kumado and Gockel, 2003). Workers who were under the Provident Fund were
University of Ghana http://ugspace.ug.edu.gh
11
automatically enrolled in the new social insurance scheme and “Individuals who attained the
retirement age at the exact date of the transition were given the option to choose between
monthly benefits and lump sum payment, and pension entitlements were extended to employees
who aged 55 (the retirement age under the provident funds) with less than 240 of months
participation but more than 180 months contribution to smoothen the transition process” (Dei,
1997). The scheme was designed in a way that it considered the three main contingencies; old
age/retirement, invalidity/disability and dependents/ survival’s benefits. The compulsory old age
retirement was pegged at 60years while the voluntary retirement was also placed at 55 years.
Kpessa (2010) finds that “Benefits are calculated on the basis of 50% of the average of an
employee’s three best years’ salary. Employees are awarded an additional 1.5% on top of the
50% minimum base pension formula for every additional year of contribution or participation in
the scheme beyond the 240 months up to a maximum pension benefit of 80% of the best three
years’ income”. Adjei (2000) and Osei (2005) also added their voice to this topic by finding that
if an employee is not able to contribute for the total of 240 months before retirement will receive
his or her accumulated contributions with interest that is calculated at half the rate of the
government’s treasury bills.
For the disability benefit, in order to qualify, the employee should have contributed not less than
three years to the scheme and must be medically proven by the medical board incapable of
working again. Disability benefits are usually paid in monthly installment to the pensioner and
lump sum payment to nominated beneficiary if the pensioner is deceased. Kpessa (2010) reports
in his research on “The politics of retirement income security policy in Ghana: Historical
University of Ghana http://ugspace.ug.edu.gh

12
trajectories and transformative capabilities” that “Dependents of deceased employees who
contribute to the scheme for a total of 240 months or more receive lump sum benefits equivalent
to twelve years monthly retirement income. Under the social insurance scheme, if an employee
passed away before reaching the 240 month contribution threshold, the dependent receives a
lump sum benefit equivalent to 12 years retirement income proportional to the contributions
made. In the event that a pensioner passes away before age 72, his/her dependent are paid lump
sum benefit calculated up to the age 72 of the deceased retiree while dependents of a deceased
pensioner aged 72 and over are not entitled to any benefit” (Dei, 1997; Dorkenoo, 2006; Osei,
2005).
The Government of Ghana also reported in 2006 that in 1991 when this scheme was introduced
the total number of active members were about 647,712. Social Security and National Insurance
Trust in 2006 also reported that by the close of that year the active members increased to
1,211,620 members, which is an 87.06% percentage increase within the fifteen years of
establishment and at the close of that year the scheme recorded a total contribution of 2,868
billion old cedis. With this type of insurance, the employee contributes 5% whiles the employer
contributes 12.5% forming a total contribution of 17.5%. “The most distinguishing feature of the
social insurance plans has to do with the fact that it ensures inter-generational transfers and
designed to ensure solidarity and collectivization of risks” (Kpessa, 2010). Funds or
contributions from the scheme are invested in various sections of the economy like financial,
manufacturing, services, residential (real estate), and commercial properties. Generally, the
investment portfolio of the scheme is divided into fixed and non-fixed income investments. The
fixed income investments include registered stocks, home finance company index linked bonds,
University of Ghana http://ugspace.ug.edu.gh

13
fixed deposits, call monies, student loans, corporate loans, treasury bills and government bonds
and most of these investments are mostly short term. “Non-fixed income investments are
economically targeted investment such real estate, commercial and residential, development and
equities. These usually have long gestation period and are venerable to market fluctuations
(Kpessa, 2010). Osei (2005) and SSNIT (2006) also collectively ascertained that by the end of
2006 the scheme had equity holdings in more than 53 companies in which some are listed on the
stock market. “Actuarial evaluation of the scheme in 2004 projected that, at 2% rate of returns on
investment and 3% annual increase in contributors; the scheme can be sustained over a fifty-year
(2004-2054) period” (Kpessa, 2010). The running of two of the nation’s pensions scheme
brought some level of dissatisfaction. Kumado and Gockel (2003) also reported emphatically
that; “Clearly, retirement benefits under CAP 30 are undoubtedly better than those under the
SSNIT scheme, which is why those who can keep themselves in the plan do so, and others
outside it are fighting to get on it. The problem is not only that there is great dissatisfaction
among those workers who do not enjoy the superior coverage of CAP 30; it is also that the
largely unfunded nature of the plan is a drain on general revenue.”
In July 2004, The President of Ghana appointed a nine member presidential commission on
pensions, chaired by one T.A. Bediako, to examine existing pension shceme(s) that will ensure
retirement income security for Ghanaian workers. The Bediako Commission submitted its final
report to government in March 2006 and the main recommendation of the commission is the
creation of a new contributory three-tier pension system for Ghana comprising two mandatory
and a voluntary scheme. It is out of this recommendation that brought to the complete phase out
of CAP 30.
University of Ghana http://ugspace.ug.edu.gh

14
Agbobli (2010) also talked about the full operation of the Three Tier Pension Scheme in Ghana.
Further light was thrown on the Three Tier Pensions Scheme as three separate sources one can
save towards ones retirement. This pensions reform introduced had its firm grounds from
National Pensions Act,2008 (Act 766). The new scheme consists of three strong investment
vehicles which are geared to bring comfort to the pensioner or there beneficiaries and they are
arranged as follows;
First Tier mandatory basic national security scheme which will incorporate an
improved system of SSNIT benefits mandatory for all employees in both the private
and public sector( no lump sum payment, only monthly pensions and related
benefits such as survivor benefit.)
Second Tier occupational pension scheme, mandatory for all employees but
privately managed and designed primarily to give contributors higher lump sum
benefits than presently available under the SSNIT or Cap 30 pensions schemes.
Third Tier voluntary provident fund and personal schemes, supported by tax
incentives. It is pertinent to note that this 3rd
tier voluntary personal pensions seeks
to address the needs of workers in the informal sector of the economy of the
working populace.
With this type of pension scheme, the employer contributes 13% and the employee contributes
5.5% making a total of 18.5%. This creates a 1% increment in contribution from the old social
security scheme. This additional increment was shared among both the employee and the
employer. Though the 1% additional increment looks quantitatively small, the benefits are much
higher and more rewarding. The benefits of this retirement scheme are monthly pension income,
University of Ghana http://ugspace.ug.edu.gh

15
lump sum payment, invalidity benefits, survivor benefits and a favorable tax exemption from
investments.
2.3 Institutions Of The National Pension Scheme
The first established of pension institution by government to regulate contributions and benefit
payment was the Social Security and National Insurance Trust in 1965. The mandate of SSNIT
has changed to administering of the First Tier Basic Scheme in a form of a Pay as you go
scheme. Currently the National Pensions Regulatory Authority (NPRA) regulates the entire the
entire administration of pensions in Ghana. Also, with the establishment of the New Three Tier
Pension Scheme, private financial institution who have been given the mandate to serve as
Trustees and Pension Fund Managers have joined the pension industry and are regulated by the
NPRA. This section briefly describes the two government agencies in the pension industry, their
functions and their objectives.
2.3.1 The National Pensions Regulations Authority (NPRA)
This is a body that was established in 2008 under Act 766 of the constitution of Ghana. The Act
766 is to provide pension reforms for Ghana by introducing a contributory Three Tier Scheme.
This Authority was established to oversee the administration and management of registered
pension schemes and trustees of the scheme. NPRA is liable to sue and can be sued since it is a
corporate body. The main objective of this body is to regulate and monitor the operations of the
scheme and ensure the effective administration of pensions in the country. NPRA performs the
following functions. Table 1 clearly outlines the functions of NPRA
University of Ghana http://ugspace.ug.edu.gh

16
Table 1: Functions of NPRA
Functions of the Authority
1. be responsible for ensuring compliance with this Act
2. register occupational pension schemes, provident funds and personal
pension schemes
3. register occupational pension schemes, provident funds and personal
pension schemes;
4. issue guidelines for the investment of pension funds
5. approve, regulate and monitor trustees, pension fund managers ,custodians and other
institutions that deal with pensions as the
custodians and other institutions that deal with pensions as the
Authority may determine
6. establish standards, rules and guidelines for the management of pension
funds under this Act;
7 establish standards, rules and guidelines for the management of pension
funds under this Act
8. regulate the affairs and activities of approved trustees and ensure that
the trustees administer the registered schemes
9. regulate and monitor the implementation of the Basic National Social
Security Scheme
University of Ghana http://ugspace.ug.edu.gh

17
10. carry-out research and ensure the maintenance of a national data bank
on pension matters
11. sensitise the public on matters related to the various pension schemes
12. receive and investigate complaints of impropriety in respect of the
management of pension schemes
13. promote and encourage the development of the pension scheme industry in the country
14. receive, and investigate grievances from pensioners and provide for
redress
15. advise government on the general welfare of pensioners
16 advise government on the overall policy on pensions in the country
17 request information from any employer, trustee, pension fund manager or custodian,
any other person or institution on matters related to
retirement benefit
18 charge and collect fees as the Authority may determine
19. impose administrative sanctions or fines
20. perform any other functions that are ancillary to the object of the
Authority
Source; National Pensions Act, ACT766
2.3.2 The Social Security And National Insurance Trust (SSNIT)
SSNIT has been administering pension funds in Ghana since 1965. It first started administering
Provident Fund for formal workers in Ghana until a bill was passed in 1991 which converted the
University of Ghana http://ugspace.ug.edu.gh
18
Provident Fund to the Pay as you go scheme. The aim of the conversion was to provide better
social income protection (Gockel, 1996).
SSNIT has about 1,051,429 members contributing to the scheme and 119,323 pensioners
benefiting from the scheme (SSNIT report, 2012). SSNIT now operates at all the ten regional
offices in Ghana. This institution operates under two main lines; that is the administrative section
and the investment sections (Gockel, 1996). The object of the Trust is to operate the basic
national social security scheme referred to as the social security scheme and other schemes as
determined by law on the recommendations of the National Pensions Regulatory Authority.
SSNIT receives financing from the contributions and the return on investment on the
contributions. Investment by SSNIT is in the areas of Equities, Fixed income, and Real estates
(SSNIT report, 2012).
Challenges Faced By SSNIT In The Administration Of The Scheme
SSNIT, a body responsible for the Pay as you go scheme, faces some administrative problems
that hinder the progress of the industry. This section of the study illuminated the main challenges
that is faced by the administrators of the mandatory basic contribution.
Delay in contribution payment by government
Government, the largest contributor to the SSNIT scheme most often delay in payment of the
contributions for the government and this causes SSNIT to delay in its projects and investment. It
is almost impossible for SSNIT to force government to pay, since some board members and the
Director General are appointed by government and are part of government. Government
sometimes also delays in the payment of loans from SSNIT and this causes some sort of
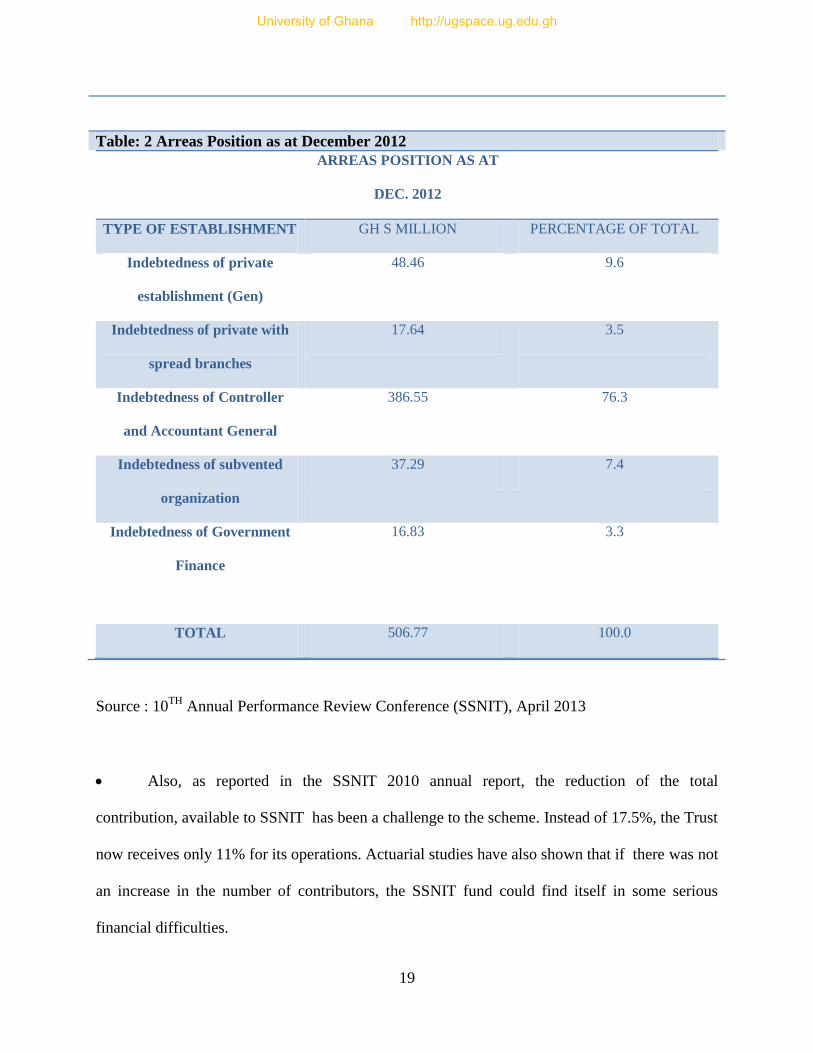
difficulty for the scheme. A table below shows the indeptedness position as at the end of
December 2012 at SSNIT
University of Ghana http://ugspace.ug.edu.gh
19
Table: 2 Arreas Position as at December 2012 ARREAS POSITION AS AT
DEC. 2012
TYPE OF ESTABLISHMENT GH S MILLION PERCENTAGE OF TOTAL
Indebtedness of private
establishment (Gen)
48.46 9.6
Indebtedness of private with
spread branches
17.64 3.5
Indebtedness of Controller
and Accountant General
386.55 76.3
Indebtedness of subvented
organization
37.29 7.4
Indebtedness of Government
Finance
16.83 3.3
TOTAL 506.77 100.0
Source : 10TH
Annual Performance Review Conference (SSNIT), April 2013
Also, as reported in the SSNIT 2010 annual report, the reduction of the total
contribution, available to SSNIT has been a challenge to the scheme. Instead of 17.5%, the Trust
now receives only 11% for its operations. Actuarial studies have also shown that if there was not
an increase in the number of contributors, the SSNIT fund could find itself in some serious
financial difficulties.
University of Ghana http://ugspace.ug.edu.gh

20
Objectives Of Pension Institutions Under The New Pensions Act 766
Table 3 below contains the main objective of the bodies that will ensure the smooth and efficient
running of the Three Tier Pension Scheme under the authority of the ACT 766. The NPRA being
the regulatory body, have a responsibility of monitoring all the other bodies mandated to manage
the scheme. SSNIT is the second largest body in the pension industry in Ghana and they have
been mandated to manage the compulsory First Tier contribution which is made up of the 13.5%
of the 18.5%. out of the protion managed by SSNIT, 2.5% also goes to insure the members of the
scheme. The Trustees and Fund Manager one chooses, are responsible for administering and
growing the 5% of the fund which is the occupational scheme. They may also be appointed by
the employee to manage the personal private pension scheme.
Table 3: The Pension Institutions And Their Main Objective In Ghana PENSION INSTITUTION CENTRAL OBJECTIVE
National Pensions Regulatory Authority The main objective of this body is to regulate
and monitor the operations of the scheme and
ensure the effective administration of pensions
in the country.
Social Security and National Insurance Trust The object of the Trust is to operate the basic
national social security scheme
referred to as the social security scheme and
other schemes as determined by law on
the recommendations of the National Pensions
Regulatory Authority
University of Ghana http://ugspace.ug.edu.gh

21
The Trustees Responsible to oversee the administration of
the second tier and third tier schemes
The Fund Managers Manage the growth of the funds from the
occupational scheme and the personal private
pension scheme.
Source; ACT766 (2008)
2.4 Trends Of Pension Contributions In Ghana
Analyzing pension contribution that span for about thirty years shows an interesting trend as is
shown the figure two. From the period of 1980 to 1983, the SSNIT scheme received
contributions in terms of hundreds of cedis. This occurrence may be as a result of political and
economical instability that Ghana was faced with at that time. One way of increasing the the
pension contribution is through the increase of productivity among firms but this was not the
case during that period since firms were folding up , many lacked sufficient raw materials to
increase productivity and the political instability also lead many people fleeing their jobs to seek
shelter elsewhere. From the period of 1984 to 1988, contributions increased to column of
thousands of old cedis. This increase in contribution can be accounted for as a result of stability
in governance and the economy during that people. Also, during that period, the Social Security
and National Insurance Trust (SSNIT) increased the awareness of the pension scheme by having
seminar workshops with employers and employees across the length and breadth of the country.
This education brought about clarity of the scheme and also contributed to the growth of the
scheme during the period of 1984 to 1988. As people came to understand the scheme,
University of Ghana http://ugspace.ug.edu.gh

22
contributions increased to tens of thousand cedis and jumped further to hundreds of thousands in
cedis from 1995 to the early 2000s.this continuous rise in trend in the period of 1990s was as a
result of tax expemtion advantage enjoyed by both employer and employee. Allen et al. (1966)
explains that, to the employer, the avoidance of tax paid on contribution makes the employer
“happy”. Also, employees are happy because they benefit of savings without tax deductions till
the day of withdrwal. This makes it a win-win affair for both the employer and the employee. In
2009, the SSNIT scheme received the highest contribution of ¢6,670,000.this was as a result of
the competitiveness of the labour market at that time. In a free, competitive labour market, an
employer with pension plans has the tendency of attracting prospective employees. This is
because employers who are embarking on this plan are considered as employee friendly.
Therefore, employers without his plan are at a competitive disadvantage in attracting and holding
personnel. Attracting more prospective employees who may be skilled will cause productivity to
increase and will also cause the pension plan to grow.
However, the fell in 2010 as a result of the introduction of the three tier scheme which limits
SSNIT to control only 11% of the contribution. Also, awareness and sensitization of the new
pension scheme was low causing employers and employees to drag their feet in payment. Figure
1 displays a graphical representation of the trend in contribution from 1980 to 2010
University of Ghana http://ugspace.ug.edu.gh

23
Figure 1: SSNIT Pension contribution :1980 -2010
Source: Author’s computation from the SSNIT data (2013)
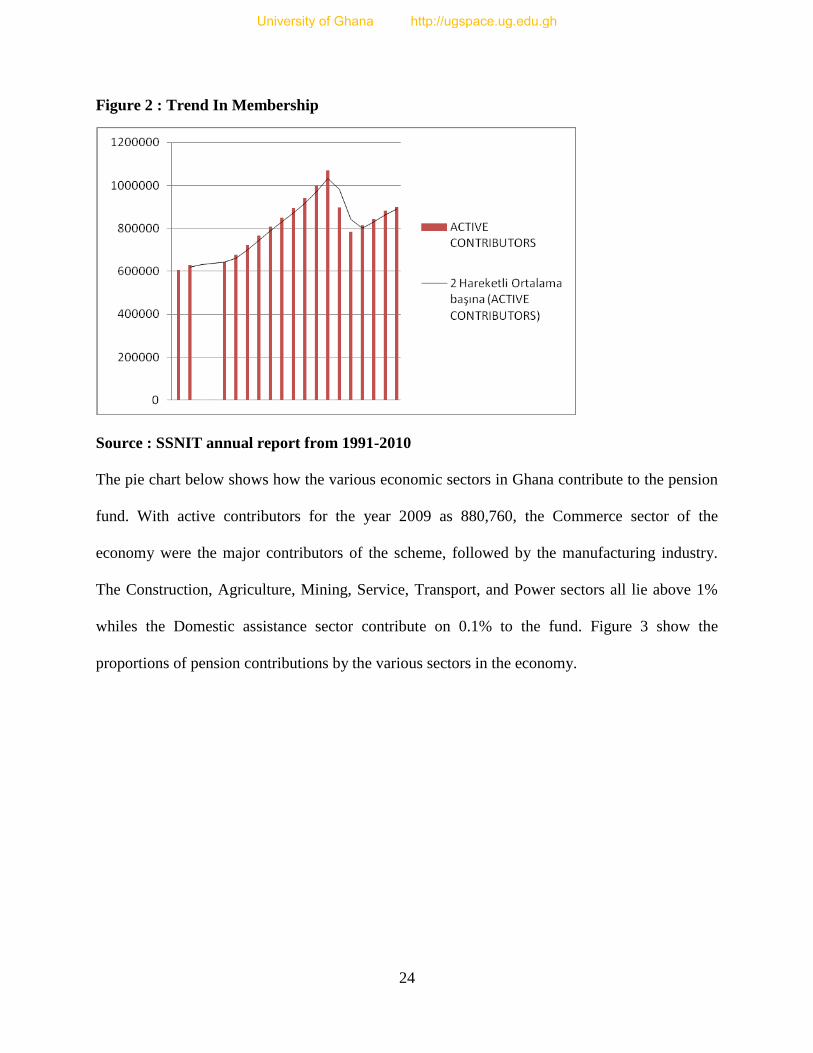
The increasing awareness of the SSNIT pension scheme, has caused a continuous increase in the
number of pension contributors. In 1991, the scheme had about six hundred thousand
contributors and this gradually continued to increase to about a million contributors in 2004.
However, in 2005 and 2006, contributors decreased by about 20% to 30% and recorded about
seven hundred thousand active contributors in the scheme.
Membership number began to rise again in 2007, till it hit the institutions target of one million
again in July 2012. Data on the membership strength for 1993 t0 1994 was not available from
SSNIT. Figure 2 shows the trend in growth of contributors form 1991 to 2010
University of Ghana http://ugspace.ug.edu.gh
24
Figure 2 : Trend In Membership
Source : SSNIT annual report from 1991-2010
The pie chart below shows how the various economic sectors in Ghana contribute to the pension
fund. With active contributors for the year 2009 as 880,760, the Commerce sector of the
economy were the major contributors of the scheme, followed by the manufacturing industry.
The Construction, Agriculture, Mining, Service, Transport, and Power sectors all lie above 1%
whiles the Domestic assistance sector contribute on 0.1% to the fund. Figure 3 show the
proportions of pension contributions by the various sectors in the economy.
University of Ghana http://ugspace.ug.edu.gh

25
Figure 3 : Sector contribution to SSNIT scheme
Source: SSNIT report (2009)
2.5 Savings in Ghana
Savings in Ghana are from two main source; public sector and the private sector. Therefore,
national savings are the compositions of savings from the public sector and the private sector.
The public sector comprises of government agencies that collect monies in forms of tarrifs and
taxes for efficient and equitable redistribution of resources in the economy. These monies help in
the developmental projects for the country.
The private sector is also made up of domestic household and private businesses in the country.
As individual always face the challenge of how much to and save in order to continue
consumption smoothening, government also face faces similar challenges in allocation monies
for consumption and national savings. Financial intermediaries have been established in most
parts of the country making it easy and comfortable to save. These financial institutions include
University of Ghana http://ugspace.ug.edu.gh

26
financial institutions and non financial institutions. Non financial institution include the NPRA,
SSNIT, Insurance companies and so on whiles financial institutions in Ghana include, Banks,
microfinance companies, Stock Exchange Commision (SEC) and Brokerage firms.
The formal sector of the Financial Institution consist of about twenty six Banks,and theinformal
sector consist of susu operators and other traditional savings operators (Bremang, 2012).
2.4.1 Trends in savings
Savings has become every nation’s prority because of its strong correlation with economic
growth. The Eastern Asia has seen some remarkable increase in their national savings due to the
improvement of infrastructure and technology, whiles most countries in Latin America have
experienced stagnancy (Apergis et al, 2012). In Africa, we have also received an undulating
trend in our national savings (Loayza et al. 2000). Apergis and Christou (2012) defined the
Gross Domestic Savings as calculated as GDP less final consumption (total consumption).
World Development Indicators (2013) also indicated an unstable movement in trend the Ghana’s
Gross Domestic Savings which supports the study of Loayza et al (2000). The bar graph below is
an average of five years interval of Gross Domestic Savings as a percentage of GDP with data
spanning from 1960 to 2012. The highest national savings was recorded between 1960-1965 and
these were the early years after independence (Kpessa, 2010). The high savings was partially as a
result of the small size in population of the country and the aboundance of natural resources.
Politcian have also attributed that growth to good management of the resource by the then
government of Ghana (Kpessa, 2010). The best savings period Ghana recorded was from 1960-
1965. The undulating trend in Ghana’s savings is as a result of economic and political instability.
From the period of 1965 to 1969, the trend in savings began to falla nd this can be attributed to
University of Ghana http://ugspace.ug.edu.gh
27
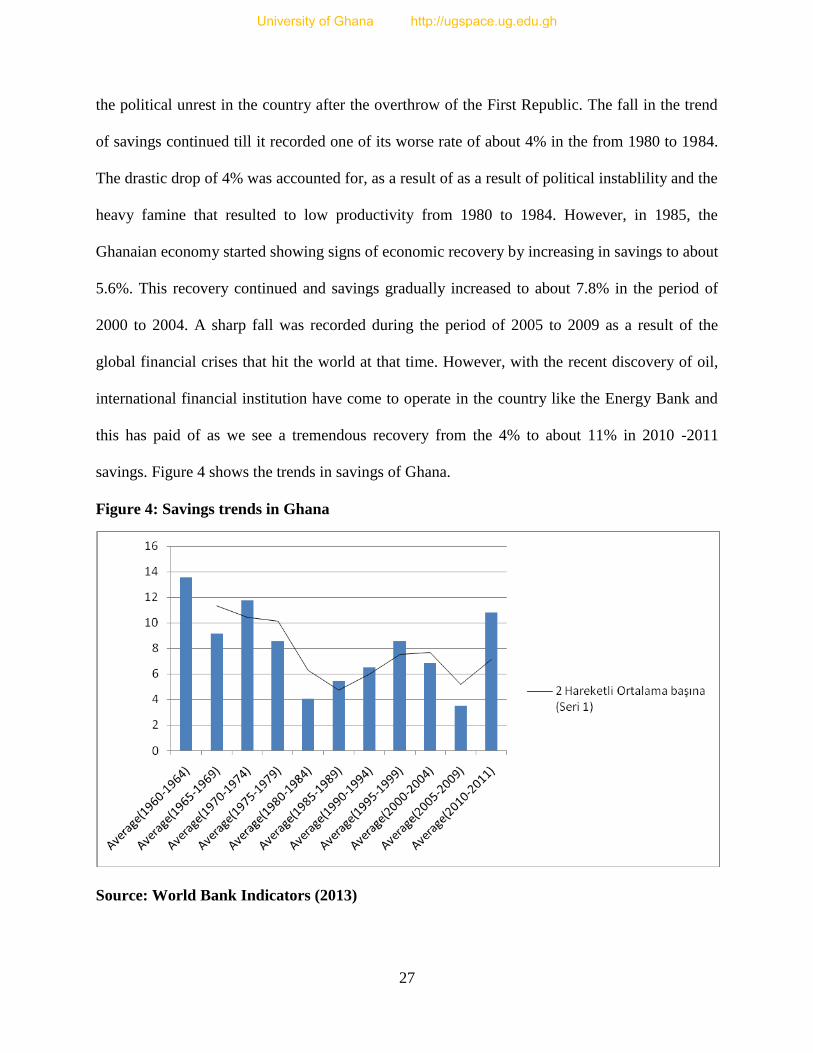
the political unrest in the country after the overthrow of the First Republic. The fall in the trend
of savings continued till it recorded one of its worse rate of about 4% in the from 1980 to 1984.
The drastic drop of 4% was accounted for, as a result of as a result of political instablility and the
heavy famine that resulted to low productivity from 1980 to 1984. However, in 1985, the
Ghanaian economy started showing signs of economic recovery by increasing in savings to about
5.6%. This recovery continued and savings gradually increased to about 7.8% in the period of
2000 to 2004. A sharp fall was recorded during the period of 2005 to 2009 as a result of the
global financial crises that hit the world at that time. However, with the recent discovery of oil,
international financial institution have come to operate in the country like the Energy Bank and
this has paid of as we see a tremendous recovery from the 4% to about 11% in 2010 -2011
savings. Figure 4 shows the trends in savings of Ghana.
Figure 4: Savings trends in Ghana
Source: World Bank Indicators (2013)
University of Ghana http://ugspace.ug.edu.gh
28
2.4 Chapter Summary
This chapter starts with a vivid history of our pension plans in Ghana, explaining the various
reasons for the evolution of our pension systems. The study in this chapter, discusses the reasons
why the pensions industry keeps growing. In that same section, it talks about the various actions
that can be taken by an employer who is faced by the problem of ageing and ends by enforcing
pension plan as the best option. Section 2.3 also talks extensively by the NPRA and its functions.
SSNIT, responsible for administering the First- Tier pension scheme are also not left out with
their functions fully elaborated. Other constitutionally licensed bodies like the Trustees, Fund
Managers and Custodians were also brought to exposition with their functions fully stated. The
pie chart diagram in this chapter graphically illustrates with percentage of contribution from the
various economic sectors of the economy.
University of Ghana http://ugspace.ug.edu.gh

29
CHAPTER THREE
LITERATURE REVIEW
3.1 Introduction
Many countries have embarked on the journey of social security since ageing is inevitable in our
societies and this backdates to the early nineteenth centuries. In our traditional circles, the
extended families took care of the aged and sick people who could not work, however the
situation we find ourselves currently is different due to the search for greener pastures. Pensions
in diverse forms have one goal in every society and that is to smoothen consumption when one is
old and cannot work anymore (Allen et al. 1966). Earlier literature have emphasised the need to
cater for the aged in the society and this has been of prime importance to many governments
across the globe.
Savings rate around the globe has been undulating and very volatile with East Asia saving more
than 30% of the gross national domestic income (GNDI) whiles Sub-Sahara Africa saves less
than 15% of their GNDI. Developed nations have similar determinants of savings whiles
developing nations like Ghana, Nigeria and Korea also have their own savings characteristics
(Deaton 1989; Gersovitz, 1988; Schmidt- Hebbel, 1992).
This chapter takes a critical review of the literature on pensions and savings developments. The
review is divided into theoretical and empirical review. The former deals with the definitions and
University of Ghana http://ugspace.ug.edu.gh

30
conceptual issues of pension and savings. It is also concerned with models/ theories of pension,
savings and savings determinants as well.
The second part has to do with the empirical considerations related to savings and pension
where related works will be brought to play.
3.2 Theoretical literature
3.2.1 Definitional Issues
The insurance rationale for Public pensions arises because every individual is faced with quite a
number of risks in his or her life time that typically cannot be insured in the private market (Aidt
et al. 2008).
Pension systems are transfer schemes instituted by the State, with the purpose of providing
income to the elderly in a context where informal arrangements are considered insufficient
(Rofman & Oliveri, 2012). A pension is a contract for a fixed sum to be paid regularly to a
person typically following retirement from service. The Organization for Economic Co-operation
and Development (OECD) glossary (2005) defines Pension funds as a pool of assets forming an
independent legal entity that are brought with the contributions to a pension plan for the
exclusive purpose of financing pension plan benefit.
Pensions as explained by Agbobli (2010) is a means of investment for retirement purposes. It is
considered as a long term investment vehicle which converts one’s pension fund to pension
income when an individual retires till he or she dies. The difference between pension and other
investment is the availability of favorable tax treatment till the point of collection. This
retirement benefit could either be provided by government or made private.
University of Ghana http://ugspace.ug.edu.gh

31
State pension combines social insurance and welfare scheme where the state or government
improves the lives of the aged and invalid by smoothening their consumption when they have
retired (Agbobli, 2010). Other names for state pension are public pension or social security
schemes and these account for a substantial portion of disposable income of the aged (Aidt et al.
2008). Obeng (2008) explains social security as a scheme, established by statute for the
protection of members through a series of public measures against economic and social distress.
A comprehensive social security covers most productive workers (Perotti and Schwienbacher,
2006)
Non-state pension or private pension is a type of occupational scheme which is individualistic in
nature. Here, the state is not involved in providing pension benefits, that is , government does not
use state taxes to pay pensioners (Agbobli, 2010).
Adenutsi (2009) explains occupational pensions as a situation where an employer creates a
pension scheme for its workers. Occupation pensions give advantage to both the employer and
employee with respect to taxation.
The defined contribution is a type of pension scheme where the firm (employer) contributes into
an established savings account for the employee as pension benefit when the employee retires.
OECD (2005) explains defined contributions as an occupational pension under which the plan
sponsor or firm pays fixed contributions and has no legal or constructive obligation to pay
further contributions to an ongoing plan in the event of unfavorable plan experience
A defined benefit is a type of pension that promises a specified monthly benefit based on a
formula that considers the contributor’s salary and years of service (Department of Labour,
University of Ghana http://ugspace.ug.edu.gh

32
2013). A plan where benefits are linked through a formula to the members wages or salaries,
length of employment, or other factor is defined by OECD (2005) as Defined benefit.
Though pensions schemes usually fall under defined contribution and defined benefit, they have
changed with time due to diversity in social needs and constraints available making it either
mandatory or contributory.
National savings is the total savings by the private sector and the government. Savings has been
known to provide an important economic link between the past, present and the future of a
country. With an adequate national savings rate, achieving targets like investment and growth
can be realised (Aqdas and Bilquees, 1993) .
3.2.2 Models and theories related to pensions and saving
There have been extensive literature on pensions and savings but there is ambiguity on whether
the relationship between pension and savings is positive or negative. However, some theories
and models have been discussed in this section that implies the kind of relationship that is existed
between the two economic variables.
The life-cycle model provides a framework to study mandatory pension scheme on savings at the
micro-level. In this model, the individual lives for two periods, that is the working period and the
retirement period. The insight coined from this model is the fact that it encourages consumption
smoothening, that is, an individual will save during his working period and dissave for
consumption purposes during retirement. The import of the model is that, when an individual is
working, he will save in the form of pension income so that when he goes on retirement and he is
not working any more, he will receive those savings as pension benefit to enable him continue
University of Ghana http://ugspace.ug.edu.gh

33
consumption like he used to when he was working. Analyzing this model at the microeconomic
level, when the net pension wealth (present value of benefit minus value of contributions) is
positive, an individual reduces all other forms of savings and this causes consumption to increase
in both periods. If the net pension wealth is negative, an individual will prefer to increase their
other forms of his savings and reduce consumption at each period. Now, if we introduce
borrowing constraints, an individual may reduce his or her other savings (non-pension savings)
because he knows there is a borrowing facility available. However, the overall aggregate savings
will increase since the borrower will be paying plus interest on the loan (Murphy and Musalem,
2004).
Real world situation have some level of market imperfections and this generates a condition
where pension income and wage income are not perfect substitutes. The theory assumes that the
firms are risk neutral and employees are risk averse and an individual lives for four periods of
equal length. The import from this theory is that workers always receive their highest post-
training wage in their most senior working years at the firm and always end up with a pension
less than their final wage (Arvin, 1991).
Money set aside for pension by individuals can be generated from three sources; money allotted
to consumption, savings that would have been done in the absence of taxes, and savings as a
result of higher disposable income. National savings will increase only in the first instance. The
underpinning of this theory is that, from the Keynesian framework in a simple economy, savings
equals Income minus consumption and considering a closed economy (Smith, 1991). A fall in
consumption will cause savings to increase. In the second instance, the effect on savings is zero
since pension contribution serves as taxes imposed on employers and employees. However, in
University of Ghana http://ugspace.ug.edu.gh

34
the case of higher disposable income, private savings is compensated by lower public savings
causing a null effect on national savings (Attanasio and Deleire, 2002)
Pension portability and labour efficiency has been an interesting study since the 1990s. a training
model which gives an implication that, for quitting a job with insurance benefit is equal to the
value of the firm’s investment has mostly been considered when finding the relationship between
pension portability and labour efficiency. A significant observation made from the study is that,
less tenure path appears less well suited to the shirking model than the training model (Dorsay,
1995).
Individuals also save for bequest motives. That is, people can save for their children, parents,
relatives or friends in the form of inheritance. The besquest model suggests that every individual
has a multi- generational time horizon, that is, a time as a child(dependant), and adult
(independent) and a retired person(dependent). In the stages of dependence of a man’s life, he
may depend on bequest savings from beneficiaries. In this model, when we introduce the Pay as
you go scheme of pensions, there is no dislocation of private savings since individuals will adjust
their private bequest causing savings to offset the transfer. However when we introduce market
imperfections to the model such as liquidity constraint, a displactment of Pension fund on
national savings may occur (Kohl and O'Brien, 1998).
Humans sometimes do not act rational as assumed in most economic literature in the sense that,
pension wealth might be considered as a separate asset class which is only used for retirement or
invalidity purpose. When this happens, pension income will not be considered as part of
University of Ghana http://ugspace.ug.edu.gh

35
permanent income. If this situation occurs, there will be no substitution between pension and
other savings. This in a long run will reflect as an increase in national savings since pension
wealth will have its separate influence on savings whiles the individual continues to save for
furthrt purposes (Bebczuk and Musalem, 2006).Pension is part of a worker’s real wage. The
author buttressed this point by establishing that the forgone increase in wage is the pension
income contribution (Deroode, 1913).
Other authors have argued that, an important key in determining the effect of 401 (K) (U.S
pensions) is heterogeneity in taste for savings. Poterba et al.(1995) hammers on the fact that
based on household income and other demographic characteristics, the probability of one
working at a firm which offers a 401 (k) plan is exogeneous and makes this independent of
individual household saving behavior (Larra-lbara, 2011). This means that a smaller family size
with high household income and fewer dependents may save more in pensions and other savings
as compared to a large family size with many dependents and low household income.
When an individual saves voluntarily for the sake of retirement purposes, a rise in mandatory
institutional saving, either through legislation or through collective agreement to broaden the
scope of pensions will cause a large offset by a fall in voluntary savings. The offset of
institutional savings for retirement purpose as a result of reduced savings in other forms depends
also on the volume of liquid assets held by individuals [Samwick (1994); Caroll (1991); Deaton
(1992)]
Reforms that have occurred in Chile (1981), Peru (1993) and Columbia (1994) have involved in
the issuance of a special bond called “recognition bonds”. This bond issued substitudes for the
obligations of the Pay as you go system. In this way, recognition bond provides a mechanism for
University of Ghana http://ugspace.ug.edu.gh

36
government to partially reputable some of the implicit debt. If this occurs, current workers will
respond by reducing consumption and increasing savings across board (Samwick ,1994).
The Pay as you go scheme is designed in a way that gives annuity to the contributor when he
goes on retirement. The mandatory nature of most Pay as you go schemes in most developing
nations helps government to overcome potential adverse selection. Reforms that have errupted in
developing like Chile and Peru have created a non- annuity option for receiving benefit. When
there is a decrease in accessing annuities occur, savings may have to increase to partially insure
against longetivity risk (Samwick, 1994).
People save for precautionary motives. Individuals save in the face of uncertain deaths, income
disruptions and extraordinary health expenditure. It is in this light a two period consumption
model is used to explain a situation where an individual has in mind the distribution of his future
(retirement) income but does not know what his pension income will be like. This can of model
has uncertainty over both pension income and length of the individual’s life. Labour income,
interest rate and date of retirement is known while the utility function to used per- period is the
Constant Absolute Risk Aversion (CERA). From this model, one is able to deduce that without
certainty, consumption would be equal to the permanent income and with certainty, consumption
equals permanent income minus precausionary saving due to lifetime and pension income
uncertainty(Santen, 2013)
From the 2000 population and housing census conducted in Ghana, it was found out that about
80% of the working populace is in the informal sector of the economy (Mensah 2009). The
import of this statement is that about 20% of the population in Ghana can be found in the bracket
of formal working class in order to enjoy the SSNIT social security scheme.
University of Ghana http://ugspace.ug.edu.gh

37
As part of our Ghanaian culture, one family obligation for children is the care of aging parents.
The author made this point to buttress the situation of pension not been indexed to inflation in
Ghana. This implies that, a Ghanaian child in the working class group would have to save part of
his income to cater for his or her aging parents. This will cause the other non-pension savings to
reduce the overall aggregate savings to fall but pension contribution may not be affected since it
is deduced from one’s salary as a form of tax before it gets to the worker (Hendricks, 2000)
Kumado and Gockel (2003) extracted essential lessons from some various schemes around the
globe like the Switzerland pension system, the Singaporean system and the Chilean system. The
lesson from the First Pillar of the Swiss System which is in the form of pay as you go scheme
provides a suitable environment for developing countries to strive since government steps in to
contribute some percentage into the scheme. Ghana’s New Three Tier Scheme has the first tier
reflecting the lessons from the Swiss pension situation. The authors made a strong point of
recommendation that the first tier of Ghana’s new pension scheme should not operate under the
fully funded scheme. This statement has an underpinning from the fact that majority of the
Ghanaian populace is receiving wages below the minimum wage and government’s heavy
reliance on foreign donor source to finance budget. The second and third pillar of the Swiss
pension is also reflected in the Chilean and Singaporean systems of pensions which provides
both mandatory and voluntary schemes respectively. The third pillar which comprises of
voluntary savings actually increases individual pension contributions which is offset by a
reduction in other savings forms.
When a nation decides to move from a Pay as you go system to a fully funded system, this may
not only cause welfare enhancement but also increase savings by merely changing the taste or
technology for savings. This, the author explains as, in the Fully funded system, an individual
University of Ghana http://ugspace.ug.edu.gh

38
has a separate account for savings making it more transparent in terms of ownership. This
confidence gained by individual household and stimulate and encourage the individual to save in
other forms since he now knows how his pension fund is faring. Also, since these Fully funded
schemes are privately managed, there is an improvement in access to capital markets. When
these capital market are developed, this will cause savings to increase (Samwick, 1994 ;
Schmidt- Hebbel, 1998). In Ghana’s context, the pension reforms that led us to have the New
Three Tier scheme, the second tier which operates as a Fully funded scheme and privately
managed will increase capital market development and hence increase savings.
Whiles the subject of interest for this paper is essentially the relationship between national
savings and pensions contribution, it is very essential to consider other determinant of savings
which may impact directly or indirectly. Quite a number of studies have be done on the
determinants of savings in both developing and developed countries, particularly notable ones
are Deaton (1989), Gersovitz (1988), Schmidt-Hebbel, Webb and Corsetti (1992), Murphy and
Musalem (2004) Bremang (2012), Adayi (2004), and Obeng (2008) and the savings determinants
includes, old age dependency, young age dependency, urbanization, terms of trade, income and
wealth, growth, real interest rate, inflation, financial deepening, and foreign savings.
3.3 Empirical literature
Empirical literature on social security and savings has produced a wide variety of conclusions.
Lack of common concensus is due to the theoretical underpinnings and the lack of a clear
empirical test.
The impact of aging population on economic growth depends on saving rate, capital stock,
access to foreign capital and level of retirees. A series of dynamic panel estimators (within
University of Ghana http://ugspace.ug.edu.gh

39
group, first differentiated and system GMM) was used to achieve the objective of the extent to
which old age dependency affect gross domestic product (GDP) growth. The study brings to
light an interesting observation of a non-linear and negative relationship between savings and
GDP growth in countries with high level old age dependency (Herzog 2012).
Considering the effect of health, wealth and wages on retirement behavior, a life-cycle model
together with method of moments is used from a panel study with income dynamics. French
(2005), examined this, and from his study,it was implied that if social security is removed from
the compensation benefit, employees who are above sixty five years will want to stay a bit longer
in the work place unless their strength gives them up
The extent to which pension benefit are offset by the reduction in wages has always been an
interesting labour issue. Montgomery et al.(1990) tried to investigate this, through the Hedonic
model. The U.S data for 1983 survey of consumer finance was used and the implication of the
findings is that, a one to one pension-wage tradeoff is always established over a worker’s life
time.
A gap in pension and wages as a result of gender has been a study some economist have
undertaken. A switching model as suggested by Maddela et al.(1985) with data from 1983
current population survey was used due to the inbuilt pension information. The understanding
from finding was that, for each sex, pension coverage is associated with a 13% to 15% increase
in return to observed characteristics (Even and Macpherson, 1990)
University of Ghana http://ugspace.ug.edu.gh
40
3.3.1Time Series Evidence
Diamons and Hausman (1980) used data from the Labour Department Survey of matured men
and found results that were consistent to the life-cycle theory. The study identified a substantial
substitution between individual asset accumulationand pension benefits provided through
savings programs.
The life-cycle model suggested by Modigliani (1970) can be used to examine the net social
security wealth on aggregate consumption. The author also considered the net effect of private
pensions on private savings. In both studies, annual time series data spanning from 1929 to 1971
was used. Both sudies had a linear relationship and ordinary least squares was used for the
estimations. The deductions from both studies are that social security indeed reduces personal
savings by 30% to 15% and private savings does not affect private pensions (Feldstein, 1974;
1978)
The relationship between private pension coverage and savings has been examined by Munnel
(1971) using a sample of men in their pre-retirement years over the period of 1966 to 1971. The
summarised findings from this study is that pension plans discourages savings in other forms
(Munnel, 1971)
Five thousand (5000) men between the ages of forty five (45) years and fifty nine (59) years in
1966 were used in the study of the effect of pension coverage on savings. The author controlled
for age, income, education, race, desire to leave an inheritance, expected retirement age and life
expectancy. The author’s result suggest that both pension coverage and participation offset
savings by reducing other forms of savings (Munnell, 1976). Another researcher (Kotlikoff,
University of Ghana http://ugspace.ug.edu.gh

41
1979) used the same data set provided by Munnel (1976) and discovered no significant effect of
pension coverage on wealth or saving.
The study of pension and savings have taken various angles over the past thirty (30) years.
Authors use several data that has pension characteristics. Older white men from a longitudinal
retirement history survey was used by an author and interesting findings was realised. An
insignificant effect of private pension wealth on other forms of wealth was discovered ( Blinder
et al. 1980). The spot light on Diamond and Hausman (1984) study was the indication that higher
annual pension benefit induce ealier retirement. This means that when pension benefit is higher,
working class who are characterised with saving may decide to retire before their retirement age,
and this will reduce savings in the country.
Cross section of households were considered for the study of ratios that exist between private
wealth and permanent income. In this study, permanent income is a function of age, income,
social security wealth and other variables. The results indicated that non- pension wealth declines
by between 27 and 51 cents per dollar of pension wealth and by between 17 and 21 cents per
dollar of social security wealth (Dicks-Mireaux and Kings, 1984). Similar study considered using
a cross section of American household and the estimates implied an offset of 16% of net worth to
pension wealth and 33% to social wealth.
Ippolito (1986) also decided to consider the empirical evidence that is consistent with personal
income tax theories of pensions. “Cross-section observations show a strong positive relationship
between the probability of pension coverage and income level” (Ippolito, 1986). Considering the
pension plan coverage for the private sector in 1979, it was observed that workers earning below
$5000 per year in U.S.A exhibited a ten percent coverage rate. “The rate increases over higher
University of Ghana http://ugspace.ug.edu.gh

42
wage levels until it reaches seventy eight (78) percent coverage for workers earning more than
$25,000 in 1979” (Ippolito, 1986)
The Vector Error Correction Model explained by Pesaran et al (2000) is a dynamic relationship
model, that allows for the Long run and short run causality of variables. It is also efficient for
small data sets of multivariate time series data (Pesaran and Smith 2006). Therefore, with a
multivariate time series data with 31 observation, the model will be efficient in establishing
dynamic relationships.
3.3.2 Cross country evidence
Cross sectional studies have discovered a complimentary relationship in terms of “recognition”
and “goal feasibility” effect between Pension coverage and savings behavior. In the study under
consideration, a positive relationship existed between pension coverage and private savings
(Katona, 1965; Cagan, 1965).
The study of determinants of savings has been considered from both developed and developing
country points of view. In one of the related works, the author used a panel of over 200
observations and one of the variables was social security. The import from the study is that,
pension is a contributory factor of savings to all the thirty two (32) nations but decreases as other
forms of savings increases. Also, a similar work with ten (10) countries and hundred (100)
observations made a remarkable finding which meant that a country that practices the mandatory
fully funded scheme will increase private savings(Edward (1996); Baillu and Reisen (1997)
University of Ghana http://ugspace.ug.edu.gh

43
The impact of age dependency on domestic savings has been empirically proven to be negative
when sixteen African countries were considered using panel unit root, panel cointegration and
panel causality tests and this supports the view that changes in non working population size are
important when considering domestic savings rates in Africa (Apergis 2012).
A comprehensive analysis of pensions and wealth accumulation using Health and Retirement
survey discovered some interesting findings. The indications from the results show a large effect
of pension on wealth accumulation.
There are contradicting results from empirical literature on age dependency on savings. There are
mixed empirical evidence across countries and methodologies (Apergis et al. 2012). In finding
significant demographic effect, studies using cross country data has been found to be more
successful than time series data for individual countires. Leff (1969), Modigliani (1970), Graham
(1987), Edwards (1996), Muradoglu and Taskin (1996), Kelley and Schimdt (1996), Masson et
al. (1998), and Loayza et al. (2000) found some evidence in favor of the life-cycle model.
Studies undertaken at individual country level like Horioka (1997), Escobar and Cardenas
(1998), Elbadawi and Mwega (2000), Thornton (2001), Prema-Chandra and Pnag-Long (2003),
Serres and Pelgrin (2003) and Modigliani and Cao (2004) show that higher age dependency
ratios are associated with lower saving rates.
Other studies like Goldberger (1973), Ram (1982), Husain (1995), Faruquee and Husain (1998),
and Baharumshah et al. (2003) present cases in which the dependency ratio effect on savings
may be insignificant or even positive.
University of Ghana http://ugspace.ug.edu.gh

44
Chapter Summary
There have been many write ups and papers on pension and savings across the globe. The
chapter starts with the introduction of various papers and research works that have been reviewed
in the context of pension and savings. Keywords regularly used in the study were defined and
explained in the first section of theoretical literature. Also, the theoretical literature also
considered several models and theories related to pensions and savings. Empirical findings that
supported the various theoretical underpinnings was also reviewed and was divided into two
parts; time series evidence and cross country evidence.
University of Ghana http://ugspace.ug.edu.gh

45
CHAPTER FOUR
THEORETICAL FRAMEWORKS AND METHODOLOGY
4.1 Introduction
The model specifications used in finding the effect of pensions contributions on national savings
in Ghana during the period of 1980 to 2010 is explicitly expatiated and presented in this chapter.
The study adopts the model used by Murphy and Musalem ( 2004).
The chapter also has a section for a theoretical framework. The overlapping generation model
explains how the introduction of a Pay as you go scheme affects an individual’s savings motive.
4.2 The Overlapping Generation Model
According to Murphy and Musalem (2004), the most natural analytical framework to study the
effect of mandatory pension programmes on aggregate savings is the overlapping generation
model with production due to Diamond (1965). Overlapping generations models have always
proved useful in analyzing how transfers that occur between generation affect economic growth.
The model was first presented by Samuelson (1958) and later Diamond (1965) introduced an
overlapping generations model with a neoclassical production setting.
An economy is considered with two generations. Each generation lives for two periods, young
and old. Each individual has no assets but receives labour incomes in both period. Individuals
work in period one and retire at a fixed age in period two where they dissave from their savings
(Magnussen, 1994). Individuals are said to be identical for all generations and are faced with a
budget constraint.
University of Ghana http://ugspace.ug.edu.gh

46
The nature of the model is intertemporal and places emphasis on the role of aggregate savings
and capital accumulation in determining long-term social outcomes. The model is intertemporal
because it allows the interaction of two separate generations.
Assumptions
Individuals live for two periods
You live as young during period 1 and old person during period 2
The number of individuals born in period t is Lt
Population grows at a rate n such that Lt+1=Lt(1+n)
Every individual is endowed with a unit of labor when young
Every individual earns labor income
One saves during period1 and dissaves during period 2.
The lifetime utility of an individual born at time t can be written as
µ(Cyt, C
ot+1)= µ(C
yt) + βµ(C
ot+1), β>0 ……………………. (1)
where Cyt is consumption when young
Cyt+1 is consumption when old
β is the discount factor and this reflects how impatient the consumer is.
The individual maximizes lifetime utility subject to the budget constraint. When the individual is
young, his budget constraint is such that his savings and current consumption does not exceed
the labour income(wage) net of pension taxes, that is;
St+Cyt =Wt –τ …………..(2)
University of Ghana http://ugspace.ug.edu.gh

47
For an old folk, his budget constraint is such that the oldage consumption does not exceed the
savings including interest earned and the public pension benefit (B), that is;
Cot+1= (1+ rt+1)St + B …….(3) where rt+1 is the interest rate.
Combining the two constraints, we have;
From (b) we can see that (Cot+1)/ (1+ rt+1) – B/(1+ rt+1) =St …………………. (4)
Put equation (4) into (2), we get the result;
(Cot+1)/ (1+ rt+1) – B/(1+ rt+1) + C
yt = Wt –τ
Which implies Cyt + (C
ot+1)/ (1+ rt+1) = Wt –τ + B/(1+ rt+1) ≡ A ………… (5)
Where A implies lifetime wealth of an individual born in the period t. it is important to note that
this constrainst holds for both funded and the PAYG system of pensions. The behavior of the
individual is affected by the Wt,, B, 1+ rt+1 . Now, since we have the individual lifetime wealth,
we maximize lifetime utility in equation (1) subject to the lifetime wealth in (5).
L = µt –λ(Cyt + (C
ot+1)/ (1+ rt+1) – A)
δL/δ Cyt = µ'(C
yt) – λ =0 …………………………(6)
δL/δ Cot+1 =β µ'(C
yt+1)-λ/(1+ rt+1)=0 ……………(7)
δL/δλ = - Cyt - (C
ot+1)/ (1+ rt+1) –A =0………….(8)
from (6),
University of Ghana http://ugspace.ug.edu.gh
48
µ'(Cyt) =λ…………………..…………………. (9)
put (9) into (7), we get the result;
β µ'(Cyt+1) = µ'(C
yt)/ (1+ rt+1)
(1+ rt+1) β µ'(Cyt+1)/ µ'(C
yt+1) = µ'(C
yt)/ µ'(C
yt+1)
β (1+ rt+1)= µ'(Cyt)/ µ'(C
yt+1) ……………………….. (10)
From (2), one will save with one vision in mind and that is to smoothen consumption over the
two periods of time. Now, if the individual decides not to save at all and there were no pensions
benefits, we will have;
St +Cty =Wt – τ, but savings =0, τ=0
Cyt =Wt when young
And when old, consumption will be zero since there will be no savings to consume from.
Now, assuming the individual decides to save GHS 1, he will forgo some consumption during
his youth and this causes a small loss in utility. However, saving GHS 1 will increase
consumption by (1+ rt+1) in his old age. “This generates a lot of utility because the marginal
utility of the first unit of consumption is very large and since this reallocation of resources is
welfare improving, individuals will continue to save more” (Aidt et al, 2008). Now from the
explanations surrounding (2), it can be clearly seen that savings is affected by variables like
wages, interest rate, pension taxes, pension benefit.
University of Ghana http://ugspace.ug.edu.gh

49
Private savings for retirement becomes;
St( Wt, rt+1,τ,β) = Wt – τ - Cty ………………… (11)
which means savings is a function of wages, interest rates, and pension contribution
Since wages and interest rates are considered as fixed, savings can be affected through net taxes
(contributions) and β ( pension benefits). That is, when τ increases, there will be a fall in private
savings. Also, when β increases, there will be a fall in private savings. The overall effect,
allowing wages and the interest rate to change depends on how the system is funded.
4.3 Model Specification
Arising from the theoretical frameworks of the study and considering the studies by Larbi
(2013), Bremang (2012) and Loayza et al. (2000), the model for the study is specified as;
Nsr= α0 + α1 pert + α2 odrt + α3 ydrt + α4 gdpgrowtht + α5 rt + α6 inflt + α7 fdt + εt
Where per = pension contribution
odr = old age dependency ratio
ydr = young dependency ratio
gdpgrowth = growth of GDP
r = interest rate
infl = inflation
fd = financial deepening
University of Ghana http://ugspace.ug.edu.gh

50
nsr = national savings rate
ε = error term.
4.4 Definition and expected signs of variables
This section of chapter four, defines and explains all the various variables used in the study and
predicts the expected sign according to theories and empirical works.
4.4.1 National savings
Loayza et al. (2000) used national savings as the dependent variable and regressed it against all
the other forms of savings.
National savings rate is obtained using adjusted saving which is the net national savings as a
percentage of the gross national Income (GNI) and this calculated by the World Bank. Net
national savings are equal to gross national savings less the value of consumption of fixed
capital. This type of adjusted savings is prefered to the adjusted saving (current us dollar) since it
gives ratios rather than actual figures as captured by the World Bank data. The expected sign for
comparing pension contribution and savings is ambiguous since it depends on several factors like
whether the pension scheme is mandatory or voluntary and whether the scheme is Fully funded
or a Pay as you go scheme.
4.4.2 Pension
Murphy and Musalem (2004) finds a relationship between national savings and pensions
depending on the type of scheme under study. Feldstein (1974; 1978) also considered the effect
of social security on consumption and found out that, social security reduces personal savings.
University of Ghana http://ugspace.ug.edu.gh

51
Pensions savings ratio is the ratio of pensions contributions in Ghana as a percentage of GNI.
Pension contributions is the annual pool of savings by working group in the SSNIT pension
scheme since 1980 to 2010. . The gross national income as explained by World Bank is the sum
of value added by all resident producers plus any product taxes (less subsidies) not included in
the valuation of output plus net receipts of primary income . GNI serves as the best denominator
since all resident producers are required by the Ghanaian law to cover all their employees under
a pensions scheme. Data for the pensions variable is gotten from the annual report of SSNIT. A
positive sign is expected between pension and savings since mandatory schemes are only
considered in the study.
4.4.3 Old age dependency ratio
World bank defines old age dependency ratio is the ratio of older dependent (people older than
64 years) to the working age population (people within the ages of 15-64 year). The old age
dependency data used for this analysis is the proportion of dependents per 100 working age
population.
Adiah (2004) affirms the position that indeed in the life cycle model, retired individuals will
have negative savings since they do not receive labour income. Bremang (2012) report that the
breakdown of the extended family system in the Sub-sahara Africa, where the aged is catered for
by the members of the family has caused individuals to save whiles they are young inorder to
dissave to smoothen consumption when they are old. This means that a negative sign is expected
according to Bremang (2012). Microeconomic and macroeconomic evidence, both international
and at single-country level, all confirm that a rise in oldage dependency ratios tends to lower
private savings- a result in line and accordance with the pridictions of the life-cycle theory
University of Ghana http://ugspace.ug.edu.gh

52
(Schmidt-Hebbel, 1992). We will expect a negative cofficient when we regress this against
national savings.
4.4.4 Young Dependency Ratio
Young dependency ratio as defined by Worldbank, is the ratio of young dependents( people
younger than 15) to the working age population (people within the ages of 15-64years). Also,
just like the oldage dependency data, the young dependency data used for this analysis is the
proportion of dependents per 100 working age population.
According to Leff N (1969), children represent a heavy charge to expenditure which in national
accout, enters under the heading of consumption.
Schmidt-Hebbel, (1992) in a panel evidence, indicated that, a rise in a young-age dependency
ratio leads to a decline in private savings rate. So, just as the oldage dependency ratio, we also
expect a negative coefficient when regressed with national savings.
4.4.5 Growth of Income
World Bank defines growth of gross domesic product as annual percentage growth of GDP at
market prices based onstant local currency. This measures the growth of income in an economy.
A complete annual growth data set of GDP is available from the World Bank with data spanning
from 1980 to 2013. This variable is justifiable in the regression because country based research
involving Ghana like Adiah (2004) considered it as a determinant of savings and have a positive
relationship with savings.
In an economy of stagnancy, what the active labour saves is what the dependents dissave for
consumption smoothening. In other words, a growing economy has active people more than
compensating dissaving passive people (Murphy & Musalem, 2004).
University of Ghana http://ugspace.ug.edu.gh
53
A simple permanent-income theory predicts that higher growth, that is in future income reduces
current savings. However, considering the life-cycle model , growth has an ambiguous effect on
savings (Norman et al, 2000).
4.4.6 Real interest rate
Real interest rate is the rate of interest an investor is expected to receive after allowing for
inflation. However, the World Bank defines this as the lending interest rate adjusted for inflation
as measured by the GDP deflator. This is the real interest rate and is calculated manually by the
researcher as deposit rate minus inflation.
Explaining this, an increase in real interest rate will make present consumption more expensive
and this will induce individuals to save more. On the other hand, an increase in the real interest
rate makes it possible for the transformation of a given amount of present consumption into
more units of future consumption and this will induce savings to fall (Murphy and Musalem,
2004). A positive real interest rate motivates individuals to save more of their disposable income
(Bremang, 2012).
The effect of interest rate on savings can not be predicted because, income and substitution effect
of higher interest rates, work in the opposite direction (Schmidt-Hebbel, 1992). A high interest
rate will reduce the prevent value of the future income inflows in an economy. Basing one’s
argument on a non econometric country studies, Mckinnon (1973) and Shaw (1973) argued that
rate of return on savings, as measured by real interest rate will have a positive effect on savings
rate. Fry (1978, 1980) and Balassa (1990) held this view by backing them with empiral works
though Fry alluded to the fact that the magnitute of the effect was small.
University of Ghana http://ugspace.ug.edu.gh

54
4.4.7 Inflation
Generally, inflation could be explained as the general rise price levels of goods and services in
an economy over a period. However, the World Bank defines it as measured by the annual
growth rate of the GDP implicit deflator, shows the rate of price changes in an economy as a
whole. The inflation data for this study covers from 1980 to 2010. The data used in this study is
the inflation of annual consumer prices recorded by world development indicators.
Inflation has the tendency of affecting savings directly and through interest rates. When we have
high inflation in an economy, stagnation or recession may occur in that economy causing
economic instability and uncertainty. Murphy and Musalem,(2004) stablished in their study, that
inflation has an ambiguous effect on savings. Therefore, the expected sign for inflation is
ambiguous when establishing a relationship with savings
4.4.8 Financial deepening
This is the variable that captures and measures vehicles available in a country for save. When we
have better functioning financial markets, this may foster savings to grow. The ratio of money to
gross domestic product is traditionally taken as a proxy for finanacial deepening in most studies
(Adiah, 2004). Adiah (2004) further goes on to explain that when this proxy is used as an
explanatory variable for financial deeping, a positive coefficient is always recorded. Edward
(1996) also finds that the coefficient is always positive. Therefore a positive sign is expected
between financial deepening and savings
University of Ghana http://ugspace.ug.edu.gh
55
4.5 Estimation Techniques
The Ordinary Least Squares (OLS) was emphasized as the main estimation technique for the
study. The OLS was preferred in the study because of simplicity and also because the variables
were time continuous variables. The choice of OLS is appropriate because it minimizes the sum
of squared vertical distance between the observed responses in time series data Koutsoyiannis
(1973). Also, the study considers OLS because of its wide use when analyzing the relationship
between pension and savings by various economist working on time series data on a particular
country.
Verbeek (2004) reports that, one of the cornerstones of econometrics is the linear regression and
the OLS estimation method. A simple linear regression can be written as ;
Y = β0 + β1x1 + ……. + βkxk (1)
Where β0 ,.. βk are th constants to be determined. Lets assume that observations are indexed by i
such that i = 1,….. N. the difference between an observed value Yi and its linear approximation
is given as;
Yi – [β0 + β1x1 + ……. + βkxk] (2)
Gathering all the β coefficients in equation (1), can be summarized as βi = [β0, β1 ,…. βk]’ and xi
= [ x1,….. xk]’ in a K-diamentional factor and can be rewritten as ;
Yi – xi’ β (3)
Clearly, one would like to minimize the values of the βi and can do that by summing the sum of
squared difference. This can be written as ;
University of Ghana http://ugspace.ug.edu.gh
56
S (β) = Ʃ(Yi – xi’ β)
2 , from i= 1, ….. N. (4)
This approach is referred to as Ordinary Least Square estimation. To solve the minimization
problem, one can look at the first order condition obtained by differenting S (β) with respect to β
(Verbeek, 2004). This results in ;
2 xi(Ʃ(Yi – xi’ β) = 0 , i = 1,….., N (5)
Equation (5) is sometimes refered to as a normal equation.
Lets assume b as the solution to the minimization problem and can be written as;
b= (Ʃ xi xi’)-1 Ʃ xi yi where i= 1, ….., N (6)
when the second order condition is fulfilled, we have b to be minimized. The resulting linear
combination of xi is thus given as ;
yi = xi’ b which is the best linear approximation of Y from x1 ,….. xk and a constant.
Estimating the VECM
The VECM is neatly documented in Garratt et al,(2006) and will be briefly explained in this
study. A weakly exogenous variable as explained by Hendry and Richard,(1983) is uncorrelated
with the stochastic error tem. For the VECM to be applicable there must be cointegration among
variables (Johansen, 1992). A precondition, indicating that variables are assumed to be non
stationary at level but become stationary after the first differenceis first established. This means
they are integrated at at same order before they become stationary.
University of Ghana http://ugspace.ug.edu.gh

57
Because stationarity of variables is an essential characteristic for VECM, the mean and variance
of the variables must be constant over time. A series that has stationarity at first difference can be
written as I(1). The Augumented Dickey Fuller test and the Philips Peron tset can be used to test
for stationary (Dickey, 1979).
The Johansen and Juselius approach is used to check for cointegration after the variables are
station at first difference. The Trace test and the Mazimum eigen value test can be both
appropriate for cointegration. The null hypothesisis or r cointegrating relations as against the
alternative of r +1 cointegrating relations for r = 0,1,2,.....n- 1. This test can be written as;
LRmax (r / n +1) = T * log(1 – λ) (1)
λ= maximum eigen value
T= sample size
With the same hypothesis, the equation for the Trace Statistic test can be written mathematically
as ; LRtr (r/n) = - T * ∑n
i=r+1 log(1 – λ) (2)
Now if it established that there is cointegration in the model, the VECM is applied in order to
know the long and short run properties of the cointegrated series. It is however important to note
that if the model lacks a cointegration property, then the VAR model is used. The regression
equation of the VECM is of the form
∆Yt = αεt-1 + γ∆Xt + ut (3)
Where ut (error term) is independent and identically distributed and the first difference of the
dependent variable Yt can be explained by the lagged εt-1 and ∆Xt . εt-1 is the one period lagged
value from the estimation of the equilibrium error term.
University of Ghana http://ugspace.ug.edu.gh
58
4.6 Justification for using OLS and Vector Error Correction Model (VECM)
The choice of this estimate (OLS) is justifiable for establishing a linear relationship between
pension funds and national savings from the theoretical framework of the study. However, due to
the multivariate nature of the secondary data time series, the VECM as proposed by
Johansen( 1988) is appropriate since it is an extension of the univariate autoregressive model to
suite multivariate time series. The VECM also estimates the speed at which the dependent
variable settles back to equilibrium after a change in the independent variables.
4.7 Data types and source
Two types of data are used in this study namely; primary data and secondary data. The primary
data was collected from pensioners to fulfill the objective three of the study whiles the secondary
data was used to establish the relationship of pensions and other forms of savings and trends in
savings and pensions.
Data was collected for the period, 1980 to 2010 due to the availability of data at that period. The
data for study is partly obtained from the World Development Indicators,World Bank and Social
Security and National Insurance Trust (SSNIT) reports. National savings rate is proxed as the
adjusted savings, which is the net national savings as a percentage of gross national income. The
gross national income as explained by World Bank is the sum of value added by all resident
producers plus any product taxes (less subsidies) not included in the valuation of output plus net
receipts of primary income. Data on national savings rate and GNI is provided by the World
Development Indicators.
University of Ghana http://ugspace.ug.edu.gh
59
Data on inflation, and GDP growth was extracted from the World Development Indicators. Real
interest rate was calculated by the researcher as lending rate minus inflation (Bremang, 2012).
The lending rate data was extracted from the Institute of Social and Statistical Economic
Research (ISSER) annual report on the “State of the Ghanaian economy”.
4.8 Primary Data Section
This section of the chapter carefully considers the issues associated with primary data. The
section starts with describing the research design, qualitative and quantitative data technique, the
population and sample size and a complete description of the structure of the questionnaire
administered
4.8.1 The Research Design
Using Field survey as the research design, qualitative and quantitative data would be employed.
The instrument for the primary data collection was a questionnaire. A well structured
questionnaire was administered to respondents belonging to the National Pensioners Association
in the Greater Accra caption area. The questionnaire was administered in a form of face to face
interview. The structure of the questionnaire was in the form of open ended and closed ended.
The closed ended questions captured the membership profile of the respondents whiles the open
ended questions in the questionnaire gave respondents the opportunity to express their views on
the challenges faced by pensioners on the scheme. Information that were not numerically
measured are qualitatively taken in this study and quatitative data was used to analysis numerical
measurements.
University of Ghana http://ugspace.ug.edu.gh
60
4.8.3 Sampling Frame
The study covers the pensioners in Greater Accra who are members of the National Pensioners
Association in Ghana. There are about one thousand registered pensioners in the Greater Accra
branch of the National Pensioners Association.
The entire sample is taken from the Greater Accra registered members of the National Pensioners
Association in Ghana. A total of one hundred and twenty respondents were used in the study and
the number is as a result of the scientific estimation formula [(Z2
P(1-P))/E2]. This formula as
illustrated by Israel (1992) was explained as ;
Z representing the normal distribution table value at 5% significance level
P representing the estimate of proportion of pensioners falling into the group of interest. For
same size purposes, P is usually 0.5
E representing the margin of error(confidence interval)
Three meeting points were selected based on the number of turnouts of members for meeting
and the time of meeting. The study gathered the data for three days at the National Pensioners
Association- Dansoman branch, Labadi branch and the Osu branch. Out of one hundred and fifty
questionnaire administered, one hundred and twenty were received and validated for use for the
analysis. According to SSNIT report (2010), Greater Accra has the highest number of pensioners
and this makes the choice of the region more appropriate since it can represent diversification
because of the number. The thirty questionnaires that were not used in the survey analysis was as
a result of questionnaires not returned after filling. The questionnaire were administered in
University of Ghana http://ugspace.ug.edu.gh

61
accordance with the membership list at the branches, sixty five questionnaires at Dansoman,
forty five at Labadi and forty at Osu.
4.8.4 Questionnaire Design Format
The questionnaire designed for this study took the standard format of clarity and simplicity. The
topic of the study was boldly and clearly indicated to give the respondent an idea of the work.
Also, issues of confidentiality of response were assured in the form of writing. For puposes of
coding, every questionnaire had a specific reference number.
The questionnaire is divided into two sections, that is the personal profile section and the
membership profile section. The former consist of close ended questions that gives some
particular information about the respondent like age range , gender, level of education, and
religious status.
The membership profile also consist of questions in open ended forms and closed ended forms.
The open ended form provides grounds for respondent to highlight views on a question.
For the purpose of simplicity, the questions were asked in basic English language. The
questionnaire administered consisted of twenty questions.
University of Ghana http://ugspace.ug.edu.gh

62
CHAPTER FIVE
PRESENTATION AND DISCUSSION OF RESULTS
5.0 Introduction
This chapter starts with the discussion and analysis of the questionnaire administered. Pie chart,
bar charts, and doughnut charts are used in the graphical representations of the findings in the
study. Also, percentages are used in the measurement of the results in the primary data.
The estimation technique to be used to estimate the Overlapping generations model in this
research is the ordinary least squares(OLS) and the Cointegration approah. These approach
requires that a model fulfills the assumption of linearity, normality, homoscedasity and no
autocorrelation in order to be best fit. The model in equation (3) depicts linearity among
variables and this is justified by savings literature of their relationships.
5.1 Discussion of results from survey
This section captures the views of pensioners on the Social Security and National Insurance
Trust (SSNIT) scheme and fill the objective of identifying the challenges in the scheme.
5.1.1 Socioeconomic Features Of Respondents
The Field survey conducted, interviewed a total of one hundred and twenty respondents who are
members of the National Pensioners Association in Greater Accra.
Out of the total number interviewed, ninety of them were males and thirty were females
representing 75% and 25% respectively. SSNIT report (2010) accounts that there are about 80%
of male pensioners and 20% female pensioners as recorded in 2010. Therefore the survey
University of Ghana http://ugspace.ug.edu.gh

63
representation gives a fair gender representation. The gender disparity could be as a result of low
level of education among females in the early times of independence since SSNIT scheme
largely covered the formal working sector of the economy. The gender status of respondents is
shown in figure 5
Figure 5: Gender of respondents
Source: Field survey (2013)
The age distribution of the sample was such that 10% within the ages of 55 to 59 whiles 70% of
the respondents were within the ages from 60 to 69. The remaining 20% were for respondents
who were 70 and above. The modal age range was 60 to 69 years. The 10% recorded for
respondents within the ages of 55 to 59 was the least in terms of percentages and this may be
because voluntary retirement in Ghana is not so attractive considering that one will not receive
full pension benefit. Also, this may be because of dependents who are catered for at that age.
Pensioners who are over 70 years were the second least age group in the sample probably due to
general weakness that are associated with that age. This is clearly shown in figure 6.
University of Ghana http://ugspace.ug.edu.gh
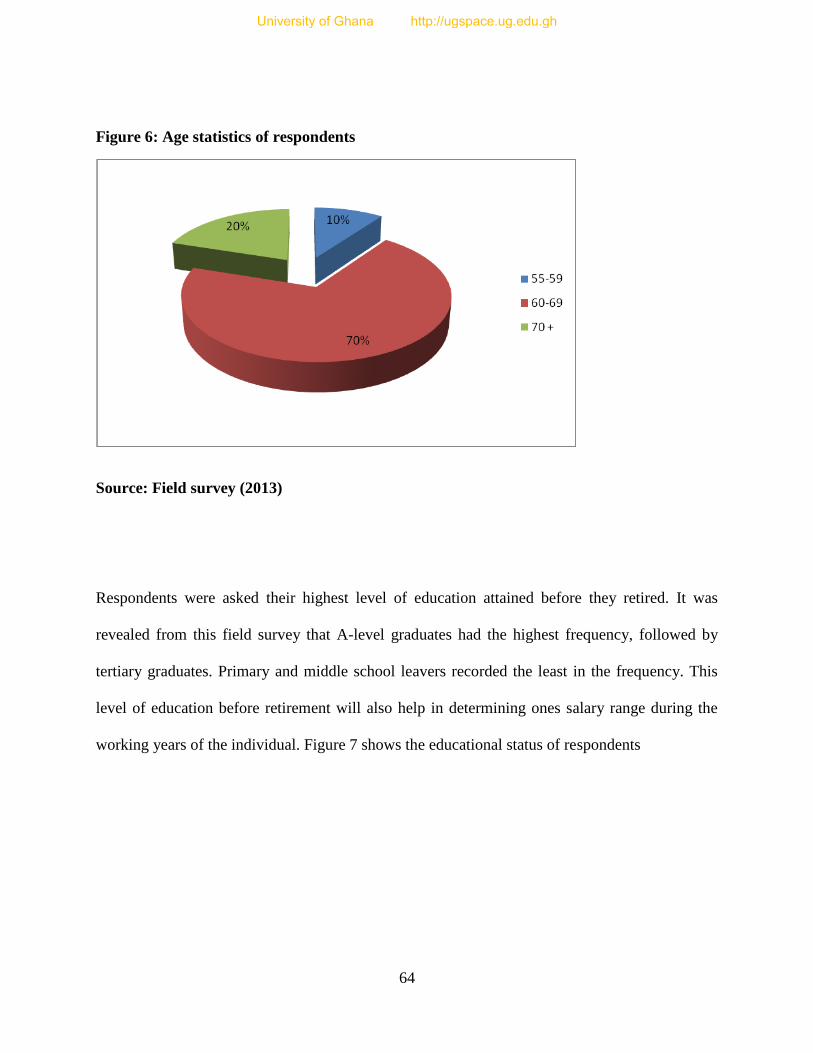
64
Figure 6: Age statistics of respondents
Source: Field survey (2013)
Respondents were asked their highest level of education attained before they retired. It was
revealed from this field survey that A-level graduates had the highest frequency, followed by
tertiary graduates. Primary and middle school leavers recorded the least in the frequency. This
level of education before retirement will also help in determining ones salary range during the
working years of the individual. Figure 7 shows the educational status of respondents
University of Ghana http://ugspace.ug.edu.gh
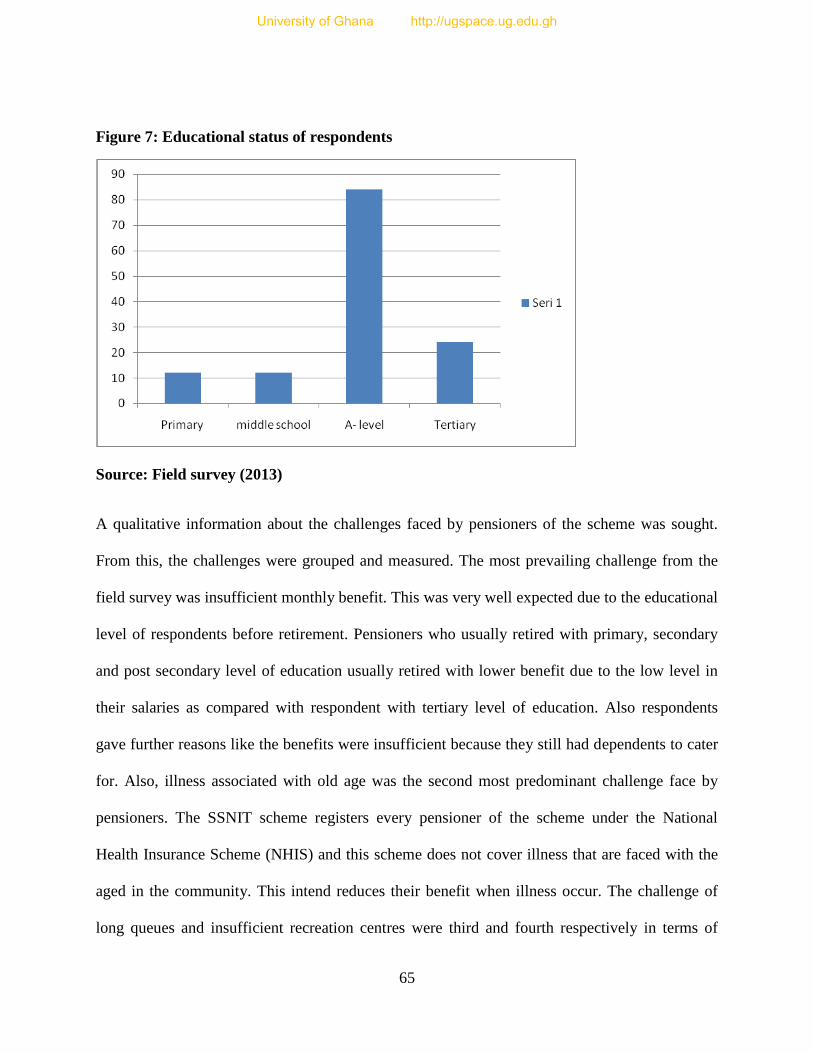
65
Figure 7: Educational status of respondents
Source: Field survey (2013)
A qualitative information about the challenges faced by pensioners of the scheme was sought.
From this, the challenges were grouped and measured. The most prevailing challenge from the
field survey was insufficient monthly benefit. This was very well expected due to the educational
level of respondents before retirement. Pensioners who usually retired with primary, secondary
and post secondary level of education usually retired with lower benefit due to the low level in
their salaries as compared with respondent with tertiary level of education. Also respondents
gave further reasons like the benefits were insufficient because they still had dependents to cater
for. Also, illness associated with old age was the second most predominant challenge face by
pensioners. The SSNIT scheme registers every pensioner of the scheme under the National
Health Insurance Scheme (NHIS) and this scheme does not cover illness that are faced with the
aged in the community. This intend reduces their benefit when illness occur. The challenge of
long queues and insufficient recreation centres were third and fourth respectively in terms of
University of Ghana http://ugspace.ug.edu.gh

66
their frequency from the field survey. Figure 8 displays the challenges faced by pensioners under
the SSNIT scheme
Figure 8: Challenges faced by pensioners
Source: Field Survey (2013)
Because all SSNIT contributors make monthly payments to NHIS levy, pensioners were
interviewed on level of satisfaction derived from their long contribution to the NHIS scheme.
From the survey, 60% of respondents were not happy with the NHIS scheme whiles 40% were
happy with the scheme. The level of dislike is probably illnesses associated with old age that are
not covered. Seventy out of the one hundred and twenty respondents were not happy with the
services they received from the Health Insurance. Figure 9 displays the quality of healthcare
pensioners get from the NHIS scheme
University of Ghana http://ugspace.ug.edu.gh

67
Figure 9: Whether Pensioners Get Quality Health Care Under NHIS Scheme?
Source: Field Survey (2013)
Respondents were also interviewed on the range of benefits currently received. From the survey,
it was discovered that, 60% of the respondents received below GH S 100, and 30 % received
between the range of GH S 100 to GHS 599. 5% for respondents in the benefit range GH S 600
to GH S 999. The survey recorded 5% for pensioners receiving between GH S 1000 to GH S
1599. Both GH S 1600 to 1999 and GH S 2000 + recorded 0%. This clearly shows and confirms
that majority of our respondent who ended with A-level certificate may receive around GH S
100 and the Tertiary graduate receive around GH S 500 as pension benefit. Figure 10 displays
the analysis graphically.
University of Ghana http://ugspace.ug.edu.gh

68
Figure 10: Pension benefit received
Source: Field survey (2013)
After the view of benefit range was sought, a question was asked if respondents were able to
save during retirement. One hundered and eight respondent out of the one hundred twenty
responded that they were not able to save with their pensions, and this forms about 90% of the
sample size. This response however confirms the complain of insufficiency of the benefit.
However, the 10% who responded that they are able to keep some portion of the pension income,
indicated that they save below GH S 50. Figure 11 illustrates the ability to save by respondents
University of Ghana http://ugspace.ug.edu.gh
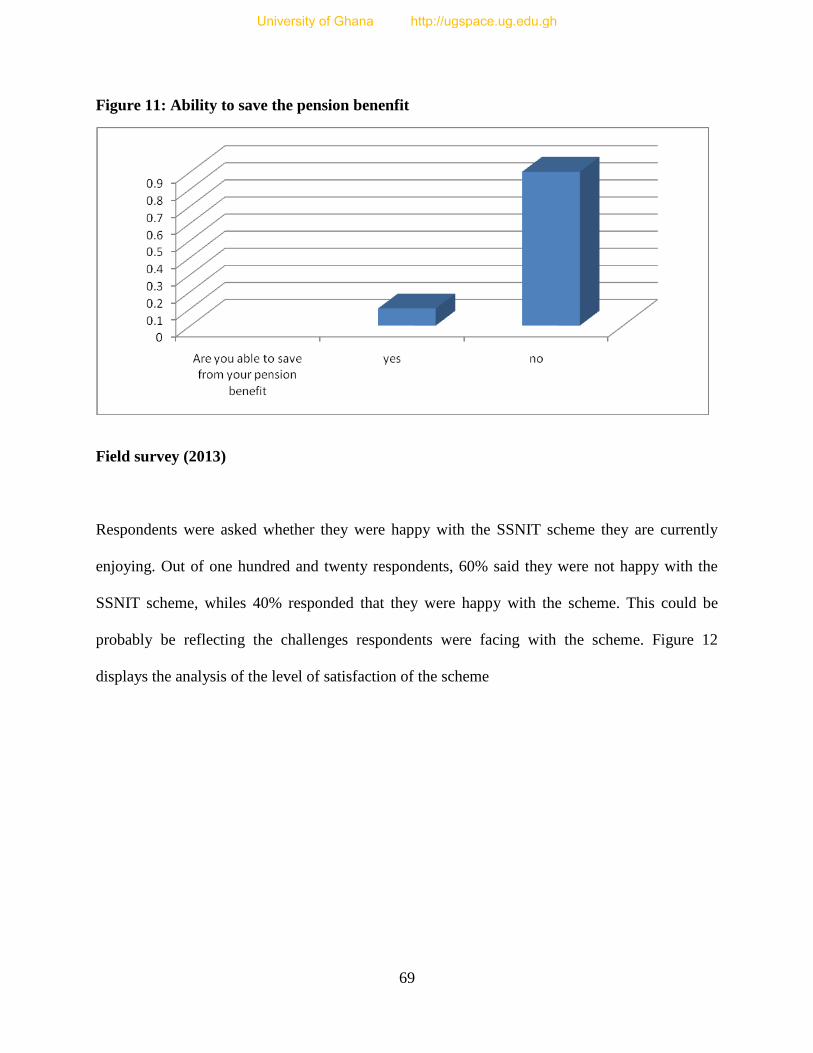
69
Figure 11: Ability to save the pension benenfit
Field survey (2013)
Respondents were asked whether they were happy with the SSNIT scheme they are currently
enjoying. Out of one hundred and twenty respondents, 60% said they were not happy with the
SSNIT scheme, whiles 40% responded that they were happy with the scheme. This could be
probably be reflecting the challenges respondents were facing with the scheme. Figure 12
displays the analysis of the level of satisfaction of the scheme
University of Ghana http://ugspace.ug.edu.gh
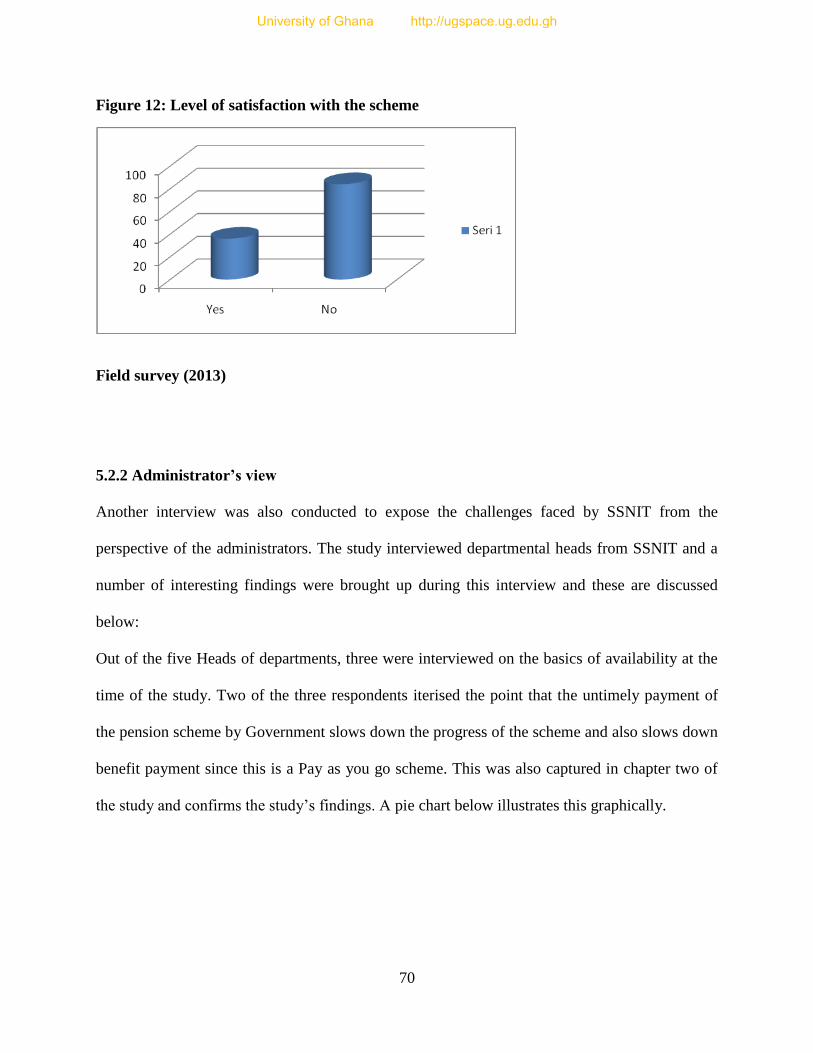
70
Figure 12: Level of satisfaction with the scheme
Field survey (2013)
5.2.2 Administrator’s view
Another interview was also conducted to expose the challenges faced by SSNIT from the
perspective of the administrators. The study interviewed departmental heads from SSNIT and a
number of interesting findings were brought up during this interview and these are discussed
below:
Out of the five Heads of departments, three were interviewed on the basics of availability at the
time of the study. Two of the three respondents iterised the point that the untimely payment of
the pension scheme by Government slows down the progress of the scheme and also slows down
benefit payment since this is a Pay as you go scheme. This was also captured in chapter two of
the study and confirms the study’s findings. A pie chart below illustrates this graphically.
University of Ghana http://ugspace.ug.edu.gh

71
Figure 13: Challenges faced by administrators
Source : Field survey (2013)
5.3 Vector Error Correction Model
5.3.1 Unit Root and Stationarity Test
The Johansen approriate was used for Cointegration test in this study. The Johansen model has a
precondition that states that; variables are assumed not to be stationary at levels but when
converted to first difference, then they become stationary, that is integrated of the same order.
The Augmented Dickey Fuller (ADF) test was used to test for stationary of all variables at level
and at first differencing. After first differencing, the dependent variable (national savings rate)
and other independent variables like pension contribution, growth of GDP, and financial
deepening was stationary. Other variables like interest rate, young age dependency ratio, oldage
dependency ratio and inflation were dropped because they were not stationary after first
differencing.
The autocorrelation and partial autocorrelation correlogram graph was also used to confirm this
test with the null hypothesis being non stationary and alternate hypothesis, stationary.
University of Ghana http://ugspace.ug.edu.gh

72
Table 4; ADF Test for Stationarity
ADF Test for Stationarity
Variable Test statistic P- value Result
Nsr -6.559 0.000* I(1)
Fd -7.891 0.000* I(1)
GDP growth -6.305 0.000* I(1)
Per -7.072 0.000* I(1)
Number of observations = 29
Dickey Fuller Test, Lag (0)
*significance at 1%
Source: Authors analysis from OLS using STATA 12
Test Result using ADF
5.3.2 Selecting The Number of Lags
To efficiently use a Vector Error correction Model (VECM), it is prudent to know the most
appropriate lag order for the model. From the multivariate time series data, VECM prestimation
diagnostic test for lag selection was applied. With this, the study considered the results of five
lag selection criteria. This include Likelihood Ratio (LR) test, Final Prediction Error (FPE) test,
Akaike’s Information Criterion (AIC) test, Hannan-Quinn Information Criterion (HQIC) test,
and Schwarz’ Bayesian Information Criterion. The result of the study showed that all the five lag
selection criteria chose Lag order 5 as the best lag in all system models for the study. That is,
Lag 5 had the least value in all the Lag estimation techniques.
University of Ghana http://ugspace.ug.edu.gh
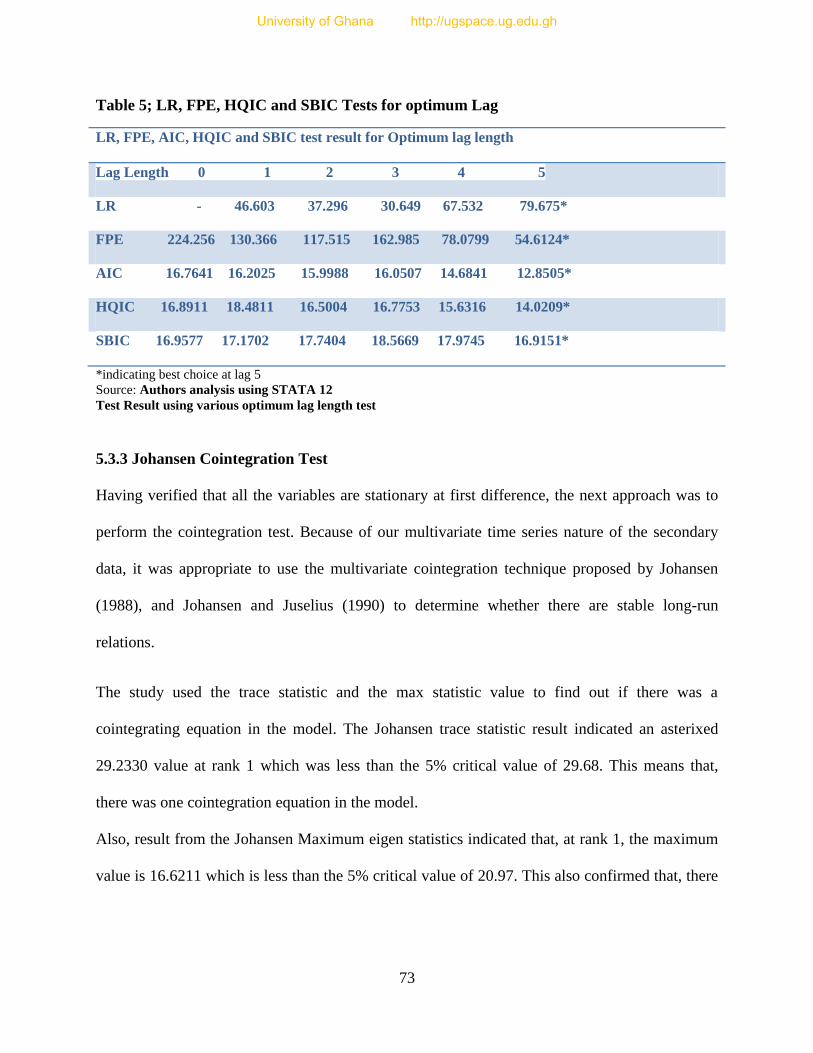
73
Table 5; LR, FPE, HQIC and SBIC Tests for optimum Lag
LR, FPE, AIC, HQIC and SBIC test result for Optimum lag length
Lag Length 0 1 2 3 4 5
LR - 46.603 37.296 30.649 67.532 79.675*
FPE 224.256 130.366 117.515 162.985 78.0799 54.6124*
AIC 16.7641 16.2025 15.9988 16.0507 14.6841 12.8505*
HQIC 16.8911 18.4811 16.5004 16.7753 15.6316 14.0209*
SBIC 16.9577 17.1702 17.7404 18.5669 17.9745 16.9151*
*indicating best choice at lag 5
Source: Authors analysis using STATA 12
Test Result using various optimum lag length test
5.3.3 Johansen Cointegration Test
Having verified that all the variables are stationary at first difference, the next approach was to
perform the cointegration test. Because of our multivariate time series nature of the secondary
data, it was appropriate to use the multivariate cointegration technique proposed by Johansen
(1988), and Johansen and Juselius (1990) to determine whether there are stable long-run
relations.
The study used the trace statistic and the max statistic value to find out if there was a
cointegrating equation in the model. The Johansen trace statistic result indicated an asterixed
29.2330 value at rank 1 which was less than the 5% critical value of 29.68. This means that,
there was one cointegration equation in the model.
Also, result from the Johansen Maximum eigen statistics indicated that, at rank 1, the maximum
value is 16.6211 which is less than the 5% critical value of 20.97. This also confirmed that, there
University of Ghana http://ugspace.ug.edu.gh

74
was one cointegration equation in the model. This makes the model appropriate for the VECM
test.
5.3.4 Vector Error Correction Model (VECM) for Dynamic Adjustment
As a result of one cointegration equation in the model, it could be said that pension contribution,
national savings, financial deepening and GDP growth are cointegrated in the long run.
With the given multivariate time series data, VECM makes use of the first difference of variables
in the model. Since the study was interested in the model with national savings as the dependent
variable, the displaced results of VECM in the appendix only captured that.
The Error Correction Term (ECT) or the speed of adjustment with the differenced national
savings rate (D_nsr) was -0.3638378 and was very significant with p value less than α (0.05). If
the ECT is negative and significant, then, we can say there is a long run causality running from
pension contribution, growth of GDP, financial deepening to National savings.
A post estimation test of the linear hypothesis was undertaken to know the short run causality of
the model. With the result indicating a P value less than α (0.05), the null hypothesis of no short
run causality was rejected. This means that pension contribution, growth of GDP and financial
deepening all had a short run causality effect on national savings rate.
The ECM of -0.36 implies that when the average national savings rate is too high, the model
quickly adjust by falling to the levels of the average ratios of pension contribution, financial
deepening and growth of GDP.
University of Ghana http://ugspace.ug.edu.gh
75
From the displaced VECM result in the appendix, it was shown that at 5% significance level,
there was a significant negative relationship between national saving and financial deepening in
Ghana. At first and second differenced lags of financial deepening, a percentage unit increase in
financial deepening will result in a 0. 49 and 0.54 decrease in the differenced national savings
rate. Loayza et al. (2000) report that, theory suggest an ambiguous sign of this variable. This
result contradicts with some studies like Murphy and Musalem (2004) who found a positive
relationship between financial deepening and national savings and confirms the findings of
Loayza et al. (2000). One of the largest investors is SSNIT in Ghana and the type of scheme they
run will affect financial deeping since most of their investments are long term. The negative
relationship of financial deepening supports the evidence found by (Oya and Oamar, 2006).
Also at 5% significance level, a percentage unit increase in GDP growth, will cause a decrease of
0.47 in a differenced national savings rate. This means that there is a negative relationship
between pensions and national savings in Ghana. This result, supports the permanent income
theory which predicts that, higher growth in future reduces savings (Norman et al, 2000).
Pension contributions , which happens to be the main explanatory variable also was positively
correlated to national savings at 10% significance levels. This means that a percentage unit
increase in Pensions contribution cause a corresponding increase in national savings in Ghana.
The positive relationship between pensions and national savings conforms to literature as
suggested by Murphy and Musalem (2004).
University of Ghana http://ugspace.ug.edu.gh

76
This model was significant with R-squared been equal to 0.97. The implication of this figure is
that the variables included in the model explains 97% of the variation in the dependent variable
(national savings) understudy.
Table 6; VECM Results
Vector Error Correction Model Results
D(nsr) D(fd) D(growth) D(Per) ECF constant
LD 0.038 -0.489** 0.087 -45.028* -0.364* 3.704*
(0.194) (0.016) (0.221) (17.366) (0.041) (0.819)
0.845 0.040 0.694 0.010 0.000 0.000
L2D 0.706* -0.540** -0.361 46.266**
(0.183) (0.026) (0.265) (24.426)
0.000 0.040 0.174 0.053
L3D 1.756* 0.031 0.393 38.991**
(0.332) (0.231) (0.244) (17.350)
0.007 0.185 0.107 0.025
L4D 1.033* 0.008 - 0.466** 39.712
(0.381) (0.238) (0.234) (21.816)
0.007 0.736 0.046 0.069
Souce; Authors analysis using STATA 12
*,*,*** signifies 1%,5%,10% significant levels respectively
Note: The upper, middle, and lower figures estimated coefficient, standard error, and P-value,
respectively.
University of Ghana http://ugspace.ug.edu.gh

77
5.3.5 Shortrun causality Test
A simple post estimation test of linearity of the hypothesis on all the variables was used to
identify if there existed a short run causality of pension contribution, financial deepening, and
GDP growth to national savings. With a significant P value, the null hypthosis of no shortrun
causality was rejected. This means that, all the independent variable had a causes a change in
national savings.
5.3.6 Test for Residual Autocorrelation
The study used the Lagrange multiplier Test to test for residual autocorrelation. From the table
below, it can be concluded that at lag order 5, we accept the null hypothesis of no autocorrelation
in the model
Table 7; LM Test for Autocorrelation
LM Test for Autocorrelation
Lag chi2 df p> chi
2
1 33.7237 16 0.00592
2 13.4364 16 0.64062
3 28.5992 16 0.02678
4 27.0616 16 0.04080
5 15.2335 16 0.50760*
H0; no autocorrelation at Lag order.
*indicating no autocorrelation at lag 5
Source: Authors analysis from OLS using STATA 12
Test Result using LM Test
University of Ghana http://ugspace.ug.edu.gh

78
5.3.7 Residual Normality Test
A post estimation Jarque – Bera test was conducted on the residuals on all the VECM to check
for the normal distribution of residual, which is preferred . from the table below, all the VECM
models were normally distributed in the residuals. The model of interest with national savings as
the dependent variables was normally distributed
Table 8; Jarque- Bera Normal Distribution Test
Jarque – Bera Normal Distribution test
Equation chi2 df P> chi
2
D_nsr 1.098 2 0.57749*
D_fd 0.326 2 0.84969
D_growth 0.007 2 0.99638
D_per 0.029 2 0.98556
ALL 1.460 8 0.99335
All means the individual equations were joined
*indicating the equation of interest
Source; Authors analysis from OLS using STATA 12
Test Result using LM Test
University of Ghana http://ugspace.ug.edu.gh

79
CHAPTER SIX
SUMMARY, CONCLUSION AND RECOMMENDATIONS
6.1 Introduction
This chapter provides the total summary and conclusion for this study, as well as
recommendations for policy analysis and further studies. We conclude this chapter with the
limitations of the study.
6.2 Summary and conclusion of the study
Population statistics in Ghana show a continuous steady increase in age dependency and a sharp
decline in fertility rate posing a problem of worry since a decrease in the number of working
class might affect the SSNIT pension scheme. This study, considered two important economic
variables and their in Ghana, Pensions and Savings. With this, the trends, challenges and
prospects were considered using both qualitative and quantitative methods.
The research was based on three objectives namely; to examine the trends in pension
contributions and national savings in Ghana, to establish the relationship between pension
contributions and national savings, to identify the prospects and challenges in the pension
industry.
Pensions in Ghana have evolved been loyalty rewarding in the 1940s to the current mandatory
and voluntary scheme called the New Three Tier scheme. The thrust of the problem statement is
why Ghana’s savings is low, though we have been practicing mandatory pension programme for
over thirty years. There have been divergent views about the relationship between pension and
University of Ghana http://ugspace.ug.edu.gh

80
national savings in literature. The significance of the study is to outdoor the reality in Ghana’s
context.
The pensions industry started with Cap 30 which was a loyalty rewarding scheme and then
moved to provident fund in 1965 providing lump sum payment to beneficiaries. After the
Provident fund, the government introduced the mandatory Pay as you go social security scheme
which was in the form of annuity payment. Currently, Ghana is operating under the New Three
Tier Scheme which is a combination of both mandatory and voluntary contribution and a
combination of both annuity and lump sum payment.
The literature review commenced with the definition of keywords in the study as the first phase
of theoretical literature section. Theories and models related to pensions and savings like life-
cycle theory, bequest model with the introduction of the Pay as you go, heterogenirty in taste for
savings and pension reforms from Chile, Peru and Columbia. Also, authors like Mensah (2009),
Kumado and Gockel (2003) and Kpessa (2010) narrows the scope of literature to Ghana’s
context. The empirical literature section explores several works in relation to the study in terms
of time series, cross section and panel data analysis.
The section for theoretical frameworks and methodology clearly explains the two Overlapping
generation frameworks behind this study and the stepwise approach in achieving the objectives
of the study. Overlapping generation model served as the theoretical frameworks of the study,
from which a linear regression was coined up and a cointegration model helped to establish the
true relationship of pension contribution and national savings due to the multivariate nature of
the time series. The reason for framework in the study is that, the Overlapping generation model
explains pension and savings at the micro level. The Ordinary Least Squares was used to
estimate the linear relationship of variables, whiles the Vector Error Correction Model was used
University of Ghana http://ugspace.ug.edu.gh

81
to establish whether there is a positive or negative correlation between pension and savings due
to the multivariate nature of the time series secondary data. A questionnaire was distributed to
120 respondents who are pensioners registered in the National Pensioners Association(NPA),
Accra branch. The objective was to identify the challenges pensioners go through with the social
security scheme. Three out of five departmental heads from SSNIT, were given questionnaires to
fill to identify the challenges from the administrators points of view and an expert pension
researcher was interviewed to indentify the research challenges in the pension industry. The
definition and justification of the variables included in the regression were clearly explained and
supported with literature. The model specification was brought forth as a result of the
combination of the Overlapping generations model and. the studies by Larbi (2013), Bremang
(2012) and Loayza et al. (2000)
Results from the VECM model indicates that, financial deepening and GDP growth were found
to be significant at 95% confidence intervals and they were both negatively correlated to national
savings in Ghana. This negative correlation supports the results of Herzog (2012). The results
from the VECM model also showed a long and short run causality relationships. The Langrange
Multiplier Test also indicated that there was no residual autocorrelation in the model. The
Jarque- Bera test indicated a normal distribution in all the VECM equations.
In the nutshell, it can be concluded from this study that, pension payments does contribute to
national savings in Ghana. This stands to prove the stands of Murphy and Musalem (2004), that
mandatory pensions contribution indeed causes national savings to increase. The findings that,
pension contribution increases national savings in Ghana means that better policy reforms that
aims at increasing mandatory pension contributions and ensuring an enjoyable pension life
should be encouraged .
University of Ghana http://ugspace.ug.edu.gh

82
6.3 Recommendations for Policy implementation and further studies
Arising from the findings in the study, the following are recommendations for policy are
suggested;
Government should stop delaying payment of contribution since they are the major
employer in the economy so that benefit payment is not delayed in the Pay as you go
scheme.
Policies such as free treatment of age related diseases for pensioners should be put in
place so that pensioners under the SSNIT scheme will be able to treat most of the
illnesses associated with old age.
Policies that will attract more informal workers to contribute can gear towards increasing
the coverage of pensions should be put in place so as to help increase national savings.
This work paves the way for further advanced study in pensions, separately considering the
schemes and its relationship with other economic variables. Further studies can also consider
both the private and the public pension to know the overall effect of pensions on national
savings.
6.4 Limitations of the study
The study faced challenges that has caused gaps in this research. The issue of data availability
was predominant. SSNIT was not able to provide me with separate data for Pay as you go
contributions and the provident fund scheme.
There was also difficulty in identifying pensioners since the National Pensioners Association
could not provide me with a concise list and contacts of pensioners.
The work should have covered all other forms of pensions, including the private pensions but
failed to because of lack of concise data and information.
University of Ghana http://ugspace.ug.edu.gh
83
REFERENCES
Act, N. P. (2008). ACT766. Ghana: Government of Ghana.
Adiah, G. A.-N. (2004). "savings mobilization and financial sector development in Ghana".
Department of Economics- University of Ghana , 33-65.
Agbobli, A. (2010). Pensions. Accra.
Agyei, E. ( 2012, august 17). NPRA releases list of 3-Tier Pension Service Providers. Accra,
Greater Accra.
Aidt, T. S., Berry, A., & Low, H. (2008). Public Pensions. university of Cambridge , 1-36.
Akerlof, A. G., & Katz, F. L. (1989, August). "workers" trust funds and logic of wages pro-files.
Quarterly journal of economics, Vol.106,No.3 , pp. 525-36.
Allen Jr, E. T., Melone, J. S., & VanDerhei, J. L. (1966). Pension Planning. usa: Richard D.
Irwin.
Allen, e. a. (1966). Pension Planning. usa: Richard D. Irwin.
Allen, S. G., & Robert, L. C. (1987). "pensions and firm performance". in Morris Kleiner et
al,.eds, Himan resouce and performance of the firm. Madison, Wis. Industrial Relations
Research Association , 195-242.
Apergis, N., & Christou, C. (2012, February 16). Dependency rate and Savings: the African
evidence with panel data. International journal of Business and management; vol7, No.4
, pp. 1-12.
Aqdas, A. K., & Bilquees, F. (1993). National savings rates of Indiaa and Pakistan: a
macroeconomic analysis. Pakistan Institute of Development Economics, Islamabad ,
1313-1324.
Arvin, M. (1991). A Role for Private Pensions in Labour Contracts. Oxford journal , 99-115.
Asamoah, Y., & Nortey. (1987). Ghana; The welfare system Environment. In J.Dixon(Ed),Social
welfare in Africa London , 1-22.
Bailliu, J., & Jeanine, H. (1997). DO FUNDED PENSIONS CONTRIBUTE TO HIGHER
AGGREGATE SAVINGS? OECD DEVELOPMENT CENTRE Working Paper No. 130 ,
1-47.
Balassa, B. (1990). The effect of interest rate on savings in developing countries. Banca
Nazionale del Lavoro Quarterly Review , 101-18.
Barr, N. (2002). The pension puzzle; The pre-requisite and policy choices in pension design. in
economic issues. No.29.IMF. , 1-17.
Becker, G., & Stigler, G. (1974). Law Enforcement, Malfeasance and Compensation of Officers.
Journal of Legal Studies,vol.3. No.1 , 1-18.
University of Ghana http://ugspace.ug.edu.gh
84
Ben-Porath, Y. (1967, march). The production of human capital and life cycle of earnings.
journal of political economy, vol.75, No.2 , pp. 352-365.
Bera, A. K. (1993). “ARCH Models: Properties,Estimation and Testing,”. Journal of Economic
Surveys, Vol. 7, No. 4, , 307-366.
BIA to probe SSNIT. (2013, march 19). Accra, Ghana, Ghana.
Blake, D. (1997). Pension choices and decisions policy in UK. In S. Valdes-Prieto, The
Economics of Pensions; principles, policies and international experience (pp. 277-317).
uk: Cambridge University Press.
Blinder, A. S., Gordon, R. H., & Wise, D. E. (1980). Reconsidering the work, disincentive effect
of social security. National tax journal 33(4) , 431-442.
board, T. p. (2006). Special savings for retirement. Report on mandatory pension system by the
pension board for Seamus Brennan T.D , 1-115.
Boyle, P., & Murray, J. (1979). " Social security wealth and private savings in Canada".
Canadian Journal of Economics , 456-69.
Bremang, J. A. (2012). An investigation into the determinants, problems and consequences of
low savings in developing. Ashesi University College , 1-61.
Cagan, P. (1965). The effect of pensions plans on aggregate savings;Evidence from sample
survey. UMI , 1-105.
Damodar, G. (2005). Essentials of Econometrics. New York: McGraw Hill Publication.
Darkwa, O. (1997). reforming the Ghanaian social security system; prospects and challenges.
cross-cultural gerontology. (12) .
Deroode, A. (1913). Pensions and wages. The American Economic Review, Vol. 3, No. 2 , 287-
295.
Dickey, D. a. (1979). Distribution of the estimators for autoregressive time series with a Unit
Root. J. the American Statistical Association, , 427-431.
Dicks-Mireaux, L., & King, M. (1984). Pension wealth and household savings; Test of
robustness. Journal of public economics, 23 , 115-139.
Diebold, F. X. (1986). “Modelling the persistence of Conditional Variances: A Comment,”.
Econometric Reviews , 5, 51-56.
Dixon, J. (1989). A comparative perspective on provident funds; Their present and future
explored. Int.Comp.Soc.Welfare, 5(2) , 1-28.
Dixon, J. (2000). African social system;An ordinal evaluation. J.soc.develop.Afr,16(1) , 68-83.
Dixon, J. (1993). National Provident funds; the challenge of harmonizing their social security,
social and economic objectives. pol.stud.rev, 1(2) , 197-213.
University of Ghana http://ugspace.ug.edu.gh
85
Dorsay, S. ( 1995, jan). Pension Portability and Labor Market Efficiency: A Survey of the
Literature. Cornell University, School of Industrial & Labor RelationsStable , pp. 276-
296.
Edwards, S. (1996). Why are Latin Americas savings rate so low? An international comparative
analysis. Journal of Development Economics, 51, 5-44. http://dx.doi.org/10.1016/S0304
-3878(96)00424-5 .
Even, W. E., & Macpherson, D. A. (1990, MaY). The gender gap in pensions and wages. the
review of economics and statistics, vol.72. No.2 , pp. 259-265.
Fazzari. (2011). Major components of the economy. 1-39.
Feldstein, M. (1974). Social Security, Induced Retirement, and Aggregate Capital Accumulation.
Journal of Political Economy, Vol. 82, No. 5 , 905-926.
French, E. (2005). The Effects of Health, Wealth, and Retirement Behaviour. Review of
economic studies , 1-33.
Graham, J. W. (1987). International differences in savings rate and life cycle hypothesis.
European Economic Review31, 1509-1529. http://dx.doi.org/10.1016/S0014
-2921(87)80024-7 .
Gustman, A. L., & Olivia, S. M. (1992). "Pensions and Labour Market Activity;Behaviour and
data requirements". In Zvi Bodie and Alicia Munnell, eds. Pensions and the US economy
.
Gustman, A. L., & Steinmeier, T. L. (1998). Effect of pension on savings; Analysis with data
from the Health and retirement study. Prepared for Carneige-Rochester conference on
public policy .
Gustman, A. L., & Steinmeier, T. L. (1993, march). pension portability and labour mobility:
Evidence from the SIPP. Journal of Public Economics. Vol.50, No.3 , pp. 299-323.
Heckman, J. (1979). " Sample selection bias as specification error. Econometricia 47 , 153-161.
Hendry, D. F., & Richard, J. F. (1983). The econometric analysis of economic time series.
International statistical review , 51(2):111-148.
Herzog, R. W. (2012). A dynamic panel of GDP growth, Savings, Age Dependency and Trade
Opennness. 1-25.
Hubbard, G. R. (1986). Pension wealth and individual savings. Journal of money, credit and
banking , 167-178.
Hubbard, R. G. (1986). Pension Wealth and Individual Saving: Some New Evidence. Journal of
Money, Credit and Banking, Vol. 18, No. 2 , 167-178.
IMF. (1995). Savings in a growing world economy. IMF World Economic Outlook.
University of Ghana http://ugspace.ug.edu.gh
86
Ippolito, R. (1986). Pensions, Economics and Public Policy. Homewood, Ill.: DowJones-Irwin.
_ 1991. , 1-18.
Ippolito, R. (1994, Summer). Pensions, Sorting and Indenture Premia. Journals of Human
Resources, vol. 29, No.3 , pp. 795-812.
Israel, G. D. (1992). Sampling the Evidence of the Extension Program Impact; Program
Evaluation and Organization Development. IFAS, University of Florida.PEOD-5 .
Jappelli, T., Padula, M., & Bottazzi, R. (2003). Retirement Expectations and Pension Reforms.
CSEF, University of Salerno and CEPR,CSEF, University of Salerno,University College
London, IFS and CSEF, University of Salerno , 1-38.
Johansen, S. (1992). "Determination of Cointegration Rank in the Presence of a Linear Trend."
. Oxford Bulletin of Economics and Statistics, , 54(3), pp. 383-97.
Johansen, S. (1988). "Statistical Analysis of Cointegrating Vectors.". Journal of Economic
Dynamics and Control , 12(2/3), pp. 231-54.
Johansen, S., & Juselius, K. (1990). "Maximum Likelihood Estimation and Inference on
Cointegration with Applications to the Demand for Money.". Oxford Bulletin of
Economics and Statistics , pp. 169-210.
Katona, G. (1965). Private pensions and individual savings. University of Michegan press .
Kotlikoff, L. J. (1979). " Testing the theory of social security and life-cycle accumulation". The
american review 69(3) , 396-410.
Koutsoyiannis, A. (1973). Theory Of Econometrics; An Introductory Exposition of Econometric
Methods. New York: PALGRAVE.
Kpessa, M. W. (2010). the politics of retirement income security policy in Ghana: Historical
trajectories and transformative capabilities. African Journal of political science and
international relations , 92-102.
Kumado, k., & Gockel, A. (2003). A study on social security in Ghana. Accra: trades union
congress.
Kune, J. (1981). "T he impact of social security on personal savings: evidence for the
Netherlands". Het Verzekeringsarchief , 33-41.
Larbi, D. A. (2013). " The Long Run Determinants of Private Domestic Savings in Ghana: A
Cointegration Approach". Journal of Economics and Sustainable Development , 1-13.
Lazear, E. P., & Moore, R. (1988). Pensions and moblity,In Zvi Bodie et al., eds.,. pensions in
the US economy , 163-188.
Leff, N. (1969). Dependancy rates and savings rates, . American Economic Review 59 , 886-896.
Leff, N. H. (1969). Dependency rates and savings rates. American Economic Review,59 , 886-
896.
University of Ghana http://ugspace.ug.edu.gh
87
Loayza, N., Schmidt-Hebbel, K., & Servén, L. (200). "Saving in Developing Countries: An
Overview". THE WORLD BANK ECONOMIC REVIEW, VOL. 14, NO. 3: , 393–414.
Madavo, C. (2005). Africa; The development challenges of the 21st century. Washington D.C:
Woodrow wilson Int.
Maddala, G. S., & Foerst, N. (1985). switching regression models with exogeneous and
endogeneous switching. proceedings of the American Statistical Association , 423-426.
Magnussen, K. A. (1994). Old-age pensions, retirement behaviour and personal savings- A
discussion of literature. social and economic studies , 1-71.
Markowski, A., & Palmer, E. E. (1980). " Social Insurance and savings in Sweden, in von
Furstenberg (ed.). Social Security versus private savings, Ballinger, Cambridge, MA .
Mckinnon, R. I. (1973). Money and capital in economic development. Washington DC:
Brookings Institution.
Mitchell, O., & Silvana, P. (1987). wages, pensions, and wage-pension tradeoff(unpublished
paper). Cornell University .
Mkandawire, T. (2001). Thinking about the developmental states in Africa. C.J.Econ.,25, 289-
313.
Modigliani, F. (1970). The Life cycle Hypothesis of savings and Inter-country differences in
savings ratio. In W. A. Eltis, M. F. Scott, and J. N. Wolfe (eds.), Induction, Trade and
Growth: Essays in Honor of Sir Roy .
Montgomery, E., Shaw, K., & Benedict, M. E. (1990). Pensions and Wages: An Hedonic Price
theory Approach. NBER working paper series , 1-35.
Munnell, A. H. (1976). Private pensions and savings. Journal of political economy 84(5);
10131032 .
Munnell, A. H. (1974). The effect of social security on personal saving. Cambridge MA;
Ballinger .
Munnell, H. A., & Yohn, O. F. (1991). what is the impact of pensions on savings. Federal
Reserve Bank of Boston , 1-36.
Muradoglu, G. &. (1996). Differences in Household Savings Behavior: Evidence from Industrial
and. The Developing Economies, 34 , 132-153.
Murphy, P. L., & Musalem, A. R. (2004). Pension Funds and National saving. WPS3410 , 1-46.
Norman Loayza, K. S.-H. (2000). Saving in Developing Countries: An Overview. The
International Bank for Reconstruction and Development / THE WORLD BANK ,393
-414.
University of Ghana http://ugspace.ug.edu.gh

88
Nwachukwu, T. E., & Odigie, P. (2009). "What drives private savings in Nigeria". Centre for the
study of African Economics Conference .
Oya, P. A., & Oamar, E. H. (2006). Financial Sector deepening and economic growth; Evidence
from Turkey. Boğazı University, Department of Economics .
Perotti, E., & Schwienbacher, A. (2006). The Political Origin of Pension Funding. Tinbergen
Institute Discussion Paper , 1-33.
Rofman, R., & Oliveri, M. L. (2012). Pension Coverage in Latin America, trends and
determinants. social protection and labour discussion paper, NO;1217 - world bank , 1-
212.
Schiller, B., & Weiss, R. (1980, november 19). "pensions and wages; a test for equalizing
differences". Review of economics and statistics. vol.62. No;4 , pp. 529-538.
Schmidt-Hebbel, K. S. (1992). “Household Saving in Developing Countries: First Cross-Country
Evidence.”. The World Bank Economic Review 6(3). , 529–47.
Service, G. S. (2008). Ghana Living Standards Survey. Accra: Government of Ghana.
Seyram, k. (2008). Analysis of the performance of Social Security. university of cape coast , 1-
161.
Shaw, E. S. (1973). Financial deepening in economic development. New York: Oxford
University Press.
Smith, R. S., & Ehrenberg, R. G. (1983). Estimating wage-fringe tradeoff. the University of
Chicago press .
Steinmeier, L. T., & Gustman, A. L. (1993, march). Pension Portability and Labour Portability;
Evidence from SIPP. vol 50; no 3 , pp. 229-323.
Stock, J. H. (1988). “Estimating Continuous-Time Processes Subject to Time Deformation,”
. Journal of the American Statistical Association (JASA) , 83, 77-85.
Valdes-prieto, s. (1997). The economics of Pensions;principles, policies, and international
experience. usa: cambridge university press.
Verbeek, M. (2004). "A guide to modern econometrics". West sussex, England: John Wiley and
Sons Ltd.
Yamada, T., & Yamada, T. (1992). "Interdependency of personal savings and Labour force
participation, and Social Security Wealth: A time series analysis". Applied Economics
, 379-88.
University of Ghana http://ugspace.ug.edu.gh

89
APPENDIX 1
QUESTIONNAIRE
PENSION CONTRIBUTION AND NATIONAL SAVINGS IN GHANA;TRENDS,
CHALLENGES AND PROSPECTS. Ref
The researcher is a final year MPhil Economics student from the University of Ghana and
working on the above topic. Any information given is for academic use only. Your responses
will be kept confidential.
Please tick where appropriate.
SECTION A (Respondent’s personal profile)
1. Age up to 55years to 60 years
61years to 70 years
71 years and above
2. Gender M Male Female
3. Occupation before going on pensions
Formal informal
4. Qualification (level of education) before going on pensions
Primary J.H.S
S.H.S Tertiary
5. Religion
Christianity Islam Traditional
University of Ghana http://ugspace.ug.edu.gh

90
SECTION B (Membership Profile)
6. Are you under any pension scheme? Yes, please
specify………………………………..
No
7. Have you joined the SSNIT Pensions Scheme ?
Yes No
8. If you are a SSNIT Pensioner, are you enjoying the scheme?
Yes No
9. If no, please your reason
………………………………………………………………………………………………
………………………………………………………………………………………………
…………………………………………………………
10. Do you get quality health care with your NHIS card in the health centers?
Yes No
11. Do you get all your drugs that have been covered under the NHIS?
Yes No
12. What do you think about the attention you get at the hospital with the NHIS card?
Very good Good
Bad Worse
13. What is the range of
your pension benefit?
(i) GHS 100 to GHS 500
University of Ghana http://ugspace.ug.edu.gh

91
(ii) GHS600 TO GHS
1000
(iii) GHS 5000 to GHS
10000
(iv)
(v) GHS 10,000 to GHS
50,000
14. Do you go through
administrative challenges when you are going for your benefit?
Yes No
15. If yes, please explain
………………………………………………………………………………………………
………………………………………………………………………………………………
………………………………………………………………………………………………
………………………………………………………………………………………………
………………………………………………………………………………………………
………………………………………………………………………………………………
……………………
16. Are you able to save
from your pension monthly benefit?
Yes No
17. If yes, what is the
range of your personal savings after retirement?
(i) Below GHS 10
(ii) GHS 11 to GHS 50
(iii) GHS 60 to GHS 100
(iv) GHS 100 to GHS 1000
University of Ghana http://ugspace.ug.edu.gh

92
18. Are you privately
employed?
Yes No
19. What do you think can
be done to improve the SSNIT pensions scheme?
………………………………………………………………………………………………
………………………………………………………………………………………………
………………………………………………………………………………………………
………………………………………………………………………………………………
………………………………………………………………………………………………
………………………………………………………………………………………………
……………………
20. How would you
describe the scheme?
Very good Good
Bad Worse
THANKYOU FOR YOUR COOPERATION!!!!!
University of Ghana http://ugspace.ug.edu.gh

93
APPENDIX 2
QUESTIONNAIRE FOR ADMINISTRATORS
“PENSION CONTRIBUTIONS AND NATIONAL SAVINGS IN GHANA: TRENDS,
CHALLENGES AND PROSPECTS”. Ref
The researcher is a final year Mphil Economics student of the University of Ghana working on
the above topic. Any information given is for academic use only. Your responses will be kept
confidential.
Please tick where appropriate.
SECTION A
1. Please tick the department you belong
ACTUARY
AUDIT
PUBLIC AFFAIRS
STRATEGIC PLAN IMPLEMENTATION
RESEARCH
2. Gender M Male Female
3. Please indicate years of service with SSNIT ; …………………………..
SECTION B
4. Please list the challenges faced by the SSNIT pension scheme
University of Ghana http://ugspace.ug.edu.gh

94
THANKYOU FOR YOUR COOPERATION!!!!!
APPENDIX 3
E x o g e n o u s : _ c o n s
E n d o g e n o u s : n s r f d g r o w t h p e r
5 - 8 3 . 0 5 6 1 7 9 . 6 7 5 * 1 6 0 . 0 0 0 5 4 . 6 1 2 4 * 1 2 . 8 5 0 5 * 1 4 . 0 2 0 9 * 1 6 . 9 1 5 1 *
4 - 1 2 2 . 8 9 3 6 7 . 5 3 2 1 6 0 . 0 0 0 7 8 . 0 7 9 9 1 4 . 6 8 4 1 1 5 . 6 3 1 6 1 7 . 9 7 4 5
3 - 1 5 6 . 6 5 9 3 0 . 6 4 9 1 6 0 . 0 1 5 1 6 2 . 9 8 5 1 6 . 0 5 0 7 1 6 . 7 7 5 3 1 8 . 5 6 6 9
2 - 1 7 1 . 9 8 4 3 7 . 2 9 6 1 6 0 . 0 0 2 1 1 7 . 5 1 5 1 5 . 9 9 8 8 1 6 . 5 0 0 4 1 7 . 7 4 0 7
1 - 1 9 0 . 6 3 2 4 6 . 6 0 3 1 6 0 . 0 0 0 1 3 0 . 3 6 6 1 6 . 2 0 2 5 1 6 . 4 8 1 1 1 7 . 1 7 0 2
0 - 2 1 3 . 9 3 4 2 2 4 . 2 5 2 1 6 . 7 6 4 1 1 6 . 8 1 9 9 1 6 . 9 5 7 7
l a g L L L R d f p F P E A I C H Q I C S B I C
S a m p l e : 1 9 8 5 - 2 0 1 0 N u m b e r o f o b s = 2 6
S e l e c t i o n - o r d e r c r i t e r i a
. v a r s o c n s r f d g r o w t h p e r , m a x l a g ( 5 )
d e l t a : 1 y e a r
1 3 - 0 . 0 3 7 5 0 . 4 2 5 9 1 3 . 0 7 9 0 . 4 4 1 7
1 2 - 0 . 2 5 2 8 - 0 . 2 6 8 8 1 2 . 9 9 9 0 . 3 6 9 1
1 1 0 . 1 6 8 6 1 . 0 9 8 8 9 . 5 9 2 4 0 . 5 6 7 4
1 0 - 0 . 1 3 7 1 - 0 . 2 1 0 5 8 . 1 5 5 3 0 . 6 1 3 7
9 0 . 2 3 2 6 0 . 0 4 3 8 7 . 2 5 3 5 0 . 6 1 0 7
8 - 0 . 0 1 8 3 - 0 . 3 9 9 3 4 . 7 8 0 2 0 . 7 8 0 8
7 0 . 0 9 2 2 - 0 . 3 3 1 2 4 . 7 6 5 5 0 . 6 8 8 6
6 - 0 . 0 6 2 1 - 0 . 4 6 6 0 4 . 4 1 0 5 0 . 6 2 1 3
5 0 . 0 0 0 0 - 0 . 3 4 2 9 4 . 2 5 6 1 0 . 5 1 3 2
4 - 0 . 1 7 5 5 - 0 . 4 9 6 4 4 . 2 5 6 1 0 . 3 7 2 5
3 - 0 . 1 9 6 2 - 0 . 3 3 2 2 3 . 1 1 8 3 0 . 3 7 3 7
2 0 . 0 2 5 1 - 0 . 0 5 0 4 1 . 7 4 9 1 0 . 4 1 7 0
1 - 0 . 2 2 8 4 - 0 . 2 2 8 6 1 . 7 2 7 5 0 . 1 8 8 7
L A G A C P A C Q P r o b > Q [ A u t o c o r r e l a t i o n ] [ P a r t i a l A u t o c o r ]
- 1 0 1 - 1 0 1
. c o r r g r a m D . n s r
University of Ghana http://ugspace.ug.edu.gh

95
1 3 - 0 . 0 0 2 9 1 . 5 3 8 6 1 0 . 3 1 0 . 6 6 8 4
1 2 - 0 . 1 4 9 3 0 . 2 6 3 9 1 0 . 3 1 0 . 5 8 8 8
1 1 0 . 1 7 3 5 1 . 1 6 5 8 9 . 1 2 1 2 0 . 6 1 0 7
1 0 - 0 . 1 3 1 6 - 0 . 2 1 7 8 7 . 6 0 0 7 0 . 6 6 7 8
9 0 . 1 4 0 5 0 . 5 3 6 5 6 . 7 6 8 8 0 . 6 6 1 2
8 - 0 . 0 4 3 9 - 0 . 4 6 9 3 5 . 8 6 6 9 0 . 6 6 2 1
7 - 0 . 0 0 4 4 - 0 . 0 9 0 1 5 . 7 8 2 8 0 . 5 6 5 3
6 - 0 . 0 1 4 3 - 0 . 1 0 5 4 5 . 7 8 2 0 . 4 4 8 0
5 0 . 0 7 3 9 - 0 . 1 8 1 4 5 . 7 7 3 9 0 . 3 2 8 8
4 - 0 . 0 9 5 6 - 0 . 5 3 1 5 5 . 5 6 3 9 0 . 2 3 4 2
3 - 0 . 0 2 0 3 - 0 . 2 8 3 7 5 . 2 2 6 8 0 . 1 5 5 9
2 - 0 . 0 3 6 5 - 0 . 5 3 5 6 5 . 2 1 2 1 0 . 0 7 3 8
1 - 0 . 3 9 5 1 - 0 . 3 9 5 2 5 . 1 6 6 5 0 . 0 2 3 0
L A G A C P A C Q P r o b > Q [ A u t o c o r r e l a t i o n ] [ P a r t i a l A u t o c o r ]
- 1 0 1 - 1 0 1
. c o r r g r a m D . f d
1 3 - 0 . 0 2 0 9 - 0 . 1 0 7 1 5 . 8 5 2 0 . 9 5 1 4
1 2 0 . 0 5 1 1 0 . 0 9 2 2 5 . 8 2 7 4 0 . 9 2 4 5
1 1 0 . 0 0 9 4 - 0 . 1 0 2 2 5 . 6 8 8 3 0 . 8 9 3 3
1 0 - 0 . 0 8 3 0 - 0 . 1 0 6 3 5 . 6 8 3 8 0 . 8 4 1 1
9 0 . 0 6 0 0 - 0 . 0 6 2 6 5 . 3 5 2 8 0 . 8 0 2 5
8 - 0 . 0 3 6 7 0 . 0 1 6 0 5 . 1 8 8 4 0 . 7 3 7 3
7 0 . 1 0 3 7 - 0 . 0 6 1 0 5 . 1 2 9 5 0 . 6 4 4 2
6 - 0 . 1 3 6 6 - 0 . 1 5 9 7 4 . 6 8 0 6 0 . 5 8 5 4
5 0 . 0 1 9 5 0 . 0 6 2 8 3 . 9 3 3 8 0 . 5 5 9 0
4 0 . 0 9 7 3 0 . 0 0 1 3 3 . 9 1 9 2 0 . 4 1 7 1
3 - 0 . 1 9 5 7 - 0 . 3 5 6 6 3 . 5 6 9 4 0 . 3 1 1 9
2 - 0 . 1 8 5 7 - 0 . 2 5 3 0 2 . 2 0 7 0 . 3 3 1 7
1 - 0 . 1 7 5 9 - 0 . 1 8 3 7 1 . 0 2 4 3 0 . 3 1 1 5
L A G A C P A C Q P r o b > Q [ A u t o c o r r e l a t i o n ] [ P a r t i a l A u t o c o r ]
- 1 0 1 - 1 0 1
. c o r r g r a m D . g r o w t h
University of Ghana http://ugspace.ug.edu.gh

96
1 3 - 0 . 1 0 1 1 - 0 . 1 9 5 2 8 . 7 4 5 5 0 . 7 9 1 9
1 2 - 0 . 1 6 7 3 - 0 . 1 1 2 7 8 . 1 6 8 6 0 . 7 7 1 8
1 1 0 . 1 8 3 7 0 . 3 5 7 1 6 . 6 7 6 5 0 . 8 2 4 6
1 0 - 0 . 0 1 1 7 - 0 . 2 0 3 0 4 . 9 7 0 8 0 . 8 9 3 1
9 0 . 1 1 2 9 - 0 . 1 2 5 2 4 . 9 6 4 2 0 . 8 3 7 4
8 - 0 . 0 8 0 0 - 0 . 3 5 8 5 4 . 3 8 1 2 0 . 8 2 1 2
7 0 . 0 0 6 5 - 0 . 2 1 1 7 4 . 1 0 2 0 . 7 6 8 0
6 - 0 . 0 6 3 4 - 0 . 2 2 5 7 4 . 1 0 0 3 0 . 6 6 3 1
5 0 . 1 0 8 9 - 0 . 0 8 1 1 3 . 9 3 9 6 0 . 5 5 8 1
4 - 0 . 0 4 8 0 - 0 . 3 4 7 5 3 . 4 8 4 6 0 . 4 8 0 2
3 - 0 . 1 2 5 8 - 0 . 3 5 3 4 3 . 3 9 9 5 0 . 3 3 4 0
2 - 0 . 0 8 1 3 - 0 . 2 9 8 2 2 . 8 3 7 2 0 . 2 4 2 0
1 - 0 . 2 8 0 8 - 0 . 2 8 1 8 2 . 6 1 0 5 0 . 1 0 6 2
L A G A C P A C Q P r o b > Q [ A u t o c o r r e l a t i o n ] [ P a r t i a l A u t o c o r ]
- 1 0 1 - 1 0 1
. c o r r g r a m D . p e r
University of Ghana http://ugspace.ug.edu.gh

97
4 8 4 - 8 3 . 0 5 6 0 9 1 0 . 0 1 5 8 1
3 8 3 - 8 3 . 2 6 3 2 6 1 0 . 3 7 4 4 6 0 . 4 1 4 3 3 . 7 6
2 8 0 - 8 9 . 3 6 2 0 5 5 0 . 4 7 2 3 2 1 2 . 1 9 7 6 1 4 . 0 7
1 7 5 - 9 7 . 6 7 2 6 0 2 0 . 9 4 0 5 2 1 6 . 6 2 1 1 2 0 . 9 7
0 6 8 - 1 3 4 . 3 5 9 3 6 . 7 3 . 3 7 3 5 2 7 . 0 7
r a n k p a r m s L L e i g e n v a l u e s t a t i s t i c v a l u e
m a x i m u m m a x c r i t i c a l
5 %
4 8 4 - 8 3 . 0 5 6 0 9 1 0 . 0 1 5 8 1
3 8 3 - 8 3 . 2 6 3 2 6 1 0 . 3 7 4 4 6 0 . 4 1 4 3 3 . 7 6
2 8 0 - 8 9 . 3 6 2 0 5 5 0 . 4 7 2 3 2 1 2 . 6 1 1 9 1 5 . 4 1
1 7 5 - 9 7 . 6 7 2 6 0 2 0 . 9 4 0 5 2 2 9 . 2 3 3 0 * 2 9 . 6 8
0 6 8 - 1 3 4 . 3 5 9 3 6 . 1 0 2 . 6 0 6 5 4 7 . 2 1
r a n k p a r m s L L e i g e n v a l u e s t a t i s t i c v a l u e
m a x i m u m t r a c e c r i t i c a l
5 %
S a m p l e : 1 9 8 5 - 2 0 1 0 L a g s = 5
T r e n d : c o n s t a n t N u m b e r o f o b s = 2 6
J o h a n s e n t e s t s f o r c o i n t e g r a t i o n
University of Ghana http://ugspace.ug.edu.gh

98
_ c o n s 3 . 7 0 4 4 9 6 . 8 1 9 3 0 4 6 4 . 5 2 0 . 0 0 0 2 . 0 9 8 6 8 9 5 . 3 1 0 3 0 4
L 4 D . 3 9 . 7 1 2 2 2 1 . 8 1 5 7 7 1 . 8 2 0 . 0 6 9 - 3 . 0 4 5 9 1 2 8 2 . 4 7 0 3 2
L 3 D . 3 8 . 9 9 0 8 4 1 7 . 3 5 0 1 1 2 . 2 5 0 . 0 2 5 4 . 9 8 5 2 5 7 7 2 . 9 9 6 4 2
L 2 D . 4 6 . 2 6 6 0 1 2 4 . 4 2 5 5 2 1 . 8 9 0 . 0 5 8 - 1 . 6 0 7 1 2 6 9 4 . 1 3 9 1 4
L D . - 4 5 . 0 2 7 7 8 1 7 . 3 6 6 4 5 - 2 . 5 9 0 . 0 1 0 - 7 9 . 0 6 5 4 - 1 0 . 9 9 0 1 6
p e r
L 4 D . - . 4 6 6 3 7 8 5 . 2 3 4 0 3 6 9 - 1 . 9 9 0 . 0 4 6 - . 9 2 5 0 8 2 5 - . 0 0 7 6 7 4 6
L 3 D . . 3 9 3 0 8 5 9 . 2 4 3 5 8 7 1 1 . 6 1 0 . 1 0 7 - . 0 8 4 3 3 6 . 8 7 0 5 0 7 8
L 2 D . - . 3 6 0 2 4 7 4 . 2 6 5 1 7 3 4 - 1 . 3 6 0 . 1 7 4 - . 8 7 9 9 7 7 8 . 1 5 9 4 8 3
L D . . 0 8 6 8 0 5 9 . 2 2 0 5 1 5 0 . 3 9 0 . 6 9 4 - . 3 4 5 3 9 5 7 . 5 1 9 0 0 7 4
g r o w t h
L 4 D . . 0 0 7 9 9 9 7 . 0 2 3 7 6 4 1 0 . 3 4 0 . 7 3 6 - . 0 3 8 5 7 6 9 . 0 5 4 5 7 6 4
L 3 D . . 0 3 0 5 9 1 9 . 0 2 3 0 6 8 7 1 . 3 3 0 . 1 8 5 - . 0 1 4 6 2 1 9 . 0 7 5 8 0 5 8
L 2 D . - . 0 5 3 9 7 0 4 . 0 2 6 3 0 5 6 - 2 . 0 5 0 . 0 4 0 - . 1 0 5 5 2 8 3 - . 0 0 2 4 1 2 4
L D . - . 0 4 8 8 7 8 6 . 0 1 5 7 0 7 1 - 3 . 1 1 0 . 0 0 2 - . 0 7 9 6 6 3 9 - . 0 1 8 0 9 3 3
f d
L 4 D . 1 . 0 3 3 4 1 1 . 3 8 0 5 7 5 7 2 . 7 2 0 . 0 0 7 . 2 8 7 4 9 6 5 1 . 7 7 9 3 2 6
L 3 D . 1 . 7 5 5 6 0 7 . 3 3 2 4 0 3 7 5 . 2 8 0 . 0 0 0 1 . 1 0 4 1 0 8 2 . 4 0 7 1 0 6
L 2 D . . 7 0 6 2 1 5 9 . 1 8 3 0 5 2 1 3 . 8 6 0 . 0 0 0 . 3 4 7 4 4 0 4 1 . 0 6 4 9 9 1
L D . . 0 3 7 8 3 0 1 . 1 9 3 8 0 7 9 0 . 2 0 0 . 8 4 5 - . 3 4 2 0 2 6 5 . 4 1 7 6 8 6 6
n s r
L 1 . - . 3 6 3 8 3 7 8 . 0 4 1 4 5 0 3 - 8 . 7 8 0 . 0 0 0 - . 4 4 5 0 7 8 8 - . 2 8 2 5 9 6 8
_ c e 1
D _ n s r
C o e f . S t d . E r r . z P > | z | [ 9 5 % C o n f . I n t e r v a l ]
D _ p e r 1 8 . 0 3 5 4 1 4 0 . 9 3 2 6 1 1 0 . 7 2 8 3 0 . 0 0 0 0
D _ g r o w t h 1 8 . 9 7 8 2 7 3 0 . 8 8 9 0 6 4 . 0 7 8 1 0 . 0 0 0 0
D _ f d 1 8 7 3 . 4 1 7 9 0 . 8 9 7 2 6 9 . 8 0 9 2 1 0 . 0 0 0 0
D _ n s r 1 8 1 . 7 4 4 0 6 0 . 9 7 0 2 2 6 0 . 8 8 9 0 . 0 0 0 0
E q u a t i o n P a r m s R M S E R - s q c h i 2 P > c h i 2
D e t ( S i g m a _ m l ) = . 0 2 1 5 3 1 7 S B I C = 1 6 . 9 1 1 6 3
L o g l i k e l i h o o d = - 9 7 . 6 7 2 6 H Q I C = 1 4 . 3 2 7 5 6
A I C = 1 3 . 2 8 2 5 1
S a m p l e : 1 9 8 5 - 2 0 1 0 N o . o f o b s = 2 6
V e c t o r e r r o r - c o r r e c t i o n m o d e l
. v e c n s r f d g r o w t h p e r , t r e n d ( c o n s t a n t ) l a g s ( 5 )
University of Ghana http://ugspace.ug.edu.gh

99
P r o b > c h i 2 = 0 . 0 0 0 0
c h i 2 ( 1 7 ) = 2 5 8 . 6 7
( 1 7 ) [ D _ n s r ] L 4 D . p e r = 0
( 1 6 ) [ D _ n s r ] L 3 D . p e r = 0
( 1 5 ) [ D _ n s r ] L 2 D . p e r = 0
( 1 4 ) [ D _ n s r ] L D . p e r = 0
( 1 3 ) [ D _ n s r ] L 4 D . g r o w t h = 0
( 1 2 ) [ D _ n s r ] L 3 D . g r o w t h = 0
( 1 1 ) [ D _ n s r ] L 2 D . g r o w t h = 0
( 1 0 ) [ D _ n s r ] L D . g r o w t h = 0
( 9 ) [ D _ n s r ] L 4 D . f d = 0
( 8 ) [ D _ n s r ] L 3 D . f d = 0
( 7 ) [ D _ n s r ] L 2 D . f d = 0
( 6 ) [ D _ n s r ] L D . f d = 0
( 5 ) [ D _ n s r ] L 4 D . n s r = 0
( 4 ) [ D _ n s r ] L 3 D . n s r = 0
( 3 ) [ D _ n s r ] L 2 D . n s r = 0
( 2 ) [ D _ n s r ] L D . n s r = 0
( 1 ) [ D _ n s r ] L . _ c e 1 = 0
. t e s t ( [ D _ n s r ] )
H 0 : n o a u t o c o r r e l a t i o n a t l a g o r d e r
5 1 5 . 2 3 3 5 1 6 0 . 5 0 7 6 0
4 2 7 . 0 6 1 6 1 6 0 . 0 4 0 8 0
3 2 8 . 5 9 9 2 1 6 0 . 0 2 6 7 8
2 1 3 . 4 3 6 4 1 6 0 . 6 4 0 6 2
1 3 3 . 7 2 3 7 1 6 0 . 0 0 5 9 2
l a g c h i 2 d f P r o b > c h i 2
L a g r a n g e - m u l t i p l i e r t e s t
. v e c l m a r , m l a g ( 5 )
University of Ghana http://ugspace.ug.edu.gh
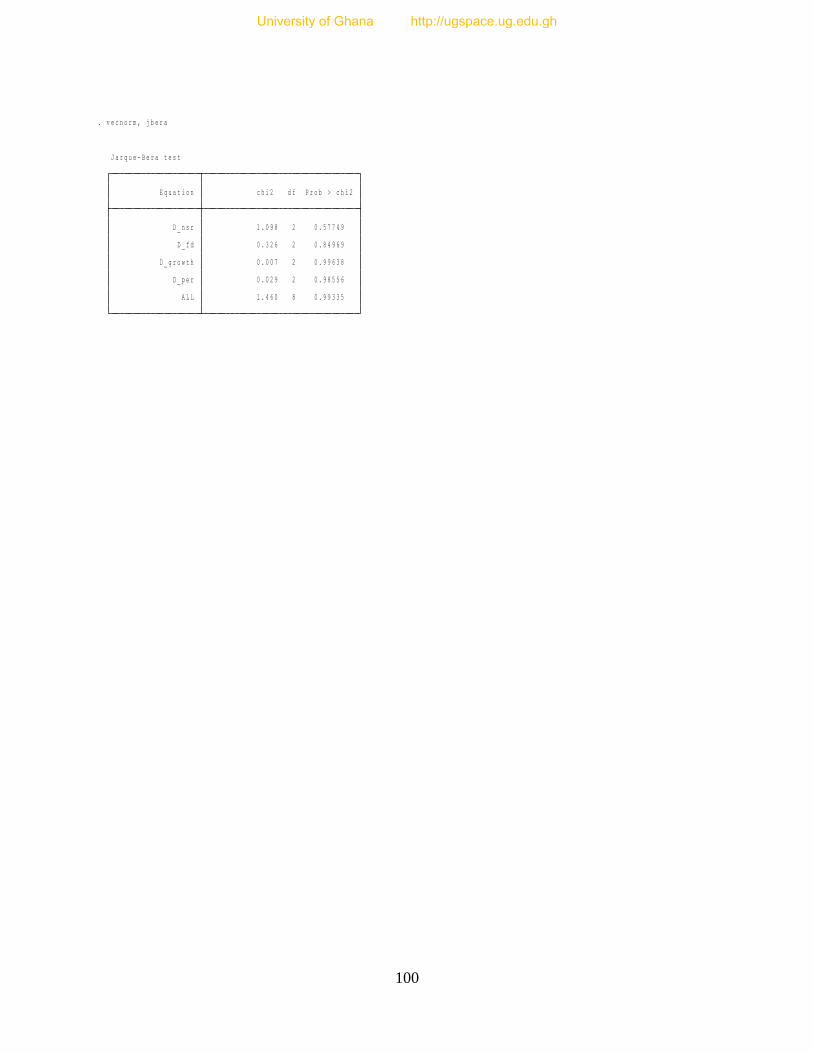
100
A L L 1 . 4 6 0 8 0 . 9 9 3 3 5
D _ p e r 0 . 0 2 9 2 0 . 9 8 5 5 6
D _ g r o w t h 0 . 0 0 7 2 0 . 9 9 6 3 8
D _ f d 0 . 3 2 6 2 0 . 8 4 9 6 9
D _ n s r 1 . 0 9 8 2 0 . 5 7 7 4 9
E q u a t i o n c h i 2 d f P r o b > c h i 2
J a r q u e - B e r a t e s t
. v e c n o r m , j b e r a
University of Ghana http://ugspace.ug.edu.gh