
peco energy company
62
PECO ENERGY COMPANY STATEMENT NO. 5 BEFORE THE PENNSYLVANIA PUBLIC UTILITY COMMISSION PENNSYLVANIA PUBLIC UTILITY COMMISSION v. PECO ENERGY COMPANY – GAS DIVISION DOCKET NO. R-2022-3031113 ____________________________________________ DIRECT TESTIMONY ____________________________________________ WITNESS: PAUL R. MOUL SUBJECT: OVERALL RATE OF RETURN, INCLUDING CAPITAL STRUCTURE RATIOS, EMBEDDED COST OF DEBT AND THE COST OF EQUITY, FOR PECO ENERGY COMPANY’S GAS DIVISION DATED: MARCH 31, 2022
-
Upload
khangminh22 -
Category
Documents
-
view
0 -
download
0
Transcript of peco energy company
PECO ENERGY COMPANY
STATEMENT NO. 5
BEFORE THE
PENNSYLVANIA PUBLIC UTILITY COMMISSION
PENNSYLVANIA PUBLIC UTILITY COMMISSION
v.
PECO ENERGY COMPANY – GAS DIVISION
DOCKET NO. R-2022-3031113
____________________________________________
DIRECT TESTIMONY
____________________________________________
WITNESS: PAUL R. MOUL
SUBJECT: OVERALL RATE OF RETURN,
INCLUDING CAPITAL STRUCTURE
RATIOS, EMBEDDED COST OF DEBT
AND THE COST OF EQUITY, FOR PECO
ENERGY COMPANY’S GAS DIVISION
DATED: MARCH 31, 2022
TABLE OF CONTENTS
Page No.
I. INTRODUCTION AND SUMMARY OF RECOMMENDATIONS ............................. 1
II. NATURAL GAS RISK FACTORS ................................................................................. 9
III. FUNDAMENTAL RISK ANALYSIS ........................................................................... 13
IV. CAPITAL STRUCTURE RATIOS ................................................................................ 20
V. COST OF SENIOR CAPITAL ....................................................................................... 23
VI. COST OF EQUITY – GENERAL APPROACH ........................................................... 25
VII. DISCOUNTED CASH FLOW ....................................................................................... 26
VIII. RISK PREMIUM ANALYSIS ....................................................................................... 41
IX. CAPITAL ASSET PRICING MODEL .......................................................................... 46
X. COMPARABLE EARNINGS APPROACH .................................................................. 51
XI. CONCLUSION ON COST OF EQUITY ....................................................................... 55
APPENDIX A - EDUCATIONAL BACKGROUND, BUSINESS EXPERIENCE AND
QUALIFICATIONS
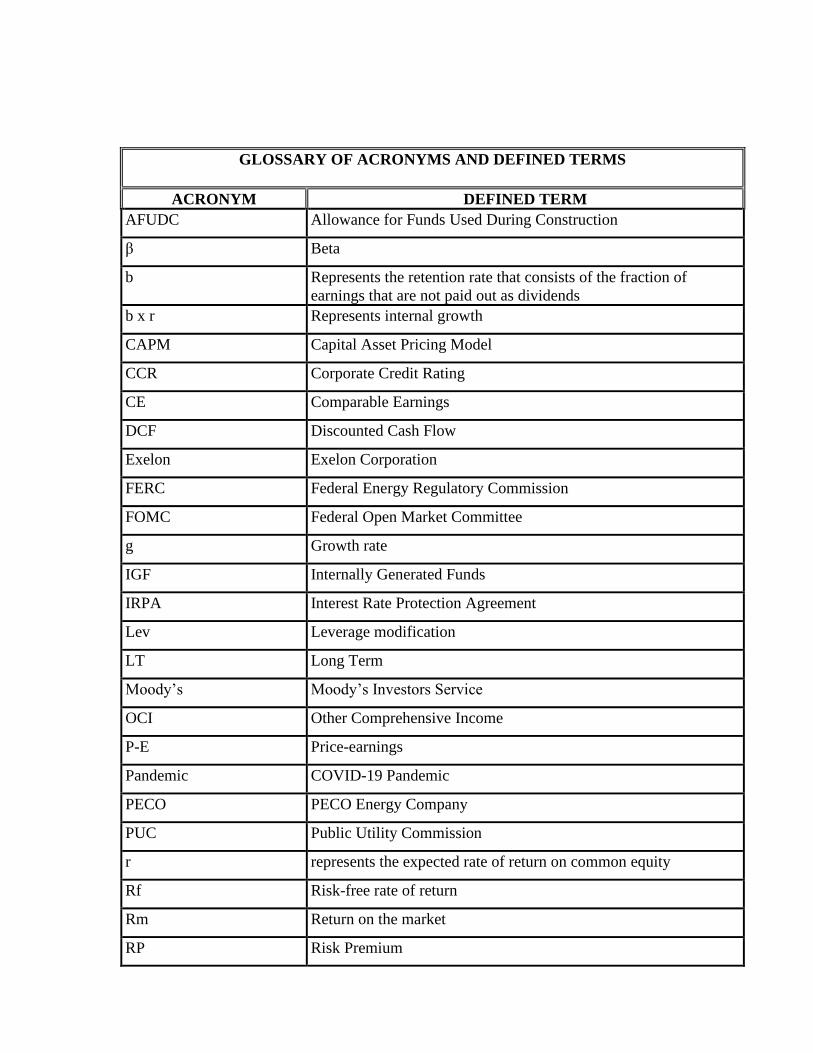
GLOSSARY OF ACRONYMS AND DEFINED TERMS
ACRONYM DEFINED TERM
AFUDC Allowance for Funds Used During Construction
β Beta
b Represents the retention rate that consists of the fraction of
earnings that are not paid out as dividends
b x r Represents internal growth
CAPM Capital Asset Pricing Model
CCR Corporate Credit Rating
CE Comparable Earnings
DCF Discounted Cash Flow
Exelon Exelon Corporation
FERC Federal Energy Regulatory Commission
FOMC Federal Open Market Committee
g Growth rate
IGF Internally Generated Funds
IRPA Interest Rate Protection Agreement
Lev Leverage modification
LT Long Term
Moody’s Moody’s Investors Service
OCI Other Comprehensive Income
P-E Price-earnings
Pandemic COVID-19 Pandemic
PECO PECO Energy Company
PUC Public Utility Commission
r represents the expected rate of return on common equity
Rf Risk-free rate of return
Rm Return on the market
RP Risk Premium

DIRECT TESTIMONY OF PAUL R. MOUL
2
s Represents the new common shares expected to be issued by a
firm
s x v Represents external growth
S&P Standard & Poor’s
V Represents the value that accrues to existing shareholders from
selling stock at a price different from value
ytm Yield to maturity
DIRECT TESTIMONY 1
OF 2
PAUL R. MOUL 3
I. INTRODUCTION AND SUMMARY OF RECOMMENDATIONS 4
1. Q. Please state your name, occupation and business address. 5
A. My name is Paul Ronald Moul. My business address is 251 Hopkins Road, 6
Haddonfield, New Jersey 08033-3062. I am Managing Consultant at the firm 7
P. Moul & Associates, an independent financial and regulatory consulting 8
firm. My educational background, business experience and qualifications are 9
provided in Appendix A, which follows my direct testimony. 10
2. Q. What is the purpose of your testimony? 11
A. My testimony presents evidence, analysis, and a recommendation concerning 12
the appropriate cost of common equity and overall rate of return that the 13
Pennsylvania Public Utility Commission (“PUC” or the “Commission”) 14
should recognize in determining the revenues PECO Energy Company 15
(“PECO Energy” or the “Company”) will be authorized to realize at the 16
conclusion of this proceeding for its Gas Division. My analysis and 17
recommendation are supported by the detailed financial data contained in 18
PECO Exhibit PRM-1, which is a multi-page document divided into fourteen 19
schedules. My testimony is based upon my first-hand knowledge of PECO 20
Energy, consisting of information obtained from meetings with the 21
2
Company’s management and Company-specific data that is widely 1
disseminated within the financial community. 2
3. Q. Based upon your analysis, what is your conclusion concerning the 3
appropriate rate of return for the Company? 4
A. My conclusion is that the Company should be afforded an opportunity to earn 5
a 7.68% overall rate of return, which includes a 10.95% rate of return on 6
common equity. My 10.95% rate of return on common equity includes 7
recognition of the exemplary performance of the Company’s management and 8
is established using capital market and financial data relied upon by investors 9
when assessing the relative risk, and hence the cost of capital for the 10
Company. The 10.95% rate of return on common equity is composed of a 11
10.85% cost of equity determined from the results of my proxy group analysis 12
and 0.10% in recognition of the exemplary performance of the Company’s 13
management. My analysis of the Company and its superior performance is 14
based upon the direct testimony of Mr. Ronald A. Bradley, the Company’s 15
Vice President of Gas Operations, and the testimony of Robert J. Stefani, the 16
Senior Vice President, Chief Financial Officer, and Treasurer of PECO 17
Energy. 18
My overall rate of return recommendation is determined by using the 19
weighted average cost of capital approach. This approach provides a means to 20
apportion the return to each class of investor. The calculation of the weighted 21
average cost of capital requires the selection of appropriate capital structure 22
ratios and a determination of the cost rate for each capital component. The 23
3
resulting overall cost of capital when applied to the Company’s rate base will 1
provide a level of return that will compensate investors for the use of their 2
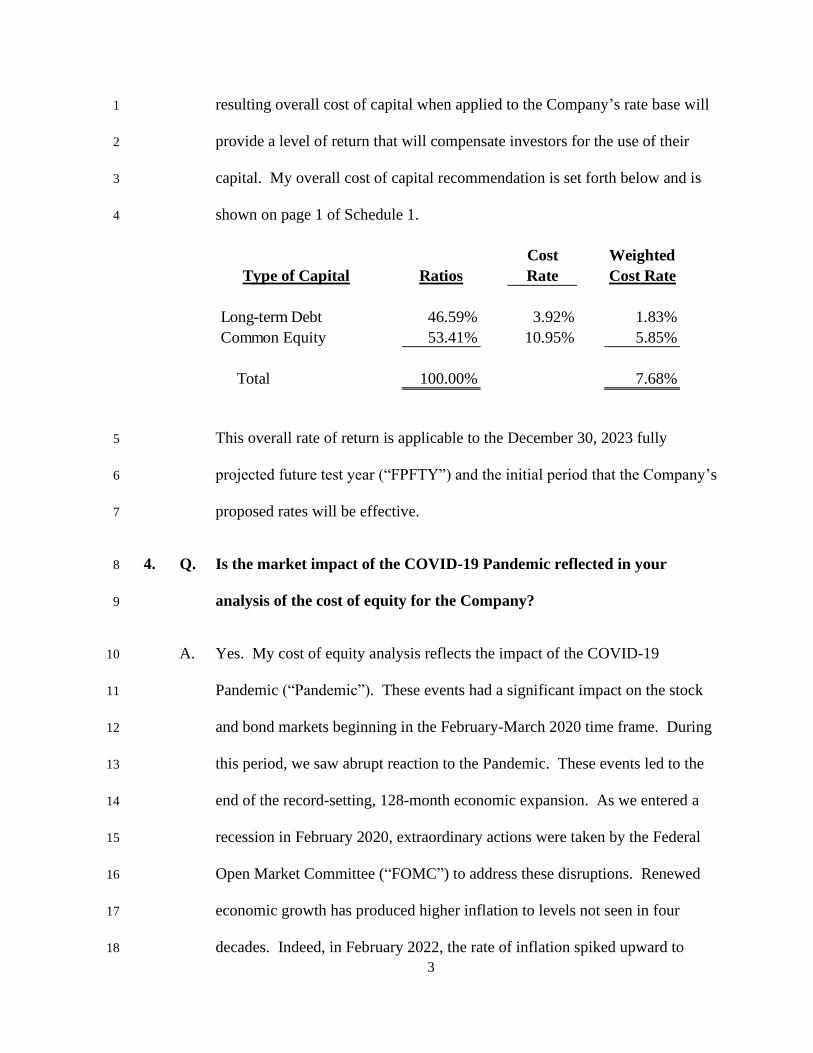
capital. My overall cost of capital recommendation is set forth below and is 3
shown on page 1 of Schedule 1. 4
Cost Weighted
Type of Capital Ratios Rate Cost Rate
Long-term Debt 46.59% 3.92% 1.83%
Common Equity 53.41% 10.95% 5.85%
Total 100.00% 7.68%
This overall rate of return is applicable to the December 30, 2023 fully 5
projected future test year (“FPFTY”) and the initial period that the Company’s 6
proposed rates will be effective. 7
4. Q. Is the market impact of the COVID-19 Pandemic reflected in your 8
analysis of the cost of equity for the Company? 9
A. Yes. My cost of equity analysis reflects the impact of the COVID-19 10
Pandemic (“Pandemic”). These events had a significant impact on the stock 11
and bond markets beginning in the February-March 2020 time frame. During 12
this period, we saw abrupt reaction to the Pandemic. These events led to the 13
end of the record-setting, 128-month economic expansion. As we entered a 14
recession in February 2020, extraordinary actions were taken by the Federal 15
Open Market Committee (“FOMC”) to address these disruptions. Renewed 16
economic growth has produced higher inflation to levels not seen in four 17
decades. Indeed, in February 2022, the rate of inflation spiked upward to 18

4
7.9%, the highest in forty-years, due to pandemic-related supply side issues, 1
strong consumer demand, and tight labor markets. Supply shortages have also 2
significantly impacted the consumer sector of the economy. Energy prices 3
have increased as well, with the commodity cost of natural gas moving up. 4
While short-term interest rates remain at historically low levels, longer term 5
interest rates began to rise in February 2021. At this point, short-term interest 6
rates are poised to increase after the FOMC ends its bond buying program. 7
The FOMC has indicated that several increases in the Fed Funds rate will 8
likely occur in 2022 and 2023. The first of these increases occurred on March 9
16, 2022, when the Fed Funds rate was increased by 0.25%. Recently, the 10
yield on ten-year Treasury notes reached 2.00% for the first time since mid-11
2019. Over the course of the Pandemic, stock prices rebounded and reached 12
new highs in reaction to renewed economic growth. There has been a 13
pullback in overall market prices in early 2022, commonly known as a market 14
correction. It followed a stellar market performance in 2021 i.e., a 26.89% 15
annual price appreciation. I have considered these events as they impact the 16
inputs that I used in the various models of the cost of equity. 17
5. Q. What factors have you considered in the determination of the Company’s 18
cost of equity in this proceeding? 19
A. The Company is a wholly owned subsidiary of Exelon Corporation 20
(“Exelon”). The common stock of Exelon is traded on the Nasdaq Global 21
Select Market. Exelon is a component of the Standard & Poor’s (“S&P’s”) 22
500 Composite Index. The Company provides natural gas distribution service 23
5
to approximately 543,000 customers located in the suburban counties 1
surrounding the City of Philadelphia. PECO Energy also provides electric 2
delivery service to more than 1,600,000 electric customers in both the City of 3
Philadelphia and the surrounding counties. Throughput to the Company’s gas 4
customers in 2020 was composed of approximately 47% to residential 5
customers, approximately 26% to small commercial and industrial customers, 6
and 27% to large commercial and industrial customers. Approximately 30% 7
of throughput goes to transportation customers. With approximately 670 8
unique large commercial and industrial customers, the energy needs of a few 9
customers can have a significant impact on the Company’s operations. PECO 10
Energy obtains its gas supplies from producers and marketers with 11
transportation arrangements through interconnections with three interstate 12
pipelines. The Company has storage arrangements with pipeline service 13
providers and owns liquefied natural gas and propane facilities to supplement 14
flowing gas. Since the restructuring of the gas utility industry in 15
Pennsylvania, PECO Energy has been the supplier of last resort for customers 16
that do not obtain their own supply. 17
6. Q. How have you determined the cost of common equity in this case? 18
A. The cost of common equity is established using capital market and financial 19
data relied upon by investors to assess the relative risk, and hence the cost of 20
equity for a natural gas utility such as PECO Energy. In this regard, I have 21
considered four well-recognized models. These methods include the 22
Discounted Cash Flow (“DCF”) model, the Risk Premium (“RP”) analysis, 23
6
the Capital Asset Pricing Model (“CAPM”), and the Comparable Earnings 1
(“CE”) approach. The results of a variety of approaches indicate that the 2
Company’s rate of return on common equity is 10.95%, including 0.10% in 3
recognition of the Company’s exemplary management performance. 4
7. Q. In your opinion, what factors should the Commission consider when 5
determining the Company’s cost of capital in this proceeding? 6
A. The Commission’s rate of return allowance must be set to cover the 7
Company’s interest and dividend payments, provide a reasonable level of 8
earnings retention, produce an adequate level of internally generated funds to 9
meet capital requirements, be commensurate with the risk to which the 10
Company’s capital is exposed, assure confidence in the financial integrity of 11
the Company, support reasonable credit quality, and allow the Company to 12
raise capital on reasonable terms. The return that I propose fulfills these 13
established standards of a fair rate of return set forth by the landmark 14
Bluefield and Hope cases.1 That is to say, my proposed rate of return is 15
commensurate with returns available on investments having corresponding 16
risks. 17
8. Q. How have you measured the cost of equity in this case? 18
A. The models that I used to measure the cost of common equity for the 19
Company were applied with market and financial data developed from a 20
1 Bluefield Water Works & Improvement Co. v. P.S.C. of W. Va., 262 U.S. 679 (1923) and F.P.C.
v. Hope Nat. Gas Co., 320 U.S. 591 (1944).

7
group of companies engaged in the distribution of natural gas. I will refer to 1
these companies as the “Gas Group” throughout my testimony. I began with 2
all of the gas utilities contained in The Value Line Investment Survey, which 3
consists of ten companies. Value Line is an investment advisory service that 4
is a widely used source in public utility rate cases. I eliminated two 5
companies from the Value Line group. UGI Corporation was removed due to 6
its diversified businesses consisting of six reportable segments, including 7
propane, two international LPG segments, natural gas utility, energy services, 8
and electric generation. I also removed South Jersey Industries from the Gas 9
Group because it entered into an agreement to be acquired by a private equity 10
investor. The remaining eight companies in the Gas Group are identified on 11
page 2 of Schedule 3. Aside from South Jersey Industries, these are the same 12
companies that were used to apply the cost of equity models in the recent 13
Quarterly Earnings Report approved by the Commission on January 13, 2022 14
(Docket No. M-2021-3030045). 15
9. Q. How have you performed your cost of equity analysis with the market 16
data for the Gas Group? 17
A. I have applied the methods/models for estimating the cost of equity using the 18
average data for the Gas Group. I have not measured separately the cost of 19
equity for the individual companies within the Gas Group, because the 20
determination of the cost of equity for an individual company can be 21
problematic. The use of group average data will reduce the effect of 22
8
potentially anomalous results for an individual company if a company-by-1
company approach were utilized. 2
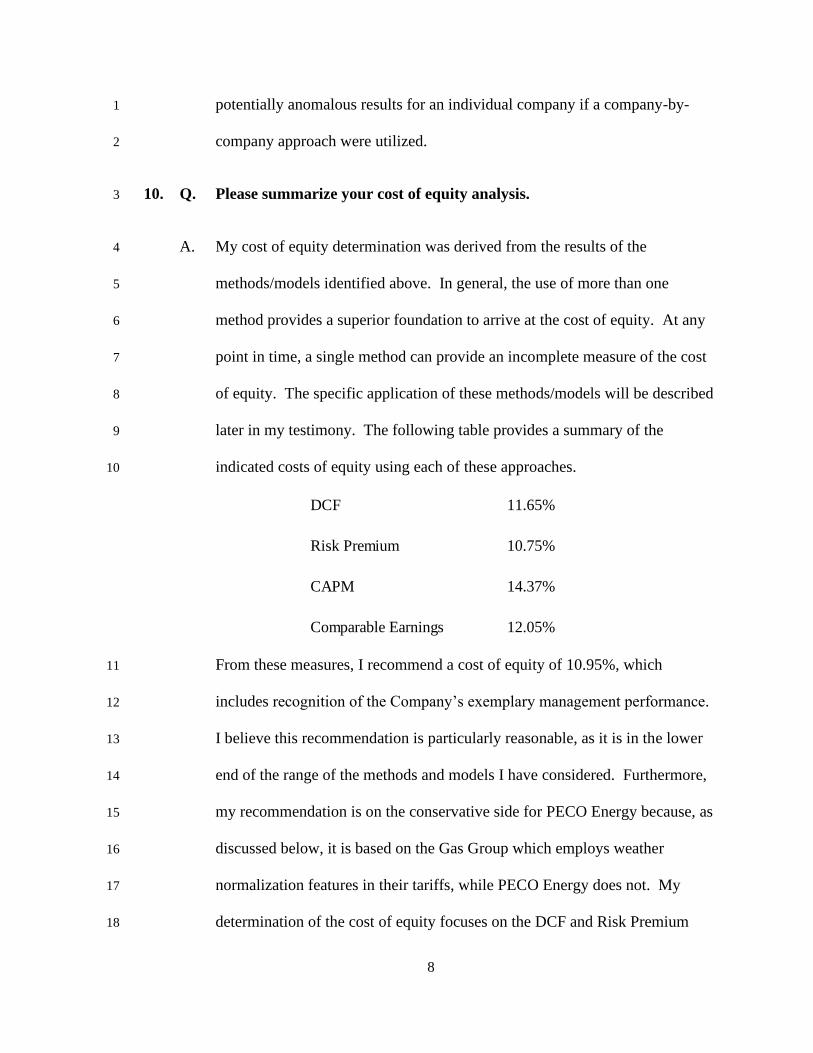
10. Q. Please summarize your cost of equity analysis. 3
A. My cost of equity determination was derived from the results of the 4
methods/models identified above. In general, the use of more than one 5
method provides a superior foundation to arrive at the cost of equity. At any 6
point in time, a single method can provide an incomplete measure of the cost 7
of equity. The specific application of these methods/models will be described 8
later in my testimony. The following table provides a summary of the 9
indicated costs of equity using each of these approaches. 10
DCF 11.65%
Risk Premium 10.75%
CAPM 14.37%
Comparable Earnings 12.05%
From these measures, I recommend a cost of equity of 10.95%, which 11
includes recognition of the Company’s exemplary management performance. 12
I believe this recommendation is particularly reasonable, as it is in the lower 13
end of the range of the methods and models I have considered. Furthermore, 14
my recommendation is on the conservative side for PECO Energy because, as 15
discussed below, it is based on the Gas Group which employs weather 16
normalization features in their tariffs, while PECO Energy does not. My 17
determination of the cost of equity focuses on the DCF and Risk Premium 18
9
approaches that, when averaged, indicate a return of 11.20% (10.75% + 1
11.65% = 22.40% ÷ 2). Averaging the results gives equal weight to the Risk 2
Premium and DCF results. My 10.95% cost of equity recommendation 3
includes 10 basis points or 0.10% recognition for the exemplary performance 4
of the Company’s management and falls within the range of 10.75% to 5
11.20% indicated above. Mr. Bradley’s testimony in PECO Energy Statement 6
No. 1 demonstrates that the Company’s superior customer service and 7
management effectiveness. To obtain new capital to support an expanded 8
construction program and retain existing capital, the rate of return on common 9
equity must be high enough to satisfy investors’ requirements. Along these 10
lines, the Company is spending considerable amounts of new capital, which 11
are large by historical standards, that will put a strain on financial 12
performance in the short run. In recognition of its performance, the Company 13
should be granted an opportunity to earn a 10.95% rate of return on common 14
equity. 15
II. NATURAL GAS RISK FACTORS 16
11. Q. What factors currently affect the business risk of natural gas utilities? 17
A. Gas utilities face risks arising from competition from other energy sources, the 18
purveyors of those sources and natural gas, economic regulation, the business 19
cycle, and customer usage patterns. Natural gas utilities have focused 20
increased attention on safety and reliability issues and on conservation. In 21
10
order to address these issues, natural gas companies are now allocating more 1
of their resources to addressing aging infrastructure issues. 2
12. Q. Are there other features of the Company’s business that should be 3
considered when assessing the Company’s risk? 4
A. Yes. Most of the Company’s residential customers use natural gas for space 5
heating purposes. Indeed, 89% of residential throughput is to customers with 6
natural gas space heating. This indicates that the energy requirements of a 7
large proportion of the Company’s residential customers are significantly 8
influenced by temperature conditions over which the Company has absolutely 9
no control. It is noteworthy that all of the companies that comprise the Gas 10
Group have some form of weather normalization feature in their tariffs. If 11
weather patterns in the future do not align with rate case test period data, a 12
weather normalization feature enables a company to adjust its revenue 13
collections to account for those variations. As PECO Energy has no such 14
provision in its gas tariff, the Company is exposed to more risk than the Gas 15
Group. With more risk, its return on equity should be higher than that 16
indicated for the Gas Group because investors’ return expectations for the Gas 17
Group companies reflect the risk mitigation attributes of weather 18
normalization. 19
In addition, PECO Energy’s ten largest volume customers, which account 20
for 10.9 million cubic feet of throughput, are engaged in the manufacturing, 21
pharmaceuticals, food processing, health care, and electric generation 22
(including cogeneration) businesses. Changes in the business environment 23
11
can negatively affect these companies, and, in that way, cause material 1
reductions in throughput on PECO Energy’s distribution system. This risk is 2
especially apparent in this time of economic uncertainty attributed to inflation, 3
supply-side issues, and global geopolitical situations. Additionally, large 4
volume users, which predominantly use transportation service, may be located 5
close enough to interstate pipelines to take gas directly from those sources and 6
bypass the local distribution company (“LDC”) entirely. The Company has 7
identified customers with combined annual throughput of approximately 8.4 8
million cubic feet (“MCF”) of gas that have the potential to bypass the 9
Company’s distribution system. Because a large part of PECO Energy’s 10
distribution revenue recovers fixed costs, which the Company continues to 11
bear even if a customer leaves the system, the loss of 8.4 million MCF of 12
throughput would impose a significant amount of uncompensated fixed costs 13
that PECO Energy would not have the opportunity to recover until it could 14
complete another base rate case. 15
13. Q. Can the Company’s construction program affect its risk profile? 16
A. Yes. The Company must undertake substantial investments to maintain and 17
upgrade existing facilities in its service territory to ensure safe and reliable 18
service to its customers. In particular, the rehabilitation of the Company’s 19
infrastructure requires it to invest capital without adding any new customers 20
and without increasing sales to existing customers. In short, infrastructure 21
rehabilitation increases fixed costs without an attendant increase in revenues. 22
Moreover, the Company is confronting significant levels of infrastructure 23

12
investment. For example, at year-end 2020, 879 miles (or approximately 1
13%) of the Company’s distribution system consisted of cast iron and ductile 2
iron pipe and steel pipe that is not cathodically protected and is, therefore, 3
susceptible to corrosion. These are all considered vulnerable materials that 4
will need to be replaced. Also, 16,731 (or approximately 4%) of the 5
Company’s services were constructed of unprotected steel. The Company 6
projects that its construction expenditures will approximate $7,457 million 7
during the period 2022-2026, which represents approximately 67% ($7,457 8
million ÷ $11,117 million) of its net utility plant as of December 31, 2021. Of 9
these amounts, construction expenditures for the gas division are expected to 10
be $1,757 million during the period 2022-2026. 11
14. Q. How should the Commission respond to the issues facing natural gas 12
utilities in general and PECO Energy in particular? 13
A. The Commission should recognize and take into account the high-risk profile 14
of PECO Energy’s Gas Division and its future capital requirements in 15
determining the cost of equity for the Company. A fair rate of return is key to 16
PECO Energy maintaining a financial profile that will provide it with the 17
ability to raise the capital necessary to meet its capital needs on reasonable 18
terms. 19
13
III. FUNDAMENTAL RISK ANALYSIS 1
15. Q. Is it necessary to conduct a fundamental risk analysis to provide a 2
framework for a determination of a utility’s cost of equity? 3
A. Yes, it is. It is necessary to establish a company’s relative risk position within 4
its industry through a fundamental analysis of various quantitative and 5
qualitative factors that bear upon investors’ assessment of overall risk. The 6
qualitative factors that bear upon Company risk have already been discussed. 7
The quantitative risk analysis follows. The items that influence investors’ 8
evaluation of risk and their required returns were described above. For this 9
purpose, I compared the Company to the S&P Public Utilities, an industry-10
wide proxy consisting of various regulated businesses, and to the Gas Group. 11
16. Q. What are the components of the S&P Public Utilities? 12
A. The S&P Public Utilities is a widely recognized index that is comprised of 13
electric power and natural gas companies. These companies are identified on 14
page 3 of Schedule 4. 15
17. Q. What companies comprise the Gas Group? 16
A. My Gas Group consists of the following companies: Atmos Energy Corp., 17
Chesapeake Utilities Corporation, New Jersey Resources Corp., NiSource, 18
Inc., Northwest Natural Holding Co., ONE Gas, Inc., Southwest Gas 19
Holdings, and Spire, Inc. 20

14
18. Q. Is knowledge of a utility’s bond rating an important factor in assessing its 1
risk and cost of capital? 2
A. Yes. Knowledge of a company’s credit quality rating is important because the 3
cost of each type of capital is directly related to the associated risk of the firm. 4
So, while a company’s credit quality risk is shown directly by the rating and 5
yield on its bonds, these relative risk assessments also bear upon the cost of 6
equity. This is because a firm’s cost of equity is represented by its borrowing 7
cost, plus compensation, to recognize the higher risk of an equity investment 8
compared to debt. 9
19. Q. How do the credit quality ratings compare for the Company, the Gas 10
Group, and the S&P Public Utilities? 11
A. Presently, the Company’s Long Term (“LT”) issuer credit quality rating is A2 12
from Moody’s Investors Service (“Moody’s”) and the corporate credit rating 13
(“CCR”) is BBB+ from S&P. The ratings represent the LT issuer rating by 14
Moody’s and CCR from S&P, which focuses upon the credit quality of the 15
issuer of the debt rather than upon the debt obligation itself. For the Gas 16
Group, the average LT issuer rating is A3 by Moody’s and A- by S&P, as 17
displayed on page 2 of Schedule 3. For the S&P Public Utilities, the average 18
credit quality rating is A3 by Moody’s and BBB+ by S&P, as displayed on 19
page 3 of Schedule 4. Many of the financial indicators that I will 20
subsequently discuss are considered during the rating process. 21
15
20. Q. How do the financial data compare for the Company, the Gas Group, and 1
the S&P Public Utilities? 2
A. The broad categories of financial data that I will discuss are shown on 3
Schedules 2, 3, and 4. The data cover the five-year period from 2016-2020. I 4
obtained financial data for PECO Energy from the S&P Utility Compustat 5
data base, which, in turn, was based on the financial statements in PECO 6
Energy’s SEC Forms 10-K. Those data include the results of operations of the 7
Company’s natural gas distribution, electric distribution and transmission 8
businesses. While it is possible to analyze the operations of the Gas Division 9
for items “above the line” (i.e., net operating income), most of the financial 10
data that I considered involved ratios that include interest expense, investor-11
provided capitalization, and cash-flow components that are not separately 12
reported for the Gas Division. Hence, my fundamental analysis is based on 13
PECO Energy’s combined operations. The important categories of relative 14
risk may be summarized as follows: 15
Size. In terms of capitalization, the Company is larger than the 16
average size of the Gas Group, and much smaller than the average size of the 17
S&P Public Utilities. All other things being equal, a smaller company is 18
riskier than a larger company because a given change in revenue and expense 19
has a proportionately greater impact on a small firm. As I will demonstrate 20
later, the size of a firm can impact its cost of equity. This is the case for 21
PECO Energy and the Gas Group as compared to the S&P Public Utilities. 22
16
Market Ratios. Market-based financial ratios, such as earnings/price 1
ratios and dividend yields, provide a partial measure of the investor-required 2
cost of equity. If all other factors are equal, investors will require a higher 3
rate of return for companies that exhibit greater risk. That is to say, a firm that 4
investors perceive to have higher risks will experience a lower price per share 5
in relation to expected earnings.2 6
There are no market ratios available for the Company because its 7
stock is owned by Exelon. The five-year average price-earnings (“P-E”) 8
multiple was somewhat higher for the Gas Group as compared to the S&P 9
Public Utilities. The five-year average dividend yield was lower for the Gas 10
Group as compared to the S&P Public Utilities. The five-year average 11
market-to-book ratio was fairly similar for the Gas Group and the S&P Public 12
Utilities. 13
Common Equity Ratio. The level of financial risk is measured by 14
the proportion of long-term debt and other senior capital that is contained in a 15
company’s capitalization. Financial risk is also analyzed by comparing 16
common equity ratios (the complement of the ratio of debt and other senior 17
capital). A firm with a higher common equity ratio has lower financial risk, 18
while a firm with a lower common equity ratio has higher financial risk. The 19
five-year average common equity ratios, based on permanent capital, were 20
54.0% for PECO Energy, 52.6% for the Gas Group, and 41.3% for the S&P 21
2 For example, two otherwise similarly situated firms each reporting $1.00 in earnings per share
would have different market prices at varying levels of risk (i.e., the firm with a higher level of risk will have
a lower share value, while the firm with a lower risk profile will have a higher share value).
17
Public Utilities. The Company’s common equity ratio was higher than the 1
Gas Group, thereby indicating somewhat lower financial risk. However, for 2
the purpose of this case, the Company’s common equity ratio is within the 3
range of other gas distribution utilities. 4
Return on Book Equity. Greater variability (i.e., uncertainty) of a 5
firm’s earned returns signifies relatively greater levels of risk, as shown by the 6
coefficient of variation (standard deviation ÷ mean) of the rate of return on 7
book common equity. The higher the coefficients of variation, the greater 8
degree of variability. For the five-year period, the coefficients of variation 9
were 0.098 (1.2% ÷ 12.3%) for the Company, 0.105 (1.0% ÷ 9.5%) for the 10
Gas Group, and 0.039 (0.4% ÷ 10.3%) for the S&P Public Utilities. The 11
variability of the Company’s rates of return was fairly similar to the Gas 12
Group and higher than the S&P Public Utilities. High variability signifies 13
higher risk. 14
Operating Ratios. I have also compared operating ratios (the 15
percentage of revenues consumed by operating expense, depreciation, and 16
taxes other than income).3 The five-year average operating ratios were 78.6% 17
for the Company, 83.2% for the Gas Group, and 78.8% for the S&P Public 18
Utilities. The Company’s operating ratios were somewhat lower than the Gas 19
Group, thereby indicating slightly lower risk. The operating ratios were 20
similar for PECO Energy and the S&P Public Utilities. 21
3 The complement of the operating ratio is the operating margin that provides a measure of
profitability. The higher the operating ratio, the lower the operating margin.
18
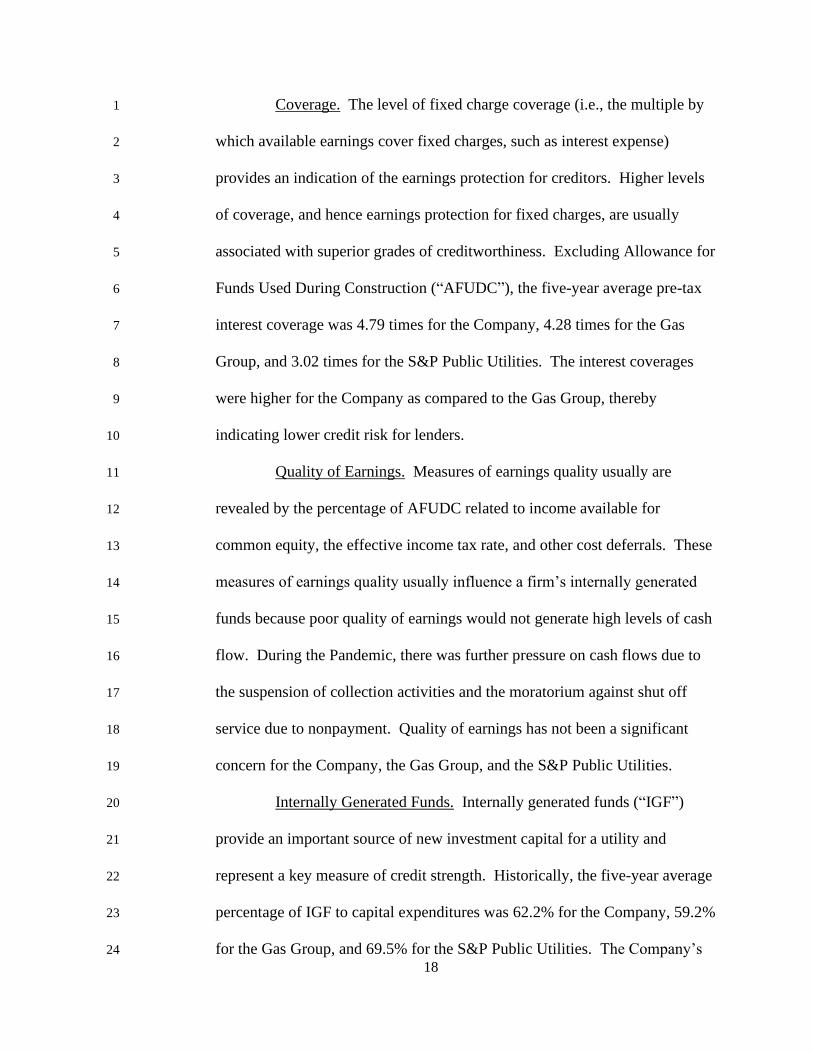
Coverage. The level of fixed charge coverage (i.e., the multiple by 1
which available earnings cover fixed charges, such as interest expense) 2
provides an indication of the earnings protection for creditors. Higher levels 3
of coverage, and hence earnings protection for fixed charges, are usually 4
associated with superior grades of creditworthiness. Excluding Allowance for 5
Funds Used During Construction (“AFUDC”), the five-year average pre-tax 6
interest coverage was 4.79 times for the Company, 4.28 times for the Gas 7
Group, and 3.02 times for the S&P Public Utilities. The interest coverages 8
were higher for the Company as compared to the Gas Group, thereby 9
indicating lower credit risk for lenders. 10
Quality of Earnings. Measures of earnings quality usually are 11
revealed by the percentage of AFUDC related to income available for 12
common equity, the effective income tax rate, and other cost deferrals. These 13
measures of earnings quality usually influence a firm’s internally generated 14
funds because poor quality of earnings would not generate high levels of cash 15
flow. During the Pandemic, there was further pressure on cash flows due to 16
the suspension of collection activities and the moratorium against shut off 17
service due to nonpayment. Quality of earnings has not been a significant 18
concern for the Company, the Gas Group, and the S&P Public Utilities. 19
Internally Generated Funds. Internally generated funds (“IGF”) 20
provide an important source of new investment capital for a utility and 21
represent a key measure of credit strength. Historically, the five-year average 22
percentage of IGF to capital expenditures was 62.2% for the Company, 59.2% 23
for the Gas Group, and 69.5% for the S&P Public Utilities. The Company’s 24
19
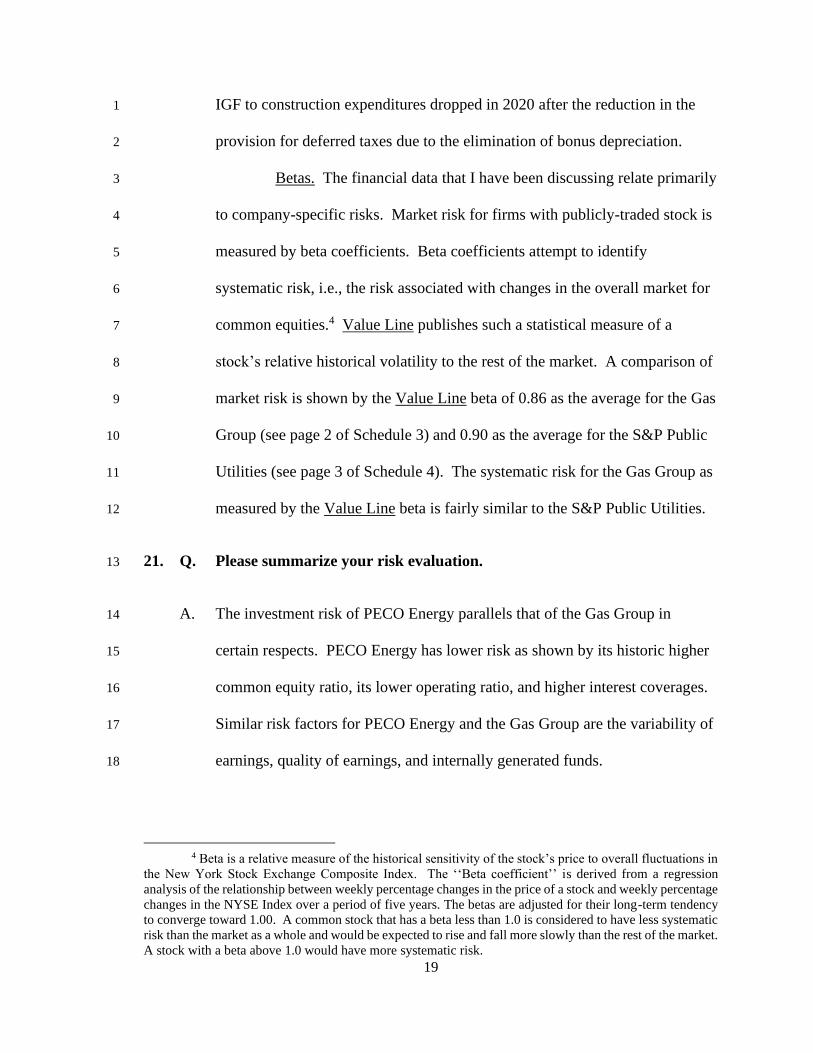
IGF to construction expenditures dropped in 2020 after the reduction in the 1
provision for deferred taxes due to the elimination of bonus depreciation. 2
Betas. The financial data that I have been discussing relate primarily 3
to company-specific risks. Market risk for firms with publicly-traded stock is 4
measured by beta coefficients. Beta coefficients attempt to identify 5
systematic risk, i.e., the risk associated with changes in the overall market for 6
common equities.4 Value Line publishes such a statistical measure of a 7
stock’s relative historical volatility to the rest of the market. A comparison of 8
market risk is shown by the Value Line beta of 0.86 as the average for the Gas 9
Group (see page 2 of Schedule 3) and 0.90 as the average for the S&P Public 10
Utilities (see page 3 of Schedule 4). The systematic risk for the Gas Group as 11
measured by the Value Line beta is fairly similar to the S&P Public Utilities. 12
21. Q. Please summarize your risk evaluation. 13
A. The investment risk of PECO Energy parallels that of the Gas Group in 14
certain respects. PECO Energy has lower risk as shown by its historic higher 15
common equity ratio, its lower operating ratio, and higher interest coverages. 16
Similar risk factors for PECO Energy and the Gas Group are the variability of 17
earnings, quality of earnings, and internally generated funds. 18
4 Beta is a relative measure of the historical sensitivity of the stock’s price to overall fluctuations in
the New York Stock Exchange Composite Index. The ‘‘Beta coefficient’’ is derived from a regression
analysis of the relationship between weekly percentage changes in the price of a stock and weekly percentage
changes in the NYSE Index over a period of five years. The betas are adjusted for their long-term tendency
to converge toward 1.00. A common stock that has a beta less than 1.0 is considered to have less systematic
risk than the market as a whole and would be expected to rise and fall more slowly than the rest of the market.
A stock with a beta above 1.0 would have more systematic risk.

20
22. Q. Based on your analysis, does the Gas Group provide a reasonable basis to 1
measure the Company’s cost of equity for this case? 2
A. Yes. On balance, the risk factors average out, indicating that the cost of 3
equity for the Gas Group provides a reasonable basis for measuring the 4
Company’s cost of equity. 5
IV. CAPITAL STRUCTURE RATIOS 6
23. Q. Please explain the selection of capital structure ratios for PECO Energy 7
in this case. 8
A. The capital structure ratios of PECO Energy should be employed for rate of 9
return purposes. If the operating public utility raises its own debt directly in 10
the capital markets, as PECO Energy does, the operating public utility’s own 11
capital structure ratios should be used to determine its overall rate of return. 12
Additionally, if the Company’s actual capital structure ratios are used, as they 13
should be, then consistency requires that the embedded cost rates associated 14
with the senior securities reflected in those capital structure ratios should also 15
be employed. 16
24. Q. Does Schedule 5 provide the Company’s capitalization and capital 17
structure ratios? 18
A. Yes. The capitalization and capital structure ratios at December 31, 2021, 19
2022 and 2023 correspond with the end of the historic test year (“HTY”), 20
future test year (“FTY”), and FPFTY in this case. The capitalization and 21
21
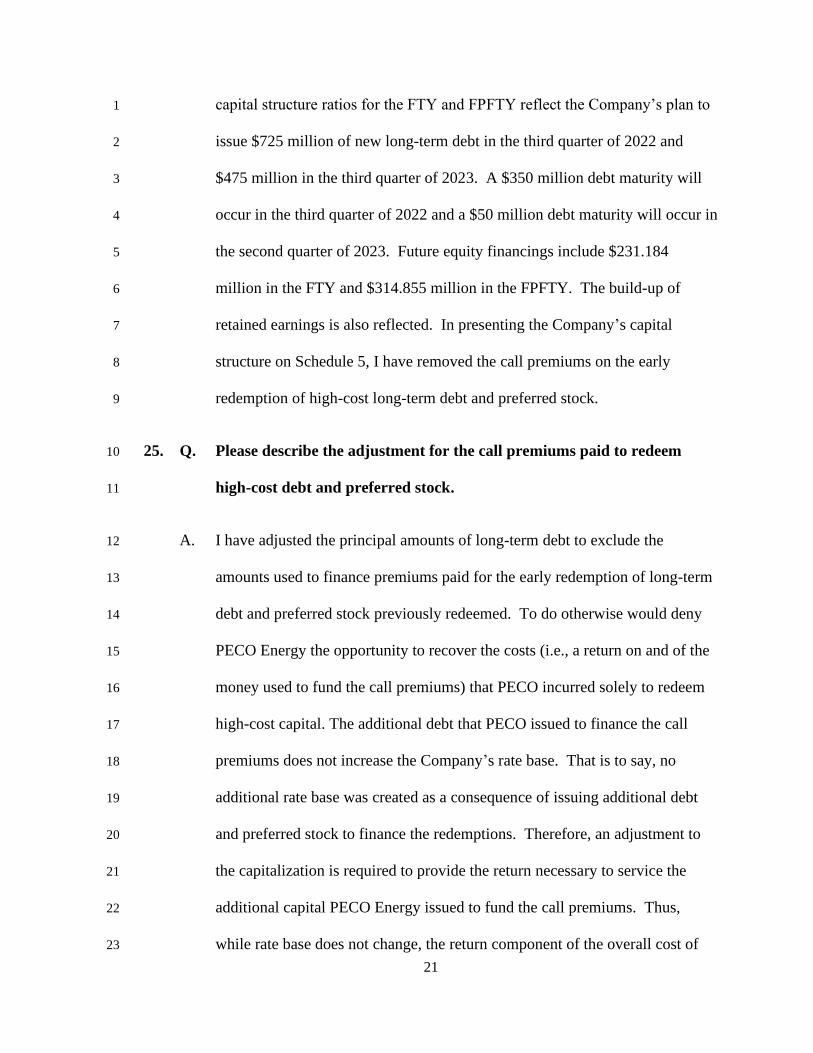
capital structure ratios for the FTY and FPFTY reflect the Company’s plan to 1
issue $725 million of new long-term debt in the third quarter of 2022 and 2
$475 million in the third quarter of 2023. A $350 million debt maturity will 3
occur in the third quarter of 2022 and a $50 million debt maturity will occur in 4
the second quarter of 2023. Future equity financings include $231.184 5
million in the FTY and $314.855 million in the FPFTY. The build-up of 6
retained earnings is also reflected. In presenting the Company’s capital 7
structure on Schedule 5, I have removed the call premiums on the early 8
redemption of high-cost long-term debt and preferred stock. 9
25. Q. Please describe the adjustment for the call premiums paid to redeem 10
high-cost debt and preferred stock. 11
A. I have adjusted the principal amounts of long-term debt to exclude the 12
amounts used to finance premiums paid for the early redemption of long-term 13
debt and preferred stock previously redeemed. To do otherwise would deny 14
PECO Energy the opportunity to recover the costs (i.e., a return on and of the 15
money used to fund the call premiums) that PECO incurred solely to redeem 16
high-cost capital. The additional debt that PECO issued to finance the call 17
premiums does not increase the Company’s rate base. That is to say, no 18
additional rate base was created as a consequence of issuing additional debt 19
and preferred stock to finance the redemptions. Therefore, an adjustment to 20
the capitalization is required to provide the return necessary to service the 21
additional capital PECO Energy issued to fund the call premiums. Thus, 22
while rate base does not change, the return component of the overall cost of 23

22
capital reflects an adjustment that, when applied to the rate base, furnishes the 1
return necessary to pay the cost of the incremental capitalization that 2
supported the call premiums paid by PECO Energy. 3
The adjustment for call premiums is appropriate because customers 4
receive all of the cost savings, in the form of a lower overall rate of return, 5
produced by refinancing higher-cost debt and preferred stock, while PECO 6
Energy is simply made whole by recovering the actual costs it incurred to 7
provide these benefits to its customers. In order to produce the savings that 8
resulted from redeeming higher-cost debt and preferred stock, the Company 9
paid to the holders of that debt and preferred stock a premium to surrender 10
their securities prior to maturity. Those premiums represented an investment 11
made by PECO Energy to reduce its overall cost of capital. Because the 12
reduced interest costs and preferred stock dividends are reflected in the lower 13
cost of capital to customers, it is proper that the Company recover the costs 14
incurred to produce these savings, which consist of a return of and a return on 15
the unamortized premiums. Adjusting the principal amounts in the capital 16
structure provides for the appropriate cost recovery by providing a return on 17
the funds used to pay the premiums, which is reflected as an increment 18
included in the embedded cost rates of PECO’s total capital. 19
26. Q. Should short-term debt be included in the capital structure for rate of 20
return purposes? 21
A. There is no need to consider short-term debt in the capital structure because 22
the amount of short-term debt is well below the construction work in progress 23
23
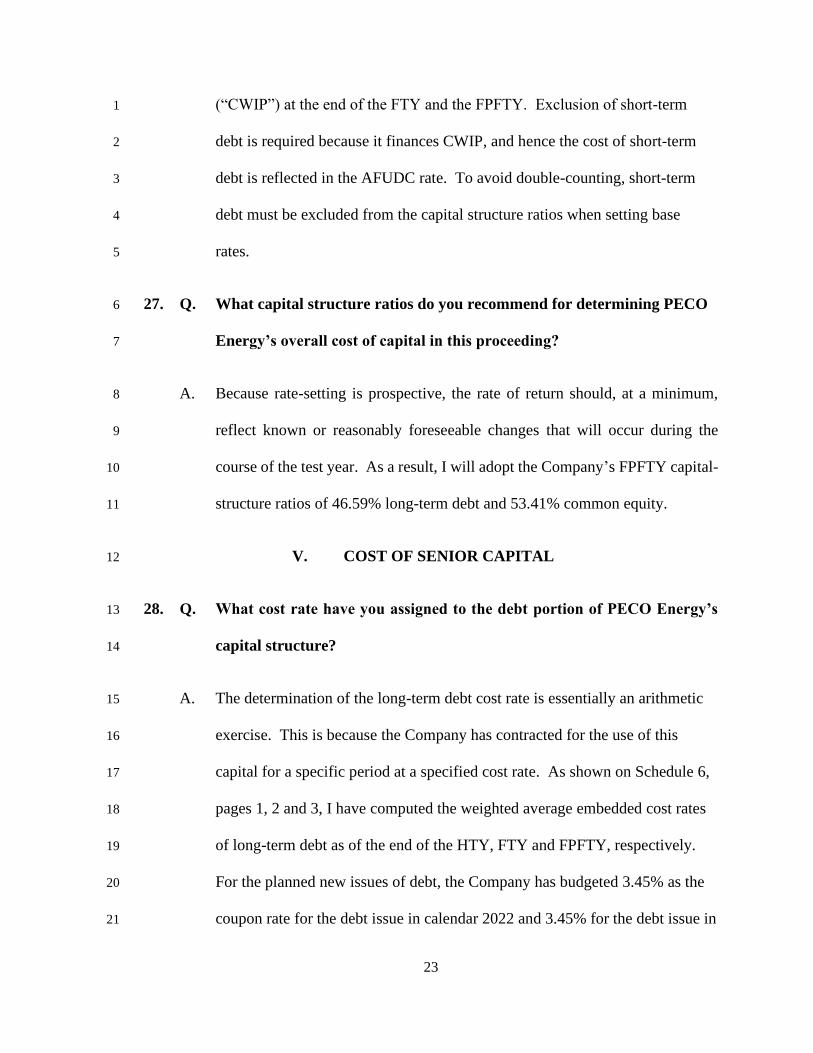
(“CWIP”) at the end of the FTY and the FPFTY. Exclusion of short-term 1
debt is required because it finances CWIP, and hence the cost of short-term 2
debt is reflected in the AFUDC rate. To avoid double-counting, short-term 3
debt must be excluded from the capital structure ratios when setting base 4
rates. 5
27. Q. What capital structure ratios do you recommend for determining PECO 6
Energy’s overall cost of capital in this proceeding? 7
A. Because rate-setting is prospective, the rate of return should, at a minimum, 8
reflect known or reasonably foreseeable changes that will occur during the 9
course of the test year. As a result, I will adopt the Company’s FPFTY capital-10
structure ratios of 46.59% long-term debt and 53.41% common equity. 11
V. COST OF SENIOR CAPITAL 12
28. Q. What cost rate have you assigned to the debt portion of PECO Energy’s 13
capital structure? 14
A. The determination of the long-term debt cost rate is essentially an arithmetic 15
exercise. This is because the Company has contracted for the use of this 16
capital for a specific period at a specified cost rate. As shown on Schedule 6, 17
pages 1, 2 and 3, I have computed the weighted average embedded cost rates 18
of long-term debt as of the end of the HTY, FTY and FPFTY, respectively. 19
For the planned new issues of debt, the Company has budgeted 3.45% as the 20
coupon rate for the debt issue in calendar 2022 and 3.45% for the debt issue in 21

24
2023. The development of the individual effective cost rates for each series of 1
long-term debt, using the cost rate to maturity technique, is shown on 2
Schedule 6, page 4. The cost rate, or yield to maturity (“ytm”), is the rate of 3
discount that equates the present value of all future interest and principal 4
payments with the net proceeds of the bond. In my calculation of the 5
embedded cost of long-term debt, I have recognized the costs associated with 6
the Company’s early redemption of high cost debt. As previously explained, 7
it is necessary to compensate PECO Energy for the costs incurred to lower the 8
embedded debt cost rate, which reduces the cost of capital charged to 9
customers. 10
29. Q. What cost rate have you determined for the Company’s long-term debt? 11
A. I will adopt the 3.92% embedded cost of long-term debt as of December 31, 12
2023, as shown on Schedule 6, page 3. This rate is related to the amount of 13
long-term debt shown in the last three columns of Schedule 5, which provides 14
the basis for the 46.59% long-term debt ratio. 15
25
VI. COST OF EQUITY – GENERAL APPROACH 1
30. Q. Please describe how you determined the cost of equity for the Company. 2
A. Although my fundamental financial analysis provides the required framework 3
to establish the risk relationships among PECO, the Gas Group, and the S&P 4
Public Utilities, the cost of equity must be measured by standard financial 5
models that I identified above. Differences in risk traits, such as size, business 6
diversification, geographical diversity, regulatory policy, financial leverage, 7
and bond ratings must be considered when analyzing the cost of equity. 8
It is also important to reiterate that no one method or model of the 9
cost of equity can be applied in an isolated manner. Rather, informed 10
judgment must be used to take into consideration the relative risk traits of the 11
firm. It is for this reason that I have used more than one method to measure 12
the Company’s cost of equity. As I describe below, each of the methods used 13
to measure the cost of equity contains certain incomplete and/or overly 14
restrictive assumptions and constraints that are not optimal. Therefore, I favor 15
considering the results from a variety of methods. In this regard, I applied 16
each of the methods with data taken from the Gas Group and arrived at a cost 17
of equity of 10.95% for PECO, which includes an increment for exemplary 18
management performance. 19
26
VII. DISCOUNTED CASH FLOW 1
31. Q. Please describe the DCF model. 2
A. The DCF model seeks to explain the value of an asset as the present value of 3
future expected cash flows discounted at the appropriate risk-adjusted rate of 4
return. In its simplest form, the DCF-determined return on common stock 5
consists of a current cash (dividend) yield and future price appreciation 6
(growth) of the investment. The dividend discount equation is the familiar 7
DCF valuation model, which assumes that future dividends are systematically 8
related to one another by a constant growth rate. The DCF formula is derived 9
from the standard valuation model: P = D/(k-g), where P = price, D = 10
dividend, k = the cost of equity, and g = growth in cash flows. By rearranging 11
the terms, we obtain the familiar DCF equation: k= D/P + g. All of the terms 12
in the DCF equation represent investors’ assessment of expected future cash 13
flows that they will receive in relation to the value that they set for a share of 14
stock (P). The DCF equation is sometimes referred to as the “Gordon” 15
model.5 My DCF results are provided on Schedule 1, page 2, for the Gas 16
Group. The DCF return is 11.65% with the leverage adjustment and 10.20% 17
without the leverage adjustment for the Gas Group. The leverage adjustment 18
is discussed more fully below. 19
5 Although the popular application of the DCF model is often attributed to the work of Myron J.
Gordon in the mid-1950s, J.B. Williams exposited the DCF model in its present form nearly two decades
earlier.
27
Among the limitations of the model, there is a certain element of 1
circularity in the DCF method when applied in rate cases. This is because 2
investors’ expectations for the future depend upon regulatory decisions. In 3
turn, when regulators depend upon the DCF model to set the cost of equity, 4
they rely upon investor expectations that include an assessment of how 5
regulators will decide rate cases. Due to this circularity, the DCF model may 6
not fully reflect the true risk of a utility. Other limitations of the DCF include 7
the constant P-E multiple assertion that does not conform with actual stock 8
market performance. And, indeed, the FERC has moved to using multiple 9
methods for measuring the cost of equity due to the limitations of the DCF. 10
32. Q. What is the dividend yield component of a DCF analysis? 11
A. The dividend yield reveals the portion of investors’ cash flow that is generated 12
by the return provided by the dividends an investor receives. It is measured 13
by the dividends per share relative to the price per share. The DCF 14
methodology requires the use of an expected dividend yield to establish the 15
investor-required cost of equity. For the twelve months ended February 2022, 16
the monthly dividend yields are shown on Schedule 7. The month-end prices 17
were adjusted to reflect the buildup of the dividend in the price that has 18
occurred since the last ex-dividend date (i.e., the date by which a shareholder 19
must own the shares to be entitled to the dividend payment – usually about 20
two to three weeks prior to the actual payment). 21
For the twelve months ended February 2022, the average dividend 22
yield was 3.22% for the Gas Group based upon a calculation using annualized 23
28
dividend payments and adjusted month-end stock prices. The dividend yields 1
for the more recent six-month and three-month periods were 3.33% and 2
3.16%, respectively. For applying the DCF model, I have used the six-month 3
average dividend yield of 3.33% for the Gas Group. The use of this dividend 4
yield will reflect current capital costs while avoiding spot yields. For the 5
purpose of a DCF calculation, the average dividend yield must be adjusted to 6
reflect the prospective nature of the dividend payments, i.e., the higher 7
expected dividends for the future. Recall that the DCF is an expectational 8
model that must reflect investors’ anticipated cash flows. I have adjusted the 9
six-month average dividend yield in three different but generally accepted 10
manners and used the average of the three adjusted values as calculated in the 11
lower panel of data presented on Schedule 7.6 This adjustment adds twelve 12
basis points to the six-month average historical yield, thus producing the 13
3.45% adjusted dividend yield for the Gas Group. 14
33. Q. What factors influence investors’ growth expectations? 15
A. As noted previously, investors are interested principally in the dividend yield 16
and future growth of their investment (i.e., the price per share of the stock). 17
6 These adjustments are the 1/2 growth approach, the discrete approach, and the quarterly
approach. Under the 1/2 approach, the procedure to adjust the average dividend yield for the expectation of
a dividend increase during the initial investment period will be at a rate of one-half the growth component,
which assumes that half of the dividend payments will be at the expected higher rate during the initial
investment period. Under the discrete approach, the “g” in the DCF model reflects the discrete growth in
the quarterly dividend, which is required for the periodic form of the DCF to properly recognize that
dividends are expected to grow on a discrete basis. The quarterly approach takes into account that
investors have the opportunity to reinvest quarterly dividend receipts. Recognizing the compounding of the
periodic quarterly dividend payments (D0) results in this third DCF formulation. This DCF equation
provides no further recognition of growth in the quarterly dividend. A compounding of the quarterly
dividend yield recognizes the necessity for an adjusted dividend yield.
29
Future growth in earnings per share is the DCF model’s primary focus 1
because, under the model’s assumption that the P-E multiple remains constant, 2
the price per share of stock will grow at the same rate as earnings per share. A 3
growth rate analysis considers a variety of variables to reach a consensus of 4
prospective growth, including historical data and widely available analysts’ 5
forecasts of earnings, dividends, book value, and cash flow (all stated on a 6
per-share basis). A fundamental growth rate analysis is frequently based upon 7
internal growth (“b x r”), where “r” is the expected rate of return on common 8
equity and “b” is the retention rate (a fraction representing the proportion of 9
earnings not paid out as dividends). To be complete, the internal growth rate 10
should be modified to account for sales of new common stock (external 11
growth), which is represented by the formula s x v, where “s” is the number of 12
new common shares that the firm expects to issue and “v” is the value that 13
accrues to existing shareholders from selling stock at a price above book 14
value. Fundamental growth, which combines internal and external growth, 15
encompasses the factors that cause book value per share to grow over time. 16
Growth also can be expressed in multiple stages. This expression of 17
growth consists of an initial “growth” stage during which a firm enjoys 18
rapidly expanding markets, high profit margins, and abnormally high growth 19
in earnings per share. Thereafter, a firm enters a “transition” stage during 20
which fewer technological advances and increased product saturation begin to 21
reduce the growth rate and profit margins come under pressure. During the 22
“transition” stage, investment opportunities begin to mature, capital 23
requirements decline, and a firm begins to pay out a larger percentage of 24
30
earnings to shareholders. Finally, the mature or “steady-state” stage is 1
reached when a firm’s earnings growth, payout ratio, and return on equity 2
stabilize at levels where they remain for the life of a firm. The three stages of 3
growth assume a step-down of high initial growth to lower sustainable growth. 4
Even if these three stages of growth can be envisioned for a firm, the third 5
“steady-state” growth stage, which is assumed to remain fixed in perpetuity, 6
represents an unrealistic expectation because the three stages of growth can be 7
repeated. That is to say, the stages can be repeated where growth for a firm 8
ramps up and ramps down in cycles over time. For these reasons, there is no 9
need to analyze growth rates individually for each cycle, but rather to rely 10
upon analysts’ growth forecasts that are used by investors when pricing 11
common stocks. 12
34. Q. How did you determine an appropriate growth rate? 13
A. The growth rate used in a DCF calculation should measure investor 14
expectations. Investors consider both company-specific variables and overall 15
market sentiment (i.e., level of inflation rates, interest rates, economic 16
conditions, etc.) when balancing their capital gains expectations with their 17
dividend yield requirements. Investors are not influenced solely by a single 18
set of company-specific variables weighted in a formulaic manner. Therefore, 19
all relevant growth rate indicators should be evaluated using a variety of 20
techniques when formulating a judgment of investor-expected growth. 21
31
35. Q. What data for the Gas Group have you considered in your growth rate 1
analysis? 2
A. I considered the growth in the financial variables shown on Schedules 8 and 9, 3
which reflect historical (Schedule 8) and projected (Schedule 9) rates of 4
growth in earnings per share, dividends per share, book value per share, and 5
cash flow per share for the Gas Group. While analysts will review all 6
measures of growth, as I have done, earnings per share growth directly 7
influences the expectations of investors for the future performance of utility 8
stocks. Forecasts of earnings growth are required because the DCF model is 9
forward-looking, and, with the constant P-E multiple and constant payout ratio 10
that the DCF model assumes, all other measures of growth will mirror 11
earnings growth. The historical growth rates were obtained from the Value 12
Line publication that provides this data. While historical data cannot be 13
ignored, they are much less significant when applying the DCF model than 14
projections of future growth. Investors cannot purchase the past earnings of a 15
utility. To the contrary they are only entitled to future earnings, which are the 16
focus of growth projections. Furthermore, if significant weight is assigned to 17
historical performance, the historical data are double-counted because they are 18
already factored into analysts’ forecasts of earnings growth. 19
36. Q. Is a five-year investment horizon associated with the analysts’ forecasts 20
consistent with the traditional DCF model? 21
A. Yes, it is. Although the constant form of the DCF model assumes an infinite 22
32
stream of cash flows, investors do not expect to hold an investment 1
indefinitely. Rather than viewing the DCF in the context of an endless stream 2
of growing dividends (e.g., a century of cash flows), the growth in the share 3
value (i.e., capital appreciation, or capital gains yield) is most relevant to 4
investors’ total return expectations. Hence, the sale price of a stock can be 5
viewed as a liquidating dividend that can be discounted along with the annual 6
dividend receipts during the investment-holding period to arrive at the 7
investors’ expected return. The growth in the price per share will equal the 8
growth in earnings per share if, as the DCF model assumes, there is no change 9
in the P-E multiple. As such, my company-specific growth analysis, which 10
focuses principally upon five-year forecasts of earnings per share growth, 11
conforms with the type of analysis that influences investors’ expectations of 12
their actual total return. Moreover, academic research also focuses on five-13
year growth rates specifically because market outcomes occurring over that 14
investment horizon are what influence stock prices. Indeed, if investors 15
required forecasts beyond five years in order to properly value common 16
stocks, then it would be reasonable to expect that some investment advisory 17
service would begin publishing that information for individual stocks in order 18
to meet the demands of the marketplace. The absence of such a publication 19
suggests that there is no market for this information because investors do not 20
require forecasts for an infinite series of future data points in order to make 21
informed decisions to purchase and sell stocks. 22
33
37. Q. What are the analysts’ forecasts of future growth that you considered? 1
A. Schedule 9 provides projected earnings per share growth rates taken from 2
analysts’ five-year forecasts compiled by IBES/First Call, Zacks, and Value 3
Line. These are all reliable authorities of projected growth that investors use 4
to make buy, sell, and hold decisions. The IBES/First Call and Zacks 5
estimates are obtained from the Internet and are widely available to investors. 6
The growth rates reported by IBES/First Call and Zacks are consensus 7
forecasts taken from a survey of analysts that make growth projections for 8
these companies. Notably, First Call’s earnings forecasts are frequently 9
quoted in the financial press. The Value Line forecasts also are widely 10
available to investors and can be obtained by subscription or free of charge at 11
most public and collegiate libraries. The IBES/First Call and Zacks forecasts 12
are limited to earnings per share growth, while Value Line makes projections 13
of other financial variables. The Value Line forecasts of dividends per share, 14
book value per share, and cash flow per share for the Gas Group are also 15
included on Schedule 9. 16
38. Q. What are the projected growth rates published by the sources you 17
discussed? 18
A. Schedule 9 shows the prospective five-year earnings per share growth rates 19
projected for the Gas Group by IBES/First Call (4.83%), Zacks (6.00%), and 20
Value Line (7.44%). 21

34
39. Q. Are certain growth rate forecasts entitled to greater weight in developing 1
a growth rate for use in the DCF model? 2
A. Yes. While a variety of factors should be examined to reach a reasonable 3
conclusion on the DCF growth rate, growth in earnings per share should 4
receive the greatest emphasis. Growth in earnings per share is the primary 5
determinant of investors’ expectations of the total returns they will obtain 6
from stocks because the capital gains yield (i.e., price appreciation) will track 7
earnings growth if the P-E multiple remains constant, as the DCF model 8
assumes. Moreover, earnings per share (derived from net income) are the 9
source of dividend payments and are the primary driver of retention growth 10
and its surrogate, i.e., book value per share growth. As such, under these 11
circumstances, greater emphasis must be placed upon projected earnings per 12
share growth. In fact, Professor Gordon, the foremost proponent of the use of 13
the DCF model in setting utility rates, concluded that the best measure of 14
growth for use in the DCF model is a forecast of earnings per-share growth.7 15
Consistent with Professor Gordon’s findings, projections of earnings per share 16
growth, such as those published by IBES/First Call, Zacks, and Value Line, 17
provide the best indication of investor expectations. 18
7 Gordon, Gordon & Gould, “Choice Among Methods of Estimating Share Yield,” The Journal of
Portfolio Management (Spring 1989).

35
40. Q. What growth rate do you use in your DCF model? 1
A. The forecasts shown on Schedule 9 for the Gas Group exhibit a range of 2
average earnings per share growth rates from 4.83% to 7.44%. DCF growth 3
rates should not be established by mathematical formulation, and I have not 4
done so. In my opinion, a growth rate of 6.75% is a reasonable estimate of 5
investor-expected growth for the Gas Group. This value is within the array of 6
analysts’ forecasts of five-year earnings per share growth rates. The 7
reasonableness of this growth rate is also supported by the expected 8
continuation of gas utility infrastructure spending. 9
41. Q. Are the dividend yield and growth components of the DCF adequate to 10
accurately depict the rate of return on common equity when it is used to 11
calculate a utility’s weighted average overall cost of capital? 12
A. The components of the DCF model are adequate for that purpose only if the 13
capital structure ratios are measured by the market value of debt and equity. 14
In the case of the Gas Group, average capital structure ratios are 40.89% long-15
term debt, 0.45% preferred stock, and 58.66% common equity, as shown on 16
Schedule 10. If book values are used to compute the capital structure ratios, 17
then a leverage adjustment is required. 18
42. Q. What is a leverage adjustment? 19
A. If a firm’s capitalization, as measured by its stock price, diverges from its 20
capitalization, measured at book value, the potential exists for a financial risk 21
36
difference. Such a risk difference arises because a market-valued 1
capitalization contains more equity and less debt than a book-value 2
capitalization and, therefore, has less risk than the book-value capitalization. 3
A leverage adjustment properly accounts for the risk differential between 4
market-value and book-value capital structures. 5
43. Q. Why is a leverage adjustment necessary? 6
A. In order to make the DCF results relevant to the capitalization measured at 7
book value (as is done for rate setting purposes), the market-derived cost rate 8
must be adjusted to account for this difference in financial risk. The only 9
perspective that is important to investors is the return that they can realize on 10
the market value of their investment. As I have measured the DCF, the simple 11
yield (D/P) plus growth (g) provides a return applicable strictly to the price 12
(P) that an investor is willing to pay for a share of stock. The need for the 13
leverage adjustment arises when the results of the DCF model (k) are to be 14
applied to a capital structure that is different from the capital structure 15
indicated by the market price (P). From the market perspective, the financial 16
risk of the Gas Group is accurately measured by the capital structure ratios 17
calculated from the market-valued capitalization of a firm. If the ratemaking 18
process utilized the market capitalization ratios, then no additional analysis or 19
adjustment would be required, and the simple yield (D/P) plus growth (g) 20
components of the DCF would satisfy the financial risk associated with the 21
market value of the equity capitalization. Because the ratemaking process 22
uses ratios calculated from a firm’s book value capitalization, further analysis 23
37
is required to synchronize the financial risk of the book capitalization with the 1
required return on the book value of the firm’s equity. This adjustment is 2
developed through precise mathematical calculations, using well-recognized 3
analytical procedures that are widely accepted in the financial literature. To 4
arrive at that return, the rate of return on common equity is the unleveraged 5
cost of capital (or equity return at 100% equity) plus one or more terms 6
reflecting the increase in financial risk resulting from the use of leverage in 7
the capital structure. The calculations presented in the lower panel of data 8
shown on Schedule 10, under the heading “M&M,”8 provide a return of 9
7.70% when applicable to a capital structure with 100% common equity. 10
44. Q. Are there specific factors that influence market-to-book ratios that 11
determine whether the leverage adjustment should be made? 12
A. No. The leverage adjustment is not intended, nor was it designed, to address 13
the reasons that stock prices vary from book value. Hence, any observations 14
concerning market prices relative to book value are not on point. The 15
leverage adjustment deals with the issue of financial risk and does not 16
transform the DCF result to a book value return through a market-to-book 17
adjustment. Again, the leverage adjustment that I propose is based on the 18
fundamental financial precept that the cost of equity is equal to the rate of 19
return for an unleveraged firm (i.e., where the overall rate of return equates to 20
8 Franco Modigliani and Merton H. Miller, “The Cost of Capital, Corporation Finance, and the
Theory of Investments,” American Economic Review, June 1958, at 261-97. Franco Modigliani and
Merton H. Miller, “Taxes and the Cost of Capital: A Correction,” American Economic Review, June 1963,
at 433-43.
38
the cost of equity with a capital structure that contains 100% equity) plus the 1
additional return required for introducing debt and/or preferred stock leverage 2
into the capital structure. 3
Further, as noted previously, the relatively high market prices of 4
utility stocks cannot be attributed solely to the notion that these companies are 5
expected to earn a return on the book value of equity that differs from their 6
cost of equity determined from stock market prices. Stock prices above book 7
value are common for utility stocks, and indeed the stock prices of non-8
regulated companies exceed book values by even greater margins. It is 9
difficult to accept that the vast majority of all firms operating in our economy 10
are generating returns far in excess of their cost of capital. Certainly, in our 11
free-market economy, competition should contain such “excesses” if they 12
actually exist. 13
Finally, the leverage adjustment adds stability to the final DCF cost 14
rate. That is to say, as the market capitalization increases relative to its book 15
value, the leverage adjustment increases while the simple yield (D/P) plus 16
growth (g) result declines. The reverse is also true: when the market 17
capitalization declines, the leverage adjustment also declines as the simple 18
yield (D/P) plus growth (g) result increases. 19
39
45. Q. Is the leverage adjustment that you propose designed to transform the 1
market return into one that is designed to produce a particular market-2
to-book ratio? 3
A. No, it is not. What I label a “leverage adjustment” is merely a convenient way 4
of showing the amount that must be added to (or subtracted from) the result of 5
the simple DCF model (i.e., D/P + g) when the DCF return applies to a capital 6
structure used for ratemaking that is computed with book-value weighting 7
rather than market-value weighting. Although I specify a separate factor, 8
which I call the leverage adjustment, there is no need to do so other than to 9
identify this factor. If I were to express my return solely in the context of the 10
book value weighting that we use to calculate the weighted average cost of 11
capital and ignore the familiar D/P + g expression entirely, then a separate 12
element in the DCF cost of equity determination would not be needed to 13
reflect the differential in financial leverage between a market-value and book-14
value capitalization. As shown in the bottom panel of data on Schedule 10, 15
the equity return applicable to the book value common equity ratio is equal to 16
7.70%, which is the return for the Gas Group appropriate for a capital 17
structure with no debt (i.e., a 100% equity ratio) plus 3.88% to compensate 18
investors for the risk of a 51.27% debt ratio and 0.07% for a 1.73% preferred 19
stock ratio. These are the book-value ratios that differ markedly from the 20
market-value based ratios I discussed previously. Under this approach, the 21
parts add up to 11.65% (7.70% + 3.88% + 0.07%), and there is no need to 22
even address the cost of equity in terms of D/P + g. To express this same 23
40
return in the context of the familiar DCF model, I added the 3.45% dividend 1
yield, the 6.75% growth rate, and 1.45% for the leverage adjustment in order 2
to arrive at the same 11.65% (3.45% + 6.75% + 1.45%) return. I know of no 3
means to mathematically solve for the 1.45% leverage adjustment by 4
expressing it in the terms of any particular relationship of market price to 5
book value. The 1.45% adjustment is merely a convenient way to compare 6
the 11.65% return computed using the Modigliani & Miller formulas to the 7
10.20% return generated by the DCF model (i.e., D1/P0 + g, or the traditional 8
form of the DCF shown on Schedule 1, page 2) based on a market-value 9
capital structure. A 10.20% return assigned to anything other than the market 10
value of equity cannot equate to a reasonable return on book value that has 11
higher financial risk. My point is that when we use a market-determined cost 12
of equity developed from the DCF model, it reflects a level of financial risk 13
that is different (in this case, lower) from the capital structure stated at book 14
value. This process has nothing to do with targeting any particular market-to-15
book ratio. 16
46. Q. Please provide the DCF return based upon your preceding discussion of 17
dividend yield, growth, and leverage. 18
A. As explained previously, I have utilized a six-month average dividend yield 19
(D1/P0) adjusted in a forward-looking manner for my DCF calculation. This 20
dividend yield is used in conjunction with the growth rate (g) previously 21
developed. The DCF also includes the leverage modification (Lev.) required 22
when the book value equity ratio is used in determining the weighted average 23
41
cost of capital in the ratemaking process rather than the market value equity 1
ratio related to the price of stock. The resulting DCF cost rate is 11.65%, 2
computed as follows: 3
D 1 /P 0 + g + lev. = k
Gas Group 3.45% + 6.75% + 1.45% = 11.65% 4
The DCF result shown above represents the simplified (i.e., Gordon) form of 5
the model that contains a constant-growth assumption. I should reiterate, 6
however, that the DCF-indicated cost rate provides an explanation of the rate 7
of return on common stock market prices without regard to the prospect of a 8
change in the P-E multiple. An assumption that there will be no change in the 9
P-E multiple is not supported by the realities of the equity market because P-E 10
multiples do not remain constant. This is one of the constraints of this model 11
that makes it important to consider the results of other models when 12
determining a company’s cost of equity. 13
VIII. RISK PREMIUM ANALYSIS 14
47. Q. Please describe your use of the Risk Premium approach to determine the 15
cost of equity. 16
A. With the Risk Premium approach, the cost of equity capital is determined by 17
corporate bond yields plus a premium to account for the fact that common 18
42
equity is exposed to greater investment risk than debt capital. The result of my 1
Risk Premium study is shown on Schedule 1, page 2. That result is 10.75%. 2
48. Q. What long-term public utility debt cost rate did you use in your Risk 3
Premium analysis? 4
A. In my opinion, and as I will explain in more detail further in my testimony, a 5
4.00% yield represents a reasonable estimate of the prospective yield on long-6
term, A-rated public utility bonds. 7
49. Q. What historical data are shown by the Moody’s data? 8
A. I have analyzed the historical yields on the Moody’s index of long-term public 9
utility debt as shown on Schedule 11, page 1. For the twelve months ended 10
February 2022, the average monthly yield on Moody’s index of A-rated public 11
utility bonds was 3.20%. For the six- and three-month periods ended 12
February 2022, the yields were 3.20% and 3.38%, respectively. During the 13
twelve months ended February 2022, the range of the yields on A-rated public 14
utility bonds was 2.95% to 3.68%. Page 2 of Schedule 11 shows the long-run 15
spread in yields between A-rated public utility bonds and long-term Treasury 16
bonds. As shown on page 3 of Schedule 11, the yields on A-rated public 17
utility bonds have exceeded those on Treasury bonds by 1.10% on a twelve-18
month average basis, 1.18% on a six-month average basis, and 1.31% on a 19
three-month average basis. With these data, 1.25% represents a reasonable 20
spread for the yield on A-rated public utility bonds over Treasury bonds. 21
43
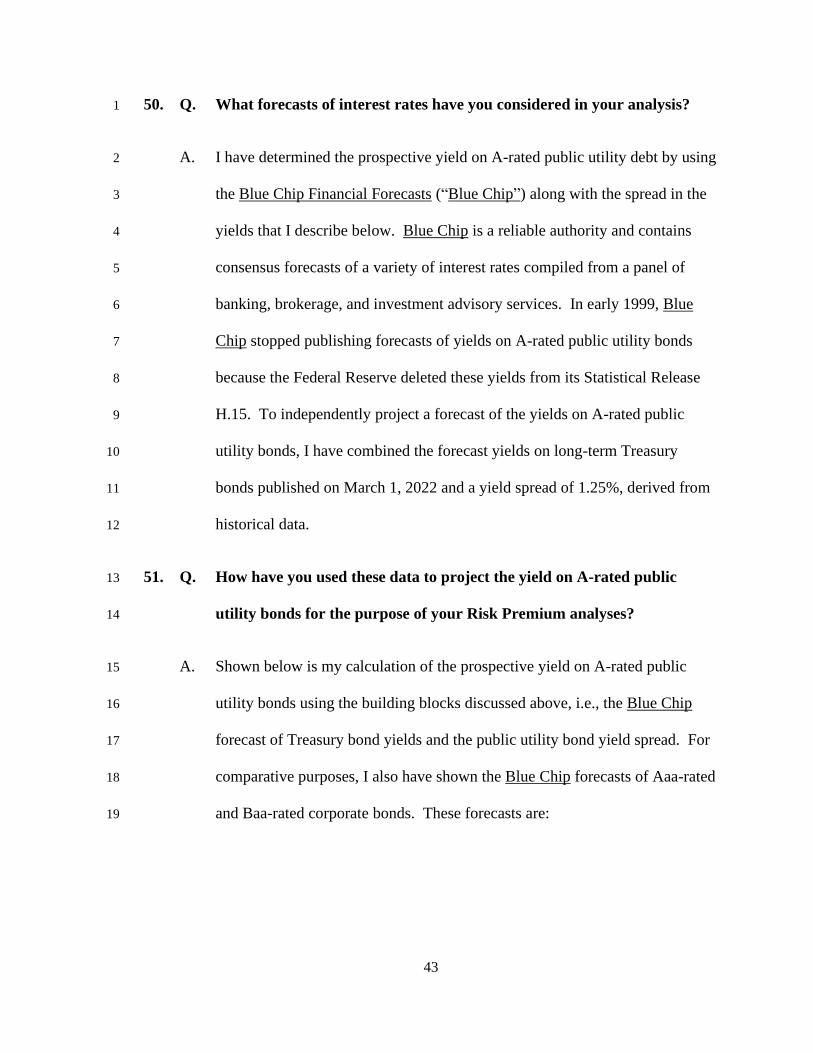
50. Q. What forecasts of interest rates have you considered in your analysis? 1
A. I have determined the prospective yield on A-rated public utility debt by using 2
the Blue Chip Financial Forecasts (“Blue Chip”) along with the spread in the 3
yields that I describe below. Blue Chip is a reliable authority and contains 4
consensus forecasts of a variety of interest rates compiled from a panel of 5
banking, brokerage, and investment advisory services. In early 1999, Blue 6
Chip stopped publishing forecasts of yields on A-rated public utility bonds 7
because the Federal Reserve deleted these yields from its Statistical Release 8
H.15. To independently project a forecast of the yields on A-rated public 9
utility bonds, I have combined the forecast yields on long-term Treasury 10
bonds published on March 1, 2022 and a yield spread of 1.25%, derived from 11
historical data. 12
51. Q. How have you used these data to project the yield on A-rated public 13
utility bonds for the purpose of your Risk Premium analyses? 14
A. Shown below is my calculation of the prospective yield on A-rated public 15
utility bonds using the building blocks discussed above, i.e., the Blue Chip 16
forecast of Treasury bond yields and the public utility bond yield spread. For 17
comparative purposes, I also have shown the Blue Chip forecasts of Aaa-rated 18
and Baa-rated corporate bonds. These forecasts are: 19

44
30-Year
Year Quarter Aaa-rated Baa-rated Treasury Spread Yield
2022 First 3.2% 3.9% 2.2% 1.25% 3.45%
2022 Second 3.4% 4.2% 2.5% 1.25% 3.75%
2022 Third 3.7% 4.4% 2.6% 1.25% 3.85%
2022 Fourth 3.9% 4.6% 2.7% 1.25% 3.95%
2023 First 4.0% 4.8% 2.9% 1.25% 4.15%
2023 Second 4.1% 4.9% 3.0% 1.25% 4.25%
Corporate A-rated Public Utility
Blue Chip Financial Forecasts
52. Q. Are there additional forecasts of interest rates that extend beyond those 1
shown above? 2
A. Yes. Twice yearly, Blue Chip provides long-term forecasts of interest rates. 3
In its December 1, 2021 publication Blue Chip published longer-term 4
forecasts of interest rates, which were reported to be: 5
30-Year
Averages Aaa-rated Baa-rated Treasury
2023-2027 4.4% 5.2% 3.4%
2028-2032 4.9% 5.7% 3.8%
Blue Chip Financial Forecasts
Corporate
The longer-term forecasts by Blue Chip suggest that interest rates will move 6
up from the levels revealed by the near-term forecasts. A 4.00% yield on A-7
rated public utility bonds represents a reasonable benchmark for measuring 8
the cost of equity in this case. All the data I used to formulate my conclusion 9
as to a prospective yield on A-rated public utility debt are available to 10
investors, who regularly rely upon such data to make investment decisions. 11
Recent FOMC pronouncements have moved the forecasts of interest rates to 12
higher levels. 13

45
53. Q. What equity risk premium have you determined for public utilities? 1
A. To develop an appropriate equity risk premium, I analyzed the results from 2
2021 SBBI Yearbook, Stocks, Bonds, Bills and Inflation. My investigation 3
reveals that the equity risk premium varies according to the level of interest 4
rates. That is to say, the equity risk premium increases as interest rates 5
decline, and it declines as interest rates increase. This inverse relationship is 6
revealed by the summary data presented below and shown on Schedule 12, 7
page 1. 8
Low Interest Rates 6.63%
Average Across All Interest Rates 5.67%
High Interest Rates 4.69%
Common Equity Risk Premiums
Based on my analysis of the historical data, the equity risk premium was 9
6.63% when the marginal cost of long-term government bonds was low (i.e., 10
2.85%, which was the average yield during periods of low rates). Conversely, 11
when the yield on long-term government bonds was high (i.e., 7.09% on 12
average during periods of high interest rates), the spread narrowed to 4.69%. 13
Over the entire spectrum of interest rates, the equity risk premium was 5.67% 14
when the average government bond yield was 4.95%. I have utilized a 6.75% 15
equity risk premium. The equity risk premium of 6.75% that I employed is 16
near the risk premiums associated with low interest rates. 17
46
54. Q. What common equity cost rate did you determine based on your Risk 1
Premium analysis? 2
A. The cost of equity (i.e., “k”) is represented by the sum of the prospective yield 3
for long-term public utility debt (i.e., “i”) and the equity risk premium (i.e., 4
“RP”). The Risk Premium approach provides a cost of equity of: 5
i + RP = k
Gas Group 4.00% + 6.75% = 10.75% 6
7
IX. CAPITAL ASSET PRICING MODEL 8
55. Q. How is the CAPM used to measure the cost of equity? 9
A. The CAPM uses the yield on a risk-free interest-bearing obligation plus a rate 10
of return premium that is proportional to the systematic risk of an investment. 11
As shown on page 2 of Schedule 1, the result of the CAPM is 14.37% for the 12
Gas Group with the leverage adjustment. Without the leverage adjustment, 13
the CAPM result is 12.54% (14.37% - (0.18 x 10.19%)). To compute the cost 14
of equity with the CAPM, three components are necessary: a risk-free rate of 15
return (“Rf”), the beta measure of systematic risk (“β”), and the market risk 16
premium (“Rm-Rf”) derived from the total return on the market of equities 17
reduced by the risk-free rate of return. The CAPM specifically accounts for 18
differences in systematic risk (i.e., market risk as measured by the beta) 19
between an individual firm or group of firms and the entire market of equities. 20

47
56. Q. What betas have you considered in the CAPM? 1
A. For my CAPM analysis, I initially considered the Value Line betas. As shown 2
on page 2 of Schedule 3, the average beta is 0.86 for the Gas Group. 3
57. Q. Did you use the Value Line betas in the CAPM determined cost of equity? 4
A. I used the Value Line betas as a foundation for the leverage adjusted betas that 5
I used in the CAPM. The betas must be reflective of the financial risk 6
associated with the ratemaking capital structure that is measured at book 7
value. Therefore, Value Line betas cannot be used directly in the CAPM, 8
unless the cost rate developed using those betas is applied to a capital 9
structure measured with market values. To develop a CAPM cost rate 10
applicable to a book-value capital structure, the Value Line (market value) 11
betas have been unleveraged and re-leveraged for the book value common 12
equity ratios using the Hamada formula,9 as follows: 13
βl = βu [1 + (1 - t) D/E + P/E] 14
ßl = the leveraged beta, ßu = the unleveraged beta, t = income tax rate, D = 15
debt ratio, P = preferred stock ratio, and E = common equity ratio. The betas 16
published by Value Line have been calculated with the market price of stock 17
and are related to the market value capitalization. By using the formula 18
shown above and the capital structure ratios measured at market value, the 19
9 Robert S. Hamada, “The Effects of the Firm’s Capital Structure on the Systematic Risk of
Common Stocks;” The Journal of Finance, Vol. 27, No. 2; Papers and Proceedings of the Thirtieth Annual
Meeting of the American Finance Association, New Orleans, Louisiana, Dec. 27-29, 1971. (May 1972),
pp. 435-52.
48
beta would become 0.55 for the Gas Group if it employed no leverage and 1
was 100% equity financed. Those calculations are shown on Schedule 10 2
under the section labeled “Hamada,” who is credited with developing those 3
formulas. With the unleveraged beta as a base, I calculated the leveraged beta 4
of 1.04 for the book value capital structure of the Gas Group. 5
58. Q. What risk-free rate have you used in the CAPM? 6
A. As shown on page 1 of Schedule 13, I provided the historical yields on 7
Treasury notes and bonds. For the twelve months ended February 2022, the 8
average yield on 30-year Treasury bonds was 2.09%. For the six- and three-9
months ended February 2022, the yields on 30-year Treasury bonds were 10
2.02% and 2.07%, respectively. During the twelve months ended February 11
2022, the range of the yields on 30-year Treasury bonds was 1.85% to 2.34%. 12
The low yields that existed during 2020 can be traced to extraordinary events 13
associated with the Pandemic that jolted the capital markets. These events led 14
to the end of the record-setting 128-month economic expansion. As the 15
recession unfolded in February 2020, the FOMC acted to address these 16
disruptions. The FOMC continued to support the money and capital markets 17
during the recovery from the Pandemic. A transition is now taking place that 18
will prospectively produce higher interest rates as the Pandemic nears its end 19
and the FOMC ends it quantitative easing. That program ended in March 20
2022 and a Fed Funds rate increase of 0.25% occurred at that time. While 21
interest rates have moved up generally, there had been a ”flight” to safety in 22
Treasury obligations due to geopolitical turmoil in Europe. A forward-23

49
looking assessment of the capital markets is especially relevant now because 1
the Company’s rates will be based on financial conditions in 2023 and 2
beyond. Higher inflation expectations are a contributing factor that points to 3
higher interest rates. Indeed, higher inflation today is revealed by a 5.9% 4
increase in Social Security payments announced on October 13, 2021, which 5
is the largest one-year increase in nearly four decades. The Fed Funds rate is 6
expected to continue to increase from very low levels that existed during the 7
Pandemic. Higher interest rates clearly point to higher capital costs 8
prospectively. 9
As shown on page 2 of Schedule 13, forecasts published by Blue 10
Chip on March 1, 2022 indicate that the yields on long-term Treasury bonds 11
are expected to be in the range of 2.2% to 3.0% during the next six quarters. 12
The longer-term forecasts described previously show that the yields on 30-13
year Treasury bonds will average 3.4% from 2023 through 2027 and 3.8% 14
from 2028 to 2032. For the reasons explained previously, forecasts of interest 15
rates should be emphasized at this time in selecting the risk-free rate of return 16
in CAPM. Hence, I have used a 2.75% risk-free rate of return for CAPM 17
purposes, which considers the Blue Chip forecasts. 18
59. Q. What market premium have you used in the CAPM? 19
A. As shown in the lower panel of data presented on Schedule 13, page 2, the 20
market premium is derived from historical data and the forecast returns. For 21
the historically based market premium, I have used the arithmetic mean 22
obtained from the data presented on Schedule 12, page 1. On that schedule, 23
50
the market return was 12.06% on large stocks during periods of low interest 1
rates. During those periods, the yield on long-term government bonds was 2
2.85% when interest rates were low. As such, I carried over to Schedule 13, 3
page 2, the average large common stock returns of 12.06% and the average 4
yield on long-term government bonds of 2.85%. The resulting market 5
premium is 9.21% (12.06% - 2.85%) based on historical data, as shown on 6
Schedule 13, page 2. As also shown on Schedule 13, page 2, I calculated the 7
forecast returns, which show a 13.91% total market return. With this forecast, 8
I calculated a market premium of 11.16% (13.91% - 2.75%) using forecast 9
data. The resulting market premium applicable to the CAPM derived from 10
these sources equals 10.19% (11.16% + 9.21% = 20.37% ÷ 2). 11
60. Q. Are there adjustments to the CAPM that are necessary to fully reflect the 12
rate of return on common equity? 13
A. Yes. The technical literature supports an adjustment relating to the size of the 14
company or portfolio for which the calculation is performed. As the size of a 15
firm decreases, its risk and required return increases. Moreover, in his 16
discussion of the cost of capital, Professor Eugene F. Brigham has indicated 17
that smaller firms have higher capital costs than otherwise similar larger firms. 18
Also, the Fama/French study (see “The Cross-Section of Expected Stock 19
Returns”; The Journal of Finance, June 1992) established that the size of a 20
firm helps explain stock returns. In an October 15, 1995 article in Public 21
Utility Fortnightly, entitled “Equity and the Small-Stock Effect,” it was 22
demonstrated that the CAPM could significantly understate the cost of equity 23
51
according to a company’s size. Indeed, it was demonstrated in the SBBI 1
Yearbook that the returns for stocks in lower deciles (i.e., smaller stocks) had 2
returns in excess of those shown by the simple CAPM. To recognize this fact, 3
I used the mid-cap adjustment of 1.02%, as revealed on page 3 of Schedule 4
13, for the CAPM calculation. The adjustment here is related to the size of 5
the Gas Group. 6
61. Q. What does your CAPM analysis show? 7
A. Using the 2.75% risk-free rate of return, the leverage adjusted beta of 1.04 for 8
the Gas Group, the 10.19% market premium, and the 1.02% size adjustment, 9
the following result is indicated. 10
Rf + ß x ( Rm-Rf ) + size = k
Gas Group 2.75% + 1.04 x ( 10.19% ) + 1.02% = 14.37%
X. COMPARABLE EARNINGS APPROACH 11
62. Q. What is the Comparable Earnings approach? 12
A. The Comparable Earnings approach estimates a fair return on equity by 13
comparing returns realized by non-regulated companies to returns that a 14
public utility with similar risk characteristics would need to realize in order to 15
compete for capital. Because regulation is a substitute for competitively 16
determined prices, the returns realized by non-regulated firms with 17
comparable risks to a public utility provide useful insight into investor 18
expectations for public utility returns. The firms selected for the Comparable 19
52
Earnings approach should be companies whose prices are not subject to cost-1
based price ceilings (i.e., non-regulated firms) so that circularity is avoided. 2
There are two avenues available to implement the Comparable 3
Earnings approach. One method involves the selection of another industry (or 4
industries) with comparable risks to the public utility in question, and the 5
results for all companies within that industry serve as a benchmark. The 6
second approach requires the selection of parameters that represent similar 7
risk traits for the public utility and the comparable risk companies. Using this 8
approach, the business lines of the comparable companies become 9
unimportant. The latter approach is preferable with the further qualification 10
that the comparable risk companies exclude regulated firms in order to avoid 11
the circular reasoning implicit in the use of the achieved earnings/book ratios 12
of other regulated firms. The United States Supreme Court has held that: 13
A public utility is entitled to such rates as will permit it to earn 14
a return on the value of the property which it employs for the 15
convenience of the public equal to that generally being made at 16
the same time and in the same general part of the country on 17
investments in other business undertakings which are attended 18
by corresponding risks and uncertainties. The return should be 19
reasonably sufficient to assure confidence in the financial 20
soundness of the utility and should be adequate, under efficient 21
and economical management, to maintain and support its credit 22
and enable it to raise the money necessary for the proper 23
discharge of its public duties. Bluefield Water Works v. Public 24
Service Commission, 262 U.S. 668 (1923). 25
26
It is important to identify the returns earned by firms that compete for capital 27
with a public utility. This can be accomplished by analyzing the returns of 28
non-regulated firms that are subject to the competitive forces of the 29
marketplace. 30

53
63. Q. Did you compare the results of your DCF and CAPM analyses to the 1
results indicated by a Comparable Earnings approach? 2
A. Yes. I selected companies from The Value Line Investment Survey for 3
Windows that have six categories of comparability designed to reflect the risk 4
of the Gas Group. These screening criteria were based upon the range as 5
defined by the rankings of the companies in the Gas Group. The items 6
considered were Timeliness Rank, Safety Rank, Financial Strength, Price 7
Stability, Value Line betas, and Technical Rank. The definition for these 8
parameters is provided on Schedule 14, page 3. The identities of the 9
companies comprising the Comparable Earnings group and their associated 10
rankings within the ranges are identified on Schedule 14, page 1. 11
I relied upon Value Line data because it provides a comprehensive 12
basis for evaluating the risks of the comparable firms. As to the returns 13
calculated by Value Line for these companies, there is some downward bias in 14
the figures shown on Schedule 14, page 2, because Value Line computes the 15
returns on year-end rather than average book value. If average book values 16
had been employed, the rates of return would have been slightly higher. 17
Nevertheless, these are the returns considered by investors when taking 18
positions in these stocks. Because many of the comparability factors, as well 19
as the published returns, are used by investors in selecting stocks, and the fact 20
that investors rely on the Value Line service to gauge returns, it is an 21
appropriate database for measuring comparable return opportunities. 22
54
64. Q. What data did you consider in your Comparable Earnings analysis? 1
A. I used both historical realized returns and forecasted returns for non-utility 2
companies. As noted previously, I have not used returns for utility companies 3
in order to avoid the circularity that arises from using regulatory-influenced 4
returns to determine a regulated return. It is appropriate to consider a 5
relatively long measurement period in the Comparable Earnings approach in 6
order to cover conditions over an entire business cycle. A ten-year period 7
(five historical years and five projected years) is sufficient to cover an average 8
business cycle. Unlike the DCF and CAPM, the results of the Comparable 9
Earnings method can be applied directly to the book value capitalization. In 10
other words, the Comparable Earnings approach does not contain the potential 11
misspecification contained in market models when the market capitalization 12
and book value capitalization diverge significantly. A point of demarcation 13
was chosen to eliminate the results of highly profitable enterprises, which the 14
Bluefield case stated were not the type of returns that a utility was entitled to 15
earn. For this purpose, I used 20% as the point where those returns could be 16
viewed as highly profitable and should be excluded from the Comparable 17
Earnings approach. The average historical rate of return on book common 18
equity was 11.5% using only the returns that were less than 20%, as shown on 19
Schedule 14, page 2. The average forecasted rate of return as published by 20
Value Line is 12.6% also using values less than 20%, as provided on Schedule 21
14, page 2. Using the average of these data, my Comparable Earnings result 22
is 12.05%, as shown on Schedule 1, page 2. 23
55
DB1/ 128074769.8
XI. CONCLUSION ON COST OF EQUITY 1
65. Q. What is your conclusion regarding the Company’s cost of common 2
equity? 3
A. Based upon the application of a variety of methods and models described 4
previously, it is my opinion that a reasonable rate of return on common equity 5
is 10.95% for PECO Energy, which includes ten basis points or 0.10% for 6
recognition of the Company’s strong management performance. My cost of 7
equity recommendation is within the range of results and should be considered 8
in the context of the Company’s risk characteristics relative to the barometer 9
group companies. It is essential that the Commission employ a variety of 10
techniques to measure the Company’s cost of equity because of the 11
limitations/infirmities that are inherent in each method. In summary, the 12
Company should be provided an opportunity to realize a 10.95% rate of return 13
on common equity so that it can compete in the capital markets, attain 14
reasonable credit quality, sustain its cash flow in the context of its high levels 15
of capital expenditures, and receive recognition of the significant 16
accomplishments that management has achieved. 17
66. Q. Does this complete your direct testimony? 18
A. Yes. However, I reserve the right to supplement my testimony, if necessary, 19
and to respond to witnesses presented by other parties. 20
21
APPENDIX A TO DIRECT TESTIMONY OF PAUL R. MOUL
A-1
EDUCATIONAL BACKGROUND, BUSINESS EXPERIENCE 1
AND QUALIFICATIONS 2
I was awarded a Bachelor of Science degree in Business Administration by Drexel 3
University in 1971. While at Drexel, I participated in the Cooperative Education Program, which 4
included employment, for one year, with American Water Works Service Company, Inc., as an 5
internal auditor. There, I was involved in the audits of several operating water companies of the 6
American Water Works System and participated in the preparation of annual reports to regulatory 7
agencies and assisted in other general accounting matters. 8
Upon graduation from Drexel University, I was employed by American Water Works 9
Service Company, Inc. in the Eastern Regional Treasury Department, where my duties included 10
preparation of rate case exhibits for submission to regulatory agencies, as well as responsibility 11
for various treasury functions of the thirteen New England operating subsidiaries. 12
In 1973, I joined the Municipal Financial Services Department of Betz Environmental 13
Engineers, a consulting engineering firm, where I specialized in financial studies for municipal 14
water and wastewater systems. 15
In 1974, I joined Associated Utility Services, Inc., now known as AUS Consultants. I held 16
various positions with the Utility Services Group of AUS Consultants, concluding my 17
employment there as a Senior Vice President. 18
In 1994, I formed P. Moul & Associates, an independent financial and regulatory 19
consulting firm. In my capacity as Managing Consultant and for the past forty-one years, I have 20
continuously studied the rate of return requirements for cost of service-regulated firms. In this 21
regard, I have supervised the preparation of rate of return studies, which were employed in 22
connection with my testimony and in the past for other individuals. I have presented direct 23
APPENDIX A TO DIRECT TESTIMONY OF PAUL R. MOUL
A-2
testimony on the subject of fair rate of return, evaluated rate of return testimony of other witnesses, 1
and presented rebuttal testimony. 2
My studies and prepared direct testimony have been presented before thirty-seven federal, 3
state and municipal regulatory commissions, consisting of the Federal Energy Regulatory 4
Commission; state public utility commissions in Alabama, Alaska, California, Colorado, 5
Connecticut, Delaware, Florida, Georgia, Hawaii, Illinois, Indiana, Iowa, Kentucky, Louisiana, 6
Maine, Maryland, Massachusetts, Michigan, Minnesota, Missouri, New Hampshire, New Jersey, 7
New York, North Carolina, Ohio, Oklahoma, Pennsylvania, Rhode Island, South Carolina, 8
Tennessee, Texas, Virginia, West Virginia, and Wisconsin; the Philadelphia Gas Commission; 9
and the Texas Commission on Environmental Quality. My testimony has been offered in over 10
300 rate cases involving electric power, natural gas distribution and transmission, resource 11
recovery, solid waste collection and disposal, telephone, wastewater, and water service utility 12
companies. While my testimony has involved principally fair rate of return and financial matters, 13
I have also testified on capital allocations, capital recovery, cash working capital, income taxes, 14
factoring of accounts receivable, and take-or-pay expense recovery. My testimony has been 15
offered on behalf of municipal and investor-owned public utilities and for the staff of a regulatory 16
commission. I have also testified at an Executive Session of the State of New Jersey Commission 17
of Investigation concerning the New Jersey Board of Public Utilities regulation of solid waste 18
collection and disposal. 19
I was a co-author of a verified statement submitted to the Interstate Commerce 20
Commission concerning the 1983 Railroad Cost of Capital (Ex Parte No. 452). I was also co-21
author of comments submitted to the Federal Energy Regulatory Commission regarding the 22
Generic Determination of Rate of Return on Common Equity for Public Utilities in 1985, 1986 23
and 1987 (Docket Nos. RM85-19-000, RM86-12-000, RM87-35-000 and RM88-25-000). 24
APPENDIX A TO DIRECT TESTIMONY OF PAUL R. MOUL
A-3
Further, I have been the consultant to the New York Chapter of the National Association of Water 1
Companies, which represented the water utility group in the Proceeding on Motion of the 2
Commission to Consider Financial Regulatory Policies for New York Utilities (Case 91-M-0509). 3
I have also submitted comments to the Federal Energy Regulatory Commission in its Notice of 4
Proposed Rulemaking (Docket No. RM99-2-000) concerning Regional Transmission 5
Organizations, and on behalf of the Edison Electric Institute in its intervention in the case of 6
Southern California Edison Company (Docket No. ER97-2355-000). Also, I was a member of 7
the panel of participants at the Technical Conference in Docket No. PL07-2 on the Composition 8
of Proxy Groups for Determining Gas and Oil Pipeline Return on Equity. 9
In late 1978, I arranged for the private placement of bonds on behalf of an investor-owned 10
public utility. I have assisted in the preparation of a report to the Delaware Public Service 11
Commission relative to the operations of the Lincoln and Ellendale Electric Company. I was also 12
engaged by the Delaware P.S.C. to review and report on the proposed financing and disposition 13
of certain assets of Sussex Shores Water Company (P.S.C. Docket Nos. 24-79 and 47-79). I was 14
a co-author of a Report on Proposed Mandatory Solid Waste Collection Ordinance prepared for 15
the Commission of County Commissioners of Collier County, Florida. 16
I have been a consultant to the Bucks County Water and Sewer Authority concerning rates 17
and charges for wholesale contract service with the City of Philadelphia. My municipal consulting 18
experience has also included an assignment for Baltimore County, Maryland, regarding the 19
City/County Water Agreement for Metropolitan District customers (Circuit Court for Baltimore 20
County in Case 34/153/87-CSP-2636). 21