PDF View - CAG
66
-
Upload
khangminh22 -
Category
Documents
-
view
0 -
download
0
Transcript of PDF View - CAG


CHAPTER-2
HEALTH, MEDICAL EDUCATION AND FAMILY WELFARE
DEPARTMENT
2.1 Performance Audit on National Rural Health Mission with special
focus on Reproductive and Child Health
Executive summary
The National Rural Health Mission (NRHM) was launched by Government of
India (GoI) in April 2005 with aims to provide accessible, affordable,
accountable, effective and reliable health care facilities in rural areas to
strengthen public health systems. The key strategy of the mission was to
bridge the gaps in health care facilities, facilitate decentralised planning in
health sector, providing an umbrella to existing programmes of Health &
Family Welfare including Reproductive & Child Health and various disease
control programmes. Some of the major audit findings are discussed below:
• The State had failed critically in creating sufficient infrastructure in terms
of Public Health facilities as required under the NRHM norms. The gaps
between requirement and available health facilities such as CHCs, PHCs and
HSCs in the State increased from 45, 76 and 55 per cent respectively in 2011
to 51, 79 and 60 per cent respectively in 2016 as NRHM and State
intervention was centered on upgradation of existing facilities leaving behind
construction of additional facilities by identifying those areas where medical
facilities did not exist.
(Paragraph 2.1.8.1)
• Poor utilisation of GoI funds resulted in short release of central share
ranging between ` 71.38 crore and ` 273.40 crore (16 and 49 per cent) during
2011-16. In case of state share there were short release of ` 70.28 crore (38
per cent) and ` 187.53 crore (99 per cent) during 2012-13 and 2014-15
respectively indicating poor financial management.
(Paragraphs 2.1.10.1 and 2.1.10.2)
• There was mis-match of ` 1076.70 crore between unspent balances shown
in the Audited Accounts and that of Utilisation Certificates submitted to GoI
during 2011-15. Jharkhand Rural Health Mission Society (JRHMS) did not
prepare bank reconciliation statements since 2011-12 resulting in significant
differences (up to ` 72 crore) between the closing balances of the JRHMS
cash book and the bank balances. The outstanding advances worth ` 48.18
crore against different parties/ officials/staff were unadjusted which resulted in
loss of interest of ` 7.06 crore.
(Paragraphs 2.1.10.3, 2.1.10.4 and 2.1.10.5)
• Out of 4.08 lakh institutional deliveries, incentives were paid to 3.21 lakh
beneficiaries. Thus, 87,098 beneficiaries with total dues of ` 12.19 crore were
not paid Janani Suraksha Yojana (JSY) incentives during 2011-16
(Paragraph 2.1.10.8)
• Against the Indian Public Health Standards (IPHS) norms, in test checked
District Hospitals (DH), the shortages of bed ranged between 50 and

Audit Report on General, Social and Economic Sectors for the year ended 31 March 2016
8
76 per cent whereas in test check CHCs shortages of beds ranged between 47
and 90 per cent.
(Paragraphs 2.1.11.1 (i) & (ii))
• Against the nine existing HSCs buildings, 18 HSCs buildings were taken
up for construction at the same places under different schemes (State fund,
Integrated Action Plan (IAP) and NRHM) in West Singhbhum district for
want of adequate coordination between sanctioning departments rendering
expenditure of ` 165.10 lakh wasteful. The CHC building Bharno and
HSC building Bindapathar not put to use resulted in idle expenditure of
` 2.89 crore.
(Paragraphs 2.1.11.3 and 2.1.11.4)
• Against the IPHS norms, essential equipment ranging between 57 and 86
per cent at DHs, 79 per cent at SDH, 44 and 92 per cent at CHCs level were
not available. Machines and equipment worth ` 2.59 crore were lying idle in
the test checked DHs and CHCs. Mobile Medical Units (MMU) were being
camped at places where CHCs/PHCs/HSCs were already operating in
violation of government instructions and depriving basic health facilities to the
needy rural people of the remote areas.
(Paragraphs 2.1.12.1, 2.1.12.2 and 2.1.12.3)
• There were shortages of Specialist doctors (92 and 78 per cent), Medical
officers (61 and 36 per cent), Staff Nurses/Auxiliary Nursing Midwifery
(ANM) (27 and 26 per cent) and Paramedics (52 and 40 per cent) with respect
to IPHS norms and Sanctioned Strength (SS) respectively.
(Paragraphs 2.1.13.1and 2.1.13.2)
• Against the requirement, 65 to 78 per cent diagnostic tests were not
performed in DHs while 42 to 85 per cent diagnostic tests were not done in
CHCs. Essential laboratory services were not available in any test checked
PHCs. Essential medicines were not available to the extent of 75 to
88 per cent in DHs, 32 to 82 per cent in CHCs, 61 to 91 per cent in PHCs and
22 to 83 per cent in HSCs.
(Paragraphs 2.1.15 and 2.1.16.1)
• Procurement of Typhoid, Human Immunodeficiency Virus (HIV)
Screening, Urine and Hepatitis ‘B’ test kits valued at ` 2.60 crore were made
from Kendria Bhandar (KB) Ranchi by Civil Surgeons (CS) Dumka and
Giridih at two to thirteen times the maximum retail price (MRP) resulting in
excess payment of ` 1.33 crore. DHs Dumka and West Singhbhum purchased
medicines/consumable at higher than approved rate contracts and paid excess
amount of ` 42.86 lakh. In Dumka, 9,028 bottles of substandard paracetamol
were supplied to the Sahiyas.
(Paragraphs 2.1.16.2, 2.1.16.3 and 2.1.16.4)
• State Quality Assurance Unit (SQAU) was not made functional till July
2016 and District Quality Assurance Units (DQAU) were not constituted in
test checked districts. No patient satisfaction survey was conducted in DHs
Dumka, Giridih and Jamtara during 2013-16. Only 56 per cent death audit
conducted.
(Paragraphs 2.1.17.2., 2.1.17.3, 2.1.17.5 and 2.1.17.6)

Chapter-2: Performance Audit
9
2.1.1 Introduction
The National Rural Health Mission (NRHM) was launched by Government of
India (GoI) in April 2005 with aims to provide accessible, affordable,
accountable, effective and reliable health care facilities in rural areas. To
strengthen public health systems as a basis for universal access and social
protection against the rising costs of health care is a core value of the National
Health Mission, which has as its primary targets, to reduce
• Infant Mortality Rate (IMR) to less than 25 per 1000 live births
• Maternal Mortality Rate (MMR) to 100 per lakh live births
• Total Fertility Rate (TFR) to 2.1 by 2017 and stabilising it.
The key strategy of the mission is to bridge the gaps in health care facilities,
facilitate decentralised planning in health sector, providing an umbrella to
existing programmes of Health & Family Welfare including Reproductive &
Child Health and various disease control programmes.
2.1.2 Organisational Set up
Health care facilities in rural areas of the state are provided through a network
of District Hospitals, Community Health Centres (CHCs), Primary Health
Centres (PHCs) and Health Sub-centres (HSCs) to which funds/ equipment/
medicinal assistance are provided under NRHM and State Budget. NRHM
functions under the overall guidance of State Health Mission (SHM), headed
by the Chief Minister. NRHM is a mission mode programme carried out by
Jharkhand Rural Health Mission Society (JRHMS) and District Health
Societies under it, as constituted in 2007. The details of various agencies
involved are represented in the chart below:
2.1.3 Audit Objectives
The specific objectives of the Performance Audit (PA) were to:
• assess the impact of NRHM on improving Reproductive and Child Health
by test check of the;
� extent of availability of physical infrastructure;

Audit Report on General, Social and Economic Sectors for the year ended 31 March 2016
10
� extent of availability of health care professionals;
� quality of health care provided; and
• assess the mechanism of data collection, management reporting and
monitoring which serve as indicators of performance.
2.1.4 Audit Criteria
The criteria for audit findings were drawn from following sources:
• NRHM framework for implementation (2005-12 & 2012-17);
• NRHM Operational Guidelines for financial management;
• Indian Public Health Standards (IPHS) guidelines1 2012;
• Operational Guidelines for Quality Assurance in Public Health Facilities
2013;
• Assessor’s Guidebooks for Quality Assurance in District Hospitals 2013
and CHC (First Referral Unit) 2014;
2.1.5 Scope and Methodology of Performance Audit
The PA of NRHM with special focus on Reproductive and Child Health for
the period 2011-16 was conducted from April to August 2016 from amongst
19 districts (with predominantly rural population) out of 24 in the state. These
were sorted into three categories based on their ranking on a Health Index.
Two districts each from category I (Jamtara and West Singhbhum) and
category II (Dumka and Giridih) and one district from category III (Gumla)
were selected and within the districts, the District Hospital and District Health
Societies, 13 CHCs, 23 PHCs and 69 Health Sub-centres (Appendix-2.1.1)
were selected by SRSWOR2 method. Records of the Mission Director
(JRHMS) along with the selected sampled units were test checked. Responses
to a questionnaire from a sample of beneficiaries and Accredited Social Health
Activist (ASHA’s/ Sahiya’s) were collected. Joint physical inspections were
done and findings of these inspections were incorporated in the Report.
An entry conference was held with the Mission Director, JRHMS on 9 March
2016 in which audit objectives, audit criteria and methodology were discussed
and agreed to. The audit findings and recommendations were discussed with
the Additional Chief Secretary, Department of Health, Medical Education and
Family Welfare, Government of Jharkhand in the exit conference held on
21 November 2016. The audit findings and recommendations made in the PA
report were accepted during exit conference. The replies given by the
Additional Chief Secretary of the department have been suitably incorporated
in the report.
1 IPHS norms adopted by the State Government in its resolution dated 20
th June 2013
2 Simple Random Sampling Without Replacement

Chapter-2: Performance Audit
11
2.1.6 Disclaimer/ Scope Limitation
Certain records (Appendix-2.1.2) were not produced to audit despite repeated
requests at various levels such as JRHMS and DRHS3, due to which their audit
could not be done. Records on construction of Health facilities were not
provided at any level on the pretext that Engineering Division had closed.
Similarly, records for its 15 bank accounts were not provided by JRHMS.
2.1.7 Public spending on healthcare (NRHM and State Budget:
2011-16)
At the national level NRHM envisaged increasing public spending on health,
with a focus on primary healthcare, from 0.9 per cent of Gross Domestic
Product (GDP) in 2004-05 to 2-3 per cent of the GDP by 2012, while the
states were required to increase their spending on health sector by at least 10
per cent year on year (YOY) basis. Although the state increased its funding for
Public Health facilities, the overall spending on Public Health facilities
remained between 0.74 and 0.90 per cent of GSDP during 2011-15, far short
of the target. The year wise details of Pubic spending including NRHM funds,
Gross State Domestic Product (GSDP) during 2011-16 are as below:
1265 1293 1569 1959
30183494
37714342
0
1000
2000
3000
4000
5000
2011-12 2012-13 2013-14 2014-15
` in
cro
re
year
Public Spending on health care
Expenditure*
Envisaged expenditure
as per NRHM^
*Expenditure: Total of State Budget and NRHM funds
^Envisaged expenditure as per NRHM: 2 per cent of GSDP
Details of year wise spending on health sector by the state are given in
Table-2.1.1 below:
Table-2.1.1: Details of year wise spending on health sector `̀̀̀ in crore
Year Total spending
including
NRHM
GSDP4 Percentage
spending
to GSDP
State spending
through budget
Increase in
YOY spending
(per cent)
2011-12 1265 150918 0.84 980 ------
2012-13 1293 174724 0.74 946 -34 (-3.59)
2013-14 1569 188567 0.83 1133 187 (16.50)
2014-15 1959 217107 0.90 1609 476 (29.58)
2015-16 Annual Accounts
not prepared.
241955 NA 2159 550 (25.47)
(Source: Data provided by JHRMS and State Appropriation Account)
3 District Rural Health Mission Societies Dumka, Gumla, Giridih, Jamtara and West
Singhbhum 4 Gross State Domestic Product (GSDP) - base year 2011-12
The state failed to
achieve the target of
2-3 per cent of GSDP
despite increasing its
funding for Public
Health facilities by the
State

Audit Report on General, Social and Economic Sectors for the year ended 31 March 2016
12
Audit Findings
2.1.8 Planning, data collection, management and reporting
2.1.8.1 Planning
NRHM aimed at decentralised planning and implementation design that would
ensure need based health action plan, which would form the basis for
intervention in the health sector. Deficiencies noticed in planning for NRHM
activities are discussed below:
• Baseline Surveys: According to NRHM guidelines, baseline surveys to
identify health care needs of rural people were to be completed by 2008 with
their validation by Village Health Committees (VHC). However, household
surveys for assessing health care requirements and identifying underserved/
unserved areas were not conducted in the state.
• Facility Survey: The state Reproductive and Child Health Society
collected (2006-08) information of facilities directly from the concerned PHCs
without involving Anganwadi Workers (AWW) and Non-Government
Organisations (NGO) and the information so collected was not validated by
the VHCs as per the requirement under guidelines.
• Annual facility surveys: Annual facility surveys were to be conducted at
facilities at all levels in order to track improvements and existing gaps. On this
basis, annual plan was to be formulated. However, no annual facility survey
was ever conducted during 2011-16 at any level of facility.
• Gaps in Primary health care facilities against the requirement: NRHM
frame work envisages service delivery by Primary health care facilities
(CHCs, PHCs and HSCs) based on population norms as per Indian Public
Health Standards (IPHS). The population wise criteria for level of institution
are given in Table-2.1.2 below:
Table-2.1.2: Details of facility wise population norms as per IPHS
Population Institution Area
80000 CHC
Tribal/ Hilly areas
120000 Plain areas
20000 PHC
Tribal/ Hilly areas
50000 Plain areas
3000 HSC
Tribal/ Hilly areas
5000 Plain areas
Audit observed significant gaps in health care facilities (CHCs, PHCs, HSCs)
as compared to the requirements based on state population census 2011 and
projected population 2016. Details of gaps are given in Table 2.1.3 below:
Table 2.1.3: Gaps in Primary health care facilities against the requirement
Name of
facilities
Population
as per
census
2011
Requirement of
health facilities
as per
population 2011
Available
health
facility
Gap
2011
(per cent)
Projected
population of
2016 (as per
census 2011)
Requirement of
health facilities
as per projected
population 2016
Available
health
facility
Gap
2016
(per cent)
1 2 3 4 5 (3-4) 6 7 8 9 (7-8)
CHC
32966238
344 188 156 (45)
36876857
385 188 197 (51)
PHC 1376 330 1046 (76) 1540 330 1210 (79)
HSC 8813 3958 4855 (55) 9858 3958 5900 (60)
(Source: Data furnished by JRHMS and census 2011)
Baseline and Annual
facility surveys were
not conducted during
2011-16

Chapter-2: Performance Audit
13
It is evident from above table that gaps between requirement and available
health facilities such as CHCs, PHCs and HSCs in the state increased from 45,
76 and 55 per cent respectively as per 2011 census to 51, 79 and 60 per cent
respectively as per projected population5 of 2016. This is because the NRHM
and state intervention was limited to upgradation of the existing facilities only
during 2011-16 and there were no plans on record to construct additional
health facilities by identifying the deficit area where no medical facility
existed. This only widened the gaps during 2011-16 instead of bridging it.
Thus, the plan failed to make suitable provisions for mitigating the identified
gaps in health facilities.
• Preparation of State Annual Action Plan (PIP): NRHM’s bottom up
planning and budgeting approach mandates preparation of Village Health
Action Plan (VHAPs) at village level by Village Health and Sanitation
Committees (VHNCs) which was to be consolidated at every level to form a
State Programme Implementation Plan (SPIP). Test check of records at HSC,
CHC and District revealed that VHAPs were not being prepared. District
Health Action Plan (DHAP) at district levels were being prepared by
conducting meetings with all Medical Officers in-charge (MOIC) of CHCs
and Block Programme Management Unit (BPMU) officials which were then
consolidated as SPIP. Thus, the SPIP was not prepared as per the prescribed
norms.
• Delays in Preparation and Approval of SPIP: Audit observed that State
PIP was approved by the JRHMS with delays6 ranging between 36 and 219
days during 2011-16. Consequently, State PIP in form of Record of
Proceedings (ROP) was approved by National Programme Co-ordination
Committee (NPCC) with delays ranging between 35 and 196 days
(Appendix-2.1.3).
In reply, the Department stated (November 2016) that annual survey would be
conducted. Further, the department also stated that online mechanism to plan
from local levels has been initiated and would be fully functional shortly. Fact
remains that the above deficiencies have led to deficient planning resulting in
widening of gaps between requirement and availability of health facilities.
2.1.9 Health Management Information System (HMIS)
The HMIS is an instrument created under NRHM in which health related data
is fed from all facilities levels and is utilised to monitor functioning of the
health facilities and develop policy initiatives on the basis of reports
generated. Audit compared the data available in the test-checked facilities with
the data entered in the HMIS portal and found significant variations at all
facility levels (Appendix-2.1.4). Further, numerous data fields for PHC and
HSC were found vacant. Thus, the reliability of HMIS reports generated was
questionable.
5 Based on district wise percentage decadal growth 2001-11
6 The State PIP/Annual Action Plan was to be approved in JRHMS and submitted to GoI
by 15th
and 22nd
of January of preceding year respectively which was to be approved by
the National Programme Co-ordination Committee (NPCC) by 15th
of March
Gaps of health care
facilities such as CHC,
PHC and HSC were
increased from 45 to 51
per cent, 76 to 79 per cent
and 55 to 60 per cent
respectively
Village Health Action
Plans are not being
prepared
Delay in preparation
SPIP ranged between
36 and 219 and
approval of RoP
ranged between 35
and 196 days
There is significant
variation between data
available in test checked
facilities and data
entered in the HMIS
Audit Report on General, Social and Economic Sectors for the year ended 31 March 2016
14
In reply, the Department accepted the fact and stated (November 2016) that
the reliability of data in HMIS will be improved.
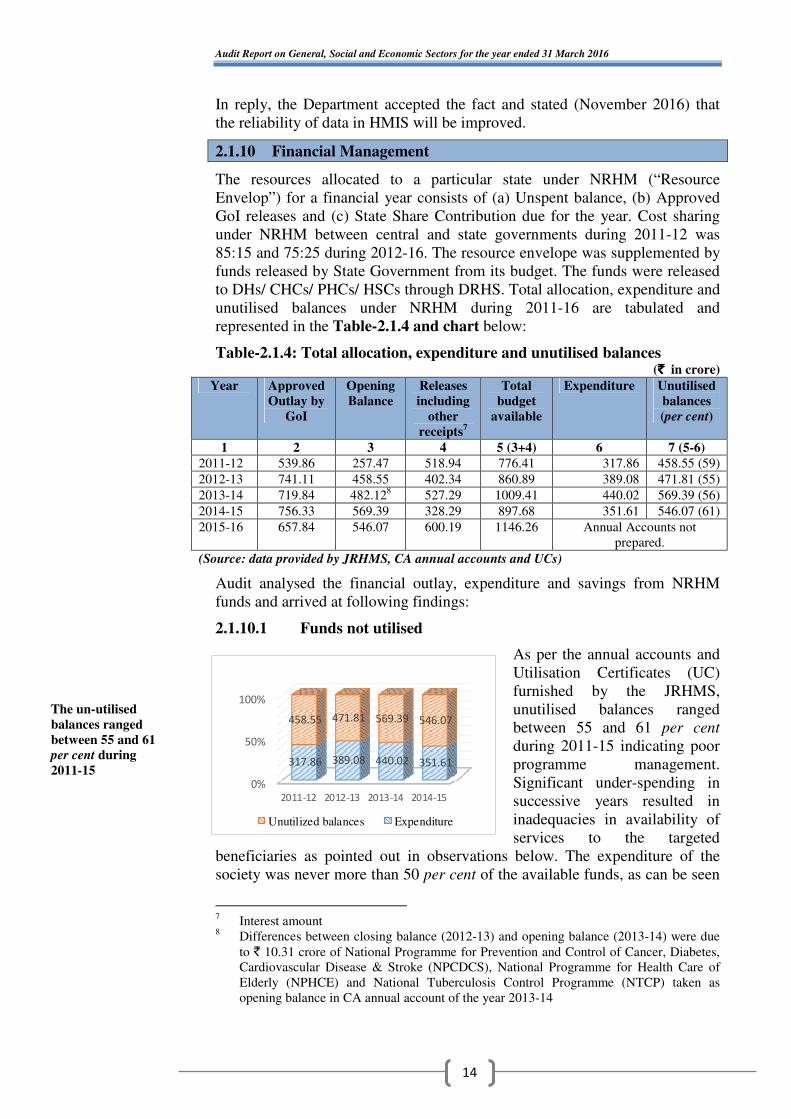
2.1.10 Financial Management
The resources allocated to a particular state under NRHM (“Resource
Envelop”) for a financial year consists of (a) Unspent balance, (b) Approved
GoI releases and (c) State Share Contribution due for the year. Cost sharing
under NRHM between central and state governments during 2011-12 was
85:15 and 75:25 during 2012-16. The resource envelope was supplemented by
funds released by State Government from its budget. The funds were released
to DHs/ CHCs/ PHCs/ HSCs through DRHS. Total allocation, expenditure and
unutilised balances under NRHM during 2011-16 are tabulated and
represented in the Table-2.1.4 and chart below:
Table-2.1.4: Total allocation, expenditure and unutilised balances (`̀̀̀ in crore)
Year Approved
Outlay by
GoI
Opening
Balance
Releases
including
other
receipts7
Total
budget
available
Expenditure Unutilised
balances
(per cent)
1 2 3 4 5 (3+4) 6 7 (5-6)
2011-12 539.86 257.47 518.94 776.41 317.86 458.55 (59)
2012-13 741.11 458.55 402.34 860.89 389.08 471.81 (55)
2013-14 719.84 482.128 527.29 1009.41 440.02 569.39 (56)
2014-15 756.33 569.39 328.29 897.68 351.61 546.07 (61)
2015-16 657.84 546.07 600.19 1146.26 Annual Accounts not
prepared.
(Source: data provided by JRHMS, CA annual accounts and UCs)
Audit analysed the financial outlay, expenditure and savings from NRHM
funds and arrived at following findings:
2.1.10.1 Funds not utilised
As per the annual accounts and
Utilisation Certificates (UC)
furnished by the JRHMS,
unutilised balances ranged
between 55 and 61 per cent
during 2011-15 indicating poor
programme management.
Significant under-spending in
successive years resulted in
inadequacies in availability of
services to the targeted
beneficiaries as pointed out in observations below. The expenditure of the
society was never more than 50 per cent of the available funds, as can be seen
7 Interest amount
8 Differences between closing balance (2012-13) and opening balance (2013-14) were due
to ` 10.31 crore of National Programme for Prevention and Control of Cancer, Diabetes,
Cardiovascular Disease & Stroke (NPCDCS), National Programme for Health Care of
Elderly (NPHCE) and National Tuberculosis Control Programme (NTCP) taken as
opening balance in CA annual account of the year 2013-14
0%
50%
100%
2011-12 2012-13 2013-14 2014-15
317.86 389.08 440.02 351.61
458.55 471.81 569.39 546.07
Unutilized balances Expenditure
The un-utilised
balances ranged
between 55 and 61
per cent during
2011-15

Chapter-2: Performance Audit
15
in the adjoining chart. The reasons behind inability to spend the fund were
delayed preparation and approval of State PIP by JRHMS (paragraph 2.1.8)
and severe shortage of specialist doctors, medical officers, staff nurses, para-
medics (paragraph 2.1.13.1).
In reply, the Department accepted the fact and stated (November 2016) that
unutilised balances would be reconciled and utilised shortly.
2.1.10.2 Short Releases due to persistent under-spending
Due to persistent inability to utilise GoI funds Audit noticed shortfall in
release of central share which ranged between ` 71.38 crore and ` 273.40
crore (16 and 49 per cent) during 2011-16 (overall short release 32 per cent).
In case of state share there were short release of ` 70.28 crore (38 per cent)
and ` 187.53 crore (99 per cent) during 2012-13 and 2014-15 respectively and
excess in the other three years due to excess/ short budgetary provisions by the
state. Performance based incentives (implemented from 2013-14) were to be
released by GoI subject to fulfilment of conditionalities by state governments
from the year 2013-14. No records relating to any such assessment was
available with the JRHMS. Audit, however, observed that GoI had not
released the incentives amounting to ` 160.06 crore during 2013-16
(Appendix-2.1.5).
In reply, the Department stated (November 2016) that efforts would be made
to fulfil conditions of grant to ensure full release in future.
2.1.10.3 Mis-match in unspent balances
As per the scheme guidelines, UCs were to be submitted to GoI by JRHMS
certifying the amount actually spent against the grant disbursed and unspent
balances. UCs submitted to GoI were based on Annual Accounts prepared by
CA for 2011-15. Audit of annual accounts revealed mis-match in unutilised
balances in the two sets of records as detailed in Table-2.1.5 below:
Table-2.1.5: Suppression of unspent balances in UCs submitted to GoI
(` ` ` ` in crore)
Year Unspent balances as
per Annual Accounts
(CA reports)
Unspent balances as
per UCs submitted to
GoI
Mis-match of unspent
balances
2011-12 458.55 234.47 224.08
2012-13 471.81 176.07 295.74
2013-14 569.39 30.58 538.81
2014-15 546.07 528.00 18.07
2015-16 Annual Accounts not prepared as yet
Total 2045.82 969.12 1076.70
(Source: JRHMS, CA reports and UCs)
Thus, against actual unspent balances of ` 2045.82 crore in the Audited
Accounts, only ` 969.12 crore were depicted in the UCs during 2011-15. This
indicated a mis-match of ` 1076.70 crore which included interest earnings of
` 51.19 crore (91 per cent of the interests earned) by the State/district societies
(Appendix-2.1.6) during 2011-15. Of this, ` 1.03 crore was found spent on
activities (Appendix-2.1.7) not approved under RoP in four districts.
Short release of GoI
funds ranged between
`̀̀̀ 71.38 crore and
`̀̀̀ 273.40 crore due to
persistent under-
spending
Mis-match of unspent
balance between annual
accounts and UCs
resultantly interest
amount `̀̀̀ 1.03 crore was
found spent on activities
not approved under RoP

Audit Report on General, Social and Economic Sectors for the year ended 31 March 2016
16
In reply, the Department accepted the fact and stated (November 2016) that
initially state releases were not sent in UCs, which led to discrepancy between
the figures. The figures for 2014-15 would be reconciled.
2.1.10.4 Bank Reconciliation
As per scheme guidelines, Bank Reconciliation Statement (BRS) should be
prepared on monthly basis by reconciling the cashbook and Bank passbook by
10th
day of the following month. Separate BRS should be prepared for each
bank account. Out of the 39 bank accounts maintained by JRHMS, statements
of 23 bank accounts (Appendix-2.1.8(a)) were provided to audit while
remaining 16 bank accounts were not provided despite several requests
(Appendix-2.1.8(b)). From the statements provided and the CA reports, Audit
noticed that BRS were not prepared by the JRHMS since 2011-12. Audit
further noticed significant differences of up to ` 72 crore between the closing
balances of the JRHMS cash book and the bank balances (Appendix-2.1.8(c)).
A difference of ` 72 crore for the year when most of the payments were made
by RTGS/NEFT besides not disclosing the transactions through the 16 bank
accounts leaves JRHMS fraught with the risk of mis-appropriation/ fraud. This
difference needs reconciliation and investigation.
The risk is further strengthened by the fact that in DH, Dumka, ` 3.60 lakh
were disbursed to an agency for supply of medicines and salary of paramedics
by issue of three cheques during January and July 2014. However, scrutiny of
bank statement revealed that against these issued cheques ` 4.03 lakh were
debited from the bank account. Thus, there was an excess debit of ` 0.43 lakh
which remained as excess disbursement to the agency and paramedics as of
August 2016. The excess disbursement could have been detected had the DH
ensured regular reconciliation of bank account and cash book. The excess
debit needs investigation.
In reply, the Department stated (November 2016) that tender for preparing
Bank Reconciliation Statement (BRS) is under process. It was also stated that
disbursements would be verified and responsibilities would be fixed.
2.1.10.5 Outstanding Advances
As per scheme guidelines, detailed advance register and advance tracking
register should be maintained to record various advances given to
implementing units, staff and external parties/suppliers. Audit observed that
these were not being maintained in JRHMS. Scrutiny of CA reports (2011-12
to 2014-159) revealed outstanding advances worth ` 48.18 crore pending
against different parties/ officials/staff. Purposes for which advances were
given were not included in the schedules to the annual accounts. Audit noticed
that:
• Advances to 35 Parties/Officials amounting to ` 5.32 crore were
outstanding for more than four years and in 14 cases advances amounting to
` 33.04 crore were outstanding for four years without any adjustment as of
March 2015.
9 Updated position could not be ascertained as Annual account for the year 2015-16 was
not prepared as yet
Bank reconciliation
statement not
prepared since
2011-12 resulting in
significant difference
Chapter-2: Performance Audit
17
• Advances in 79 cases amounting to ` 43.73 crore which is 91 per cent of
total advance as of March 2015 were outstanding without any adjustment for
more than one year. The unadjusted advances would have also resulted in a
loss of at least ` 7.06 crore calculated on the basis of four per cent simple
interest rated provided by the banks (Appendix-2.1.9).
• Of the 55 staff against whom ` 31 lakh (Appendix-2.1.10) was
outstanding, 26 staff with outstanding advances of ` 21.56 lakh were not
currently working with the JRHMS making their settlement a remote
possibility. Further, the possibility of mis-utilisation/ mis-appropriation of the
advances outstanding for such a long period could not be ruled out.
In reply, the Department accepted the fact and stated (November 2016) that
outstanding advances will be recovered.
2.1.10.6 Irregular release/ expenditure of facility funds
As per Operational Guidelines for Financial Management, 2012, Untied Funds
(UF), Hospital Management Society (HMS) funds would be provided to those
health facilities such as DHs/RHs/CHCs/PHCs/HSCs where institutional
deliveries are conducted. The Annual Maintenance Grant (AMG) would be
provided to the facilities functioning in government building.
The CHCs in block headquarters (sadar block) where DHs or RHs are located
do not have provision for UF, AMG and HMS funds as per Record of
Proceeding (ROP). In the three test checked districts10
, audit observed that
UF/AMG/HMS funds of ` 21 lakh (Appendix-2.1.11) were irregularly
disbursed to the Medical Officer in charge (MOIC) of sadar CHCs Jamtara,
Dumka and West Singhbhum which had administrative control over PHCs in
sadar area. Of this ` 25.08 lakh11
were spent by the Medical Officer-in-Charge
(MOIC) during 2011-16.
CS-cum-CMO Jamtara stated that the CHC had been operating in a building
owned by the Block level administration and provided various services such as
immunisation centre and family planning camp and therefore required
administrative expenses. The reply confirms use of hospital based grants for
other purposes. CS cum CMOs of CHCs Dumka and West Singhbhum did not
reply to the audit observation.
2.1.10.7 Idle funds
Prior to 2011-12, pool-wise allocation under NRHM was not made by JRHMS
due to which, in Dumka DRHS, the closing balance of ` 5.32 crore on account
of RCH, NRHM and RI including interest could not be merged with the new
pool-wise (RCH Flexi-pool, NRHM Flexi-pool and Routine immunisation)
allotment of funds from the year 2011-12 onwards. This amount was still
found parked as of March 2016 in the separate bank account opened for the
erstwhile purpose.
In reply, the Department stated (November 2016) that responsibilities would
be fixed.
10
Dumka, Jamtara and West Singhbhum 11
Including balances of previous year
UF, AMG and HMS
funds were irregularly
released where DHs
and RHs already
existed
Funds prior to 2011-12,
was not merged in new
pools thereby `̀̀̀ 5.32
crore was found parked
in bank account as of
March 2016

Audit Report on General, Social and Economic Sectors for the year ended 31 March 2016
18
2.1.10.8 Incentives to JSY beneficiaries not paid
Janani Suraksha Yojana (JSY) is a safe motherhood intervention under
NRHM. It integrates cash assistance with delivery and post-delivery care to
create demand for institutional delivery. For every delivery conducted in the
institution (DH, CHC, PHC and HSC) cash incentive of ` 1400 is to be paid to
each beneficiary. In five test checked districts, audit observed that out of 4.08
lakh institutional deliveries, incentives were paid to 3.21 lakh beneficiaries
during 2011-16. Thus, 87,098 beneficiaries were not paid JSY incentives of
` 12.19 crore during 2011-16 (Appendix-2.1.12).
In reply, the Department accepted the fact and stated (November 2016) that
presently payments were being made through Public Financial Management
System (PFMS) and delays were due to bank account mismatches. Efforts
were being made to reduce the dues. Fact remains that 51,447 beneficiaries
were still to be paid incentives.
2.1.11 Availability of Physical Infrastructure
NRHM is aimed to bridge the gaps in existing capacity of rural health
infrastructure by establishing functional health centres through revitalisation
of existing physical infrastructure and fresh construction or renovation as
required. Audit observed deficiencies in delivery of this mandate by the
department as discussed below.
2.1.11.1 Shortages in Bed Capacity
The IPHS norms prescribe bed capacity requirement of District Hospitals
(DH) on the basis of population served12
. The norms also specify at-least 50,
30 and six beds for SDH, CHC and PHC, respectively. Audit compared
prescribed norms for number of beds with actual availability by visiting the
sample units and observed the following:
(i) District Hospitals
As per IPHS norms, requirements of bed in DHs ranged from 200 to 500 in the
five sampled districts13
on the basis of Census 2011. Against this, only100-120
beds were available in DHs of selected districts and shortage in bed capacities
ranged from 100 (50 per cent) to 380 (76 per cent). Details are given in
Table-2.1.6 below:
12
Requirement of bed = population x 1/50 x 80/100 x 1/365 13
Dumka, Giridih, Gumla, Jamtara and West Singhbhum
JSY incentive `̀̀̀ 12.19
crore was not paid to
87,098 beneficiaries
There were significant
shortage of bed
capacity in DHs, CHCs,
SDH and PHCs of
test-checked districts

Chapter-2: Performance Audit
19
Table-2.1.6: Details of requirements of bed capacity in selected districts
Sl.
No.
District Population
(Census 2011)
Prescribed
Bed Capacity
Available
Bed Capacity
Shortfall (in
number of bed/
per cent)
1. Dumka 1321096 300 100 200 (67)
2. Giridih 2445203 500 120 380 (76)
3. Gumla 1025656 200 100 200 (67)
4. Jamtara 790207 200 100 100 (50)
5. West
Singhbhum
1501619 300 100 200 (67)
(Source: DRHS)
From the Table-2.1.6 it could be seen that the deficit bed capacity is highest in
Giridih at 76 per cent and lowest in Jamtara at 50 per cent.
(ii) Community Health Centre
Against the prescribed requirement of 30 beds, the shortages in bed capacity in
10 out of 12 sampled CHCs ranged from 14 (47 per cent) to 27 (90 per cent)
(Appendix-2.1.13). The worst situations were in Tonto and Bagodar CHCs
that were functioning with only three beds each.
(iii) Sub-divisional Hospital
In one sampled SDH, shortage in bed capacity was eight (16 per cent) against
the requirement of 50 beds (Appendix-2.1.13).
(iv) Primary Health Centre
A test-check of bed capacity of test-checked 23 PHCs revealed that:
• Three PHCs14
(13 per cent) had no beds and were operating in HSC/ old
OPD building against the requirement of six beds;
• Thirteen PHCs15
had bed capacities ranging from one to three against the
requirement of six beds.
In reply, the Department stated (November 2016) that efforts were being made
to improve availability of physical infrastructure. However, road map to
ensure this was not furnished to Audit.
14
Anandpur, Dhandra and Maluti 15
Amba, Atka, Barmasia, Barapalasi, Bhandro, Bindapathar, Chiknia, Duria, Juria, Kurgi,
Nimiaghat, Suriya and Tuladih

Audit Report on General, Social and Economic Sectors for the year ended 31 March 2016
20
2.1.11.2 Operational conditions
State government in its annual plan 2012-13 planned construction or
upgradation of existing CHCs/ PHCs/ HSCs only to increase bed capacity and
associated facilities through NRHM and State Plan funds. The detailed status
of construction/ upgradation (as on October 2015) is detailed in the
Table-2.1.7 below:
Table-2.1.7: Detailed requirement of CHCs, PHCs and HSCs in the State
Sl.
No.
Name
of
facility
Existing
facility
Planned
Construction/
Upgradation in
existing facility
Construction/
Upgradation
completed
Under
Construction/
Not taken up
Operating
with
inadequate
facilities/ old
buildings
1 2 3 4 (3-4) (2-4)
1 CHC 188 162 73 89 115
2 PHC 330 196 65 131 265
3 HSC 3958 1402 728 674 3230
(Source: State NHM)
From the Table-2.1.7 it is evident that 115, 265 and 3230 CHCs, PHCs and
HSCs respectively were operating in buildings with inadequate bed capacity/
facilities, thereby rendering limited health services to the population served.
Furthermore, in physical verification of operating condition of sampled health
facilities, Audit noted that:
Primary Health Centres
• Three test-checked PHCs16
did not exist and their funds/ manpower were
being utilised by two linked CHCs (Palkot and Tonto);
• Five PHCs17
were operating in other government buildings like
Anganwadi Centre, Panchayat Bhawan etc.
• Newly constructed building of PHC Anandpur, in West Singhbhum district
was occupied by Central Reserve Police Force (CRPF) since 2011-12, while
the PHC was operating from its old OPD building.
Health Sub-Centres
Out of 69 selected HSCs in five test checked districts18
, Audit noticed that:
• Twelve HSCs19
were operating in rented buildings;
• There was absence of beds in two Type B20
HSCs21
in Tonto, West
Singhbhum;
• Eleven HSCs22
were operating from other government buildings i.e.
Anganwari Centres, Panchayat Bhawans etc.
16
Biligbira, Tonto gram and Tonto headquarter 17
Ataka, Chekania, Dhandra, Maluti and Sariya 18
Dumka, Giridih, Gumla, Jamtara and West Singhbhum 19
Balgoh, Banguru, Birajpur, Deogaon, Kharkhari, Khatangbera, Jakilata, Luyia, Pithartoli,
Padampur, Tensera and Tirilposi 20
Type B HSCs were supposed to provide facility for normal deliveries 21
Tonto and Samij 22
Ataka, Bagodih, Dhangaon, Geriya, Lilakari, Mandramo, Mundro, Nagar Keswai, Maluti,
Mohanpur and Serengsiya
115, 265 and 3230 CHCs,
PHCs and HSCs were
operating in building
with inadequate bed
capacity thereby
rendering limited health
services

Chapter-2: Performance Audit
21
PHC &HSC, Maluti operating in one
building at Shikaripara, Dumka district HSC, Dhangaon operating at Anganwari
Centre in Chakradharpur sub division,
West Singhbhum
Thus, due to absence/shortages in bed capacity, essential services, particularly
in-patient services, were being denied to the targeted population.
In reply, the Department stated (November 2016) that efforts were being made
to improve availability of physical infrastructure.
2.1.11.3 Construction of additional HSCs beyond norms
As per IPHS norms, one HSC is required for a population of 3000-5000. Audit
observed construction of 18 buildings under different schemes (State fund,
IAP and NRHM) for nine HSCs in West Singhbhum district and found the
following:
• Four HSCs23
building were constructed (December 2011) for ` 84.95 lakh
under IAP funds. These HSCs buildings were again constructed in December
2015 from other funds (three under NRHM and one under State funds) at
` 97.07 lakh;
• Two buildings for one HSC at Makranda in Manoharpur block were
constructed in November 2011 under IAP for ` 42.78 lakh (at ` 21.39 lakh
each);
• One building for HSC at Kusmita in Kumardungi block was under
construction since April 2011 under IAP with an expenditure (July 2016) of
` 9.63 lakh, whereas another HSC building was constructed (April 2015) at
the same place under NRHM at a cost of ` 22.75 lakh;
• Two HSCs24
building were constructed (April 2015) under NRHM at a
cost of ` 46.27 lakh. However, two additional HSC buildings were under
construction since August 2014 under state fund and expenditure as on March
2015 was ` 22.67 lakh;
• One building for HSC at Putasia in Manjhari block was constructed
(December 2011) under IAP at a cost of ` 18.25 lakh but again construction of
another building was taken up in August 2014 under state fund on which
` 14.34 lakh was incurred as of March 2015.
23
Chitmitti, Kalenda, Pilka and Purnapani 24
Nakti and Purnia
Additional HSC
buildings were
constructed in same
places where HSCs
existed

Audit Report on General, Social and Economic Sectors for the year ended 31 March 2016
22
The population of above mentioned villages ranged from 1378 to 2548. Thus,
the construction of additional HSC buildings in the same place where an HSC
already existed was in violation of IPHS norms. Further, lack of coordination
among departments and inadequate monitoring by the government resulted in
wasteful expenditure ` 165.10 lakh (Appendix-2.1.14 (a) & (b)) and denied
the construction of an HSC in locations that actually required it.
In reply, the Department stated (November 2016) that the duplicate
construction would be verified and responsibilities would be fixed.
2.1.11.4 Idle Health Centre buildings
• CHC Bharno in Gumla district constructed at an estimated cost of ` 2.75
crore and handed over in August 2014 was not being utilised due to poor road
connectivity, lack of machines and equipment and shortage of manpower.
Building constructed for CHC Bharno in Gumla
lying unutilised
HSC and PHC Bindapathar run jointly in the
smaller red building, while the larger double
storey building in the picture is lying unused
• Likewise HSC Bindapathar in Jamtara district constructed at a cost of
` 14.49 lakh and handed over during January 2015 was still not put to use
(October 2016).
In reply, the Department accepted the fact and assured (November 2016) to
make such buildings functional by procurement of machines and equipment
and sanctioning manpower.
2.1.11.5 Availability of staff quarters
As per IPHS norms 2012 all essential medical and para-medical staff should
be provided with residential accommodation so as to ensure 24x7 service
delivery. Audit observed that against requirement of 1053 quarters as per
revised IPHS norms 2012, 300 quarters were available in the 66 test checked
health facilities as detailed in Table-2.1.8 below:
Table-2.1.8: Requirements and availability of staff quarters
Health facility Number
of health
facilities
Staff quarters
required as per IPHS
norms
Staff quarters
available
Shortage of
staff quarters
(In per cent)
1 2 3 4 5 (3-4)
DHs 5 500 194 306 (61)
CHCs/ SDH 13 247 72 175 (71)
PHCs 21 252 18 234 (93)
HSCs (type B) 27 54 16 38 (70)
66 1053 300 753 (72)
The CHC, Bharno and
HSC, Bindapather
constructed at cost of
`̀̀̀ 2.89 crore were not
being utilised
The 300 staff quarters
were available in test-
checked health facilities
against required 1053

Chapter-2: Performance Audit
23
Inadequacy of staff quarters might be one of the reasons for shortages in
availability of medical staff at various levels. Further, 24 hour availability of
staff cannot be ensured in the absence of suitable accommodation
arrangements close to the health facilities.
In reply, the Department stated (November 2016) that efforts were being taken
to improve availability of physical infrastructure.
2.1.12 Equipment Procurement and Availability
2.1.12.1 Absence of equipment in health facilities
IPHS norms 2012, recommend equipment for various grades of health centres
on the basis of services recommended at each level. The details of availability
of equipment for test-checked services in the sampled facilities for which
norms recommend 336 equipment for DH, 264 equipment for CHC and 132
equipment for SDH are as follows:
• In the five DHs, 191 (57 per cent) to 289 (86 per cent) essential equipment
were not available against requirement of 336 for the test-checked
(Appendix-2.1.15) services25
while in one SDH, 104 (79 per cent) essential
equipment were not available against requirement of 132 for the test-checked
(Appendix-2.1.16) services.
• In 12 CHCs of five test checked districts, 116 (44 per cent) to 244
(92 per cent) essential equipment were not available against requirement of
264 essential equipment for 17 services26
(Appendix-2.1.17).
In reply, the Department stated (November 2016) that issue of shortages
would be taken care of shortly and that the department is moving from local
procurement to central procurement and distribution. Fact remains that a time
bound action plan to address the shortages was not yet prepared.
2.1.12.2 Purchase and Utilisation of machine and equipment
The details of examination of purchase and utilisation of machine and
equipment in the sample units revealed the following observations:
• JRHMS and CS-cum-CMOs approve rate-contracts across state and
district respectively at which the respective sub-ordinate offices are required to
procure the listed medicines/ consumables from the approved vendors. Audit
noticed that CS, Jamtara procured various Equipment/ Rashtriya Bal Swasthya
Karyakram (RBSK) Cards (Appendix-2.1.18) at prices higher than approved
rate-contract resulting in an excess payment of ` 2.94 lakh.
25
Imaging equipment, X-ray room accessories, cardiopulmonary equipment, Labour Ward,
New Natal and special New born Care Unit (SNCU), Immunisation equipment, Ear Nose
Throat (ENT) equipment, Eye equipment, Dental equipment, Operation Theatre
equipment and Laboratory equipment 26
Standard Surgical Set-I, Standard Surgical Set-II, Standard Surgical Set-III, Standard
Surgical Set-IV, Standard Surgical Set-V, Standard Surgical Set-VI, Intra Uterine
Contraceptive Device (IUD) Insertion Kit, Normal Delivery, Equipment for Anesthesia,
Equipment for Neo-Natal Resuscitation, Blood Transfusion Kit, Operation Theatre
equipment, Labour room equipment, Radiology equipment, Immunisation equipment,
cold chain equipment and miscellaneous
Essential equipment
ranging between 57 and
86 per cent in DHs, 79 per
cent in SDH and 44 and
92 per cent in CHCs were
not available in test-
checked health facilities
against required as per
IPHS norms

Audit Report on General, Social and Economic Sectors for the year ended 31 March 2016
24
• CS Jamtara, procured furniture items amounting to ` 19.81 lakh on five
different invoices during 2011-12 on nomination basis without floating any
tender and on single quotation basis thereby violating the norms of sanction
order. However, this included ` 2.33 lakh for purchase of four radiant
warmers for which supply order was initially issued but later cancelled and
diverted to purchase of furniture. Besides, eight Diesel Generating (DG) sets
were also procured for which excess payment of ` 0.49 lakh was made.
• DRHS Jamtara entered into an agreement (November 2012) with an NGO
(Basuki Trayambkeshwar Seva Mission, Dumka) for identifying the cases fit
for cataract surgery, motivate and provide transportation to the base hospital,
pre-operative examination, undertaking cataract surgery and post-operative
care and follow up services including refraction and provision of glasses. The
Additional Chief Medical Officer (ACMO), issued order (October 2013 and
December 2015) to NGO to carry out the agreed activities of cataract surgery.
Audit observed that the agreement and payment of ` 16.99 lakh to the NGO
for the services rendered was in contravention of guidelines/ government
orders because as per the scheme, payments were to be made only if the NGO
arranged private surgery in a private hospital while in this case the NGO
utilised services and infrastructure of Government Doctors/ Hospital for the
surgeries.
No reply to audit observations was furnished by the government.
• Idle machine and equipment
Audit observed that 26 machines/ equipment such as Auto Analyser, Path
Fast, Three Channel ECG Machines, Multi Parameters Patient Monitors and
Cardiac Monitors with Defibrillator etc., were lying idle in the test checked
DHs and CHCs since their purchase in March 2011. The value of these
machines and equipment was ` 3.11 crore (Appendix-2.1.19). These were
idle/ not functional due to absence of trained man power, reagents/kit etc in
health facilities.
• Purchase of four27
machines (valued at ` 67.53 lakh) during 2011-12 by
CS, West Singhbhum was doubtful as the payment vouchers were not passed
by the CS and stock register was not produced to audit. The CS-cum-CMO
stated (August 2016) that the concerned person has been asked to provide the
record.
Auto analyser and Path Fast lying idle
in District Hospital, Jamtara
USG machines lying idle in District
Hospital, Jamtara
27
Multi para patient monitor, Portable Ultrasound machine, Fully automatic immunoassay
and Diathermy
Machines and
equipment worth
`̀̀̀ 3.11 crore were lying
idle in the test-checked
DHs and CHCs

Chapter-2: Performance Audit
25
In reply, the Department stated (November 2016) that efforts would be taken
to improve utilisation of idle equipment. However, no reply for doubtful
purchase was furnished by government.
2.1.12.3 Mobile Medical Units (MMU)
Mobile Medical Unit is a mechanism to provide health services in remote
areas through well-equipped mobile vans. Agreements were executed with
different NGOs by JRHMS, Namkum and DRHS of concerned districts during
2011-13 to run MMUs. Audit noticed the following irregularities in provision
of health services through MMUs in test checked districts:
• No deployment of Lady Medical Officer
As per the agreements, a Lady Medical Officer (LMO) was to be deployed for
obstetric and gynaecological consultation, Antenatal checkups (ANC), etc. In
five test checked districts28
Audit observed that eight NGOs29
did not deploy
LMO between April 2011 and October 2013. Moreover, when agreements
were renewed with NGOs (between March 2013 and October 2013) the clause
to deploy LMO was deleted.
• Irregular preparation of route chart
As per Government instruction (June 2012) and agreements, the MMU were to
camp in hard to reach areas where health facilities such as CHC, PHC & HSC
are absent. The route chart for movement of MMU was to be prepared in
coordination with CSs, MOICs, Programme Managers and NGOs. In four test
checked districts30
Audit noticed that MMUs were being camped at places
where CHCs/ PHCs/ HSCs were already operating in violation of government
instructions for which no reasons were on record (Appendix-2.1.20).
• Shortfall in machine and equipment
As per agreements, the JRHMS provided 33 equipment in the MMU vans to
the NGOs. In four districts31
, Audit noticed that out of 33 machines and
equipment, three to 26 machines and equipment were either not kept in the
MMU or lying idle/damaged between January 2010 and October 2015.
Reasons for this were not on record.
• Shortage of MMU
In five test checked districts32
the CS projected requirement of 31 MMUs in
the five districts based on hard to reach areas in the block. Against this only 20
MMUs were available with a shortage of 11 MMUs (Appendix-2.1.21).
In reply, the Department accepted the fact and stated (November 2016) that
functioning of MMUs would be streamlined as per the recommendation of
UNICEF. However, timeline for ensuring this was not stated.
28
Dumka, Giridih, Gumla,Jamtara and West Singhbhum 29
Vikash Bharti, Bishunpur; ICERT, Ranchi; Lievenc Health Centre, Chainpur; Rinchi
Trust Hospital, Ranchi; Jharkhand Step-Up Trust, Badajamda; Citizen Foundation,
Ranchi; Human Rural Foundation, Ranchi and Vikas Kendra, Bagodar 30
Dumka, Gumla, Jamtara and West Singhbhum 31
Dumka, Giridih, Gumla and West Singhbhum 32
Dumka, Giridih, Gumla, Jamtara and West Singhbhum
MMUs were being
camped at places
where CHCs/ PHCs/
HSCs were already
operating in violation
of government
instructions

Audit Report on General, Social and Economic Sectors for the year ended 31 March 2016
26
Out of order X-ray machine installed in MMU run by NGO Vikash Bharti in
West Singhbhum district
2.1.12.4 Absence of ambulance service
As per IPHS norms 2012, DH shall have well equipped Basic Life Support
(BLS) and desirably one Advance Life Support (ALS) ambulance.
Audit observed that target for procurement of 503 ambulances (` 50.30 crore)
was made during 2015-16 against which 369 ambulances (BLS-329 and
ALS-40) for ` 39.30 crore were approved in RoP of the year 2015-16. Further,
funds ranging from ` 22.40 crore to ` 39.30 crore sanctioned every year
(2012-16) under NRHM for procurement of ambulances were left unutilised
by the JRHMS as not a single ambulance had been purchased or made
operational till date (Appendix-2.1.22).
In reply, the Department stated (November 2016) that process of procurement
of ambulances was under process.
2.1.12.5 Bio Medical Waste Management System not functional
IPHS norms 2012, prescribe infrastructure, equipment and procedure for
disposal of Bio-Medical waste generated by a health facility. Following
irregularities were noticed in test checked districts:
• At DH Dumka, ` 18.40 lakh was sanctioned (January 2012) for
institutionalisation and strengthening of Bio Medical Waste Management
System (BMWMS). Of this, ` 4.95 lakh was spent on construction of
infrastructure (Deep Burial pit, sharp pit and trench with tin roof and bamboo
baricate) and procurement of equipment (trolley), consumables items (puncher
proof container, sealing tapes, apron, cap, spectacles, boot, gloves, black bins,
red bins, yellow bins etc.) and remaining ` 13.45 lakh was lying idle as
BMWMS was not functional due to failure to create other required
infrastructure. As a result, waste was being disposed-off in the open as can be
seen in the photographs below:
Unused deep Open waste disposal in District Hospital, Dumka
Fund of `̀̀̀ 39.20 crore
not utilised for
procurement of 369
ambulances (BLS
and ALS)
Bio Medical Waste
Management System
was not found
functional in test-
checked health
facilities

Chapter-2: Performance Audit
27
In DH Gumla and Chaibasa, incinerators (valued at` 29.98 lakh) constructed
for disposal of bio-medical waste were found idle and condemned since
January 2013 and October 2013 respectively.
Idle incinerator at DH, Gumla Condemned incinerator at DH, West
Singhbhum, Chaibasa
On this being pointed out (between June 2016 and September 2016) Deputy
Superintendent, Gumla replied (June 2016) that the incinerator could not be
made functional due to lack of required power load for which the Principal
Secretary, Health, Medical Education and Family Welfare, GoJ was requested
(July 2015) to take action but his response was awaited (November 2016). No
reply was furnished by the Government.
2.1.13 Availability of Health Care Professionals
IPHS norms 2012, prescribe 24 hours service provision for CHC, PHC and
HSC. It further prescribes manpower requirement for DHs on the basis of bed
strength which in turn is prescribed on the basis of population served. The
health facilities in the state are supported by regular staff (paid from State
budget) and Contractual Staff recruited under NRHM funds.
2.1.13.1 Human resource shortages
The SS and person-in-position (PIP) of Specialist33
doctors, Medical Officers,
Staff Nurses, ANMs and Para medics34
of the State at DHs, SDHs, CHCs,
PHCs and HSCs levels is given in Table-2.1.9 below:
Table-2.1.9: Sanctioned strength and men-in-position as on 31 March 2016
Name of post Required
as per
IPHS
norms
Regular Contractual Shortfall in PIP
SS PIP SS PIP As per
IPHS (in
per cent)
As per SS
(in per cent)
1 2 3 4 5 6 7 [2-(4+6)] 8 [(3+5)-
(4+6)]
Specialist doctors 2776 876 172 157 58 2546 (92) 803 (78)
Medical Officers 4586 2733 1793 86 15 2778 (61) 1011 (36)
Staff Nurse/ ANM 12082 5351 3619 6528 5160 3303 (27) 3100 (26)
Para Medics 1856 1124 469 415 415 972 (52) 655 (40)
(Source: State NHM)
33
Medicine, Surgery, Obstetric & Gynecologist, Pediatrics, Anaesthesia, Ophthalmology,
Orthopedics, Radiology, Pathology, ENT, Dental, Psychiatry and Ayush doctors 34
Laboratory Technician, Pharmacist, Operation Theatre technician
There were shortages
of Specialist doctors
(92 per cent), Medical
officers (61 per cent),
Staff Nurses/ ANMs
(27 per cent) and
Paramedics
(52 per cent) as
compared with IPHS
norms

Audit Report on General, Social and Economic Sectors for the year ended 31 March 2016
28
0%
50%
100%
230 1808 8779 964
2776 4586
12082 1856
PIP Requirement (IPHS)
From Table-2.1.9 it could be seen
that shortages of Specialist
doctors were 92 per cent when
compared with IPHS norms and
78 per cent as compared to the
sanctioned strength. Similarly,
there were shortages in cadres of
Medical officers (61 and
36 per cent), Staff Nurses/ ANMs
(27 and 26 per cent) and
Paramedics (52 and 40 per cent)
with respect to IPHS norms and
SS respectively.
In five35
test checked districts, out of 92 PHCs, 30 PHCs (33 per cent) were
operated by Staff Nurse/ ANMs without any Medical Officer. Further no
Paramedics were available in any of the test checked PHCs. Out of 48 CHCs
in the sample districts, 28 CHCs (58 per cent) were operating without
specialist doctors. In three36
out of five DHs, neither Gynaecologist nor
Paediatrician were posted.
In reply, the Department accepted the fact and stated (November 2016) that
the recruitment process to fill up vacancies is under process. However, no
timeline was furnished.
2.1.13.2 Shortage of Speciality treatment
IPHS norms (2012) recommend treatment of 200 types of illness under 32
medical/ surgical specialties through performance of 500 procedures at district
hospitals (DH). The results of test-check of speciality treatment in the five
district hospitals37
as of July 2016 are given in Table-2.1.10 below:
Table-2.1.10: Details of departments, procedures and treatment of illness
Sl.
No.
Name of
selected
district
Speciality
treatment
recommended
(IPHS norms)
Number
of illness
requiring
treatment
in DH
(IPHS
norms)
Speciality
treatment
(partial)
available
in DH (in
number/
per cent)
Types of
illness
treated
in DH
(in
number)
Shortfall of
recommended
speciality (in
number / per
cent)
Shortfall
of
treatment
of illness
in DH (in
number/
per cent)
1 Dumka 32 200 6 (19) 48 26 (81) 152 (76)
2 Giridih 32 200 8 (25) 169 24(75) 31(16)
3 Gumla 32 200 9 (28) 145 23 (71) 55 (28)
4 Jamtara 32 200 14 (44) 58 18 (56) 140 (70)
5 West
Singhbhum
32 200 11 (34) 31 21 (66) 131 (67)
(Source: DRHS)
From Table-2.1.10 it could be seen that services for 56 to 81 per cent
specialties were not available in the test-checked DHs whereas in 19 to
44 per cent specialities, the services were partial. Hence, treatment/ care for 55
35
Dumka, Giridih, Gumla, Jamtara and West Singhbhum 36
District Hospital Dumka, District Hospital Gumla and District Hospital Jamtara 37
Dumka, Giridih, Gumla, Jamtara and West Singhbhum
In test checked DHs
services for 56 to
81 per cent specialty
treatment were not
available whereas in 19
to 44 per cent
specialities, the services
were partial. Hence
treatment for 55 to 152
types of illness was not
provided to the
community

Chapter-2: Performance Audit
29
(28 per cent) to 152 (76 per cent) types of illness was not provided to the
community.
2.1.14 Training
Training of all cadres of workers at periodic intervals is an essential
component of the IPHS for all health facilities. With regards training,
following deficiencies were noticed during audit:
2.1.14.1 Inadequate SBA training to ANMs
As per revised IPHS norms 2012, the ANM posted at type B HSC (HSC with
delivery facilities) should mandatorily be Skilled Birth Attendance (SBA)
trained. Audit observed that out of 2207 type B HSCs (where deliveries are
conducted), in 618 HSCs, SBA trained ANMs were not posted in violation of
norms. JRHMS replied (October 2016) that instructions have been given to all
CS-cum-CMO to post SBA trained ANMs at type B HSCs.
2.1.14.2 Inadequate training to ASHA (Sahiya)
Each ASHA (Sahiya) shall be trained in public health services such as
information on immunisation/ vaccination, recording weight & height, ANC,
etc. under eight modules. Audit observed that state fixed target for providing
6.40 lakh numbers of training to 40964 Sahiyas during 2011-16 against which
2.12 lakh numbers of training were provided to Sahiyas leaving a shortfall of
4.28 lakh numbers (67 per cent) in providing training. The details of the
modules and ASHAs (Sahiyas) trained, though called for in audit, were not
furnished. The shortfall in training with respect to the targets ranged from 45
to 71 per cent during 2011-16 (Appendix-2.1.23). Insufficient trainings to
ASHAs could have resulted in inadequate awareness generation among the
rural communities.
No reply was furnished by the department to audit observation in this regard.
2.1.15 Short availability of diagnostic services
The IPHS norms 2012 recommend 102 and 33 tests for a DH and CHC
laboratories respectively so that they could perform all tests required to
diagnose epidemic or important diseases. Further, norms recommend X-ray,
Eco Cardio Gram (ECG) facilities to be available in a CHC and that essential38
laboratory services should be available in a PHC.
• In five test checked districts39
, Audit observed that 66 (65 per cent) to 80
(78 per cent) diagnostic tests were not performed in DHs against IPHS
recommended requirement of 102 diagnostic tests. In CHCs, 14 (42 per cent)
to 28 (85 per cent) diagnostic tests, were not done against recommended 33
tests (Appendix-2.1.24).
38
Routine urine, stool and blood tests, diagnosis of RTI/STDs with wet mounting, grams,
stain, sputum testing for mycobacterium, blood smear examination malarial, blood for
grouping and Rh typing, RDK for Pf malaria, rapid tests for pregnancy, RPR test for
syphilis/YAWS surveillance, rapid test kit for fecal contamination of water, estimation of
chlorine level of water using orthotoludine, blood suger etc. 39
Dumka, Giridih, Gumla,Jamtara and West Singhbhum
SBA training were not
provided to ANMs
posted in 618 out of
2207 type B HSCs
65 to 78 per cent
diagnostic tests were not
performed in test checked
DHs. X-ray and ECG
services were not
available in seven and
nine test checked CHCs
respectively. No essential
laboratory services were
available in any test
checked PHCs

Audit Report on General, Social and Economic Sectors for the year ended 31 March 2016
30
• Audit further noticed that essential test facilities viz. X-ray and ECG were
not available in seven and nine test checked CHCs respectively. These test
facilities were also not available in SDH, Chakradharpur.
• It was also noticed that no essential laboratory services were available in
any of the 2140
test checked PHCs.
Thus, there were significant shortages in availability of diagnostic services at
all levels of medical facilities.
Government did not furnish any reply to the audit observation.
2.1.16 Service Delivery Infrastructure
IPHS norms 2012 recommend that drugs and consumables shall be available
in health facilities for delivery of minimum assured services.
2.1.16.1 Absence of medicines in health facilities
As per the norms, DH/ CHC/ PHC/ HSC require 493, 176, 119 and 18 types of
essential medicines respectively for delivery of minimum assured services.
Audit noticed that
• In five DHs, only 61 to 124 types of essential medicines were available
while 369 (75per cent) to 432 (88 per cent) recommended essential medicines
were not available as of March 2016. In 13 CHCs/SDH41
, 31 to 119 types of
essential medicines were available while 57 (32 per cent) to 145 (82 per cent)
recommended essential medicines were not available as of March 2016. In
2142
out of 23 selected PHCs, 15 to 67 types of essential medicines were
available while 106 (61 per cent) to 158 (91 per cent) recommended
medicines were not available as of March 2016 (Appendix-2.1.25).
• It was also noticed that no medicines were available in Kurgi and
Bilingbera PHCs during 2015-16.
• In 57 out of 69 selected HSCs, three to 14 types of essential medicines
were available and four (22 per cent) to 15 (83 per cent) essential medicines
were not available as of March 2016 (Appendix-2.1.26). Further, it was
noticed that no essential medicines were available at 19 HSCs43
during
2015-16.
Absence of essential medicines at health care facilities may impair the
delivery of required medical services.
40
Amba, Ananadpur, Ataka, Bilingbera, Barapalasi, Baramisia, Bhandro, Bindapathar,
Chikania, Dhandara, Duriya, Fatehpur, Geriya, Hathia, Jeraikela, Jura, Kurgi, Maluti,
Nimiaghat, Sariya, and Tuladih 41
Bagodar, Bharno, Birni, Chakradharpur SDH, Dumri, Jama, Kundhit, Manoharpur, Nala,
Palkot, Shikaripara, Sisai and Tonto 42
Amba, Anandpur, Atka, Barmasia, Barapalasi, Bhandro, Bilingbera, Bindapathar,
Chiknia, Dhandara, Duriya, Fatehpur, Geriya, HathiyaJaraikela, Jura, Kurgi, Maluti,
Nimiyaghat, Suriya and Tuladih. 43
Atakora, Babupur, Bangru, Bhandro, Bhabhanbandhi`, Charapura, Duria, Domba,
Fathepur, Harinarayanpur, Jura, Marasili, Margaown, Narayanpur, Pohara, Pithartoli,
Rosantunda, Solga, Satki
Essential medicines
ranged from 75 to 88
per cent in DHs, 32 to
82 per cent in CHCs, 61
to 91 per cent in PHCs
and 22 to 83 per cent in
HSCs were not
available

Chapter-2: Performance Audit
31
In reply, the Department stated (November 2016) that issue of shortages
would be taken care of shortly and the department has been moving from local
procurement to central procurement and distribution. However, the timeline
for ensuring this was not stated.
2.1.16.2 Fraudulent payment on procurement of Diagnostic Kits
As per rule 151 (i) of GFR 2005, limited tender enquiry method may be
adopted when estimated value of the goods to be procured is between ` one
lakh and ` 25 lakh. The number of suppliers firms in limited tender enquiry
should be more than three. Further, as per Office Memorandum44
of Ministry
of Personnel, Public Grievances and Pension, procurement of all items of
office consumption beyond ` one lakh to ` 25 lakh, where limited tender are
to be invited as per rule 151 of the GFR 2005, Kendriya Bhandar (KB) and
National Consumer Co-operative Federation (NCCF), among others, shall also
be invited to participate in such limited tender. Purchase preference will be
granted to KB/NCCF if the price quoted by the Co-operatives is within
10 per cent of the L1 price and if these Co-operatives are willing to match the
L1 price. No price preference over and above the L1 price shall be given to
these Co-operatives. Further, as per rule 137 of GFR 2005, the specifications
in terms of quality, type etc. as also quantity of goods to be procured should be
clearly spelt out and care should be taken to avoid purchasing quantities in
excess of requirement.
• Audit noticed that, CS Dumka and CS Giridih violating the above rules
placed purchase orders to KB, Ranchi on nomination basis for procurement of
Typhoid detection kit (5000 Nos.), HIV Screening test kit (147020 Nos.),
Urine Test kit (53000 Nos.) and Hepatitis ‘B’ test kit (55340 Nos.) valued at
` 2.60 crore without inviting tenders or assessing actual requirement, during
March 2014 to June 2016 from the Janani Shishu Suraksha Karyakaram
(JSSK) fund. Audit further noticed that KB, Ranchi supplied the said items at
two to 13 times the maximum retail price (MRP). Details of excess over MRP
amount charged by the KB is given in Appendix-2.1.27. Total excess payment
to KB worked out to ` 1.33 crore (51 per cent of the supply value).
This resulted in excess payment of at least ` 1.33 crore (51 per cent)
calculated on the basis of MRP which appears to be fraudulent. Purchase
prices may have been even lower in case limited open tender was invited.
• In the test checked CHCs (Jama and Shikaripada), audit noticed purchases
made without assessment of requirements as HIV screening test kit (4430 out
of 16500) and Hepatitis ‘B’ test kit (7646 out of 8500) valuing ` 7.76 lakh
(35 per cent of total value of supply) expired as these were not utilised.
44
No. 14/12/94-Welfare Vol.-II dated 05 July 2007 of Department of Personnel and
Training, extended upto March 2015
Fraudulent payment
` ` ` ` 1.33 crore (two to
thirteen times of the
MRP) was made to
Kendriya Bhandar,
Ranchi on procurement
of diagnostic kits valued
at ` ` ` ` 2.60 crore in Dumka
and Giridih districts

Audit Report on General, Social and Economic Sectors for the year ended 31 March 2016
32
Printed MRP on the Box – `̀̀̀ 4800 for 40 kits
(Indicated in above Photograph)
Price at which supplied - `̀̀̀ 64134 for 40 kits
Deliberate scratching of MRP from
supplied box
Expired HIV screening test kits in store at
CHC, Jama
Expired Hepatitis ‘B’ test kits in store at
CHC, Jama
In reply, the Department stated (November 2016) that the matter would be
examined and suitable action would be taken.
• During audit of CS-cum-CMO, Giridih, it was noticed that 30 radiant
warmers valued at ` 26.85 lakh were purchased in September 2013 (at
` 89,500 each) from KB on nomination basis. On physical verification of the
warmers (in CHC, Dumri) the MOIC stated that four out of five equipment
were not functioning, since their supply. The CS Giridih replied that matter
would be examined and intimated to audit.
• On similar lines, CS Jamtara procured 16 IUCD (Intra Uterine
Contraceptive Device) kits and 70 Manual Vacuum Aspiration (MVA) kits
during 2013-14 without assessing requirement and without inviting tender and
placed order on a nomination basis to KB, Ranchi. It was also noticed that the
MVA kits were of different quality as per report submitted by District
Reproductive and Child Health Programme (RCH) Officer. Thus,
conformation to quality requirement was not ensured. Further, the Kits were
procured at higher prices over the offers available from another supplier
resulting in avoidable expenditure of ` 1.18 lakh as shown in Table-2.1.11:
Table-2.1.11: Details of excess amount paid to Kendriya Bhandar Amount in `̀̀̀
Sl.
No.
Name of
kit
Rate offered by
M/s Masuk
Enterprises,
Jamtara
Rate at which Kits
procured from
Kendriya Bhandar,
Ranchi
Excess
cost per
unit
Total
quantity
procured
Excess
payment
made
1 IUCD Kit 1420 2550 1130 16 18080
2 MVA Kit 700 2125 1425 70 99750
Total 117830

Chapter-2: Performance Audit
33
2.1.16.3 Loss on purchase of medicines/ equipment/ consumables
JRHMS and CS-cum-CMOs approve rate-contracts across state and district
respectively and the respective sub-ordinate offices are required to procure the
listed medicines/ consumables from the approved vendors at the price
specified in this approved rate contract.
Audit noticed that DHs45
and DRHS46
purchased medicines/ consumables at
rates higher than approved rate-contracts from other than approved agencies
on nomination basis or by calling quotations during 2011-16 and resultantly
paid ` 42.86 lakh (Appendix-2.1.28) in excess to the suppliers. This resulted
in excess payment of ` 42.86 lakh.
In the exit conference, Government stated (November 2016) that the
department has been moving from local procurement to central procurement
and distribution. However, they did not respond to the fact of any action
would have been taken or was contemplated against the officials responsible
for incurring loss to Government.
2.1.16.4 Purchase and distribution of substandard medicines
As per government order, medicine suppliers shall compulsorily submit copy
of test report of each batch of drug supplied to the state agencies with the sales
invoice. Further, samples of drugs of each batch may be taken for testing/
analysis by the Drug inspector from company’s godown-cum-store/ district
drug store/ medical college hospital store.
• Audit noticed that test report of each batch of supplied medicines
(procured for ` 10.20 crore47
during 2011-16) was not enclosed with the
supply invoice by suppliers in three test checked districts48
. Further, the batch
wise sample of medicines tested/ analysed by the Drug Inspectors was also not
found. The medicines were consequently procured by ignoring the government
orders and under these circumstances, supply of sub-standard medicines could
not be ruled out.
• DRHS, Dumka was supplied 14052 bottles of Paracetamol Syrup (60 ml
each bottle) valued at ` 1.54 lakh by M/s Bengal Chemical and
Pharmaceuticals Ltd., Ranchi in June 2015 which was distributed to 2813
Sahiyas (five bottles each). Audit noticed that out of 14,052 bottles, 9028
bottles valued at ` 0.99 lakh were found substandard in the test report/
certificate of State Drug Testing Laboratory, Ranchi (November 2015).
Medicines from this batch were supplied to the Sahiyas between June-July
2015 i.e. four to five months before obtaining test certificate. It was also
noticed that CS-cum-CMO, Dumka instructed (December 2015) all the MOIC
of CHCs to take back the medicines but these were not found returned as of
June 2016. Thus, the possibility of use of these substandard medicine which
would endanger health of several children could not be ruled out.
45
District Hospital, Dumka & West Singhbhum 46
West Singhbhum 47
State fund – ` 3.89 crore + NRHM fund - ` 6.31 crore 48
Dumka, Gumla and West Singhbhum
Medicines/ consumable
were purchased higher
than approved rate
contracts and paid excess
amount `̀̀̀ 42.86 lakh to
suppliers in DH Dumka
and West Singhbhum
districts
In Dumka district, 9028
bottles of substandard
paracetamol were
supplied to the Sahiyas

Audit Report on General, Social and Economic Sectors for the year ended 31 March 2016
34
2.1.16.5 Expired medicines
In joint physical verification of stock audit noticed that 157018 medicines in
stock expired during stocking in four49
facilities (Appendix-2.1.29). Expiry of
significant quantity of medicine indicated procurement without assessment of
proper need.
In the exit conference, Government stated (November 2016) that the
department has been moving from local procurement to central procurement
and distribution. However, reasons for excess procurement over requirement
were not stated.
2.1.16.6 Out of stock medicines
During test check of stock registers of DHs50
, CHCs51
and one SDH52
of five
test checked districts53
audit noticed that 963 types of medicines were out-of-
stock for periods ranging between one to 12 months during 2011-16
(Appendix-2.1.30). Failure to stock/procure essential medicines for stores
again indicated absence of procurement on the basis of a systematic need
based assessment.
In reply, the Department stated (November 2016) that issue of shortages
would be taken care of shortly and the department is moving from local
procurement to central procurement and distribution. However, any timeline
for redressal of the problems was not stated.
2.1.17 Quality Assurance and Monitoring
2.1.17.1 Quality Assurance Standards
Quality Assurance (QA) standards under NRHM are prescribed in Operational
Guidelines for Quality Assurance in Public Health Facilities 2013. As per the
guidelines for strengthening the QA activities, organisation arrangements is to
be ensured through State Quality Assurance Committee (SQAC), State Quality
Assurance Unit (SQAU), District Quality Assurance Committee (DQAC),
District Quality Assurance Unit (DQAU) and District Quality Team (DQT) at
respective levels with defined roles and responsibilities. Audit scrutiny
revealed the following shortcomings of the Quality Assurance System
operational in the State:
2.1.17.2 State Quality Assurance Committee and Unit
Broad responsibility of SQAC is to oversee the QA activities across the state
in accordance with the national and state guidelines and also to ensure regular
and accurate reporting of various key indicators.
• Audit noticed that SQAC, though constituted after restructuring of existing
committees in October 2014, did not discuss Key Performance Indicators
(KPIs) pertaining to reproductive, maternal, new-born, Child health and
49
DH Gumla; DH West Singhbhum; CHC Shikaripara, Dumka; and CHC Tonto, West
Singhbhum 50
District Hospital of Dumka, Giridih, Gumla, Jamtara and West Singhbhum 51
Community Health Centre of Manoharpur, Shikaripara and Tonto 52
Sub divisional Hospital, Chakradharpur 53
Dumka, Giridih, Gumla, Jamtara and West Singhbhum
SQAU was not made
functional till July 2016
and DQAU not
constituted in test
checked districts

Chapter-2: Performance Audit
35
adolescent (RMNCH+A) with concerned CS-cum-CMO. Further, follow-up
action with responsibility and timelines for the improvement of KPIs were not
ensured by SQAC during 2014-16, as required under guidelines.
• SQAU is the working arm under SQAC and responsible for undertaking
various activities as per its Term of References (ToR). However, the SQAU
was not made functional till July 2016.
In reply, the Department stated (November 2016) that quality assurance and
monitoring mechanism would be strengthened.
2.1.17.3 District Quality Assurance Committee and Unit
DQAC is responsible for dissemination of QA policy and guidelines, ensuring
standards for quality of care, review, report and process compensation claims,
etc. and to meet at least once in a quarter.
• DQAUs are the working arms of DQAC and responsible for undertaking
activities as per ToRs of the committee which included field visits to ensure
quality assessment of the services. However, DQAUs were not constituted in
the five test-checked districts54
.
• Audit observed that only two review meetings of DQAC were organised in
Dumka and Gumla in the year 2014-15 and 2015-16 respectively. No review
meetings were organised in the other test checked districts. Monthly KPIs
data/ report were not available in Gumla and Jamtara whereas three monthly
KPIs reports were sent to SQAC by West Singhbhum district during 2013-16.
In reply, the Department stated (November 2016) that quality assurance and
monitoring mechanism would be strengthened.
2.1.17.4 District Quality Team at District Hospital
As per guidelines, DQT functioning exclusively at district hospital is
responsible for staff orientation, ensuring adherence to quality standards, etc.
DQT needs to meet once every month. In five test-checked DHs under the
sampled districts55
it was observed that out of 87 required meetings only 18
meetings were conducted as of March 2016 (Appendix-2.1.31).
In reply, the Department stated (November 2016) that quality assurance and
monitoring mechanism would be strengthened.
2.1.17.5 Patient Satisfaction Survey at District Hospital
Under the guidelines, a quarterly feedback (for 30 OPD and 30 IPD patients
separately) is to be taken on a structured format by the hospital manager. In
the test checked districts56
audit observed that in DHs Gumla and West
Singhbhum, 20 and 150 patient satisfaction surveys were conducted against
required 720 every year during 2014-15 and 2015-16 respectively. In DH
West Singhbhum, test check of 35 OPD patient survey sheets conducted
during 2014-16, revealed that 14 patients (40 per cent) were not satisfied with
the facilities provided by the hospital but no action taken reports were
54
Dumka, Giridih, Gumla, Jamtara and West Singhbhum 55
Dumka, Giridih, Gumla, Jamtara and West Singhbhu. 56
Dumka, Gumla, Jamtara and West Singhbhum
No patient satisfaction
survey was conducted
in DHs Dumka, Giridih
and Jamtara during
2013-16. Only 56 per
cent death audit
conducted

Audit Report on General, Social and Economic Sectors for the year ended 31 March 2016
36
available in the hospitals. No patient satisfaction survey was conducted in DHs
of Dumka, Giridih and Jamtara districts during 2013-16.
In reply, the Department stated (November 2016) that online satisfaction
survey has been started recently. However, the methodology of monitoring of
feedback was not stated.
2.1.17.6 Death Audit
Under the guidelines, all health facilities should establish procedure for the
audit of all deaths happening at the facility. Further, audit of deaths is to be
undertaken by the DQAC and reports are to be forwarded to the state with a
copy to the Ministry of Health & Family Welfare, GoI. In the test checked
DHs57
, audit observed that 255 death cases were recorded during 2013-16
against which 112 death cases were audited and 143 (56 per cent) were not
audited, in violation of the above provisions.
No reply to the audit observation was furnished by the Government.
2.1.17.7 Standards Operating & Work instructions
As per Guidelines, Standard Operating Procedures (SOPs) should be
documented for standardising the clinical and management process at facility
level. Appropriate training to the staff on SOPs and guidelines may be
provided. In none of the DHs of five test checked districts58
department wise
SOPs were documented and consequently the work was not being done as per
the SOPs. Deputy Superintendent, DH Jamtara stated that SOPs were to be
issued by the State Quality Department and would be introduced shortly.
No reply to the audit observation was furnished by the Government.
2.1.17.8 Internal Quality Assurance Team at lower level facilities
As per Guidelines, in-charge of health facility would form an internal quality
assessment team which would meet periodically to discuss the status of quality
assurance in their facility. In the test checked districts59
audit observed that no
quality assurance team at facility levels such as CHCs, PHCs and HSs was
constituted.
No reply to the audit observation was furnished by the Government.
2.1.17.9 Assessment of services
As per Assessor’s guidebook for Quality Assurance in District Hospital 2013,
scores of the department/facility are to be calculated60
every quarter based on
assessment of all the measurable elements and checkpoints and upon testing
compliance. This is to identify the gaps in service delivery and for taking
effective actions for removing these gaps. The SQAU and DQAU are to assess
the score quarterly and six-monthly respectively. However, no such scoring
was done or assessed at any level in any of the facilities test-checked by audit.
57
Dumka, Giridih, Gumla, Jamtara and West Singhbhum 58
Dumka, Giridih, Gumla, Jamtara and West Singhbhum 59
Dumka, Gumla, Jamtara and West Singhbhum. 60
(a) two marks for full compliance, (b) one mark for partial compliance and zero for
non compliance
Department wise SOPs
were not documented
and consequently the
work was not being done
as per SOP in test -
checked districts. No
Internal Quality
Assurance Team
constituted at lower
facility level
As services were not
assessed, the gaps in the
quality of services
provided by the facilities
remained unidentified

Chapter-2: Performance Audit
37
In DHs of test checked districts61
audit assessed all the measurable elements
and checkpoints of the area of concerns (services) by using the checklist and
observed that the overall score of hospitals ranged from 43 to 52 per cent as
detailed in Table-2.1.12 below:
Table-2.1.12: Details of area wise score of test-checked DHs
Sl.
No.
Area of concern Area wise score (in per cent)
Dumka Giridih Gumla Jamtara West
Singhbhum
1 Availability of functional
Services
78 48 74 61 50
2 Accessibility of Services to
the Users
66 68 52 70 52
3 Availability of Support
Services
41 48 37 50 44
4 Adequate Clinical
Processes
61 57 71 57 64
5 Infection Control Practices 41 35 47 59 44
6 Quality Management
Control
9 47 6 13 6
Hospital score
(in per cent)
49 51 48 52 43
Similarly in 13 CHCs (including one SDH) audit assessed that overall scores
ranged from 37 to 63 per cent and in 20 PHCs overall scores ranged from 11
to 57 per cent in five test- checked districts.
Thus the quality assurance mechanism envisaged under NRHM was still at its
nascent stage, despite ` 7.83 crore being spent on the quality assurance
activities in the last two years. Resultantly, the gaps in the quality of services
provided by the facilities remained unidentified and were not rectified.
The department did not reply to the audit observation.
2.1.18 Maintenance of records
As per IPHS norms 2012, proper maintenance of records of services provided
at the HSC and the morbidity/ mortality data is necessary for assessing the
health situation in the HSC area. In addition, all births and deaths under the
jurisdiction of HSC should be documented and sex ratio at birth should be
monitored and reported. Minimum 12 registers62
are required to be maintained
at HSC. Audit noticed that only three to eight types of registers were being
maintained in 69 selected HSCs of five test checked districts63
. Thus,
61
Dumka, Giridih, Gumla, Jamtara and West Singhbhum 62
i. Eligible Couple Register, ii. Maternal and Child Health Register (a. antenatal,
intra-natal, postnatal, b. Under-five register – immunisation, growth monitoring, c. above
five child immunisation, d. number of HIV/STI screening and referral), iii. Birth and
Death Register, iv. Drug Register, v. Equipment, Furniture and other accessories
Register, vi. Communicable diseases/ Epidemic Register/ Register for Syndromic
Surveillance, vii. Passive surveillance register for malaria cases, viii. Register for records
pertaining to Jannani Suraksha Yojana, ix. Register for maintenance of accounts
including untied funds, x. Register for water quality and sanitation, xi. Minor Ailments
Register, and xii. Records/ registers as per various National Health Programme guidelines
(NLEP, RNTCP, NVBDCP etc.) 63
Dumka, Giridih, Gumla, Jamtara and West Singhbhum

Audit Report on General, Social and Economic Sectors for the year ended 31 March 2016
38
maintenance of mandatory records were not ensured. No reply to the audit
observation was furnished by the government.
2.1.19 Implications of Audit Findings
2.1.19.1 Availability of Health Care
The deficiencies identified in the observations above have resulted in critical
shortcomings in provision of health care facilities to mother and child in the
state. The analysis of the state level figures of the same are detailed below:
(i) Shortage of Health Care Facilities: As per the 2011 census, the state
had one HSC for 8,329 population (against prescribed norms of 3,000-5,000),
one PHC for 99,898 population (against prescribed norms of 20,000-30,000)
and one CHC for 1,75,352 (against prescribed norms of 80,000-1,20,000)
population. Similarly, as per projected population64
2016, the state had one
HSC for 9,317 population, one PHC for 1,11,748 population and one CHC for
1,96,153 population.
The gaps in actual availability of health care facilities against the requirements
as per 2011 census were 55 per cent in HSCs, 76 per cent in PHCs and
45 per cent in CHCs which increased to 60 per cent (HSCs), 79 per cent
(PHCs) and 51 per cent (CHCs) as per projected population for 2016. Further,
the department did not make any plan to construct additional centres as
noticed from State government five year plans/ PIPs.
In reply, the Department accepted the audit observation and stated (November
2016) that it had been trying to rectify the shortcomings. However, no
roadmap was shown to have been developed to bridge the gaps between
requirement and availability.
(ii) Inadequate Antenatal Care: As per IPHS norms 2012, complete
antenatal care (ANC) requires early registration, three subsequent ANCs and
provision of complete package of services with review of third visit by a
doctor. It was noticed that shortfall in providing second and fourth ANCs to
pregnant women (PW) was 26.82 lakh (72 per cent) and 11 lakh (29 per cent)
respectively in the state out of 37.51 lakh pregnant women (PW) registered for
ANC check-ups (Appendix-2.1.32).
No reply to audit observation was furnished by the department.
(iii) Inadequate ANC associated services: The ANCs associated services
mandates provision for general examination such as height, weight, blood
pressure, anaemia, abdominal examination, breast examination and providing
iron and folic acid (IFA) tablets, Tetanus Toxoid (TT) injection etc. to PW.
Audit observed that out of 37.51 lakh registered PW for ANC in the state
during 2011-16, shortages in providing first TT and second TT injection to
PW were 6.19 lakh (16 per cent) and 8.02 lakh (21 per cent) respectively.
Similarly, shortages in providing IFA tablets to PW was 16.39 lakh
(44 per cent). Incidentally, during 2011-16, audit noticed 31430 (5 per cent)
cases of reported low weight births and 9477 cases of still births (2 per cent)
against 5.84 lakh reported cases of live births in the four test checked
64
based on district wise percentage decadal growth 2001-11
The department failed
to create health care
facilities in the state
based on population
norms
The department failed
to provide all ANC
and associated services
to the pregnant women

Chapter-2: Performance Audit
39
districts65
. The failure to provide adequate ANC services may increase the risk
of low weight/still births of children in the state.
No reply to audit observation was furnished by the department.
(iv) Shortfall in reported deliveries (institutional and home) against
registered pregnant women: Audit observed that 37,51,047 PWs were
registered in the state during 2011-16 of which, 31,50,713 (84 per cent)
institutional (DHs, CHCs, PHCs and HSCs) and home deliveries were found
reported, while remaining 6,00,344 (16 per cent) registered PWs were not
tracked during 2011-16 as the system for tracking registered PWs was not
developed by the state. As such it might be presumed that the PWs had either
migrated or their deliveries were conducted in private hospital. Detailed are
given in Table-2.1.13 below:
Table-2.1.13: Details of shortfall in reported deliveries (institutional and
home) against registered PW in the State during 2011-16
Sl.
No.
Year Total
number of
registered
PW
Number of
Institutional
delivery
conducted in
health care
facilities
(number/ per
cent)
Number of
home delivery
against
registered
PW (in
number/ per
cent)
Total
deliveries
were reported
against
registered
PW (in
number/ per
cent)
Difference (in
number/ per
cent)
1 2 3 4 5 6 (4+5) 7 (3-6)
1. 2011-12 734914 372229 (51) 211462 (29) 583691 (80) 151223 (20)
2. 2012-13 724839 435668 (60) 176135 (24) 611803 (84) 113036 (16)
3. 2013-14 801120 504646 (63) 141092 (18) 645738 (81) 155382 (19)
4. 2014-15 782667 500177 (64) 136567 (17) 636744 (81) 145923 (19)
5. 2015-16 707507 555785 (79) 116952 (16) 672737 (95) 34770 (5)
Total 3751047 2368505 (63) 782208 (21) 3150713 (84) 600334 (16)
(Source: JRHMS )
No reply to audit observation was furnished by the department.
(v) Home deliveries without Skilled Birth Attendant: Audit observed that
against 7.8 lakh home deliveries in the state during 2011-16, 6.2 lakh
(79 per cent) deliveries were not attended by SBA such as Doctors/ Nurses/
ANMs which was a violation of the prescribed norms.
No reply to audit observation was furnished by the department.
(vi) Shortfalls in Family Planning Implementation: The Family Planning
Programme aimed to reduce the TFR by encouraging adoption of appropriate
family planning methods. The target of Jharkhand was to reach the Total
Fertility Rate (TFR) of 2.4 by 2015-16. Against this, the achievement was 2.7
as of March 2016.
• Limiting Methods: Limiting methods of family planning consist of
vasectomy for male and tubectomy for female. Total target of 9.75 lakh was
fixed by the state for sterilisation against which achievement was 6.15 lakh
during 2011-16. Thus, overall shortfall was 3.60 lakh (37 per cent).
65
Dumka, Giridih, Jamtara and West Singhbhum
79 per cent home
deliveries were
not attended by
SBA

Audit Report on General, Social and Economic Sectors for the year ended 31 March 2016
40
Achievement against target for sterilisation declined from 73 to 42 per cent
during 2012-16 (Appendix-2.1.33).
• Spacing Methods: The targets fixed by the state for insertion of IUCD,
distribution of Oral pills and condom was 10.82 lakh, 706 lakh and 44.70 crore
against which over all shortfalls were 52, 96 and 95 per cent respectively
during 2011-16 (Appendix-2.1.34).
Thus, the mandate of NRHM to reach TFR of 2.4 by 2015-16 was not
achieved. No reply to audit observation was furnished by the department.
(vii) Patients “Left against Medical Advice (LAMA)”: Provision of
inadequate service delivery was also confirmed in test check of IPD registers
of two DHs, one SDH and two CHCs of test checked districts. It was noticed
that 6,064 patients (out of 45,017) admitted in labour ward for delivery left the
health care facilities against medical advice during 2011-12 to 2015-16. The
patients leaving health care facilities against medical advice ranged between
0.3 per cent and 80 per cent. Patients leaving the health facilities against
medical advice indicated possible deficient service delivery or inadequate
medical awareness of the patient or both (Appendix-2.1.35).
No reply to audit observation was furnished by the department.
2.1.19.2 Beneficiary and ASHA (Accredited Social Health Activist) /
Sahiya Survey Findings
Audit surveyed, 10 JSY beneficiaries and three ASHAs at each sampled HSC
(690 eligible beneficiaries and 207 ASHA/ Sahiyas) by using structured
questionnaire. The survey results detailed below confirmed the inadequacies
pointed out in the audit findings and the statistics mentioned above in
provision of health care services:
Beneficiary Survey
In five test checked districts66
out of 690 beneficiaries surveyed, audit noticed:
• Registration of Pregnancy: Of the 690 beneficiaries surveyed, 377 (55
per cent) beneficiaries were registered in time, 155 (22 per cent) beneficiaries
were registered between four to six months of their pregnancies, 45 (five per
cent) beneficiaries were registered between six to nine months of their
pregnancies and 113 (16 per cent) beneficiaries did not know about
registration of their pregnancies.
• Knowledge about Due date: 336 beneficiaries knew about due date of
their delivery, whereas 354 (51 per cent) beneficiaries did not know about
their due date of delivery.
• Ante-Natal Care (ANC): PWs are required to visit the facilities at least
four times for ANCs. In the beneficiary survey audit found that 25
(four per cent) beneficiaries visited health centre or hospital just once, 99
(14 per cent) beneficiaries visited the health centre or hospital twice and 136
(20 per cent) beneficiaries visited the health centre or hospital three times and
430 beneficiaries visited health centre or hospital four times or more.
66
Dumka, Giridih, Gumla, Jamtara and West Singhbhum
In test-checked districts,
0.3 to 80 per cent patients
were leaving the health
facilities without medical
advice (LAMA) due to
deficient service delivery
or inadequate awareness
among the patients

Chapter-2: Performance Audit
41
• Under the scheme guidelines, ASHAs (Sahiyas) are required to visit
beneficiary homes at least thrice during the pregnancy period. Sahiya visits to
beneficiary homes, in the sample, during the pregnancy period was once for 20
PWs (three per cent), twice for 76 PWs (11 per cent), thrice for 88 PWs
(13 per cent) and four and above times for 506 PW (76 per cent). Thus, the
required visits were not ensured.
• NRHM is being implemented with the objective of reducing maternal and
neo-natal mortality by promoting institutional delivery among the poor PW.
589 (85 per cent) beneficiaries delivered at health facilities (CHC-207
beneficiaries, PHC-196 beneficiaries, HSC-186 beneficiaries), 37 beneficiaries
delivered at private hospitals, 63 beneficiaries delivered at home and one
beneficiary delivered in transit. Thus, institutional delivery in all the surveyed
cases was not ensured.
No reply to the findings of the beneficiary survey was furnished by the
department.
• Under the guidelines, Sahiyas are to motivate PWs for institutional
deliveries. In 454 cases (beneficiaries) Sahiyas responded quickly, in 139 (20
per cent) cases Sahiyas did not respond quickly on any issue during pregnancy
when they were called by the beneficiaries while 97 beneficiaries did not give
any specific response.
• Ambulance availability: As per JSSK guidelines, referral transport
facility should be made available at no cost for PWs. It was noticed that 412
beneficiaries (PWs) called the ambulances whereas 278 (40 per cent)
beneficiaries did not call the ambulance. Further, ambulances arrived in time
in 596 cases and did not arrive in time in 94 cases (14 per cent). Four
beneficiaries had to pay ` 150 to ` 400 for the ambulance service. Thus,
referral transport facility was not provided in all cases.
• Stay in Health facility: As per JSSK guidelines, beneficiaries are to stay
in the hospital facility for at-least 48 hours after delivery. Audit survey
revealed that 99 (14 per cent) beneficiaries stayed in the health institution after
delivery upto 12 hours, 300 (43 per cent) beneficiaries stayed in the health
institution after delivery for 12-24 hours, 128 (19 per cent) beneficiaries
stayed in the health institution after delivery for 24-48 hours and 163
(24 per cent) beneficiaries stayed beyond 48 hours after delivery. Thus,
provisions of the guidelines were not adhered to in any of the cases.
• 612 beneficiaries were provided food in health institutions free of cost
whereas 21 beneficiaries had to pay for the food provided to them and no food
was provided to 57 (8 per cent) beneficiaries in health institution.
• JSY Cash Incentive: Under JSY, every women is entitled for cash
incentive of ` 1,400 immediately after her institutional delivery. Audit survey
revealed that 408 beneficiaries were paid incentives, while 282 (41 per cent)
beneficiaries were not paid incentives under JSY. Of the 408 beneficiaries,
198 received incentives in time whereas 210 (30 per cent) beneficiaries were
paid the incentives with delays between one and 365 days. Thus, the cash
incentive was not provided timely to all PW.

Audit Report on General, Social and Economic Sectors for the year ended 31 March 2016
42
• Post-Natal Care (PNC): Under the guidelines, new mothers are required
to visit health facilities at least four times within 42 days of delivery for PNCs.
Audit survey revealed that 66 (10 per cent) beneficiaries visited the medical
facilities only once for PNC, 134 (19 per cent) beneficiaries visited the
medical facilities twice, 195 (28 per cent) beneficiaries visited the medical
facilities three times and 295 (43 per cent)beneficiaries visited the medical
facilities four time for post-natal care. Thus, proper dissemination of
information about PNC does not seem to have been ensured.
• Under the guidelines, health workers are to visit beneficiary’s home at
least twice within seven days from the date of delivery. In 413 cases health
worker visited beneficiaries home within two-seven days, in 174 (25 per cent)
cases health worker did not visit the beneficiaries home within seven days to
check the mother and baby and in 103 cases beneficiaries did not know about
the visit requirement of health workers.
• 564 beneficiaries received Vitamin A dose, 71 (10 per cent) beneficiaries
did not receive Vitamin A dose and 55 beneficiaries were not aware of this
service.
Thus, the PNC measures were not properly enforced.
ASHA (Sahiya) Survey
The result of survey of 207 ASHAs (Sahiya) revealed the following:
• Training: Under JSY, Sahiyas are to be trained for emergency situations.
Forty five sampled Sahiyas were trained for emergency situation and 162
(78 per cent) surveyed Sahiyas were not trained for emergencies and did not
have necessary equipment to conduct a normal delivery. This constrained
them from effectively delivering the mandated health care service.
Usage of kits
Out of 207 ASHAs (Sahiyas) surveyed by audit, 31 Sahiyas who possessed
disposable delivery kits and 16 Sahiyas who had pregnancy test kits in their
possession did not know how to use them. Likewise, 56 Sahiyas had blood
pressure monitor, seven Sahiyas had paracetamol tablets and iron pills and six
Sahiyas had deworming pills but they all did not know about its use. This
reduced the effectiveness of the Sahiyas in delivering the mandated health
services.
• Receipt of Incentives: Under JSY, Sahiyas should be paid incentives for
each activity such as ANC, institutional delivery, PNC etc. Audit survey
revealed that 83 Sahiyas were paid incentives always on time, 64 Sahiyas got
incentives usually in time, four Sahiyas got incentives sometimes, 29
(14 per cent) Sahiyas got incentives rarely and 27 (13 per cent) Sahiyas never
got incentives in time. This may demotivate the Sahiyas in performing their
duties diligently.
2.1.20 State of Ultimate Goals
NRHM aims to reduce IMR to less than 25 per 1000 live births, MMR to 100
per lakh live births and TFR to 2.1 by 2017. India is also a signatory to UN
targets of Millennium Development Goals (MDGs) as indicated below. As per

Chapter-2: Performance Audit
43
the last two Sample Registration Survey (SRS) the figures for the vital
indicators are as shown in Table-2.1.14 below:
Indicators Targets in
Millennium
Development
Goal by 31st
March 2016
NHM GOAL
(2012-17)
Achievements as per last sample
registration survey
Jharkhand
(2001)
Jharkhand
(2007)
Jharkhand
(2012/13)
IMR 26 Less than 25 62 48 37
MMR 100 Less than 100 400 261 208
TFR 2.1 Less than 2.1 3.4* 3.2* 2.7
(Source: Survey Registration Sample) * Year 2006
Although the state parameters have improved during the eleven years since the
implementation of NRHM scheme, the vital health indicators were still not
close to the goals the programme had set. The audit findings in this report
highlight and flag the key area of concerns which need to be addressed if the
goals of NRHM are to be achieved.
2.1.21 Conclusion
• The State had failed critically in creating sufficient infrastructure in terms
of Public Health facilities as required under the NRHM norms. The gaps
between requirement and available health facilities such as CHCs, PHCs and
HSCs in the State increased from 45, 76 and 55 per cent respectively in 2011
to 51, 79 and 60 per cent respectively in 2016 as NRHM and State
intervention was centered on upgradation of existing facilities while
construction of additional facilities by identifying the deficit areas was
neglected.
• There were shortages of Specialist Doctors (92 and 78 per cent), Medical
Officers (61 and 36 per cent), Staff Nurses/ANM (27 and 26 per cent) and
Paramedics (52 and 40 per cent) with respect to IPHS norms and Sanctioned
Strength respectively. SQAU was not made functional while DQAUs were not
constituted in the test checked districts.
• Medical services suffered from significant shortages of essential
equipment which ranged between 57 and 86 per cent at DHs, 79 per cent at
SDH and 44 and 92 per cent at CHCs while deficit of essential medicines were
to the extent of 75 to 88 per cent in DHs, 32 to 82 per cent in CHCs and 61 to
91 per cent in PHCs and 22 to 83 per cent in HSCs. Bed capacity was short
between 50 and 76 per cent in test checked DHs, and between 47 and
90 per cent in CHCs. Essential laboratory services were not available in any
test checked PHCs.
• There was significant under-spending which ranged between 55 and
61 per cent during 2011-15 which resulted in creation of capacity that were far
below the requirement leading to inadequate provision of services.
• In the absence of adequate improvement in health care facilities, the Infant
and Mother Mortality Rates (IMR: 37/1000, MMR: 208/100000) were far
short of the NRHM goals (IMR: less than 25/1000, MMR: less than
100/100000) and MDG (IMR: 26/1000 and MMR: 100/100000).
The desired NHM Goal
through the
implementation of
NRHM has not been
achieved

Audit Report on General, Social and Economic Sectors for the year ended 31 March 2016
44
2.1.22 Recommendations
• The assessment of gaps in facilities such as infrastructure, equipment,
medicines, diagnostic services etc. should be made and measures to bridge
these gaps should be undertaken as early as possible.
• State Government should ensure utilisation of its budget properly and draw
up its realistic annual plans to be implemented effectively so as to achieve the
target as provided for in NRHM.
• The service deliveries of the health care facilities should be upgraded and
skilled manpower be recruited to reduce vacancies.
• The functioning of JRHMS should be reviewed and streamlined so that it
implements the objectives of NRHM properly.

Chapter 2: Performance Audit
45
INDUSTRIES AND MINES & GEOLOGY DEPARTMENT
2.2 Performance Audit on Investment Promotion Activities/
Initiatives in Jharkhand
Executive summary
With a vision to make Jharkhand the favoured destination of investors,
Jharkhand Industrial Policy (JIP) 2012 was announced in June 2012. Thrust of
the policy is to simplify administrative procedures, bring about legal reforms
etc. to attract investors and to promote participation of the private sector in the
industrialisation in the state. Some of the major audit findings are discussed
below:
• Ease of Doing Business in Jharkhand suffered from constraints in the
fields of setting up of business, allotment of land, uninterrupted supply of
power, water and raw materials etc. As a result, investment decreased to
` 4,493 crore during the JIP period 2012 (2011-16) as compared to ` 28,424
crore in the previous policy period (2000-11). The investments were skewed
and limited to eight out of 24 districts although other districts possessed equal
investment potential. Further, 48 per cent of Memorandum of Understandings
(MoUs) were cancelled due to failure to acquire land and lack of facilitation
by the Government for setting up the industries etc. resulting in deprivation of
investment worth ` 62,879 crore in the State. At the same time, there was
opportunity loss of ` 1.60 lakh crore to the State due to the failure to facilitate
the establishment of five Steel Plants cum Captive Power Plants in 10 years of
receipt of their proposals.
(Paragraphs 2.2.6, 2.2.7, 2.2.8 and 2.2.11)
• The Single Window System (SWS) of the state was only partially
functional and so could not address the concerns of potential investors as the
investors could not get clearances of required departments/ agencies at ‘one
stop’ service point. As a result, SWS failed to address the impediments in the
projects which could not be set up for a period ranging from four to 13 years
of signing of MoUs.
(Paragraph 2.2.9)
• Special Economic Zone for Automobiles and Auto components in the
State, though sanctioned, could not be established due to delayed action by the
government. This prevented promotion of Automobile sector in the State and
failed to attract investment.
(Paragraph 2.2.12)
• Committee under chairmanship of the Chief Minister to review the
implementation of JIP 2012 so as to promote investments by attracting
investors was not constituted. As such, neither progress of implementation of
the JIP 2012 could be monitored at apex level nor mid-term review of the
policy could be carried out by the Government.
(Paragraph 2.2.16)

Audit Report on General, Social and Economic Sectors for the year ended 31 March 2016
46
2.2.1 Introduction
Jharkhand, widely acclaimed as a region with great industrial future, has
enormous potential for industrialisation. With its large deposits of minerals, it
provides an attractive destination for all kinds of industries. The state holds 40
per cent of nation’s mineral reserves.
With a vision to leverage this locational advantage and make it the favoured
destination of investors, Jharkhand Industrial Policy (JIP) 2012 was
announced in June 2012 to simplify administrative procedures, bring about
legal reforms to attract investors and to promote participation of the private
sector in the industrialisation of the state. JIP 2012 also aimed to improve
upon the JIP 2001.
2.2.2 Organisational set up
The Industries Department is headed by the Principal Secretary who is
responsible for overall implementation of the Industrial Policy of the State to
promote investment activities1. Director (Industries) is responsible to
implement the policy at the state level. Managing Directors of four2 Industrial
Area Development Authorities (IADAs) and General Managers of 12 District
Industries Centres3 (DICs) are responsible for implementation of all activities
of the department at the field/ district levels.
2.2.3 Audit objectives
The objectives of the performance audit were to assess whether:
• the investment has increased after implementation of the Industrial Policy
2012 in comparison to the prior period;
• the Industrial Policy 2012 has been implemented in a proper, efficient and
effective manner to promote investment activities; and
• land and other basic infrastructure to promote investment have been
provided as per rules.
2.2.4 Audit criteria
The criteria for audit findings were drawn from the following sources:
• Jharkhand Industrial Policy 2012; and
• Circulars/orders and other guidelines/directives/policies issued by the
Government (Central/State) to promote investment initiatives.
1 A new industrial policy-Jharkhand Industrial and Investment Promotion Policy 2016 has
been issued with effect from April 2016 2 Adityapur Industrial Area Development Authority (AIADA), Bokaro Industrial Area
Development Authority (BIADA), Ranchi Industrial Area Development Authority
(RIADA) and Santhal Paragana Industrial Area Development Authority (SPIADA) 3 Covering all 24 districts of the State
Chapter 2: Performance Audit
47
2.2.5 Audit scope and methodology
Audit assessed the investment promotional activities/ initiatives in two stages;
i.e. first against the reported achievements till 2011 and second, against targets
of JIP 2012, which were effective from April 2011 to March 2016. For this,
records of the Directorate of Industries (DI), all four4 IADAs and six
5 out of
12 DICs for the period from 2011-12 to 2015-16 were test checked in audit
between April and July 2016.
An entry conference was held on 06 April 2016 with Director of Industries in
which the audit objectives, criteria, scope and methodology were discussed.
Exit conference was held on 04 November 2016 with the Secretary, Industries,
Mines and Geology Department, Government of Jharkhand in which audit
findings were discussed. Replies of the Department have been suitably
incorporated in the report.
Audit findings
2.2.6 Ease of Doing Business
In December, 2014, “Make in India” workshop was held at Vigyan Bhawan,
New Delhi, in which Prime Minister of India, Cabinet Ministers, Chief
Secretaries of all States/ Union Territories (UTs) and Secretaries of the
Government participated. All the participating governments agreed to a
98-point action plan for business reforms across States and UTs. The objective
of the action plan was to make recommendations that were targeted at
increasing transparency and improving efficiency and effectiveness of
regulatory functions and services of the government that support doing
business in India. Simplifying the regulatory burden on business at the State
level was accepted as an important component of the ambitious Ease of Doing
Business (EoDB) initiative in India. An assessment of implementation of
business reforms was compiled (September 2015) by the World Bank in the
form of a report6. Data was collected through a structured questionnaire from
each State and UT government and 285 questions developed from the 98-point
action-plan, were categorised under eight distinct areas7. On the basis of
responses, Jharkhand was placed third in India for EoDB, as per the report.
However, the rank declined to seventh in the Assessment Report (October
2016) of World Bank carried out on the same parameters.
4 Adityapur Industrial Area Development Authority (AIADA), Bokaro Industrial Area
Development Authority (BIADA), Ranchi Industrial Area Development Authority
(RIADA) and Santhal Pargana Industrial Area Development Authority (SPIADA) at
Deoghar 5 Daltonganj, Dhanbad, Deoghar, Giridih, Hazaribag, and Lohardaga (selected through
Simple Random Sampling) 6 Assessment of State Implementation of Business Reforms (September 2015)
7 Setting up a business, Allotment of land and obtaining construction permit, Complying
with environment procedures, Complying with labour rules, obtaining infrastructure
related utilities, Registering & Complying with tax procedures, carrying out inspections
and enforcing contracts

Audit Report on General, Social and Economic Sectors for the year ended 31 March 2016
48
2.2.6.1 Report analysis
While analysing the report, audit observed that the position of Jharkhand was
in the top five (ranked first) in only two out of the eight distinct areas, namely-
(i) complying with labour regulations and (ii) carrying out inspections
(Appendix-2.2.1) while in the remaining six areas viz. setting up a business,
enforcing contracts, obtaining infrastructure related utilities, allotment of land,
complying with environment issues, Jharkhand did not feature in the top five
States with scores ranging8 between 15 and 50 per cent.
The report also stressed the need for private sector participation and to
ascertain if the beneficiaries i.e. the private sector actually felt the reforms.
To ascertain the ground reality, audit endeavored to gather the responses of the
stakeholders, who are representatives of the industrial-sector viz. Federation
of Jharkhand Chamber of Commerce and Industries (FJCCI) and Jharkhand
Small Industries Association (JSIA) through a beneficiary survey and by
meetings with FJCCI and JSIA. Analysis of responses from these industry
groups revealed that:
• Due to hindrances stemming from Chhota-Nagpur Tenancy Act/ Santhal
Pargana Tenancy Act (CNT/SPT Acts), policy problems and lack of efforts by
the government, land is not easily available in the State to set up industries.
• One-stop-service (Single Window System) for all types of clearance is not
available in the State. There was a lack of willingness on the part of the
Government to ensure a transparent and technology driven system.
• New industrial areas for Micro, Small, Medium Enterprises (MSMEs),
infrastructure for MSMEs, availability of minerals, good power supply, clear
cut policy, fast approval of applications, safety of industrialists, corruption
free environment etc., were the expectations of FJCCI from the Government,
which have not been met.
• Jharkhand Small Industries Association indicated that the primary
bottlenecks in growth of MSME industries were failure of the Government to
implement the provisions of JIP 2012, such as Procurement Policy, poor
condition of power supply, difficulties in getting mines and minerals due to
stringent environmental clearances, absence of land for MSMEs etc.
• Associated Chambers of Commerce and Industry of India (ASSOCHAM)
also stated (October 2015) in its report “Impact of delay in investment
implementation in Jharkhand-An analysis” that the state had failed to
encourage investors for investment in the State. The investment performance
was poor and there was continuous downfall in investment growth which was
25.70 per cent in 2010-11 but decelerated to minus 10.10 per cent in 2014-15
as shown in the graph:
8 (i) Setting up a business-15 per cent, (ii) Enforcing contracts-23 per cent, (iii) Obtaining
infrastructure related utilities-26 per cent, (iv) Allotment of land-42 per cent,
(v) Complying with environment issues-50 per cent
Ease of Doing Business
in Jharkhand suffered
from constraints like
setting up business,
allotment of land etc,
which are important
areas to facilitate and
attract investments in
the State

Chapter 2: Performance Audit
49
(Source: ASSOCHAM Economic Research Bureau)
Thus, the apparently impressive rank accorded to Jharkhand in the assessment
made in the World Bank report needs to be read with the responses of
stakeholders, as was stressed in the report itself.
On this being pointed out (October 2016), the Department did not reply
specifically to all the issues raised by stakeholders. However, in the exit
conference, the Secretary while accepting the audit observation stated that
forest clearances and CNT/SPT acts were the main hindrances in setting up of
an industry.
The fact remains that the business environment in Jharkhand has not been
encouraging as the reforms are yet to be implemented in the state.
Audit also test checked the records of the Industries Department along with
those in IADAs and DICs. Based on the audit findings presented here, the
position of Jharkhand in EoDB may not appear as encouraging as reflected
from the third rank obtained in the World Bank’s assessment report.
2.2.7 Committed issues of JIP 2012 not implemented
As per terms of JIP 2012, during 2011-16, the State government planned to
promote employment generating industrial (manufacturing and service sector)
units by providing facilitation under the industrial policy, creation of a single
window system for clearances from government departments, providing more
industrial area through government, encourage private and Public Private
Partnership-Special Purpose Vehicle (PPP-SPV) mode for setting up Micro,
Small and Medium Enterprises (MSME).
Audit observed from the records of the DI that important commitments were
not achieved as detailed in Table-2.2.1
Gro
wth
in
per
cen
tag
e
Year(s)

Audit Report on General, Social and Economic Sectors for the year ended 31 March 2016
50
Table-2.2.1: Details of commitments of JIP 2012 and its status
Clause No.
of JIP12
Commitments Status Remarks
3.2 Operationalisation of Single
Window System
Partially
implemented
Discussed in
Paragraph 2.2.9
4 Creation of Land Bank in
each district
Not created Discussed in
Paragraph 2.2.11
16 Setting up of Special
Economic Zone
Not setup Discussed in
Paragraph 2.2.12
22 Establishment of Food
Processing Park
Under process Land for mega food park
earmarked in February 2016.
30
Revival of sick/closed units Not revived Survival of 24 large and 117
small industries not
achieved
(Source: JIP 2012 and related records of the Department)
As could be seen from the above table, important commitments of JIP 2012
were not achieved and the State was unsuccessful in attracting investors as
discussed in succeeding paragraphs.
2.2.8 Failure in Investment Initiatives
For investment to take place for setting up of industry, at the first stage a
Memorandum of Understanding (MoU) is signed between the Government of
Jharkhand and the prospective investors, which serves as an indicator of
intention to invest. The MoU states in brief, the proposed industries in which
investment is intended and possible facilitation to be extended by the State
Government. Subsequently, a second stage MoU is signed incorporating
complete details of projects, resources required, possible sources of funds, raw
materials, consumables, utilities, manpower requirement, infrastructure details
and implementation time frame.
Scrutiny of records of DI revealed that 79 MoUs involving proposed
investment of ` 3.51 lakh crore were signed after creation (November 2000)
of Jharkhand state by Government of Jharkhand with prospective investors.
These were mostly in the Steel and Cement sectors. Of the 79 MoUs, 38 with
proposed investment of ` 0.63 lakh crore were cancelled while in 23 MoUs
with proposed investment of ` 2.26 lakh crore, the proposed industries have
not been set up as of July 2016. In respect of the remaining 18 MoUs
(23 per cent) with proposed investments of ` 0.62 lakh crore, audit noticed
that investment worth ` 0.33 lakh crore have been made by the investors as of
July 2016. Status of these MoUs are depicted in Chart-2.2.1.

Chapter 2: Performance Audit
51
Chart-2.2.1: Status of MoUs signed after creation of the state
(Source: Information furnished by Director Industries)
It was further analysed that of the 18 MoUs resulting in investment of
` 33,169.49 crore, one MoU signed was with Tata Steel for an expansion
project of ` 20,000 crore. This MoU for expansion of an existing project could
not be attributed to the investment promotion policy of the state, since Tata
Steel had run operations in the state (Jamshedpur) since 1912 and expanded
their steel plant on several occasions, independent of the special policies of the
state.
As a result, the monetary impact of JIP 2001 and JIP 2012 was fresh
investment in green field projects worth ` 0.13 lakh crore out of MoU’s signed
by interested industrialists for ` 3.51 lakh crore. Thus, only 3.8 per cent of the
initial commitment could fructify.
Audit further noticed that during 2011-16 which coincides with the JIP 2012,
only four MoUs with proposed investment of ` 22,011 crore were signed. Of
this, actual investments in the state are still to be realised as all these projects
were reported as ‘likely to be setup’. This indicated a decreasing trend of
investment proposals in Jharkhand from investors as detailed in the
Chart-2.2.2.
Chart-2.2.2: Status of MoUs and Investments during 2001-2016
(Source: Industries Department, GoJ)
To ascertain the reasons for cancellation of 38 MoUs for an investment of
` 62,878.68 crore and reasons for failure to commence the projects pertaining
to 23 MoUs (` 2,26,070.31 crore) that are categorised ‘likely to be setup’,
Nu
mb
er o
f M
oU
s
Period
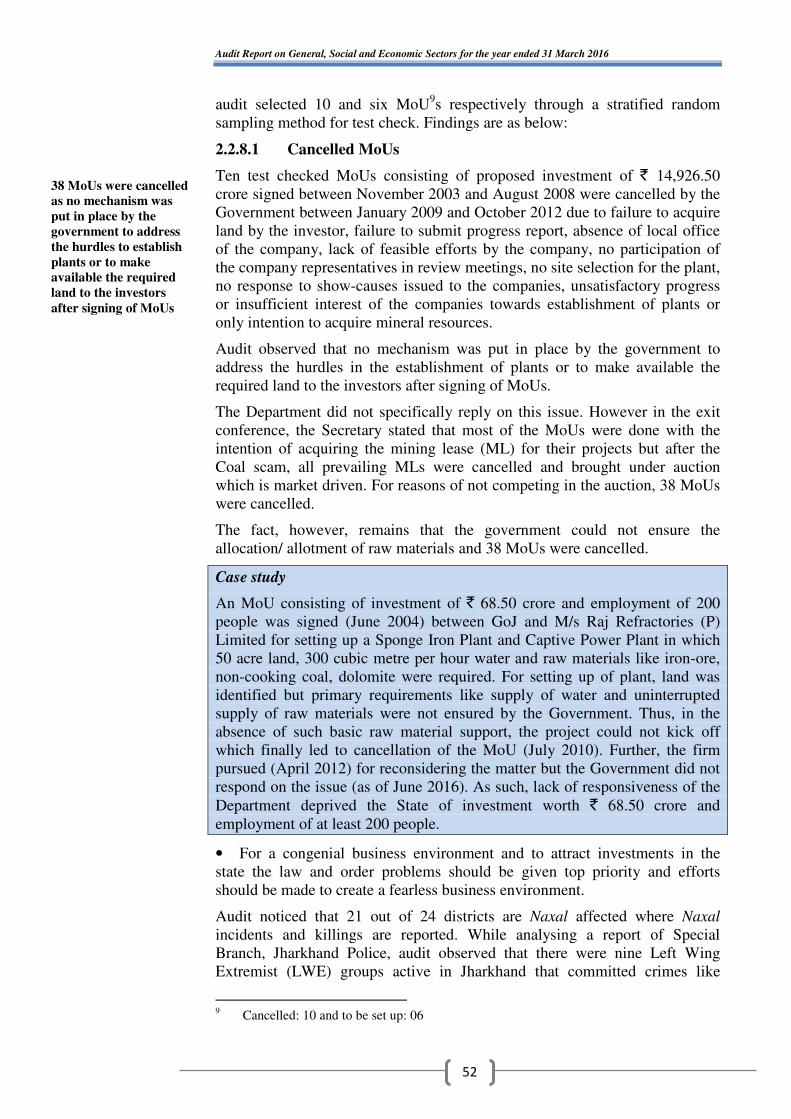
Audit Report on General, Social and Economic Sectors for the year ended 31 March 2016
52
audit selected 10 and six MoU9s respectively through a stratified random
sampling method for test check. Findings are as below:
2.2.8.1 Cancelled MoUs
Ten test checked MoUs consisting of proposed investment of ` 14,926.50
crore signed between November 2003 and August 2008 were cancelled by the
Government between January 2009 and October 2012 due to failure to acquire
land by the investor, failure to submit progress report, absence of local office
of the company, lack of feasible efforts by the company, no participation of
the company representatives in review meetings, no site selection for the plant,
no response to show-causes issued to the companies, unsatisfactory progress
or insufficient interest of the companies towards establishment of plants or
only intention to acquire mineral resources.
Audit observed that no mechanism was put in place by the government to
address the hurdles in the establishment of plants or to make available the
required land to the investors after signing of MoUs.
The Department did not specifically reply on this issue. However in the exit
conference, the Secretary stated that most of the MoUs were done with the
intention of acquiring the mining lease (ML) for their projects but after the
Coal scam, all prevailing MLs were cancelled and brought under auction
which is market driven. For reasons of not competing in the auction, 38 MoUs
were cancelled.
The fact, however, remains that the government could not ensure the
allocation/ allotment of raw materials and 38 MoUs were cancelled.
Case study
An MoU consisting of investment of ` 68.50 crore and employment of 200
people was signed (June 2004) between GoJ and M/s Raj Refractories (P)
Limited for setting up a Sponge Iron Plant and Captive Power Plant in which
50 acre land, 300 cubic metre per hour water and raw materials like iron-ore,
non-cooking coal, dolomite were required. For setting up of plant, land was
identified but primary requirements like supply of water and uninterrupted
supply of raw materials were not ensured by the Government. Thus, in the
absence of such basic raw material support, the project could not kick off
which finally led to cancellation of the MoU (July 2010). Further, the firm
pursued (April 2012) for reconsidering the matter but the Government did not
respond on the issue (as of June 2016). As such, lack of responsiveness of the
Department deprived the State of investment worth ` 68.50 crore and
employment of at least 200 people.
• For a congenial business environment and to attract investments in the
state the law and order problems should be given top priority and efforts
should be made to create a fearless business environment.
Audit noticed that 21 out of 24 districts are Naxal affected where Naxal
incidents and killings are reported. While analysing a report of Special
Branch, Jharkhand Police, audit observed that there were nine Left Wing
Extremist (LWE) groups active in Jharkhand that committed crimes like
9 Cancelled: 10 and to be set up: 06
38 MoUs were cancelled
as no mechanism was
put in place by the
government to address
the hurdles to establish
plants or to make
available the required
land to the investors
after signing of MoUs

Chapter 2: Performance Audit
53
murder, extortion, burning of vehicle, burning of Government property, killing
of police informer, kidnapping and killing of police personal and civilians.
During 2011-16, 865 Naxal incidences were reported in which 584 people
were killed (as of August 2016) which is one indicator of the law and order
situation in the state. A study undertaken by Bindrai Institute for Research
Study & Action (BIRSA)-an NGO also reported that during 2012-14, 2057
Naxal incidents occurred in which 273 people were killed. Uncertainty with
regard to law and order situation in the state may also be one of the reasons
that discourage investors.
2.2.8.2 Opportunity loss to the State in tapping investment of `̀̀̀ 1.60
lakh crore
Five MoUs were signed with reputed corporate houses to establish integrated
Steel Plants cum Captive Power Plants with proposed investment of ` 1.60
lakh crore as detailed below in Table-2.2.2:
Table-2.2.2: Details of five MoUs signed with reputed corporate houses
Name of
Company
Plant Place Proposed
Investment
( `̀̀̀ in crore)
Date of
MoU
M/s Tata Steel
Ltd. (Greenfield)
12 MTPA Steel
plant with captive
power plant
Manoharpur &
Saraikela
41000 8/9/2005
M/s Arcellor
Mittal India Ltd.
12 MTPA Steel
plant with captive
power plant
Chas, Bokaro 40000 8/10/2005
M/s JSW Steel
Ltd.
10 MTPA Steel
plant with captive
power plant
Sonahatu Ranchi 35000 9/11/2005
JSPL 6 MTPA Steel plant
with captive power
plant
Asanbani/ Potka/
Gharshila
32302 5/7/2005
Rungta Mines Ltd. 4.5 MTPA Steel
plant with captive
power plant
Gaisuti, Chaibasa 11320 11/9/2006
Total 159622
Audit observed that due to delay in transfer/notification for acquisition of land,
provision of water, power, forest land clearances and poor law and order
situation, none of the steel plants could be established (November 2016) even
after lapse of more than 10 years of signing of MoUs. This was despite the fact
that these corporate houses have established businesses in the State and
regularly been intimating to the Industries Department of slow progress in
land acquisition, water allocation etc. However, scrutiny revealed that the
Government failed to take purposeful action which resulted in opportunity loss
of ` 1.60 lakh crore to the State in fructifying these investments. These are
discussed below:
(i) Establishment of Steel Plant by Tata Steel Limited (Greenfield)
An MoU was signed (September 2005) between Government of Jharkhand
and Tata Steel to establish 12 Million Ton Per Annum (MTPA) steel plant in
two phases, power plant and township in Jharkhand with a proposed
investment of ` 41,000 crore. As per Primary Project Report, 9,800 hectare
Due to delay in
transfer/notification for
acquisition of land,
water, power, forest
clearances and poor
law and order situation,
five Steel plants could
not be established
which resulted in loss of
opportunity in taping
investment of `̀̀̀ 1.60
lakh crore

Audit Report on General, Social and Economic Sectors for the year ended 31 March 2016
54
land, 130 million gallon water per day, 1,822 MT iron ore and 1,920 MT coal
per year was required by Tata Steel to setup the plants and township.
As per para 6(i) (f) of MoU, the Government agreed to provide the required
land to Tata Steel free from all encumbrances on priority basis at the location
of its choice at acquisition cost including administrative charges. Six MTPA
plants were to be established in 36 to 54 months from date of obtaining all
clearances.
Scrutiny however, revealed that mandatory clearances were not granted even
after lapse of 11 years from signing of the MoU as detailed in Table-2.2.3:
Table-2.2.3: Details of applications for clearances and status thereof
Particular Date of
application by
Tata steel
Target as per MoU Present position
(August 2016)
Govt land 21.10.2005 On application Transfer awaited
Private land 21.10.2005 Notification within 30 days in
case of acquisition and within
190 days in case of leases.
Notification awaited
Water
allocation
29.10.2005 Within six months Allocation awaited
Power
allocation
14.11.2005 Within six months Allocation awaited
Iron block 31.10.2005 Within six months Drilling started but
stopped temporarily due
to law and order problem
Coal block 31.10.2005 Within six months Allocation awaited
Forest land 21.10.2005 ---- Awaited
It was noticed that land records in the areas where plant was proposed to be
established were not updated while Tata Steel had been regularly requesting
GoJ for the pending clearances. GoJ, without ensuring these, requested
(September 2015) Tata Steel for second stage MoU on the basis of decisions
taken in the meeting held in February 2015 which was awaited.
Thus, the plant could not be set up which resulted in loss of opportunity by the
State in tapping investment of ` 41,000 crore.
(ii) Establishment of Steel Plant by Mittal Steel Company
An MoU was signed (October 2005) between GoJ and Mittal Steel Company
to establish 12 MTPA steel plant at Peterwar-Kasmar, Bokaro in two phases in
Jharkhand. The first phase of the Steel Plant consisting of six MTPA capacity
was to be set up within 48 months from date of submission of DPR whereas
second phase consisting of six MTPA was to be set up within 54 months from
the completion of first phase. The proposed investment of the project was
` 40,000 crore. As per MoU, 10,000 hectare land, 10,000 cubic meter water
per hour, 600 MT iron ore reserve sufficient for first thirty years of operation
and 1.20 billion tones of mineable coal reserve were required to establish the
plant.
Scrutiny revealed that:
• The Forest Department did not permit the company to undertake drilling
works as of October 2015 although the company applied for it in
February 2011 for which no reasons were on record;
Chapter 2: Performance Audit
55
• As land survey was not taken up, acquisition of required land could not be
done;
• Application for forest clearance in respect of grant of Mining Lease (ML)
of Karampada iron ore block was submitted by the company in April 2009 but
the same was forwarded to Ministry of Environment and Forest (MoEF) by
GoJ only in May 2013 i.e. after lapse of four years. Further, queries of Forest
Advisory Committee, though complied by GoJ in August 2014, was pending
with MoEF. Procurement of 230 out 500 acres of land was not finalised till
November 2016 for which no reasons were on record.
Thus, the plant could not be set up.
(iii) Establishment of Steel Plant by Jindal Steel and Power Limited
(JSPL)
An MoU was signed (July 2005) between GoJ and JSPL to establish five
MTPA Steel plant (at Asanbani) along with 1000 MW Captive Power Plant (at
Godda) in Jharkhand. It was envisaged that the steel plant was to be built in a
time frame of five years from the date of land possession and availability of
raw material linkage for the project. The total capital investment proposed for
the project was ` 11,500 crore which was further revised to ` 32,302 crore. It
was noticed that 2,987 acres of land was required to set up the plant. The
company submitted applications for land acquisition (September-October
2005), allocation of 140 MCM water for the Steel plant (August 2005) and 25
MCM water for Power Plant (May 2008) but neither the land was allocated
nor water was provided as of November 2016. However, reasons for inaction
were not on record.
Thus, the plant could not be setup and the State failed to tap investment
opportunity of ` 32302 crore.
(iv) Establishment of Steel Plant and Captive Power Plant by
Rungata Mines Limited
An MoU was signed (September 2006) between Government of Jharkhand
and Rungata Mines Limited to establish 4.5 MTPA integrated steel plant with
600 MW Captive Power Plant at Chandil block in Jharkhand. As per Primary
Project Report, 3,000 acres land was required. The proposed investment was
for ` 11,320 crore.
As per para 4(i) of MoU, GoJ was to render all possible assistance in
procuring suitable land required for setting up of manufacturing plant and
township besides permission for optimal drawal of water from nearby river for
operation of the project. The company was also to be allocated 272 MT
non-coking coal and 145 MT coking coal for captive coal mining for the
project either directly or through joint venture with a Jharkhand PSU.
Scrutiny revealed that Rungata Mines Limited identified land and applied
(March 2007) for it along with processing fees of ` 13.04 lakh to Jharkhand
Industrial Infrastructure Development Corporation for acquisition of 1588.03
acres land. The Company purchased 215 acres land for existing and proposed
plant. Audit further noticed that:

Audit Report on General, Social and Economic Sectors for the year ended 31 March 2016
56
• Processing for acquisition of 53 acres of land was completed in
February 2013 and ` 4.22 crore was deposited in the Government account but
the application was still pending as of November 2016 for which no reasons
were on record;
• Application for acquisition of 78.12 acres additional government land by
payment of ` 97 lakh was submitted (October 2009) but, application was also
pending as of November 2016 for which no reasons were recorded;
• Applications for iron ore and coking coal have been made several times
since signing of MoU (September 2006) for grant of captive mineral
concession for sustained operation of the project. However, these were
pending for consideration by the GoJ as of November 2016 for which no
reasons were on record.
Thus, despite executing MoU, GoJ failed to facilitate assistance in land
acquisition, water connection, coal blocks etc. As a result, the plant could not
be setup as of November 2016 which resulted in loss of opportunity in tapping
investment of ` 11,320 crore.
(v) Establishment of Steel Plant and Power Plant by JSW Steel
An MoU was signed (November 2005) between Government of Jharkhand and
JSW Steel Limited to set up 10 MTPA Integrated Steel plan with 800 MW
green field power plant in the State with proposed investment of ` 35,000
crore. Land requirement for this project was 7000 acres. Land was identified
in Nimdih Circle in Saraikela-Kharsawan district by the company. As per
MoU, GoJ was to facilitate the acquisition of these lands to the company on
payment of appropriate costs besides facilitating grant of all statutory
clearances, supply of water, power and other resources required for the project
preferably within six months from the date of MoU.
However, after detailed survey the site was not found feasible and a new site
of 3800 acres at Sonahatu in Ranchi district was identified (May 2008).
Audit observed that:
• JSW reported (March 2015) that all key inputs like land, water, and
minerals were in place except a few regulatory approvals. The company
further requested GoJ to take up case with MoEF to grant Environment and
Forest clearance. However, these were not granted (November 2016).
• In February 2015, GoJ extended the validity of MoU up to March 2016 but
sanction of Jharkhand State Electricity Board was awaited for construction of
five MVA power station. Likewise, permission for widening and
strengthening of approach road to the Plant was still awaited. Reasons for
inactions were not put on record.
As such, due to failure to facilitate assistance in land acquisition and other
basic requirements, the plant could not be setup which resulted in loss of
opportunity to tap the proposed investment of ` 35,000 crore.
In the exit conference, the Secretary admitted the facts and stated (November
2016) that allotment and allocation of basic requirements viz. Mines, land,
water etc. to the above companies were under process.

Chapter 2: Performance Audit
57
Fact remains that due to failure to address the basic requirements in about ten
years, the state had lost an opportunity to tap investment proposals worth
` 1.60 lakh crore which would have changed the economic conditions of the
state.
2.2.8.3 Declining Trend of investment
As per statements in the JIP 2012, 26 mega, 106 large and medium and 18,109
micro and small industries with an approximate investment of ` 28,424.06
crore and employment for 63,000 people had been set up in the State up to
March 2011 consequent to its previous policy i.e. JIP 2001. Whereas during
JIP 2012 policy period i.e. 2011-16, eight mega, 19 large and 12,996 MSME
units with investment of only ` 4,492.73 crore10
and employment for 61,618
people, were set up. As such, it appears that no special efforts were made by
the Government during the five year period under JIP 2012, as can be seen
from the low quantum of fresh investment received during the period.
The Department admitted the fact and replied (November 2016) that
investment sentiments have been weak and efforts were being made to secure
more and more investments. Focus has been on business for which factors of
production are favourable in Jharkhand.
2.2.8.4 Declining contribution of industry sector to the growth of GSDP
It was claimed in JIP 2012 that there had been almost three times growth in
GSDP which increased from ` 39,191.09 crore in 2000-01 to ` 1,20,010.20
crore in 2010-11. Analysis of Economic Survey of Jharkhand 2015-16 revealed
the following trend of growth in GSDP and contribution of Industry Sector and
within that Manufacturing sector to GSDP:
Table-2.2.4: Year-wise GSDP with contribution of manufacturing and
industry sector
Year GSDP
(in crore)
at current price
(2011-12)
Growth
rate
(per cent)
Contribution of
Industry sector
to GSDP
(per cent)
Contribution of
manufacturing
sector to GSDP
(per cent)
2011-12 1,50,918 18.6 39.96 17.85
2012-13 1,74,724 15.8 38.52 17.73
2013-14 1,88,567 7.9 37.50 16.80
2014-15 2,17,107 15.1 36.11 15.43
2015-16 2,41,955 11.4 34.78 14.17
(Source: Economic Survey of Jharkhand, 2015-16 and Website of Ministry of Statistics
and Programme Implementation, Government of India.)
From Table-2.2.4 it may be seen that:
• The contribution of manufacturing sector has shown a declining trend
during the period 2011-12 to 2015-16.
• The contribution of industry sector to GSDP has declined from 40 per cent
in 2011-12 to 35 per cent in 2015-16.
• Further, CAGR of Industry sector was only 3.38 per cent whereas CAGR
of GSDP was 12.87 per cent during the period 2004-05 to 2015-16. Thus,
10
Eight mega industries with investment of ` 2,988.58 crore, 19 large industries with
investment of ` 865.66 crore and 12,996 MSME units with investment of ` 638.49 crore
During 2011-16,
investment worth
` ` ` ` 4,492.73 crore was
made against the
investment of
`̀̀̀ 28,424.06 crore
made during the
previous policy
period
The contribution of
manufacturing
sector has shown a
declining trend
during the period
2011-12 to 2015-16

Audit Report on General, Social and Economic Sectors for the year ended 31 March 2016
58
despite overall growth in GSDP of the state, CAGR of industry sector was not
satisfactory and it failed to become the engine of growth for the state that is
endowed with mineral resources.
The Department admitted the fact and replied (November 2016) that the
decline in manufacturing sector is a part of national phenomenon. Reply is not
convincing as there was good responses from investors as evident from the
fact that 38 MoUs were signed between 2006 and 2016 but they failed to
materialise and most of the MoUs were either cancelled or are pending due to
constraints like CNT Act, SPT Act, forest clearances etc. which the state was
unable to mitigate.
2.2.8.5 Neighboring states better in attracting investments than
Jharkhand
While comparing with neighboring states that are of similar nature as
Jharkhand with rich mineral reserves and equivalent socio-economic
development, audit observed that they have been more successful in attracting
investments. For example, 121 MoUs were executed in Chhattisgarh during
2001 to 2016, out of which in 60 cases, production had already started while in
remaining 61 cases projects were under implementation. Likewise in Odisha,
88 MoUs were signed, out of which in 42 cases production have started and in
remaining 46 cases, the projects were under implementation. The comparison
is shown in Chart-2.2.3 below.
Chart-2.2.3: Comparison among neighbouring States
Significantly no MoUs were cancelled in these states unlike the high rate of
cancellation in Jharkhand which is 48 per cent. As such, performance of the
Jharkhand state in attracting investment was disappointing as compared to the
above neighbouring states which have similar socio-economic conditions and
mines and minerals.
On being pointed out (June 2016), the department did not reply on this issue.
2.2.9 Partial Operationalisation of Single Window System (SWS)
As a tool for development of Industrial Facilitation Mechanism, SWS was the
main thrust in JIP 2012 even though it was conceived in Industrial Policy 2001
for providing an integrated administrative clearance mechanism across various
concerned departments. In JIP 2012, SWS was sought to be made more
effective by integrating 14 departments with Industries Department for quick
clearances of proposals offered by investors so that setting up their desired
industry becomes time bound.
Nu
mb
er o
f M
oU
s
State(s)
Chapter 2: Performance Audit
59
Audit observed from the records of the DI that portal of SWS was launched
only in September 2015 after a delay of 42 months from notification of JIP
2012 (April 2012) and fell short of the objective of integrating all required 14
departments to provide a single window clearance system as only five11
departments/ agencies were included up to November 2016, while the
remaining nine12
departments were not integrated. Moreover, it was also being
operated as a ‘one-way-system’ as there was no mechanism at the designated
single window to locate the progress of applications that required onward
clearances at various levels. This indicated that clearances of administrative
nature necessary for setting up of an industrial unit were not being done at one
place.
Further, the Jharkhand Single Window Clearance Act 2015 came into effect
only in March 2016. It provided for constitution of a Governing Body13
, a
High Power Committee14
and Single Window Clearance Committee15
for
creating a friendly environment and ease of doing business in the State but
none of the committees were actually constituted as of November 2016.
Audit also observed that:
• Launch of the SWS portal and its utility for the citizen were not widely
advertised to generate awareness among the general mass, so that an interested
investor may access the facility of SWS. Lack of awareness resulted in low
pace of receiving applications at the portal.
• There was no mechanism to monitor the stage at which applications were
pending in various departments. Further, if there were delays on the part of the
investors to comply with queries/objection raised by any authority in course of
awarding clearances, the application was not rejected rather status is shown as
pending even beyond the prescribed timeline.
• Forest clearance was one of the major hurdles in attracting investment. It
was noticed that an application in the prescribed format is to be submitted by
the investor to the concerned Divisional Forest Officer (DFO) under whose
jurisdiction the land is proposed to be acquired/obtained. The proposal duly
vetted along with the comments of DFO is then forwarded to the Nodal
Officer for submission to the Forest Department, GoJ which after due
diligence, may send it to MoEF, GoI.
11
Labour, Pollution Control Board, Forest and Environment, Jharkhand Bijli Vitaran Nigam
Limited and Industry (Land allotment) 12
Commercial tax, Revenue, Registration & Land Reforms, Urban Development,
agriculture, Energy, Excise, Health, Mines and Food Supply & Consumers Affairs 13
Chairman: CM, Vice-Chairman: Minister of Industries, Members: Finance Minister,
Minister of Revenue, Registration & Land Reform, Chief Secretary and Principal
Secretary of Industry 14
Chairman: Chief Secretary, Members: Development Commissioner, Principal
Secretary/secretary of Industry and Planning-cum-Finance Department and Director of
Industry 15
Chairman: Principal Secretary of Industry, Members: Principal Secretary/secretary of
Planning-cum-Finance, Revenue and Land Reforms, Urban Development and Housing,
Labour Employment and Training, Forest, Environment and Climate Changes, Energy,
Water Resources, Mines and Geology, Chairman of Pollution Control Board and Director
of Industries as Coordinator
SWS was only partially
functional and not fully
effective which adversely
affected the pace of
investment in Jharkhand
as the investors were
deprived of the facility of
clearances from various
departments as a ‘one
stop’ service point

Audit Report on General, Social and Economic Sectors for the year ended 31 March 2016
60
Audit observed that there was no mechanism to track the applications of forest
clearances in the SWS portal even at the State level as these were not
integrated into the SWS.
• Although being a focal point in JIP 2001 and JIP 2012, the SWS even after
the delayed launch in September 2015 was only partially functional and not
fully effective. This adversely affected the pace of investment in Jharkhand as
the investors were deprived of the facility of clearances from various
departments as a ‘one stop’ service point as planned. As a result, SWS could
not facilitate in addressing the project impediments in respect of 23 projects
which could not be set up in four to 13 years of signing of MoUs.
On being pointed out (June 2016), the Department replied (November 2016)
that the Government had notified the Centre for Industrial Development and
Promotional activities, a Single Window System in August 2003 which is full-
fledged operational. The SWS portal is the latest version with high end
features in which 38 out of 66 mandatory services, as required under law, have
been made online. It has also integrated ten out of 14 covering departments
while integration of other services/departments is under process.
The reply is not convincing as the department could not provide any evidence
of having facilitated any service through SWS since 2003. Further, absence of
integration of four departments and 28 services, as admitted, defeats the basic
purpose of SWS to provide a ‘one stop’ service point as planned.
2.2.10 Skewed coverage of sectors and area
As provisioned in JIP 2012, special focus was to be given to sectors like
Automobile, Wood and Agro processing, Electronics, Information and
Communication Technology, Power generating units, Technical Institutes and
Private Universities to attract investors.
Audit observed from the records of the DI that the Government did not take
any initiatives to promote these sectors.
Further, with the aim to ensure balanced regional development and to prevent
socio-economic deprivation due to backwardness of any region, JIP 2012 also
envisaged setting of industries across the state. However, 41 MoU16
s that were
signed and not cancelled were limited to only eight17
out of 24 districts as can
be seen in the following map depicting the district-wise distribution of
industries proposed to be set up and for which MoUs’ were entered into by the
state.
16
18- started and 23- Not started 17
Bokaro, East Singhbhum (Jamshedpur), Hazaribagh, Ramgarh, Ranchi, Sahebganj
Saraikela and West Singhbhum (Chaibasa)

Chapter 2: Performance Audit
61
The distribution indicates a skewed industrial development with the bulk of
proposed or actual investments coming only in the coal and iron ore belts (40
out of 41).
Audit further noticed that in other regions no investment was proposed though
these were also areas of potential in terms of mines, minerals and other natural
resources viz., Bauxite and Aluminium is available in Lohardaga, Latehar,
Gumla, Simdega and Chatra districts; Iron ore, Dolomite, Coal and Graphite in
Palamu and Garhwa districts; Mica in Koderma district whereas in Santhal
Pargana there is potential for Oil, Steel, Silk and Food processing like
industries. As such, industrialisation was not encouraged in new areas as
envisaged in JIP 2012.
The Department replied (November 2016) that MoU is not the proper
indication of the number of industries started in each district.
Fact remains that the MoUs for the setting of the industries were not uniformly
distributed in all the district of the state.
2.2.11 Land Bank
JIP 2012 stipulated that effort would be made for creation of land banks in
each district by acquiring a minimum of 200-500 acres of land and
demarcating them as industrial estates with provision of basic industrial
infrastructure to attract investors. Further, a comprehensive exercise was also
to be undertaken to identify and utilise government owned or common land
that was mostly waste or fallow, in different parts of the State.
Scrutiny of records of DI, four IADAs and six DICs revealed that not a single
piece of land was acquired after creation of Jharkhand State. As such no land
bank was created in any of the districts. However, four IADAs were created
by the government for acquiring lands for distribution purposes having
Not a single piece of
land was acquired
after creation of
Jharkhand State
and no land bank
was created in any
of the districts

Audit Report on General, Social and Economic Sectors for the year ended 31 March 2016
62
jurisdiction over more than one district. Details of land available in the four
IADAs are given in Table-2.2.5.
Table-2.2.5: Showing details of land in IADAs
Name of
the
Authority
Land
Given
(in acre)
In
Possession
(in acre)
Not in
Possession
(in acre)
Remarks
AIADA 3166.86 3160.88 5.98 34.62 acre vacant
BIADA 1798.47 1470.60 327.87 327.87 acre not handed over by BSL.
Of 1470.60 acre handed over, 73.58
acre were undeveloped or under
litigation.
RIADA 1505.13 1290.57 214.56 101.50 acre under Cobra Battalion
and 113.06 acre were under litigation
SPIADA 1043.15 1043.15 Nil 49.50 acre were not plotted for use
(Source: Information obtained from the Department)
Further, ` 54.54 crore18
was allotted (between February and August 2015) to
all four IADAs for purchase/acquisition of land of 420.32 acre, out of which
` 11.52 crore was transferred19
and balance amount of ` 43.02 crore remained
unutilised and kept in the Personal Ledger accounts of IADAs as of June
2016. This indicates lack of efforts made by the IADAs.
• In BIADA, 1,798.47 acres land was made available between 1972-73 and
1985-86 to BIADA which was to be transferred from Bokaro Steel Limited
(BSL). Of this only 1,470.60 acres land was transferred and taken into
possession for four industrial areas (Bokaro, Giridih, Kandra and Sindri). As
such, 327.87 acres allotted land was still under the possession of BSL. Further
scrutiny revealed that of the 1,470.60 acres land taken into possession/
acquired, only 991.91 acres land was allotted to different industries while
279.88 acres remained vacant across all four industrial areas in which 68.97
acres were undeveloped or under litigation.
• Audit observed that under RIADA, 113.06 acre of land in Irba Industrial
Area (Ranchi district) and 101.50 acre in Barhi Industrial Area (Hazaribag
district) were not in possession of RIADA (as of July 2016) though these
lands were acquired during November 1983 and September 1996 respectively
(before creation of Jharkhand). Amounts of ` 0.21 crore and ` 2.51 crore
respectively, were also paid as land compensation to the DCs of Ranchi and
Hazaribag districts. Despite protracted correspondence with concerned Deputy
Commissioners (DCs) and higher authorities, RIADA could not take
possession of the lands. Further, it was also observed that 4.47 acres of
acquired lands at Irba were sold by land-brokers and 101.50 acres land at
Barhi was occupied by the Home Department for Cobra Battalion. Thus, after
incurring expenditure of ` 2.72 crore, the land at both these places remained
out of possession of RIADA.
It is pertinent to mention here that Barhi is situated at the junction of NH-2
(GT Road) and NH-33 whereas Irba is beside NH-33. Thus, despite being
18
AIADA: ` 18.00 crore for 162.25 acre, BIADA: ` 2.76 crore for 36.37 acre, RIADA:
` 29.26 crore for 210 acre and SPIADA: ` 4.52 crore for 11.70 acre 19
` 7 crore by AIADA towards forest clearance and ` 4.52 crore by SPIADA for land
acquisition

Chapter 2: Performance Audit
63
NH-33
strategically located with good road connectivity, these places could not be
developed for industries due to lack of possession of land with RIADA.
The Department while accepting the audit observation stated (November
2016) that Land Acquisition, Rehabilitation and Resettlement Act 2013 came
after a long time repealing Land Acquisition Act 1894, but land acquisition
became too difficult and cumbersome under the new Act. However, as
compared to other states, there are some issues in purchasing land from
Raiyats. To improve the availability of land, GoJ recently passed a resolution
to transfer all government land which is suitable for industries to the
Jharkhand Industrial Development Authority by the respective DCs.
Fact, however, remains that land bank could not be created which affected the
flow of resources for investment in the state.
2.2.12 Special Economic Zone (SEZ) not established
SEZ20
is a growth engine for attracting Industrial investment and boosting
exports. The concept of SEZ is expected to bring large dividends to the State
in terms of economic and industrial development and the generation of new
employment opportunities. This concept was to be promoted in IT/ automobile
/ chemical-pharmaceutical and other sectors as per JIP 2012.
Audit observed from the records of AIADA Jamshedpur that sector specific
SEZ was approved (April 2005) by Ministry of Commerce and Industry
(Department of Commerce), GoI for Automobiles and Auto components
which was to be developed within three years from the date of sanction
extended upto June 2015. A chunk of 90 acres land was earmarked at
Adityapur under the command area of AIADA. The developmental work was
to be taken up by incorporating a Special Purpose Company (Adityapur SEZ
Limited) in PPP21
mode.
20
“SEZs are specifically delineated enclaves treated as foreign territory for the purpose of
industrial, service and trade operations, with relaxation in customs duties and a more
liberal regime in respect of other levies, foreign investments and other transactions.
Domestic restrictions and infrastructure inadequacies would be removed in the SEZ to
create an internationally benchmarked environment for business transaction and
operations” 21
AIADA (with stake of 55 per cent) and JUSCO-Gammon consortium (the private
partner)
NH-31
GT Rd
SEZ not established
as 54.18 acres forest
land could not be
de-notified

Audit Report on General, Social and Economic Sectors for the year ended 31 March 2016
64
However, the project could not take-off as 54.18 acres forest land within the
project area of 90 acres which was transferred (January 1982) by the Forest
Department to AIADA for industrial development could not be de-notified as
the State Government failed to provide equivalent land for compensatory
afforestation as required under the Forest (Conservation) Act, 1980. This was
despite pursuance (between January 2007 and October 2013) made by the
Department and the Chief Secretary after AIADA deposited (June 2009)
` 7.01 crore in the Compensatory Afforestation Fund Management and
Planning Authority (CAMPA) fund along with a detailed proposal as per
provisions under the Act. But the Ministry of Commerce and Industry, GoI
refused to grant further extension of the SEZ project (September 2015) on the
ground that no development had taken place since notification (2006). This
deprived the State from establishing a SEZ.
The Department while accepting the audit observation replied (November
2016) that GoI cancelled the project as environmental clearance for forest land
could not be secured.
Fact remains that had the department initiated the process of de-notification of
the forest land in the initial stages, the SEZ could have been established in the
state.
2.2.13 Failure to create infrastructure
JIP 2012 clearly prescribed that sincere efforts should be made to provide
investors quality infrastructure like all-weather roads, uninterrupted power
supply, adequate water, connectivity through railways etc. The Policy further
prescribed that the State Government had taken steps to set up an Air Cargo
Complex at Ranchi to provide a boost to export oriented industries.
A review of the infrastructure available in the state to promote investment
revealed the following:
• Road Network: Four laning of Barhi-Hazaribag-Ranchi-Bahragora road
which is lifeline of the Jharkhand state situated on NH-33 connecting it with
Bihar, Uttar-Pradesh, Orissa was still incomplete (November 2016) even after
four years of commencement.

Chapter 2: Performance Audit
65
In reply, the Department replied that the work is under process.
• Rail Network: Rail connectivity between Koderma-Ranchi, Koderma-
Giridih and Tori-Lohardaga had not been started as of June 2016, despite
giving special focus in JIP 2012.
During exit conference, the secretary stated that Koderma-Hazaribag section
of Koderma–Ranchi line is completed and Tori-Lohardaga line is expected to
be completed soon.
• Air Cargo: An Air Cargo Complex at Birsa Munda Airport Ranchi for
export promotion was reported as complete (September 2016). However, as
security clearances from the Board of Controller of Aeronautic Standard
(BCAS), is yet to be received, air cargo flight is yet to commence (November
2016).
• Failure to develop industrial area
(i) Trade Centre: In SPIADA, ` 4.52 crore was transferred (October 2014)
to the DC, Deoghar towards acquisition of land for establishment of a Trade
Centre-cum-Convention Centre in Deoghar but no land was acquired even
after lapse of almost two years, which defeated the purpose of providing
infrastructure for trade.
In reply, the Department stated (November 2016) that the project has been
closed due to delinking of Central Assistance to States for Developing Export
Infrastructure and other Allied Activities (ASIDE) scheme by the GoI.
(ii) For creating basic infrastructure like road, pucca drain, boundary wall etc.
at industrial areas in Dumka, Jamtara and Jasidih, ` 5.71 crore was provided
(2013-15). But the entire amount was lying in the PL account of SPIADA for
failure to plan and create basic infrastructure. This resulted in these industrial
areas failing to attract investors.
• Water treatment plant
Though committed in its policy, neither feasibility of desalination plants and
supply of recycled and treated waste water to industries was explored nor the
Government implemented and facilitated mega water supply schemes for
industries at specified location through IADAs/Special Purpose Vehicles.

Audit Report on General, Social and Economic Sectors for the year ended 31 March 2016
66
In reply to the audit observation, the Department did not comment on this
issue.
2.2.14 Sericulture production (Tasar) not tapped for investment
As per JIP 2012, Jharkhand stood first (2012) in the country in production of
Tasar Silk. Analysis of statement furnished by Silk Directorate revealed an
increasing trend of production of raw silk during 2011-16, as can be seen in
the Chart below:
Though the efforts of the State in this regard are noteworthy, its full potential
has not been tapped as efforts for forward integration by attracting investors to
establish silk and cotton based industry were not found on record.
2.2.15 Procurement policy not implemented
JIP 2012, envisages the formation and implementation of a Procurement
Policy, which was notified (October 2014) as Jharkhand Procurement Policy
2014 with the aim to promote and develop Micro and Small Enterprises in the
state which would encourage competitiveness among local MSM and other
industrial units. It was also aimed at facilitating purchases from MSMEs in the
State by the Government Departments, Institutions including aided agencies
and Urban Local Bodies.
As per the objective, above mentioned entities are to ensure procurement of a
minimum of 20 per cent of their total annual purchase of products and services
from MSMEs of Jharkhand in a period of three years to encourage the
MSMEs.
Audit observed that there was nothing on record of the DI to show that the
intended objective of the Policy was achieved as the Industries Department
has no mechanism to monitor achievement of the 20 per cent target for
purchase from MSME.
The Department while accepting the audit observation replied (November
2016) that the department is revising the mandatory list of items reserved for
MSME as per the local requirement and making other amendments to improve
this policy further.
Fact remains that 20 per cent target for purchase from MSME could not be
ensured to assist the growth of MSME sectors.
The Department
has no mechanism
to monitor to
ensure 20 per cent
purchase from
MSME
Pro
du
ctio
n (
in M
T)
Year(s)

Chapter 2: Performance Audit
67
2.2.16 Lack of Monitoring
In terms of Regulations of IADAs, a Project Clearance Committee (PCC) of
IADAs is to meet once in a month for project clearances, allotment of land to
the applicants and other related issues.
Audit observed from the records of test-checked IADAs that none of the
IADAs maintained records of applications received from the entrepreneurs/
applicants for allotment of land/sheds and clearances of their projects in their
respective jurisdiction. However, only those applications prima facie chosen
for consideration in PCC meeting were recorded in the files as applications
have been received. Further in contravention of the provisions in three of the
four IADAs, only 31 PCC meetings (13 per cent) were held during 2011-16,
though 240 meetings were required. Whereas in SPIADA, number of PCC
meeting was nil during the period as detailed in Table-2.2.6:
Table-2.2.6: Details of PCC meetings
Year Details of Meetings AIADA BIADA RIADA SPIADA
2011-12 No. of Meetings to be held 12 12 12 12
No. of Meetings held 01 Nil 02 Nil
Shortfall 11 12 10 12
2012-13 No of Meetings to be held 12 12 12 12
No. of Meetings held 01 02 04 Nil
Shortfall 11 10 08 12
2013-14 No of Meetings to be held 12 12 12 12
No. of Meetings held Nil 01 Nil Nil
Shortfall 12 11 12 12
2014-15 No of Meetings to be held 12 12 12 12
No. of Meetings held 02 02 03 Nil
Shortfall 10 10 09 12
2015-16 No of Meetings to be held 12 12 12 12
No. of Meetings held 05 03 05 Nil
Shortfall 07 09 07 12
(Source: IADAs)
The Department replied (November 2016) that PCC meetings are scheduled
once a month. However, availability of sufficient number of applications in
the concerned IADAs is also taken into account which decide the schedule of
meetings. In some IADAs, the Honourble High Court prohibited (2011) the
conduct of meetings till the passing of uniform regulation. Reply is not
convincing as number of application received was not maintained in IADAs.
Further, the Department delayed framing regulation for four years.
• As per JIP 2012, a committee under chairmanship of Chief Minister was to
be constituted. The committee was to meet twice in a year to review the
implementation of the policy. The implementation of the policy was also to be
monitored at least once in every quarter by the Chief Secretary and the
Government was to carry out a mid-term review of the policy.
Audit observed from the records of DI that the committee under the
chairmanship of Chief Minister was not constituted (June 2016). Hence, in the
absence of the committee, review of the policy could also not be carried out by
Government. As such, neither shortcomings in policy were brought out nor
measures to address these could be discussed.
Implementation of
the policy could not
be reviewed as the
committee under
chairmanship of
Chief Minister was
not constituted

Audit Report on General, Social and Economic Sectors for the year ended 31 March 2016
68
The Department while accepting the audit observation replied (November
2016) that the committee under the chairmanship of Chief Minister had not
been constituted but from time to time the Chief Minister and other higher
authorities reviewed the JIP 2012 policy.
Fact remains that in the absence of the committee, institutionalisation of
review/monitoring process of industrial policy at the apex level was not done.
2.2.17 Surrender and saving of funds
During 2011-16, the Industries Department made provision of funds under
Publicity and Publication, Establishment of SWS and Project Feasibility and
Consultancy to facilitate industrial investment promotional activities as
detailed in Appendix-2.2.2.
Audit noticed that during 2011-16, the department allotted ` 40.2322
crore for
investment promotion activities of Publication and Publicity, SWS and Project
Feasibility and Consultancy. It also received ` 3.24 crore as ‘other receipts’ in
SWS. Of this, only ` 27.27 crore could be spent while ` 16.20 crore
(37 per cent) remained unspent. Out of unspent balance, ` 9.90 crore was
lying idle in bank accounts of SWS. Thus, the fund was not entirely utilised to
realise the intended objective.
In reply the Department stated (November 2016) that the actual expense may
differ from assessments as provided in the budget. A separate bank account is
being operated for various expenditure under SWS. Fact remains that
utilisation of the available fund for the intended purpose was not ensured.
2.2.18 Conclusion
Efforts of the Government to create a conducive environment to increase flow
of investment in the State was not sufficient as:
• Ease of Doing Business in Jharkhand suffered from constraints such as
setting up business, allotment of land, power, water etc. As a result,
investment decreased to ` 4,493 crore during the JIP period 2012 as compared
to ` 28,424 crore in the previous policy period. While 48 per cent MoUs were
cancelled due to failure to acquire land and lack of facilitation by the
Government for setting up the industries etc., resulting in deprivation of
investment worth ` 62,879 crore in the State, there was opportunity loss of
` 1.60 lakh crore to the State due to failure to facilitate the proposed
establishment of five Steel Plant cum Captive Power Plants.
• The partially functional SWS could not address the concerns of potential
investors and was not effective as the investors could not get clearances of
required departments/ agencies at ‘one stop’ service point. As a result, SWS
could not facilitate speedy project implementation and remove impediments in
respect of 23 projects which could not be set up even after four to 13 years
from signing of MoUs.
• Government failed in its role to provide basic infrastructure facilities to
attract investors like land bank, uninterrupted supply of power, water and raw
materials etc. Further, Special Economic Zone for Automobiles and Auto
22
Included Opening Balance of ` 1.20 crore

Chapter 2: Performance Audit
69
components in the State, though sanctioned, could not be established due to
delayed action on environment by the State. This prevented promotion of
Automobile sector in the State and failed to attract investment.
• Committee under chairmanship of the Chief Minister to review
implementation of JIP 2012 to facilitate investment and to attract investors
was not constituted. As such, neither progress of implementation of the JIP
2012 could be monitored at apex level nor mid-term review of the policy be
carried out by the Government.
2.1.19 Recommendation
The Government should address the impediments in setting up business and
should allot land, power, water and other infrastructure in a time bound
manner to investors so that investments could be facilitated in the State.
Single Window System for clearance of all services by integrating all the
concerned departments should be finalised and put to operation at the earliest
to provide ‘one stop’ service point to the investors seeking to invest in the
state.
The Committee under the Chairmanship of the Chief Minister should be
established in the State at the earliest to review and monitor the
implementation of JIP 2012 with a view to promote investment activities in
the state.