PDF Downloads - Hill Publishing Group
16
Engineering Advances, 2021, 1(2), 67-82 http://www.hillpublisher.com/journals/ea/ ISSN Online: 2768-7961 ISSN Print: ****-**** DOI: 10.26855/ea.2021.12.005 67 Engineering Advances Modeling and Design of a Prototype Footstep Power Generating Machine Israel Enema Ohiemi 1 , Nnorum Choice Obundah 1 , Ugwuoke Cornelius Chinoso 1 , Israel Ojo Enock 2,* , Kolo Yetu Babazhitsu 2 , Ayuba Elkanah Jatau 3 , Elvis Adam Alhassan 4 1 Department of Mechanical Engineering, University of Nigeria, Nsukka, Nigeria. 2 Department of Mechanical Engineering, Federal Polytechnic Bida, Bida, Niger State, Nigeria. 3 Department of Mechanical Engineering, Technology, Niger State Polytechnic, Zungeru, Niger State, Nigeria. 4 Faculty of Mathematical Sciences, C.K. Tedam University of Technology and Applied Sciences, Navrongo, Upper East Region, Ghana. How to cite this paper: Israel Enema Ohiemi, Nnorum Choice Obundah, Ug- wuoke Cornelius Chinoso, Israel Ojo Enock, Kolo Yetu Babazhitsu, Ayuba Elkanah Jatau, Elvis Adam Alhassan. (2021) Modeling and Design of a Proto- type Footstep Power Generating Machine. Engineering Advances, 1(2), 67-82. DOI: 10.26855/ea.2021.12.005 Received: November 15, 2021 Accepted: December 10, 2021 Published: December 30, 2021 * Corresponding author: Israel Ojo Enock, Department of Mechanical Engineering, Federal Polytechnic Bida, Bida, Niger State, Nigeria. Email: [email protected] Abstract This paper presents a non-conventional method of electrical power generation through the design, modelling and fabrication of a footstep power generating system. It is configured to generate electricity as long as there is a foot force on it. The system consists mainly of a connecting rod, gears, u-shaped shaft, and an alternator. The component members were designed, while static and fatigue ana- lyses were carried out using Autodesk Inventor software. The static and fatigue analysis of both spring and footboard revealed yield strength of 207 Gpa and a factor of safety of 12 for spring and 6.58 for footboard. Basic manufacturing processes were employed during the construction of the machine. The results show an output power of 0.912W, voltage of 1.52V, and an efficiency of 21% when an average mass of 62kg acted on it. The root mean square value greater than 0.9 shows a strong correlation of the predictive model. Keywords Power Generation, Footstep, Autodesk, Electrical Energy 1. Introduction Electricity is the most convenient and versatile form of energy and in high demand, it is growing at a faster rate than other forms of energy and plays a crucial role in the industrial and agricultural sectors [1]. Electricity is most often gen- erated at a power station by electromechanical systems, primarily driven by heat engines fueled by combustion or nuc- lear fission but also by other means such as the kinetic energy of flowing water and wind. Other energy sources include solar photovoltaic and geothermal power [2]. The fundamental principles of electricity generation were discovered in the 1820s and early 1830s by British scientist Michael Faraday [3]. His method is still in use today. Electricity can be generated by the movement of a loop of wire, or disc of copper between the poles of a magnet [4]. The consumption of electricity is an index of the productivity and growth of a country. Therefore, power develop- ment has been given high priority in development programs [5]. The increase of the human population in the country has necessitated and multiplied the need for use of energy to do work and to improve well-being than ever existed mil- lions of years ago. As a result, many resources are being wasted with attendant consequences on health and the envi- ronment [6]. So, non-conventional energy is very essential at this time to any nation. Walking is a common activity performed by people daily. There is a loss in kinetic energy due to the weight transfer to the surface of the foot during walking. Therefore, the energy of the person from the footstep can be converted to electrical energy. Human power is an attractive energy source. Footstep power generating system is a nonconventional/renewable source of energy that reduces environmental pollution (such as air pollution caused by burning of fossil fuels and improves public health)
-
Upload
khangminh22 -
Category
Documents
-
view
0 -
download
0
Transcript of PDF Downloads - Hill Publishing Group

Engineering Advances, 2021, 1(2), 67-82 http://www.hillpublisher.com/journals/ea/
ISSN Online: 2768-7961 ISSN Print: ****-****
DOI: 10.26855/ea.2021.12.005 67 Engineering Advances
Modeling and Design of a Prototype Footstep Power Generating Machine
Israel Enema Ohiemi1, Nnorum Choice Obundah1, Ugwuoke Cornelius Chinoso1, Israel Ojo Enock2,*, Kolo Yetu Babazhitsu2, Ayuba Elkanah Jatau3, Elvis Adam Alhassan4
1Department of Mechanical Engineering, University of Nigeria, Nsukka, Nigeria. 2Department of Mechanical Engineering, Federal Polytechnic Bida, Bida, Niger State, Nigeria. 3Department of Mechanical Engineering, Technology, Niger State Polytechnic, Zungeru, Niger State, Nigeria. 4Faculty of Mathematical Sciences, C.K. Tedam University of Technology and Applied Sciences, Navrongo, Upper East Region, Ghana.
How to cite this paper: Israel Enema Ohiemi, Nnorum Choice Obundah, Ug-wuoke Cornelius Chinoso, Israel Ojo Enock, Kolo Yetu Babazhitsu, Ayuba Elkanah Jatau, Elvis Adam Alhassan. (2021) Modeling and Design of a Proto-type Footstep Power Generating Machine. Engineering Advances, 1(2), 67-82. DOI: 10.26855/ea.2021.12.005 Received: November 15, 2021 Accepted: December 10, 2021 Published: December 30, 2021 *Corresponding author: Israel Ojo Enock, Department of Mechanical Engineering, Federal Polytechnic Bida, Bida, Niger State, Nigeria. Email: [email protected]
Abstract This paper presents a non-conventional method of electrical power generation through the design, modelling and fabrication of a footstep power generating system. It is configured to generate electricity as long as there is a foot force on it. The system consists mainly of a connecting rod, gears, u-shaped shaft, and an alternator. The component members were designed, while static and fatigue ana-lyses were carried out using Autodesk Inventor software. The static and fatigue analysis of both spring and footboard revealed yield strength of 207 Gpa and a factor of safety of 12 for spring and 6.58 for footboard. Basic manufacturing processes were employed during the construction of the machine. The results show an output power of 0.912W, voltage of 1.52V, and an efficiency of 21% when an average mass of 62kg acted on it. The root mean square value greater than 0.9 shows a strong correlation of the predictive model. Keywords Power Generation, Footstep, Autodesk, Electrical Energy
1. Introduction
Electricity is the most convenient and versatile form of energy and in high demand, it is growing at a faster rate than other forms of energy and plays a crucial role in the industrial and agricultural sectors [1]. Electricity is most often gen-erated at a power station by electromechanical systems, primarily driven by heat engines fueled by combustion or nuc-lear fission but also by other means such as the kinetic energy of flowing water and wind. Other energy sources include solar photovoltaic and geothermal power [2].
The fundamental principles of electricity generation were discovered in the 1820s and early 1830s by British scientist Michael Faraday [3]. His method is still in use today. Electricity can be generated by the movement of a loop of wire, or disc of copper between the poles of a magnet [4].
The consumption of electricity is an index of the productivity and growth of a country. Therefore, power develop-ment has been given high priority in development programs [5]. The increase of the human population in the country has necessitated and multiplied the need for use of energy to do work and to improve well-being than ever existed mil-lions of years ago. As a result, many resources are being wasted with attendant consequences on health and the envi-ronment [6]. So, non-conventional energy is very essential at this time to any nation. Walking is a common activity performed by people daily. There is a loss in kinetic energy due to the weight transfer to the surface of the foot during walking. Therefore, the energy of the person from the footstep can be converted to electrical energy. Human power is an attractive energy source. Footstep power generating system is a nonconventional/renewable source of energy that reduces environmental pollution (such as air pollution caused by burning of fossil fuels and improves public health)
Israel Enema Ohiemi et al.
DOI: 10.26855/ea.2021.12.005 68 Engineering Advances
thereby reducing premature mortalities due to pollution and saving associated health costs [7].
2. Design Analysis and Calculations
2.1. Spring Design
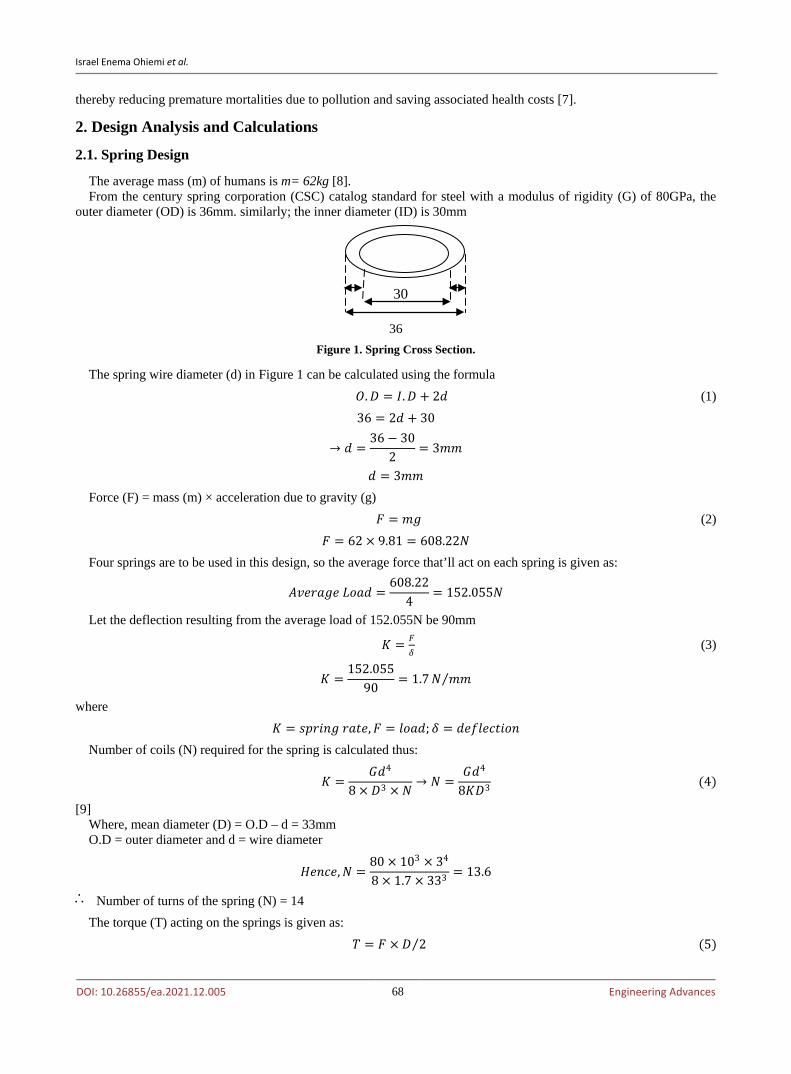
The average mass (m) of humans is m= 62kg [8]. From the century spring corporation (CSC) catalog standard for steel with a modulus of rigidity (G) of 80GPa, the
outer diameter (OD) is 36mm. similarly; the inner diameter (ID) is 30mm
36
Figure 1. Spring Cross Section.
The spring wire diameter (d) in Figure 1 can be calculated using the formula 𝑂𝑂.𝐷𝐷 = 𝐼𝐼.𝐷𝐷 + 2𝑑𝑑 (1) 36 = 2𝑑𝑑 + 30
→ 𝑑𝑑 =36 − 30
2= 3𝑚𝑚𝑚𝑚
𝑑𝑑 = 3𝑚𝑚𝑚𝑚 Force (F) = mass (m) × acceleration due to gravity (g)
𝐹𝐹 = 𝑚𝑚𝑚𝑚 (2) 𝐹𝐹 = 62 × 9.81 = 608.22𝑁𝑁
Four springs are to be used in this design, so the average force that’ll act on each spring is given as:
𝐴𝐴𝐴𝐴𝐴𝐴𝐴𝐴𝐴𝐴𝑚𝑚𝐴𝐴 𝐿𝐿𝐿𝐿𝐴𝐴𝑑𝑑 =608.22
4= 152.055𝑁𝑁
Let the deflection resulting from the average load of 152.055N be 90mm
𝐾𝐾 = 𝐹𝐹𝛿𝛿 (3)
𝐾𝐾 =152.055
90= 1.7𝑁𝑁 𝑚𝑚𝑚𝑚⁄
where 𝐾𝐾 = 𝑠𝑠𝑠𝑠𝐴𝐴𝑠𝑠𝑠𝑠𝑚𝑚 𝐴𝐴𝐴𝐴𝑟𝑟𝐴𝐴,𝐹𝐹 = 𝑙𝑙𝐿𝐿𝐴𝐴𝑑𝑑; 𝛿𝛿 = 𝑑𝑑𝐴𝐴𝑑𝑑𝑙𝑙𝐴𝐴𝑑𝑑𝑟𝑟𝑠𝑠𝐿𝐿𝑠𝑠
Number of coils (N) required for the spring is calculated thus:
𝐾𝐾 =𝐺𝐺𝑑𝑑4
8 × 𝐷𝐷3 × 𝑁𝑁→ 𝑁𝑁 =
𝐺𝐺𝑑𝑑4
8𝐾𝐾𝐷𝐷3 (4)
[9] Where, mean diameter (D) = O.D – d = 33mm O.D = outer diameter and d = wire diameter
𝐻𝐻𝐴𝐴𝑠𝑠𝑑𝑑𝐴𝐴,𝑁𝑁 =80 × 103 × 34
8 × 1.7 × 333 = 13.6
Number of turns of the spring (N) = 14 The torque (T) acting on the springs is given as:
𝑇𝑇 = 𝐹𝐹 × 𝐷𝐷 2⁄ (5)
30
∴

Israel Enema Ohiemi et al.
DOI: 10.26855/ea.2021.12.005 69 Engineering Advances
[9] 𝑇𝑇 = 608.22 × 18
𝑇𝑇 = 10947.96𝑁𝑁 −𝑚𝑚𝑚𝑚 The shear stress in the spring is given thus:
𝑇𝑇𝐽𝐽
=𝜏𝜏𝐴𝐴
(6)
[9]
→ 𝜏𝜏 =𝑇𝑇𝐴𝐴𝐽𝐽
where
𝐽𝐽 =𝜋𝜋𝑑𝑑4
32= 7.95
J is polar moment of inertia of spring wire 𝐴𝐴 = 𝐷𝐷 2⁄ = 18
𝐴𝐴 is the radius of wire diameter
𝜏𝜏 =10947.96 × 18
7.95= 24787.83𝑁𝑁 𝑚𝑚𝑚𝑚2⁄
2.2. Bearing Design
From the gear specifications, its approximate weight = 25.9N and the weight of the connecting rod = 5N. These weights constitute
Figure 2. Force Diagram.
the forces acting on the shaft on the bearing illustrated in Figure 2.
� ↑ = 𝑅𝑅𝐴𝐴 + 𝑅𝑅𝐵𝐵 − 25.9 − 5
→ 𝑅𝑅𝐴𝐴 + 𝑅𝑅𝐵𝐵 = 30.9 (7) Where 𝑅𝑅𝐴𝐴 𝐴𝐴𝑠𝑠𝑑𝑑 𝑅𝑅𝐵𝐵 are reactions at points A and B, respectively. The moment about point A is given by:
�𝑀𝑀𝐴𝐴 = 0 (8)
𝑅𝑅𝐵𝐵 × 32 = 25.9 × 1 + 5 × 16
𝑅𝑅𝐵𝐵 =25.9 + 80
32= 3.31
Substitute 𝑅𝑅𝐵𝐵 = 3.31 into equation (1) 𝑅𝑅𝐴𝐴 = 30.9 − 𝑅𝑅𝐵𝐵 = 27.59𝑁𝑁
Since 𝑅𝑅𝐴𝐴 𝐴𝐴𝑠𝑠𝑑𝑑 𝑅𝑅𝐵𝐵 are 27.59 𝐴𝐴𝑠𝑠𝑑𝑑 3.31 respectively. The bearing loads are small; therefore, the recommended bear-ing is a journal bearing. Table 1 shows the bearing specification.
Table 1. Specification of Ball Bearing R1804
Description Value Bore(d) 26mm
Outer Diameter (OD) 42mm Width (B) 7mm
25.9N 5N
16m 15m 1m
RA
A
RB
B

Israel Enema Ohiemi et al.
DOI: 10.26855/ea.2021.12.005 70 Engineering Advances
Ball No. 14 Ball Size 3.3mm
Dynamic Load Rating (C) 750 Static Load Rating (Co) 480
𝐴𝐴𝑠𝑠𝑚𝑚𝑙𝑙𝐴𝐴 𝐿𝐿𝑑𝑑 𝐶𝐶𝐿𝐿𝑠𝑠𝑟𝑟𝐴𝐴𝑑𝑑𝑟𝑟 𝐶𝐶0 = 𝑑𝑑0𝑠𝑠𝑖𝑖𝐷𝐷2 cos𝛼𝛼 (9) [10]
Where; i= Number of rows of balls in any one bearing = 1 Z = Number of ball per row = 14 D= Diameter of balls = 3.3mm
= Angle of contact
= A factor depending upon the type of bearing = 3.33 for ball bearing
cos𝛼𝛼 =𝐶𝐶0
𝑑𝑑0 × 𝑠𝑠 × 𝑧𝑧 × 𝐷𝐷2
cos𝛼𝛼 =480
3.33 × 1 × 14 × 3.32
𝛼𝛼 = 19.56° The life of the bearing is given by the formula below
𝐿𝐿1 = �𝐶𝐶𝑊𝑊1�
3
× 106 𝐴𝐴𝐴𝐴𝐴𝐴𝐿𝐿𝑙𝑙𝑟𝑟𝑟𝑟𝑠𝑠𝐿𝐿𝑠𝑠𝑠𝑠 (10)
[9] where,
L = bearing life C = dynamic load rating = 750 W = dynamic load k = 3 for ball bearing. For Section A: W = RA = 27.59N
𝐿𝐿 = �𝐶𝐶𝑊𝑊�
3
× 106 𝐴𝐴𝐴𝐴𝐴𝐴𝐿𝐿𝑙𝑙𝑟𝑟𝑟𝑟𝑠𝑠𝐿𝐿𝑠𝑠𝑠𝑠 = �750
27.59�
3
× 106 𝐴𝐴𝐴𝐴𝐴𝐴𝐿𝐿𝑙𝑙𝑟𝑟𝑟𝑟𝑠𝑠𝐿𝐿𝑠𝑠𝑠𝑠 = 2.0 × 10¹⁰ 𝐴𝐴𝐴𝐴𝐴𝐴𝐿𝐿𝑙𝑙𝑟𝑟𝑟𝑟𝑠𝑠𝐿𝐿𝑠𝑠𝑠𝑠 [9]
For Section B: 𝑊𝑊 = 𝑅𝑅𝐵𝐵 = 3.31
𝐿𝐿 = �𝐶𝐶𝑊𝑊�𝐾𝐾
× 106 𝐴𝐴𝐴𝐴𝐴𝐴𝐿𝐿𝑙𝑙𝑟𝑟𝑟𝑟𝑠𝑠𝐿𝐿𝑠𝑠𝑠𝑠
𝐿𝐿 = �7503.31
�3
× 106 𝐴𝐴𝐴𝐴𝐴𝐴𝐿𝐿𝑙𝑙𝑟𝑟𝑟𝑟𝑠𝑠𝐿𝐿𝑠𝑠𝑠𝑠
= 1.16 × 10¹³ 𝐴𝐴𝐴𝐴𝐴𝐴𝐿𝐿𝑙𝑙𝑟𝑟𝑟𝑟𝑠𝑠𝐿𝐿𝑠𝑠𝑠𝑠 The resulting calculation above shows that the bearing chosen is suitable for the project as it has many revolutions to
undergo before failure and the bearings used are journal bearings because it is readily available.
2.3. Shaft Design
The specifications of the shaft below were assumed with respect to its availability and the resulting deflection calcu-lated
Let the length of the shaft (L) be 320mm Diameter of the shaft = 24mm Selected shaft material is steel. Modulus of Rigidity of steel (G) = 80 GPa
αof

Israel Enema Ohiemi et al.
DOI: 10.26855/ea.2021.12.005 71 Engineering Advances
The deflection that the shaft will experience is given by the equation below
𝛿𝛿 =𝐹𝐹𝐿𝐿3
3𝐺𝐺𝐼𝐼 (11)
[10] where;
F = W = shaft load
𝑀𝑀𝐿𝐿𝑚𝑚𝐴𝐴𝑠𝑠𝑟𝑟 𝐿𝐿𝑑𝑑 𝐼𝐼𝑠𝑠𝐴𝐴𝐴𝐴𝑟𝑟𝑠𝑠𝐴𝐴 𝐼𝐼 =𝜋𝜋𝑑𝑑4
64=𝜋𝜋 × 244
64= 16286.02
∴ 𝛿𝛿 =30.9 × 3203
3 × 80 × 103 × 16286.02= 0.259𝑚𝑚𝑚𝑚
This means that the material of the shaft is suitable for the project because its deflection as a result of the weight is within limit.
The torque T acting on the shaft is given by the equation 𝑇𝑇 = 𝐹𝐹 × 𝑑𝑑 2⁄
[10] Where the force F on the shaft is 30.9
= 30.9 × 12 = 370 𝑁𝑁𝑚𝑚𝑚𝑚 The shear stress is calculated using the formula:
𝑇𝑇𝐽𝐽
=𝜏𝜏𝐴𝐴
[9]
→ 𝜏𝜏 =𝑇𝑇𝐴𝐴𝐽𝐽
Where,
𝐽𝐽 =𝜋𝜋𝑑𝑑4
32= 32572.03
Hence,
𝜏𝜏 =370.8 × 24 2⁄
32572.03= 0.1366𝑁𝑁 𝑚𝑚𝑚𝑚2⁄
To determine depth value of the shaft “h”. The maximum compression allowable on the spring is 120mm. So, let the maximum vertical deflection of the spring be 𝑋𝑋 = 120𝑚𝑚𝑚𝑚. When rotated, the u-shaped shaft creates a virtual circle.
NOTE: The depth of shaft was determined with respect to the extent of compression of the spring, this is in order to enable the shaft make full revolutions.
Now, let points A and B be just a little more than 180° say 185° apart. The angular distance S (length of arc sub-tended by 185° of the circle) between these points should be less than or equal to the maximum spring deflection.
Hence, calculating for ℎ = 𝐴𝐴 𝑋𝑋 = 𝑆𝑆 = 120𝑚𝑚𝑚𝑚
𝜃𝜃 = 185° 𝐴𝐴𝑠𝑠𝑑𝑑 𝑆𝑆 = 𝑙𝑙𝐴𝐴𝑠𝑠𝑚𝑚𝑟𝑟ℎ 𝐿𝐿𝑑𝑑 𝐴𝐴𝐴𝐴𝑑𝑑
∴ 𝑆𝑆 =𝜃𝜃
360× 2𝜋𝜋𝐴𝐴 (12)
→ 𝐴𝐴 =360 × 𝑆𝑆
2𝜋𝜋𝜃𝜃=
360 × 1202 × 𝜋𝜋 × 180
= 37.165𝑚𝑚𝑚𝑚
Therefore, ℎ = 𝐴𝐴 = 37.165𝑚𝑚𝑚𝑚
It is important to note that the vertical deflection of the spring is tactically calculated to make the shaft rotate to ap-proximately 185°, the spring compression stops here and the completion of the shaft rotation is achieved by the spring

Israel Enema Ohiemi et al.
DOI: 10.26855/ea.2021.12.005 72 Engineering Advances
return, thereby completing a revolution of 360°.
2.4. Gear Design
The aim is to get a gear ratio of 4:1, the specifications of gears were chosen due to its availability For the driving gear, Number of teeth = 36 Pitch circle diameter = 106mm Inner diameter = 24mm For the driven gear, Number of teeth = 9 Pitch circle diameter = 24mm Inner diameter = 10mm
𝐶𝐶𝑠𝑠𝐴𝐴𝑑𝑑𝑟𝑟𝑙𝑙𝐴𝐴𝐴𝐴 𝑃𝑃𝑠𝑠𝑟𝑟𝑑𝑑ℎ (𝑃𝑃𝑑𝑑) = 𝜋𝜋𝐷𝐷 𝑇𝑇⁄ (13) Where, D = Diameter of the pitch circle = 106mm T = Number of teeth on the wheel = 36
∴ 𝑃𝑃𝑑𝑑 =𝜋𝜋 × 106
36= 9.25𝑚𝑚𝑚𝑚
𝐷𝐷𝑠𝑠𝐴𝐴𝑚𝑚𝐴𝐴𝑟𝑟𝐴𝐴𝐴𝐴𝑙𝑙 𝑃𝑃𝑠𝑠𝑟𝑟𝑑𝑑ℎ (𝑃𝑃𝑑𝑑) =𝑇𝑇𝐷𝐷
∴ 𝑃𝑃𝑑𝑑 =36
106= 0.34 𝑟𝑟𝐴𝐴𝐴𝐴𝑟𝑟ℎ 𝑚𝑚𝑚𝑚⁄
𝑀𝑀𝐿𝐿𝑑𝑑𝑟𝑟𝑙𝑙𝐴𝐴(𝑀𝑀) =𝐷𝐷𝑇𝑇
(14)
∴ 𝑀𝑀 =10636
= 3𝑚𝑚𝑚𝑚
Table 2 shows the standard proportion for gear systems of 20o full depth involute.
Table 2. Standard Proportion for Gear Systems of 20o Full Depth Involute
S/n Particulars 20o full depth involute system 1 Addendum 1 x 3 = 3mm 2 Dedendum 1.25 x 3 = 3.75mm 3 Working depth 2 x 3 = 6mm 4 Minimum total depth 2.25 x 3 = 6.75mm 5 Tooth thickness 1.5708 x 3 = 4.71mm 6 Minimum clearance 0.25 x 3 = 0.75mm 7 Fillet radius at root 0.4 x 3 = 1.2mm
𝑉𝑉𝐴𝐴𝑙𝑙𝐿𝐿𝑑𝑑𝑠𝑠𝑟𝑟𝑉𝑉 𝐴𝐴𝐴𝐴𝑟𝑟𝑠𝑠𝐿𝐿(𝑉𝑉𝑅𝑅) =𝑇𝑇1
𝑇𝑇2 (15)
where 𝑇𝑇1 = Number of teeth of small gear = 9 𝑇𝑇2 = Number of teeth of big gear = 36
𝑉𝑉𝑅𝑅 =9
36= 0.25
Check for interference
𝑇𝑇1 ≥2𝐴𝐴𝑎𝑎 1
𝑇𝑇2𝑃𝑃𝑑𝑑
�1 + 1𝑇𝑇2� 1𝑇𝑇2
+ 2� sin2 𝜑𝜑 − 1 (16)

Israel Enema Ohiemi et al.
DOI: 10.26855/ea.2021.12.005 73 Engineering Advances
where 𝑇𝑇1 = the number of teeth of the small gear
𝑃𝑃𝑑𝑑 = 0.34 𝑟𝑟𝐴𝐴𝐴𝐴𝑟𝑟ℎ 𝑚𝑚𝑚𝑚⁄ 𝐴𝐴𝑎𝑎 = 𝑀𝑀 = 𝑀𝑀𝐿𝐿𝑑𝑑𝑟𝑟𝑙𝑙𝐴𝐴 = 3𝑚𝑚𝑚𝑚
𝜑𝜑 = 20°
𝑇𝑇1 ≥2 × 3 × 1
36× 0.34
�1 + 136� 1
36+ 2� sin2 20 − 1
𝑇𝑇1 ≥ 0.7 This means that there is no interference.
3. Fabrication and Testing The 3-D drawing and constructed figure of the footstep power generating machine is shown in Figure 3 (a) and Fig-
ure 3 (b)
(a) (b)
Figure 3. Footstep Power Generating Machine (a) 3D model (b) Fabricated.
The design of the footstep power generating machine includes essential components such as: The foot board where the force is applied, helical compression spring to return the system to its original position when the load is removed, shaft to transmit power to the gear. Connecting rod to convert reciprocating motion into rotational motion. Other equipment includes: gears, bearing, D.C. generator, multimeter and light emitting diode (LED) bulbs. The selected ma-terials are discussed in Table 3.
Table 3. Materials Listing and Specifications
Name of component Specification (mm) Material used
Plate 400 x300x4 Mild Steel
Base 400x300x4 Mild Steel
Connecting rod Length = 120 Bore = 24 Steel
Spring Outer diameter = 36 Inner diameter = 30 Wire diameter = 3
Steel
Driving gear - No of teeth = 36 - Type - spur gear Steel
1. Footboard
2. Connecting rod
3. Spring

Israel Enema Ohiemi et al.
DOI: 10.26855/ea.2021.12.005 74 Engineering Advances
Driven gear - No of teeth = 9 - Type -spur gear Mild steel
U shaped shaft - length = 320mm - thickness = 20mm Steel
Straight shaft - length = 200mm - diameter = 10mm Steel
D. C generator - Type - dynamo - voltage = 12 v
LED bulb -voltage = 3 v
4. Results and Discussion The results got from the design calculations are summarized in Table 4.
Table 4. Design Results
Component Design Results
Spring
Spring rate = 1.7N/mm Number of turns = 14
Torque = 10947.96N-mm Shear stress = 24787.83N/mm2
Shaft Deflection = 0.119mm Torque = 146.4N-mm
Shear stress = 0.0539N/mm2
Bearing
Angle of contact = 20o Reaction on bearing A = 9.47N Reaction on bearing B = 2.73N
Life of bearing A = 4.96 × 10⁶ revolutions
Life of bearing B = 2.07 × 10¹³ revolutions
Gear Module = 3
velocity ratio = 0.25 Interference = 0.7
4.1. Static Analysis of Spring and Footboard The static analysis of some of the components of the footstep power generating machine was done. The results got
from the analysis of the necessary components are presented in tables and graphs.
4.2. Spring Analysis Results The spring’s physical properties, mechanical properties and force distributions in the X, Y and Z co-ordinates are
shown in Tables 5 and 6 respectively.
Table 5. Physical & Mechanical Properties of Spring
Material Steel Density 7.85𝑚𝑚 𝑑𝑑𝑚𝑚3⁄ Mass 0.145351 𝑘𝑘𝑚𝑚 Area 21,777.9 𝑚𝑚𝑚𝑚2
Volume 18,516 𝑚𝑚𝑚𝑚3
Center of Gravity 𝑥𝑥 = 0.000223447 𝑚𝑚𝑚𝑚 𝑉𝑉 = 135.002 𝑚𝑚𝑚𝑚 𝑧𝑧 = −0.29917𝑚𝑚𝑚𝑚
Yield Strength 207 𝑀𝑀𝑃𝑃𝐴𝐴

Israel Enema Ohiemi et al.
DOI: 10.26855/ea.2021.12.005 75 Engineering Advances
Ultimate Tensile Strength 345 𝑀𝑀𝑃𝑃𝐴𝐴 Young’s Modulus 210 𝐺𝐺𝑃𝑃𝐴𝐴 Poisson’s Ratio 0.3 Shear Modulus 80.7692 𝐺𝐺𝑃𝑃𝐴𝐴
Table 6. Spring Force Values
Load Type Force Magnitude 245.25 𝑁𝑁 Vector X 22.628 𝑁𝑁 Vector Y −236.883 𝑁𝑁 Vector Z 59.348 𝑁𝑁
4.2.1 Von Mises Stress The figure below shows the von Mises stress in different regions of the spring when a load of 100kg is placed on the
foot bar. The Von Mises stress of the spring is shown in Figure 4.
Figure 4. Von Mises Stress in the spring.
The Finite Element Analysis done using Autodesk Inventor software is summarized in Table 7.
Table 7. Spring Static Analysis Summary
Name Minimum Maximum Volume 18,516.3 𝑚𝑚𝑚𝑚3
Mass 0.145353 𝑘𝑘𝑚𝑚 Von Mises Stress 0.00869094 𝑀𝑀𝑃𝑃𝐴𝐴 3.11667 𝑀𝑀𝑃𝑃𝐴𝐴 1st Principal Stress −0.137906 𝑀𝑀𝑃𝑃𝐴𝐴 1.86763 𝑀𝑀𝑃𝑃𝐴𝐴 3rd Principal Stress −1.73083 𝑀𝑀𝑃𝑃𝐴𝐴 0.150263 𝑀𝑀𝑃𝑃𝐴𝐴
Displacement 0 𝑚𝑚𝑚𝑚 0.000273822 𝑚𝑚𝑚𝑚 Safety Factor 15 15
Stress XX −0.988447 𝑀𝑀𝑃𝑃𝐴𝐴 0.990931 𝑀𝑀𝑃𝑃𝐴𝐴 Stress XY −1.73781 𝑀𝑀𝑃𝑃𝐴𝐴 0.287367 𝑀𝑀𝑃𝑃𝐴𝐴 Stress XZ −0.528229 𝑀𝑀𝑃𝑃𝐴𝐴 0.542401 𝑀𝑀𝑃𝑃𝐴𝐴 Stress YY −0.578698 𝑀𝑀𝑃𝑃𝐴𝐴 0.584505 𝑀𝑀𝑃𝑃𝐴𝐴 Stress YZ −0.464399 𝑀𝑀𝑃𝑃𝐴𝐴 0.412399 𝑀𝑀𝑃𝑃𝐴𝐴 Stress ZZ −0.969968 𝑀𝑀𝑃𝑃𝐴𝐴 0.988355 𝑀𝑀𝑃𝑃𝐴𝐴
X Displacement −1.0156 × 10⁻⁴ 𝑚𝑚𝑚𝑚 1.0238 × 10⁻⁴ 𝑚𝑚𝑚𝑚 Y Displacement −2.7381 × 10⁻³ 𝑚𝑚𝑚𝑚 6.8791 × 10⁻⁶ 𝑚𝑚𝑚𝑚 Z Displacement −7.842 × 10⁻⁵ 𝑚𝑚𝑚𝑚 7.8827 × 10⁻⁵ 𝑚𝑚𝑚𝑚
Equiv. Strain 3.6103 × 10⁻⁸ 1.2863 × 10⁻⁵

Israel Enema Ohiemi et al.
DOI: 10.26855/ea.2021.12.005 76 Engineering Advances
1st Principal Strain 3.0676 × 10⁻⁸ 1.1330 × 10⁻⁵ 3rd Principal Strain −1.0945 × 10⁻⁵ −2.625 × 10⁻⁸
Strain XX −4.6810 × 10⁻⁶ 4.6484 × 10⁻⁶ Strain XY −1.0757 × 10⁻⁵ 1.7789 × 10⁻⁶ Strain XZ −3.2699 × 10⁻⁶ 3.3577 × 10⁻⁶ Strain YY −2.1195 × 10⁻⁶ 2.1411 × 10⁻⁶ Strain YZ −2.8748 × 10⁻⁶ 2.5529 × 10⁻⁶ Strain ZZ −4.5782 × 10⁻⁶ 4.6560 × 10⁻⁶
4.2.2 Footboard Analysis The footboard’s physical, mechanical properties and force distributions in the X, Y and Z co-ordinates are listed in
Tables 8 and 9 respectively.
Table 8. Physical & Mechanical Properties of Footboard
Material Steel, Mild Density 7.85𝑚𝑚 𝑑𝑑𝑚𝑚3⁄ Mass 5.19984 𝑘𝑘𝑚𝑚 Area 337,760 𝑚𝑚𝑚𝑚2
Volume 662,400 𝑚𝑚𝑚𝑚3
Center of Gravity 𝑥𝑥 = 230 𝑚𝑚𝑚𝑚 𝑉𝑉 = 180 𝑚𝑚𝑚𝑚 𝑧𝑧 = −2 𝑚𝑚𝑚𝑚
Yield Strength 207 𝑀𝑀𝑃𝑃𝐴𝐴 Ultimate Tensile Strength 345 𝑀𝑀𝑃𝑃𝐴𝐴
Young’s Modulus 220 𝐺𝐺𝑃𝑃𝐴𝐴 Poisson’s Ratio 0.275 Shear Modulus 86.2745 𝐺𝐺𝑃𝑃𝐴𝐴
Table 9. Footboard Force Values
Load Type Force Magnitude 981.000 𝑁𝑁 Vector X 0.000 𝑁𝑁 Vector Y 0.000 𝑁𝑁 Vector Z −981.000 𝑁𝑁
The Von Mises stress distribution over the footboard on application of 981 N force (100kg) is shown in figure 5
Figure 5. Von Misses Stress Distribution in Footboard.

Israel Enema Ohiemi et al.
DOI: 10.26855/ea.2021.12.005 77 Engineering Advances
The corresponding displacement distribution is shown in Figure 6.
Figure 6. Footboard Factor of Safety.
The Finite Element Analysis is summarized in Table 10.
Table 10. Footboard Static Analysis Summary
Name Minimum Maximum Volume 662,400 𝑚𝑚𝑚𝑚3
Mass 5.19984 𝑘𝑘𝑚𝑚 Von Mises Stress 0.176792 𝑀𝑀𝑃𝑃𝐴𝐴 31.4377 𝑀𝑀𝑃𝑃𝐴𝐴 1st Principal Stress −15.5508 𝑀𝑀𝑃𝑃𝐴𝐴 40.3576 𝑀𝑀𝑃𝑃𝐴𝐴 3rd Principal Stress −41.2078 𝑀𝑀𝑃𝑃𝐴𝐴 15.2345 𝑀𝑀𝑃𝑃𝐴𝐴
Displacement 0 𝑚𝑚𝑚𝑚 0.587365 𝑚𝑚𝑚𝑚 Safety Factor 6.585 15
Stress XX −41.1502 𝑀𝑀𝑃𝑃𝐴𝐴 40.3042 𝑀𝑀𝑃𝑃𝐴𝐴 Stress XY −2.75368 𝑀𝑀𝑃𝑃𝐴𝐴 2.7746 𝑀𝑀𝑃𝑃𝐴𝐴 Stress XZ −2.06052 𝑀𝑀𝑃𝑃𝐴𝐴 1.95488 𝑀𝑀𝑃𝑃𝐴𝐴 Stress YY −15.6087 𝑀𝑀𝑃𝑃𝐴𝐴 15.2878 𝑀𝑀𝑃𝑃𝐴𝐴 Stress YZ −0.997642 𝑀𝑀𝑃𝑃𝐴𝐴 0.758438 𝑀𝑀𝑃𝑃𝐴𝐴 Stress ZZ −15.6087 𝑀𝑀𝑃𝑃𝐴𝐴 15.2878 𝑀𝑀𝑃𝑃𝐴𝐴
X Displacement −7.9677 × 10³ 𝑚𝑚𝑚𝑚 7.9663 × 10³ 𝑚𝑚𝑚𝑚 Y Displacement −1.8009 × 10⁻³ 𝑚𝑚𝑚𝑚 1.7989 × 10⁻³ 𝑚𝑚𝑚𝑚 Z Displacement −0.587365 𝑚𝑚𝑚𝑚 0 𝑚𝑚𝑚𝑚
Equiv. Strain 7.0808 × 10⁻⁷ 1.2864 × 10⁻⁴ 1st Principal Strain 9.8645 × 10⁻⁷ 1.5024 × 10⁻⁴ 3rd Principal Strain −1.4953 × 10⁻⁴ 2.6521 × 10⁻⁶
Strain XX −1.4914 × 10⁻⁴ 1.5024 × 10⁻⁴ Strain XY −1.5959 × 10⁻⁵ 1.6080 × 10⁻⁵ Strain XZ −1.1942 × 10⁻⁵ 1.1329 × 10⁻⁵ Strain YY −2.5496 × 10⁻⁵ 2.4479 × 10⁻⁵ Strain YZ −5.7818 × 10⁻⁶ 4.3955 × 10⁻⁶ Strain ZZ −5.6327 × 10⁻⁵ 5.2795 × 10⁻⁵
The corresponding factor of safety distribution is shown in Figure 7.

Israel Enema Ohiemi et al.
DOI: 10.26855/ea.2021.12.005 78 Engineering Advances
Figure 7. Footboard Factor of Safety.
4.3. Experimentation and Evaluation
In this section, a detailed evaluation of experimental test conducted on the manufactured footstep generator is pre-sented. Based on the test results, a correlation was carried out to generate a predictive model for the prediction of vol-tage and power beyond experimental limits. The power input and output evaluations are presented in sections 4.3.1 and 4.3.2 respectively.
4.3.1 Power Input Let us consider, The average mass of human moving over the machine = 62kg [8] The deflection caused by 62kg = 9cm
𝐼𝐼𝑠𝑠𝑠𝑠𝑟𝑟𝑟𝑟 𝑠𝑠𝐿𝐿𝑎𝑎𝐴𝐴𝐴𝐴 = 𝑎𝑎𝐿𝐿𝐴𝐴𝑘𝑘𝑑𝑑𝐿𝐿𝑠𝑠𝐴𝐴 𝑟𝑟𝑠𝑠𝑚𝑚𝐴𝐴⁄ (17) 𝑊𝑊𝐿𝐿𝐴𝐴𝑘𝑘𝑑𝑑𝐿𝐿𝑠𝑠𝐴𝐴 = 𝑑𝑑𝐿𝐿𝐴𝐴𝑑𝑑𝐴𝐴 × 𝑑𝑑𝑠𝑠𝑠𝑠𝑟𝑟𝐴𝐴𝑠𝑠𝑑𝑑𝐴𝐴
𝐹𝐹𝐿𝐿𝐴𝐴𝑑𝑑𝐴𝐴 = 𝑚𝑚𝐴𝐴𝑠𝑠𝑠𝑠 (𝐴𝐴) × 𝐴𝐴𝑑𝑑𝑑𝑑𝑙𝑙.𝑑𝑑𝑟𝑟𝐴𝐴 𝑟𝑟𝐿𝐿 𝑚𝑚𝐴𝐴𝐴𝐴𝐴𝐴𝑠𝑠𝑟𝑟𝑉𝑉 (𝑚𝑚) 𝐹𝐹𝐿𝐿𝐴𝐴𝑑𝑑𝐴𝐴 = 62 × 9.81 = 608.22 𝑁𝑁
Hence, 𝑊𝑊𝐿𝐿𝐴𝐴𝑘𝑘𝑑𝑑𝐿𝐿𝑠𝑠𝐴𝐴 = 608.22 × 0.09 = 54.73𝑁𝑁𝑚𝑚
𝐼𝐼𝑠𝑠𝑠𝑠𝑟𝑟𝑟𝑟 𝑠𝑠𝐿𝐿𝑎𝑎𝐴𝐴𝐴𝐴 =54.73
60= 0.912 𝑎𝑎𝐴𝐴𝑟𝑟𝑟𝑟𝑠𝑠
4.3.2 Power Output 𝑃𝑃𝐿𝐿𝑎𝑎𝐴𝐴𝐴𝐴 𝐿𝐿𝑟𝑟𝑟𝑟𝑠𝑠𝑟𝑟𝑟𝑟 = 𝑑𝑑𝑟𝑟𝐴𝐴𝐴𝐴𝐴𝐴𝑠𝑠𝑟𝑟 (𝐼𝐼) × 𝐴𝐴𝐿𝐿𝑙𝑙𝑟𝑟𝐴𝐴𝑚𝑚𝐴𝐴(𝑉𝑉) (18)
But V = IR (Where R = resistance) Therefore,
𝑃𝑃𝐿𝐿𝑎𝑎𝐴𝐴𝐴𝐴 =𝑉𝑉2
𝑅𝑅
The dynamo used has specification of 6V, 3 watts
𝑅𝑅 =𝑉𝑉2
𝑃𝑃=
62
3= 12Ω
But the maximum voltage produced = 1.52V Therefore,
𝑃𝑃𝐿𝐿𝑎𝑎𝐴𝐴𝐴𝐴 = 𝐼𝐼𝑉𝑉 =𝑉𝑉2
𝑅𝑅 =
1.522
12= 0.193 𝑎𝑎𝐴𝐴𝑟𝑟𝑟𝑟𝑠𝑠
𝐸𝐸𝑑𝑑𝑑𝑑𝑠𝑠𝑑𝑑𝑠𝑠𝐴𝐴𝑠𝑠𝑑𝑑𝑉𝑉 =𝑂𝑂𝑟𝑟𝑟𝑟𝑠𝑠𝑟𝑟𝑠𝑠 𝑠𝑠𝐿𝐿𝑎𝑎𝐴𝐴𝐴𝐴𝐼𝐼𝑠𝑠𝑠𝑠𝑟𝑟𝑟𝑟 𝑠𝑠𝐿𝐿𝑎𝑎𝐴𝐴𝐴𝐴
× 100% ( 19)
Israel Enema Ohiemi et al.
DOI: 10.26855/ea.2021.12.005 79 Engineering Advances
η =0.9130.912
× 100 = 21.162%
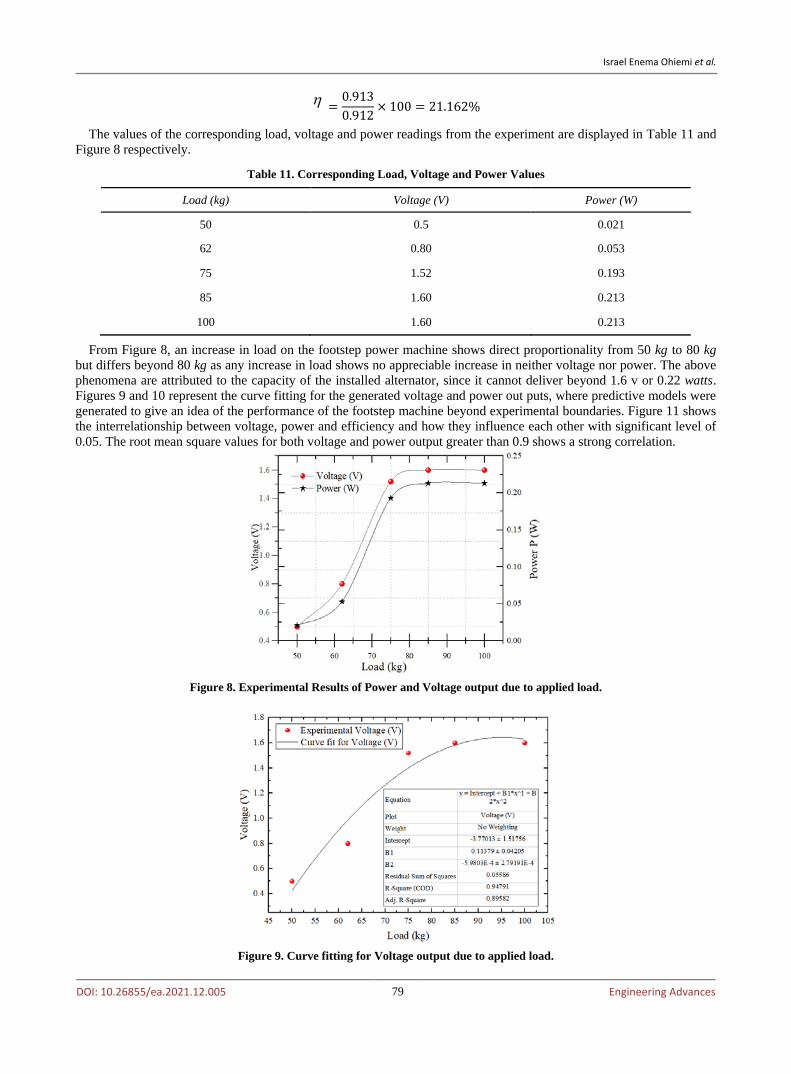
The values of the corresponding load, voltage and power readings from the experiment are displayed in Table 11 and Figure 8 respectively.
Table 11. Corresponding Load, Voltage and Power Values
Load (kg) Voltage (V) Power (W)
50 0.5 0.021
62 0.80 0.053
75 1.52 0.193
85 1.60 0.213
100 1.60 0.213
From Figure 8, an increase in load on the footstep power machine shows direct proportionality from 50 kg to 80 kg but differs beyond 80 kg as any increase in load shows no appreciable increase in neither voltage nor power. The above phenomena are attributed to the capacity of the installed alternator, since it cannot deliver beyond 1.6 v or 0.22 watts. Figures 9 and 10 represent the curve fitting for the generated voltage and power out puts, where predictive models were generated to give an idea of the performance of the footstep machine beyond experimental boundaries. Figure 11 shows the interrelationship between voltage, power and efficiency and how they influence each other with significant level of 0.05. The root mean square values for both voltage and power output greater than 0.9 shows a strong correlation.
Figure 8. Experimental Results of Power and Voltage output due to applied load.
Figure 9. Curve fitting for Voltage output due to applied load.

Israel Enema Ohiemi et al.
DOI: 10.26855/ea.2021.12.005 80 Engineering Advances
Figure 10. Curve fitting for Power Output due to applied load.
Figure 11. Curve fitting for Power Output due to applied load.
5. Conclusion The static analysis of both the spring and footboard reveals that an increase in load results in an increase in the von
Mises stress, displacement, 1st Principal stress, and 3rd Principal stress of the material. Also, the factor of safety of the material was found to inversely proportional to load (see Figures 5, 6 and 7)
The yield strength and maximum stress of the footboard when a force of 981 N was applied were 207MPa and 40.3576MPa, respectively. The values above indicate the safety of the footboard material (mild steel) since the stress in the footboard is less than the yield strength of the material with corresponding factor of safety of 6.58445.
As observed from Figure 7, points of maximum stress concentrations in the footboard are at the points where fixed constraints were applied to the board. The minimum stress in the footboard is at the point of application of the load. As shown in Figure 6, there was no displacement at the points on the footboard where the fixed constraints were applied, but this displacement increases from zero at the points of fixed constraints to a maximum value of 0.5874 at the point of application of the load which is the point of maximum displacement from the fixed ends.
Steel has a yield strength of 207MPa. The spring used in this design is made from steel, and the maximum stress concentration in the spring when acted on by a 245.250N force as 3.11667MPa (that is the von Mises Stress). This is seen in Table 4. It is obvious that the material is in a safe zone. This is because the stress in the plate is less than the yield strength of the material.
In testing the setup, different weights were used on the prototype footstep power generating machine to get the output voltage using a multimeter. Table 11 shows the result of the experiments conducted on the prototype system. It was observed that the voltage and hence power readings kept changing with the change in the applied load, but this was discontinued from when a load of 85kg was used, at this load value, the corresponding voltage and power values re-mained constant. This was because, at this point, the spring had attained its maximum vertical deflection. Moreso the capacity of the generator could be another contributing factor since it cannot generate power beyond its maximum ca-pacity. Due to the above limitations, a correlation was carried out for predicting the voltage and corresponding power with both the R2-value greater than 0.9, indicating a strong correlation.

Israel Enema Ohiemi et al.
DOI: 10.26855/ea.2021.12.005 81 Engineering Advances
References [1] O. A. Olugboji, I. Ohiemi, and C. Ajani. (2015). “Modelling and Design of an Auto Street Light Generation Speed Breaker
Mechanism,” no. January, 2015, doi: 10.12691/ajme-3-3-3.
[2] S. Afzal. (2010). “Power generation,” Filtr. Sep., vol. 47, no. 6, p. 1, 2010, doi: 10.1016/S0015-1882(10)70267-6.
[3] “Electrical energy,” Nature, vol. 178, no. 4543. p. 1151, 1956, doi: 10.1038/1781151a0.
[4] J. Tour, K. Ashley. (2011). “construction of electric power generation using reverse electowetting,” 2011.
[5] K. Shiraishi, R. G. Shirley, and D. M. Kammen. (2018). “Geospatial multi-criteria analysis for identifying high priority clean energy investment opportunities: A case study on land-use conflict in Bangladesh,” Appl. Energy, vol. 235, no. August 2018, pp. 1457-1467, 2019, doi: 10.1016/j.apenergy.2018.10.123.
[6] O. A. Olugboji and C. Ajani. (2019). “Development of a speed breaker mechanism for generating,” no. February, 2019.
[7] S. p. Kari, M., Ahsan, K., Shag, H., Kibul, H. (2016). “Electrical power generation through speed breaker,” 9th Int. Conf. Elec-tron. Comput. Eng., 2016.
[8] M. Brooke. (2009). “The weight of the world,” Sight and Sound, 2009.
[9] M. Design, Khurmi, R. S., and J. K. Gupta. (2019). A textbook of machine design. S. Chand publishing, 2005. 2019.
[10] Richard G. Budynas and J. Keith Nisbett. (2015). Shigley’s Mechanical Engineering Design. Tenth edit. New York: McGraw-Hill Education, 2 Penn Plaza, New York, NY 10121., 2015.
[11] “Unconfirmed 287199.crdownload.”
[12] H. Patel, H. K. Patel, S. K. Dutta, P. Sahu, and K. Das. (2015). “Production of Electricity by the Method of Road Power Gener-ation,” Int. J. Res., vol. 2, no. 5, pp. 636-640, 2015, [Online]. Available: http://edupediapublications.org/journals/index. php/ijr/article/view/2030.
[13] I. Mahmud. (2018). “Electrical Power Generation Using Footsteps,” Eur. Sci. Journal, ESJ, vol. 14, no. 21, p. 318, 2018, doi: 10.19044/esj.2018.v14n21p318.
[14] A. L. Gorle, A. V. Thawale, and L. H. Patil. (2018). “‘Literature Review on Electricity Generation using Speed Breaker,’” Ijarcce, vol. 7, no. 10, pp. 44-47, 2018, doi: 10.17148/ijarcce.2018.71010.
[15] B. S. Sarma, V. Jyothi, and D. Sudhir. (2014). “Design of Power Generation Unit Using Roller Mechanism,” IOSR J. Electr. Electron. Eng., vol. 9, no. 3, pp. 55-60, 2014, doi: 10.9790/1676-09315560.
[16] B. Swetha, L. Prasanna, N. T. Anjum, and R. Chandra. (2020). “Footstep Power Generation System,” Int. J. Mod. Trends Sci. Technol., vol. 6, no. 5, pp. 100-104, 2020, doi: 10.46501/ijmtst060517.
[17] A. Kumar, A. Kumar, D. Arockiaraj, and G. P. U.S. (2018). “Energy Harvesting Using Rack and Pinion Mechanism,” J. Mech. Civ. Eng., vol. 15, no. I, pp. 75-80, 2018, doi: 10.9790/1684-1501047580.
[18] G. Vamsi Krishna, S. Srinivasa Rao, P. Sriharsha, B. V. Neerav, and G. E. N. M. S. Satyasai. (2019). “Modeling and analysis of flat spiral spring based speed breaker device for generation of electricity,” Int. J. Recent Technol. Eng., vol. 8, no. 1, pp. 555-561, 2019.
[19] A. Mishra, et al. (2013). “Electricity Generation from Speed Breakers,” Int. J. Electr. Electron. Res. ISSN, vol. 4, no. 1, pp. 25-27, 2013, [Online]. Available: www.theijes.com.
[20] M. M. Durai. (2017). “Using Road Speed Breakers to Extract Electric Power,” Int. J. Adv. Res. Basic Eng. Sci. Technol., vol. 3, no. 24, pp. 464-470, 2017.
[21] J. E. Dara, C. M. Odazie, P. C. Okolie, and A. O. Azaka. (2020). “Design and construction of a double actuated mechanical speed breaker electricity generator,” Heliyon, vol. 6, no. 9, p. e04802, 2020, doi: 10.1016/j.heliyon.2020.e04802.
[22] K. Kolhe and A. Pandhare. (2017). “International Journal of Current Engineering and Technology Electric Power Generation System from Speed Breaker by using Rack and Pinion Mechanism,” 1151| Int. J. Curr. Eng. Technol., vol. 7, no. 3, pp. 1151-1158, 2017, [Online]. Available: http://inpressco.com/category/ijcet.
[23] M. Palanivendhan, S. Logeshwaran, G. Naresh, K. Ankush, A. Sidhaant, and S. Shivam. (2020). “Design and fabrication of speed bump for energy generation,” IOP Conf. Ser. Mater. Sci. Eng., vol. 993, no. 1, 2020, doi: 10.1088/1757-899X/993/1/012149.
[24] K. C. A. O. A. Olugboji, M. S. Abolarin, I. E. Ohiemi. (2016). “Development of a Speed Breaker Mechanism for Generating,” Proc. 2016 Annu. Conf. Sch. Eng. Eng. Technol., no. February, pp. 131-138, 2016.
[25] A. K. Singh. (2021). “Electricity Generation Through Speed Breaker Mechanism,” Strad Res., vol. 8, no. 5, 2021, doi: 10.37896/sr8.5/025.
[26] T. Krupenkin and J. A. Taylor. (2011). “Reverse electrowetting as a new approach to high-power energy harvesting,” Nat. Commun., vol. 2, no. 1, pp. 1-8, 2011, doi: 10.1038/ncomms1454.

Israel Enema Ohiemi et al.
DOI: 10.26855/ea.2021.12.005 82 Engineering Advances
[27] P. Bhagdikar, S. Gupta, N. Rana, R. Jegadeeshwaran, and B. Sciences. (2014). “G Eneration of E Lectricity With the Use of S Peed,” 2017 IEEE Int. Conf. Power, Control. Signals Instrum. Eng., vol. 7, no. 2, pp. 589-595, 2014.
[28] J. D. Jaymin. (2015). “Power Generation from Speed Breakers by Air Compression Method,” Int. J. Eng. Dev. Res., vol. 3, no. 2, pp. 75-80, 2015.
[29] J. Khurmi, R., Gupta, “machine design,” in international edition.
[30] H. Yang, S. Hong, B. Koo, D. Lee, and Y. B. Kim. (2017). “High-performance reverse electrowetting energy harvesting using atomic-layer-deposited dielectric film,” Nano Energy, vol. 31, pp. 450-455, 2017, doi: 10.1016/j.nanoen.2016.11.006.
[31] K. M. Ullah, K. M. Ahsan-Uz-zaman, S. Hosen, R. H. Khan, and S. Parvin. (2017). “Electrical power generation through speed breaker,” Proc. 9th Int. Conf. Electr. Comput. Eng. ICECE 2016, pp. 30-33, 2017, doi: 10.1109/ICECE.2016.7853848.
[32] T. H. Hsu, S. Manakasettharn, J. A. Taylor, and T. Krupenkin. (2015). “Bubbler: A Novel Ultra-High Power Density Energy Harvesting Method Based on Reverse Electrowetting,” Sci. Rep., vol. 5, pp. 1-13, 2015, doi: 10.1038/srep16537.
[33] S. M. Mahind. (2016). “Power Generation Through Foot Step,” Int. Eng. Res. J., vol. 2, no. 3, pp. 1009-1012, 2016.
[34] Anonymous. “Shaft (mechanical engineering.” https://en.m.wikipedia.org/wiki/Shaft_(mechanical_engineering) (accessed Aug. 25, 2018).
[35] Anonymous. “Ball Bearing.” https://en.m.wikipedia.org/wiki/Ball_bearing (accessed Jul. 25, 2018).
[36] Ametek. (2015). “What are the common spring materials (springs),” 2015. http://www.hunterspringandrell.com/support/faq/ what-are-the-common-spring-materials-springs (accessed Aug. 29, 2018).
[37] J. Richard, G., Nisbett. (2011). “No Title,” in mechanical engineering design, Ninth edit., 2011.
[38] F. Nwachinemelu and C. Anyaegbunam. (2016). “Power Generation from a Renewable Energy Source - Speed Breaker Gene-rators,” no. June, pp. 1-5, 2016.
[39] N. Kachale. (2019). “Road Power Generation,” Int. J. Res. Appl. Sci. Eng. Technol., vol. 7, no. 5, pp. 2761–2766, 2019, doi: 10.22214/ijraset.2019.5455.
[40] T. A. T. Aziz and M. S. Subri. (2019). “Footstep power generation using Arduino Uno,” AIP Conf. Proc., vol. 2129, no. July, 2019, doi: 10.1063/1.5118105.
[41] K. F. S. F. R. M. El Habrouk. (2019). “Speed Breaker Energy Harvester Using Roller Mechanism,” Int. J. Sci. Res., vol. 8, no. 1, pp. 598–605, 2019, [Online]. Available: https://www.ijsr.net/archive/v8i1/ART20194214.pdf.
[42] C. K. Ang, A. A. Al-Talib, S. M. Tai, and W. H. Lim. (2019). “Development of a footstep power generator in converting kinet-ic energy to electricity,” E3S Web Conf., vol. 80, pp. 10–13, 2019, doi: 10.1051/e3sconf/20198002001.
[43] G. Dhanalakshmi, T. Manjulai, M. Mirunalini, and S. Sangeetha Mary. (2017). “Footstep Power Generation System,” Int. J. Eng. Comput. Sci., 2017, doi: 10.18535/ijecs/v6i4.38.
[44] A. S. Fawade. (2015). “Air Compression and Electricity Generation by Using Speed Breaker with Rack And Pinion Mechan-ism,” Www.Ijmer.Com, vol. 5, pp. 23-28, 2015.
[45] A. A. Al Ahmadi, et al. (2018). “Power generation through road speed breakers—An experimental approach,” 2018 Adv. Sci. Eng. Technol. Int. Conf. ASET 2018, pp. 1-6, 2018, doi: 10.1109/ICASET.2018.8376796.
[46] M. S. Aljohani. (2020). “Mechanical Footstep power generator,” 2020.
![[Eng]Eurocode Training - EN 1993 2011.0 v4 - SCIA Downloads](https://static.fdokumen.com/doc/165x107/6326d727e491bcb36c0afe50/engeurocode-training-en-1993-20110-v4-scia-downloads.jpg)