
PAYGo PERFORM Portfolio Quality Working Group Session #1
23
PAYGo PERFORM Portfolio Quality Working Group Session #1 Anish Thakkar & Nicky Khaki March 28, 2019
-
Upload
khangminh22 -
Category
Documents
-
view
1 -
download
0
Transcript of PAYGo PERFORM Portfolio Quality Working Group Session #1
PAYGo PERFORMPortfolio Quality Working Group Session #1
Anish Thakkar & Nicky Khaki
March 28, 2019

© CGAP 2018
2
Agenda
1 Review Survey Results
2 Groups and Goals
3 Subcommittee Assignment

© CGAP 2018
1. We want this and future sessions to be interactive, open to questions or
points of discussion at any time, unmute and speak up at any time
2. To minimize outside noise, however, your mics have been muted on entry.
Please keep yourself muted throughout the call unless you have a question.
3. You may ask a question or make a comment at any time during the call. To
do so you can:
a) Use the Chat box on the right-hand side of the WebEx session.
• To ensure that your question is seen by the moderator, select “All
Participants” from the drop-down menu before sending the question.
b) Unmute yourself and ask a question remembering to re-mute yourself when
done.
3
Logistics

1. Portfolio Quality Survey Review
© CGAP 2018
5
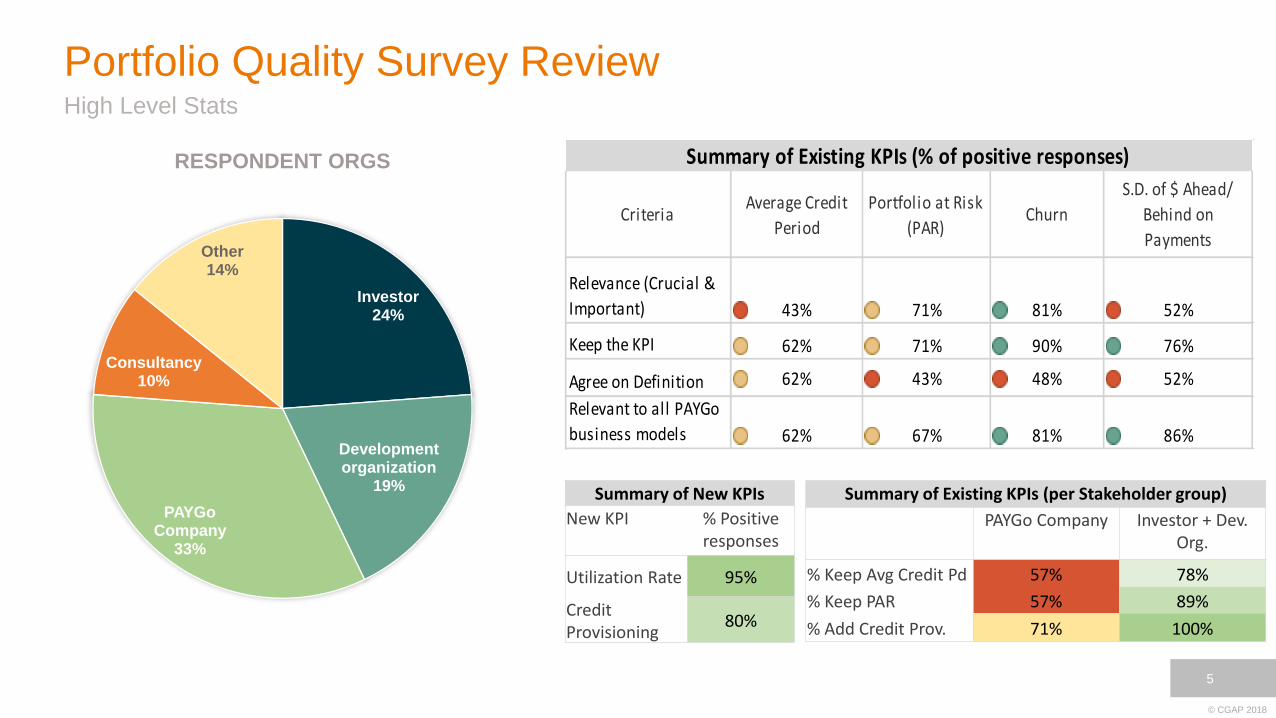
High Level Stats
Portfolio Quality Survey Review
Investor24%
Development organization
19%
PAYGo Company
33%
Consultancy10%
Other14%
RESPONDENT ORGS
CriteriaAverage Credit
Period
Portfolio at Risk
(PAR)Churn
S.D. of $ Ahead/
Behind on
Payments
Relevance (Crucial &
Important) 43% 71% 81% 52%
Keep the KPI 62% 71% 90% 76%
Agree on Definition 62% 43% 48% 52%
Relevant to all PAYGo
business models 62% 67% 81% 86%
Summary of Existing KPIs (% of positive responses)
Summary of Existing KPIs (per Stakeholder group)
PAYGo Company Investor + Dev. Org.
% Keep Avg Credit Pd 57% 78%
% Keep PAR 57% 89%
% Add Credit Prov. 71% 100%
Summary of New KPIs
New KPI % Positive responses
Utilization Rate 95%
Credit Provisioning
80%

© CGAP 2018
6
What should the PQ KPIs Convey?
Portfolio Quality Survey Review
• Respondents reported that portfolio quality KPIs should broadly convey information about accounts receivables, account performance over time, and risks associated with nonpayment.
• Examples of specific information include:
➢ Account Information - account balance, average age, average delay in repayment, provision for write off, NPV of risk adjusted accounts receivables
➢ Account Performance - repayment trends, collection ratio, write off rates, utilization rate, churn rate, rates and costs of recollection and repossession, cohort vs. portfolio performance trends
➢ Risk Data - value at risk, economic impacts of default, historical loss given default
➢ Variance for the above (expected vs actual)

© CGAP 2018
7
What limitations and/or considerations should we be mindful of?
Portfolio Quality Survey Review
• Respondents highlighted the need to use not one, but several metrics that were simple to calculate and useful across various business models, and the importance of cautious interpretation of KPIs. They also reported concerns around data quality.
• Considerations/ Limitations to be mindful of:
➢ The KPI metric - should be simple to calculate, forward looking, capture changes over time, on cash basis & incorporate differences in PAYG business models.
➢ Underlying data – poor data quality (low user literacy & outdated information), poor data collection mechanisms (connectivity issues in rural areas & inadequate tech platforms)
➢ How KPIs are used – companies may not be willing to share, they may not be comparable, may be interpreted differently by different companies. One’s not good, should use a set of KPIs for holistic picture.

© CGAP 2018
8
Missing KPIs?
Portfolio Quality Survey Review
Respondents proposed several additional KPIs that they would like to be included to evaluate portfolio. Some of them are:
• Average credit period and average credit % paid by churned clients
• Average time to completion (expressed as time taken to pay off loan/ nominal days of contract)
• Red line metrics like the number of consecutive missed days at which a borrower becomes historically unlikely (i.e. < 50%) to ever pay again
• Number of products written off as a percentage of total PAYGO registrations made per month
• Number of products repossessed as a percentage of total PAYGO registrations made per month
• Roll rate Analysis: the rate of migration of customers from one receivables bucket to another (e.g. from 30-60 to 60-90)
• Security coverage ratio: (total value of security / portfolio and receivables), to measure what portion of portfolio quality risk is covered by actionable security/collateral
• Average rate per user (ARPU)
• Customer satisfaction KPI, such as % of retained customers
• Risk Adjusted Present Value of Receivables
Many of the same / overlapping KPIs with similar, yet distinct, definitions.

© CGAP 2018
9
Analytical Frameworks?
Portfolio Quality Survey Review
Respondents indicated a strong preference for analytical tools that considered a present value perspective of the receivables and impacts of currency loss based on repayment speeds.
At the customer end, they suggested:
• State-Phase Analysis: In a given time period, how many (a) 'Perfect' customers stayed 'Perfect', (b) slipped down to 'Good'? (c) 'Locked' customers moved up to 'Good’?
• Survival analysis: to help predict likely account durations, cashflows, etc.
• First Payment Default: as a useful predictor of payment behavior
• Segmentation: to break down customers by portfolio quality, customer segment, market, distribution channel etc. for tapping into new types of customers
• Customer rating system based on utilization rate

2. Groups and GoalsWeek 1

PAYGo Company
“These KPIs should ultimately answer two questions:
1) how much of my money will I ultimately get back, and
2) how long will it take.”

© CGAP 2018
12
Groups and Goals
PQ Week 1 Subcommittees
1. Collection Efficiency 2. Loss / Default
Utilization Rate PAR
Units in Circulation Repaid
/ Total Units Beyond Credit
Period
Write-off Ratio
Standard Deviation of
Amount Ahead/Behind on
Payments
Repossession Ratio
On-time Payments Rate (Cumulative) Default Rate
Et al… Churn
Et al…
Sam
ple
KP
Is
Considerations
• Definitions
• Explanatory power
• Limited Overlap
• Relevant cohorts, time series, and thresholds
• Consultants?
• Credit Risk and Time Value Discount
• Sniff tests…
• Analytical vs. Informational KPIs…

© CGAP 2018
13
What to Keep in Mind
CGAP’s “Measuring Microcredit Delinquency Ratios Can Be Harmful to Your Health”1 provides us with a helpful checklist for testing the reliability and durability of our portfolio quality metrics:
• Red Flag Test: “Does the delinquency ratio support timely response to day-to-day repayment issues?”
• Fire Bell Test: “When delinquency has reached dangerous levels, does the ratio reveal the seriousness of the problem, or does it tend to camouflage it?”
• Smoke and Mirrors Test: “Can the delinquency measure be made to look better through inappropriate rescheduling or refinancing of loans, or manipulation of accounting policies?”
1. CGAP Occasional Paper Issue No. 3 June 1999: Measuring Microcredit Delinquency Ratios Can Be Harmful to Your Health

© CGAP 2018
14
Running PAR Through the Sniff Tests
Test Discussion / Response
Red Flag Test The PAR as defined may give an indication of day-to-day risk when showing
a high or increasing PAR. Consideration of the payment frequency is highly
relevant as the risk associated with 30 days late for a product that collects
daily is different than one that collects monthly. Aging is important.
Fire Alarm Test The significance of missed payments over the 30 most recent days has not
been linked to any actual PAYGo historical data. What is the historical rate
at which those that have missed payments in the last 30 days default? Are
there more indicative numbers for the PAYGo industry? Aging is important.
Smoke and Mirrors Test Aggressive write-off policy can distort as can rapid growth (assuming PAR
issues are more likely to manifest >90 days after purchase)
Other Tests or Issues ?
© CGAP 2018
15
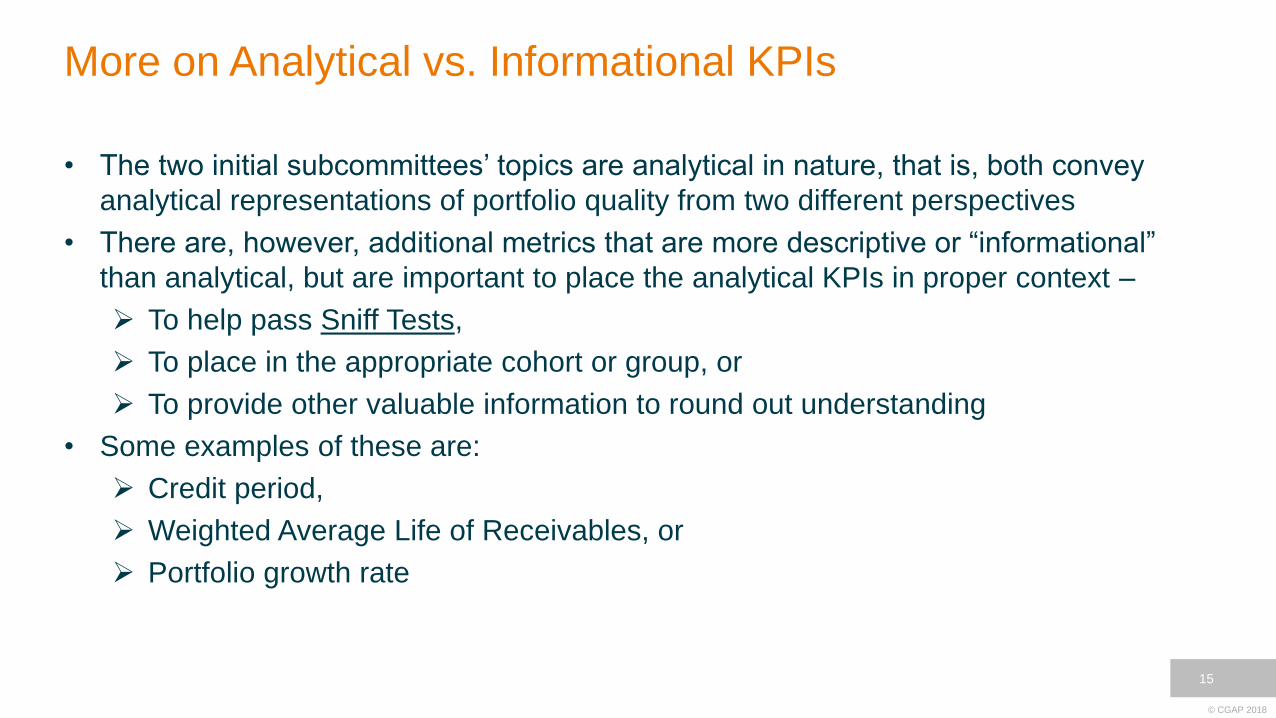
More on Analytical vs. Informational KPIs
• The two initial subcommittees’ topics are analytical in nature, that is, both convey
analytical representations of portfolio quality from two different perspectives
• There are, however, additional metrics that are more descriptive or “informational”
than analytical, but are important to place the analytical KPIs in proper context –
➢ To help pass Sniff Tests,
➢ To place in the appropriate cohort or group, or
➢ To provide other valuable information to round out understanding
• Some examples of these are:
➢ Credit period,
➢ Weighted Average Life of Receivables, or
➢ Portfolio growth rate

Polls on Subcommittees

3. Subcommittee Assignment

© CGAP 2018
18
Working Group Timeline
• Agree on list of KPIs and basic definitionsWeeks 1 & 2
• Determine relevant cohorts, thresholds, time series
• Assign formulasWeek 3
• Identify missing ancillary / informational indicators to pass sniff tests
• Present recommendations to working groupWeek 4

© CGAP 2018
19
Consultative Group
Comprised of all Stakeholders
Steering Group
IFC, GOGLA, CGAP
Working Groups
Made of members from CG & Experts as appropriate; co-chaired by company & investor representatives
Consultative Group
Steering Group
Recommends formation of Working
Group(s) (WG)
Accepts CG's request and constitutes a
WG; coordinates groups & participants;
and sets expectations in terms of time,
resources, budgets, etc.
Opportunity for additional diligence and
input (drawing resources from SG) before
making final recommendation to the
Steering Group
Considers CG recommendation with
necessary support and implements
Researches and deliberates (drawing
resources from SG); makes a
recommendation to the CG

© CGAP 2018
20
Working Group Timeline
• Recommend Collection Efficiency and Loss / Default KPIs and gather feedback
• Identify additional KPIs / Groups of KPIs neededMarch - April
• Finalize CE and L/D KPIs
• Recommend additional KPIs and gather feedback
• Identify any other outstanding items (including analytical tools)April - May
• Present to broader set of WGs and gather feedback
• Finalize PQ and related KPIsMay – June
• Share progress with peers at AGM, workshop outstanding issues
• Share v1.X KPIs with CG via webinar – get feedback, “What else is needed for v2.0?”
June AGM & July Webinar

© CGAP 2018
DEFINITION. A concise explanation for what the indicator represents.
WHY DOES IT MATTER? Analytical insights of each indicator that make each
indicator, as defined here for standardized reporting, useful for analysis by companies
and investors.
CALCULATION. How to generate the indicator from data inputs.
NOTES. Considerations for using each indicator, including commentary on what is
included in the definition and calculation, as well as practical considerations for use
with real data
BUSINESS MODEL considerations
WORKING GROUP. (i. Which Technical WG is it allocated to and ii. Status of being
discussed across the WG (i.e. feedback consolidated across KPI WG)
STATUS. Is it agreed and final or subject to discussion? (red/amber/green)
21
Sample KPI (Abridged) Output

© CGAP 2018
22
Next Steps
• Finalize subcommittees and co-chairs (assuming in agreement)
➢ Please indicate your preference if you haven’t already and share with
others that could help us
• Email early next week from subcommittee co-chair indicating next meeting and
any homework/reading ahead
• Email from PERFORM sometime later with next PQ WG call date
➢ Will be ~end of April
Additional considerations? Questions?

© CGAP 2018
Thank you
To learn more, please visit
https://www.findevgateway.org/organization/paygo-perform