regulation of the number of follicles maturing and ovulating ...
Upload
independentCategory
view
4download
0
Ž .Aquaculture 189 2000 307–333www.elsevier.nlrlocateraqua-online
Patterns of muscle growth in early and latematuring populations of Atlantic salmon
ž /Salmo salar L.
Ian A. Johnston a,), Richard Alderson b, Claire Sandham a,David Mitchell c, Craig Selkirk c, Alistair Dingwall d,
David Nickell e, Remi Baker c, Billy Robertson c, David Whyte f,John Springate g
a Gatty Marine Laboratory, DiÕision of EnÕironmental and EÕolutionary Biology, School of Biology,UniÕersity of St Andrews, St Andrews, Fife, Scotland KY16 8LB, UK
b BioMar Ltd., North Shore Road, Grangemouth Docks, Grangemouth, Scotland FK3 8UL, UKc Marine HarÕest Scotland Ltd., Craigcrook Castle, Edinburgh EH4 3TU, UK
d Pinneys of Scotland Ltd., Stapleton Road, Annan, Dumfriesshire DG12 6RX, UKe Roche Products Ltd., Heanor, Derbyshire DE75 7SG, UK
f Aquasmart UK Ltd., Royal Exchange Square, Glasgow G1 3AH, Scotland, UKg F. Hoffmann La-Roche AG, Basel, Switzerland
Received 26 April 1999; received in revised form 10 March 2000; accepted 15 March 2000
Abstract
Ž .Muscle growth was investigated in two populations of Atlantic salmon Salmo salar LŽ .derived from an early maturing stock of West Coast Scottish origin strain X and a late maturing
Ž .stock strain Y of Norwegian origin. Fish from six families per population were PIT-tagged andreared together in a 5=5=5 m sea cage between April 1997 and September 1998. Thedistribution of muscle fibre diameters in different age classes was investigated using non-paramet-ric smoothing and bootstrapping techniques. Body mass and the total cross-sectional area of whitemuscle at the level of the first dorsal fin ray increased at a significantly faster rate in strain X than
Ž .in strain Y after the first 6 months in seawater April–October . The relative contributions of fibrerecruitment and hypertrophy to muscle growth were very different for the two populations. The
) Corresponding author. Fax: q44-1334-463443; Fish Muscle Research Group: http:rrwww.st-and.ac.ukr ; fmrg.
Ž .E-mail address: [email protected] I.A. Johnston .
0044-8486r00r$ - see front matter q2000 Elsevier Science B.V. All rights reserved.Ž .PII: S0044-8486 00 00372-0

( )I.A. Johnston et al.rAquaculture 189 2000 307–333308
number of white muscle fibres per trunk cross-section was around 150,000 in June and 250,000 inJuly for both populations. The majority of fish sampled in June, July and August 1997 showed aunimodal distribution of fibre diameter. Between July and August fish from strain Y recruited twotimes more fibres for each square millimeter increase in white muscle cross-sectional area thanfish from strain X. Fibre number in strain X had caught up with strain Y by January with 545,000fibres per cross-section. There was no significant increase in the number of white fibres in strain Ybetween January and September 1998, such that growth was entirely by fibre hypertrophy. Incontrast, fibre number continued to increase in strain X until the final sample in June, reaching718,000 per trunk cross-section. All fish showed a bimodal distribution of fibre diameter in theOctober and subsequent samples with significant differences between strains. The right-hand peakof the distribution was shifted towards higher diameters in strain X than in strain Y, indicatingsuperior hypertrophic growth performance in the early maturing population. For example, in theMay 1998 sample, the 95th percentile of fibre diameter was at 215 mm in strain X and 171 mm instrain Y. In March and subsequent samples, the left-hand peak of the distribution was shifted tohigher fibre diameters in strain Y relative to strain X, reflecting the cessation of new fibrerecruitment in strain Y. Immature fish within strain X had a lower density of small diameter fibresand the right-tail of the distribution was shifted to higher diameters relative to fish that had begunto sexually mature. Thus greater muscle fibre hypertrophy was observed in immature thanmaturing fish of the same strain. It was concluded that the superior growth performance of theearly maturing population was associated with a longer period of fibre recruitment and greaterfibre hypertrophy than in the late maturing population, although these differences were not directlyrelated to sexual maturation. q 2000 Elsevier Science B.V. All rights reserved.
Keywords: Atlantic salmon; Muscle fibres; Growth; Sexual maturation
1. Introduction
Muscle fibre formation occurs at the foetal stage in mammals and subsequent growthŽinvolves the elongation and hypertrophy of the fibres already present at birth Rowe and
.Goldspink, 1969 . In fish, with the exception of species that only have a maximumlength of a few centimeters, the recruitment of muscle fibres occurs throughout the
Ž .growing period Weatherley et al., 1988 . Different muscle fibre types can be recog-Žnised, arranged in discrete layers within the myotomes Johnston et al., 1974; 1975;
.Carpene et al., 1982; Rowlerson et al., 1995; Ramırez-Zarzosa et al., 1998 . Slow twitch` ´Žmuscle fibres, supplied primarily by aerobic metabolic pathways Johnston et al., 1977;
.Bone, 1978 , are located in a thin superficial strip that forms a thicker layer at the majorhorizontal septum. The red muscle layer, which increases in thickness towards the tail, isresponsible for powering slow speed swimming and accounts for a relatively small
Žproportion of the total muscle volume in most species Johnston et al., 1977; Bone,.1978 . White muscle comprises the major edible part of the myotome and is composed
Ž .of fast twitch fibres Hudson, 1969; Johnston, 1980 . The white muscle is active duringhigh speed swimming and is primarily dependent on anaerobic metabolic pathways for
Ž .its energy supply Driedzic and Hochachka, 1976 .Muscle is a post-mitotic tissue and the nuclei required for post-embryonic fibre
Žrecruitment and hypertrophy are derived from satellite cells see Koumans and Akster,
( )I.A. Johnston et al.rAquaculture 189 2000 307–333 309
.1995; Johnston, 1999 for reviews . The satellite cells represent a muscle stem cellŽpopulation and their division products committed to differentiation Yablonka-Reuveni
.and Rivera, 1994; Schultz, 1996 . These division products are either absorbed intomuscle fibres as they hypertrophy or else they fuse together to form new myotubes on
Žthe surface of existing fibres that mature into small diameter muscle fibres 3–5 mm. Ž .diameter . In Atlantic salmon Salmo salar , a cross-section of the anterior part of the
trunk contains around 5,000 white muscle fibres at hatch, increasing to 10,000 by firstŽ .feeding Johnston and McLay, 1997 and 150,000 to 200,000 following smoltification
Ž .Higgins and Thorpe, 1990; Johnston et al., 1999 . Muscle fibre recruitment continuesduring seawater growth reaching more than 1 million in two-sea-winter salmon reared
Ž .under commercial conditions Johnston, 1999 . Individual white muscle fibres increaseŽ .in size hypertrophic growth until they reach their maximum diameter of around 240
Ž .mm Johnston et al., 1999 . Thus growth in body girth relies on new fibre recruitmentbut is largely driven by fibre hypertrophy. The number and size distribution of musclefibres present in the myotomes of any particular age class reflects both genetic factors
Ž .and the growth history of the fish Weatherley and Gill, 1985; Johnston, 1999 .The tendency of wild Atlantic salmon to home to their natal streams to spawn
promotes reproductive isolation and genetic differentiation between populationsŽ .Verspoor, 1997 . Wild salmon show significant phenotypic diversity between and
Žwithin river systems with respect to body size and age at maturity Schaffer and Elson,. Ž .1975; Thorpe and Mitchell, 1981 , morphology Riddell and Leggett, 1981 and
Žphysiological characteristics including digestion and growth rates Taylor, 1991; Nicieza.et al., 1994 . In some cases, such population differences have been shown to be heritable
Žin breeding experiments Riddell and Leggett, 1981; Nicieza et al., 1994; Thorpe et al.,.1983 .
There is some evidence for genetic influences on muscle growth patterns in salmonids,Ž .particularly the number and size distributions of muscle fibres. Valente et al. 1998
determined the concentrations of RNA, DNA and protein in the skeletal muscle of a fastŽ . Ž . Ž .Cornec and slow Mirwart growing strain of rainbow trout Oncorhynchus mykiss .The higher DNA:protein ratio observed in the Cornec strain was interpreted in terms ofa smaller average cell size, but a larger number of cells per unit weight compared to theMirwart strain. In a subsequent paper, the percentage of fibres less than 25 mm diameter
Žwas shown to be greater in the fish from the fast than slow growing strain Valente et.al., 1999 . Muscle growth patterns have also been shown to vary between triploid and
Ždiploid individuals from the same families in both rainbow trout Suresh and Sheehan,. Ž .1998 and Atlantic salmon Johnston et al., 1999 . Triploid Atlantic salmon recruited
around one-third fewer fibres to reach a given muscle cross-sectional area than diploids,Ž .but showed a compensatory increase in hypertrophic growth Johnston et al., 1999 . The
reduced number of muscle fibres in triploids was associated with a lower density ofŽ .muscle satellite cells Johnston et al., 1999 .
In salmon farming, sexual maturation marks the end of the useful period ofcultivation since associated deteriorative changes reduce flesh quality and lower marketvalue. The proportion of fish maturing as grilse after one sea-winter has a strong genetic
Ž .as well as an environmental component Hansen et al., 1992; Taranger et al., 1998 .Strains with a high proportion of early maturing fish generally have faster growth rates

( )I.A. Johnston et al.rAquaculture 189 2000 307–333310
than strains with a high proportion of late maturing fish but must be harvested early inthe year when market prices may be lower. The main aim of the present study was toinvestigate the influence of genetic stock and sexual maturation on muscle fibrerecruitment and hypertrophy during the seawater stages of Atlantic salmon reared undersemi-commercial conditions. The relationship between the different densities of musclefibres found between the populations and the texture and colour of the flesh was
Ž .investigated in an accompanying paper Johnston et al., 2000a .
2. Materials and methods
2.1. Fish stocking and culture
Ž .Two populations of Atlantic salmon S. salar L. were studied corresponding to aŽhigh grilsing stock of West Coast Scottish origin strain X derived from the ‘‘Lochy’’
. Žstock , and a low grilsing stock of Norwegian origin strain Y derived from the.‘‘Namsen’’ stock . Each population had been maintained for at least five generations as
part of Marine Harvest McConnell’s genetic improvement programme. Individually PITŽtagged passive integrated transponder, supplied by Fish Eagle Co., Gloucestershire,. Ž .England and freeze-branded S1 smolts were transferred from Loch Arkaig freshwater
Ž .to Loch Duich seawater on the 14th April 1997. Fish were stocked into a steel-con-Ž .struction cage 5=5=5 m with a 12 mm mesh cube net. The cage was stocked with
585 smolts with an average mass of 55 g, representing six families of strain X and sixfamilies of strain Y. Fish were fed by hand to satiation between one and three times perday depending on season. The diet used was a standard commercial ration of the
w Ž .Ecolife series from BioMar Ltd. Composition ranged from 23r49 oilrprotein in thesmaller pellet size to 28r46 in the larger. The temperature was recorded throughout the
Ž .growing cycle Fig. 1A .
2.2. Fish health
Ž . ŽThe sea cages were stocked with Goldsinney wrasse Ctenolabrus rupestris 1 per.50 salmon in an attempt to control sea lice infestations. Additional treatments were
carried out with dichlorvos on the 23rd May 1997 and with hydrogen peroxide at 2- to4-week intervals as necessary between December 1997 and August 1998.
2.3. Sampling
The mass of each fish was measured at 5- to 6-week intervals. Fish were batch-nettedinto a sample weigh bin, anaesthetised with benzocaine in acetone, identified by PIT tag,and mass, fork length and maturity status recorded. At each weighing fish were removedfor muscle analysis to ensure a good representation of the different families in the

( )I.A. Johnston et al.rAquaculture 189 2000 307–333 311
Ž .Fig. 1. A PDF of muscle fibre diameter for the June 1997 sample of strain X. The dotted lines representŽ . Ž .individual fish and the solid line the average PDF. B Variability band around the average PDF solid line for
Ž . Ž .the fish illustrated in A constructed using 100 bootstrap estimates shaded area .
populations. On each date between June 1997 and October 1997, five fish each weresampled from families designated Xrn, Xrh, Yr3, and Yrq , and a further three fisheach from families designated Xlh, Yldu and Yrh. For the January and March 1998samples, six fish each were analysed from families Xrn and Xrh, three fish from familyXlh, and four fish each from families Yr3 and Yrq . May 1998, eight fish were sampledfrom family Xrn and six fish from families Xrh and Xlh. The June sample comprisedthree fish from family Xlh, four fish from family Xli, and three fish from family Xlq .The final sample in September 1998 comprised six fish each from familiesYr3, andYrq , and three fish each from families Yrh and Yldu. All fish were identified by theirbrand and cross-referenced against PIT number. Fish were starved for 7 days beforebeing killed by percussion stunning.

( )I.A. Johnston et al.rAquaculture 189 2000 307–333312
2.4. Carcass processing
Sampled fish were gill tagged and placed on ice. Following evisceration, gonads andliver were weighed, and fish gutted mass recorded. Salmon sampled between June 1997and March 1998 were sectioned at a point immediately behind the dorsal fin. Theanterior half of the carcass was transported to St Andrews University on ice for the
Žanalysis of muscle cellularity. Fish used for taste panel assessment strain X: May 1998,. ŽJune 1998; strain Y: Sept. 1998 were sent on ice to Pinneys of Scotland Annan,
.Scotland . At Pinneys one fillet was removed for smoking and organoleptic investiga-tion. The second fillet was left on the skeleton and the anterior portion, including thedorsal fin, was sent to St Andrews on ice for the analysis of muscle cellularity.
2.5. Quantification of muscle growth
A range of families was sampled in each age class as described above and the datacombined for the analyses of muscle growth patterns in the two populations. To avoidproblems associated with shrinkage the number and diameter distributions of musclefibres was determined using frozen sections. A 5 mm thick transverse steak wasprepared at the level of the first dorsal fin ray and either photographed with a digitalcamera or traced on an acetate sheet. The total cross-sectional area of the white muscle
Ž .was digitised using an Image Analysis System Tema2, ScanBeam, Denmark . The steakfrom one half of the body was divided up into a number of labelled blocks. The numberof blocks made from each cross-section of the trunk varied from 5 in the smallest fish to12 in the largest fish. Blocks were mounted on cork strips and frozen in 2-methyl butane
Ž .cooled to near its freezing point y1598C in liquid nitrogen. Samples were wrapped intinfoil to avoid desiccation and stored in a liquid nitrogen refrigerator until they could beprocessed. Frozen sections, 8 mm thick, were cut, air dried, and stained with Mayer’shaemoatoxylin. The outlines of 150 to 200 muscle fibres were digitised from each blockusing the Image Analysis System and fibre diameters were computed. Small diameterfibres less than 10 mm diameter were identified by the presence of myofibrils. Thenumber of fibres sampled in successive blocks was plotted against the accumulative
Ž 2estimate of the total number cross-sectional area of white muscle per steak, mm rÝ2 .muscle cross-section areas sampled, mm multiplied by the Ý number of fibres counted
Ž . Ž .until a stable estimate was obtained "3% Johnston et al., 1999 . In most cases,around 1000 muscle fibres were digitised per fish, distributed approximately equally
Ž .between the different blocks see above .
2.6. Statistics
The effects of population origin on muscle cellularity parameters was tested usingANCOVA with either body mass, fork length or muscle cross-sectional area as a
Ž .co-variate SPSS statistical software, SPSS Inc., USA . In cases where the data failedtests for non-uniform variance values were transformed to the natural logarithm prior to

( )I.A. Johnston et al.rAquaculture 189 2000 307–333 313
ANCOVA. Body mass and length, and muscle parameters at particular sample dateswere compared using a Mann–Whitney Rank Sum test, or in those cases were tests fornormality and equal variance in the data were passed, by a Student’s t-test.
Non parametric statistical techniques were used to fit smoothed probability densityŽ .functions PDFs to the measured fibre diameters using the kernel approach. The
Ž .statistical methods used are described in Silverman 1986 and Bowman and AzzaliniŽ .1997 and their application to the study of muscle fibre size distribution in Johnston et
Ž .al., 1999 . The construction of a smooth PDF of muscle fibre diameters has advantagesover the use of histograms as used in most previous studies of muscle growth. Theseadvantages include the preservation of the value of the realisation and the ease with
Žwhich graphical and statistical comparisons can be made between groups Johnston et.al., 1999 . The construction of a variability band around the mean PDF using bootstrap
techniques allows inference about the existence of unimodal, bimodal or trimodalŽ .distributions Bowman and Azzalini, 1997 . In contrast, the shape of the distribution
obtained using histograms is very dependent on the bin interval chosen.Ž x . Ž y .The average smooth PDFs for strain X f and strain Y f were estimated using
the diameters pooled over each group and the mean optimal smoothing parameter wasŽ .calculated for each fish in an age class Bowman and Azzalini, 1997 . Values for the
smoothing parameter varied between 0.15 and 0.28 and showed no systematic differ-ences between populations. In order to restrict diameters to positive values, densityfunctions were estimated for the natural logarithm of diameter and then transformedback to the original scale. A two-stage sampling procedure was used to account for thehierarchical nature of the data. First, an equal number n of fish was selected at randomfrom the two populations at each sample period and then 500 muscle fibres wereselected at random per fish. To estimate f x and f y, the kernel estimator was applied tothe fibre diameters pooled over the group. In order to obtain consistency whencomparing tail percentiles the maximal diameter within an age class was fixed at 110%of the maximum diameter sampled. Bootstrap techniques were used to distinguish
Žunderlying structure in the distributions from random variation Bowman and Azzalini,.1997; Johnston et al., 1999 . For each bootstrap sample the average density was
estimated and the area between this estimate and f x or f y was shaded. The final shadedarea, which is referred to as the variability band, represents the maximal polygon createdby the 100 bootstrap estimates of density. An example of the construction of avariability band for the smoothed distribution of fibre diameter in the June 1997 sampleis shown in Fig. 1A,B. The Kolmogorov–Smirnov two-sample test statistic was used totest the null hypothesis that f x s f y over all diameters. To approximate the P-value ofthis statistic, 100 bootstrap samples were drawn from the distribution that satisfied the
Ž .relevant null hypothesis. This was accomplished by re-sampling in three stages: 1Ž .within each group, n fish were sampled with replacement, 2 ignoring original
groupings, group labels were randomly assigned such that there were n fish in eachŽ . Žgroup and 3 a smooth bootstrap sample of 500 fibres for each fish was generated see
.Davison and Hinkley, 1997 . To supplement this test, the two density curves werecompared graphically by constructing a variability band around the density estimateˆxqyf estimated by pooling fish over the age-class and using the mean smoothing
ˆx ˆyparameter. Any region where f and f lay outside of this ‘‘reference’’ band provides

( )I.A. Johnston et al.rAquaculture 189 2000 307–333314
evidenced for a major difference between the densities. Finally, the 5th, 10th, 50th, 95th,and 99th percentiles of muscle fibre diameter were calculated. In cases where theKolmogorov–Smirnov test statistic was significant a Rank Sum two-sample non-para-
Ž . Ž . Ž .Fig. 2. A . The body mass of Atlantic salmon S. salar from strain X solid symbolsrline and strain YŽ . Ž .open symbolsrdotted line during the course of the growth trial. The triangles dashed line represent the
Ž .average sea temperature for the month in which the samples were taken. B The cross-sectional area of whiteŽ 2 . Ž .muscle mm at the level of the first dorsal fin ray in fish from strain X solid symbolsrline and strain Y
Ž .open symbolsrdotted line during the course of the growth trial. The fish were sampled on the 5th June, 8thJuly, 13th August, 21st October 1997 and the 20th January, 2nd March, 6th May, 22nd June and the 8thSeptember 1998. Values represent mean"SE. The number of fish per sample date was as follows: strain X:
Ž .June–October 1997, 13; January and March 1998, 15; May 1998, 20; and June 1998, 10 ns112 ; strain Y:Ž .June–October 1997, 16; January–May 1998, 8; and September 1988, 18 ns98 .

( )I.A. Johnston et al.rAquaculture 189 2000 307–333 315
metric test was used to test the hypothesis that the median value of the specifiedpercentile was equivalent between strains.
3. Results
3.1. Body mass
Ž .There was no significant difference in the initial body mass of fish ;55 g from thetwo populations. At the first sample point 6 weeks following seawater transfer the mean
Ž .body mass of the fish was 89.8"5.4 g for strain X ns11 and 86.6"3.1 g for strainŽ . Ž . Ž .Y ns16 mean"SE . The growth in body mass Mb of the two salmon populations
during the whole course of the trial is shown in Fig. 2A. The average body mass of theŽ . ŽAugust sample was significantly higher in strain Y than strain X t-test; P-0.05 Fig.
.2A . However, from this point on the growth trajectories of the two populations began toŽcross over with no significant differences between strains at the October sample Fig.
.2A . From January 1998 onwards, the average body mass of fish from strain X wassignificantly higher than for strain Y. For example, in January the average body mass of
Ž .the early maturing population strain X sampled was 72% higher than for the lateŽ . Ž .maturing population strain Y t-test; P-0.001 . ANCOVA with the whole data set
with the time from the first sample as a co-variate revealed a highly significantŽ .difference between populations Ps0.0021 .
Fig. 3. The relationship between the cross-sectional area of white muscle at the level of the first dorsal fin rayŽ . Ž . Žand fork length for Atlantic salmon S. salar from strain X solid circlesrsolid line and strain Y open
.circlesrdotted line . Values represent mean"SE. The number of fish sampled is shown in the legend to Fig. 2.

( )I.A. Johnston et al.rAquaculture 189 2000 307–333316
3.2. Muscle growth
There was no significant difference in the cross-sectional area of white muscle at theŽlevel of the first dorsal fin for the June, July, August and October 1997 samples Fig.
.2B . From the January sample onwards the cross-sectional area of white muscle was a
Ž .Fig. 4. A . The number of white muscle fibres per cross-section of the trunk at the level of the first dorsal finŽ . Ž .ray in fish from strain X solid symbolsrline and strain Y open symbolsrdotted line during the course of
Ž .the growth trial. See the legend to Fig. 2 for other details of the numbers and dates of the samples. B . Thenumber of white muscle fibres recruited for each 1 mm2 increment of growth in white muscle cross-sectional
Ž . Ž .area since the previous sample period for salmon from strain X closed circles and strain Y open circles . Forexample, the July 1997 point represents the increase in average white muscle cross-sectional area betweenJune and July divided by the average difference in the number of fibres.

( )I.A. Johnston et al.rAquaculture 189 2000 307–333 317
Ž .significantly greater in strain X than strain Y Fig. 2B . For example, for the May 1998sample the muscle cross-sectional area was 47.5% greater for strain X than strain YŽ .Mann–Whitney Rank Sum Test; P-0.001 . This difference in the cross-sectional areaof white muscle between populations was not simply a reflection of the difference inbody mass shown in Fig. 2A. For fish greater than about 40 cm fork length the musclecross-sectional area was significantly greater in the early than late maturing populationŽ .Fig. 3 , indicating differences in fish shape. ANCOVA of white muscle cross-sectionalarea for the whole data set with either fork length or body mass as a co-variate revealed
Ž .highly significant differences between populations P-0.005 . During the trial, thecross-sectional area of white muscle increased 14.3-fold in strain X and 10.7-fold in
Ž .strain Y Fig. 2B .
3.3. Fibre recruitment
The relationship between fibre number and body mass for each population during thetrial is illustrated in Fig. 4A. The number of white muscle fibres per trunk cross-sectionwas around 150,000 and 250,000 in June and July respectively, with no significantdifferences between populations. However, major differences in muscle fibre recruit-
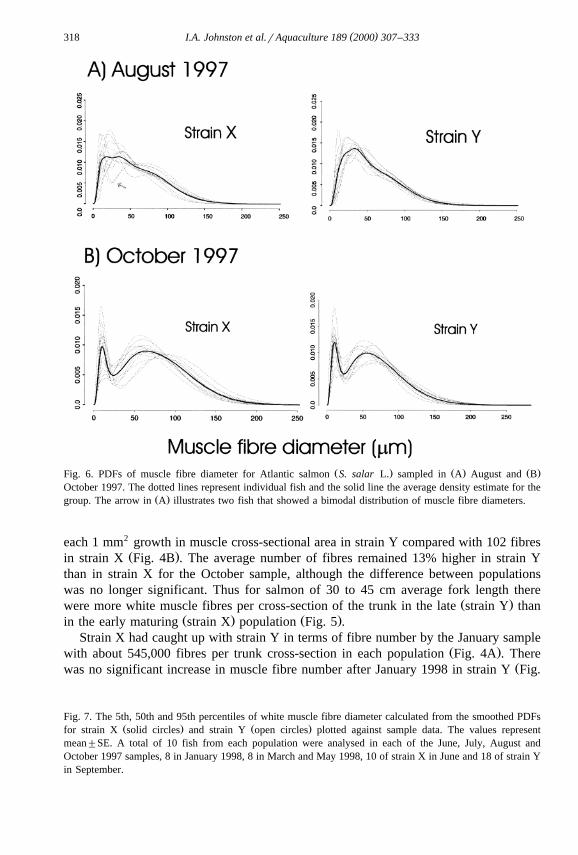
Žment patterns became apparent between populations in subsequent samples Figs. 4A.and 5 . In the August sample there were 27% more white muscle fibres per cross-section
Ž . Ž .in strain Y 334,000"16,200, ns16 than in strain X 278,500"9,900, ns13Ž . Ž . Ž .mean"SE Ps0.001; Mann–Whitney Rank Sum Test Figs. 4A and 5 . Thenumber of additional white fibres recruited for each square millimeter increase in muscleis shown in Fig. 4B. On average between July and August 230 fibres were recruited for
Fig. 5. The number of white muscle fibres muscle at the level of the first dorsal fin ray and its relation to forkŽ . Ž . Žlength for Atlantic salmon S. salar L. from strain X closed circlesrsolid line and strain Y open
.circlesrdotted line . Values represent mean"SE. The number of fish sampled is shown in the legend to Fig. 2.
( )I.A. Johnston et al.rAquaculture 189 2000 307–333318
Ž . Ž . Ž .Fig. 6. PDFs of muscle fibre diameter for Atlantic salmon S. salar L. sampled in A August and BOctober 1997. The dotted lines represent individual fish and the solid line the average density estimate for the
Ž .group. The arrow in A illustrates two fish that showed a bimodal distribution of muscle fibre diameters.
each 1 mm2 growth in muscle cross-sectional area in strain Y compared with 102 fibresŽ .in strain X Fig. 4B . The average number of fibres remained 13% higher in strain Y
than in strain X for the October sample, although the difference between populationswas no longer significant. Thus for salmon of 30 to 45 cm average fork length there
Ž .were more white muscle fibres per cross-section of the trunk in the late strain Y thanŽ . Ž .in the early maturing strain X population Fig. 5 .
Strain X had caught up with strain Y in terms of fibre number by the January sampleŽ .with about 545,000 fibres per trunk cross-section in each population Fig. 4A . There
Žwas no significant increase in muscle fibre number after January 1998 in strain Y Fig.
Fig. 7. The 5th, 50th and 95th percentiles of white muscle fibre diameter calculated from the smoothed PDFsŽ . Ž .for strain X solid circles and strain Y open circles plotted against sample data. The values represent
mean"SE. A total of 10 fish from each population were analysed in each of the June, July, August andOctober 1997 samples, 8 in January 1998, 8 in March and May 1998, 10 of strain X in June and 18 of strain Yin September.

( )I.A. Johnston et al.rAquaculture 189 2000 307–333 319

( )I.A. Johnston et al.rAquaculture 189 2000 307–333320
. Ž .4A such that growth in the cross-sectional area of white muscle Fig. 2B was entirelyŽ .by fibre hypertrophy Fig. 4B . Thus the number of white muscle fibres per trunk
Žcross-section in strain Y was relatively constant for fish of 40 to 60 cm fork length Fig..5 . In contrast, fibre number continued to increase between January and September 1998
Ž .in fish from strain X Fig. 4A . By the June sample fibre number had increased to 718,Ž . Ž .100"33,800 in fish of 61.5"1.5 cm fork length mean"SE, 10 fish Fig. 5 . The
number of fibres recruited for each 1 mm2 increase in white muscle cross-sectional areawas in the range 30–60 during the late autumn, winter and early spring periods but
Ž .increased to 150 between May and June Fig. 4B .The period between October 1997 and June 1998 when fish from strain Y had largely
Ž .stopped recruiting new fibres corresponded to the point at which body mass Fig. 1AŽ .and white muscle cross-sectional area Fig. 1B started to increase at a much slower rate
than in strain X. Thus part of the variation in growth rate between the two populationsŽ .after the first 5 months of the trial April–October was related to very different patterns
of muscle fibre recruitment. For the entire data set here was a significant main effects ofŽ .population on the number of muscle fibres per myotome with both body mass P-0.01
Ž .and muscle cross-sectional area as a co-variate P-0.001 .
3.4. Muscle fibre hypertrophy
Unimodal distributions of muscle fibre diameter were observed in June, July andŽ .August 1997, using the evidence of the variability bands. Fig. 1 illustrates A the
Ž .individual smoothed distributions and B the variability band constructed for the Junesample from strain X. Two of the individual fish from the early maturing population had
Ž .a bimodal distribution of fibre diameters in August arrow in Fig. 6A . However, by theOctober 1997 sample there was strong evidence of a bimodal distribution of fibre
Ž .diameters both for individual fish Fig. 6B and with respect to the variability bandsŽ .constructed for each group not illustrated . The reference bands and Kolmogorov–
Smirnoff tests indicated no statistically significant differences in the fibre distributionsŽ .in the first three samples not illustrated . Fig. 7 shows the 10th, 50th and 95th percentile
of fibre diameter calculated from the smoothed distributions. Between June and Augustthe 5th, 50th, and 95th percentile of fibre diameters were in the region of 15, 50 and 120
Ž .mm, respectively, and were similar for the two populations Fig. 7 . In October, theleft-peak in muscle fibre diameter was around 15 mm in both strains with right-peaks in
Ž .the distribution at 70 and 60 mm in strains X and Y, respectively Fig. 6B . The 50thand 95th percentiles of fibre diameter were 72 and 153 mm, respectively for strain X and
Ž . Ž62 and 141 mm, respectively for strain Y Fig. 7 P-0.01; Mann–Whitney Rank Sum.Test . There were no significant differences in the 10th, 50th and 95th percentile of fibre
Ž .diameter with respect to fork length in the June to October 1997 samples Fig. 8 .
Fig. 8. The 5th, 50th and 95th percentiles of white muscle fibre diameter calculated from the smoothed PDFsŽ . Ž .for strain X solid circles and strain Y open circles plotted against fork length. The values represent
mean"SE. A total of 10 fish from each population were analysed in the June, July, August and October 1997samples, 8 in January 1998, 8 in March and May 1998, 10 of strain X in June and 18 of strain Y in September.
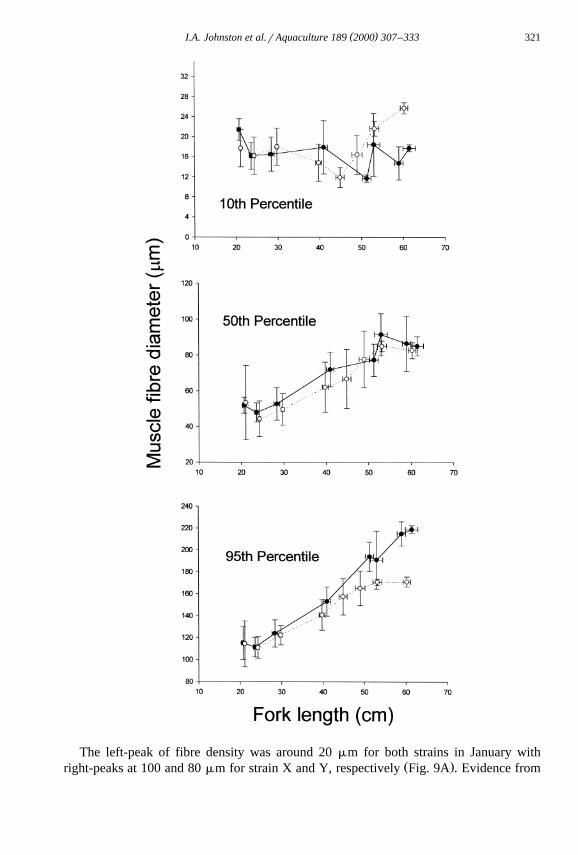
( )I.A. Johnston et al.rAquaculture 189 2000 307–333 321
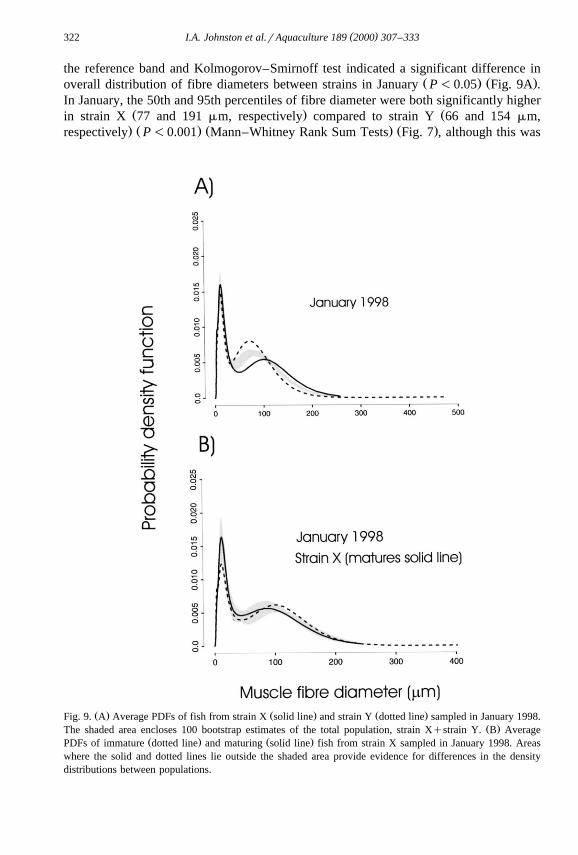
The left-peak of fibre density was around 20 mm for both strains in January withŽ .right-peaks at 100 and 80 mm for strain X and Y, respectively Fig. 9A . Evidence from
( )I.A. Johnston et al.rAquaculture 189 2000 307–333322
the reference band and Kolmogorov–Smirnoff test indicated a significant difference inŽ . Ž .overall distribution of fibre diameters between strains in January P-0.05 Fig. 9A .
In January, the 50th and 95th percentiles of fibre diameter were both significantly higherŽ . Žin strain X 77 and 191 mm, respectively compared to strain Y 66 and 154 mm,. Ž . Ž . Ž .respectively P-0.001 Mann–Whitney Rank Sum Tests Fig. 7 , although this was
Ž . Ž . Ž .Fig. 9. A Average PDFs of fish from strain X solid line and strain Y dotted line sampled in January 1998.Ž .The shaded area encloses 100 bootstrap estimates of the total population, strain Xqstrain Y. B Average
Ž . Ž .PDFs of immature dotted line and maturing solid line fish from strain X sampled in January 1998. Areaswhere the solid and dotted lines lie outside the shaded area provide evidence for differences in the densitydistributions between populations.
( )I.A. Johnston et al.rAquaculture 189 2000 307–333 323
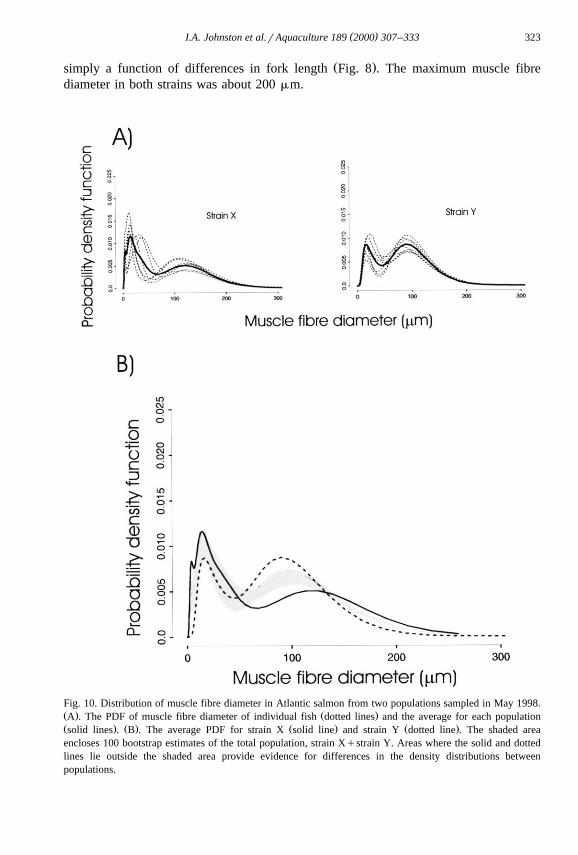
Ž .simply a function of differences in fork length Fig. 8 . The maximum muscle fibrediameter in both strains was about 200 mm.
Fig. 10. Distribution of muscle fibre diameter in Atlantic salmon from two populations sampled in May 1998.Ž . Ž .A . The PDF of muscle fibre diameter of individual fish dotted lines and the average for each populationŽ . Ž . Ž . Ž .solid lines . B . The average PDF for strain X solid line and strain Y dotted line . The shaded areaencloses 100 bootstrap estimates of the total population, strain Xqstrain Y. Areas where the solid and dottedlines lie outside the shaded area provide evidence for differences in the density distributions betweenpopulations.

( )I.A. Johnston et al.rAquaculture 189 2000 307–333324
Fig. 9B shows the average PDF of immature and maturing fish from strain X. Therewas a higher peak density at 20 mm in the maturing fish although this fell within the
Ž .reference band for the combined populations, indicating it was not significant Fig. 9B .In contrast, there was a right-shift in the secondary peak of density to higher fibrediameters in the immature fish which fell outside the reference band consistent with a
Ž .better hypertrophic growth performance P-0.05; Fig. 9B . Thus greater hypertrophicgrowth was observed for white muscle fibres in immature than maturing fish within
Ž .strain X. In contrast, the right peak in the distribution Fig. 9A and the 95th percentileŽ .of fibre diameter Fig. 7 were at higher values in strain X than in strain Y. This
suggests that the greater hypertrophic growth performance of fibres in strain X was not
Ž .Fig. 11. Distribution of muscle fibre diameter in Atlantic salmon from two populations sampled in A JuneŽ . Ž . Ž . Ž .1998 strain X and B September strain Y at the end of the growth trial. C The average PDF for strain X
Ž . Ž .solid line and strain Y dotted line . The shaded area encloses 100 bootstrap estimates of the total population,strain Xqstrain Y. Areas where the solid and dotted lines lie outside the shaded area provide evidence fordifferences in the density distributions between populations. Ten fish were analysed from each population.

( )I.A. Johnston et al.rAquaculture 189 2000 307–333 325
directly related to sexual maturation but rather to some other genetic difference betweenthe populations.
In all subsequent samples, the right-hand peak of maturing fibres was shifted tohigher diameters in strain X than in strain Y, and was 100 and 75 mm, respectively, in
Ž . Ž .March not illustrated and 123 and 90 mm, respectively, in May 1998 Fig. 10A . Thesmallest diameter size classes were absent from fish of the late maturing population in
Ž .the May sample Fig. 10B , reflecting the virtual cessation of new fibre recruitment inŽ .strain Y Fig. 4A . Consequently, the 5th percentile of fibre diameter was also at a
Ž . Žsignificantly higher value in strain Y than in strain X Fig. 7 P-0.01; Mann–Whit-. Ž .ney Rank Sum Test . Fish from strain Y only reached a similar fork length ;59 cm to
the May sample of strain X in September. At this fork length the 95th percentile of fibrediameter was greater in strain X than strain Y, whereas the 10th percentile was greater in
Ž .strain Y than strain X Fig. 8 , reflecting the cessation of fibre recruitment in the latematuring population. It should be noted that because of heavy sea lice infestation and theneed for frequent medication the growth performance of fish in this trial was relatively
Žpoor. A final sample of the remaining fish was taken in June for strain X 100%. Ž . Ž .maturing and in September from strain Y 100% immature Fig. 11A,B . The condition
Ž .factor of the strain X fish 1.23"0.02 was significantly higher than for strain Y fishŽ . Ž . Ž1.03"0.02 at the time of harvest mean"SE, ns15 per group ANCOVA with
. Ž .fork length as co-variate; P-0.001 . The reference band Fig. 11B and Kolmogorov–Smirnoff test indicated a significant difference in overall distribution of fibre diameters
Ž .in the final samples P-0.05 . Individual variation in the distribution of fibre diametersŽ .was much greater for strain Y than strain X Fig. 11A . The variability bands
constructed around the average density estimates from each population indicated that the
Ž .Fig. 12. The relationship between fork length cm and the density of white muscle fibres at the level of theŽ . Ž .first dorsal fin ray in Atlantic salmon S. salar L. from two populations, strain X solid circles and strain Y
Ž . bopen circles . The fitted lines represent a power function of the form Ys aX . The equations for the lineswere as follows: strain X: as11,600"1800, bsy1.14"0.04, r 2 adjs0.89, P -0.001; strain Y: as8000"1500, bsy0.98"0.060, r 2 adjs0.80, P -0.001.

( )I.A. Johnston et al.rAquaculture 189 2000 307–333326
Ž .fibre diameter distributions were bimodal not illustrated , although several individualŽ .fish from strain X had a trimodal distribution Fig. 11A . The maximum of the
right-hand peak of the average density was at 130-mm diameter in strain X and 100-mmŽ .diameter in strain Y Fig. 11B . The 95th percentile of fibre diameter was at 220 mm in
Ž . Ž .strain X and 171 mm in strain Y P-0.001; Mann–Whitney Rank Sum Test Fig. 7 .Thus at the end of the trial there was evidence for a superior hypertrophic growthperformance of white fibres in strain X compared to strain Y. The maximum diameter ofwhite fibres was around 240 mm. The density of muscle fibres is plotted against forklength in Fig. 12. Muscle fibre density was significantly higher in strain Y than in strain
Ž .X ANCOVA with fork length as co-variate; P-0.01 . For fish less than 40 cm thiswas largely due to the initially greater rate of fibre recruitment in strain Y than strain XŽ .Fig. 5 . Following the January sample, in fish greater than 40 cm fork length, the highernumbers of white muscle fibres per myotomal cross-section in strain X than strain YŽ . Ž .Figs. 4A and 5 was offset by the greater rate of fibre hypertrophy Fig. 8 , resulting in
Ž .a lower fibre density Fig. 12 .
4. Discussion
Muscle growth in fish is a complex process involving the recruitment and subsequenthypertrophy of muscle fibres. The process has been described over the complete life
Ž . Žcycle for just a few fish species including Atlantic cod Gadus morhua Greer-Walker,. Ž . Ž .1970 , rainbow trout O. mykiss Stickland, 1983; Kiessling et al., 1991 and gilthead
Ž . Ž .sea bream Sparus auratus Rowlerson et al., 1995 . The present study describesŽ .patterns of muscle growth in Atlantic salmon S. salar L. over a complete production
cycle in seawater, and extends previous work on tank-reared fish involving the freshwa-Ž . Ž .ter Higgins and Thorpe, 1990 , and early seawater stages Johnston et al., 1999 .
Muscle growth in Atlantic salmon is of particular interest due to its commercialimportance and because of its flexible life history strategy. Genetic and environmentalfactors combine to influence life history factors such as the time spent in freshwater and
Ž .age and size at sexual maturity, all of which effect growth rate Thorpe, 1989 , and havethe potential to modify muscle growth patterns. For example, different patterns ofmuscle growth have already been described for parr destined to smolt after one or two
Ž .years in freshwater Higgins and Thorpe, 1990 . Sibling populations of juvenile Atlanticsalmon exhibit a bimodal length frequency distribution in late summer. For fish in theupper growth mode, the number of white muscle fibres increased more than 6-fold fromthe fry to the smolt stage. In contrast, the lower growth mode fish recruited relativelyfew muscle fibres over the same period, but in their second year resumed a similarpattern of muscle growth to that observed in the upper mode fish the previous year. Thedecision to smolt in a particular year is known to vary between families, but is stronglyinfluenced by prior feeding opportunity and can be modified by temperature and
Ž .day-length Metcalfe et al., 1988; Thorpe, 1989 .A major finding of the present study was that Atlantic salmon populations with
different growth rates and ages at sexual maturity also showed markedly differentpatterns of muscle growth. In this case, fish from the two populations were rearedtogether in the same cage and the different growth patterns are probably genetic in

( )I.A. Johnston et al.rAquaculture 189 2000 307–333 327
origin. Differences in the average cross-sectional area of white muscle between theŽ .populations only became apparent 6 months after seawater transfer Fig. 2B . Fish from
the late maturing population recruited more than twice as many fibres for each squaremillimeter increase in muscle cross-sectional area between August and July 1997 as the
Ž .early maturing population Fig. 4B . As a result, in August the number of white muscleŽ .fibres per trunk cross-section was 26% higher in strain Y than strain X Fig. 4A . In
both populations the recruitment of new fibres declined in the period from August toŽ . Ž .January, as reported for the freshwater stages Higgins and Thorpe, 1990 Fig. 4B . For
Ž y2strain X the number of fibres recruited between March and January 1998 ;30 mm.muscle was only about 10% of that observed between June and July shortly after
transfer to seawater. The number of fibres recruited in the high grilsing populationincreased again in the spring and early summer, reaching around five times the winter
Ž y2 . Ž .level ;150 mm muscle Fig. 4B . In marked contrast, there was little fibrerecruitment after January in fish from the late maturing population with fibre number
Ž .remaining relatively constant between 42 and 63 cm fork length Fig. 5 . Thus theincrease in muscle girth that was observed between January and the final harvest samplewas the result of a combination of fibre recruitment and hypertrophy in the earlymaturing population but entirely due to fibre hypertrophy in the late maturing popula-tion. Since a significant difference in the cross-sectional area of the white musclebetween populations was only evident from the January sample onwards our resultspoint to an association between fast muscle growth and fibre recruitment. In contrast, inrainbow trout populations selected for differences in growth rate, no difference wasfound in the number of white muscle fibres per trunk cross-section at any given body
Ž .size Valente et al., 1999 .A similar correlation between fibre recruitment and fast growth rate has been noted
Ž . Ž .previously for the larvae of carp Cyprinus carpio Alami-Durante et al., 1997 andŽ . Ž .Atlantic cod G. morhua fed different diets Galloway et al., 1999 . In rainbow trout
fed ad libitum for 16 weeks growth rate was found to be higher at 128C than 168CŽ .Weatherley et al., 1979 . The modal muscle fibre diameter was lower in the 128C than168C group, even for fish of similar body length, consistent with a greater contribution
Ž .of fibre recruitment in the fastest growing fish Weatherley et al., 1979 . Similarrelationships between growth characteristics and muscle fibre recruitment have beenobserved between different species. In a study of 10 teleost fish, the largest, fastest
Ž .growing species e.g., smallmouth bass, Micropterus dolomieui were found to sustainrecruitment of fibres for longer in the life cycle than smaller, slower growing speciesŽ . Ž .e.g., longnose dace, Rhininichthys cataractae Weatherley et al., 1988 . Meyer-Rochow
Ž . Žand Ingram 1993 found that the dwarf lacustrine form of the Southern smelt Retro-.pina retropina Richardson stopped recruiting new white muscle fibres at a significantly
shorter fork length than the larger riverine form.The maximum diameter for white muscle fibres in temperate fish is around 240 mm,
Žperhaps reflecting some constraint on the diffusion of metabolites Weatherley et al.,.1988; Johnston et al., 1999 . Small diameter fibres can be expected to grow more
quickly than large diameter fibres because of their higher surface to volume ratio andŽ .greater capacity to assimilate nutrients Weatherley et al., 1988 . In support of this idea,
the white muscle of a fast growing strain of rainbow trout was found to have smaller

( )I.A. Johnston et al.rAquaculture 189 2000 307–333328
Ž .diameter fibres than a slow growing strain Valente et al., 1998 . Thus maintaining ahigh proportion of smaller size classes of muscle fibre through new fibre recruitmentaids rapid growth and overcomes the constraint on body size associated with themaximum diameter of the fibres. Although fibre recruitment is critical for growth itshould be remembered that most of the increase in muscle girth derives from fibrehypertrophy. The average diameter of a newly formed myotube in the white muscle of
Ž .Atlantic salmon is only around 5 mm Johnston et al., 2000b . Thus in strain X, newfibres accounted for only 0.65% and 0.35% of the cross-sectional area of the white
Ž 2 . Ž 2 .muscle in the June 1997 3.1 mm and June 1998 41 mm samples, respectively.Muscle fibre recruitment is presumably dependent on the number of activated satellite
Ž .cells and their proliferative capacity Koumans et al., 1991; Koumans and Akster, 1995 .Ž .Selection for a high body mass in mice Brown and Stickland, 1993; 1994 and quail
Ž .Fowler et al., 1980; Campion et al., 1982 was associated with an increase in thenumber of satellite cells and muscle fibres present at birth relative to control lines. Fibrenumber is known to have a strong genetic component, showing moderate to high
Ž . Ž . Žheritability in rats Suwa et al., 1996 , pigs Larzul et al., 1997 and cattle Renand et.al., 1995 . Triploid Atlantic salmon were also found to have 24% more satellite cells per
trunk cross-section than diploid fish and to recruit about one third fewer fibres to reach aŽ .given muscle cross-sectional area Johnston et al., 1999 . Whilst differences in satellite
cell density might well be responsible for variation in muscle fibre number andrecruitment potential between families it is not a likely explanation for the observedpopulation differences in the present study. The most plausible hypothesis to explainvariations in the timing of muscle fibre recruitment is a difference in the proliferativecapacity of the satellite cells. Activated muscle stem cells are thought to undergo anasymmetric division to regenerate the stem cell and produce a daughter cell that
Ž .continues to divide several more times before differentiating Schultz, 1996 . Satellitecells that are committed to differentiation express myogenic regulatory factors belonging
Žto the MyoD gene family Cornelison and Wold, 1997; Sabourin et al., 1999; Johnston.et al., 1999 . Their behaviour is determined by a complex network of antagonistic
proliferation and differentiation signalling pathways that are only just beginning to beŽ . Ž .investigated in fish see Johnston, 1999 for a review . Fauconneau et al. 1997 found
that growth hormone supplementation in rainbow trout increased the percentage of smalldiameter fibres suggesting this hormone may have a role in controlling fibre recruitment.Factors that have been implicated in satellite cell activation in mammals include,
Ž . Ž . Žfibroblast growth factor-2 FGF2 Yablonka-Reuveni et al., 1999 , FGF6 Floss et al.,. Ž . Ž .1997 , Insulin-like growth factor-1 IGF-1 Florini et al., 1991 and hepatocycte growth
Ž . Ž .factorrscatter factor HGFrSF Tatsumi et al., 1998 . Interestingly, satellite cellsisolated from heavy-weight strains of turkey showed a higher proliferative capacity in
Ž .vitro than cells from light-weight strains Merly et al., 1998 . This also providesevidence that the proliferative capacity of satellite cells is under genetic as well asenvironmental control.
Another major finding in the present study was for population differences in musclefibre hypertrophy. From the October 1997 sample onwards the smoothed distribution of
Ž .muscle fibre diameter was bimodal Figs. 6, 9–11 . In all cases the right-hand peak ofmaturing fibres was shifted to higher diameters in the early maturing than the late

( )I.A. Johnston et al.rAquaculture 189 2000 307–333 329
Ž .maturing population Figs. 6, 9–11 . This was not simply a function of differences inbody size since for fish of equivalent fork length the 95th percentile of muscle fibrediameter was at higher values in the early than late maturing strain towards the end of
Ž .the trial Fig. 8 . Evidence for genetic differences in muscle fibre size has been obtainedin farm animals. For example, studies in pigs have found heritable variation in themaximum diameter of different muscle fibre types for a given body mass betweenstrains selected for differences daily weight gain and lean and fat content of the carcassŽ .Ruusunen et al., 1996; Larzul et al., 1997 . In contrast, the frequency distributions ofmuscle fibre diameter in populations of rainbow trout selected for fast and slow growth
Žrate were found to be rather similar, particularly for the larger size classes see Fig. 6 in.Valente et al., 1999 . The population differences in muscle fibre diameter found in the
present study were not directly related to sexual maturation since within strain X greaterŽ .fibre hypertrophy was observed for immature than mature individuals Fig. 9B .
Insulin-like growth factors have been broadly implicated in regulating hypertrophicŽ .growth Florini et al., 1991 . Induced expression of the non-circulating IGF-1 isoform in
Ža post-mitotic rat myocyte line was shown to result in hypertrophy Musaro and`.Rosenthal, 1999 . There is evidence that IGF-1 mediated muscle fibre hypertrophy
Žinvolves the activation of the calcineurin signal transduction pathway Dunn et al., 1999;.Musaro et al., 1999; Semsarian et al., 1999 . Calcineurin is a calcium-activated serum`
Ž . Ž .phosphatase comprising catalytic CnA and regulatory subunits CnB and the calciumsensor molecule, calmodulin. Transfected IGF-1 gene expression in a post-mitotic cell
Žline resulted in increased expression of CnA but not CnB transcripts Musaro et al.,`.1999 . Cell cultures stably transfected with a calcium-independent form of CnA driven
by a myogenin promoter had a pronounced hypertrophic phenotype. IGF-1 is thought toact in skeletal muscle by mobilising intracellular calcium stores, which activate cal-cineurin, and induce the nuclear translocation of the transcription factor NF-ATc1Ž . ŽMusaro et al., 1999; Semsarian et al., 1999 . Three isoforms of NF-AT nuclear factor`
.of activated T cells are present in mammalian muscle, and one of them, NF-ATc 1 canpreferentially translocate to a sub-set of nuclei within a single multi-nucleated myotubeŽ .Abbot et al., 1998 . IGF-1 andror activated calcineurin have also been implicated inthe expression of GATA-2, which also accumulates in a subset of myocycte nucleiŽ .Musaro et al., 1999 . Although the details have not been established CnA and GATA-2`expression may be involved in a signalling cascade associated with the up-regulation of
Žgenes involved in muscle fibre hypertrophy Musaro et al., 1999; Semsarian et al.,`.1999 . In adult mammals, dependence on calcineurin signalling is associated with
Ž .relative increases in muscle activation characteristics Dunn et al., 1999 . Exercise isŽknown to be a powerful stimulus for muscle fibre hypertrophy in fish Greer-Walker and
. Ž .Pull, 1973; Johnston and Moon, 1980 . Totland et al. 1987 found that the averagediameter of white muscle fibres in Atlantic salmon forced to swim in a flume wasgreater than controls. The differences in fibre hypertrophy observed between populationscould therefore be related to behavioural differences in foraging activity andror reflectgenetic differences in the regulatory machinery.
Muscle structure has a major impact on the textural characteristics of fish productsŽ .Hurling et al., 1996; Johnston et al., 2000a . Since patterns of muscle fibre recruitmentand hypertrophy vary between salmon populations this opens up the possibility of using
( )I.A. Johnston et al.rAquaculture 189 2000 307–333330
selective breeding programs to manipulate muscle structure and hence the texturalcharacteristics of the fillet.
Acknowledgements
This work was supported by an Aquaculture Link Programme from the NaturalEnvironment Research Council. We are grateful to Dr. Marti L. McCraken of theInstitute of Mathematical Sciences for statistical advice and for programming.
References
Abbot, K., Friday, B.B., Thaloor, D., Murphy, T.J., Pavlath, G.K., 1998. Activation and cellular localization ofthe cyclosporine A-sensitive transcription factor NF-AT in skeletal muscle cells. Mol. Biol. Cell 9,2905–2916.
Alami-Durante, H., Fauconneau, B., Rouel, M., Escaffre, A.M., Bergot, P., 1997. Growth and multiplicationof white skeletal muscle fibres in relation to somatic growth rate. J. Fish Biol. 50, 1285–1302.
Ž .Bone, Q., 1978. Locomotor muscle. In: Hoar, W.S., Randall, D.J. Eds. , Fish Physiology vol. 7 AcademicPress, New York, pp. 361–424.
Bowman, A.W., Azzalini, A., 1997. Applied smoothing techniques for data analysis. In: The Kernel Approachwith S-Plus Illustrations. Oxford Science Publications, Oxford Univ. Press, Oxford, p. 193.
Brown, S.C., Stickland, N.C., 1993. Satellite cell content in muscles of large and small mice. J. Anat. 183,91–96.
Brown, S.C., Stickland, N.C., 1994. Muscle at birth in mice selected for large and small body size. J. Anat.184, 371–380.
Campion, D.R., Marks, H.L., Richardson, L.R., 1982. An analysis of satellite cell content in the semimembra-Ž .nosus muscle of Japanese quail Coturnix coturnix japonica selected for rapid growth. Acta Anat 112,
9–13.Carpene, E., Veggetti, A., Mascarello, F., 1982. Histochemical fibre types in the lateral muscle of fishes in`
fresh, brackish and salt water. J. Fish Biol. 20, 346–379.Cornelison, D.D.W., Wold, B.J., 1997. Single-cell analysis of regulatory gene expression in quiescent and
activated mouse skeletal muscle satellite cells. Dev. Biol. 191, 270–283.Davison, A.C., Hinkley, D.V., 1997. In: Bootstrap Methods and their Applications. Cambridge Univ. Press,
Cambridge, p. 257.Driedzic, W.R., Hochachka, P.W., 1976. Control of energy metabolism in fish white muscle. Am. J. Physiol.
230, 579–582.Dunn, S.E., Burns, J.L., Michel, R.N., 1999. Calcineurin is required for skeletal muscle hypertrophy. J. Biol.
Chem. 274, 21908–21912.Fauconneau, B., Andre, S., Chmaitilly‘, LeBail, P.-Y., Krieg, F., Kaushik, S.J., 1997. Control of skeletal
muscle fibres and adipose cells in the flesh of rainbow trout. J. Fish Biol. 50, 296–314.Florini, J.R., Ewton, D.Z., Magri, K.A., 1991. Hormones, growth factors, and myogenic differentiation. Annu.
Rev. Physiol. 53, 201–216.Floss, T., Arnold, H.-H., Braun, T., 1997. A role for FGF-6 in skeletal muscle regeneration. Genes Dev. 11,
2040–2051.Fowler, S.P., Campion, D.R., Marks, H.L., Reagan, J.O., 1980. An analysis of skeletal muscle response to
Ž .selection for rapid growth in Japanese quail Coturnix coturnix Japonica . Growth 44, 235–252.ŽGalloway, T.F., Kjørsvik, E., Kryvi, H., 1999. Muscle growth and development in Atlantic cod larvae Gadus
.morhua L. related to different somatic growth rates. J. Exp. Biol. 202, 2111–2120.Ž .Greer-Walker, M., 1970. Growth and development of the skeletal muscle fibres of the cod Gadus morhua L. .
J. Cons. Int. Expl. Mer. 33, 421–426.

( )I.A. Johnston et al.rAquaculture 189 2000 307–333 331
Greer-Walker, M., Pull, M.G., 1973. Skeletal muscle function and sustained swimming speeds in the coalfishŽ .Gadus Õirens L. . Comp. Biochem. Physiol. 44A, 495–501.
Hansen, T., Steffansson, S., Taranger, G.L., 1992. Growth and sexual maturation in Atlantic salmon, Salmosalar L., reared in sea cages at two different light regimes. Aquacult. Fish. Manage. 22, 275–280.
Higgins, P.J., Thorpe, J.E., 1990. Hyperplasia and hypertrophy in the growth of skeletal muscle in juvenileAtlantic salmon, Salmo salar L. J. Fish Biol. 37, 505–519.
Hudson, R.C.L., 1969. Polyneuronal innervation of the fast muscles of the marine teleost Cottus scorpius L. J.Exp. Biol. 50, 47–67.
Hurling, R., Rodell, J.B., Hunt, H.D., 1996. Fibre diameter and fish texture. J. Texture Stud. 27, 679–685.Johnston, I.A., 1980. Contractile properties of fish fast muscle fibres. Mar. Biol. Lett. 1, 323–328.Johnston, I.A., 1999. Muscle development and growth: potential implications for flesh quality in fish.
Aquaculture 177, 99–115.Johnston, I.A., Patterson, S., Ward, P.S., Goldspink, G., 1974. The histochemical demonstration of myofibril-
lar adenosine triphosphatase activity in fish muscle. Can J. Zool. 52, 871–877.Johnston, I.A., Ward, P.S., Goldspink, G., 1975. Studies on the swimming musculature of the rainbow trout: I.
Fibre types. J. Fish Biol. 7, 451–458.Johnston, I.A., McLay, H.A., 1997. Temperature and family effects on muscle cellularity at hatch and first
Ž .feeding in Atlantic salmon Salmo salar L. . Can. J. Zool. 75, 64–74.ŽJohnston, I.A., Moon, T.W., 1980. Exercise training in skeletal muscle of the brook trout SalÕelinus
.fontinalis . J. Exp. Biol. 87, 177–194.Johnston, I.A., Davison, W., Goldspink, G., 1977. Energy metabolism of carp swimming muscles. J. Comp.
Physiol. 114, 203–216.Johnston, I.A., Strugnell, G., McCraken, M.L., Johnstone, R., 1999. Muscle growth in normal sex ratio and
all-female diploid and triploid Atlantic salmon. J. Exp. Biol. 202, 1991–2016.Johnston, I.A., Alderson, D., Sandham, C., Dingwall, A., Mitchell, D., Selkirk, C., Nickell, D., Baker, R.,
Robertson, B., Whyte, D., Springate, J., 2000a. Muscle cellularity in relation to flesh quality in fresh andŽ .smoked Atlantic salmon Salmo salar L. . Aquaculture.
Johnston, I.A., McLay, H.A., Abercromby, M., Robbins, D., 2000b. Phenotypic plasticity of early myogenesisand satellite cell numbers in Atlantic salmon spawning in an upland and a lowland tributary of a riversystem. J. Exp. Biol., in press.
˚Kiessling, A., Storebakken, T., Asgard, T., Kiessling, K.-H., 1991. Changes in the structure and function of˚Ž .the epaxial muscle of rainbow trout Oncorhynchus mykiss in relation to ration and age: I. Growth
dynamics. Aquaculture 93, 335–355.Koumans, J.T.M., Akster, H.A., 1995. Myogenic cells in development and growth of fish. Comp. Biochem.
Physiol. 110A, 3–20.Koumans, J.T.M., Akster, H.A., Brooms, G.H.R., Lemmens, C.J.J., Osse, J.W.M., 1991. Numbers of
Ž .myosatellite cells in white axial muscle of growing fish: Cyprinus carpio L. Teleostei . Am. J. Anat. 192,418–424.
Larzul, C., Lefaucheur, L., Ecolan, P., Gogue, J., Talmant, A., Sellier, P., Le Roy, P., Monin, G., 1997.´Phenotypic and genetic parameters for longissimus muscle fiber characteristics in relation to growth,carcass, and meat quality traits in Large White pigs. J. Anim. Sci. 75, 3126–3127.
Merly, F., Magras-Resch, C., Rouaud, T., Fontaine-Perus, J., Gardahaut, M.F., 1998. Comparative analysis ofsatellite cell properties in heavy- and lightweight strains of turkey. J. Muscle Res. Motil. 19, 257–270.
Metcalfe, N.B., Huntingford, F.A., Thorpe, J.E., 1988. Feeding intensity, growth rates and the establishment oflife history patterns in juvenile Atlantic salmon. J. Anim. Ecol. 57, 463–474.
Meyer-Rochow, V.B., Ingram, J.R., 1993. Red–white muscle distribution and fibre growth dynamics: acomparison between lacustrine and riverine populations of the Southern smelt Retropinna retropinnaRichardson. Proc. R. Soc. London, Ser. B 252, 85–92.
Musaro, A., Rosenthal, N., 1999. Maturation of the myogenic program is induced by post-mitotic expression`of IGF-1. Mol. Cell. Biol. 19, 3115–3124.
Musaro, A., McCullagh, K.J.A., Naya, F.J., Olson, N., Rosenthal, N., 1999. IGF-1 induces skeletal myocyte`hypertrophy through calcineurin in association with GATA-2 and NF-Atc1. Nature 400, 581–585.
Nicieza, A.G., Reyes-Gavian, F.G., Brana, F., 1994. Differentiation in juvenile growth and bimodality patterns´ ˜

( )I.A. Johnston et al.rAquaculture 189 2000 307–333332
Ž .between northern and southern populations of Atlantic salmon Salmo salar L. . Can. J. Zool. 72,1603–1610.
Ramırez-Zarzosa, G., Gil, F., Vazquez, A., Arenciba, A., Latorre, R., Lopez-Albors, O., Ortega, A., Moreno,´ ´ ´Ž .F., 1998. The post-larval development of lateral musculature in gilthead sea bream Sparus aurata L. and
Ž .sea bass Dicentrarchus labrax L. . Anat. Histol. Embryol. 27, 21–29.Renand, G., Jurie, C., Robelin, J., Picard, B., Geay, Y., Menissier, 1995. Genetic variability of muscle´
biological characteristics of young Limousin bulls. Genet. Sel. Evol. 27, 287–296.Riddell, B.E., Leggett, W.C., 1981. Evidence of an adaptive basis for geographic variation of body
Ž .morphology, and time of downstream migration of juvenile Atlantic salmon Salmo salar . Can. J. Fish.Aquat. Sci. 38, 308–320.
Rowe, R.W.E., Goldspink, G., 1969. Muscle growth in five different muscles in both sexes of mice: I. Normalmice. J. Anat. 132, 557–579.
Rowlerson, A., Mascarello, F., Radaelli, G., Veggetti, A., 1995. Differentiation and growth of muscle in theŽ .fish Sparus aurata L : II. Hyperplastic and hypertrophic growth of lateral muscle from hatching to adult.
J. Muscle Res. Cell Motil. 16, 223–236.Ruusunen, M., Sevon-Aiomen, M.L., Puolanne, E., 1996. Composition and cross-sectional area of muscle
fibre types in relation to daily gain and lean and fat content of carcass in Landrace and Yorkshire pigs.Agric. Food Sci. Finl. 5, 593–600.
Sabourin, L.A., Girgis-Gabardo, A., Seale, P., Asakura, A., Rudnicki, M.A., 1999. Reduced differentiationpotential of primary MyoDyry myogenic cells derived from adult skeletal muscle. J. Cell Biol. 144,631–643.
Schaffer, W.M., Elson, P.F., 1975. The adaptive significance of variations in life history among localpopulations of Atlantic salmon in North America. Ecology 56, 577–590.
Schultz, E., 1996. Satellite cell proliferative compartments in growing skeletal muscles. Dev. Biol. 175,84–94.
Semsarian, C., Ming-Jie, W., Yue-Kun, J., Marciniec, T., Yeoh, T., Allen, D.G., Harvey, R.P., Graham, R.M.,1999. Skeletal muscle hypertrophy is mediated by a Ca2q-dependent calcineurin signalling pathway.Nature 400, 576–580.
Silverman, D., 1986. Density Estimation for Statistics and Data Analysis. Chapman & Hall, New York, 175pp.
Ž .Stickland, N.C., 1983. Growth and development of muscle fibbers in the rainbow trout Salmo gairdneri . J.Anat. 137, 323–333.
Suresh, A.V., Sheehan, R.J., 1998. Muscle fibre growth dynamics in diploid and triploid rainbow trout. J. FishBiol. 52, 570–587.
Suwa, M.T., Nakamura, T., Katsuta, S., 1996. Heredity of muscle fiber composition and correlated response ofŽ .the synergistic muscle in rats. Am. J. Physiol., Regul., Integr. Comp. Physiol. 271 40 , 432–440.
Taranger, G.L., Haux, C., Stefansson, S.O., Bjornsson, B.T., Walther, B.T., Hansen, T., 1998. Abrupt changes¨in photoperiod affect age at maturity, timing of ovulation and plasma testosterone and oesttradiol-17b inAtlantic salmon, Salmo salar. Aquaculture 162, 85–98.
Tatsumi, R., Anderson, J.E., Nevoret, C.J., Harvey, O., Allen, R.E., 1998. HGFrSF is present in normal adultskeletal muscle and is capable of activating satellite cells. Dev. Biol. 194, 114–128.
Taylor, E.B., 1991. A review of local adaptation in Salmonidae, with special reference to Pacific and Atlanticsalmon. Aquaculture 98, 185–207.
Ž .Thorpe, J.E., 1989. Developmental variation in salmonid populations. J. Fish Biol. 35 Suppl. A , 295–303.Ž .Thorpe, J.E., Mitchell, K.A., 1981. Stocks of Atalntic salmon Salmo salar in Britain and Ireland:
discreteness, and current management. Can. J. Fish. Aquat. Sci. 38, 1576–1590.Thorpe, J.E., Morgan, R.I.G., Talbot, C., Miles, M.S., 1983. Inheritance of developmental rates in Atlantic
salmon, Salmo salar L. Aquaculture 33, 119–128.Totland, G.K., Kryvi, H., Jødestol, K.A., Christiansen, E.N., Tangeras, A., Slinde, E., 1987. Growth and˚
Ž .composition of the swimming muscle of adult Atlantic salmon Salmo salar L during long-term sustainedswimming. Aquaculture 66, 299–313.
Valente, L.M.P., Gomes, E.F.S., Fauconneau, B., 1998. Biochemical growth characterisation of fast andslow-growing rainbow trout strains: effect of cell proliferation and size. Fish Physiol. Biochem. 18,213–224.

( )I.A. Johnston et al.rAquaculture 189 2000 307–333 333
Valente, L.M.P., Rocha, E., Gomes, E.F.S., Silva, M.W., Oliveira, M.H., Monteiro, R.A.F., Fauconneau, B.,1999. Growth dynamics of white and red muscles in fast and slow growing strains of rainbow trout. J. FishBiol. 55, 675–691.
Ž .Verspoor, E., 1997. Genetic diversity among Atlantic salmon Salmo salar L. populations. ICES J. Mar. Sci.54, 965–973.
Weatherley, A.H., Gill, H.S., 1985. Dynamics of increase in muscle fibers in fishes in relation to size andgrowth. Experentia 41, 353–354.
Weatherley, A.H., Gill, H.S., Rogers, S.C., 1979. Growth dynamics of muscle fibres, dry weight, andŽ .condition in relation to somatic growth rate in yearling rainbow trout Salmo gairdneri . Can J. Zool. 57,
2385–2392.Weatherley, A.H., Gill, H.S., Lobo, A.F., 1988. Recruitment and maximal diameter of axial muscle fibres in
teleosts and their relationship to somatic growth and ultimate size. J. Fish Biol. 33, 851–859.Yablonka-Reuveni, Z., Rivera, A.J., 1994. Temporal expression of regulatory and structural muscle proteins
during myogenesis of satellite cells on isolated adult rat fibers. Dev. Biol. 164, 588–603.Yablonka-Reuveni, Z., Seger, R., Rivera, A.J., 1999. Fibroblast growth factor promotes recruitment of skeletal
muscle satellite cells in young and old rats. J. Histochem. Cytochem. 47, 23–42.
Copyright © 2022 FDOKUMEN