Tailoring of Atlantic Salmon ( Salmo salar L.) Flesh Lipid Composition and Sensory Quality by...
45
Tailoring of Atlantic salmon (Salmo salar L.) flesh lipid composition and sensory quality by replacing fish oil with a vegetable oil blend Bente E. Torstensen a *, J. Gordon Bell b , Grethe Rosenlund c , R. James Henderson b , Ingvild E. Graff a , Douglas R. Tocher b , Øyvind Lie a & John R. Sargent b a Institute of Nutrition and Seafood Research, N-5817 Bergen, Norway b Institute of Aquaculture, University of Stirling, Stirling FK9 4LA, Scotland, UK c Nutreco Aquaculture Research Centre A/S (ARC), Stavanger, Norway Running title: TAILORING OF ATLANTIC SALMON FLESH *Corresponding author: Dr Bente E. Torstensen, National Institute of Nutrition and Seafood Research (NIFES), P.O. Box 2029 Nordnes, N-5817 Bergen, Norway. Phone: +47 55 90 52 99, Fax: +47 55 90 51 45, e-mail: [email protected] Key words: fatty acids, lipid level, rapeseed oil, capelin oil, palm oil, linseed oil, sensory analysis, tailoring, flesh quality
-
Upload
independent -
Category
Documents
-
view
0 -
download
0
Transcript of Tailoring of Atlantic Salmon ( Salmo salar L.) Flesh Lipid Composition and Sensory Quality by...

Tailoring of Atlantic salmon (Salmo salar L.) flesh lipid composition
and sensory quality by replacing fish oil with a vegetable oil blend
Bente E. Torstensena*, J. Gordon Bellb,
Grethe Rosenlundc, R. James Hendersonb, Ingvild E. Graffa, Douglas R. Tocherb, Øyvind Liea
& John R. Sargentb
aInstitute of Nutrition and Seafood Research, N-5817 Bergen, Norway
bInstitute of Aquaculture, University of Stirling, Stirling FK9 4LA, Scotland, UK
cNutreco Aquaculture Research Centre A/S (ARC), Stavanger, Norway
Running title: TAILORING OF ATLANTIC SALMON FLESH
*Corresponding author: Dr Bente E. Torstensen, National Institute of Nutrition and Seafood Research (NIFES), P.O. Box 2029 Nordnes, N-5817 Bergen, Norway. Phone: +47 55 90 52 99, Fax: +47 55 90 51 45, e-mail: [email protected]
Key words: fatty acids, lipid level, rapeseed oil, capelin oil, palm oil, linseed oil, sensory analysis, tailoring, flesh
quality

Abstract 1
Atlantic salmon (Salmo salar L.) juveniles were fed either 100% fish oil (FO), 75% vegetable 2
oil (VO) or 100% VO throughout their life cycle to harvest weight followed by a finishing 3
diet period when all groups were fed 100% FO. The two experimental VO diets were tested at 4
two different locations against the same control diet (100% FO) (Scotland and Norway). The 5
VO blend was composed of rapeseed oil, palm oil and linseed oil using capelin oil as a control 6
for fatty acid class compositions. Flesh fatty acid profiles were measured regularly throughout 7
the experiment, with the times of sampling determined by changes in pellet size/lipid content 8
and fish life stage. Growth and mortality rates were not significantly affected by dietary fatty 9
acid compositions throughout the life cycle, except during the seawater winter period in 10
Norway when both growth and protein utilisation were increased in salmon fed 100% VO 11
compared to 100% FO. Flesh fatty acid composition was highly influenced by that of the diet, 12
and after the finishing diet period the weekly recommendations of VLCn-3 PUFA for human 13
health were 80 % and 56 % satisfied by a 200 g meal of 75% VO and 100% VO flesh, 14
respectively. No effect on flesh astaxanthin levels was observed in relation to changing 15
dietary oil sources. Sensory evaluation showed only minor differences between salmon flesh 16
from the dietary groups although prior to the finishing diet period, flesh from 100% VO had 17
less rancid and marine characteristics, and was preferred over flesh from the other dietary 18
groups by a trained taste panel. After the finishing diet period the levels of typical vegetable 19
oil fatty acids in flesh were reduced whereas those of VLCn-3 PUFA increased to levels 20
comparable with a 100% FO fed salmon. No differences in any of the sensory characteristics 21
were observed between dietary groups. By blending VO’s to provide balanced levels of 22
dietary fatty acids up to 100% of the fish oil can be replaced by the VO blend without 23
compromising growth or flesh quality. At the same time 75 % of the dietary fish oil can be 24

3
replaced without compromising flesh VLCn-3 PUFA content, thereby, providing beneficial 25
nutritional profile for human consumption. 26
27
28
Abbreviations: VLCn-3 PUFA: Very Long Chain n-3 Polyunsaturated Fatty acids 29
(EPA+DHA); VO: Vegetable oil blend; FO: Fish oil; PCA: Principal Component Analysis; 30
PPV: Productive Protein Value; SGR: Specific Growth rate; TGC: Thermal Growth 31
Coefficient; FCR: Feed Conversion Ratio 32
33

4
Introduction 33
Atlantic salmon (Salmo salar L.) flesh has a naturally high content of very long chain n-3 34
polyunsaturated fatty acids (VLCn-3 PUFA) such as EPA (20:5n-3) and DHA (22:6n-3). It 35
has been suggested that these fatty acids are essential for protecting humans against cardiac 36
diseases (1) and that these VLCn-3 PUFA’s cannot be replaced by the shorter and less 37
unsaturated n-3 fatty acid, 18:3n-3; LNA (1). Further, salmon flesh lipid is naturally low in n-38
6 fatty acids and consequently has a high n-3/n-6 ratio which is recommended for promoting 39
human health (2). As capture fisheries decline, an increasing proportion of human fish 40
consumption is provided by aquaculture (3-5). In 2000 the global production of Atlantic 41
salmon was about 885 000 metric tonnes, and the production is expected to exceed 1 million 42
metric tonnes by 2005 (6). The aquaculture of salmonids (Atlantic salmon and rainbow trout 43
(Oncorhynchus mykiss)) currently accounts for 60 % of the total fish oil used in aquaculture 44
feeds with 70 % of world supply being used for all aquafeeds (6). By 2010, with continuing 45
growth in aquaculture estimates suggest 97 % of the global fish oil supply will be used in 46
aquafeeds (6). Thus, the decline in fisheries and the increase in aquaculture will make using 47
fish oil (FO) and fishmeal non-sustainable as feed ingredients in the very near future (7, 8). A 48
sustainable alternative to fish oil is vegetable oils (VO), and these are all devoid of VLCn-3 49
PUFA’s while the levels of 18:2n-6 and monoene fatty acids are usually high giving a low n-50
3/n-6 ratio. A number of studies have shown that complete or partial replacement of FO with 51
single VO’s, such as rapeseed oil, palm oil, linseed oil, soya oil in parts of the salmon growth 52
phase does not affect growth but does affect the fatty acid composition of the edible portion 53
(9-16). Other quality aspects of Atlantic salmon fillet, such as colour, liquid holding capacity 54
(17) and moisture levels (14) have been reported to be affected by dietary VO. However, 55
organoleptic properties of salmonid flesh after VO feeding have been contradictory with 56
reports both of significant effects (18-20) and no effects (21-23) of dietary VO feeding on 57
5
sensory parameters. The visual colour and carotenoid concentrations of salmon flesh have 58
also been reported both to be affected (17) and unaffected (9, 13) by replacing dietary FO 59
with VO. 60
61
Although salmon flesh fatty acid compositions have been shown to be closely correlated with 62
dietary fatty acids (9, 12, 14, 15, 24), other metabolic regulators may influence flesh fatty acid 63
composition. This includes fatty acid digestibility (15, 25, 26), preferential catabolism of 64
certain fatty acids (13, 27, 28), desaturation and elongation of dietary fatty acids (29-32). 65
Thus, if possible, a FO replacement should aim towards a fatty acid composition favouring 66
high digestibility and retention of VLCn-3 PUFA, high levels of fatty acids preferred for 67
catabolism and high levels of precursor fatty acids for elongation and desaturation to VLCn-3 68
PUFA. Concomitantly, n-6 fatty acid levels should be kept low to maintain a high n-3/n-6 69
ratio and high VLCn-3 PUFA beneficial to human health (33). 70
71
Capelin oil, which a typical Northern hemisphere FO most frequently used in Atlantic salmon 72
aquaculture feeds, generally has high levels of the long chain monounsaturated and saturated 73
fatty acids and VLCn-3 PUFA’s. By using capelin oil as a control, a fatty acid composition 74
formulated by mixing different VO’s to provide similar levels of the different fatty acid 75
classes (saturated, monounsaturated and polyunsaturated n-3 fatty acids) may be better 76
physiologically for salmon health and welfare. Thus, even at 75 or 100% replacement a 77
balanced fatty acid composition should be more beneficial compared to the more extreme 78
fatty acid compositions obtained by replacing FO with a single VO as demonstrated in 79
previous studies (9-16). The aim of the current study was to investigate the effects of 75 % 80
and 100 % replacement of FO, by a VO blend based on capelin oil as a control, on Atlantic 81
salmon growth, feed utilisation and final flesh product quality. The dietary trial was 82
6
conducted through a complete Atlantic salmon life cycle followed by a period with a FO 83
finishing diet and tested at two different locations (Scotland and Norway). 84
85

7
Materials and Methods 85
Animals and diets 86
The effect of replacing FO with vegetable oil (VO) at two replacement levels (75 and 100 %) 87
was investigated in Atlantic salmon in a trial conducted over an entire two year production 88
cycle. As the trial was both large scale and long term, it was carried out as a collaboration 89
between the Institute of Aquaculture, University of Stirling, Scotland, and the National 90
Institute of Nutrition and Seafood Research, Bergen, Norway, with the 75% replacement diet 91
tested in Scotland and the 100% replacement tested in Norway, with the control FO diet 92
replicated at each site. The diets were fed to triplicate tanks/cages from April 2002 and the 93
experiments were performed using identical culture conditions other than the obvious 94
environmental differences such as water temperature and day length. In Scotland, the trial 95
was carried out at Marine Harvest Ltd. facilities at Invergarry, Highland (freshwater) and 96
Loch Duich, Highland (seawater), and in Norway, the entire trial was conducted at the 97
Nutreco Aquaculture Research Centre, Lerang Research Station, Stavanger. At each site, 98
Atlantic salmon fry were distributed randomly into 6 tanks (3m x 3m, depth 0.5m) at a 99
stocking level of 3000/tank, and weaned onto extruded feeds containing 20% added oil which 100
was either fish oil (FO; capelin oil (Norsildmel, Norway)) or a VO blend, containing rapeseed 101
oil (Oelmuhle, Germany), palm oil (Denofa, Norway) and de-gummed linseed oil (NV 102
Oliefabriek, Belgium) in a 3.7 : 2 : 1 ratio, replacing 75% or 100% of the FO. Fish were fed 103
the diets described above for around one year until sea water transfer, at which point fish 104
(average weight ~ 50 g in Scotland and ~ 120 g in Norway) were transferred into 5m x 5m x 105
5m net pens at 700 fish/pen. The fish were fed the same diet in seawater as in freshwater 106
although the dietary oil levels were increased to 25% (3mm pellet) rising to 32% (9mm 107
pellets) through the year long seawater phase (22 months in Norway and 25 months in 108
Scotland) including the finishing diet phase lasting for an additional 5 months in Norway and 109

8
6 months in Scotland, where all dietary groups were fed a 100% FO based diet. The diets 110
aimed to be practical and therefore were formulated according to current practices in the 111
salmon feed industry (Table 1) and were manufactured by Nutreco ARC, Stavanger, Norway. 112
All diets were formulated to satisfy the nutritional requirements of salmonid fish (34). The 113
measured proximate and fatty acid compositions of the diets are given in Table 2. 114
115
In Norway, the diets were fed to satiation by hand and the exact amounts consumed were 116
recorded. In Scotland, the diets were supplied by automatic feeders controlled by an 117
automated feeding sensor system (Arvo-tec, Sterner AquaTech UK, Inverness). Mortalities 118
were recorded and dead fish removed daily. 119
120
Sampling 121
Samples were taken from all diets and stored at -20°C. Fish were not fed during the 24 h prior 122
to sampling. In Norway ten fish were sampled randomly from each tank and anaesthetised 123
with MS222 (7 g/l, Norsk Medisinaldepot, Oslo, Norway). In Scotland, four fish were 124
sampled per tank/pen until the final and wash out points at which six fish per pen were 125
sampled. Samplings were done when pellet size and hence dietary lipid level changed and 126
during smoltification, which was respectively 6, 9, 14, 16 and 22 months after start of feeding 127
in Norway, and 6, 9, 12, 14, 17, 21 and 25 months after start of feeding in Scotland. For total 128
lipid, fatty acid composition and astaxanthin analysis prior to the finishing diet period, the 129
Norwegian quality cut (NQC) from salmon sampled from each tank were pooled and 130
homogenised and frozen on dry ice. During the finishing diet period pooled samples of NQC 131
from 3 fish per net pen (6 fish/pen in Scotland, pooled as 2 groups of 3) were sampled for 132
analysis. All samples were stored at -80°C. 133

9
134
Proximate composition of diets 135
Dry matter in the diets was measured gravimetrically after freeze-drying of homogenised 136
samples for 48 hours. Total nitrogen was determined on homogenised, freeze-dried samples 137
using a nitrogen determinator (LECO, FP-428 system 601-700-500; Perkin Elmer Coop., Ct, 138
USA). Protein was calculated as N x 6.25. Total lipid of the diets and fillet was measured 139
gravimetrically as described by Lie and co-workers (35) after ethyl acetate extraction and 140
after acid hydrolysis of the diet samples. 141
142
Lipid extraction and fatty acid analysis 143
Total lipid was extracted from salmon flesh NQC by homogenization in chloroform/methanol 144
(2:1, v/v) 19:0 methyl ester as internal standard (Norway), basically according to Folch et al. 145
(36). Fatty acid methyl esters (FAME) were prepared from total lipid by either acid-catalyzed 146
transesterification, with FAME extracted and purified as described previously (37) (Scotland) 147
or by boron trifluoride following saponification essentially as described by Lie et al. (38) and 148
Torstensen et al (28) (Norway). In Scotland FAME were separated and quantified by gas-149
liquid chromatography with on-column injection using a Thermo Finnegan, Trace 2000 GC 150
(Thermoquest, Hemel Hempstead U.K.) equipped with a fused silica capillary column (ZB 151
wax; 30m x 0.32 mm id.; Phenomenex, Macclesfield, U.K) with helium as carrier gas and 152
temperature programming was from 50oC to 150oC at 40oC/min and then to 195oC at 153
1.5oC/min, and finally to 220oC for 2 min. In Norway, a Thermo Finnegan Trace 2000 GC 154
equipped with a fused silica capillary column was used (CP-sil 88; 50m x 0.32 mm id.; 155
Chrompak Ltd.) with temperature programming of 60°C for 1 minute, 160°C for 28 minutes, 156
190 °C for 17 minute, and finally 220°C for 10 minutes with all intervening temperature 157

10
ramps being at 25 oC/min. Individual methyl esters were identified by comparison to known 158
standards and by reference to published data (39). Data were collected and processed using 159
the Chromcard for Windows (version 1.19) computer package (Thermoquest Italia S.p.A., 160
Milan, Italy) (Scotland) or using the Totalchrom software (ver. 6.2, Perkin Elmer) (Norway). 161
162
Astaxanthin analysis 163
Norway: All-trans and 9&13-cis astaxanthin were measured in fish muscle using a procedure 164
modified from Bligh and Dyer (40) by Bjerkeng et al (41). Briefly, homogenised fish muscle 165
was extracted using a water:methanol:chloroform (1:1:3) solution. An aliquot of the 166
astaxanthin containing chloroform phase was evaporated under N2 and redissolved in hexane. 167
Quantitative analysis of astaxanthin from flesh was performed using an HPLC system 168
consisting of a Spectra-Physics 8810 LC pump, a Gilson 234 Autoinjector, a Spectra-Physics 169
770 UV-VIS detector coupled with a Spectra-Physics Wavelength drive SFA 339, a 170
Supelcosil 5 µm LC-CN column (25 cm x 4,6 mm), ”Xtra Chrom” software (HP/Nelson 171
analytical) and eluted isocratically using n-heptane:isopropylacetate:acetone:ethanol 172
(84.5:10:4:1.5) at 2.75 ml min-1. Quantification of astaxanthin was performed using an 173
external standard method where standard solutions prepared from crystalline all-trans-174
astaxanthin (Hoffman LaRoche, Oslo, Norway) were measured with a spectrophotometer 175
(UV-260, Shimadzu, Japan) using a molar absorptivity in hexane of E1%1cm = 2100 at λmax = 176
472 nm for astaxanthin. The retention time for all-trans astaxanthin was 2.9 minutes and 177
detection wavelength was 470 nm. 178
179
Scotland: Astaxanthin was extracted from salmon muscle largely by the method of Barua et 180
al. (27). Tissue samples were homogenised in 5 ml of absolute ethanol and 5 ml of ethyl 181
acetate using an Ultra-Turrax tissue disrupter. The homogenate was centrifuged (1000 x g, 5 182

11
min) and the supernatant removed to a stoppered glass tube. The pellet was rehomogenised in 183
5 mL of ethyl acetate and recentrifuged, and the supernatant was combined with the first 184
supernatant. Finally, the pellet was rehomogenised in 10 mL of hexane and recentrifuged, 185
and the supernatant combined with the pooled supernatant. The pooled supernatant was dried 186
under N2 and vacuum desiccated for 2 h before redissolving the residue in 2 mL of hexane 187
containing 0.2% (w/v) BHT. Measurement of astaxanthin (Ax) was carried out using a 5-µm 188
Luna ODS2 column (4.6 x 150 mm, Phenomenex, Macclesfield, U.K.). The chromatographic 189
system was equipped with a Waters Model 501 pump and astaxanthin was detected at 470 190
nm using a Waters 490E multiwavelength UV/vis detector [Millipore (U.K.), Watford, U.K.]. 191
An isocratic solvent system was used containing ethyl acetate/methanol/water (20:72:8 192
v/v/v) at a flow rate of 1 mL/min. Ax was detected at 470 nm and quantified using an 193
external standard of Ax obtained from Roche (Heanor, U.K.). 194
195
Sensory analysis – objective and subjective tests using taste panels 196
Fish was sampled for sensory analysis in January and June 2004 (Norway), i.e. before and 197
after finishing diet period. Further, fish both from Scotland and Norway were sampled in 198
February 2004 (after 23 months of feeding; before finishing diet period) for sensory analysis 199
performed in Scotland. For the sensory analysis in Scotland fresh cooked fillets was assessed 200
from the two locations and smoked salmon was assessed for 100% FO (S) and 75% VO. Two 201
fish from each dietary group were chilled in ice slurry and killed by a blow to the head and 202
cutting the gills. Gutted, chilled salmon were then shipped on ice to Food Industry Forum 203
(FIF), Queen Margaret University College, Edinburgh. A trained panel performed 204
Quantitative Descriptive Analysis (QDA) methods to profile each salmon in terms of sensory 205
attributes related to smell, appearance, texture and flavour. For each of the 12 sensory 206
attributes of this QDA test, a two-anchored (e.g. soft and firm) linear scale (0-10) was used, in 207

12
which the score of five is the mid-point. This scale is objective and has nothing to do with the 208
like or dislike of a given panellist. 209
210
The trained panel was also asked to be subjective and score their degree of like or dislike 211
(preference) for each attribute of each sample (two fish from each dietary group both from 212
Norway and Scotland; Table 6) on another linear scale (0-10). On this scale, scores have the 213
following meanings: 214
0 = extremely disliked, 10 = extremely liked and score of 5 = the mid-point (which indicates 215
that an attribute was neither liked nor disliked). For example, all scores of above 5 are on the 216
liked side of the preference scale. The trained panellists have been taught to be more 217
discerning than the average consumer. 218
219
In Norway three salmon from each group of 100% FO and 100% VO (totally 9 from each 220
dietary treatment) were chilled in ice slurry and killed by cutting the gills. Gutted, chilled 221
salmon were then shipped on ice to MATFORSK, Ås, Norway, and evaluated on the 222
following day for Quality - Descriptive - Analysis, ISO 6564:1985 E, by testing 23 sensory 223
attributes by 11 judges. On arrival the salmon was filleted, and 6 fillet samples with a 224
thickness of 2.5 cm from each fish fillet was put in coded diffusion tight plastic bags and 225
vacuumed. Prior to the sensory evaluation the fillet samples were heated in a water bath at 226
75°C for 30 minutes. The samples were served to the sensory panel in steel containers on a 227
heated plate at 65°C. The cooked fillet samples were served to the sensory panel in a 228
randomised manner regarding dietary group of salmon, judge and replicates. Six samples 229
were served in each session. For each sensory parameter the grading is from 1.0 = no intensity 230
up to 9.0 = distinct intensity. 231
232

13
Statistics 233
The sensory attributes of salmon flesh were analysed using SIRIUS for Windows (Version 234
6.5). The purpose of PCA is to express the main information in the variables by a lower 235
number of variables, the so-called principal components (PC1, PC2, ...). A high positive or 236
negative loading reveals a significant variable in the actual PCA model. Score plots from the 237
PCA explore the main trends in the data, and their respective loading reveal variables with a 238
significant loading. The samples with similar sensory attributes are located in the same area in 239
the score plot. These classes are indicated in Figure 5 by circles drawn freehand. Since 240
samples with the same sensory attributes will be located on top of each other, to ease 241
interpretation of the samples the classes contained are written beside the circle. Differences 242
between the dietary treatments through the feeding experiment and after finishing diet period 243
were analysed by Breakdown & 1-way ANOVA followed by Tukeys HSD test, using 244
CSS:Statistica (version 6.1; StatSoft Inc.). The significance level was set to P ≤ 0.05, and 245
data are presented as mean ± STD (n=3 or otherwise stated). 246
247
Calculations 248
Specific growth rate (SGR%) = {exp[ln W2 – ln W1)/(T2 – T1)]-1} x 100, where W1 and W2 249
are initial and final body mass in g, and T2-T1 is sum experimental days. 250
Feed conversion ratio (FCR) = g dry feed eaten / g live weight gain 251
Thermal growth coefficient (TGC) = ((W2 0.333 – W1 0.333)/(∑ ºC)) x 1000, where W1 and W2 252
are initial and final bodymass in g and ∑ ºC are sum day-degrees in the experiment (43). 253
Protein productive value (PPV) = g retained protein (g protein intake)-1 254
255
256

14
Results 256
In freshwater, the control diet (FO), formulated with 100% FO, contained approximately 20% 257
of the total fatty acids as saturated fatty acids, mainly 16:0 and 14:0, and almost 60% as 258
monounsaturated fatty acids over half of which were the long chain monounsaturated fatty 259
acids, 20:1 and 22:1. Polyunsaturated fatty acids of the n-6 and n-3 series accounted for 4.4% 260
and 15%, respectively of the total diet fatty acids. 18:2n-6 was the predominant n-6 fatty acid 261
and within the n-3 fatty acids 20:5n-3 and 22:6n-3 were present in approximately equal 262
amounts, and less than 1% was 18:3n-3 (Table 2). Replacement of FO with the vegetable oil 263
blend resulted in increased percentages of 18:3n-3, 18:2n-6 and 18:1n-9 with concomitant 264
decreased proportions of n-3HUFA, 20:1, 22:1 and total monoenoic fatty acids. These effects 265
were quantitatively greater in the diet with the higher level of FO replacement, diet 100% VO. 266
The FO diet in seawater was characterized by having lower 20:1 and higher 22:6n-3 267
compared to the freshwater phase due to seasonal variation in batches of capelin oil. 268
However, replacement of FO with the VO blend had similar effects in seawater diets as in the 269
freshwater diets except total levels of monounsaturated fatty acids were unchanged by 270
substitution in seawater diets whereas there was a 9 percent point decrease in the freshwater 271
diets (Table 2). The vegetable oil (VO) blend was formulated to mimic FO in total saturated, 272
monounsaturated and polyunsaturated fatty acid content, but with no HUFA, and this was 273
largely achieved, particularly in the seawater diets. 274
275
Growth, feed efficiency and mortality 276
There was no significant difference in SGR, FCR or TGC between 100% FO and 75% VO in 277
Scotland or between 100% FO and 100% VO in Norway in the freshwater or seawater period 278
(Table 3). In Norway the Atlantic salmon fed the experimental diets increased their weights 279
from 0.16 g at start feeding to 76 g in October 2002 and to 103 g before seawater transfer 280
15
(Figure 1). After seawater transfer, the salmon fish weight increased to 890 g after 6 months 281
in the sea, and there were no significant differences in growth between salmon fed 100% FO 282
and 100% VO up to this time point (Figure 1). However, after almost 1 year in seawater the 283
100% VO fed fish had significantly higher weight (2.7 kg) compared to the 100% FO fed fish 284
(2.3 kg) (Figure 1). Concomitantly, in the same period when the mean fish weight differences 285
appeared in Norway (from October 2003 to January 2004) the feed efficiencies were poor 286
(100% FO: 2.8±0.3; 100% VO: 1.9±0.4), and the Protein Productive Value (PPV) was 287
generally very low, however significantly higher (p=0.02) in the 100% VO group (0.15±0.03) 288
compared to the 100% FO group (0.09±0.01). Concomitantly, whole fish protein levels were 289
not significantly different between the dietary groups, and increased from 31% to 38% from 290
August 2003 to January 2004 (results not presented in detail). It is noteworthy, however, that 291
both PPV and feed efficiencies are merely estimates since feed collection was not conducted 292
in this feeding experiment. The specific growth rate (SGR) and feed conversion ratio (FCR) 293
varied through the experiment with high growth rates in high temperature periods, and lower 294
SGR when temperatures decreased during winter time (detailed data not shown). The mean 295
growth was significantly higher in Norway (where heated water was used in the freshwater 296
period) compared to Scotland (Table 3). Thus, the salmon weights at smoltification and 297
seawater transfer were significantly higher in Norway giving an advantage for growth in the 298
sea water period in Norway (Figure 1). There were, however, no significant differences in fish 299
weights (approximately 2.5 kg) between the two locations at the final sampling (after 22 300
months in Norway and 25 months in Scotland). 301
302
The finishing diet period lasted for 5 months in Norway, and for 6 months in Scotland. 303
Further, the finishing diet period in Scotland included the summer 2004 with higher water 304
temperatures and hence high growth giving a final weight of 5.5 kg compared to 305

16
approximately 4.5 kg mean salmon weight after finishing diet period in Norway (Figure 1). 306
Mortalities were low throughout the experiment, and no significant differences were observed 307
between the dietary groups at both locations. 308
309
Flesh lipid composition 310
The lipid content of the flesh (Table 4 and 5) after 6 months of feeding was 3.1-4.9 % (w.w.), 311
and was higher in the Scottish fish (4.1-4.9%, w.w.) compared to the Norwegian fish (3.1-312
3.2%, w.w.) (Table 5). Thereafter, at all subsequent sampling points during the feeding 313
experiment, salmon from the Scottish location had consistently higher flesh lipid levels 314
compared to salmon from Norway (Table 4 and 5). Flesh lipid level from fish at both 315
locations dropped around smoltification prior to sea water transfer followed by an increase 316
after transfer to sea water. The sampling after 16 (N) and 17 (S) months was an exception 317
with the fish from Norway having significantly higher flesh lipid levels than their Scottish 318
counterparts (Table 5). These data correlate with the highest difference in fish weight at this 319
sampling point between the two locations (about 200 g in Scotland and 1.4 kg in Norway; 320
Figure 1). At the final sampling prior to finishing diet period, at both locations, there were no 321
major differences in flesh lipid content between FO and VO groups (Table 5). Although the 322
100% FO groups from the two locations were significantly different (12.6 % (S) and 8.7 % 323
(N)), flesh lipid levels from 75% VO and 100% VO fed fish were similar with approximately 324
10 % lipid w.w (Table 5). Throughout the finishing diet period however, the total lipid level 325
gradually increased in the two dietary groups in Scotland, whereas there was a gradual 326
decrease in the 100% VO fed fish in Norway resulting in significantly different flesh lipid 327
levels between the dietary treatments at the two locations at the end of the finishing diet 328
periods (Table 5, Figure 2). In the FO group in Norway, however, flesh lipid levels first 329
increased followed by a decrease towards the final finishing diet sampling (Figure 2). 330

17
Through both the freshwater and seawater phases the flesh fatty acid composition closely 331
reflected that of the diet (Table 4 and 5). After only 6 months of feeding in freshwater, the 332
flesh fatty acids reflected the dietary fatty acids and the relative levels of all fatty acids, with 333
the exception of 22:6n-3 and the total n-3PUFA, were significantly different in the 100% FO 334
groups compared to either 75% VO or 100% VO, respectively (Table 4). Also, the flesh fatty 335
acids in the two VO replacement groups were significantly different for all fatty acids except 336
for the VLCn-3 PUFA. Furthermore, the n-3/n-6 ratio was the same in flesh from salmon fed 337
75% VO and 100% VO after 6 months of feeding (Table 4). From 6 months onwards the 338
differences in fatty acid composition between the 100% FO, 75% VO and 100% VO became 339
more obvious and the variation, especially in 18:1n-9, 18:2n-6, 18:3n-3, VLCn-3 PUFA 340
became greater with length of feeding period and increasing fish weights (Table 4 and 5). 341
During the smoltification period, only observed in the salmon in Scotland, fatty acid 342
compositions showed increasing VLCn-3 PUFA and decreasing 18:2n-6, 18:1n-9 and 18:3n-3 343
compared to the previous and following sampling points (Table 4 and 5). These alterations in 344
relative fatty acid composition seen during the smoltification period, disappeared with further 345
growth and feeding and probably reflect physiological changes induced by the smoltification 346
process (Table 5). 347
348
Flesh fatty acids through the finishing diet period 349
The relative fatty acid composition in the 75% VO and 100% VO changed towards that of the 350
100% FO flesh fatty acid composition through the finishing diet period (Table 5). The amount 351
(mg FA g-1 flesh) of 18:1n-9 decreased in the 75% VO and 100% VO fish through the 352
finishing diet period, and the amounts of both 16:0 and 18:1n-9 resulted at the same levels as 353
in the 100% FO group (Figure 2). The amount of 18:2n-6 and 18:3n-3 decreased significantly 354
in both 75% VO and 100% VO fed fish, however they were still significantly higher than the 355

18
100% FO group at the end of the finishing diet period. At relative fatty acid basis, the level of 356
18:2n-6 decreased with 5 percent points in both the 75% VO and 100% VO groups whereas 357
the 100% FO groups were stable at 3 % in fillet from fish at both locations (Table 5). 18:3n-3 358
decreased with approximately 4 percent points in both vegetable oil groups, being 1.5 and 3.5 359
% higher in the 75% and 100% VO groups, respectively, compared to fillet from fish fed 360
100% FO through the experiment (Table 5). The difference between 100% FO and 75% VO 361
was only 1.4 mg 18:2n-6 g-1 flesh after the finishing diet period, compared to a difference of 362
6.5 mg 18:2n-6 g-1 flesh prior to the finishing diet period (Figure 2). The amount of VLCn-3 363
PUFA (EPA+DHA) in the 100% FO group increased by 3.5 mg g-1 flesh through the finishing 364
diet period (Figure 2). Over the same period the levels of VLCn-3 PUFA in the flesh of fish 365
originally fed 75% and 100% VO increased by 6.2 and 4.8 mg g-1, respectively. 366
Consequently, after the finishing diet period with all groups being fed 100% FO based diets 367
the 75% VO and 100% VO fish still contained significantly lower VLCn-3 PUFA levels (30% 368
and 50% lower, respectively) compared to the 100% FO group (Figure 2). Taking all the n-3 369
fatty acids together (18:3n-3 + VLCn-3 PUFA) gave a flesh n-3/n-6 ratio which was still 370
significantly higher in the 100% FO fed fish after the finishing diet compared to flesh from 371
the two VO groups (Figure 2). 372
373
Flesh astaxanthin 374
Flesh total astaxanthin increased gradually during growth in seawater (Figure 3). No 375
significant differences between 100% FO and VO fed fish was observed at either location. 376
The amount of astaxanthin was generally slightly higher in salmon sampled in Scotland 377
compared to the Norwegian salmon (Figure 3). A dramatic increase in flesh astaxanthin 378
levels was observed from 25 to 31 months (finishing diet period) of feeding in Scotland. 379
380

19
Flesh sensory quality 381
The objective sensory taste panels showed no or only minor, but statistically significant, 382
differences, between 100% FO and VO fed salmon flesh (Figure 4 to 6). The taste panel in 383
Scotland detected no significant differences in any of the sensory attributes between salmon 384
fed 100% FO and 75% VO, either with fresh or smoked Atlantic salmon after 25 months of 385
feeding (Figure 4). The taste panel did however find statistically significant differences 386
between salmon fed 100% FO and 100% VO for 22 months in Norway (Figure 5 and 6 387
upper). Principal component analysis (PCA) show that flesh from salmon fed 100% FO form 388
a separate group from flesh from salmon fed 100% VO for 22 months (Figure 5 upper). 389
Intensity of odour, marine oil odour, colour tone, marine oil flavour and rancid flavour were 390
all given significantly higher score in fresh cooked flesh from salmon fed 100% FO compared 391
to 100% VO (Figure 6 upper). Vegetable oil flavour scored significantly higher in the 100% 392
VO fed group compared to the 100% FO salmon (Figure 6 upper). After the finishing diet 393
period (27 months of feeding) when both dietary groups were fed the 100% FO diet, all 394
sensory parameters were equal, demonstrated both by the PCA plot where no distinct groups 395
were formed (Figure 5 lower) and the figure of sensory parameter scores (Figure 6 lower). 396
397
In the preference test with scores from 0 to 10 where 0 was extremely disliked and 10 was 398
extremely liked, no major differences were observed between flesh from the different dietary 399
groups (Table 6). However, a ranking test generally showed that flesh from the salmon fed 400
100% VO was preferred over the other groups. 401
402
403

20
Discussion 403
The aim of this study was to replace 75% and 100% of fish oil in diets with a vegetable oil 404
blend throughout the complete life cycle of Atlantic salmon to evaluate the effects of the 405
substitution on growth, flesh nutritional and sensory quality, consumer acceptance and 406
consequences as a health- promoting sea food product for humans. For the first time dietary 407
fish oil has been replaced partially and completely through the whole life cycle at two 408
different locations, and shown to produce the same results. With both levels of VO 409
replacement examined growth was high and either not significantly different from that of the 410
100% FO group, or as in the case of the sampling after 22 months of feeding 100% VO in 411
Norway, significantly higher mean fish weight compared to the 100% FO group. This 412
observed higher mean fish weight after 22 months in Norway correlated with higher protein 413
utilisation (PPV) in the 100% VO group compared to the 100% FO indicating that during the 414
late autumn and winter period of the sea water growth phase the fatty acid composition of the 415
100% VO diet favoured protein growth and spared dietary protein from energy production. 416
Previously, dietary lipid content, but not dietary oil source (15, 44), has been shown to affect 417
protein utilisation, growth rate, muscle lipid level and feed conversion (45, 46). The results 418
found in this study, which is supported by Bendiksen and co-workers (47) indicate that a 419
dietary fatty acid composition favouring lipid catabolism, and sparing dietary protein for 420
muscle growth, may manifest itself during certain stages in the growth/life cycle, especially 421
during seasons with generally low growth rates such as the winter time following a high 422
growth rate period. The significantly increased PPV and growth in the 100% VO group may 423
be due to increased digestibility of dietary lipid and protein in the VO diet at low 424
temperatures, as previously shown by Bendiksen et al (47). However, feed intake data and 425
thus PPV and feed utilisation are estimates and not exact data, due to the lack of feed 426

21
collection in the current experiment, and can only be compared on a relative basis within this 427
study. 428
429
However, when considering growth as a whole through the freshwater and seawater phase, 430
no differences were found here in either growth, feed efficiency or survival between the 431
dietary groups examined, which is in line with previous reported results on vegetable oil 432
replacements in Atlantic salmon (9, 10, 12-15, 18). The higher growth in the freshwater 433
period seen in Norway was mainly due to the use of heated water in the on-shore fish tanks, a 434
system not used in Scotland where the fish were cultured at ambient water temperatures and 435
photoperiod. Consequently, the mean fish weight was significantly higher during 436
smoltification and sea water transfer in Norway compared to Scotland, in addition to an 437
earlier onset of smoltification in Norway. Furthermore, salmon in Scotland had higher growth 438
rates compared to the Norwegian salmon during the seawater period. Consequently, all 439
samplings were adjusted to life stage and mean fish weight, enabling results from the two 440
locations to be comparable and giving thorough and robust data for investigating effects of the 441
dietary vegetable oil replacements in Atlantic salmon, irrespective of location. In fact, mean 442
fish weight was approximately 2.5 kg (Figure 1) at the final sampling prior to initiation of the 443
finishing diet period at both locations. 444
445
In support of existing literature (9-11, 13, 26) describing feeding trials with post-smolt 446
salmon, the dietary fatty acid composition resulting from a blend of palm oil, rapeseed oil and 447
linseed oil used in the current dietary trial, had no adverse effects on lipid digestibility at any 448
stage in the life cycle affecting growth or feed efficiency, as has been reported for complete 449
replacement with palm oil (15). Further, the contribution of essential n-3 PUFA provided by 450
the LT fishmeal used in the diets was sufficient for meeting the requirement for Atlantic 451

22
salmon (48) even during potentially stressful early life stages and through smoltification. 452
Flesh fatty acids, however, were affected in the salmon sampled in Scotland after 12 months 453
of feeding just prior to sea water transfer with n-3 PUFA being significantly higher. This may 454
be due to a life stage-dependent increase in PUFA’s resulting from an increased activity of 455
hepatic desaturase and elongase activity which has been reported in the same fish in this 456
period (49). A similar increase in salmon from Norway may have been obscured due to the 457
use of artificial environmental conditions resulting in early smoltification. 458
459
Flesh lipid composition through the whole life cycle including a finishing diet period 460
The current results confirm the numerous previous reports (9-16, 50) of flesh fatty acid 461
composition being highly influenced by dietary fatty acids. By introducing a finishing diet 462
period when all groups were fed a 100% FO diet, the levels of VLCn-3 PUFA increased 463
whereas the typical VO fatty acids decreased to levels comparable with the 100% FO group. 464
Similar results have been reported previously after feeding a single level of VO followed by a 465
finishing diet (9, 12). The level of lipid in fillet increased with increasing fish size, which also 466
coincided with increasing lipid content in the feed as pellet size increased. Previously, both 467
dietary lipid content and fish size have been positively correlated with salmon flesh lipid 468
content (51, 52). The slight increase followed by a decrease observed in the salmon flesh in 469
Norway during the finishing diet period was not related to onset of sexual maturation but may 470
be related to the variable flesh lipid content often observed during periods of very low sea 471
water temperatures (47). In contrast, the finishing diet period in Scotland started in spring 472
followed by a high growth period through the summer until September 2004. Thus, these 473
salmon had a higher temperature growth period when flesh lipid gradually increased with 474
increasing fish weight (Figure 2). 475
476

23
The latest human n-3 intake recommendations of the International Society for the Study of 477
Fatty Acids and Lipids (ISSFAL; www.issfal.org) is 3.5 g EPA+DHA per week to provide 478
good cardiac health in adults. After 22/25 months of feeding, the VLCn-3 PUFA 479
(EPA+DHA) contents of a 200 g portion of flesh were 3.2, 1.5 and 1.0 g in salmon from the 480
100% FO, 75% VO and 100% VO groups, respectively. After the finishing diet period the 481
levels of VLCn-3 PUFA were 3.9, 2.8 and 2.0 respectively in the three dietary groups. Thus, 482
only one meal a week of 200 g flesh from salmon fed 100% FO through the whole life cycle 483
or 75% VO followed by a finishing diet will provide 110 % and 80%, respectively of the 484
weekly recommended intake. By feeding salmon 100% VO for 22 months followed by a 485
finishing diet, 56 % of the weekly recommended intake is being met by a 200g portion. It is 486
generally recommended that an increase in the n-3/n-6 ratio of human diets is achieved 487
largely by increasing the VLCn-3 PUFA intake, but also by decreasing the n-6 intake (2, 53, 488
54). After the finishing diet period the level of 18:2n-6 was still 2 fold higher in the flesh of 489
the 100% VO group than the 100% FO group, and contributed 1.6 g to a 200 g portion. 490
However, a less efficient dilution of 18:2n-6 than that observed in the current study was 491
reported by Torstensen et al (9) where the level of 18:2n-6 was 2.6 fold higher in salmon fed 492
100% rapeseed oil followed by a finishing diet for 6 months (1800 day degrees). Due to the 493
high levels of 18:3n-3 provided by the dietary linseed oil, the n-3/n-6 ratio in flesh from VO 494
fed salmon was not particularly low. However, marine VLCn-3 PUFA provides the health 495
beneficial effects for cardiovascular health, which seem to be lacking, or greatly reduced, with 496
18:3n-3 (1). Therefore, it is important to note that, although n-3/n-6 did not change more than 497
two-fold through the finishing diet period, the levels of 18:3n-3 decreased significantly while 498
VLCn-3PUFA levels increased producing an overall more beneficial product for human 499
consumption. 500
501

24
Flesh pigmentation is an important factor in perception of flesh quality in salmonids (55, 56). 502
The flesh levels of lipid soluble nutrients, such as astaxanthin are dependent on the dietary 503
composition (24), and it has been shown that both total lipid and type of oil can affect 504
carotenoid absorption (57, 58) and colour characteristics in raw and smoked fillets (17). 505
However, in this study no negative effects of using up to 100% VO was observed on flesh 506
astaxanthin levels, confirming previous results using single VO replacements (9, 10, 13). 507
Total flesh astaxanthin content was significantly higher after the finishing diet period in 508
Scotland compared to Norway, which was correlated to, and can be explained by, higher final 509
fish weight and flesh lipid content in Scotland. 510
511
Flesh sensory quality 512
Only marginal differences were observed in flesh sensory characteristics between the 100% 513
FO and 100% VO fed fish prior to the finishing diet period, in both fresh and smoked salmon. 514
However, some significant effects on marine and rancid flavour and odour were observed by 515
the Norwegian taste panel in fresh cooked salmon. There was a tendency towards the 516
Norwegian salmon, and especially salmon fed 100% VO, being preferred over the Scottish 517
salmon, however not statistically significant. It may be the decreased rancid and marine 518
flavour and rancid odour found in the 100% VO fed salmon which may have been preferred 519
by the Scottish taste panel. These effects may also have been influenced by the higher lipid 520
content, particularly of fish fed 100% FO from Scotland, compared to fish fed the same diet in 521
Norway. However, after the finishing diet period, even the trained taste panel could not detect 522
any differences between the 100% FO and 100% VO fed salmon. Previous experiments 523
replacing FO with a single level of VO, even at lower replacement levels, have reported 524
differences in “salmon taste and odour” (19), taste intensity, fattiness and juiciness (18), and 525
“fish aroma” (20). In contrast, other reports show no effects of replacing FO with VO on 526

25
organoleptic properties in other salmonids (22, 23), (also reviewed by (59)). Flesh sensory 527
quality for other aquaculture species, such as gilthead seabream (Sparus aurata) and seabass 528
(Dicentrarchus labrax) were slightly affected by replacing fish oil with either sunflower oil, 529
rapeseed oil, linseed oil or mix of these three, but were very well accepted by the trained 530
sensory panel (60). Also Turbot (Psetta maxima) flesh sensory quality was affected by 531
replacing FO with soybean oil or linseed oil (60). Supporting the current results, all 532
differences in sensory quality disappeared after a finishing diet period was used also in turbot 533
(61). 534
535
In conclusion, replacing dietary FO with both 75% and 100% VO blend containing balanced 536
levels of saturated, monounsaturated and polyunsatured fatty acids, from start feeding to 537
harvest weight, including a finishing diet period, allowed sustainable production of Atlantic 538
salmon with a profile of flesh fatty acids with typical fatty acid profiles that might benefit 539
human nutritional requirements without compromising sensory qualities or fish growth. 540
541 542
Acknowledgements 543
This experiment was part of the project, Researching Alternatives to Fish Oils in 544
Aquaculture” (RAFOA), Q5RS-2000-30058 funded by the EU Fifth Framework Programme. 545
The technical assistance of Mr Jacob Wessels, Ms Thu Thao Nguyen, Mrs Felicia Coulliard, 546
Mr Vidar Fauskanger and Mrs Trine Simonsen (NIFES) is greatly appreciated. Further, the 547
staff at Nutreco ARC’s Research Station, and especially Mrs Irene Lauvsnes, is 548
acknowledged for excellent fish husbandry. We would also like to acknowledge Mr Iain 549
Martin of the Loch Duich Fish Trials Unit for his expertise with fish husbandry. 550

References
1. Sanderson, P.;Finnegan, Y.E.;Williams, C.M.;Calder, P.C.;Burdge, G.C.;Wootton, S.A.;Griffin,
B.A.;Millward, D.J.;Pegge, N.C.;Bemelmans, W.J.E., UK Food standards agency alpha-linolenic acid
workshop report. Br. J. Nutr, 2002, 88, 573-579.
2. Simopoulos, A.P., n-3 fatty acids and human health: defining strategies for public policy. Lipids, 2001,
36, S83-89.
3. Organisation, F.a.A., Yearbook of Fisheries Statistics 2002. Capture Production, 2004, 94/2, FAO,
Rome, 206p.
4. Organisation, F.a.A., Yearbook of Fisheries 2002. Capture Production, 2004, 94/1 FAO, Rome, 654p.
5. Tidwell, J.H.;Allan, G.I., Fish as food; aquaculture's contribution. World Aquacult., 2002, 33, 44-48.
6. Tacon, A.G.J., Global trends in aquaculture and compound aquafeed production, in International
Aquafeed Directory and Buyer's Guide 2003, A.G.J. Tacon, Editor. 2003, Turret RAI: Uxbridge,
Middlesex, UK. p. 8-23.
7. Hardy, R.W., Fish feeds and nutrition - Alternatives to fish oil. Aquacult. Mag., 2001, July/AUg, 49-54.
8. Barlow, S., Fishmeal and oil: sustainable feed ingredients for aquafeeds. Global Aquacult. Advocate,
2000, 4, 85-88.
9. Torstensen, B.E.;Frøyland, L.;Ørnsrud, R.;Lie, Ø. Tailoring of a cardioprotective fillet fatty acid
composition of Atlantic salmon (Salmo salar) fed vegetable oils. Food Chem., 2004, 87, 567-580.
10. Bell, J.G.;Henderson, R.J.;Tocher, D.R.;McGhee, F.;Dick, J.R.;Porter, A.;Smullen, R.P.;Sargent, J.R.,
Substituting fish oil with crude palm oil in the diet of Atlantic salmon (Salmo salar) affects muscle fatty
acid composition and hepatic fatty acid metabolism. J. Nutr., 2002, 132, 222-230.
11. Bell, J.G.;McGhee, F.;Campbell, P.J.;Sargent, J.R., Rapeseed oil as an alternative to marine fish oil in
diets of post-smolt Atlantic salmon (Salmo salar): changes in flesh fatty acid composition and
effectiveness of subsequent fish oil "wash out". Aquaculture, 2003, 218, 515-528.
12. Bell, J.G.;Tocher, D.;Henderson, R.J.;Dick, J.R.;Crampton, V.O., Altered fatty acid compositions in
Atlantic salmon (Salmo salar) fed diets containing linseed and rapeseed oils can be partially restored by
a subsequent fish oil finishing diet. J. Nutr., 2003, 133, 2793-2801.
13. Bell, J.G.;McEvoy, J.;Tocher, D.R.;McGhee, F.;Campbell, P.J.;Sargent, J.R., Replacement of fish oil
with rapeseed oil in diets of Atlantic salmon (Salmo salar) affects tissue lipid compositions and
hepatocyte fatty acid metabolism. J Nutr, 2001, 131, 1535-1543.
27
14. Rosenlund, G.;Obach, A.;Sandberg, M.G.;Standal, H.;Tveit, K., Effect of alternative lipid sources on
long-term growth performance and quality of Atlantic salmon (Salmo salar L.). Aquacult. Res., 2001,
32, 323-328.
15. Torstensen, B.E.;Lie, Ø.;Frøyland, L., Lipid metabolism and tissue composition in Atlantic salmon
(Salmo salar L.) - Effects of capelin oil, palm oil, and oleic acid-enriched sunflower oil as dietary lipid
sources. Lipids, 2000, 35, 653-664.
16. Waagbø, R.;Sandnes, K.;Sandvin, A.;Lie, Ø. Feeding three levels of n-3 polyunsaturated fatty acids at
two levels of vitamin E to Atlantic salmon (Salmo salar). Growth and chemical composition. Fisk. Dir.
Skr., Ser. Ernaering, 1991, 4, 51-63.
17. Regost, C.;Jakobsen, J.V.;Rørå, A.M.B., Flesh quality of raw and smoked fillets of Atlantic salmon as
influenced by dietary oil sources and frozen storage. Food Res. Int., 2004, 37, 259-271.
18. Waagbø, R.;Sandnes, K.;Torrisen, O.J.;Sandvin, A.;Lie, Ø. Chemical and sensory evaluation of fillets
from Atlantic salmon (Salmo salar) fed three levels of n-3 polyunsaturated fatty acids at two levels of
vitamin E. Food Chem., 1993, 46, 361-366.
19. Thomassen, M.S.;Røsjø, C., Different Fats in Feed for Salmon: Influence on Sensory Parameters,
Growth Rate and Fatty Acids in Muscle and Heart. Aquaculture, 1989, 79, 129-135.
20. Skonberg, D.I.;Rasco, B.A.;Dong, F.M., Effects of feeding high monounsaturated sunflower oil diets on
sensory attributes of salmonid fillets. J. Aquatic Food Prod. Techn., 1993, 2, 117-133.
21. Guillou, A.;Soucy, P.;Khalil, M.;Adambounou, L., Effects of dietary vegetable and marine lipid on
growth, muscle fatty acid composition and organoleptic quality of flesh of brook charr (Salvelinius
fontalis). Aquaculture, 1995, 136, 351-329.
22. Hardy, R.W.;Scott, T.M.;L.W., H., Replacement of Herring Oil with Menhaden Oil, Soybean oil, or
Tallow in the Diets of Atlantic Salmon Raised in Marine Net-Pens. Aquaculture, 1987, 65, 267-277.
23. Koshio, S.;Ackman, R.G.;Lall, S.P., Effects of oxidised herring and canola oils in diets on growth,
survival, and flavour of Atlantic salmon , Salmo salar. J. Agric. Food Chem., 1994, 42, 1164-1169.
24. Lie, Ø. Flesh quality - the role of nutrition. Aquacult. Res., 2001, 32, 341-348.
25. Sigurgisladottir, S.;Lall, S.P.;Parrish, C.C.;Ackman, R.G., Cholestane as a digestability marker in the
absorbtion of polyunsaturated fatty acid ethyl esters in Atlantic salmon. Lipids, 1992, 27, 418-424.

28
26. Ng, W.-K.;Sigholt, T.;Bell, J.G., The influence of environmental temperature on the apparent nutrient
and fatty acid digestibility in Atlantic salmon (Salmo salar L.) fed finishing diets containing different
blends of fish oil, rapeseed oil and palm oil. Aquacult. Res., 2004, 35, 1228-1237.
27. Kiessling, K.-H.;Kiessling, A., Selective Utilization of Fatty acids in Rainbow trout (Onchorhychus
mykiss Walbaum) Red muscle Mitochondria. Can. J. Zool., 1993, 71, 248-251.
28. Torstensen, B.E.;Frøyland, L.;Lie, Ø. Replacing dietary fish oil with increasing levels of rapeseed oil
and olive oil - Effects on Atlantic salmon (Salmo salar) tissue and lipoprotein composition and
lipogenic enzyme activities. Aqua. Nutr., 2004, 10, 175-192.
29. Tocher, D.R.;Bell, J.G.;Dick, J.R.;Crampton, V.O., Effects of dietary vegetable oil on Atlantic salmon
hepatocyte fatty acid desaturation and liver fatty acid compositions. Lipids, 2003, 38, 723-732.
30. Tocher, D.R.;Agaba, M.;Hastings, N.;Bell, J.G.;Dick, J.R.;Teale, A.J., Nutritional regulation of
hepatocyte fatty acid desaturation and polyunsaturated fatty acid composition in zebrafish (Danio rerio)
and tilapia (Oreochromis niloticus). Fish Physiol. Biochem., 2002, 24, 309-320.
31. Tocher, D.R.;Bell, J.G.;MacGlaughlin, P.;McGhee, F.;Dick, J.R., Hepatocyte fatty acid desaturation
and polyunsaturated fatty acid composition of liver in salmonids: effects of dietary vegetable oil. Comp.
Biochem. Physiol. B, 2001, 130, 257-270.
32. Ruyter, B.;Roesjoe, C.;Maesoeval, K.;Einen, O.;Thomassen, M.S., Influence of dietary n-3 fatty acids
on the desaturation and elongation of [1- super(14)C] 18:2 n-6 and [1- super(14)C] 18:3 n-3 in Atlantic
salmon hepatocytes. Fish Physiol. Biochem., 2000, 23, 151-158.
33. Seierstad, S.L.;Seljeflot, I.;Johansen, O.;Hansen, R.;Haugen, M.;Rosenlund, G.;Frøyland, L.;Arnesen,
H., Dietary intake of differently fed salmon; the influence on markers of human atherosclerosis. Eur. J.
Clin. Invest., 2005, 35, 52-59.
34. Council, N.R., Nutrient Requirements of Fish. National Academy Press, Washington D.C., 1993.
35. Lie, Ø.; Waagbø, R.; Sandnes, K. Growth and chemical composition of adult Atlantic salmon (Salmo
salar) fed dry silage based diets. Aquaculture, 1988, 69, 343-353.
36. Folch, J.;Lees, M.;Sloane-Stanley, G.H., A simple method for the isolation and purification of total
lipids from animal tissues. J. Biol. Chem., 1957, 226, 497-509.
37. Tocher, D.R.;Harvie, D.G., Fatty acid composition of the major phosphoglycerides from fish neural
tissues; (n-3) and (n-6) polyunsaturated fatty acids in rainbow trout (Salmo gairdneri) and cod (Gadus
morhua) brains and retinas. Fish Physiol. Biochem., 1988, 5, 229-239.

29
38. Lie, Ø.;Lambertsen, G., Fatty acid composition of glycerophospholipids in seven tissues of cod (Gadus
morhua), determined by combined high-performance liquid chromatography and gas chromatography.
J. Chromat., 1991, 565, 119-129.
39. Ackman, R.G., Fish lipids. Advances in Fish Science and Technology,, ed. J.J. J.J. Connell. Vol. Part
1. 1980, Farnham: Fishing News Books. 87-103.
40. Bligh, E.G.;Dyer, W.J., A rapid method of total lipid extraction and purification. Can. J. Biochem.
Physiol., 1959, 37, 911-917.
41. Bjerkeng, B.;Refstie, S.;Fjalestad, K.T.;Storebakken, T.;Rødbotten, M.;Roem, A.J., Quality parameters
of the flesh of Atlantic salmon (Salmo salar) as affected by dietary fat content and full-fat soybean meal
as a partial substitute for fish meal in the diet. Aquaculture, 1997, 154, 297-309.
42. Wold, S.;Esbensen, K.;Geladi, P., Principal component analysis. Chemometrics and Int. Lab. Systems.,
1987, 2, 37-52.
43. Cho, C.Y., Feeding systems for rainbow trout and other salmonids with reference to current estimates of
energy and protein-requirements. Aquaculture, 1992, 100, 107-123.
44. Bendiksen, E.Å.;Berg, O.K.;Jobling, M.;Arnesen, A.M.;Måsøval, K., Digestibility, growth and nutrient
utilisation of Atlantic salmon (Salmo salar L.) in relation to temperature, feed fat content and oil source.
Aquaculture, 2003, 224, 283-299.
45. Arzel, J.;Martinez Lopez, F.X.;Metailler, R.;Stephan, G.;Viau, M.;Gandemer, G.;Guillaume, J., Effect
of dietary lipid on growth performance and body composition of brown trout (Salmo trutta) reared in
seawater. Aquaculture, 1994, 123, 361-375.
46. Arzel, J.;Cardinal, M.;Cornet, J.;Metailler, R.;Guillaume, J.C., Nutrition of brown trout (Salmo trutta)
reared in seawater, effect of dietary lipid on growth performances, body composition and fillet quality.
Spec. Publ. Eur. Aquacult. Soc., 1993, 19, 309.
47. Bendiksen, E.Å.;Berg, O.K.;Jobling, M.;Arnesen, A.M.;Måsøval, K., Digestibility, growth and nutrient
utilisation of Atlantic salmon (Salmo salar L.) in relation to temperature, feed fat content and oil source.
Aquaculture, 2003, 224, 283-299.
48. Ruyter, B., Fatty acid metabolism in Atlantic salmon. A focus on essential fatty acids. Thesis of Dr.
scient. University of Oslo, Norway., 1998, 10-37.

30
49. Zheng, X.;Torstensen, B.E.;Tocher, D.R.;Dick, J.R.;Henderson, R.J.;Bell, J.G., Environmental and
dietary influences on polyunsaturated fatty acid synthesis and expression of fatty acyl desaturase and
elongase genes in liver of Atlantic salmon (Salmo salar). Biochem. Biophys. Acta, 2005, In press.
50. Grisdale-Helland, B.;Ruyter, B.;Rosenlund, G.;Obach, A.;Helland, S.J.;Sandberg, M.G.;Standal,
H.;Roesjoe, C., Influence of high contents of dietary soybean oil on growth, feed utilization, tissue fatty
acid composition, heart histology and standard oxygen consumption of Atlantic salmon (Salmo salar)
raised at two temperatures. Aquaculture, 2002, 207, 311-329.
51. Hemre, G.I.;Sandnes, K., Effect of dietary lipid level on muscle composition in Atlantic salmon Salmo
salar. Aquacult. Nutr., 1999, 5, 9-16.
52. Torstensen, B.E.;Lie, Ø.;Hamre, K., A factorial experimental design for investigation of effects of
dietary lipid content and pro-and antioxidants on lipid composition in Atlantic salmon (Salmo salar)
tissues and lipoproteins. Aquacult. Nutr., 2001, 7, 265-276.
53. Simopoulos, A.P., Human requirement for n-3 polyunsaturated fatty acids. Poult. Sci., 2000, 79, 961-
970.
54. deDeckere, E.A.;Korver, O.;Verschuren, P.M.;Katan, M.B., Health aspects of fish and n-3
polyunsaturated fatty acids from plant and marine origin. Eur. J. Clin. Nutr., 1998, 52, 749-753.
55. Bell, J.G.;McEvoy, J.;Webster, J.L.;McGhee, F.;Millar, R.M.;Sargent, J.R., Flesh lipid and carotenoid
composition of Scottish farmed Atlantic salmon (Salmo salar). J. Agric. Food Chem., 1998, 46, 119-
127.
56. Refsgaard, H.H.F.;Brockhoff, P.B.;Jensen, B.H., Biological variation of lipid constituents and
distribution of tocopherols and astaxanthin in farmed Atlantic salmon (Salmo salar). J. Agric. Food
Chem., 1998, 46, 808-812.
57. Clark, R.M.;Furr, H.C., Absorption of canthaxanthin by the rat is influenced by total lipid in the
intestinal lumen. Lipids., 2001, 36, 473-475.
58. Clark, R.M.;Yao, L.;She, L.;Furr, H.C., A comparison of lycopene and astaxanthin absorption from
corn oil and olive oil emulsions. Lipids., 2000, 35, 803-806.
59. Rasmussen, R.S., Quality of farmed salmonids with emphasis on proximate composition, yield and
sensory characteristics. Aquacult. Res., 2001, 32, 767-786.
31
60. Izquierdo, M.S.;Obach, A.;Arantzamendi, L.;Montero, D.;Robaina, L.;Rosenlund, G., Dietary lipid
sources for seabream and seabass: growth performance, tissue composition and flesh quality. Aquacult.
Nutr., 2003, 9, 397-407.
61. Regost, C.;Arzel, J.;Robin, J.;Rosenlund, G.;Kaushik, S.J., Total replacement of fish oil by soybean or
linseed oil with a return to fish oil in turbot (Psetta maxima) 1. Growth performance, flesh fatty acid
profile and lipid metabolism. Aquaculture, 2003, 217, 465-482.

32
Legend to Figures
Figure 1 Mean Atlantic salmon weight (g) from start feeding to harvest in fish fed either
100% FO, 75% VO or 100% VO at two different locations (Scotland and Norway). *indicates
statistically significant differences between the dietary groups by 1-way ANOVA. Sea water
transfer is indicated by dotted (10 months, Norway) and continuous line (12 months,
Scotland).
Figure 2 The amount of 16:0, 18:1n-9, 18:2n-6, 18:3n-3, VLCn-3 PUFA (EPA+DHA), n-3/n-
6 ratio (mg g-1 flesh, w.w.), total flesh lipid (g 100g-1, w.w.), and fish weight (g) through fresh
water and sea water period for Atlantic salmon fed either 100% FO (N; Norway and S;
Scotland), 75% VO (Scotland) or 100% VO (Norway), and through the finishing diet period
when all groups were fed a 100% FO finishing diet. Time of feeding (x-axis) refers to the
number of months of feeding after start feeding, and time points when fish weight and life
stage correlates between the two locations are presented together as N/S. Data are presented
as mean ± std. Different letters denote statistically significant differences between the four
dietary groups at the final time point of finishing diet period identified by 1-way ANOVA.
Figure 3 Total astaxanthin (mg kg-1, w.w.) in flesh from Atlantic salmon fed either 100% FO,
75% VO or 100% VO from start feeding to harvest at two different locations (Scotland and
Norway). Sea water transfer is indicated by dotted (10 months, Norway) and continuous line
(12 months, Scotland)
Figure 4 Sensory attributes of smoked salmon (Scotland) after 25 months of feeding Atlantic
salmon either 100% FO or 75% VO.

33
Figure 5 Principal Component Analysis (PCA) Biplot of fillet samples from Atlantic salmon
fed either 100% FO or 100% VO from start feeding and with the sensory attributes before
(January 2004; upper figure) and after (June 2004; lower figure) finishing diet period with
100% FO.
Figure 6 Sensory characteristics score of fillets from Atlantic salmon fed either 100 % VO or
100% FO from start feeding both before (January 2004; upper figure) and after (June 2004;
lower figure) finishing diet period. The salmon were fed 100% FO or 100% VO for 22
months followed by 5 months of 100% FO diet. Significant differences between the dietary
treatments are denoted by *.

34
Table 1 Composition of the different basal diets (according to pellet size mm; g kg-1).
Pellet Size (mm) Ingredients 0.3-2.0 3
FW1 2.0 FW
3.0 FW
3.0 SW2
4.0 SW
6.0 SW
9.0 SW
Fish meal, (LT Nordsildmel, Norway)
672 567 553 147 386
Fish meal,(Consortio, Peru) 407 506 473 Corn gluten (Cargill, USA) 100 100 100 100 100 100 Soybean meal extracted (Denofa, Norway)
54 100 100 100
Wheat (Statkorn, Norway) 164 155 166 60 46 80 99 Oil4 139 153 153 208 223 223 291 Vitamins and minerals5 25 25 25 25 25 25 25 1FW: freshwater stage 2SW: seawater stage 3 Includes five different pellet sizes. Here composition of the largest two diet sizes (1.2 and 2.0 mm) is given 4 Oil is capelin oil (Nordsildmel, Norway) for fish oil based diet, or a mixture of 55 % rapeseed oil (Oelmuhle, Germany), 30 % palm oil (Denofa, Norway) and 15 % linseed oil (NV Oliefabriek, Belgium) for vegetable oil based diets 5 Vitamin and mineral supplementation is estimated to cover requirements according NRC, 199

35
Table 2 Proximate compositions (percentage) and fatty acid compositions (percentage of
weight of total fatty acids) of representative diets used in freshwater (3mm) and seawater (9
mm pellet).
Freshwater Seawater FO 75% VO 100% VO FO 75% VO 100% VO
Proximate composition Protein 46.5 ± 0.4 45.8 ± 0.3 46.7 ± 0.2 42.1 ± 0.2 41.2 ± 0.4 42.9 ± 0.3 Lipid 19.6 ± 0.1 18.2 ± 0.2 18.8 ± 0.1 31.4 ± 0.8 32.8 ± 0.3 31.3 ± 0.1 Moisture 8.4 ± 0.0 6.8 ± 0.1 6.6 ± 0.0 7.0 ± 0.3 6.4 ± 0.2 6.5 ± 0.1 Ash 7.8 ± 0.0 7.9 ± 0.0 7.5 ± 0.0 7.0 ± 0.1 7.1 ± 0.0 6.6 ± 0.1 Fatty acid composition 14:0 6.1 ± 0.1 2.7 ± 0.1 1.1 ± 0.1 6.2 ± 0.1 2.2 ± 0.2 0.6 ± 0.1 16:0 12.4 ± 0.2 15.5 ± 0.5 16.9 ± 0.4 14.5 ± 0.4 16.1 ± 0.2 15.3 ± 0.3 18:0 1.5 ± 0.0 2.4 ± 0.1 2.7 ± 0.0 2.4 ± 0.6 3.0 ± 0.5 2.7 ± 0.0
Total saturated1 20.3 ± 0.3 20.8 ± 0.6 21.8 ± 0.4 23.6 ± 0.9 21.5 ± 0.5 19.4 ± 0.3
16:1n-72 7.9 ± 0.1 3.2 ± 0.0 1.1 ± 0.0 4.9 ± 0.2 1.8 ± 0.3 0.5 ± 0.1 18:1n-9 11.9 ± 0.4 30.6 ± 0.7 40.4 ± 0.5 13.2 ± 0.4 35.2 ± 0.0 43.0 ± 0.2 18:1n-7 3.3 ± 0.1 2.6 ± 0.1 2.5 ± 0.1 2.4 ± 0.1 2.5 ± 0.2 2.4 ± 0.0
20:1n-93 19.9 ± 0.4 7.4 ± 0.1 2.7 ± 0.1 11.1 ± 1.0 3.8 ± 0.3 1.3 ± 0.1
22:1n-114 15.8 ± 0.3 6.4 ± 0.1 2.3 ± 0.1 16.5 ± 1.9 5.1 ± 0.4 0.8 ± 0.0 24:1n-9 0.7 ± 0.0 0.4 ± 0.0 0.3 ± 0.0 0.7 ± 0.0 0.2 ± 0.0 0.0 ± 0.0 Total monoenes 59.4 ± 1.3 50.6 ± 0.8 50.2 ± 0.5 48.8 ± 2.5 48.6 ± 0.6 48.2 ± 0.5 18:2n-6 3.9 ± 0.1 11.7 ± 0.3 13.5 ± 0.2 3.6 ± 0.6 12.7 ± 1.2 17.1 ± 0.2 20:4n-6 0.2 ± 0.0 0.2 ± 0.0 0.2 ± 0.0 0.5 ± 0.1 0.2 ± 0.1 0.0 ± 0.0 Total n-6 PUFA5 4.4 ± 0.1 12.2 ± 0.3 13.7 ± 0.2 4.6 ± 0.7 13.0 ± 1.1 17.1 ± 0.2 18:3n-3 0.6 ± 0.0 6.8 ± 0.3 8.0 ± 0.2 1.2 ± 0.1 9.0 ± 0.7 13.4 ± 0.5 18:4n-3 1.9 ± 0.1 1.0 ± 0.1 0.4 ± 0.1 2.5 ± 0.1 0.8 ± 0.0 0.2 ± 0.0 20:4n-3 0.3 ± 0.0 0.2 ± 0.0 0.1 ± 0.1 0.7 ± 0.0 0.2 ± 0.0 0.0 ± 0.0 20:5n-3 5.8 ± 0.6 3.6 ± 0.3 2.1 ± 0.0 6.5 ± 0.2 2.4 ± 0.5 0.6 ± 0.0 22:5n-3 0.4 ± 0.1 0.2 ± 0.0 0.2 ± 0.0 0.9 ± 0.2 0.3 ± 0.2 0.0 ± 0.0 22:6n-3 5.9 ± 0.6 4.2 ± 0.4 3.4 ± 0.2 10.0 ± 0.6 3.7 ± 1.1 1.0 ± 0.0 Total n-3 PUFA6 14.9 ± 1.4 15.9 ± 1.1 14.3 ± 0.6 21.8 ± 0.8 16.5 ± 1.1 15.2 ± 0.5
Total PUFA7 20.3 ± 1.6 28.6 ± 1.3 28.0 ± 0.8 27.6 ± 1.6 29.8 ± 0.1 32.3 ± 0.7

36
Table 3 Experimental conditions, feed conversion (FCR) and growth (SGR: Specific Growth rate and TGC:
Thermal Growth Coefficient) for each period (FW and SW) of Atlantic salmon fed either 100% FO, 75% VO (S)
or 100% VO (N) from start feeding until harvest size prior to finishing diet period at two different locations
(Scotland (S) and Norway (N)).
Time of feeding
(Months) Location
Feed conversion ratio
(FCR) Growth. SGR Growth. TGC
FO VO FO VO FO VO
0-12 S FW 1.12 ± 0.01 1.17 ± 0.02 1.43 ± 0.00 1.42 ± 0.01 1.00 ± 0.01 1.01 ± 0.01 12-25 S SW 1.02 ± 0.02 0.98 ± 0.02 1.16 ± 0.02 1.14 ± 0.02 2.45 ± 0.06 2.53 ± 0.06 0-10 N FW 1.31 ± 0.03 1.34 ± 0.05 2.16 ± 0.03 2.19 ± 0.01 1.23 ± 0.03 1.27 ± 0.01
10-22 N SW 1.34 ± 0.07 1.22 ± 0.11 0.92 ± 0.06 0.89 ± 0.04 2.13 ± 0.15 2.36 ± 0.17

37
Table 4. Effect of feeding diets containing fish oil or vegetable oil on the fatty acid composition (percentage of weight) of total lipid and total fat (%) from flesh of Atlantic salmon (Salmo salar) at selected freshwater and seawater stages from the Scotland (S) and Norway (N).
6 months (FW) - S
6 months (FW) - N
9 months (FW) - S
9 months (FW) – N
12 Months (FW) - S
12 Months (SW) - N
100% FO 100% FO 75%VO 100%VO 100%FO 100%FO 75%VO 100%VO 100%FO 100%FO 75%VO 100%VO Total lipid 3.1 ± 0.3 4.9 ± 0.4 3.2 ± 0.3 4.1 ± 0.7 3.1 ± 0.1 4.5 ± 0.6 2.6 ± 0.3 b 3.8 ± 0.6 a 2.0 ± 0.1 n.a. 1.6 ± 0.3 n.a. 14:0 5 ± 0.3 5.3 ± 0.1 2.3 ± 0.1 a 1.7 ± 0.1 b 4.2 ± 0.1 4.8 ± 0.1 1.9 ± 0.1 a 1.6 ± 0.1 b 2.7 ± 0.1 5 ± 0.1 1.1 ± 0.1 b 1.3 ± - a 16:0 14.7 ± 0.5 13.2 ± 0.2 15.8 ± 0.2 a 15.1 ± 0.1 b 14 ± 0.3 13 ± 0.1 15.7 ± 0.5 a 14.7 ± 0.2 b 16.9 ± 1 12.8 ± 0.2 17.8 ± 1.1 a 14.3 ± 0.2 b 18:0 2.3 ± 0.1 2.4 ± 0.1 3.1 ± 0.1 3.6 ± - b 2.3 ± 0.1 2.4 ± 0.1 3.1 ± 0.1 b 3.6 ± - a 2.8 ± 0.1 2.4 ± - 3.8 ± 0.3 3.4 ± 0.1 Sum sat. 1 22.4 ± 0.8 21.6 ± 0.2 21.5 ± 0.3 a 20.6 ± 0.1 b 21 ± 0.3 21 ± - 21 ± 0.4 a 20 ± 0.2 b 23 ± 1 21 ± 0.3 22.8 ± 1.4 a 19.7 ± 0.4 b 16:1n-7 2 6.2 ± 0.1 6.2 ± 0.2 2.8 ± 0.1 a 1.6 ± - b 5.9 ± 0 6 ± 0.1 2.5 ± 0 a 1.5 ± 0.1 b 3.7 ± 0.2 6.2 ± 0.1 1.4 ± 0.1 1.4 ± - 18:1n-7 3.7 ± 0.3 3.4 ± 0.1 2.7 ± - a 2.5 ± - b 3.6 ± 0.3 3.4 ± 0.1 2.6 ± 0.1 2.5 ± 0.1 2.8 ± 0.1 3.5 ± - 2.1 ± 0.1 b 2.5 ± - a 18:1n-9 15 ± 0.2 13.7 ± 0.5 28.3 ± 0.3 b 31.4 ± 0.4 a 14.0 ± 0.3 14.0 ± 0.3 26.6 ± 1.6 b 33.5 ± 0.5 a 10.2 ± 0.6 13.4 ± 0.2 15.9 ± 2.1 b 34.8 ± 0.4 a 20:1n-93 15.1 ± 0.4 14.6 ± 0.4 6.4 ± 0.2 a 3.8 ± 0.1 b 15.0 ± 0.5 15.0 ± 0.3 5.9 ± 0.5 a 3.8 ± 0.1 b 8.4 ± 0.7 15.3 ± 0.2 3 ± 0.3 3.4 ± - 20:1n-11 0.5 ± 0.1 0.7 ± 0.1 0.4 ± 0.1 a 0.2 ± 0.1 b 0.4 ± 0.1 0.8 ± 0.1 0.4 ± 0.1 0.3 ± - 0.3 ± - 0.7 ± - 0.2 ± - 0.2 ± - 22:1n-9 1.5 ± 0.2 1.4 ± - 0.7 ± 0.1 a 0.5 ± - b 1.4 ± 0.3 1.3 ± - 0.6 ± 0.1 0.5 ± - 0.6 ± 0.1 1.4 ± - 0.2 ± 0.1 0.4 ± - 22:1n-114 8.7 ± 0.4 9.0 ± 0.2 3.8 ± 0.1 a 2.3 ± - b 7.8 ± 0.3 8.5 ± 0.3 3.3 ± 0.3 a 2 ± - b 4 ± 0.4 8.9 ± 0.1 1.4 ± 0.2 b 1.7 ± - a Sum mono 52.5 ± 0.3 51.7 ± 0.8 46.1 ± 0.5 a 43.2 ± 0.4 b 50 ± 0.7 51 ± 0.6 42.8 ± 2.6 b 45 ± 0.5 a 31 ± 2 52 ± 0.4 25.1 ± 2.7 b 45 ± 0.3 a
18:2n-6 3.3 ± 0.1 3 ± - 9.4 ± 0.1 b 10.4 ± 0.1 a 3.4 ± 0.1 3.0 ± - 9.0 ± 0.3 b 10.4 ± - a 2.4 ± 0.1 3.4 ± - 5.7 ± 0.8 b 10.9 ± 0.2 a 20:2n-6 0.3 ± - 0.3 ± - 0.6 ± - 0.8 ± - 0.3 ± - 0.3 ± - 0.6 ± - b 0.8 ± - a 0.2 ± - 0.3 ± - 0.4 ± 0.1 b 0.9 ± - a 20:4n-6 0.3 ± - 0.5 ± - 0.3 ± - b 0.9 ± - a 0.4 ± - 0.5 ± - 0.4 ± 0.1 b 0.8 ± - a 0.7 ± - 0.5 ± - 0.7 ± 0.1 b 0.9 ± - a Sum n-65 4.3 ± 0.1 4 ± 0.1 10.8 ± 0.2 b 12.5 ± 0.1 a 4.6 ± 0.1 4 ± - 10.6 ± 0.3 b 13 ± 0.1 a 3.8 ± 0.1 4.4 ± - 7.7 ± 0.7 b 13.3 ± 0.1 a
18:3n-3 0.8 ± 0.1 0.6 ± 0.1 4.9 ± 0.1 b 5.9 ± - a 0.7 ± 0.1 0.6 ± - 4.7 ± 0.2 b 5.4 ± 0.1 a 0.5 ± 0.1 0.6 ± - 3.3 ± 0.3 b 6.2 ± 0.1 a 18:4n-3 1.2 ± 0.1 1.2 ± - 1 ± - 0.9 ± - 1.2 ± 0.1 1.1 ± - 0.9 ± 0.1 0.8 ± - 0.7 ± 0.1 1.2 ± - 0.5 ± 0.1 b 1.2 ± 0.1* a 20:5n-3 3.6 ± 0.1 3.5 ± 0.1 2.3 ± 0.1 2.2 ± 0.1 3.9 ± 0.1 3.5 ± - 2.6 ± 0.3 a 2 ± - b 6.2 ± 0.3 3.8 ± - 4.6 ± 0.4 a 2.1 ± 0.1 b 22:5n-3 1.1 ± 0.1 1.2 ± - 0.7 ± 0.1 0.7 ± - 1.2 ± 0.1 1.2 ± - 0.8 ± - a 0.6 ± - b 1.5 ± 0.1 1.2 ± - 0.9 ± 0.1 a 0.6 ± - b 22:6n-3 12.6 ± 0.5 12.2 ± 0.8 11.2 ± 0.5 11.2 ± 0.7 16 ± 0.6 13 ± 0.2 14.9 ± 2.2 a 11.2 ± 0.5 b 31.3 ± 1.3 12.4 ± 0.4 32.3 ± 2.5 a 10 ± 0.1 b Sum n-36 20 ± 0.9 19.6 ± 1.0 20.9 ± 0.7 21.6 ± 0.8 24 ± 0.7 21 ± 0.2 24.8 ± 2.4 a 21 ± 0.5 b 41 ± 1.2 20 ± 0.4 42.6 ± 2.6 a 21 ± 0.3 b n-3/n-6 4.7 ± 0.2 4.9 ± 0.2 1.9 ± 0.2 1.7 ± 0.1 5.1 ± 0.3 5.1 ± 0.1 2.3 ± 0.2 a 1.6 ± - b 10.8 ± 0.9 4.6 ± 0.1 5.5 ± 1 a 1.6 ± - b
Results are means ± SD. 1totals include 15:0 present at up to 0.3%; 2also contains n-9 isomer; 3also contains n-11 and n-7 isomers; 4also contains n-9 isomer; 5totals include 22:5n-6 present at up to 0.5%; 6totals include C16 PUFA present at up to 0.5%. 100% FO, fish oil diet; 75% VO and 100% VO, diets with 75% and 100% of fish oil replaced by vegetable oil. Different letters indicate statistical differences between 75% VO and 100% VO within each sampling period obtained by 1-WAY ANOVA

38
Table 5. Effect of feeding diets containing fish oil or vegetable oil on the fatty acid composition (percentage of weight) of total lipid and total fat (%) from flesh of Atlantic salmon (Salmo salar) at selected seawater stages from the Scotland (S) and Norway (N).
17 months (SW) - S
16 months (SW) - N
25 months (SW) - S
22 months (SW) - N
31 months (SW) - S
27 months (SW) - N
100%FO 100%FO 75%VO 100%VO 100%FO 100%FO 75%VO 100%VO 100%FO 100%FO 75%VO 100%VO Total lipid 3.1 ± 0.2 8.5 ± 1.5 2.5 ± 0.6 b 8.3 ± 0.3 a 12.6 ± 0.2 8.7 ± 0.7 11.6 ± 1.0 9.8 ± 0.5 15.8 ± 1.4 10.4 ± 2.1 13.1 ± 1.7 a 9.3 ± 0.8 b 14:0 4.4 ± 0.4 5.3 ± - 1.9 ± 0.2 a 1.1 ± - b 5.0 ± 0.1 4.9 ± - 2.2 ± 0.1 a 0.8 ± - b 5.0 ± 0.2 4.8 ± 0.1 4.2 ± 0.1 a 2.7 ± 0.3 b 16:0 13.4 ± 0.3 13.5 ± 0.2 14.8 ± 0.6 14.4 ± 0.1 13.6 ± 0.3 13 ± 0.2 13.3 ± 0.3 12.9 ± 0.1 13.5 ± 0.4 12.9 ± 0.0* 13.4 ± 0.1 12.7 ± 0.0* 18:0 2.4 ± - 2.8 ± - 3.1 ± 0.1 b 3.5 ± - a 2.6 ± 0.1 2.6 ± 0.1 3 ± 0.1 3.1 ± - 2.6 ± 0.1 2.6 ± 0.1 2.7 ± 0.0 2.9 ± 0.1 Sum sat. 1 20.4 ± 0.5 22.6 ± 0.3 20 ± 0.4 19.7 ± 0.0 21.6 ± 0.4 21.1 ± 0.3 19 ± 0.4 a 17 ± 0.1 b 21.5 ± 0.5 20.9 ± 0.1 20.6 ± 0.1 a 18.6 ± 0.2 b 16:1n-7 2 5.7 ± 0.6 5.1 ± 0.1 2.3 ± 0.3 a 1.0 ± - b 5.3 ± 0.1 4.4 ± - 2.5 ± 0.1 a 0.9 ± - b 4.9 ± 0.1 4.3 ± 0.2 4.0 ± 0.0 a 2.4 ± 0.3 b 18:1n-7 3.4 ± 0.2 3 ± - 2.6 ± 0.1 a 2.3 ± - b 3.0 ± 0.1 2.7 ± - 2.7 ± 0.1 2.5 ± - 2.8 ± 0.1 2.7 ± 0.0 2.7 ± 0.0 2.7 ± 0.0 18:1n-9 12.9 ± 0.7 13.7 ± 0.1 26.8 ± 2.4 b 39.9 ± 0.1 a 16.7 ± 0.2 14.6 ± 0.3 34.5 ± 0.5 b 41.3 ± 0.2 a 16.8 ± 0.3 15.1 ± 0.3 21.6 ± 0.7 b 29.2 ± 1.9 a 20:1n-93 16 ± 1 12.2 ± 0.2 6.1 ± 0.6 a 2.8 ± 0.1 b 11.2 ± 0.4 10 ± 0.1 5.5 ± 0.1 a 2.7 ± - b 11.1 ± 0.1 9.8 ± 0.1 9.3 ± 0.2 a 6.2 ± 0.5 b 20:1n-11 0.5 ± 0.2 1 ± 0.1 0.2 ± - 0.1 ± - 1.0 ± 0.2 1.4 ± - 0.4 ± 0 - ± - 1.1 ± 0.1 1.6 ± 0.0 0.9 ± 0.1 0.8 ± 0.1 22:1n-9 1.4 ± 0.1 1.1 ± 0.1 0.7 ± 0.1 a 0.4 ± - b 1.0 ± 0.0 0.9 ± - 0.6 ± - a 0.4 ± - b 1.0 ± 0 0.9 ± 0.0 0.9 ± 0.1 a 0.7 ± 0.0 b 22:1n-114 9.2 ± 0.9 10.5 ± 0.1 3.6 ± 0.4 a 1.0 ± - b 11.7 ± 0.5 11.4 ± 0.1 4.1 ± 0.2 a 0.9 ± - b 12.9 ± 0.1 11.7 ± 0.6 10.8 ± 0.3 a 6.6 ± 0.8 b Sum mono 50.7 ± 3.6 48.9 ± 0.5 43 ± 3.7 47.8 ± 0.0 51.4 ± 0.3 48.2 ± 0.3 51.0 ± 0.6 b 49.0 ± 0.1 a 52.1 ± 0.4 49.0 ± 0.4 51.6 ± 0.6 a 50.0 ± 0.1 b 18:2n-6 3.3 ± 0.2 3.4 ± - 8.8 ± 0.6 b 12.7 ± 0.1 a 3.3 ± 0.1 3.3 ± - 10.3 ± 0.1 b 14.4 ± - a 3.1 ± 0.1 3.3 ± 0.2 5.2 ± 0.2 b 9.1 ± 0.8 a 20:2n-6 0.4 ± - 0.4 ± - 0.7 ± 0.1 b 1 ± - a 0.4 ± 0.0 0.4 ± - 1 ± 0 1.2 ± - 0.4 ± 0 0.1 ± 0.2 0.6 ± 0.0 a 0.0 ± 0.0 b 20:4n-6 0.4 ± 0 0.4 ± 0.3
* 0.4 ± 0.1 b 0.9 ± -* a
0.4 ±
0.0 0.7 ±
- 0.3 ±
0.1 b 0.9 ±
- a 0.4 ± 0 0.5 ± 0.0 0.4 ± 0.0 0.3 ± 0.0 Sum n-65 4.5 ± 0 4.3 ± 0.3 10 ± 0.6 b 15 ± - a 4.8 ± 0.1 4.5 ± - 12 ± 0.1 b 17 ± 0.1 a 4.5 ± 0.1 3.9 ± 0.2 6.9 ± 0.2 b 9.8 ± 0.8 a 18:3n-3 0.6 ± 0.1 0.8 ± - 5.6 ± 0.2 b 8.0 ± 0.1 a 1.0 ± 0.0 1.1 ± - 6.5 ± 0.1 b 8.2 ± 0.1 a 1.0 ± 0 1.1 ± 0.1 2.6 ± 0.2 b 4.6 ± 0.4 a 18:4n-3 1.1 ± 0.1 1.4 ± - 0.7 ± 0.1 0.8 ± - 1.4 ± 0.1 1.5 ± - 0.7 ± 0 b 1.2 ± 0.1 a 1.4 ± 0 1.4 ± 0.0 1.2 ± 0.1 1.2 ± 0.1 20:5n-3 5.3 ± 0.6 4.3 ± 0.1 3.9 ± 0.6 a 1.6 ± - b 4.5 ± 0.1 4.6 ± 0.1 2.2 ± 0.1 a 1.6 ± - b 4.4 ± 0.1 4.6 ± 0.1 3.8 ± 0.2 a 2.9 ± 0.2 b 22:5n-3 1.5 ± 0.1 1.7 ± - 1.1 ± 0.1 a 0.6 ± - b 2.1 ± 0.1 2.1 ± - 1 ± 0.1 a 0.6 ± - b 2.3 ± 0.1 2.3 ± 0.1 1.9 ± 0.1 a 1.5 ± 0.2 b 22:6n-3 14.2 ± 3.3 11.5 ± 0.4 13.2 ± 3.3 a 5.3 ± 0.1 b 11 ± 0.4 12.7 ± 0.2 5.9 ± 0.5 a 3.4 ± 0.1 b 10.6 ± 0.4 12.8 ± 0.4 9.4 ± 0.4 8.4 ± 0.5 Sum n-36 23.7 ± 3.8 20.9 ± 0.2 26 ± 3.7 a 17 ± 0 b 21.7 ± 0.5 23.4 ± 0.3 18 ± 0.7 a 16 ± 0.1 b 21.4 ± 0.6 23.9 ± 0.3 20.5 ± 0.7 20.3 ± 0.5 n-3/n-6 5.3 ± 0.7 4.8 ± 0.3 2.5 ± 0.5 a 1.1 ± - b 4.5 ± 0.2 5.2 ± 0.1 1.5 ± 0.2 a 0.9 ± - b 4.8 ± 0.3 6.1 ± 0.2 3.0 ± 0.3 a 2.1 ± 0.2 b
Results are means ± SD. 1totals include 15:0 present at up to 0.3%; 2also contains n-9 isomer; 3also contains n-11 and n-7 isomers; 4also contains n-9 isomer; 5totals include 22:5n-6 present at up to 0.5%; 6totals include C16 PUFA present at up to 0.5%. 100% FO, fish oil diet; 75% VO and 100% VO, diets with 75% and 100% of fish oil replaced by vegetable oil. Different letters indicate statistical differences between 75% VO and 100% VO within each sampling period obtained by 1-WAY ANOVA

39
Table 6 Sensory analysis performed in Scotland on fillets from Atlantic salmon fed either
100% FO (Norway and Scotland) or 75% VO (Scotland) or 100% VO (Norway) for 23
months. Scores of the attributes are given as 0-10, and for the preference test 0 refer to
extremely disliked, whereas 10 refer to extremely liked.
100% FO (Norway)
100% FO (Scotland) 75% VO 100% VO
Attributes Fishy aroma 5.7 ± 0.7 5.3 ± 0.8 5.2 ± 1.1 5.2 ± 1.2 Colour intensity 4.3 ± 1.6 4.2 ± 1.5 3.9 ± 1.4 4.1 ± 1.8 Flake size 5.0 ± 1.2 5.0 ± 0.9 4.6 ± 1.6 5.1 ± 1.3 Hardness 4.3 ± 1.3 4.9 ± 1.1 4.5 ± 1.5 4.6 ± 1.2 Firmness 4.3 ± 1.2 4.6 ± 1.3 4.8 ± 1.5 4.5 ± 1.3 Fibrousness 5.2 ± 1.2 4.8 ± 0.9 5.2 ± 1.5 5.1 ± 1.2 Degree of Chewiness 5.2 ± 1.3 5.1 ± 1.0 5.2 ± 1.4 5.0 ± 1.3 Moistness 5.6 ± 1.0 5.0 ± 0.5 5.2 ± 1.2 5.6 ± 1.0 Oiliness (texture & flavour) 5.1 ± 0.9 4.8 ± 0.8 4.9 ± 1.3 5.5 ± 1.0 Fishy flavour character 5.0 ± 1.2 4.6 ± 1.1 4.8 ± 0.8 4.8 ± 1.2 Off-flavour 1.5 ± 0.7 1.3 ± 0.3 1.6 ± 1.0 1.5 ± 0.9 Aftertaste 3.7 ± 1.8 3.3 ± 1.5 3.3 ± 1.6 3.2 ± 1.6 PREFERENCE TEST Smell 5.5 ± 1.1 5.1 ± 0.7 5.3 ± 1.5 5.5 ± 1.5 Colour 5.2 ± 1.5 4.8 ± 1.7 4.9 ± 2.0 5.3 ± 1.7 Appearance 5.3 ± 1.4 4.8 ± 1.6 5.0 ± 2.0 5.5 ± 1.8 Texture 5.3 ± 1.2 5.3 ± 1.6 5.4 ± 1.8 5.6 ± 1.3 Flavour 5.4 ± 1.3 5.4 ± 1.2 5.5 ± 1.4 5.9 ± 1.2

40
Figure 1

41
Figure 2

42
Figure 3

43
Figure 4

44
Figure 5
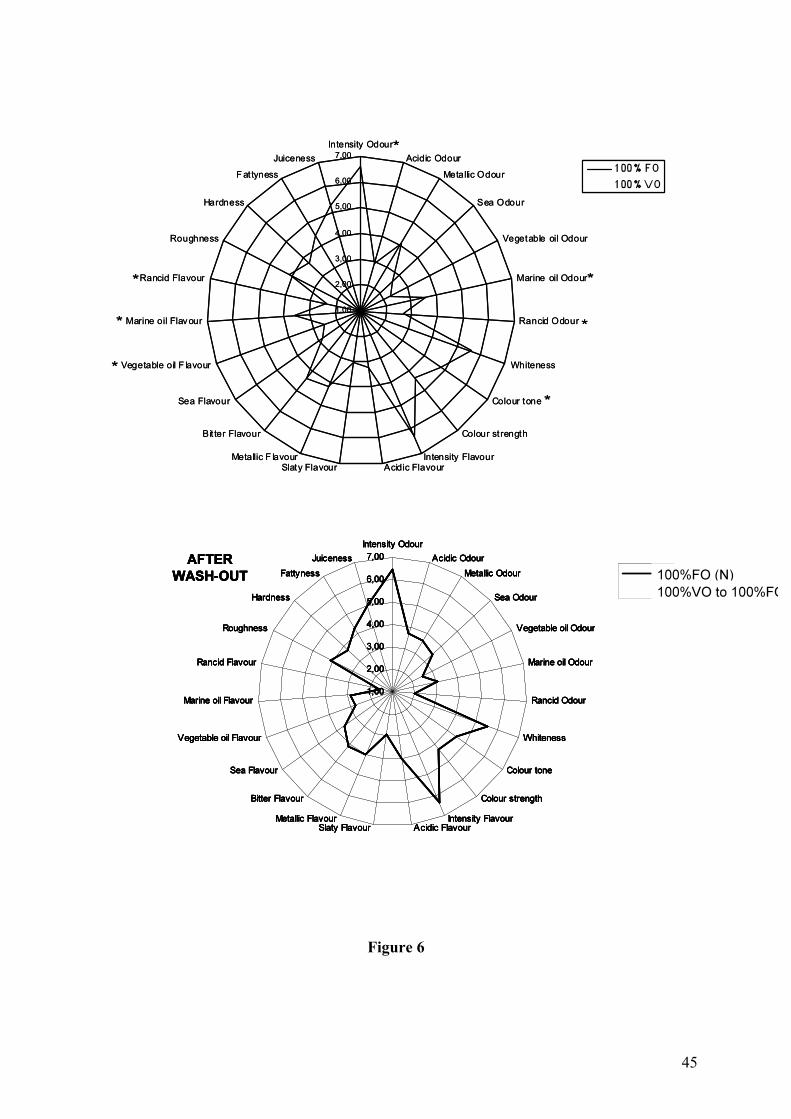
45
Figure 6