Patterns of bioelectrical impedance vector distribution by body mass index and age: implications for...
10
Patterns of bioelectrical impedance vector distribution by body mass index and age: implications for body-composition analysis 1–3 Anja Bosy-Westphal, Sandra Danielzik, Ralf-Peter Dörhöfer, Antonio Piccoli, and Manfred J Mu ¨ller ABSTRACT Background: Bioelectrical impedance analysis (BIA) gives resis- tance (R) and reactance (Xc). R and Xc normalized for body height (H) can be plotted as a bivariate vector (H 2 /Xc versus H 2 /R). Vector BIA is useful for studying the determinants of BIA results. Objective: We investigated the effect of age on BIA results and its relevance to body-composition analysis in a large database of im- pedance vector distributions stratified by age, sex, and body mass index (BMI). Design: Mean bivariate vector distribution patterns (95% confi- dence ellipses) were examined in a German population of 15 605 children and adolescents and 213 294 adults. Children and adoles- cents were divided into 3 age groups with up to 5 BMI categories. In adults, 5 BMI categories were stratified into 7 age groups. Results: Mean impedance vectors were shorter in children than in adults. The vector distribution pattern was influenced by sex, BMI, and age, with shorter vectors in females than in males and longer vectors with increasing BMI. Consistent with a decrease in body cell mass with increasing age, there was a downward slope in the mean vector with age as a result of a decrease in the H 2 /Xc vector compo- nent. By contrast, there was no age-dependent increase in the H 2 /R vector component. In women of the same BMI at different ages, H 2 /R and percentage fat mass tended to decrease with age. Conclusions: The lack of an age-dependent increase in the H 2 /R vector component renders conventional BIA unsuitable for an ex- amination of the age-related increase in body fat mass. By contrast, the increase in the H 2 /Xc vector component with advancing age suggests the potential of BIA to depict the age-related decrease in body cell mass. Am J Clin Nutr 2005;82:60 – 8. KEY WORDS Bioelectrical impedance analysis, resistance, reactance, body mass index, children, adolescents, adults, aging INTRODUCTION Vector bioelectrical impedance analysis (BIA, RXc-graph method) is a pattern analysis of direct impedance measurements (resistance, R, and reactance, Xc) plotted as a bivariate vector standardized by the subject’s height (ie, expressing R/H and Xc/H in /m). This method was described as a useful tool for moni- toring hydration status in renal (1–3) and critical care (4) patients, in the follow-up of obese subjects during weight loss (3), and in infants (5–7). In the clinical setting, the advantages of vector BIA are convincing: no algorithms for conversion of raw impedance data into body-composition compartments are required. Results are therefore not biased by the choice of regression equation, the accuracy of the criterion method, or the selection criteria of the reference population. Because vector distribution patterns differ between men and women and by race or ethnicity and are de- pendent on body mass index (BMI) and age, national reference distributions for R and Xc used for body-composition analysis have been stratified accordingly (8, 9). Vector distribution patterns reveal the determinants of BIA results; ie, the sex- and BMI-dependency of BIA results indicate that equations used for the prediction of body composition from impedance measurements need to be validated separately by sex and BMI classes (9). The age-dependency of vector distribution has not yet been critically viewed with regard to its relevance to body-composition analysis. The present work aimed to investigate vector distribution pat- terns according to sex, BMI, and age in a large database of white children and adolescents (n 16 237) and adults (n 214 294). We used a modified version of the RXc-graph with the vector components H 2 /R and H 2 /Xc to analyze the relevance of age- related changes in vector BIA components for the description of age-related changes in body composition. SUBJECTS AND METHODS Subjects were recruited from 524 Precon-centers (commercial weight-management facilities) and the Kiel Obesity Prevention Study (KOPS) in Germany. Informed consent was obtained from all volunteers before participation. In case of children, parents provided written informed consent. Data comprising 10 127 girls (x SD age: 11.5 3.9 y; range: 6 –17 y), 6110 boys (9.5 3.2 y; 6 –17 y), 183 982 women (42.5 13.2 y; 18 –102 y), and 30 750 men (44.6 13.5 y; 18 –100 y) were collected over a period of 14 y from June 1990 to August 2003. Data from 420 girls and 212 boys were omitted because the children’s BMI (in 1 From the Institut fu ¨r Humanerna ¨hrung und Lebensmittelkunde, Christian-Albrechts- Universita ¨t zu Kiel, Kiel, Germany (AB-W, SD, and MJM); Data Input Company, Darmstadt, Germany (R-PD); and the Depart- ment of Medical and Surgical Sciences, University of Padova, Padova, Italy (AP). 2 Supported by a grant from Precon, Darmstadt, Germany. 3 Reprints not available. Address correspondence to MJ Mu ¨ ller, Institut fu ¨r Humanerna ¨hrung und Lebensmittelkunde, Christian-Albrechts-Universita ¨t zu Kiel, Du ¨sternbroker Weg 17, D-24105 Kiel, Germany. E-mail: [email protected]. Received September 14, 2004. Accepted for publication February 23, 2005. 60 Am J Clin Nutr 2005;82:60 – 8. Printed in USA. © 2005 American Society for Clinical Nutrition by guest on August 21, 2014 ajcn.nutrition.org Downloaded from by guest on August 21, 2014 ajcn.nutrition.org Downloaded from by guest on August 21, 2014 ajcn.nutrition.org Downloaded from
-
Upload
independent -
Category
Documents
-
view
3 -
download
0
Transcript of Patterns of bioelectrical impedance vector distribution by body mass index and age: implications for...

Patterns of bioelectrical impedance vector distribution by bodymass index and age: implications for body-composition analysis1–3
Anja Bosy-Westphal, Sandra Danielzik, Ralf-Peter Dörhöfer, Antonio Piccoli, and Manfred J Muller
ABSTRACTBackground: Bioelectrical impedance analysis (BIA) gives resis-tance (R) and reactance (Xc). R and Xc normalized for body height(H) can be plotted as a bivariate vector (H2/Xc versus H2/R). VectorBIA is useful for studying the determinants of BIA results.Objective: We investigated the effect of age on BIA results and itsrelevance to body-composition analysis in a large database of im-pedance vector distributions stratified by age, sex, and body massindex (BMI).Design: Mean bivariate vector distribution patterns (95% confi-dence ellipses) were examined in a German population of 15 605children and adolescents and 213 294 adults. Children and adoles-cents were divided into 3 age groups with up to 5 BMI categories. Inadults, 5 BMI categories were stratified into 7 age groups.Results: Mean impedance vectors were shorter in children than inadults. The vector distribution pattern was influenced by sex, BMI,and age, with shorter vectors in females than in males and longervectors with increasing BMI. Consistent with a decrease in body cellmass with increasing age, there was a downward slope in the meanvector with age as a result of a decrease in the H2/Xc vector compo-nent. By contrast, there was no age-dependent increase in the H2/Rvector component. In women of the same BMI at different ages, H2/Rand percentage fat mass tended to decrease with age.Conclusions: The lack of an age-dependent increase in the H2/Rvector component renders conventional BIA unsuitable for an ex-amination of the age-related increase in body fat mass. By contrast,the increase in the H2/Xc vector component with advancing agesuggests the potential of BIA to depict the age-related decrease inbody cell mass. Am J Clin Nutr 2005;82:60–8.
KEY WORDS Bioelectrical impedance analysis, resistance,reactance, body mass index, children, adolescents, adults, aging
INTRODUCTION
Vector bioelectrical impedance analysis (BIA, RXc-graphmethod) is a pattern analysis of direct impedance measurements(resistance, R, and reactance, Xc) plotted as a bivariate vectorstandardized by the subject’s height (ie, expressing R/H and Xc/Hin �/m). This method was described as a useful tool for moni-toring hydration status in renal (1–3) and critical care (4) patients,in the follow-up of obese subjects during weight loss (3), and ininfants (5–7). In the clinical setting, the advantages of vector BIAare convincing: no algorithms for conversion of raw impedancedata into body-composition compartments are required. Resultsare therefore not biased by the choice of regression equation, the
accuracy of the criterion method, or the selection criteria of thereference population. Because vector distribution patterns differbetween men and women and by race or ethnicity and are de-pendent on body mass index (BMI) and age, national referencedistributions for R and Xc used for body-composition analysishave been stratified accordingly (8, 9).
Vector distribution patterns reveal the determinants of BIAresults; ie, the sex- and BMI-dependency of BIA results indicatethat equations used for the prediction of body composition fromimpedance measurements need to be validated separately by sexand BMI classes (9). The age-dependency of vector distributionhas not yet been critically viewed with regard to its relevance tobody-composition analysis.
The present work aimed to investigate vector distribution pat-terns according to sex, BMI, and age in a large database of whitechildren and adolescents (n � 16 237) and adults (n � 214 294).We used a modified version of the RXc-graph with the vectorcomponents H2/R and H2/Xc to analyze the relevance of age-related changes in vector BIA components for the description ofage-related changes in body composition.
SUBJECTS AND METHODS
Subjects were recruited from 524 Precon-centers (commercialweight-management facilities) and the Kiel Obesity PreventionStudy (KOPS) in Germany. Informed consent was obtained fromall volunteers before participation. In case of children, parentsprovided written informed consent. Data comprising 10 127 girls(x� � SD age: 11.5 � 3.9 y; range: 6–17 y), 6110 boys (9.5 �3.2 y; 6–17 y), 183 982 women (42.5 � 13.2 y; 18–102 y), and30 750 men (44.6 � 13.5 y; 18–100 y) were collected over aperiod of 14 y from June 1990 to August 2003. Data from 420girls and 212 boys were omitted because the children’s BMI (in
1 From the Institut fur Humanernahrung und Lebensmittelkunde,Christian-Albrechts- Universitat zu Kiel, Kiel, Germany (AB-W, SD, andMJM); Data Input Company, Darmstadt, Germany (R-PD); and the Depart-ment of Medical and Surgical Sciences, University of Padova, Padova, Italy(AP).
2 Supported by a grant from Precon, Darmstadt, Germany.3 Reprints not available. Address correspondence to MJ Muller, Institut fur
Humanernahrung und Lebensmittelkunde, Christian-Albrechts-Universitatzu Kiel, Dusternbroker Weg 17, D-24105 Kiel, Germany. E-mail:[email protected].
Received September 14, 2004.Accepted for publication February 23, 2005.
60 Am J Clin Nutr 2005;82:60–8. Printed in USA. © 2005 American Society for Clinical Nutrition
by guest on August 21, 2014
ajcn.nutrition.orgD
ownloaded from
by guest on A
ugust 21, 2014ajcn.nutrition.org
Dow
nloaded from
by guest on August 21, 2014
ajcn.nutrition.orgD
ownloaded from
kg/m2) exceeded the highest age-dependent BMI category. Like-wise, we excluded 499 women and 62 men because of under-weight (BMI � 18.5) and 761 women and 119 men because ofsevere obesity (BMI � 50). Thus, the final study populationconsisted of 15 605 children and adolescents (age range: 6–17 y)and 213 294 adults (age range: 18–102 y) who were examined bya total of 530 trained observers. Training of the investigatorsfollowed the same manual. All subjects were white, nonpregnantand nonlactating, and healthy (defined as the absence of a clinicalcondition that could influence fluid balance, eg, renal, endocrine,or myocardial disease, as ascertained by participant question-naire). There were no further selection criteria.
Data were acquired between 0700 and 1200. In the case ofadults, all subjects were instructed on the importance of fastingovernight before measurement. Fasting was not a preconditionfor study participation by children. Body weight was measured to
the nearest 0.1 kg and standing height to the nearest 0.5 cm withthe subject in underwear and without shoes. BMI (kg/m2) wascalculated with weight (kg) and height (m) measurements. Asingle tetrapolar BIA measurement of resistance (R) and reac-tance (Xc) was taken at a fixed frequency of 50 kHz between theright wrist and ankle (standard placement of surface electrodes)with a body impedance analyzer (BIA 2000-S; Data Input,Frankfurt, Germany) while the subjects were in a supine positionon a nonconductive surface. (See reference 10 for a detaileddescription of the measurement procedure.) Mean CVs forwithin-day and between-day intraindividual measurements bythe same observer were �2% for R and �3.5% for Xc and �1.5%for R and �5% for Xc, respectively. The study was approved bythe Ethical Committee of the Christian-Albrechts-University ofKiel.
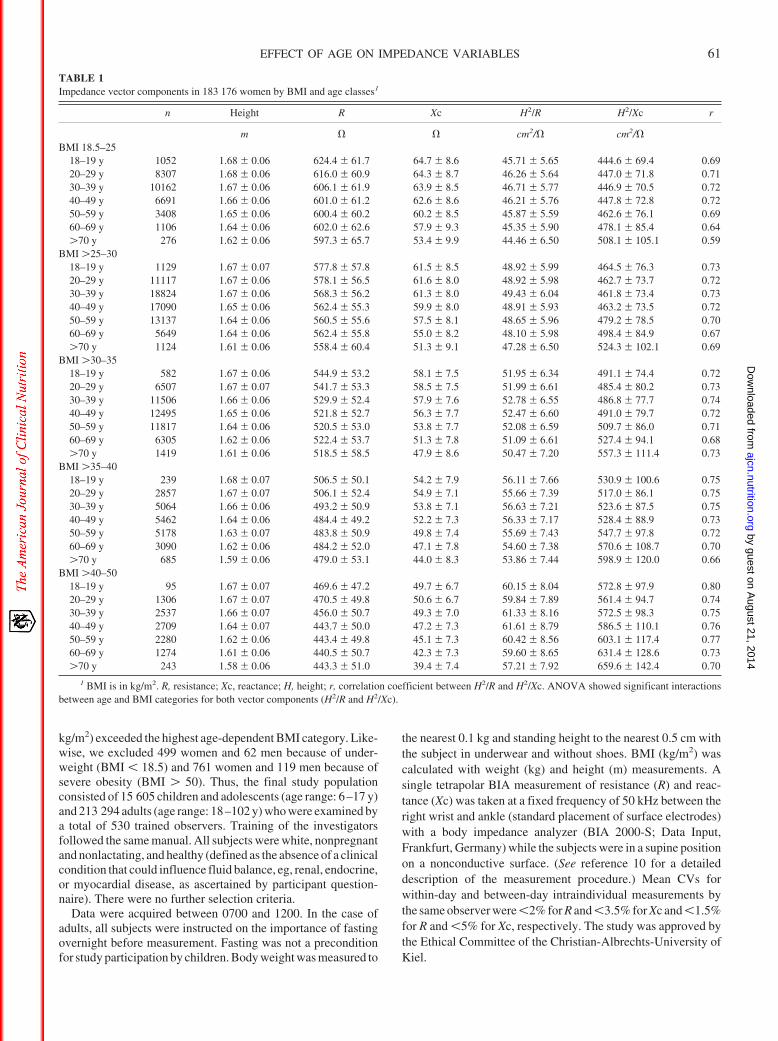
TABLE 1Impedance vector components in 183 176 women by BMI and age classes1
n Height R Xc H2/R H2/Xc r
m � � cm2/� cm2/�BMI 18.5–25
18–19 y 1052 1.68 � 0.06 624.4 � 61.7 64.7 � 8.6 45.71 � 5.65 444.6 � 69.4 0.6920–29 y 8307 1.68 � 0.06 616.0 � 60.9 64.3 � 8.7 46.26 � 5.64 447.0 � 71.8 0.7130–39 y 10162 1.67 � 0.06 606.1 � 61.9 63.9 � 8.5 46.71 � 5.77 446.9 � 70.5 0.7240–49 y 6691 1.66 � 0.06 601.0 � 61.2 62.6 � 8.6 46.21 � 5.76 447.8 � 72.8 0.7250–59 y 3408 1.65 � 0.06 600.4 � 60.2 60.2 � 8.5 45.87 � 5.59 462.6 � 76.1 0.6960–69 y 1106 1.64 � 0.06 602.0 � 62.6 57.9 � 9.3 45.35 � 5.90 478.1 � 85.4 0.64�70 y 276 1.62 � 0.06 597.3 � 65.7 53.4 � 9.9 44.46 � 6.50 508.1 � 105.1 0.59
BMI �25–3018–19 y 1129 1.67 � 0.07 577.8 � 57.8 61.5 � 8.5 48.92 � 5.99 464.5 � 76.3 0.7320–29 y 11117 1.67 � 0.06 578.1 � 56.5 61.6 � 8.0 48.92 � 5.98 462.7 � 73.7 0.7230–39 y 18824 1.67 � 0.06 568.3 � 56.2 61.3 � 8.0 49.43 � 6.04 461.8 � 73.4 0.7340–49 y 17090 1.65 � 0.06 562.4 � 55.3 59.9 � 8.0 48.91 � 5.93 463.2 � 73.5 0.7250–59 y 13137 1.64 � 0.06 560.5 � 55.6 57.5 � 8.1 48.65 � 5.96 479.2 � 78.5 0.7060–69 y 5649 1.64 � 0.06 562.4 � 55.8 55.0 � 8.2 48.10 � 5.98 498.4 � 84.9 0.67�70 y 1124 1.61 � 0.06 558.4 � 60.4 51.3 � 9.1 47.28 � 6.50 524.3 � 102.1 0.69
BMI �30–3518–19 y 582 1.67 � 0.06 544.9 � 53.2 58.1 � 7.5 51.95 � 6.34 491.1 � 74.4 0.7220–29 y 6507 1.67 � 0.07 541.7 � 53.3 58.5 � 7.5 51.99 � 6.61 485.4 � 80.2 0.7330–39 y 11506 1.66 � 0.06 529.9 � 52.4 57.9 � 7.6 52.78 � 6.55 486.8 � 77.7 0.7440–49 y 12495 1.65 � 0.06 521.8 � 52.7 56.3 � 7.7 52.47 � 6.60 491.0 � 79.7 0.7250–59 y 11817 1.64 � 0.06 520.5 � 53.0 53.8 � 7.7 52.08 � 6.59 509.7 � 86.0 0.7160–69 y 6305 1.62 � 0.06 522.4 � 53.7 51.3 � 7.8 51.09 � 6.61 527.4 � 94.1 0.68�70 y 1419 1.61 � 0.06 518.5 � 58.5 47.9 � 8.6 50.47 � 7.20 557.3 � 111.4 0.73
BMI �35–4018–19 y 239 1.68 � 0.07 506.5 � 50.1 54.2 � 7.9 56.11 � 7.66 530.9 � 100.6 0.7520–29 y 2857 1.67 � 0.07 506.1 � 52.4 54.9 � 7.1 55.66 � 7.39 517.0 � 86.1 0.7530–39 y 5064 1.66 � 0.06 493.2 � 50.9 53.8 � 7.1 56.63 � 7.21 523.6 � 87.5 0.7540–49 y 5462 1.64 � 0.06 484.4 � 49.2 52.2 � 7.3 56.33 � 7.17 528.4 � 88.9 0.7350–59 y 5178 1.63 � 0.07 483.8 � 50.9 49.8 � 7.4 55.69 � 7.43 547.7 � 97.8 0.7260–69 y 3090 1.62 � 0.06 484.2 � 52.0 47.1 � 7.8 54.60 � 7.38 570.6 � 108.7 0.70�70 y 685 1.59 � 0.06 479.0 � 53.1 44.0 � 8.3 53.86 � 7.44 598.9 � 120.0 0.66
BMI �40–5018–19 y 95 1.67 � 0.07 469.6 � 47.2 49.7 � 6.7 60.15 � 8.04 572.8 � 97.9 0.8020–29 y 1306 1.67 � 0.07 470.5 � 49.8 50.6 � 6.7 59.84 � 7.89 561.4 � 94.7 0.7430–39 y 2537 1.66 � 0.07 456.0 � 50.7 49.3 � 7.0 61.33 � 8.16 572.5 � 98.3 0.7540–49 y 2709 1.64 � 0.07 443.7 � 50.0 47.2 � 7.3 61.61 � 8.79 586.5 � 110.1 0.7650–59 y 2280 1.62 � 0.06 443.4 � 49.8 45.1 � 7.3 60.42 � 8.56 603.1 � 117.4 0.7760–69 y 1274 1.61 � 0.06 440.5 � 50.7 42.3 � 7.3 59.60 � 8.65 631.4 � 128.6 0.73�70 y 243 1.58 � 0.06 443.3 � 51.0 39.4 � 7.4 57.21 � 7.92 659.6 � 142.4 0.70
1 BMI is in kg/m2. R, resistance; Xc, reactance; H, height; r, correlation coefficient between H2/R and H2/Xc. ANOVA showed significant interactionsbetween age and BMI categories for both vector components (H2/R and H2/Xc).
EFFECT OF AGE ON IMPEDANCE VARIABLES 61
by guest on August 21, 2014
ajcn.nutrition.orgD
ownloaded from
All data are given as means � SDs. Statistical analyses wereperformed by using SPSS for WINDOWS 8.0 (SPSS Inc, Chi-cago, IL). Pearson’s correlation coefficients were calculated forrelations between H2/R and H2/Xc. A P value � 0.05 was con-sidered as statistically significant. Differences between age orBMI groups were analyzed by ANOVA with Bonferroni post hoctest. Interactions among age and BMI categories were also in-vestigated by ANOVA.
Confidence ellipses were calculated by using BIVA software(A Piccoli, G Pastori, Department of Medical and Surgical Sci-ences, University of Padova, Padova, Italy, 2002; available byE-mail: [email protected]). The calculation of confidence limitsfor mean impedance vectors requires bivariate normal distribu-tions of H2/R and H2/Xc and is explained in detail by Piccoli et al(1, 9). Confidence ellipses describe the area in which the meansex-, BMI-, and age-specific two-dimensional vectors fall within
a 95% probability (1). This implies that graphically nonoverlap-ping 95% confidence ellipses are significantly different fromeach other (P � 0.05; conterminous with a significant Hotell-ing’s T2 test; 1).
RESULTS
Study groups were divided into sex, BMI, and age classes asfollows: 15 605 children and adolescents were stratified into 3age groups with up to 5 BMI classes (6–9 y with BMIs of 9–13,�13–15, �15–17, and �17–25; 10–13 y with BMIs of 11–15,�15–20, �20–25, �25–30, and �30–35; and 14–17 y withBMIs of 14–19, �19–25, �25–30, �30–35, and �35–40). In213 294 adults, 5 BMI categories (normal weight: 18.5–25; over-weight: �25–30; and obese: �30–35, �35–40, and �40–50)
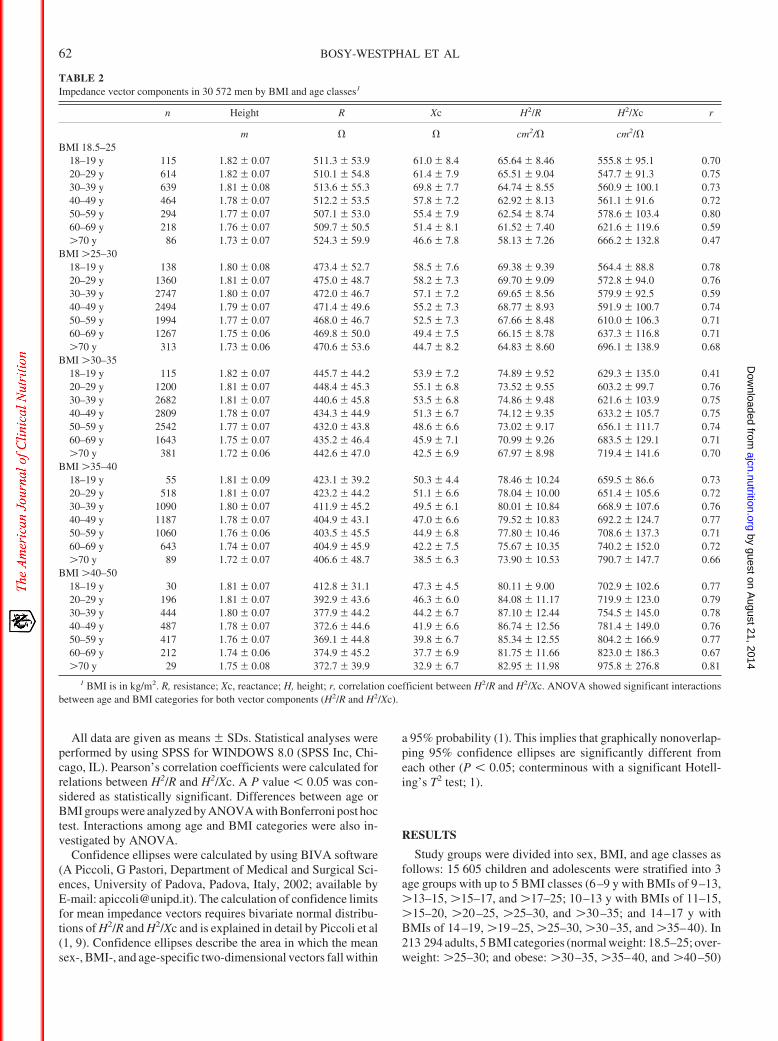
TABLE 2Impedance vector components in 30 572 men by BMI and age classes1
n Height R Xc H2/R H2/Xc r
m � � cm2/� cm2/�BMI 18.5–25
18–19 y 115 1.82 � 0.07 511.3 � 53.9 61.0 � 8.4 65.64 � 8.46 555.8 � 95.1 0.7020–29 y 614 1.82 � 0.07 510.1 � 54.8 61.4 � 7.9 65.51 � 9.04 547.7 � 91.3 0.7530–39 y 639 1.81 � 0.08 513.6 � 55.3 69.8 � 7.7 64.74 � 8.55 560.9 � 100.1 0.7340–49 y 464 1.78 � 0.07 512.2 � 53.5 57.8 � 7.2 62.92 � 8.13 561.1 � 91.6 0.7250–59 y 294 1.77 � 0.07 507.1 � 53.0 55.4 � 7.9 62.54 � 8.74 578.6 � 103.4 0.8060–69 y 218 1.76 � 0.07 509.7 � 50.5 51.4 � 8.1 61.52 � 7.40 621.6 � 119.6 0.59�70 y 86 1.73 � 0.07 524.3 � 59.9 46.6 � 7.8 58.13 � 7.26 666.2 � 132.8 0.47
BMI �25–3018–19 y 138 1.80 � 0.08 473.4 � 52.7 58.5 � 7.6 69.38 � 9.39 564.4 � 88.8 0.7820–29 y 1360 1.81 � 0.07 475.0 � 48.7 58.2 � 7.3 69.70 � 9.09 572.8 � 94.0 0.7630–39 y 2747 1.80 � 0.07 472.0 � 46.7 57.1 � 7.2 69.65 � 8.56 579.9 � 92.5 0.5940–49 y 2494 1.79 � 0.07 471.4 � 49.6 55.2 � 7.3 68.77 � 8.93 591.9 � 100.7 0.7450–59 y 1994 1.77 � 0.07 468.0 � 46.7 52.5 � 7.3 67.66 � 8.48 610.0 � 106.3 0.7160–69 y 1267 1.75 � 0.06 469.8 � 50.0 49.4 � 7.5 66.15 � 8.78 637.3 � 116.8 0.71�70 y 313 1.73 � 0.06 470.6 � 53.6 44.7 � 8.2 64.83 � 8.60 696.1 � 138.9 0.68
BMI �30–3518–19 y 115 1.82 � 0.07 445.7 � 44.2 53.9 � 7.2 74.89 � 9.52 629.3 � 135.0 0.4120–29 y 1200 1.81 � 0.07 448.4 � 45.3 55.1 � 6.8 73.52 � 9.55 603.2 � 99.7 0.7630–39 y 2682 1.81 � 0.07 440.6 � 45.8 53.5 � 6.8 74.86 � 9.48 621.6 � 103.9 0.7540–49 y 2809 1.78 � 0.07 434.3 � 44.9 51.3 � 6.7 74.12 � 9.35 633.2 � 105.7 0.7550–59 y 2542 1.77 � 0.07 432.0 � 43.8 48.6 � 6.6 73.02 � 9.17 656.1 � 111.7 0.7460–69 y 1643 1.75 � 0.07 435.2 � 46.4 45.9 � 7.1 70.99 � 9.26 683.5 � 129.1 0.71�70 y 381 1.72 � 0.06 442.6 � 47.0 42.5 � 6.9 67.97 � 8.98 719.4 � 141.6 0.70
BMI �35–4018–19 y 55 1.81 � 0.09 423.1 � 39.2 50.3 � 4.4 78.46 � 10.24 659.5 � 86.6 0.7320–29 y 518 1.81 � 0.07 423.2 � 44.2 51.1 � 6.6 78.04 � 10.00 651.4 � 105.6 0.7230–39 y 1090 1.80 � 0.07 411.9 � 45.2 49.5 � 6.1 80.01 � 10.84 668.9 � 107.6 0.7640–49 y 1187 1.78 � 0.07 404.9 � 43.1 47.0 � 6.6 79.52 � 10.83 692.2 � 124.7 0.7750–59 y 1060 1.76 � 0.06 403.5 � 45.5 44.9 � 6.8 77.80 � 10.46 708.6 � 137.3 0.7160–69 y 643 1.74 � 0.07 404.9 � 45.9 42.2 � 7.5 75.67 � 10.35 740.2 � 152.0 0.72�70 y 89 1.72 � 0.07 406.6 � 48.7 38.5 � 6.3 73.90 � 10.53 790.7 � 147.7 0.66
BMI �40–5018–19 y 30 1.81 � 0.07 412.8 � 31.1 47.3 � 4.5 80.11 � 9.00 702.9 � 102.6 0.7720–29 y 196 1.81 � 0.07 392.9 � 43.6 46.3 � 6.0 84.08 � 11.17 719.9 � 123.0 0.7930–39 y 444 1.80 � 0.07 377.9 � 44.2 44.2 � 6.7 87.10 � 12.44 754.5 � 145.0 0.7840–49 y 487 1.78 � 0.07 372.6 � 44.6 41.9 � 6.6 86.74 � 12.56 781.4 � 149.0 0.7650–59 y 417 1.76 � 0.07 369.1 � 44.8 39.8 � 6.7 85.34 � 12.55 804.2 � 166.9 0.7760–69 y 212 1.74 � 0.06 374.9 � 45.2 37.7 � 6.9 81.75 � 11.66 823.0 � 186.3 0.67�70 y 29 1.75 � 0.08 372.7 � 39.9 32.9 � 6.7 82.95 � 11.98 975.8 � 276.8 0.81
1 BMI is in kg/m2. R, resistance; Xc, reactance; H, height; r, correlation coefficient between H2/R and H2/Xc. ANOVA showed significant interactionsbetween age and BMI categories for both vector components (H2/R and H2/Xc).
62 BOSY-WESTPHAL ET AL
by guest on August 21, 2014
ajcn.nutrition.orgD
ownloaded from
were stratified into 7 age groups (18–19, 20–29, 30–39, 40–49,50–59, 60–69, and �70 y).
Shown in Tables 1–3 are all the parameters necessary forcalculation of the respective confidence or tolerance ellipses insubgroups of women (Table 1), men (Table 2), and children andadolescents (Table 3). The size of the confidence ellipses wasinfluenced by the variability of the vector components and thesample size (smaller ellipses from a greater number of subjectswith a similar SD). The shape of both the tolerance and theconfidence ellipses was determined by the coefficient of corre-lation between H2/R and H2/Xc (more flat and elongated shapewith a higher correlation).
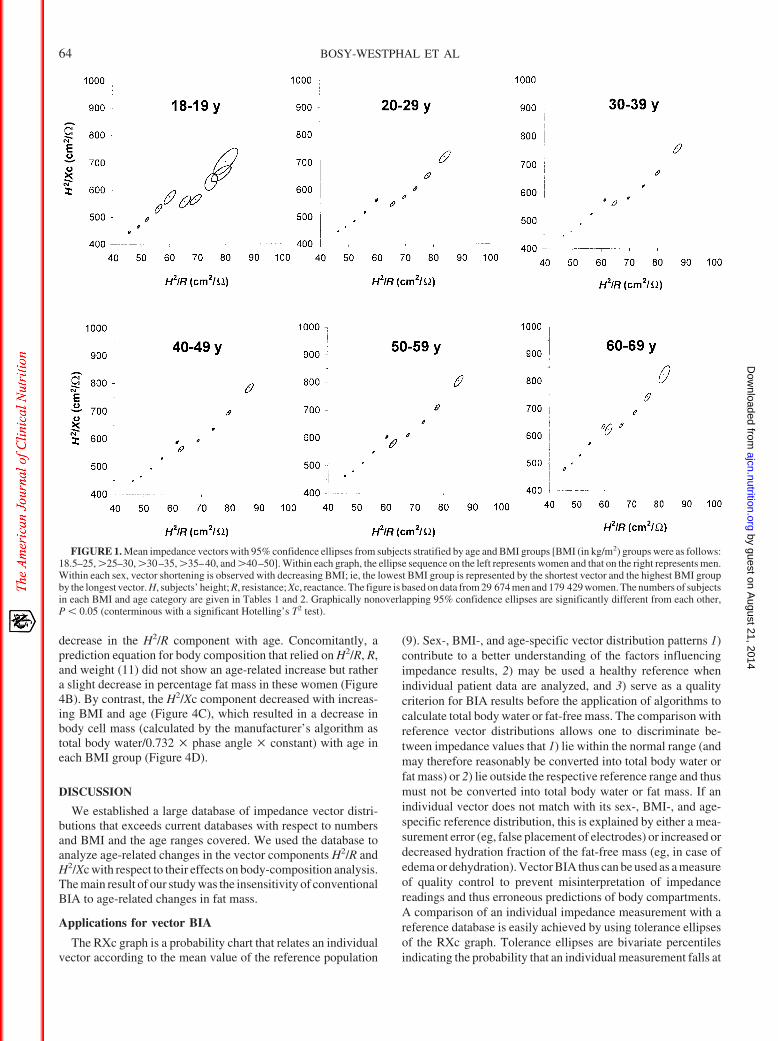
The sex and BMI dependency of the vector distribution pat-terns within age classes (95% confidence ellipses) for adults isshown in Figure 1. Within a BMI and age category, vectors forwomen were significantly shorter than those for men. With de-creasing BMI, there was a progressive shortening of the imped-ance vectors with a combined decrease of both the H2/R and theH2/Xc components, without overlapping of confidence ellipses.
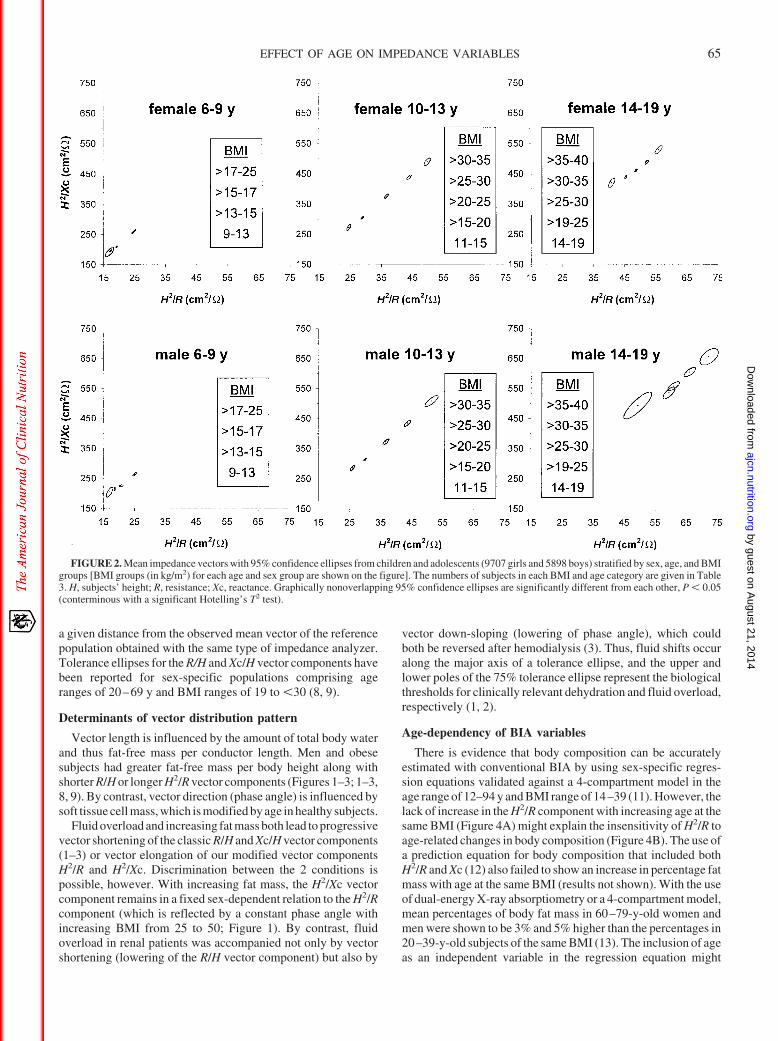
In Figure 2, 95% confidence ellipses were plotted for subgroupsof children and adolescents. Mean impedance vectors in childrenwere shorter than in adults, and a gradual vector shortening wasobserved with decreasing age. Sex differences in vector distri-bution were already apparent in children, although they were lesspronounced than in adults. Longer vectors were found in boysthan in girls of the same age and BMI group, without a differencein mean vector direction between the sexes.
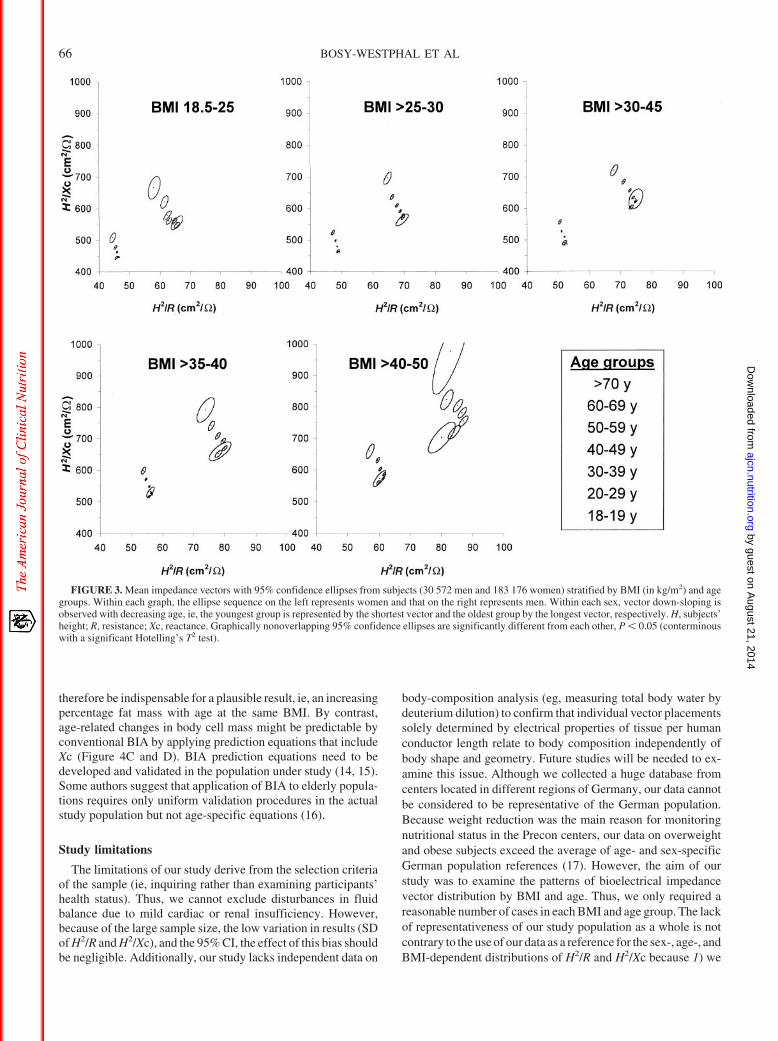
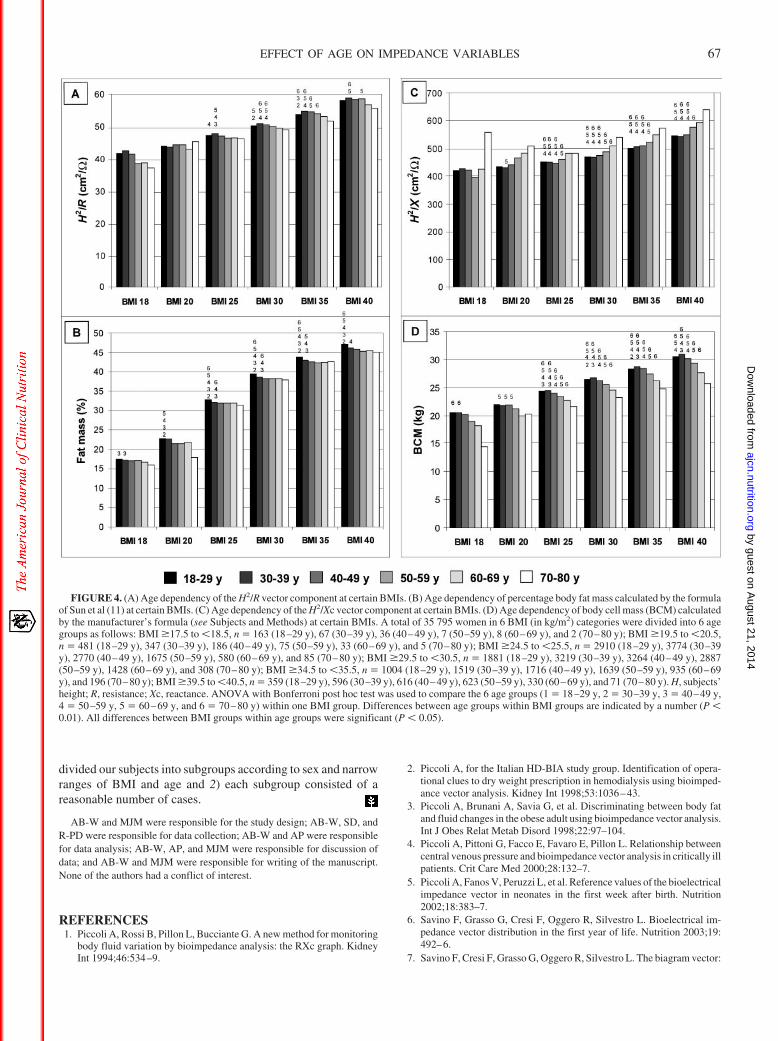
In Figure 3, the age dependency of mean vector placement isapparent as a continuous down-sloping of the mean vector as theresult of a decrease in the H2/Xc component with decreasing age.By contrast, the H2/R component within each sex and BMI groupremained fairly constant with increasing age. In Figure 4, 35 795women were divided into 6 groups of a certain BMI and 6 ageranges. This classification required a large sample size and couldtherefore not be done in men because of insufficient numbers inindividual BMI categories. As shown in Figure 4A, the H2/Rcomponent increased with increasing BMI (P � 0.05 for all agegroups), whereas there was no consistent change or even a slight
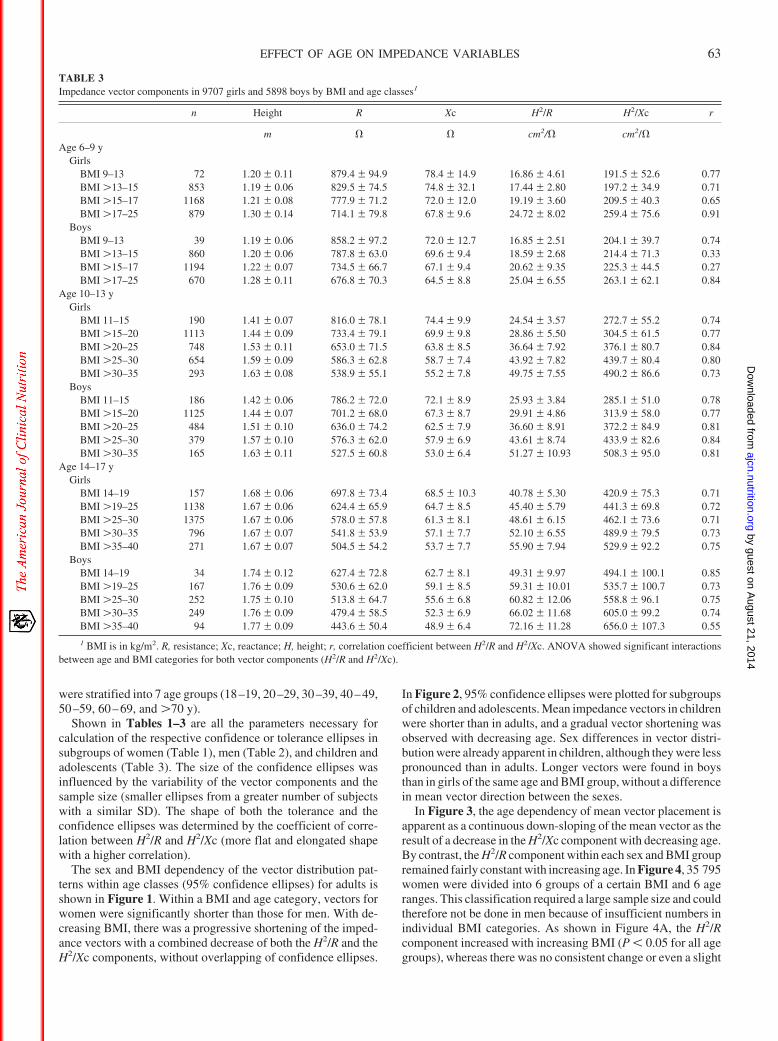
TABLE 3Impedance vector components in 9707 girls and 5898 boys by BMI and age classes1
n Height R Xc H2/R H2/Xc r
m � � cm2/� cm2/�Age 6–9 y
GirlsBMI 9–13 72 1.20 � 0.11 879.4 � 94.9 78.4 � 14.9 16.86 � 4.61 191.5 � 52.6 0.77BMI �13–15 853 1.19 � 0.06 829.5 � 74.5 74.8 � 32.1 17.44 � 2.80 197.2 � 34.9 0.71BMI �15–17 1168 1.21 � 0.08 777.9 � 71.2 72.0 � 12.0 19.19 � 3.60 209.5 � 40.3 0.65BMI �17–25 879 1.30 � 0.14 714.1 � 79.8 67.8 � 9.6 24.72 � 8.02 259.4 � 75.6 0.91
BoysBMI 9–13 39 1.19 � 0.06 858.2 � 97.2 72.0 � 12.7 16.85 � 2.51 204.1 � 39.7 0.74BMI �13–15 860 1.20 � 0.06 787.8 � 63.0 69.6 � 9.4 18.59 � 2.68 214.4 � 71.3 0.33BMI �15–17 1194 1.22 � 0.07 734.5 � 66.7 67.1 � 9.4 20.62 � 9.35 225.3 � 44.5 0.27BMI �17–25 670 1.28 � 0.11 676.8 � 70.3 64.5 � 8.8 25.04 � 6.55 263.1 � 62.1 0.84
Age 10–13 yGirls
BMI 11–15 190 1.41 � 0.07 816.0 � 78.1 74.4 � 9.9 24.54 � 3.57 272.7 � 55.2 0.74BMI �15–20 1113 1.44 � 0.09 733.4 � 79.1 69.9 � 9.8 28.86 � 5.50 304.5 � 61.5 0.77BMI �20–25 748 1.53 � 0.11 653.0 � 71.5 63.8 � 8.5 36.64 � 7.92 376.1 � 80.7 0.84BMI �25–30 654 1.59 � 0.09 586.3 � 62.8 58.7 � 7.4 43.92 � 7.82 439.7 � 80.4 0.80BMI �30–35 293 1.63 � 0.08 538.9 � 55.1 55.2 � 7.8 49.75 � 7.55 490.2 � 86.6 0.73
BoysBMI 11–15 186 1.42 � 0.06 786.2 � 72.0 72.1 � 8.9 25.93 � 3.84 285.1 � 51.0 0.78BMI �15–20 1125 1.44 � 0.07 701.2 � 68.0 67.3 � 8.7 29.91 � 4.86 313.9 � 58.0 0.77BMI �20–25 484 1.51 � 0.10 636.0 � 74.2 62.5 � 7.9 36.60 � 8.91 372.2 � 84.9 0.81BMI �25–30 379 1.57 � 0.10 576.3 � 62.0 57.9 � 6.9 43.61 � 8.74 433.9 � 82.6 0.84BMI �30–35 165 1.63 � 0.11 527.5 � 60.8 53.0 � 6.4 51.27 � 10.93 508.3 � 95.0 0.81
Age 14–17 yGirls
BMI 14–19 157 1.68 � 0.06 697.8 � 73.4 68.5 � 10.3 40.78 � 5.30 420.9 � 75.3 0.71BMI �19–25 1138 1.67 � 0.06 624.4 � 65.9 64.7 � 8.5 45.40 � 5.79 441.3 � 69.8 0.72BMI �25–30 1375 1.67 � 0.06 578.0 � 57.8 61.3 � 8.1 48.61 � 6.15 462.1 � 73.6 0.71BMI �30–35 796 1.67 � 0.07 541.8 � 53.9 57.1 � 7.7 52.10 � 6.55 489.9 � 79.5 0.73BMI �35–40 271 1.67 � 0.07 504.5 � 54.2 53.7 � 7.7 55.90 � 7.94 529.9 � 92.2 0.75
BoysBMI 14–19 34 1.74 � 0.12 627.4 � 72.8 62.7 � 8.1 49.31 � 9.97 494.1 � 100.1 0.85BMI �19–25 167 1.76 � 0.09 530.6 � 62.0 59.1 � 8.5 59.31 � 10.01 535.7 � 100.7 0.73BMI �25–30 252 1.75 � 0.10 513.8 � 64.7 55.6 � 6.8 60.82 � 12.06 558.8 � 96.1 0.75BMI �30–35 249 1.76 � 0.09 479.4 � 58.5 52.3 � 6.9 66.02 � 11.68 605.0 � 99.2 0.74BMI �35–40 94 1.77 � 0.09 443.6 � 50.4 48.9 � 6.4 72.16 � 11.28 656.0 � 107.3 0.55
1 BMI is in kg/m2. R, resistance; Xc, reactance; H, height; r, correlation coefficient between H2/R and H2/Xc. ANOVA showed significant interactionsbetween age and BMI categories for both vector components (H2/R and H2/Xc).
EFFECT OF AGE ON IMPEDANCE VARIABLES 63
by guest on August 21, 2014
ajcn.nutrition.orgD
ownloaded from
decrease in the H2/R component with age. Concomitantly, aprediction equation for body composition that relied on H2/R, R,and weight (11) did not show an age-related increase but rathera slight decrease in percentage fat mass in these women (Figure4B). By contrast, the H2/Xc component decreased with increas-ing BMI and age (Figure 4C), which resulted in a decrease inbody cell mass (calculated by the manufacturer’s algorithm astotal body water/0.732 � phase angle � constant) with age ineach BMI group (Figure 4D).
DISCUSSION
We established a large database of impedance vector distri-butions that exceeds current databases with respect to numbersand BMI and the age ranges covered. We used the database toanalyze age-related changes in the vector components H2/R andH2/Xc with respect to their effects on body-composition analysis.The main result of our study was the insensitivity of conventionalBIA to age-related changes in fat mass.
Applications for vector BIA
The RXc graph is a probability chart that relates an individualvector according to the mean value of the reference population
(9). Sex-, BMI-, and age-specific vector distribution patterns 1)contribute to a better understanding of the factors influencingimpedance results, 2) may be used a healthy reference whenindividual patient data are analyzed, and 3) serve as a qualitycriterion for BIA results before the application of algorithms tocalculate total body water or fat-free mass. The comparison withreference vector distributions allows one to discriminate be-tween impedance values that 1) lie within the normal range (andmay therefore reasonably be converted into total body water orfat mass) or 2) lie outside the respective reference range and thusmust not be converted into total body water or fat mass. If anindividual vector does not match with its sex-, BMI-, and age-specific reference distribution, this is explained by either a mea-surement error (eg, false placement of electrodes) or increased ordecreased hydration fraction of the fat-free mass (eg, in case ofedema or dehydration). Vector BIA thus can be used as a measureof quality control to prevent misinterpretation of impedancereadings and thus erroneous predictions of body compartments.A comparison of an individual impedance measurement with areference database is easily achieved by using tolerance ellipsesof the RXc graph. Tolerance ellipses are bivariate percentilesindicating the probability that an individual measurement falls at
FIGURE 1. Mean impedance vectors with 95% confidence ellipses from subjects stratified by age and BMI groups [BMI (in kg/m2) groups were as follows:18.5–25, �25–30, �30–35, �35–40, and �40–50]. Within each graph, the ellipse sequence on the left represents women and that on the right represents men.Within each sex, vector shortening is observed with decreasing BMI; ie, the lowest BMI group is represented by the shortest vector and the highest BMI groupby the longest vector. H, subjects’ height; R, resistance; Xc, reactance. The figure is based on data from 29 674 men and 179 429 women. The numbers of subjectsin each BMI and age category are given in Tables 1 and 2. Graphically nonoverlapping 95% confidence ellipses are significantly different from each other,P � 0.05 (conterminous with a significant Hotelling’s T2 test).
64 BOSY-WESTPHAL ET AL
by guest on August 21, 2014
ajcn.nutrition.orgD
ownloaded from
a given distance from the observed mean vector of the referencepopulation obtained with the same type of impedance analyzer.Tolerance ellipses for the R/H and Xc/H vector components havebeen reported for sex-specific populations comprising ageranges of 20–69 y and BMI ranges of 19 to �30 (8, 9).
Determinants of vector distribution pattern
Vector length is influenced by the amount of total body waterand thus fat-free mass per conductor length. Men and obesesubjects had greater fat-free mass per body height along withshorter R/H or longer H2/R vector components (Figures 1–3; 1–3,8, 9). By contrast, vector direction (phase angle) is influenced bysoft tissue cell mass, which is modified by age in healthy subjects.
Fluid overload and increasing fat mass both lead to progressivevector shortening of the classic R/H and Xc/H vector components(1–3) or vector elongation of our modified vector componentsH2/R and H2/Xc. Discrimination between the 2 conditions ispossible, however. With increasing fat mass, the H2/Xc vectorcomponent remains in a fixed sex-dependent relation to the H2/Rcomponent (which is reflected by a constant phase angle withincreasing BMI from 25 to 50; Figure 1). By contrast, fluidoverload in renal patients was accompanied not only by vectorshortening (lowering of the R/H vector component) but also by
vector down-sloping (lowering of phase angle), which couldboth be reversed after hemodialysis (3). Thus, fluid shifts occuralong the major axis of a tolerance ellipse, and the upper andlower poles of the 75% tolerance ellipse represent the biologicalthresholds for clinically relevant dehydration and fluid overload,respectively (1, 2).
Age-dependency of BIA variables
There is evidence that body composition can be accuratelyestimated with conventional BIA by using sex-specific regres-sion equations validated against a 4-compartment model in theage range of 12–94 y and BMI range of 14–39 (11). However, thelack of increase in the H2/R component with increasing age at thesame BMI (Figure 4A) might explain the insensitivity of H2/R toage-related changes in body composition (Figure 4B). The use ofa prediction equation for body composition that included bothH2/R and Xc (12) also failed to show an increase in percentage fatmass with age at the same BMI (results not shown). With the useof dual-energy X-ray absorptiometry or a 4-compartment model,mean percentages of body fat mass in 60–79-y-old women andmen were shown to be 3% and 5% higher than the percentages in20–39-y-old subjects of the same BMI (13). The inclusion of ageas an independent variable in the regression equation might
FIGURE 2. Mean impedance vectors with 95% confidence ellipses from children and adolescents (9707 girls and 5898 boys) stratified by sex, age, and BMIgroups [BMI groups (in kg/m2) for each age and sex group are shown on the figure]. The numbers of subjects in each BMI and age category are given in Table3. H, subjects’ height; R, resistance; Xc, reactance. Graphically nonoverlapping 95% confidence ellipses are significantly different from each other, P � 0.05(conterminous with a significant Hotelling’s T2 test).
EFFECT OF AGE ON IMPEDANCE VARIABLES 65
by guest on August 21, 2014
ajcn.nutrition.orgD
ownloaded from
therefore be indispensable for a plausible result, ie, an increasingpercentage fat mass with age at the same BMI. By contrast,age-related changes in body cell mass might be predictable byconventional BIA by applying prediction equations that includeXc (Figure 4C and D). BIA prediction equations need to bedeveloped and validated in the population under study (14, 15).Some authors suggest that application of BIA to elderly popula-tions requires only uniform validation procedures in the actualstudy population but not age-specific equations (16).
Study limitations
The limitations of our study derive from the selection criteriaof the sample (ie, inquiring rather than examining participants’health status). Thus, we cannot exclude disturbances in fluidbalance due to mild cardiac or renal insufficiency. However,because of the large sample size, the low variation in results (SDof H2/R and H2/Xc), and the 95% CI, the effect of this bias shouldbe negligible. Additionally, our study lacks independent data on
body-composition analysis (eg, measuring total body water bydeuterium dilution) to confirm that individual vector placementssolely determined by electrical properties of tissue per humanconductor length relate to body composition independently ofbody shape and geometry. Future studies will be needed to ex-amine this issue. Although we collected a huge database fromcenters located in different regions of Germany, our data cannotbe considered to be representative of the German population.Because weight reduction was the main reason for monitoringnutritional status in the Precon centers, our data on overweightand obese subjects exceed the average of age- and sex-specificGerman population references (17). However, the aim of ourstudy was to examine the patterns of bioelectrical impedancevector distribution by BMI and age. Thus, we only required areasonable number of cases in each BMI and age group. The lackof representativeness of our study population as a whole is notcontrary to the use of our data as a reference for the sex-, age-, andBMI-dependent distributions of H2/R and H2/Xc because 1) we
FIGURE 3. Mean impedance vectors with 95% confidence ellipses from subjects (30 572 men and 183 176 women) stratified by BMI (in kg/m2) and agegroups. Within each graph, the ellipse sequence on the left represents women and that on the right represents men. Within each sex, vector down-sloping isobserved with decreasing age, ie, the youngest group is represented by the shortest vector and the oldest group by the longest vector, respectively. H, subjects’height; R, resistance; Xc, reactance. Graphically nonoverlapping 95% confidence ellipses are significantly different from each other, P � 0.05 (conterminouswith a significant Hotelling’s T2 test).
66 BOSY-WESTPHAL ET AL
by guest on August 21, 2014
ajcn.nutrition.orgD
ownloaded from
divided our subjects into subgroups according to sex and narrowranges of BMI and age and 2) each subgroup consisted of areasonable number of cases.
AB-W and MJM were responsible for the study design; AB-W, SD, andR-PD were responsible for data collection; AB-W and AP were responsiblefor data analysis; AB-W, AP, and MJM were responsible for discussion ofdata; and AB-W and MJM were responsible for writing of the manuscript.None of the authors had a conflict of interest.
REFERENCES1. Piccoli A, Rossi B, Pillon L, Bucciante G. A new method for monitoring
body fluid variation by bioimpedance analysis: the RXc graph. KidneyInt 1994;46:534–9.
2. Piccoli A, for the Italian HD-BIA study group. Identification of opera-tional clues to dry weight prescription in hemodialysis using bioimped-ance vector analysis. Kidney Int 1998;53:1036–43.
3. Piccoli A, Brunani A, Savia G, et al. Discriminating between body fatand fluid changes in the obese adult using bioimpedance vector analysis.Int J Obes Relat Metab Disord 1998;22:97–104.
4. Piccoli A, Pittoni G, Facco E, Favaro E, Pillon L. Relationship betweencentral venous pressure and bioimpedance vector analysis in critically illpatients. Crit Care Med 2000;28:132–7.
5. Piccoli A, Fanos V, Peruzzi L, et al. Reference values of the bioelectricalimpedance vector in neonates in the first week after birth. Nutrition2002;18:383–7.
6. Savino F, Grasso G, Cresi F, Oggero R, Silvestro L. Bioelectrical im-pedance vector distribution in the first year of life. Nutrition 2003;19:492–6.
7. Savino F, Cresi F, Grasso G, Oggero R, Silvestro L. The biagram vector:
FIGURE 4. (A) Age dependency of the H2/R vector component at certain BMIs. (B) Age dependency of percentage body fat mass calculated by the formulaof Sun et al (11) at certain BMIs. (C) Age dependency of the H2/Xc vector component at certain BMIs. (D) Age dependency of body cell mass (BCM) calculatedby the manufacturer’s formula (see Subjects and Methods) at certain BMIs. A total of 35 795 women in 6 BMI (in kg/m2) categories were divided into 6 agegroups as follows: BMI �17.5 to �18.5, n � 163 (18–29 y), 67 (30–39 y), 36 (40–49 y), 7 (50–59 y), 8 (60–69 y), and 2 (70–80 y); BMI �19.5 to �20.5,n � 481 (18–29 y), 347 (30–39 y), 186 (40–49 y), 75 (50–59 y), 33 (60–69 y), and 5 (70–80 y); BMI �24.5 to �25.5, n � 2910 (18–29 y), 3774 (30–39y), 2770 (40–49 y), 1675 (50–59 y), 580 (60–69 y), and 85 (70–80 y); BMI �29.5 to �30.5, n � 1881 (18–29 y), 3219 (30–39 y), 3264 (40–49 y), 2887(50–59 y), 1428 (60–69 y), and 308 (70–80 y); BMI �34.5 to �35.5, n � 1004 (18–29 y), 1519 (30–39 y), 1716 (40–49 y), 1639 (50–59 y), 935 (60–69y), and 196 (70–80 y); BMI �39.5 to �40.5, n � 359 (18–29 y), 596 (30–39 y), 616 (40–49 y), 623 (50–59 y), 330 (60–69 y), and 71 (70–80 y). H, subjects’height; R, resistance; Xc, reactance. ANOVA with Bonferroni post hoc test was used to compare the 6 age groups (1 � 18–29 y, 2 � 30–39 y, 3 � 40–49 y,4 � 50–59 y, 5 � 60–69 y, and 6 � 70–80 y) within one BMI group. Differences between age groups within BMI groups are indicated by a number (P �0.01). All differences between BMI groups within age groups were significant (P � 0.05).
EFFECT OF AGE ON IMPEDANCE VARIABLES 67
by guest on August 21, 2014
ajcn.nutrition.orgD
ownloaded from
a graphical relation between reactance and phase angle measured bybioelectrical analysis in infants. Ann Nutr Metab 2004;48:84–9.
8. Piccoli A, Nigrelli S, Caberlotto A, et al. Bivariate normal values of thebioelectrical impedance vector in adult and elderly populations. Am JClin Nutr 1995;61:269–70.
9. Piccoli A, Pillon L, Dumler F. Impedance vector distribution by sex,race, body mass index, and age in the United States: standard referenceintervals as bivariate Z scores. Nutrition 2002;18:153–67.
10. Kushner RF. Bioelectrical impedance analysis: a review of principalsand applications. Am Coll Nutr 1992;11:199–209.
11. Sun SS, Chumlea WC, Heymsfield SB, et al. Development of bioelec-trical impedance analysis prediction equations for body compositionwith the use of a multicomponent model for use in epidemiologic sur-veys. Am J Clin Nutr 2003;77:331–40.
12. Kyle UG, Genton L, Karsegard L, Slosman DO, Pichard C. Singleprediction equation for bioelectrical impedance analysis in adults aged20–94yrs. Nutrition 2001;17:248–53.
13. Gallagher D, Heymsfield SB, Heo M, Jebb SA, Murgatroyd PR, Saka-moto Y. Healthy percentage of body fat ranges: an approach for devel-oping guidelines based on body mass index. Am J Clin Nutr 2000;72:694–701.
14. Dey DK, Bosaeus I. Comparison of bioelectrical impedance predictionequations for fat-free mass in a population-based sample of 75 y olds: theNORA study. Nutrition 2003;19:858–64.
15. Genton L, Karsegard VL, Kyle UG, Hans DB, Michel JP, Pichard C.Comparison of four bioelectrical impedance analysis formulas in healthyelderly subjects. Gerontology 2001;47:315–23.
16. Roubenoff R, Baumgartner RN, Harris TB, et al. Application of bioel-ectrical impedance analysis to elderly populations. J Gerontol A Biol SciMed Sci 1997;52:M129–36.
17. G Mensink. Ubergewicht. [Overweight.] In: Beitrage zur Gesundheits-berichterstattung des Bundes. Was essen wir heute? Ernahrungsver-halten in Deutschland. [Contributions to the German Nutrition Survey.Nutrition habits in Germany.] Berlin: Robert Koch Institut, 2002 (inGerman).
68 BOSY-WESTPHAL ET AL
by guest on August 21, 2014
ajcn.nutrition.orgD
ownloaded from
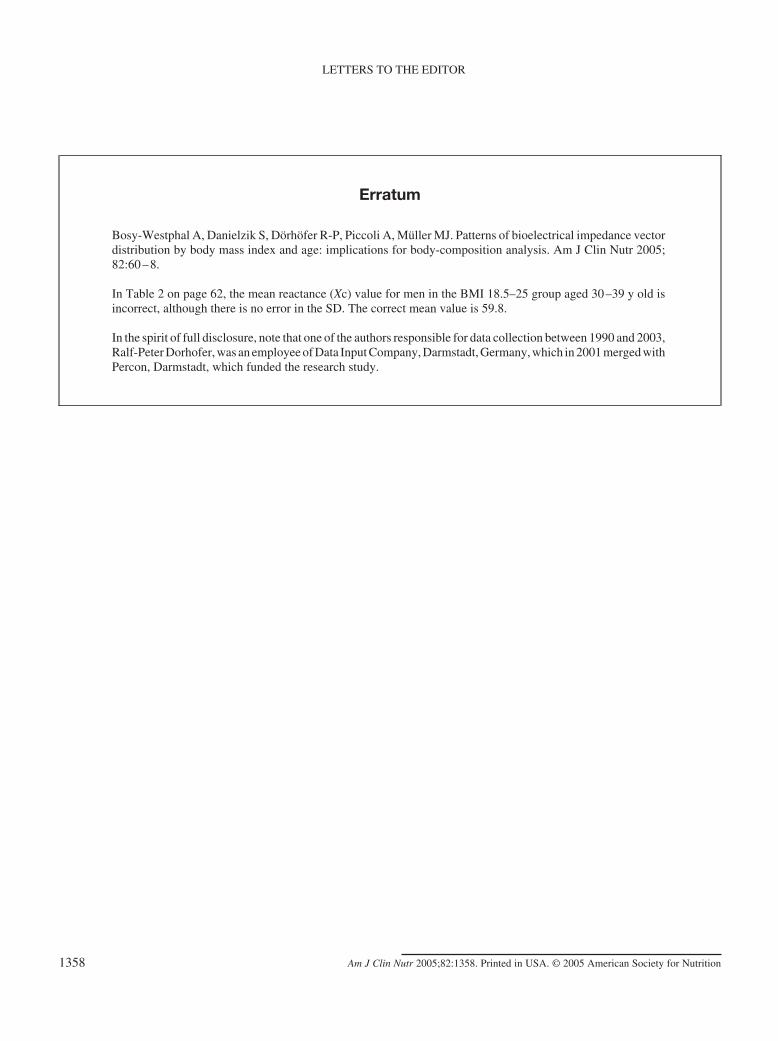
Erratum
Bosy-Westphal A, Danielzik S, Dörhöfer R-P, Piccoli A, Muller MJ. Patterns of bioelectrical impedance vectordistribution by body mass index and age: implications for body-composition analysis. Am J Clin Nutr 2005;82:60–8.
In Table 2 on page 62, the mean reactance (Xc) value for men in the BMI 18.5–25 group aged 30–39 y old isincorrect, although there is no error in the SD. The correct mean value is 59.8.
In the spirit of full disclosure, note that one of the authors responsible for data collection between 1990 and 2003,Ralf-Peter Dorhofer, was an employee of Data Input Company, Darmstadt, Germany, which in 2001 merged withPercon, Darmstadt, which funded the research study.
1358 Am J Clin Nutr 2005;82:1358. Printed in USA. © 2005 American Society for Nutrition
LETTERS TO THE EDITOR