PATTERNS AND DETERMINANTS OF EDUCATIONAL ... - UOK
299
PATTERNS AND DETERMINANTS OF EDUCATIONAL ATTAINMENT A STUDY OF CHITTAURGARH DISTRICT A THESIS Submitted for the Award of Ph.D. Degree In Geography (Faculty of Social Science) To the University of Kota By Durga Kadel Under the Supervision of Dr. M.Z.A. Khan Department of Geography Government Arts College, Kota (Raj.) UNIVERSITY OF KOTA, KOTA (RAJASTHAN) 2019
-
Upload
khangminh22 -
Category
Documents
-
view
0 -
download
0
Transcript of PATTERNS AND DETERMINANTS OF EDUCATIONAL ... - UOK
PATTERNS AND DETERMINANTS OF EDUCATIONAL ATTAINMENT
A STUDY OF CHITTAURGARH DISTRICT
A THESIS
Submitted for the Award of Ph.D. Degree
In Geography
(Faculty of Social Science)
To the
University of Kota
By
Durga Kadel
Under the Supervision of
Dr. M.Z.A. Khan
Department of Geography Government Arts College, Kota (Raj.)
UNIVERSITY OF KOTA, KOTA (RAJASTHAN)
2019
CERTIFICATE
I feel great pleasure in certifying that the thesis entitled "Patterns and
Determinants of Educational Attainment–A Study of Chittaurgarh District" by
Durga Kadel under my guidance. She has completed the following requirements as per
Ph.D. regulations of the university.
(a) Course work as per the University rules.
(b) Residential requirement of the University, (200 days).
(c) Regularly submitted Annual Progress Report.
(d) Presented her work in the Departmental Committee.
(e) Published/Accepted minimum of two research paper in a referred research
journal.
I recommended the submission of thesis.
Date: Dr. M.Z.A. Khan
Supervisor
ANTI-PLAGIARISM CERTIFICATE
It is certificated that Ph.D. thesis titled "Patterns and Determinants of
Educational Attainment – A Study of Chittaurgarh District" by Durga Kadel has
been examined by us with the following anti-plagiarism tools. We undertake the
follows:
a. Thesis has significant new work/knowledge as compared already published
elsewhere. No sentence, equation, diagram, table, paragraph or section has been
copied verbatim from previous work unless it is placed under quotation marks
and duly referenced.
b. The work presented is original and own work of the author (i.e. there is no
plagiarism). No ideas, processes, results or words of others have been presented
as author's own work.
c. There is no falsification by manipulating research materials, equipment or
processes, or changing or minting data or results such that the research is not
accurately represented in the research record.
d. There is no fabrication of data or results which have been completed and
analyzed.
e. The thesis has been checked using “URKUND” software and found within
limits as per HEC plagiarism policy and instructions issued from time to time.
(Name & Signature of (Name & Signature and Seal of
Research Scholar) Research Supervisor)
Place: Place:
Date: Date:
ABSTRACT
Literacy is one of the most important indicators of socio-economic and political
development of a society. Literacy discharges many functions in the society, that is;
Socialization, Communication knowledge and information, Contribution to social,
political and economic development, Development of human resources, Character
building and personality development, Social, ethical and democratic control.
The study attempts to present the holistic picture of the pattern of literacy system
in Chittaurgarh district. This study is an interpretative and analytical investigation of the
impacts of literacy system on the community of the district, affecting the economic,
social and cultural development of the place. The main objectives of the present
research work to study the growth of literacy, various literacy programs and their
consequences, current educational status, analyze the possibilities of future progress of
literacy rate, suggest the appropriate strategies designed for the eradication of problems
and develop a strategy to make Chittaurgarh district a complete literate district.
During the last 60 years there has been an appreciable continuous increase in the
level of literacy as from 7.07 percent in 1951; it has risen to 61.71 percent in 2011
Census. When we examine the progress of literacy in 20th Century, it was slow till 1951.
The post 1951 period association with quickening pace of the urbanization process,
opening of a very large number of new schools, social awareness about especially girls
education development, new technology in schools and society, increasing educational
facilities along with availability of female teachers in abundance particularly in rural
areas, increasing value of female education for matrimony, increasing degree of socio-
economic awareness, waning social taboos and prejudices against female education,
Scheduled Tribe and Caste.
The analysis has recorded wide range disparity among different types of literacy.
The data shows not only that the rate of literacy is low case of female, rural, scheduled
caste and scheduled tribe population but the difference among groups male-female,
rural-urban and scheduled caste, scheduled tribe is critically high. Special efforts should
be made not only to curb these gaps but also to increase overall literacy rate so that
dream of making the district a complete literate division be fulfilled.
Various schemes were introduced by the Central and State government through
their own support and with external assistance from time to time, but their remained
lack of continuity in terms of objectives, contents, mode of implementation and
operationalization of schemes. More emphasis is being laid on development of
education on in the area through various programmed for e.g. Adarsh and Utkrist
Vidhyalaya Yojana, State Initiative for Quality Education, Activity Based Learning,
Kasturba Gandhi Balika Vidhyalaya, Sharda Girls Hostel, Residential Training,
Community Mobilization, Information Communication Technology Scheme,
Vocational Education Program, School Integration, Inclusive Education for Disabled at
Secondary Stage, Staff Rationalization, Swami Vivekanand Government Model
Schools, Transport Voucher Scheme, School Water Sanitation and Hygiene Education
Program, Saakshar Bharat Program, Jan Shikshan Sansthan, Mid-Day Meal Scheme,
Scheme for Infrastructure Development in Minority Institutes, Scheme to provide
quality education in madrasas and Right to Education, Samagra Shiksha etc.
Having reached an effective literacy rate of 61.71 percent (76.61 percent for males
and 46.53 percent for females) in 2011, the area seems to have attained a respectable
place in terms of literacy but the prospects in the area of education is that are-firstly,
although in terms of effective literacy (aged 7 & above) the male-female differentials
have squeezed down. Secondly, promoting higher education requires opening up higher
education institutions, enrolling students and recruiting the faculty. Thirdly, distribution
of educated workers in different sectors of economy holds the key to diversification of
occupational structure of a society. Fourthly, of recent there had been a growing
demand in the area to allow greater access to the private sector in the field of education
with a view to achieve its expansion plans as well as to provide competition for
improving the quality of education in the area.
The government efforts for universalization of education and comprehensive
literacy drive have yielded positive results. These efforts have helped in growth of
literacy rates. There is necessity of addressing various policy issues, which need
attention for sustainable growth of literacy rates. The objective of the program is to
include all children under education, where the number of non-nominated children is
low and all the illiterates are up to 35 years of age. However the situation of growth of
literacy is not an issue to covers only through the allocation of funds and opening of
new primary, upper primary, secondary and senior secondary schools as well as literacy
centers. There are various constraints in literacy program, which need to be addressed
in the requisite manner. For this purpose various policy measures are required to be
taken at the national and State level for addressing the quantitative and qualitative
issues of literacy, which are equally important and overlooking those would reflect over
the growth of literacy rate in sustainable manner, that are addressing the lacking areas,
quality of education, quality issues, the use of ICT in education remains limited, teacher
development and management, equity issues, drop out issues, governance and
management, budgetary constraints, coordination in government and private efforts etc.
The overall result of the present research has shown that the total literacy has
increased over the years. Though the literacy rate has increased in the district yet there
are only certain sections of society which have been benefited by this overall increase.
For example, in case of female, rural, scheduled caste and scheduled tribe, the position
of literacy is still critical.
The present study divided into six chapters. Chapter I deal with the introduction
and importance of literacy in society and economy, discussion on cartographic and
statistical techniques used. In chapter II, detailed service of literature has been made.
This chapter also contains the choice of study area; Chapter III is devoted to “Pattern of
literacy-1981, 1991, 2001 & 2011". Besides discuss the level and changes of total
literacy, male-female literacy. This chapter consists of not only the level of rural- urban
literacy but also about the changes of rural-urban literacy. This chapter discussing the
level and changes of scheduled caste and scheduled tribe. Chapter IV deals with
education facilities and efforts for literacy in Chittaurgarh district begins with a detailed
discussion on various State and centre sponsored programs to increase the levels of
literacy in Chittaurgarh district. Chapter V is devoted to “Educational Parameters” for
Village sample survey and describes the variations in Village area. Chapter VI deals
with the conclusions and policy issues drawn from the whole study and
recommendations are made to make Chittaurgarh a complete literate district.
Durga Kadel
CANDIDATE'S DECLARATION
I hereby certify that the work which is being presented in the thesis entitled
"Patterns and Determinants of Educational Attainment–A Study of Chittaurgarh
District" in partial fulfillment of the requirement for the award of the degree of Doctor
of Philosophy, carried out under the supervision of Dr. M.Z.A. Khan and submitted to
University of Kota, represents my idea in my own words and where other ideas or
words have been included, I have adequately cited and referenced the original sources.
The work presented in this thesis has not been submitted elsewhere for the award of any
other degree or diploma from any institution.
I also declare that I have adhered to all principles of academic honesty and
integrity and have not misrepresented or fabricated or falsified any idea/data/fact/source
in my submission. I understand that any violation of the above will cause for
disciplinary action by the University and can also evoke penal action from the sources
which have thus not been properly cited or from whom proper permission has not been
taken when needed.
Place: Kota Durga Kadel
Date: (Research Scholar)
This is certifying that above statement made by Durga Kadel, Registration No. F-61 ( )
/Res/UOK/2013/ 11845–46 is correct to the best of my knowledge.
Date: Dr. M.Z.A. Khan
(Research Supervisor)
ACKNOWLEDGEMENT
Life is a long journey, during which we come across many souls and few of
them leave a strong impression on us because of their rectitude and grandeur. I feel
overwhelmed to spell few such supportive souls who helped me to accomplish this
Ph.D. work in one way or other.
My guide and mentor Dr. M.Z.A. Khan, Associate Professor, Department of
Geography, Govt. Arts College, Kota. Diction seems inadequate to express my
indebtedness and appreciation for his sagacious guidance, unfailing interest, critical
appreciation, moral boasting and magnanimity which not only created congenial
atmosphere, but also made work enjoyable. Without his keen efforts and selfless help it
would not have been possible to bring out this Ph.D. work. I would like to express the
inexpressible thanks and immense gratefulness to my younger brother Mr. Ram Krishna
Kadel for his precious suggestions, guidance and support all through my Ph.D. work
like: Tabulation, Map work, Presentation, Written Work etc. Also I would like to
express my special thanks to Prof. R.D. Gupta, Professor (Retd.) Geography
Department, Rajasthan University, Jaipur continuously assisted and supported through
my Ph.D. work with valuable suggestions, valuable comments, precious knowledge and
parental care. I will fail in my duty if i do not thank for their support time to time to
enable me accomplish my Ph.D. work.
I applaud to my well wisher my companion my brother Mahesh Kadel, my elder
sister's Lakshmi Thakur, Saraswati Kadel and my Jijaji Mr. Devendra Thakur for
benevolent support, encouragement and backup which constantly kept me charged
while writing my Ph.D. work. I wish to express my thanks to all government officials
and research institutions that provided me needful help and information.
The Ph.D. is solely dedicated to my respected Padmashree Sri Sri 1008
Narayandasji Maharajji (Triveni Dham - Shapura, Jaipur), and my parents father Shri
R.S.Verma and mother Shrimati Sita Verma who has always constantly encouraged and
reminded me to achieve this goal is life. I do not have enough work Ph.D. thesis to
thank you; I just dedicate this Ph.D. thesis to you. And I am also thankful to Mr.
Surendra, Ronak, Pramod and Jaiprakash who have done my typing work on time.
Last but not the least; I thank the almighty for blessing me with all the good
opportunities in life. Research Scholar
Durga Kadel
I
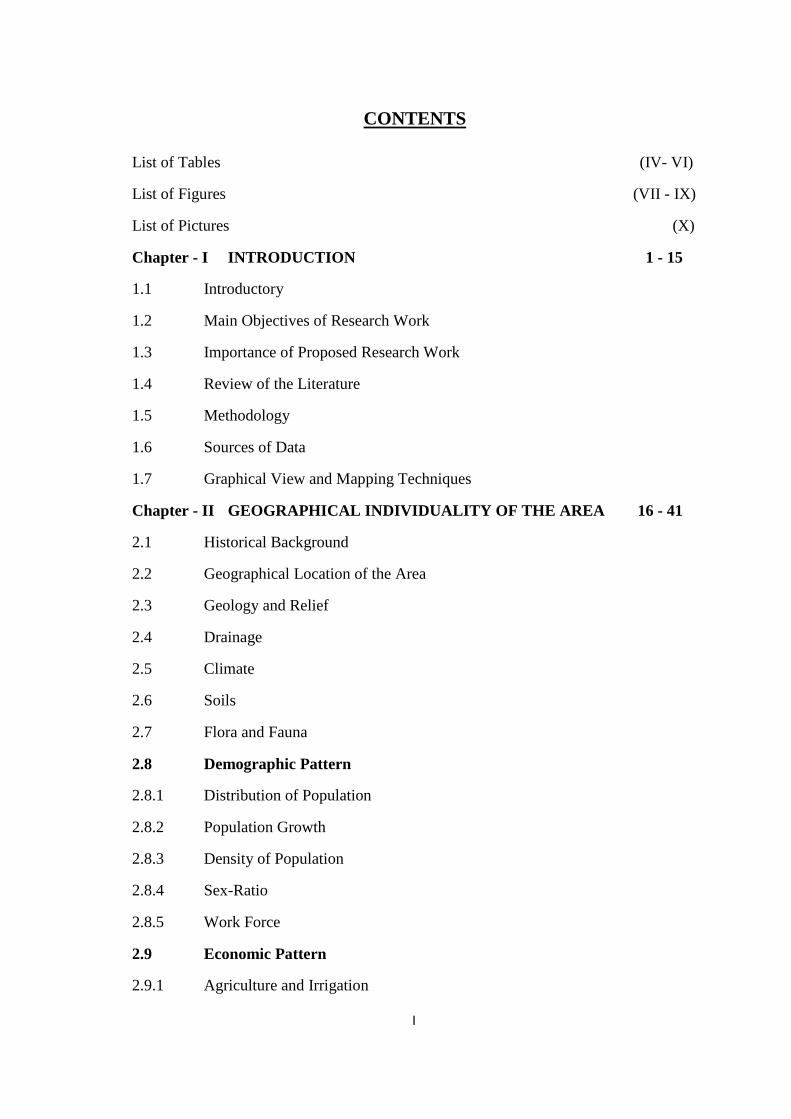
CONTENTS
List of Tables (IV- VI)
List of Figures (VII - IX)
List of Pictures (X)
Chapter - I INTRODUCTION 1 - 15
1.1 Introductory
1.2 Main Objectives of Research Work
1.3 Importance of Proposed Research Work
1.4 Review of the Literature
1.5 Methodology
1.6 Sources of Data
1.7 Graphical View and Mapping Techniques
Chapter - II GEOGRAPHICAL INDIVIDUALITY OF THE AREA 16 - 41
2.1 Historical Background
2.2 Geographical Location of the Area
2.3 Geology and Relief
2.4 Drainage
2.5 Climate
2.6 Soils
2.7 Flora and Fauna
2.8 Demographic Pattern
2.8.1 Distribution of Population
2.8.2 Population Growth
2.8.3 Density of Population
2.8.4 Sex-Ratio
2.8.5 Work Force
2.9 Economic Pattern
2.9.1 Agriculture and Irrigation

II
2.9.2 Major Crop and Pattern
2.9.3 Land Use Pattern
2.9.4 Trade and Commerce
2.9.5 Industries
2.9.6 Transportation and Communication
2.9.7 Power Supply
2.10 Social Pattern
2.10.1 Education Facilities
2.10.2 Medical Facilities
2.10.3 Other Facilities
2.10.4 Fairs and Festivals
Chapter - III PATTERN OF LITERACY OF THE AREA 42 - 134
3.1 Introduction
3.2 Literacy Background of the Area
3.3 Literate Population and Literacy rate
3.3.1 Tehsilwise Total Literacy Rate
3.3.2 Change Rate in Total Literacy Rate
3.3.3 Pattern of Male Literacy Rate
3.3.4 Change Rate in Total Male Literacy Rate
3.3.5 Pattern of Female Literacy Rate
3.3.6 Change Rate in Total Female Literacy Rate
3.3.7 Gender Gap in Literacy Rate
3.3.8 Pattern of Urban Literacy Rate
3.3.9 Change Rate in Urban Literacy Rate
3.3.10 Pattern of Rural Literacy Rate
3.3.11 Change Rate in Rural Literacy Rate
3.4 Factors Responsible For Literacy
3.5 Literate Population and Literacy Rate in Schedule Caste
3.5.1 Pattern of Scheduled Caste Literacy Rate
III
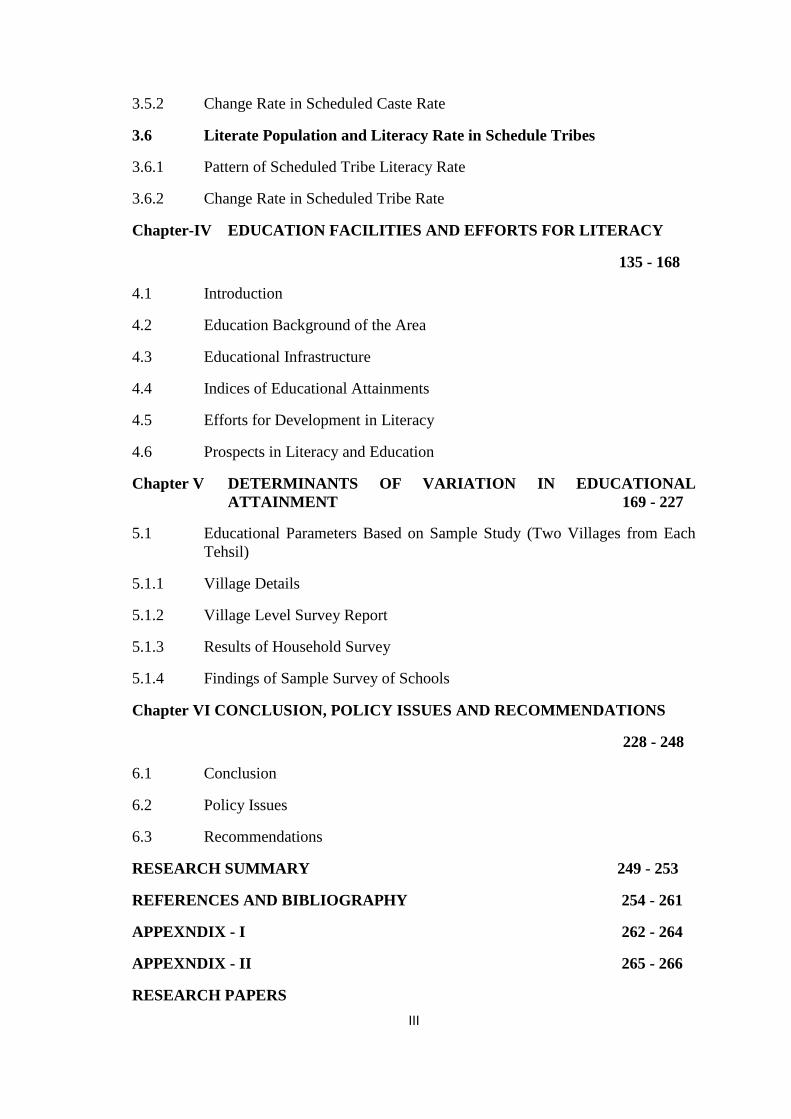
3.5.2 Change Rate in Scheduled Caste Rate
3.6 Literate Population and Literacy Rate in Schedule Tribes
3.6.1 Pattern of Scheduled Tribe Literacy Rate
3.6.2 Change Rate in Scheduled Tribe Rate
Chapter-IV EDUCATION FACILITIES AND EFFORTS FOR LITERACY
135 - 168
4.1 Introduction
4.2 Education Background of the Area
4.3 Educational Infrastructure
4.4 Indices of Educational Attainments
4.5 Efforts for Development in Literacy
4.6 Prospects in Literacy and Education
Chapter V DETERMINANTS OF VARIATION IN EDUCATIONAL ATTAINMENT 169 - 227
5.1 Educational Parameters Based on Sample Study (Two Villages from Each Tehsil)
5.1.1 Village Details
5.1.2 Village Level Survey Report
5.1.3 Results of Household Survey
5.1.4 Findings of Sample Survey of Schools
Chapter VI CONCLUSION, POLICY ISSUES AND RECOMMENDATIONS
228 - 248
6.1 Conclusion
6.2 Policy Issues
6.3 Recommendations
RESEARCH SUMMARY 249 - 253
REFERENCES AND BIBLIOGRAPHY 254 - 261
APPEXNDIX - I 262 - 264
APPEXNDIX - II 265 - 266
RESEARCH PAPERS

IV
List of Tables
Table. No.
Contents Page. No.
2.1 Geomorphologic Division 19
2.2 Geological Distribution of Rocks 20
2.3 Drainage 21
2.4 Temperature 22
2.5 Rainfall 22
2.6 Soils 23
2.7 Distribution of Population 26
2.8 Decadal population Growth of Chittaurgarh District 27
2.9 Sex- Ratio of the District, 1901-2011 28
2.10 Chittaurgarh District-Tehsilwise Sex-Ratio, 2011 29
2.11 Chittaurgarh District-Tehsilwise Main,Marginal & Non-Workers-2011 (in % )
31
2.12 Chittaurgarh District-Tehsilwise Distribution of Workers by Economic Activity-2011 (in % )
31
2.13 Irrigation 33
2.14 Crop Pattern 34
2.15 Land Use Pattern 35
2.16 Size of Industries 36
2.17 Industry and Employment Structure 36
2.18 Registered Industrial Unit, Employment and Investment 36
2.19 Types of Roads 37
2.20 Types of Vehicles 38
2.21 Types of Electricity Uses 38
2.22 Educational Facilities 39
2.23 Medical Facilities 39
2.24 Distribution of Villages according to Availability of Different Amenities, 2011
40
3.1 Growth of Literacy if the Study Region Compare with Rajasthan and India, 1981-2011
46
3.2 Chittaurgarh District - Tehsilwise Literacy Rate, 1981-2011 49
3.3 Change Rate in Total Literacy Rate, 1981-2011 51
3.4 Chittaurgarh District - Male Literacy Rate, 1981-2011 54
3.5 Change Rate in Male Literacy Rate, 1981-2011 56
3.6 Chittaurgarh District - Female Literacy Rate, 1981-2011 59
3.7 Change Rate in Female Literacy Rate, 1981-2011 61
V
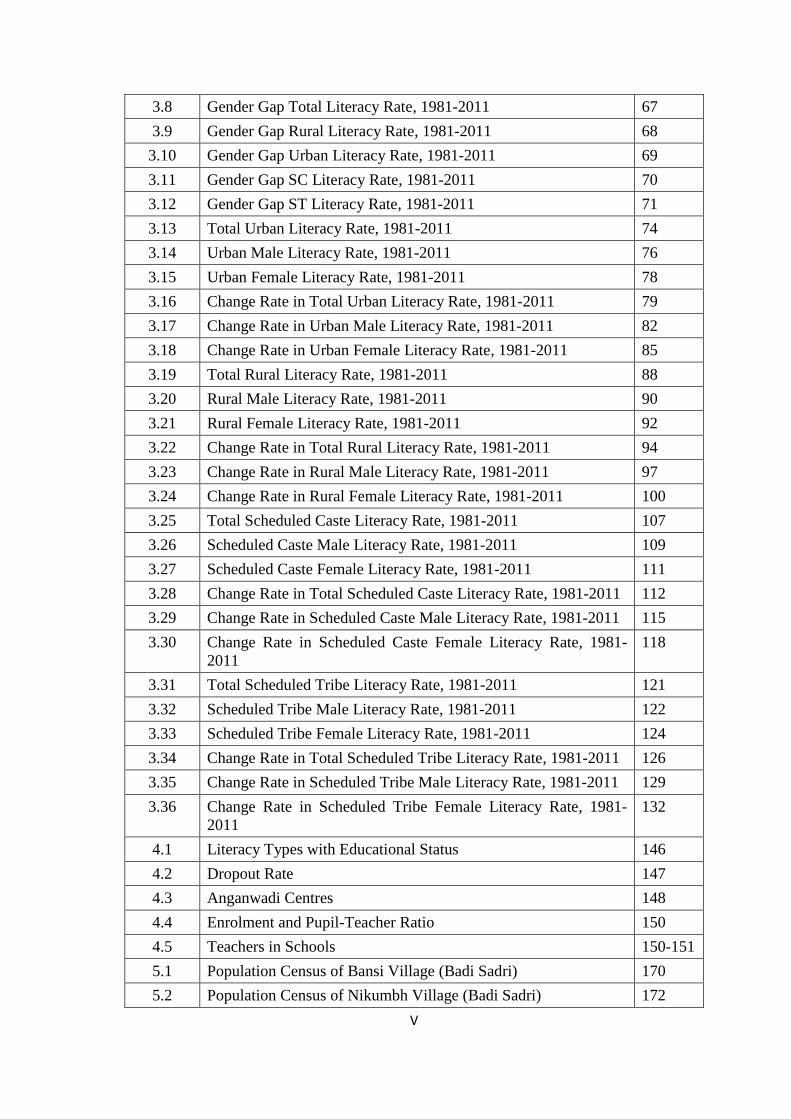
3.8 Gender Gap Total Literacy Rate, 1981-2011 67
3.9 Gender Gap Rural Literacy Rate, 1981-2011 68
3.10 Gender Gap Urban Literacy Rate, 1981-2011 69
3.11 Gender Gap SC Literacy Rate, 1981-2011 70
3.12 Gender Gap ST Literacy Rate, 1981-2011 71
3.13 Total Urban Literacy Rate, 1981-2011 74
3.14 Urban Male Literacy Rate, 1981-2011 76
3.15 Urban Female Literacy Rate, 1981-2011 78
3.16 Change Rate in Total Urban Literacy Rate, 1981-2011 79
3.17 Change Rate in Urban Male Literacy Rate, 1981-2011 82
3.18 Change Rate in Urban Female Literacy Rate, 1981-2011 85
3.19 Total Rural Literacy Rate, 1981-2011 88
3.20 Rural Male Literacy Rate, 1981-2011 90
3.21 Rural Female Literacy Rate, 1981-2011 92
3.22 Change Rate in Total Rural Literacy Rate, 1981-2011 94
3.23 Change Rate in Rural Male Literacy Rate, 1981-2011 97
3.24 Change Rate in Rural Female Literacy Rate, 1981-2011 100
3.25 Total Scheduled Caste Literacy Rate, 1981-2011 107
3.26 Scheduled Caste Male Literacy Rate, 1981-2011 109
3.27 Scheduled Caste Female Literacy Rate, 1981-2011 111
3.28 Change Rate in Total Scheduled Caste Literacy Rate, 1981-2011 112
3.29 Change Rate in Scheduled Caste Male Literacy Rate, 1981-2011 115
3.30 Change Rate in Scheduled Caste Female Literacy Rate, 1981-2011
118
3.31 Total Scheduled Tribe Literacy Rate, 1981-2011 121
3.32 Scheduled Tribe Male Literacy Rate, 1981-2011 122
3.33 Scheduled Tribe Female Literacy Rate, 1981-2011 124
3.34 Change Rate in Total Scheduled Tribe Literacy Rate, 1981-2011 126
3.35 Change Rate in Scheduled Tribe Male Literacy Rate, 1981-2011 129
3.36 Change Rate in Scheduled Tribe Female Literacy Rate, 1981-2011
132
4.1 Literacy Types with Educational Status 146
4.2 Dropout Rate 147
4.3 Anganwadi Centres 148
4.4 Enrolment and Pupil-Teacher Ratio 150
4.5 Teachers in Schools 150-151
5.1 Population Census of Bansi Village (Badi Sadri) 170
5.2 Population Census of Nikumbh Village (Badi Sadri) 172
VI
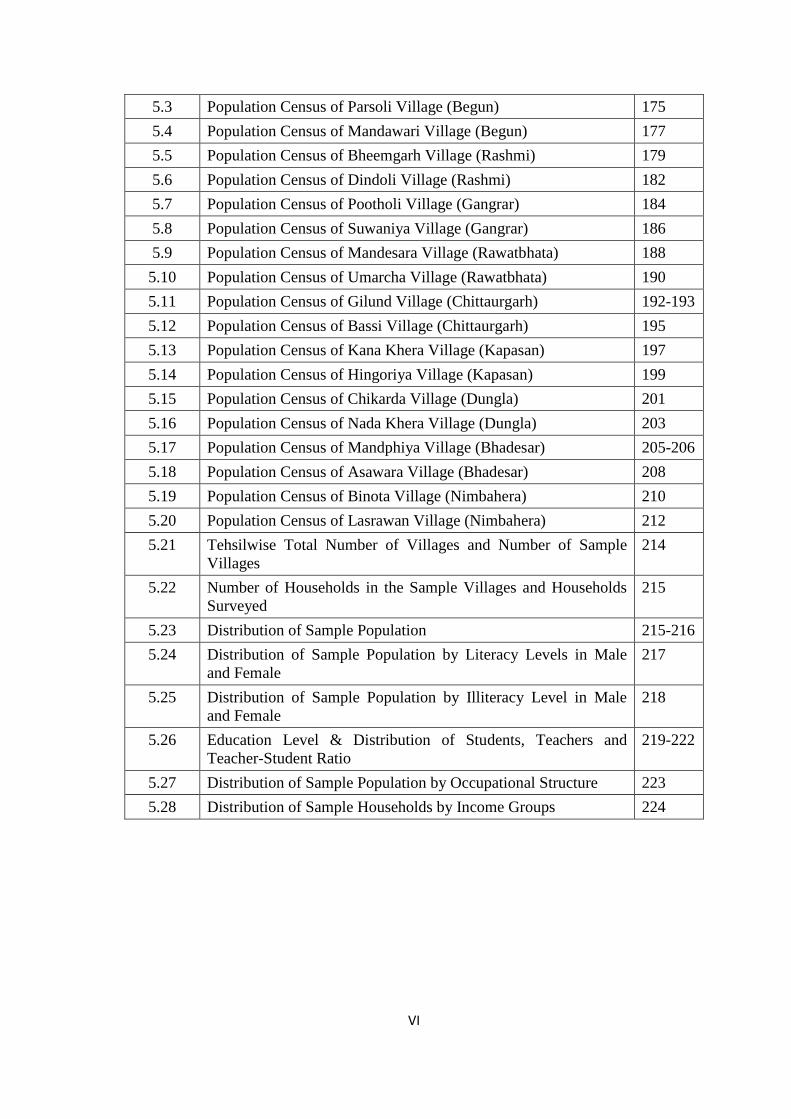
5.3 Population Census of Parsoli Village (Begun) 175
5.4 Population Census of Mandawari Village (Begun) 177
5.5 Population Census of Bheemgarh Village (Rashmi) 179
5.6 Population Census of Dindoli Village (Rashmi) 182
5.7 Population Census of Pootholi Village (Gangrar) 184
5.8 Population Census of Suwaniya Village (Gangrar) 186
5.9 Population Census of Mandesara Village (Rawatbhata) 188
5.10 Population Census of Umarcha Village (Rawatbhata) 190
5.11 Population Census of Gilund Village (Chittaurgarh) 192-193
5.12 Population Census of Bassi Village (Chittaurgarh) 195
5.13 Population Census of Kana Khera Village (Kapasan) 197
5.14 Population Census of Hingoriya Village (Kapasan) 199
5.15 Population Census of Chikarda Village (Dungla) 201
5.16 Population Census of Nada Khera Village (Dungla) 203
5.17 Population Census of Mandphiya Village (Bhadesar) 205-206
5.18 Population Census of Asawara Village (Bhadesar) 208
5.19 Population Census of Binota Village (Nimbahera) 210
5.20 Population Census of Lasrawan Village (Nimbahera) 212
5.21 Tehsilwise Total Number of Villages and Number of Sample Villages
214
5.22 Number of Households in the Sample Villages and Households Surveyed
215
5.23 Distribution of Sample Population 215-216
5.24 Distribution of Sample Population by Literacy Levels in Male and Female
217
5.25 Distribution of Sample Population by Illiteracy Level in Male and Female
218
5.26 Education Level & Distribution of Students, Teachers and Teacher-Student Ratio
219-222
5.27 Distribution of Sample Population by Occupational Structure 223
5.28 Distribution of Sample Households by Income Groups 224
VII
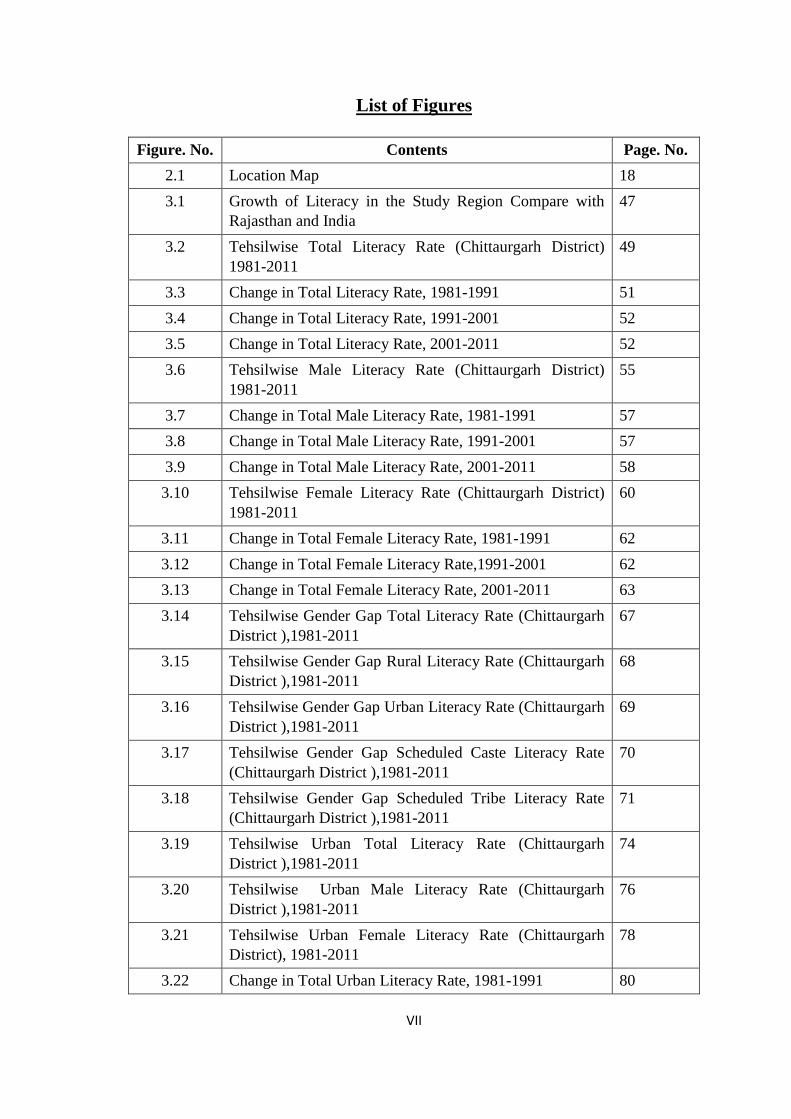
List of Figures
Figure. No. Contents Page. No.
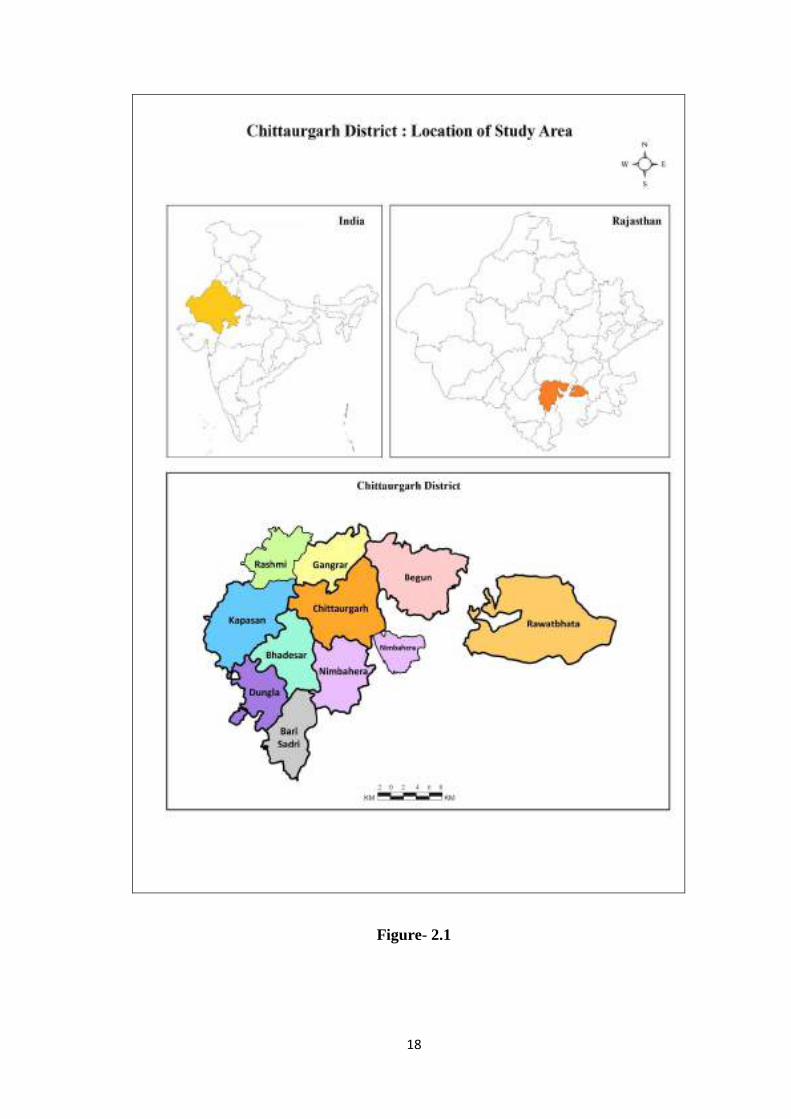
2.1 Location Map 18
3.1 Growth of Literacy in the Study Region Compare with Rajasthan and India
47
3.2 Tehsilwise Total Literacy Rate (Chittaurgarh District) 1981-2011
49
3.3 Change in Total Literacy Rate, 1981-1991 51
3.4 Change in Total Literacy Rate, 1991-2001 52
3.5 Change in Total Literacy Rate, 2001-2011 52
3.6 Tehsilwise Male Literacy Rate (Chittaurgarh District) 1981-2011
55
3.7 Change in Total Male Literacy Rate, 1981-1991 57
3.8 Change in Total Male Literacy Rate, 1991-2001 57
3.9 Change in Total Male Literacy Rate, 2001-2011 58
3.10 Tehsilwise Female Literacy Rate (Chittaurgarh District) 1981-2011
60
3.11 Change in Total Female Literacy Rate, 1981-1991 62
3.12 Change in Total Female Literacy Rate,1991-2001 62
3.13 Change in Total Female Literacy Rate, 2001-2011 63
3.14 Tehsilwise Gender Gap Total Literacy Rate (Chittaurgarh District ),1981-2011
67
3.15 Tehsilwise Gender Gap Rural Literacy Rate (Chittaurgarh District ),1981-2011
68
3.16 Tehsilwise Gender Gap Urban Literacy Rate (Chittaurgarh District ),1981-2011
69
3.17 Tehsilwise Gender Gap Scheduled Caste Literacy Rate (Chittaurgarh District ),1981-2011
70
3.18 Tehsilwise Gender Gap Scheduled Tribe Literacy Rate (Chittaurgarh District ),1981-2011
71
3.19 Tehsilwise Urban Total Literacy Rate (Chittaurgarh District ),1981-2011
74
3.20 Tehsilwise Urban Male Literacy Rate (Chittaurgarh District ),1981-2011
76
3.21 Tehsilwise Urban Female Literacy Rate (Chittaurgarh District), 1981-2011
78
3.22 Change in Total Urban Literacy Rate, 1981-1991 80
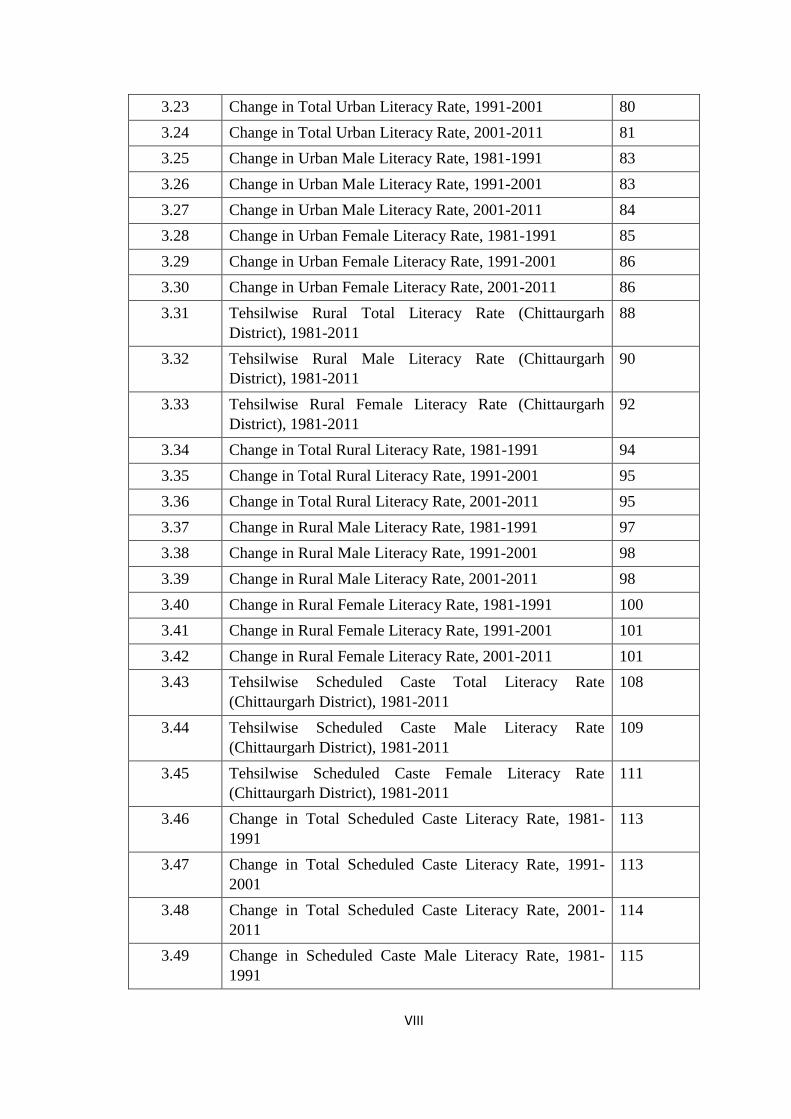
VIII
3.23 Change in Total Urban Literacy Rate, 1991-2001 80
3.24 Change in Total Urban Literacy Rate, 2001-2011 81
3.25 Change in Urban Male Literacy Rate, 1981-1991 83
3.26 Change in Urban Male Literacy Rate, 1991-2001 83
3.27 Change in Urban Male Literacy Rate, 2001-2011 84
3.28 Change in Urban Female Literacy Rate, 1981-1991 85
3.29 Change in Urban Female Literacy Rate, 1991-2001 86
3.30 Change in Urban Female Literacy Rate, 2001-2011 86
3.31 Tehsilwise Rural Total Literacy Rate (Chittaurgarh District), 1981-2011
88
3.32 Tehsilwise Rural Male Literacy Rate (Chittaurgarh District), 1981-2011
90
3.33 Tehsilwise Rural Female Literacy Rate (Chittaurgarh District), 1981-2011
92
3.34 Change in Total Rural Literacy Rate, 1981-1991 94
3.35 Change in Total Rural Literacy Rate, 1991-2001 95
3.36 Change in Total Rural Literacy Rate, 2001-2011 95
3.37 Change in Rural Male Literacy Rate, 1981-1991 97
3.38 Change in Rural Male Literacy Rate, 1991-2001 98
3.39 Change in Rural Male Literacy Rate, 2001-2011 98
3.40 Change in Rural Female Literacy Rate, 1981-1991 100
3.41 Change in Rural Female Literacy Rate, 1991-2001 101
3.42 Change in Rural Female Literacy Rate, 2001-2011 101
3.43 Tehsilwise Scheduled Caste Total Literacy Rate (Chittaurgarh District), 1981-2011
108
3.44 Tehsilwise Scheduled Caste Male Literacy Rate (Chittaurgarh District), 1981-2011
109
3.45 Tehsilwise Scheduled Caste Female Literacy Rate (Chittaurgarh District), 1981-2011
111
3.46 Change in Total Scheduled Caste Literacy Rate, 1981-1991
113
3.47 Change in Total Scheduled Caste Literacy Rate, 1991-2001
113
3.48 Change in Total Scheduled Caste Literacy Rate, 2001-2011
114
3.49 Change in Scheduled Caste Male Literacy Rate, 1981-1991
115
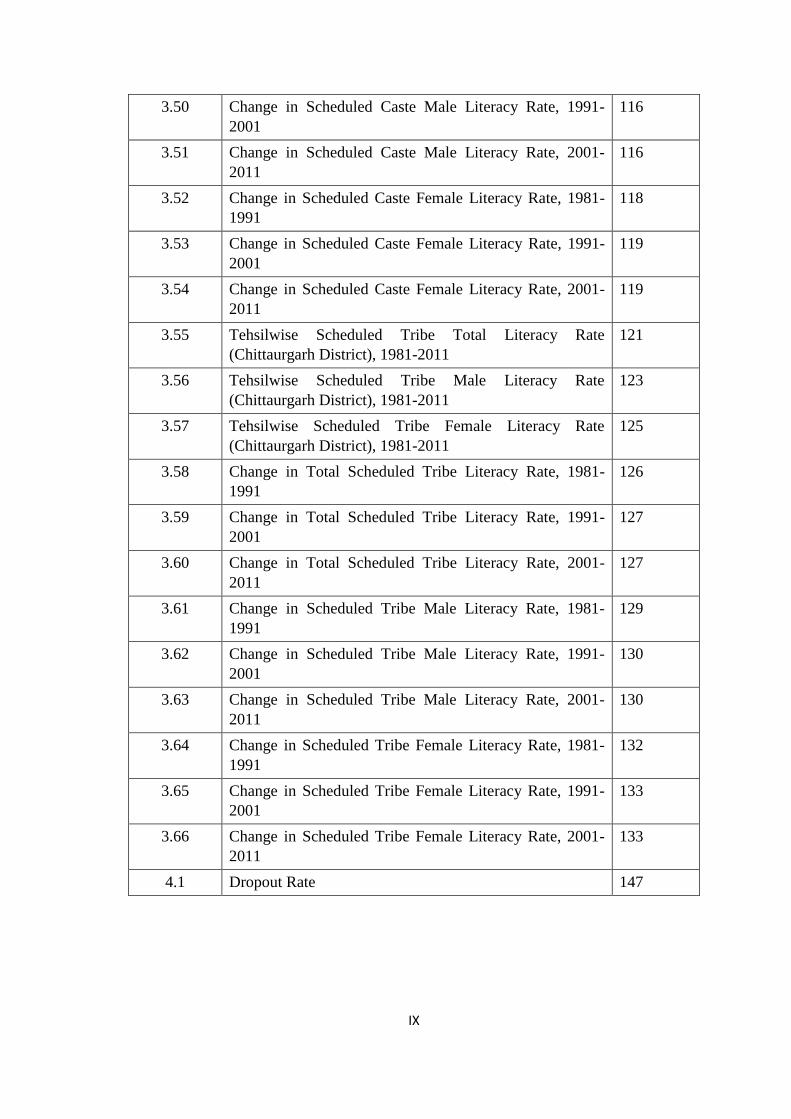
IX
3.50 Change in Scheduled Caste Male Literacy Rate, 1991-2001
116
3.51 Change in Scheduled Caste Male Literacy Rate, 2001-2011
116
3.52 Change in Scheduled Caste Female Literacy Rate, 1981-1991
118
3.53 Change in Scheduled Caste Female Literacy Rate, 1991-2001
119
3.54 Change in Scheduled Caste Female Literacy Rate, 2001-2011
119
3.55 Tehsilwise Scheduled Tribe Total Literacy Rate (Chittaurgarh District), 1981-2011
121
3.56 Tehsilwise Scheduled Tribe Male Literacy Rate (Chittaurgarh District), 1981-2011
123
3.57 Tehsilwise Scheduled Tribe Female Literacy Rate (Chittaurgarh District), 1981-2011
125
3.58 Change in Total Scheduled Tribe Literacy Rate, 1981-1991
126
3.59 Change in Total Scheduled Tribe Literacy Rate, 1991-2001
127
3.60 Change in Total Scheduled Tribe Literacy Rate, 2001-2011
127
3.61 Change in Scheduled Tribe Male Literacy Rate, 1981-1991
129
3.62 Change in Scheduled Tribe Male Literacy Rate, 1991-2001
130
3.63 Change in Scheduled Tribe Male Literacy Rate, 2001-2011
130
3.64 Change in Scheduled Tribe Female Literacy Rate, 1981-1991
132
3.65 Change in Scheduled Tribe Female Literacy Rate, 1991-2001
133
3.66 Change in Scheduled Tribe Female Literacy Rate, 2001-2011
133
4.1 Dropout Rate 147
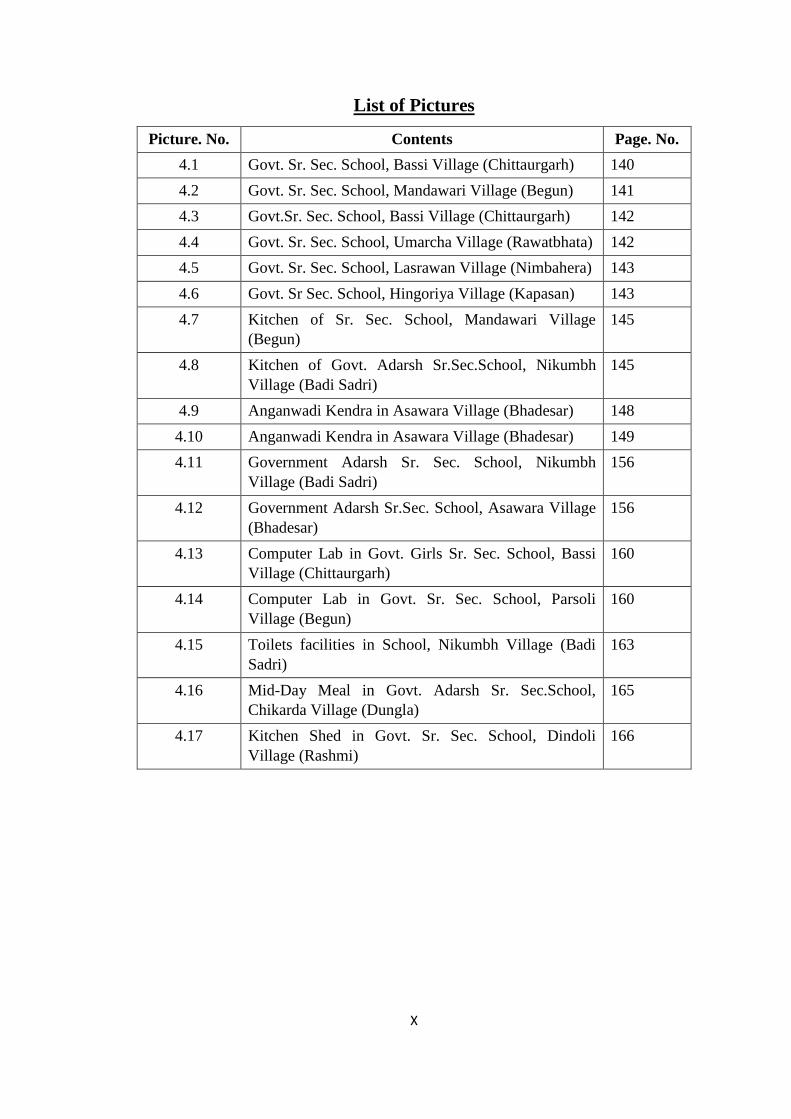
X
List of Pictures
Picture. No. Contents Page. No.
4.1 Govt. Sr. Sec. School, Bassi Village (Chittaurgarh) 140
4.2 Govt. Sr. Sec. School, Mandawari Village (Begun) 141
4.3 Govt.Sr. Sec. School, Bassi Village (Chittaurgarh) 142
4.4 Govt. Sr. Sec. School, Umarcha Village (Rawatbhata) 142
4.5 Govt. Sr. Sec. School, Lasrawan Village (Nimbahera) 143
4.6 Govt. Sr Sec. School, Hingoriya Village (Kapasan) 143
4.7 Kitchen of Sr. Sec. School, Mandawari Village (Begun)
145
4.8 Kitchen of Govt. Adarsh Sr.Sec.School, Nikumbh Village (Badi Sadri)
145
4.9 Anganwadi Kendra in Asawara Village (Bhadesar) 148
4.10 Anganwadi Kendra in Asawara Village (Bhadesar) 149
4.11 Government Adarsh Sr. Sec. School, Nikumbh Village (Badi Sadri)
156
4.12 Government Adarsh Sr.Sec. School, Asawara Village (Bhadesar)
156
4.13 Computer Lab in Govt. Girls Sr. Sec. School, Bassi Village (Chittaurgarh)
160
4.14 Computer Lab in Govt. Sr. Sec. School, Parsoli Village (Begun)
160
4.15 Toilets facilities in School, Nikumbh Village (Badi Sadri)
163
4.16 Mid-Day Meal in Govt. Adarsh Sr. Sec.School, Chikarda Village (Dungla)
165
4.17 Kitchen Shed in Govt. Sr. Sec. School, Dindoli Village (Rashmi)
166
1
CHPATER- I
INTRODUCTION
1.1 Introductory
Literacy is one of the most important indicators of socio-economic and political
development of a society. It is a major component of human resource development and
is thus basic of any programmed of social and economic development.
In past the literacy was studied under Population Geography but Literacy
Geography has obtained place under Geography as a separate branch of Geography,
only some years ago under which all aspects of literacy are studied.
In last two decades there is a tremendous development in the area of literacy but
the lower community of the society has been less benefited. Even today, millions of
people in the remote areas are illiterate, if efforts made by the government sector used
in the right direction can be eliminated illiteracy at a lower cost at a lower cost.
According to United Nations Population Commission literacy means “Literacy
is the ability of person to read and write understanding short simple Statement of his
everyday life ‟‟.
At the time of issuing of human development report 2007 of UNDP on 29
November, 2009 Mrs. Maxine Olson (The UNDP representative present in India) said
that India has made progress with slow pace in the direction of improvement of
education, health and development of their people. In this report on the basis of human
development index the ranking of development of 177 nations has been decided, in
which India is placed at 128th rank.
In democratic nations like India, citizens have some fundamental rights. All
these rights provide to its citizen rights of respectable and free life. Out of this one right
is "right of education" also. By 86th constitutional amendment, 2001, a new Para 21 (A)
has been added which provide that the State by making law will manage to provide free
and compulsory education to all children of age 6 to 14 years.
Literacy an important tool for communication, learning and information, is a
virtual precondition for an individual's evolution and national development. Research
2
studies on human cognitive development have established that literacy enhances the
critical faculties and enables to reflect on the existential reality in which they have been
placed. It promotes objectivity, capacity for clear perception, thought logical and
coherent analysis. It promotes the sense of history and helps in combining personality
with universality. In this sense, literacy can be regarded as inalienable fundamental
rights.
1.2 Main Objectives of the Study
Literacy in the district is the most basic indicator of socio-economic progress.
The UNESCO defines a literate person as "the one who has acquired all the essential
knowledge and skills which enable him/her to engage in all those activities in which
literacy is required for effectives functioning in his/her group and community and those
attaining in reading, writing and numeracy make it possible to use these skills towards
his/her own his/her community's development. The National Literacy Mission (NLM)
defines literacy as" acquiring the ability to apply them to one's day-to-day life". The
Census of India has defined literacy rates as a crucial measure to enhance a region's
human prosperity. Literacy discharges many functions in the society, that is;
Socialization,
Communication knowledge and information,
Contribution to social, political and economic development,
Development of human resources,
Character building and personality development,
Social, ethical and democratic control.
Literacy in general is not just for understanding and writing, but also for
thinking critically and responding accordingly. To participate fully in civic life, people
must have the skills necessary to access and act upon information. Literacy is more than
just a tool. Literacy system of India has changed a lot from what introduced by the
British Rule till now. In the current scenario of universalizing, literacy has introduced
new dimensions. Now the Government is moving forward towards welfare education,
with emphasis on social and economic research, focusing on research and concentration
on free and compulsory primary education for children up to the age of 14 years. Such
reformations in literacy system has influenced the society to the great extend modifying
its fundamental structure and region as a whole.
3
The research study is most comprehensive in nature, covering aspects related to
literacy, where the growth of literacy rates in the district of Chittaurgarh is main issue
and which center-related development which is beneficial through literacy. The Central
Government is vigilant for achievement of total literacy to all the States and provides
financial assistance to States lagging behind, but the process of implementation is main
lacking area. This issue is directly related to the problems of livelihood of the people
and even after the construction of the requisite facilities; people of such areas remain
apathetic to avail themselves for their socio-economic uplift. The literacy and
development are dependent on each other literacy is helpful in achieving various
national objectives, which are staggering in view of lack of awareness. After reviewing
various literacy studies conducted on national and State levels, we have reached at the
conclusion that the study of literacy in the Chittaurgarh district of Rajasthan has not
attracted attention either from the side of geographers or other social scientists. While it
is important to note that any literacy study in Chittaurgarh district is important in
keeping in mind the level of literacy and their tehsils in the district.
The study thus, aims to highlight how the reformations in a literacy system in
the district have led to the changes in its socio-economic and Geographic structure. But
change in scenario has also led to some adverse impacts in the district in terms of
uprising social problems. In view of above discussions, the study attempts to present the
holistic picture of the pattern of literacy system in Chittaurgarh district. This study is an
interpretative and analytical investigation of the impacts of literacy system on the
community of the district, affecting the economic, social and cultural development of
the place. The main objectives of the present research work, therefore, may be
summarized as follows:-
– To study the growth of literacy, rated and development like demographic, social
and economic structure.
– To study the level of rural- urban literacy rates.
– To study the level of Scheduled Caste and Scheduled Tribe literacy rates.
– To study the various literacy programs in Chittaurgarh district and their
consequences. Review the achievements attained by the promotional literacy
programmers and educational development done in the region.
4
– To assess the gap of male - female literacy rate.
– To study the current educational status of Chittaurgarh district.
– To analyze the possibilities of future progress of literacy rate in Chittaurgarh
district. And evaluate the causes of low literacy rate in the region. Access the
areas which are most affected from lower literacy rate.
– To suggest the appropriate strategies designed for the eradication of problems.
– To develop a strategy to make Chittaurgarh district a complete literate district.
1.3 Importance of Proposed Research Work
Despite various government efforts there is no integrated and coordinated work
done to study the literacy system set-up of the district. The scattered studied have been
taken up by the government departments and individual educational institutions of the
district. But they are lacking the holistic approach towards the adverse impact of the
prevailing levels of reduced rate of literacy and its consequences on the social structure.
Therefore, the study is significant in order to develop such lines which will highlight
the contribution of different educational departments, literacy commissions and
constitutional provisions and their impact on the society as a whole.
The importance of literacy can be stated at two levels: National and Individual.
At the national level in India, a literate population is required to build a nation with
strong socio-economic and political foundations. On the individual level, the confidence
of each new literate person is increasing in order to achieve the impossible power of
literacy.
As an educator, one is given the responsibility of cultivating and strengthening
minds. An essential element of this task is ensuring students are literate. According to
the latest report by the International Literacy Association (ILA), early literacy is
considered vital, while digital literacy is a current tendency. Another form of literacy
that is important is the 21st Century is culturally relevant literacy. Encouraging children
to read and write at a young age and building on that foundation throughout their
learning experiences as students, educators and parents alike are recumbent solid
groundwork and endowing children with tools needed for their future success.
5
According early literacy is defined as "what children know about reading and
writing before they actually read or write. Digital literacy is the ability to use ICT to
find, evaluate, construct and communicate information, requiring both experimental and
technical skills. Culturally relevant literacy is essential to ensuring that students receive
the quality education that they deserve.
1.4 Review of the Literature
Primary source to know that literacy level of India and Rajasthan is the Census
department of the Government of India, which renders the information related to
literacy every decade. This is the significant source of literacy as different analytical
studies are carried out over various aspects by interpretation of the basic information's.
Information is available up to village level in a comprehensive manner to derive various
analytical research works.
All the norms for collection of Census information are framed at the national
level and released in each district containing information of villages, Panchayat Samiti,
Tehsils and District for comparison of the data. Literacy studies have been carried on at
various levels in International, India and Rajasthan.
Bell W. James (1967) in his article "A Comparison of Dropouts and Non-
dropouts on Participation in School Activities" highlighted on the critical problem of
school education, where children attend school on casual basis on stop attending school
for various reasons. Main problem for such situation is association in domestic
activities, where parents are working and child supposed to attend school is assigned the
task to graze livestock or take care of rids during the day. This problem remained in
most of the countries of the world and every country government tried to tackle in their
own manner understanding the root cause of such situations. Such problems are quite
following decades Darby (1935, 1948) produced two papers is this field (He is well
known for the later on "The Regional Geography of Thomas Hardy's Wessel"). The
1970s witnessed the real beginnings in this area when Literature Geography common
grounds were looked into from different angles. Since then a great stride in this field
has been made and today over two thousand titles on Literary Geography exist (cf.
Landau. 1996), yet it is one among the lesser known branches of Geography.
6
Arun C. Mehta (2010) in "Elementary Education in India" has presented
analytical report of 2007-08 has presented sound information system for successful
monitoring and implementation of District Primary Education Programmed started in
the country with the external assistance started since 1994. This envisages development
of transparent education management information system and preparatory education
management information system and preparatory activities for strengthening
infrastructure for education in the country. The publication provides information of 35
States and union territories of India to bring new dimensions of elementary education
into focus. The publication details about the data on children with disabilities,
examination results, medium of instructions of educational systems. The second has
used various parameters to expand efficiency and deficiencies in the educational system
in the country.
Meenaxi J. (Ed.) (2007) in the publication "Women Literacy in India" has
included various issues related to women literacy in the broad spectrum of social,
cultural, economic and development issues relevant to women. The publication has
served in developing countries and mid-day programmed was initiated to meet the
nutrition deficiencies of children as well as creating interest to attend school. The drop-
out starts from first month of admission of children and continues for round the year.
This situation has been termed as ineffective potential utilization of government efforts
and spread literacy in rural and urban areas, where girls are in large number, who are
compelled to leave school for various reasons.
Batelle (1976) in his article "A Turning Point for Literacy" included in the
proceedings of International Symposium for literacy expresses the importance of the
literacy at International level and attention of all the member countries was focused
over initiating sincere efforts in view of importance. The development objectives cannot
be achieved in desired spirit, unless the people of the country are aware about various
aspects of their own spheres. People's participation in development efforts of national
can succeed when the people are literate to know the difference in between
development and destruction, which cannot function together. The author treated
literacy as turning point for human resource development and helpful in success of
development activities of the country.
7
The Anglo-French tradition in Literacy Geography at best could be traced back
only at the onset of 20th Century. However, the Italian tradition had already begun with
Della Vedova (1881) and Almagia (1903-04) plea to use literacy source in
Geographical works. Wright probably has the credit of advocating on the similar lines
in English speaking world (cf. 1924 a & b, 1926 a & b). To strengthen the patriarchal
social structure highlighted the socio-economic conditions of the people of India as well
as their views, values and culture. During the British rule, education became tool of
colonial power, enabling a small minority to have access to education and all the
benefits in enabled. The social reformers raised the demand for transformation of
women to make them more capable to fulfill their traditional roles. After independence,
the policy makers argued for universal education as a tool for bringing social equality.
It has been stressed that women issues are not limited to education but covers
environment, employment, production process and in entire gamut of socio-economic
policies.
Adinaryan P. Reddy (2004) in his book "Literacy Retention and Socio-
Economic Development" has stressed that recognizing the relationship between the
literacy and economic development of the individual and the nation as a whole, the
Government of India had implemented a number of literacy promotion programmed. Of
these, very few attempts have been made to study the level of retention of literacy and
its impact on the socio-economic development of individuals. The author has revealed
that recognizing the mistakes of past and keeping in view the existing necessities the
National Literacy Mission was started in 1988 to universalize literacy in the productive
age group of 15-35 years with a view to improve their status and to provide information
relating to the national goals and the total literacy campaign was resultant impact of
such strategy.
Khan (2004) explained the regional imbalances and changing pattern of literacy
in Jammu & Kashmir State (1961-2001).
Kaur (2003) focused on gender disparity in literacy in Indian Punjab. It was
found that gender inequality in literacy was less compared to rural areas in the cities.
Vimla Ramchandran (2007) in her article "The Great Number Race and
Challenge of Education" had observed that State Governments established primary
schools in rural and urban areas across the country but real attention was emphasized
8
for higher education as the ruling elite had committed it to build quality institutions for
professional and technical education. It is needed ironical that on one hand the children
from poor and socially under - privileged groups of society do not get quality education
and on the other hand the government services seats for them in higher educational
institutions. Thus the economic cake is expanding fast for some people in India. Now
opportunities are available to those, who have been able to access to quality education.
The reservation system is responsible for creating class within under-privileged sections
of society, who do not bother of uplift of their own community people.
The "Annual Status of Education Report (ASER)" Prepared by Pratham
NGO (2005) which is independent non-governmental organization, facilitated a
nationwide sample survey on learning outcomes of children. The survey findings
provide useful information of literacy. The analysis of the sample survey findings are
evident that the students after having completed minimum five years of education fully
at the primary level, one third of all students cannot read at the level established for
standard second starts from class sixth. The analysis is reveals that there is lack of
continuity at two levels and the deficiency remained in significant number of children is
evident that course material and teaching is not according the grasping capacity of
children and such a situation is not fully conducive for educational system, where
careful planning of the education mechanisms are most required.
Krishan (2002) emphasizes a major rise in female-male ratio in higher
education from 14:100 in 1951 to 6:100 in 2001. Women's participation in medical,
engineering and technical education has also gone up noticeably in the past few
decades. The State level data reveals that the presence of women in higher education
finds a stronger correlation with female literacy rate, than with level of urbanization or
per capita income.
In his district-wise Census data based detailed study on "Spatial Dimensions of
Literacy in India". Gosal (2002) points out that during the period 1961-2001 there has
not been much change in the regional pattern of literacy in the country. However, rural-
urban and male-female differential in literacy rates have narrowed down considerably
over these years. Male-female differential in literacy rate showed significant inverse
correlation with general literacy rate.
9
Hazra (1997) has compared performance of major regions in female literacy of
the world and highlighted low position of the South Asian countries realm in this
regard. Discussing the pattern of female literacy in India, the author pointed out that the
vicious circle of female illiteracy, poverty and low status in society needs to be broken
down.
Mehta (1995) focused on patterns and correlates of tribal literacy in India.
Physical and economic distance to school as well as lack of opportunity for schooling in
mother tongue was found to be main deterrents in the way of tribal literacy in the
country.
Premi (1991) studied the literacy scenario in India and found that as a result of
National Policy on Education and other new policy thrusts, the literacy rates have
improved gradually despite tremendous increase in population, but the rural-urban
literacy differentials continue to be high even in 1991.
Tilak, Jandhyals B.G. (1996) in their article "How Free is Free Primary
Education in India" elaborated the expenditure a family has to bear for sending single
child to school. There are primary schools run by State government, private schools
duly recognized and getting grant-in-aid from State and school run by various
organizations duly recognized but not getting any financial assistance from State
government. In the later category schools children aged three years and above are given
admission but the fees of such school is beyond the reach of not only poor but even
middle class families. The fees charged from parents includes development charges,
computer charges, donations etc. besides tuition fees, conveyance charges, books,
copies, dictionary and other material which is compulsory for parents. Many private
schools could not manage teachers of suitable standard but earn money on the credit of
the school. People of various social groups feel humiliated in sending their children in
government schools. These barriers are responsible for increase in literacy rates.
Jalan Jyotsna & Elena Glinskaya (2005) in their article on "Improving
Primary School Education in India: An Impact Assessment of DPEP-I" have stressed
the necessity of improvement of conditions befitted for schooling the children attending
the primary classes. District Primary Education Project is World Bank assisted primary
education project started in Rajasthan to provide education facilities in remote areas of
the State for coverage largest population of school, going children. The Geographical
10
situation of Rajasthan area most varied where the density of population varies from 13
persons per sq. km. to 471 persons per sq. km. The strengthening of primary education
system is difficult in various areas especially in low density regions, where village
culture is largely absent. The teachers working in existing schools try to avoid reaching
in difficult areas.
Krishan G. & Shyam M. (1978) in their article on "Regional Aspects of Rural-
Urban Differentials of Literacy" have highlighted to problems of low literacy in rural
areas where the literacy is quite low. Rural and Urban areas have different problems,
where rural literacy is low in view of non-existence of literacy centrals, while urban
areas face problem of indifferent attitude of parents or children in attending educational
institutions or literacy centers existing for very purpose. The authors have analyzed the
situations were universality of literacy is most difficult task for social, economic and
cultural factors.
The suggestions given for sorting out such problems are practical and possible
to be attained without much recurring expenditure. It was further stressed that sooner
achieving in various literacy programs can be diverted to regular schools and the
expenditure incurred over literacy would be curtailed.
Mishra L. (1988) in his article on "Literacy - A Victim of Many Prejudices"
signifies the importance of literacy where people awareness generation can be helpful in
attaining the potential utilization and achievement of maximum level through the
suggested measures citing the problems of social and cultural nature where women and
girls are not allowed to get them literate for various social reasons, while the tribal
people remain suspicious over such activities, which can interfere in their traditional
and cultural systems. In such areas all the outsiders are treated as miscreants and do not
associate unless their social and religious heads are fully convinced unless their social
and religious heads are fully convinced over the objectives of any scheme intended in
their areas of concentration. Such problems are also faced in literacy campaign in view
of various prejudices of the people who are target group of benefit.
Mitra Ashok (1979) in his article on "The Status of Women Literacy and
Employment Progress of Women's Studies" as described the problems of women who
want to avail the benefits of various schemes introduced for them, but unable to attain
in view of their literacy. The relationship between literacy and employment has been
11
carried out stressing the need for empowerment for their mental preparedness and
association of their parents or other relatives for encouraging them for prosperity to
literacy and employment. Even the well qualified women hesitate to seek employment
for various social barriers and compelled to survive in poverty and helplessness. This
article was written when the women empowerment was dream and reservation in
political and administrative system was not even thought of. The literacy helps in
seeking employment of women, which is helpful in prosperity of the family.
Radhakrishnan & Akita (1993) in their article "India's Educational Efforts"
provide useful information about education and literacy. The authors have observed that
education must support the task of making people-children, youth, and adults aware of
their identity, problems and needs. Education must also be a catalyst and a channel for
the initiative and creative resolve of the people to solve the problems and structures that
hinder progress. It has been deemed necessary that education must develop vision of the
student to understand the things through differentiating their positive and negative
aspects and this grasping capacity developing is the actual objective of the education. If
the children are unable to understand by observation, interpretation and analysis, it
reveals that there are some lacking issues in the education system, which need
corrective measures.
Sadhna Kothari (2001) in her article "Status of Gender Disparity in Literacy of
Rajasthan" had analyzed the formal-informal education is an important agent of social
change among the females by exposing them to outside world, widening their horizons
and getting information about many matters relevant to life. Therefore, it would be
interesting to trace out of the progress of male-female literacy rates and their
differentials on Rajasthan, during 1901-2001 at State level and spatial patterns of
male/female and rural/urban disparities during 1991 and 2001 at district level.
R. N. Mishra (2001) in his article "Spatial Variation in Female Literacy of
Rajasthan State" had analyzed the Rajasthan has been quite backward in educational
development. Before independence the educational facilities of secondary and higher
level were only located in district head quarters. As such in spite of various
development activities taken by the government the educational structure of population
is still low. The literacy rate of Rajasthan in 2001 was 61.03%, which is quite, less than
the national average rate of 65.38%.
12
L. C. Agrawal (1988) in his article "Spatial Distribution Patterns of Literacy in
Tribal Areas - A Case Study of Kishanganj and Shahabad Tehsils of Baran District in
Rajasthan" had analyzed the distribution of literacy is the study area under the prevalent
socio-economic conditions. The total literacy campaign strategy as a part of the
National Literacy Mission launched on May 5, 1988, which was considered in this
study reflected a new sense of urgency and seriousness to eradicate illiteracy in the
tribal area.
Singh Lalit & Dr. Kothari Sadhana in their article "Status of Gender Disparity
in Literacy or Banswara and Dungarpur Districts of Southern Rajasthan" had analyzed
the overall socio-economic development of a country depend on the status of both male
and female literacy. Since gender disparity in literacy level in inversely related to
overall development, therefore, step should be taken to reduce it. The female literacy
should be given the first priority as female literacy has more social impact than male
literacy. An increase in the status of female literacy will prove helpful to reduce the
poverty level of a region. For balanced growth, funds should be allocated for the female
literacy programs which lead to overall socio-economic development of society.
Thus, most of the studies, pertaining to literacy, have been confined to the
spatial analysis of this attribute either at national or at regional level.
1.5 Methodology
As per the search presented, data obtained from various sources in statistical
category has been classified differently for different purposes. In order to obtain and
assess related objectives, the classified data is arranged in the arrays in incremental
order. The necessary literacy, population and related data for research have been
obtained from District Census Handbook for the year 1981, 1991, 2001 and 2011. The
essential data is also obtained from district headquarter, tehsil headquarter, Economic
and Statistic Department, Yearly Outline, other offices by classifying the needed data
for the present study. Statistics of population and literacy rate have been tabulated
according to the tehsil level and presented in the systematic manner. Based on the data
obtained, the distribution of population, literate persons and other facts has been
displayed with the help of additional diagrams and figures of tables. For this research,
data from 1981 to 2011 related to population, literate population and literacy rate has
been processed by a descriptive, numerical and mathematical method. But data is
13
calculated according to the changes in the tehsils administrative boundaries. In 2007,
Pratapgarh Tehsil was made the new district of Rajasthan as a result Chhoti Sadri and
Arnod tehsils are now included in Pratapgarh district. There by, according to the
available data of 2010, Chittaurgarh district is now divided in to ten tehsil. In addition
to the data obtained from the above mentioned source for the study of research
presented; information and all the knowledge has been received from local residences,
personally through direct contact or through the internet. Thereafter, the data collected
through the local observation and through the different administrative bodies have been
authenticated by matching them.
A part from this, the facts related to the relief, climate, soil, workers, agriculture,
irrigation, drainage system, vegetation, minerals, business, fairs etc. of the district are
shown with the help of arrays.
The following cartographic techniques are
– The Spatial pattern of literacy is discussed on the basis of areal variations in
terms of male-female, rural- urban, scheduled caste-scheduled tribe and general
literacy tools used like: bar diagram and Choropleth method.
– I have employed statistical method to measure the comparison on between 1981,
1991, 2001 and 2011 for the change or growth of literacy rate.
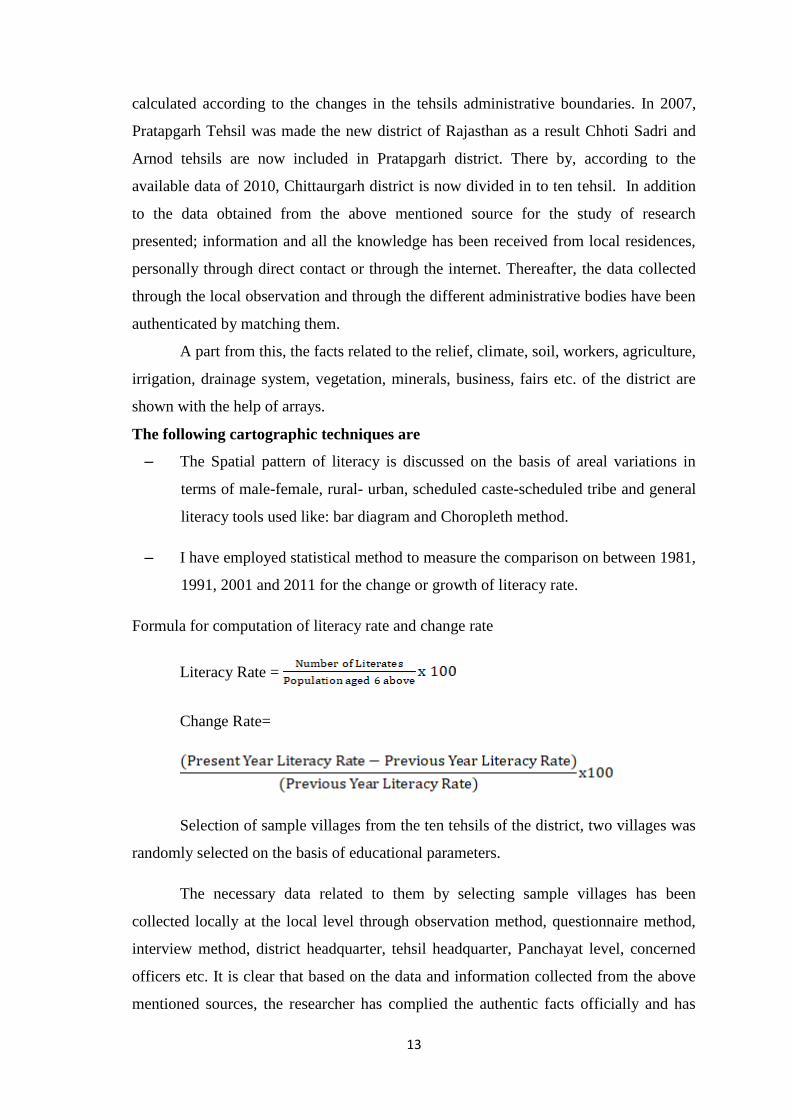
Formula for computation of literacy rate and change rate
Literacy Rate =
Change Rate=
Selection of sample villages from the ten tehsils of the district, two villages was
randomly selected on the basis of educational parameters.
The necessary data related to them by selecting sample villages has been
collected locally at the local level through observation method, questionnaire method,
interview method, district headquarter, tehsil headquarter, Panchayat level, concerned
officers etc. It is clear that based on the data and information collected from the above
mentioned sources, the researcher has complied the authentic facts officially and has

14
used it in research work, with the help of which the researcher could complete this
research systematically and properly.
1.6 Sources of Data
Availability of above mentioned and reliable data is essential for research,
which is collected by various techniques and methods. For the study of various
symptoms of literacy rates and population, many types of data are required to be
collected from many methods and sources. Geographical studies are related to place or
area. Therefore, according to the size of the study area, the first problem is the selection
of the method of collection of data. When the small scale research work is done, due to
the field constraints, the researcher must make the necessary data themselves.
Comprehensive information regarding small areas is not generally available for
government publications or records. This is the reason that the population data for small
scale studies such as- village, development block, small town etc. is collected by the
researcher himself or with his friends. When the study area of research is elaborate
them it is not possible to collect data at the individual level. Therefore, data related to
population, literary for large area received from various publications, Government and
Non-Government records. The present research work is based on the study of literacy
levels of Chittaurgarh district of Rajasthan. Primary and secondary data have been
collected in this research for the study of literacy level of Chittaurgarh district. The
present work is an empirical study designed for a micro level investigation, which is a
data based research. The analysis is based on sample method for the tendency of the
development of educational facilities at tehsil level. Field survey were undertaken to
survey the schools and households on the basis of random approach.
Primary data collection for different aspects, related to literacy such as
population, literate persons, education level, occupational structure, income structure,
house condition and infrastructure facilities, schools, teachers, students, educational
basic facilities etc. has been collected personally by going to the village level, for
knowing the real situation. For the above mentioned aspects direct personal survey
method, questionnaires and interview has been done.
Beside the interviews and interactions with the natives of different localities, the
educational centers helped in the analysis of the study. Field observations were of
15
immense help for the interpretation of the result. On the other hand figures have been
collected from the books and records published by the Economic and Statistical outline,
District Information Centers, Demographics Department etc. As a source of secondary
data of this data, the census data of 1981, 1991, 2001 and 2011 has been collected from
the District Census Handbook. The study of other literature related to the subject has
also been studied for this research and according to the prescribed objectives; the
published and unpublished data collected from various sources has been studied
compiled, edited, promoted, mapped, tabulated and analyzed. Data and information
related to relief, slope, drainage-systems, transport, and settlements were received from
the census report.
1.7 Graphical View and Mapping Techniques
In the study of Geography, maps are of utmost importance in order to give a
more accessible, simple and explicit form and to display statistics, facts etc. in visual
from. In addition, the diagrams have also been displayed appropriately. Thus, the map
the facts and figures are grasped in the mind through a diagram for a clearer and longer
period of time, as the maps and diagrams show all the topics through various aspects,
conditions, intensity and diversity which can be be highlighted in a meaningful way. In
this research, the literacy aspects of Chittaurgarh district have been depicted through
maps and diagrams. The method of mapping like-choropleth method and diagrams has
been used to show various literacy related data with the help of maps.
16
CHAPTER- II
GEOGRAPHICAL INDIVIDUALITY OF THE AREA
2.1 Historical Background
The land of bravery and sacrifice is the epitome of Chattri Rajput (Indian
warrior caste) pride, romance and spirit for the people of Chittaurgarh always chose
death before surrendering against anyone. It reverberate the history of heroism and
nobility that is evident from the tales still by the bard of Rajasthan.
The eventful history of Chittaurgarh dates back to the Mahabharata. The legend
has it that the brave Bhim stomped the ground with such force that a water body was
born known as „Bhim Lat‟. Historically, it is believed that Chittaurgarh was built by the
Maurya dynasty in the 7th Century A.D. It was then named Chitrakut after Chitrangada
Mori, a Rajput chieftain as inscribed on ancient Mewari coins. Some accounts say that
the Mori dynasty was in possession of the Chittaurgarh fort when Bappa Rawal the
legendary founders of the kingdom of Mewar seized Chittaurgarh and made it the
capital in 734 A.D.
Throughout the period of 8th Century to the 16th Century, the descendents of
Bappa Rawal reined over Mewar, stretching from Gujarat to Ajmer. And during these
times only, Chittaurgarh was besieged three times. The first attack was by Allaudin
Khilji in 1303 A.D, who was enamored by the beauty of Padmini of which he had only
heard. Rani Padmini preferred death to abduction and dishonor and committed jauhar
along with other ladies of kingdom. The year 1535 saw the Bahadur Shah, the sultan of
Gujarat attack the fort and sentencing many men to death. It was during this time that
women folk of Chittaurgarh, led by Karnawati, committed jauhar. After few years in
1568, Mughal emperor Akbar wrecked the fort and brought it to ruins. Chittaurgarh is
also famous for its association with very widely known historical figures of Maharana
Kumbha, Sanga, Pratap, Pannadhai and Meera Bai. Chittaurgarh is often called as the
„Bhakti and Shakti ki Nagri‟.
The district is named after the town of Chittaurgarh, which is the headquarters
of district administration. The district in its present shape was carved out of the various
erstwhile princely territories, namely the portions of Mewar State, Pratapgarh State,
17
Nimbahera district of Tonk State, 79 villages of the former Madhya Bharat and five
forest villages of Jhalawar State. The district, initially with headquarters at Nimbahera,
was formed on the 1st August, 1948, comprising the tehsils of Nimbahera, Dungla,
Bhadesar, Kapasan, Rashmi, Chittaurgarh and Kanera. In February, 1949, tehsil
Kuakhera was also transferred to this district. Later on a new tehsil Gangrar was formed
and the headquarters of tehsil Kuakhera were shifted to Bhainsrorgarh. The district was
again re-organized at the time of formation of Rajasthan by adding Pratapgarh, Achnera
and Chhoti Sadri tehsils and Nimbahera was made the district headquarters. In 1950,
the district headquarter was shifted to Chittaurgarh. On 25-01-2008 State government
has transferred Pratapgarh, Chhoti Sadari and Arnod tehsils to form a new district
Pratapgarh.
2.2 Geographical Location of the Area
In term of location the district is located between 23° 32' and 25° 13' north
latitudes and between 74° 12' and 75° 49' east longitudes in the south eastern part of
Rajasthan State. The district encompasses 10,856 sq. km. (3.17 per cent of the
Rajasthan State) area of land. The topography of the district is generally undulating
with hills belonging to the Aravalli Ranges scattering over the entire region. Four major
rivers run through the district, namely Chambal, Banas, Bedach and Jakaharn along
with tributaries such as Gambhiri, Barhmani and Gunjali.
The district is divided into a larger western and a smaller eastern portion by
Neemuch District of Madhya Pradesh. The western portion is bordered by
Neemuch, Mandsaur, and Ratlam districts of Madhya Pradesh to the east, and the
Rajasthan district of Pratapgarh to the south, Udaipur and Rajsamand to the east,
and Bhilwara to the north. The eastern portion is bordered by Rajasthan districts of
Bhilwara, Bundi, and Kota districts to the north and Neemuch District of Madhya
Pradesh to the south and west.Chittaurgarh is east of Udaipur, south of Jaipur and
situated at the beginning of Vindhyan Mountains in south-eastern Rajasthan.
Chittaurgarh City is located at 24.88°N latitude to 74.63°E longitude. It has an
average elevation of 394 meters (1292 ft). Chittaurgarh is located in the southern part of
the State of Rajasthan, in the north western part of India. It is located beside a high hill
near the Gambhiri River.
18
Figure- 2.1
19
2.3 Geology and Relief
The topography of the district is generally undulating but the hills belonging to
the famous Aravalli range are scattered all over the area. The western, southern and
northern parts of the district are to some extent plain. Bhainsrorgarh area in the east is
practically hilly excepting some portion which is plain but is surrounded by hills. The
district gently slopes from south to north, the height varying from 317 meters to
maximum 617 meters at Palkhera. The slopes of the hills are gentle and steep and are
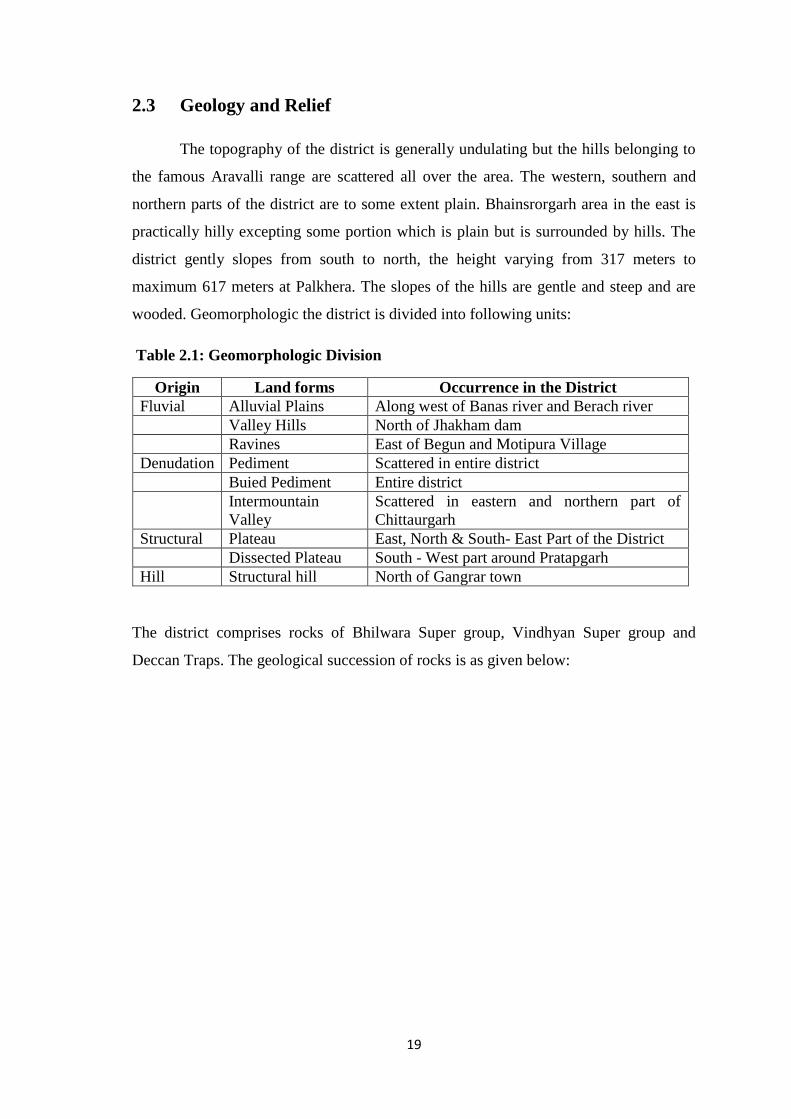
wooded. Geomorphologic the district is divided into following units:
Table 2.1: Geomorphologic Division
Origin Land forms Occurrence in the District Fluvial Alluvial Plains Along west of Banas river and Berach river Valley Hills North of Jhakham dam Ravines East of Begun and Motipura Village Denudation Pediment Scattered in entire district Buied Pediment Entire district Intermountain
Valley Scattered in eastern and northern part of Chittaurgarh
Structural Plateau East, North & South- East Part of the District Dissected Plateau South - West part around Pratapgarh Hill Structural hill North of Gangrar town
The district comprises rocks of Bhilwara Super group, Vindhyan Super group and
Deccan Traps. The geological succession of rocks is as given below:
20
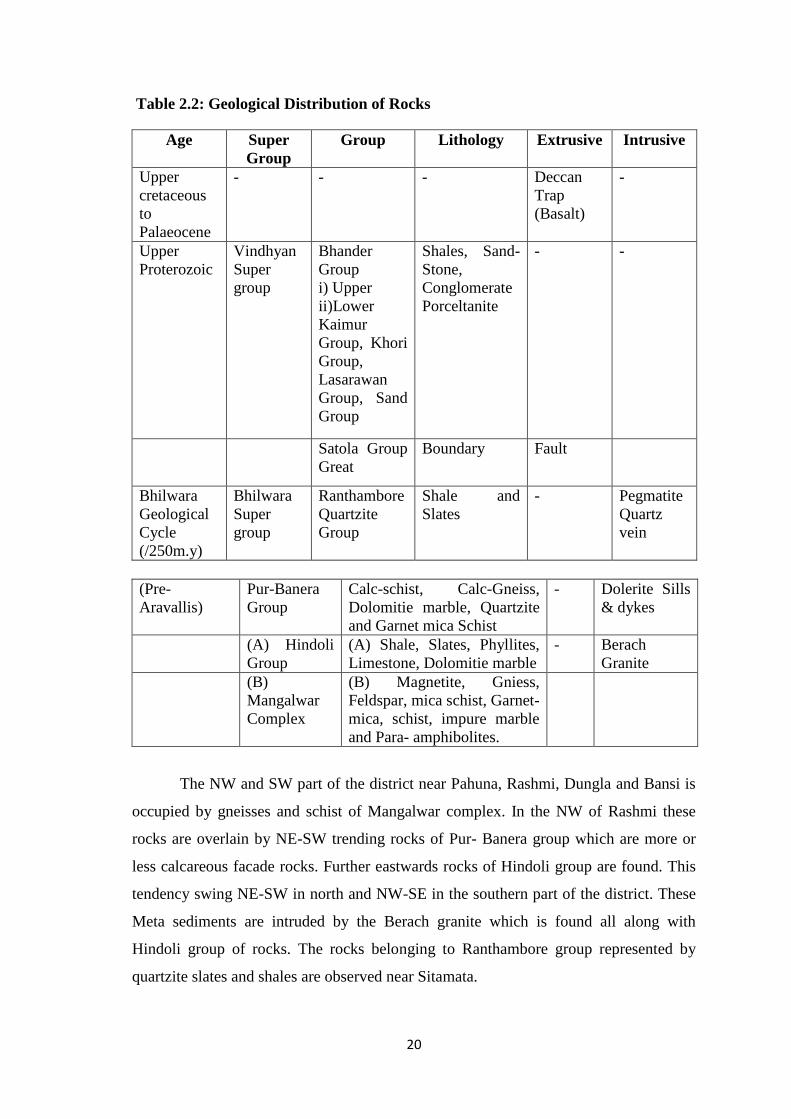
Table 2.2: Geological Distribution of Rocks
Age Super Group
Group Lithology Extrusive Intrusive
Upper cretaceous to Palaeocene
- - - Deccan Trap (Basalt)
-
Upper Proterozoic
Vindhyan Super group
Bhander Group i) Upper ii)Lower Kaimur Group, Khori Group, Lasarawan Group, Sand Group
Shales, Sand- Stone, Conglomerate Porceltanite
- -
Satola Group Great
Boundary Fault
Bhilwara Geological Cycle (/250m.y)
Bhilwara Super group
Ranthambore Quartzite Group
Shale and Slates
- Pegmatite Quartz vein
(Pre- Aravallis)
Pur-Banera Group
Calc-schist, Calc-Gneiss, Dolomitie marble, Quartzite and Garnet mica Schist
- Dolerite Sills & dykes
(A) Hindoli Group
(A) Shale, Slates, Phyllites, Limestone, Dolomitie marble
- Berach Granite
(B) Mangalwar Complex
(B) Magnetite, Gniess, Feldspar, mica schist, Garnet-mica, schist, impure marble and Para- amphibolites.
The NW and SW part of the district near Pahuna, Rashmi, Dungla and Bansi is
occupied by gneisses and schist of Mangalwar complex. In the NW of Rashmi these
rocks are overlain by NE-SW trending rocks of Pur- Banera group which are more or
less calcareous facade rocks. Further eastwards rocks of Hindoli group are found. This
tendency swing NE-SW in north and NW-SE in the southern part of the district. These
Meta sediments are intruded by the Berach granite which is found all along with
Hindoli group of rocks. The rocks belonging to Ranthambore group represented by
quartzite slates and shales are observed near Sitamata.
21
Vindhyan sedimentary are found further east separated by great boundary fault
in the NW of Chittaurgarh. These comprise conglomerates, shale, sandstone, limestone
and porcelain. Deccan traps are exposed in the southern portion which is basaltic in
nature. Several different flows have been identified. Intrusive bodies of dolerite are
found in Gangrar and Bari Sadri tehsils.
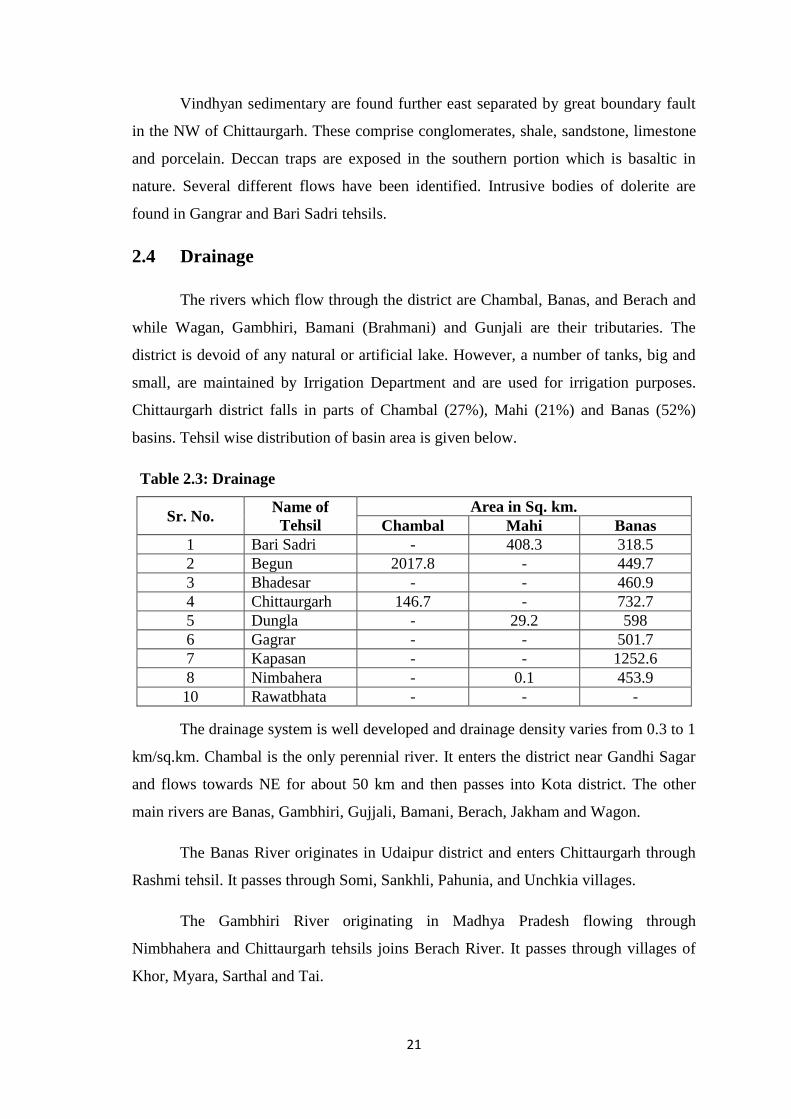
2.4 Drainage
The rivers which flow through the district are Chambal, Banas, and Berach and
while Wagan, Gambhiri, Bamani (Brahmani) and Gunjali are their tributaries. The
district is devoid of any natural or artificial lake. However, a number of tanks, big and
small, are maintained by Irrigation Department and are used for irrigation purposes.
Chittaurgarh district falls in parts of Chambal (27%), Mahi (21%) and Banas (52%)
basins. Tehsil wise distribution of basin area is given below.
Table 2.3: Drainage
Sr. No. Name of Tehsil
Area in Sq. km. Chambal Mahi Banas
1 Bari Sadri - 408.3 318.5 2 Begun 2017.8 - 449.7 3 Bhadesar - - 460.9 4 Chittaurgarh 146.7 - 732.7 5 Dungla - 29.2 598 6 Gagrar - - 501.7 7 Kapasan - - 1252.6 8 Nimbahera - 0.1 453.9 10 Rawatbhata - - -
The drainage system is well developed and drainage density varies from 0.3 to 1
km/sq.km. Chambal is the only perennial river. It enters the district near Gandhi Sagar
and flows towards NE for about 50 km and then passes into Kota district. The other
main rivers are Banas, Gambhiri, Gujjali, Bamani, Berach, Jakham and Wagon.
The Banas River originates in Udaipur district and enters Chittaurgarh through
Rashmi tehsil. It passes through Somi, Sankhli, Pahunia, and Unchkia villages.
The Gambhiri River originating in Madhya Pradesh flowing through
Nimbhahera and Chittaurgarh tehsils joins Berach River. It passes through villages of
Khor, Myara, Sarthal and Tai.

22
2.5 Climate
The maximum & minimum temperature recorded at Chittaurgarh centre during
the year 2011 was 45.8°C and 2.3°C. The normal rainfall in the district is about 841.5
mm. while actual rainfall at the district headquarters during the year 2011 is 861.0 mm.
The climate of this district is generally dry except during the south-west monsoon
season. The duration of cold season is from December to February, while that of
summer from March to the third week of June. The south-west monsoon season this
follows thereafter lasts till about the middle of September. The meteorological
observatory set up at Chambal dam registers the data of temperature for the district.
The suitability of climate for the field work is in the months of July, October
and March.
2.5.1 Temperature
The following table shows the unevenness is the temperature-
Table 2.4: Temperature
Year Temperature
Humidity Percentage Maximum Minimum Mean
2007 44.6 3.4 25.9 56 2008 43.5 0.5 25.4 58 2009 45.5 4.6 26.1 56 2010 47.5 4.0 26.7 55 2011 45.5 2.3 25.9 61
Source: India Meteorological Department, Government of India.
2.5.2 Rainfall
The annual normal rainfall of the district is 841.5 mm. The following table shows
the annual rainfall and deviation from normal rain fall-
Table 2.5: Rainfall
Year Rainfall (in mm) Percent variation from Normal Rainfall 2007 742.2 -11.80 2008 815.9 -3.04 2009 576.7 -31.47 2010 829.3 -1.45 2011 861.0 2.32
Source: Statistical Abstract Rajasthan 2011/2012 (DES, Government of Rajasthan)
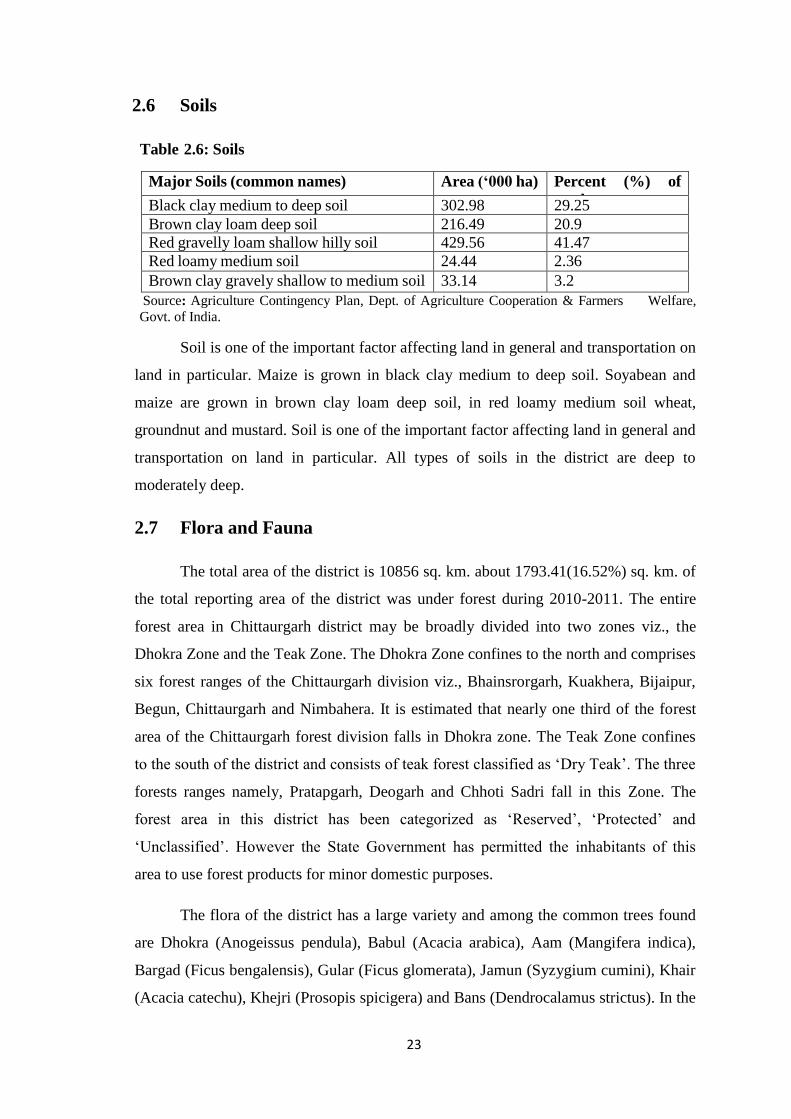
23
2.6 Soils
Table 2.6: Soils
Major Soils (common names)
Area (‘000 ha) Percent (%) of total Black clay medium to deep soil 302.98 29.25
Brown clay loam deep soil 216.49 20.9 Red gravelly loam shallow hilly soil 429.56 41.47 Red loamy medium soil 24.44 2.36 Brown clay gravely shallow to medium soil 33.14 3.2
Source: Agriculture Contingency Plan, Dept. of Agriculture Cooperation & Farmers Welfare, Govt. of India.
Soil is one of the important factor affecting land in general and transportation on
land in particular. Maize is grown in black clay medium to deep soil. Soyabean and
maize are grown in brown clay loam deep soil, in red loamy medium soil wheat,
groundnut and mustard. Soil is one of the important factor affecting land in general and
transportation on land in particular. All types of soils in the district are deep to
moderately deep.
2.7 Flora and Fauna
The total area of the district is 10856 sq. km. about 1793.41(16.52%) sq. km. of
the total reporting area of the district was under forest during 2010-2011. The entire
forest area in Chittaurgarh district may be broadly divided into two zones viz., the
Dhokra Zone and the Teak Zone. The Dhokra Zone confines to the north and comprises
six forest ranges of the Chittaurgarh division viz., Bhainsrorgarh, Kuakhera, Bijaipur,
Begun, Chittaurgarh and Nimbahera. It is estimated that nearly one third of the forest
area of the Chittaurgarh forest division falls in Dhokra zone. The Teak Zone confines
to the south of the district and consists of teak forest classified as „Dry Teak‟. The three
forests ranges namely, Pratapgarh, Deogarh and Chhoti Sadri fall in this Zone. The
forest area in this district has been categorized as „Reserved‟, „Protected‟ and
„Unclassified‟. However the State Government has permitted the inhabitants of this
area to use forest products for minor domestic purposes.
The flora of the district has a large variety and among the common trees found
are Dhokra (Anogeissus pendula), Babul (Acacia arabica), Aam (Mangifera indica),
Bargad (Ficus bengalensis), Gular (Ficus glomerata), Jamun (Syzygium cumini), Khair
(Acacia catechu), Khejri (Prosopis spicigera) and Bans (Dendrocalamus strictus). In the
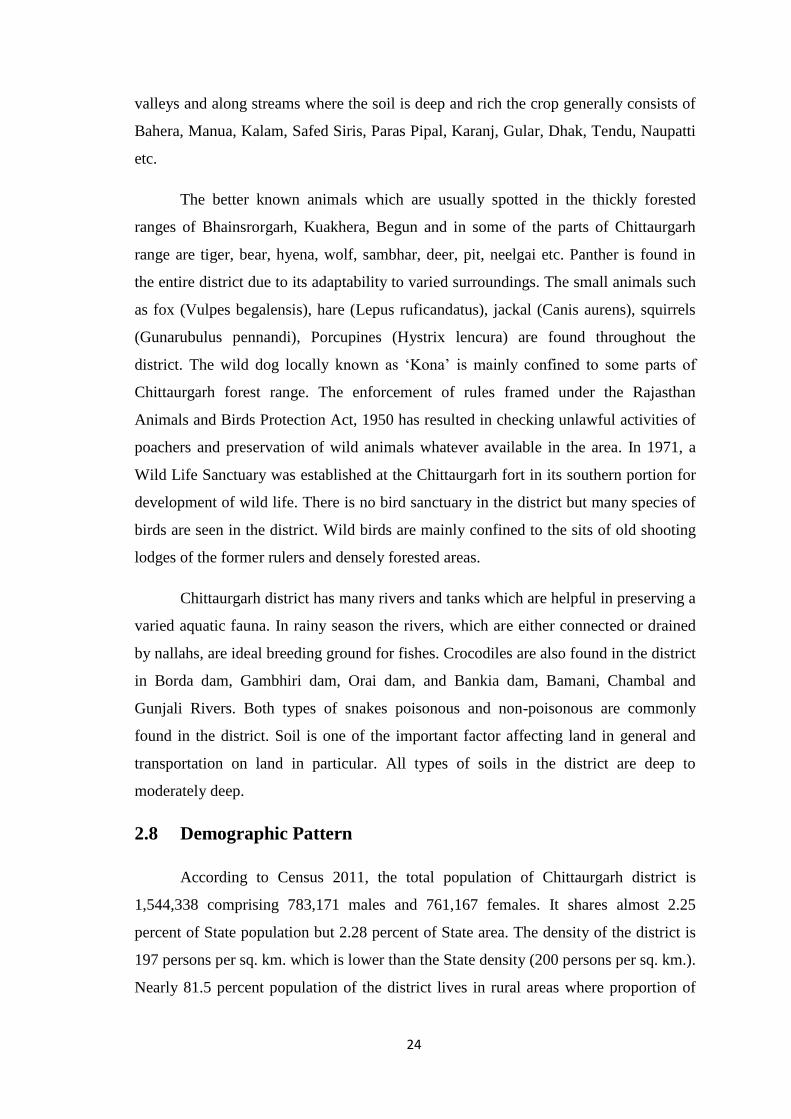
24
valleys and along streams where the soil is deep and rich the crop generally consists of
Bahera, Manua, Kalam, Safed Siris, Paras Pipal, Karanj, Gular, Dhak, Tendu, Naupatti
etc.
The better known animals which are usually spotted in the thickly forested
ranges of Bhainsrorgarh, Kuakhera, Begun and in some of the parts of Chittaurgarh
range are tiger, bear, hyena, wolf, sambhar, deer, pit, neelgai etc. Panther is found in
the entire district due to its adaptability to varied surroundings. The small animals such
as fox (Vulpes begalensis), hare (Lepus ruficandatus), jackal (Canis aurens), squirrels
(Gunarubulus pennandi), Porcupines (Hystrix lencura) are found throughout the
district. The wild dog locally known as „Kona‟ is mainly confined to some parts of
Chittaurgarh forest range. The enforcement of rules framed under the Rajasthan
Animals and Birds Protection Act, 1950 has resulted in checking unlawful activities of
poachers and preservation of wild animals whatever available in the area. In 1971, a
Wild Life Sanctuary was established at the Chittaurgarh fort in its southern portion for
development of wild life. There is no bird sanctuary in the district but many species of
birds are seen in the district. Wild birds are mainly confined to the sits of old shooting
lodges of the former rulers and densely forested areas.
Chittaurgarh district has many rivers and tanks which are helpful in preserving a
varied aquatic fauna. In rainy season the rivers, which are either connected or drained
by nallahs, are ideal breeding ground for fishes. Crocodiles are also found in the district
in Borda dam, Gambhiri dam, Orai dam, and Bankia dam, Bamani, Chambal and
Gunjali Rivers. Both types of snakes poisonous and non-poisonous are commonly
found in the district. Soil is one of the important factor affecting land in general and
transportation on land in particular. All types of soils in the district are deep to
moderately deep.
2.8 Demographic Pattern
According to Census 2011, the total population of Chittaurgarh district is
1,544,338 comprising 783,171 males and 761,167 females. It shares almost 2.25
percent of State population but 2.28 percent of State area. The density of the district is
197 persons per sq. km. which is lower than the State density (200 persons per sq. km.).
Nearly 81.5 percent population of the district lives in rural areas where proportion of
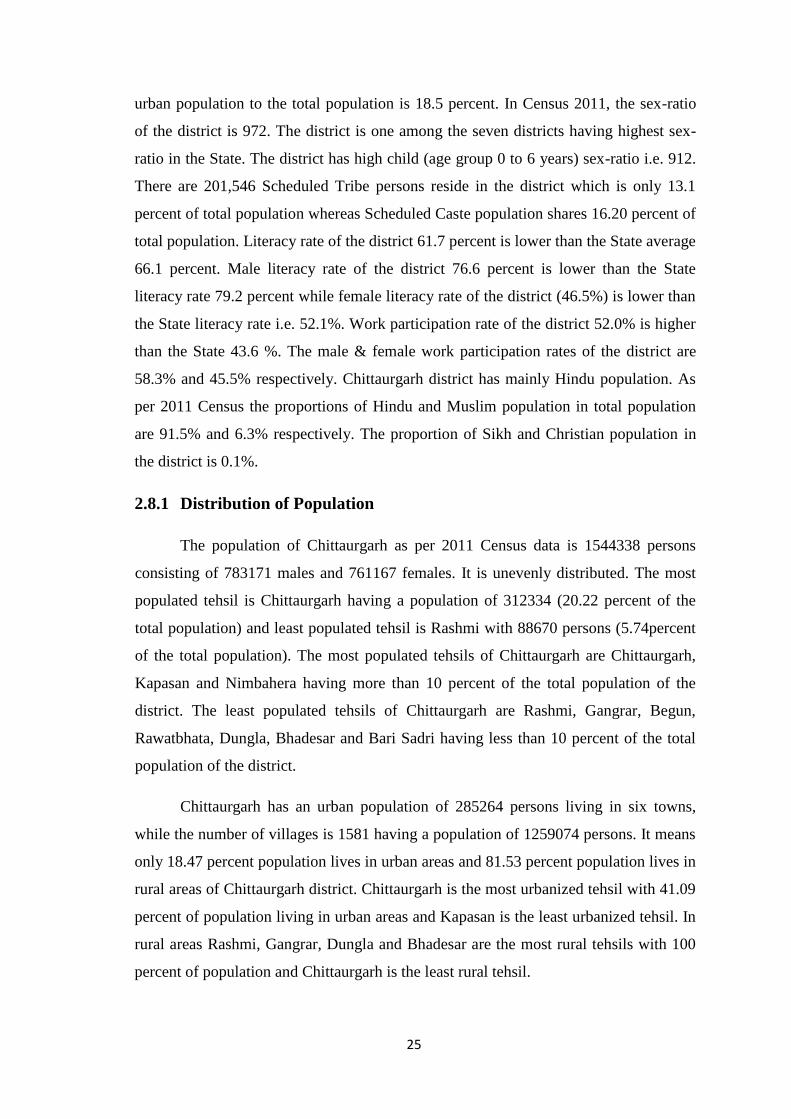
25
urban population to the total population is 18.5 percent. In Census 2011, the sex-ratio
of the district is 972. The district is one among the seven districts having highest sex-
ratio in the State. The district has high child (age group 0 to 6 years) sex-ratio i.e. 912.
There are 201,546 Scheduled Tribe persons reside in the district which is only 13.1
percent of total population whereas Scheduled Caste population shares 16.20 percent of
total population. Literacy rate of the district 61.7 percent is lower than the State average
66.1 percent. Male literacy rate of the district 76.6 percent is lower than the State
literacy rate 79.2 percent while female literacy rate of the district (46.5%) is lower than
the State literacy rate i.e. 52.1%. Work participation rate of the district 52.0% is higher
than the State 43.6 %. The male & female work participation rates of the district are
58.3% and 45.5% respectively. Chittaurgarh district has mainly Hindu population. As
per 2011 Census the proportions of Hindu and Muslim population in total population
are 91.5% and 6.3% respectively. The proportion of Sikh and Christian population in
the district is 0.1%.
2.8.1 Distribution of Population
The population of Chittaurgarh as per 2011 Census data is 1544338 persons
consisting of 783171 males and 761167 females. It is unevenly distributed. The most
populated tehsil is Chittaurgarh having a population of 312334 (20.22 percent of the
total population) and least populated tehsil is Rashmi with 88670 persons (5.74percent
of the total population). The most populated tehsils of Chittaurgarh are Chittaurgarh,
Kapasan and Nimbahera having more than 10 percent of the total population of the
district. The least populated tehsils of Chittaurgarh are Rashmi, Gangrar, Begun,
Rawatbhata, Dungla, Bhadesar and Bari Sadri having less than 10 percent of the total
population of the district.
Chittaurgarh has an urban population of 285264 persons living in six towns,
while the number of villages is 1581 having a population of 1259074 persons. It means
only 18.47 percent population lives in urban areas and 81.53 percent population lives in
rural areas of Chittaurgarh district. Chittaurgarh is the most urbanized tehsil with 41.09
percent of population living in urban areas and Kapasan is the least urbanized tehsil. In
rural areas Rashmi, Gangrar, Dungla and Bhadesar are the most rural tehsils with 100
percent of population and Chittaurgarh is the least rural tehsil.
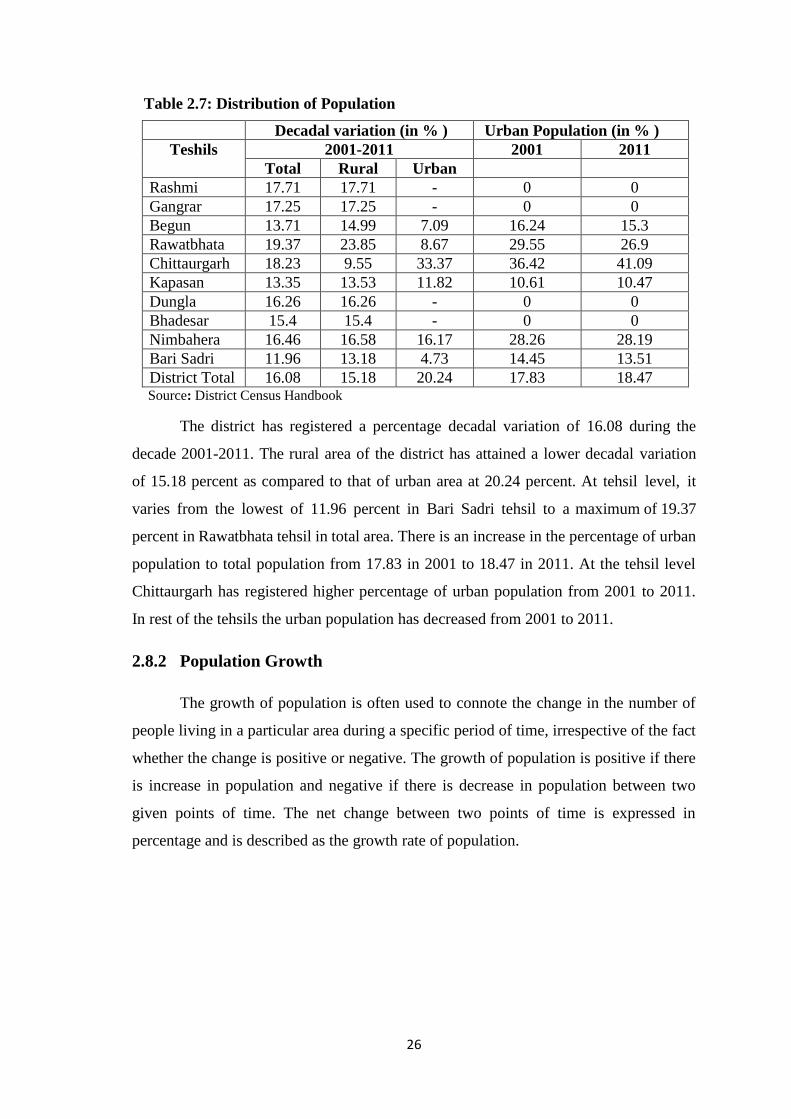
26
Table 2.7: Distribution of Population
Decadal variation (in % ) Urban Population (in % )
Teshils 2001-2011 2001 2011 Total Rural Urban
Rashmi 17.71 17.71 - 0 0 Gangrar 17.25 17.25 - 0 0 Begun 13.71 14.99 7.09 16.24 15.3 Rawatbhata 19.37 23.85 8.67 29.55 26.9 Chittaurgarh 18.23 9.55 33.37 36.42 41.09 Kapasan 13.35 13.53 11.82 10.61 10.47 Dungla 16.26 16.26 - 0 0 Bhadesar 15.4 15.4 - 0 0 Nimbahera 16.46 16.58 16.17 28.26 28.19 Bari Sadri 11.96 13.18 4.73 14.45 13.51 District Total 16.08 15.18 20.24 17.83 18.47
Source: District Census Handbook
The district has registered a percentage decadal variation of 16.08 during the
decade 2001-2011. The rural area of the district has attained a lower decadal variation
of 15.18 percent as compared to that of urban area at 20.24 percent. At tehsil level, it
varies from the lowest of 11.96 percent in Bari Sadri tehsil to a maximum of 19.37
percent in Rawatbhata tehsil in total area. There is an increase in the percentage of urban
population to total population from 17.83 in 2001 to 18.47 in 2011. At the tehsil level
Chittaurgarh has registered higher percentage of urban population from 2001 to 2011.
In rest of the tehsils the urban population has decreased from 2001 to 2011.
2.8.2 Population Growth
The growth of population is often used to connote the change in the number of
people living in a particular area during a specific period of time, irrespective of the fact
whether the change is positive or negative. The growth of population is positive if there
is increase in population and negative if there is decrease in population between two
given points of time. The net change between two points of time is expressed in
percentage and is described as the growth rate of population.
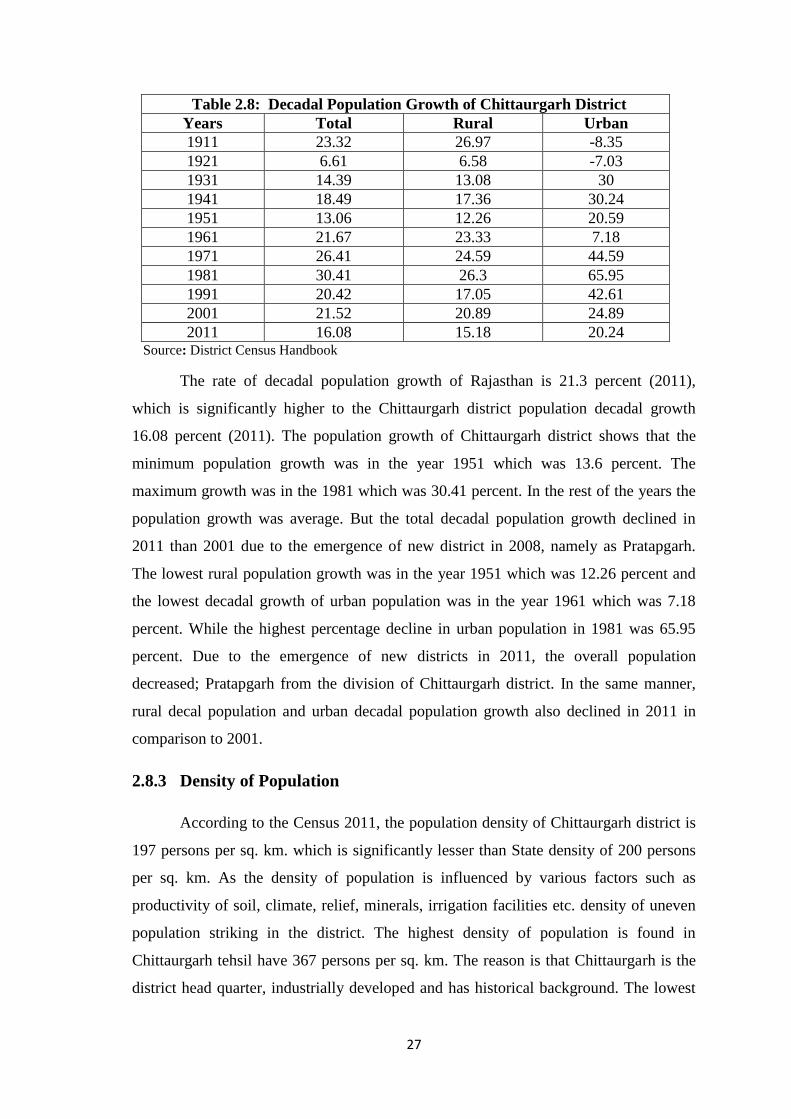
27
Table 2.8: Decadal Population Growth of Chittaurgarh District Years Total Rural Urban 1911 23.32 26.97 -8.35 1921 6.61 6.58 -7.03 1931 14.39 13.08 30 1941 18.49 17.36 30.24 1951 13.06 12.26 20.59 1961 21.67 23.33 7.18 1971 26.41 24.59 44.59 1981 30.41 26.3 65.95 1991 20.42 17.05 42.61 2001 21.52 20.89 24.89 2011 16.08 15.18 20.24
Source: District Census Handbook
The rate of decadal population growth of Rajasthan is 21.3 percent (2011),
which is significantly higher to the Chittaurgarh district population decadal growth
16.08 percent (2011). The population growth of Chittaurgarh district shows that the
minimum population growth was in the year 1951 which was 13.6 percent. The
maximum growth was in the 1981 which was 30.41 percent. In the rest of the years the
population growth was average. But the total decadal population growth declined in
2011 than 2001 due to the emergence of new district in 2008, namely as Pratapgarh.
The lowest rural population growth was in the year 1951 which was 12.26 percent and
the lowest decadal growth of urban population was in the year 1961 which was 7.18
percent. While the highest percentage decline in urban population in 1981 was 65.95
percent. Due to the emergence of new districts in 2011, the overall population
decreased; Pratapgarh from the division of Chittaurgarh district. In the same manner,
rural decal population and urban decadal population growth also declined in 2011 in
comparison to 2001.
2.8.3 Density of Population
According to the Census 2011, the population density of Chittaurgarh district is
197 persons per sq. km. which is significantly lesser than State density of 200 persons
per sq. km. As the density of population is influenced by various factors such as
productivity of soil, climate, relief, minerals, irrigation facilities etc. density of uneven
population striking in the district. The highest density of population is found in
Chittaurgarh tehsil have 367 persons per sq. km. The reason is that Chittaurgarh is the
district head quarter, industrially developed and has historical background. The lowest
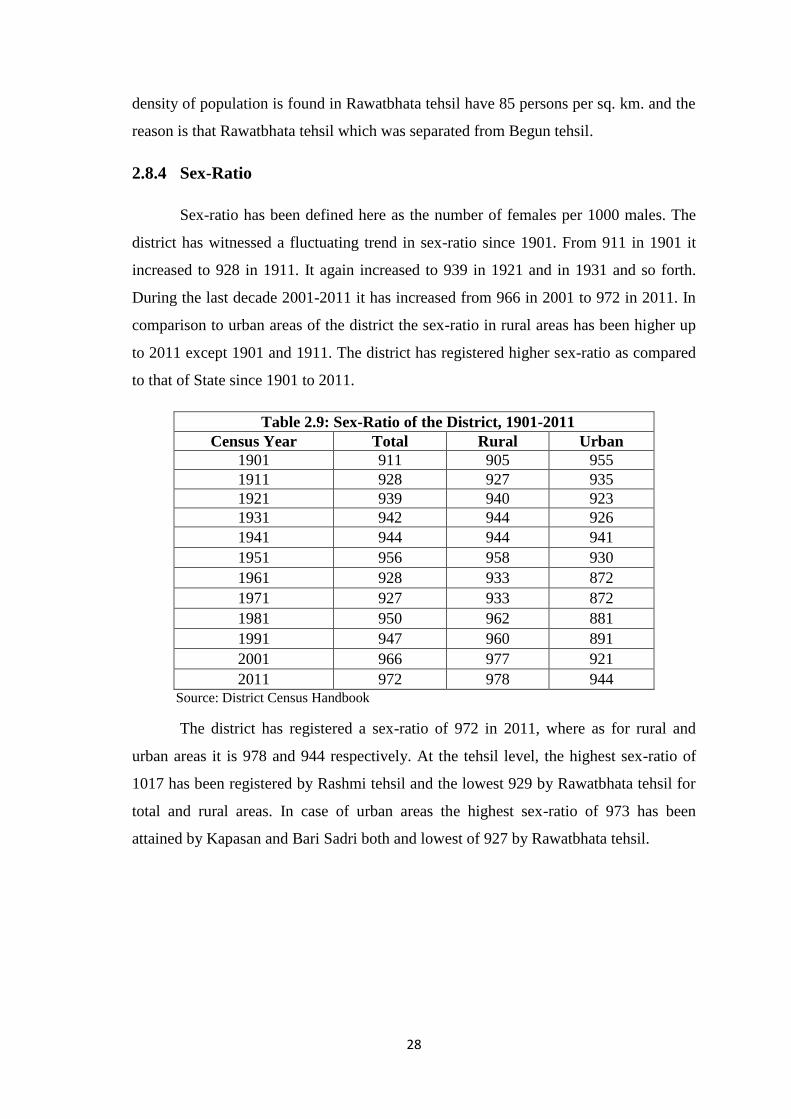
28
density of population is found in Rawatbhata tehsil have 85 persons per sq. km. and the
reason is that Rawatbhata tehsil which was separated from Begun tehsil.
2.8.4 Sex-Ratio
Sex-ratio has been defined here as the number of females per 1000 males. The
district has witnessed a fluctuating trend in sex-ratio since 1901. From 911 in 1901 it
increased to 928 in 1911. It again increased to 939 in 1921 and in 1931 and so forth.
During the last decade 2001-2011 it has increased from 966 in 2001 to 972 in 2011. In
comparison to urban areas of the district the sex-ratio in rural areas has been higher up
to 2011 except 1901 and 1911. The district has registered higher sex-ratio as compared
to that of State since 1901 to 2011.
Table 2.9: Sex-Ratio of the District, 1901-2011 Census Year Total Rural Urban
1901 911 905 955 1911 928 927 935 1921 939 940 923 1931 942 944 926 1941 944 944 941 1951 956 958 930 1961 928 933 872 1971 927 933 872 1981 950 962 881 1991 947 960 891 2001 966 977 921 2011 972 978 944
Source: District Census Handbook
The district has registered a sex-ratio of 972 in 2011, where as for rural and
urban areas it is 978 and 944 respectively. At the tehsil level, the highest sex-ratio of
1017 has been registered by Rashmi tehsil and the lowest 929 by Rawatbhata tehsil for
total and rural areas. In case of urban areas the highest sex-ratio of 973 has been
attained by Kapasan and Bari Sadri both and lowest of 927 by Rawatbhata tehsil.
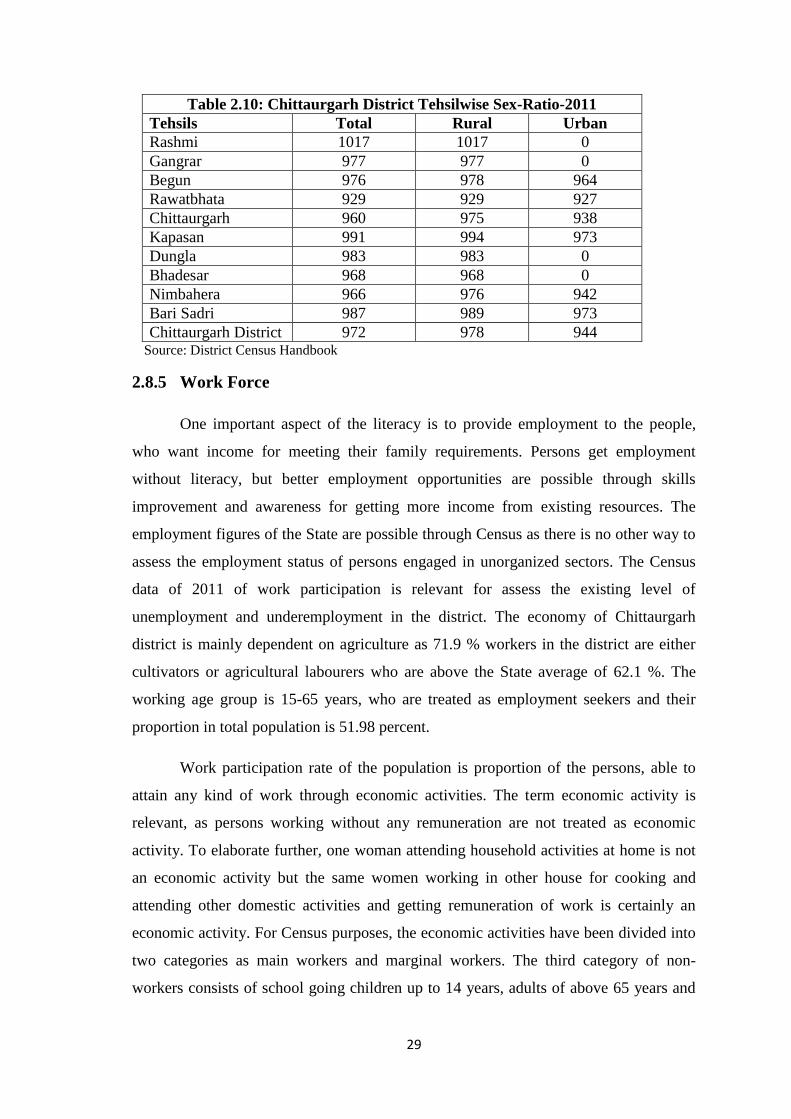
29
Table 2.10: Chittaurgarh District Tehsilwise Sex-Ratio-2011 Tehsils Total Rural Urban Rashmi 1017 1017 0 Gangrar 977 977 0 Begun 976 978 964 Rawatbhata 929 929 927 Chittaurgarh 960 975 938 Kapasan 991 994 973 Dungla 983 983 0 Bhadesar 968 968 0 Nimbahera 966 976 942 Bari Sadri 987 989 973 Chittaurgarh District 972 978 944
Source: District Census Handbook
2.8.5 Work Force
One important aspect of the literacy is to provide employment to the people,
who want income for meeting their family requirements. Persons get employment
without literacy, but better employment opportunities are possible through skills
improvement and awareness for getting more income from existing resources. The
employment figures of the State are possible through Census as there is no other way to
assess the employment status of persons engaged in unorganized sectors. The Census
data of 2011 of work participation is relevant for assess the existing level of
unemployment and underemployment in the district. The economy of Chittaurgarh
district is mainly dependent on agriculture as 71.9 % workers in the district are either
cultivators or agricultural labourers who are above the State average of 62.1 %. The
working age group is 15-65 years, who are treated as employment seekers and their
proportion in total population is 51.98 percent.
Work participation rate of the population is proportion of the persons, able to
attain any kind of work through economic activities. The term economic activity is
relevant, as persons working without any remuneration are not treated as economic
activity. To elaborate further, one woman attending household activities at home is not
an economic activity but the same women working in other house for cooking and
attending other domestic activities and getting remuneration of work is certainly an
economic activity. For Census purposes, the economic activities have been divided into
two categories as main workers and marginal workers. The third category of non-
workers consists of school going children up to 14 years, adults of above 65 years and
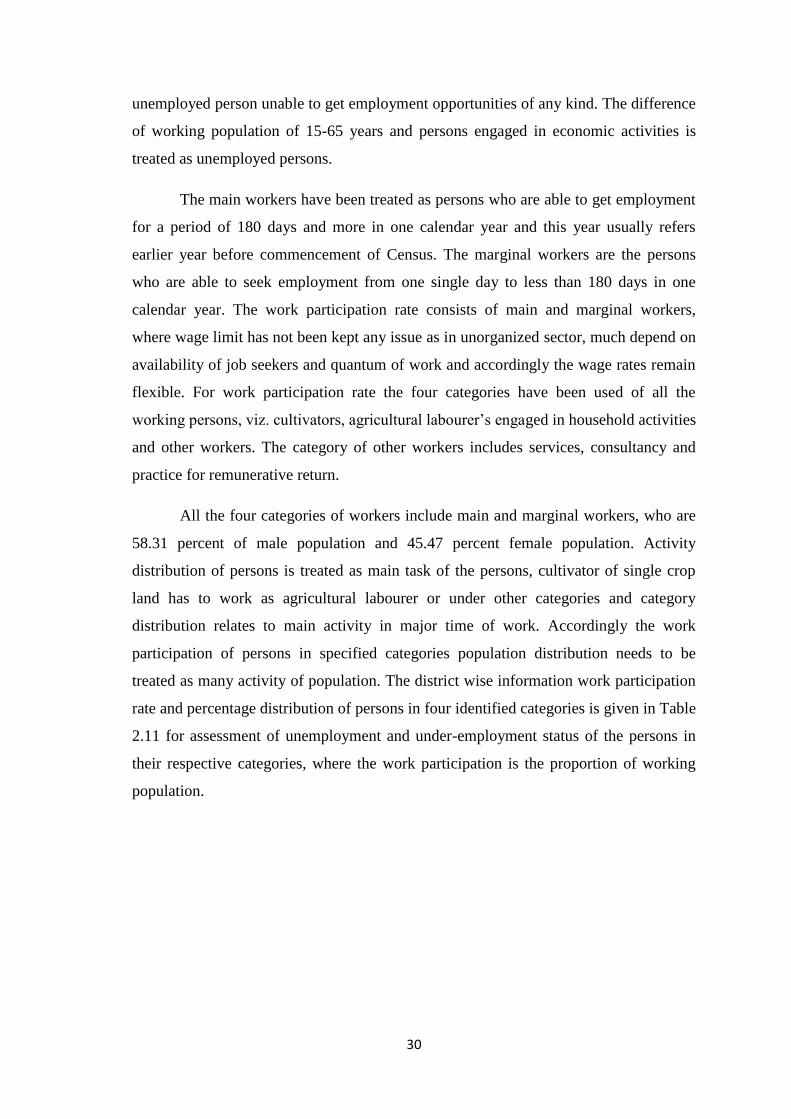
30
unemployed person unable to get employment opportunities of any kind. The difference
of working population of 15-65 years and persons engaged in economic activities is
treated as unemployed persons.
The main workers have been treated as persons who are able to get employment
for a period of 180 days and more in one calendar year and this year usually refers
earlier year before commencement of Census. The marginal workers are the persons
who are able to seek employment from one single day to less than 180 days in one
calendar year. The work participation rate consists of main and marginal workers,
where wage limit has not been kept any issue as in unorganized sector, much depend on
availability of job seekers and quantum of work and accordingly the wage rates remain
flexible. For work participation rate the four categories have been used of all the
working persons, viz. cultivators, agricultural labourer‟s engaged in household activities
and other workers. The category of other workers includes services, consultancy and
practice for remunerative return.
All the four categories of workers include main and marginal workers, who are
58.31 percent of male population and 45.47 percent female population. Activity
distribution of persons is treated as main task of the persons, cultivator of single crop
land has to work as agricultural labourer or under other categories and category
distribution relates to main activity in major time of work. Accordingly the work
participation of persons in specified categories population distribution needs to be
treated as many activity of population. The district wise information work participation
rate and percentage distribution of persons in four identified categories is given in Table
2.11 for assessment of unemployment and under-employment status of the persons in
their respective categories, where the work participation is the proportion of working
population.
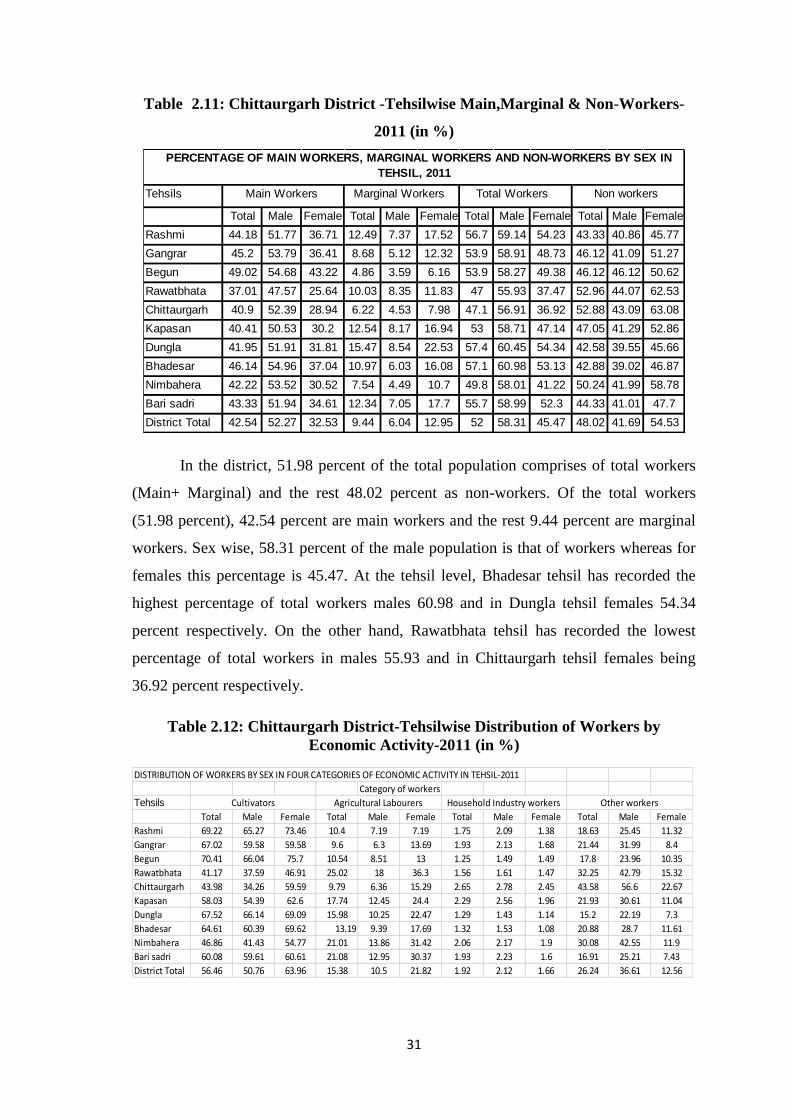
31
Table 2.11: Chittaurgarh District -Tehsilwise Main,Marginal & Non-Workers-
2011 (in %)
Tehsils Main Workers Marginal Workers Total Workers Non workers
Total Male Female Total Male Female Total Male Female Total Male Female
Rashmi 44.18 51.77 36.71 12.49 7.37 17.52 56.7 59.14 54.23 43.33 40.86 45.77
Gangrar 45.2 53.79 36.41 8.68 5.12 12.32 53.9 58.91 48.73 46.12 41.09 51.27
Begun 49.02 54.68 43.22 4.86 3.59 6.16 53.9 58.27 49.38 46.12 46.12 50.62
Rawatbhata 37.01 47.57 25.64 10.03 8.35 11.83 47 55.93 37.47 52.96 44.07 62.53
Chittaurgarh 40.9 52.39 28.94 6.22 4.53 7.98 47.1 56.91 36.92 52.88 43.09 63.08
Kapasan 40.41 50.53 30.2 12.54 8.17 16.94 53 58.71 47.14 47.05 41.29 52.86
Dungla 41.95 51.91 31.81 15.47 8.54 22.53 57.4 60.45 54.34 42.58 39.55 45.66
Bhadesar 46.14 54.96 37.04 10.97 6.03 16.08 57.1 60.98 53.13 42.88 39.02 46.87
Nimbahera 42.22 53.52 30.52 7.54 4.49 10.7 49.8 58.01 41.22 50.24 41.99 58.78
Bari sadri 43.33 51.94 34.61 12.34 7.05 17.7 55.7 58.99 52.3 44.33 41.01 47.7
District Total 42.54 52.27 32.53 9.44 6.04 12.95 52 58.31 45.47 48.02 41.69 54.53
PERCENTAGE OF MAIN WORKERS, MARGINAL WORKERS AND NON-WORKERS BY SEX IN TEHSIL, 2011
In the district, 51.98 percent of the total population comprises of total workers
(Main+ Marginal) and the rest 48.02 percent as non-workers. Of the total workers
(51.98 percent), 42.54 percent are main workers and the rest 9.44 percent are marginal
workers. Sex wise, 58.31 percent of the male population is that of workers whereas for
females this percentage is 45.47. At the tehsil level, Bhadesar tehsil has recorded the
highest percentage of total workers males 60.98 and in Dungla tehsil females 54.34
percent respectively. On the other hand, Rawatbhata tehsil has recorded the lowest
percentage of total workers in males 55.93 and in Chittaurgarh tehsil females being
36.92 percent respectively.
Table 2.12: Chittaurgarh District-Tehsilwise Distribution of Workers by Economic Activity-2011 (in %)
DISTRIBUTION OF WORKERS BY SEX IN FOUR CATEGORIES OF ECONOMIC ACTIVITY IN TEHSIL-2011
Category of workers
TehsilsTotal Male Female Total Male Female Total Male Female Total Male Female
Rashmi 69.22 65.27 73.46 10.4 7.19 7.19 1.75 2.09 1.38 18.63 25.45 11.32
Gangrar 67.02 59.58 59.58 9.6 6.3 13.69 1.93 2.13 1.68 21.44 31.99 8.4
Begun 70.41 66.04 75.7 10.54 8.51 13 1.25 1.49 1.49 17.8 23.96 10.35
Rawatbhata 41.17 37.59 46.91 25.02 18 36.3 1.56 1.61 1.47 32.25 42.79 15.32
Chittaurgarh 43.98 34.26 59.59 9.79 6.36 15.29 2.65 2.78 2.45 43.58 56.6 22.67
Kapasan 58.03 54.39 62.6 17.74 12.45 24.4 2.29 2.56 1.96 21.93 30.61 11.04
Dungla 67.52 66.14 69.09 15.98 10.25 22.47 1.29 1.43 1.14 15.2 22.19 7.3
Bhadesar 64.61 60.39 69.62 13.19 9.39 17.69 1.32 1.53 1.08 20.88 28.7 11.61
Nimbahera 46.86 41.43 54.77 21.01 13.86 31.42 2.06 2.17 1.9 30.08 42.55 11.9
Bari sadri 60.08 59.61 60.61 21.08 12.95 30.37 1.93 2.23 1.6 16.91 25.21 7.43
District Total 56.46 50.76 63.96 15.38 10.5 21.82 1.92 2.12 1.66 26.24 36.61 12.56
Cultivators Agricultural Labourers Household Industry workers Other workers
32
Cultivators are the main working force in the district as they form 56.46 percent
of total workers. It is followed by other workers (26.24 percent), agricultural labourers
(15.38 percent) etc. Females 75,525 outnumber males 47,944 as agricultural labourers.
Much variation in the percentages of male workers (36.61) and female workers (12.56)
classified as other workers is seen in the district.
At tehsil level, the percentage of cultivators to total workers varies from 70.41
in Begun tehsil followed by 69.22 in Rashmi tehsil to 41.17 in Rawatbhata tehsil. For
household industry workers, it varies from 2.65 percent in Chittaurgarh tehsil to 1.25
percent in Begun tehsil .In case of 'other workers' the highest percentage of 43.58 has
been registered by Chittaurgarh tehsil while the lowest of 15.20 percent in Dungla
tehsil.
2.9 Economic Pattern
2.9.1 Agriculture and Irrigation
The economy of Chittaurgarh district is agro based and the majority of the
working population of the district derives the livelihood from agriculture. The districts
temperate climate makes its north-west and central plains in the Gangrar, Rashmi,
Chittaurgarh and Kapasan Tehsils particularly well suited to agriculture condition very
markedly in different parts of the district having different types of soil texture and other
facilities like availability of water, whereas, certain areas in Kapasan, Rashmi, Dungla,
Bhadesar and Nimbahera are plains. There are plains there are unproductive rocky soils
in Bhainsrorgarh and Pratapgarh tehsils and partly hilly areas in Begun, Chittaurgarh,
Bari Sadri, Chhoti Sadri, tehsils. In plots of black soil, found prominently in southern
and eastern parts, Rabi crops are sown and harvested without irrigation in alternate
years.
Irrigation
Chittaurgarh district is one of the most fertile districts of Rajasthan.The ground
water in the district occurs predominately in the bedrock where the water level is
normally about 10m below ground level. The quality of water is generally good. The
major water and irrigation resources are as follows:-
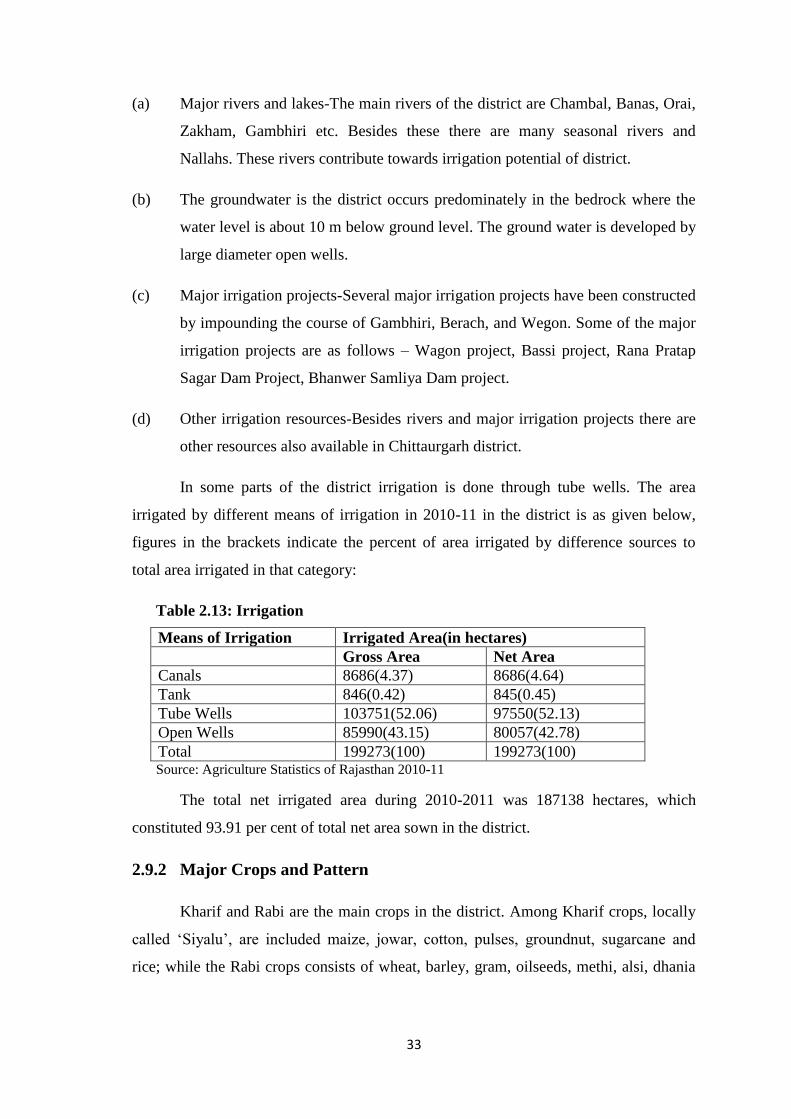
33
(a) Major rivers and lakes-The main rivers of the district are Chambal, Banas, Orai,
Zakham, Gambhiri etc. Besides these there are many seasonal rivers and
Nallahs. These rivers contribute towards irrigation potential of district.
(b) The groundwater is the district occurs predominately in the bedrock where the
water level is about 10 m below ground level. The ground water is developed by
large diameter open wells.
(c) Major irrigation projects-Several major irrigation projects have been constructed
by impounding the course of Gambhiri, Berach, and Wegon. Some of the major
irrigation projects are as follows – Wagon project, Bassi project, Rana Pratap
Sagar Dam Project, Bhanwer Samliya Dam project.
(d) Other irrigation resources-Besides rivers and major irrigation projects there are
other resources also available in Chittaurgarh district.
In some parts of the district irrigation is done through tube wells. The area
irrigated by different means of irrigation in 2010-11 in the district is as given below,
figures in the brackets indicate the percent of area irrigated by difference sources to
total area irrigated in that category:
Table 2.13: Irrigation
Means of Irrigation Irrigated Area(in hectares) Gross Area Net Area Canals 8686(4.37) 8686(4.64) Tank 846(0.42) 845(0.45) Tube Wells 103751(52.06) 97550(52.13) Open Wells 85990(43.15) 80057(42.78) Total 199273(100) 199273(100)
Source: Agriculture Statistics of Rajasthan 2010-11
The total net irrigated area during 2010-2011 was 187138 hectares, which
constituted 93.91 per cent of total net area sown in the district.
2.9.2 Major Crops and Pattern
Kharif and Rabi are the main crops in the district. Among Kharif crops, locally
called „Siyalu‟, are included maize, jowar, cotton, pulses, groundnut, sugarcane and
rice; while the Rabi crops consists of wheat, barley, gram, oilseeds, methi, alsi, dhania
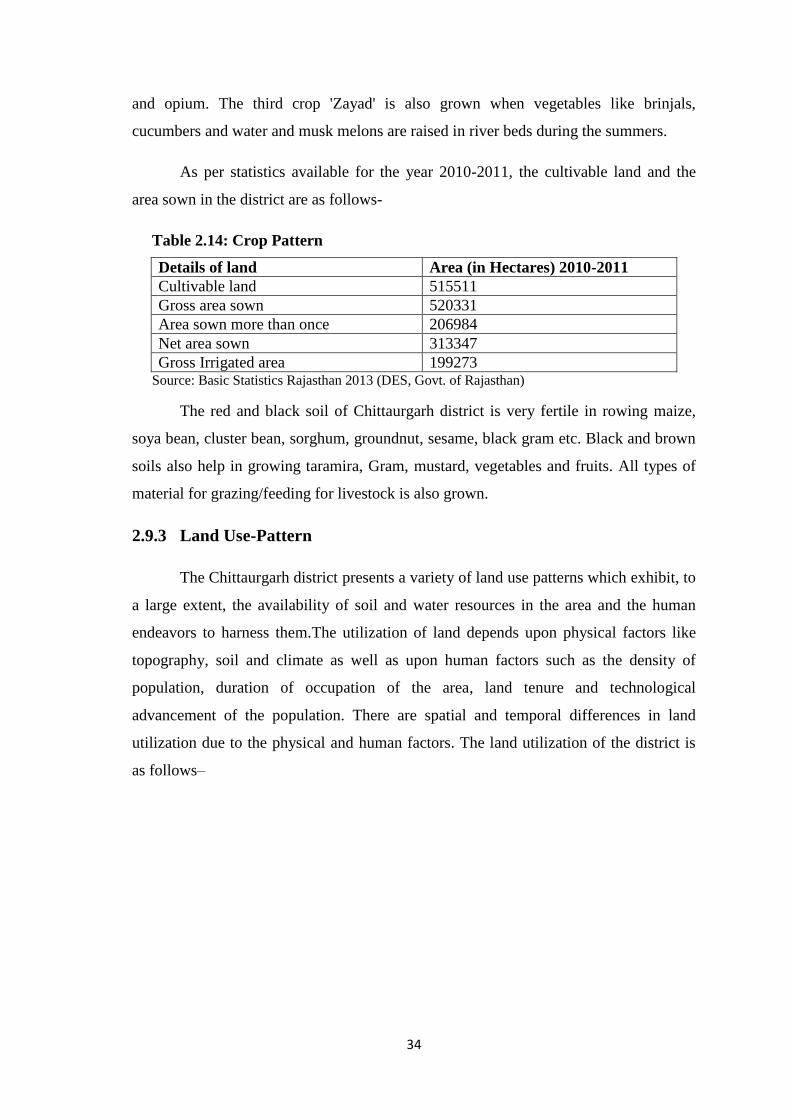
34
and opium. The third crop 'Zayad' is also grown when vegetables like brinjals,
cucumbers and water and musk melons are raised in river beds during the summers.
As per statistics available for the year 2010-2011, the cultivable land and the
area sown in the district are as follows-
Table 2.14: Crop Pattern
Details of land Area (in Hectares) 2010-2011 Cultivable land 515511 Gross area sown 520331 Area sown more than once 206984 Net area sown 313347 Gross Irrigated area 199273
Source: Basic Statistics Rajasthan 2013 (DES, Govt. of Rajasthan)
The red and black soil of Chittaurgarh district is very fertile in rowing maize,
soya bean, cluster bean, sorghum, groundnut, sesame, black gram etc. Black and brown
soils also help in growing taramira, Gram, mustard, vegetables and fruits. All types of
material for grazing/feeding for livestock is also grown.
2.9.3 Land Use-Pattern
The Chittaurgarh district presents a variety of land use patterns which exhibit, to
a large extent, the availability of soil and water resources in the area and the human
endeavors to harness them.The utilization of land depends upon physical factors like
topography, soil and climate as well as upon human factors such as the density of
population, duration of occupation of the area, land tenure and technological
advancement of the population. There are spatial and temporal differences in land
utilization due to the physical and human factors. The land utilization of the district is
as follows–
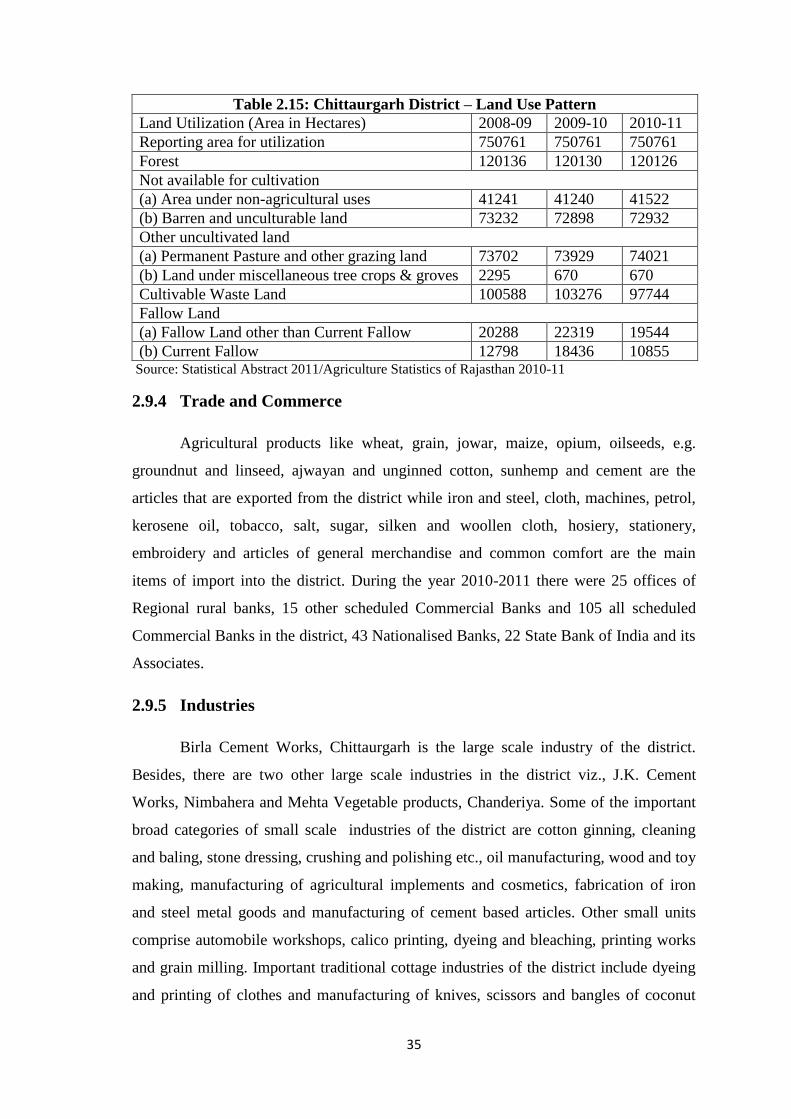
35
Table 2.15: Chittaurgarh District – Land Use Pattern Land Utilization (Area in Hectares) 2008-09 2009-10 2010-11 Reporting area for utilization 750761 750761 750761 Forest 120136 120130 120126 Not available for cultivation (a) Area under non-agricultural uses 41241 41240 41522 (b) Barren and unculturable land 73232 72898 72932 Other uncultivated land (a) Permanent Pasture and other grazing land 73702 73929 74021 (b) Land under miscellaneous tree crops & groves 2295 670 670 Cultivable Waste Land 100588 103276 97744 Fallow Land (a) Fallow Land other than Current Fallow 20288 22319 19544 (b) Current Fallow 12798 18436 10855
Source: Statistical Abstract 2011/Agriculture Statistics of Rajasthan 2010-11
2.9.4 Trade and Commerce
Agricultural products like wheat, grain, jowar, maize, opium, oilseeds, e.g.
groundnut and linseed, ajwayan and unginned cotton, sunhemp and cement are the
articles that are exported from the district while iron and steel, cloth, machines, petrol,
kerosene oil, tobacco, salt, sugar, silken and woollen cloth, hosiery, stationery,
embroidery and articles of general merchandise and common comfort are the main
items of import into the district. During the year 2010-2011 there were 25 offices of
Regional rural banks, 15 other scheduled Commercial Banks and 105 all scheduled
Commercial Banks in the district, 43 Nationalised Banks, 22 State Bank of India and its
Associates.
2.9.5 Industries
Birla Cement Works, Chittaurgarh is the large scale industry of the district.
Besides, there are two other large scale industries in the district viz., J.K. Cement
Works, Nimbahera and Mehta Vegetable products, Chanderiya. Some of the important
broad categories of small scale industries of the district are cotton ginning, cleaning
and baling, stone dressing, crushing and polishing etc., oil manufacturing, wood and toy
making, manufacturing of agricultural implements and cosmetics, fabrication of iron
and steel metal goods and manufacturing of cement based articles. Other small units
comprise automobile workshops, calico printing, dyeing and bleaching, printing works
and grain milling. Important traditional cottage industries of the district include dyeing
and printing of clothes and manufacturing of knives, scissors and bangles of coconut
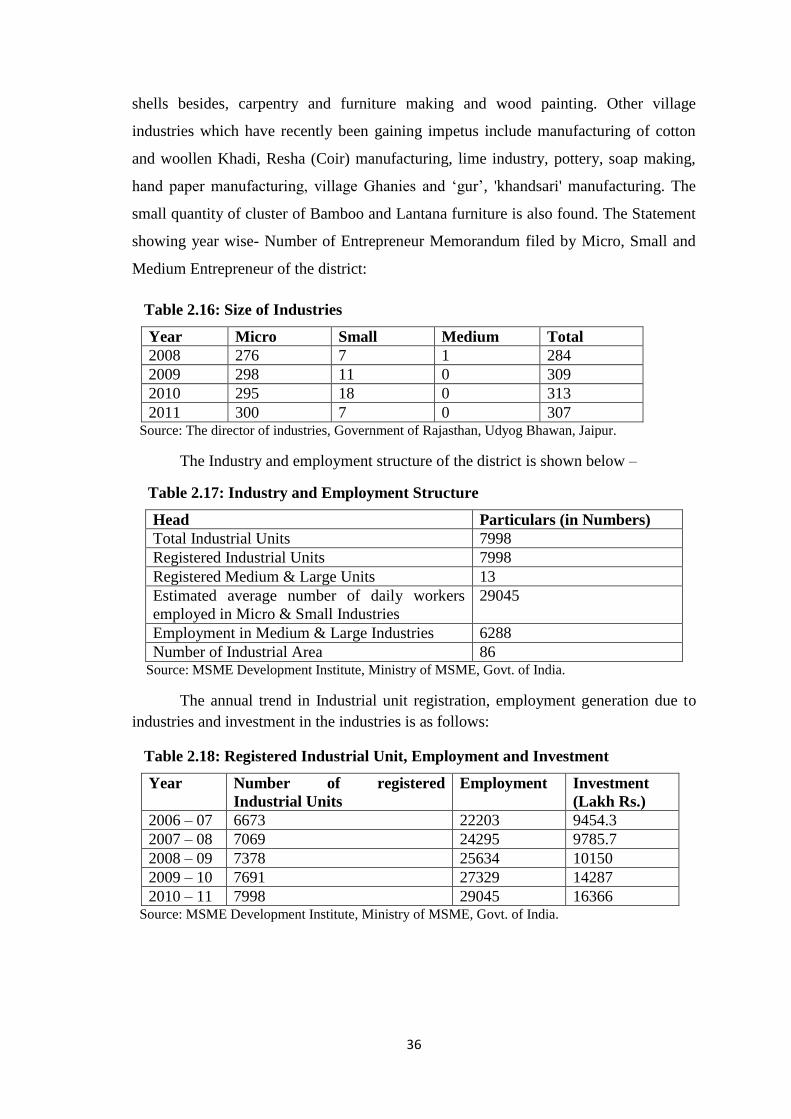
36
shells besides, carpentry and furniture making and wood painting. Other village
industries which have recently been gaining impetus include manufacturing of cotton
and woollen Khadi, Resha (Coir) manufacturing, lime industry, pottery, soap making,
hand paper manufacturing, village Ghanies and „gur‟, 'khandsari' manufacturing. The
small quantity of cluster of Bamboo and Lantana furniture is also found. The Statement
showing year wise- Number of Entrepreneur Memorandum filed by Micro, Small and
Medium Entrepreneur of the district:
Table 2.16: Size of Industries
Year Micro Small Medium Total 2008 276 7 1 284 2009 298 11 0 309 2010 295 18 0 313 2011 300 7 0 307
Source: The director of industries, Government of Rajasthan, Udyog Bhawan, Jaipur.
The Industry and employment structure of the district is shown below –
Table 2.17: Industry and Employment Structure
Head Particulars (in Numbers) Total Industrial Units 7998 Registered Industrial Units 7998 Registered Medium & Large Units 13 Estimated average number of daily workers employed in Micro & Small Industries
29045
Employment in Medium & Large Industries 6288 Number of Industrial Area 86
Source: MSME Development Institute, Ministry of MSME, Govt. of India.
The annual trend in Industrial unit registration, employment generation due to industries and investment in the industries is as follows:
Table 2.18: Registered Industrial Unit, Employment and Investment
Year Number of registered Industrial Units
Employment Investment (Lakh Rs.)
2006 – 07 6673 22203 9454.3 2007 – 08 7069 24295 9785.7 2008 – 09 7378 25634 10150 2009 – 10 7691 27329 14287 2010 – 11 7998 29045 16366
Source: MSME Development Institute, Ministry of MSME, Govt. of India.
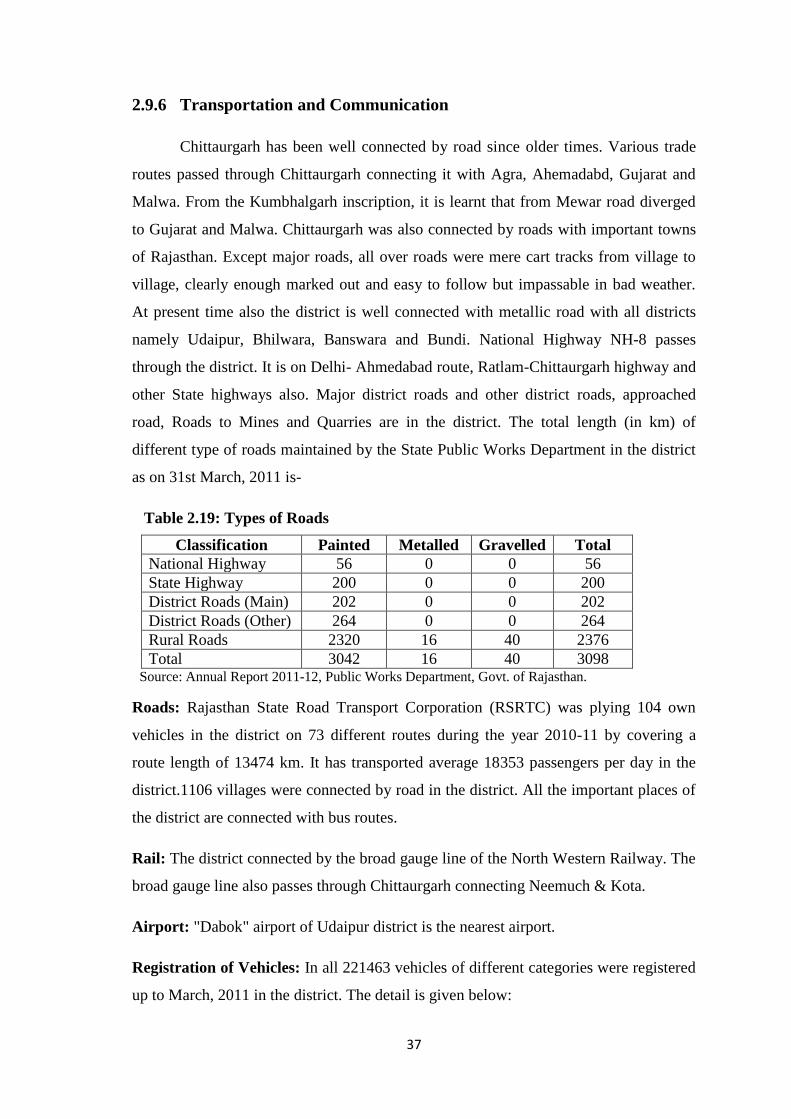
37
2.9.6 Transportation and Communication
Chittaurgarh has been well connected by road since older times. Various trade
routes passed through Chittaurgarh connecting it with Agra, Ahemadabd, Gujarat and
Malwa. From the Kumbhalgarh inscription, it is learnt that from Mewar road diverged
to Gujarat and Malwa. Chittaurgarh was also connected by roads with important towns
of Rajasthan. Except major roads, all over roads were mere cart tracks from village to
village, clearly enough marked out and easy to follow but impassable in bad weather.
At present time also the district is well connected with metallic road with all districts
namely Udaipur, Bhilwara, Banswara and Bundi. National Highway NH-8 passes
through the district. It is on Delhi- Ahmedabad route, Ratlam-Chittaurgarh highway and
other State highways also. Major district roads and other district roads, approached
road, Roads to Mines and Quarries are in the district. The total length (in km) of
different type of roads maintained by the State Public Works Department in the district
as on 31st March, 2011 is-
Table 2.19: Types of Roads
Classification Painted Metalled Gravelled Total National Highway 56 0 0 56 State Highway 200 0 0 200 District Roads (Main) 202 0 0 202 District Roads (Other) 264 0 0 264 Rural Roads 2320 16 40 2376 Total 3042 16 40 3098
Source: Annual Report 2011-12, Public Works Department, Govt. of Rajasthan.
Roads: Rajasthan State Road Transport Corporation (RSRTC) was plying 104 own
vehicles in the district on 73 different routes during the year 2010-11 by covering a
route length of 13474 km. It has transported average 18353 passengers per day in the
district.1106 villages were connected by road in the district. All the important places of
the district are connected with bus routes.
Rail: The district connected by the broad gauge line of the North Western Railway. The
broad gauge line also passes through Chittaurgarh connecting Neemuch & Kota.
Airport: "Dabok" airport of Udaipur district is the nearest airport.
Registration of Vehicles: In all 221463 vehicles of different categories were registered
up to March, 2011 in the district. The detail is given below:
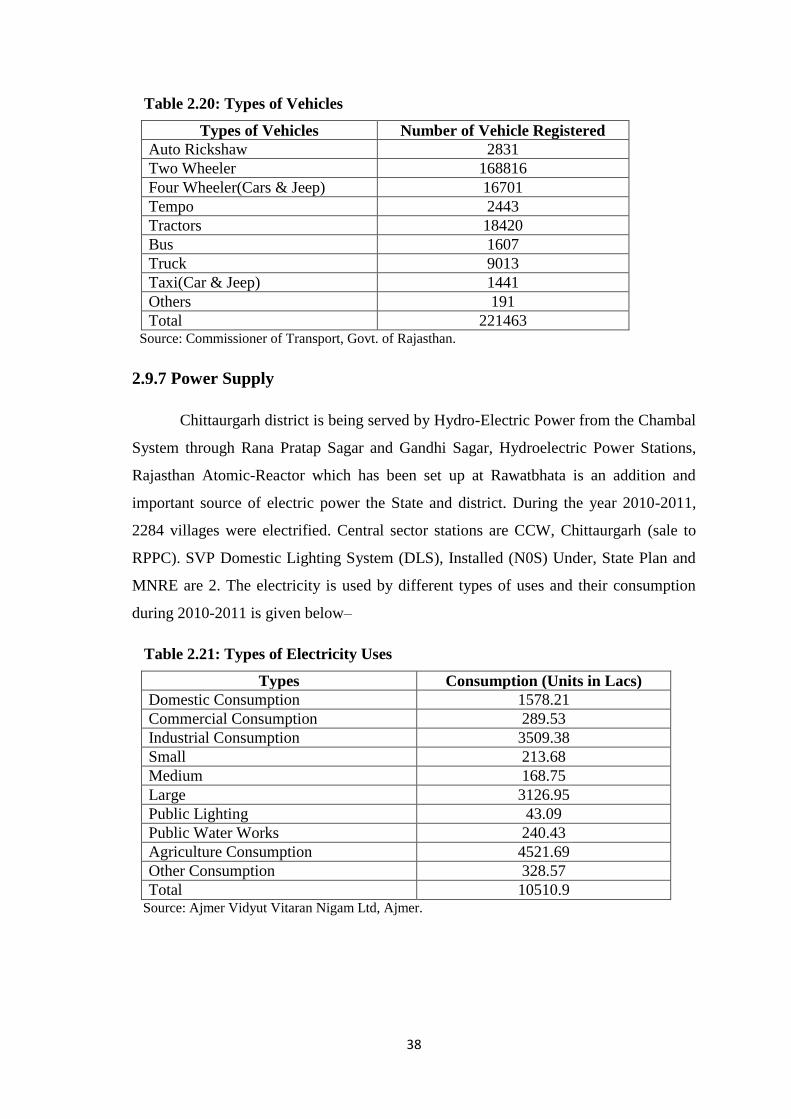
38
Table 2.20: Types of Vehicles
Types of Vehicles Number of Vehicle Registered Auto Rickshaw 2831 Two Wheeler 168816 Four Wheeler(Cars & Jeep) 16701 Tempo 2443 Tractors 18420 Bus 1607 Truck 9013 Taxi(Car & Jeep) 1441 Others 191 Total 221463
Source: Commissioner of Transport, Govt. of Rajasthan.
2.9.7 Power Supply
Chittaurgarh district is being served by Hydro-Electric Power from the Chambal
System through Rana Pratap Sagar and Gandhi Sagar, Hydroelectric Power Stations,
Rajasthan Atomic-Reactor which has been set up at Rawatbhata is an addition and
important source of electric power the State and district. During the year 2010-2011,
2284 villages were electrified. Central sector stations are CCW, Chittaurgarh (sale to
RPPC). SVP Domestic Lighting System (DLS), Installed (N0S) Under, State Plan and
MNRE are 2. The electricity is used by different types of uses and their consumption
during 2010-2011 is given below–
Table 2.21: Types of Electricity Uses
Types Consumption (Units in Lacs) Domestic Consumption 1578.21 Commercial Consumption 289.53 Industrial Consumption 3509.38 Small 213.68 Medium 168.75 Large 3126.95 Public Lighting 43.09 Public Water Works 240.43 Agriculture Consumption 4521.69 Other Consumption 328.57 Total 10510.9
Source: Ajmer Vidyut Vitaran Nigam Ltd, Ajmer.
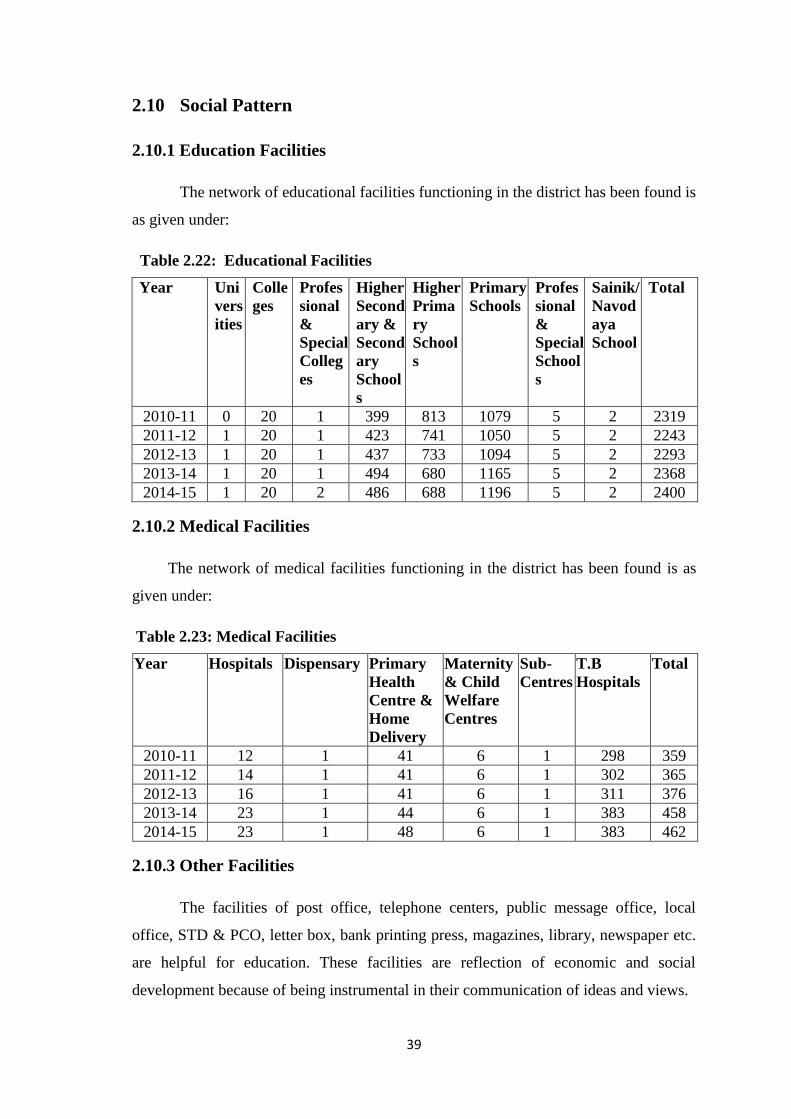
39
2.10 Social Pattern
2.10.1 Education Facilities
The network of educational facilities functioning in the district has been found is
as given under:
Table 2.22: Educational Facilities
Year Universities
Colleges
Professional & Special Colleges
Higher Secondary & Secondary Schools
Higher Primary Schools
Primary Schools
Professional & Special Schools
Sainik/Navodaya School
Total
2010-11 0 20 1 399 813 1079 5 2 2319 2011-12 1 20 1 423 741 1050 5 2 2243 2012-13 1 20 1 437 733 1094 5 2 2293 2013-14 1 20 1 494 680 1165 5 2 2368 2014-15 1 20 2 486 688 1196 5 2 2400
2.10.2 Medical Facilities
The network of medical facilities functioning in the district has been found is as
given under:
Table 2.23: Medical Facilities
Year Hospitals Dispensary Primary Health Centre & Home Delivery
Maternity & Child Welfare Centres
Sub-Centres
T.B Hospitals
Total
2010-11 12 1 41 6 1 298 359 2011-12 14 1 41 6 1 302 365 2012-13 16 1 41 6 1 311 376 2013-14 23 1 44 6 1 383 458 2014-15 23 1 48 6 1 383 462
2.10.3 Other Facilities
The facilities of post office, telephone centers, public message office, local
office, STD & PCO, letter box, bank printing press, magazines, library, newspaper etc.
are helpful for education. These facilities are reflection of economic and social
development because of being instrumental in their communication of ideas and views.

40
Table 2.24: Distribution of Village According to Availability of Different Amenities, 2011
DISTRIBUTION OF VILLAGES ACCORDING TO AVAILABILITY OF DIFFERENT AMINITIES,2011
Type of amenity available
Name of
Panchayat
Samities
Number of
inhabited
villages
Total
population
of inhabited
villages Education Medical Drinking water Post office Telephone
Transport
communications Banks
Agricultural
credit
socities
Approach by
pucca road Power supply
Rashmi 87 88670 51 35 87 28 86 42 7 15 21 86
% 58.62 40.23 100 32.18 98.85 48.28 8.05 17.24 24.14 98.85
Gangrar 131 103933 70 32 131 25 131 34 5 11 19 131
% 53.44 24.43 100 19.08 100 25.95 3.82 8.4 14.5 100
Begun 226 117390 86 50 226 23 224 65 7 12 18 220
% 38.05 22.12 100 10.18 99.12 28.76 3.1 5.31 7.96 97.35
Bhainsrorgarh 155 99674 74 37 152 22 154 46 4 10 15 147
% 47.74 23.87 98.06 14.19 99.35 29.68 2.58 6.45 9.68 94.84
Chittaurgarh 219 184005 120 61 218 45 216 68 11 24 33 219
% 54.79 27.85 99.54 20.55 98.63 31.05 5.02 10.96 15.07 100
Bhopalsagar 83 83457 51 27 82 82 82 41 5 13 15 83
% 61.45 32.53 98.8 19.28 98.8 49.4 6.02 15.66 18.07 100
Kapasan 108 95014 67 24 108 22 108 49 5 11 18 108
% 62.04 22.22 100 20.37 100 45.37 4.63 10.19 16.67 100
Dungla 103 104607 70 35 103 28 103 32 8 19 23 103
% 67.96 33.98 100 27.18 100 31.07 7.77 18.45 22.33 100
Bhadesar 163 123930 77 34 162 23 163 55 7 16 19 162
% 47.24 20.86 99.39 14.11 100 33.74 4.29 9.82 11.66 99.39
Nimbahera 158 157841 98 51 158 39 158 47 11 26 35 158
% 62.03 32.28 100 24.68 100 29.75 6.96 16.46 22.15 100
Bari sadri 148 100553 64 29 148 20 147 40 6 12 14 147
% 43.24 19.59 100 13.51 99.32 27.03 4.05 8.11 9.46 99.32
Total 1581 1259074 828 415 1575 291 1572 519 76 169 230 1564
52.37 26.25 99.62 18.41 99.43 32.83 4.81 10.69 14.55 98.92
Of the total 1581 inhabited villages 828(52.37 %) have educational facilities. In
case of medical amenities only 26.25 percent of inhabited villages have such amenities.
A significant number i.e. 1575 (99.62 %) villages have drinking water amenities. In the
communication field only 18.41 percent of villages have post office facilities while
99.43 percent have telephone facilities. In the banking field the picture is gloomy as
only 76 (4.81 %) villages have banks. Only 14.55 percent i.e. (230) are linked with
pucca approach roads whereas 98.92 percent have power supply Dungla has the higher
percentage i.e. 67.96 of villages having educational facilities. For medical amenities, it
is Rashmi, which have highest percentage of 40.23. Little variation has seen in
telephone facilities. Gangrar, Kapasan, Dungla, Bhadesar and Nimbahera have the
highest percentage of villages i.e. 100 percent, which have, telephone facilities whereas
Chittaurgarh has the minimum percentage of 98.63 for such facility. Gangrar,
Chittaurgarh, Bhopalsagar, Kapasan, Nimbahera and Dungla have the 100 percent
villages having power supply.
2.10.4 Fairs & Festivals
A number of fairs are held in the district. The principal ones are given below:
41
Mahadeoji-ka-Mela: This fair is held at Matri Kundia in tehsil Rashmi on Vaisakha
Purnima (April- May) annually. Nearly 20,000 persons congregate in the fair to have a
dip in the holy water of river Banas.
Savariyaji-ka-Mela: This fair is held at Mandpiya village in tehsil Bhadesar on
Bhadrapad shukla 11 annually. Approximately 1.25 Lac persons congregate in the fair.
It has an idol of Lord Krishna in black stone. The place is served by a regular bus
service.
Kalkaji-Ka-Mela: It is a religious fair and is held on Chittaurgarh fort on Vaisakha
Sudi 8 (April- May) when about 10,000 persons assemble and have a darshan of
goddess Kalka Mata.
Gotameshwar Fair: This fair is organised at Achnera in tehsil of the same name on
Vaisakha Sudi 15 (April–May) annually. About 10,000 persons participate in this fair.
Urs of Diwanji Shah: The Urs of Diwanji Shah is celebrated at Kapasan annually. The
month of its celebration varies according to the Muslim calendar. There is a tomb of
Diwan Shah. The Urs day starts with mass prayer and the holy Quran is recited. Nearly
2,000 Muslims congregate on this occasion.
Among the other important fairs held in the district, mention may be made of
Bhanwar Mata-ka-Mela and Mahadeoji-ka-Mela at Chhoti Sadri, Sheetla Ashtami at
Chittaurgarh, and Kotri, Shivaratri at Matasara, Rupaji Karmalji ka Mela at Begun etc.
As in other districts of the State, the principal Hindu festivals are Holi, Diwali,
Dusshera, Gangaur, Sheetla Ashtami, Raksha Bandhan, Basant Panchami, and Makar
Sankranti. The chief Muslim festivals are Muharram, Barawafat, Id-Ul-Fitr, Id-Ul-
Azha, Shab-e-Barat and Ramzan.
42
CHAPTER - III
PATTERN OF LITERACY OF THE AREA
3.1 Introduction
Prior to the advent of the skills of reading and writing, society could be
classified as being in the pre-literate cultural stage. The change from pre-literate to
literate society is said to have Begun somewhere during the fourth millennium B.C.
through a gradual transition from pictography to the use of an alphabet. After the advent
of the dual skills of reading and writing, the relevance of literacy to the cultural
advancement enhanced significantly.
When we see history of education in India, we find that education flourished
during the Vedic period. It was imparted to all without any destinations of gender,
caste, class or color. During Post- Vedic period only the upper castes i.e. Brahmins,
Kshatriyas had access to it in view of their occupational necessity. Women education
was neglected, women education was lowest due to restrictions on their movement, and
only rich family‟s women could get education. However, some of the rulers during
Mughal period promoted educational institutions. The characteristics stagnation of late
Indian feudalism was responsible for lower levels of literacy in 12th 18th Centuries.
Within the invasion & colonizers from the 18th century right up to the beginning of
20th Century, the number of literate persons declined. The war of late 18th Century and
neglect of Sanskrit and descriptive learning by the British was largely responsible for
this time, during this time the European education system was introduced. Education
was only accessible to a limited number of wealthy Indians. After that charters like of
1813, 1833, and 1835 were passed to improve literacy and education. Lord MC Cauley
played an important role in this regard. Different commission and committees like
Hunter Commission, Sadler Commission etc. were appointed to assess the position of
education in the country.
Some social reformers like Gandhi, Tagore, Ambedkar, Vidyasagar etc.
emphasized the cause of need for education. Several organizations launched social
reform movements of which literacy and education became an integral part like:
Brahma Samaj (1828), Prathana Samaj (1867), Arya Samaj (1875), Radha Krishan
43
Mission (1897). In fact, Literacy was not dealt with in the abstract and was therefore,
not meaningless. It was a part of struggle for India's Independence that India witnessed
meaningful literacy related activities.
The Period 1920-40 was marked by intense literacy and political awareness
related programs implemented through summer schools, literacy classes and campaigns.
In 1937-38, Gandhi elaborated the concept of basic education which included the
training of handicraft, self-reliance and flexible curriculum.
The 1940s and 1950s was a period of consolidation and institutionalization of
literacy efforts in India. It was a period when small scale campaigns were started for its
spread. In 1939, Indian Adult Education Association was created to launch several
literacy programs. Different big commissions like UGC (1948), Secondary Education
Commission (1952-53), and Kothari Commission (1964-66) were appointed for
improvement in like Sarva Shiksha Abhiyan. The National Adult Education Program
(1978) and National Literacy Mission (1988) were started to improve literacy rates.
Open schools was started in 1979 to provide education to those people who are unable
to attend regular schools.
When we examine the progress of literacy in 20th Century, it was slow till 1931.
In 1901, the literacy rate was 5.35 percent that became 9.50 percent in 1931. The post
1931 period experienced a comparatively fast growth of literacy mainly in association
with quickening pace of the urbanization process. The Independence of the Country in
1947 was, also instrumental in exposing the people to external influences that, among
other things, generated a general awareness conductive to spread of literacy.
At the time of Independence, one in every seven persons in India was literate.
The regular increase in literacy rate was associated with the opening of a very large
number of new schools under various five year plans. The percentage of literate person
increased from 18.33 percent in 1951 to 61.71 percent in 2011. Correspondingly, the
male and female literacy rates have also increased. In 1901, the male literacy was 9.88
percent that became 76.61 percent in 2011. Female literacy has also progressed
significantly from 0.6 percent in 1901 to 46.53 percent in 2011. It is also notable that
despite regular rise in the literacy rate, the number of illiterates had also been shooting
up from 223 million in 1901 to 249 million in 1931 and 381 million in 1971 as a result
44
of accelerating rate of population growth. It is only during the decade 1991-2001 the
absolute number of illiterates has decreased by 32 million for the first time.
3.2 Literacy Background of the Area
During the last 60 years there has been an appreciable continuous increase in the
level of literacy as from 7.07 percent in 1951; it has risen to 61.71 percent in 2011
Census. The rate of increase has been more important in the case of males, which
increased from 12.6 percent in 1951 to 76.61 percent in 2011. In case of females the
literacy has increased from 1.87 percent in 1951 to 46.53 percent in 2011 Census.
Analyzing the literacy at tehsil level for rural and urban areas separately, the
level of rural literacy as from 17.28 percent in 1981, it has risen to 56.84 percent in
2011. Increase of females the literacy has increased from 5.43 in 1951 to 40.24 percent
in 2011. The rate of increase has been more significant in case of males in 1981; it
increased from 28.65 percent to 73.26 percent in 2011. The level of urban literacy as
from 51.99 percent in 1981, it has risen to 82.75 percent in 2011. In case of males the
literacy rate is 66.02 percent it increased to 90.81 percent in 2011. In case of female the
literacy rate is 36.22 percent in 1981, it increased to 74.27 percent in 2011. Analyzing
the literacy at tehsil level for Scheduled Tribe and Scheduled Caste areas separately, the
level of Scheduled Tribe literacy as from 4.0 percent in 1981, it has risen to 39.19
percent in 2011. The rate of increase has been more significant in case of males in
1981; it increased from 6.91 percent to 52.16 percent in 2011. In case females the
literacy has increased from 0.35 in 1981 to 24.68 percent in 2011. The level of
Scheduled Caste as from 12.47 percent in 1981, it has risen to 55.83 percent in 2011. In
case of males the literacy rate is 22.55 percent it increased to 71.92 percent in 2011. In
case of females the literacy rate is 1.96 percent in 1981; it increased to 39.46 percent in
2011. When we examine the progress of literacy in 20th Century, it was slow till 1951.
The post 1951 period association with quickening pace of the urbanization process,
opening of a very large number of new schools, social awareness about especially girls
education development, new technology in schools and society, increasing educational
facilities along with availability of female teachers in abundance particularly in rural
areas, increasing value of female education for matrimony, increasing degree of socio-
economic awareness, waning social taboos and prejudices against female education,
Scheduled Tribe and Caste.
45
3.3 Literate Population and Literacy Rate
During the early years of 1946-58, one of the main objectives of UNESCO was
fundamental education. The main aim of the fundamental education is that every person
has a right to three 'R' is i.e., reading, writing and arithmetic. Literacy is one of the
Importance parameter of education development of a nation. United Nations
Organization and UNESCO place great emphasis on removal of illiteracy. Literacy
means, formal school education and a person is functionally literate if he or she is able
to engage in all those activities, in which literacy is required for effective functioning of
his or her group and community for enabling him or her to continue use reading, writing
and calculation.
The concept of literacy, that varies from country to country, generally refers to
the minimum level of literacy skills. The minimum level of skills varies from ability to
communicate orally, to make a check of a variety of difficult arithmetical computations.
However, schooling has often been considered as a basis of distinguish between a
literate and illiterate.
The population commission of United Nations considers the ability to both read,
and write a simple message with understanding in any language a sufficient basic for
classifying a person as literate. The Indian Census has adopted this definition. At the
1991 Census, it was also decided that all children in the age group 0-6 years will be
treated as illiterate by definition and the population aged seven years and above only is
to be classified as literate or illiterate.
Literacy is being re-defined by the presence of technology in our schools and in
our society. No longer does literacy mean only the ability to read with sense and write
with clarity. Today's students used technological advancements across the curriculum,
from mathematics to language arts, from music to exercise. Since the introduction of
personal computers in 1980, technology has been part of the educational system. Most
recently, with the advent of the internet and advanced software, technology has become
a part of the daily lives, now we are shifting into a new age.
Furthermore, in the past, literacy means being able to read, write and
communicate. Mastering the language was the center of literacy. Today, being
considered literate does not mean being able to master the language of technology, but
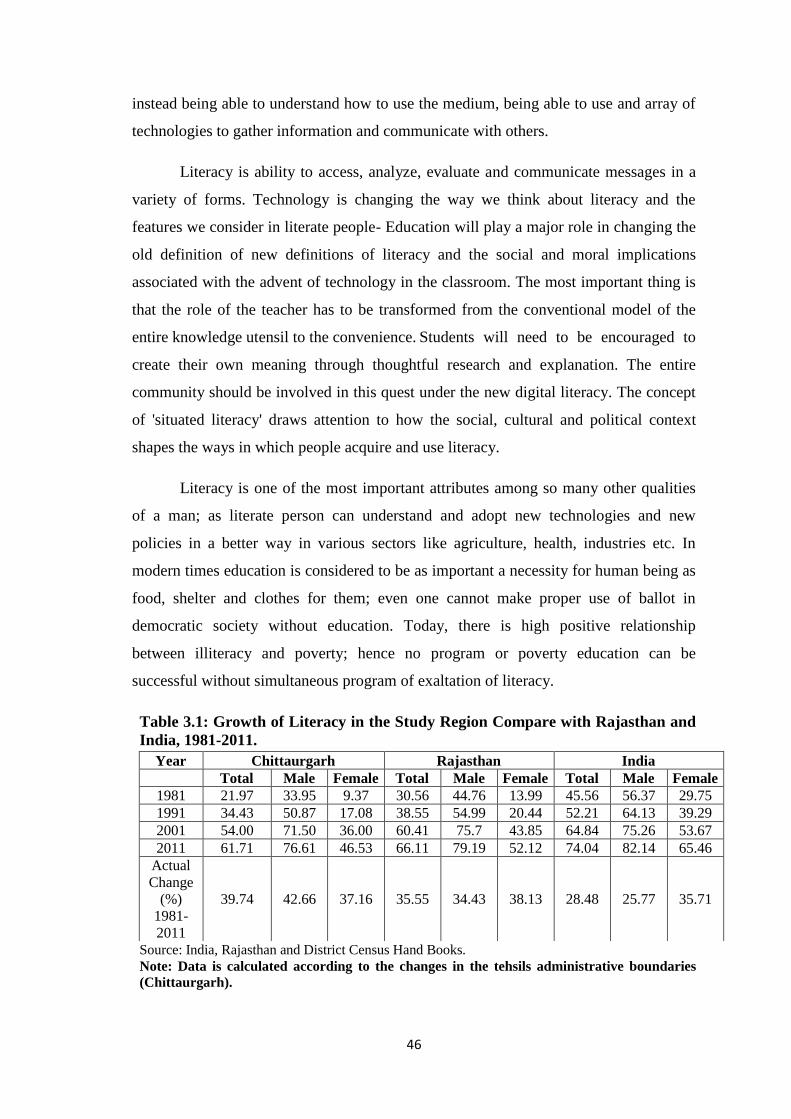
46
instead being able to understand how to use the medium, being able to use and array of
technologies to gather information and communicate with others.
Literacy is ability to access, analyze, evaluate and communicate messages in a
variety of forms. Technology is changing the way we think about literacy and the
features we consider in literate people- Education will play a major role in changing the
old definition of new definitions of literacy and the social and moral implications
associated with the advent of technology in the classroom. The most important thing is
that the role of the teacher has to be transformed from the conventional model of the
entire knowledge utensil to the convenience. Students will need to be encouraged to
create their own meaning through thoughtful research and explanation. The entire
community should be involved in this quest under the new digital literacy. The concept
of 'situated literacy' draws attention to how the social, cultural and political context
shapes the ways in which people acquire and use literacy.
Literacy is one of the most important attributes among so many other qualities
of a man; as literate person can understand and adopt new technologies and new
policies in a better way in various sectors like agriculture, health, industries etc. In
modern times education is considered to be as important a necessity for human being as
food, shelter and clothes for them; even one cannot make proper use of ballot in
democratic society without education. Today, there is high positive relationship
between illiteracy and poverty; hence no program or poverty education can be
successful without simultaneous program of exaltation of literacy.
Table 3.1: Growth of Literacy in the Study Region Compare with Rajasthan and India, 1981-2011.
Source: India, Rajasthan and District Census Hand Books. Note: Data is calculated according to the changes in the tehsils administrative boundaries (Chittaurgarh).
Year Chittaurgarh Rajasthan India
Total Male Female Total Male Female Total Male Female 1981 21.97 33.95 9.37 30.56 44.76 13.99 45.56 56.37 29.75 1991 34.43 50.87 17.08 38.55 54.99 20.44 52.21 64.13 39.29 2001 54.00 71.50 36.00 60.41 75.7 43.85 64.84 75.26 53.67 2011 61.71 76.61 46.53 66.11 79.19 52.12 74.04 82.14 65.46
Actual Change
(%) 1981-2011
39.74 42.66 37.16 35.55 34.43 38.13 28.48 25.77 35.71
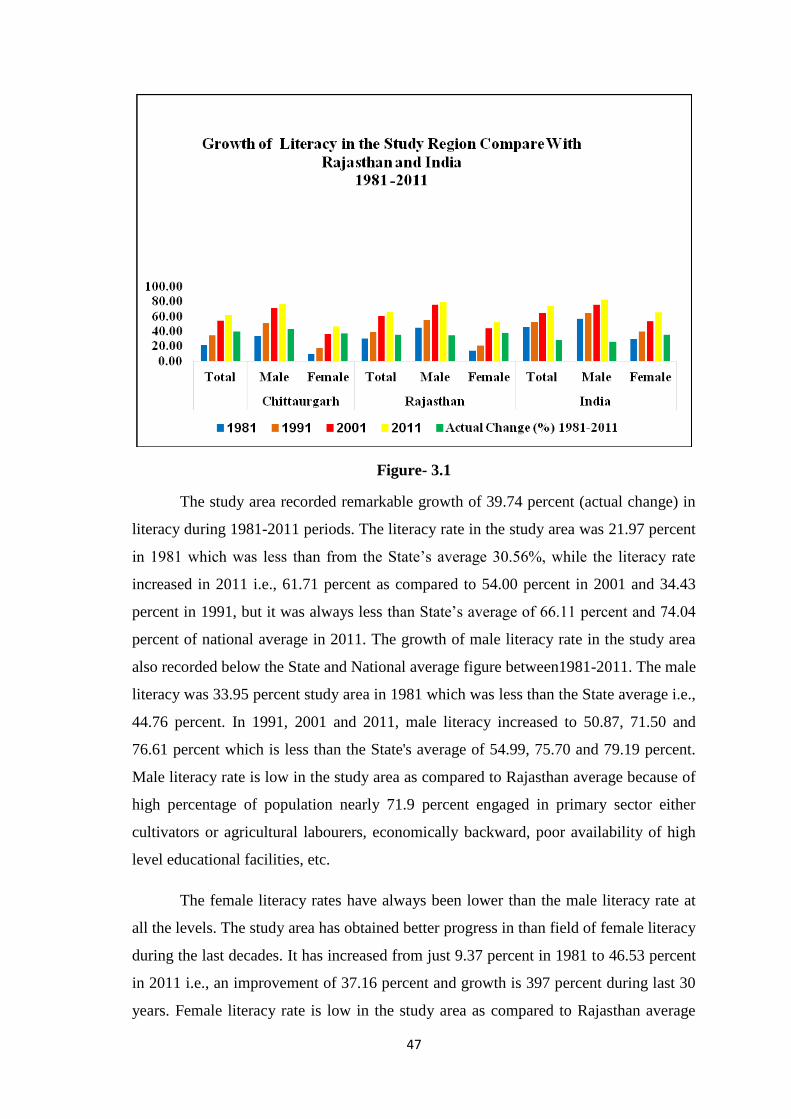
47
Figure- 3.1
The study area recorded remarkable growth of 39.74 percent (actual change) in
literacy during 1981-2011 periods. The literacy rate in the study area was 21.97 percent
in 1981 which was less than from the State‟s average 30.56%, while the literacy rate
increased in 2011 i.e., 61.71 percent as compared to 54.00 percent in 2001 and 34.43
percent in 1991, but it was always less than State‟s average of 66.11 percent and 74.04
percent of national average in 2011. The growth of male literacy rate in the study area
also recorded below the State and National average figure between1981-2011. The male
literacy was 33.95 percent study area in 1981 which was less than the State average i.e.,
44.76 percent. In 1991, 2001 and 2011, male literacy increased to 50.87, 71.50 and
76.61 percent which is less than the State's average of 54.99, 75.70 and 79.19 percent.
Male literacy rate is low in the study area as compared to Rajasthan average because of
high percentage of population nearly 71.9 percent engaged in primary sector either
cultivators or agricultural labourers, economically backward, poor availability of high
level educational facilities, etc.
The female literacy rates have always been lower than the male literacy rate at
all the levels. The study area has obtained better progress in than field of female literacy
during the last decades. It has increased from just 9.37 percent in 1981 to 46.53 percent
in 2011 i.e., an improvement of 37.16 percent and growth is 397 percent during last 30
years. Female literacy rate is low in the study area as compared to Rajasthan average
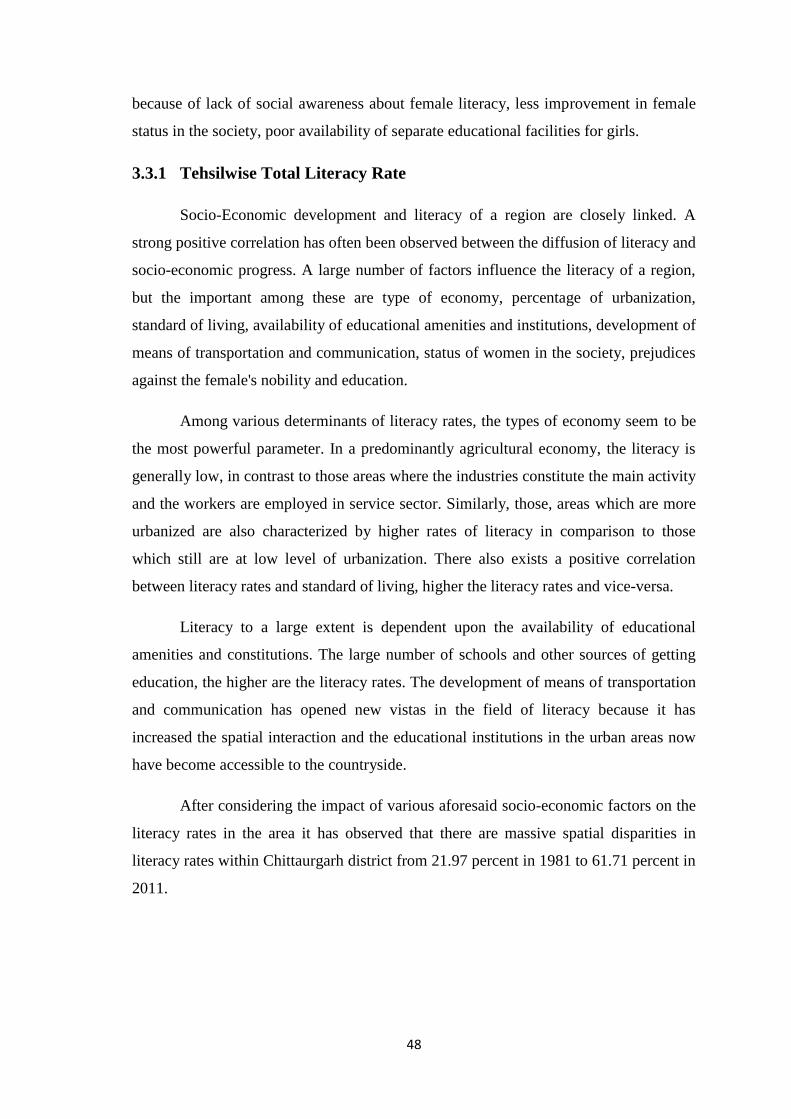
48
because of lack of social awareness about female literacy, less improvement in female
status in the society, poor availability of separate educational facilities for girls.
3.3.1 Tehsilwise Total Literacy Rate
Socio-Economic development and literacy of a region are closely linked. A
strong positive correlation has often been observed between the diffusion of literacy and
socio-economic progress. A large number of factors influence the literacy of a region,
but the important among these are type of economy, percentage of urbanization,
standard of living, availability of educational amenities and institutions, development of
means of transportation and communication, status of women in the society, prejudices
against the female's nobility and education.
Among various determinants of literacy rates, the types of economy seem to be
the most powerful parameter. In a predominantly agricultural economy, the literacy is
generally low, in contrast to those areas where the industries constitute the main activity
and the workers are employed in service sector. Similarly, those, areas which are more
urbanized are also characterized by higher rates of literacy in comparison to those
which still are at low level of urbanization. There also exists a positive correlation
between literacy rates and standard of living, higher the literacy rates and vice-versa.
Literacy to a large extent is dependent upon the availability of educational
amenities and constitutions. The large number of schools and other sources of getting
education, the higher are the literacy rates. The development of means of transportation
and communication has opened new vistas in the field of literacy because it has
increased the spatial interaction and the educational institutions in the urban areas now
have become accessible to the countryside.
After considering the impact of various aforesaid socio-economic factors on the
literacy rates in the area it has observed that there are massive spatial disparities in
literacy rates within Chittaurgarh district from 21.97 percent in 1981 to 61.71 percent in
2011.
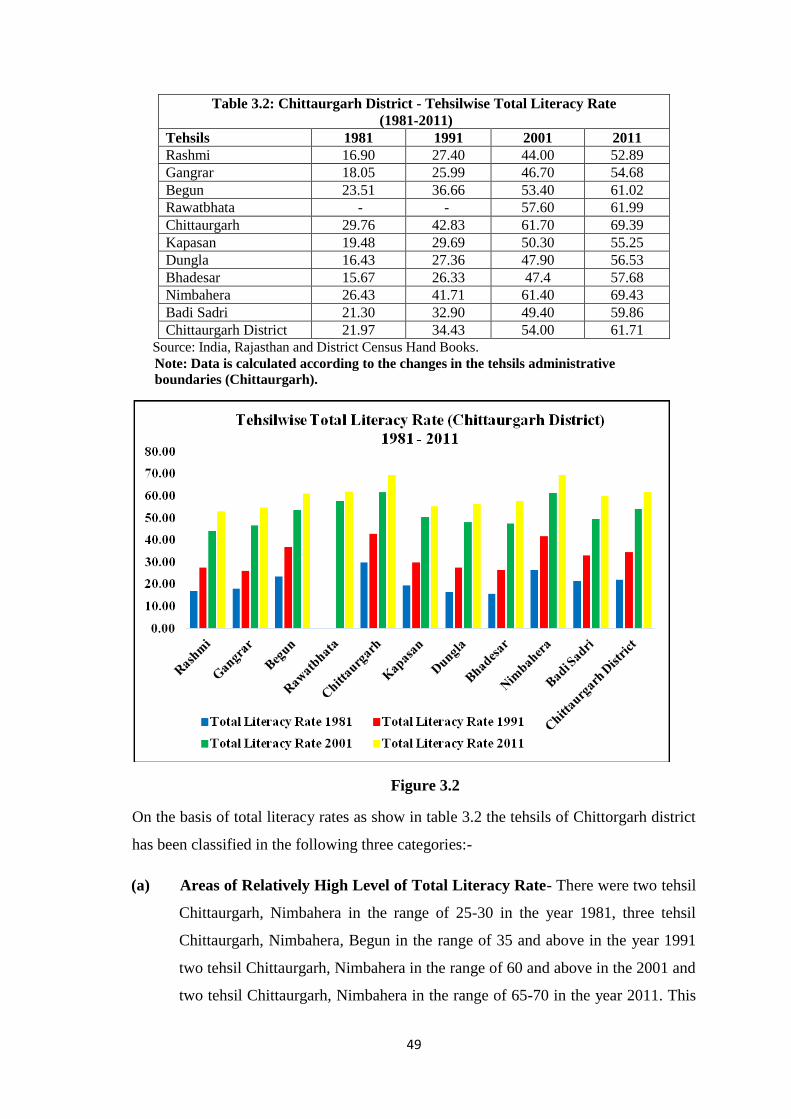
49
Table 3.2: Chittaurgarh District - Tehsilwise Total Literacy Rate (1981-2011)
Tehsils 1981 1991 2001 2011 Rashmi 16.90 27.40 44.00 52.89 Gangrar 18.05 25.99 46.70 54.68 Begun 23.51 36.66 53.40 61.02 Rawatbhata - - 57.60 61.99 Chittaurgarh 29.76 42.83 61.70 69.39 Kapasan 19.48 29.69 50.30 55.25 Dungla 16.43 27.36 47.90 56.53 Bhadesar 15.67 26.33 47.4 57.68 Nimbahera 26.43 41.71 61.40 69.43 Badi Sadri 21.30 32.90 49.40 59.86 Chittaurgarh District 21.97 34.43 54.00 61.71
Source: India, Rajasthan and District Census Hand Books. Note: Data is calculated according to the changes in the tehsils administrative boundaries (Chittaurgarh).
Figure 3.2
On the basis of total literacy rates as show in table 3.2 the tehsils of Chittorgarh district
has been classified in the following three categories:-
(a) Areas of Relatively High Level of Total Literacy Rate- There were two tehsil
Chittaurgarh, Nimbahera in the range of 25-30 in the year 1981, three tehsil
Chittaurgarh, Nimbahera, Begun in the range of 35 and above in the year 1991
two tehsil Chittaurgarh, Nimbahera in the range of 60 and above in the 2001 and
two tehsil Chittaurgarh, Nimbahera in the range of 65-70 in the year 2011. This
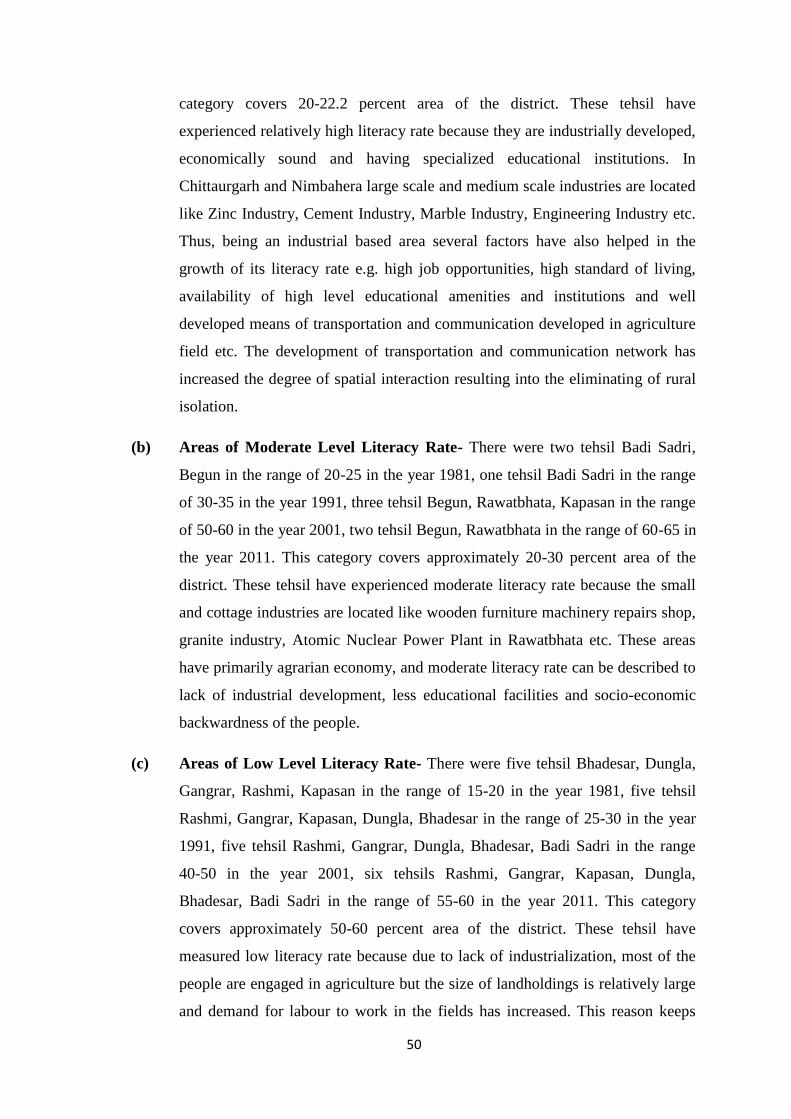
50
category covers 20-22.2 percent area of the district. These tehsil have
experienced relatively high literacy rate because they are industrially developed,
economically sound and having specialized educational institutions. In
Chittaurgarh and Nimbahera large scale and medium scale industries are located
like Zinc Industry, Cement Industry, Marble Industry, Engineering Industry etc.
Thus, being an industrial based area several factors have also helped in the
growth of its literacy rate e.g. high job opportunities, high standard of living,
availability of high level educational amenities and institutions and well
developed means of transportation and communication developed in agriculture
field etc. The development of transportation and communication network has
increased the degree of spatial interaction resulting into the eliminating of rural
isolation.
(b) Areas of Moderate Level Literacy Rate- There were two tehsil Badi Sadri,
Begun in the range of 20-25 in the year 1981, one tehsil Badi Sadri in the range
of 30-35 in the year 1991, three tehsil Begun, Rawatbhata, Kapasan in the range
of 50-60 in the year 2001, two tehsil Begun, Rawatbhata in the range of 60-65 in
the year 2011. This category covers approximately 20-30 percent area of the
district. These tehsil have experienced moderate literacy rate because the small
and cottage industries are located like wooden furniture machinery repairs shop,
granite industry, Atomic Nuclear Power Plant in Rawatbhata etc. These areas
have primarily agrarian economy, and moderate literacy rate can be described to
lack of industrial development, less educational facilities and socio-economic
backwardness of the people.
(c) Areas of Low Level Literacy Rate- There were five tehsil Bhadesar, Dungla,
Gangrar, Rashmi, Kapasan in the range of 15-20 in the year 1981, five tehsil
Rashmi, Gangrar, Kapasan, Dungla, Bhadesar in the range of 25-30 in the year
1991, five tehsil Rashmi, Gangrar, Dungla, Bhadesar, Badi Sadri in the range
40-50 in the year 2001, six tehsils Rashmi, Gangrar, Kapasan, Dungla,
Bhadesar, Badi Sadri in the range of 55-60 in the year 2011. This category
covers approximately 50-60 percent area of the district. These tehsil have
measured low literacy rate because due to lack of industrialization, most of the
people are engaged in agriculture but the size of landholdings is relatively large
and demand for labour to work in the fields has increased. This reason keeps
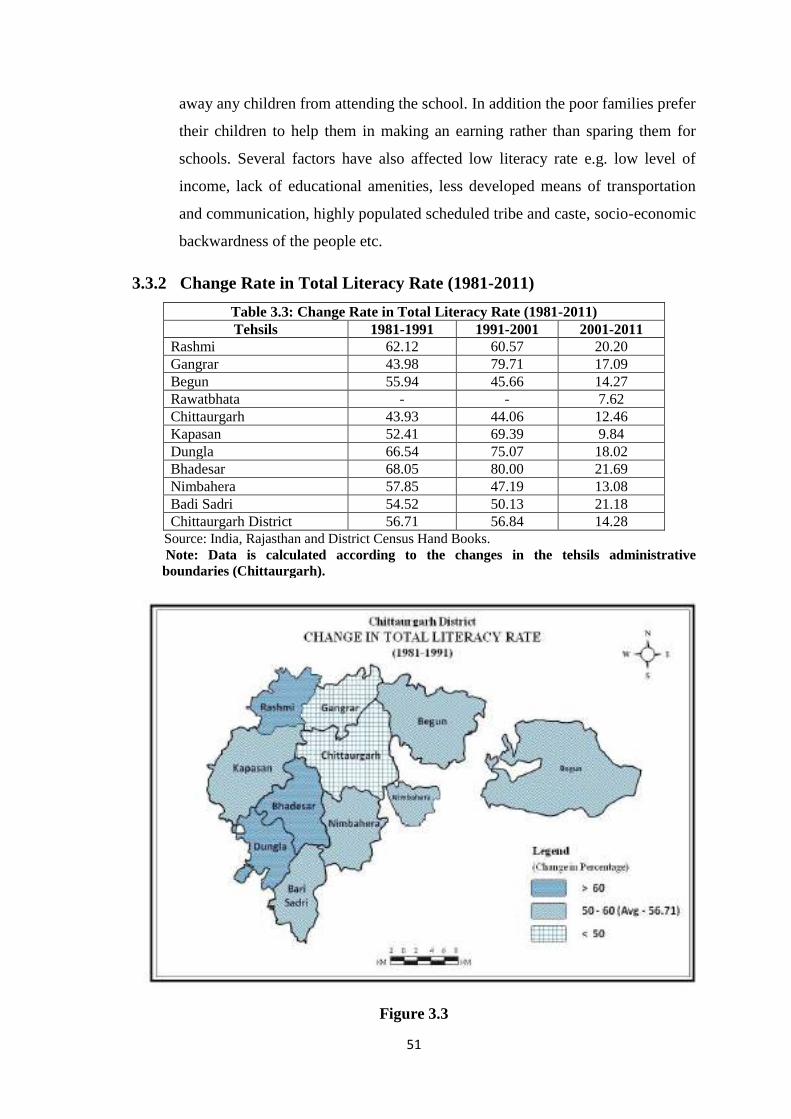
51
away any children from attending the school. In addition the poor families prefer
their children to help them in making an earning rather than sparing them for
schools. Several factors have also affected low literacy rate e.g. low level of
income, lack of educational amenities, less developed means of transportation
and communication, highly populated scheduled tribe and caste, socio-economic
backwardness of the people etc.
3.3.2 Change Rate in Total Literacy Rate (1981-2011)
Table 3.3: Change Rate in Total Literacy Rate (1981-2011) Tehsils 1981-1991 1991-2001 2001-2011
Rashmi 62.12 60.57 20.20 Gangrar 43.98 79.71 17.09 Begun 55.94 45.66 14.27 Rawatbhata - - 7.62 Chittaurgarh 43.93 44.06 12.46 Kapasan 52.41 69.39 9.84 Dungla 66.54 75.07 18.02 Bhadesar 68.05 80.00 21.69 Nimbahera 57.85 47.19 13.08 Badi Sadri 54.52 50.13 21.18 Chittaurgarh District 56.71 56.84 14.28
Source: India, Rajasthan and District Census Hand Books. Note: Data is calculated according to the changes in the tehsils administrative boundaries (Chittaurgarh).
Figure 3.3
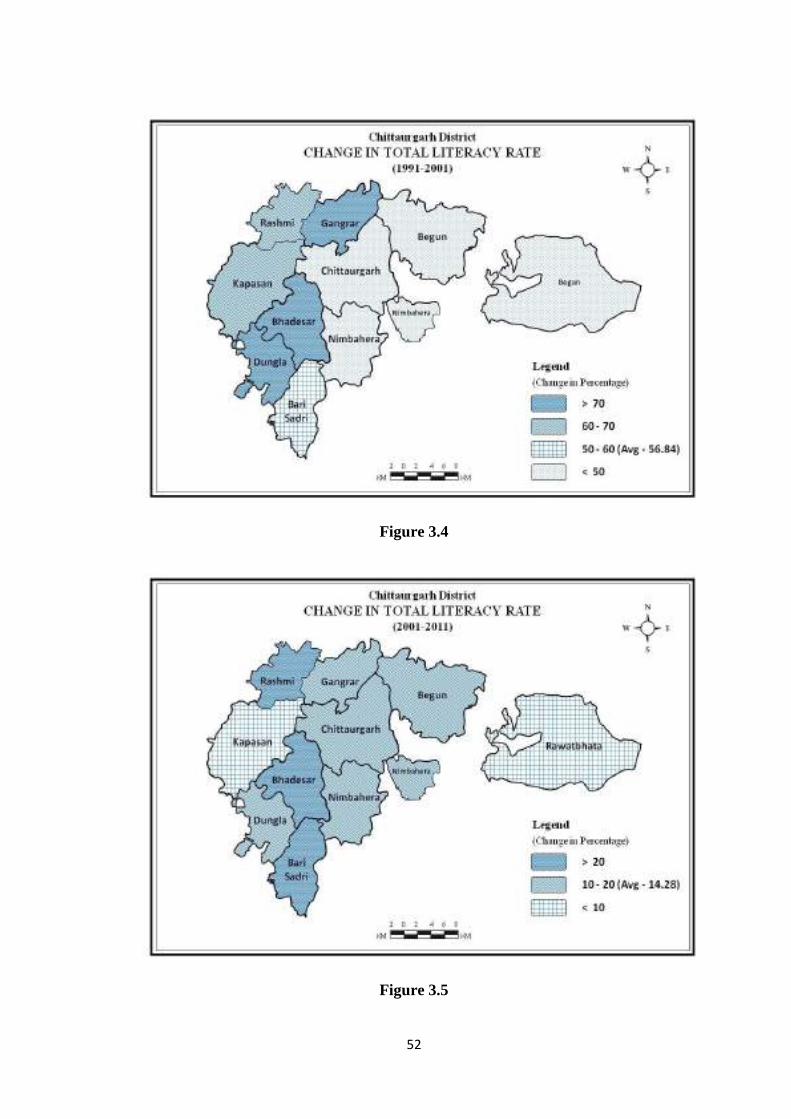
52
Figure 3.4
Figure 3.5
53
Chittaurgarh made a tremendous progress in the education sector in the last
some decades and the rate of literacy has increased. The rate of literacy in Chittaurgarh
district was 21.77 percent in 1981, which increased to 34.43 percent in 1991, further it
increased to 54.00 percent in 2001 and 2011 it reached up to 61.71 percent. The change
in total literacy rate from 1981-2011 has been 180.88 percent, which was 56.71 percent
from 1981-1991, from 1991-2001 it was 56.84 percent and from 2001-2011 it has been
14.28 percent. This is the outcome of better policies of the government which
ultimately has increased the literacy in area for example free education, compulsory
education, scholarship for the poor, free mid-day meal, special motivation for the girl
education. Provision of schools in all areas, games and sports, special scholarship for
women and backward classes, increase in basic requirements of educational transport
facilities, hostel facilities etc. Generally, there was a magnitudinal change of 56.71
percent during the decade 1981-1991 in the total literacy rate in Chittaurgarh district.
There was highest growth of literacy rate in Bhadesar area that is 68.05 percent and the
lowest growth of literacy rate was 43.93 percent in Chittaurgarh. The growth rate which
increased in Bhadesar, Dungla, Rashmi and Nimbahera was higher as compared to the
other part of the district. On the other hand, the literacy rate was quite lower in
Chittaurgarh, Gangrar, Kapasan, Badi Sadri, Begun as compared to the above
mentioned growth rate of literacy. The total literacy rate changed to 56.84 percent from
1991-2001. Among all the tehsil, the increase in literacy rate was the highest in
Bhadesar which is 80.0 percent and the lowest 44.06 percent was in Chittaurgarh. The
growth rate which increased in Gangrar, Dungla, Kapasan, and Rashmi was higher as
compared to the other parts of district. On the other hand the literacy rate was quite
lower in Begun, Nimbahera, Badi Sadri as compared to the above mentioned growth
rate of literacy. The total literacy rate changed to 14.28 percent from 2001-2011. There
was highest growth of literacy rate in Bhadesar area that is 21.69 percent and the lowest
growth of literacy rate was 7.62 percent in Rawatbhata. The growth rate which
increased in Bhadesar, Rashmi, Badi Sadri, Dungla, and Gangrar was higher as
compared to the other parts of the district. On the other hand the literacy rate was quite
lower in Chittaurgarh, Rawatbhata, Kapasan, Nimbahera, Begun, as compared to the
above mentioned growth rate of literacy. So there was, however, a negative correlation
between literacy level of tehsil and the mangnitude of change in it. This intends to say
that where the literacy level was high, the magnitude of change was low, where the
literacy level was low; the magnitude of change in literacy was high. There are area
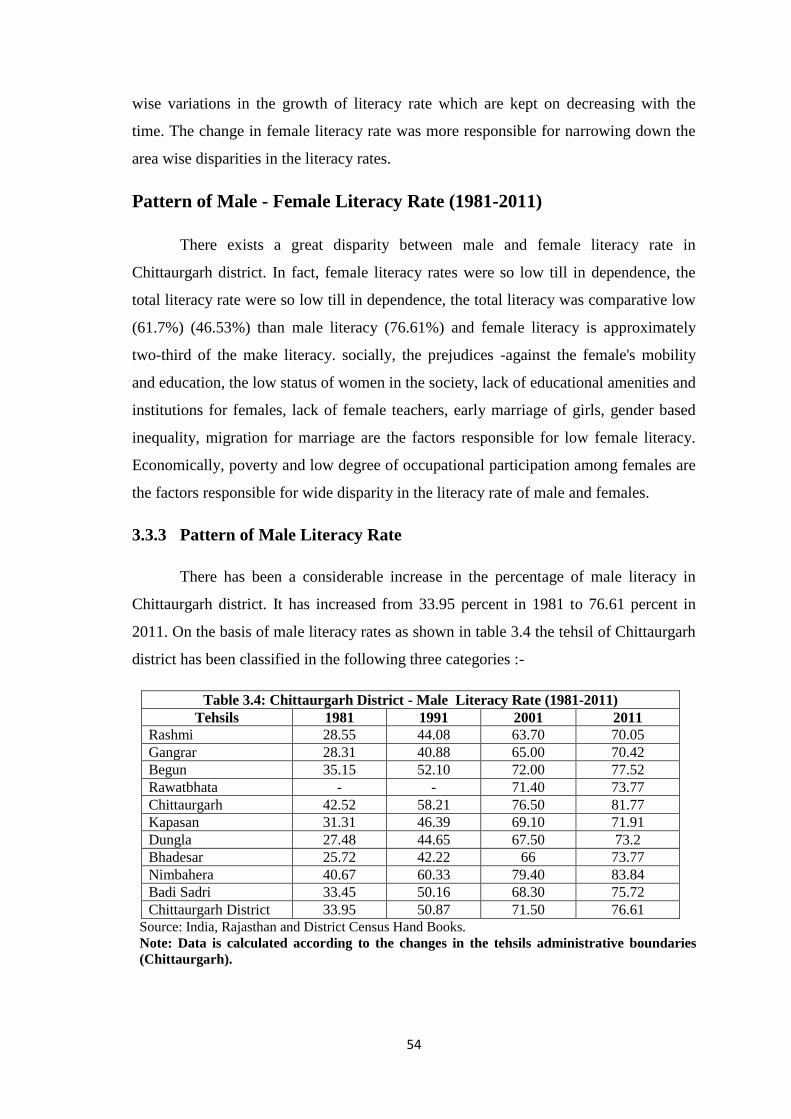
54
wise variations in the growth of literacy rate which are kept on decreasing with the
time. The change in female literacy rate was more responsible for narrowing down the
area wise disparities in the literacy rates.
Pattern of Male - Female Literacy Rate (1981-2011)
There exists a great disparity between male and female literacy rate in
Chittaurgarh district. In fact, female literacy rates were so low till in dependence, the
total literacy rate were so low till in dependence, the total literacy was comparative low
(61.7%) (46.53%) than male literacy (76.61%) and female literacy is approximately
two-third of the make literacy. socially, the prejudices -against the female's mobility
and education, the low status of women in the society, lack of educational amenities and
institutions for females, lack of female teachers, early marriage of girls, gender based
inequality, migration for marriage are the factors responsible for low female literacy.
Economically, poverty and low degree of occupational participation among females are
the factors responsible for wide disparity in the literacy rate of male and females.
3.3.3 Pattern of Male Literacy Rate
There has been a considerable increase in the percentage of male literacy in
Chittaurgarh district. It has increased from 33.95 percent in 1981 to 76.61 percent in
2011. On the basis of male literacy rates as shown in table 3.4 the tehsil of Chittaurgarh
district has been classified in the following three categories :-
Table 3.4: Chittaurgarh District - Male Literacy Rate (1981-2011) Tehsils 1981 1991 2001 2011
Rashmi 28.55 44.08 63.70 70.05 Gangrar 28.31 40.88 65.00 70.42 Begun 35.15 52.10 72.00 77.52 Rawatbhata - - 71.40 73.77 Chittaurgarh 42.52 58.21 76.50 81.77 Kapasan 31.31 46.39 69.10 71.91 Dungla 27.48 44.65 67.50 73.2 Bhadesar 25.72 42.22 66 73.77 Nimbahera 40.67 60.33 79.40 83.84 Badi Sadri 33.45 50.16 68.30 75.72 Chittaurgarh District 33.95 50.87 71.50 76.61
Source: India, Rajasthan and District Census Hand Books. Note: Data is calculated according to the changes in the tehsils administrative boundaries (Chittaurgarh).
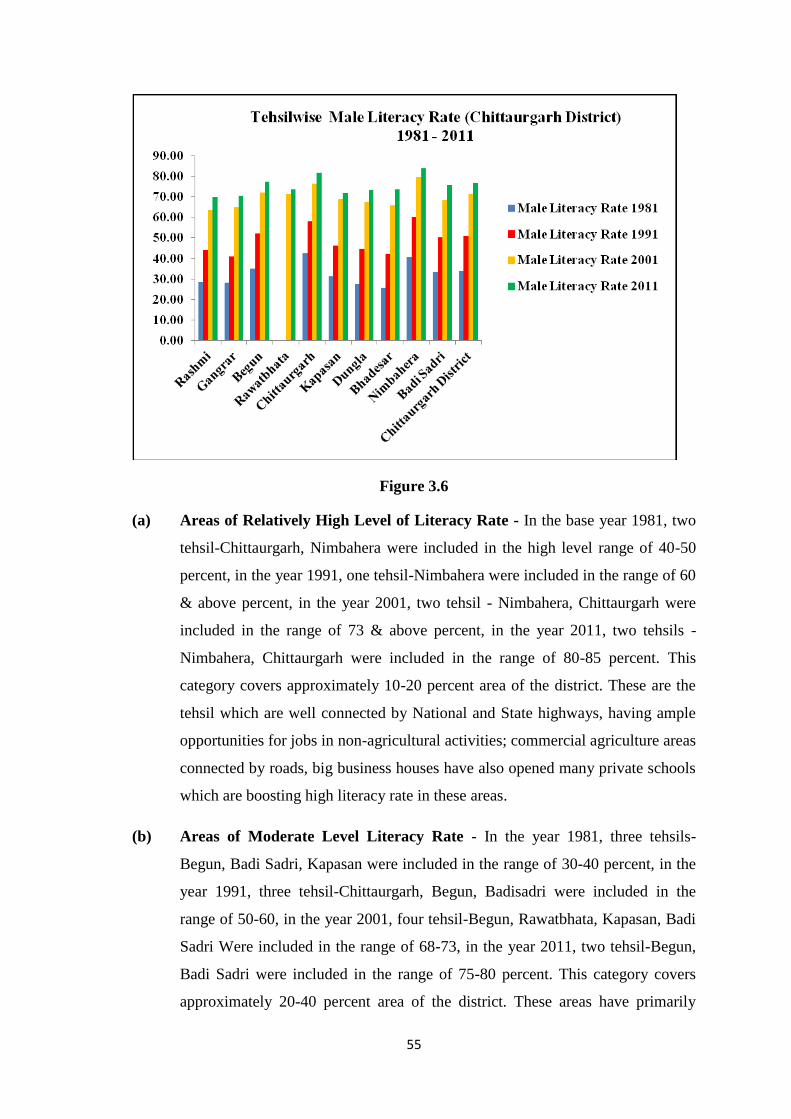
55
Figure 3.6
(a) Areas of Relatively High Level of Literacy Rate - In the base year 1981, two
tehsil-Chittaurgarh, Nimbahera were included in the high level range of 40-50
percent, in the year 1991, one tehsil-Nimbahera were included in the range of 60
& above percent, in the year 2001, two tehsil - Nimbahera, Chittaurgarh were
included in the range of 73 & above percent, in the year 2011, two tehsils -
Nimbahera, Chittaurgarh were included in the range of 80-85 percent. This
category covers approximately 10-20 percent area of the district. These are the
tehsil which are well connected by National and State highways, having ample
opportunities for jobs in non-agricultural activities; commercial agriculture areas
connected by roads, big business houses have also opened many private schools
which are boosting high literacy rate in these areas.
(b) Areas of Moderate Level Literacy Rate - In the year 1981, three tehsils-
Begun, Badi Sadri, Kapasan were included in the range of 30-40 percent, in the
year 1991, three tehsil-Chittaurgarh, Begun, Badisadri were included in the
range of 50-60, in the year 2001, four tehsil-Begun, Rawatbhata, Kapasan, Badi
Sadri Were included in the range of 68-73, in the year 2011, two tehsil-Begun,
Badi Sadri were included in the range of 75-80 percent. This category covers
approximately 20-40 percent area of the district. These areas have primarily
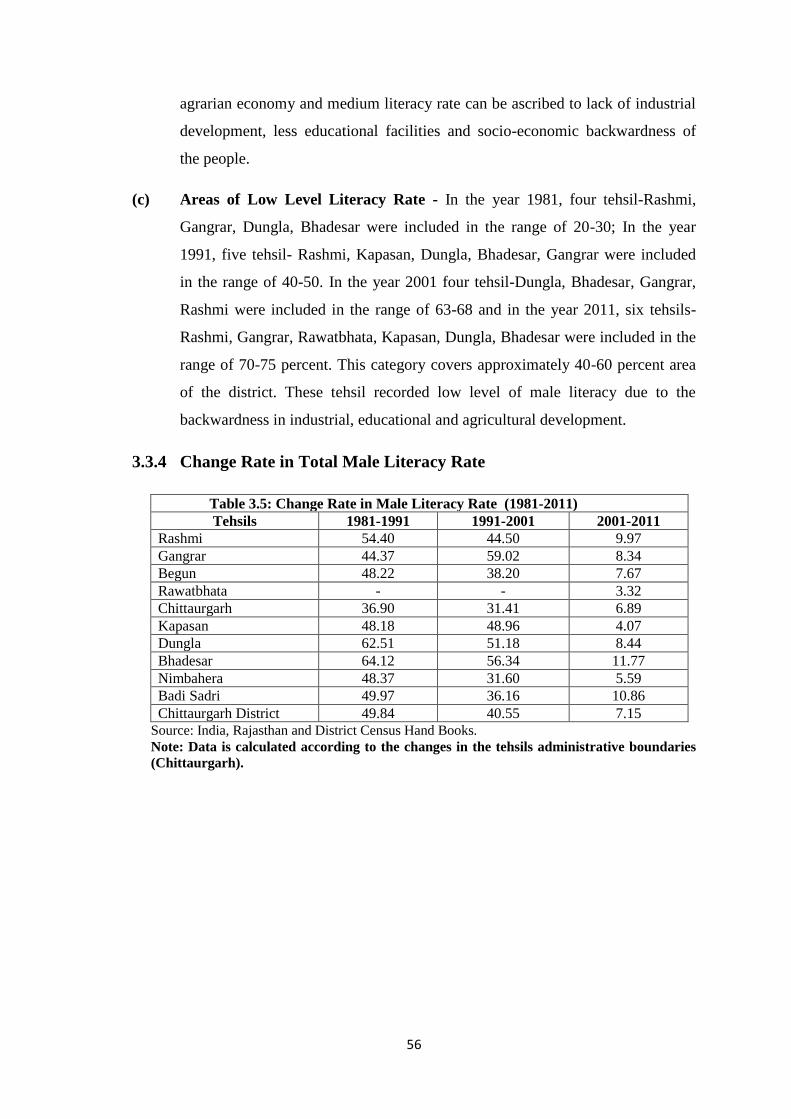
56
agrarian economy and medium literacy rate can be ascribed to lack of industrial
development, less educational facilities and socio-economic backwardness of
the people.
(c) Areas of Low Level Literacy Rate - In the year 1981, four tehsil-Rashmi,
Gangrar, Dungla, Bhadesar were included in the range of 20-30; In the year
1991, five tehsil- Rashmi, Kapasan, Dungla, Bhadesar, Gangrar were included
in the range of 40-50. In the year 2001 four tehsil-Dungla, Bhadesar, Gangrar,
Rashmi were included in the range of 63-68 and in the year 2011, six tehsils-
Rashmi, Gangrar, Rawatbhata, Kapasan, Dungla, Bhadesar were included in the
range of 70-75 percent. This category covers approximately 40-60 percent area
of the district. These tehsil recorded low level of male literacy due to the
backwardness in industrial, educational and agricultural development.
3.3.4 Change Rate in Total Male Literacy Rate
Table 3.5: Change Rate in Male Literacy Rate (1981-2011) Tehsils 1981-1991 1991-2001 2001-2011
Rashmi 54.40 44.50 9.97 Gangrar 44.37 59.02 8.34 Begun 48.22 38.20 7.67 Rawatbhata - - 3.32 Chittaurgarh 36.90 31.41 6.89 Kapasan 48.18 48.96 4.07 Dungla 62.51 51.18 8.44 Bhadesar 64.12 56.34 11.77 Nimbahera 48.37 31.60 5.59 Badi Sadri 49.97 36.16 10.86 Chittaurgarh District 49.84 40.55 7.15
Source: India, Rajasthan and District Census Hand Books. Note: Data is calculated according to the changes in the tehsils administrative boundaries (Chittaurgarh).
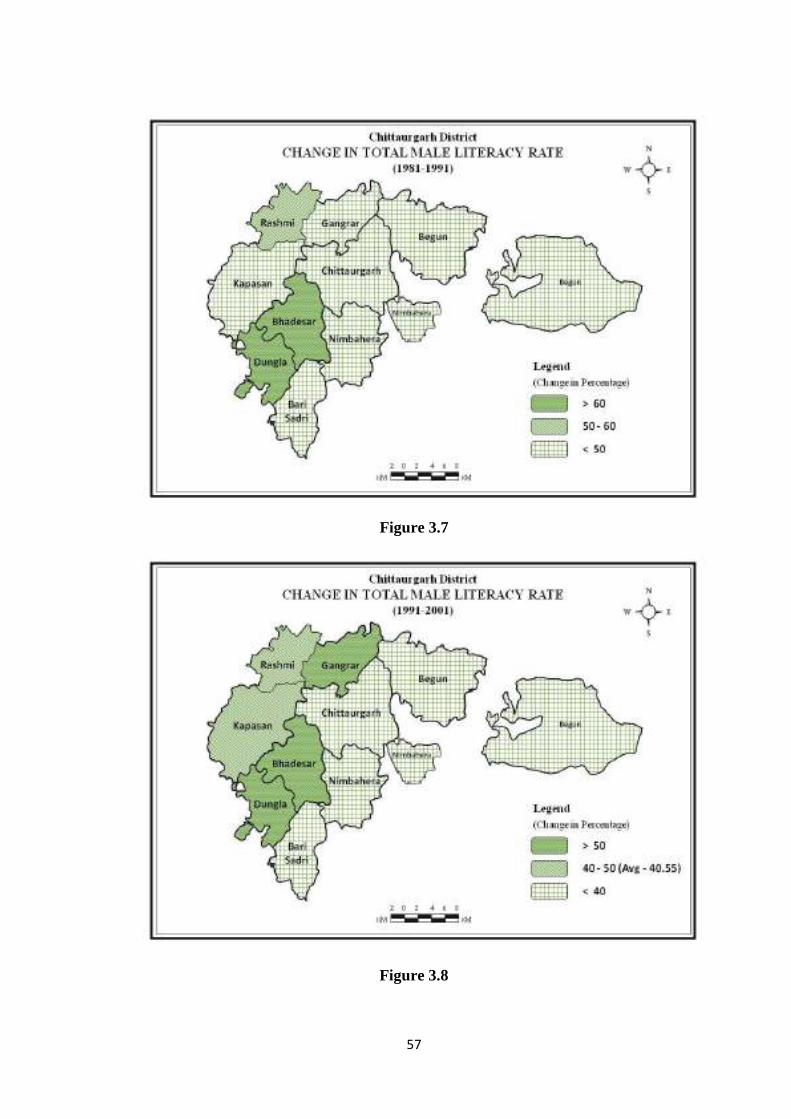
57
Figure 3.7
Figure 3.8
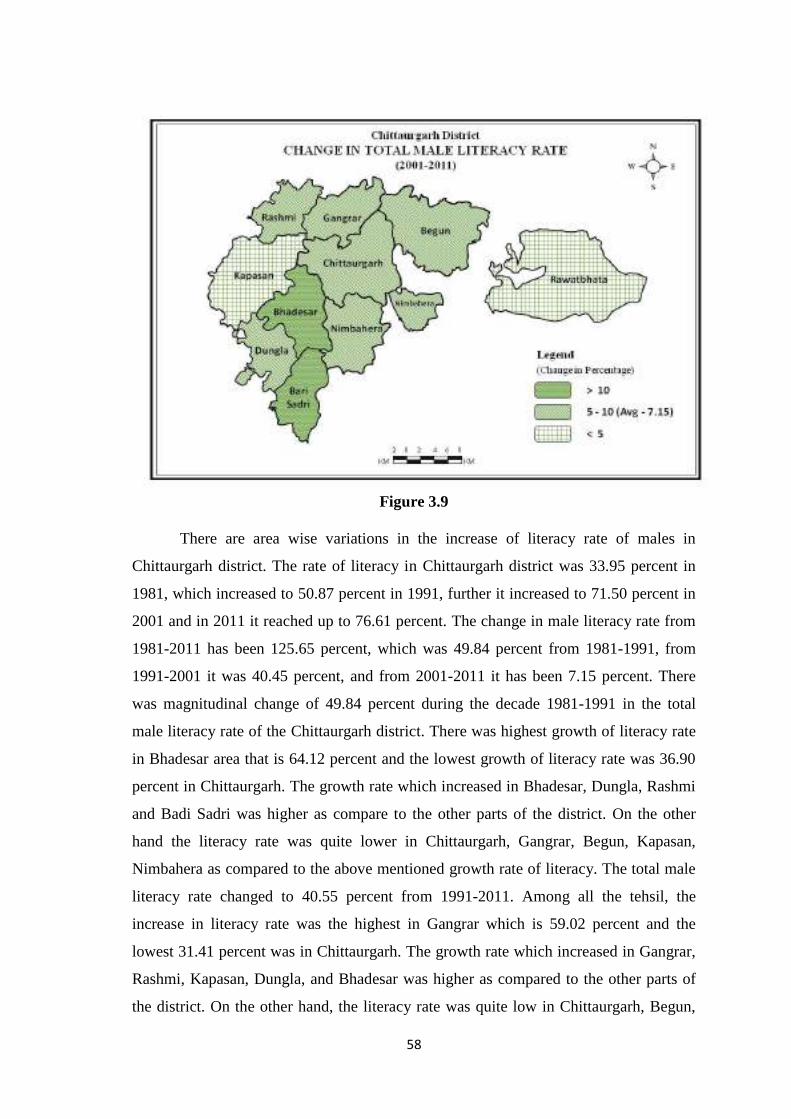
58
Figure 3.9
There are area wise variations in the increase of literacy rate of males in
Chittaurgarh district. The rate of literacy in Chittaurgarh district was 33.95 percent in
1981, which increased to 50.87 percent in 1991, further it increased to 71.50 percent in
2001 and in 2011 it reached up to 76.61 percent. The change in male literacy rate from
1981-2011 has been 125.65 percent, which was 49.84 percent from 1981-1991, from
1991-2001 it was 40.45 percent, and from 2001-2011 it has been 7.15 percent. There
was magnitudinal change of 49.84 percent during the decade 1981-1991 in the total
male literacy rate of the Chittaurgarh district. There was highest growth of literacy rate
in Bhadesar area that is 64.12 percent and the lowest growth of literacy rate was 36.90
percent in Chittaurgarh. The growth rate which increased in Bhadesar, Dungla, Rashmi
and Badi Sadri was higher as compare to the other parts of the district. On the other
hand the literacy rate was quite lower in Chittaurgarh, Gangrar, Begun, Kapasan,
Nimbahera as compared to the above mentioned growth rate of literacy. The total male
literacy rate changed to 40.55 percent from 1991-2011. Among all the tehsil, the
increase in literacy rate was the highest in Gangrar which is 59.02 percent and the
lowest 31.41 percent was in Chittaurgarh. The growth rate which increased in Gangrar,
Rashmi, Kapasan, Dungla, and Bhadesar was higher as compared to the other parts of
the district. On the other hand, the literacy rate was quite low in Chittaurgarh, Begun,
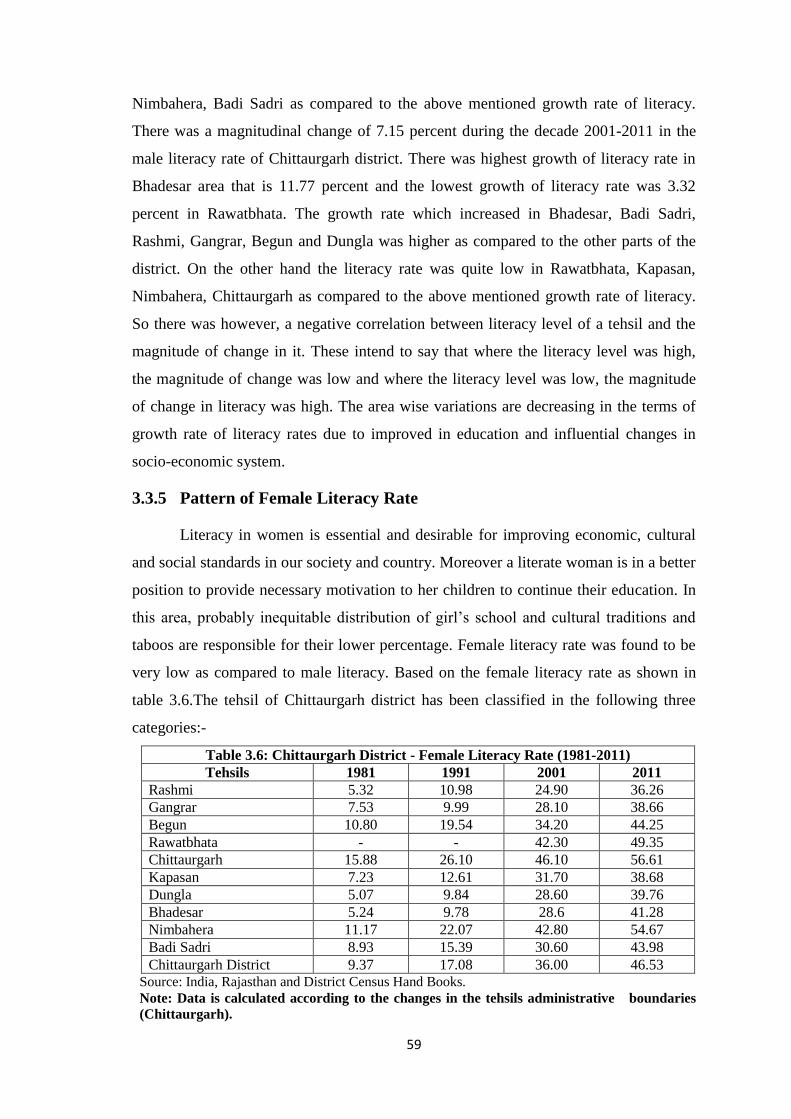
59
Nimbahera, Badi Sadri as compared to the above mentioned growth rate of literacy.
There was a magnitudinal change of 7.15 percent during the decade 2001-2011 in the
male literacy rate of Chittaurgarh district. There was highest growth of literacy rate in
Bhadesar area that is 11.77 percent and the lowest growth of literacy rate was 3.32
percent in Rawatbhata. The growth rate which increased in Bhadesar, Badi Sadri,
Rashmi, Gangrar, Begun and Dungla was higher as compared to the other parts of the
district. On the other hand the literacy rate was quite low in Rawatbhata, Kapasan,
Nimbahera, Chittaurgarh as compared to the above mentioned growth rate of literacy.
So there was however, a negative correlation between literacy level of a tehsil and the
magnitude of change in it. These intend to say that where the literacy level was high,
the magnitude of change was low and where the literacy level was low, the magnitude
of change in literacy was high. The area wise variations are decreasing in the terms of
growth rate of literacy rates due to improved in education and influential changes in
socio-economic system.
3.3.5 Pattern of Female Literacy Rate
Literacy in women is essential and desirable for improving economic, cultural
and social standards in our society and country. Moreover a literate woman is in a better
position to provide necessary motivation to her children to continue their education. In
this area, probably inequitable distribution of girl‟s school and cultural traditions and
taboos are responsible for their lower percentage. Female literacy rate was found to be
very low as compared to male literacy. Based on the female literacy rate as shown in
table 3.6.The tehsil of Chittaurgarh district has been classified in the following three
categories:-
Table 3.6: Chittaurgarh District - Female Literacy Rate (1981-2011) Tehsils 1981 1991 2001 2011
Rashmi 5.32 10.98 24.90 36.26 Gangrar 7.53 9.99 28.10 38.66 Begun 10.80 19.54 34.20 44.25 Rawatbhata - - 42.30 49.35 Chittaurgarh 15.88 26.10 46.10 56.61 Kapasan 7.23 12.61 31.70 38.68 Dungla 5.07 9.84 28.60 39.76 Bhadesar 5.24 9.78 28.6 41.28 Nimbahera 11.17 22.07 42.80 54.67 Badi Sadri 8.93 15.39 30.60 43.98 Chittaurgarh District 9.37 17.08 36.00 46.53
Source: India, Rajasthan and District Census Hand Books. Note: Data is calculated according to the changes in the tehsils administrative boundaries (Chittaurgarh).
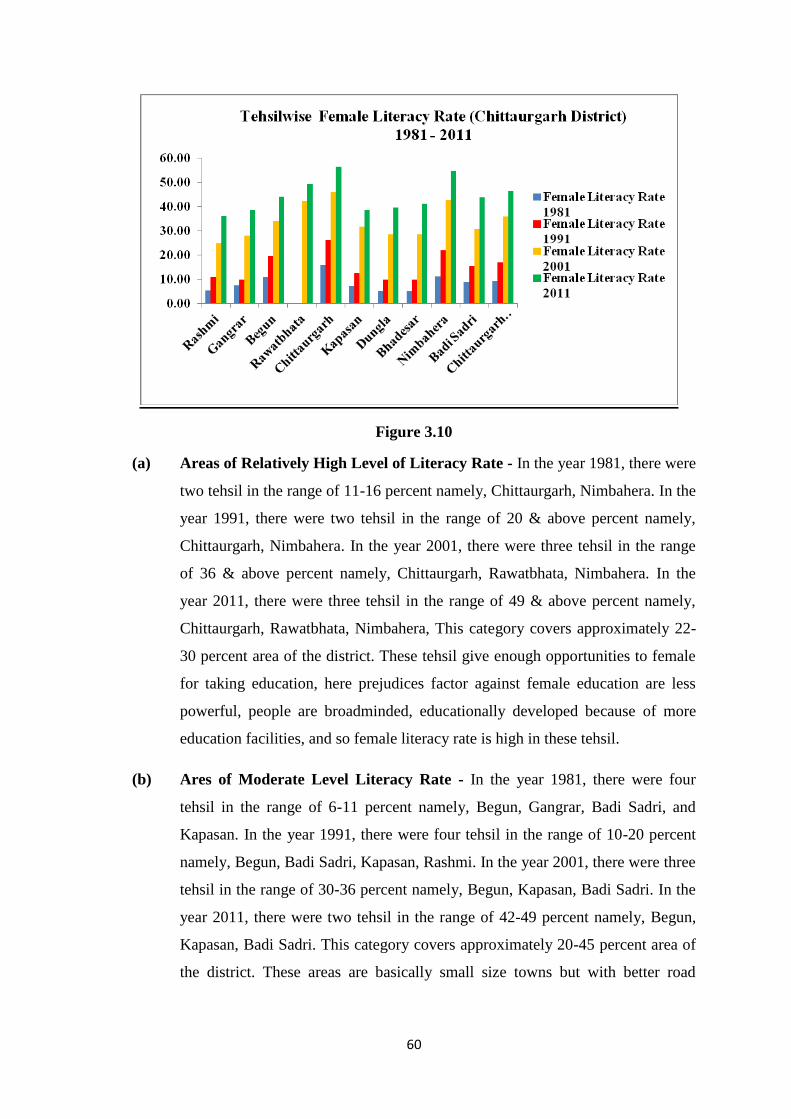
60
Figure 3.10
(a) Areas of Relatively High Level of Literacy Rate - In the year 1981, there were
two tehsil in the range of 11-16 percent namely, Chittaurgarh, Nimbahera. In the
year 1991, there were two tehsil in the range of 20 & above percent namely,
Chittaurgarh, Nimbahera. In the year 2001, there were three tehsil in the range
of 36 & above percent namely, Chittaurgarh, Rawatbhata, Nimbahera. In the
year 2011, there were three tehsil in the range of 49 & above percent namely,
Chittaurgarh, Rawatbhata, Nimbahera, This category covers approximately 22-
30 percent area of the district. These tehsil give enough opportunities to female
for taking education, here prejudices factor against female education are less
powerful, people are broadminded, educationally developed because of more
education facilities, and so female literacy rate is high in these tehsil.
(b) Ares of Moderate Level Literacy Rate - In the year 1981, there were four
tehsil in the range of 6-11 percent namely, Begun, Gangrar, Badi Sadri, and
Kapasan. In the year 1991, there were four tehsil in the range of 10-20 percent
namely, Begun, Badi Sadri, Kapasan, Rashmi. In the year 2001, there were three
tehsil in the range of 30-36 percent namely, Begun, Kapasan, Badi Sadri. In the
year 2011, there were two tehsil in the range of 42-49 percent namely, Begun,
Kapasan, Badi Sadri. This category covers approximately 20-45 percent area of
the district. These areas are basically small size towns but with better road
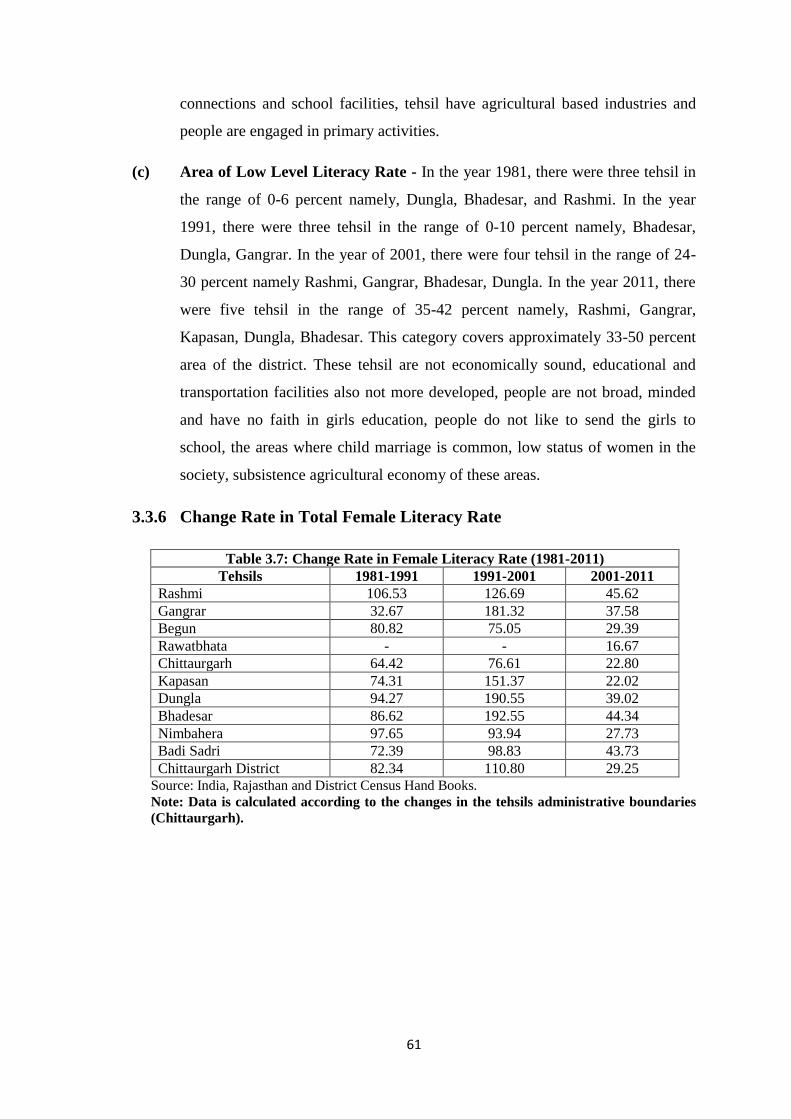
61
connections and school facilities, tehsil have agricultural based industries and
people are engaged in primary activities.
(c) Area of Low Level Literacy Rate - In the year 1981, there were three tehsil in
the range of 0-6 percent namely, Dungla, Bhadesar, and Rashmi. In the year
1991, there were three tehsil in the range of 0-10 percent namely, Bhadesar,
Dungla, Gangrar. In the year of 2001, there were four tehsil in the range of 24-
30 percent namely Rashmi, Gangrar, Bhadesar, Dungla. In the year 2011, there
were five tehsil in the range of 35-42 percent namely, Rashmi, Gangrar,
Kapasan, Dungla, Bhadesar. This category covers approximately 33-50 percent
area of the district. These tehsil are not economically sound, educational and
transportation facilities also not more developed, people are not broad, minded
and have no faith in girls education, people do not like to send the girls to
school, the areas where child marriage is common, low status of women in the
society, subsistence agricultural economy of these areas.
3.3.6 Change Rate in Total Female Literacy Rate
Table 3.7: Change Rate in Female Literacy Rate (1981-2011) Tehsils 1981-1991 1991-2001 2001-2011
Rashmi 106.53 126.69 45.62 Gangrar 32.67 181.32 37.58 Begun 80.82 75.05 29.39 Rawatbhata - - 16.67 Chittaurgarh 64.42 76.61 22.80 Kapasan 74.31 151.37 22.02 Dungla 94.27 190.55 39.02 Bhadesar 86.62 192.55 44.34 Nimbahera 97.65 93.94 27.73 Badi Sadri 72.39 98.83 43.73 Chittaurgarh District 82.34 110.80 29.25
Source: India, Rajasthan and District Census Hand Books. Note: Data is calculated according to the changes in the tehsils administrative boundaries (Chittaurgarh).
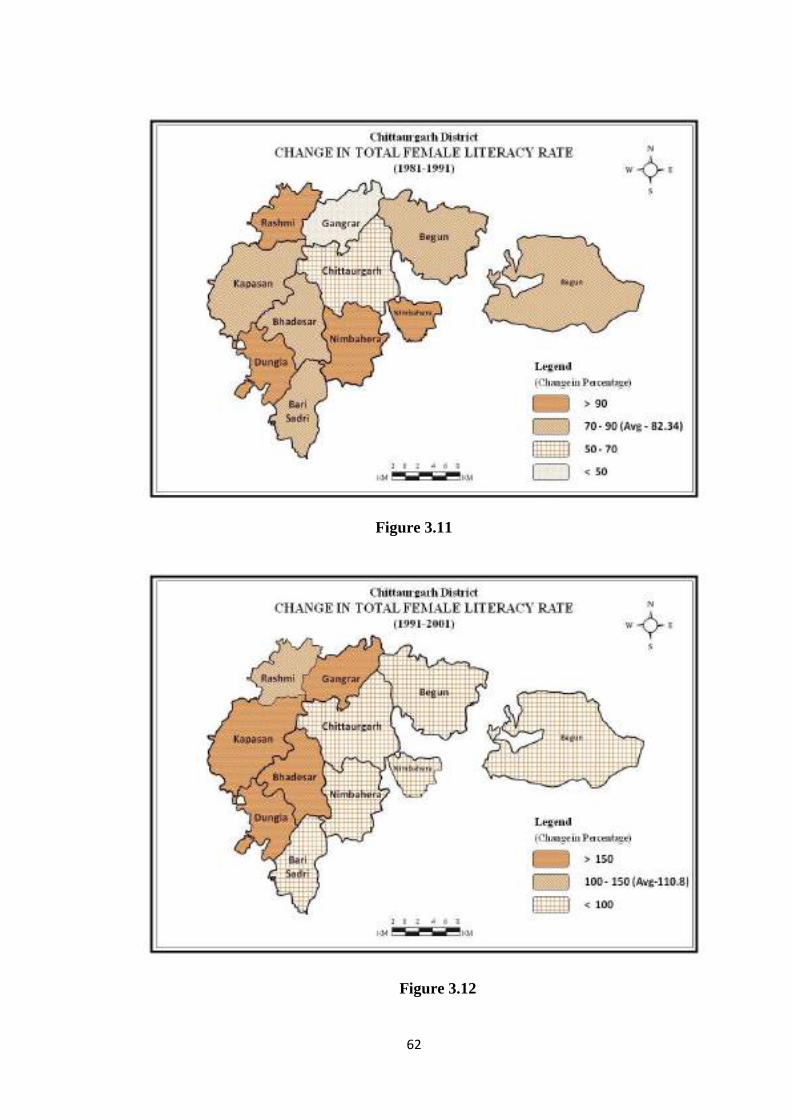
62
Figure 3.11
Figure 3.12
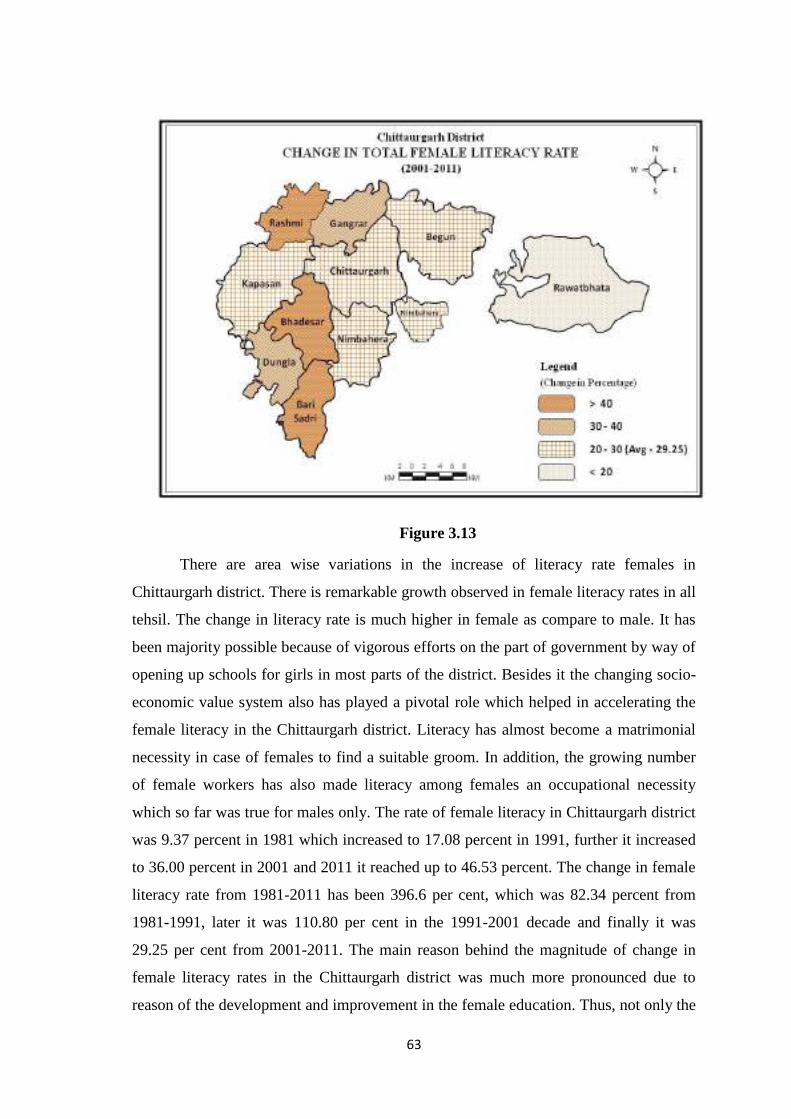
63
Figure 3.13
There are area wise variations in the increase of literacy rate females in
Chittaurgarh district. There is remarkable growth observed in female literacy rates in all
tehsil. The change in literacy rate is much higher in female as compare to male. It has
been majority possible because of vigorous efforts on the part of government by way of
opening up schools for girls in most parts of the district. Besides it the changing socio-
economic value system also has played a pivotal role which helped in accelerating the
female literacy in the Chittaurgarh district. Literacy has almost become a matrimonial
necessity in case of females to find a suitable groom. In addition, the growing number
of female workers has also made literacy among females an occupational necessity
which so far was true for males only. The rate of female literacy in Chittaurgarh district
was 9.37 percent in 1981 which increased to 17.08 percent in 1991, further it increased
to 36.00 percent in 2001 and 2011 it reached up to 46.53 percent. The change in female
literacy rate from 1981-2011 has been 396.6 per cent, which was 82.34 percent from
1981-1991, later it was 110.80 per cent in the 1991-2001 decade and finally it was
29.25 per cent from 2001-2011. The main reason behind the magnitude of change in
female literacy rates in the Chittaurgarh district was much more pronounced due to
reason of the development and improvement in the female education. Thus, not only the
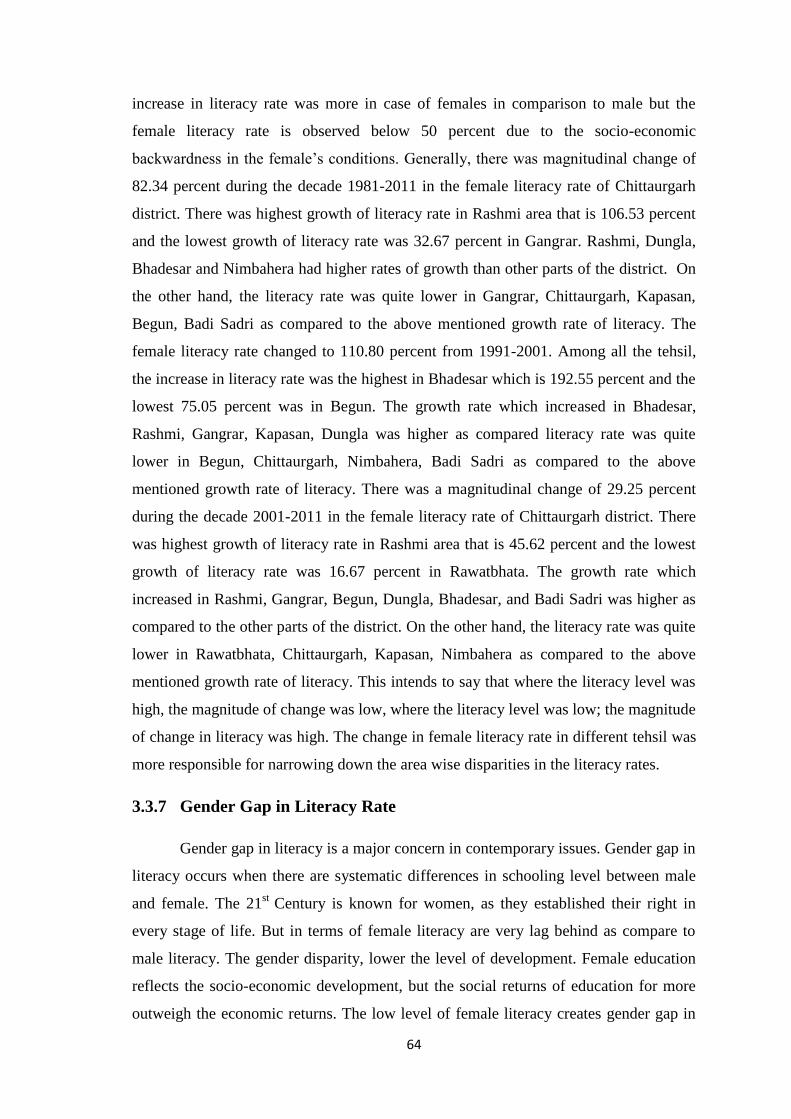
64
increase in literacy rate was more in case of females in comparison to male but the
female literacy rate is observed below 50 percent due to the socio-economic
backwardness in the female‟s conditions. Generally, there was magnitudinal change of
82.34 percent during the decade 1981-2011 in the female literacy rate of Chittaurgarh
district. There was highest growth of literacy rate in Rashmi area that is 106.53 percent
and the lowest growth of literacy rate was 32.67 percent in Gangrar. Rashmi, Dungla,
Bhadesar and Nimbahera had higher rates of growth than other parts of the district. On
the other hand, the literacy rate was quite lower in Gangrar, Chittaurgarh, Kapasan,
Begun, Badi Sadri as compared to the above mentioned growth rate of literacy. The
female literacy rate changed to 110.80 percent from 1991-2001. Among all the tehsil,
the increase in literacy rate was the highest in Bhadesar which is 192.55 percent and the
lowest 75.05 percent was in Begun. The growth rate which increased in Bhadesar,
Rashmi, Gangrar, Kapasan, Dungla was higher as compared literacy rate was quite
lower in Begun, Chittaurgarh, Nimbahera, Badi Sadri as compared to the above
mentioned growth rate of literacy. There was a magnitudinal change of 29.25 percent
during the decade 2001-2011 in the female literacy rate of Chittaurgarh district. There
was highest growth of literacy rate in Rashmi area that is 45.62 percent and the lowest
growth of literacy rate was 16.67 percent in Rawatbhata. The growth rate which
increased in Rashmi, Gangrar, Begun, Dungla, Bhadesar, and Badi Sadri was higher as
compared to the other parts of the district. On the other hand, the literacy rate was quite
lower in Rawatbhata, Chittaurgarh, Kapasan, Nimbahera as compared to the above
mentioned growth rate of literacy. This intends to say that where the literacy level was
high, the magnitude of change was low, where the literacy level was low; the magnitude
of change in literacy was high. The change in female literacy rate in different tehsil was
more responsible for narrowing down the area wise disparities in the literacy rates.
3.3.7 Gender Gap in Literacy Rate
Gender gap in literacy is a major concern in contemporary issues. Gender gap in
literacy occurs when there are systematic differences in schooling level between male
and female. The 21st Century is known for women, as they established their right in
every stage of life. But in terms of female literacy are very lag behind as compare to
male literacy. The gender disparity, lower the level of development. Female education
reflects the socio-economic development, but the social returns of education for more
outweigh the economic returns. The low level of female literacy creates gender gap in
65
literacy which is constraint on the improvements of individuals as well as nations socio-
economic conditions. Gender inequality in literacy is the result of the continuous
discrimination of a group of people on the basis of gender. The difference between male
and female literacy rate is still very high, although since independence, female literacy
has increased, but the large number of women is still illiterate. The gender gap in
literacy reduced the total literacy level which shows negative consequences on the
development of the economy, because education is the most active indicator of
economic development. Male - Female literacy gaps are differing from rural to urban
scheduled tribe to scheduled caste, agricultural economy society to industrial society
depending on educational facilities, social custom and parent‟s educational level.
The gender gap in literacy is very high in the study area, due to many reasons
including appalling poverty, parents lack of interest in female education, early marriage
of the females, household responsibilities of the females, prevalence of prejudices
against the females education, mobility and employment, inadequate schools for
females, dearth of female teachers particularly in rural areas, more preference for
education of sons, and the low degree of participation of females in work. The present
study is an attempt to measure the gender gap in literacy rate in various tehsil of study
area for the year 1981, 1991, 2001 and 2011. Gender gap has been calculated by
absolute sense; it may be calculated by simply subtracting the lesser literacy rates from
the higher literacy rates.
After 1980's the female literacy made a considerable progress as a result of
changing socio-economic conditions in the study region. In Chittaurgarh female literacy
has increased in 1981-2011, from 9.37 to 46.53 and gender gap in literacy has also
increased significantly 24.58 to 30.08 respectively. In the year 1981, gender gap in
literacy was 24.58, after a decade in the year 1991; gender gap in literacy was also
increased and reached at 33.79 from 24.58. In the year 2001, gender gap in literacy was
also increased and reached at 35.50 from 33.79, but in the year 2011, gender gap
reached at 30.08 by reduced from previous Census year. In the Census of 2001 it was
noted that total literacy rate was 54.00 percent by comprising of male literacy of 71.50
percent and female literacy of 36.00 percent and gender gap reached at the peak level of
35.50 percent. In the latest Census of 2011 the total literacy rate is reached at 61.71
percent while male literacy rate is reached 76.61 percent and female literacy is 46.53
percent. The gender gap in literacy is being reduced by nearly 5.42 percent and reached
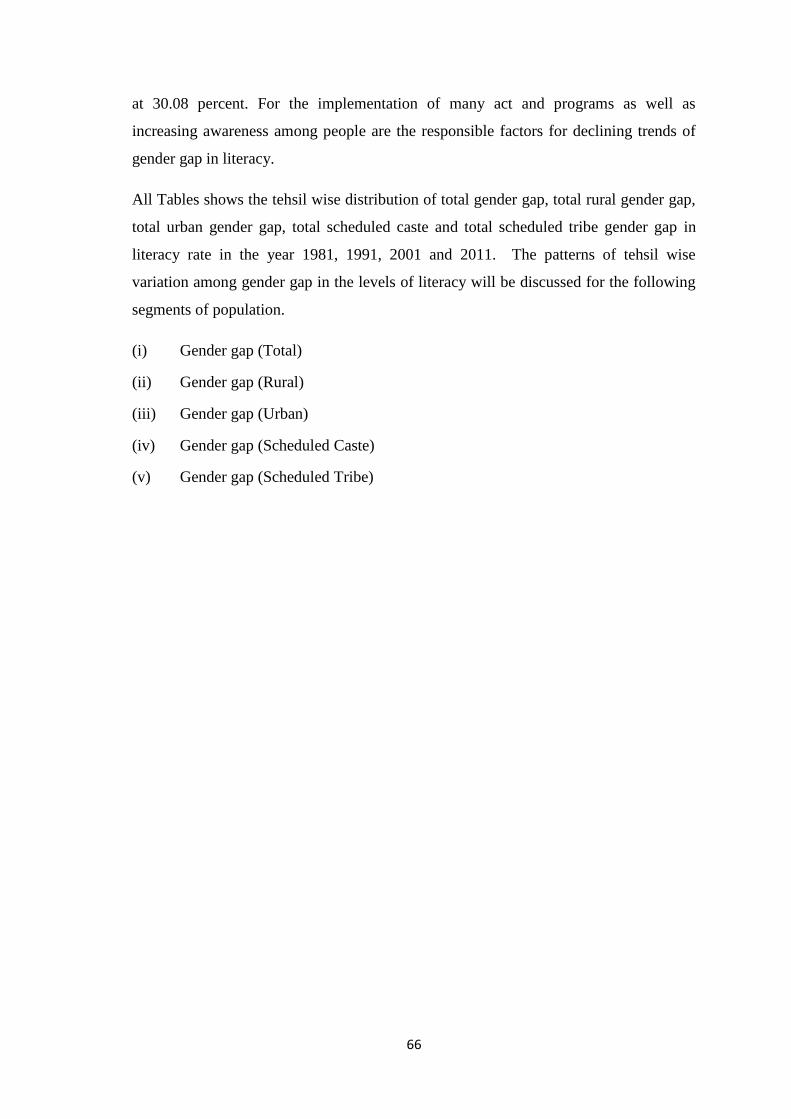
66
at 30.08 percent. For the implementation of many act and programs as well as
increasing awareness among people are the responsible factors for declining trends of
gender gap in literacy.
All Tables shows the tehsil wise distribution of total gender gap, total rural gender gap,
total urban gender gap, total scheduled caste and total scheduled tribe gender gap in
literacy rate in the year 1981, 1991, 2001 and 2011. The patterns of tehsil wise
variation among gender gap in the levels of literacy will be discussed for the following
segments of population.
(i) Gender gap (Total)
(ii) Gender gap (Rural)
(iii) Gender gap (Urban)
(iv) Gender gap (Scheduled Caste)
(v) Gender gap (Scheduled Tribe)
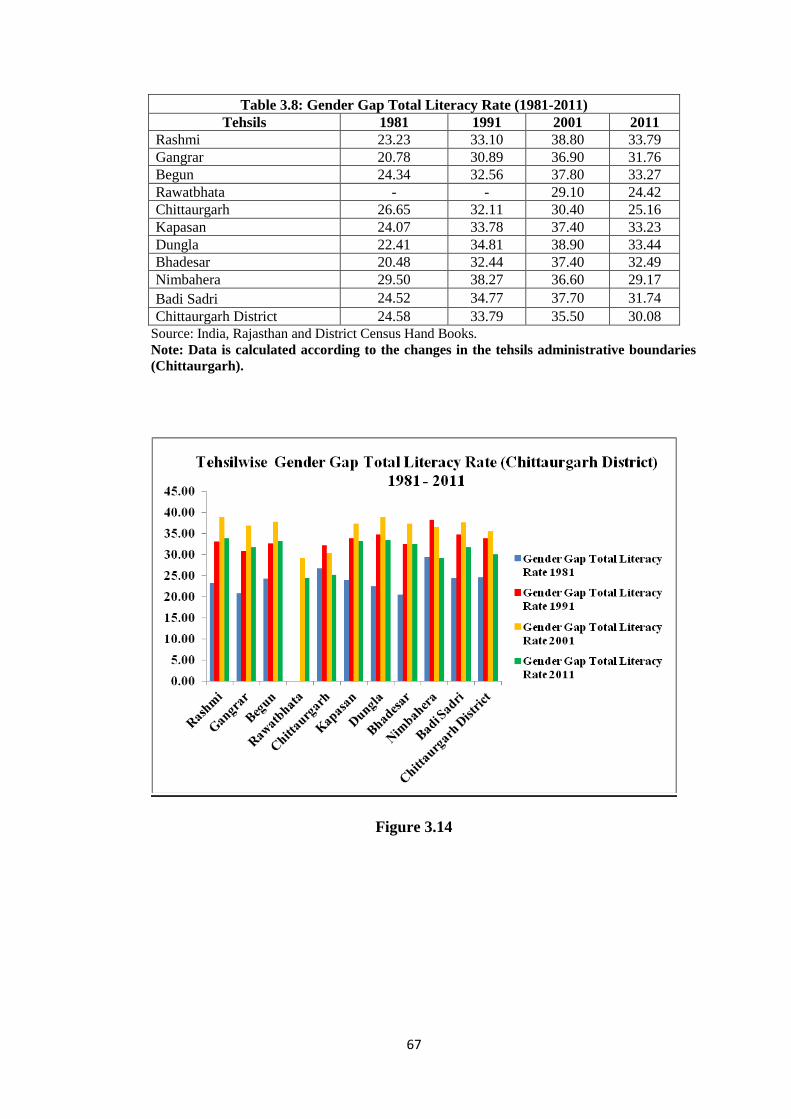
67
Table 3.8: Gender Gap Total Literacy Rate (1981-2011) Tehsils 1981 1991 2001 2011
Rashmi 23.23 33.10 38.80 33.79 Gangrar 20.78 30.89 36.90 31.76 Begun 24.34 32.56 37.80 33.27 Rawatbhata - - 29.10 24.42 Chittaurgarh 26.65 32.11 30.40 25.16 Kapasan 24.07 33.78 37.40 33.23 Dungla 22.41 34.81 38.90 33.44 Bhadesar 20.48 32.44 37.40 32.49 Nimbahera 29.50 38.27 36.60 29.17 Badi Sadri 24.52 34.77 37.70 31.74 Chittaurgarh District 24.58 33.79 35.50 30.08
Source: India, Rajasthan and District Census Hand Books. Note: Data is calculated according to the changes in the tehsils administrative boundaries (Chittaurgarh).
Figure 3.14
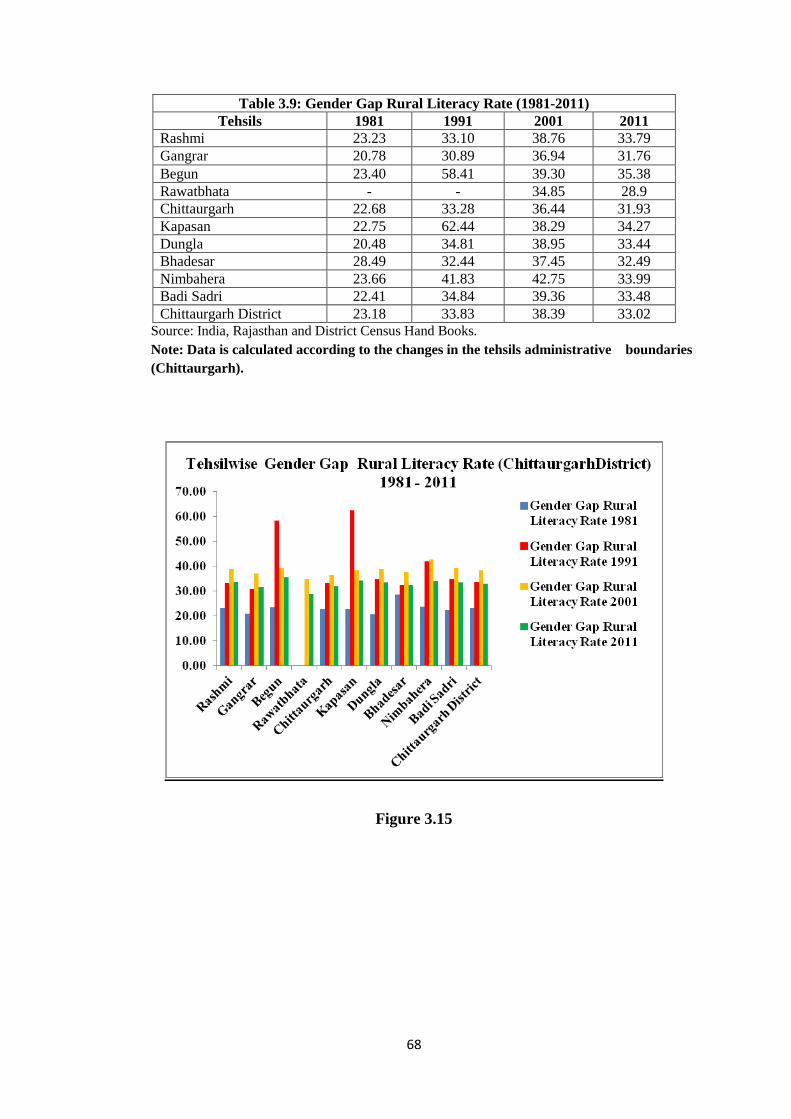
68
Table 3.9: Gender Gap Rural Literacy Rate (1981-2011) Tehsils 1981 1991 2001 2011
Rashmi 23.23 33.10 38.76 33.79 Gangrar 20.78 30.89 36.94 31.76 Begun 23.40 58.41 39.30 35.38 Rawatbhata - - 34.85 28.9 Chittaurgarh 22.68 33.28 36.44 31.93 Kapasan 22.75 62.44 38.29 34.27 Dungla 20.48 34.81 38.95 33.44 Bhadesar 28.49 32.44 37.45 32.49 Nimbahera 23.66 41.83 42.75 33.99 Badi Sadri 22.41 34.84 39.36 33.48 Chittaurgarh District 23.18 33.83 38.39 33.02
Source: India, Rajasthan and District Census Hand Books. Note: Data is calculated according to the changes in the tehsils administrative boundaries (Chittaurgarh).
Figure 3.15
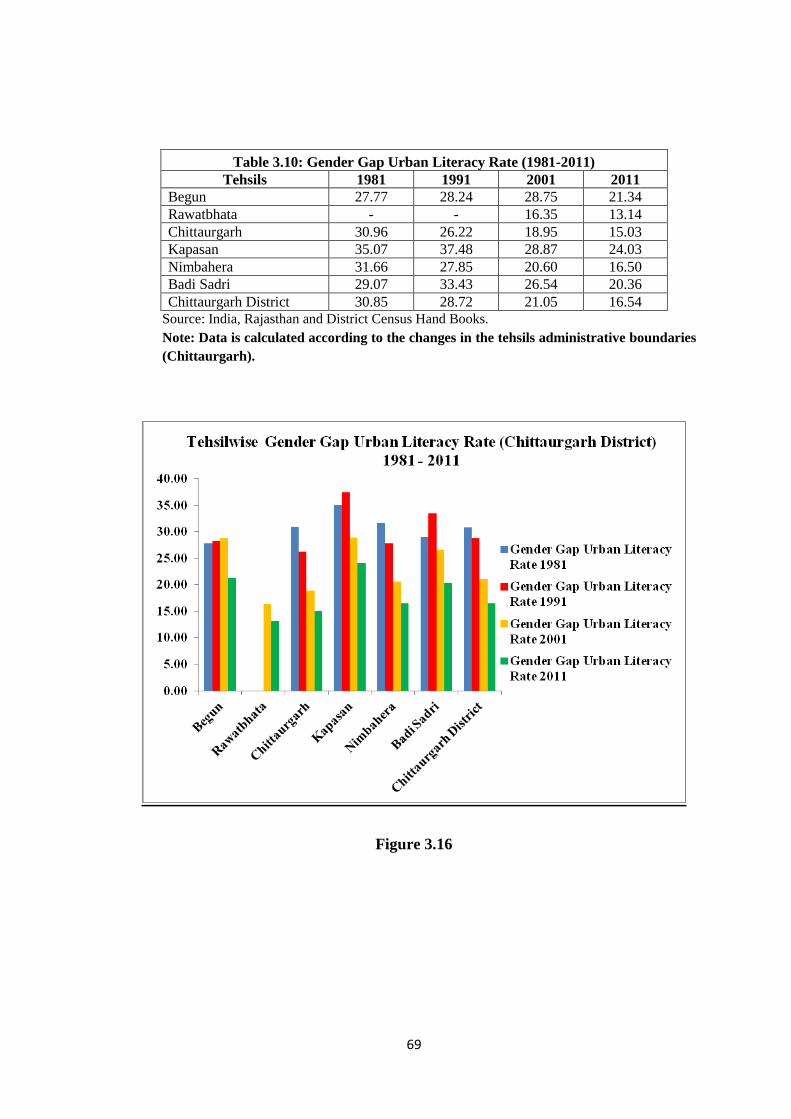
69
Table 3.10: Gender Gap Urban Literacy Rate (1981-2011) Tehsils 1981 1991 2001 2011
Begun 27.77 28.24 28.75 21.34 Rawatbhata - - 16.35 13.14 Chittaurgarh 30.96 26.22 18.95 15.03 Kapasan 35.07 37.48 28.87 24.03 Nimbahera 31.66 27.85 20.60 16.50 Badi Sadri 29.07 33.43 26.54 20.36 Chittaurgarh District 30.85 28.72 21.05 16.54
Source: India, Rajasthan and District Census Hand Books. Note: Data is calculated according to the changes in the tehsils administrative boundaries (Chittaurgarh).
Figure 3.16
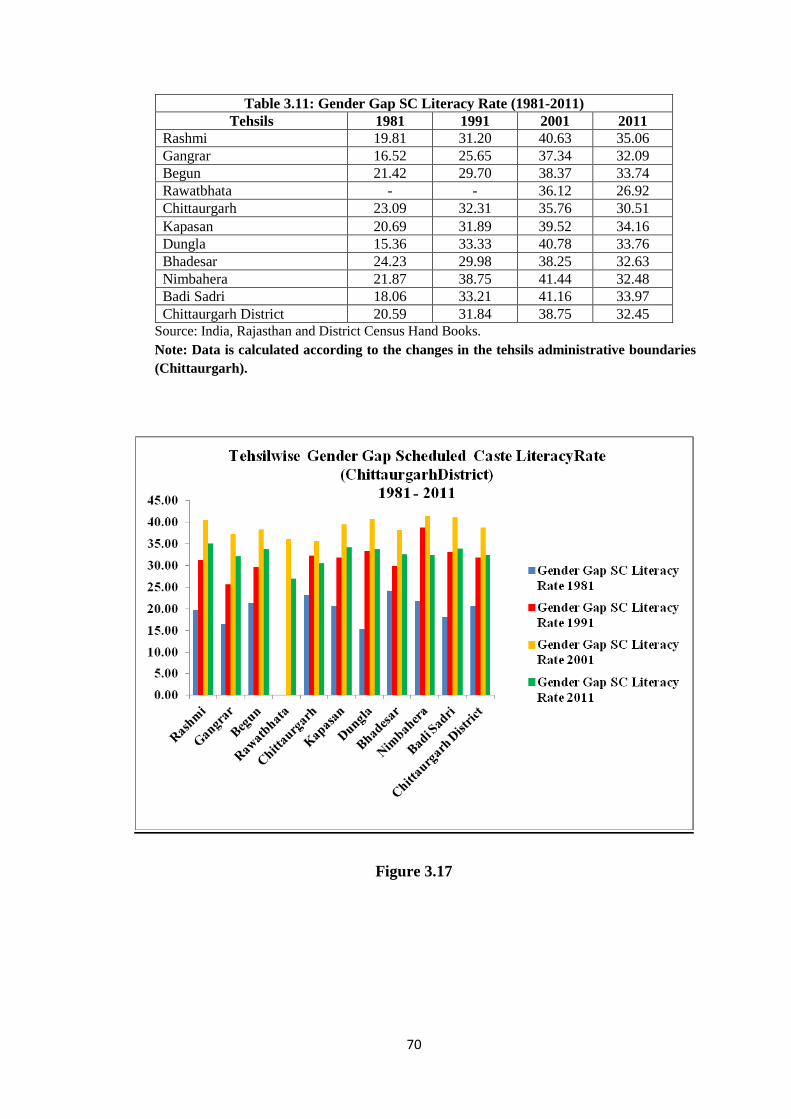
70
Table 3.11: Gender Gap SC Literacy Rate (1981-2011) Tehsils 1981 1991 2001 2011
Rashmi 19.81 31.20 40.63 35.06 Gangrar 16.52 25.65 37.34 32.09 Begun 21.42 29.70 38.37 33.74 Rawatbhata - - 36.12 26.92 Chittaurgarh 23.09 32.31 35.76 30.51 Kapasan 20.69 31.89 39.52 34.16 Dungla 15.36 33.33 40.78 33.76 Bhadesar 24.23 29.98 38.25 32.63 Nimbahera 21.87 38.75 41.44 32.48 Badi Sadri 18.06 33.21 41.16 33.97 Chittaurgarh District 20.59 31.84 38.75 32.45
Source: India, Rajasthan and District Census Hand Books. Note: Data is calculated according to the changes in the tehsils administrative boundaries (Chittaurgarh).
Figure 3.17
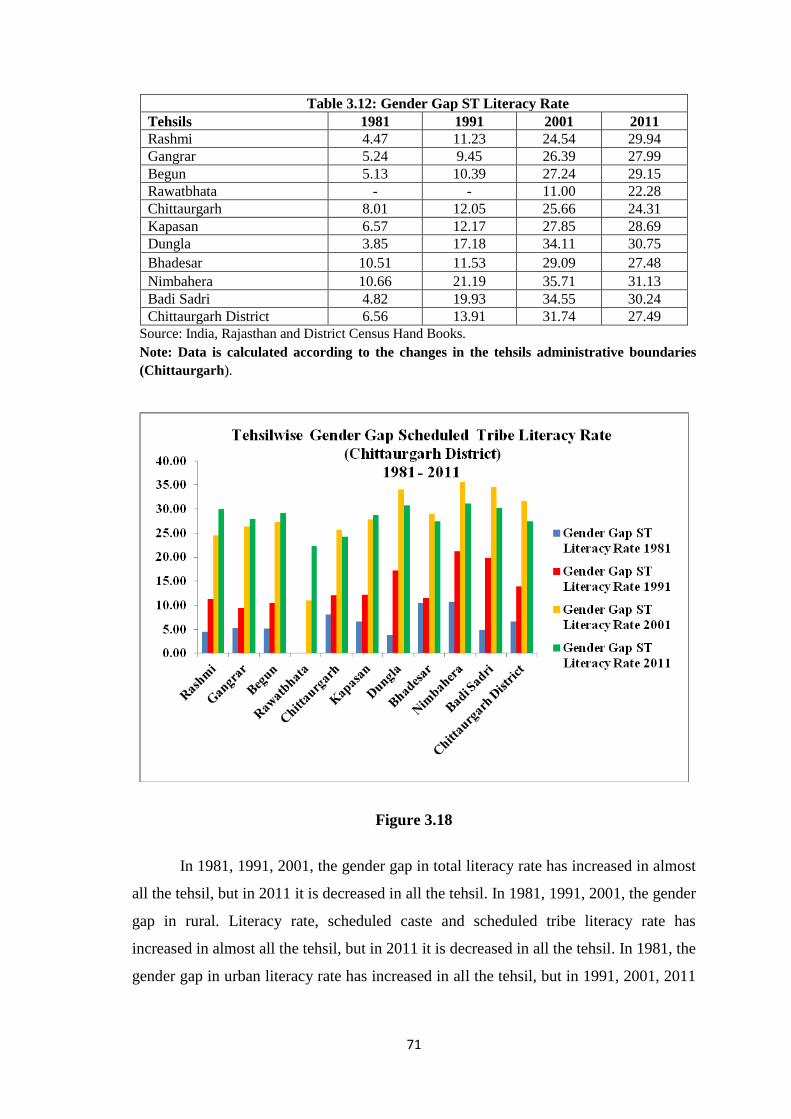
71
Table 3.12: Gender Gap ST Literacy Rate Tehsils 1981 1991 2001 2011 Rashmi 4.47 11.23 24.54 29.94 Gangrar 5.24 9.45 26.39 27.99 Begun 5.13 10.39 27.24 29.15 Rawatbhata - - 11.00 22.28 Chittaurgarh 8.01 12.05 25.66 24.31 Kapasan 6.57 12.17 27.85 28.69 Dungla 3.85 17.18 34.11 30.75 Bhadesar 10.51 11.53 29.09 27.48 Nimbahera 10.66 21.19 35.71 31.13 Badi Sadri 4.82 19.93 34.55 30.24 Chittaurgarh District 6.56 13.91 31.74 27.49
Source: India, Rajasthan and District Census Hand Books. Note: Data is calculated according to the changes in the tehsils administrative boundaries (Chittaurgarh).
Figure 3.18
In 1981, 1991, 2001, the gender gap in total literacy rate has increased in almost
all the tehsil, but in 2011 it is decreased in all the tehsil. In 1981, 1991, 2001, the gender
gap in rural. Literacy rate, scheduled caste and scheduled tribe literacy rate has
increased in almost all the tehsil, but in 2011 it is decreased in all the tehsil. In 1981, the
gender gap in urban literacy rate has increased in all the tehsil, but in 1991, 2001, 2011
72
it is decreased in almost all the tehsil, while there is no positive relationship between
high literacy and low gender gap.
Although the situation that prevailed in 2011 has change and all of the high
literacy tehsil now have a lower gender gap. Recent years, of course, have witnessed a
change in the context of gender gap in literacy. There has been a conspicuous decline in
the gap between male and female literacy rates as the female literacy rates have
increased more rapidly than the male literacy rates. The low gender gap is due to
educational facilities for females, the number of female teachers has also increased
significantly, and the increasing social awakening and increasing male literacy have
stimulated female literacy, better standard of living and as the literacy among females is
becoming a matrimonial necessity.
All graphs show the clear cut picture of the comparison between gender gap of
literacy of Chittaurgarh district. In Chittaurgarh, total rural, scheduled caste and
scheduled tribe literacy gender gap has increase from 1981 to 2001, which shows that
the performance of female literacy was very poor as compared to male literacy in these
decades. In 2011, total, rural, scheduled caste and scheduled tribe literacy gender gap
has decreased due to socio-economic development of the area. Whereas, the urban
gender gap of literacy shows the trend of falling from 2001 to 2011, and then increased
in almost all tehsil from 1981 to 1991.Figure shows the relationship between the total
literacy rates and gender gaps in literacy rates of Chittaurgarh district. Table and figure
clearly shows that there are a strong negative relation between the two variable, total
literacy rates and gender gaps in literacy. With the increasing of total literacy rates,
male - female gaps in literacy are decreasing continuously and vice-versa, which shows
that if it continue then the district literacy gender gap, has decreased in coming decades.
To remove this gap in gender literacy in Chittaurgarh proper educational
opportunities should be provide for women especially in rural areas at village level.
Especially for women, employment opportunities should be created, the importance of
education should be understood by them and their children. Female abuse and eve
teasing should be strictly banned with the due importance of protection of women.
Though for the Right to Education Act, 2009 gender gaps will be reducing continuously
and the district will be development district in coming decades. At last, it may be
73
conducted that this region requires special attention to fill the gap of literacy at gender
level and women empowerment for social revolution in general.
Pattern of Rural-Urban Literacy Rate of the Area
Rural and Urban populations in the Chittaurgarh also display a wide disparity in
respect of literacy rates. The literacy rates of urban population are significantly high in
comparison to those rural populations. The disparity in the literacy rates of rural and
urban populations exists because -
(i) In the primarily agrarian areas literacy has little social and economic functional
value in the countryside and need to get educated is more in urban areas than in
agricultural countryside.
(ii) The urban populations are characterized by relatively high degree of social and
economic awakening in comparison to the rural populations.
(iii) Urban females enjoy relatively higher status in comparison to their rural
compatriots.
(iv) The facilities to get educated are concentrated more in urban areas while these
may be completely absent in certain rural areas.
(v) Those rural males who get educated have a tendency to migrate to urban areas in
search of employment, particularly when there are no avenues in the countryside
outside the agricultural sector.
3.3.8 Pattern of Urban Literacy Rate
All the areas in urban Chittaurgarh recorded literacy rate which was higher than
the State overall literacy percentage. Economic development and literacy of a region are
closely linked. A strong positive correlation has often been observed between the
diffusion of literacy and economic progress. The degree of urbanization, the
development of means of transportation and communication, standard of living, the
degree of spatial interaction and the educational institutions are the factors responsible
for higher literacy rates in urban areas. On the basis of urban literacy rates as shown in
(Table 3.13) the tehsil of Chittaurgarh district has been classified in the following three
categories-
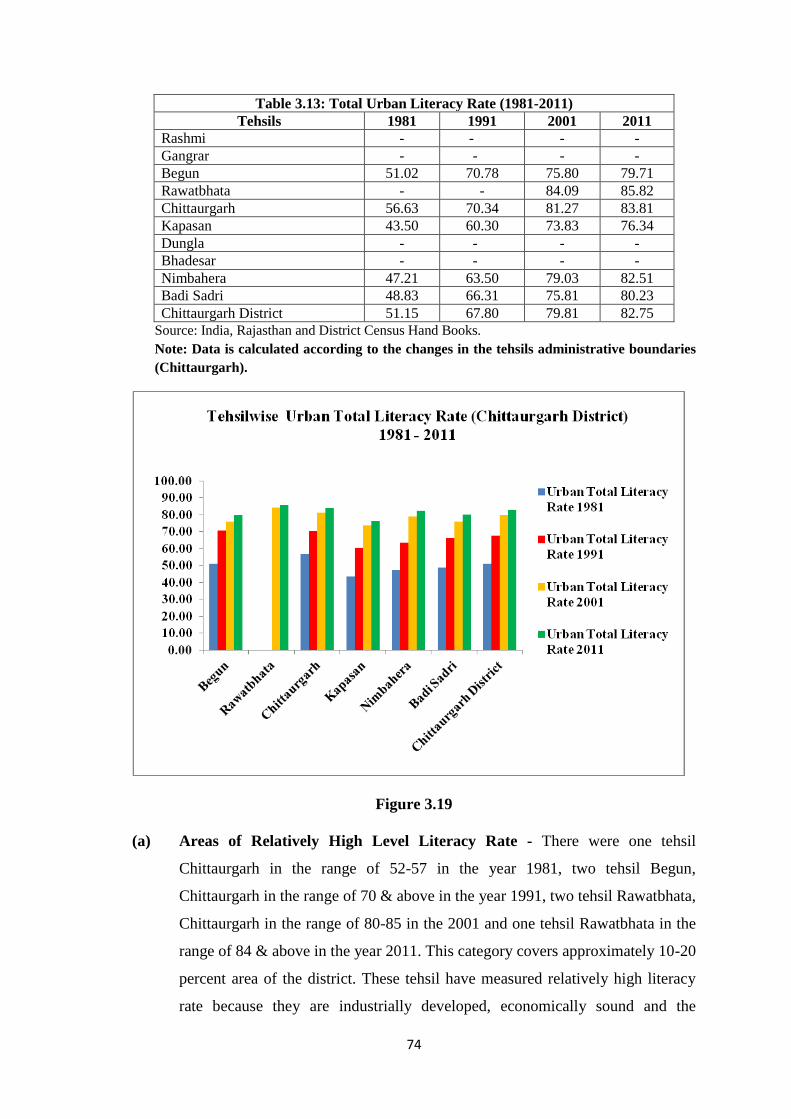
74
Table 3.13: Total Urban Literacy Rate (1981-2011) Tehsils 1981 1991 2001 2011
Rashmi - - - - Gangrar - - - - Begun 51.02 70.78 75.80 79.71 Rawatbhata - - 84.09 85.82 Chittaurgarh 56.63 70.34 81.27 83.81 Kapasan 43.50 60.30 73.83 76.34 Dungla - - - - Bhadesar - - - - Nimbahera 47.21 63.50 79.03 82.51 Badi Sadri 48.83 66.31 75.81 80.23 Chittaurgarh District 51.15 67.80 79.81 82.75
Source: India, Rajasthan and District Census Hand Books. Note: Data is calculated according to the changes in the tehsils administrative boundaries (Chittaurgarh).
Figure 3.19
(a) Areas of Relatively High Level Literacy Rate - There were one tehsil
Chittaurgarh in the range of 52-57 in the year 1981, two tehsil Begun,
Chittaurgarh in the range of 70 & above in the year 1991, two tehsil Rawatbhata,
Chittaurgarh in the range of 80-85 in the 2001 and one tehsil Rawatbhata in the
range of 84 & above in the year 2011. This category covers approximately 10-20
percent area of the district. These tehsil have measured relatively high literacy
rate because they are industrially developed, economically sound and the
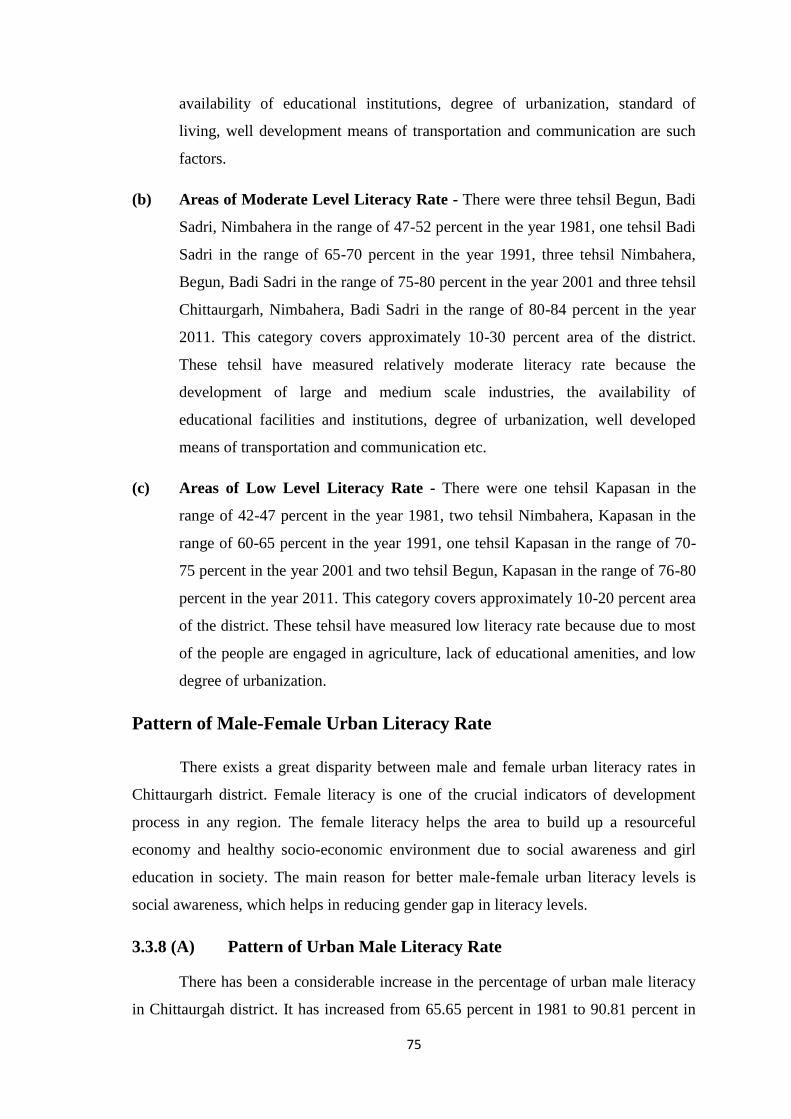
75
availability of educational institutions, degree of urbanization, standard of
living, well development means of transportation and communication are such
factors.
(b) Areas of Moderate Level Literacy Rate - There were three tehsil Begun, Badi
Sadri, Nimbahera in the range of 47-52 percent in the year 1981, one tehsil Badi
Sadri in the range of 65-70 percent in the year 1991, three tehsil Nimbahera,
Begun, Badi Sadri in the range of 75-80 percent in the year 2001 and three tehsil
Chittaurgarh, Nimbahera, Badi Sadri in the range of 80-84 percent in the year
2011. This category covers approximately 10-30 percent area of the district.
These tehsil have measured relatively moderate literacy rate because the
development of large and medium scale industries, the availability of
educational facilities and institutions, degree of urbanization, well developed
means of transportation and communication etc.
(c) Areas of Low Level Literacy Rate - There were one tehsil Kapasan in the
range of 42-47 percent in the year 1981, two tehsil Nimbahera, Kapasan in the
range of 60-65 percent in the year 1991, one tehsil Kapasan in the range of 70-
75 percent in the year 2001 and two tehsil Begun, Kapasan in the range of 76-80
percent in the year 2011. This category covers approximately 10-20 percent area
of the district. These tehsil have measured low literacy rate because due to most
of the people are engaged in agriculture, lack of educational amenities, and low
degree of urbanization.
Pattern of Male-Female Urban Literacy Rate
There exists a great disparity between male and female urban literacy rates in
Chittaurgarh district. Female literacy is one of the crucial indicators of development
process in any region. The female literacy helps the area to build up a resourceful
economy and healthy socio-economic environment due to social awareness and girl
education in society. The main reason for better male-female urban literacy levels is
social awareness, which helps in reducing gender gap in literacy levels.
3.3.8 (A) Pattern of Urban Male Literacy Rate
There has been a considerable increase in the percentage of urban male literacy
in Chittaurgah district. It has increased from 65.65 percent in 1981 to 90.81 percent in
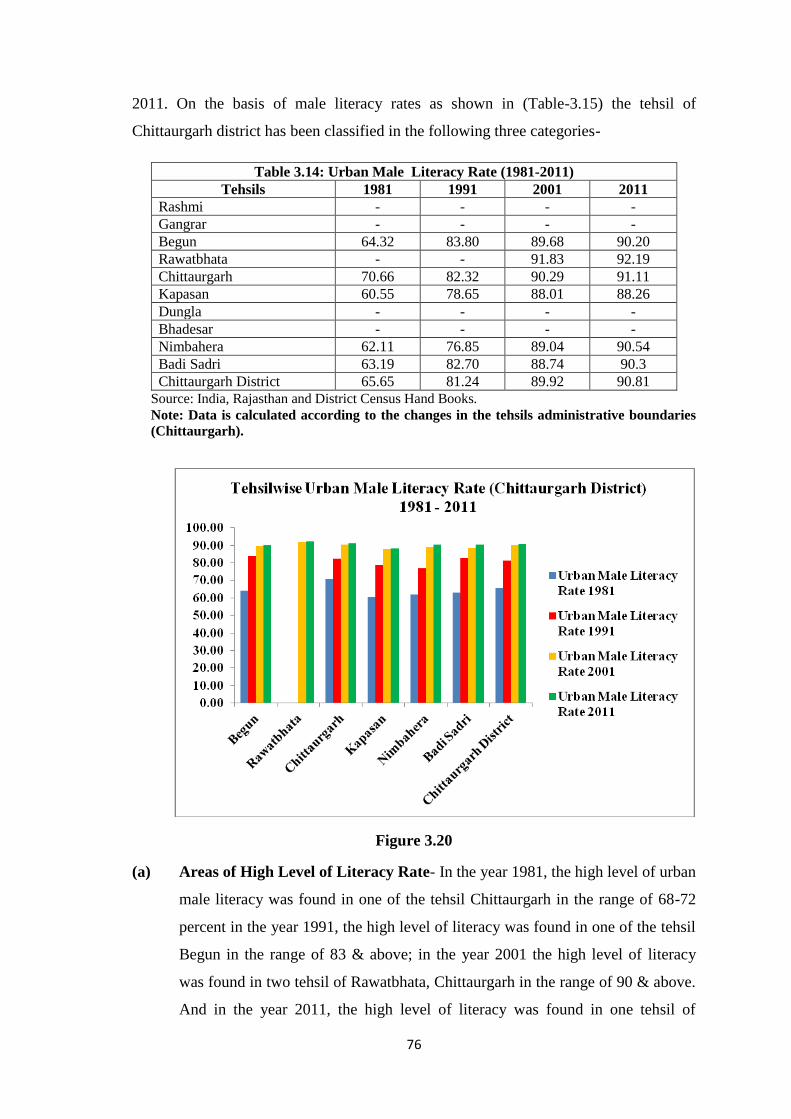
76
2011. On the basis of male literacy rates as shown in (Table-3.15) the tehsil of
Chittaurgarh district has been classified in the following three categories-
Table 3.14: Urban Male Literacy Rate (1981-2011) Tehsils 1981 1991 2001 2011
Rashmi - - - - Gangrar - - - - Begun 64.32 83.80 89.68 90.20 Rawatbhata - - 91.83 92.19 Chittaurgarh 70.66 82.32 90.29 91.11 Kapasan 60.55 78.65 88.01 88.26 Dungla - - - - Bhadesar - - - - Nimbahera 62.11 76.85 89.04 90.54 Badi Sadri 63.19 82.70 88.74 90.3 Chittaurgarh District 65.65 81.24 89.92 90.81
Source: India, Rajasthan and District Census Hand Books. Note: Data is calculated according to the changes in the tehsils administrative boundaries (Chittaurgarh).
Figure 3.20
(a) Areas of High Level of Literacy Rate- In the year 1981, the high level of urban
male literacy was found in one of the tehsil Chittaurgarh in the range of 68-72
percent in the year 1991, the high level of literacy was found in one of the tehsil
Begun in the range of 83 & above; in the year 2001 the high level of literacy
was found in two tehsil of Rawatbhata, Chittaurgarh in the range of 90 & above.
And in the year 2011, the high level of literacy was found in one tehsil of
77
Chittaurgarh in the range of 92-94 percent. This category covers approximately
10-20 percent area of the district.
(b) Areas of Moderate Level of Literacy Rate- In the year 1981, the moderate
level of urban male literacy was found in one of tehsil Begun in the range of 64-
68 percent; in the year 1991 the moderate level of literacy was found in two
tehsil of Badi Sadri, Chittaurgarh in the range of 79-83 percent; in the year 2001,
the moderate level of literacy was found in two tehsil of Begun, Nimbahera in
the range of 89-90 percent. And in the year 2011, the moderate level of literacy
was found in four tehsil of Chittaurgarh, Nimbahera, Badi Sadri, and Begun in
the range of 90-92 percent. This category covers approximately 10-40 percent
area of the district.
(c) Areas of Low Level of Literacy Rate - In the year 1981, the low level of urban
male literacy was found in three tehsil of Kapasan, Nimbahera, and Badi Sadri
in the range of 60-64 percent. In the year 1991, the low level of literacy rate was
found in two tehsil Nimbahera, Kapasan in the range of 75-79 percent. In the
year 2001, the low level of literacy rate was found in two tehsil of Kapasan,
Badi Sadri in the range of 88-89 percent. And in the year 2011, the low level of
literacy rate was found in one tehsil of Kapasan in the range of 88-90 percent.
This category covers approximately 20-22 percent area of the district.
3.3.8 (B) Pattern of Urban Female Literacy Rate
There has been a considerable increase in the percentage of urban female
literacy in Chittaurgarh district, which was higher than the State urban female literacy
percentage. But urban female literacy rate was found to be low as compared to male
literacy. On the basis of urban female literacy rates as shown in (Table 3.15) the tehsil
of Chittaurgarh district has been classified in the following three categories –
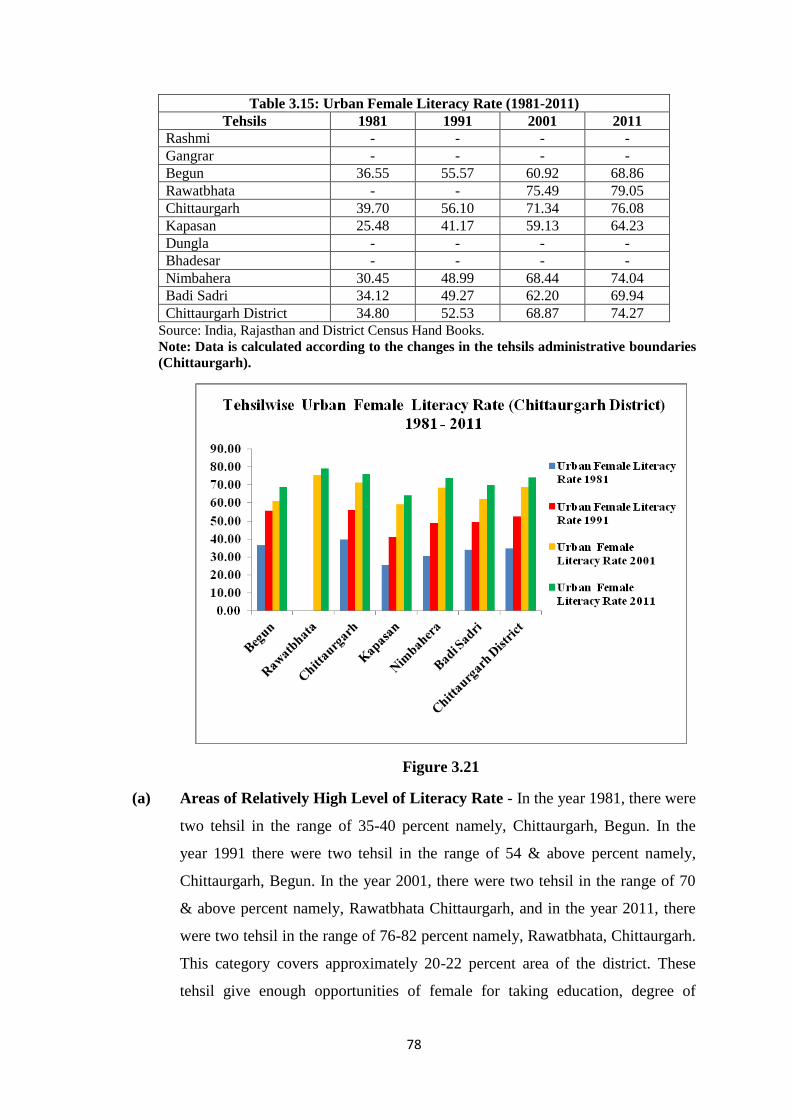
78
Table 3.15: Urban Female Literacy Rate (1981-2011) Tehsils 1981 1991 2001 2011
Rashmi - - - - Gangrar - - - - Begun 36.55 55.57 60.92 68.86 Rawatbhata - - 75.49 79.05 Chittaurgarh 39.70 56.10 71.34 76.08 Kapasan 25.48 41.17 59.13 64.23 Dungla - - - - Bhadesar - - - - Nimbahera 30.45 48.99 68.44 74.04 Badi Sadri 34.12 49.27 62.20 69.94 Chittaurgarh District 34.80 52.53 68.87 74.27
Source: India, Rajasthan and District Census Hand Books. Note: Data is calculated according to the changes in the tehsils administrative boundaries (Chittaurgarh).
Figure 3.21
(a) Areas of Relatively High Level of Literacy Rate - In the year 1981, there were
two tehsil in the range of 35-40 percent namely, Chittaurgarh, Begun. In the
year 1991 there were two tehsil in the range of 54 & above percent namely,
Chittaurgarh, Begun. In the year 2001, there were two tehsil in the range of 70
& above percent namely, Rawatbhata Chittaurgarh, and in the year 2011, there
were two tehsil in the range of 76-82 percent namely, Rawatbhata, Chittaurgarh.
This category covers approximately 20-22 percent area of the district. These
tehsil give enough opportunities of female for taking education, degree of
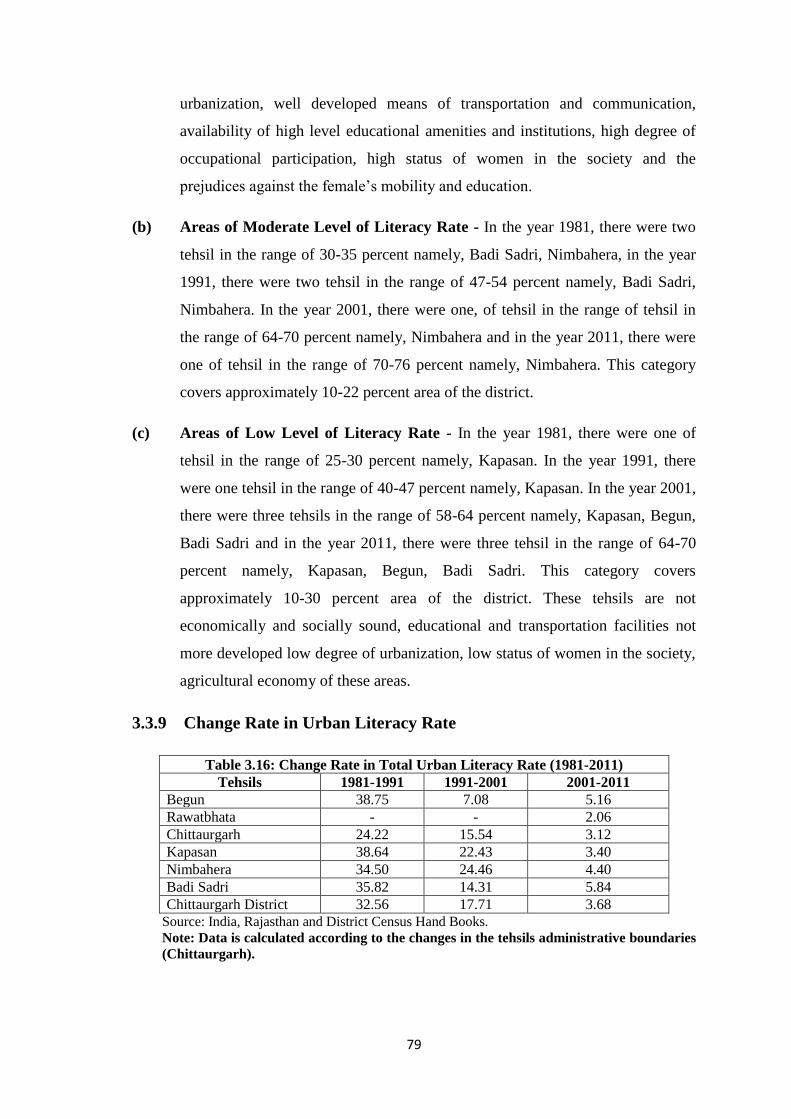
79
urbanization, well developed means of transportation and communication,
availability of high level educational amenities and institutions, high degree of
occupational participation, high status of women in the society and the
prejudices against the female‟s mobility and education.
(b) Areas of Moderate Level of Literacy Rate - In the year 1981, there were two
tehsil in the range of 30-35 percent namely, Badi Sadri, Nimbahera, in the year
1991, there were two tehsil in the range of 47-54 percent namely, Badi Sadri,
Nimbahera. In the year 2001, there were one, of tehsil in the range of tehsil in
the range of 64-70 percent namely, Nimbahera and in the year 2011, there were
one of tehsil in the range of 70-76 percent namely, Nimbahera. This category
covers approximately 10-22 percent area of the district.
(c) Areas of Low Level of Literacy Rate - In the year 1981, there were one of
tehsil in the range of 25-30 percent namely, Kapasan. In the year 1991, there
were one tehsil in the range of 40-47 percent namely, Kapasan. In the year 2001,
there were three tehsils in the range of 58-64 percent namely, Kapasan, Begun,
Badi Sadri and in the year 2011, there were three tehsil in the range of 64-70
percent namely, Kapasan, Begun, Badi Sadri. This category covers
approximately 10-30 percent area of the district. These tehsils are not
economically and socially sound, educational and transportation facilities not
more developed low degree of urbanization, low status of women in the society,
agricultural economy of these areas.
3.3.9 Change Rate in Urban Literacy Rate
Table 3.16: Change Rate in Total Urban Literacy Rate (1981-2011) Tehsils 1981-1991 1991-2001 2001-2011
Begun 38.75 7.08 5.16 Rawatbhata - - 2.06 Chittaurgarh 24.22 15.54 3.12 Kapasan 38.64 22.43 3.40 Nimbahera 34.50 24.46 4.40 Badi Sadri 35.82 14.31 5.84 Chittaurgarh District 32.56 17.71 3.68
Source: India, Rajasthan and District Census Hand Books. Note: Data is calculated according to the changes in the tehsils administrative boundaries (Chittaurgarh).
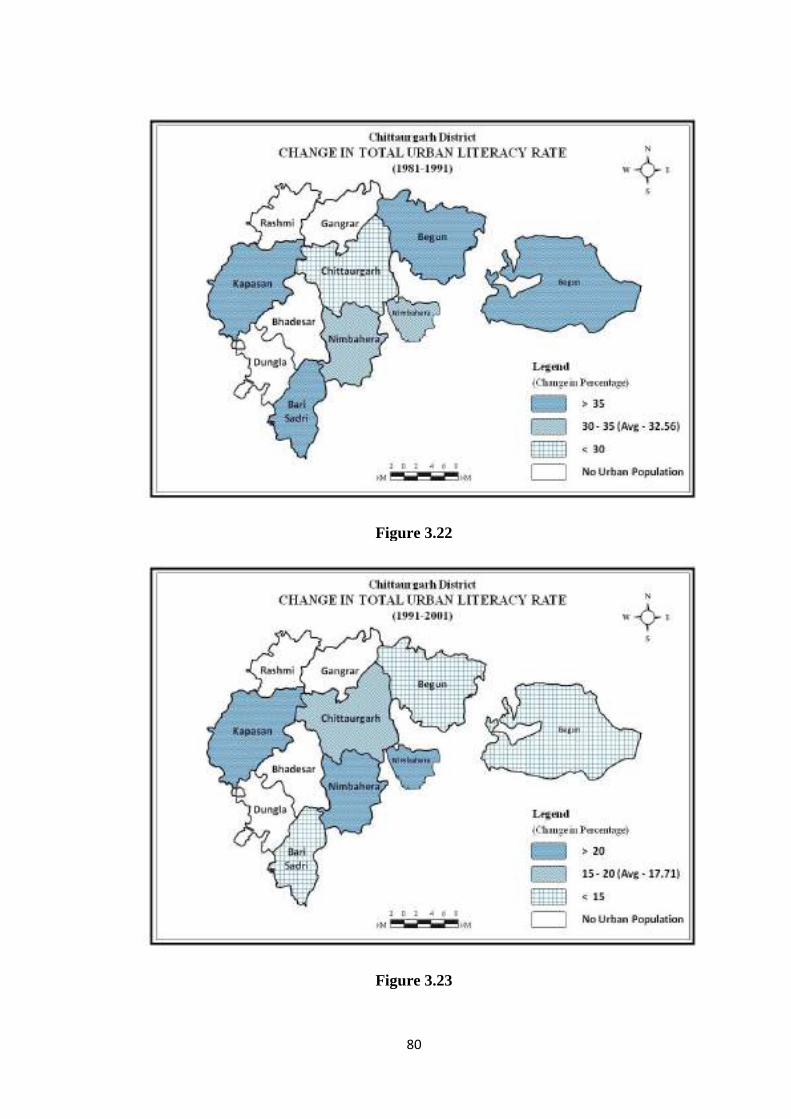
80
Figure 3.22
Figure 3.23
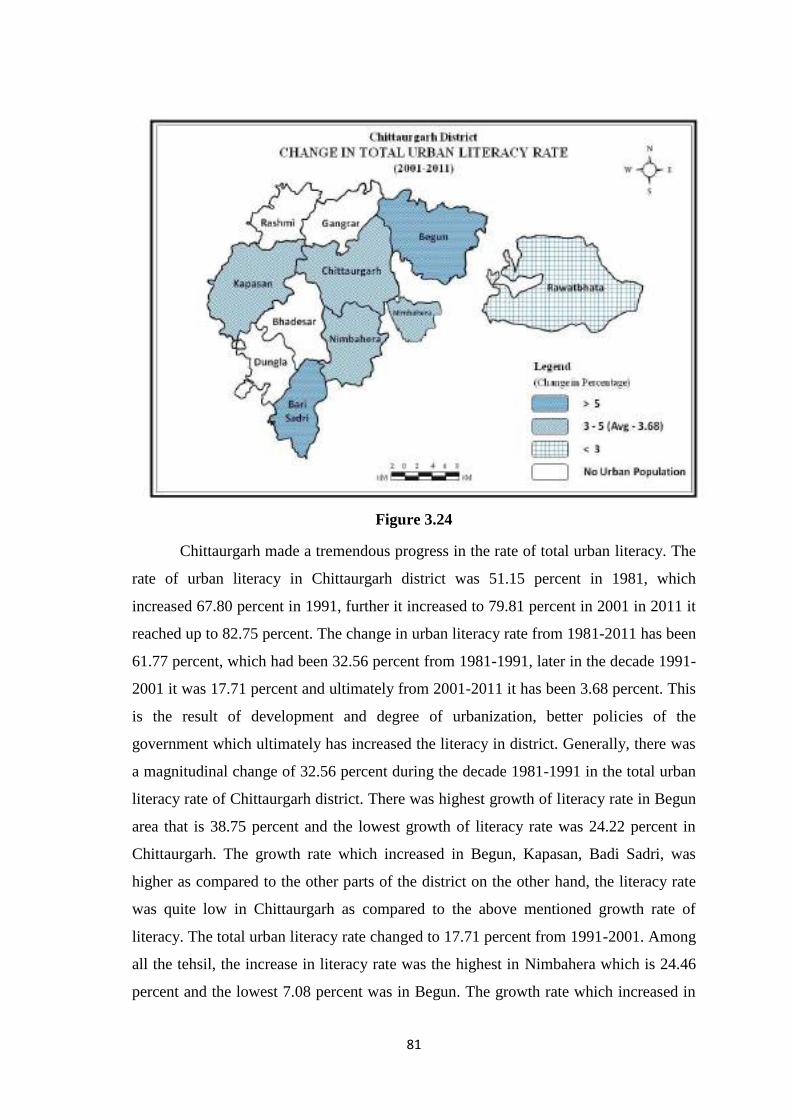
81
Figure 3.24
Chittaurgarh made a tremendous progress in the rate of total urban literacy. The
rate of urban literacy in Chittaurgarh district was 51.15 percent in 1981, which
increased 67.80 percent in 1991, further it increased to 79.81 percent in 2001 in 2011 it
reached up to 82.75 percent. The change in urban literacy rate from 1981-2011 has been
61.77 percent, which had been 32.56 percent from 1981-1991, later in the decade 1991-
2001 it was 17.71 percent and ultimately from 2001-2011 it has been 3.68 percent. This
is the result of development and degree of urbanization, better policies of the
government which ultimately has increased the literacy in district. Generally, there was
a magnitudinal change of 32.56 percent during the decade 1981-1991 in the total urban
literacy rate of Chittaurgarh district. There was highest growth of literacy rate in Begun
area that is 38.75 percent and the lowest growth of literacy rate was 24.22 percent in
Chittaurgarh. The growth rate which increased in Begun, Kapasan, Badi Sadri, was
higher as compared to the other parts of the district on the other hand, the literacy rate
was quite low in Chittaurgarh as compared to the above mentioned growth rate of
literacy. The total urban literacy rate changed to 17.71 percent from 1991-2001. Among
all the tehsil, the increase in literacy rate was the highest in Nimbahera which is 24.46
percent and the lowest 7.08 percent was in Begun. The growth rate which increased in
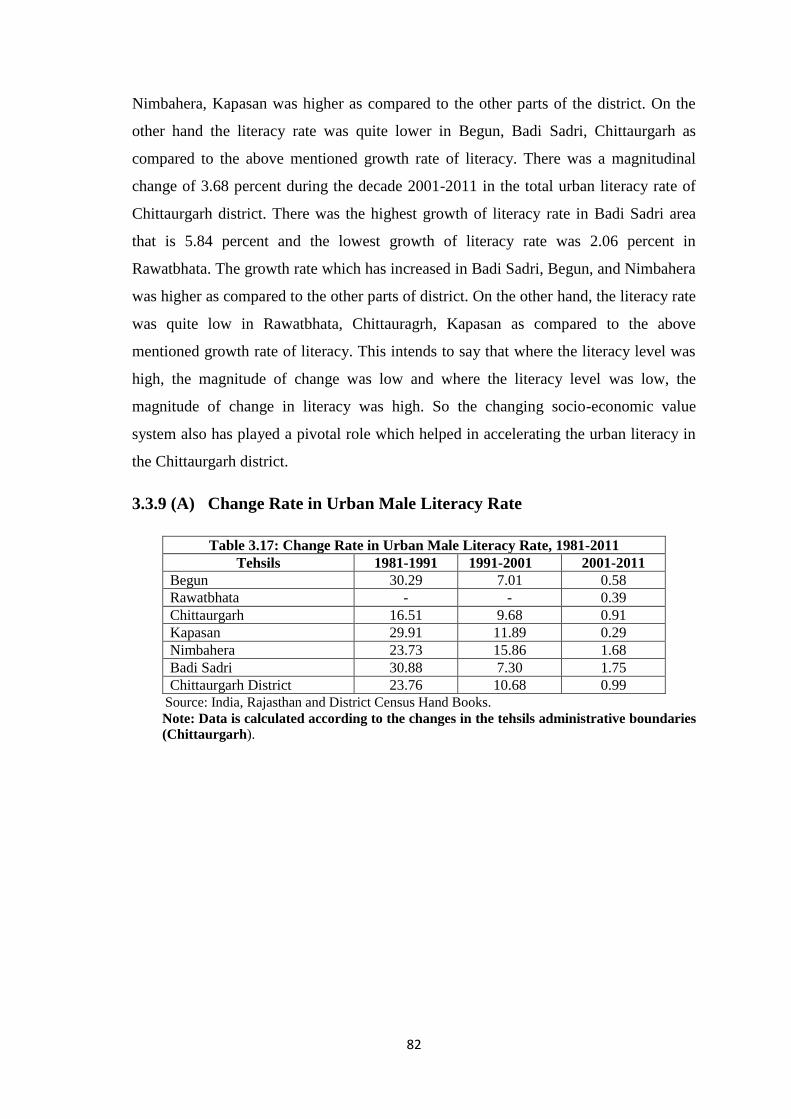
82
Nimbahera, Kapasan was higher as compared to the other parts of the district. On the
other hand the literacy rate was quite lower in Begun, Badi Sadri, Chittaurgarh as
compared to the above mentioned growth rate of literacy. There was a magnitudinal
change of 3.68 percent during the decade 2001-2011 in the total urban literacy rate of
Chittaurgarh district. There was the highest growth of literacy rate in Badi Sadri area
that is 5.84 percent and the lowest growth of literacy rate was 2.06 percent in
Rawatbhata. The growth rate which has increased in Badi Sadri, Begun, and Nimbahera
was higher as compared to the other parts of district. On the other hand, the literacy rate
was quite low in Rawatbhata, Chittauragrh, Kapasan as compared to the above
mentioned growth rate of literacy. This intends to say that where the literacy level was
high, the magnitude of change was low and where the literacy level was low, the
magnitude of change in literacy was high. So the changing socio-economic value
system also has played a pivotal role which helped in accelerating the urban literacy in
the Chittaurgarh district.
3.3.9 (A) Change Rate in Urban Male Literacy Rate
Table 3.17: Change Rate in Urban Male Literacy Rate, 1981-2011 Tehsils 1981-1991 1991-2001 2001-2011
Begun 30.29 7.01 0.58 Rawatbhata - - 0.39 Chittaurgarh 16.51 9.68 0.91 Kapasan 29.91 11.89 0.29 Nimbahera 23.73 15.86 1.68 Badi Sadri 30.88 7.30 1.75 Chittaurgarh District 23.76 10.68 0.99
Source: India, Rajasthan and District Census Hand Books. Note: Data is calculated according to the changes in the tehsils administrative boundaries (Chittaurgarh).
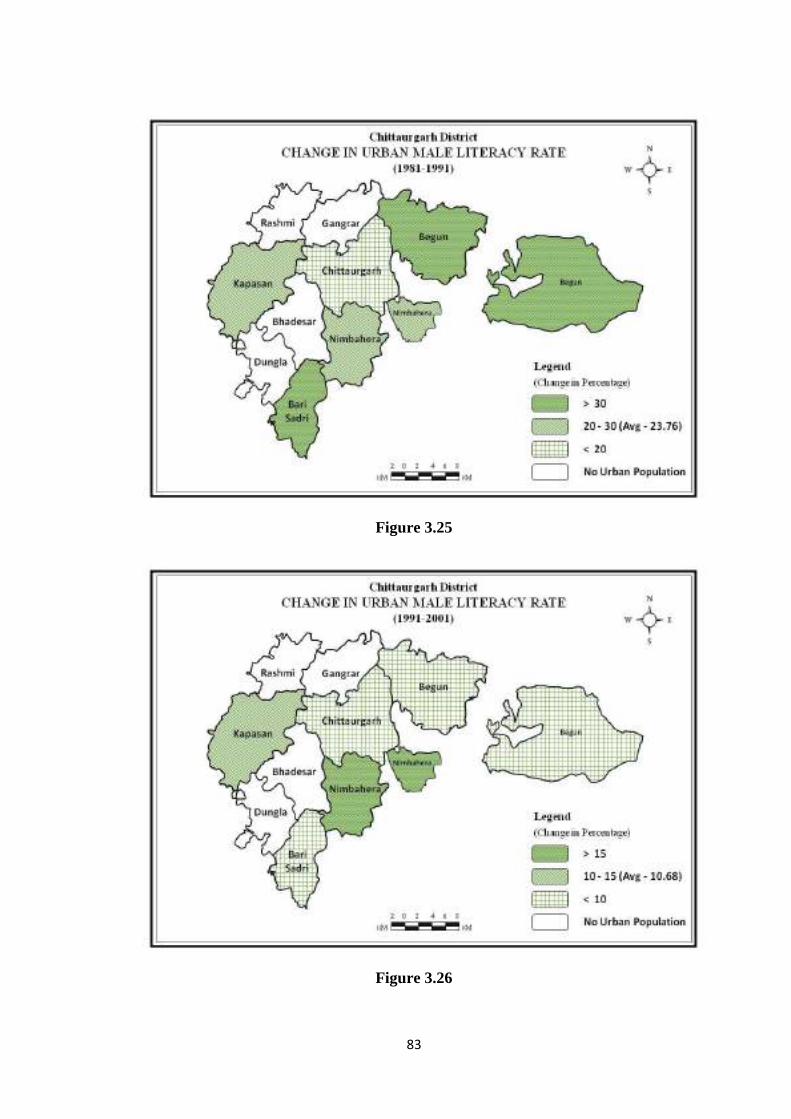
83
Figure 3.25
Figure 3.26
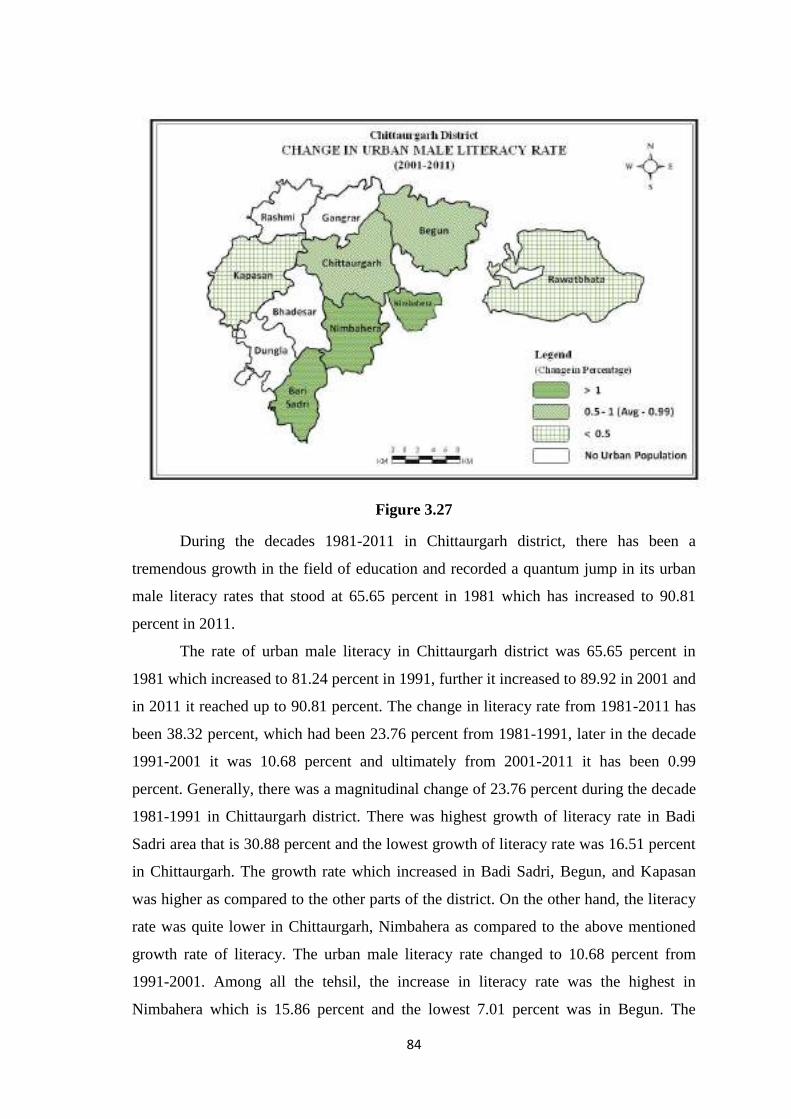
84
Figure 3.27
During the decades 1981-2011 in Chittaurgarh district, there has been a
tremendous growth in the field of education and recorded a quantum jump in its urban
male literacy rates that stood at 65.65 percent in 1981 which has increased to 90.81
percent in 2011.
The rate of urban male literacy in Chittaurgarh district was 65.65 percent in
1981 which increased to 81.24 percent in 1991, further it increased to 89.92 in 2001 and
in 2011 it reached up to 90.81 percent. The change in literacy rate from 1981-2011 has
been 38.32 percent, which had been 23.76 percent from 1981-1991, later in the decade
1991-2001 it was 10.68 percent and ultimately from 2001-2011 it has been 0.99
percent. Generally, there was a magnitudinal change of 23.76 percent during the decade
1981-1991 in Chittaurgarh district. There was highest growth of literacy rate in Badi
Sadri area that is 30.88 percent and the lowest growth of literacy rate was 16.51 percent
in Chittaurgarh. The growth rate which increased in Badi Sadri, Begun, and Kapasan
was higher as compared to the other parts of the district. On the other hand, the literacy
rate was quite lower in Chittaurgarh, Nimbahera as compared to the above mentioned
growth rate of literacy. The urban male literacy rate changed to 10.68 percent from
1991-2001. Among all the tehsil, the increase in literacy rate was the highest in
Nimbahera which is 15.86 percent and the lowest 7.01 percent was in Begun. The
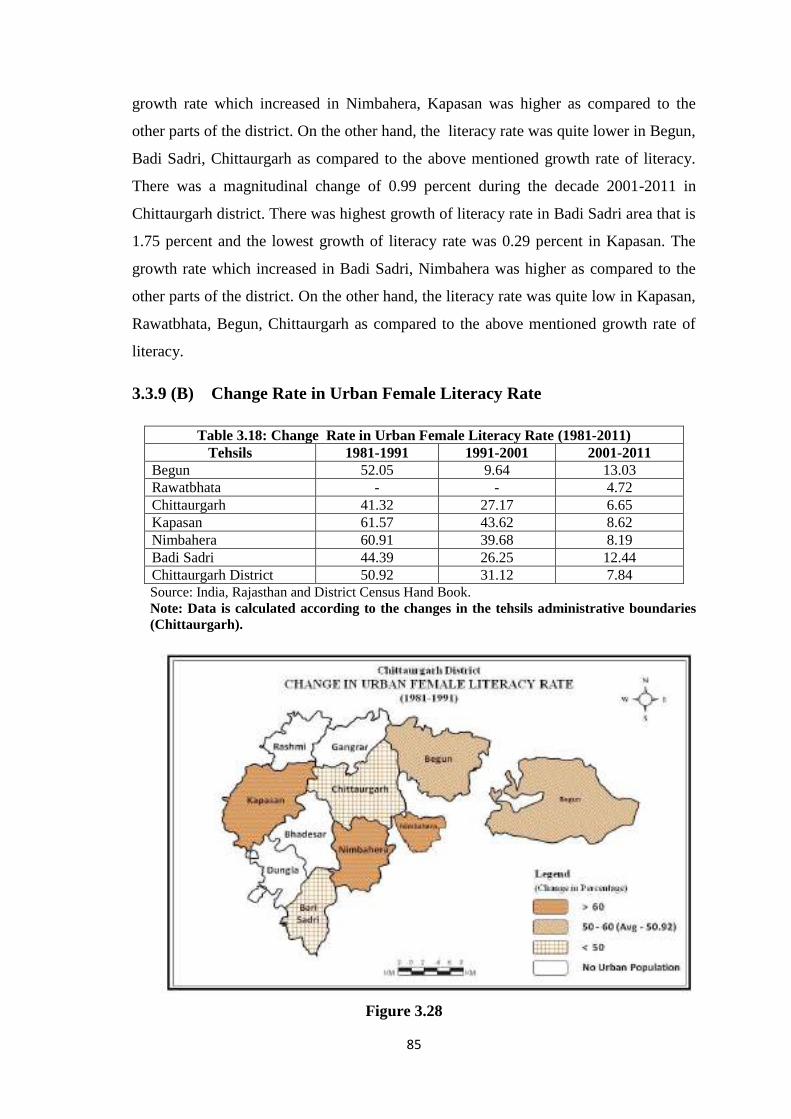
85
growth rate which increased in Nimbahera, Kapasan was higher as compared to the
other parts of the district. On the other hand, the literacy rate was quite lower in Begun,
Badi Sadri, Chittaurgarh as compared to the above mentioned growth rate of literacy.
There was a magnitudinal change of 0.99 percent during the decade 2001-2011 in
Chittaurgarh district. There was highest growth of literacy rate in Badi Sadri area that is
1.75 percent and the lowest growth of literacy rate was 0.29 percent in Kapasan. The
growth rate which increased in Badi Sadri, Nimbahera was higher as compared to the
other parts of the district. On the other hand, the literacy rate was quite low in Kapasan,
Rawatbhata, Begun, Chittaurgarh as compared to the above mentioned growth rate of
literacy.
3.3.9 (B) Change Rate in Urban Female Literacy Rate
Table 3.18: Change Rate in Urban Female Literacy Rate (1981-2011) Tehsils 1981-1991 1991-2001 2001-2011
Begun 52.05 9.64 13.03 Rawatbhata - - 4.72 Chittaurgarh 41.32 27.17 6.65 Kapasan 61.57 43.62 8.62 Nimbahera 60.91 39.68 8.19 Badi Sadri 44.39 26.25 12.44 Chittaurgarh District 50.92 31.12 7.84 Source: India, Rajasthan and District Census Hand Book. Note: Data is calculated according to the changes in the tehsils administrative boundaries (Chittaurgarh).
Figure 3.28
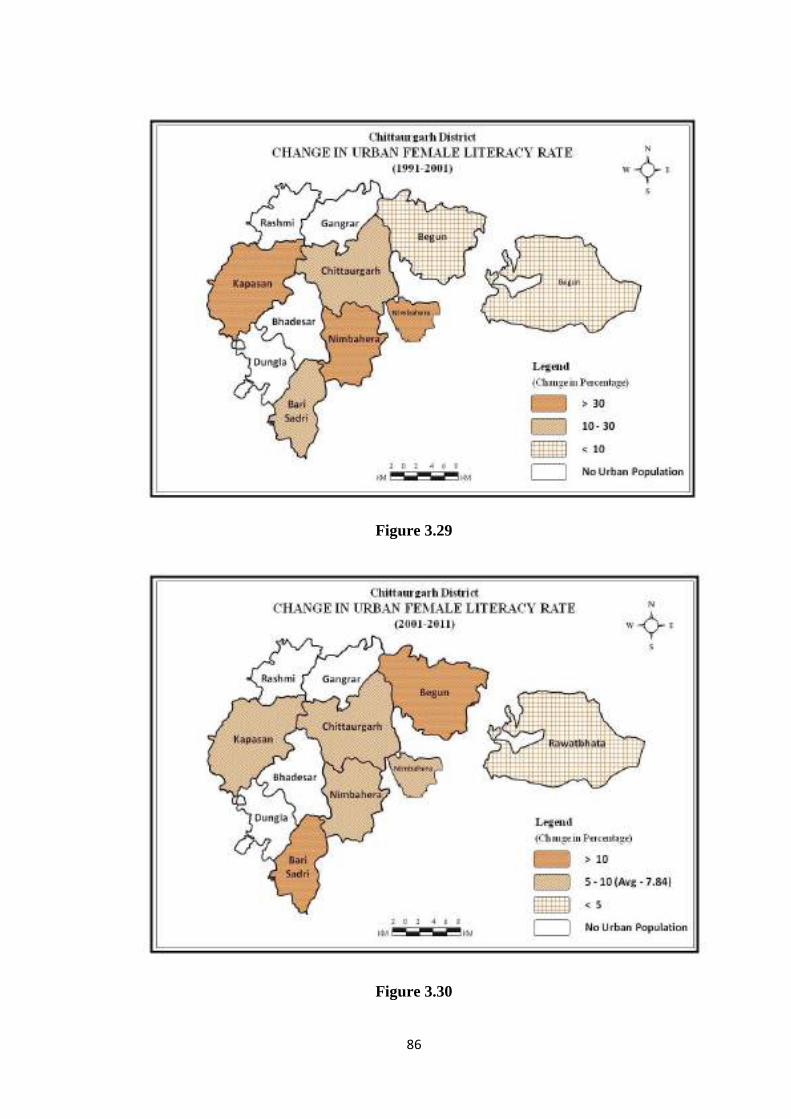
86
Figure 3.29
Figure 3.30
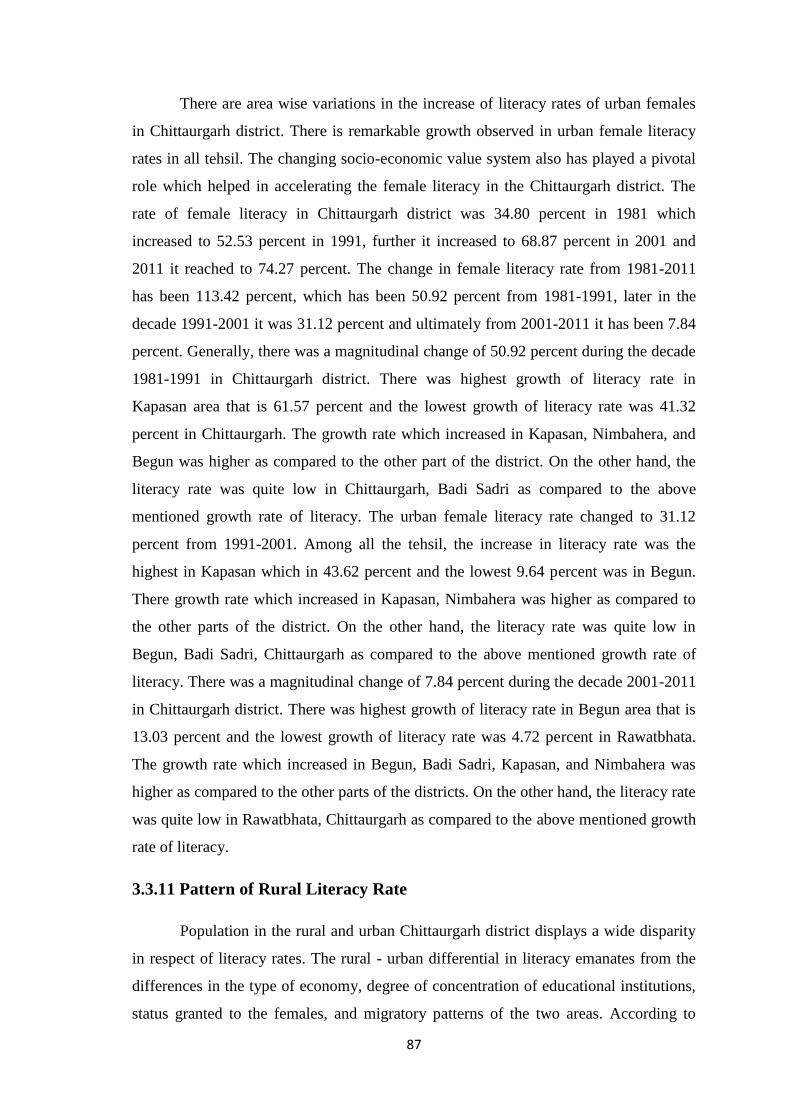
87
There are area wise variations in the increase of literacy rates of urban females
in Chittaurgarh district. There is remarkable growth observed in urban female literacy
rates in all tehsil. The changing socio-economic value system also has played a pivotal
role which helped in accelerating the female literacy in the Chittaurgarh district. The
rate of female literacy in Chittaurgarh district was 34.80 percent in 1981 which
increased to 52.53 percent in 1991, further it increased to 68.87 percent in 2001 and
2011 it reached to 74.27 percent. The change in female literacy rate from 1981-2011
has been 113.42 percent, which has been 50.92 percent from 1981-1991, later in the
decade 1991-2001 it was 31.12 percent and ultimately from 2001-2011 it has been 7.84
percent. Generally, there was a magnitudinal change of 50.92 percent during the decade
1981-1991 in Chittaurgarh district. There was highest growth of literacy rate in
Kapasan area that is 61.57 percent and the lowest growth of literacy rate was 41.32
percent in Chittaurgarh. The growth rate which increased in Kapasan, Nimbahera, and
Begun was higher as compared to the other part of the district. On the other hand, the
literacy rate was quite low in Chittaurgarh, Badi Sadri as compared to the above
mentioned growth rate of literacy. The urban female literacy rate changed to 31.12
percent from 1991-2001. Among all the tehsil, the increase in literacy rate was the
highest in Kapasan which in 43.62 percent and the lowest 9.64 percent was in Begun.
There growth rate which increased in Kapasan, Nimbahera was higher as compared to
the other parts of the district. On the other hand, the literacy rate was quite low in
Begun, Badi Sadri, Chittaurgarh as compared to the above mentioned growth rate of
literacy. There was a magnitudinal change of 7.84 percent during the decade 2001-2011
in Chittaurgarh district. There was highest growth of literacy rate in Begun area that is
13.03 percent and the lowest growth of literacy rate was 4.72 percent in Rawatbhata.
The growth rate which increased in Begun, Badi Sadri, Kapasan, and Nimbahera was
higher as compared to the other parts of the districts. On the other hand, the literacy rate
was quite low in Rawatbhata, Chittaurgarh as compared to the above mentioned growth
rate of literacy.
3.3.11 Pattern of Rural Literacy Rate
Population in the rural and urban Chittaurgarh district displays a wide disparity
in respect of literacy rates. The rural - urban differential in literacy emanates from the
differences in the type of economy, degree of concentration of educational institutions,
status granted to the females, and migratory patterns of the two areas. According to
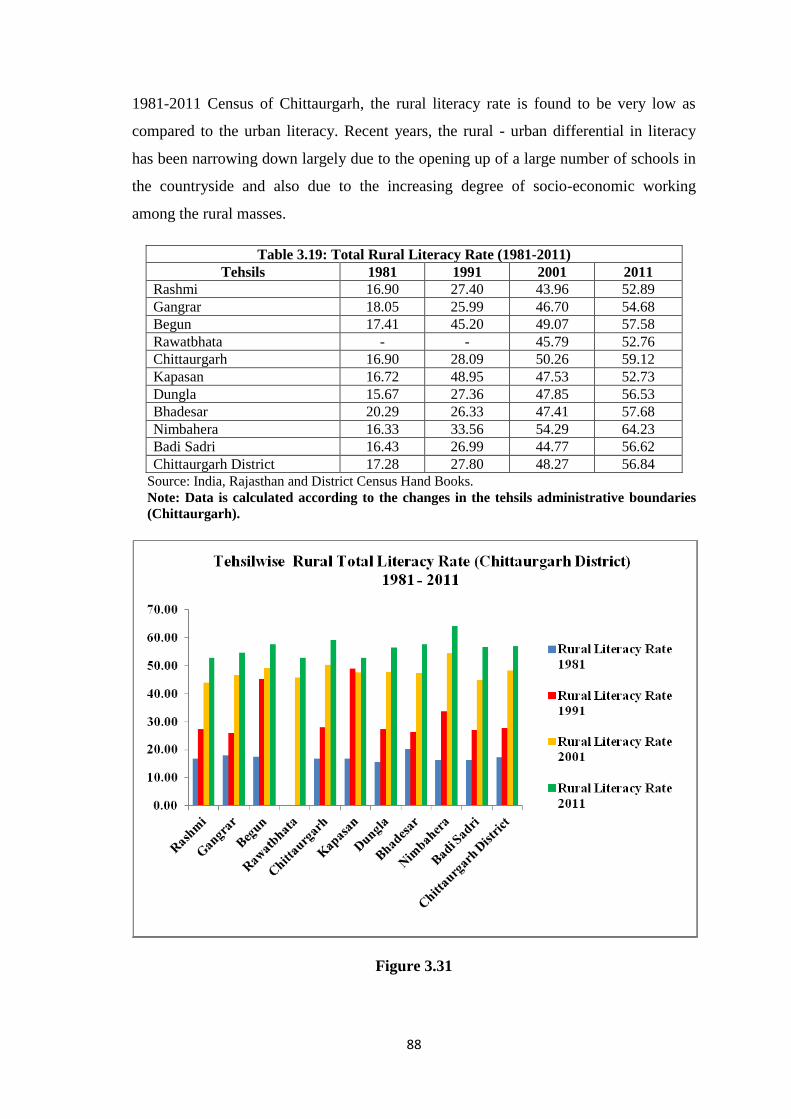
88
1981-2011 Census of Chittaurgarh, the rural literacy rate is found to be very low as
compared to the urban literacy. Recent years, the rural - urban differential in literacy
has been narrowing down largely due to the opening up of a large number of schools in
the countryside and also due to the increasing degree of socio-economic working
among the rural masses.
Table 3.19: Total Rural Literacy Rate (1981-2011) Tehsils 1981 1991 2001 2011
Rashmi 16.90 27.40 43.96 52.89 Gangrar 18.05 25.99 46.70 54.68 Begun 17.41 45.20 49.07 57.58 Rawatbhata - - 45.79 52.76 Chittaurgarh 16.90 28.09 50.26 59.12 Kapasan 16.72 48.95 47.53 52.73 Dungla 15.67 27.36 47.85 56.53 Bhadesar 20.29 26.33 47.41 57.68 Nimbahera 16.33 33.56 54.29 64.23 Badi Sadri 16.43 26.99 44.77 56.62 Chittaurgarh District 17.28 27.80 48.27 56.84
Source: India, Rajasthan and District Census Hand Books. Note: Data is calculated according to the changes in the tehsils administrative boundaries (Chittaurgarh).
Figure 3.31
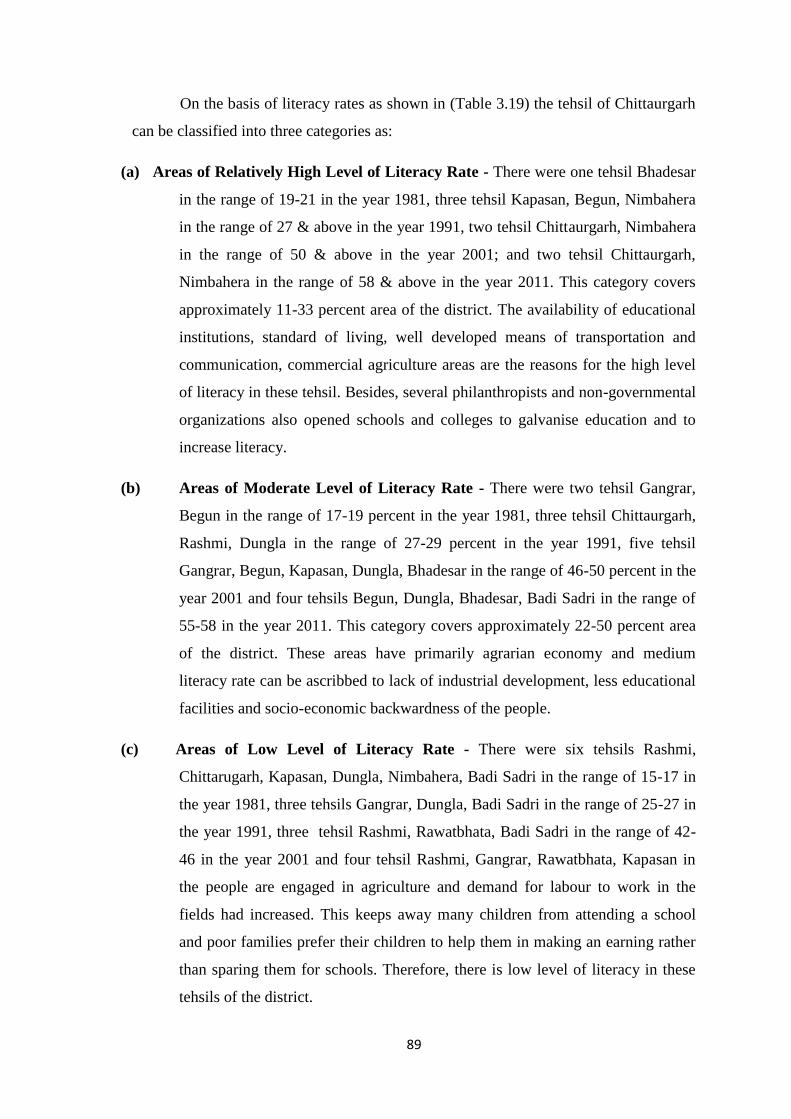
89
On the basis of literacy rates as shown in (Table 3.19) the tehsil of Chittaurgarh
can be classified into three categories as:
(a) Areas of Relatively High Level of Literacy Rate - There were one tehsil Bhadesar
in the range of 19-21 in the year 1981, three tehsil Kapasan, Begun, Nimbahera
in the range of 27 & above in the year 1991, two tehsil Chittaurgarh, Nimbahera
in the range of 50 & above in the year 2001; and two tehsil Chittaurgarh,
Nimbahera in the range of 58 & above in the year 2011. This category covers
approximately 11-33 percent area of the district. The availability of educational
institutions, standard of living, well developed means of transportation and
communication, commercial agriculture areas are the reasons for the high level
of literacy in these tehsil. Besides, several philanthropists and non-governmental
organizations also opened schools and colleges to galvanise education and to
increase literacy.
(b) Areas of Moderate Level of Literacy Rate - There were two tehsil Gangrar,
Begun in the range of 17-19 percent in the year 1981, three tehsil Chittaurgarh,
Rashmi, Dungla in the range of 27-29 percent in the year 1991, five tehsil
Gangrar, Begun, Kapasan, Dungla, Bhadesar in the range of 46-50 percent in the
year 2001 and four tehsils Begun, Dungla, Bhadesar, Badi Sadri in the range of
55-58 in the year 2011. This category covers approximately 22-50 percent area
of the district. These areas have primarily agrarian economy and medium
literacy rate can be ascribbed to lack of industrial development, less educational
facilities and socio-economic backwardness of the people.
(c) Areas of Low Level of Literacy Rate - There were six tehsils Rashmi,
Chittarugarh, Kapasan, Dungla, Nimbahera, Badi Sadri in the range of 15-17 in
the year 1981, three tehsils Gangrar, Dungla, Badi Sadri in the range of 25-27 in
the year 1991, three tehsil Rashmi, Rawatbhata, Badi Sadri in the range of 42-
46 in the year 2001 and four tehsil Rashmi, Gangrar, Rawatbhata, Kapasan in
the people are engaged in agriculture and demand for labour to work in the
fields had increased. This keeps away many children from attending a school
and poor families prefer their children to help them in making an earning rather
than sparing them for schools. Therefore, there is low level of literacy in these
tehsils of the district.
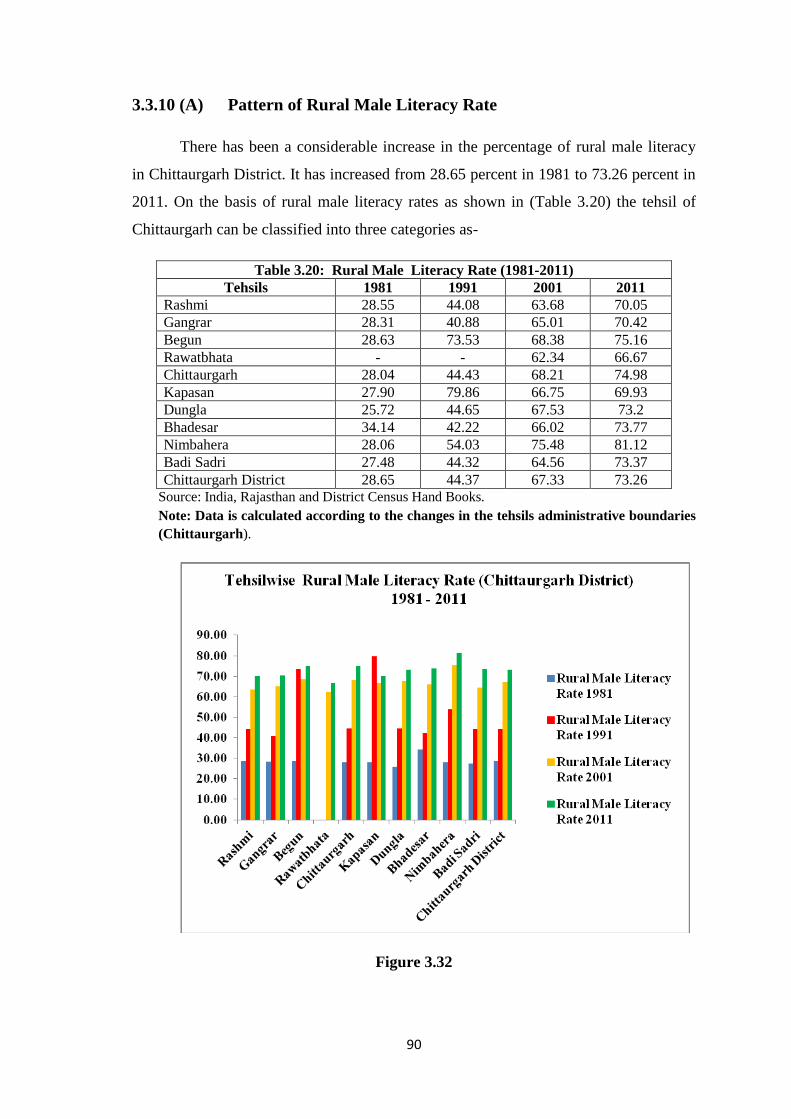
90
3.3.10 (A) Pattern of Rural Male Literacy Rate
There has been a considerable increase in the percentage of rural male literacy
in Chittaurgarh District. It has increased from 28.65 percent in 1981 to 73.26 percent in
2011. On the basis of rural male literacy rates as shown in (Table 3.20) the tehsil of
Chittaurgarh can be classified into three categories as-
Table 3.20: Rural Male Literacy Rate (1981-2011) Tehsils 1981 1991 2001 2011
Rashmi 28.55 44.08 63.68 70.05 Gangrar 28.31 40.88 65.01 70.42 Begun 28.63 73.53 68.38 75.16 Rawatbhata - - 62.34 66.67 Chittaurgarh 28.04 44.43 68.21 74.98 Kapasan 27.90 79.86 66.75 69.93 Dungla 25.72 44.65 67.53 73.2 Bhadesar 34.14 42.22 66.02 73.77 Nimbahera 28.06 54.03 75.48 81.12 Badi Sadri 27.48 44.32 64.56 73.37 Chittaurgarh District 28.65 44.37 67.33 73.26
Source: India, Rajasthan and District Census Hand Books. Note: Data is calculated according to the changes in the tehsils administrative boundaries (Chittaurgarh).
Figure 3.32
91
(a) Areas of Relatively High Level of Literacy Rate - In the year 1981, the high
level of rural male literacy was found in one of the tehsil Bhadesar in the range
of 31 & above; In the year 1991, the high level of literacy was found in three
tehsils of Kapasan (79.86%), Begun (73.53%) and Nimbahera (54.03%) in the
year 2001, the high level of literacy was found in one of the tehsils Nimbahera
in the range of 70 & above. And in the year 2011, the high level of literacy was
found in two tehsils of Nimbahera, Begun in the range of 75 & above. This
category covers approximately 11-33 percent area of the district.
(b) Areas of Moderate Level of Literacy Rate - In the year 1981 the moderate
level of rural male literacy was found in five tehsils of Rashmi, Begun, Gangrar,
Chittaurgarh, Nimbahera, in the range of 28-31 percent ; In the year 1991, the
moderate level of rural male literacy was found in four tehsils of Rashmi,
Chittaurgarh. Dungla, Badi Sadri in the range of 44-48 percent; In the Year 2001,
the moderate level of literacy was found in six tehsils of Gangrar, Begun,
Chittaurgarh, Kapasan, Dungla, and Bhadesar or in the range of 65-70 percent.
And in the year 2011, the moderate level of literacy was found in six tehsil of
Rashmi, Gangrar, Chittaurgarh, Dungla, Bhadesar, and Badi Sadri in the range of
70-75 percent. This category covers approximately 55-60 percent area of the
district.
(c) Areas of Low Level of Literacy Rate - In the year 1981, the low level of rural
male literacy was found in the range of 25-28 percent. In the year 1991, the low
level of literacy was found in two tehsil of Gangrar, Bhadesar in the range of 40-
44 percent; in the year 2001, the low level of literacy was found in three tehsil of
Rashmi, Rawatbhata and Badi Sadri in the range of 60-65 percent. And in the
year 2011 the low level of literacy was found in two tehsil of Rawatbhata,
Kapasan in the range of 65-70 percent. This category covers approximately 20-
33 percent area of the district.
3.3.10 (B) Pattern of Rural Female Literacy Rate
Literacy of Chittaurgarh district is characterized with sharp difference between
the literacy rate of females of rural and urban areas. Such contrasts are the
manifestation of the differences in the socio-economic background of the concerned
area. There has been a considerable increase in the percentage of rural female literacy in
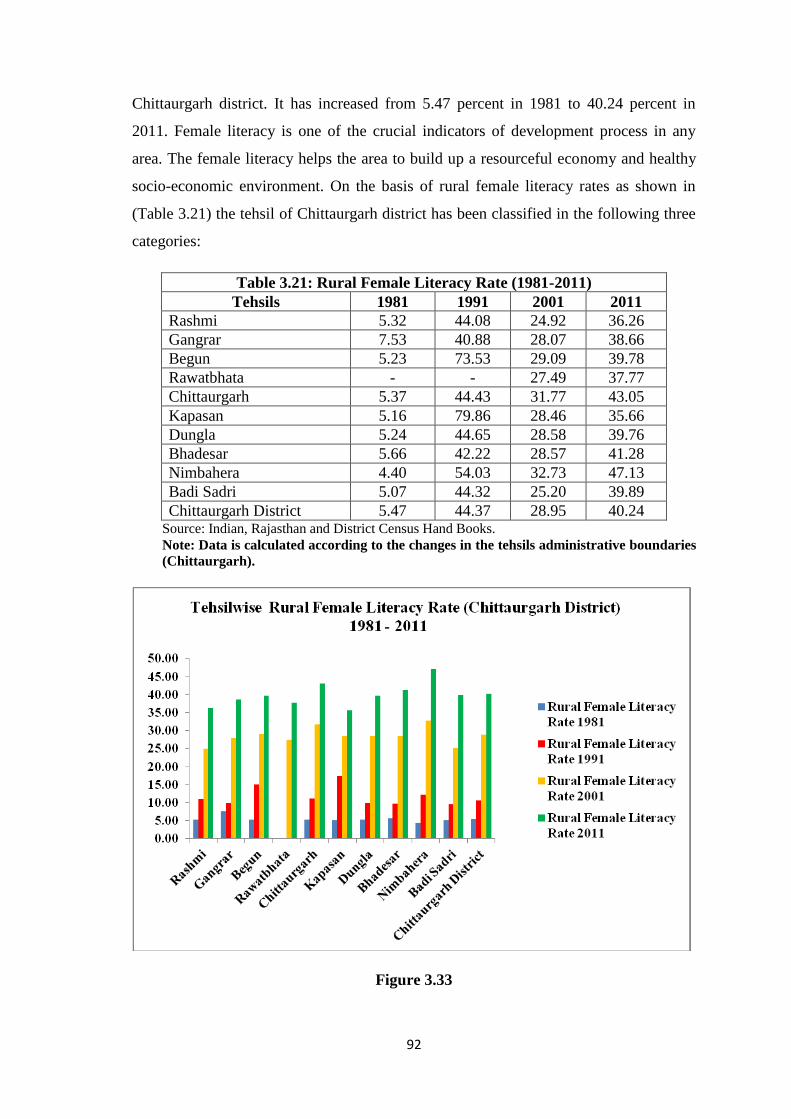
92
Chittaurgarh district. It has increased from 5.47 percent in 1981 to 40.24 percent in
2011. Female literacy is one of the crucial indicators of development process in any
area. The female literacy helps the area to build up a resourceful economy and healthy
socio-economic environment. On the basis of rural female literacy rates as shown in
(Table 3.21) the tehsil of Chittaurgarh district has been classified in the following three
categories:
Table 3.21: Rural Female Literacy Rate (1981-2011) Tehsils 1981 1991 2001 2011
Rashmi 5.32 44.08 24.92 36.26 Gangrar 7.53 40.88 28.07 38.66 Begun 5.23 73.53 29.09 39.78 Rawatbhata - - 27.49 37.77 Chittaurgarh 5.37 44.43 31.77 43.05 Kapasan 5.16 79.86 28.46 35.66 Dungla 5.24 44.65 28.58 39.76 Bhadesar 5.66 42.22 28.57 41.28 Nimbahera 4.40 54.03 32.73 47.13 Badi Sadri 5.07 44.32 25.20 39.89 Chittaurgarh District 5.47 44.37 28.95 40.24
Source: Indian, Rajasthan and District Census Hand Books. Note: Data is calculated according to the changes in the tehsils administrative boundaries (Chittaurgarh).
Figure 3.33
93
(a) Areas of Relatively High Level of Literacy Rate - In the year 1981 here were
two tehsils in the range of 5.5 percent and above namely, Gangrar, Bhadesar. In
the year 1991, there were four tehsils in the range of 11 percent and above
namely, Kapasan, Begun, Nimbahera and Chittaurgarh. In the year 2001, there
were two tehsil in the range of 31 percent and above namely, Nimbahera,
Chittaurgarh. In the year 2011, there were three tehsils in the range of 41 percent
and above namely, Nimbahera. Chittaurgarh, Bhadesar. This category covers
approximately 20-40 percent area of the district. In these tehsil several opened
schools, colleges to glavanize education for girls and to increase rural female
literacy.
(b) Areas of Moderate Level of Literacy Rate -In the year 1981, there were six
tehsils in the range of 5.0-5.5 percent namely, Rashmi, Begun, Chittaurgarh,
Kapasan, Dungla, and Badi Sadri. In the year 1991, there were one tehsil in the
range of 9-11 percent namely, Rashmi. In the year 2001, there were six tehsils in
the range of 27-30 percent namely, Gangrar, Begun, Rawatbhata, Kapasan,
Dungla, Bhadesar. In the year 2011, there were four tehsils in the range of 38-41
percent namely, Gangrar, Begun, Dungla, Badi Sadri. This category covers
approximately 40-65 percent area of the district. These tehsil have the moderate
literacy rate due to location of female‟s educational institutions in rural areas
with better road connections and school facilities.
(c) Areas of Low Level of Literacy Rate - In the year 1981, there were one tehsil
in the range of 4.5-5.0 percent namely, Nimbahera. In the year 1991, there were
four tehsil in the range of 9-10 percent namely, Badi Sadri, Bhadesar, Dungla,
Gangrar. In the year 2001, there were two tehsil in the range of 24-27 percent
namely, Rashmi, Badi Sadri. In the year 2011, there were two tehsil in the range
of 35-38 percent namely, Kapasan, Rawatbhata. This category covers
approximately 10-40 percent area of the district. These tehsil recorded low
female literacy rate due to agricultural economy of these areas.
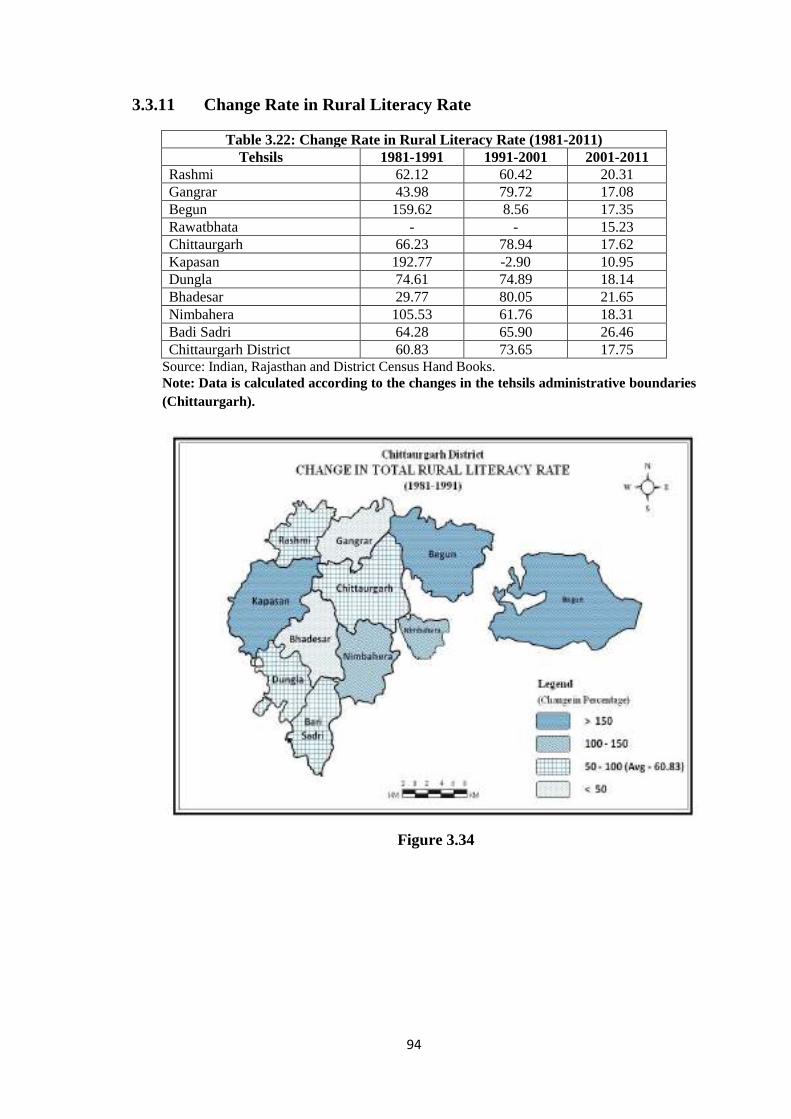
94
3.3.11 Change Rate in Rural Literacy Rate
Table 3.22: Change Rate in Rural Literacy Rate (1981-2011) Tehsils 1981-1991 1991-2001 2001-2011
Rashmi 62.12 60.42 20.31 Gangrar 43.98 79.72 17.08 Begun 159.62 8.56 17.35 Rawatbhata - - 15.23 Chittaurgarh 66.23 78.94 17.62 Kapasan 192.77 -2.90 10.95 Dungla 74.61 74.89 18.14 Bhadesar 29.77 80.05 21.65 Nimbahera 105.53 61.76 18.31 Badi Sadri 64.28 65.90 26.46 Chittaurgarh District 60.83 73.65 17.75
Source: Indian, Rajasthan and District Census Hand Books. Note: Data is calculated according to the changes in the tehsils administrative boundaries (Chittaurgarh).
Figure 3.34
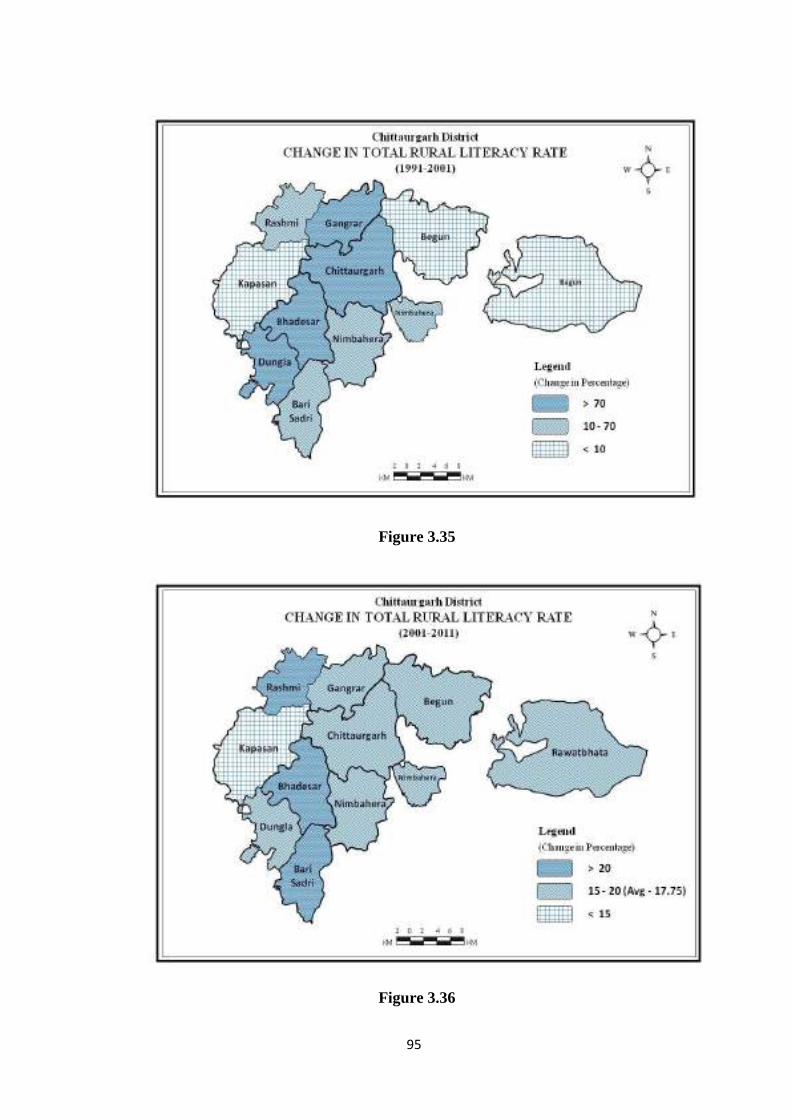
95
Figure 3.35
Figure 3.36
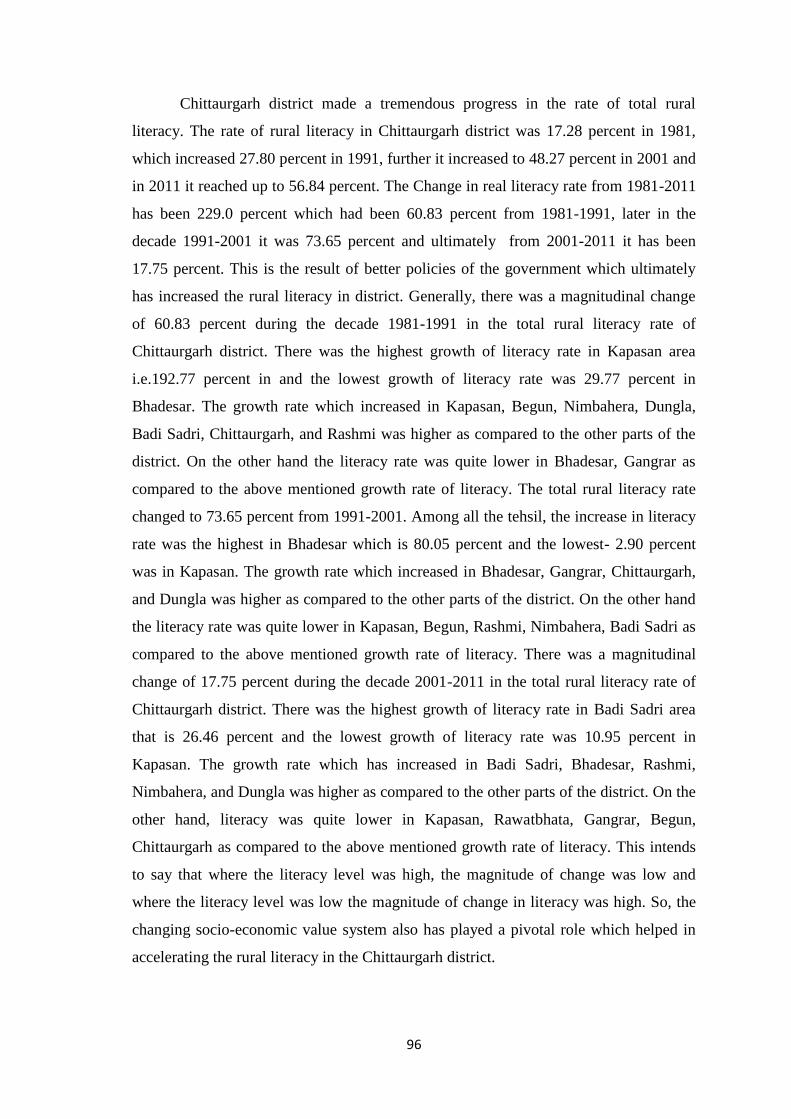
96
Chittaurgarh district made a tremendous progress in the rate of total rural
literacy. The rate of rural literacy in Chittaurgarh district was 17.28 percent in 1981,
which increased 27.80 percent in 1991, further it increased to 48.27 percent in 2001 and
in 2011 it reached up to 56.84 percent. The Change in real literacy rate from 1981-2011
has been 229.0 percent which had been 60.83 percent from 1981-1991, later in the
decade 1991-2001 it was 73.65 percent and ultimately from 2001-2011 it has been
17.75 percent. This is the result of better policies of the government which ultimately
has increased the rural literacy in district. Generally, there was a magnitudinal change
of 60.83 percent during the decade 1981-1991 in the total rural literacy rate of
Chittaurgarh district. There was the highest growth of literacy rate in Kapasan area
i.e.192.77 percent in and the lowest growth of literacy rate was 29.77 percent in
Bhadesar. The growth rate which increased in Kapasan, Begun, Nimbahera, Dungla,
Badi Sadri, Chittaurgarh, and Rashmi was higher as compared to the other parts of the
district. On the other hand the literacy rate was quite lower in Bhadesar, Gangrar as
compared to the above mentioned growth rate of literacy. The total rural literacy rate
changed to 73.65 percent from 1991-2001. Among all the tehsil, the increase in literacy
rate was the highest in Bhadesar which is 80.05 percent and the lowest- 2.90 percent
was in Kapasan. The growth rate which increased in Bhadesar, Gangrar, Chittaurgarh,
and Dungla was higher as compared to the other parts of the district. On the other hand
the literacy rate was quite lower in Kapasan, Begun, Rashmi, Nimbahera, Badi Sadri as
compared to the above mentioned growth rate of literacy. There was a magnitudinal
change of 17.75 percent during the decade 2001-2011 in the total rural literacy rate of
Chittaurgarh district. There was the highest growth of literacy rate in Badi Sadri area
that is 26.46 percent and the lowest growth of literacy rate was 10.95 percent in
Kapasan. The growth rate which has increased in Badi Sadri, Bhadesar, Rashmi,
Nimbahera, and Dungla was higher as compared to the other parts of the district. On the
other hand, literacy was quite lower in Kapasan, Rawatbhata, Gangrar, Begun,
Chittaurgarh as compared to the above mentioned growth rate of literacy. This intends
to say that where the literacy level was high, the magnitude of change was low and
where the literacy level was low the magnitude of change in literacy was high. So, the
changing socio-economic value system also has played a pivotal role which helped in
accelerating the rural literacy in the Chittaurgarh district.
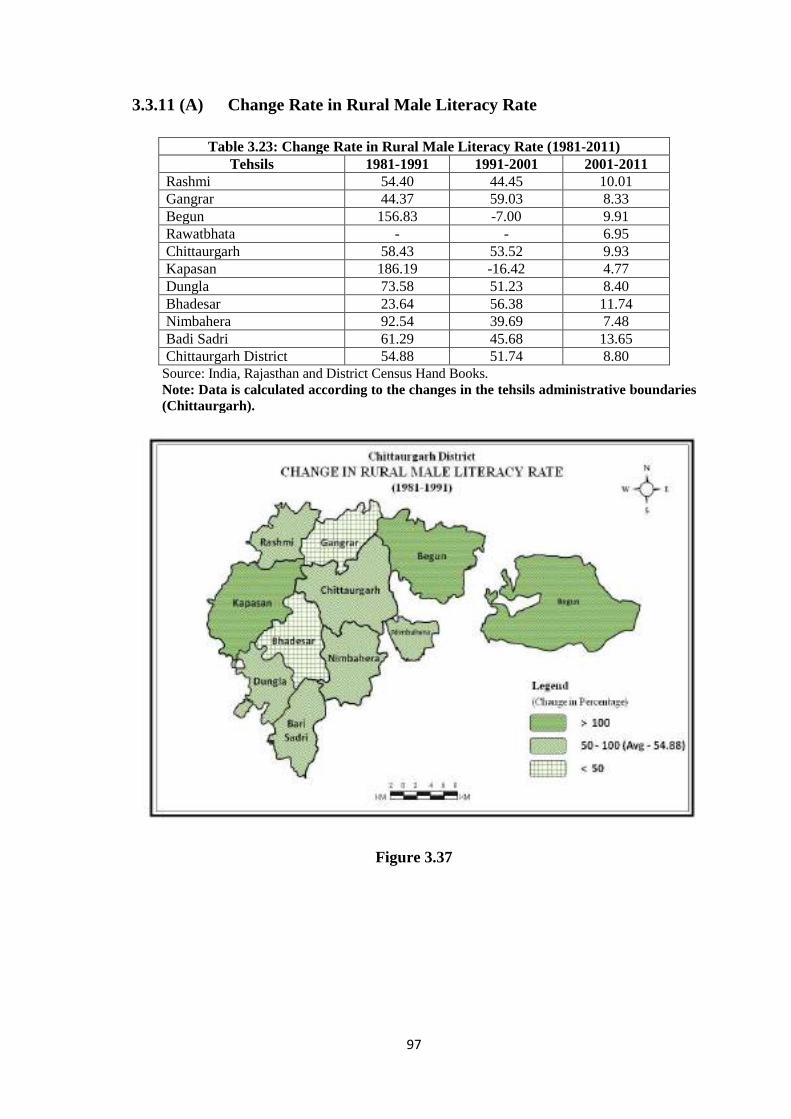
97
3.3.11 (A) Change Rate in Rural Male Literacy Rate
Table 3.23: Change Rate in Rural Male Literacy Rate (1981-2011) Tehsils 1981-1991 1991-2001 2001-2011
Rashmi 54.40 44.45 10.01 Gangrar 44.37 59.03 8.33 Begun 156.83 -7.00 9.91 Rawatbhata - - 6.95 Chittaurgarh 58.43 53.52 9.93 Kapasan 186.19 -16.42 4.77 Dungla 73.58 51.23 8.40 Bhadesar 23.64 56.38 11.74 Nimbahera 92.54 39.69 7.48 Badi Sadri 61.29 45.68 13.65 Chittaurgarh District 54.88 51.74 8.80
Source: India, Rajasthan and District Census Hand Books. Note: Data is calculated according to the changes in the tehsils administrative boundaries (Chittaurgarh).
Figure 3.37
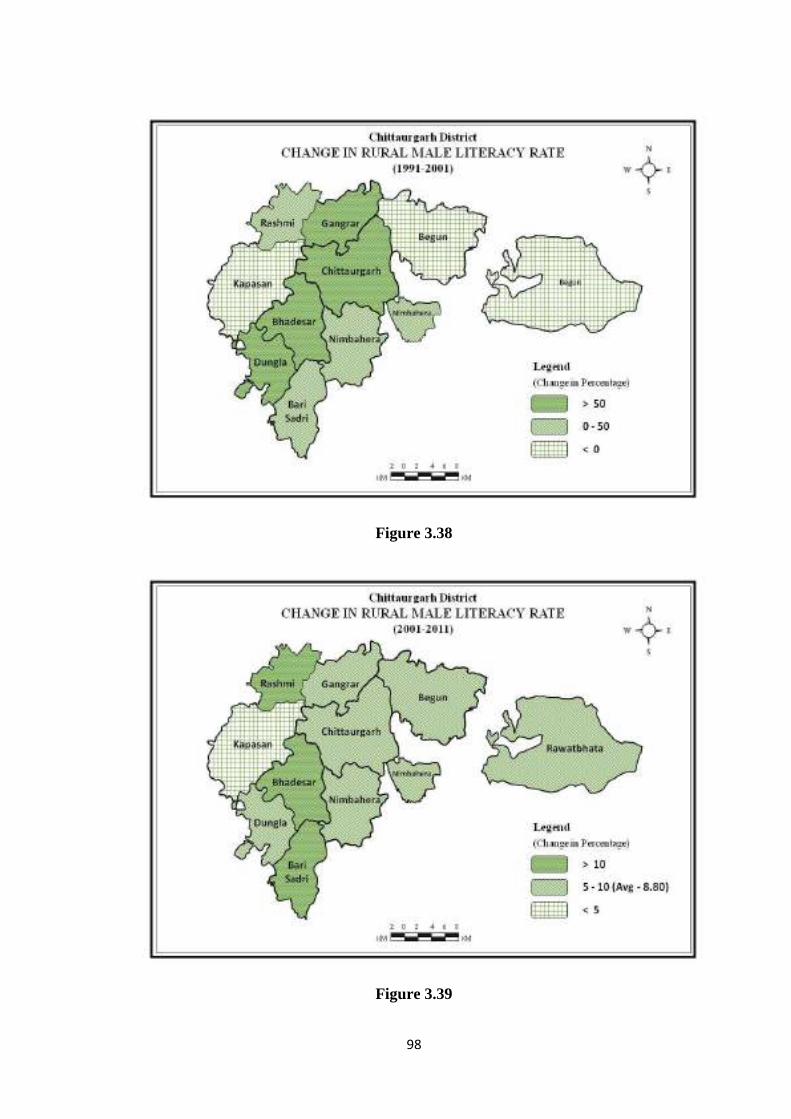
98
Figure 3.38
Figure 3.39
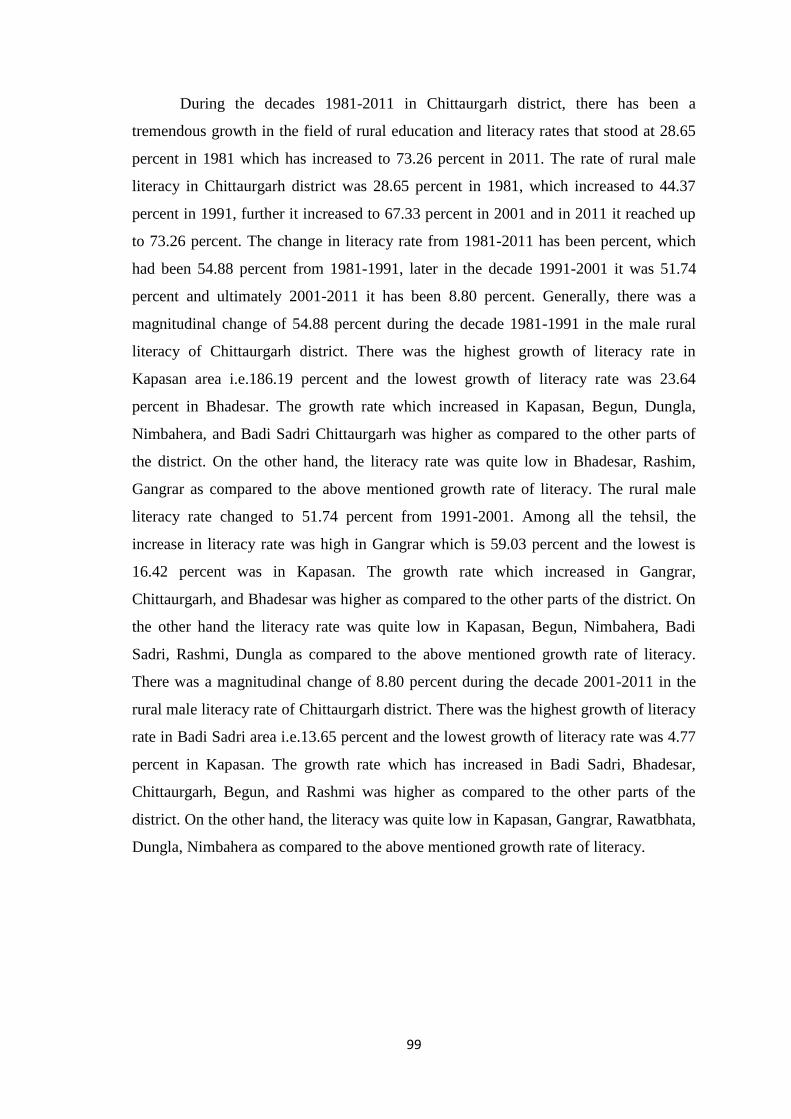
99
During the decades 1981-2011 in Chittaurgarh district, there has been a
tremendous growth in the field of rural education and literacy rates that stood at 28.65
percent in 1981 which has increased to 73.26 percent in 2011. The rate of rural male
literacy in Chittaurgarh district was 28.65 percent in 1981, which increased to 44.37
percent in 1991, further it increased to 67.33 percent in 2001 and in 2011 it reached up
to 73.26 percent. The change in literacy rate from 1981-2011 has been percent, which
had been 54.88 percent from 1981-1991, later in the decade 1991-2001 it was 51.74
percent and ultimately 2001-2011 it has been 8.80 percent. Generally, there was a
magnitudinal change of 54.88 percent during the decade 1981-1991 in the male rural
literacy of Chittaurgarh district. There was the highest growth of literacy rate in
Kapasan area i.e.186.19 percent and the lowest growth of literacy rate was 23.64
percent in Bhadesar. The growth rate which increased in Kapasan, Begun, Dungla,
Nimbahera, and Badi Sadri Chittaurgarh was higher as compared to the other parts of
the district. On the other hand, the literacy rate was quite low in Bhadesar, Rashim,
Gangrar as compared to the above mentioned growth rate of literacy. The rural male
literacy rate changed to 51.74 percent from 1991-2001. Among all the tehsil, the
increase in literacy rate was high in Gangrar which is 59.03 percent and the lowest is
16.42 percent was in Kapasan. The growth rate which increased in Gangrar,
Chittaurgarh, and Bhadesar was higher as compared to the other parts of the district. On
the other hand the literacy rate was quite low in Kapasan, Begun, Nimbahera, Badi
Sadri, Rashmi, Dungla as compared to the above mentioned growth rate of literacy.
There was a magnitudinal change of 8.80 percent during the decade 2001-2011 in the
rural male literacy rate of Chittaurgarh district. There was the highest growth of literacy
rate in Badi Sadri area i.e.13.65 percent and the lowest growth of literacy rate was 4.77
percent in Kapasan. The growth rate which has increased in Badi Sadri, Bhadesar,
Chittaurgarh, Begun, and Rashmi was higher as compared to the other parts of the
district. On the other hand, the literacy was quite low in Kapasan, Gangrar, Rawatbhata,
Dungla, Nimbahera as compared to the above mentioned growth rate of literacy.
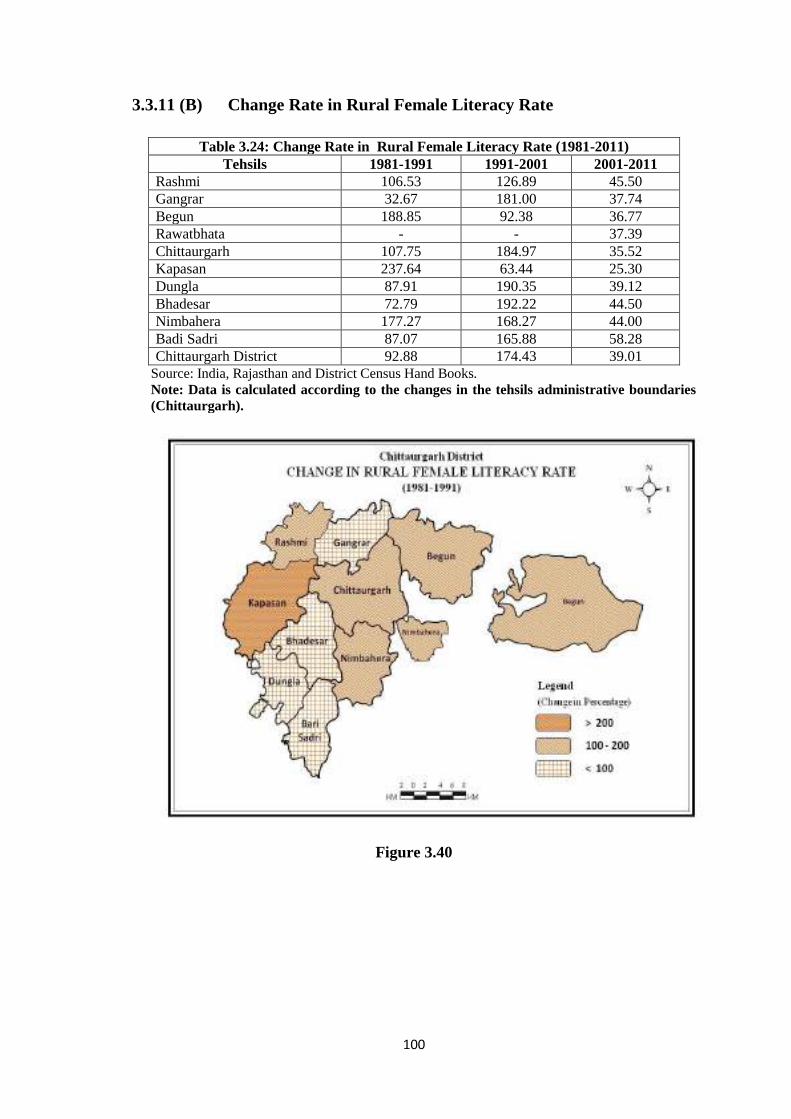
100
3.3.11 (B) Change Rate in Rural Female Literacy Rate
Table 3.24: Change Rate in Rural Female Literacy Rate (1981-2011) Tehsils 1981-1991 1991-2001 2001-2011
Rashmi 106.53 126.89 45.50 Gangrar 32.67 181.00 37.74 Begun 188.85 92.38 36.77 Rawatbhata - - 37.39 Chittaurgarh 107.75 184.97 35.52 Kapasan 237.64 63.44 25.30 Dungla 87.91 190.35 39.12 Bhadesar 72.79 192.22 44.50 Nimbahera 177.27 168.27 44.00 Badi Sadri 87.07 165.88 58.28 Chittaurgarh District 92.88 174.43 39.01
Source: India, Rajasthan and District Census Hand Books. Note: Data is calculated according to the changes in the tehsils administrative boundaries (Chittaurgarh).
Figure 3.40
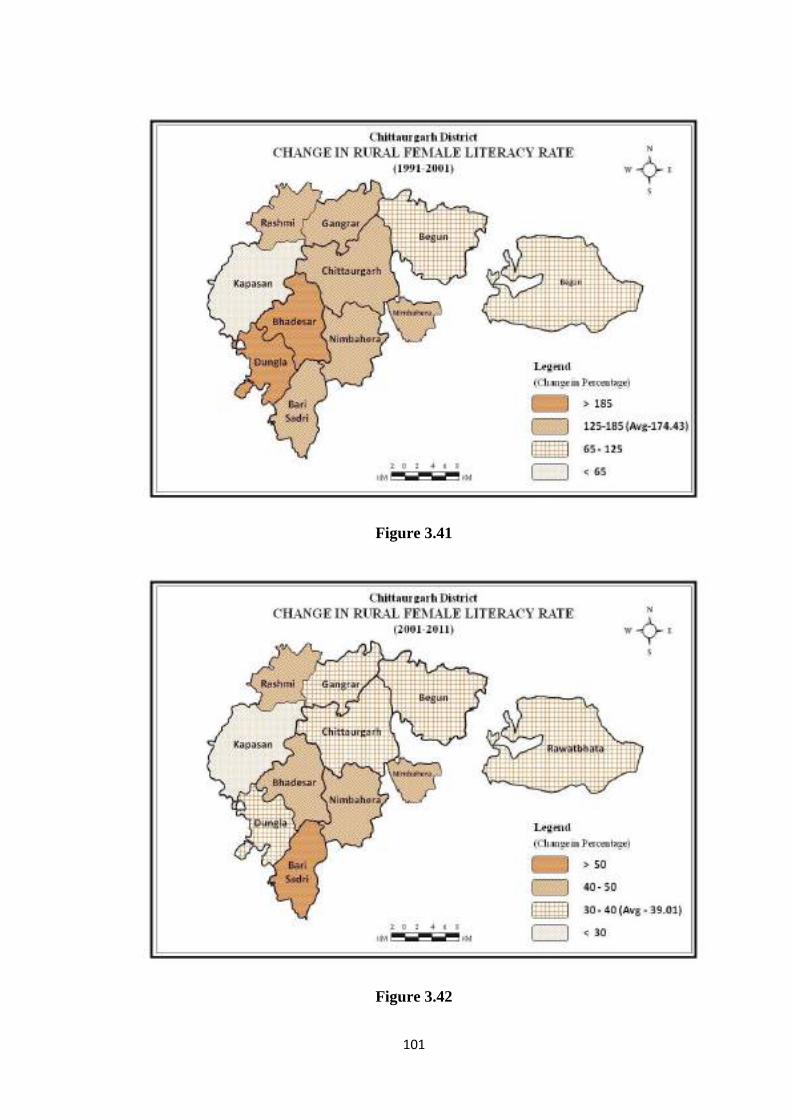
101
Figure 3.41
Figure 3.42

102
Chittaurgarh district literacy is characterized with sharp differences between the
literacy rate of females of rural and urban areas. The rural urban literacy differential
among females was wider than that among males. Such contrasts are the manifestation
of the differences in the socio-economic background of the concerned area. The rate of
rural female literacy in Chittaurgarh district was 5.47 percent in 1981, which increased
10.55 percent in 1991, further it increased to 28.95 percent in 2001 and in 2011 it
reached up to 40.24 percent. The change in rural female literacy rate from 1981-2011
has been 635.65 percent, which had been 92.88 percent from 1981-1991, later in the
decade 1991-2001 it was 174.43 percent and ultimately from 2001-2011 it has been
39.01 percent. Generally, there was a magnitudinal change of 92.88 percent during the
decade 1981-1991 in the rural female literacy rate of Chittaurgarh district. There was
the highest growth of literacy rate in Kapasan area that is 237.64 percent and the lowest
growth of literacy rate was 32.67 percent in Gangrar. The growth rate which increased
in Kapasan, Nimbahera, Begun, Chittaurgarh, and Rashmi was higher as compared to
the other parts of the district. On the other hand, the literacy rate was quite low in
Gangrar, Dungla, Bhadesar, Badi Sadri as compared to the above mentioned growth
rate of literacy. The rural female literacy rate changed to 174.43 percent from 1991-
2001. Among all the tehsil, the increase in literacy rate was the highest in Bhadesar
which is 192.22 percent and the lowest 63.44 percent was in Kapasan. The growth rate
which increased in Bhadesar, Dungla, Gangrar, and Chittaurgarh was higher as
compared to the other parts of the district. On the other hand, the literacy rate was quite
low in Kapasan, Begun, Rashmi Nimbahera, Badi Sadri as compared to the above
mentioned growth rate of literacy. There was a magnitudinal change of 39.01 percent
during the decade 2001-2011 in the rural female literacy rate of Chittaurgarh district.
There was the higest growth of literacy rate in Badi Sadri area that is 58.28 percent and
the lowest growth of literacy rate was 25.30 percent in Kapasan. The growth rate which
has increased in Badi Sadri, Rashmi, Nimbahera, Bhadesar, and Dungla was higher as
compared to the other parts of the district. On the other hand, the literacy was quite low
in Kapasan, Gangrar, Begun, Rawatbhata, Chittaurgarh, as compared to the above
mentioned growth rate of literacy.
103
3.4 Factors Responsible for Literacy
The empirical observations about the space-time diffusion of literacy rate reveal
a direct correlation between the literacy rate and economic transformation, though it
may be difficult to establish as to which cause is and which is effect. If the literacy rate
was low, the economic development slowed down, while the economic development
was rapid if the literacy rate was fast. The literacy rates in any area were determined
largely by a variety of historical, social and economic factors and the factors are-
Cost of Education
In the less developed areas where education is not free and the cost of education
is high, the cost of imparting education to the children becomes an important
determinant of literacy. The experience of India in this regard reveals that even if
education is made compulsory and free, the extremely poor families prefer their
children to help in making an earning, howsoever, meager it may be, rather than sparing
them for schools.
Political Background
The present political set-up in these areas has taken up this task of social
development but the constraints of resources have impeded the pace of such
advancement. Similarly, those areas, which have had a long spell of feudalistic rule,
also continue to display low literacy rates as a legacy of their historic past.
Type of Economy
The difference in the literacy levels of the industrial and agricultural nations
contrast so much that one cannot help inferring a correlation between the type of
economy and the literacy rates. The requirements of the non-agricultural economy are
such that acquisition of literacy skills becomes a functional prerequisite. On the other
hand, the agricultural operations, particularly in the less developed area, are such as
these do not have any demand on education. No wonder, these is a positive correlation
between the proportion of non agricultural works and the literacy rate.

104
Standard of Living
Normally, there exists a positive correlation between literacy rates and the
standard of living. Such a correlation has greater significance for poor areas where the
appalling poverty of the masses, in general, demands different priorities.
Degree of Urbanization
There is a positive correlation between literacy rates and the degree of
development. Thus, the most urbanized societies have very high or even universal
literacy rates while the rural societies usually display low level of literacy rates. The
type of economy and the social set up of urban areas is such that the literacy skills have
greater functional utility, whereas in the countryside the various occupations do not
warrant literacy as a pre-requisite. Moreover, the children in the rural areas can become
associate workers with other members of their family whether it is cultivation or
household industry or labour but in the urban areas there is no such possibility.
Stage of Technological Advancement
The technological advanced areas display high literacy rates in contrast to the
low literacy rates of the areas where the technological advancements were in its infancy
stage. Their differences are related to the differences in the requirements of the
economy of the two types of areas. While in case of highly technologically advanced
areas, literacy and education may be a pre-requisite for getting employment, it may not
be so in case of the technologically less advanced areas.
Development of Means of Transportation and Communication
The development of means of transportation and communication has increased
the degree of spatial interactions. The so-called rural isolation has been broken. The
educational institutions in the urban areas now have become accessible to the
countryside. Similarly, the rural society, which interacts more with the urban areas with
the development of means of transportation and communications starts appreciating the
value of education and starts making the use of educational institutions that are not
located locally. It implies a positive correlation between the literacy rate and the degree
of development of means of transportation and communication.
105
Religious Background
Those religious communities, where oral worship has been in vogue for millions
of years, still have low literacy in comparison to those religious communities, where
reading of religious book is part of the religious tenets. The Islamic world, where oral
prayer five times a day constitutes an important religious requirement, still lies for
behind other such religious groups, where the reading of religious books may be an
essential part of daily life.
Medium of Instruction
The medium of education, if the mother tongues of the people, can help to
increase literacy rate. In the multi-lingual societies of the third world, it has often been
found that education in the mother tongue is more acceptable than the education in
English or even the national language. In India, one of the reasons for the social
backwardness of the Muslims, for instance, has been their aversion to getting educated
in a language other than their mother tongue.
Status of Women in the Society
There is a positive correlation between the status granted to the women and
literacy rates. Those societies, which do not give equal status to males and females;
suffer from low female literacy rates, which affect adversely the total literacy rate.
Similarly, the societies where the females are not allowed mobility or which suffer from
prejudices against females education also display low female literacy and hence, low
general literacy. That is why the Muslim world, which is characterized by these
restrictions females‟ mobility and education, exhibits the lowest literacy rates in the
world.
Availability of Educational Institutions
Much of the progress in literacy in the less developed areas, which are lagging
behind, depends largely upon the availability of facilities for getting education. There
exists a positive correlation between the literacy rates and the degree of availability of
educational institutions. Lower the number of people per educational institution higher
is the literacy rate. The availability of educational facilities within an easy access and
within the reach of one's pocket works as a positive in the propagation of literacy and
education.
106
Public Policies
In the end, mention must be made of the policies of the government, which in
their own way, affect the attitudes of the people towards education. Such policies like
the free and compulsory education and adult literacy programs have had their positive
impact felt in the areas that have followed them. In Chittaurgarh also after the
independence, the government has followed the policy of propagating education among
its masses as it adopted the idea of welfare area.
3.5 Literate Population and Literacy Rate in Scheduled Caste and
Scheduled Tribe
Our Constitution has accepted the ideals of equality and justice both in the
social and political field. Accordingly, it abolishes any discrimination to any class of
persons on the ground of religion, race or place of birth. Articles 330-342 of Indian
constitution make special provisions for safe guarding the interest of scheduled castes
and scheduled tribes, Anglo-Indians and backward classes. The scheduled caste and
scheduled tribe population represent one of the most economically impoverished and
marginalized groups in Rajasthan. The scheduled tribes are not discriminated against in
the same way by the mainstream Hindu population as the scheduled caste population in
Rajasthan. While the later group is related to the lowest hierarchy of the social system
and is often considered to be impure or unclean, for most part of the Scheduled Tribes,
socially distorted and living outside mainstream Hindu society. The areas inhabited by
the tribal population constitute a significant part of the underdeveloped areas of the
State. The tribes of Rajasthan are predominantly Bhil and Mina‟s castes. In fact they
were the original inhabitants of the area where Rajasthan stands now. Apart from these
main tribes, there are also a number of smaller tribes like Gadiya Luhar, Garasiya,
Sahariyas, Damor. Rajasthan tribes include the following also: Meo and Banjara (the
travelling tribes), Kathodi (found in mewar region), Rabaris (Cattle breeders, found in
Mewar region), Sansi, Kanjar. However all Rajasthan tribes shares certain traits, the
variations being in their costumes, jewelers, fair and festivals, etc. These tribal groups
have their own distinctive cultures, social practices, religions, dialects and business.
Thus, various tribal groups are highly heterogeneous, and their differences are an act in
which they live, the degree of risk of the mainstream Hindu population, government
participation in their daily lives, their economic status and past history. The tribes are
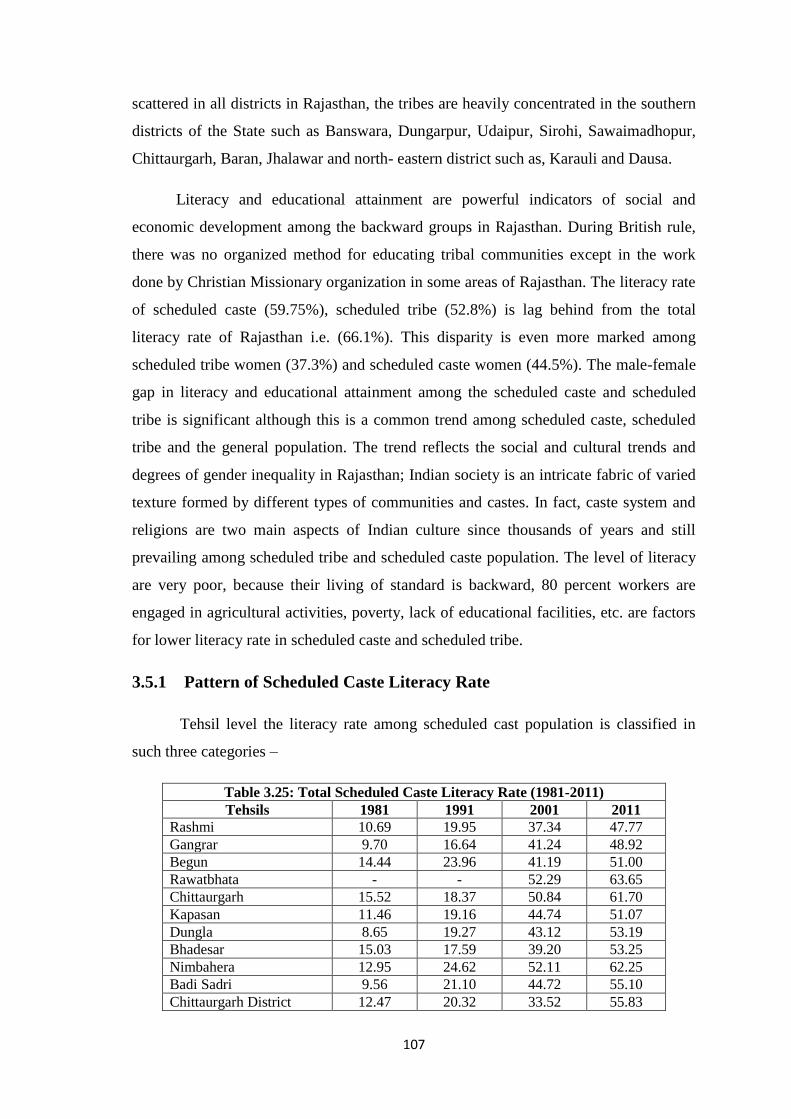
107
scattered in all districts in Rajasthan, the tribes are heavily concentrated in the southern
districts of the State such as Banswara, Dungarpur, Udaipur, Sirohi, Sawaimadhopur,
Chittaurgarh, Baran, Jhalawar and north- eastern district such as, Karauli and Dausa.
Literacy and educational attainment are powerful indicators of social and
economic development among the backward groups in Rajasthan. During British rule,
there was no organized method for educating tribal communities except in the work
done by Christian Missionary organization in some areas of Rajasthan. The literacy rate
of scheduled caste (59.75%), scheduled tribe (52.8%) is lag behind from the total
literacy rate of Rajasthan i.e. (66.1%). This disparity is even more marked among
scheduled tribe women (37.3%) and scheduled caste women (44.5%). The male-female
gap in literacy and educational attainment among the scheduled caste and scheduled
tribe is significant although this is a common trend among scheduled caste, scheduled
tribe and the general population. The trend reflects the social and cultural trends and
degrees of gender inequality in Rajasthan; Indian society is an intricate fabric of varied
texture formed by different types of communities and castes. In fact, caste system and
religions are two main aspects of Indian culture since thousands of years and still
prevailing among scheduled tribe and scheduled caste population. The level of literacy
are very poor, because their living of standard is backward, 80 percent workers are
engaged in agricultural activities, poverty, lack of educational facilities, etc. are factors
for lower literacy rate in scheduled caste and scheduled tribe.
3.5.1 Pattern of Scheduled Caste Literacy Rate
Tehsil level the literacy rate among scheduled cast population is classified in
such three categories –
Table 3.25: Total Scheduled Caste Literacy Rate (1981-2011) Tehsils 1981 1991 2001 2011
Rashmi 10.69 19.95 37.34 47.77 Gangrar 9.70 16.64 41.24 48.92 Begun 14.44 23.96 41.19 51.00 Rawatbhata - - 52.29 63.65 Chittaurgarh 15.52 18.37 50.84 61.70 Kapasan 11.46 19.16 44.74 51.07 Dungla 8.65 19.27 43.12 53.19 Bhadesar 15.03 17.59 39.20 53.25 Nimbahera 12.95 24.62 52.11 62.25 Badi Sadri 9.56 21.10 44.72 55.10 Chittaurgarh District 12.47 20.32 33.52 55.83
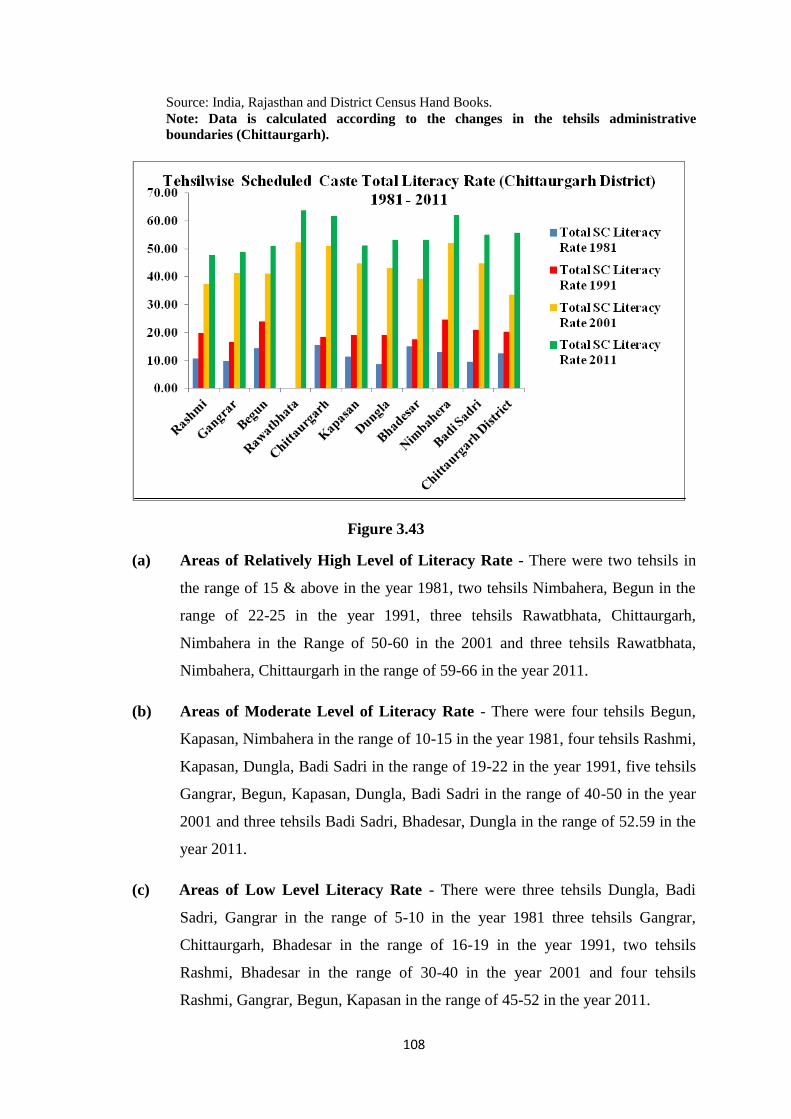
108
Source: India, Rajasthan and District Census Hand Books. Note: Data is calculated according to the changes in the tehsils administrative boundaries (Chittaurgarh).
Figure 3.43
(a) Areas of Relatively High Level of Literacy Rate - There were two tehsils in
the range of 15 & above in the year 1981, two tehsils Nimbahera, Begun in the
range of 22-25 in the year 1991, three tehsils Rawatbhata, Chittaurgarh,
Nimbahera in the Range of 50-60 in the 2001 and three tehsils Rawatbhata,
Nimbahera, Chittaurgarh in the range of 59-66 in the year 2011.
(b) Areas of Moderate Level of Literacy Rate - There were four tehsils Begun,
Kapasan, Nimbahera in the range of 10-15 in the year 1981, four tehsils Rashmi,
Kapasan, Dungla, Badi Sadri in the range of 19-22 in the year 1991, five tehsils
Gangrar, Begun, Kapasan, Dungla, Badi Sadri in the range of 40-50 in the year
2001 and three tehsils Badi Sadri, Bhadesar, Dungla in the range of 52.59 in the
year 2011.
(c) Areas of Low Level Literacy Rate - There were three tehsils Dungla, Badi
Sadri, Gangrar in the range of 5-10 in the year 1981 three tehsils Gangrar,
Chittaurgarh, Bhadesar in the range of 16-19 in the year 1991, two tehsils
Rashmi, Bhadesar in the range of 30-40 in the year 2001 and four tehsils
Rashmi, Gangrar, Begun, Kapasan in the range of 45-52 in the year 2011.
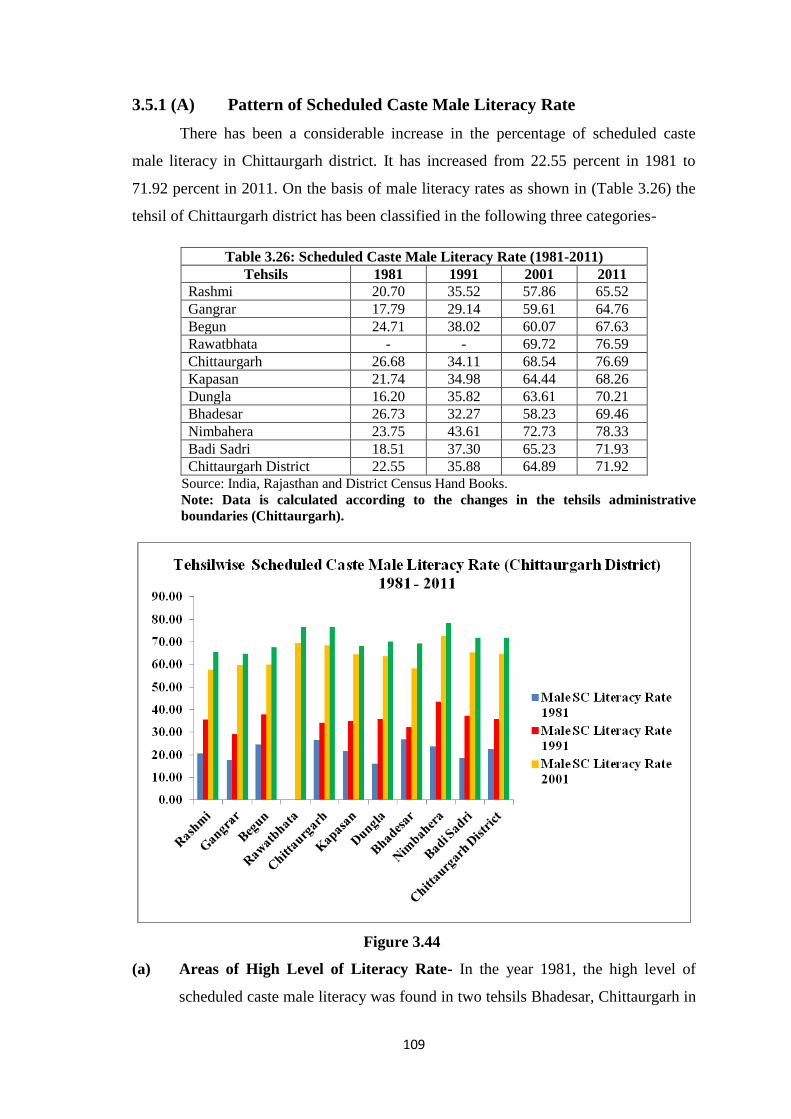
109
3.5.1 (A) Pattern of Scheduled Caste Male Literacy Rate
There has been a considerable increase in the percentage of scheduled caste
male literacy in Chittaurgarh district. It has increased from 22.55 percent in 1981 to
71.92 percent in 2011. On the basis of male literacy rates as shown in (Table 3.26) the
tehsil of Chittaurgarh district has been classified in the following three categories-
Table 3.26: Scheduled Caste Male Literacy Rate (1981-2011) Tehsils 1981 1991 2001 2011
Rashmi 20.70 35.52 57.86 65.52 Gangrar 17.79 29.14 59.61 64.76 Begun 24.71 38.02 60.07 67.63 Rawatbhata - - 69.72 76.59 Chittaurgarh 26.68 34.11 68.54 76.69 Kapasan 21.74 34.98 64.44 68.26 Dungla 16.20 35.82 63.61 70.21 Bhadesar 26.73 32.27 58.23 69.46 Nimbahera 23.75 43.61 72.73 78.33 Badi Sadri 18.51 37.30 65.23 71.93 Chittaurgarh District 22.55 35.88 64.89 71.92
Source: India, Rajasthan and District Census Hand Books. Note: Data is calculated according to the changes in the tehsils administrative boundaries (Chittaurgarh).
Figure 3.44
(a) Areas of High Level of Literacy Rate- In the year 1981, the high level of
scheduled caste male literacy was found in two tehsils Bhadesar, Chittaurgarh in
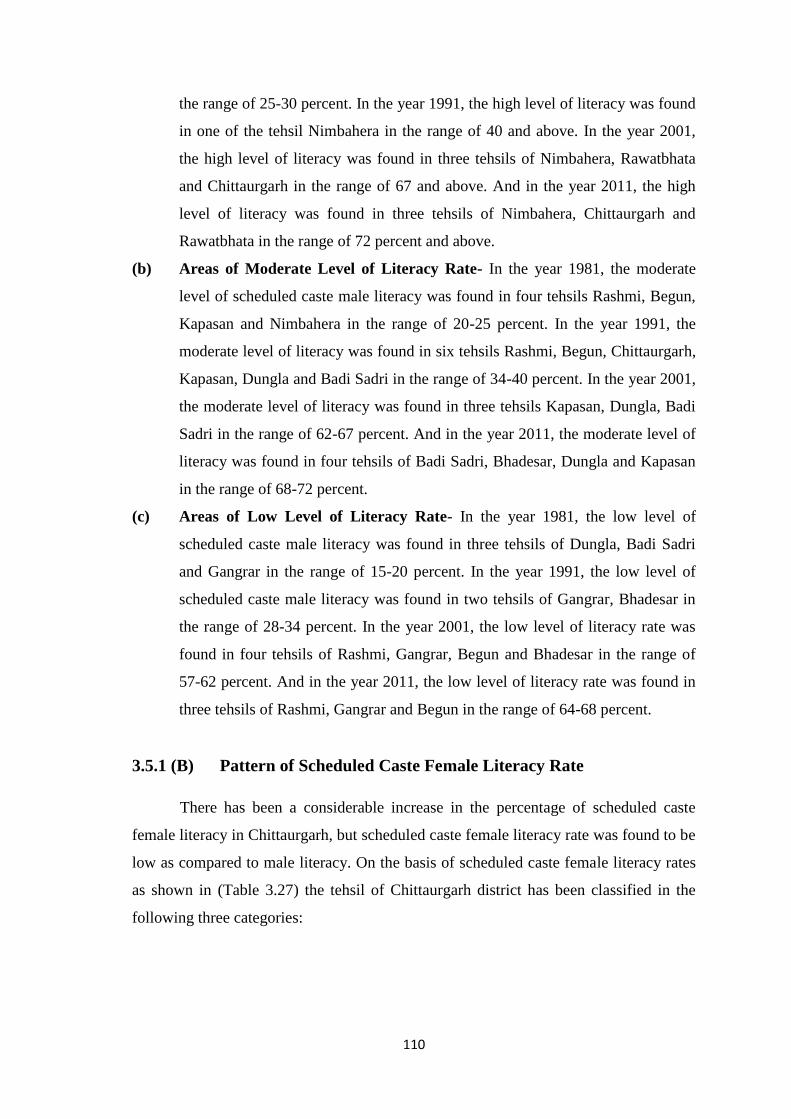
110
the range of 25-30 percent. In the year 1991, the high level of literacy was found
in one of the tehsil Nimbahera in the range of 40 and above. In the year 2001,
the high level of literacy was found in three tehsils of Nimbahera, Rawatbhata
and Chittaurgarh in the range of 67 and above. And in the year 2011, the high
level of literacy was found in three tehsils of Nimbahera, Chittaurgarh and
Rawatbhata in the range of 72 percent and above.
(b) Areas of Moderate Level of Literacy Rate- In the year 1981, the moderate
level of scheduled caste male literacy was found in four tehsils Rashmi, Begun,
Kapasan and Nimbahera in the range of 20-25 percent. In the year 1991, the
moderate level of literacy was found in six tehsils Rashmi, Begun, Chittaurgarh,
Kapasan, Dungla and Badi Sadri in the range of 34-40 percent. In the year 2001,
the moderate level of literacy was found in three tehsils Kapasan, Dungla, Badi
Sadri in the range of 62-67 percent. And in the year 2011, the moderate level of
literacy was found in four tehsils of Badi Sadri, Bhadesar, Dungla and Kapasan
in the range of 68-72 percent.
(c) Areas of Low Level of Literacy Rate- In the year 1981, the low level of
scheduled caste male literacy was found in three tehsils of Dungla, Badi Sadri
and Gangrar in the range of 15-20 percent. In the year 1991, the low level of
scheduled caste male literacy was found in two tehsils of Gangrar, Bhadesar in
the range of 28-34 percent. In the year 2001, the low level of literacy rate was
found in four tehsils of Rashmi, Gangrar, Begun and Bhadesar in the range of
57-62 percent. And in the year 2011, the low level of literacy rate was found in
three tehsils of Rashmi, Gangrar and Begun in the range of 64-68 percent.
3.5.1 (B) Pattern of Scheduled Caste Female Literacy Rate
There has been a considerable increase in the percentage of scheduled caste
female literacy in Chittaurgarh, but scheduled caste female literacy rate was found to be
low as compared to male literacy. On the basis of scheduled caste female literacy rates
as shown in (Table 3.27) the tehsil of Chittaurgarh district has been classified in the
following three categories:
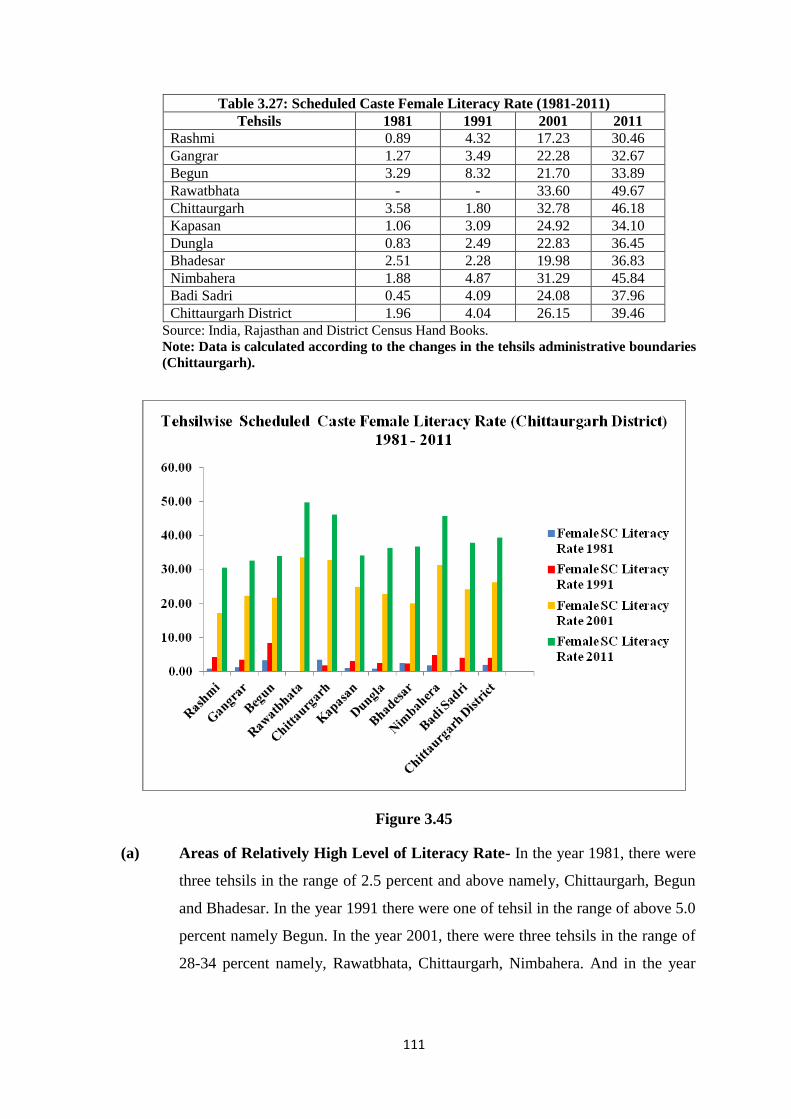
111
Table 3.27: Scheduled Caste Female Literacy Rate (1981-2011) Tehsils 1981 1991 2001 2011
Rashmi 0.89 4.32 17.23 30.46 Gangrar 1.27 3.49 22.28 32.67 Begun 3.29 8.32 21.70 33.89 Rawatbhata - - 33.60 49.67 Chittaurgarh 3.58 1.80 32.78 46.18 Kapasan 1.06 3.09 24.92 34.10 Dungla 0.83 2.49 22.83 36.45 Bhadesar 2.51 2.28 19.98 36.83 Nimbahera 1.88 4.87 31.29 45.84 Badi Sadri 0.45 4.09 24.08 37.96 Chittaurgarh District 1.96 4.04 26.15 39.46
Source: India, Rajasthan and District Census Hand Books. Note: Data is calculated according to the changes in the tehsils administrative boundaries (Chittaurgarh).
Figure 3.45
(a) Areas of Relatively High Level of Literacy Rate- In the year 1981, there were
three tehsils in the range of 2.5 percent and above namely, Chittaurgarh, Begun
and Bhadesar. In the year 1991 there were one of tehsil in the range of above 5.0
percent namely Begun. In the year 2001, there were three tehsils in the range of
28-34 percent namely, Rawatbhata, Chittaurgarh, Nimbahera. And in the year
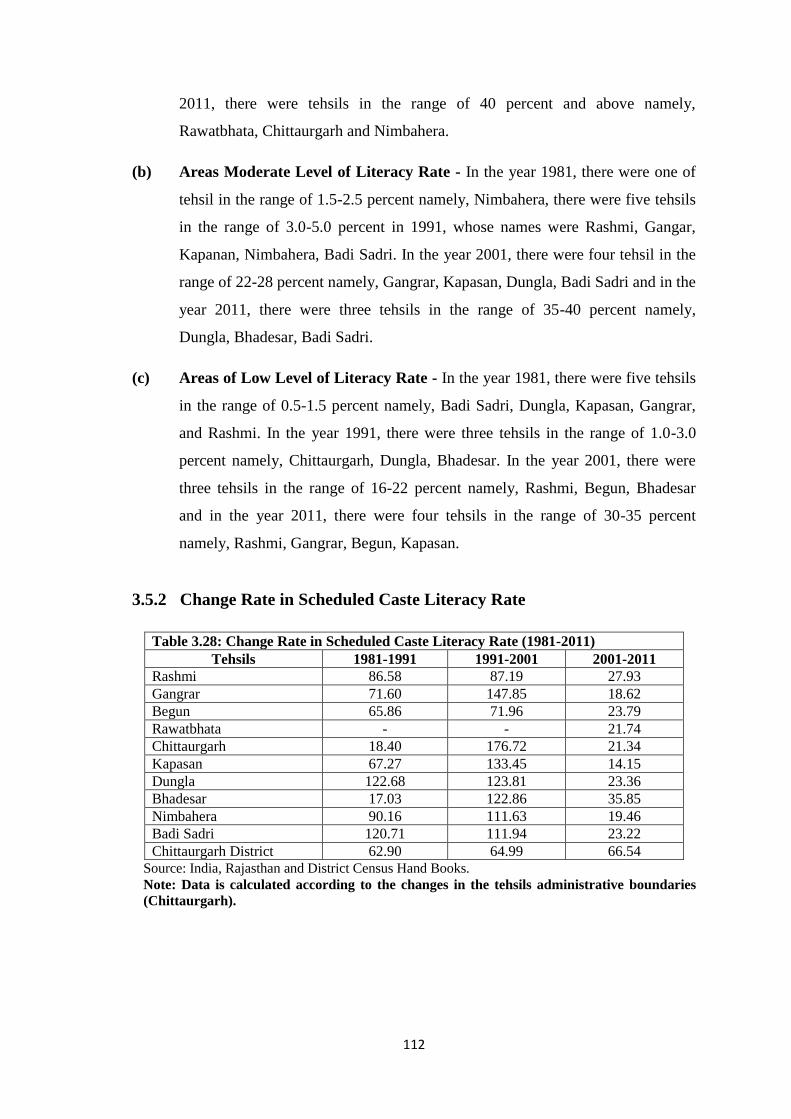
112
2011, there were tehsils in the range of 40 percent and above namely,
Rawatbhata, Chittaurgarh and Nimbahera.
(b) Areas Moderate Level of Literacy Rate - In the year 1981, there were one of
tehsil in the range of 1.5-2.5 percent namely, Nimbahera, there were five tehsils
in the range of 3.0-5.0 percent in 1991, whose names were Rashmi, Gangar,
Kapanan, Nimbahera, Badi Sadri. In the year 2001, there were four tehsil in the
range of 22-28 percent namely, Gangrar, Kapasan, Dungla, Badi Sadri and in the
year 2011, there were three tehsils in the range of 35-40 percent namely,
Dungla, Bhadesar, Badi Sadri.
(c) Areas of Low Level of Literacy Rate - In the year 1981, there were five tehsils
in the range of 0.5-1.5 percent namely, Badi Sadri, Dungla, Kapasan, Gangrar,
and Rashmi. In the year 1991, there were three tehsils in the range of 1.0-3.0
percent namely, Chittaurgarh, Dungla, Bhadesar. In the year 2001, there were
three tehsils in the range of 16-22 percent namely, Rashmi, Begun, Bhadesar
and in the year 2011, there were four tehsils in the range of 30-35 percent
namely, Rashmi, Gangrar, Begun, Kapasan.
3.5.2 Change Rate in Scheduled Caste Literacy Rate
Table 3.28: Change Rate in Scheduled Caste Literacy Rate (1981-2011) Tehsils 1981-1991 1991-2001 2001-2011
Rashmi 86.58 87.19 27.93 Gangrar 71.60 147.85 18.62 Begun 65.86 71.96 23.79 Rawatbhata - - 21.74 Chittaurgarh 18.40 176.72 21.34 Kapasan 67.27 133.45 14.15 Dungla 122.68 123.81 23.36 Bhadesar 17.03 122.86 35.85 Nimbahera 90.16 111.63 19.46 Badi Sadri 120.71 111.94 23.22 Chittaurgarh District 62.90 64.99 66.54
Source: India, Rajasthan and District Census Hand Books. Note: Data is calculated according to the changes in the tehsils administrative boundaries (Chittaurgarh).
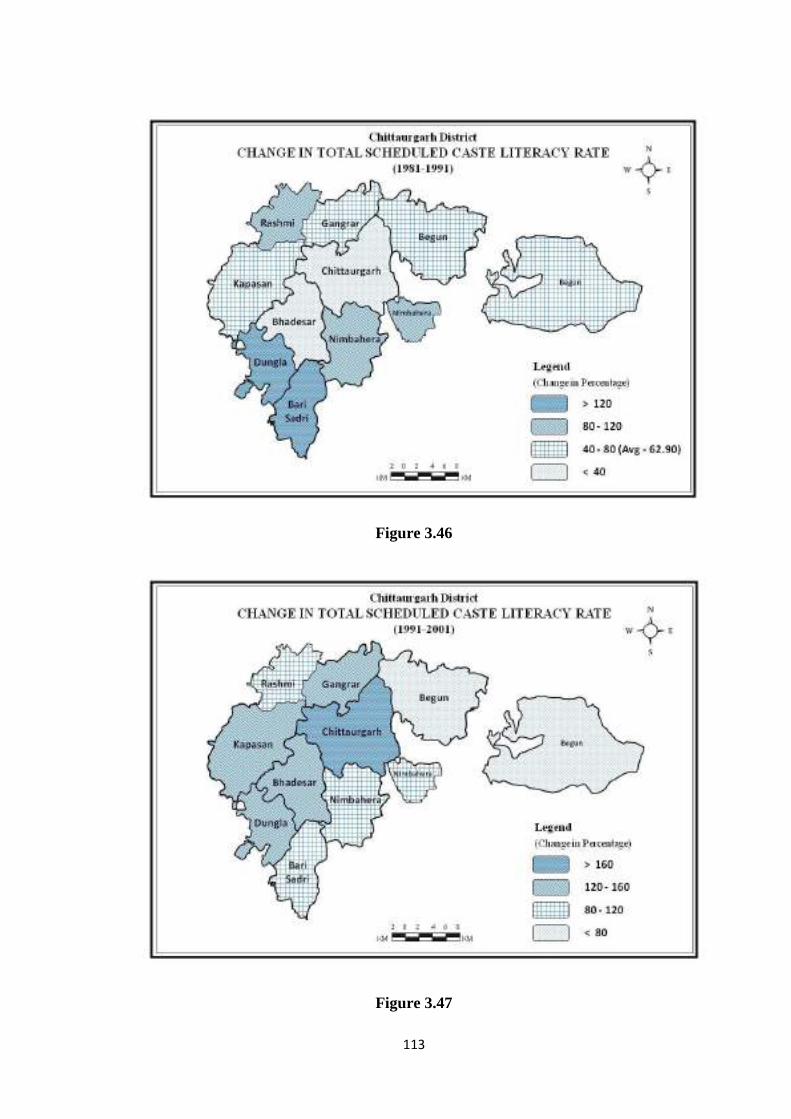
113
Figure 3.46
Figure 3.47
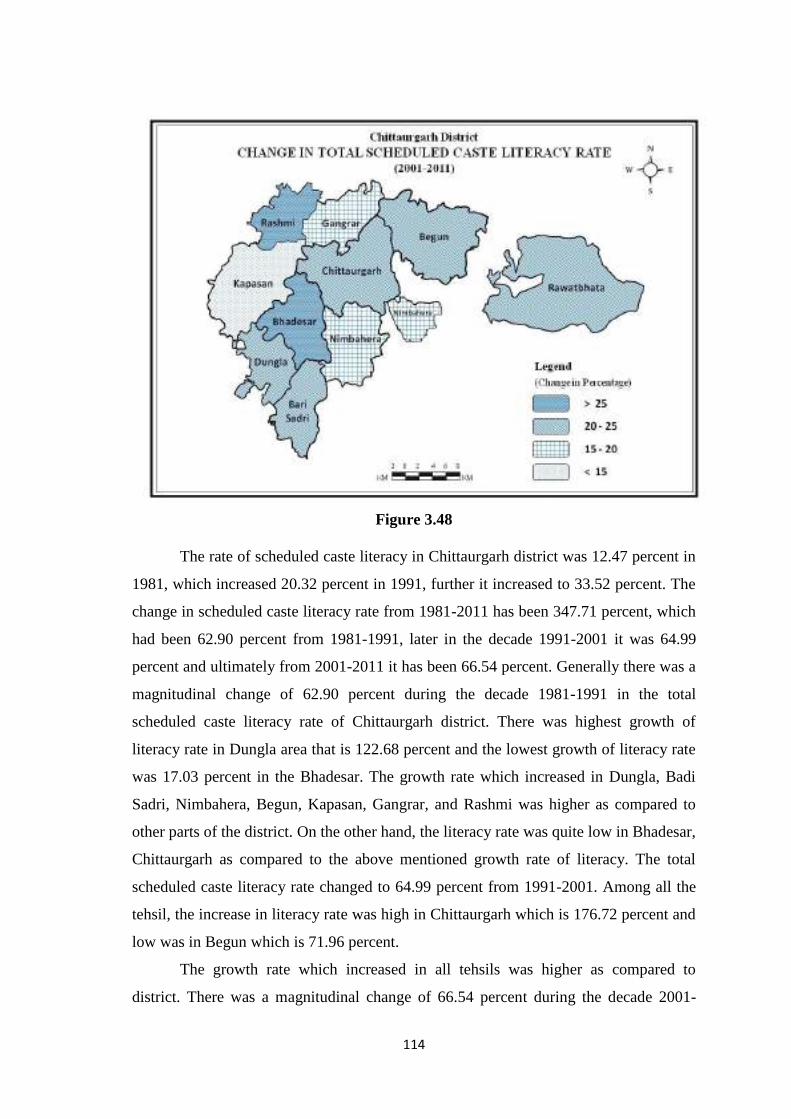
114
Figure 3.48
The rate of scheduled caste literacy in Chittaurgarh district was 12.47 percent in
1981, which increased 20.32 percent in 1991, further it increased to 33.52 percent. The
change in scheduled caste literacy rate from 1981-2011 has been 347.71 percent, which
had been 62.90 percent from 1981-1991, later in the decade 1991-2001 it was 64.99
percent and ultimately from 2001-2011 it has been 66.54 percent. Generally there was a
magnitudinal change of 62.90 percent during the decade 1981-1991 in the total
scheduled caste literacy rate of Chittaurgarh district. There was highest growth of
literacy rate in Dungla area that is 122.68 percent and the lowest growth of literacy rate
was 17.03 percent in the Bhadesar. The growth rate which increased in Dungla, Badi
Sadri, Nimbahera, Begun, Kapasan, Gangrar, and Rashmi was higher as compared to
other parts of the district. On the other hand, the literacy rate was quite low in Bhadesar,
Chittaurgarh as compared to the above mentioned growth rate of literacy. The total
scheduled caste literacy rate changed to 64.99 percent from 1991-2001. Among all the
tehsil, the increase in literacy rate was high in Chittaurgarh which is 176.72 percent and
low was in Begun which is 71.96 percent.
The growth rate which increased in all tehsils was higher as compared to
district. There was a magnitudinal change of 66.54 percent during the decade 2001-
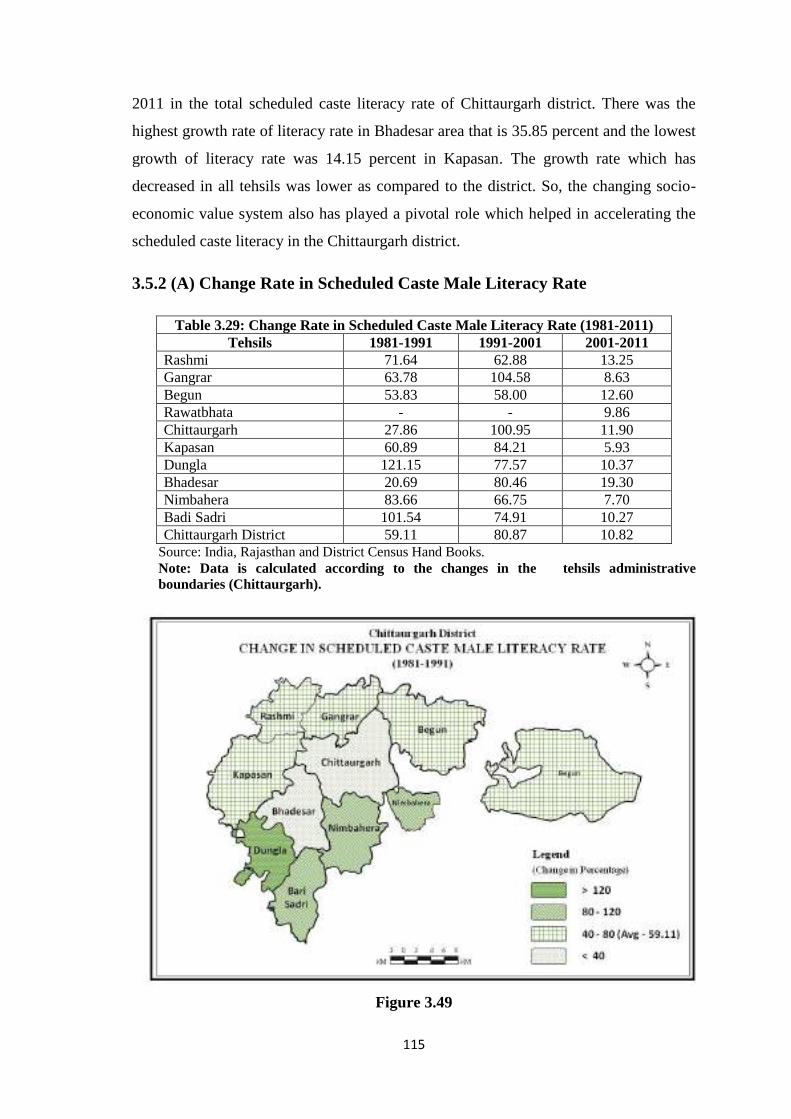
115
2011 in the total scheduled caste literacy rate of Chittaurgarh district. There was the
highest growth rate of literacy rate in Bhadesar area that is 35.85 percent and the lowest
growth of literacy rate was 14.15 percent in Kapasan. The growth rate which has
decreased in all tehsils was lower as compared to the district. So, the changing socio-
economic value system also has played a pivotal role which helped in accelerating the
scheduled caste literacy in the Chittaurgarh district.
3.5.2 (A) Change Rate in Scheduled Caste Male Literacy Rate
Table 3.29: Change Rate in Scheduled Caste Male Literacy Rate (1981-2011) Tehsils 1981-1991 1991-2001 2001-2011
Rashmi 71.64 62.88 13.25 Gangrar 63.78 104.58 8.63 Begun 53.83 58.00 12.60 Rawatbhata - - 9.86 Chittaurgarh 27.86 100.95 11.90 Kapasan 60.89 84.21 5.93 Dungla 121.15 77.57 10.37 Bhadesar 20.69 80.46 19.30 Nimbahera 83.66 66.75 7.70 Badi Sadri 101.54 74.91 10.27 Chittaurgarh District 59.11 80.87 10.82
Source: India, Rajasthan and District Census Hand Books. Note: Data is calculated according to the changes in the tehsils administrative boundaries (Chittaurgarh).
Figure 3.49
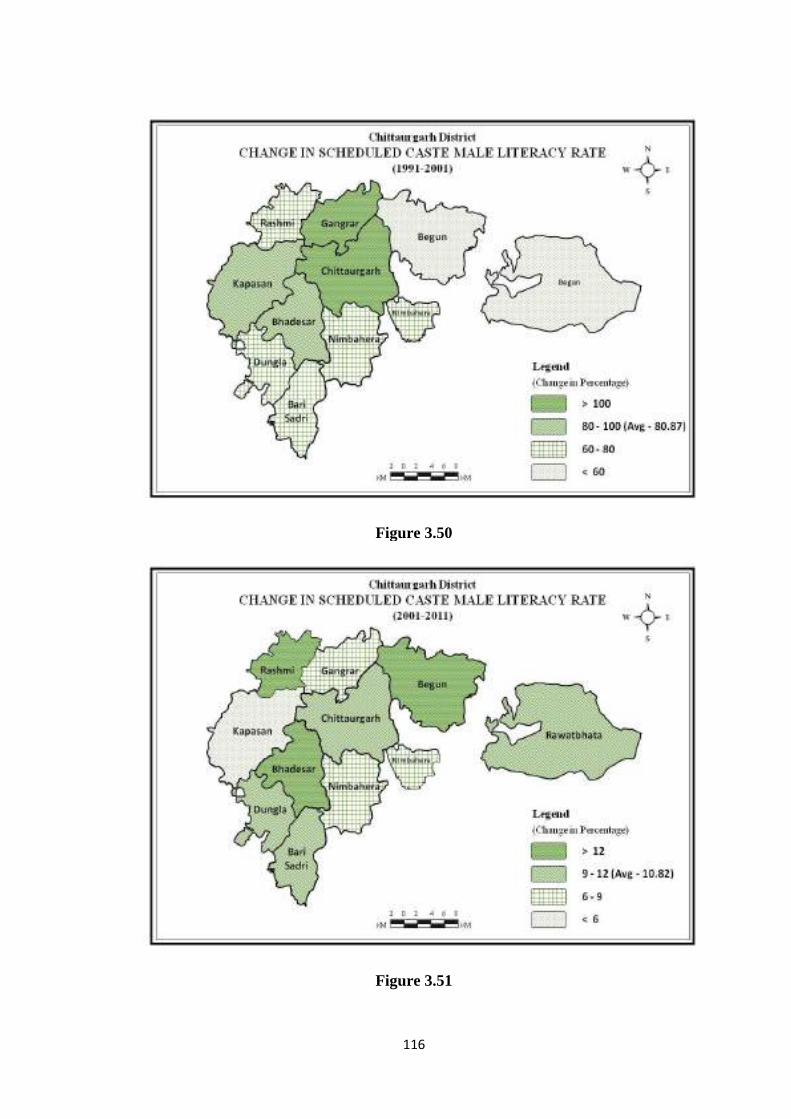
116
Figure 3.50
Figure 3.51
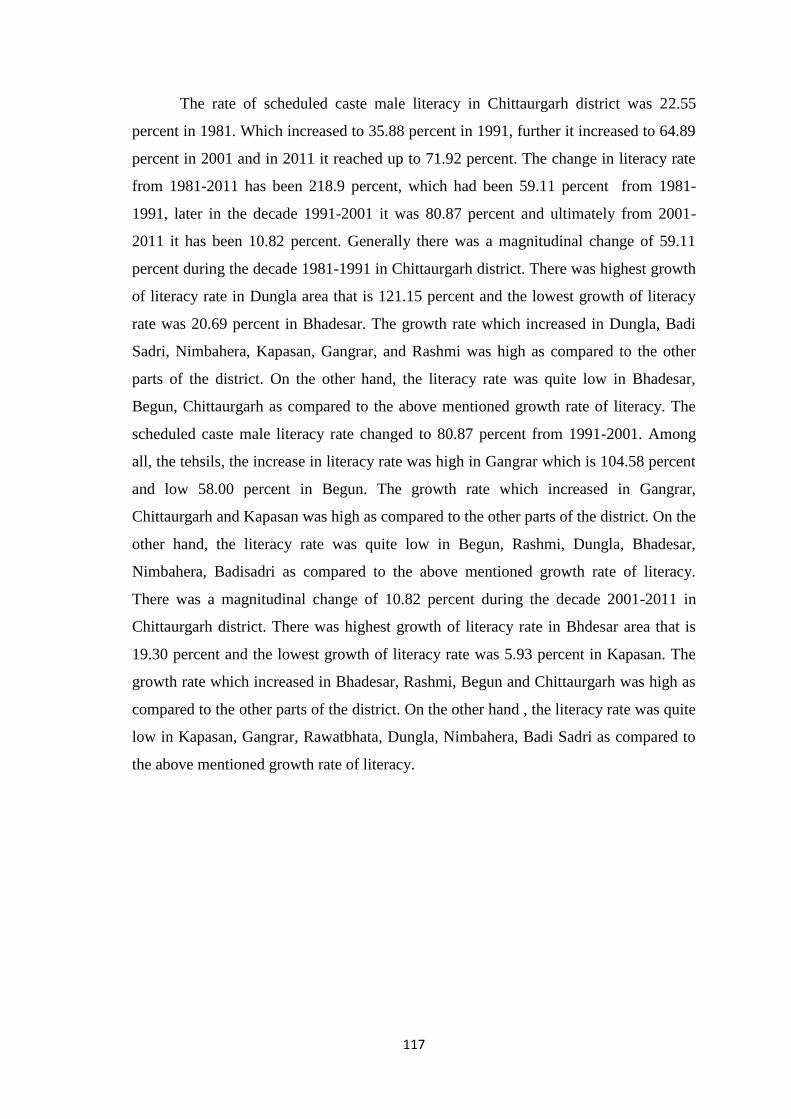
117
The rate of scheduled caste male literacy in Chittaurgarh district was 22.55
percent in 1981. Which increased to 35.88 percent in 1991, further it increased to 64.89
percent in 2001 and in 2011 it reached up to 71.92 percent. The change in literacy rate
from 1981-2011 has been 218.9 percent, which had been 59.11 percent from 1981-
1991, later in the decade 1991-2001 it was 80.87 percent and ultimately from 2001-
2011 it has been 10.82 percent. Generally there was a magnitudinal change of 59.11
percent during the decade 1981-1991 in Chittaurgarh district. There was highest growth
of literacy rate in Dungla area that is 121.15 percent and the lowest growth of literacy
rate was 20.69 percent in Bhadesar. The growth rate which increased in Dungla, Badi
Sadri, Nimbahera, Kapasan, Gangrar, and Rashmi was high as compared to the other
parts of the district. On the other hand, the literacy rate was quite low in Bhadesar,
Begun, Chittaurgarh as compared to the above mentioned growth rate of literacy. The
scheduled caste male literacy rate changed to 80.87 percent from 1991-2001. Among
all, the tehsils, the increase in literacy rate was high in Gangrar which is 104.58 percent
and low 58.00 percent in Begun. The growth rate which increased in Gangrar,
Chittaurgarh and Kapasan was high as compared to the other parts of the district. On the
other hand, the literacy rate was quite low in Begun, Rashmi, Dungla, Bhadesar,
Nimbahera, Badisadri as compared to the above mentioned growth rate of literacy.
There was a magnitudinal change of 10.82 percent during the decade 2001-2011 in
Chittaurgarh district. There was highest growth of literacy rate in Bhdesar area that is
19.30 percent and the lowest growth of literacy rate was 5.93 percent in Kapasan. The
growth rate which increased in Bhadesar, Rashmi, Begun and Chittaurgarh was high as
compared to the other parts of the district. On the other hand , the literacy rate was quite
low in Kapasan, Gangrar, Rawatbhata, Dungla, Nimbahera, Badi Sadri as compared to
the above mentioned growth rate of literacy.
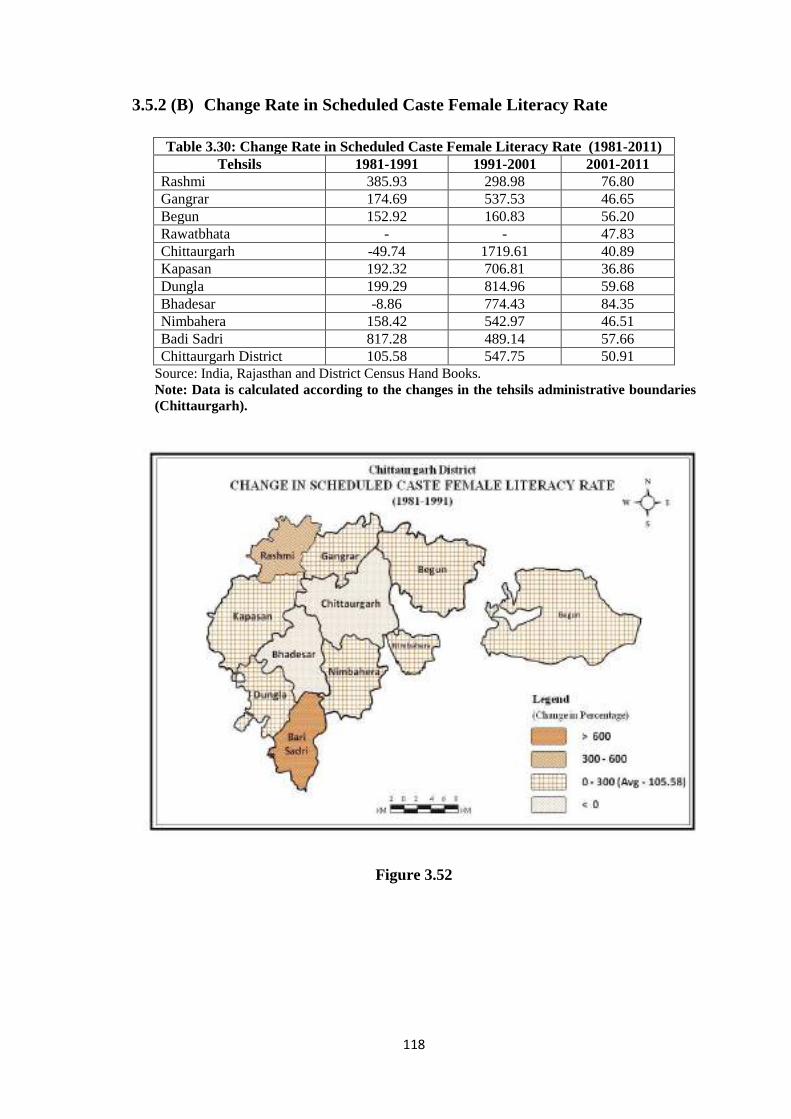
118
3.5.2 (B) Change Rate in Scheduled Caste Female Literacy Rate
Table 3.30: Change Rate in Scheduled Caste Female Literacy Rate (1981-2011) Tehsils 1981-1991 1991-2001 2001-2011
Rashmi 385.93 298.98 76.80 Gangrar 174.69 537.53 46.65 Begun 152.92 160.83 56.20 Rawatbhata - - 47.83 Chittaurgarh -49.74 1719.61 40.89 Kapasan 192.32 706.81 36.86 Dungla 199.29 814.96 59.68 Bhadesar -8.86 774.43 84.35 Nimbahera 158.42 542.97 46.51 Badi Sadri 817.28 489.14 57.66 Chittaurgarh District 105.58 547.75 50.91
Source: India, Rajasthan and District Census Hand Books. Note: Data is calculated according to the changes in the tehsils administrative boundaries (Chittaurgarh).
Figure 3.52
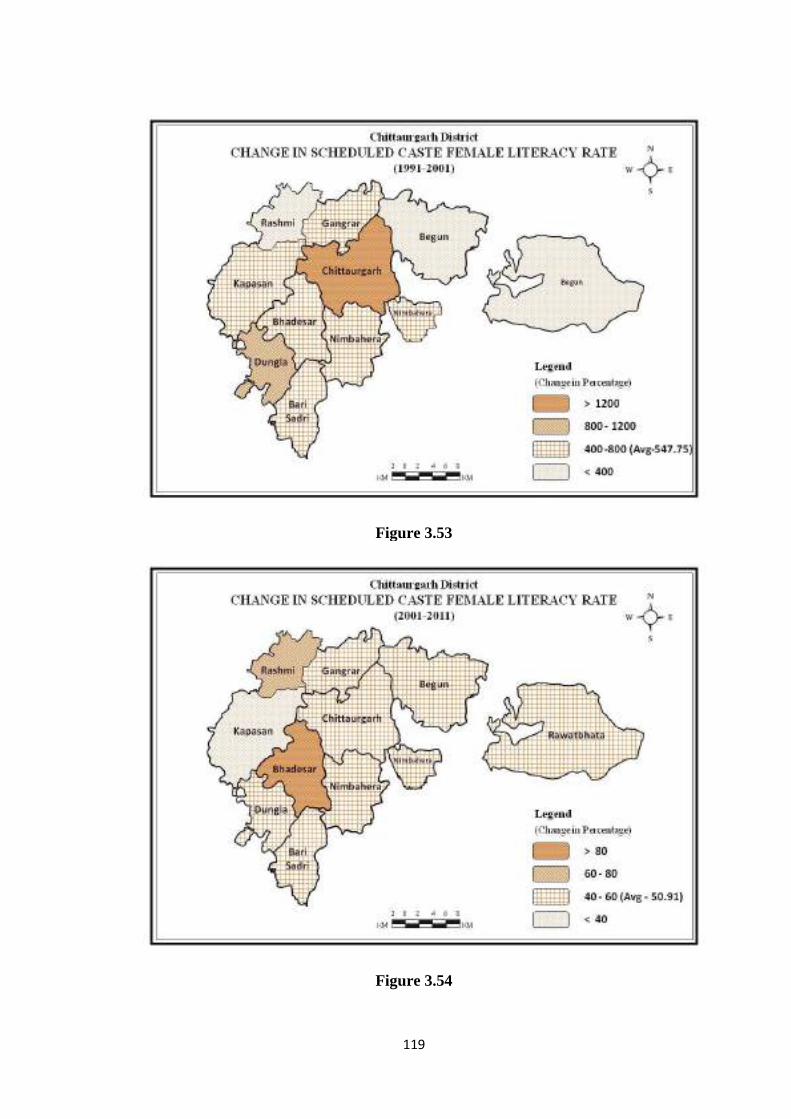
119
Figure 3.53
Figure 3.54
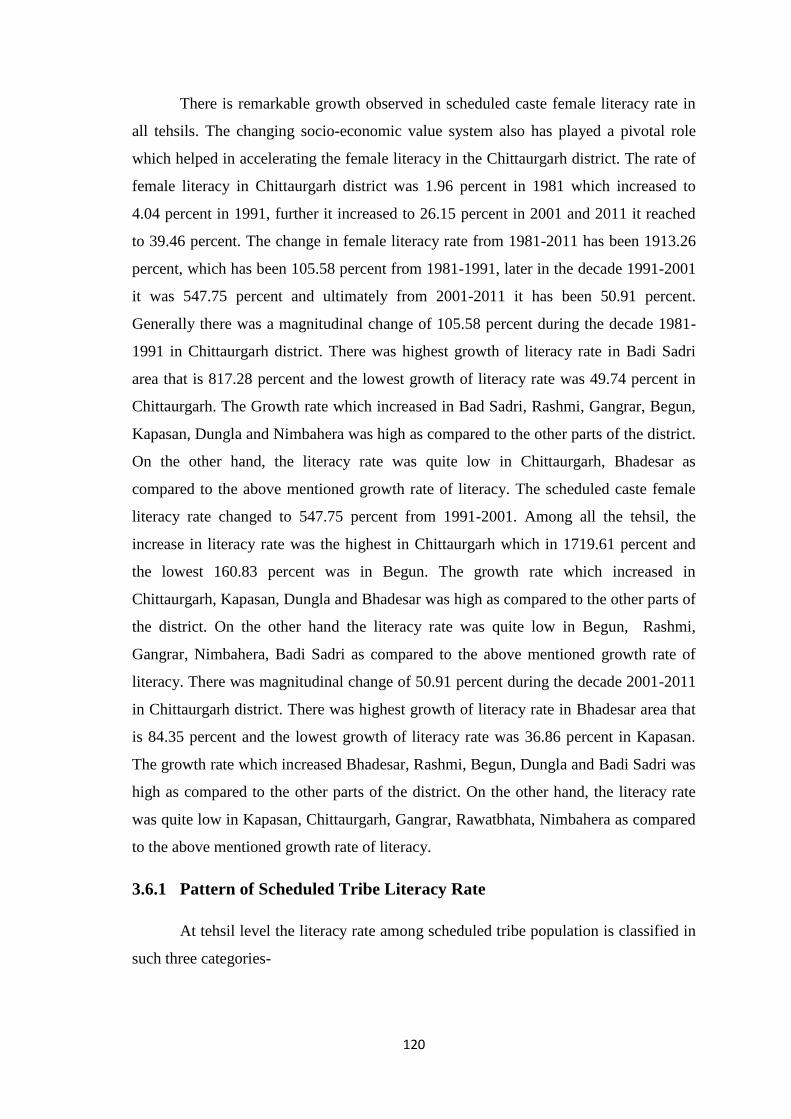
120
There is remarkable growth observed in scheduled caste female literacy rate in
all tehsils. The changing socio-economic value system also has played a pivotal role
which helped in accelerating the female literacy in the Chittaurgarh district. The rate of
female literacy in Chittaurgarh district was 1.96 percent in 1981 which increased to
4.04 percent in 1991, further it increased to 26.15 percent in 2001 and 2011 it reached
to 39.46 percent. The change in female literacy rate from 1981-2011 has been 1913.26
percent, which has been 105.58 percent from 1981-1991, later in the decade 1991-2001
it was 547.75 percent and ultimately from 2001-2011 it has been 50.91 percent.
Generally there was a magnitudinal change of 105.58 percent during the decade 1981-
1991 in Chittaurgarh district. There was highest growth of literacy rate in Badi Sadri
area that is 817.28 percent and the lowest growth of literacy rate was 49.74 percent in
Chittaurgarh. The Growth rate which increased in Bad Sadri, Rashmi, Gangrar, Begun,
Kapasan, Dungla and Nimbahera was high as compared to the other parts of the district.
On the other hand, the literacy rate was quite low in Chittaurgarh, Bhadesar as
compared to the above mentioned growth rate of literacy. The scheduled caste female
literacy rate changed to 547.75 percent from 1991-2001. Among all the tehsil, the
increase in literacy rate was the highest in Chittaurgarh which in 1719.61 percent and
the lowest 160.83 percent was in Begun. The growth rate which increased in
Chittaurgarh, Kapasan, Dungla and Bhadesar was high as compared to the other parts of
the district. On the other hand the literacy rate was quite low in Begun, Rashmi,
Gangrar, Nimbahera, Badi Sadri as compared to the above mentioned growth rate of
literacy. There was magnitudinal change of 50.91 percent during the decade 2001-2011
in Chittaurgarh district. There was highest growth of literacy rate in Bhadesar area that
is 84.35 percent and the lowest growth of literacy rate was 36.86 percent in Kapasan.
The growth rate which increased Bhadesar, Rashmi, Begun, Dungla and Badi Sadri was
high as compared to the other parts of the district. On the other hand, the literacy rate
was quite low in Kapasan, Chittaurgarh, Gangrar, Rawatbhata, Nimbahera as compared
to the above mentioned growth rate of literacy.
3.6.1 Pattern of Scheduled Tribe Literacy Rate
At tehsil level the literacy rate among scheduled tribe population is classified in
such three categories-
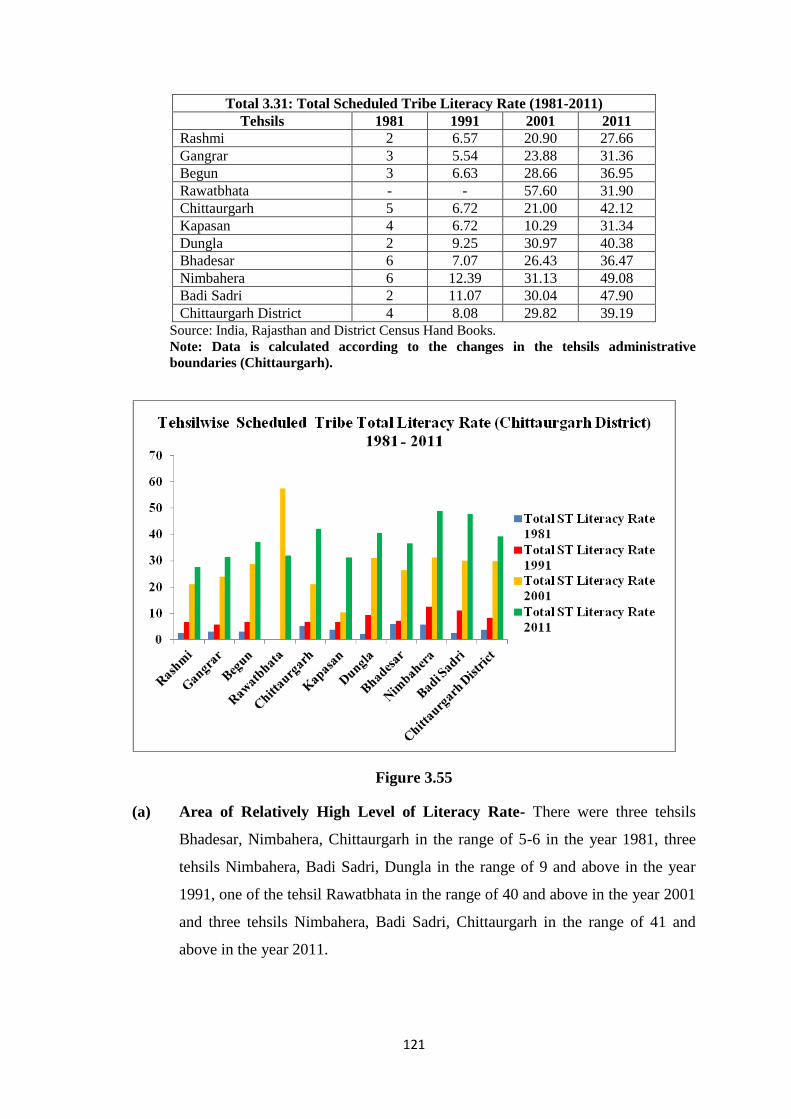
121
Total 3.31: Total Scheduled Tribe Literacy Rate (1981-2011) Tehsils 1981 1991 2001 2011
Rashmi 2 6.57 20.90 27.66 Gangrar 3 5.54 23.88 31.36 Begun 3 6.63 28.66 36.95 Rawatbhata - - 57.60 31.90 Chittaurgarh 5 6.72 21.00 42.12 Kapasan 4 6.72 10.29 31.34 Dungla 2 9.25 30.97 40.38 Bhadesar 6 7.07 26.43 36.47 Nimbahera 6 12.39 31.13 49.08 Badi Sadri 2 11.07 30.04 47.90 Chittaurgarh District 4 8.08 29.82 39.19
Source: India, Rajasthan and District Census Hand Books. Note: Data is calculated according to the changes in the tehsils administrative boundaries (Chittaurgarh).
Figure 3.55
(a) Area of Relatively High Level of Literacy Rate- There were three tehsils
Bhadesar, Nimbahera, Chittaurgarh in the range of 5-6 in the year 1981, three
tehsils Nimbahera, Badi Sadri, Dungla in the range of 9 and above in the year
1991, one of the tehsil Rawatbhata in the range of 40 and above in the year 2001
and three tehsils Nimbahera, Badi Sadri, Chittaurgarh in the range of 41 and
above in the year 2011.
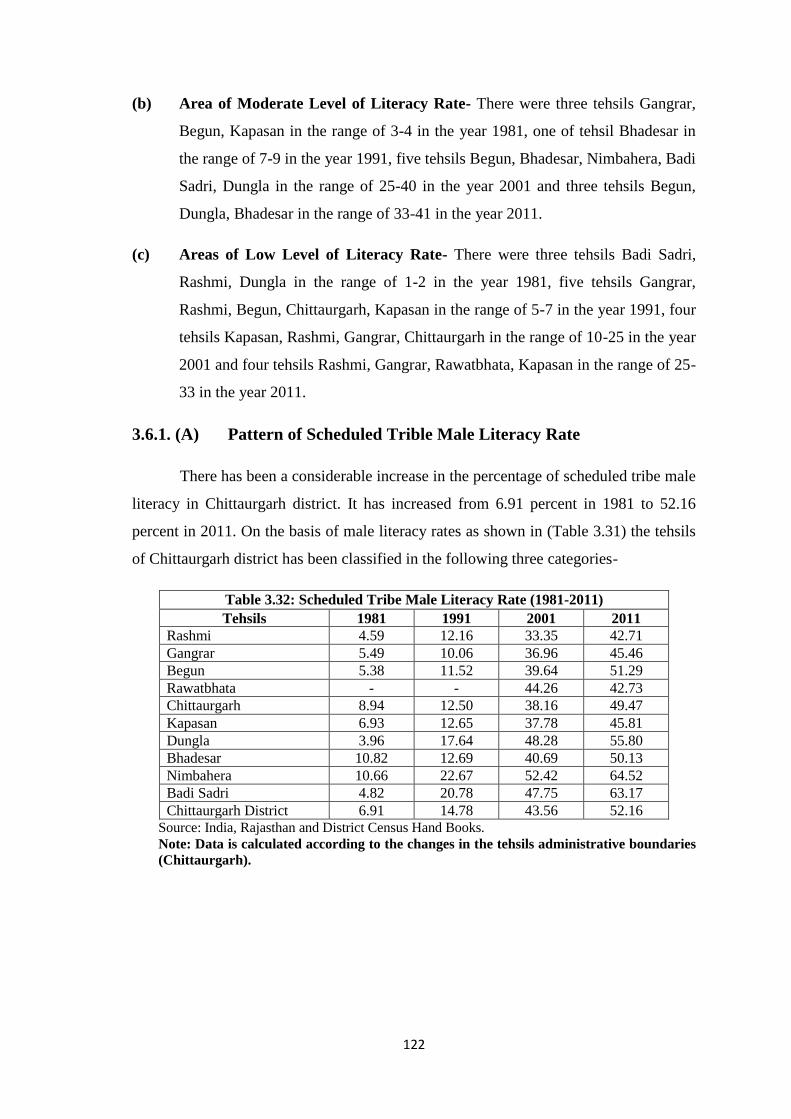
122
(b) Area of Moderate Level of Literacy Rate- There were three tehsils Gangrar,
Begun, Kapasan in the range of 3-4 in the year 1981, one of tehsil Bhadesar in
the range of 7-9 in the year 1991, five tehsils Begun, Bhadesar, Nimbahera, Badi
Sadri, Dungla in the range of 25-40 in the year 2001 and three tehsils Begun,
Dungla, Bhadesar in the range of 33-41 in the year 2011.
(c) Areas of Low Level of Literacy Rate- There were three tehsils Badi Sadri,
Rashmi, Dungla in the range of 1-2 in the year 1981, five tehsils Gangrar,
Rashmi, Begun, Chittaurgarh, Kapasan in the range of 5-7 in the year 1991, four
tehsils Kapasan, Rashmi, Gangrar, Chittaurgarh in the range of 10-25 in the year
2001 and four tehsils Rashmi, Gangrar, Rawatbhata, Kapasan in the range of 25-
33 in the year 2011.
3.6.1. (A) Pattern of Scheduled Trible Male Literacy Rate
There has been a considerable increase in the percentage of scheduled tribe male
literacy in Chittaurgarh district. It has increased from 6.91 percent in 1981 to 52.16
percent in 2011. On the basis of male literacy rates as shown in (Table 3.31) the tehsils
of Chittaurgarh district has been classified in the following three categories-
Table 3.32: Scheduled Tribe Male Literacy Rate (1981-2011) Tehsils 1981 1991 2001 2011
Rashmi 4.59 12.16 33.35 42.71 Gangrar 5.49 10.06 36.96 45.46 Begun 5.38 11.52 39.64 51.29 Rawatbhata - - 44.26 42.73 Chittaurgarh 8.94 12.50 38.16 49.47 Kapasan 6.93 12.65 37.78 45.81 Dungla 3.96 17.64 48.28 55.80 Bhadesar 10.82 12.69 40.69 50.13 Nimbahera 10.66 22.67 52.42 64.52 Badi Sadri 4.82 20.78 47.75 63.17 Chittaurgarh District 6.91 14.78 43.56 52.16
Source: India, Rajasthan and District Census Hand Books. Note: Data is calculated according to the changes in the tehsils administrative boundaries (Chittaurgarh).
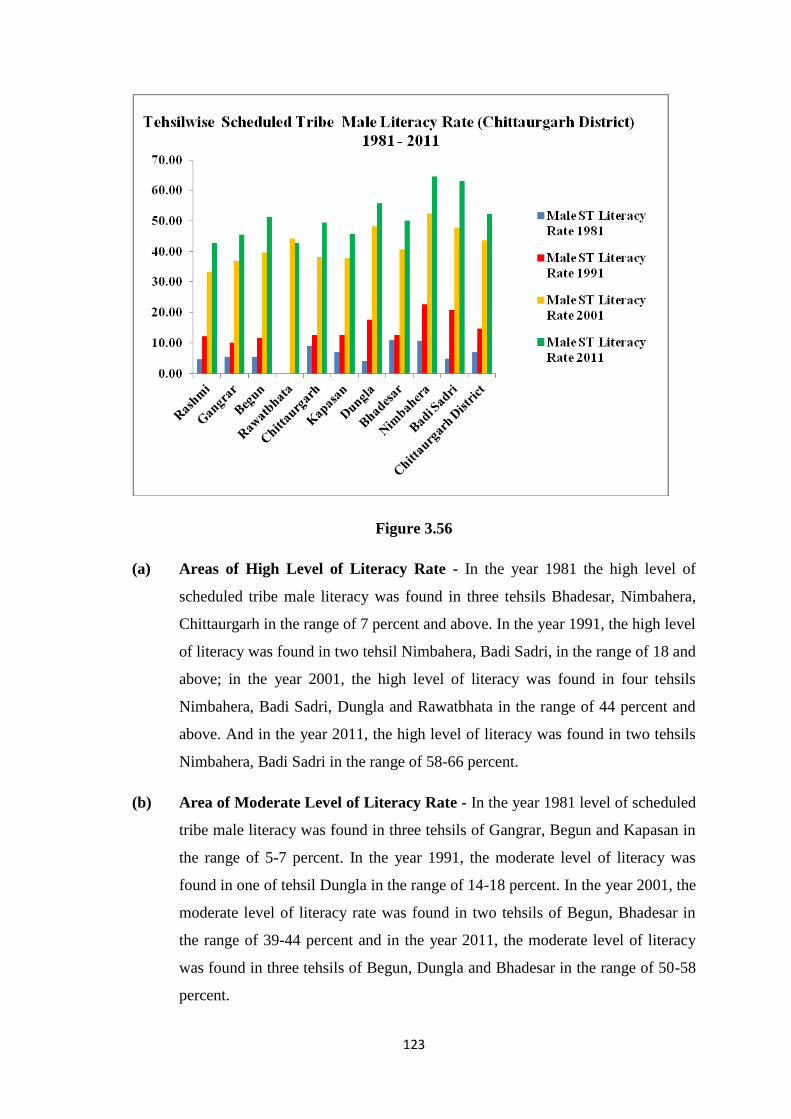
123
Figure 3.56
(a) Areas of High Level of Literacy Rate - In the year 1981 the high level of
scheduled tribe male literacy was found in three tehsils Bhadesar, Nimbahera,
Chittaurgarh in the range of 7 percent and above. In the year 1991, the high level
of literacy was found in two tehsil Nimbahera, Badi Sadri, in the range of 18 and
above; in the year 2001, the high level of literacy was found in four tehsils
Nimbahera, Badi Sadri, Dungla and Rawatbhata in the range of 44 percent and
above. And in the year 2011, the high level of literacy was found in two tehsils
Nimbahera, Badi Sadri in the range of 58-66 percent.
(b) Area of Moderate Level of Literacy Rate - In the year 1981 level of scheduled
tribe male literacy was found in three tehsils of Gangrar, Begun and Kapasan in
the range of 5-7 percent. In the year 1991, the moderate level of literacy was
found in one of tehsil Dungla in the range of 14-18 percent. In the year 2001, the
moderate level of literacy rate was found in two tehsils of Begun, Bhadesar in
the range of 39-44 percent and in the year 2011, the moderate level of literacy
was found in three tehsils of Begun, Dungla and Bhadesar in the range of 50-58
percent.
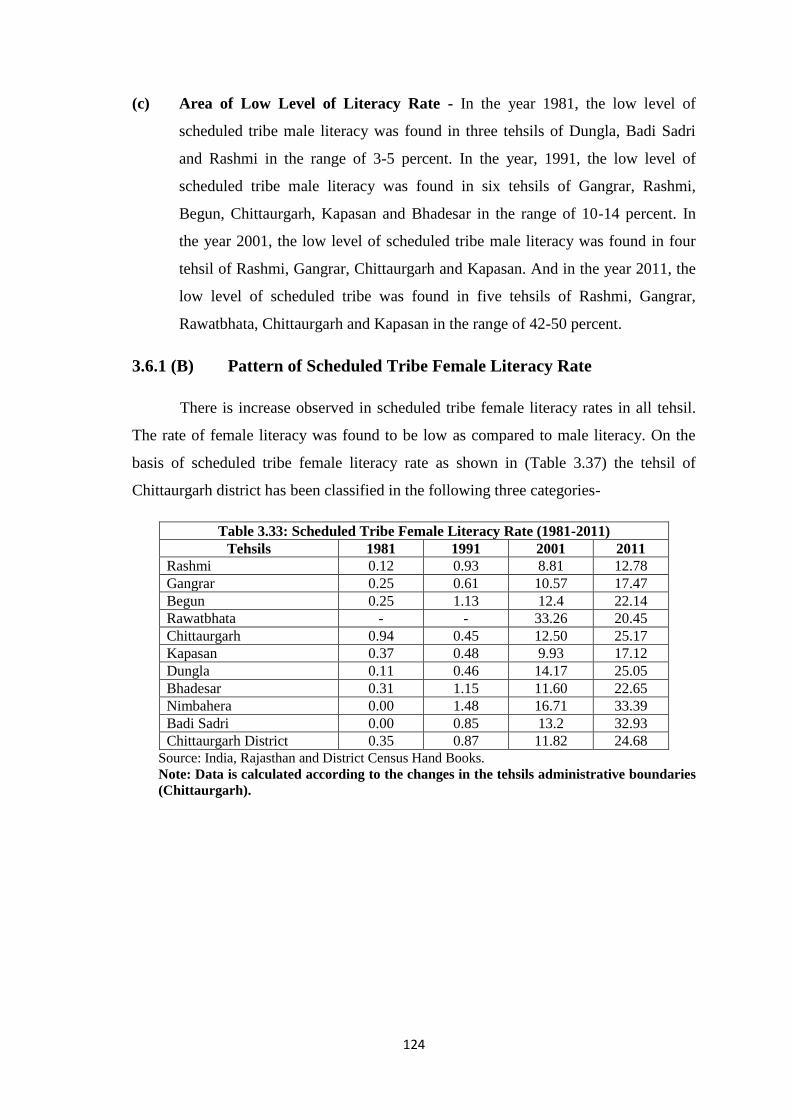
124
(c) Area of Low Level of Literacy Rate - In the year 1981, the low level of
scheduled tribe male literacy was found in three tehsils of Dungla, Badi Sadri
and Rashmi in the range of 3-5 percent. In the year, 1991, the low level of
scheduled tribe male literacy was found in six tehsils of Gangrar, Rashmi,
Begun, Chittaurgarh, Kapasan and Bhadesar in the range of 10-14 percent. In
the year 2001, the low level of scheduled tribe male literacy was found in four
tehsil of Rashmi, Gangrar, Chittaurgarh and Kapasan. And in the year 2011, the
low level of scheduled tribe was found in five tehsils of Rashmi, Gangrar,
Rawatbhata, Chittaurgarh and Kapasan in the range of 42-50 percent.
3.6.1 (B) Pattern of Scheduled Tribe Female Literacy Rate
There is increase observed in scheduled tribe female literacy rates in all tehsil.
The rate of female literacy was found to be low as compared to male literacy. On the
basis of scheduled tribe female literacy rate as shown in (Table 3.37) the tehsil of
Chittaurgarh district has been classified in the following three categories-
Table 3.33: Scheduled Tribe Female Literacy Rate (1981-2011) Tehsils 1981 1991 2001 2011
Rashmi 0.12 0.93 8.81 12.78 Gangrar 0.25 0.61 10.57 17.47 Begun 0.25 1.13 12.4 22.14 Rawatbhata - - 33.26 20.45 Chittaurgarh 0.94 0.45 12.50 25.17 Kapasan 0.37 0.48 9.93 17.12 Dungla 0.11 0.46 14.17 25.05 Bhadesar 0.31 1.15 11.60 22.65 Nimbahera 0.00 1.48 16.71 33.39 Badi Sadri 0.00 0.85 13.2 32.93 Chittaurgarh District 0.35 0.87 11.82 24.68
Source: India, Rajasthan and District Census Hand Books. Note: Data is calculated according to the changes in the tehsils administrative boundaries (Chittaurgarh).
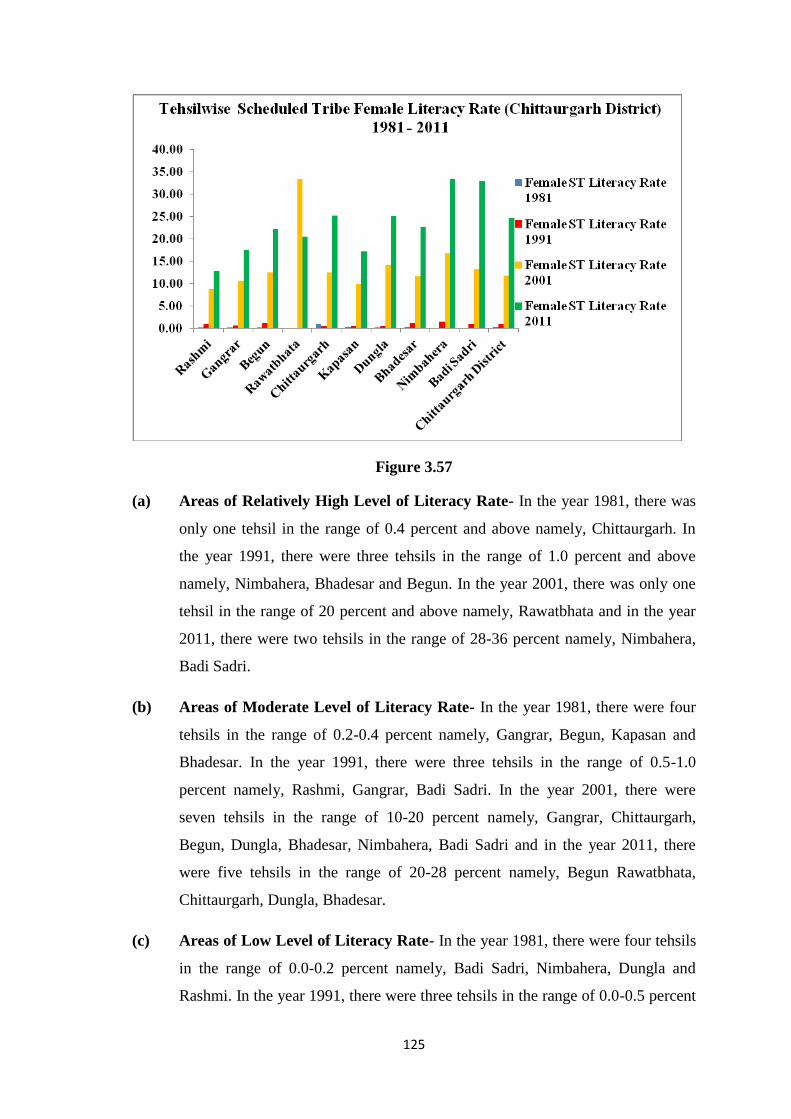
125
Figure 3.57
(a) Areas of Relatively High Level of Literacy Rate- In the year 1981, there was
only one tehsil in the range of 0.4 percent and above namely, Chittaurgarh. In
the year 1991, there were three tehsils in the range of 1.0 percent and above
namely, Nimbahera, Bhadesar and Begun. In the year 2001, there was only one
tehsil in the range of 20 percent and above namely, Rawatbhata and in the year
2011, there were two tehsils in the range of 28-36 percent namely, Nimbahera,
Badi Sadri.
(b) Areas of Moderate Level of Literacy Rate- In the year 1981, there were four
tehsils in the range of 0.2-0.4 percent namely, Gangrar, Begun, Kapasan and
Bhadesar. In the year 1991, there were three tehsils in the range of 0.5-1.0
percent namely, Rashmi, Gangrar, Badi Sadri. In the year 2001, there were
seven tehsils in the range of 10-20 percent namely, Gangrar, Chittaurgarh,
Begun, Dungla, Bhadesar, Nimbahera, Badi Sadri and in the year 2011, there
were five tehsils in the range of 20-28 percent namely, Begun Rawatbhata,
Chittaurgarh, Dungla, Bhadesar.
(c) Areas of Low Level of Literacy Rate- In the year 1981, there were four tehsils
in the range of 0.0-0.2 percent namely, Badi Sadri, Nimbahera, Dungla and
Rashmi. In the year 1991, there were three tehsils in the range of 0.0-0.5 percent
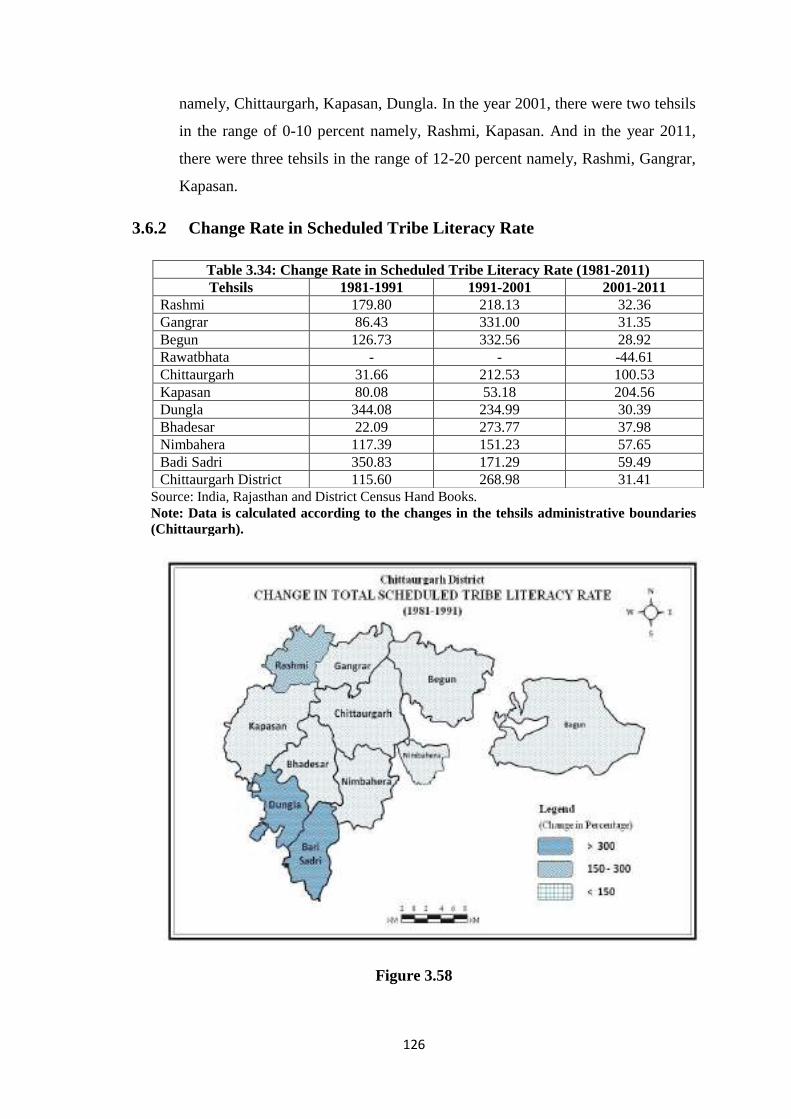
126
namely, Chittaurgarh, Kapasan, Dungla. In the year 2001, there were two tehsils
in the range of 0-10 percent namely, Rashmi, Kapasan. And in the year 2011,
there were three tehsils in the range of 12-20 percent namely, Rashmi, Gangrar,
Kapasan.
3.6.2 Change Rate in Scheduled Tribe Literacy Rate
Source: India, Rajasthan and District Census Hand Books. Note: Data is calculated according to the changes in the tehsils administrative boundaries (Chittaurgarh).
Figure 3.58
Table 3.34: Change Rate in Scheduled Tribe Literacy Rate (1981-2011) Tehsils 1981-1991 1991-2001 2001-2011
Rashmi 179.80 218.13 32.36 Gangrar 86.43 331.00 31.35 Begun 126.73 332.56 28.92 Rawatbhata - - -44.61 Chittaurgarh 31.66 212.53 100.53 Kapasan 80.08 53.18 204.56 Dungla 344.08 234.99 30.39 Bhadesar 22.09 273.77 37.98 Nimbahera 117.39 151.23 57.65 Badi Sadri 350.83 171.29 59.49 Chittaurgarh District 115.60 268.98 31.41
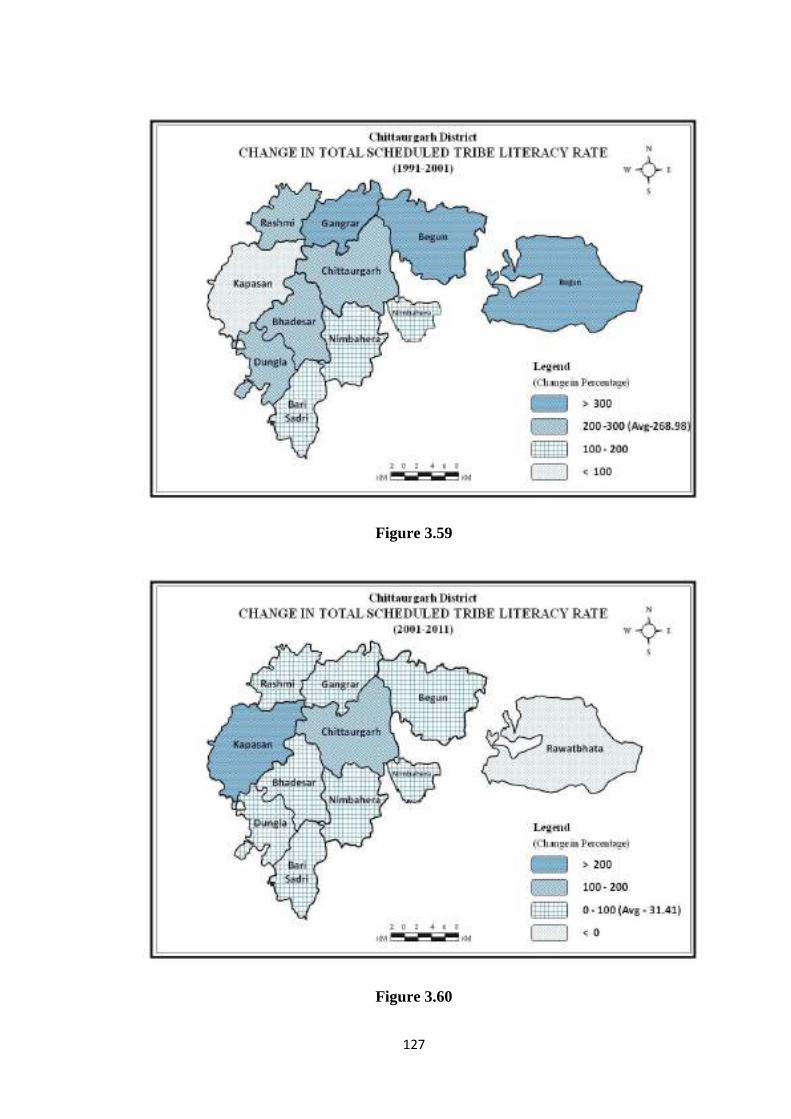
127
Figure 3.59
Figure 3.60
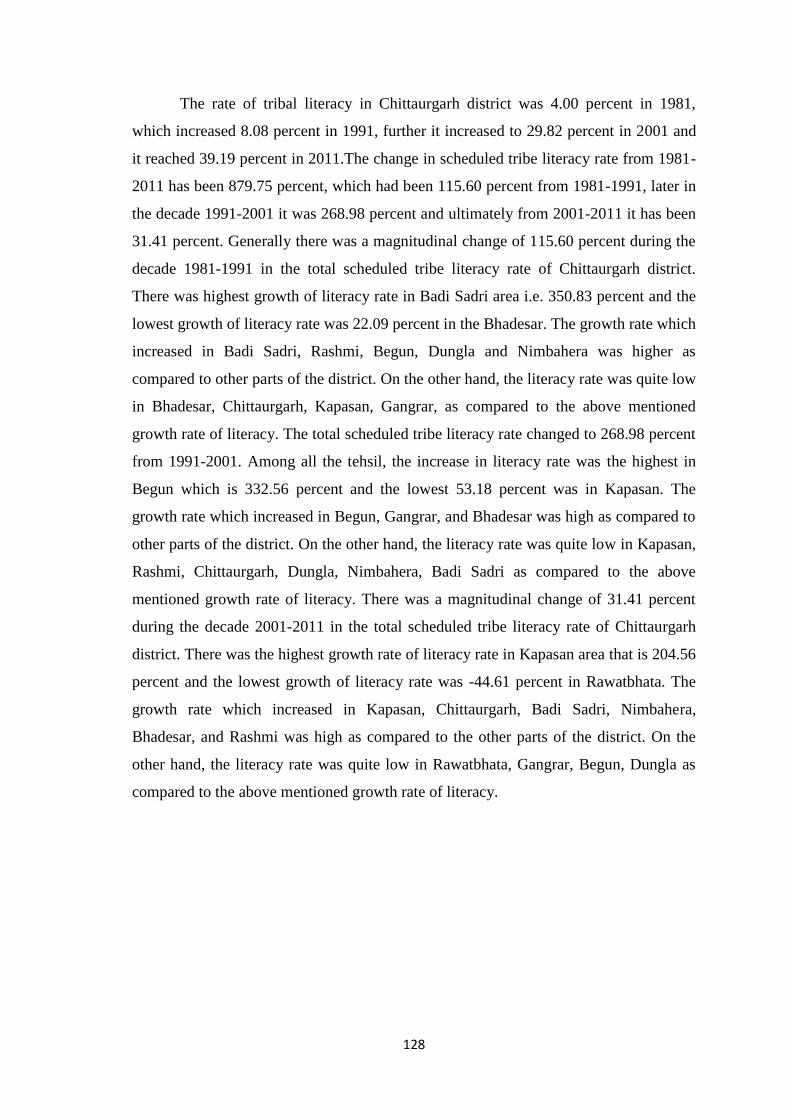
128
The rate of tribal literacy in Chittaurgarh district was 4.00 percent in 1981,
which increased 8.08 percent in 1991, further it increased to 29.82 percent in 2001 and
it reached 39.19 percent in 2011.The change in scheduled tribe literacy rate from 1981-
2011 has been 879.75 percent, which had been 115.60 percent from 1981-1991, later in
the decade 1991-2001 it was 268.98 percent and ultimately from 2001-2011 it has been
31.41 percent. Generally there was a magnitudinal change of 115.60 percent during the
decade 1981-1991 in the total scheduled tribe literacy rate of Chittaurgarh district.
There was highest growth of literacy rate in Badi Sadri area i.e. 350.83 percent and the
lowest growth of literacy rate was 22.09 percent in the Bhadesar. The growth rate which
increased in Badi Sadri, Rashmi, Begun, Dungla and Nimbahera was higher as
compared to other parts of the district. On the other hand, the literacy rate was quite low
in Bhadesar, Chittaurgarh, Kapasan, Gangrar, as compared to the above mentioned
growth rate of literacy. The total scheduled tribe literacy rate changed to 268.98 percent
from 1991-2001. Among all the tehsil, the increase in literacy rate was the highest in
Begun which is 332.56 percent and the lowest 53.18 percent was in Kapasan. The
growth rate which increased in Begun, Gangrar, and Bhadesar was high as compared to
other parts of the district. On the other hand, the literacy rate was quite low in Kapasan,
Rashmi, Chittaurgarh, Dungla, Nimbahera, Badi Sadri as compared to the above
mentioned growth rate of literacy. There was a magnitudinal change of 31.41 percent
during the decade 2001-2011 in the total scheduled tribe literacy rate of Chittaurgarh
district. There was the highest growth rate of literacy rate in Kapasan area that is 204.56
percent and the lowest growth of literacy rate was -44.61 percent in Rawatbhata. The
growth rate which increased in Kapasan, Chittaurgarh, Badi Sadri, Nimbahera,
Bhadesar, and Rashmi was high as compared to the other parts of the district. On the
other hand, the literacy rate was quite low in Rawatbhata, Gangrar, Begun, Dungla as
compared to the above mentioned growth rate of literacy.
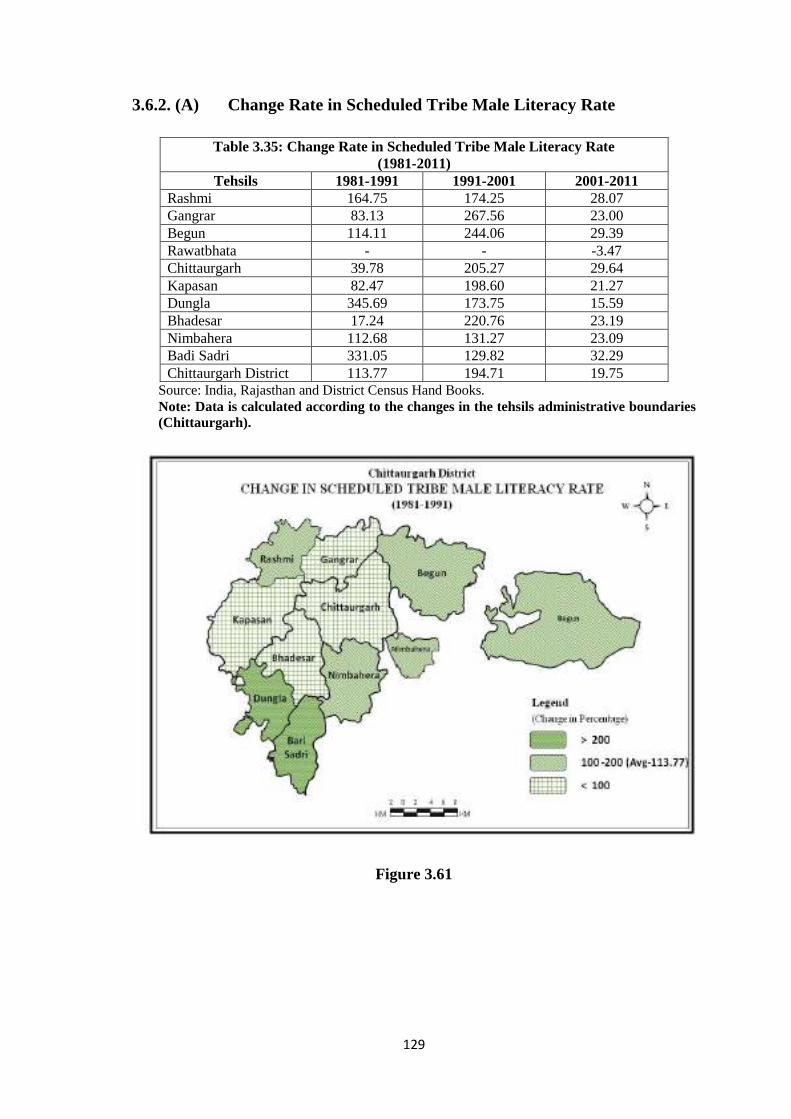
129
3.6.2. (A) Change Rate in Scheduled Tribe Male Literacy Rate
Table 3.35: Change Rate in Scheduled Tribe Male Literacy Rate (1981-2011)
Tehsils 1981-1991 1991-2001 2001-2011 Rashmi 164.75 174.25 28.07 Gangrar 83.13 267.56 23.00 Begun 114.11 244.06 29.39 Rawatbhata - - -3.47 Chittaurgarh 39.78 205.27 29.64 Kapasan 82.47 198.60 21.27 Dungla 345.69 173.75 15.59 Bhadesar 17.24 220.76 23.19 Nimbahera 112.68 131.27 23.09 Badi Sadri 331.05 129.82 32.29 Chittaurgarh District 113.77 194.71 19.75
Source: India, Rajasthan and District Census Hand Books. Note: Data is calculated according to the changes in the tehsils administrative boundaries (Chittaurgarh).
Figure 3.61
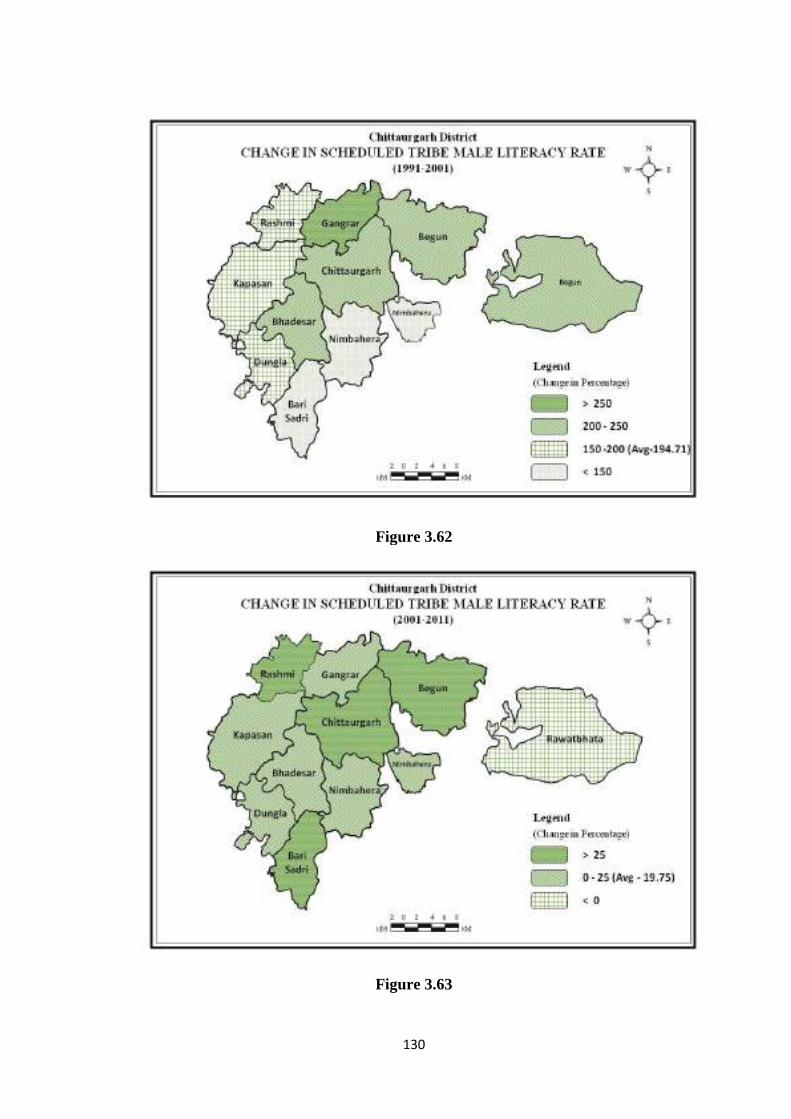
130
Figure 3.62
Figure 3.63
131
The rate of scheduled tribe male literacy in Chittaurgarh district was 6.91
percent in 1981, which increased to 14.78 percent in 1991, further it increased to 43.56
percent in 2001 and in 2011 it reached up to 52.16 percent. The change in literacy rate
from 1981-2011 has been 654.84 percent, which had been 113.77 percent from 1981-
1991, later in the decade 1991-2001 it was 194.71 percent and ultimately from 2001-
2011 it has been 19.75 percent. Generally, there was a magnitudinal change of 113.77
percent during the decade 1981-1991 in Chittaurgarh district. There was highest growth
of literacy rate in Dungla area that is 345.69 percent and the lowest growth of literacy
rate was 17.24 percent in Bhadesar. The growth rate which increased in Dungla,
Rashmi, Badi Sadri, and Begun was higher as compared to the other parts of the district.
On the other hand, the literacy rate was quite lower in Bhadesar, Gangrar, Chittaurgarh,
Nimbahera, Kapasan as compared to the above mentioned growth rate of literacy. The
scheduled tribe male literacy rate changed to 194.71 percent from 1991-2001. Among
all the tehsil, the increase in literacy rate was the highest in Gangrar area that is 267.56
percent and the lowest growth of literacy rate was 129.82 percent in Badi Sadri. The
growth rate which increased in Gangrar, Begun, Chittaurgarh, Kapasan, and Bhadesar
was high as compared to the other parts of the district. On the other hand, the literacy
rate was quite low in Badi Sadri, Nimbahera, Dungla, Rashmi, as compared to the
above mentioned growth rate of literacy. There was a magnitudinal change of 19.75
percent during the decade 2001-2011 in Chittaurgarh district. There was highest growth
of literacy rate in Badi Sadri area that is 32.29 percent and the lowest growth of literacy
rate was - 3.47 percent in Rawatbhata. The growth rate which increased in Badi Sadri,
Rashmi, Begun, Gangrar, Chittaurgarh, Kapasan, Bhadesar and Nimbahera was higher
as compared to the other parts of the district. On the other hand, the literacy rate was
quite low in Rawatbhata, Dungla as compared to the above mentioned growth rate of
literacy.
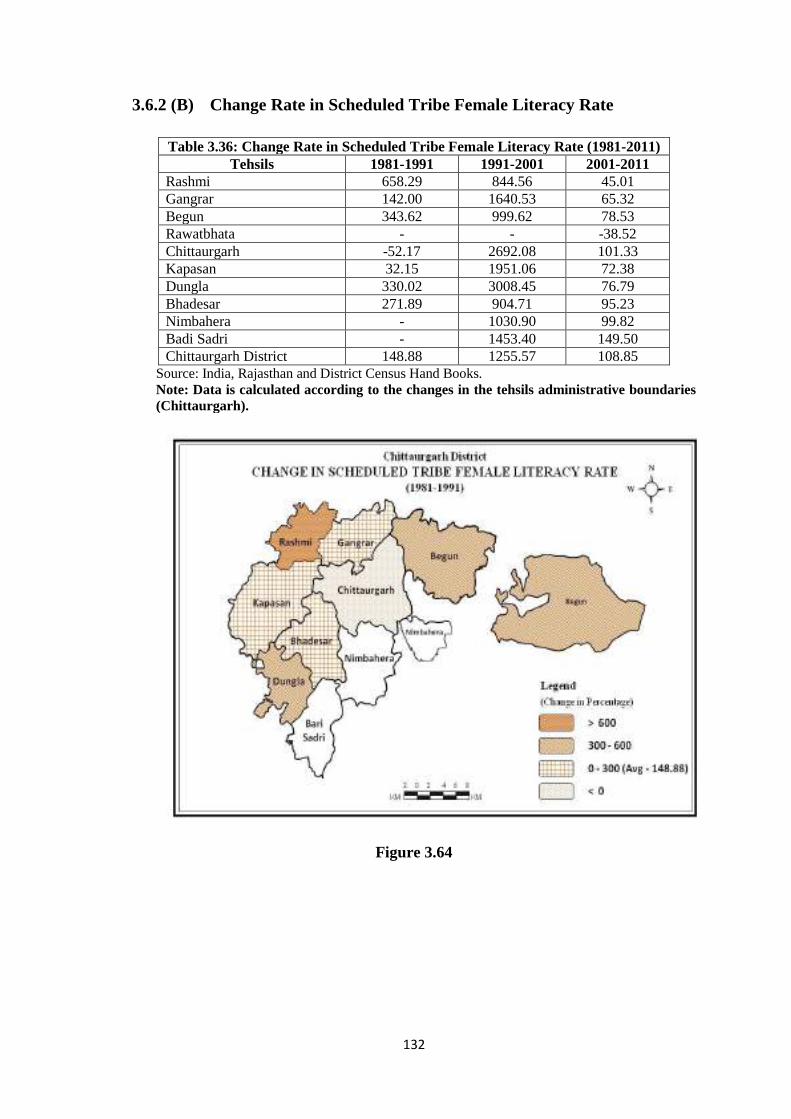
132
3.6.2 (B) Change Rate in Scheduled Tribe Female Literacy Rate
Table 3.36: Change Rate in Scheduled Tribe Female Literacy Rate (1981-2011) Tehsils 1981-1991 1991-2001 2001-2011
Rashmi 658.29 844.56 45.01 Gangrar 142.00 1640.53 65.32 Begun 343.62 999.62 78.53 Rawatbhata - - -38.52 Chittaurgarh -52.17 2692.08 101.33 Kapasan 32.15 1951.06 72.38 Dungla 330.02 3008.45 76.79 Bhadesar 271.89 904.71 95.23 Nimbahera - 1030.90 99.82 Badi Sadri - 1453.40 149.50 Chittaurgarh District 148.88 1255.57 108.85
Source: India, Rajasthan and District Census Hand Books. Note: Data is calculated according to the changes in the tehsils administrative boundaries (Chittaurgarh).
Figure 3.64
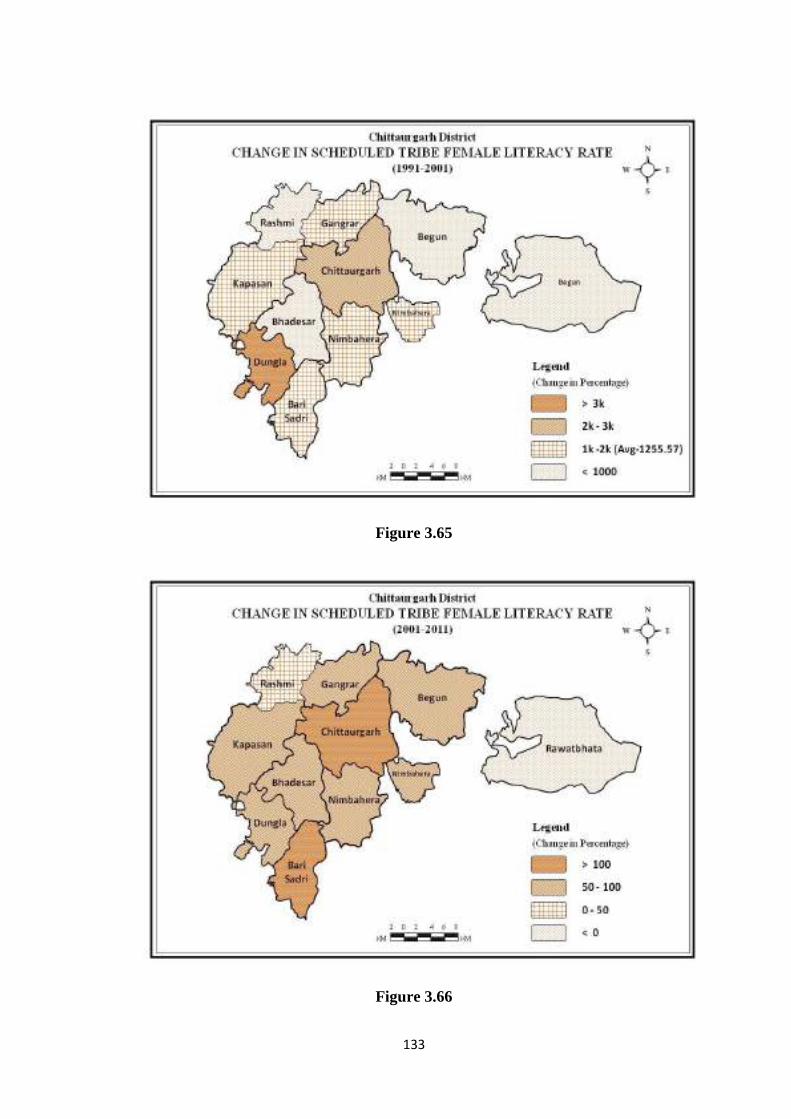
133
Figure 3.65
Figure 3.66
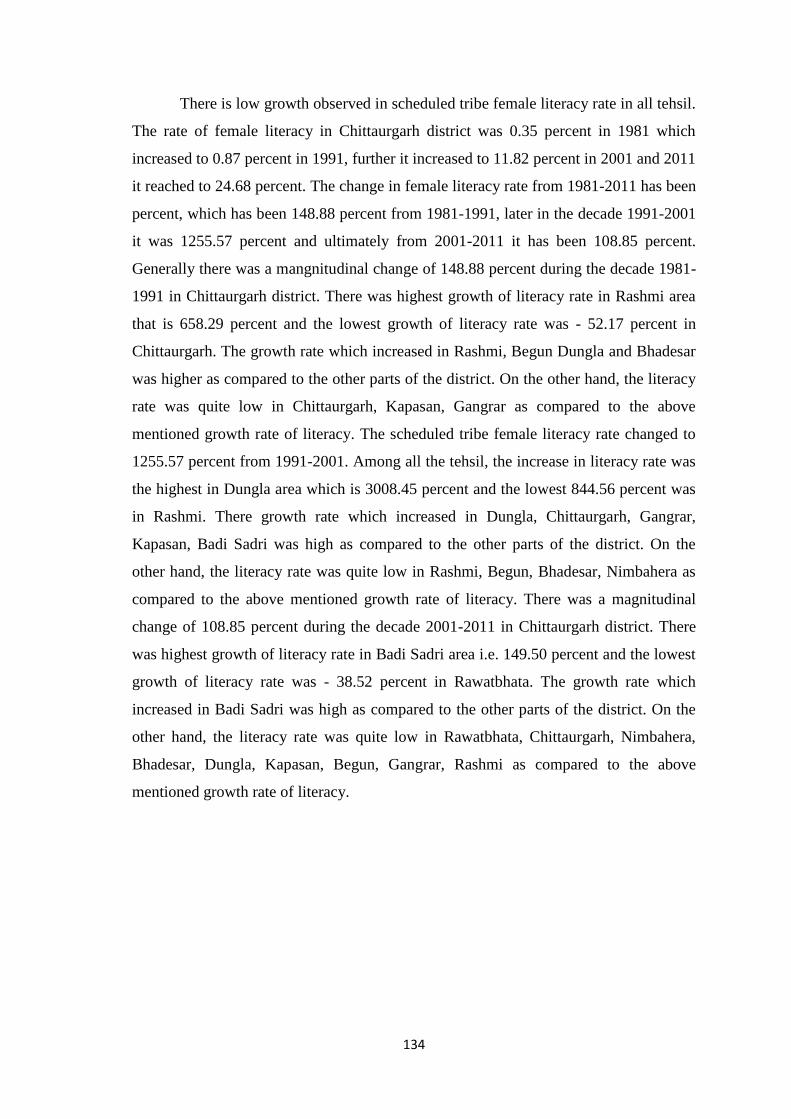
134
There is low growth observed in scheduled tribe female literacy rate in all tehsil.
The rate of female literacy in Chittaurgarh district was 0.35 percent in 1981 which
increased to 0.87 percent in 1991, further it increased to 11.82 percent in 2001 and 2011
it reached to 24.68 percent. The change in female literacy rate from 1981-2011 has been
percent, which has been 148.88 percent from 1981-1991, later in the decade 1991-2001
it was 1255.57 percent and ultimately from 2001-2011 it has been 108.85 percent.
Generally there was a mangnitudinal change of 148.88 percent during the decade 1981-
1991 in Chittaurgarh district. There was highest growth of literacy rate in Rashmi area
that is 658.29 percent and the lowest growth of literacy rate was - 52.17 percent in
Chittaurgarh. The growth rate which increased in Rashmi, Begun Dungla and Bhadesar
was higher as compared to the other parts of the district. On the other hand, the literacy
rate was quite low in Chittaurgarh, Kapasan, Gangrar as compared to the above
mentioned growth rate of literacy. The scheduled tribe female literacy rate changed to
1255.57 percent from 1991-2001. Among all the tehsil, the increase in literacy rate was
the highest in Dungla area which is 3008.45 percent and the lowest 844.56 percent was
in Rashmi. There growth rate which increased in Dungla, Chittaurgarh, Gangrar,
Kapasan, Badi Sadri was high as compared to the other parts of the district. On the
other hand, the literacy rate was quite low in Rashmi, Begun, Bhadesar, Nimbahera as
compared to the above mentioned growth rate of literacy. There was a magnitudinal
change of 108.85 percent during the decade 2001-2011 in Chittaurgarh district. There
was highest growth of literacy rate in Badi Sadri area i.e. 149.50 percent and the lowest
growth of literacy rate was - 38.52 percent in Rawatbhata. The growth rate which
increased in Badi Sadri was high as compared to the other parts of the district. On the
other hand, the literacy rate was quite low in Rawatbhata, Chittaurgarh, Nimbahera,
Bhadesar, Dungla, Kapasan, Begun, Gangrar, Rashmi as compared to the above
mentioned growth rate of literacy.
135
CHAPTER - IV
EDUCATIONAL FACILITIES AND EFFORTS FOR
LITERACY
4.1 Introduction
Education is about teaching, learning skills and knowledge. This means that
people help in learning things and support them to think about what they learn. It is also
important for teachers to find and learn ways to use them. Through education;
knowledge of society, country, and world passes generation-to-generation. Education
can help and guide individuals from one class to another. Education people and groups
can do things that cannot be educated less.
Education is important for the human, social and economic development of the
Nation. Development is not merely the statistical measure of the GNP of a country but
the development of its people as politically active, economically productive and
independent and able to make informed choices and intelligent decisions in matters that
affect them and their Nation. Education improves the productive capacity of societies
and their political, economic and scientific institutions (Reddy, 2001).
Education is a part of our life and is so much important for success in life, live
with happiness and prosperity, empowers mind that will be able to conceive good
thoughts and ideas, enables to the analysis while making life decisions. Education has
been unanimously accepted as a very potent and a highly significant social variable of
training about socio-economic and cultural transformation perceptions. It is the process
that liberates that mind and in its truest sense, goes beyond mere literacy. Education is
the training for the completeness of life, bringing perfection to life which means the
growth and development of personality; it qualifies a person to fulfill certain economic,
political and cultural functions and there by improve the socio-economic status of the
people. Education helps to equalize the status of individuals who belong to different
social status.
Education is one of the important factors of development and there is a strong
relationship between education and development. The globalization has affected the
136
education of the nation to great extent, where emphasis is largely from literacy to higher
education. Literacy has been accepted as one of the indicator of development of a
country as part of the vision of education for sustainable development of the world.
Education has been classified as formal, informal and non-formal categories,
where formal education is imparted in schools of general education. The objective of
such education is to equip the students to develop capabilities to learn various
disciplines of education, which they intend to, learn. The informal education is gathered
through media and general behaviour, where classroom system does not prevails. The
non formal system of education has been carried for the school age group children, who
cannot spare time to attend schools due to domestic reasons or other factors, but intend
to learn at the time of their convenience. Education is an investment, which brings
development in the long run.
According to Amartya Sen, the solution of all problems related to the economy,
development or population lies in education. Various determinants of education such as,
literacy, expenditure on education etc. affect the education development of a nation.
Education mostly in developing countries is faced with various problems, where access
to educational facilities in rural areas remains problematic and cost effective. The
education is an important tool for empowerment of the people in decision making
process and sharing benefits of development. Education is pre-requisite for the
successful implementation of national plans for economic and social development.
Development benefits a great deal from education, as outlined here under:
(i) Investment in human capital enhances the productivity and development.
(ii) Education provides widespread employment and income earning opportunities
to the qualified and skilled people.
(iii) Education is contributing factor in achieving development goals like increased
expectancy of life, improvement in health and reducing the fertility among
educated mothers.
(iv) A minimum level of schooling is a pre-requisite for the effectiveness of political
democracy and strengthening the democratic values in a society.
137
(v) Education can bring transparency accountability in implementation of rural
development programs.
(vi) Education promotes peace and stability in society and peace education has
become an independent discipline.
(vii) Education is an instrument for social upliftment and promotion of gender
equality, thereby enhancing work force participation with men.
(viii) Educated person can understand the values of right to information act and ask
for any information of public interest from government departments,
autonomous organizations and take benefit of Consumer Protection Act in
befitted manner.
So necessity of education has been stressed for speedy growth of human, socio-
economic development.
4.2 Educational Background of the Area
Literacy in any country plays an important and positive role in the socio-
economic development and the position of Chittaurgarh district in this respect is far
from satisfaction. 2011 Census report shows that only 61.71% of the total population is
literate and out of these figure women is 46.53 % but better than 1981 figure which was
only 9.35 %. The State and district chose the overall literacy program for the State and
the district, but the progress made was not marked.
Illiteracy is main hindrance in our development and growth. Eradication of
poverty, unemployment, child and mother care, family welfare, economic and social
welfare, protection of environment etc. can only be solved if the masses are literate.
Illiteracy is a curse that gives rise to many kinds of diseases, crimes, addictions,
lawsuits and bad habits. India lives in villages and as per 2011 Census figures male and
female rates in rural areas in 73.26% and 40.24% respectively, a figure for the entire
Chittaurgarh district.
Efficient and educated man-power of any country does affect the economy in an
important way. Literacy and socio-economic development have a positive co-existence.
"Literacy is one who can read and write some language. UNESCO has defined a literate
person “one who can with understanding both read and write a short simple Statement
138
on his everyday life.” There has been some progress in the field of education since
1950. The number of accredited primary, upper primary, secondary and senior
secondary schools has increased more than three times.
Keeping educational backwardness of the area in view, the district of
Chittaurgarh has made constant efforts to develop education in the district. To provide
education to all including females always had been a basic objective of the Chittaurgarh
district. For this, it has been decided to strengthen and encourage education in
Chittaurgarh to achieve this programme at different levels have also been launched. All
the children up to 14 years of age are to be provided education compulsorily. In 1981
Census only 21.94% persons were literate and out of this 33.91% percent males, 9.35%
females literate. The figures were alarming and the State government had to launch
various literacy programmes to cover up the gap. As a result in 2011 Census report the
figures rose to 61.71% for literacy figures. The percentage of male literacy rose from
33.91% in 1981 to 76.61% in 2011. Female literacy figure jumped from 9.35% to
46.53% almost four times than the previous figure. As per 2011 Census report
Nimbahera tehsil ranks first where 69.43% persons are literate, male and female literacy
are 83.84% and 54.67% respectively. In 1981 the figures were 26.43%, 40.67% and
11.17% respectively. As per 1981 Census Chittaurgarh tehsil ranks first where 29.76 %
persons are literate, male and female literacy are 42.52% and 15.88% respectively. In
2011 the figures were 69.39%, 81.77% and 56.61% respectively. As per 2011 Rashmi
tehsil ranks last where 52.89% persons are literate, male and female literacy are 70.05%
and 36.26% respectively. In 1981 the figures were 16.9%, 28.55% and 5.32%
respectively. As per 1981, Bhadesar tehsil ranks last where 15.67% persons are literate,
male and female literacy are 25.72% and 5.24% respectively. In 2011 the figures were
57.68%, 73.77% and 41.28% respectively.
The Census department considers all the children below 6 years are illiterate, the
figures of illiterate up to 510,006 persons (28.4%) in 2011. According to the 1981
Census, 56.11% persons of Chittaurgarh or about 962072 persons were illiterate. The
available figures point out the educational backwardness in this area.
There was large number of government primary and upper primary schools with
low enrolment and having insufficient number of teachers. Secondary schools were not
available in Gram Panchayat. Most of the schools were lacking in proper infrastructure.
139
There was huge number of vacancies in the schools. Due to improper facilities and
large number of vacancies learning levels of children were very low.
Present time, to ensure equality education and effective monitoring, State has
initiated several reforms and innovations-primary and upper primary schools integrated
with secondary schools resulting in 553 integrated schools with class 1-10/12 (in
Chittaurgarh). The number of government schools in the area is near about 1915 and the
total number enrolment of the students in the schools near about 199753.
4.3 Educational Infrastructure
Educational facilities are created by the government and managed by various
departments, where education department is the nodal agency to provide facilities to
children for achieving the target of universalization of elementary education. After
enactment of 73rd and 74th Constitutional Amendment, certain department was
identified to be managed by local bodies. This process of transfer of rural and urban
educational institutions is at different stages in the area. In addition, some schools have
been created in tribal concentrated areas getting Central assistance from the ministry of
tribal affairs of the government of India, while some schools are run for scheduled
castes children by the ministry of welfare. In addition to government efforts, private
sector is also involved in imparting education mostly in urban areas and in villages
having large concentration of population. Schools managed by private sector have to
get recognition of which some get grant in aid from the government.
4.3.1 Status of Ownership of School Buildings
Building of the school is an essential feature to create healthy atmosphere but
there are various constraints in construction of building for government schools. This
situation is also relevant for private schools who cannot afford their own buildings.
Usually at the time of sanction of school by the government, first choice remained to
locate community facilities as location of land and construction of building remained
problematic to the area. In last decade, efforts have been made for construction of
building or class rooms by available funds with the State funds become easier in lieu of
Central support for permanent works under relief and rural works. At the status of
building of schools till 2015-16 is as under.
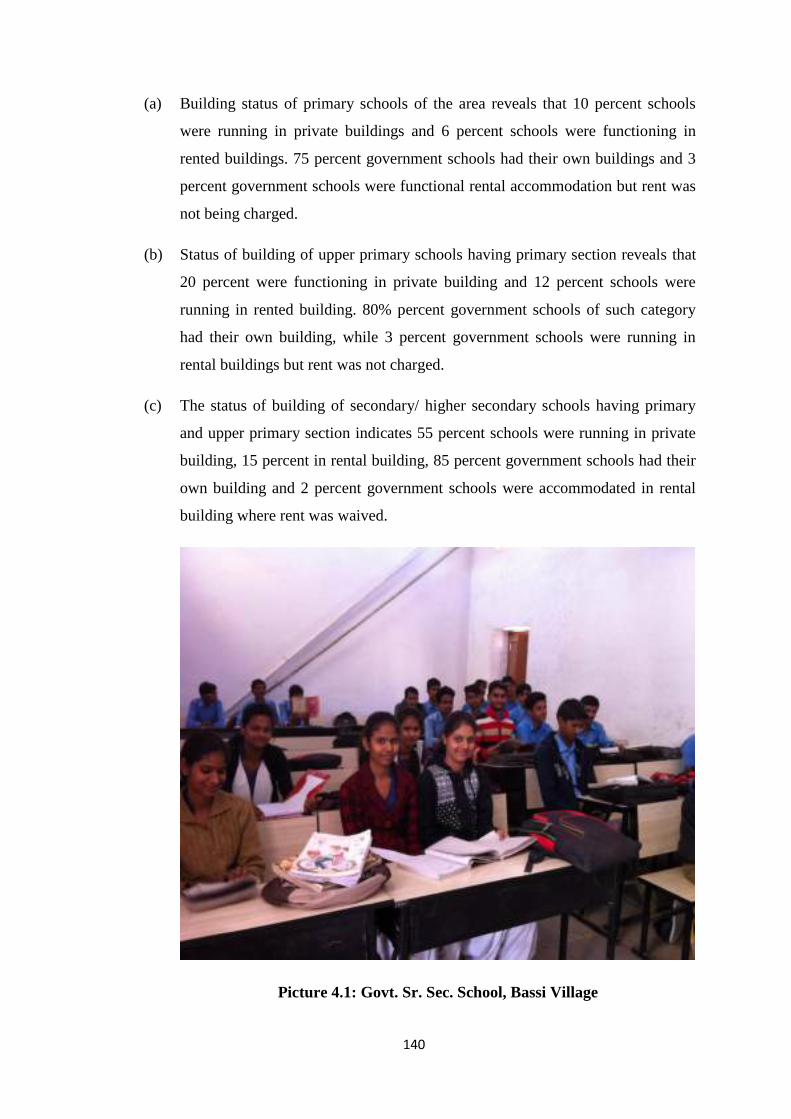
140
(a) Building status of primary schools of the area reveals that 10 percent schools
were running in private buildings and 6 percent schools were functioning in
rented buildings. 75 percent government schools had their own buildings and 3
percent government schools were functional rental accommodation but rent was
not being charged.
(b) Status of building of upper primary schools having primary section reveals that
20 percent were functioning in private building and 12 percent schools were
running in rented building. 80% percent government schools of such category
had their own building, while 3 percent government schools were running in
rental buildings but rent was not charged.
(c) The status of building of secondary/ higher secondary schools having primary
and upper primary section indicates 55 percent schools were running in private
building, 15 percent in rental building, 85 percent government schools had their
own building and 2 percent government schools were accommodated in rental
building where rent was waived.
Picture 4.1: Govt. Sr. Sec. School, Bassi Village
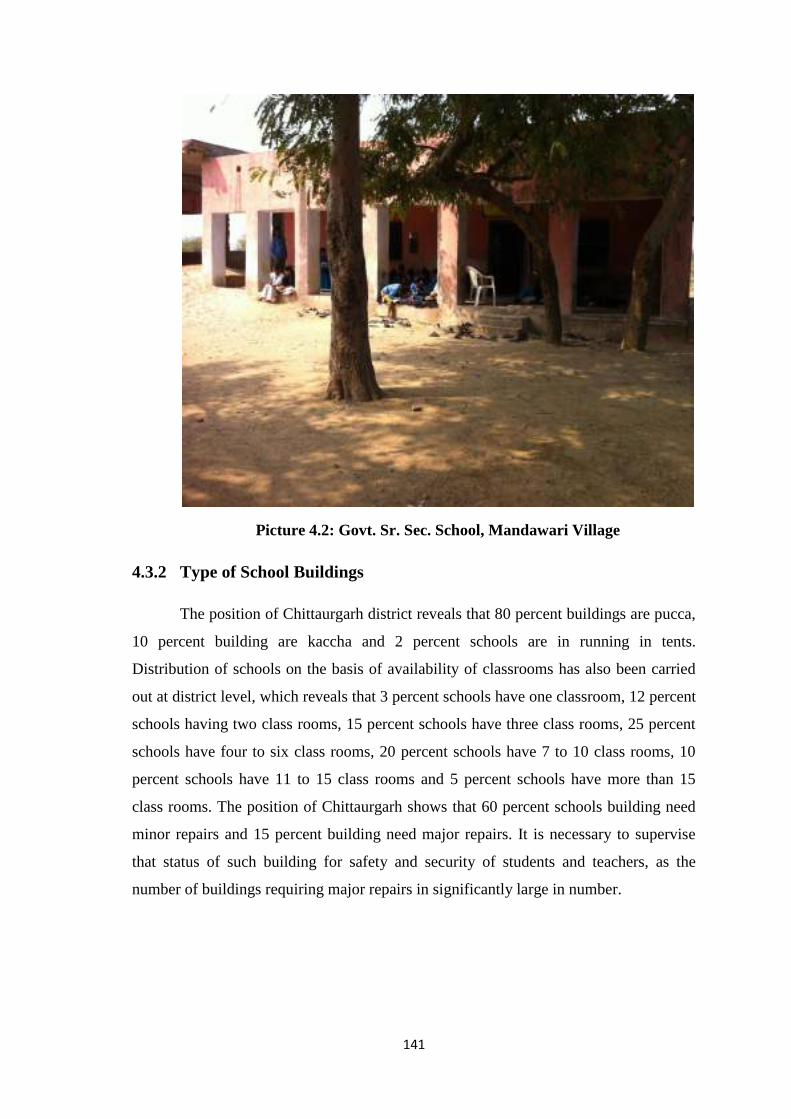
141
Picture 4.2: Govt. Sr. Sec. School, Mandawari Village
4.3.2 Type of School Buildings
The position of Chittaurgarh district reveals that 80 percent buildings are pucca,
10 percent building are kaccha and 2 percent schools are in running in tents.
Distribution of schools on the basis of availability of classrooms has also been carried
out at district level, which reveals that 3 percent schools have one classroom, 12 percent
schools having two class rooms, 15 percent schools have three class rooms, 25 percent
schools have four to six class rooms, 20 percent schools have 7 to 10 class rooms, 10
percent schools have 11 to 15 class rooms and 5 percent schools have more than 15
class rooms. The position of Chittaurgarh shows that 60 percent schools building need
minor repairs and 15 percent building need major repairs. It is necessary to supervise
that status of such building for safety and security of students and teachers, as the
number of buildings requiring major repairs in significantly large in number.
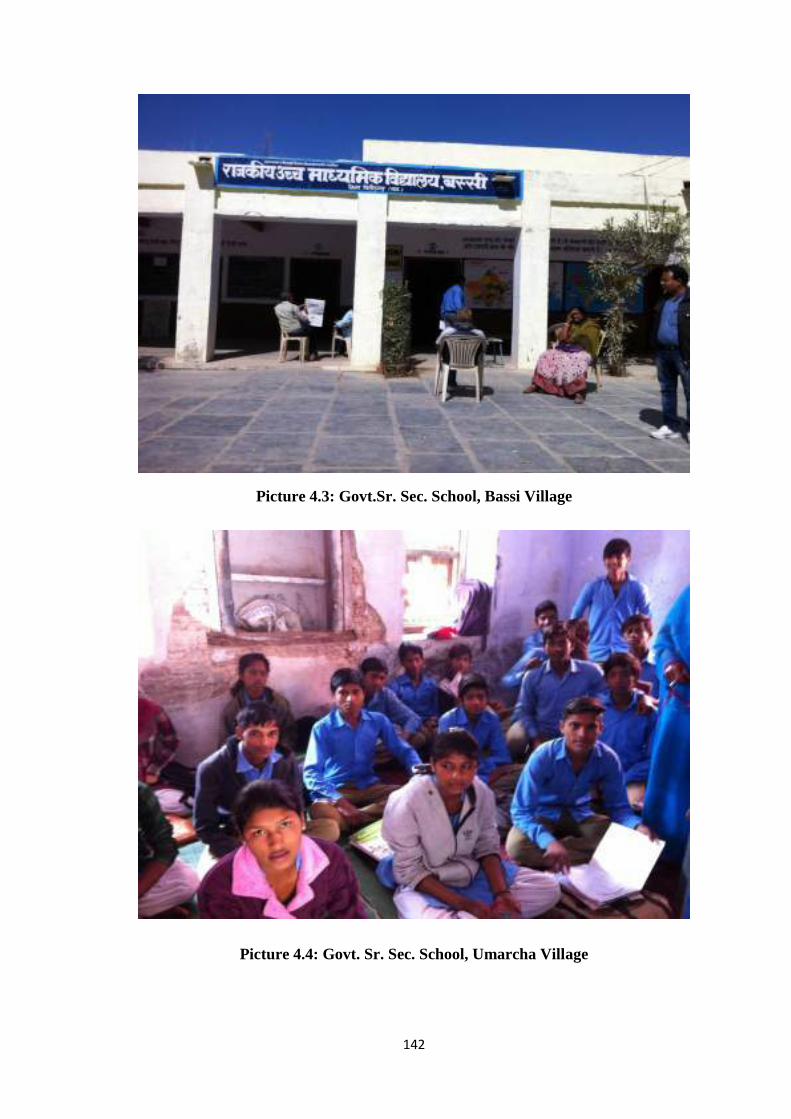
142
Picture 4.3: Govt.Sr. Sec. School, Bassi Village
Picture 4.4: Govt. Sr. Sec. School, Umarcha Village
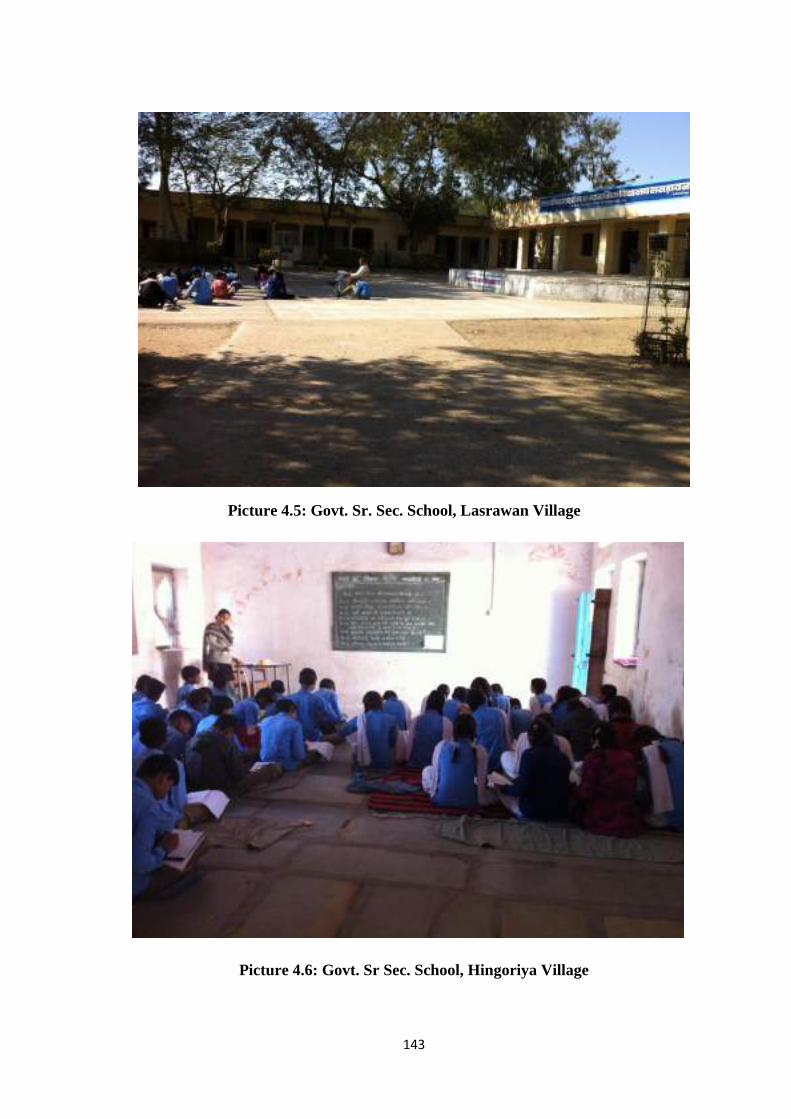
143
Picture 4.5: Govt. Sr. Sec. School, Lasrawan Village
Picture 4.6: Govt. Sr Sec. School, Hingoriya Village
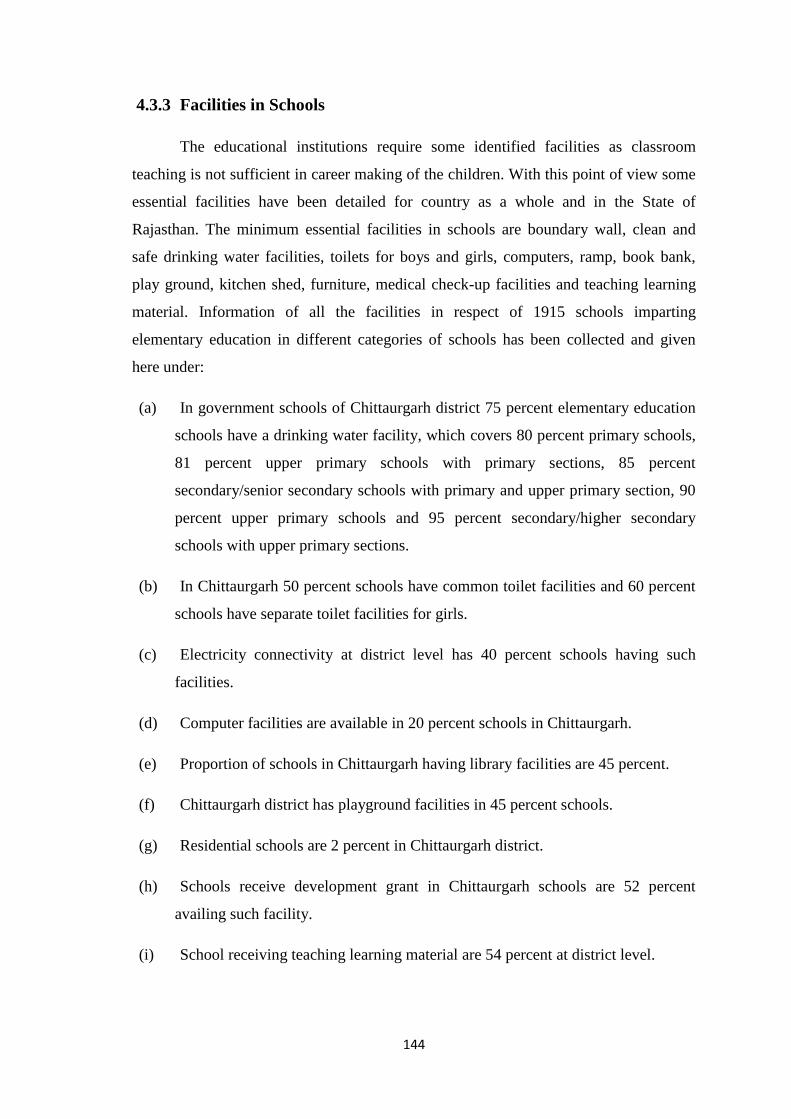
144
4.3.3 Facilities in Schools
The educational institutions require some identified facilities as classroom
teaching is not sufficient in career making of the children. With this point of view some
essential facilities have been detailed for country as a whole and in the State of
Rajasthan. The minimum essential facilities in schools are boundary wall, clean and
safe drinking water facilities, toilets for boys and girls, computers, ramp, book bank,
play ground, kitchen shed, furniture, medical check-up facilities and teaching learning
material. Information of all the facilities in respect of 1915 schools imparting
elementary education in different categories of schools has been collected and given
here under:
(a) In government schools of Chittaurgarh district 75 percent elementary education
schools have a drinking water facility, which covers 80 percent primary schools,
81 percent upper primary schools with primary sections, 85 percent
secondary/senior secondary schools with primary and upper primary section, 90
percent upper primary schools and 95 percent secondary/higher secondary
schools with upper primary sections.
(b) In Chittaurgarh 50 percent schools have common toilet facilities and 60 percent
schools have separate toilet facilities for girls.
(c) Electricity connectivity at district level has 40 percent schools having such
facilities.
(d) Computer facilities are available in 20 percent schools in Chittaurgarh.
(e) Proportion of schools in Chittaurgarh having library facilities are 45 percent.
(f) Chittaurgarh district has playground facilities in 45 percent schools.
(g) Residential schools are 2 percent in Chittaurgarh district.
(h) Schools receive development grant in Chittaurgarh schools are 52 percent
availing such facility.
(i) School receiving teaching learning material are 54 percent at district level.
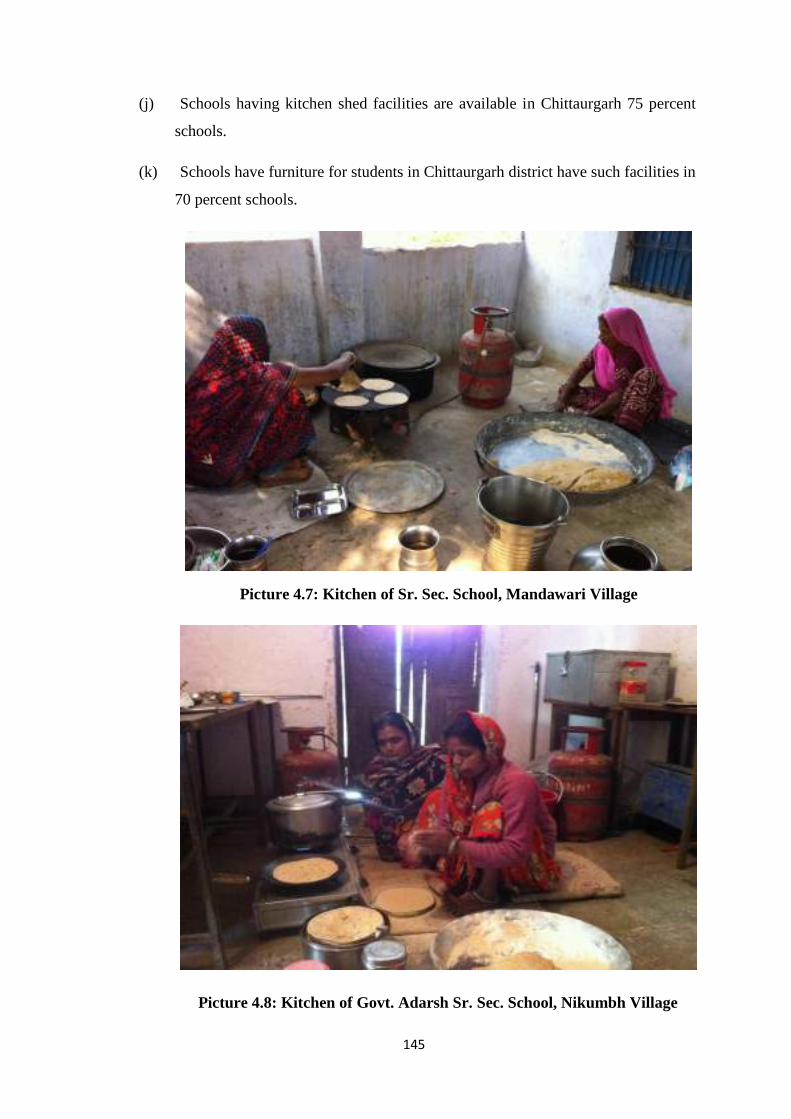
145
(j) Schools having kitchen shed facilities are available in Chittaurgarh 75 percent
schools.
(k) Schools have furniture for students in Chittaurgarh district have such facilities in
70 percent schools.
Picture 4.7: Kitchen of Sr. Sec. School, Mandawari Village
Picture 4.8: Kitchen of Govt. Adarsh Sr. Sec. School, Nikumbh Village
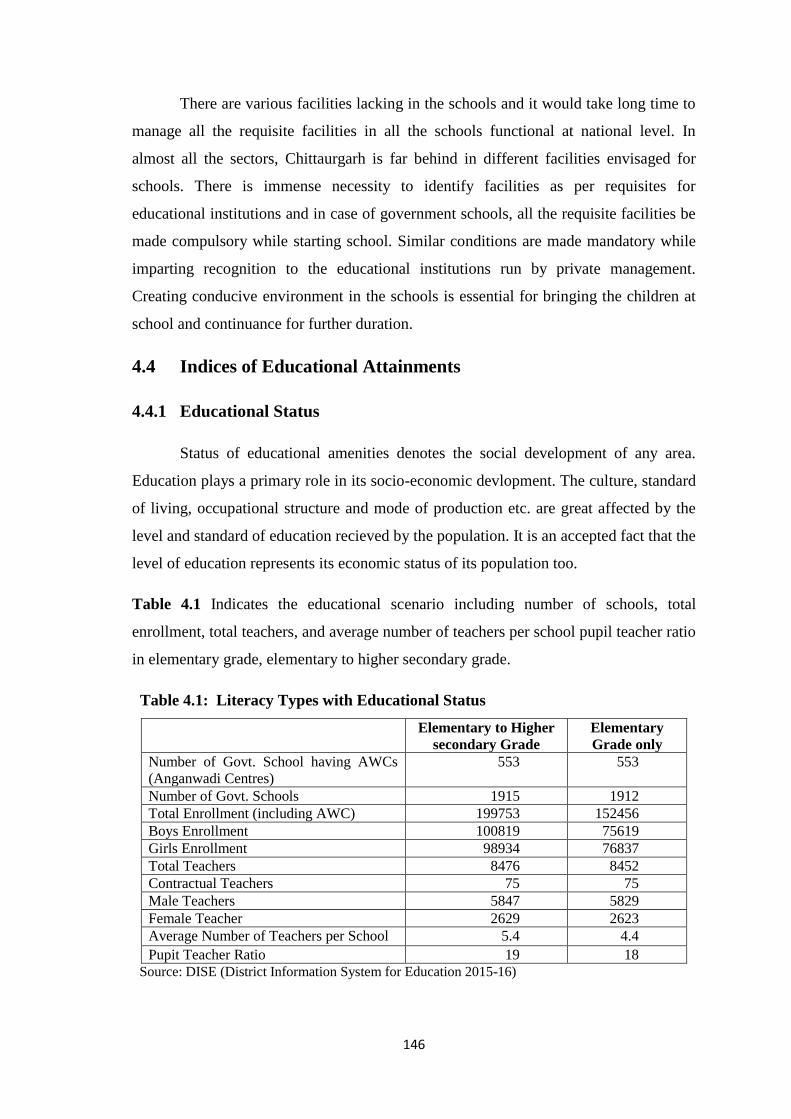
146
There are various facilities lacking in the schools and it would take long time to
manage all the requisite facilities in all the schools functional at national level. In
almost all the sectors, Chittaurgarh is far behind in different facilities envisaged for
schools. There is immense necessity to identify facilities as per requisites for
educational institutions and in case of government schools, all the requisite facilities be
made compulsory while starting school. Similar conditions are made mandatory while
imparting recognition to the educational institutions run by private management.
Creating conducive environment in the schools is essential for bringing the children at
school and continuance for further duration.
4.4 Indices of Educational Attainments
4.4.1 Educational Status
Status of educational amenities denotes the social development of any area.
Education plays a primary role in its socio-economic devlopment. The culture, standard
of living, occupational structure and mode of production etc. are great affected by the
level and standard of education recieved by the population. It is an accepted fact that the
level of education represents its economic status of its population too.
Table 4.1 Indicates the educational scenario including number of schools, total
enrollment, total teachers, and average number of teachers per school pupil teacher ratio
in elementary grade, elementary to higher secondary grade.
Table 4.1: Literacy Types with Educational Status
Elementary to Higher secondary Grade
Elementary Grade only
Number of Govt. School having AWCs (Anganwadi Centres)
553 553
Number of Govt. Schools 1915 1912 Total Enrollment (including AWC) 199753 152456 Boys Enrollment 100819 75619 Girls Enrollment 98934 76837 Total Teachers 8476 8452 Contractual Teachers 75 75 Male Teachers 5847 5829 Female Teacher 2629 2623 Average Number of Teachers per School 5.4 4.4 Pupit Teacher Ratio 19 18
Source: DISE (District Information System for Education 2015-16)
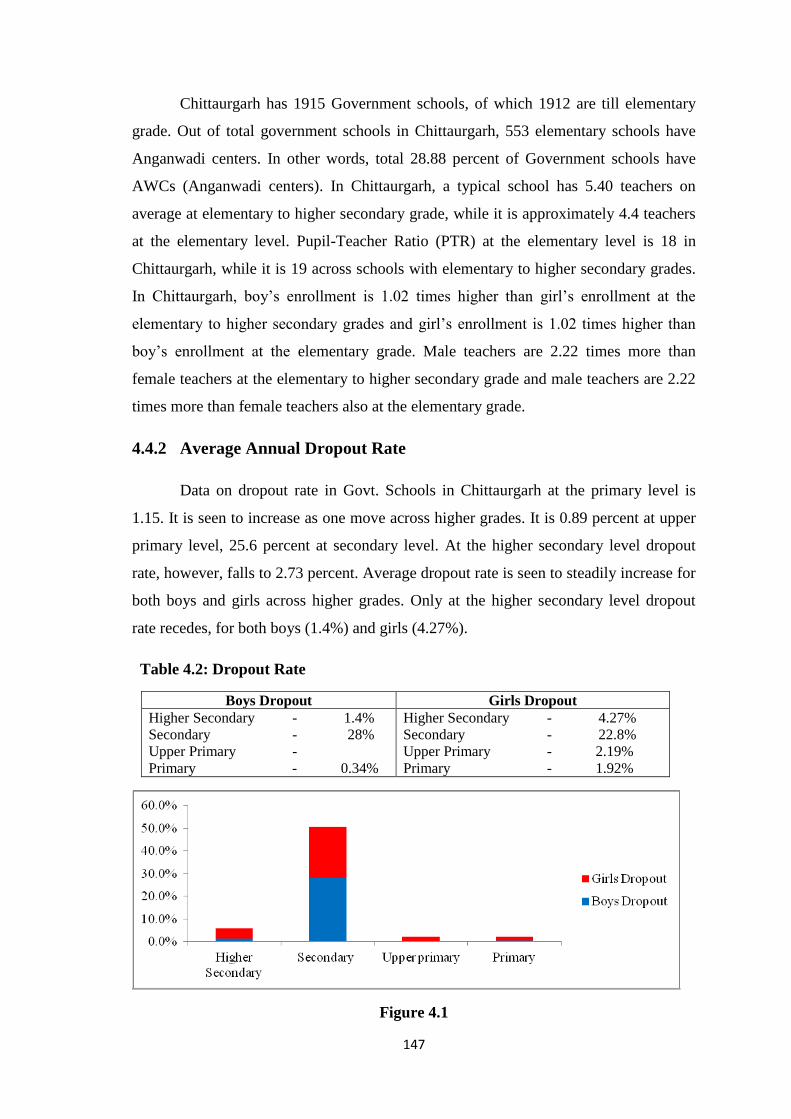
147
Chittaurgarh has 1915 Government schools, of which 1912 are till elementary
grade. Out of total government schools in Chittaurgarh, 553 elementary schools have
Anganwadi centers. In other words, total 28.88 percent of Government schools have
AWCs (Anganwadi centers). In Chittaurgarh, a typical school has 5.40 teachers on
average at elementary to higher secondary grade, while it is approximately 4.4 teachers
at the elementary level. Pupil-Teacher Ratio (PTR) at the elementary level is 18 in
Chittaurgarh, while it is 19 across schools with elementary to higher secondary grades.
In Chittaurgarh, boy‟s enrollment is 1.02 times higher than girl‟s enrollment at the
elementary to higher secondary grades and girl‟s enrollment is 1.02 times higher than
boy‟s enrollment at the elementary grade. Male teachers are 2.22 times more than
female teachers at the elementary to higher secondary grade and male teachers are 2.22
times more than female teachers also at the elementary grade.
4.4.2 Average Annual Dropout Rate
Data on dropout rate in Govt. Schools in Chittaurgarh at the primary level is
1.15. It is seen to increase as one move across higher grades. It is 0.89 percent at upper
primary level, 25.6 percent at secondary level. At the higher secondary level dropout
rate, however, falls to 2.73 percent. Average dropout rate is seen to steadily increase for
both boys and girls across higher grades. Only at the higher secondary level dropout
rate recedes, for both boys (1.4%) and girls (4.27%).
Table 4.2: Dropout Rate
Boys Dropout Girls Dropout Higher Secondary - 1.4% Secondary - 28% Upper Primary - Primary - 0.34%
Higher Secondary - 4.27% Secondary - 22.8% Upper Primary - 2.19% Primary - 1.92%
Figure 4.1
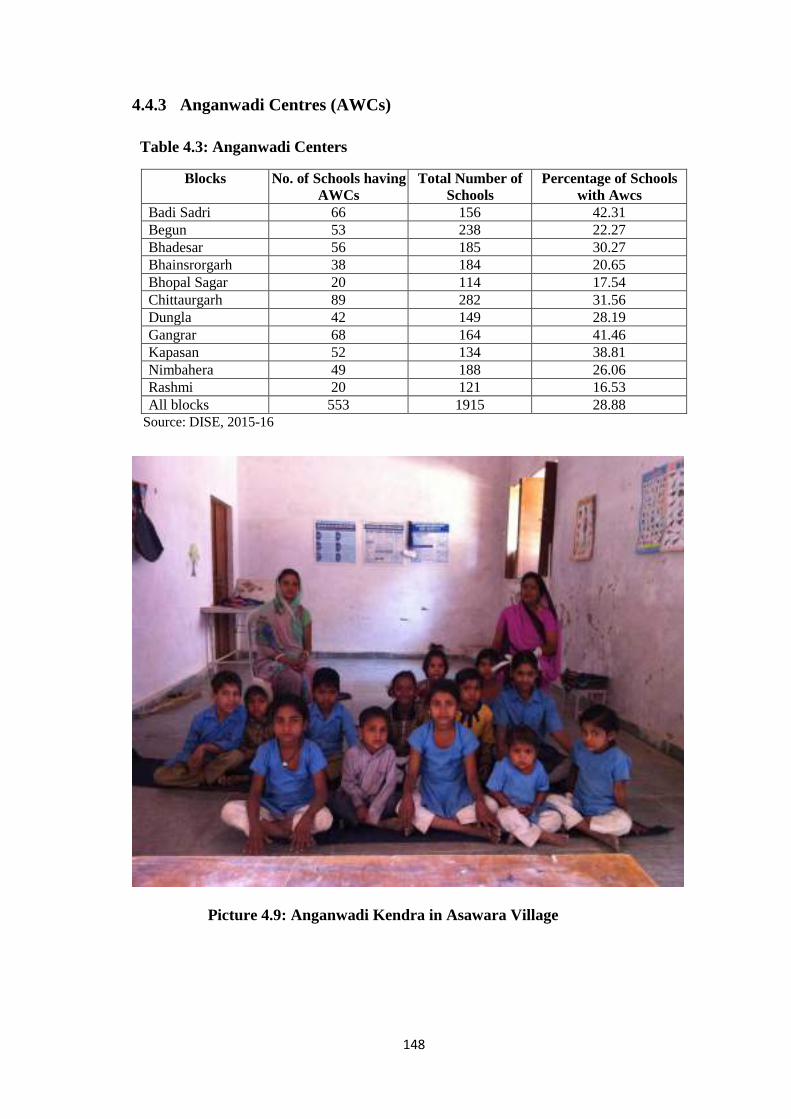
148
4.4.3 Anganwadi Centres (AWCs)
Table 4.3: Anganwadi Centers
Blocks No. of Schools having AWCs
Total Number of Schools
Percentage of Schools with Awcs
Badi Sadri 66 156 42.31 Begun 53 238 22.27 Bhadesar 56 185 30.27 Bhainsrorgarh 38 184 20.65 Bhopal Sagar 20 114 17.54 Chittaurgarh 89 282 31.56 Dungla 42 149 28.19 Gangrar 68 164 41.46 Kapasan 52 134 38.81 Nimbahera 49 188 26.06 Rashmi 20 121 16.53 All blocks 553 1915 28.88
Source: DISE, 2015-16
Picture 4.9: Anganwadi Kendra in Asawara Village
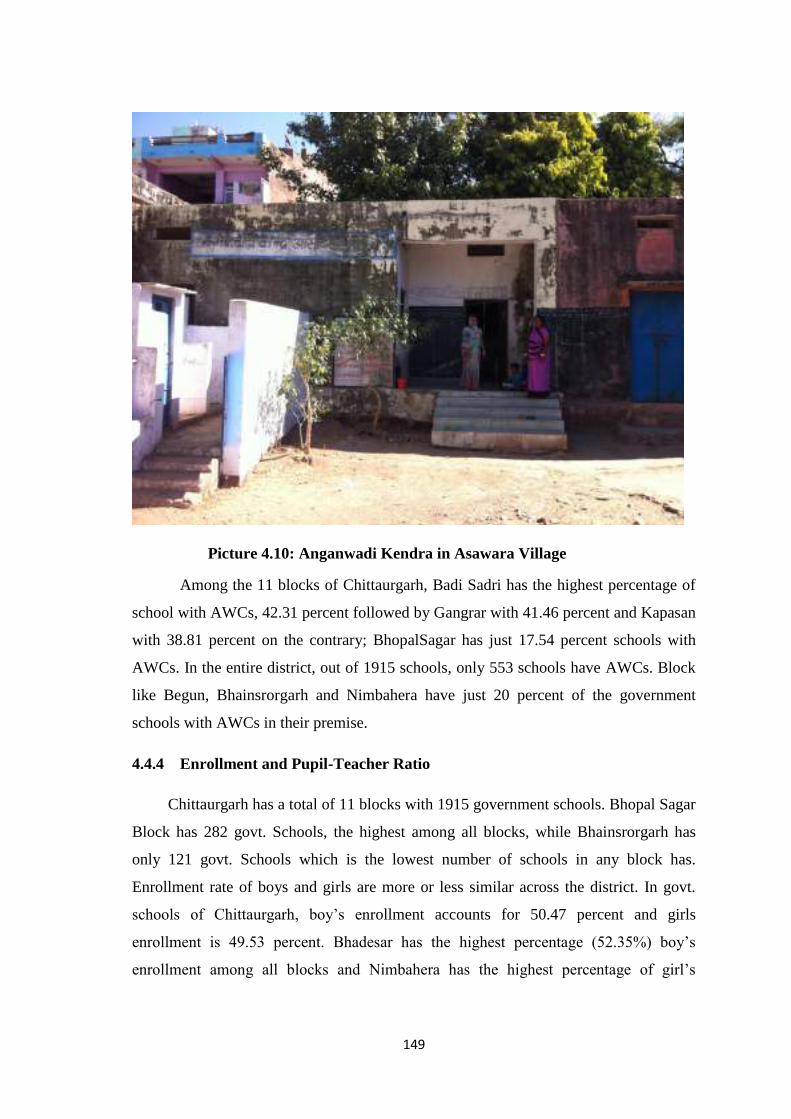
149
Picture 4.10: Anganwadi Kendra in Asawara Village
Among the 11 blocks of Chittaurgarh, Badi Sadri has the highest percentage of
school with AWCs, 42.31 percent followed by Gangrar with 41.46 percent and Kapasan
with 38.81 percent on the contrary; BhopalSagar has just 17.54 percent schools with
AWCs. In the entire district, out of 1915 schools, only 553 schools have AWCs. Block
like Begun, Bhainsrorgarh and Nimbahera have just 20 percent of the government
schools with AWCs in their premise.
4.4.4 Enrollment and Pupil-Teacher Ratio
Chittaurgarh has a total of 11 blocks with 1915 government schools. Bhopal Sagar
Block has 282 govt. Schools, the highest among all blocks, while Bhainsrorgarh has
only 121 govt. Schools which is the lowest number of schools in any block has.
Enrollment rate of boys and girls are more or less similar across the district. In govt.
schools of Chittaurgarh, boy‟s enrollment accounts for 50.47 percent and girls
enrollment is 49.53 percent. Bhadesar has the highest percentage (52.35%) boy‟s
enrollment among all blocks and Nimbahera has the highest percentage of girl‟s
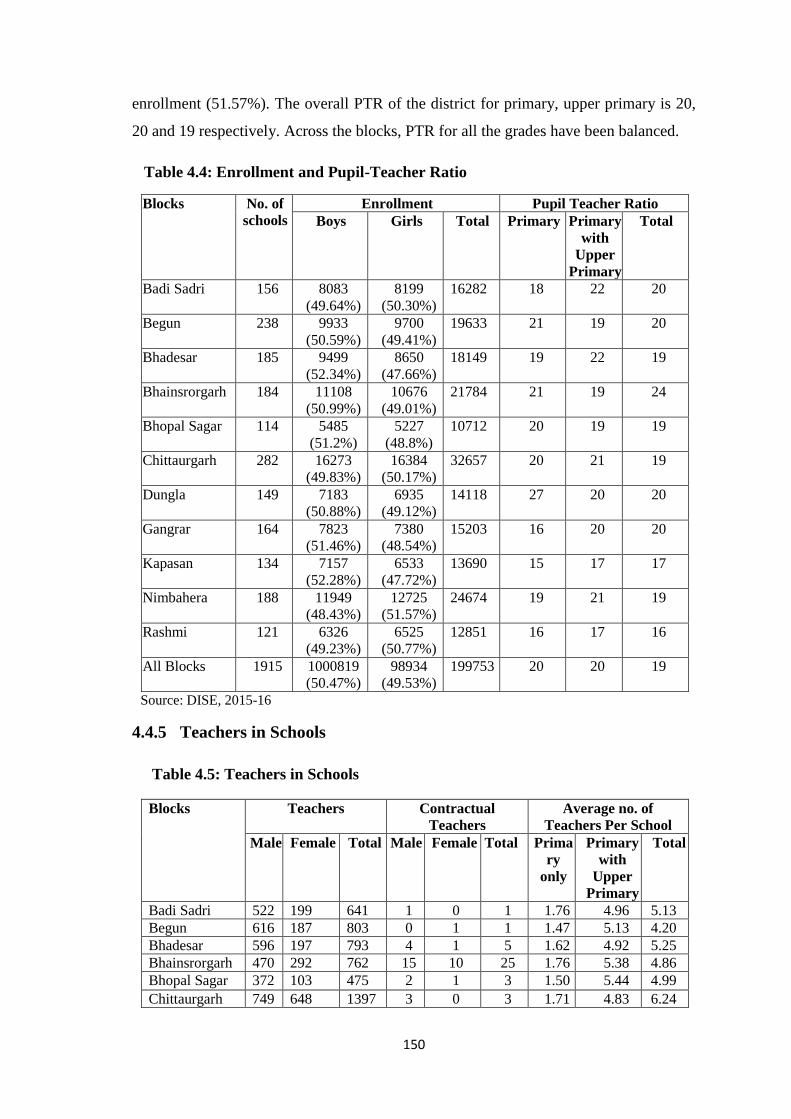
150
enrollment (51.57%). The overall PTR of the district for primary, upper primary is 20,
20 and 19 respectively. Across the blocks, PTR for all the grades have been balanced.
Table 4.4: Enrollment and Pupil-Teacher Ratio
Blocks No. of schools
Enrollment Pupil Teacher Ratio Boys Girls Total Primary Primary
with Upper
Primary
Total
Badi Sadri 156 8083 (49.64%)
8199 (50.30%)
16282 18 22 20
Begun 238 9933 (50.59%)
9700 (49.41%)
19633 21 19 20
Bhadesar 185 9499 (52.34%)
8650 (47.66%)
18149 19 22 19
Bhainsrorgarh 184 11108 (50.99%)
10676 (49.01%)
21784 21 19 24
Bhopal Sagar 114 5485 (51.2%)
5227 (48.8%)
10712 20 19 19
Chittaurgarh 282 16273 (49.83%)
16384 (50.17%)
32657 20 21 19
Dungla 149 7183 (50.88%)
6935 (49.12%)
14118 27 20 20
Gangrar 164 7823 (51.46%)
7380 (48.54%)
15203 16 20 20
Kapasan 134 7157 (52.28%)
6533 (47.72%)
13690 15 17 17
Nimbahera 188 11949 (48.43%)
12725 (51.57%)
24674 19 21 19
Rashmi 121 6326 (49.23%)
6525 (50.77%)
12851 16 17 16
All Blocks 1915 1000819 (50.47%)
98934 (49.53%)
199753 20 20 19
Source: DISE, 2015-16
4.4.5 Teachers in Schools
Table 4.5: Teachers in Schools
Blocks Teachers Contractual Teachers
Average no. of Teachers Per School
Male Female Total Male Female Total Primary
only
Primary with
Upper Primary
Total
Badi Sadri 522 199 641 1 0 1 1.76 4.96 5.13 Begun 616 187 803 0 1 1 1.47 5.13 4.20 Bhadesar 596 197 793 4 1 5 1.62 4.92 5.25 Bhainsrorgarh 470 292 762 15 10 25 1.76 5.38 4.86 Bhopal Sagar 372 103 475 2 1 3 1.50 5.44 4.99 Chittaurgarh 749 648 1397 3 0 3 1.71 4.83 6.24
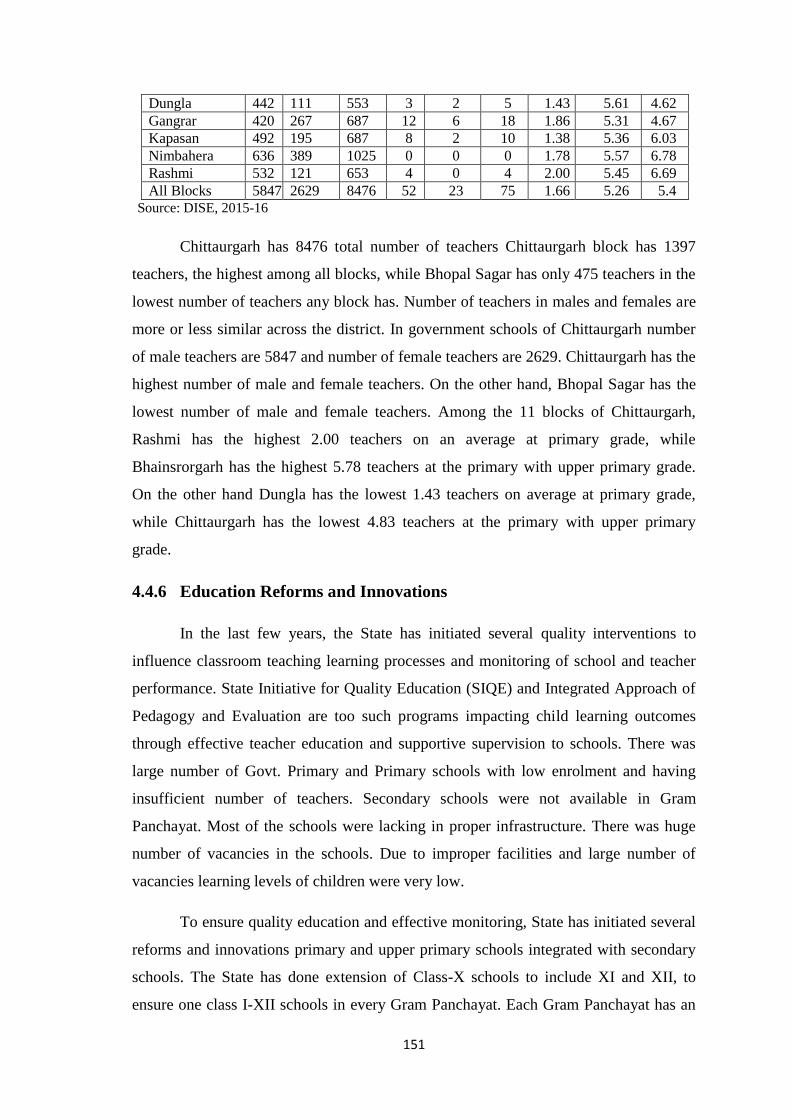
151
Dungla 442 111 553 3 2 5 1.43 5.61 4.62 Gangrar 420 267 687 12 6 18 1.86 5.31 4.67 Kapasan 492 195 687 8 2 10 1.38 5.36 6.03 Nimbahera 636 389 1025 0 0 0 1.78 5.57 6.78 Rashmi 532 121 653 4 0 4 2.00 5.45 6.69 All Blocks 5847 2629 8476 52 23 75 1.66 5.26 5.4
Source: DISE, 2015-16
Chittaurgarh has 8476 total number of teachers Chittaurgarh block has 1397
teachers, the highest among all blocks, while Bhopal Sagar has only 475 teachers in the
lowest number of teachers any block has. Number of teachers in males and females are
more or less similar across the district. In government schools of Chittaurgarh number
of male teachers are 5847 and number of female teachers are 2629. Chittaurgarh has the
highest number of male and female teachers. On the other hand, Bhopal Sagar has the
lowest number of male and female teachers. Among the 11 blocks of Chittaurgarh,
Rashmi has the highest 2.00 teachers on an average at primary grade, while
Bhainsrorgarh has the highest 5.78 teachers at the primary with upper primary grade.
On the other hand Dungla has the lowest 1.43 teachers on average at primary grade,
while Chittaurgarh has the lowest 4.83 teachers at the primary with upper primary
grade.
4.4.6 Education Reforms and Innovations
In the last few years, the State has initiated several quality interventions to
influence classroom teaching learning processes and monitoring of school and teacher
performance. State Initiative for Quality Education (SIQE) and Integrated Approach of
Pedagogy and Evaluation are too such programs impacting child learning outcomes
through effective teacher education and supportive supervision to schools. There was
large number of Govt. Primary and Primary schools with low enrolment and having
insufficient number of teachers. Secondary schools were not available in Gram
Panchayat. Most of the schools were lacking in proper infrastructure. There was huge
number of vacancies in the schools. Due to improper facilities and large number of
vacancies learning levels of children were very low.
To ensure quality education and effective monitoring, State has initiated several
reforms and innovations primary and upper primary schools integrated with secondary
schools. The State has done extension of Class-X schools to include XI and XII, to
ensure one class I-XII schools in every Gram Panchayat. Each Gram Panchayat has an
152
Adarsh Vidhyalaya (Std.1-12), Utkrisht Vidhyalaya and Panchayat Elementary
Education Officer (PEEO) for academic and administrative support to Primary school/
Upper Primary school under SSA. The State has also finalized staffing norms as per
Right to Education for all schools ensuring availability of subject teachers and
improving availability of teaching staff in rural and for flung areas. Further the State
has extended the coverage to pre-primary level, integration of at least one Anganwadi
Centre (AWC) with integrated schools (1-10/12).
State Initiative for Quality Education (SIQE) is being implemented in all
schools with class‟s I-V. This is in Child Centric Pedagogy (CCP). Continuous and
Comprehensive Evaluation (CCE), Activity Based Learning (ABL) and tracking of
learning level at various levels with online Management Information System (MIS).
CBSE affiliated English medium Swami Vivekanand Model schools (Class 6 to
12) with science faculty started in Educationally Backward Blocks (EBBS) to serve as
centres of excellence. For strengthening monitoring at various levels, real time database
form MIS (Shaala Darpan / Darshan) has been developed and is being used for
identification of vacancies and placement if staff leading to equitable and objective
distribution of staff.
For felicitating meritorious students of government schools laptop distribution
scheme has benefited students on performance in Class-VIII, X and XII board
examination. One time cash incentives of Rs.10000 per student selected for NTSE
scholarship is also provided. Initiative like Transport Vouchers Schemes,
Mukhyamantri Hamari Beti Yojna, Gargi Awards, Rajshree Yojana, 50% seats
reservation for girls in Vivekanand Model schools has been implemented for
improvement in girl child education.
Basic Infrastructure has been improved by leveraging funds from various
schemes like MNREGA, MLA/MPLAD, and Mukhyamantri Jan Sahabhagita
Vidhyalaya Vikas Yojana.
Through these revolutionary reforms and innovations, Chittaurgarh has emerged
as one of the leading area in education across the nation.
153
Udaan in Chittaurgarh
Realizing that many children, especially girl are out of school but yet not
covered under any program under SSA, District Magistrate of Chittaurgarh
district launched a program in 2017- Udaan. The assumption is that strategy is
useful in getting the most deprived child in school and gets them in the process
of learning, and then all other children who are out of school will surely be
benefitted. Hence the target was out of school girls. The goal of this campaign-
based intervention was to make sure that all girls in the district are enrolled in
school by June 2018, reduce dropouts at upper primary and secondary levels, by
the joint efforts of administration, public representatives and community. This
innovation aimed to upraise esteem of girl child in the society and ensuring the
right to education is realized by them. The fundamentals of the campaign are
based on following commitments-
Every girl of the district must go to school;
Eradicate inequalities among boys and girls access to education;
Ensure parity in opportunities for quality of education among boys and
girl;
Sensitize and engage the community for educating girls.
The approach of this initiative is involving various departments and
mobilizes the community to achieve the desired results.
The program has six major components and linked with each other in a
coherent manner and hence, is significant to be explored and understood.
Identification of out of school girls;
Enrollment of children in school;
Dialogues in every village during Ratrichaupal;
Creating positive environment by media;
Foster enabling environment in schools and generate resource to make
schools attractive for children and parents;
Monitoring and data management.
154
Government of India has taken several measures to improve literacy rate
in Indian villages and towns. State governments have been directed to ensure
and improve literacy rate in districts and villages where people are very poor. In
the last 10 years, India's literacy rate has improved, but there is still a long way
to go. Going by previous growth rate, Chittaurgarh will be able to achieve its
universal literate target not easy. Some steps taken by government to improve
literacy rate like-
Free education programs to poor living in villages and towns.
Settling up of new schools and colleges at district and State levels.
Several committees have been constituted to ensure proper utilization of
funds allocated for improving literacy rate.
Beti Bachao-Beti Padao Yojna is the latest initiative taken by the Indian
government to save and educate girls in India.
State literacy campaigns are launched at several times to conduct door to
door survey to examine overall literacy scenario in the districts.
4.5 Efforts for Development in Literacy
Various schemes were introduced by the Central and State government through
their own support and with external assistance from time to time, but their remained
lack of continuity in terms of objectives, contents, mode of implementation and
operationalization of schemes. Usually one scheme posed before State‟s continue for
short or long duration, but in case of education, various schemes started in the State
after 1991 reveal that every new scheme was introduced as an experiment and could not
continue long. Such schemes were replaced by another schemes and this process has
become unending in the sphere of education. The problems with the State are slackness
in sending proposals to the related ministry in time and follow up its approval and
release of funds. Mostly the proposals forwarded quite land in most of the schemes and
no or insignificant funds were received to start with. The preparedness of State, district
and field agencies takes significant time and funds remain unutilized or lapsed.
155
The Directorate of Literacy implements literacy programs along with non-
formal education activities. It also provides education to all those boys and girls who
are unable to go for formal education in schools and belong to 6-14 age groups because
of their social, economic and other reasons for considerations. More emphasis is being
laid on development of education in the area through various programs e.g. Adarsh and
Utkrist Vidhyalaya Yojana, State Initiative for Quality Education, Activity Based
Learning, Kasturba Gandhi Balika Vidhyalaya, Sharde Girls Hostel, Residential
Training, Community Mobilization, Information Communication Technology Scheme,
Vocational Education Program, Inclusive Education, School Water Sanitation and
Hygiene Education Program, States of Implementation of RTE act 2009 in Rajasthan
Saakshar Bharat Program, Samagra Shiksha Abhiyan, Mid-Day Meal School
Integration, Swami Vivekanand Government Model Schools Scheme, Transport
Voucher Scheme, Inclusive Education for Disabled at Secondary Stage, Staff
Rationalization, Jan-Shikshan Sansthan, Scheme for Infrastructure Development in
Minority Institutes, scheme for provide quality education in Madrasas, State Resource
Centre, Assistance to Voluntary Agencies etc.
Adarsh Vidhyalaya Yojana
Adarsh Vidhyalaya Yojana has been started by the State government to create
optimum number of good quality schools rather than too many schools with suboptimal
quality, from session 2015-16. Integration and strengthening of schools has been done.
In each village Panchayat, 1-12 / 10 schools are identified as excellence centers and are
developed as ideal schools. Adarsh School shall work as mentor schools and resource
centers for other schools located in the Gram Panchayat. Large integrated schools,
ensuring child friendly environment adequate number of trained teachers, high quality
education, activity based learning with sufficient number of enrollment and availability
of proper infrastructure such as playground, boundary wall separate toilet for boys and
girls, drinking water facility, computer labs, library, adequate number of class rooms
etc. Impact improved gross enrollment ratio, transition rates and gender parity
especially in senior classes improved.
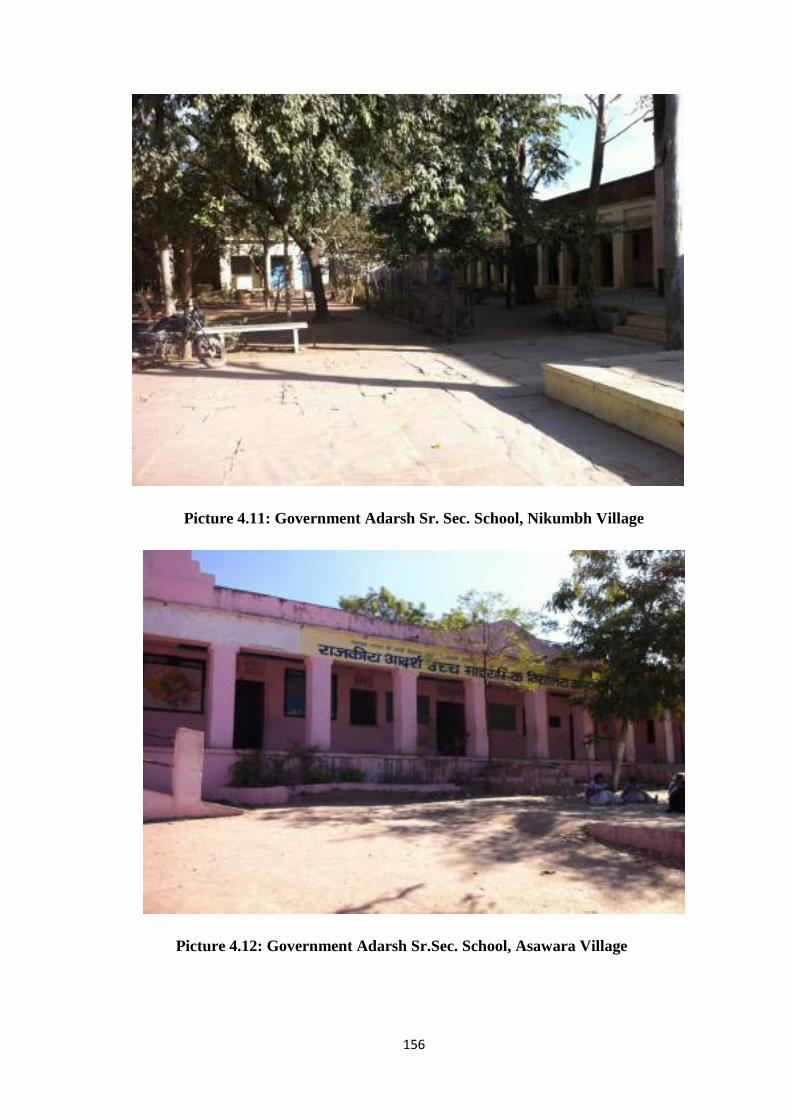
156
Picture 4.11: Government Adarsh Sr. Sec. School, Nikumbh Village
Picture 4.12: Government Adarsh Sr.Sec. School, Asawara Village
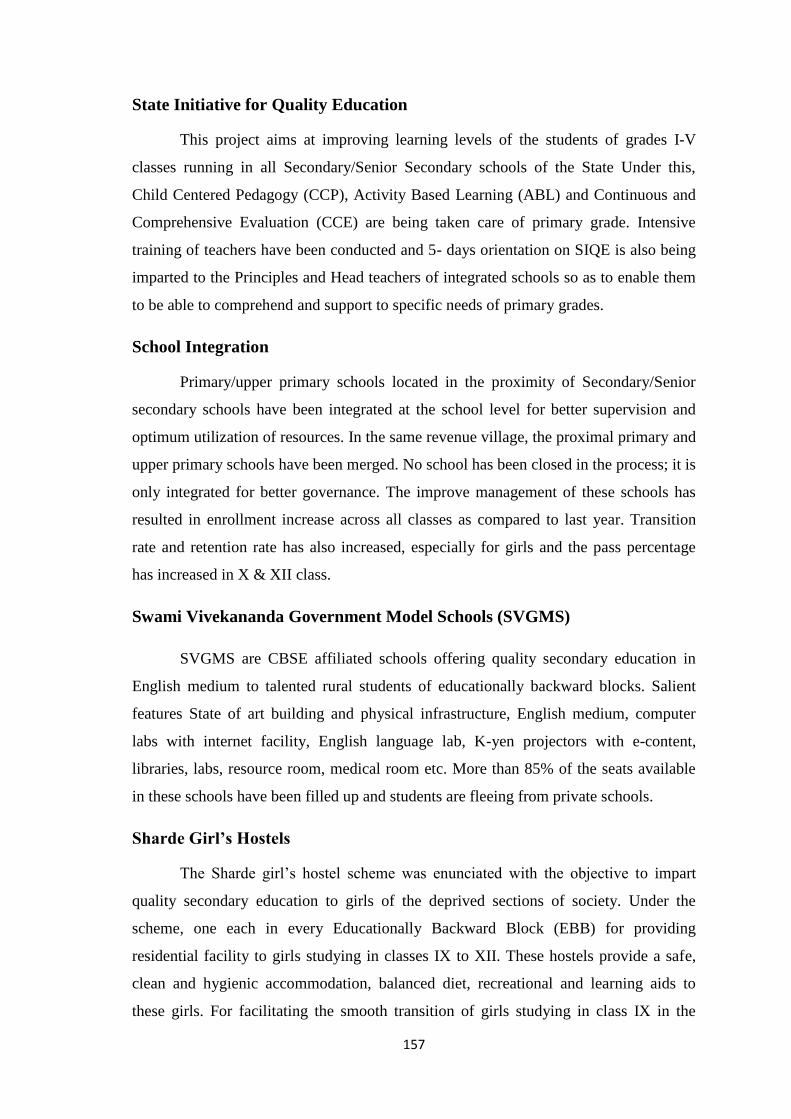
157
State Initiative for Quality Education
This project aims at improving learning levels of the students of grades I-V
classes running in all Secondary/Senior Secondary schools of the State Under this,
Child Centered Pedagogy (CCP), Activity Based Learning (ABL) and Continuous and
Comprehensive Evaluation (CCE) are being taken care of primary grade. Intensive
training of teachers have been conducted and 5- days orientation on SIQE is also being
imparted to the Principles and Head teachers of integrated schools so as to enable them
to be able to comprehend and support to specific needs of primary grades.
School Integration
Primary/upper primary schools located in the proximity of Secondary/Senior
secondary schools have been integrated at the school level for better supervision and
optimum utilization of resources. In the same revenue village, the proximal primary and
upper primary schools have been merged. No school has been closed in the process; it is
only integrated for better governance. The improve management of these schools has
resulted in enrollment increase across all classes as compared to last year. Transition
rate and retention rate has also increased, especially for girls and the pass percentage
has increased in X & XII class.
Swami Vivekananda Government Model Schools (SVGMS)
SVGMS are CBSE affiliated schools offering quality secondary education in
English medium to talented rural students of educationally backward blocks. Salient
features State of art building and physical infrastructure, English medium, computer
labs with internet facility, English language lab, K-yen projectors with e-content,
libraries, labs, resource room, medical room etc. More than 85% of the seats available
in these schools have been filled up and students are fleeing from private schools.
Sharde Girl’s Hostels
The Sharde girl‟s hostel scheme was enunciated with the objective to impart
quality secondary education to girls of the deprived sections of society. Under the
scheme, one each in every Educationally Backward Block (EBB) for providing
residential facility to girls studying in classes IX to XII. These hostels provide a safe,
clean and hygienic accommodation, balanced diet, recreational and learning aids to
these girls. For facilitating the smooth transition of girls studying in class IX in the
158
eighth grade (especially Kasturba Gandhi Balika Vidyalaya). These hostels will provide
quality secondary and senior secondary education for the girls of disadvantaged
sections and enable them to complete up to 12th standard of schooling. In the current
session, girls' enrollment effectiveness increased in the ninth and twelfth grade. Impact
on transition rates, girl‟s retention and enrollment have improved significantly.
Transport Voucher Scheme
In order to ensure ease of access to schools for girls, State government, gives
bicycles to all girls students in grade IX. Additionally, the option of transport voucher
has been given to all grades IX -XII girl students who come from more them 5
kilometers distance. An amount of Rs. 20/- per day girls is given for transport facility to
such girls, School where the number of such girls is fairly high, bulk transport facility is
being provided by hiring of vehicles by school management and development
committee for Swami Vivekananda Government Model School, this facility has been
extended to girls of VI - VIII also. Impact the transition rate, retention and enrollment
of girls has considerably improved.
Vocational Education
Vocational education has been introduced as an additional subject for students
of grade IX-XII, in select schools from last year. The program aims to develop
employability skills in students and reduce dropouts. Phase - I where in four trades were
initiated auto mobile, health care, beauty and wellness and IT. This year additional
schools have been covered with additional three trade‟s retail, security and travel and
tourism. Impact many students have been enrolled for these courses.
Inclusive Education for Disabled at Secondary Stage (IEDSS)
The aim of this scheme is to enable disabled students to complete four years of
secondary education in inclusive and competent environments after completing eight
years in primary education. The scheme covers all children studying in classes IX to
XII in government, local body with one or more disabilities Braille books have already
been provided to blind children. Environment building program has been organized and
medical cum functional assessment camps are being organized. Impact on the inclusion
of disabled children and ensuring their retention
159
Staff Rationalization
Staffing norms have been identified for schools, for all the schools, staff
rationalization have been done based on staffing norms. Impact as a result of staff
rationalization concentrated around urban areas much in excess of the actual
requirement, has been moved to rural areas ensuring availability of staff to schools.
This will ensure optimum utilization of staff strength. Rationalization shall prove to be
a key to improved quality and thus increased enrollment and pass percentages in
schools.
Activity Based Learning
ABL method is that, it uses child friendly educational aids to faster self-learning
and allows a child to study according to his or her aptitude and skill. ABL serves as a
model of child-centered, child friendly education, which is the mandate of the Right to
Education (RTE) Act in India. ABL method has improved a view in children's learning
and psychology. The main objective of ABL is to strengthen the foundation of
elementary education by ensuring child centered pedagogy and making teaching simple,
spontaneous, joyful and engaging. By making the classroom process activity based,
attention of children is ensured in the classroom processes. It also provides sufficient '
learning by doing' opportunities to children.
Information and Communication Technology Interventions (ICT)
The dissemination and use of ICT in schools has come to be seen as a
significant opportunity for teachers and learners. ICT can improve student achievement,
extend access to schooling increase efficiencies and reduce costs, prepare students for
lifelong learning and train them for a globally competitive work force. To enable and
update the students to meet the demands of this techno friendly world, our mission is to
empower schools with the use of ICT. Under this scheme a computer lab is provided in
each school with minimum 10 computers, projector, display unit etc.
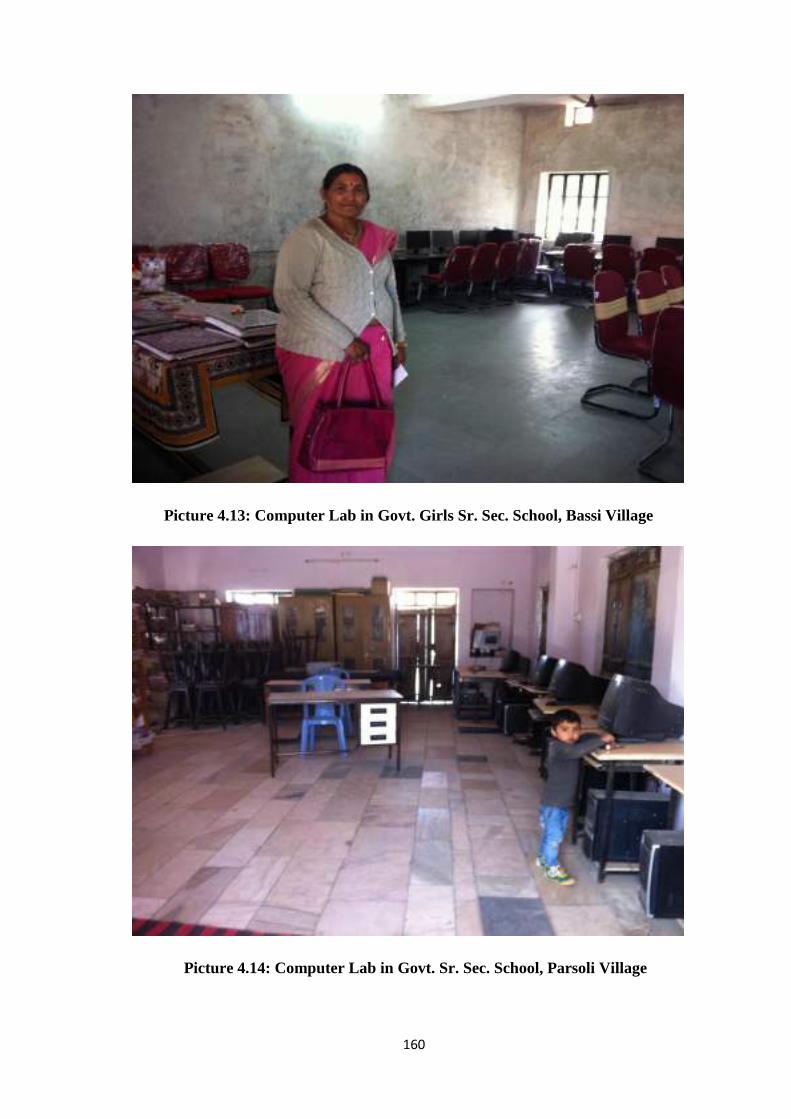
160
Picture 4.13: Computer Lab in Govt. Girls Sr. Sec. School, Bassi Village
Picture 4.14: Computer Lab in Govt. Sr. Sec. School, Parsoli Village
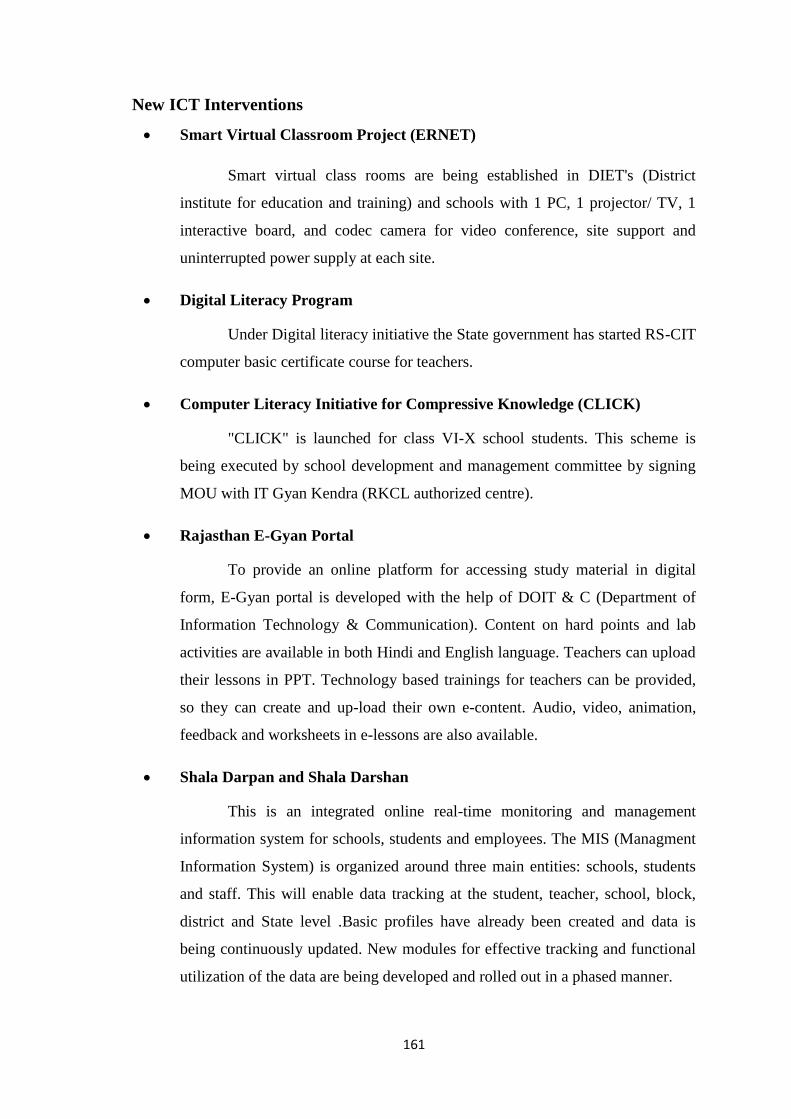
161
New ICT Interventions
Smart Virtual Classroom Project (ERNET)
Smart virtual class rooms are being established in DIET's (District
institute for education and training) and schools with 1 PC, 1 projector/ TV, 1
interactive board, and codec camera for video conference, site support and
uninterrupted power supply at each site.
Digital Literacy Program
Under Digital literacy initiative the State government has started RS-CIT
computer basic certificate course for teachers.
Computer Literacy Initiative for Compressive Knowledge (CLICK)
"CLICK" is launched for class VI-X school students. This scheme is
being executed by school development and management committee by signing
MOU with IT Gyan Kendra (RKCL authorized centre).
Rajasthan E-Gyan Portal
To provide an online platform for accessing study material in digital
form, E-Gyan portal is developed with the help of DOIT & C (Department of
Information Technology & Communication). Content on hard points and lab
activities are available in both Hindi and English language. Teachers can upload
their lessons in PPT. Technology based trainings for teachers can be provided,
so they can create and up-load their own e-content. Audio, video, animation,
feedback and worksheets in e-lessons are also available.
Shala Darpan and Shala Darshan
This is an integrated online real-time monitoring and management
information system for schools, students and employees. The MIS (Managment
Information System) is organized around three main entities: schools, students
and staff. This will enable data tracking at the student, teacher, school, block,
district and State level .Basic profiles have already been created and data is
being continuously updated. New modules for effective tracking and functional
utilization of the data are being developed and rolled out in a phased manner.
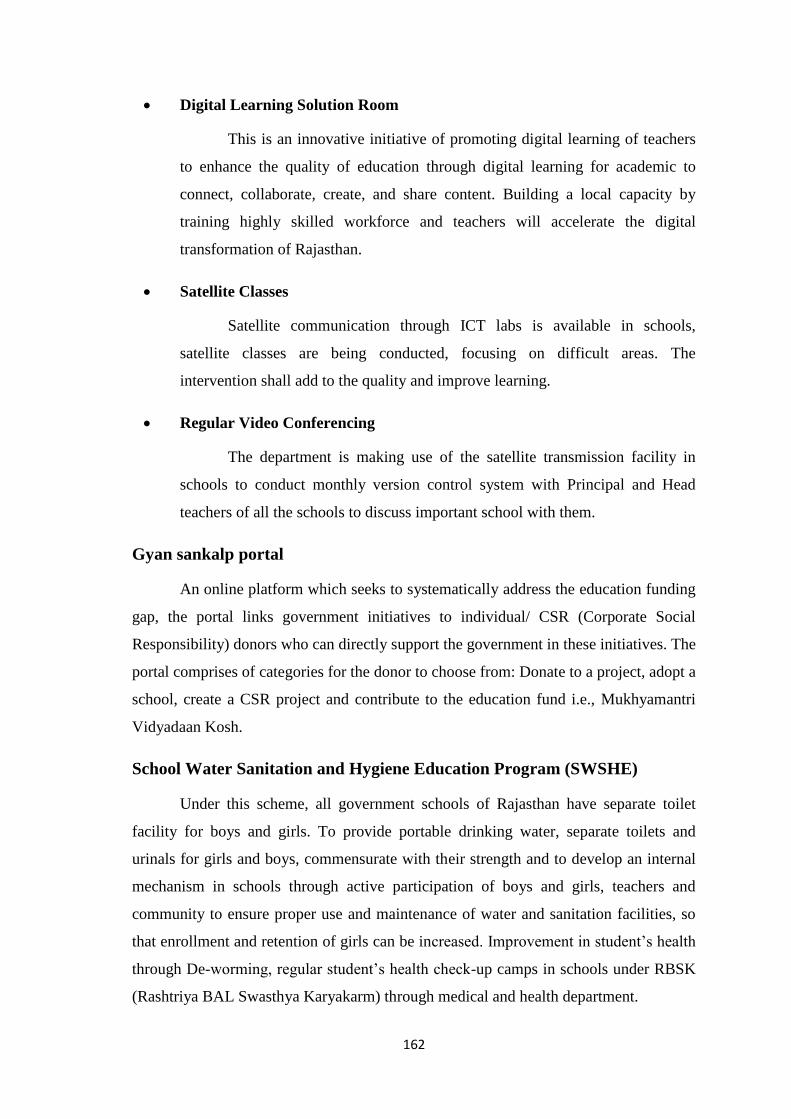
162
Digital Learning Solution Room
This is an innovative initiative of promoting digital learning of teachers
to enhance the quality of education through digital learning for academic to
connect, collaborate, create, and share content. Building a local capacity by
training highly skilled workforce and teachers will accelerate the digital
transformation of Rajasthan.
Satellite Classes
Satellite communication through ICT labs is available in schools,
satellite classes are being conducted, focusing on difficult areas. The
intervention shall add to the quality and improve learning.
Regular Video Conferencing
The department is making use of the satellite transmission facility in
schools to conduct monthly version control system with Principal and Head
teachers of all the schools to discuss important school with them.
Gyan sankalp portal
An online platform which seeks to systematically address the education funding
gap, the portal links government initiatives to individual/ CSR (Corporate Social
Responsibility) donors who can directly support the government in these initiatives. The
portal comprises of categories for the donor to choose from: Donate to a project, adopt a
school, create a CSR project and contribute to the education fund i.e., Mukhyamantri
Vidyadaan Kosh.
School Water Sanitation and Hygiene Education Program (SWSHE)
Under this scheme, all government schools of Rajasthan have separate toilet
facility for boys and girls. To provide portable drinking water, separate toilets and
urinals for girls and boys, commensurate with their strength and to develop an internal
mechanism in schools through active participation of boys and girls, teachers and
community to ensure proper use and maintenance of water and sanitation facilities, so
that enrollment and retention of girls can be increased. Improvement in student‟s health
through De-worming, regular student‟s health check-up camps in schools under RBSK
(Rashtriya BAL Swasthya Karyakarm) through medical and health department.
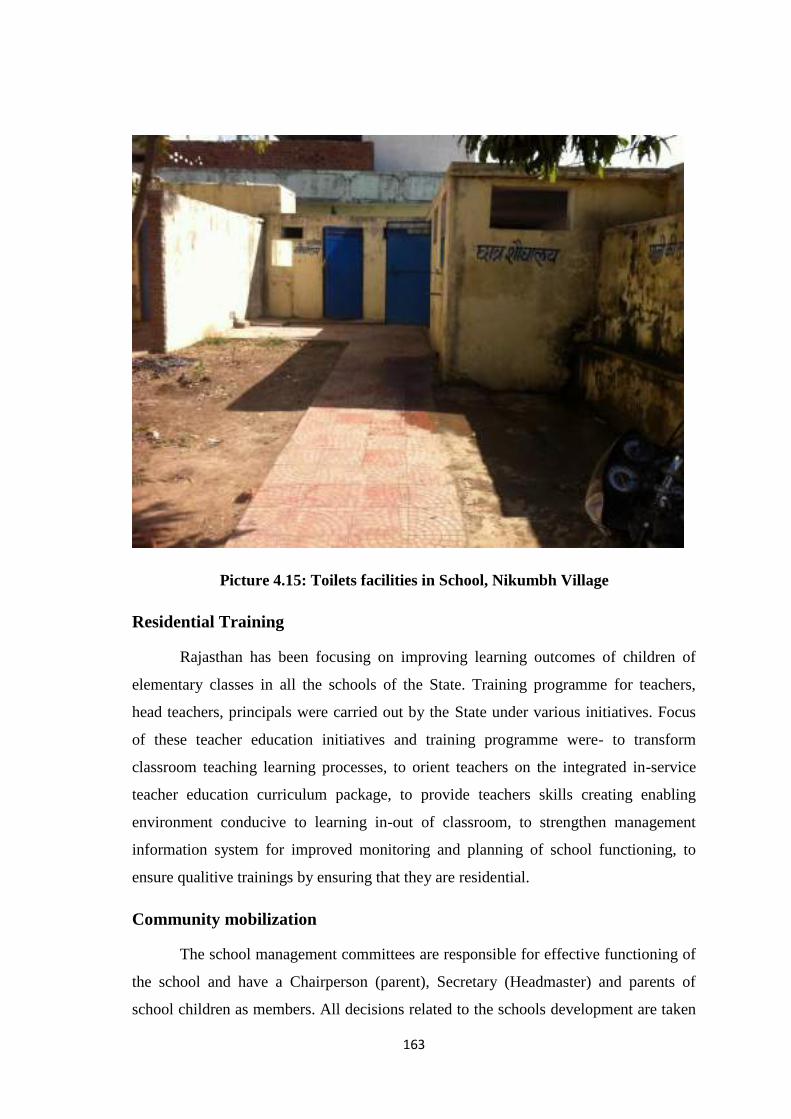
163
Picture 4.15: Toilets facilities in School, Nikumbh Village
Residential Training
Rajasthan has been focusing on improving learning outcomes of children of
elementary classes in all the schools of the State. Training programme for teachers,
head teachers, principals were carried out by the State under various initiatives. Focus
of these teacher education initiatives and training programme were- to transform
classroom teaching learning processes, to orient teachers on the integrated in-service
teacher education curriculum package, to provide teachers skills creating enabling
environment conducive to learning in-out of classroom, to strengthen management
information system for improved monitoring and planning of school functioning, to
ensure qualitive trainings by ensuring that they are residential.
Community mobilization
The school management committees are responsible for effective functioning of
the school and have a Chairperson (parent), Secretary (Headmaster) and parents of
school children as members. All decisions related to the schools development are taken
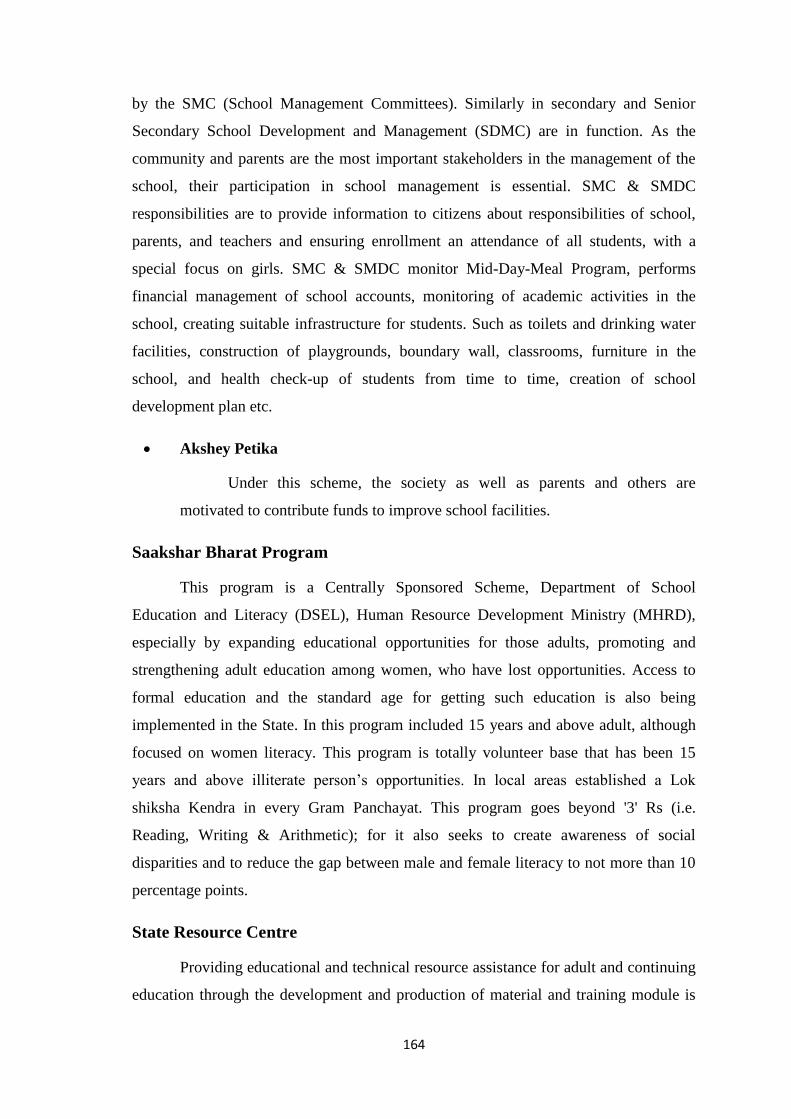
164
by the SMC (School Management Committees). Similarly in secondary and Senior
Secondary School Development and Management (SDMC) are in function. As the
community and parents are the most important stakeholders in the management of the
school, their participation in school management is essential. SMC & SMDC
responsibilities are to provide information to citizens about responsibilities of school,
parents, and teachers and ensuring enrollment an attendance of all students, with a
special focus on girls. SMC & SMDC monitor Mid-Day-Meal Program, performs
financial management of school accounts, monitoring of academic activities in the
school, creating suitable infrastructure for students. Such as toilets and drinking water
facilities, construction of playgrounds, boundary wall, classrooms, furniture in the
school, and health check-up of students from time to time, creation of school
development plan etc.
Akshey Petika
Under this scheme, the society as well as parents and others are
motivated to contribute funds to improve school facilities.
Saakshar Bharat Program
This program is a Centrally Sponsored Scheme, Department of School
Education and Literacy (DSEL), Human Resource Development Ministry (MHRD),
especially by expanding educational opportunities for those adults, promoting and
strengthening adult education among women, who have lost opportunities. Access to
formal education and the standard age for getting such education is also being
implemented in the State. In this program included 15 years and above adult, although
focused on women literacy. This program is totally volunteer base that has been 15
years and above illiterate person‟s opportunities. In local areas established a Lok
shiksha Kendra in every Gram Panchayat. This program goes beyond '3' Rs (i.e.
Reading, Writing & Arithmetic); for it also seeks to create awareness of social
disparities and to reduce the gap between male and female literacy to not more than 10
percentage points.
State Resource Centre
Providing educational and technical resource assistance for adult and continuing
education through the development and production of material and training module is
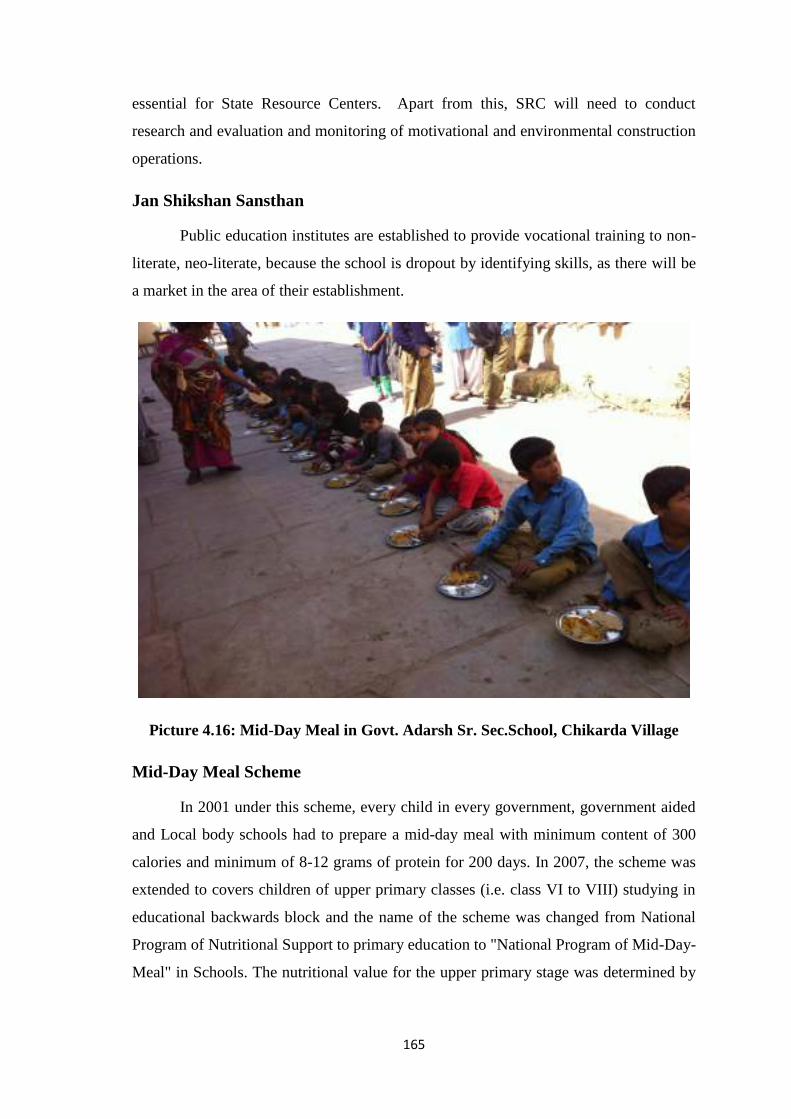
165
essential for State Resource Centers. Apart from this, SRC will need to conduct
research and evaluation and monitoring of motivational and environmental construction
operations.
Jan Shikshan Sansthan
Public education institutes are established to provide vocational training to non-
literate, neo-literate, because the school is dropout by identifying skills, as there will be
a market in the area of their establishment.
Picture 4.16: Mid-Day Meal in Govt. Adarsh Sr. Sec.School, Chikarda Village
Mid-Day Meal Scheme
In 2001 under this scheme, every child in every government, government aided
and Local body schools had to prepare a mid-day meal with minimum content of 300
calories and minimum of 8-12 grams of protein for 200 days. In 2007, the scheme was
extended to covers children of upper primary classes (i.e. class VI to VIII) studying in
educational backwards block and the name of the scheme was changed from National
Program of Nutritional Support to primary education to "National Program of Mid-Day-
Meal" in Schools. The nutritional value for the upper primary stage was determined by
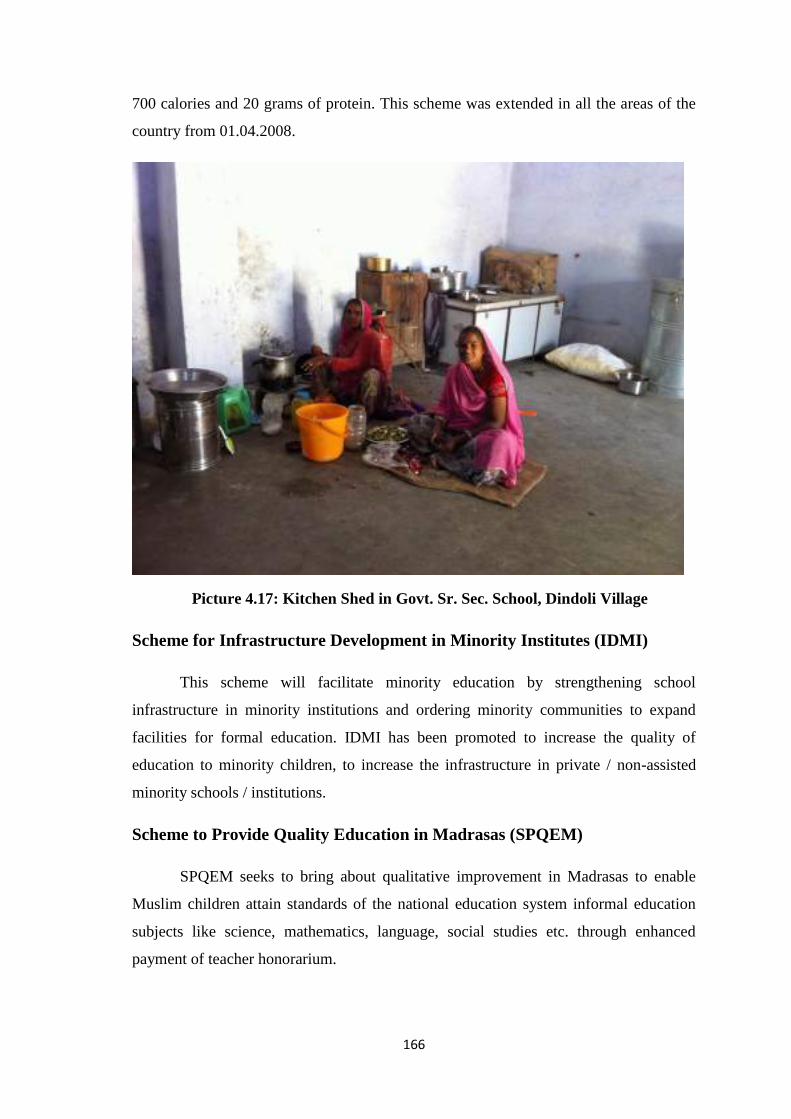
166
700 calories and 20 grams of protein. This scheme was extended in all the areas of the
country from 01.04.2008.
Picture 4.17: Kitchen Shed in Govt. Sr. Sec. School, Dindoli Village
Scheme for Infrastructure Development in Minority Institutes (IDMI)
This scheme will facilitate minority education by strengthening school
infrastructure in minority institutions and ordering minority communities to expand
facilities for formal education. IDMI has been promoted to increase the quality of
education to minority children, to increase the infrastructure in private / non-assisted
minority schools / institutions.
Scheme to Provide Quality Education in Madrasas (SPQEM)
SPQEM seeks to bring about qualitative improvement in Madrasas to enable
Muslim children attain standards of the national education system informal education
subjects like science, mathematics, language, social studies etc. through enhanced
payment of teacher honorarium.
167
Right to Education
'RTE' was made a part of the fundamental rights of a citizen. In pursuance of the
constitutional provision, the right of children to free and Compulsory Education Act -
2009 (RTE) was passed and has been in force since 1 April, 2010 in all parts of the
country except Jammu and Kashmir. The State specific rules for implementation of the
Right of Children to free and Compulsory Education Act-2009 were notified in the
State Gazette. The entire process of admission of children on free seats monitoring of
physical verification and reimbursement of fees is being done online through the private
school web portal rte.raj.nic.in. 'Compulsory education' means to provide free
elementary education to each primary education and to fulfill mandatory admission,
attendance and elementary education of every 6-14 age group. „Free means‟ that no
child will be liable to pay any fee or fee or expense which may prevent him from
pursuing elementary education and completing it.
Samagra Shiksha
Samagra Shiksha - an overarching program for the school education sector
extending from pre-school to class 12 has been, therefore, prepared with the broader
goal of improving school. Effectiveness in measuring equal opportunities for school
education and similar learning results is measured. If three plans of Sarva Shiksha
Abhiyan (SSA), National Medium Education Mission (RMSA) and Teacher Education
(TE) are met, then implement area-wide development programs/schemes at all levels.
Develop resources and comprehensive strategic planning for the development of school
education at the district level. The change in focus is project objective to improve the
level of performance and schooling of the system, which encourages State‟s to improve
the quality of education, as well as emphasis on the joint scheme.
4.6 Prospects in Literacy and Education
Having reached an effective literacy rate of 61.71 percent (76.61 percent for
males and 46.53 percent for females) in 2011, the area seems to have attained a
respectable place in terms of literacy but the prospects in the area of education is that
are -
168
Firstly, although in terms of effective literacy (aged 7 & above) the Male-
Female differentials have squeezed down, yet in terms of levels of educational
attainments such differentials do persist especially in rural areas and less so in
case of urban areas.
Secondly, promoting higher education requires opening up higher education
institutions, enrolling students and recruiting the faculty.
Thirdly, distribution of educated workers in different sectors of economy holds
the key to diversification of occupational structure of a society. Generally in less
literate agrarian an economy, the educated workers move out of the agricultural
sector for better quality of life. Cultivators are the main working force in the
district as they form 56.46 percent of total workers. If is followed by other
workers (26.24 percent) agricultural labourers (15.38 percent) etc.
Fourthly, of recent there had been a growing demand in the area to allow greater
access to the private sector in the field of education with a view to achieve its
expansion plans as well as to provide competition for improving the quality of
education in the area. How for public private participation in the field of
education succeeds in meeting these two goals, only the coming decades will
show. The contribution of private sector in the field of education in terms of its
share both in expansion and quality improvement strategies for education in
Chittaurgarh. The role of private sector at school level of education which had
been allowed ever since Independence was to the tune of 35% by 2015. When
we compare it in terms of share in the number of students, it is found that private
sector accounted for 29.05% of all students at the school level. Two obvious
inferences that emerge from such figures are one, for private sector profitability
and not the social obligation in the mantra and two; the compromise on quality
is not that obvious in private sector as in the case with the government
institutions. The student ratio in case of private sector institutions where the
large number positions remain vacant for decades because the government does
not care institutions the management is answerable to immediate local
surroundings.

169
CHAPTER – V
DETERMINANTS OF VARIATION IN EDUCATIONAL
ATTAINMENT
5.1 Educational Parameters Based on Sample Study (Two Villages
from Each Tehsil)
In this chapter, the description and effect of academics, social and economic
status based on the educational parameters of some households and schools sample has
been analyzed. From the ten tehsil of the district, two villages were randomly selected
for the survey. Twenty households and one school from each village were chosen thus
total 200 households were selected for the analysis of the Chittaurgarh district. My
observation is based on personal interview, direct experience and questionnaire. The
questionnaire used for this field survey work is given in appendix-I and II. The
following educational parameters have been used in this field survey.
For Households: Population, literate persons, educational level, occupational structure
income structure, housing and infrastructure facilities etc.
For Schools: Total schools, students, teachers, teacher student-ratio, infrastructure
facilities etc.
5.1.1 Village Details
(1)
Bansi Village (Badi Sadri)
Location and Administration
Bansi is a village in Badi Sadri tehsil in Chittaurgarh District of Rajasthan State,
India. Bansi is 15 km. distance from Sub-District Headquarters Badi Sadri and it is 82
km. distance from District Headquarter Chittaurgarh. Total of Bansi area is 417.85
hectares, Non-agricultural area is 155.1 hectares and total irrigated area is 189.5
hectares.
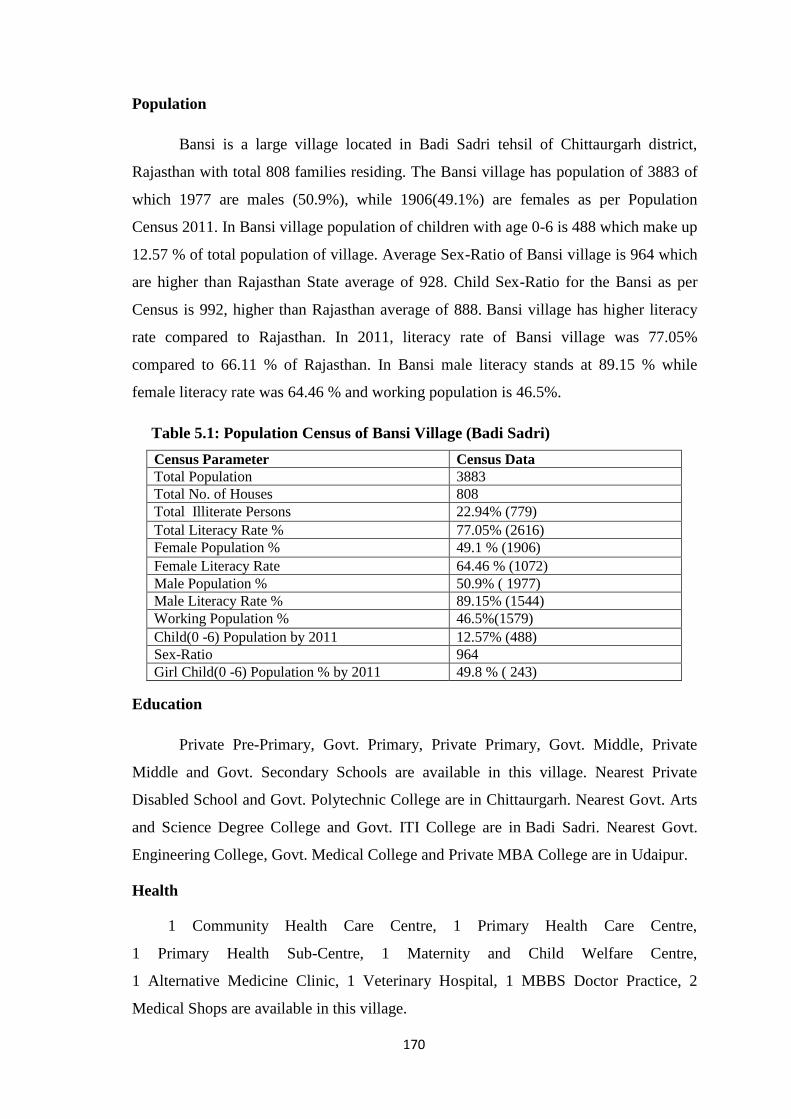
170
Population
Bansi is a large village located in Badi Sadri tehsil of Chittaurgarh district,
Rajasthan with total 808 families residing. The Bansi village has population of 3883 of
which 1977 are males (50.9%), while 1906(49.1%) are females as per Population
Census 2011. In Bansi village population of children with age 0-6 is 488 which make up
12.57 % of total population of village. Average Sex-Ratio of Bansi village is 964 which
are higher than Rajasthan State average of 928. Child Sex-Ratio for the Bansi as per
Census is 992, higher than Rajasthan average of 888. Bansi village has higher literacy
rate compared to Rajasthan. In 2011, literacy rate of Bansi village was 77.05%
compared to 66.11 % of Rajasthan. In Bansi male literacy stands at 89.15 % while
female literacy rate was 64.46 % and working population is 46.5%.
Table 5.1: Population Census of Bansi Village (Badi Sadri)
Census Parameter Census Data Total Population 3883 Total No. of Houses 808 Total Illiterate Persons 22.94% (779) Total Literacy Rate % 77.05% (2616) Female Population % 49.1 % (1906) Female Literacy Rate 64.46 % (1072) Male Population % 50.9% ( 1977) Male Literacy Rate % 89.15% (1544) Working Population % 46.5%(1579) Child(0 -6) Population by 2011 12.57% (488) Sex-Ratio 964 Girl Child(0 -6) Population % by 2011 49.8 % ( 243)
Education
Private Pre-Primary, Govt. Primary, Private Primary, Govt. Middle, Private
Middle and Govt. Secondary Schools are available in this village. Nearest Private
Disabled School and Govt. Polytechnic College are in Chittaurgarh. Nearest Govt. Arts
and Science Degree College and Govt. ITI College are in Badi Sadri. Nearest Govt.
Engineering College, Govt. Medical College and Private MBA College are in Udaipur.
Health
1 Community Health Care Centre, 1 Primary Health Care Centre,
1 Primary Health Sub-Centre, 1 Maternity and Child Welfare Centre,
1 Alternative Medicine Clinic, 1 Veterinary Hospital, 1 MBBS Doctor Practice, 2
Medical Shops are available in this village.
171
Agriculture
Maize, Wheat and Mustard is agriculture commodities grow in this
village. Earthen Pots, Handicraft products are manufactured in this village. Agricultural
power supply in summer is 6 hours and 16 hours in winter is available in this village.
Total irrigated area in this village is 189.5 hectares from boreholes/tube wells.
Drinking-Water and Sanitation
Covered wells, uncovered wells, Hand pump and tube wells/boreholes are other
drinking water sources. Closed and open drainage system available in this village. This
village covered under total sanitation. Community toilet complex is available in this
village. There is no system to collect garbage from street. Drain water is discharged
directly into water bodies.
Communication
Post office, sub post-office, landline telephone available, mobile coverage and
internet facility centre available in this village. No private courier facility around 10 km.
Transportation
Public bus service, Private bus service, railway station, autos, tractors and
animal driven carts has available in this village. No nearest National Highway around
10 km. State Highway passes and district road passes through this village. Pucca
(metalled) road, kuccha (non-metalled) road, macadam road and foot path are other
roads and transportation within the village.
Commerce
ATM, Commercial Bank, Co-operative Bank, Agricultural credit society and
Mandis/Regular market is available in this village.
Other Amenities
This village has a power supply with 18 hours power supply in summer and in
winter, Anganwadi centre, ASHA, Birth & Death registration office, sports facilities;
daily news paper and polling station are the other amenities in the village.
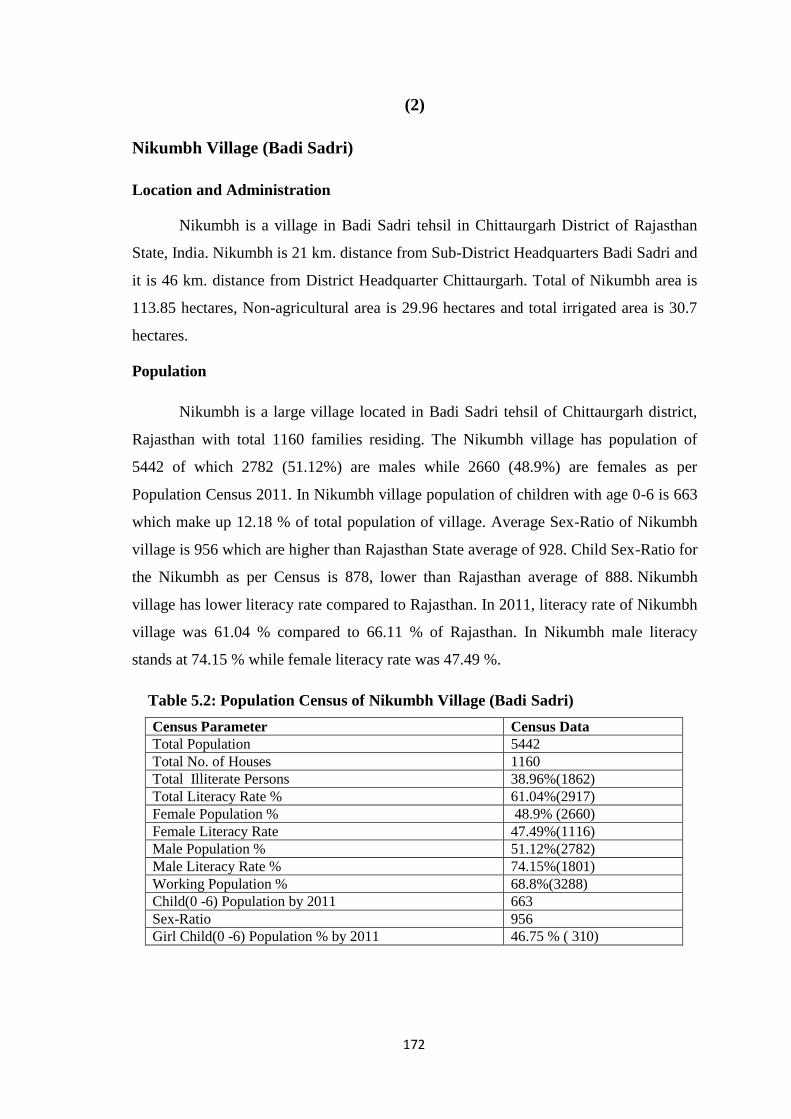
172
(2)
Nikumbh Village (Badi Sadri)
Location and Administration
Nikumbh is a village in Badi Sadri tehsil in Chittaurgarh District of Rajasthan
State, India. Nikumbh is 21 km. distance from Sub-District Headquarters Badi Sadri and
it is 46 km. distance from District Headquarter Chittaurgarh. Total of Nikumbh area is
113.85 hectares, Non-agricultural area is 29.96 hectares and total irrigated area is 30.7
hectares.
Population
Nikumbh is a large village located in Badi Sadri tehsil of Chittaurgarh district,
Rajasthan with total 1160 families residing. The Nikumbh village has population of
5442 of which 2782 (51.12%) are males while 2660 (48.9%) are females as per
Population Census 2011. In Nikumbh village population of children with age 0-6 is 663
which make up 12.18 % of total population of village. Average Sex-Ratio of Nikumbh
village is 956 which are higher than Rajasthan State average of 928. Child Sex-Ratio for
the Nikumbh as per Census is 878, lower than Rajasthan average of 888. Nikumbh
village has lower literacy rate compared to Rajasthan. In 2011, literacy rate of Nikumbh
village was 61.04 % compared to 66.11 % of Rajasthan. In Nikumbh male literacy
stands at 74.15 % while female literacy rate was 47.49 %.
Table 5.2: Population Census of Nikumbh Village (Badi Sadri)
Census Parameter Census Data Total Population 5442 Total No. of Houses 1160 Total Illiterate Persons 38.96%(1862) Total Literacy Rate % 61.04%(2917) Female Population % 48.9% (2660) Female Literacy Rate 47.49%(1116) Male Population % 51.12%(2782) Male Literacy Rate % 74.15%(1801) Working Population % 68.8%(3288) Child(0 -6) Population by 2011 663 Sex-Ratio 956 Girl Child(0 -6) Population % by 2011 46.75 % ( 310)
173
Education
Schools are available in this village. Nearest Private Disabled School, Private
Engineering College, Private MBA College and Govt. Polytechnic College are
in Chittaurgarh. Nearest Private Pre Primary school, Govt. Primary School, Govt. Pre
Primary School, Govt. Secondary School and Govt. Senior Secondary School are
in Nikumbh. Nearest Govt. Arts and Science Degree College and Govt. ITI College are
in Badi Sadri. Nearest Govt. Medical College is in Udaipur.
Health
1 Community Health Care Centre, 1 Primary Health Care Centre,
1 Primary Health Sub-Centre, 1 Maternity and Child Welfare Centre,
1 Alternative Medicine Clinic, 1 Veterinary Hospital, 1 Family Welfare Centre, 1
MBBS Doctor Practice, 2 Medical Shops are available in this village.
Agriculture
Maize, Wheat and Mustard is agriculture commodities grow in this village
and Handicraft items are also in this village. 6 hours agricultural power supply in
summer and winter is available in this village. Total irrigated area in this village is 30.7
hectares from boreholes/tube wells.
Drinking-Water and Sanitation
Treated and untreated tap water supply all round the year and in summer also
available. Hand pumps and tube wells/boreholes are other drinking water sources.
Closed and open drainage system available in this village. There is no system to collect
garbage from street and drain water is discharged directly into water bodies.
Communication
Post office, sub post office, landline telephone available, mobile coverage,
internet facility centre and private courier facility available in this village.
Transportation
Public and private bus service is available in this village. There is no railway
station near by 10 km. autos, tractors, man pulled cycle rickshaws, and animal driven
carts are there in this village. No nearest National Highway around 10 km. nearest State
Highway is in 5-10 km and district road passes through this village. Pucca (metalled)
174
road, kuccha (non-metalled) road and foot path are other roads and transportation within
the village.
Commerce
ATM, Commercial Bank, Co-operative Bank, Agricultural credit society,
Mandis/Regular market and weekly Haat/Santha are available in this village.
Other Amenities
This village has a power supply with 20 hours power supply in summer and
winter, Anganwadi centre and ASHA are the other amenities in the village.
(3)
Parsoli Village (Begun)
Location and Administration
Parsoli is a village in Begun tehsil in Chittaurgarh District of Rajasthan State,
India. Parsoli is 24 km. distance from Sub-District Headquarters Begun and it is 45 km.
distance from District Headquarter Chittaurgarh. Total of Parsoli area is 313 hectares,
Non-agricultural area is 114 hectares and total irrigated area is 258.47 hectares.
Population
Parsoli is a large village located in Begun tehsil of Chittaurgarh district,
Rajasthan with total 829 families residing. The Parsoli village has population of 3984 of
which 1978(49.64%) are males while 2006(50.4%) are females as per Population
Census 2011. In Parsoli village population of children with age 0-6 is 498 which make
up 12.50 % of total population of village. Average Sex-Ratio of Parsoli village is 1014
which is higher than Rajasthan State average of 928. Child Sex-Ratio for the Parsoli as
per Census is 1016, higher than Rajasthan average of 888. Parsoli village has higher
literacy rate compared to Rajasthan. In 2011, literacy rate of Parsoli village was 68.96
% compared to 66.11 % of Rajasthan. In Parsoli male literacy stands at 83.65 % while
female literacy rate was 54.47 %.
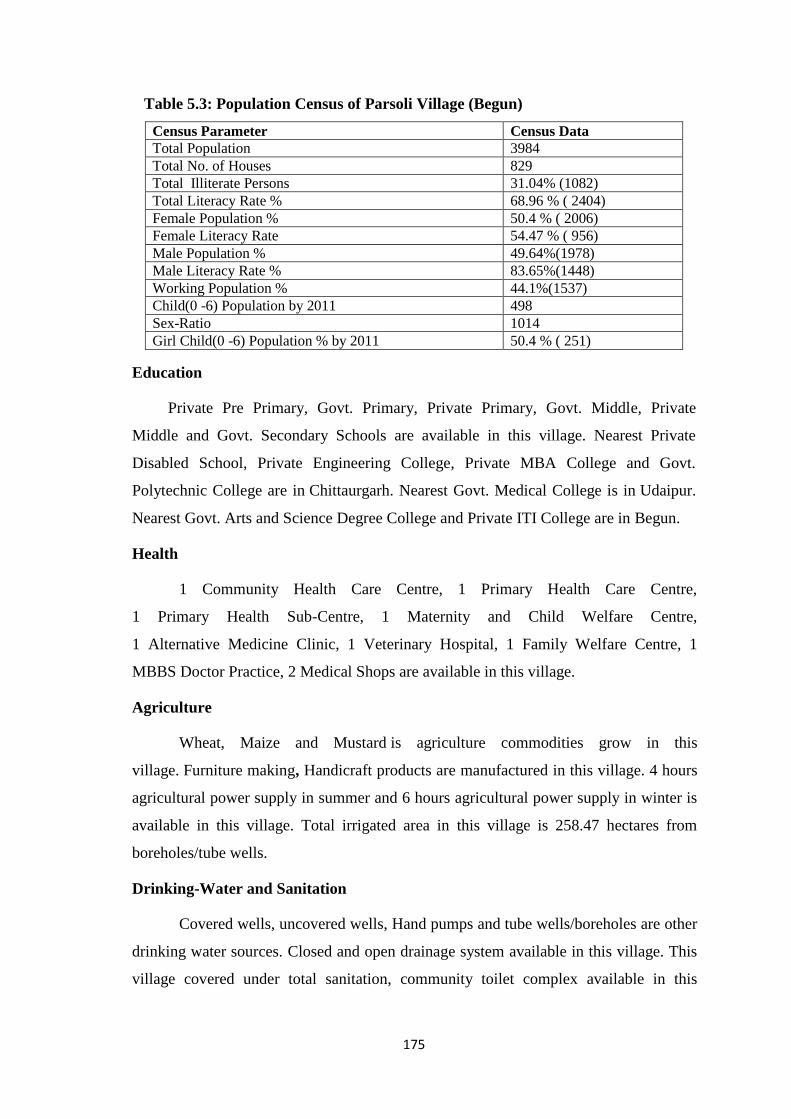
175
Table 5.3: Population Census of Parsoli Village (Begun)
Census Parameter Census Data Total Population 3984 Total No. of Houses 829 Total Illiterate Persons 31.04% (1082) Total Literacy Rate % 68.96 % ( 2404) Female Population % 50.4 % ( 2006) Female Literacy Rate 54.47 % ( 956) Male Population % 49.64%(1978) Male Literacy Rate % 83.65%(1448) Working Population % 44.1%(1537) Child(0 -6) Population by 2011 498 Sex-Ratio 1014 Girl Child(0 -6) Population % by 2011 50.4 % ( 251)
Education
Private Pre Primary, Govt. Primary, Private Primary, Govt. Middle, Private
Middle and Govt. Secondary Schools are available in this village. Nearest Private
Disabled School, Private Engineering College, Private MBA College and Govt.
Polytechnic College are in Chittaurgarh. Nearest Govt. Medical College is in Udaipur.
Nearest Govt. Arts and Science Degree College and Private ITI College are in Begun.
Health
1 Community Health Care Centre, 1 Primary Health Care Centre,
1 Primary Health Sub-Centre, 1 Maternity and Child Welfare Centre,
1 Alternative Medicine Clinic, 1 Veterinary Hospital, 1 Family Welfare Centre, 1
MBBS Doctor Practice, 2 Medical Shops are available in this village.
Agriculture
Wheat, Maize and Mustard is agriculture commodities grow in this
village. Furniture making, Handicraft products are manufactured in this village. 4 hours
agricultural power supply in summer and 6 hours agricultural power supply in winter is
available in this village. Total irrigated area in this village is 258.47 hectares from
boreholes/tube wells.
Drinking-Water and Sanitation
Covered wells, uncovered wells, Hand pumps and tube wells/boreholes are other
drinking water sources. Closed and open drainage system available in this village. This
village covered under total sanitation, community toilet complex available in this
176
village. There is no system to collect garbage from street and drain water is discharged
directly into water bodies.
Communication
Sub post office, landline telephone available, mobile coverage, and internet
facility centre available in this village. No private courier facility available in 10km.
Transportation
This village has railway station, public bus service, private bus service, autos,
tractors and animal driven carts available in this village. National Highways, State
Highways, district road pass through this village. Pucca (metalled) road, kuccha (non-
metalled) road, macadam road and foot path are other roads and transportation within
the village.
Commerce
ATM, Commercial Bank, Co-operative Bank, Agricultural credit society and
Mandis/Regular market is available in this village.
Other Amenities
This village has a power supply with 6 hours power supply for summer and 22
hours for winter, Anganwadi centre, ASHA, Birth & Death registration office, sports
facilities, public library; daily news paper and polling station are the other amenities
available in the village.
(4)
Mandawari Village (Begun)
Location and Administration
Mandawari is a village in Begun tehsil in Chittaurgarh District of Rajasthan
State, India. Mandawari is 5 km. distance from Sub-District Headquarters Begun and it
is 70 km. distance from District Headquarter Chittaurgarh. Total of Mandawari area is
716 hectares, Non-agricultural area is 49 hectares and total irrigated area is 586.17
hectares.
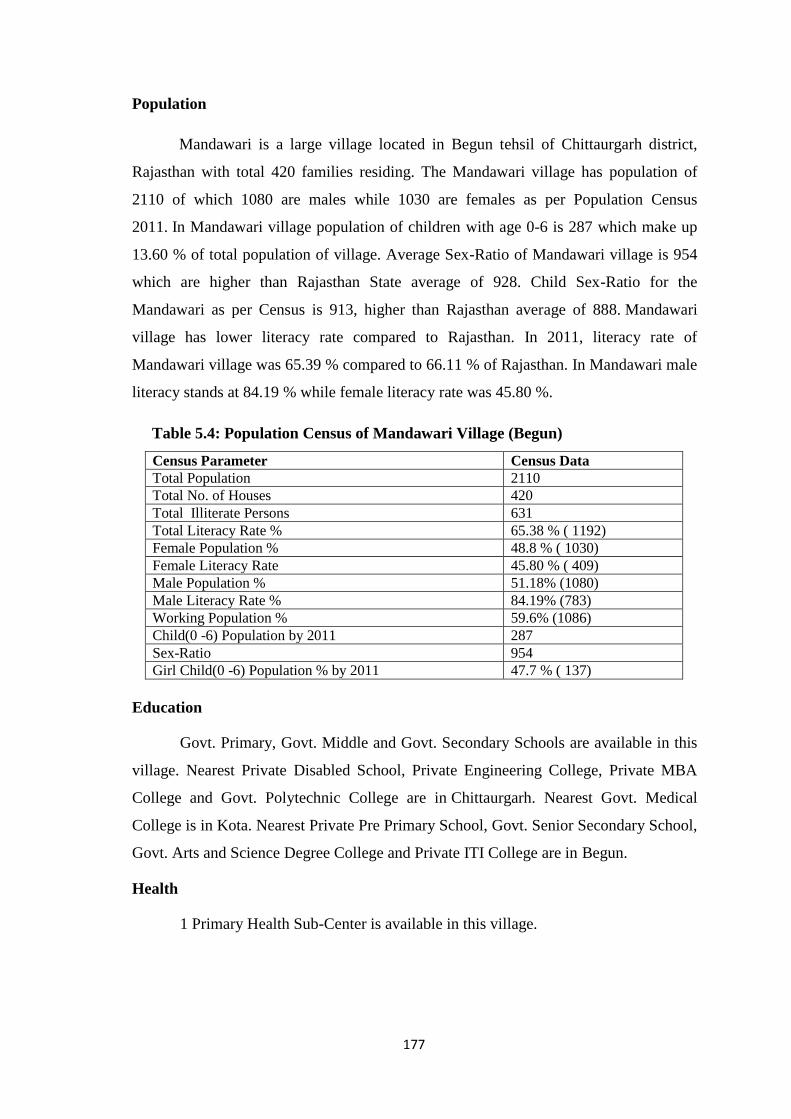
177
Population
Mandawari is a large village located in Begun tehsil of Chittaurgarh district,
Rajasthan with total 420 families residing. The Mandawari village has population of
2110 of which 1080 are males while 1030 are females as per Population Census
2011. In Mandawari village population of children with age 0-6 is 287 which make up
13.60 % of total population of village. Average Sex-Ratio of Mandawari village is 954
which are higher than Rajasthan State average of 928. Child Sex-Ratio for the
Mandawari as per Census is 913, higher than Rajasthan average of 888. Mandawari
village has lower literacy rate compared to Rajasthan. In 2011, literacy rate of
Mandawari village was 65.39 % compared to 66.11 % of Rajasthan. In Mandawari male
literacy stands at 84.19 % while female literacy rate was 45.80 %.
Table 5.4: Population Census of Mandawari Village (Begun)
Census Parameter Census Data Total Population 2110 Total No. of Houses 420 Total Illiterate Persons 631 Total Literacy Rate % 65.38 % ( 1192) Female Population % 48.8 % ( 1030) Female Literacy Rate 45.80 % ( 409) Male Population % 51.18% (1080) Male Literacy Rate % 84.19% (783) Working Population % 59.6% (1086) Child(0 -6) Population by 2011 287 Sex-Ratio 954 Girl Child(0 -6) Population % by 2011 47.7 % ( 137)
Education
Govt. Primary, Govt. Middle and Govt. Secondary Schools are available in this
village. Nearest Private Disabled School, Private Engineering College, Private MBA
College and Govt. Polytechnic College are in Chittaurgarh. Nearest Govt. Medical
College is in Kota. Nearest Private Pre Primary School, Govt. Senior Secondary School,
Govt. Arts and Science Degree College and Private ITI College are in Begun.
Health
1 Primary Health Sub-Center is available in this village.
178
Agriculture
Wheat, Maize and Mustard is agriculture commodities grow in this
village. Ghee, Handicraft product is manufactured in this village. 6 hours agricultural
power supply in summer and 8 hours in winter is available in this village. Total irrigated
area in this village is 586.17 hectares from boreholes/tube wells.
Drinking-Water and Sanitation
Covered-uncovered wells, hand pumps and tube wells/boreholes are other
drinking water sources. Closed and open drainage system available in this village. No
system to collect garbage on street and drain water is discharged directly into water
bodies.
Communication
Sub post office, landline telephone available, mobile coverage, internet facility
centre available in this village. Nearest private courier facility is in 5-10 Km.
Transportation
Nearest public bus service available in 5-10 km. There is no railway station near
by 10 km. autos, tractors and animal driven carts are there in this village. No nearest
National Highway near by 10 km. no nearest State Highway in less than 10 km and no
nearest district road in less than 10 km. Pucca (metalled) road, kuccha (non-metalled)
road, macadam road and foot path are other roads and transportation within the village.
Commerce
Nearest ATM is in 5 - 10 km, Commercial Bank is in 5 - 10 km and Co-
operative Bank is in 5 - 10 km. Agricultural credit society and Mandis/Regular market
is available in this village.
Other Amenities
This village has a power supply with 12 hours in summer and 16 hours in
winter, Anganwadi centre, ASHA, Birth & Death registration office, sports facilities;
daily news paper and polling station are the other amenities in the village.
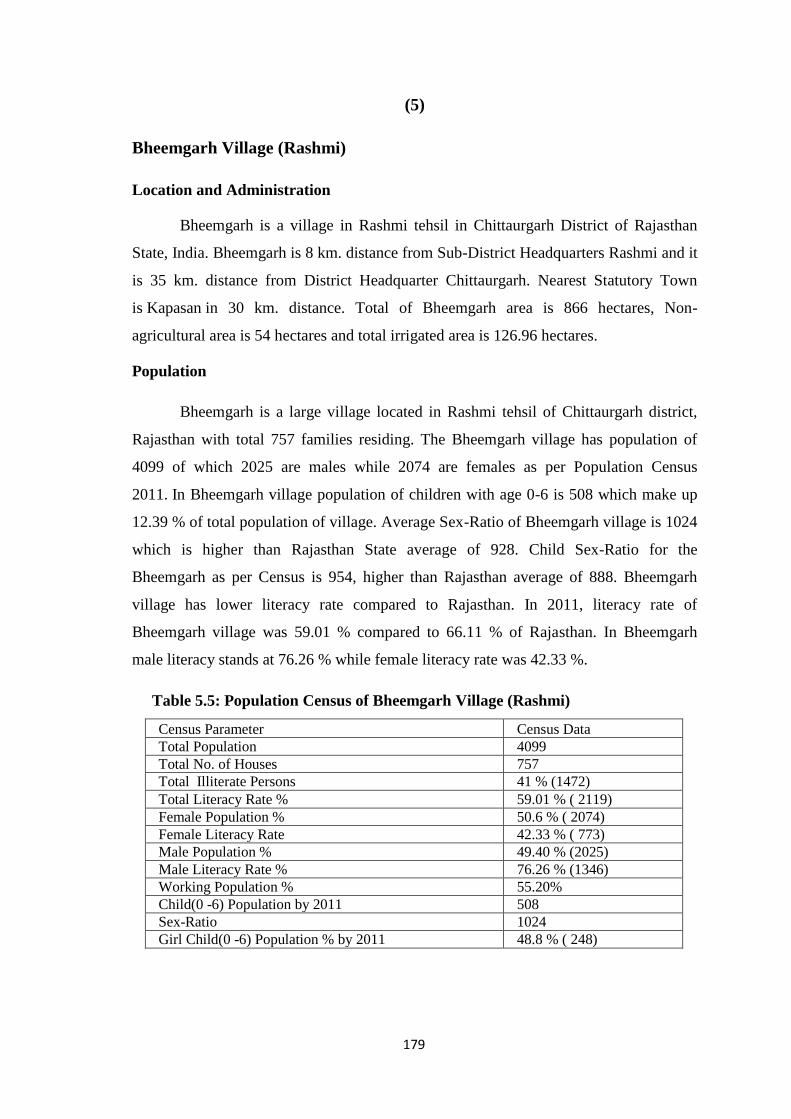
179
(5)
Bheemgarh Village (Rashmi)
Location and Administration
Bheemgarh is a village in Rashmi tehsil in Chittaurgarh District of Rajasthan
State, India. Bheemgarh is 8 km. distance from Sub-District Headquarters Rashmi and it
is 35 km. distance from District Headquarter Chittaurgarh. Nearest Statutory Town
is Kapasan in 30 km. distance. Total of Bheemgarh area is 866 hectares, Non-
agricultural area is 54 hectares and total irrigated area is 126.96 hectares.
Population
Bheemgarh is a large village located in Rashmi tehsil of Chittaurgarh district,
Rajasthan with total 757 families residing. The Bheemgarh village has population of
4099 of which 2025 are males while 2074 are females as per Population Census
2011. In Bheemgarh village population of children with age 0-6 is 508 which make up
12.39 % of total population of village. Average Sex-Ratio of Bheemgarh village is 1024
which is higher than Rajasthan State average of 928. Child Sex-Ratio for the
Bheemgarh as per Census is 954, higher than Rajasthan average of 888. Bheemgarh
village has lower literacy rate compared to Rajasthan. In 2011, literacy rate of
Bheemgarh village was 59.01 % compared to 66.11 % of Rajasthan. In Bheemgarh
male literacy stands at 76.26 % while female literacy rate was 42.33 %.
Table 5.5: Population Census of Bheemgarh Village (Rashmi)
Census Parameter Census Data Total Population 4099 Total No. of Houses 757 Total Illiterate Persons 41 % (1472) Total Literacy Rate % 59.01 % ( 2119) Female Population % 50.6 % ( 2074) Female Literacy Rate 42.33 % ( 773) Male Population % 49.40 % (2025) Male Literacy Rate % 76.26 % (1346) Working Population % 55.20% Child(0 -6) Population by 2011 508 Sex-Ratio 1024 Girl Child(0 -6) Population % by 2011 48.8 % ( 248)
180
Education
Private Pre Primary, Govt. Primary, Private Primary, Govt. Middle, Private
Middle and Govt. Secondary Schools are available in this village. Nearest Private
Disabled School, Private Engineering College and Govt. Polytechnic College are
in Chittaurgarh. Nearest Govt. Medical College and Private MBA College are in
Udaipur. Nearest Govt. Arts and Science Degree College and Govt ITI College are
in Rashmi.
Health
1 Primary Health Sub-Centre, 1 Maternity and Child Welfare Centre, 1
Alternative Medicine Clinic, 1 Medical Shop is available in this village.
Agriculture
Wheat, Maize and Groundnut is agriculture commodities grow in this Village.
Agricultural power supply in summer and winter is 6 hours available in this village.
Total irrigated area in this village is 126.96 hectares from boreholes/tube wells.
Drinking-Water and Sanitation
Covered-uncovered wells, Hand pumps and tube wells/boreholes are other
drinking water sources. Closed-open drainage system is available in this village. This
village covered under total sanitation and community toilet complex available in this
village. There is system to collect garbage on street. Drain water is discharged directly
into water bodies.
Communication
Sub post office, landline telephone facility, mobile coverage and internet facility
centre available in this village. No private courier facility near by 10 km.
Transportation
Public and private bus service is available in this village. There is no railway
station around 10 km. autos, tractors, man pulled cycle rickshaws and animal driven
carts are there in this village. No nearest National Highway and no nearest State
Highway less than 10 km. but district road pass through this village. Pucca (metalled)
road, kuccha (non-metalled) road, macadam road and foot path are other roads and
transportation within the village.
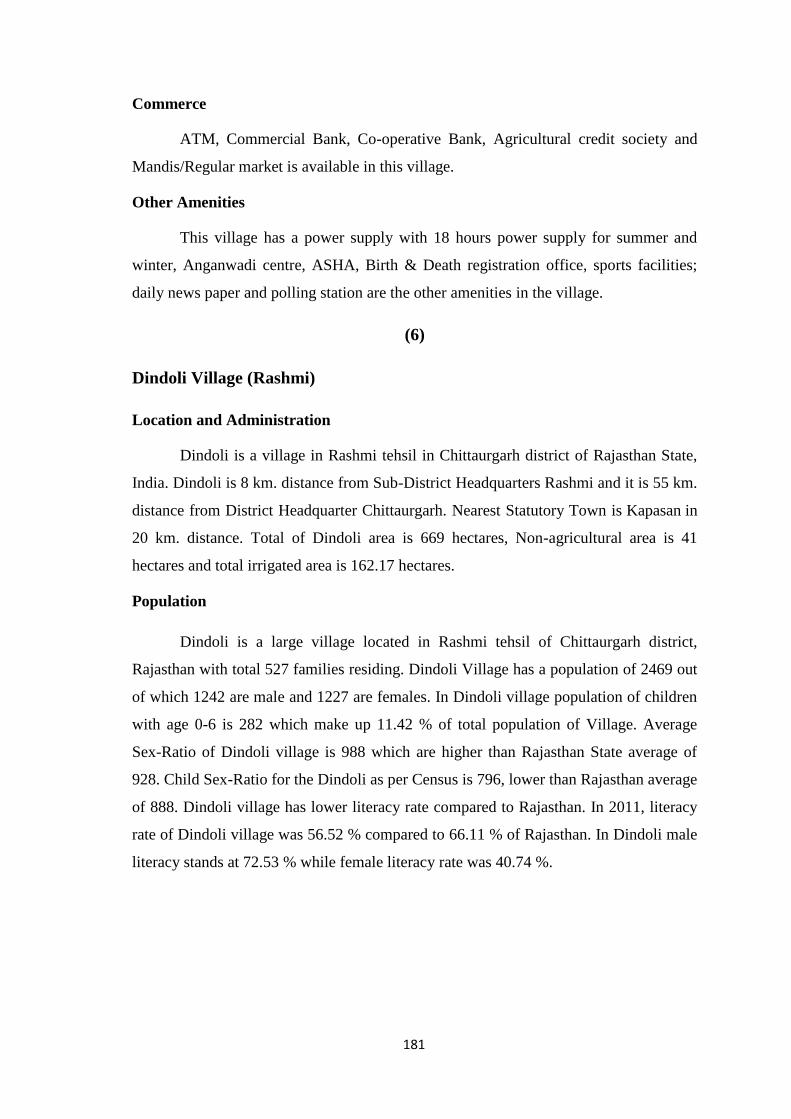
181
Commerce
ATM, Commercial Bank, Co-operative Bank, Agricultural credit society and
Mandis/Regular market is available in this village.
Other Amenities
This village has a power supply with 18 hours power supply for summer and
winter, Anganwadi centre, ASHA, Birth & Death registration office, sports facilities;
daily news paper and polling station are the other amenities in the village.
(6)
Dindoli Village (Rashmi)
Location and Administration
Dindoli is a village in Rashmi tehsil in Chittaurgarh district of Rajasthan State,
India. Dindoli is 8 km. distance from Sub-District Headquarters Rashmi and it is 55 km.
distance from District Headquarter Chittaurgarh. Nearest Statutory Town is Kapasan in
20 km. distance. Total of Dindoli area is 669 hectares, Non-agricultural area is 41
hectares and total irrigated area is 162.17 hectares.
Population
Dindoli is a large village located in Rashmi tehsil of Chittaurgarh district,
Rajasthan with total 527 families residing. Dindoli Village has a population of 2469 out
of which 1242 are male and 1227 are females. In Dindoli village population of children
with age 0-6 is 282 which make up 11.42 % of total population of Village. Average
Sex-Ratio of Dindoli village is 988 which are higher than Rajasthan State average of
928. Child Sex-Ratio for the Dindoli as per Census is 796, lower than Rajasthan average
of 888. Dindoli village has lower literacy rate compared to Rajasthan. In 2011, literacy
rate of Dindoli village was 56.52 % compared to 66.11 % of Rajasthan. In Dindoli male
literacy stands at 72.53 % while female literacy rate was 40.74 %.
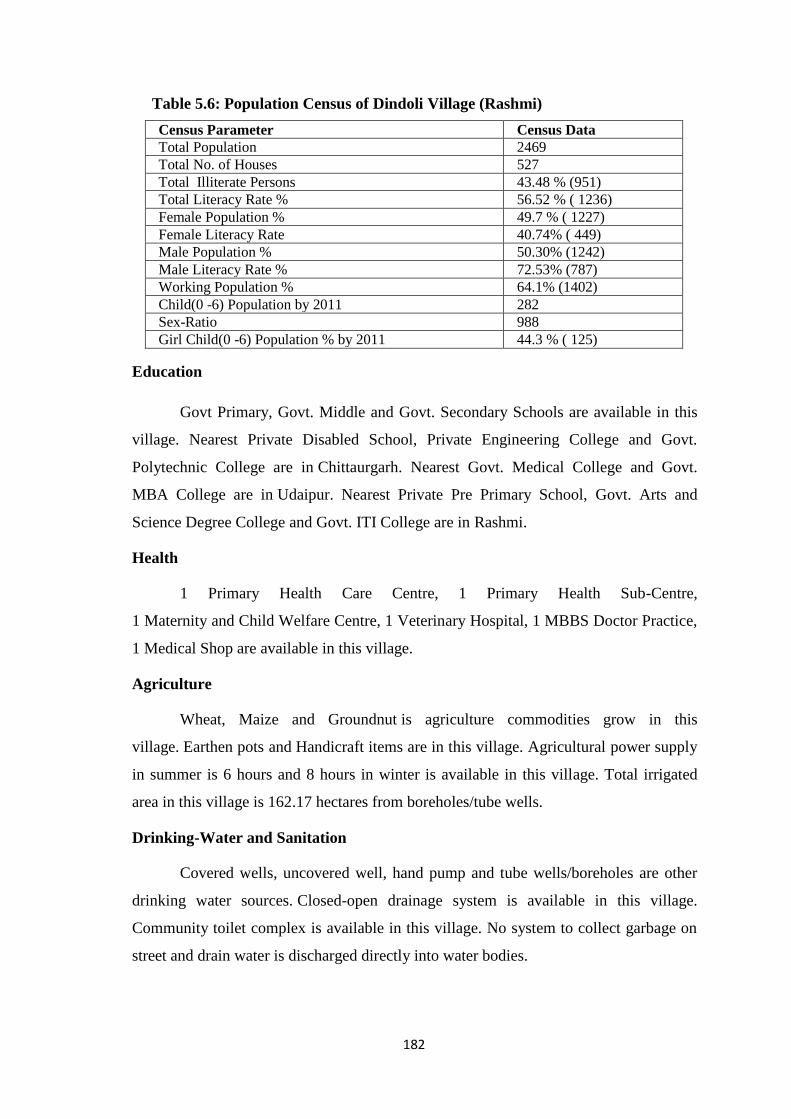
182
Table 5.6: Population Census of Dindoli Village (Rashmi)
Census Parameter Census Data Total Population 2469 Total No. of Houses 527 Total Illiterate Persons 43.48 % (951) Total Literacy Rate % 56.52 % ( 1236) Female Population % 49.7 % ( 1227) Female Literacy Rate 40.74% ( 449) Male Population % 50.30% (1242) Male Literacy Rate % 72.53% (787) Working Population % 64.1% (1402) Child(0 -6) Population by 2011 282 Sex-Ratio 988 Girl Child(0 -6) Population % by 2011 44.3 % ( 125)
Education
Govt Primary, Govt. Middle and Govt. Secondary Schools are available in this
village. Nearest Private Disabled School, Private Engineering College and Govt.
Polytechnic College are in Chittaurgarh. Nearest Govt. Medical College and Govt.
MBA College are in Udaipur. Nearest Private Pre Primary School, Govt. Arts and
Science Degree College and Govt. ITI College are in Rashmi.
Health
1 Primary Health Care Centre, 1 Primary Health Sub-Centre,
1 Maternity and Child Welfare Centre, 1 Veterinary Hospital, 1 MBBS Doctor Practice,
1 Medical Shop are available in this village.
Agriculture
Wheat, Maize and Groundnut is agriculture commodities grow in this
village. Earthen pots and Handicraft items are in this village. Agricultural power supply
in summer is 6 hours and 8 hours in winter is available in this village. Total irrigated
area in this village is 162.17 hectares from boreholes/tube wells.
Drinking-Water and Sanitation
Covered wells, uncovered well, hand pump and tube wells/boreholes are other
drinking water sources. Closed-open drainage system is available in this village.
Community toilet complex is available in this village. No system to collect garbage on
street and drain water is discharged directly into water bodies.
183
Communication
Sub post office, landline telephone facility, mobile coverage, internet facility
centre available and no private courier facility around 10 km.
Transportation
Public and private bus service is available in this village. There is no railway
station near by 10 km. autos, tractors and animal driven carts are there in this village.
No nearest National Highway around 10 km, State Highway passes and district road
passes through this village. Pucca (metalled) road, kuccha (non-metalled) road,
macadam road and foot path are other roads and transportation within the village.
Commerce
Nearest ATM is in 5-10 km. No Commercial Bank in less than 10 km., nearest
Co-operative Bank is in 5-10 km. Agricultural credit society and Mandis/Regular
markets are available in this village.
Other Amenities
This village has a power supply with 6 hour for summer and 8 for winter,
Anganwadi centre, ASHA, Birth & Death registration office, sports facilities; daily
news paper and polling station are the other amenities in the village.
(7)
Pootholi Village (Gangrar)
Location and Administration
Pootholi is a village in Gangrar tehsil in Chittaurgarh district of Rajasthan State,
India. Pootholi is 14 km. distance from Sub-District Headquarters Gangrar and it is 8
km. distance from District Headquarter Chittaurgarh. Nearest Statutory Town
is Chittaurgarh in 8 km. distance. Total of Pootholi area is 451.94 hectares, non-
agricultural area is 197.67 hectares and total irrigated area is 155.89 hectares.
Population
Pootholi is a large village located in Gangrar tehsil of Chittaurgarh district,
Rajasthan with total 846 families residing. The Pootholi village has population of 4081
of which 2242 are males while 1839 are females as per Population Census 2011. In
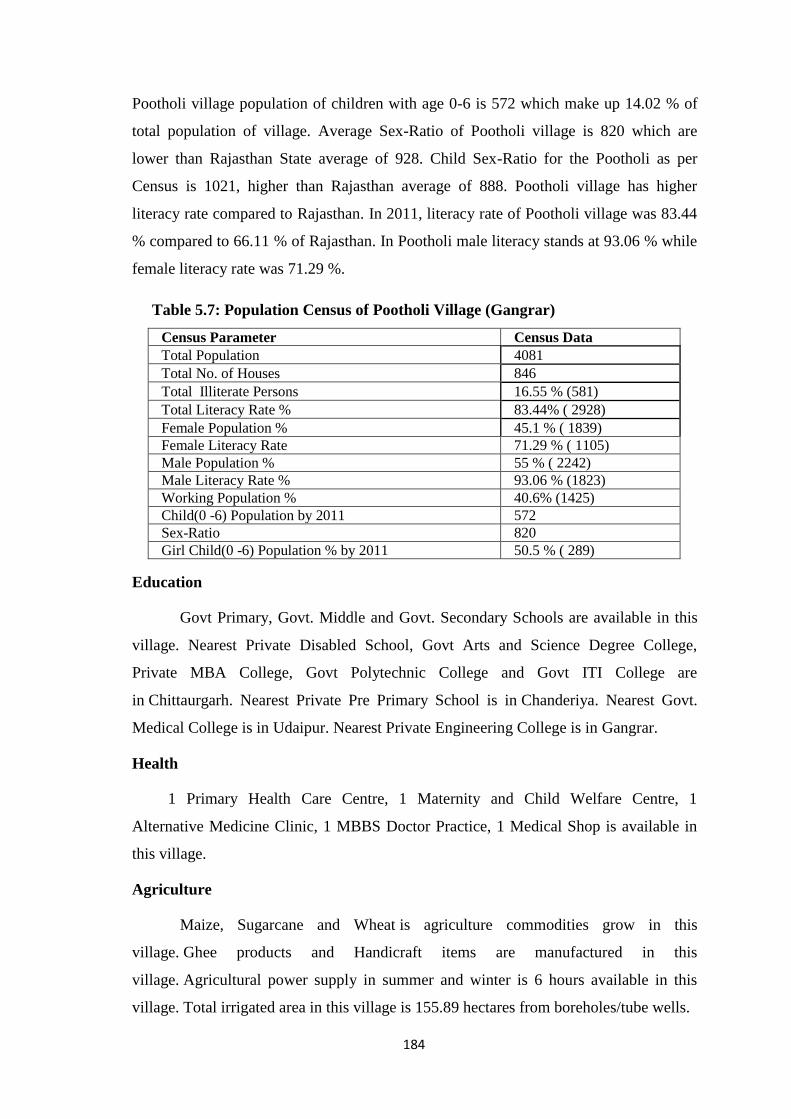
184
Pootholi village population of children with age 0-6 is 572 which make up 14.02 % of
total population of village. Average Sex-Ratio of Pootholi village is 820 which are
lower than Rajasthan State average of 928. Child Sex-Ratio for the Pootholi as per
Census is 1021, higher than Rajasthan average of 888. Pootholi village has higher
literacy rate compared to Rajasthan. In 2011, literacy rate of Pootholi village was 83.44
% compared to 66.11 % of Rajasthan. In Pootholi male literacy stands at 93.06 % while
female literacy rate was 71.29 %.
Table 5.7: Population Census of Pootholi Village (Gangrar)
Census Parameter Census Data Total Population 4081 Total No. of Houses 846 Total Illiterate Persons 16.55 % (581) Total Literacy Rate % 83.44% ( 2928) Female Population % 45.1 % ( 1839) Female Literacy Rate 71.29 % ( 1105) Male Population % 55 % ( 2242) Male Literacy Rate % 93.06 % (1823) Working Population % 40.6% (1425) Child(0 -6) Population by 2011 572 Sex-Ratio 820 Girl Child(0 -6) Population % by 2011 50.5 % ( 289)
Education
Govt Primary, Govt. Middle and Govt. Secondary Schools are available in this
village. Nearest Private Disabled School, Govt Arts and Science Degree College,
Private MBA College, Govt Polytechnic College and Govt ITI College are
in Chittaurgarh. Nearest Private Pre Primary School is in Chanderiya. Nearest Govt.
Medical College is in Udaipur. Nearest Private Engineering College is in Gangrar.
Health
1 Primary Health Care Centre, 1 Maternity and Child Welfare Centre, 1
Alternative Medicine Clinic, 1 MBBS Doctor Practice, 1 Medical Shop is available in
this village.
Agriculture
Maize, Sugarcane and Wheat is agriculture commodities grow in this
village. Ghee products and Handicraft items are manufactured in this
village. Agricultural power supply in summer and winter is 6 hours available in this
village. Total irrigated area in this village is 155.89 hectares from boreholes/tube wells.
185
Drinking-Water and Sanitation
Covered wells, uncovered wells, Hand pumps and tube wells/boreholes are other
drinking water sources. Closed and open drainage system available in this village. This
village covered under total sanitation. There is system to collect garbage on street and
drain water is discharged directly into water bodies.
Communication
Post office, sub post office, landline, mobile coverage and internet centre
available in this village. Nearest private courier facility is in less than 5 km.
Transportation
Public bus service, private bus service, nearest railway station is in less than 5
km. autos, tractors, man pulled cycle rickshaws and animal driven carts are there in this
village. National Highway, State Highway and district road passes through this
village. Pucca road, kuccha road, macadam road and foot path are other roads and
transportation within the village.
Commerce
ATM, Commercial Bank, Co-operative Bank, Agricultural credit society and
Mandis/Regular market is available in this village.
Other Amenities
This village has a power supply with 18 hours power supply for summer and 18
hours power supply for winter, Anganwadi centre, ASHA, Birth & Death registration
office, sports facilities; daily news paper and polling station are the other amenities in
the village.
(8)
Suwaniya Village (Gangrar)
Location and Administration
Suwaniya is a village in Gangrar tehsil in Chittaurgarh district of Rajasthan
State, India. Suwaniya is 8 km. distance from Sub-District Headquarters Gangrar and it
is 17 km. distance from District Headquarter Chittaurgarh. Nearest Statutory Town
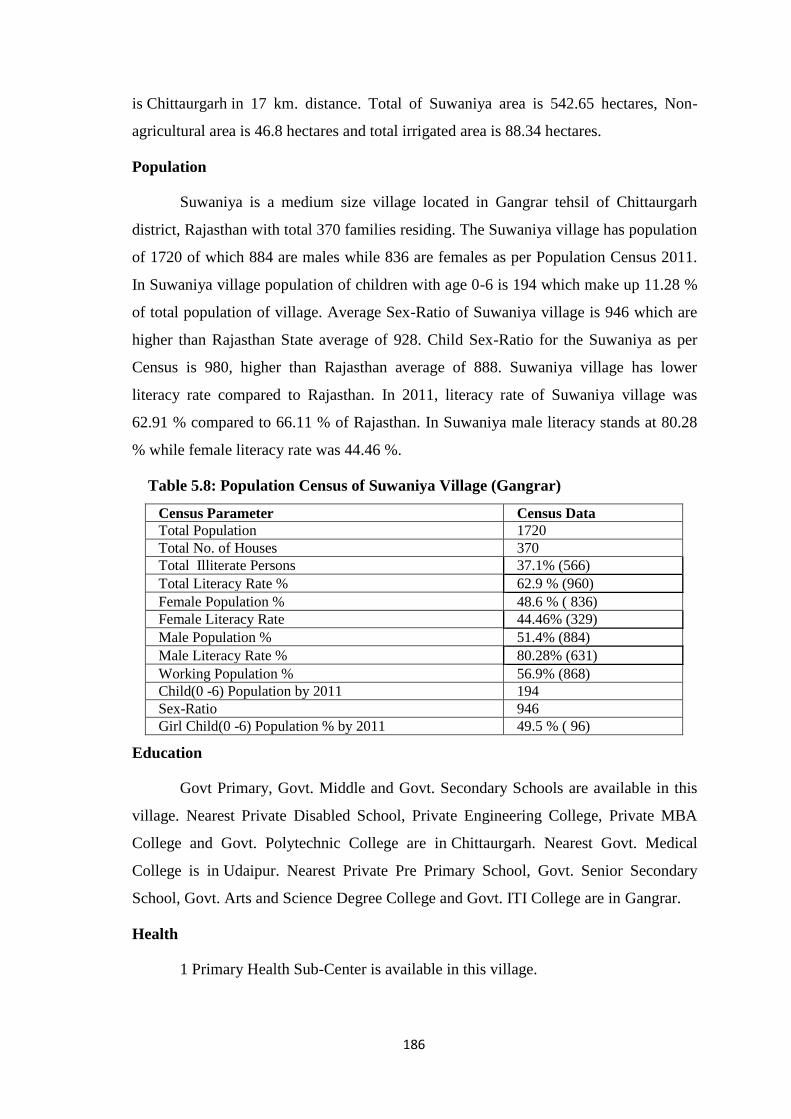
186
is Chittaurgarh in 17 km. distance. Total of Suwaniya area is 542.65 hectares, Non-
agricultural area is 46.8 hectares and total irrigated area is 88.34 hectares.
Population
Suwaniya is a medium size village located in Gangrar tehsil of Chittaurgarh
district, Rajasthan with total 370 families residing. The Suwaniya village has population
of 1720 of which 884 are males while 836 are females as per Population Census 2011.
In Suwaniya village population of children with age 0-6 is 194 which make up 11.28 %
of total population of village. Average Sex-Ratio of Suwaniya village is 946 which are
higher than Rajasthan State average of 928. Child Sex-Ratio for the Suwaniya as per
Census is 980, higher than Rajasthan average of 888. Suwaniya village has lower
literacy rate compared to Rajasthan. In 2011, literacy rate of Suwaniya village was
62.91 % compared to 66.11 % of Rajasthan. In Suwaniya male literacy stands at 80.28
% while female literacy rate was 44.46 %.
Table 5.8: Population Census of Suwaniya Village (Gangrar)
Census Parameter Census Data Total Population 1720 Total No. of Houses 370 Total Illiterate Persons 37.1% (566) Total Literacy Rate % 62.9 % (960) Female Population % 48.6 % ( 836) Female Literacy Rate 44.46% (329) Male Population % 51.4% (884) Male Literacy Rate % 80.28% (631) Working Population % 56.9% (868) Child(0 -6) Population by 2011 194 Sex-Ratio 946 Girl Child(0 -6) Population % by 2011 49.5 % ( 96)
Education
Govt Primary, Govt. Middle and Govt. Secondary Schools are available in this
village. Nearest Private Disabled School, Private Engineering College, Private MBA
College and Govt. Polytechnic College are in Chittaurgarh. Nearest Govt. Medical
College is in Udaipur. Nearest Private Pre Primary School, Govt. Senior Secondary
School, Govt. Arts and Science Degree College and Govt. ITI College are in Gangrar.
Health
1 Primary Health Sub-Center is available in this village.
187
Agriculture
Wheat, Groundnut and Jeera is agriculture commodities grow in this village. 8
hours agricultural power supply in summer and 12 hours in winter is available in this
village. Total irrigated area in this village is 88.34 hectares from boreholes/tube wells.
Drinking-Water and Sanitation
Treated and untreated tap water supply all round the year and in summer also
available. Uncovered well and tube wells/boreholes are other drinking water
sources. Open drainage system available in this village. There is no system to collect
garbage from street and drain water is discharged directly into water bodies.
Communication
Sub post office, landline telephone, mobile coverage, internet facility centre
available in this village. No private courier facility around 10 km.
Transportation
There is no public bus service in less than 10 km and no railway station near by
10 km. Tractors and animal driven carts are there in this village. National Highway is in
5 - 10 km and State Highway is in 5 - 10 km. No nearest district road in less than 10
km. Pucca (metalled) road, kuccha (non-metalled) road, macadam road and foot path
are other roads and transportation within the village.
Commerce
Nearest ATM, Commercial Bank, Co-operative Bank is in 5 - 10 km.
Agricultural credit society is available in this village.
Other Amenities
This village has a power supply with 12 hours in summer and 18 hour in winter,
Anganwadi centre, ASHA, Birth & Death registration office, sports facilities; daily
news paper and polling station are the other amenities in the village.
(9)
Mandesara Village (Rawatbhata)
Location and Administration
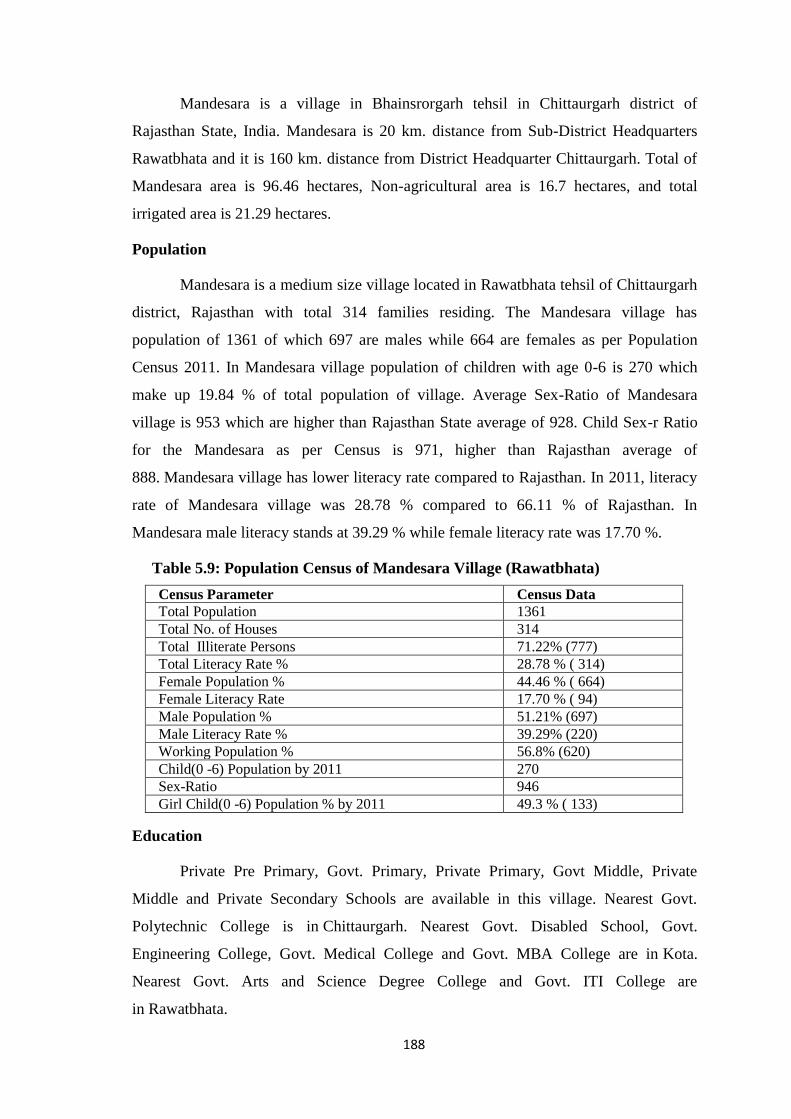
188
Mandesara is a village in Bhainsrorgarh tehsil in Chittaurgarh district of
Rajasthan State, India. Mandesara is 20 km. distance from Sub-District Headquarters
Rawatbhata and it is 160 km. distance from District Headquarter Chittaurgarh. Total of
Mandesara area is 96.46 hectares, Non-agricultural area is 16.7 hectares, and total
irrigated area is 21.29 hectares.
Population
Mandesara is a medium size village located in Rawatbhata tehsil of Chittaurgarh
district, Rajasthan with total 314 families residing. The Mandesara village has
population of 1361 of which 697 are males while 664 are females as per Population
Census 2011. In Mandesara village population of children with age 0-6 is 270 which
make up 19.84 % of total population of village. Average Sex-Ratio of Mandesara
village is 953 which are higher than Rajasthan State average of 928. Child Sex-r Ratio
for the Mandesara as per Census is 971, higher than Rajasthan average of
888. Mandesara village has lower literacy rate compared to Rajasthan. In 2011, literacy
rate of Mandesara village was 28.78 % compared to 66.11 % of Rajasthan. In
Mandesara male literacy stands at 39.29 % while female literacy rate was 17.70 %.
Table 5.9: Population Census of Mandesara Village (Rawatbhata)
Census Parameter Census Data Total Population 1361 Total No. of Houses 314 Total Illiterate Persons 71.22% (777) Total Literacy Rate % 28.78 % ( 314) Female Population % 44.46 % ( 664) Female Literacy Rate 17.70 % ( 94) Male Population % 51.21% (697) Male Literacy Rate % 39.29% (220) Working Population % 56.8% (620) Child(0 -6) Population by 2011 270 Sex-Ratio 946 Girl Child(0 -6) Population % by 2011 49.3 % ( 133)
Education
Private Pre Primary, Govt. Primary, Private Primary, Govt Middle, Private
Middle and Private Secondary Schools are available in this village. Nearest Govt.
Polytechnic College is in Chittaurgarh. Nearest Govt. Disabled School, Govt.
Engineering College, Govt. Medical College and Govt. MBA College are in Kota.
Nearest Govt. Arts and Science Degree College and Govt. ITI College are
in Rawatbhata.
189
Health
1 Primary Health Sub-Centre, 1 Veterinary Hospital, 1 Medical Shop are
available in this village.
Agriculture
Maize, Bajra and Guar is agriculture commodities grow in this village. 12 hours
agricultural power supply in summer and 18 hours agricultural power supply in winter
is available in this village. Total irrigated area in this village is 21.29 hectares from
boreholes/tube wells.
Drinking-Water and Sanitation
Treated and untreated tap water is supplied throughout the year and summer.
Uncovered well, Hand pump and tube wells/boreholes are other drinking water
sources. Open drainage system available in this village. There is no system to collect
garbage from street and drain water is discharged directly into water bodies.
Communication
Post office, sub post office, mobile coverage and internet facility centre
available in this village. There is no private courier facility near by 10km.
Transportation
There is no public bus service around 10 km but private bus service available in
this village. There is no railway station near by 10 km. tractors and animal driven carts
are there in this village. No nearest National Highway, State Highway and no nearest
district road in less than 10 Km. Pucca (metalled) road, kuccha (non-metalled) road,
macadam road and foot path are other roads and transportation within the village.
Commerce
No ATM, Commercial Bank and Co-operative Bank in less than 10 km.
Agricultural credit society are available in this village.
Other Amenities
This village has a power supply with 12 hours in summer and 18 hours in
winter, Anganwadi centre, ASHA, Birth & Death registration office, sports facilities;
daily news paper and polling station are the other amenities in the village.
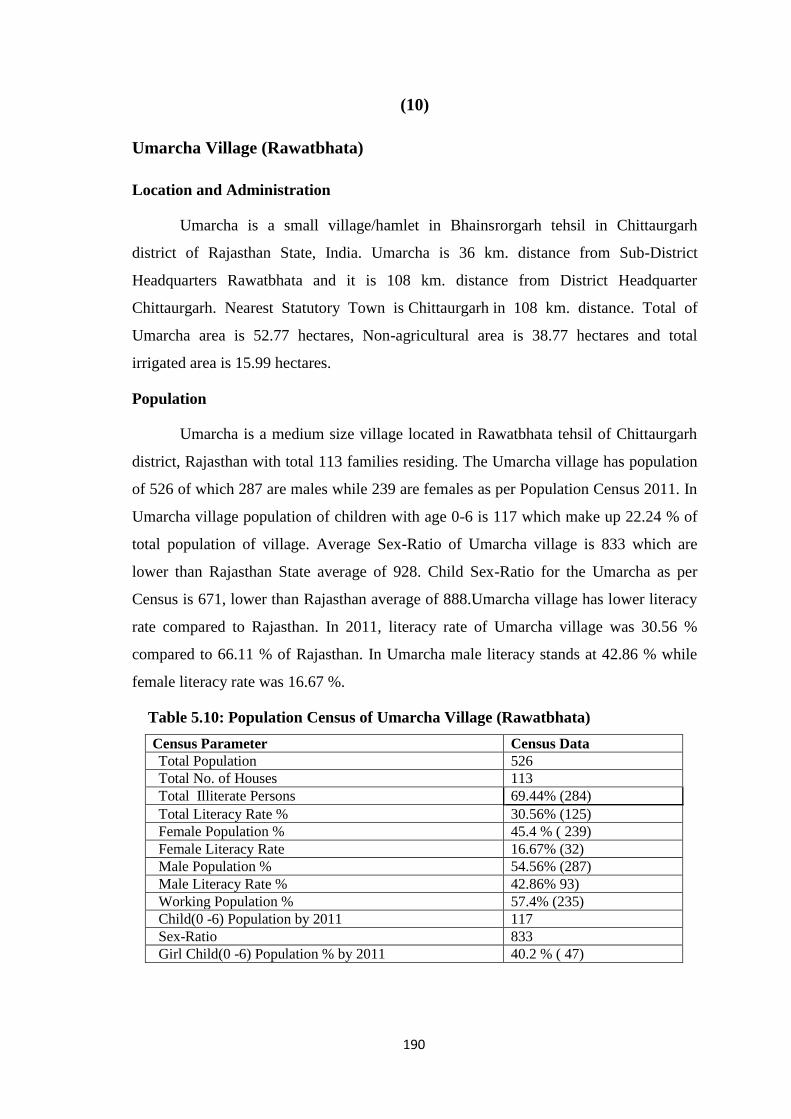
190
(10)
Umarcha Village (Rawatbhata)
Location and Administration
Umarcha is a small village/hamlet in Bhainsrorgarh tehsil in Chittaurgarh
district of Rajasthan State, India. Umarcha is 36 km. distance from Sub-District
Headquarters Rawatbhata and it is 108 km. distance from District Headquarter
Chittaurgarh. Nearest Statutory Town is Chittaurgarh in 108 km. distance. Total of
Umarcha area is 52.77 hectares, Non-agricultural area is 38.77 hectares and total
irrigated area is 15.99 hectares.
Population
Umarcha is a medium size village located in Rawatbhata tehsil of Chittaurgarh
district, Rajasthan with total 113 families residing. The Umarcha village has population
of 526 of which 287 are males while 239 are females as per Population Census 2011. In
Umarcha village population of children with age 0-6 is 117 which make up 22.24 % of
total population of village. Average Sex-Ratio of Umarcha village is 833 which are
lower than Rajasthan State average of 928. Child Sex-Ratio for the Umarcha as per
Census is 671, lower than Rajasthan average of 888.Umarcha village has lower literacy
rate compared to Rajasthan. In 2011, literacy rate of Umarcha village was 30.56 %
compared to 66.11 % of Rajasthan. In Umarcha male literacy stands at 42.86 % while
female literacy rate was 16.67 %.
Table 5.10: Population Census of Umarcha Village (Rawatbhata)
Census Parameter Census Data Total Population 526 Total No. of Houses 113 Total Illiterate Persons 69.44% (284) Total Literacy Rate % 30.56% (125) Female Population % 45.4 % ( 239) Female Literacy Rate 16.67% (32) Male Population % 54.56% (287) Male Literacy Rate % 42.86% 93) Working Population % 57.4% (235) Child(0 -6) Population by 2011 117 Sex-Ratio 833 Girl Child(0 -6) Population % by 2011 40.2 % ( 47)
191
Education
Govt Primary School is available in this village. Nearest Govt. Polytechnic
College is in Chittaurgarh. Nearest Govt. Disabled School, Govt. Engineering College,
Govt. Medical College and Govt. MBA College are in Kota. Nearest Private Arts and
Science Degree College and Govt. ITI College are in Rawatbhata.
Health
There is no facilities available is here.
Agriculture
Maize, Wheat and Mustard is agriculture commodities grow in this village.
Agricultural power supply in summer and winter is 8 hours available in this village.
Total irrigated area in this village is 15.99 hectares from boreholes/tube wells.
Drinking-Water and Sanitation
Treated tap water supply is available throughout the year and summer.
Uncovered well, Hand pumps and tube wells/boreholes are other drinking water
sources. There is no system to collect garbage from street and no drainage system
available in this village. Drain water is discharged directly into water bodies.
Communication
Landline telephone available, mobile coverage is available. Nearest internet
facility centre is in 5 - 10 km. No private courier facility near by 10 km.
Transportation
Nearest public bus service available in 5 - 10 km. There is no railway station
near by 10 km. Tractors and animal driven carts are there in this village. No nearest
National Highway around 10 km, nearest State Highway and district road is in 5 - 10
km. Kuccha (non-metalled) road, macadam road and foot path are other roads and
transportation within the village.
Commerce
No ATM in less than 10 km, nearest Commercial Bank and Co-operative Bank
is in 5 - 10 km.
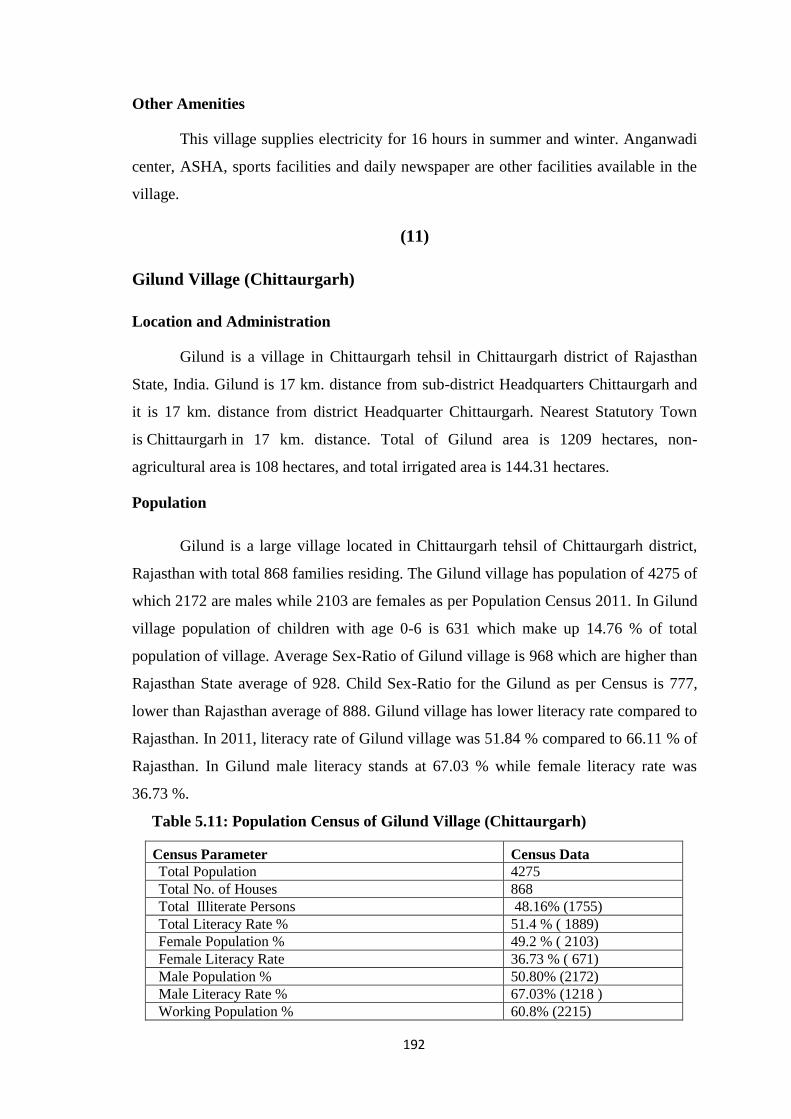
192
Other Amenities
This village supplies electricity for 16 hours in summer and winter. Anganwadi
center, ASHA, sports facilities and daily newspaper are other facilities available in the
village.
(11)
Gilund Village (Chittaurgarh)
Location and Administration
Gilund is a village in Chittaurgarh tehsil in Chittaurgarh district of Rajasthan
State, India. Gilund is 17 km. distance from sub-district Headquarters Chittaurgarh and
it is 17 km. distance from district Headquarter Chittaurgarh. Nearest Statutory Town
is Chittaurgarh in 17 km. distance. Total of Gilund area is 1209 hectares, non-
agricultural area is 108 hectares, and total irrigated area is 144.31 hectares.
Population
Gilund is a large village located in Chittaurgarh tehsil of Chittaurgarh district,
Rajasthan with total 868 families residing. The Gilund village has population of 4275 of
which 2172 are males while 2103 are females as per Population Census 2011. In Gilund
village population of children with age 0-6 is 631 which make up 14.76 % of total
population of village. Average Sex-Ratio of Gilund village is 968 which are higher than
Rajasthan State average of 928. Child Sex-Ratio for the Gilund as per Census is 777,
lower than Rajasthan average of 888. Gilund village has lower literacy rate compared to
Rajasthan. In 2011, literacy rate of Gilund village was 51.84 % compared to 66.11 % of
Rajasthan. In Gilund male literacy stands at 67.03 % while female literacy rate was
36.73 %.
Table 5.11: Population Census of Gilund Village (Chittaurgarh)
Census Parameter Census Data Total Population 4275 Total No. of Houses 868 Total Illiterate Persons 48.16% (1755) Total Literacy Rate % 51.4 % ( 1889) Female Population % 49.2 % ( 2103) Female Literacy Rate 36.73 % ( 671) Male Population % 50.80% (2172) Male Literacy Rate % 67.03% (1218 ) Working Population % 60.8% (2215)
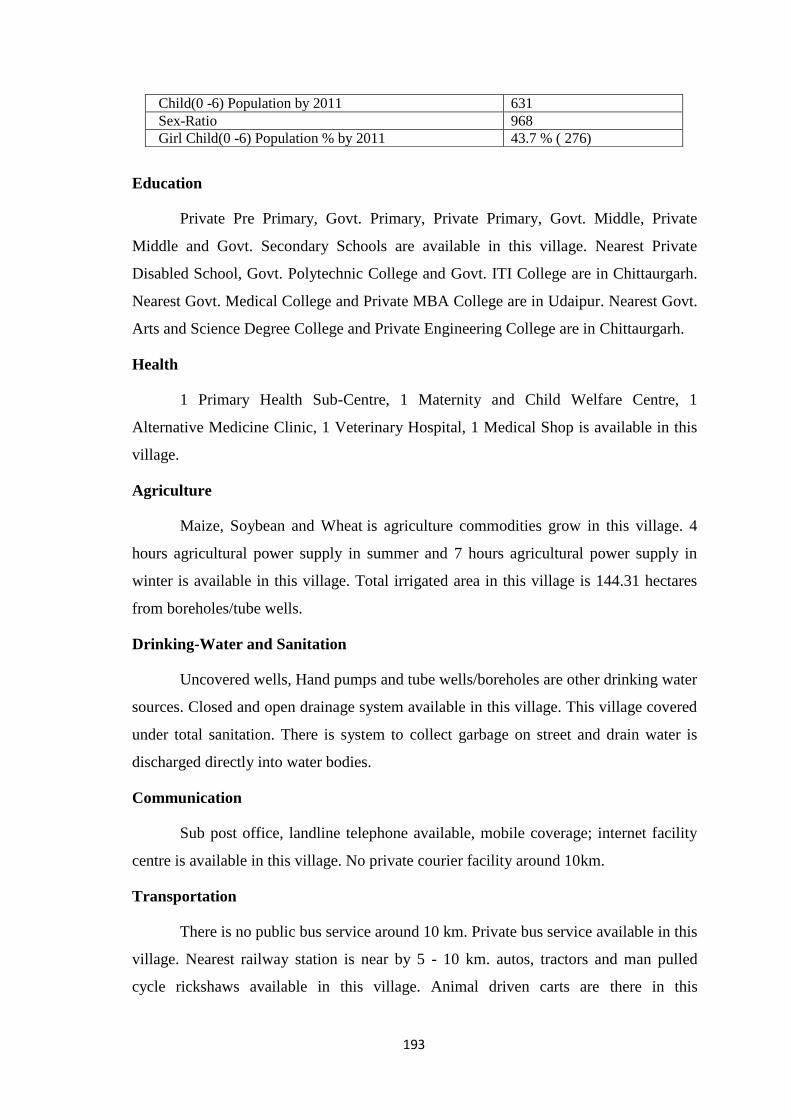
193
Child(0 -6) Population by 2011 631 Sex-Ratio 968 Girl Child(0 -6) Population % by 2011 43.7 % ( 276)
Education
Private Pre Primary, Govt. Primary, Private Primary, Govt. Middle, Private
Middle and Govt. Secondary Schools are available in this village. Nearest Private
Disabled School, Govt. Polytechnic College and Govt. ITI College are in Chittaurgarh.
Nearest Govt. Medical College and Private MBA College are in Udaipur. Nearest Govt.
Arts and Science Degree College and Private Engineering College are in Chittaurgarh.
Health
1 Primary Health Sub-Centre, 1 Maternity and Child Welfare Centre, 1
Alternative Medicine Clinic, 1 Veterinary Hospital, 1 Medical Shop is available in this
village.
Agriculture
Maize, Soybean and Wheat is agriculture commodities grow in this village. 4
hours agricultural power supply in summer and 7 hours agricultural power supply in
winter is available in this village. Total irrigated area in this village is 144.31 hectares
from boreholes/tube wells.
Drinking-Water and Sanitation
Uncovered wells, Hand pumps and tube wells/boreholes are other drinking water
sources. Closed and open drainage system available in this village. This village covered
under total sanitation. There is system to collect garbage on street and drain water is
discharged directly into water bodies.
Communication
Sub post office, landline telephone available, mobile coverage; internet facility
centre is available in this village. No private courier facility around 10km.
Transportation
There is no public bus service around 10 km. Private bus service available in this
village. Nearest railway station is near by 5 - 10 km. autos, tractors and man pulled
cycle rickshaws available in this village. Animal driven carts are there in this
194
village. Nearest National Highway, State Highway and nearest district road is in 5 - 10
km. Pucca (metalled) road, kuccha (non-metalled) road, macadam road and foot path
are other roads and transportation within the village.
Commerce
ATM, Commercial Bank, Co-operative Bank, Agricultural credit society and
Mandis/Regular market is available in this village.
Other Amenities
This village has a power supply with 5 hours for summer and 7 hours for winter,
Anganwadi centre, ASHA, Birth & Death registration office, sports facilities; daily
news paper and polling station are the other amenities in the village.
(12)
Bassi Village (Chittaurgarh)
Location and Administration
Bassi is a village of Chittaurgarh tehsil in Chittaurgarh district of Rajasthan State
of India. Bassi District Headquarters is 24 km. away from Chittaurgarh and the District
Headquarter are 24 km. away from Chittaurgarh. Total of Bassi area is 637.72 hectares,
non-agricultural area is 16.44 hectares, and total irrigated area is 356.74 hectares.
Population
Bassi is a large village located in Chittaurgarh tehsil of Chittaurgarh district,
Rajasthan with total 2362 families residing. The Bassi village has population of 11743
of which 5991 are males while 5752 are females as per Population Census 2011. In
Bassi village population of children with age 0-6 is 1661 which makes up 14.14 % of
total population of village. Average Sex-Ratio of Bassi village is 960 which are higher
than Rajasthan State average of 928. Child Sex-Ratio for the Bassi as per Census is 862,
lower than Rajasthan average of 888.Bassi village has higher literacy rate compared to
Rajasthan. In 2011, literacy rate of Bassi village was 71.65 % compared to 66.11 % of
Rajasthan. In Bassi male literacy stands at 83.17 % while female literacy rate was 59.86
%.
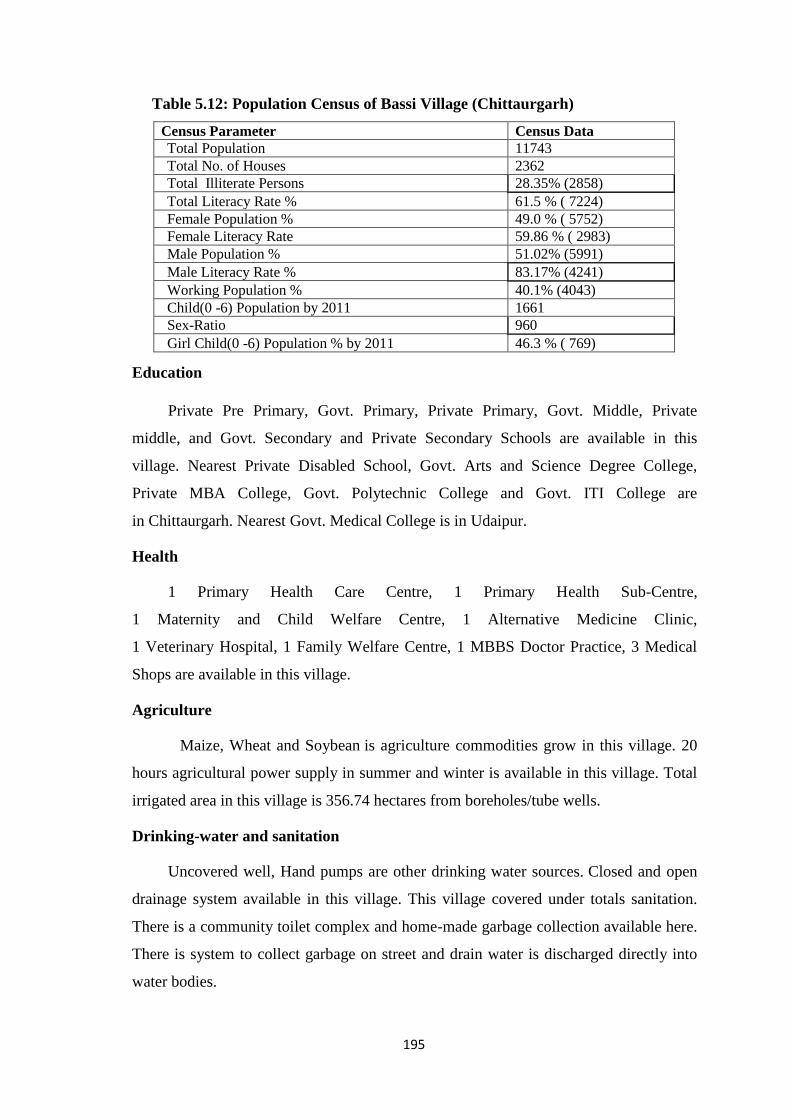
195
Table 5.12: Population Census of Bassi Village (Chittaurgarh)
Census Parameter Census Data Total Population 11743 Total No. of Houses 2362 Total Illiterate Persons 28.35% (2858) Total Literacy Rate % 61.5 % ( 7224) Female Population % 49.0 % ( 5752) Female Literacy Rate 59.86 % ( 2983) Male Population % 51.02% (5991) Male Literacy Rate % 83.17% (4241) Working Population % 40.1% (4043) Child(0 -6) Population by 2011 1661 Sex-Ratio 960 Girl Child(0 -6) Population % by 2011 46.3 % ( 769)
Education
Private Pre Primary, Govt. Primary, Private Primary, Govt. Middle, Private
middle, and Govt. Secondary and Private Secondary Schools are available in this
village. Nearest Private Disabled School, Govt. Arts and Science Degree College,
Private MBA College, Govt. Polytechnic College and Govt. ITI College are
in Chittaurgarh. Nearest Govt. Medical College is in Udaipur.
Health
1 Primary Health Care Centre, 1 Primary Health Sub-Centre,
1 Maternity and Child Welfare Centre, 1 Alternative Medicine Clinic,
1 Veterinary Hospital, 1 Family Welfare Centre, 1 MBBS Doctor Practice, 3 Medical
Shops are available in this village.
Agriculture
Maize, Wheat and Soybean is agriculture commodities grow in this village. 20
hours agricultural power supply in summer and winter is available in this village. Total
irrigated area in this village is 356.74 hectares from boreholes/tube wells.
Drinking-water and sanitation
Uncovered well, Hand pumps are other drinking water sources. Closed and open
drainage system available in this village. This village covered under totals sanitation.
There is a community toilet complex and home-made garbage collection available here.
There is system to collect garbage on street and drain water is discharged directly into
water bodies.
196
Communication
Post office; sub post office, landline telephone, mobile coverage, internet facility
centre and private courier facility available in this village.
Transportation
Public and private bus services are available in this village. This village has
railway station, autos, tractors, man pulled cycle rickshaws available in this village.
Animal driven carts are there in this village. National Highway, State Highway and
district road passes through this village. Pucca (metalled) road, kuccha (non-metalled)
road and foot path are other roads and transportation within the village.
Commerce
ATMs, Commercial Bank, Co-operative Bank, Agricultural credit societies,
Mandis/Regular markets, weekly Haat/Santha and agricultural marketing societies are
available in this village.
Other Amenities
This village has a power supply with 22 hours for summer and 22 hours for
winter, Anganwadi centre, ASHA, Birth & Death registration office, sports facilities,
cinema theatre in Village or nearby, public library; daily news paper and polling station
are the other amenities in the village.
(13)
Kana Khera Village (Kapasan)
Location and Administration
Kana khera is a village in Kapasan tehsil in Chittaurgarh district of Rajasthan
State, India. Kana Khera is 17 km. distance from Sub-District Headquarters Kapasan
and it is 53 km. distance from District Headquarter Chittaurgarh. Total of Kana Khera
area is 248 hectares, Non-agricultural area is 43 hectares and total irrigated area is
108.59 hectares.
Population
Kana Khera is a medium size village located in Kapasan tehsil of Chittaurgarh
district, Rajasthan with total 186 families residing. The Kana Khera village has
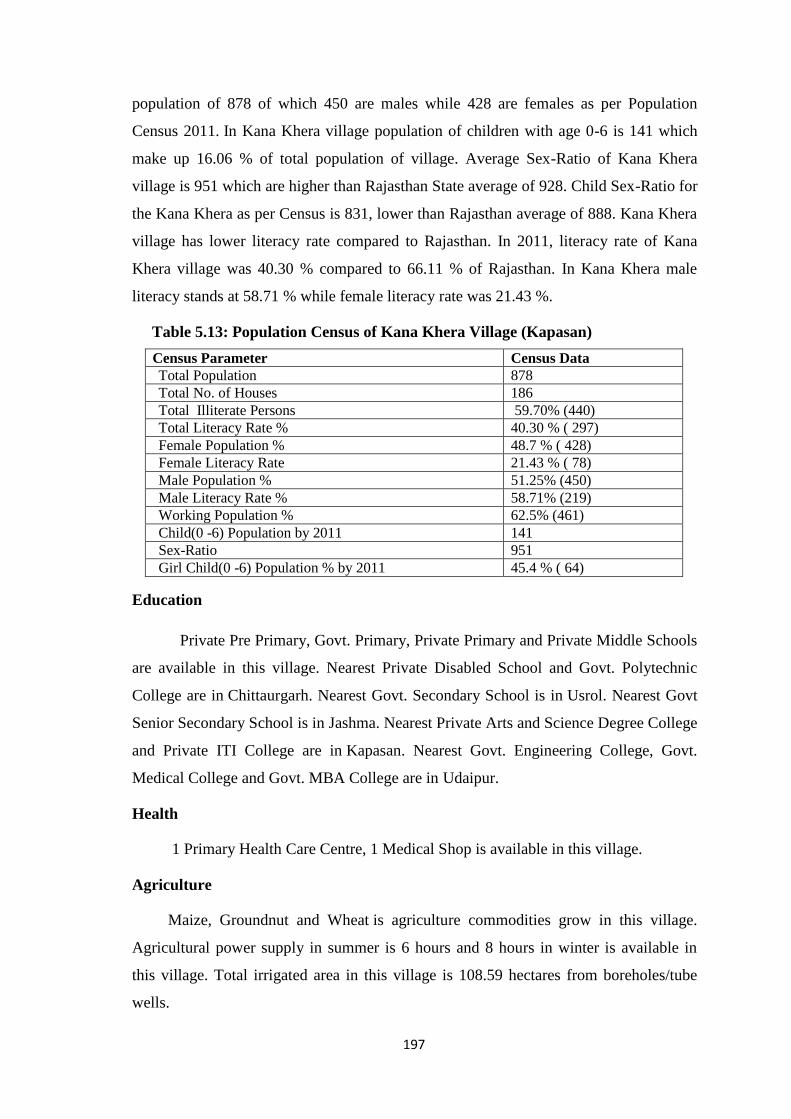
197
population of 878 of which 450 are males while 428 are females as per Population
Census 2011. In Kana Khera village population of children with age 0-6 is 141 which
make up 16.06 % of total population of village. Average Sex-Ratio of Kana Khera
village is 951 which are higher than Rajasthan State average of 928. Child Sex-Ratio for
the Kana Khera as per Census is 831, lower than Rajasthan average of 888. Kana Khera
village has lower literacy rate compared to Rajasthan. In 2011, literacy rate of Kana
Khera village was 40.30 % compared to 66.11 % of Rajasthan. In Kana Khera male
literacy stands at 58.71 % while female literacy rate was 21.43 %.
Table 5.13: Population Census of Kana Khera Village (Kapasan)
Census Parameter Census Data Total Population 878 Total No. of Houses 186 Total Illiterate Persons 59.70% (440) Total Literacy Rate % 40.30 % ( 297) Female Population % 48.7 % ( 428) Female Literacy Rate 21.43 % ( 78) Male Population % 51.25% (450) Male Literacy Rate % 58.71% (219) Working Population % 62.5% (461) Child(0 -6) Population by 2011 141 Sex-Ratio 951 Girl Child(0 -6) Population % by 2011 45.4 % ( 64)
Education
Private Pre Primary, Govt. Primary, Private Primary and Private Middle Schools
are available in this village. Nearest Private Disabled School and Govt. Polytechnic
College are in Chittaurgarh. Nearest Govt. Secondary School is in Usrol. Nearest Govt
Senior Secondary School is in Jashma. Nearest Private Arts and Science Degree College
and Private ITI College are in Kapasan. Nearest Govt. Engineering College, Govt.
Medical College and Govt. MBA College are in Udaipur.
Health
1 Primary Health Care Centre, 1 Medical Shop is available in this village.
Agriculture
Maize, Groundnut and Wheat is agriculture commodities grow in this village.
Agricultural power supply in summer is 6 hours and 8 hours in winter is available in
this village. Total irrigated area in this village is 108.59 hectares from boreholes/tube
wells.
198
Drinking-Water and Sanitation
Treated water and untreated tap water supply is available throughout the year and
summer. Hand pump and tube wells/boreholes are other drinking water sources. Closed
and open drainage system available in this village. No system to collect garbage on
street. Drain water is discharged directly into water bodies.
Communication
Landline telephone, mobile coverage and internet facility centre available in this
village. No private courier facility around 10 km.
Transportation
Nearest bus service available nearby 5 km. Private bus service available in this
village. Nearest railway station is in 5 - 10 km. Tractors available in this village. Animal
driven carts are there in this village. No nearest National Highway around 10 km,
nearest State Highway is in 5 - 10 km and district road passes through this village.
Kuccha (non-metalled) road, macadam road and foot path are other roads and
transportation within the village.
Commerce
Nearest ATM, Commercial Bank and Co-operative Bank is in
5-10km.
Other Amenities
This village has 6 hours in summer and 8 hours power supply in winter.
Anganwadi centre, ASHA, Birth & Death registration office, sports facilities, daily
news paper and polling station are the other amenities available in the village.
(14)
Hingoriya Village (Kapasan)
Location and Administration
Hingoriya is a village in Kapasan tehsil in Chittaurgarh district of Rajasthan State,
India. Hingoriya is 15 km. distance from Sub-District Headquarters Kapasan and it is 32
km. distance from District Headquarter Chittaurgarh. Total of Hingoriya area is 466
hectares, Non-agricultural area is 24 hectares and total irrigated area is 162.48 hectares.
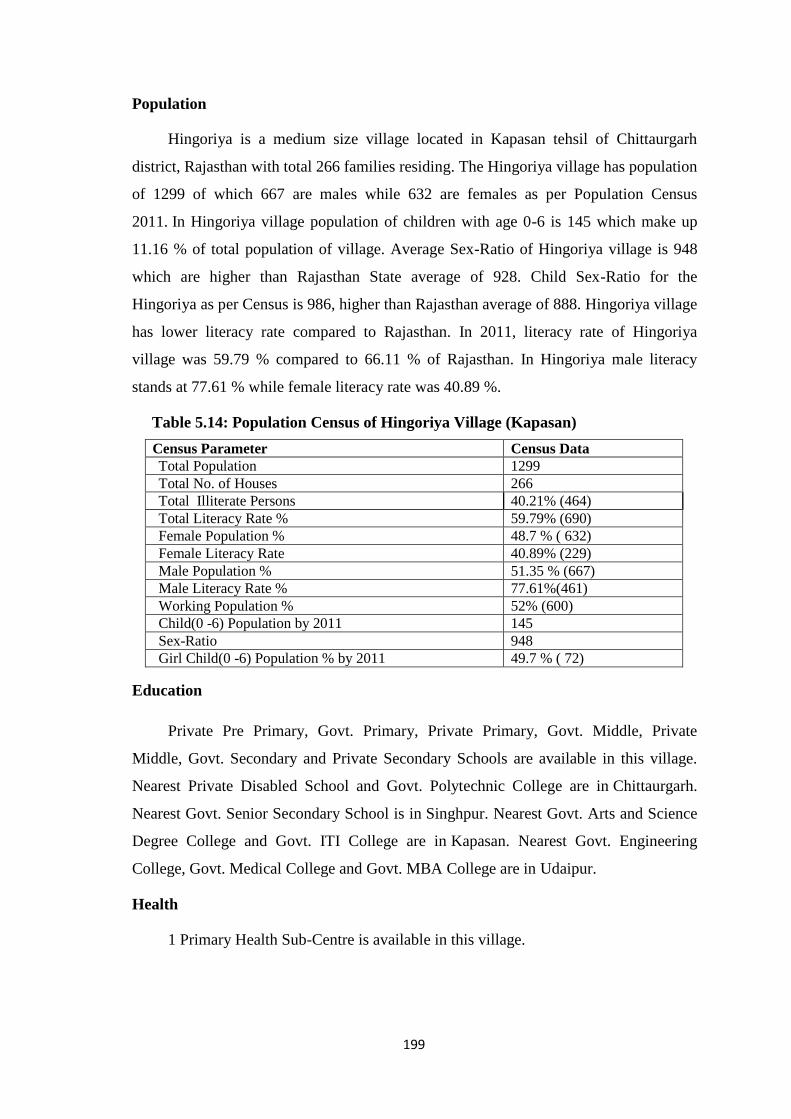
199
Population
Hingoriya is a medium size village located in Kapasan tehsil of Chittaurgarh
district, Rajasthan with total 266 families residing. The Hingoriya village has population
of 1299 of which 667 are males while 632 are females as per Population Census
2011. In Hingoriya village population of children with age 0-6 is 145 which make up
11.16 % of total population of village. Average Sex-Ratio of Hingoriya village is 948
which are higher than Rajasthan State average of 928. Child Sex-Ratio for the
Hingoriya as per Census is 986, higher than Rajasthan average of 888. Hingoriya village
has lower literacy rate compared to Rajasthan. In 2011, literacy rate of Hingoriya
village was 59.79 % compared to 66.11 % of Rajasthan. In Hingoriya male literacy
stands at 77.61 % while female literacy rate was 40.89 %.
Table 5.14: Population Census of Hingoriya Village (Kapasan)
Census Parameter Census Data Total Population 1299 Total No. of Houses 266 Total Illiterate Persons 40.21% (464) Total Literacy Rate % 59.79% (690) Female Population % 48.7 % ( 632) Female Literacy Rate 40.89% (229) Male Population % 51.35 % (667) Male Literacy Rate % 77.61%(461) Working Population % 52% (600) Child(0 -6) Population by 2011 145 Sex-Ratio 948 Girl Child(0 -6) Population % by 2011 49.7 % ( 72)
Education
Private Pre Primary, Govt. Primary, Private Primary, Govt. Middle, Private
Middle, Govt. Secondary and Private Secondary Schools are available in this village.
Nearest Private Disabled School and Govt. Polytechnic College are in Chittaurgarh.
Nearest Govt. Senior Secondary School is in Singhpur. Nearest Govt. Arts and Science
Degree College and Govt. ITI College are in Kapasan. Nearest Govt. Engineering
College, Govt. Medical College and Govt. MBA College are in Udaipur.
Health
1 Primary Health Sub-Centre is available in this village.
200
Agriculture
Maize, Wheat and Bajara is agriculture commodities grow in this village. 6 hours
agricultural power supply in summer and winter is available in this village. Total
irrigated area in this village is 162.48 hectares from boreholes/tube wells.
Drinking-Water and Sanitation
Hand pump and tube wells/boreholes are other drinking water sources. Closed and
open drainage system available in this village. There is no system to collect garbage on
street. And drain water is discharged directly into water bodies.
Communication
Sub post office, landline telephone, mobile coverage, and internet centre available
in this village. No private courier facility near by 10 km.
Transportation
There is no public bus service and railway station near by 10 km. but private bus
service, tractors and animal driven carts are available in this village. No nearest national
highway in 10 km, nearest State highway, district road is in 5-10 km. Pucca (metalled)
road, kuccha (non-metalled) road, macadam road and foot path are other roads and
transportation within the village.
Commerce
No ATM, no Commercial Bank and no Co-operative Bank in less than 10 km.
Agricultural credit society are available in this village.
Other Amenities
In this village there are 12 hours of power supply in summer and winter.
Anganwadi centre, ASHA, Birth & Death registration office, sports facilities, daily
news paper and polling station are the other amenities available in the village.
(15)
Chikarda Village (Dungla)
Location and Administration
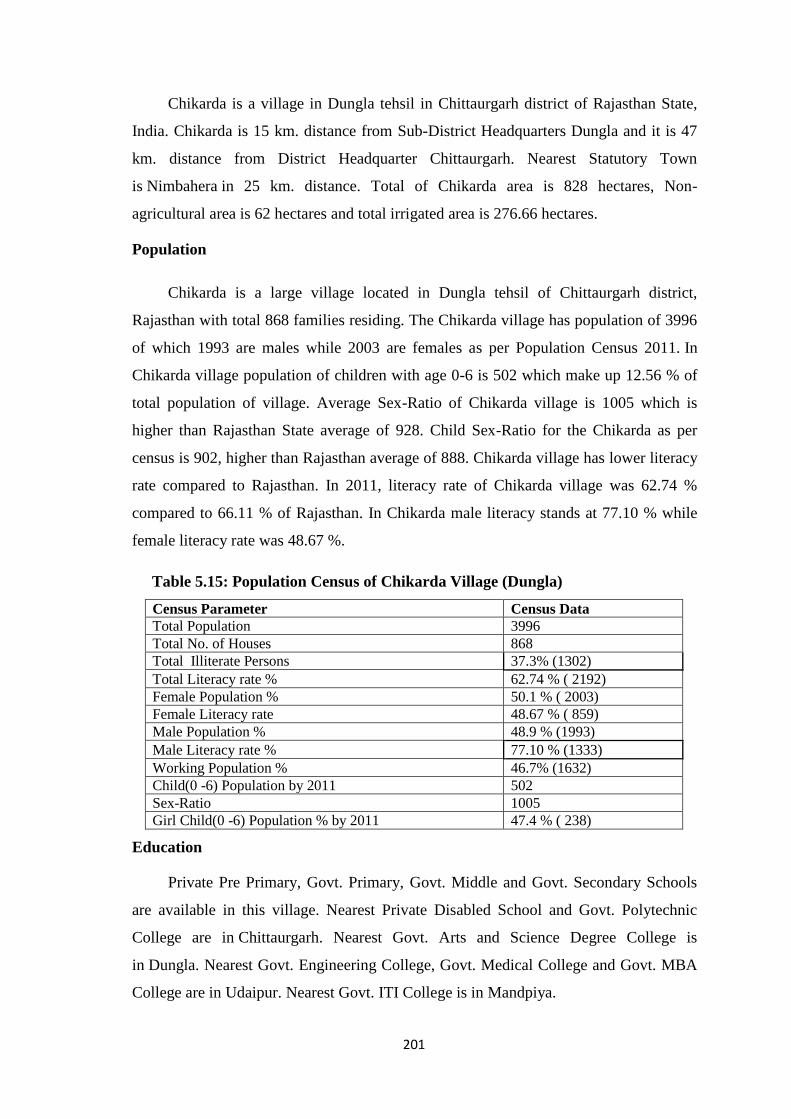
201
Chikarda is a village in Dungla tehsil in Chittaurgarh district of Rajasthan State,
India. Chikarda is 15 km. distance from Sub-District Headquarters Dungla and it is 47
km. distance from District Headquarter Chittaurgarh. Nearest Statutory Town
is Nimbahera in 25 km. distance. Total of Chikarda area is 828 hectares, Non-
agricultural area is 62 hectares and total irrigated area is 276.66 hectares.
Population
Chikarda is a large village located in Dungla tehsil of Chittaurgarh district,
Rajasthan with total 868 families residing. The Chikarda village has population of 3996
of which 1993 are males while 2003 are females as per Population Census 2011. In
Chikarda village population of children with age 0-6 is 502 which make up 12.56 % of
total population of village. Average Sex-Ratio of Chikarda village is 1005 which is
higher than Rajasthan State average of 928. Child Sex-Ratio for the Chikarda as per
census is 902, higher than Rajasthan average of 888. Chikarda village has lower literacy
rate compared to Rajasthan. In 2011, literacy rate of Chikarda village was 62.74 %
compared to 66.11 % of Rajasthan. In Chikarda male literacy stands at 77.10 % while
female literacy rate was 48.67 %.
Table 5.15: Population Census of Chikarda Village (Dungla)
Census Parameter Census Data Total Population 3996 Total No. of Houses 868 Total Illiterate Persons 37.3% (1302) Total Literacy rate % 62.74 % ( 2192) Female Population % 50.1 % ( 2003) Female Literacy rate 48.67 % ( 859) Male Population % 48.9 % (1993) Male Literacy rate % 77.10 % (1333) Working Population % 46.7% (1632) Child(0 -6) Population by 2011 502 Sex-Ratio 1005 Girl Child(0 -6) Population % by 2011 47.4 % ( 238)
Education
Private Pre Primary, Govt. Primary, Govt. Middle and Govt. Secondary Schools
are available in this village. Nearest Private Disabled School and Govt. Polytechnic
College are in Chittaurgarh. Nearest Govt. Arts and Science Degree College is
in Dungla. Nearest Govt. Engineering College, Govt. Medical College and Govt. MBA
College are in Udaipur. Nearest Govt. ITI College is in Mandpiya.
202
Health
1 Primary Health Care Centre, 1 Primary Health Sub-Centre,
1 Maternity and Child Welfare Centre, 1 Alternative Medicine Clinic,
1 MBBS Doctor Practice, 1 Medical Shop are available in this village.
Agriculture
Maize, Soybean and Mustard is agriculture commodities grow in this
village. Furniture making and Handicraft items are manufactured in this village. 8 hours
agricultural power supply in summer and 10 hours in winter is available in this village.
Total irrigated area in this village is 276.66 hectares from boreholes/tube wells.
Drinking-Water and Sanitation
Covered wells, uncovered wells, Hand pumps and tube wells/boreholes are other
drinking water sources. Closed and open drainage system available in this village. This
village covered under total sanitation. There is no system to collect garbage from street.
Drain water is discharged directly into water bodies.
Communication
Sub post office, landline telephone, mobile coverage and internet centre available
in this village. No private courier facility around 10 km.
Transportation
Public and private bus service is available in this village. There is no railway
station near by 10 km. autos and tractors available in this village. Animal driven carts
are there in this village. No nearest National Highway around 10 km. State Highway
and district road passes through this village. Pucca (metalled) road, kuccha (non-
metalled) road, macadam road and foot path are other roads and transportation within
the village.
Commerce
There are ATMs, Commercial Bank and Co-operative Bank, Agricultural credit
societies and Mandis/Regular markets available in this village.
Other Amenities
This village has a power supply with 16 hours for summer and 18 hours for
winter. Anganwadi centre, ASHA, Birth & Death registration office, sports facilities,
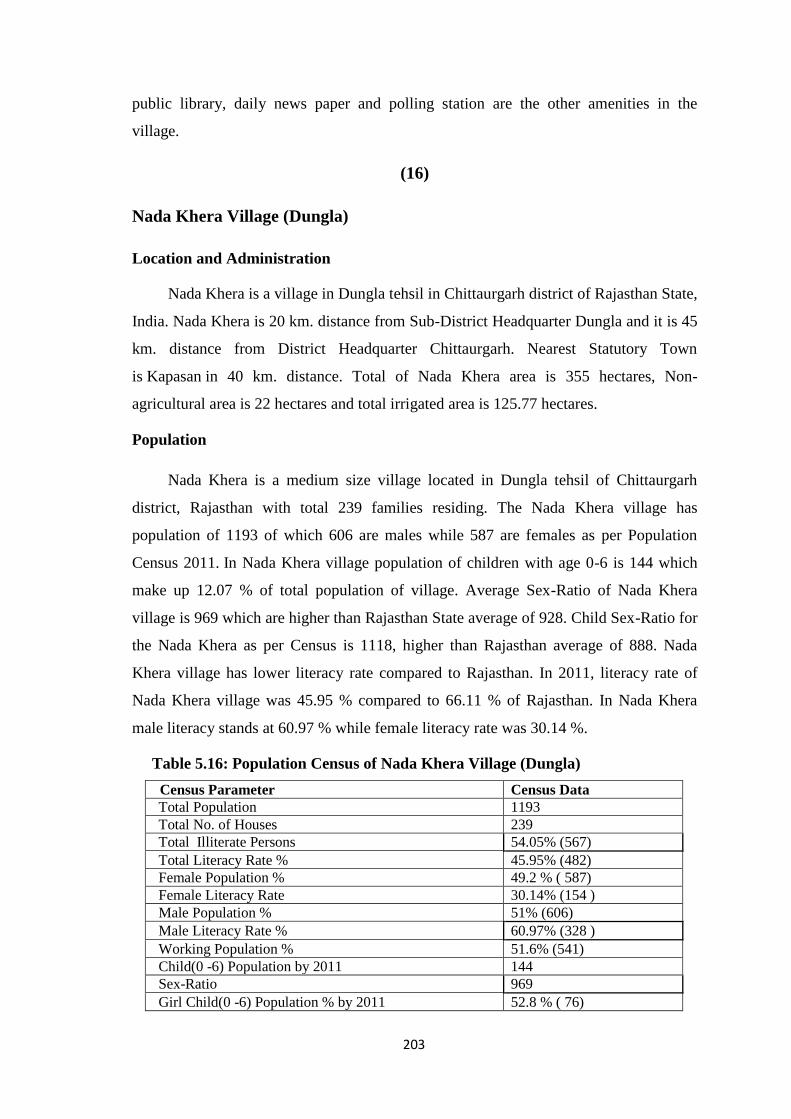
203
public library, daily news paper and polling station are the other amenities in the
village.
(16)
Nada Khera Village (Dungla)
Location and Administration
Nada Khera is a village in Dungla tehsil in Chittaurgarh district of Rajasthan State,
India. Nada Khera is 20 km. distance from Sub-District Headquarter Dungla and it is 45
km. distance from District Headquarter Chittaurgarh. Nearest Statutory Town
is Kapasan in 40 km. distance. Total of Nada Khera area is 355 hectares, Non-
agricultural area is 22 hectares and total irrigated area is 125.77 hectares.
Population
Nada Khera is a medium size village located in Dungla tehsil of Chittaurgarh
district, Rajasthan with total 239 families residing. The Nada Khera village has
population of 1193 of which 606 are males while 587 are females as per Population
Census 2011. In Nada Khera village population of children with age 0-6 is 144 which
make up 12.07 % of total population of village. Average Sex-Ratio of Nada Khera
village is 969 which are higher than Rajasthan State average of 928. Child Sex-Ratio for
the Nada Khera as per Census is 1118, higher than Rajasthan average of 888. Nada
Khera village has lower literacy rate compared to Rajasthan. In 2011, literacy rate of
Nada Khera village was 45.95 % compared to 66.11 % of Rajasthan. In Nada Khera
male literacy stands at 60.97 % while female literacy rate was 30.14 %.
Table 5.16: Population Census of Nada Khera Village (Dungla)
Census Parameter Census Data Total Population 1193 Total No. of Houses 239 Total Illiterate Persons 54.05% (567) Total Literacy Rate % 45.95% (482) Female Population % 49.2 % ( 587) Female Literacy Rate 30.14% (154 ) Male Population % 51% (606) Male Literacy Rate % 60.97% (328 ) Working Population % 51.6% (541) Child(0 -6) Population by 2011 144 Sex-Ratio 969 Girl Child(0 -6) Population % by 2011 52.8 % ( 76)
204
Education
Govt Primary and Govt. Middle Schools are available in this village. Nearest
Private Disabled School and Govt. Polytechnic College are in Chittaurgarh. Nearest
Private Pre Primary School is in Mangalwar. Nearest Govt. Secondary School and Govt.
Senior Secondary School are in Morwan. Nearest Govt. Arts and Science Degree
College is in Dungla. Nearest Private Engineering College, Govt. Medical College and
Private MBA College are in Udaipur. Nearest Govt. ITI College is in Sawaliyaji.
Health
1 Primary Health Sub-Centre is available in this village.
Agriculture
Maize, Mustard and Wheat is agriculture commodities grow in this village. 6
hours agricultural power supply in summer and winter is available in this village. Total
irrigated area in this village is 125.77 hectares from boreholes/tube wells.
Drinking-Water and Sanitation
Treated water supply is available throughout the year and in summer. Hand pumps
and tube wells/boreholes are other drinking water sources. Open drainage system
available in this village. There is no system to collect garbage from street and drain
water is discharged directly into water bodies.
Communication
Sub post office, landline telephone, mobile coverage and internet centre available
in this village. Nearest private courier facility is around 5-10 km.
Transportation
Nearest public bus service available in 5-10 km. There is no railway station near
by 10 km. Tractors available in this village. Animal driven carts are there in this village.
Nearest National Highway, State Highway and district road is in 5-10 km. Pucca
(metalled) road, kuccha (non-metalled) road, macadam road and foot path are other
roads and transportation within the village.
Commerce
Nearest ATM, Commercial Bank is available and no Co-operative Bank around 10
km.
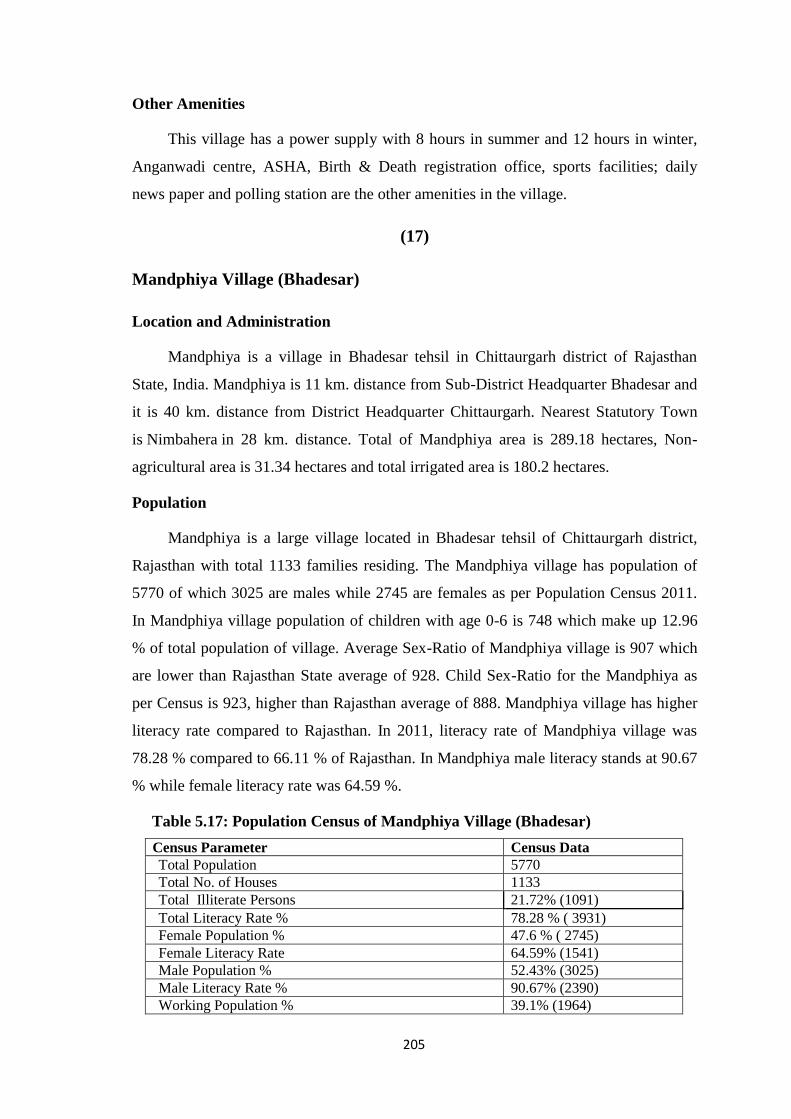
205
Other Amenities
This village has a power supply with 8 hours in summer and 12 hours in winter,
Anganwadi centre, ASHA, Birth & Death registration office, sports facilities; daily
news paper and polling station are the other amenities in the village.
(17)
Mandphiya Village (Bhadesar)
Location and Administration
Mandphiya is a village in Bhadesar tehsil in Chittaurgarh district of Rajasthan
State, India. Mandphiya is 11 km. distance from Sub-District Headquarter Bhadesar and
it is 40 km. distance from District Headquarter Chittaurgarh. Nearest Statutory Town
is Nimbahera in 28 km. distance. Total of Mandphiya area is 289.18 hectares, Non-
agricultural area is 31.34 hectares and total irrigated area is 180.2 hectares.
Population
Mandphiya is a large village located in Bhadesar tehsil of Chittaurgarh district,
Rajasthan with total 1133 families residing. The Mandphiya village has population of
5770 of which 3025 are males while 2745 are females as per Population Census 2011.
In Mandphiya village population of children with age 0-6 is 748 which make up 12.96
% of total population of village. Average Sex-Ratio of Mandphiya village is 907 which
are lower than Rajasthan State average of 928. Child Sex-Ratio for the Mandphiya as
per Census is 923, higher than Rajasthan average of 888. Mandphiya village has higher
literacy rate compared to Rajasthan. In 2011, literacy rate of Mandphiya village was
78.28 % compared to 66.11 % of Rajasthan. In Mandphiya male literacy stands at 90.67
% while female literacy rate was 64.59 %.
Table 5.17: Population Census of Mandphiya Village (Bhadesar)
Census Parameter Census Data Total Population 5770 Total No. of Houses 1133 Total Illiterate Persons 21.72% (1091) Total Literacy Rate % 78.28 % ( 3931) Female Population % 47.6 % ( 2745) Female Literacy Rate 64.59% (1541) Male Population % 52.43% (3025) Male Literacy Rate % 90.67% (2390) Working Population % 39.1% (1964)
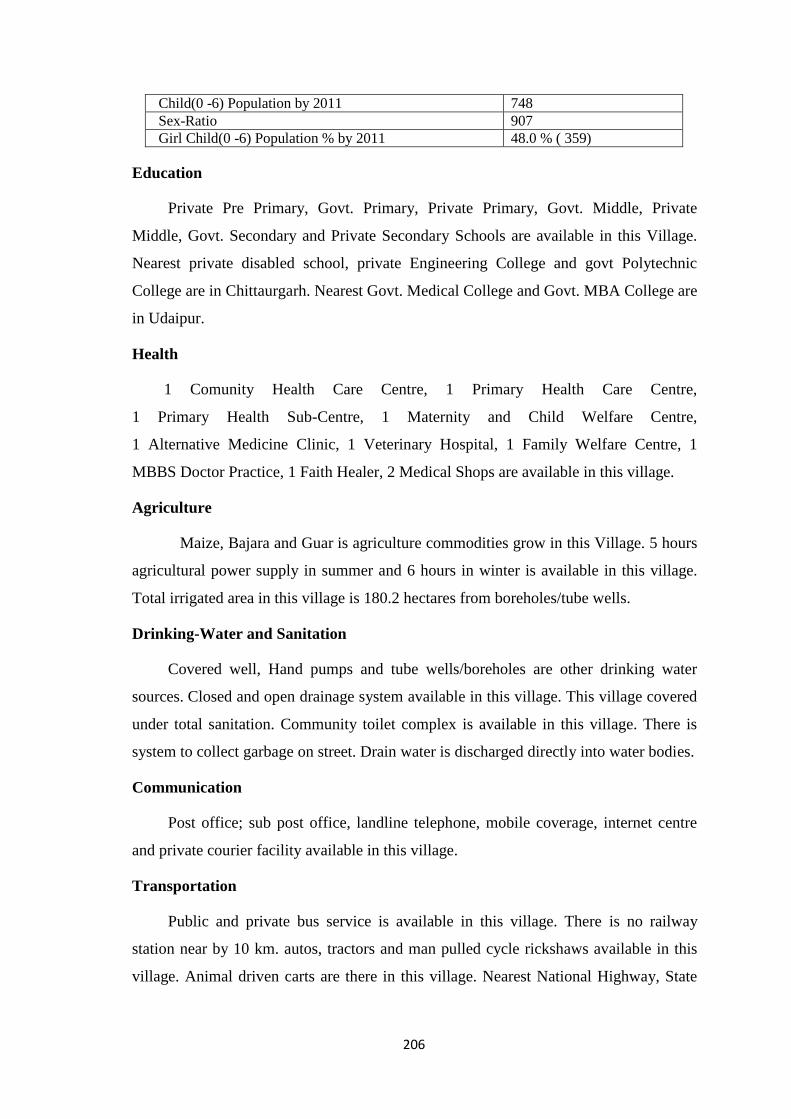
206
Child(0 -6) Population by 2011 748 Sex-Ratio 907 Girl Child(0 -6) Population % by 2011 48.0 % ( 359)
Education
Private Pre Primary, Govt. Primary, Private Primary, Govt. Middle, Private
Middle, Govt. Secondary and Private Secondary Schools are available in this Village.
Nearest private disabled school, private Engineering College and govt Polytechnic
College are in Chittaurgarh. Nearest Govt. Medical College and Govt. MBA College are
in Udaipur.
Health
1 Comunity Health Care Centre, 1 Primary Health Care Centre,
1 Primary Health Sub-Centre, 1 Maternity and Child Welfare Centre,
1 Alternative Medicine Clinic, 1 Veterinary Hospital, 1 Family Welfare Centre, 1
MBBS Doctor Practice, 1 Faith Healer, 2 Medical Shops are available in this village.
Agriculture
Maize, Bajara and Guar is agriculture commodities grow in this Village. 5 hours
agricultural power supply in summer and 6 hours in winter is available in this village.
Total irrigated area in this village is 180.2 hectares from boreholes/tube wells.
Drinking-Water and Sanitation
Covered well, Hand pumps and tube wells/boreholes are other drinking water
sources. Closed and open drainage system available in this village. This village covered
under total sanitation. Community toilet complex is available in this village. There is
system to collect garbage on street. Drain water is discharged directly into water bodies.
Communication
Post office; sub post office, landline telephone, mobile coverage, internet centre
and private courier facility available in this village.
Transportation
Public and private bus service is available in this village. There is no railway
station near by 10 km. autos, tractors and man pulled cycle rickshaws available in this
village. Animal driven carts are there in this village. Nearest National Highway, State
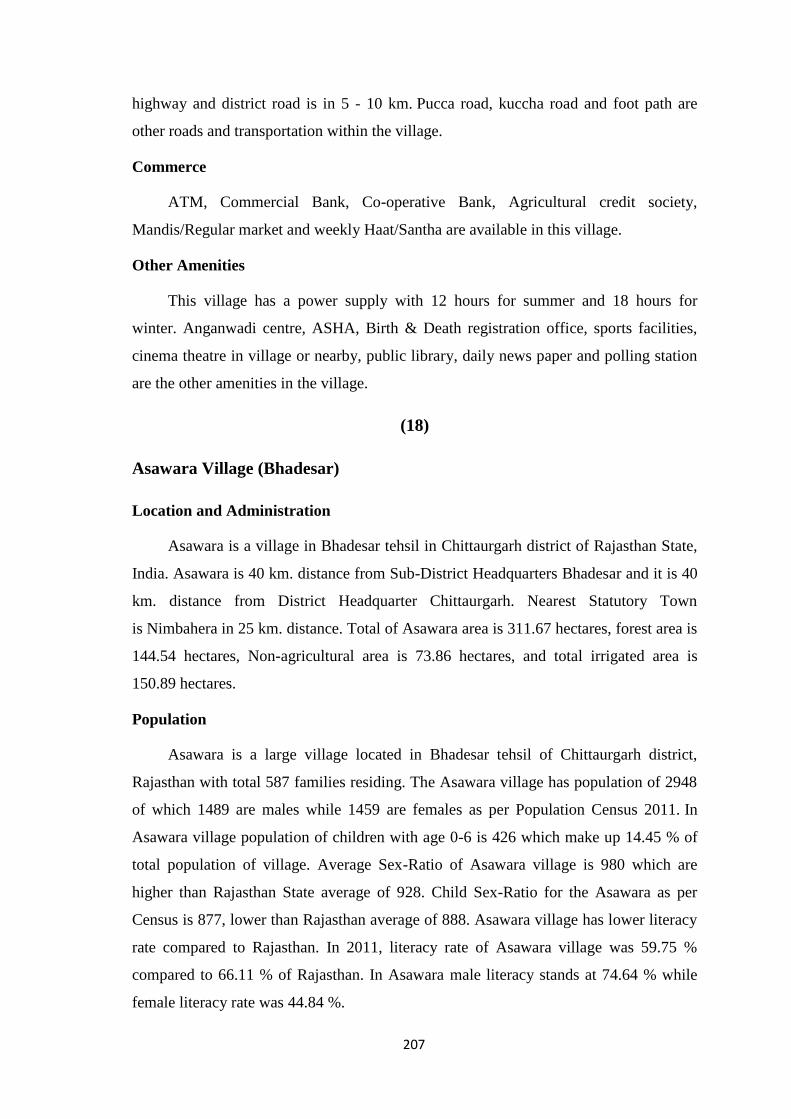
207
highway and district road is in 5 - 10 km. Pucca road, kuccha road and foot path are
other roads and transportation within the village.
Commerce
ATM, Commercial Bank, Co-operative Bank, Agricultural credit society,
Mandis/Regular market and weekly Haat/Santha are available in this village.
Other Amenities
This village has a power supply with 12 hours for summer and 18 hours for
winter. Anganwadi centre, ASHA, Birth & Death registration office, sports facilities,
cinema theatre in village or nearby, public library, daily news paper and polling station
are the other amenities in the village.
(18)
Asawara Village (Bhadesar)
Location and Administration
Asawara is a village in Bhadesar tehsil in Chittaurgarh district of Rajasthan State,
India. Asawara is 40 km. distance from Sub-District Headquarters Bhadesar and it is 40
km. distance from District Headquarter Chittaurgarh. Nearest Statutory Town
is Nimbahera in 25 km. distance. Total of Asawara area is 311.67 hectares, forest area is
144.54 hectares, Non-agricultural area is 73.86 hectares, and total irrigated area is
150.89 hectares.
Population
Asawara is a large village located in Bhadesar tehsil of Chittaurgarh district,
Rajasthan with total 587 families residing. The Asawara village has population of 2948
of which 1489 are males while 1459 are females as per Population Census 2011. In
Asawara village population of children with age 0-6 is 426 which make up 14.45 % of
total population of village. Average Sex-Ratio of Asawara village is 980 which are
higher than Rajasthan State average of 928. Child Sex-Ratio for the Asawara as per
Census is 877, lower than Rajasthan average of 888. Asawara village has lower literacy
rate compared to Rajasthan. In 2011, literacy rate of Asawara village was 59.75 %
compared to 66.11 % of Rajasthan. In Asawara male literacy stands at 74.64 % while
female literacy rate was 44.84 %.
208
Table 5.18: Population Census of Asawara Village (Bhadesar)
Census Parameter Census Data Total Population 2948 Total No. of Houses 587 Total Illiterate Persons 40.24% (1015) Total Literacy Rate % 59.75 % ( 1507) Female Population % 49.5 % ( 1459) Female Literacy Rate 44.84 % ( 565) Male Population % 50.51% (1489) Male Literacy Rate % 74.64% (942) Working Population % 51.1% (1289) Child(0 -6) Population by 2011 426 Sex-Ratio 877 Girl Child(0 -6) Population % by 2011 46.7 % ( 199)
Education
Private Pre Primary, Govt. Primary, Private Primary, Govt. Middle, Private
Middle and Govt. Secondary Schools are available in this village. Nearest Private
Disabled School, Govt. Polytechnic College and Govt. ITI College are in Chittaurgarh.
Nearest Govt. Senior Secondary School and Private Arts and Science Degree College
are in Bhadesar. Nearest Govt. Engineering College, Govt. Medical College and Govt.
MBA College are in Udaipur.
Health
1 Primary Health Sub-Centre, 1 Maternity and Child Welfare Centre, 1 Veterinary
Hospital, 1 Faith Healer, 1 Medical Shop is available in this village.
Agriculture
Maize, Bajara and Guar is agriculture commodities grow in this village. 6 hours
agricultural power supply in summer and winter is available in this village. Total
irrigated area in this village is 150.89 hectares from boreholes/tube wells.
Drinking-Water and Sanitation
Covered-uncovered well, Hand pumps and tube wells/boreholes are other drinking
water sources. Closed and open drainage system and Community toilet complex
available in this village. No system to collect garbage from street and drain water is
discharged directly into water bodies.
209
Communication
Sub post office, landline telephone, mobile coverage and internet centre available
in this village. No private courier facility near by 10 km.
Transportation
Public and private bus service, tractors and auto are available in this village. There
is no railway station around 10 km. Animal driven carts are there in this village. No
nearest National Highway near by 10 km. No nearest State Highway in less than 10 km,
district road passes through this Village. Pucca (metalled) road, kuccha (non-metalled)
road, macadam road and foot path are other roads and transportation within the village.
Commerce
There are ATMs, Commercial Bank and Co-operative Bank, Agricultural credit
societies and Mandis/Regular markets available in this Village.
Other Amenities
This village has a power supply with 6 hours power supply for summer and
winter. Anganwadi centre, ASHA, Birth & Death registration office, sports facilities,
public library, daily news paper and polling station are the other amenities in the
village.
(19)
Binota Village (Nimbahera)
Location and Administration
Binota is a village in Nimbahera tehsil in Chittaurgarh district of Rajasthan State,
India. Binota is 20 km. distance from sub-district Headquarters Nimbahera and it is 50
km. distance from District Headquarter Chittaurgarh. Nearest Statutory Town
is Nimbahera in 20 km distance. Total of Binota area is 869 hectares, Non-agricultural
area is 92 hectares, and total irrigated area is 403.35 hectares.
Population
Binota is a large village located in Nimbahera tehsil of Chittaurgarh district,
Rajasthan with total 1234 families residing. The Binota village has population of 5868
of which 3016 are males while 2852 are females as per Population Census 2011. In
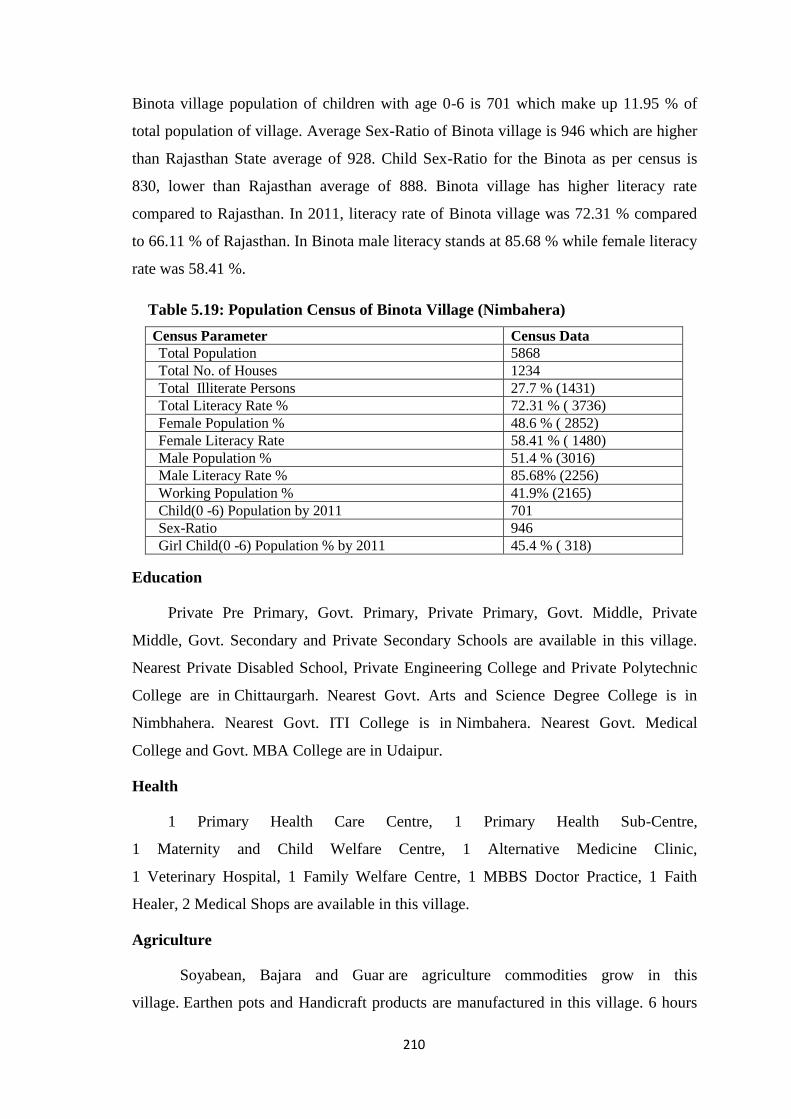
210
Binota village population of children with age 0-6 is 701 which make up 11.95 % of
total population of village. Average Sex-Ratio of Binota village is 946 which are higher
than Rajasthan State average of 928. Child Sex-Ratio for the Binota as per census is
830, lower than Rajasthan average of 888. Binota village has higher literacy rate
compared to Rajasthan. In 2011, literacy rate of Binota village was 72.31 % compared
to 66.11 % of Rajasthan. In Binota male literacy stands at 85.68 % while female literacy
rate was 58.41 %.
Table 5.19: Population Census of Binota Village (Nimbahera)
Census Parameter Census Data Total Population 5868 Total No. of Houses 1234 Total Illiterate Persons 27.7 % (1431) Total Literacy Rate % 72.31 % ( 3736) Female Population % 48.6 % ( 2852) Female Literacy Rate 58.41 % ( 1480) Male Population % 51.4 % (3016) Male Literacy Rate % 85.68% (2256) Working Population % 41.9% (2165) Child(0 -6) Population by 2011 701 Sex-Ratio 946 Girl Child(0 -6) Population % by 2011 45.4 % ( 318)
Education
Private Pre Primary, Govt. Primary, Private Primary, Govt. Middle, Private
Middle, Govt. Secondary and Private Secondary Schools are available in this village.
Nearest Private Disabled School, Private Engineering College and Private Polytechnic
College are in Chittaurgarh. Nearest Govt. Arts and Science Degree College is in
Nimbhahera. Nearest Govt. ITI College is in Nimbahera. Nearest Govt. Medical
College and Govt. MBA College are in Udaipur.
Health
1 Primary Health Care Centre, 1 Primary Health Sub-Centre,
1 Maternity and Child Welfare Centre, 1 Alternative Medicine Clinic,
1 Veterinary Hospital, 1 Family Welfare Centre, 1 MBBS Doctor Practice, 1 Faith
Healer, 2 Medical Shops are available in this village.
Agriculture
Soyabean, Bajara and Guar are agriculture commodities grow in this
village. Earthen pots and Handicraft products are manufactured in this village. 6 hours
211
agricultural power supply in summer and 8 hours in winter is available in this village.
Total irrigated area in this village is 403.35 hectares from canals.
Drinking-Water and Sanitation
Hand pumps and tube wells/boreholes are other drinking water sources. Closed
and open drainage system and community toilet complex available in this village. This
village covered under total sanitation. There is system to collect garbage from street and
drain water is discharged directly into water bodies.
Communication
Post office, sub post office, landline telephone, mobile coverage, internet centre
and private courier facility available in this village.
Transportation
Public and private bus service is available in this village. There is no railway
station near by 10 km. Autos, tractors and man pulled cycle rickshaws available in this
village. Animal driven carts are there in this village. No nearest National Highway
around 10 km, nearest State Highway is in 5 - 10 km and district road passes through
this village. Pucca (metalled) road, kuccha (non-metalled) road and foot path are other
roads and transportation within the village.
Commerce
ATM, Commercial Bank, Co-operative Bank, Agricultural credit society,
Mandis/Regular market and weekly Haat/Santha are available in this village.
Other Amenities
This village has a power supply with 8 hours for summer and 12 hours for winter.
Anganwadi centre, ASHA, Birth & Death registration office, sports facilities, cinema
theatre in village or nearby, public library, daily news paper and polling station are the
other amenities in the village.
(20)
Lasrawan Village (Nimbahera)
Location and Administration
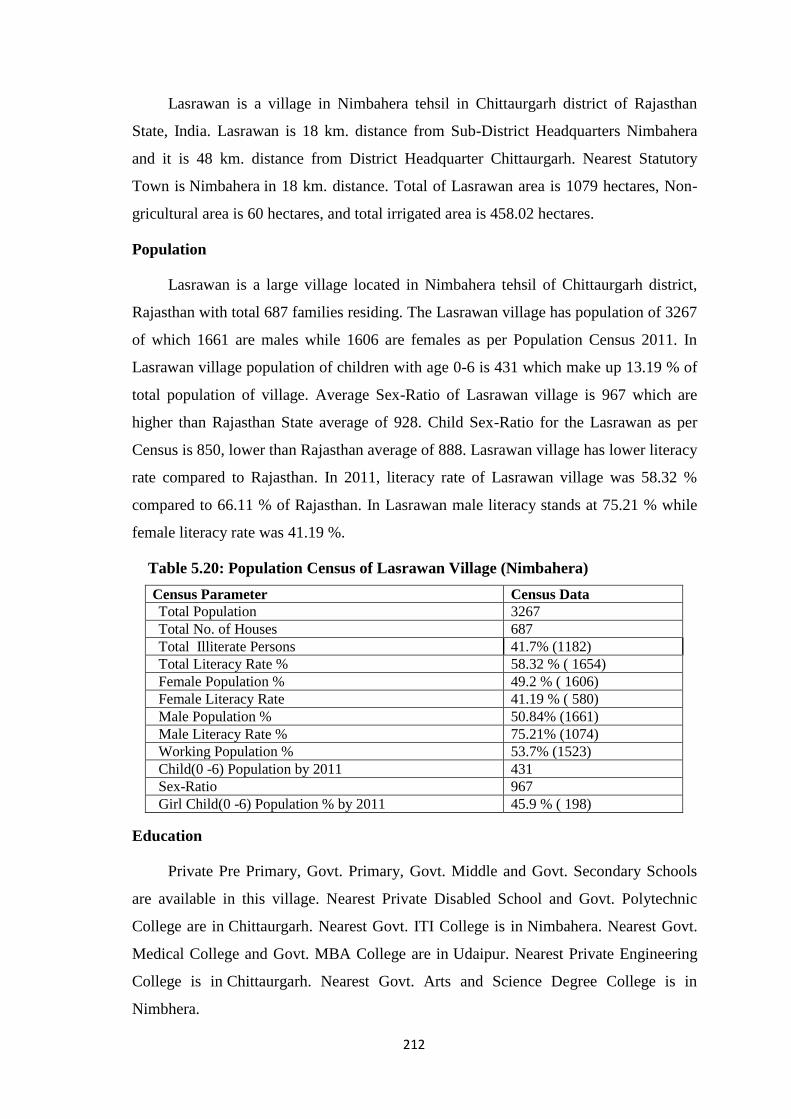
212
Lasrawan is a village in Nimbahera tehsil in Chittaurgarh district of Rajasthan
State, India. Lasrawan is 18 km. distance from Sub-District Headquarters Nimbahera
and it is 48 km. distance from District Headquarter Chittaurgarh. Nearest Statutory
Town is Nimbahera in 18 km. distance. Total of Lasrawan area is 1079 hectares, Non-
gricultural area is 60 hectares, and total irrigated area is 458.02 hectares.
Population
Lasrawan is a large village located in Nimbahera tehsil of Chittaurgarh district,
Rajasthan with total 687 families residing. The Lasrawan village has population of 3267
of which 1661 are males while 1606 are females as per Population Census 2011. In
Lasrawan village population of children with age 0-6 is 431 which make up 13.19 % of
total population of village. Average Sex-Ratio of Lasrawan village is 967 which are
higher than Rajasthan State average of 928. Child Sex-Ratio for the Lasrawan as per
Census is 850, lower than Rajasthan average of 888. Lasrawan village has lower literacy
rate compared to Rajasthan. In 2011, literacy rate of Lasrawan village was 58.32 %
compared to 66.11 % of Rajasthan. In Lasrawan male literacy stands at 75.21 % while
female literacy rate was 41.19 %.
Table 5.20: Population Census of Lasrawan Village (Nimbahera)
Census Parameter Census Data Total Population 3267 Total No. of Houses 687 Total Illiterate Persons 41.7% (1182) Total Literacy Rate % 58.32 % ( 1654) Female Population % 49.2 % ( 1606) Female Literacy Rate 41.19 % ( 580) Male Population % 50.84% (1661) Male Literacy Rate % 75.21% (1074) Working Population % 53.7% (1523) Child(0 -6) Population by 2011 431 Sex-Ratio 967 Girl Child(0 -6) Population % by 2011 45.9 % ( 198)
Education
Private Pre Primary, Govt. Primary, Govt. Middle and Govt. Secondary Schools
are available in this village. Nearest Private Disabled School and Govt. Polytechnic
College are in Chittaurgarh. Nearest Govt. ITI College is in Nimbahera. Nearest Govt.
Medical College and Govt. MBA College are in Udaipur. Nearest Private Engineering
College is in Chittaurgarh. Nearest Govt. Arts and Science Degree College is in
Nimbhera.
213
Health
1 Primary Health Care Centre , 1 Primary Health Sub-Centre , 1 Maternity and
Child Welfare Centre , 1 Alternative Medicine Clinic , 1 Veterinary Hospital , 1 MBBS
Doctor Practice , 2 Medical Shops are available in this village.
Agriculture
Soybean, Maize and Wheat is agriculture commodities grow in this
village. Furniture making and Handicraft products are manufactured in this village. 6
hours agricultural power supply in summer and winter is available in this village. Total
irrigated area in this village is 458.02 hectares from boreholes/tube wells.
Drinking-Water and Sanitation
Covered wells, Hand pumps and tube wells/boreholes are other drinking water
sources. Closed and open drainage system available in this village. No system to collect
garbage on street. Drain water is discharged directly into water bodies.
Communication
Sub post office, landline telepone, mobile and internet centre available in this
village. No private courier facility around 10 km.
Transportation
Public and private bus service is available in this village. There is no railway
station around 10 km. autos, tractors and animal driven carts are there in this village. No
nearest National Highway near by 10 km, nearest State Highway and district road is in 5
- 10 km. Pucca road, kuccha road, macadam road and foot path are other roads and
transportation within the village.
Commerce
ATM, Commercial Bank, Co-operative Bank, Agricultural credit society and
Mandis/Regular market is available in this village.
Other Amenities
This village has a power supply with 12 hours in summer and 18 hours in winter.
Anganwadi centre, ASHA, Birth & Death registration office, sports facilities; daily
news paper and polling station are the other amenities in the village.
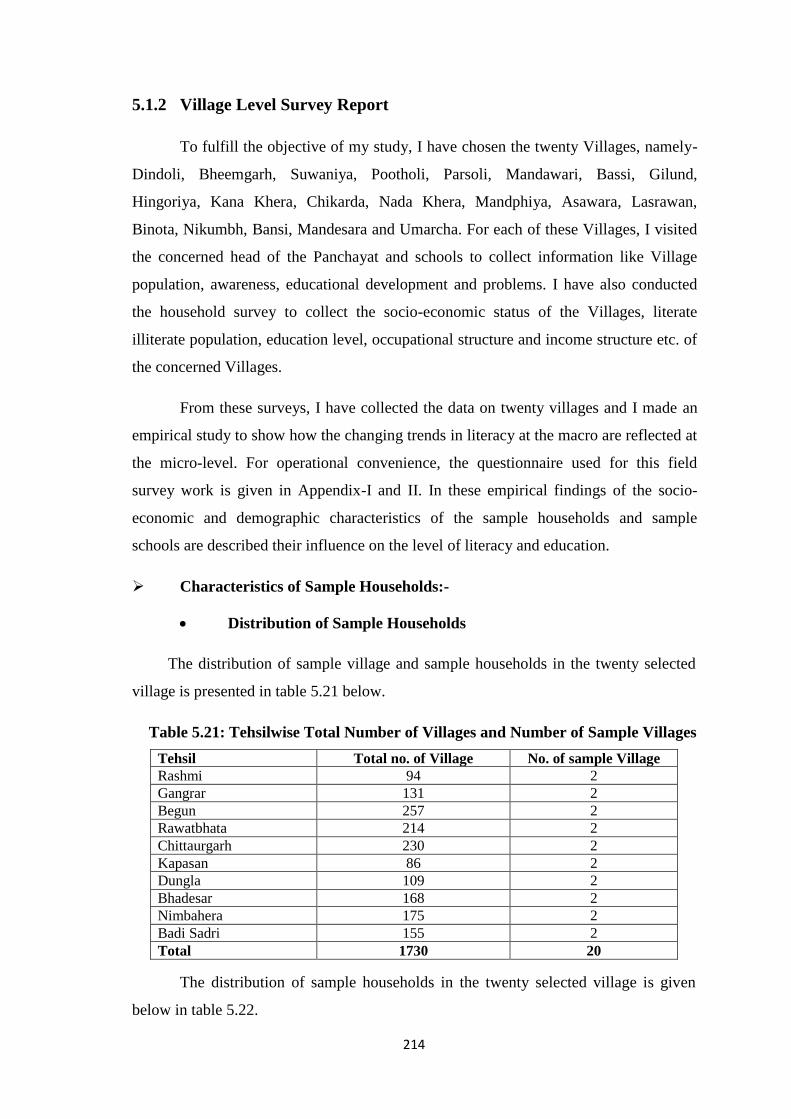
214
5.1.2 Village Level Survey Report
To fulfill the objective of my study, I have chosen the twenty Villages, namely-
Dindoli, Bheemgarh, Suwaniya, Pootholi, Parsoli, Mandawari, Bassi, Gilund,
Hingoriya, Kana Khera, Chikarda, Nada Khera, Mandphiya, Asawara, Lasrawan,
Binota, Nikumbh, Bansi, Mandesara and Umarcha. For each of these Villages, I visited
the concerned head of the Panchayat and schools to collect information like Village
population, awareness, educational development and problems. I have also conducted
the household survey to collect the socio-economic status of the Villages, literate
illiterate population, education level, occupational structure and income structure etc. of
the concerned Villages.
From these surveys, I have collected the data on twenty villages and I made an
empirical study to show how the changing trends in literacy at the macro are reflected at
the micro-level. For operational convenience, the questionnaire used for this field
survey work is given in Appendix-I and II. In these empirical findings of the socio-
economic and demographic characteristics of the sample households and sample
schools are described their influence on the level of literacy and education.
Characteristics of Sample Households:-
Distribution of Sample Households
The distribution of sample village and sample households in the twenty selected
village is presented in table 5.21 below.
Table 5.21: Tehsilwise Total Number of Villages and Number of Sample Villages
Tehsil Total no. of Village No. of sample Village Rashmi 94 2 Gangrar 131 2 Begun 257 2 Rawatbhata 214 2 Chittaurgarh 230 2 Kapasan 86 2 Dungla 109 2 Bhadesar 168 2 Nimbahera 175 2 Badi Sadri 155 2 Total 1730 20
The distribution of sample households in the twenty selected village is given
below in table 5.22.
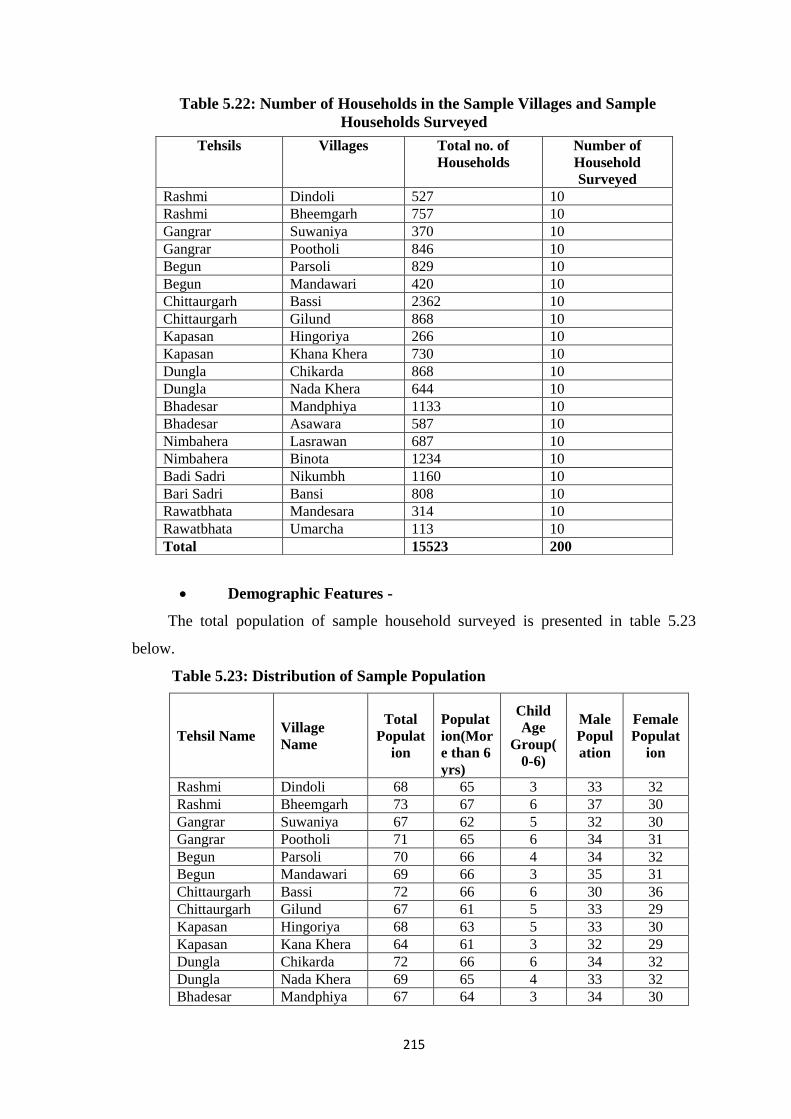
215
Table 5.22: Number of Households in the Sample Villages and Sample Households Surveyed
Demographic Features -
The total population of sample household surveyed is presented in table 5.23
below.
Table 5.23: Distribution of Sample Population
Tehsil Name Village Name
Total Populat
ion
Population(More than 6 yrs)
Child Age
Group(0-6)
Male Population
Female Populat
ion
Rashmi Dindoli 68 65 3 33 32 Rashmi Bheemgarh 73 67 6 37 30 Gangrar Suwaniya 67 62 5 32 30 Gangrar Pootholi 71 65 6 34 31 Begun Parsoli 70 66 4 34 32 Begun Mandawari 69 66 3 35 31 Chittaurgarh Bassi 72 66 6 30 36 Chittaurgarh Gilund 67 61 5 33 29 Kapasan Hingoriya 68 63 5 33 30 Kapasan Kana Khera 64 61 3 32 29 Dungla Chikarda 72 66 6 34 32 Dungla Nada Khera 69 65 4 33 32 Bhadesar Mandphiya 67 64 3 34 30
Tehsils Villages Total no. of Households
Number of Household Surveyed
Rashmi Dindoli 527 10 Rashmi Bheemgarh 757 10 Gangrar Suwaniya 370 10 Gangrar Pootholi 846 10 Begun Parsoli 829 10 Begun Mandawari 420 10 Chittaurgarh Bassi 2362 10 Chittaurgarh Gilund 868 10 Kapasan Hingoriya 266 10 Kapasan Khana Khera 730 10 Dungla Chikarda 868 10 Dungla Nada Khera 644 10 Bhadesar Mandphiya 1133 10 Bhadesar Asawara 587 10 Nimbahera Lasrawan 687 10 Nimbahera Binota 1234 10 Badi Sadri Nikumbh 1160 10 Bari Sadri Bansi 808 10 Rawatbhata Mandesara 314 10 Rawatbhata Umarcha 113 10 Total 15523 200
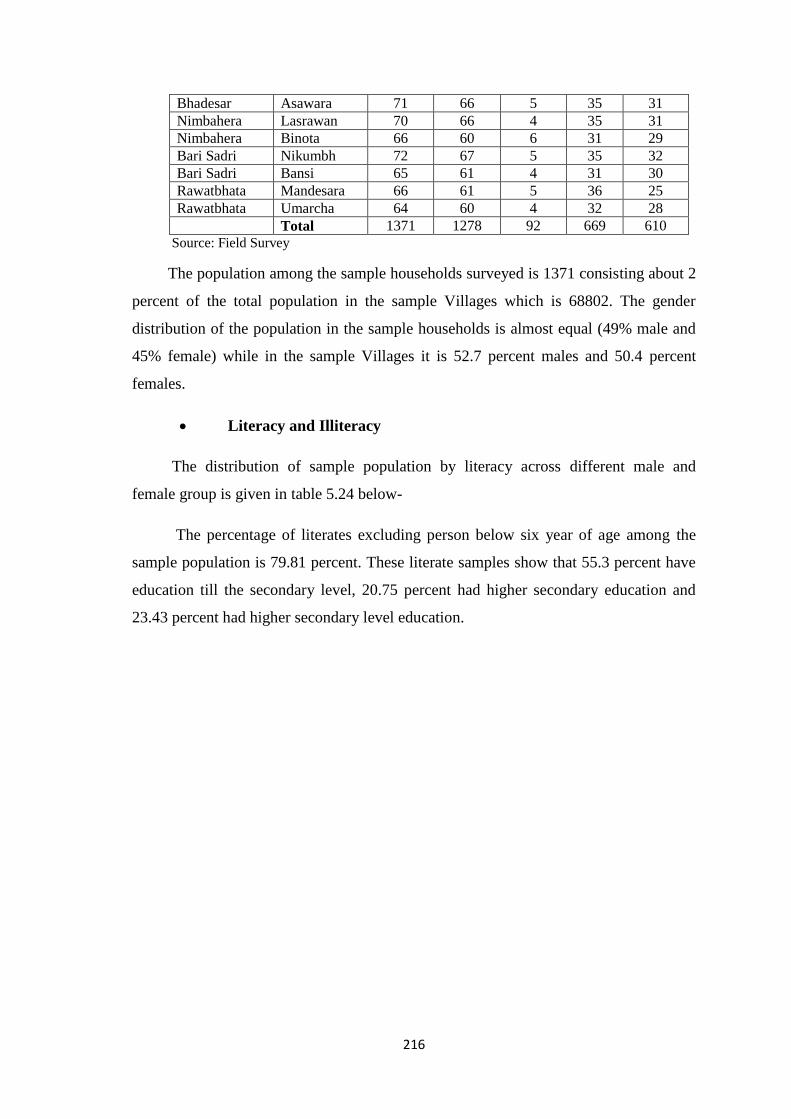
216
Bhadesar Asawara 71 66 5 35 31 Nimbahera Lasrawan 70 66 4 35 31 Nimbahera Binota 66 60 6 31 29 Bari Sadri Nikumbh 72 67 5 35 32 Bari Sadri Bansi 65 61 4 31 30 Rawatbhata Mandesara 66 61 5 36 25 Rawatbhata Umarcha 64 60 4 32 28
Total 1371 1278 92 669 610
Source: Field Survey
The population among the sample households surveyed is 1371 consisting about 2
percent of the total population in the sample Villages which is 68802. The gender
distribution of the population in the sample households is almost equal (49% male and
45% female) while in the sample Villages it is 52.7 percent males and 50.4 percent
females.
Literacy and Illiteracy
The distribution of sample population by literacy across different male and
female group is given in table 5.24 below-
The percentage of literates excluding person below six year of age among the
sample population is 79.81 percent. These literate samples show that 55.3 percent have
education till the secondary level, 20.75 percent had higher secondary education and
23.43 percent had higher secondary level education.

217
Table 5.24: Distribution of Sample Population by Literacy Levels in Male and Female
Tehsil Name Village Name
Total Population
Population(more than 6 yrs)
Child Age
Group (0-6)
Literate Populatio
n
% of Literate Persons
Male Population
Male Litera
te
% of Male
Literate
Female Populat
ion
Female Literate
% of Female Literate
Rashmi Dindoli 68 65 3 53 81.54 33 31 93.94 32 22 68.75 Rashmi Bheemgarh 73 67 6 45 67.16 37 25 67.57 30 20 66.67 Gangrar Suwaniya 67 62 5 49 79.03 32 28 87.50 30 21 70.00 Gangrar Pootholi 71 65 6 52 80.00 34 25 73.53 31 27 87.10 Begun Parsoli 70 66 4 61 92.42 34 30 88.24 32 31 96.88 Begun Mandawari 69 66 3 51 77.27 35 30 85.71 31 21 67.74 Chittaurgarh Bassi 72 66 6 58 87.88 30 25 83.33 36 33 91.67 Chittaurgarh Gilund 67 61 5 48 78.69 33 26 78.79 29 22 75.86 Kapasan Hingoriya 68 63 5 48 76.19 33 26 78.79 30 22 73.33 Kapasan Kana Khera 64 61 3 46 75.41 32 25 78.13 29 21 72.41 Dungla Chikarda 72 66 6 60 90.91 34 34 100.00 32 26 81.25 Dungla Nada Khera 69 65 4 47 72.31 33 27 81.82 32 20 62.50 Bhadesar Mandphiya 67 64 3 61 95.31 34 33 97.06 30 28 93.33 Bhadesar Asawara 71 66 5 58 87.88 35 31 88.57 31 27 87.10 Nimbahera Lasrawan 70 66 4 52 78.79 35 30 85.71 31 22 70.97 Nimbahera Binota 66 60 6 50 83.33 31 28 90.32 29 22 75.86 Bari Sadri Nikumbh 72 67 5 50 74.63 35 29 82.86 32 21 65.63 Bari Sadri Bansi 65 61 4 52 85.25 31 27 87.10 30 25 83.33 Rawatbhata Mandesara 66 61 5 40 65.57 36 22 61.11 25 18 72.00 Rawatbhata Umarcha 64 60 4 39 65.00 32 24 75.00 28 15 53.57
1371 1278 92 1020 79.81 669 556 83.11 610 464 76.07
Source: Field Survey
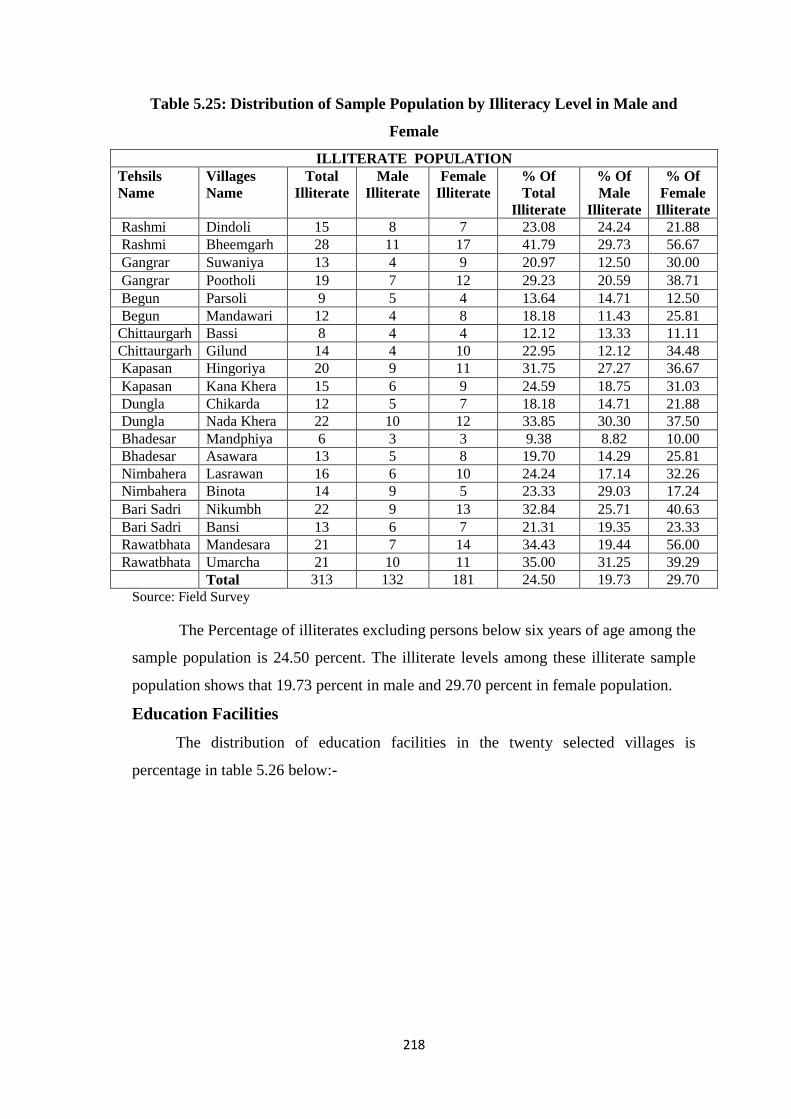
218
Table 5.25: Distribution of Sample Population by Illiteracy Level in Male and
Female
ILLITERATE POPULATION Tehsils Name
Villages Name
Total Illiterate
Male Illiterate
Female Illiterate
% Of Total
Illiterate
% Of Male
Illiterate
% Of Female
Illiterate Rashmi Dindoli 15 8 7 23.08 24.24 21.88 Rashmi Bheemgarh 28 11 17 41.79 29.73 56.67 Gangrar Suwaniya 13 4 9 20.97 12.50 30.00 Gangrar Pootholi 19 7 12 29.23 20.59 38.71 Begun Parsoli 9 5 4 13.64 14.71 12.50 Begun Mandawari 12 4 8 18.18 11.43 25.81 Chittaurgarh Bassi 8 4 4 12.12 13.33 11.11 Chittaurgarh Gilund 14 4 10 22.95 12.12 34.48 Kapasan Hingoriya 20 9 11 31.75 27.27 36.67 Kapasan Kana Khera 15 6 9 24.59 18.75 31.03 Dungla Chikarda 12 5 7 18.18 14.71 21.88 Dungla Nada Khera 22 10 12 33.85 30.30 37.50 Bhadesar Mandphiya 6 3 3 9.38 8.82 10.00 Bhadesar Asawara 13 5 8 19.70 14.29 25.81 Nimbahera Lasrawan 16 6 10 24.24 17.14 32.26 Nimbahera Binota 14 9 5 23.33 29.03 17.24 Bari Sadri Nikumbh 22 9 13 32.84 25.71 40.63 Bari Sadri Bansi 13 6 7 21.31 19.35 23.33 Rawatbhata Mandesara 21 7 14 34.43 19.44 56.00 Rawatbhata Umarcha 21 10 11 35.00 31.25 39.29 Total 313 132 181 24.50 19.73 29.70
Source: Field Survey The Percentage of illiterates excluding persons below six years of age among the
sample population is 24.50 percent. The illiterate levels among these illiterate sample
population shows that 19.73 percent in male and 29.70 percent in female population.
Education Facilities
The distribution of education facilities in the twenty selected villages is
percentage in table 5.26 below:-
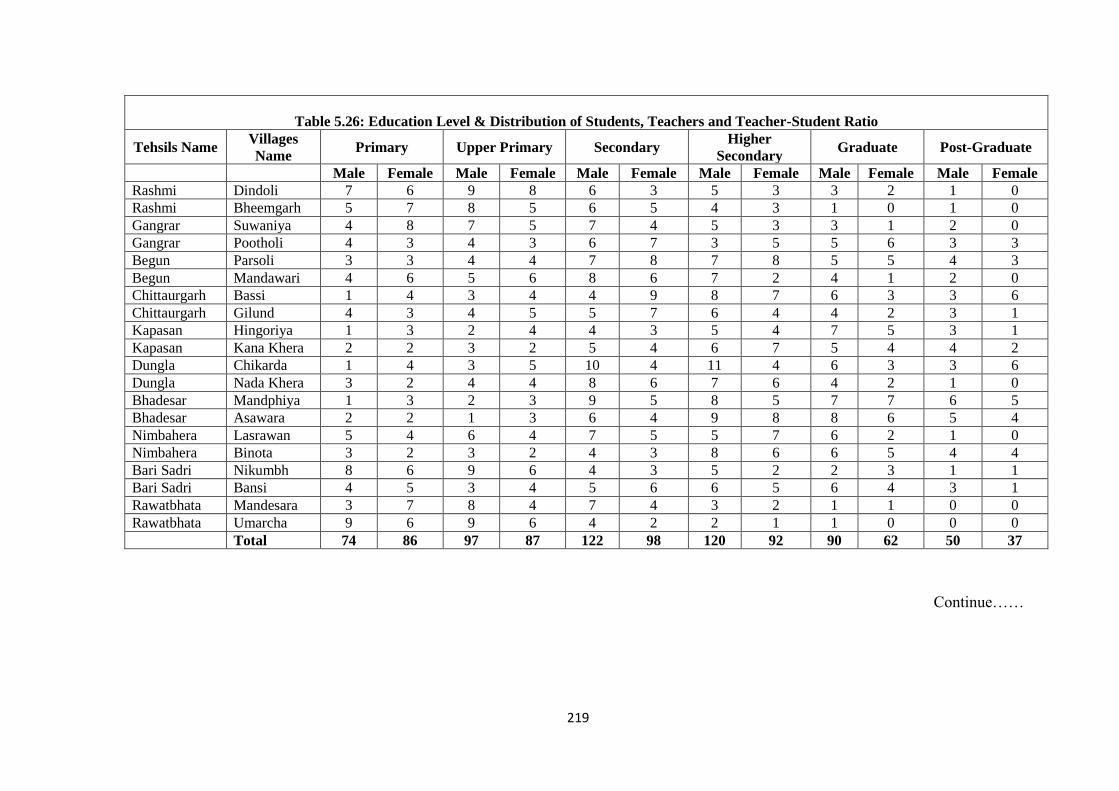
219
Table 5.26: Education Level & Distribution of Students, Teachers and Teacher-Student Ratio
Tehsils Name Villages Name Primary Upper Primary Secondary Higher
Secondary Graduate Post-Graduate
Male Female Male Female Male Female Male Female Male Female Male Female
Rashmi Dindoli 7 6 9 8 6 3 5 3 3 2 1 0 Rashmi Bheemgarh 5 7 8 5 6 5 4 3 1 0 1 0 Gangrar Suwaniya 4 8 7 5 7 4 5 3 3 1 2 0 Gangrar Pootholi 4 3 4 3 6 7 3 5 5 6 3 3 Begun Parsoli 3 3 4 4 7 8 7 8 5 5 4 3 Begun Mandawari 4 6 5 6 8 6 7 2 4 1 2 0 Chittaurgarh Bassi 1 4 3 4 4 9 8 7 6 3 3 6 Chittaurgarh Gilund 4 3 4 5 5 7 6 4 4 2 3 1 Kapasan Hingoriya 1 3 2 4 4 3 5 4 7 5 3 1 Kapasan Kana Khera 2 2 3 2 5 4 6 7 5 4 4 2 Dungla Chikarda 1 4 3 5 10 4 11 4 6 3 3 6 Dungla Nada Khera 3 2 4 4 8 6 7 6 4 2 1 0 Bhadesar Mandphiya 1 3 2 3 9 5 8 5 7 7 6 5 Bhadesar Asawara 2 2 1 3 6 4 9 8 8 6 5 4 Nimbahera Lasrawan 5 4 6 4 7 5 5 7 6 2 1 0 Nimbahera Binota 3 2 3 2 4 3 8 6 6 5 4 4 Bari Sadri Nikumbh 8 6 9 6 4 3 5 2 2 3 1 1 Bari Sadri Bansi 4 5 3 4 5 6 6 5 6 4 3 1 Rawatbhata Mandesara 3 7 8 4 7 4 3 2 1 1 0 0 Rawatbhata Umarcha 9 6 9 6 4 2 2 1 1 0 0 0
Total 74 86 97 87 122 98 120 92 90 62 50 37
Continue……
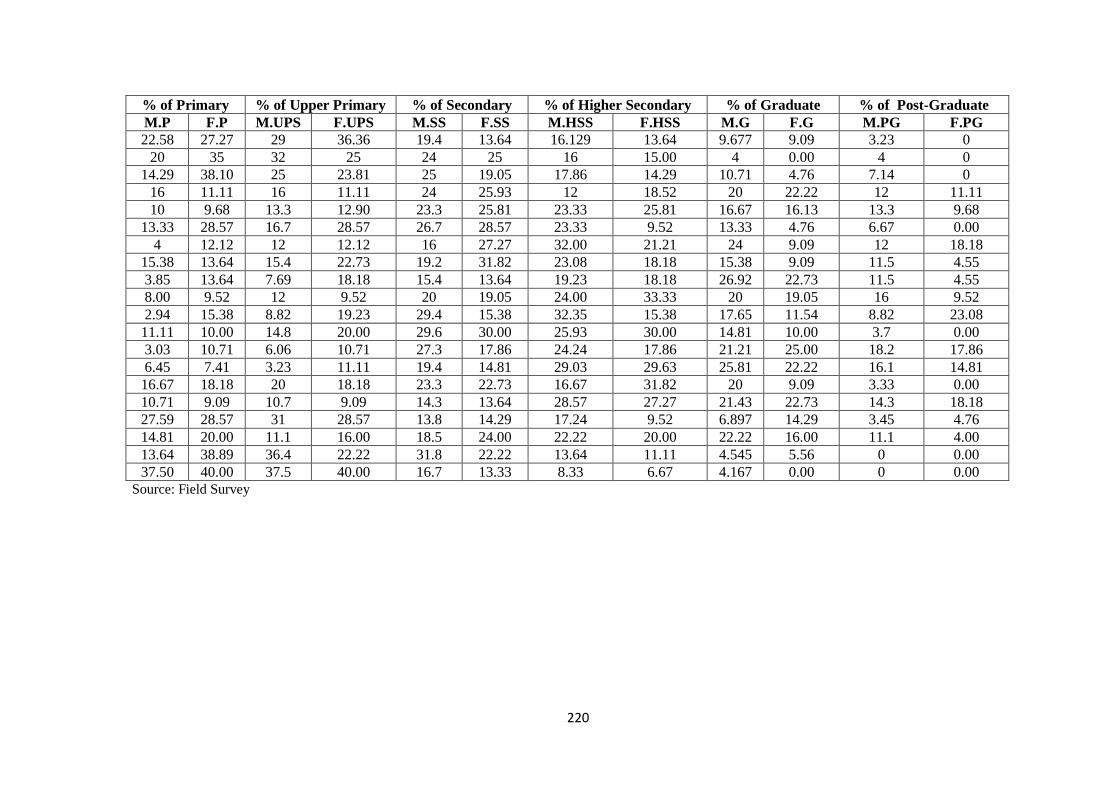
220
% of Primary % of Upper Primary % of Secondary % of Higher Secondary % of Graduate % of Post-Graduate M.P F.P M.UPS F.UPS M.SS F.SS M.HSS F.HSS M.G F.G M.PG F.PG 22.58 27.27 29 36.36 19.4 13.64 16.129 13.64 9.677 9.09 3.23 0
20 35 32 25 24 25 16 15.00 4 0.00 4 0 14.29 38.10 25 23.81 25 19.05 17.86 14.29 10.71 4.76 7.14 0
16 11.11 16 11.11 24 25.93 12 18.52 20 22.22 12 11.11 10 9.68 13.3 12.90 23.3 25.81 23.33 25.81 16.67 16.13 13.3 9.68
13.33 28.57 16.7 28.57 26.7 28.57 23.33 9.52 13.33 4.76 6.67 0.00 4 12.12 12 12.12 16 27.27 32.00 21.21 24 9.09 12 18.18
15.38 13.64 15.4 22.73 19.2 31.82 23.08 18.18 15.38 9.09 11.5 4.55 3.85 13.64 7.69 18.18 15.4 13.64 19.23 18.18 26.92 22.73 11.5 4.55 8.00 9.52 12 9.52 20 19.05 24.00 33.33 20 19.05 16 9.52 2.94 15.38 8.82 19.23 29.4 15.38 32.35 15.38 17.65 11.54 8.82 23.08 11.11 10.00 14.8 20.00 29.6 30.00 25.93 30.00 14.81 10.00 3.7 0.00 3.03 10.71 6.06 10.71 27.3 17.86 24.24 17.86 21.21 25.00 18.2 17.86 6.45 7.41 3.23 11.11 19.4 14.81 29.03 29.63 25.81 22.22 16.1 14.81 16.67 18.18 20 18.18 23.3 22.73 16.67 31.82 20 9.09 3.33 0.00 10.71 9.09 10.7 9.09 14.3 13.64 28.57 27.27 21.43 22.73 14.3 18.18 27.59 28.57 31 28.57 13.8 14.29 17.24 9.52 6.897 14.29 3.45 4.76 14.81 20.00 11.1 16.00 18.5 24.00 22.22 20.00 22.22 16.00 11.1 4.00 13.64 38.89 36.4 22.22 31.8 22.22 13.64 11.11 4.545 5.56 0 0.00 37.50 40.00 37.5 40.00 16.7 13.33 8.33 6.67 4.167 0.00 0 0.00
Source: Field Survey
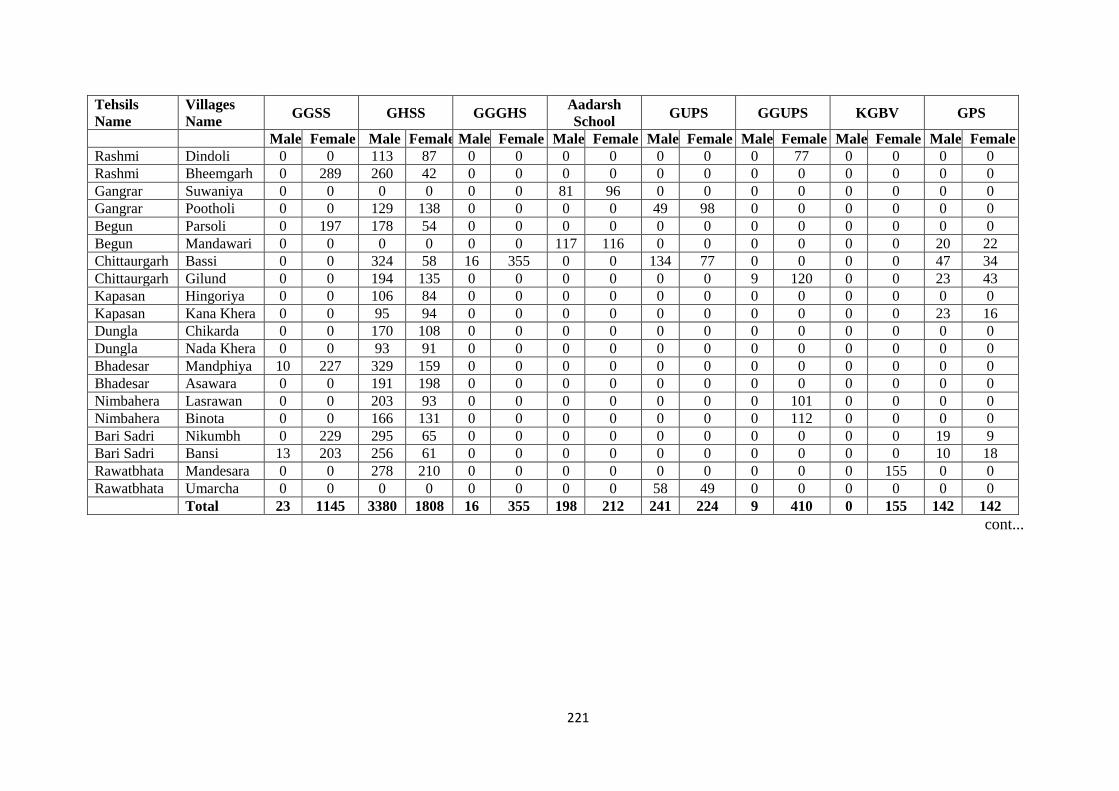
221
Tehsils Name
Villages Name GGSS GHSS GGGHS Aadarsh
School GUPS GGUPS KGBV GPS
Male Female Male Female Male Female Male Female Male Female Male Female Male Female Male Female Rashmi Dindoli 0 0 113 87 0 0 0 0 0 0 0 77 0 0 0 0 Rashmi Bheemgarh 0 289 260 42 0 0 0 0 0 0 0 0 0 0 0 0 Gangrar Suwaniya 0 0 0 0 0 0 81 96 0 0 0 0 0 0 0 0 Gangrar Pootholi 0 0 129 138 0 0 0 0 49 98 0 0 0 0 0 0 Begun Parsoli 0 197 178 54 0 0 0 0 0 0 0 0 0 0 0 0 Begun Mandawari 0 0 0 0 0 0 117 116 0 0 0 0 0 0 20 22 Chittaurgarh Bassi 0 0 324 58 16 355 0 0 134 77 0 0 0 0 47 34 Chittaurgarh Gilund 0 0 194 135 0 0 0 0 0 0 9 120 0 0 23 43 Kapasan Hingoriya 0 0 106 84 0 0 0 0 0 0 0 0 0 0 0 0 Kapasan Kana Khera 0 0 95 94 0 0 0 0 0 0 0 0 0 0 23 16 Dungla Chikarda 0 0 170 108 0 0 0 0 0 0 0 0 0 0 0 0 Dungla Nada Khera 0 0 93 91 0 0 0 0 0 0 0 0 0 0 0 0 Bhadesar Mandphiya 10 227 329 159 0 0 0 0 0 0 0 0 0 0 0 0 Bhadesar Asawara 0 0 191 198 0 0 0 0 0 0 0 0 0 0 0 0 Nimbahera Lasrawan 0 0 203 93 0 0 0 0 0 0 0 101 0 0 0 0 Nimbahera Binota 0 0 166 131 0 0 0 0 0 0 0 112 0 0 0 0 Bari Sadri Nikumbh 0 229 295 65 0 0 0 0 0 0 0 0 0 0 19 9 Bari Sadri Bansi 13 203 256 61 0 0 0 0 0 0 0 0 0 0 10 18 Rawatbhata Mandesara 0 0 278 210 0 0 0 0 0 0 0 0 0 155 0 0 Rawatbhata Umarcha 0 0 0 0 0 0 0 0 58 49 0 0 0 0 0 0 Total 23 1145 3380 1808 16 355 198 212 241 224 9 410 0 155 142 142
cont...
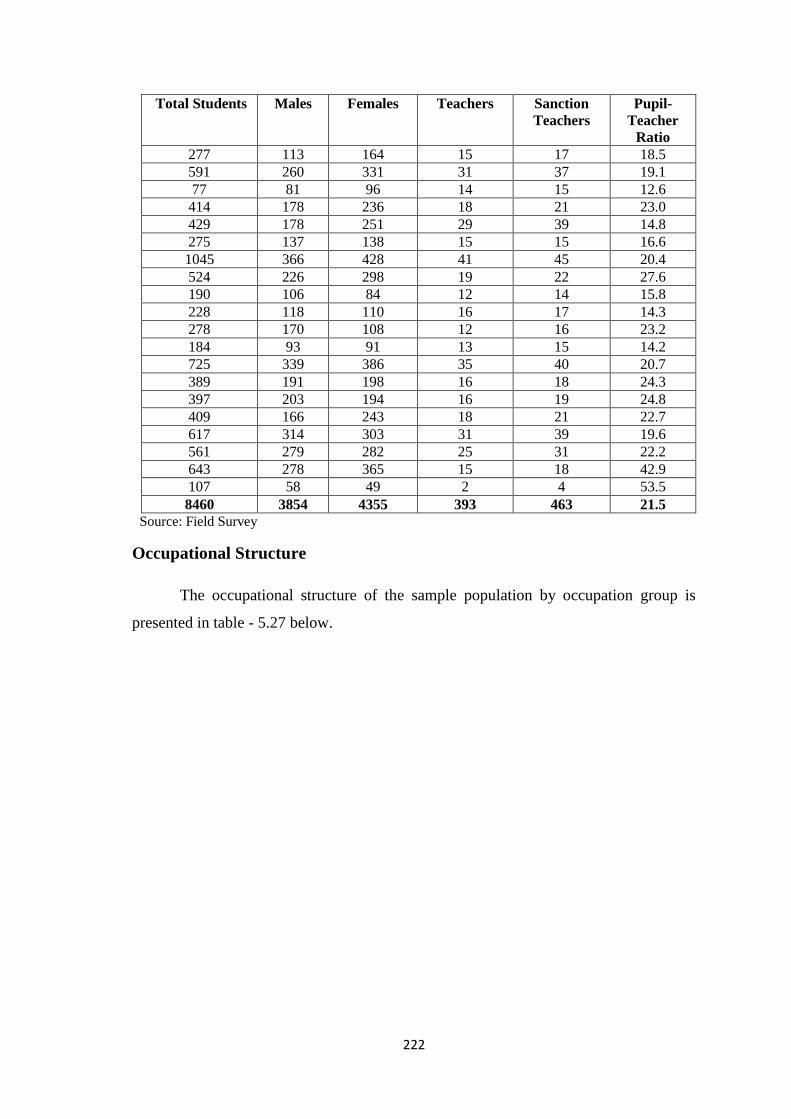
222
Total Students Males Females Teachers Sanction Teachers
Pupil-Teacher
Ratio 277 113 164 15 17 18.5 591 260 331 31 37 19.1 77 81 96 14 15 12.6
414 178 236 18 21 23.0 429 178 251 29 39 14.8 275 137 138 15 15 16.6 1045 366 428 41 45 20.4 524 226 298 19 22 27.6 190 106 84 12 14 15.8 228 118 110 16 17 14.3 278 170 108 12 16 23.2 184 93 91 13 15 14.2 725 339 386 35 40 20.7 389 191 198 16 18 24.3 397 203 194 16 19 24.8 409 166 243 18 21 22.7 617 314 303 31 39 19.6 561 279 282 25 31 22.2 643 278 365 15 18 42.9 107 58 49 2 4 53.5 8460 3854 4355 393 463 21.5
Source: Field Survey
Occupational Structure
The occupational structure of the sample population by occupation group is
presented in table - 5.27 below.
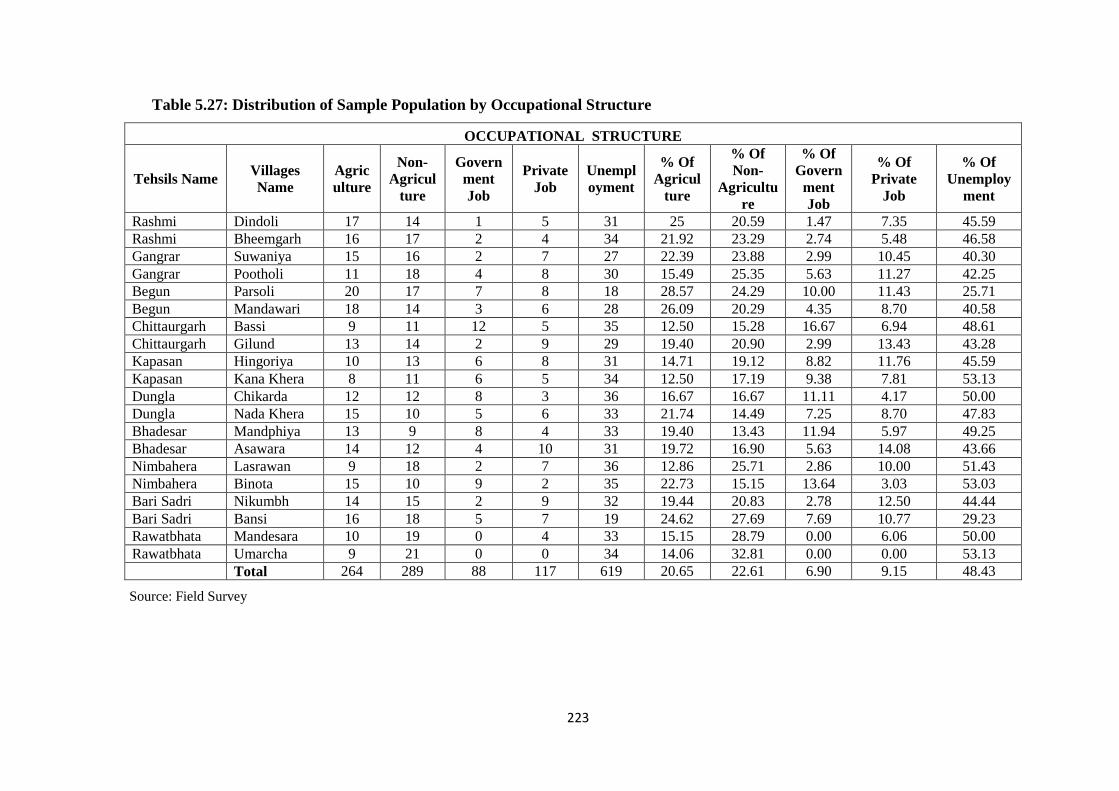
223
Table 5.27: Distribution of Sample Population by Occupational Structure
OCCUPATIONAL STRUCTURE
Tehsils Name Villages Name
Agriculture
Non-Agricul
ture
Government Job
Private Job
Unemployment
% Of Agricul
ture
% Of Non-
Agriculture
% Of Govern
ment Job
% Of Private
Job
% Of Unemploy
ment
Rashmi Dindoli 17 14 1 5 31 25 20.59 1.47 7.35 45.59 Rashmi Bheemgarh 16 17 2 4 34 21.92 23.29 2.74 5.48 46.58 Gangrar Suwaniya 15 16 2 7 27 22.39 23.88 2.99 10.45 40.30 Gangrar Pootholi 11 18 4 8 30 15.49 25.35 5.63 11.27 42.25 Begun Parsoli 20 17 7 8 18 28.57 24.29 10.00 11.43 25.71 Begun Mandawari 18 14 3 6 28 26.09 20.29 4.35 8.70 40.58 Chittaurgarh Bassi 9 11 12 5 35 12.50 15.28 16.67 6.94 48.61 Chittaurgarh Gilund 13 14 2 9 29 19.40 20.90 2.99 13.43 43.28 Kapasan Hingoriya 10 13 6 8 31 14.71 19.12 8.82 11.76 45.59 Kapasan Kana Khera 8 11 6 5 34 12.50 17.19 9.38 7.81 53.13 Dungla Chikarda 12 12 8 3 36 16.67 16.67 11.11 4.17 50.00 Dungla Nada Khera 15 10 5 6 33 21.74 14.49 7.25 8.70 47.83 Bhadesar Mandphiya 13 9 8 4 33 19.40 13.43 11.94 5.97 49.25 Bhadesar Asawara 14 12 4 10 31 19.72 16.90 5.63 14.08 43.66 Nimbahera Lasrawan 9 18 2 7 36 12.86 25.71 2.86 10.00 51.43 Nimbahera Binota 15 10 9 2 35 22.73 15.15 13.64 3.03 53.03 Bari Sadri Nikumbh 14 15 2 9 32 19.44 20.83 2.78 12.50 44.44 Bari Sadri Bansi 16 18 5 7 19 24.62 27.69 7.69 10.77 29.23 Rawatbhata Mandesara 10 19 0 4 33 15.15 28.79 0.00 6.06 50.00 Rawatbhata Umarcha 9 21 0 0 34 14.06 32.81 0.00 0.00 53.13
Total 264 289 88 117 619 20.65 22.61 6.90 9.15 48.43
Source: Field Survey
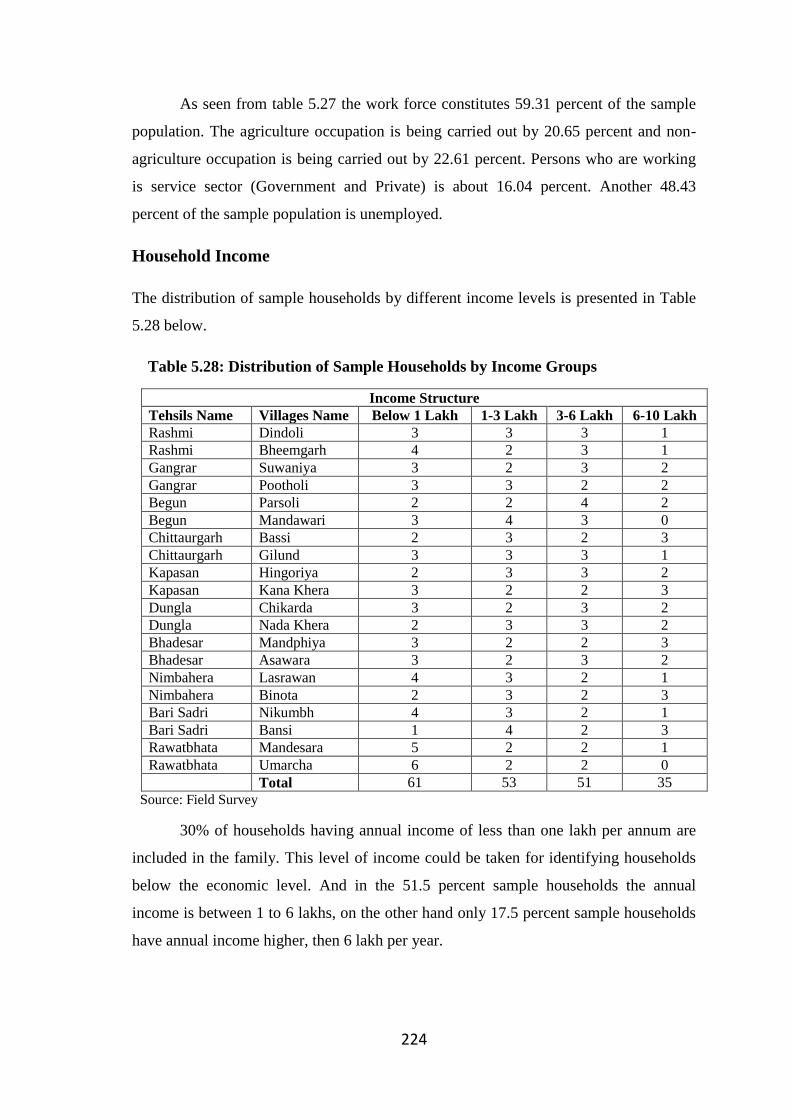
224
As seen from table 5.27 the work force constitutes 59.31 percent of the sample
population. The agriculture occupation is being carried out by 20.65 percent and non-
agriculture occupation is being carried out by 22.61 percent. Persons who are working
is service sector (Government and Private) is about 16.04 percent. Another 48.43
percent of the sample population is unemployed.
Household Income
The distribution of sample households by different income levels is presented in Table
5.28 below.
Table 5.28: Distribution of Sample Households by Income Groups
Income Structure Tehsils Name Villages Name Below 1 Lakh 1-3 Lakh 3-6 Lakh 6-10 Lakh Rashmi Dindoli 3 3 3 1 Rashmi Bheemgarh 4 2 3 1 Gangrar Suwaniya 3 2 3 2 Gangrar Pootholi 3 3 2 2 Begun Parsoli 2 2 4 2 Begun Mandawari 3 4 3 0 Chittaurgarh Bassi 2 3 2 3 Chittaurgarh Gilund 3 3 3 1 Kapasan Hingoriya 2 3 3 2 Kapasan Kana Khera 3 2 2 3 Dungla Chikarda 3 2 3 2 Dungla Nada Khera 2 3 3 2 Bhadesar Mandphiya 3 2 2 3 Bhadesar Asawara 3 2 3 2 Nimbahera Lasrawan 4 3 2 1 Nimbahera Binota 2 3 2 3 Bari Sadri Nikumbh 4 3 2 1 Bari Sadri Bansi 1 4 2 3 Rawatbhata Mandesara 5 2 2 1 Rawatbhata Umarcha 6 2 2 0 Total 61 53 51 35
Source: Field Survey
30% of households having annual income of less than one lakh per annum are
included in the family. This level of income could be taken for identifying households
below the economic level. And in the 51.5 percent sample households the annual
income is between 1 to 6 lakhs, on the other hand only 17.5 percent sample households
have annual income higher, then 6 lakh per year.
225
5.1.3 Results of Household Survey
In order to get better insights into the conditions prevailing in rural Chittaurgarh
among the weaker sections particularly in the education sector, a sample survey of
households was conducted. More specifically, the intention was to get some idea about
(i) the household expenditure on the education (ii) the reasons why the enrollment of
children in schools is low (iii) the extent of the benefits of incentives provided by the
government actually reaching the education (iv) their perception about the quality of the
education and (v) the social awareness about education.
Moreover, researcher conducted the purposive sample survey of the households
belonging to the weaker sections of the society, besides in-depth survey of the schools
in and around the selected villages. The questionnaires used for the survey. The sample
survey of households revealed some interesting features of the weaker section in rural
Chittaurgarh. Researcher surveyed 200 households in Chittaurgarh district. Researcher
had detailed interactions with the district education department and officers. Researcher
met teachers and students who were present in the schools during our unannounced
visits. Discussions were also held with Sarpanch and other members of the Panchayat
besides a large number of villagers. During these schools visits were to see the
dilapidated conditions of the school buildings were not usable due to prolonged decay,
lack of repairs, incomplete construction and lack of maintenance. About 70%
households in Chittaurgarh out of our sample owned land. Generally the children both
girls and boys, are driven cattle to this activity even if they have to sacrifice attending
schools. These families also often migrate out seasonally in search of food, fodder and
employment. This happens because only 20.65% of the sample households in the
Chittaurgarh district reported farming occupation. The other 22.16% of the households
depending on non-agricultural activities, 6.90% of the households depending on
government job, 9.15% of the households depending on private job and 48.43% of the
households depending on unemployment. Solution of this problem of drop-out and
migration cannot be piecemeal. It has to be comprehensive. The weaker section
households in rural Chittaurgarh are that access to electricity in their residence. An
access is also limited to 6 days in a week for about 10 hours/day in Chittaurgarh. The
learning and reading environment at home is thus seriously lacking.
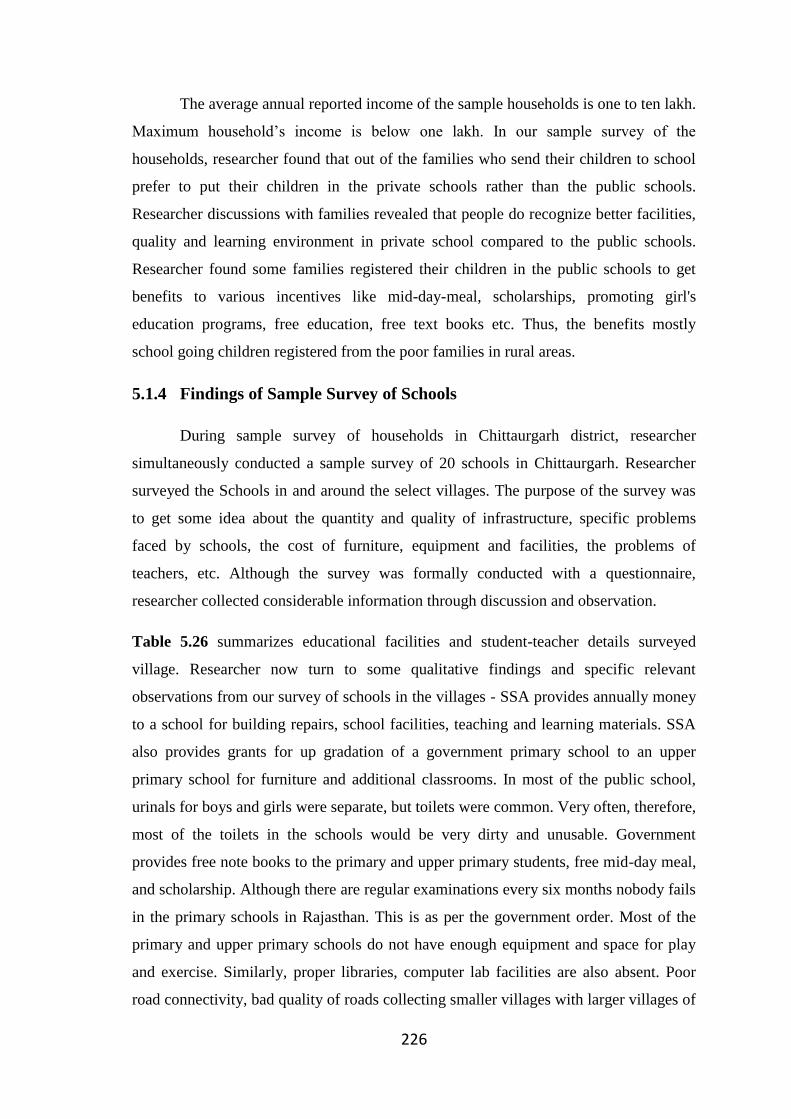
226
The average annual reported income of the sample households is one to ten lakh.
Maximum household‟s income is below one lakh. In our sample survey of the
households, researcher found that out of the families who send their children to school
prefer to put their children in the private schools rather than the public schools.
Researcher discussions with families revealed that people do recognize better facilities,
quality and learning environment in private school compared to the public schools.
Researcher found some families registered their children in the public schools to get
benefits to various incentives like mid-day-meal, scholarships, promoting girl's
education programs, free education, free text books etc. Thus, the benefits mostly
school going children registered from the poor families in rural areas.
5.1.4 Findings of Sample Survey of Schools
During sample survey of households in Chittaurgarh district, researcher
simultaneously conducted a sample survey of 20 schools in Chittaurgarh. Researcher
surveyed the Schools in and around the select villages. The purpose of the survey was
to get some idea about the quantity and quality of infrastructure, specific problems
faced by schools, the cost of furniture, equipment and facilities, the problems of
teachers, etc. Although the survey was formally conducted with a questionnaire,
researcher collected considerable information through discussion and observation.
Table 5.26 summarizes educational facilities and student-teacher details surveyed
village. Researcher now turn to some qualitative findings and specific relevant
observations from our survey of schools in the villages - SSA provides annually money
to a school for building repairs, school facilities, teaching and learning materials. SSA
also provides grants for up gradation of a government primary school to an upper
primary school for furniture and additional classrooms. In most of the public school,
urinals for boys and girls were separate, but toilets were common. Very often, therefore,
most of the toilets in the schools would be very dirty and unusable. Government
provides free note books to the primary and upper primary students, free mid-day meal,
and scholarship. Although there are regular examinations every six months nobody fails
in the primary schools in Rajasthan. This is as per the government order. Most of the
primary and upper primary schools do not have enough equipment and space for play
and exercise. Similarly, proper libraries, computer lab facilities are also absent. Poor
road connectivity, bad quality of roads collecting smaller villages with larger villages of
227
towns, and poor transport facilities are major deterrents for children of smaller villages
to study further. The salary difference between a so-called "trained or qualified" teacher
and untrained teacher is amazingly high in the public and private schools. The problems
of education in rural Chittaurgarh are the low density of population with less developed
in socio-economic condition like-high rate of school dropouts, lack of social awareness,
low income, mostly people engaged in agriculture occupation, lack of schools and
teachers.
In finding, these observations reveal that (i) male-female differential still
prevails in every level of education (ii) the number of educational institutions need to be
opened with good facilities and their distribution needs to be made more balanced (iii)
providing State of art infrastructure in all (both government an private) institutions is
another compelling area warranting immediate attention (iv) recruiting faculty and
filling up, and not letting the vacant positions lie for decades; (v) the agricultural sector
still has the lowest proportion of educated workers (vi) opening up of education
institutes to private providers and working for useful public-private partnership has
become an inescapable necessity of our times.
Conclusion
During my fieldwork in twenty villages a total number of 200 households and
20 schools were interviewed. The present survey shows the demographic features,
literacy level, illiteracy level, educational facilities, occupational structure and
household‟s income etc. The investigation shows an increase of the female literacy level
than the male literacy due to social awareness in society, educational facilities, and
vigorous efforts on the part of government by way of opening up schools for girls. Both
quantitative expansion of facilities for education and qualitative improvement in the
education system of the area were taken up simultaneously. Government‟s policy of
free and compulsory education, scholarships for the poor, mid-day meal schemes for
school going children, special focus on female child's education, providing quality
educational institute in almost all areas, expansion of technical education all have
worked in giving necessary filled to attainments of the villages in the field of education.
228
CHAPTER - VI
CONCLUSIONS, POLICY ISSUES AND
RECOMMENDATIONS
6.1 Conclusion
After 71 years of Independence the progress of literacy in an area indicates the
pace at which a particular society is transforming. Literacy is regarded as an essential
tool for eradicating social evils like poverty, unemployed, economically imbalance,
mental isolation etc. The lack of literacy, on the other hand, detracts from man his
dignity and does not allow a man to play a prominent role in the society. Social
advancement and democratic growth of any country (Chandana and Sidhu, 1980: 96)
Literacy is essential for economic development. Now it has been clear on the one hand
that the levels of literacy in a region determine the levels of economic development. It
is because literacy helps people to be aware about their rights in a democratic country
like India. On the other hand, the progress of literacy and demographic differentials in a
region are a function of the interplay of a socio-economic and development factors.
The present research work, which is a study of pattern of literacy rate in the
district of Chittaurgarh, begun with the following objectives:
(i) To study the growth of literacy rate and development like demographic, social
and economic structure;
(ii) To study the level of rural- urban literacy rate;
(iii) To study the level of Scheduled Caste and Scheduled Tribe literacy rate;
(iv) To study the various literacy programs in Chittaurgarh district and their
consequences;
(v) To assess the gap of male-female literacy rate;
(vi) To study the current educational status of Chittaurgarh district;
(vii) To identify the factors affecting literacy rates in Chittaurgarh district;
229
(viii) To analyze the possibilities of future progress of literacy rate in Chittaurgarh
district;
(ix) To develop a strategy to make Chittaurgarh district a complete literate district.
The present study divided into six chapters. Chapter I deal with the
introduction and importance of literacy in society and economy, discussion on
cartographic and statistical techniques used. In chapter II, detailed service of literature
has been made. This chapter also contains the choice of study area; Chapter III is
devoted to “Pattern of literacy-1981, 1991, 2001 & 2011". Besides discuss the level and
changes of total literacy, male-female literacy. This chapter consists of not only the
level of rural- urban literacy but also about the changes of rural-urban literacy. This
chapter discussing the level and changes of scheduled caste and scheduled tribe.
Chapter IV deals with education facilities and efforts for literacy in Chittaurgarh district
begins with a detailed discussion on various State and centre sponsored programs to
increase the levels of literacy in Chittaurgarh district. Chapter V is devoted to
“Educational Parameters” for Village sample survey and describes the variations in
Village area. Chapter VI deals with the conclusions and policy issues drawn from the
whole study and recommendations are made to make Chittaurgarh a complete literate
district.
Pattern and Changes of Total Literacy
The analysis on the patterns of total literacy shows that there are striking spatial
disparities in the levels of literacy. On the one hand, we have Bhadesar tehsil (15.6% in
1981), Gangrar tehsil (25.99% in 1991), and Rashmi tehsil (44% in 2001 & 52.89% in
2011) in which the literacy rate is very low. On the other hand we have Chittaurgarh
(29.76% in 1981, 42.83% 1991 & 61.70% in 2001) and Nimbahera (69.43% in 2011) in
which literacy rate is very high. Very low literacy rate is recorded in these tehsils as
they are lack of educational amenities low level of income, lack of industrialization and
urbanization most of the people are engaged in agriculture, less developed means of
transportation and communication, socio-economic backwardness of the people etc.
Very high literacy rate is recorded in these tehsils as they are industrially and urbanized
developed socio-economically sound and having specialized educational institutions.
230
The analysis on change of total literacy shows that there are striking disparities
in the changes of literacy. On the one hand, we have Chittaurgarh tehsil (43.93% 1981-
91 & 44.06% in 1991-2001) and Rawatbhata (7.62% in 2001-11) in which change rate
is very low due to a negative correlation between literacy level of tehsils and the
magnitude of change in it. This intends to say that where the literacy level was high, the
magnitude of change was low, where the literacy level was low; the magnitude of
change in literacy was high. On the other hand we have Bhadesar tehsil (68.05% in
19181-91, 80.00% in 1991-01 & 21.69% in 2001-11) in which change rate is very high.
There are areawise variations in the growth of literacy rate which are kept on decreasing
with the time.
Pattern and Changes of Male-Female Literacy
Undoubtly due to change taking place in the social system, females today are
enjoying better status and recognition than what they had in past, yet the gap in terms of
male-female literacy is alarming. The male literacy rate of Chittaurgarh district shows
that there are striking spatial disparities in the levels of literacy. On the only hand we
have Bhadesar (25.72% in 1981), Gangarar (40.88% in 1991), and Rashmi (63.70% in
2001 & 70.05% in 2011) in which literacy rate is very low. On the other hand we have
Chittaurgarh (42.52% in 1981) and Nimbahera (60.33% in 1991, 79.40% in 2001 &
83.84% in 2011) in which literacy rate is very high. Very low literacy rate is recorded in
these tehsils due to the backwardness in industrial, educational and agricultural
development. Very high literacy rate is recorded in these tehsils as they are well
connected by national and State highways, have ample opportunities for jobs in non-
agriculture activities, commercial agricultural areas connected by roads, big business
houses have also opened many private schools which are boosting high literacy rate in
these areas.
The analysis on changes of male literacy shows that there are striking disparities
in the changes of literacy. On the one hand, we have Chittaurgarh tehsil (36.90% in
1981-91 & 31.41% in 1991-01) and Rawatbhata tehsil (3.32% in 2001-2011) in which
change rate is very low due to a negative correlation between literacy level of tehsils
and the magnitude of change in it. On the other hand we have Bhadesar tehsil (64.12%
in 1981-91 & 11.77% in 2001-11) and Gangrar tehsil (59.02% in 1991-01) in which
change rate is very high. The area wise variations are decreasing in the terms of growth
231
rate of literacy rate due to improve in education and influential change in socio-
economic systems.
The patterns of female literacy show that there are spatial disparities in the
levels of literacy. On the one hand we have Nimbahera (4.40% in 1981), Badi Sadri
(9.48% in 1991), Rashmi (24.92% in 2001) and Kapasan tehsils (35.66% in 2011) in
which literacy rate is very low. On the other hand we have Gangrar (7.53% in 1981),
Kapasan (17.41% in 1991), and Nimbahera (32.73% in 2001 & 47.13% in 2011) in
which literacy rate is very high. Very low literacy rate is recorded in these tehsils as
they are not economically sound, educational and transport facilities also not more
developed, people are not broad minded and have no faith in girls education, people do
not like to send the girls to schools, the areas where child marriage is common, low
status of women in the society, subsistence agricultural economy of these areas. Very
high literacy rate is recorded in these tehsils as they are enough opportunities to female
for taking education, here prejudices factor against female education are less powerful,
people are broad minded educationally developed because of more education facilities,
so female literacy rate is high in these tehsils.
The analysis on changes of female literacy shows that there are spatial
disparities in the changes of literacy. On the one hand, we have Gangrar (32.67% in
1981-91), Begun (75.05% in 1991-01) and Rawatbhata (16.67% in 2001-01) in which
change rate is very low. These intend to say that where the literacy level was high, the
magnitude of change was low, where the literacy level was low; the magnitude of
change in literacy was high. On the other hand, we have Rashmi (106.53% in 1981-91),
Bhadesar (192.55% in 1991-01) and Rashmi (45.62% in 2001-11) in which change rate
is very high.
Gender Gap in Literacy
The gender gap in literacy is very high in the study area, due to many reasons
including appalling poverty, parents lack of interest in female education, early marriage
of the females, households responsibilities of the females, prevalence of prejudices
against the females education, mobility and development inadequate schools for
females, dearth of female teachers particularly in rural areas, more preference for
education of sons and the low degree of participation of females in work. The patterns
of tehsilwise variation among gender gap in the levels of literacy shows that there are
232
striking disparities in the levels of literacy. In 1981, 1991, 2001, the gender gap in total
literacy rate, rural, scheduled caste and scheduled tribe literacy rate has increased in
almost all the tehsils but in 2011 it is decreased in all the tehsils. In 1981, the gender
gap in urban literacy rate has increased in all the tehsils, but in 1991, 2001, 2011 it is
decreased in almost all the tehsils.
Pattern and Changes of Rural Literacy
In Chittaurgarh district, as in case literacy in the case of rural-urban literacy also
the gap in alarming. This gap is considered to be the result of better facilities available
in urban area. The analysis on the spatial patterns of rural literacy shows that there are
striking disparities in the levels of literacy. On the one hand, we have Dungla tehsil
(15.67% in 1981), Gangrar (25.99% in 2011) in which literacy rate is very low. On the
other hand we have Bhadesar (20.29% in 1981), Kapasan (48.95% in 1991), and
Nimbahera (54.29% in 2001 & 64.23% in 2011) in which literacy rate is very high.
Very low literacy rate is recorded in these tehsils as they are engaged in agriculture and
demand for labour to work in the fields had increased. This keeps away many children
from attending a school and poor families prefer their children to help them in making
an earning rather than sparing them for schools. Therefore, there is low level of literacy
in these tehsils of the district. Very high literacy rate is recorded in these tehsils due to
availability of educational institutions, standard of living, well developed means of
transportation and communication, commercial agriculture areas are the reasons for the
high level of literacy in these tehsils. Besides several philanthropists and non-
governmental organizations also opened schools and colleges of galvanize education
and to increase literacy.
The analysis on changes of rural total literacy shows that there are striking
disparities in the changes of literacy. On the one hand, we have Bhadesar tehsil
(29.77% in 1981-91) and Kapasan (-2.90% in 1991-01 & 10.95% in 2001-11) in which
change rate is very low. On the other hand, we have Kapasan is very low. On the other
hand, we have Kapasan teshil (192.77% in 1981-91), Bhadesar (80.05% in 1991-01)
and Badi Sadri (26.46% in 2001-11) in which change rate is very high. So, the changing
socio-economic value system also has played a pivotal role which helped in
accelerating the rural literacy in the Chittaurgarh district.
233
Pattern and Changes of Rural Male - Female Literacy
The analysis on the patterns of rural male literacy shows that there are spatial
disparities literacy shows that there are spatial disparities in the levels of literacy. On
the one hand, we have Dungla (25.72% in 1981), Gangrar (40.88% in 1991), and
Rawatbhata (62.34% in 2001 & 66.67% in 2011) in which literacy rate is very low. On
the other hand we have Bhadesar (34.14% in 1981), Kapasan (79.86% in 1991), and
Nimbahera (75.48% in 2001 & 81.12% in 2011) in which literacy rate is very high.
The analysis on changes of rural male literacy shows that there are variations in
the changes of literacy. On the one hand, we have Bhadesar (23.64% in 1981-91),
Kapasan (-16.42% in 1991-01 & 4.77% in 2001-11) in which change rate is very low.
On the other hand, we have Kapasan (189.19% in 1981-91), Begun (59.03% in 1991-
01) and Badi Sadri (13.65% in 2001-11) in which change rate is very high.
The analysis on the patterns of rural female literacy shows that there are spatial
disparities in the level of literacy. On the one hand, we have Nimbahera (4.40% in
1981), Badi Sadri (9.48% in 1991), Rashmi (24.92% in 2001) and Kapasan (35.66% in
2011) in which literacy rate is very low. On the other hand, we have Gangrar (7.53% in
1981), Kapasan (17.41% in 1991), and Nimbahera (32.73% in 2001 & 47.13% in 2011)
in which literacy rate is very high.
The analysis on changes of rural female literacy shows that are variations in the
changes of literacy. On the one hand, we have Gangrar (32.67% in 1981-91) and
Kapasan (63.44% in 1991-01 & 25.30% in 2001-11) in which change rate is very low.
On the other hand, we have Kapasan (237.67% in 1981-91), Bhadesar (192.22% in
1991-01) and Badi Sadri (58.28% in 2001-11) in which change rate is very high.
Pattern and Changes of Urban Literacy
The analysis on the patterns of urban literacy shows that there are regional
disparities in the levels of literacy. On the one hand, we have Kapasan (43.50% in 1981,
60.30% in 1991, 73.83% in 2001 & 76.34% in 2011) in which literacy rate is very low,
due to most of the people are engaged in agriculture, lack of educational amenities, low
degree of urbanization. On the other hand, we have Chittaurgarh (56.63% in 1981),
Begun (70.78% in 1991) and Rawatbhata (84.09% in 2001% & 85.82% in 2011) in
234
which literacy rate is very high, they are in industrially developed, economically sound
and the availability of educational institutions, degree of urbanization, standard of
living, well developed means of transportation and communication are such factors.
Pattern and Changes Urban Male - Female Literacy
The analysis on the patterns of urban male literacy shows that there are spatial
disparities in the levels of literacy. On the one hand, we have Kapasan (60.55% in
1981), Nimbahera (76.85% in 1991), and Kapasan (88.01% in 2001 & 88.26% in 2011)
in which literacy rate is very low. On the other hand, we have Chittaurgarh (70.66% in
1981), Begun (83.80% in 1991) and Rawatbhata (91.83% in 2001 & 92.19% in 2011) in
which literacy rate is very high.
The analysis on changes of urban male literacy shows that these are regional
variations in the change of literacy. On the one hand, we have Chittaurgarh (16.51% in
1981-91), Begun (7.01% in 1991-01) and Kapasan (0.29% in 2001-11) in which change
rate is very low. On the other hand, we have Badi Sadri (30.88% in 1981-91),
Nimbahera (15.86% in 1991-01) and Badi Sadri (1.75% in 2001-11) in which change
rate is very high.
The analysis on the patterns of urban female literacy shows that there are spatial
disparities in the levels of literacy. On the one, hand, we have Kapasan tehsil (25.48%
in 1981, 41.17% in 1991, 59.13% in 2001 7 64.23% in 2011) in which literacy rate is
very low. On the other hand, we have Chittaurgarh (39.70% in 1981 & 56.10% in 1991)
and Rawatbhata (75.49% in 2001 & 79.05% in 2011) in which literacy rate is very high.
Analysis of changes in urban female literacy revealed that there are differences
in the change in literacy. On the one hand, we have Chittaurgarh (41.32% in 1981-91),
Begun (9.64% in 1991-01) and Rawatbhata (4.72% in 2001-11) in which change rte is
very low. On the other hand, we have Kapasan (61.57% in 1981-91 & 43.62% in 1991-
01) and Begun (13.03% in 2001-11) in which change rate is very high.
Pattern and Changes of Scheduled Caste in Literacy
According the Census 2011, the literacy rate of scheduled caste (55.83%) is lag
behind from total literacy rate of Chittaurgarh district (61.71%). The male-female gap
235
in literacy rate is high. The trends reflect the social and cultural trends and degrees of
gender inequality in Chittaurgarh area.
The analysis on the patterns of scheduled caste total, male and female literacy
shows that there are spatial disparities in the levels of literacy. On the one hand, we
have Dungla (8.65% in 1981), Gangrar (16.64% in 1991) and Rashmi (37.34% in 2001
& 47.77% in 2011) in which total literacy rate is very low. On the other hand
Chittaurgarh (15.52% in 1981), Nimbahera (24.62% in 1991) and Rawatbhata (52.29%
in 2001 & 63.65% in 2011) in which total literacy rate is very high.
The levels of scheduled caste male literacy shows that, we have Dungla (16.20%
in 1981), Gangrar (29.14% in 1991), Rashmi (57.86% in 2001) and Gangrar (64.76% in
2011) in which SC male literacy rate is very low. On the other hand, we have Bhadesar
(26.73% in 26.73%), Nimbahera (43.61% in 1991, 72.73% in 2001 & 78.33% in 2011)
in which SC male literacy rate is very high. The levels of scheduled caste female
literacy shows that, we have Badi Sadri (0.45% in 1981), Chittaurgarh (1.80% in 1991)
and Rashmi (17.23% in 2001 & 30.46% in 2011) in which SC female literacy rate is
very low. On the other hand, we have Chittaurgarh (3.58% in 1981), Begun (8.32 in
1991) and Rawatbhata (33.60% in 2001 & 49.67% in 2011) in which SC female literacy
rate is very high.
The analysis on changes of scheduled caste literacy rate shows that there are
regional variations in the changes of literacy. The changes of scheduled caste total
literacy shows that, we have Bhadesar (17.03% in 1981-91), Begun (71.96% in 1991-
01) and Kapasan (14.15% in 2001-11) in which SC total Change rate is very low. On
the other hand, we have Dungla (122.68% in 1981-91), Chittaurgarh (176.72% in 1991-
01) and Bhadeshar (35.85% in 2001-11) in which SC total change rate is very high. The
change of scheduled caste male literacy shows that, we have Bhadesar (20.69% in
1981-91), Begun (58.00% in 1991-01) and Kapasan (5.93% in 2001-11) in which SC
male change rate is very low. On the other hand, we have Dungla (121.15% in 1981-
91), Gangrar (104.58% in 1991-01) and Bhadesar (19.30% in 2011-11) in which SC
male change rate is very high.
The change of the scheduled caste female literacy shows that, we have
Chittaurgarh (-49.74% in 1981-91), Begun (160.83% in 1991-01) and Kapasan (36.86%
in 2001-11) in which SC female the change rate in very low. On the other hand, we
236
have Nimbahera (817.28% in 1981-91), Rawatbhata (1719.61% in 1991-01) and
Bhadesar (84.35% in 2001-11) in which SC female change the rate is very high.
Pattern and Changes of Scheduled Tribe in Literacy
According the Census 2011, the literacy rate of scheduled tribe (39.19%) is lag
behind from total literacy rate of Chittaurgarh district (61.71%). The male-female gap
in literacy rate is high. The trends reflect the social and cultural trends and degrees of
gender inequality in Chittaurgarh area.
The analysis on the patterns of scheduled tribe total, male and female literacy
shows that there are spatial disparities in the levels of literacy. On the one hand, we
have Dugnla, Rashmi and Badi Sadri (2% in 1981), Gangrar (5.54% in 1991), Kapasan
(10.29% in 2001) and Rashmi (27.66% in 2011) in which literacy rate is very low. On
the other hand, Nimbahera and Bhadesar (6% in 1981), Nimbahera (12.39% in 1991 &
49.08% in 2011) and Rawatbhata (57.60% in 2001) in which literacy rate are very high.
The levels of scheduled tribe male literacy shows that, we have Dungla (3.96%
in 1981), Gangrar (10.06% in 1991) and Rashmi (33.35% in 2001 & 42.71% in 2011)
in which literacy rate is very low. On the other hand, Bhadesar (10.82% in 1981) and
Nimbahera (22.67% in 1991, 52.42% in 2001 & 64.42% in 2011) in which literacy rate
are very high. The levels of scheduled tribe female literacy shows that, we have
Nimbahera and Badi Sadri (0.0% in 1981), Chittaurgarh (0.45% in 1991) and Rashmi
(8.81% in 2001 & 12.785 in 2011) in which literacy rate is very low on the other hand,
we have Chittaurgarh (0.94% in 1981), Nimbahera (1.48% in 1991), Rawatbhata
(33.26% in 2001) and Nimbahera (33.39% in 2011) in which literacy rate is very high.
The analysis on changes of scheduled tribe literacy rate shows that there are
regional variations in the changes of literacy. The change of scheduled tribe total
literacy shows that, we have Bhadesar (22.09%) in 1981-91), Kapasan (53.18% in
1991-01) and Rawatbhata (-44.61% in 2001-11) in which ST total Change rate is very
low. On the other hand, we have Badi Sadri (350.83% in 1981-91), Begun (332.56% in
1991-01) and Kapasan (204.56% in 2001-11) in which ST total change rate is very
high. The change of scheduled tribe male literacy shows that, we have Bhadesar
(17.24% in 1981-91) Badi Sadri (129.82% in 1991-01) and Rawatbhata (-3.47% in
2001-11) in which ST male change rate is very low. On the other hand, we have
237
Dungla (345.69% in 1981-91), Gangrar (267.56% in 1991-01) and Badi Sadri (32.29%
in 2001-11) in which ST male rate is very high. The change of scheduled tribe female
literacy shows that, we have Chittaurgarh (-52.17% in 1981-91), Rashmi (844.56% in
1991-01) and Rawatbhata (-38.52% in 2001-11) in which ST female change rate is very
low. On the other hand we have Rashmi (658.29% in 1981-91), Dungla (3008.45% in
1991-01) and Badi Sadri (149.50 in 2001-11) in which ST female change rate is very
high.
Overall Literacy Pattern
The analysis has recorded wide range disparity among different types of
literacy. The data shows not only that the rate of literacy is low case of female, rural,
scheduled caste and scheduled tribe population but the difference among groups male-
female, rural-urban and scheduled caste, scheduled tribe is critically high. Special
efforts should be made not only to curb these gaps but also to increase overall literacy
rate so that dream of making the district a complete literate division be fulfilled.
The analysis shows that number of govt. schools with total enrollment, total
teachers, average number of teachers per school and pupil-teacher ratio. As far as
provision in infrastructure facilities are concerned, 1907 elementary schools and 1910
all grade schools have school buildings. Library facilities is available 1602 all grade
government schools of Chittaurgarh. Out of the total school, only 1919 all grade
government schools have girls toilet.
Efforts for Development in Literacy
Various schemes were introduced by the Central and State government through
their own support and with external assistance from time to time, but their remained
lack of continuity in terms of objectives, contents, mode of implementation and
operationalization of schemes. The Directorate of Literacy, implements literacy
programs along with non-formal education activities. It also provides education to all
those boys and girls who are unable to go for formal education is schools and belong to
6-14 age groups because of their social, economic and other reasons for considerations.
More emphasis is being laid on development of education on in the area through
various programs for e.g. Adarsh and Utkrist Vidhyalaya Yojana, State Initiative for
Quality Education, Activity Based Learning, Kasturba Gandhi Balika Vidhyalaya,
238
Sharda Girls Hostel, Residential Training, Community Mobilization, Information
Communication Technology Scheme, Vocational Education Program, School
Integration, Inclusive Education for Disabled at Secondary Stage, Staff Rationalization,
Swami Vivekanand Government Model Schools, Transport Voucher Scheme, School
Water Sanitation and Hygiene Education Program, Saakshar Bharat Program, Jan
Shikshan Sansthan, Mid-Day Meal Scheme, Scheme for Infrastructure Development in
Minority Institutes, Scheme to provide quality education in madrasas and Right to
Education, Samagra Shiksha etc.
Prospects in Literacy and Education
Having reached an effective literacy rate of 61.71 percent (76.61 percent for
males and 46.53 percent for females) in 2011, the area seems to have attained a
respectable place in terms of literacy but the prospects in the area of education is that
are-firstly, although in terms of effective literacy (aged 7 & above) the male-female
differentials have squeezed down. Secondly, promoting higher education requires
opening up higher education institutions, enrolling students and recruiting the faculty.
Thirdly, distribution of educated workers in different sectors of economy holds the key
to diversification of occupational structure of a society. Fourthly, of recent there had
been a growing demand in the area to allow greater access to the private sector in the
field of education with a view to achieve its expansion plans as well as to provide
competition for improving the quality of education in the area.
Policy Issues
The government efforts for universalization of education and comprehensive
literacy drive have yielded positive results. These efforts have helped in growth of
literacy rates and performance of the State in quantitative terms would be know after
availability of literacy rates of 2011. There are various issues which are still uncovered
and there is necessity to consider the significance of these aspects in overall
perspective. There is necessity of addressing various policy issues, which need attention
for sustainable growth of literacy rates. The objective of the program is to include all
children under education, where the number of non-nominated children is low and all
the illiterates are up to 35 years of age. However the situation of growth of literacy is
not an issue to covers only through the allocation of funds and opening of new primary,
239
upper primary, secondary and senior secondary schools as well as literacy centers.
There are various constraints in literacy program, which need to be addressed in the
requisite manner. For this purpose various policy measures are required to be taken at
the national and State level for addressing the quantitative and qualitative issues of
literacy, which are equally important and overlooking those would reflect over the
growth of literacy rate in sustainable manner, that are addressing the lacking areas,
quality of education, quality issues, the use of ICT in education remains limited, teacher
development and management, equity issues, drop out issues, governance and
management, budgetary constraints, coordination in government and private efforts etc.
The overall result of the present research has shown that the total literacy has
increased over the years. Though the literacy rate has increased in the district yet there
are only certain sections of society which have been benefited by this overall increase.
For example, in case of female, rural, scheduled caste and scheduled tribe, the position
of literacy is still critical.
6.2 Policy Issues
The government efforts for universalization of education and comprehensive
literacy drive have yielded positive results. These efforts have helped in growth of
literacy rates and performance of the State in quantitative terms would be known after
availability of literacy rates of 2011. These are various issues, which are still uncovered
and there is necessity to consider the significance of these aspect in overall perspective
of the Rajasthan in general and Chittaurgarh district in particular. There is necessity of
addressing various policy issues, which need attention for sustainable growth of literacy
rates. As a matter of fact the comprehensive literacy drive was started in the Rajasthan
for meeting various national expectations, which the literate people can shoulder in
benefited manner. With regards to Census terminology is concerned, the eligibility of a
literate person is capability of reading, writing in any of the regional or national
language and knowledge of simple arithmetic of daily use. These expectations of
literacy can be met in short duration literacy program. The objective of the program is
to covers all the children under education, where the number of non-enrolled children is
low and all the illiterates up to age of 35 years. The implementation of literacy
programs is being carried out by the State government through departments and private
efforts. If the process of implementation of universalization of education and
240
comprehensive literacy program is covered completely, there is every possibility to
covers large section of population under literacy covers. In ideal conditions
achievement of male literacy of 85 percent and female literacy of 75 percent is not
difficult to achieve for any district if the pace of implementation of education is carried
out in the envisaged manner. The logic behind the theme is existence of literates in age
group above 35 years and death of elder people in natural manner.
If all the districts are able to achieve the minimum level as estimated, the
districts much ahead the literacy level can also perform better in comparison to
backward districts in the sphere of literacy. However, the situation of growth of literacy
is not an issue to covers only through the allocation of funds and opening of new
primary and upper primary schools, secondary and senior secondary schools as well as
literacy centers. There are various constraints in literacy program, which need to be
addressed in the requisite manner. For this purpose various policy measures are
required to be taken at the national and State level for addressing the quantitative and
qualitative issues of literacy, which are equally important and overlooking those would
reflect over the growth of literacy rate in sustainable manner.
Addressing the Lacking Areas
The performance of literacy rates remained and slows as reflected in the literacy
rate of 2011 where male literacy rates increased from 71.50 to 76.61 percent and female
literacy increased from 36.00 to 46.53 percent and total literacy increased from 54.00 to
61.71 percent. The growth trends of literacy rates of 2011 are evident that even after
spending significant money from Central and state funds no performance could be
accelerated to the requisite extent. This situation is most humiliating to the total policy
makers of the State and performance of literacy program, where various claims were
made of sizeable step in enrollment of children and running of comprehensive literacy
program. The main cause of such a pity situation of the State is evident that no sincere
efforts were taken in all the programs of universalization of elementary education.
There is necessary of stocking of all the missing areas, which could not be attended in
the literacy program of the district.
The position of literacy rates of 2011 is evident that Chittaurgarh is further
lowered down in the rank of States in view of their slackness, which is mainly for lack
of initiative to achieve the success.
241
Quality of Education
Quality of education is the major area of concern of the districts as no efforts
could be made to improve the quality of education in schools. In this field, the
government schools lacks in the placement of teachers, as the mostly school were
building require major repairing and schools where one teacher is attending more than
60 children. The quality of teaching is affected most in these conditions but the
situation could not improve even after availability of significant funds from Central
government and externally aided project for school building. The State government
does not pay attention on quality of education at all the levels and the situation is worst
in far distant and difficult areas of State where teacher feel punishment post and
teaching suffers in view of reluctant attitude of unwilling teachers.
The general degradation of quality of education is reflected in competitive
examinations where children of Chittaurgarh district remain lagging behind to other
districts. Student getting excellent performance in studies and competition are due to
out of school efforts. Usually teachers avoid teaching in effective manner which helps
in personal benefit of money by group coaching of students, where government and
private teachers have common interest. In addition to school fees, parents have to bear
cost of private coaching of their children, which is quite burdensome to parents and
overall development of most of the children is affected in view of constant teaching.
Most of the children remain depressed with the study fewer from grass root education to
highest level.
Access and Participation
Expanding access to early childhood education is a high priority task to provide
equal opportunities to all children for better preparation for formal education. The
percentage of school children aged 6-13 years is much less than 2000 years. However,
the total number of school children is high. Compared to primary education, relatively
low enrollment rates in higher primary and secondary education are also a matter of
concern. It is a challenge to ensure universal secondary education from primary to
secondary and to ensure transition / mobility towards students from secondary to higher
secondary and tertiary education. The relatively slow progress in reducing the number
of non-literate continues is a concern. Chittaurgarh currently has the largest non-literate
242
population in the Rajasthan with the absolute number of non-literates among population
aged 7 and above being 510006 in 2011.
Quality Issues
The poor quality of education is a matter of great concern as a result of the
results of unsatisfactory learning. Defects related to quality such as unfair courses, lack
of trained teachers and ineffectual education is a major challenge related to pre-school
education. The biggest challenge facing school education is related to the unsatisfactory
level of learning in the student. Poor quality of learning in primary and upper primary
stages influences learning in the student at secondary level. The poor quality of learning
at the secondary level spreads over the years of college / university, resulting in poor
learning outcomes in the higher education sector.
Many factors contributed to the unsatisfactory quality of school education.
Some of these include: existence of a large proportion of schools that are not complaint
to the prescribed norms and standards for a school; student and teacher absenteeism;
serious gaps in teacher motivation and training resulting in deficiencies relating to
teacher quality and performance; slow progress in regards to use of information and
communication technologies in education; Sub-optimal personnel management, monitor
performance and insufficient attention to supervision etc. To provide good quality
education, the alleged failure of schools in the government system has started entering a
large number of private schools, many of which lack the necessary infrastructure,
learning environment and competent teachers.
Skills and Employability
It is necessary that through the youth education and training of the country, the
skill and knowledge of the workforce should be equipped. However, the institutional
arrangements to support technical and vocational education programs remain quite in
adequate. Formally linking the development of skills in vocational fields, and bringing
an academic equivalence to vocational accomplishments with avenues for horizontal
and vertical mobility of students has been attempted only recently. Need to focus on
promoting dignity and social acceptance of high quality professional training. A large
part of the education system's products are found to be lacking in employable skills.
This has greatly reduced the credibility of the higher education system. Many graduate
243
and postgraduate students do not get jobs in their respective fields. This task of
enhancing the employability of the products of the education system ought to accorded
high priority.
Curriculum and Assessment
The Curricular thrust that is needed for promoting the acquisition by students of
relevant skills required for decent work and a better life in a rapidly changing world. A
key challenge in this context is expanding opportunities to acquire relevant skills,
including the skills needed for work and entrepreneurship; Skills and competencies,
which allow learners to think critically, think creatively, think creatively, think critics to
be more creative and innovative, to think critically creative to communicate effectively;
and life skills which enable individuals to develop a responsible citizen and to adopt
cultural diversity, enable them to live and work harmoniously together, etc. The overall
assessment practices at the school and college level remain unsatisfactory. In most cases
the assessment of learning achievement continues to focus on rote learning and testing
the student's ability to reproduce content knowledge. The entire evaluation system
needs to be re-prepared to ensure the comprehensive evaluation of students, including
the results of learning related to both scholastic and co-scholastic domains.
Information and Communication Technology (ICT)
The potential of ICT in education has not been fully harnessed. The use of ICT
in education remains limited and there is a need to accelerate efforts of use ICT of
fostering quality education.
Teacher Development and Management
The current teacher education and training programs are considered
inappropriate in terms of equipping the teachers with the competencies required to cope
with the new profile and roles are expected of teachers and they are capable of
performing their duties in a variety of social, economic, cultural and technological
environments. This is a continuous mismatch between institutional capacity and
essential teacher supplies, which resulted in lack of teachers. The problem is acute in
the eastern part of the country where there is a huge backlog of untrained teachers. The
capacity to train teachers is also very limited in this area. Research experiment and
244
innovation in teacher education are very limited. These deficiencies have brought about
erosion in the professional identity of teachers and the status of teaching as a
profession. To improve the learning outcomes of students, there is a need to address
issues related to teachers' ability, motivation and accountability immediately.
Equity Issues
Regional disparities continue, as do difference in access depending on the socio-
economic background of students. The findings of significant and differences in the
average achievement levels of students between urban-rural, private-government,
general category- reserved category. They also indicate that urban students are
performing significantly better than rural students; in private unaided schools performed
marginally better than government schools; students from the general category and
OBC category performed better than the SC and ST students. These findings suggest a
serious challenge to the 'equity in learning' goals. Children from historically
disadvantage and economically weaker sections of society and first generation learner's
exhibit significantly lower learning outcomes. Most areas have made impressive
progress in terms of reduction in gender disparities in participation in primary and
upper primary stages of education. However, large disparities are maintained at senior
secondary level. Many girls are not sent to schools; and many people who complete
secondary education are not able to do their studies at the higher secondary level. The
interventions which are currently being made to bridge the gender and social category
gaps need to be stepped up, there is a need to work on more focused strategies for
facilitating effective inclusion and participation of girls and other special category
children. The relatively gender gaps in youth and adult literacy rates remain a principal
challenge.
Drop Out Issue
Even though the drop-out rates at elementary and secondary stages of education
have been declining, large number of children continues to leave the school before
completing elementary education. Dropout rates in secondary education remain high for
the learners especially in the socially and economically disadvantaged groups. Though
the dropout rate is a matter of concern in the case of all categories of students, drop-out
rates among socially and economically disadvantaged groups, especially for girls form
245
these groups. It focuses on the need for measures to improve the retention of children's
schools for socially and economically disadvantaged communities. Completing
primary, secondary and higher secondary education by all enrolled students is a high
priority task.
Governance and Management
Many studies have reported challenges in education administration, absent from
the absence of teachers, absentee funds flow in schools / colleges and administrative
capacities. Capacity constraints relating to effective programmer planning and
implementation continue to be a key issue. Consequently, the progress of
implementation of planned programmers remains uneven. The governance and
management of education system and institutions has assumed complexity with the
advent of a multiplicity of providers, programmers and modes of financing. It is
imperative to look at governance and management policies on the system as well as at
the institutional level.
Budgetary Constraints
Insufficient financing of education continues to contain efforts to expand access
to education and foster quality education. Several studies have reported the challenges
in education governance exemplified by the delayed found flows to school/college.
Shortfall in the funding has been a major constraint to the complete implementation of
some of the programmers designed to further expand school, higher and adult education
programs and to maintain a reasonable level of quality in education.
Coordination in Government and Private Efforts
There is no coordination in government and private efforts in imparting
education to children. Usually the private schools are raised in urban and semi-urban
areas, where parents have capacity to bear expenses of private schools. The private
schools not getting grant-in-aid from government meet all their expenses from fees
from children and manage various means like admission fees, laboratory fees, computer
learning fees, building charges and various others. They also manage money from
books and uniform which schools provide, under their own managed system. School
bus in another means of profit making to management, which in owned or hired by
246
schools. In addition to visible fees, low quality teachers add their profit, where names of
qualified teachers and teaching personnel are different.
There is common feeling among the people that private schools provide quality
education and ever the people of lower middle income group, try to teach their children
in private schools. Children enrolled in government schools develop heinous feeling for
incapability of their parents to manage their education through private schools. The
private schools on their part keep strict system of admission by entrance examination or
interview of child and parents for adjudging the capacity of parents to teach their
children at home. In addition, private schools manage pushing forward three to five
students through special efforts to get rank in board examination, which helps in
crowding schools and their business start prospering. One single school is added by
series of schools in other parts of city and this process continues.
Situation of government schools is quite pity as there is children from low
income parents, who can‟t afford private schools. Teachers take interest in private
coaching for children of their own schools or private schools. Teachers of some
disciplines life science, mathematics etc. bear supremacy over other teachers manage
their efforts in amicable manners. Such teachers try to manage their posting in urban
areas through all possible effort as private coaching is most remunerative task to them.
Well- off persons of rural areas manages education of their children in private school in
cities by hiring or purchasing house of their own.
The policy issue involve in raising schools in cities and semi-urban areas is
interest of private sector and government need to manage the situation in the manner,
where the government schools are more in unattended area to provide access to
education to more children. Residential private schools are opened in rural areas to
accommodate children of Village, which is also a profit making task for many persons
engaged in school education. No efforts from government side could be made to
coordinate in government and private schools. Such schools want recognition form the
government is not in a position to regulate system for coordinate in efforts to covers
larger area under education covers. The government needs to stress on quality of
education in their own schools, which is possible with sincere efforts. It is quite difficult
for the government to break coaching, which is only possible, if school education is
excellent in government schools.
247
6.3 Recommendations
The overall result of the present study has shown that the total literacy has
increased over the years in the district. In 1981, the total literacy was 21.97 percent and
the literacy rate has increased in 2011, is 61.71 percent. Although the literacy rate in the
district has increased. Every type of literacy was found to be positively associated both
with urban population and persons engaged in non-agricultural activities. On the overall
analysis, the present study recommends the followings:
(1) Special emphasis should be laid to increase the female literacy rate because a
literate female can change the whole environment of the house and society.
(2) Scheduled caste and scheduled tribe‟s needs proper attention to minimize the
literacy gap. There is found a rapid growth in last decades in literacy rate, but
the literacy rates are not enough.
(3) More rural people should be made educated about the importance of education
and they can become the part of economy. The literate people of the Villages
can be grouped together to unveil the blessings of education to earn better
livelihood.
(4) There is a great need to establish centers of vocational education in rural areas,
like horticulture, intensive agriculture, modern farming techniques, animal
husbandry, leather work, carpentry etc. Such a vocational educational will be of
great use to the rural people and will also not influence them towards urban
migration to seek jobs. Thus farming education will be of great use in the tribal
areas.
(5) Total literacy mission should also be followed up by various other programs so
that the people can take full advantage of education. Here the objective should
not be to increase the numbers of literate persons only but these neo-literates
should contribute towards increasing the human welfare and benefit of the
society. Education is meant to uplift the thinking process of individuals and their
contribution to the society. Education is meant to uplift the thinking process of
individuals and their contribution to the society. Education can lead them for
better skills in their own field of live hood.
248
(6) It is apparent from the present studies that present study that formal education is
directly related to the means of transport. Schools which are far distant from the
Villages are least attended due to transport difficulties. Here, there is a need to
construct all type roads in rural areas.
(7) The system of providing mid-day meals to children is extended to more areas so
that the children are better nourished and also feel an attraction towards schools.
(8) There should be proper committee of keeping watch on the system of education
time to time and provide the proper administration system.
(9) Government should have take appropriate action to provide adequate funds to
the government schools and colleges for their basic needs and basic
infrastructure like classrooms, chairs, benches, blackboard, light, water,
sanitation, toilets, computer lab, books in libraries, internet etc.
(10) There is need to establish adequate number of schools and colleges in rural
areas. These educational institutes need adequate number of teachers also.
(11) Education amenities should be established in low levels class Villages,
especially those Villages which have not even a single institution. This is
necessary to provide basic educational amenities in every Village of the area for
economic and social upliftment of tribal. Adult literacy should be functional and
result oriented.
(12) It is also recommended that government should take active steps to accelerate by
the proper utilization of human resources by establishing and creating
organizational steps which will be provide economic opportunities to the people
of the region.
(13) To create more manpower of trained women teaching staff by having women
teachers training colleges in all the district head quarters and providing more job
opportunity to female candidate.
249
RESEARCH SUMMARY
Literacy is one of the most important indicators of socio-economic and political
development of a society. It is a major component of human resource development and
is thus basic of any programmed of social and economic development.
In last two decades there is a tremendous development in the area of literacy but
the lower community of the society has been less benefited. Even today, millions of
people in the remote areas are illiterate, if efforts made by the government sector used
in the right direction can be eliminated illiteracy at a lower cost at a lower cost.
According to United Nations Population Commission literacy means “Literacy is
the ability of person to read and write understanding short simple Statement of his
everyday life ‟‟.
In democratic nations like India, citizens have some fundamental rights. All these
rights provide to its citizen rights of respectable and free life. Out of this one right is
"right of education" also. By 86th constitutional amendment, 2001, a new Para 21 (A)
has been added which provide that the State by making law will manage to provide free
and compulsory education to all children of age 6 to 14 years.
Literacy an important tool for communication, learning and information, is a
virtual precondition for an individual's evolution and national development. Research
studies on human cognitive development have established that literacy enhances the
critical faculties and enables to reflect on the existential reality in which they have been
placed. It promotes objectivity, capacity for clear perception, thought logical and
coherent analysis. It promotes the sense of history and helps in combining personality
with universality. In this sense, literacy can be regarded as inalienable fundamental
rights.
Literacy in the district is the most basic indicator of socio-economic progress. The
UNESCO defines a literate person as "the one who has acquired all the essential
knowledge and skills which enable him/her to engage in all those activities in which
literacy is required for effectives functioning in his/her group and community and those
attaining in reading, writing and numeracy make it possible to use these skills towards
his/her own his/her community's development.
250
The Census of India has defined literacy rates as a crucial measure to enhance a
region's human prosperity. Literacy discharges many functions in the society, that is;
Socialization,
Communication knowledge and information,
Contribution to social, political and economic development,
Development of human resources,
Character building and personality development,
Social, ethical and democratic control.
The study thus, aims to highlight how the reformations in a literacy system in the
district have led to the changes in its socio-economic and Geographic structure. But
change in scenario has also led to some adverse impacts in the district in terms of
uprising social problems. In view of above discussions, the study attempts to present the
holistic picture of the pattern of literacy system in Chittaurgarh district. This study is an
interpretative and analytical investigation of the impacts of literacy system on the
community of the district, affecting the economic, social and cultural development of
the place. The main objectives of the present research work, therefore, may be
summarized as follows:-
– To study the growth of literacy, rated and development like demographic, social
and economic structure.
– To study the level of rural- urban literacy rates.
– To study the level of Scheduled Caste and Scheduled Tribe literacy rates.
– To study the various literacy programs in Chittaurgarh district and their
consequences. Review the achievements attained by the promotional literacy
programmers and educational development done in the region.
– To assess the gap of male - female literacy rate.
– To study the current educational status of Chittaurgarh district.
– To analyze the possibilities of future progress of literacy rate in Chittaurgarh
district. And evaluate the causes of low literacy rate in the region. Access the
areas which are most affected from lower literacy rate.
251
– To suggest the appropriate strategies designed for the eradication of problems.
– To develop a strategy to make Chittaurgarh district a complete literate district.
As an educator, one is given the responsibility of cultivating and strengthening
minds. An essential element of this task is ensuring students are literate. According
early literacy is defined as "what children know about reading and writing before they
actually read or write. Digital literacy is the ability to use ICT to find, evaluate,
construct and communicate information, requiring both experimental and technical
skills. Culturally relevant literacy is essential to ensuring that students receive the
quality education that they deserve.
During the last 60 years there has been an appreciable continuous increase in the
level of literacy as from 7.07 percent in 1951; it has risen to 61.71 percent in 2011
Census. When we examine the progress of literacy in 20th Century, it was slow till 1951.
The post 1951 period association with quickening pace of the urbanization process,
opening of a very large number of new schools, social awareness about especially girls
education development, new technology in schools and society, increasing educational
facilities along with availability of female teachers in abundance particularly in rural
areas, increasing value of female education for matrimony, increasing degree of socio-
economic awareness, waning social taboos and prejudices against female education,
Scheduled Tribe and Caste.
The analysis has recorded wide range disparity among different types of literacy.
The data shows not only that the rate of literacy is low case of female, rural, scheduled
caste and scheduled tribe population but the difference among groups male-female,
rural-urban and scheduled caste, scheduled tribe is critically high. Special efforts should
be made not only to curb these gaps but also to increase overall literacy rate so that
dream of making the district a complete literate division be fulfilled.
The analysis shows that number of govt. schools with total enrollment, total
teachers, average number of teachers per school and pupil-teacher ratio. As far as
provision in infrastructure facilities are concerned, 1907 elementary schools and 1910
all grade schools have school buildings. Library facilities is available 1602 all grade
government schools of Chittaurgarh. Out of the total school, only 1919 all grade
government schools have girls toilet.
252
Various schemes were introduced by the Central and State government through
their own support and with external assistance from time to time, but their remained
lack of continuity in terms of objectives, contents, mode of implementation and
operationalization of schemes. The Directorate of Literacy, implements literacy
programmed along with non-formal education activities. It also provides education to
all those boys and girls who are unable to go for formal education is schools and belong
to 6-14 age groups because of their social, economic and other reasons for
considerations. More emphasis is being laid on development of education on in the area
through various programmed for e.g. Adarsh and Utkrist Vidhyalaya Yojana, State
Initiative for Quality Education, Activity Based Learning, Kasturba Gandhi Balika
Vidhyalaya, Sharda Girls Hostel, Residential Training, Community Mobilization,
Information Communication Technology Scheme, Vocational Education Program,
School Integration, Inclusive Education for Disabled at Secondary Stage, Staff
Rationalization, Swami Vivekanand Government Model Schools, Transport Voucher
Scheme, School Water Sanitation and Hygiene Education Program, Saakshar Bharat
Program, Jan Shikshan Sansthan, Mid-Day Meal Scheme, Scheme for Infrastructure
Development in Minority Institutes, Scheme to provide quality education in madrasas
and Right to Education, Samagra Shiksha etc.
Having reached an effective literacy rate of 61.71 percent (76.61 percent for males
and 46.53 percent for females) in 2011, the area seems to have attained a respectable
place in terms of literacy but the prospects in the area of education is that are-firstly,
although in terms of effective literacy (aged 7 & above) the male-female differentials
have squeezed down. Secondly, promoting higher education requires opening up higher
education institutions, enrolling students and recruiting the faculty. Thirdly, distribution
of educated workers in different sectors of economy holds the key to diversification of
occupational structure of a society. Fourthly, of recent there had been a growing
demand in the area to allow greater access to the private sector in the field of education
with a view to achieve its expansion plans as well as to provide competition for
improving the quality of education in the area.
The government efforts for universalization of education and comprehensive
literacy drive have yielded positive results. These efforts have helped in growth of
literacy rates and performance of the State in quantitative terms would be know after
availability of literacy rates of 2011. There are various issues which are still uncovered
253
and there is necessity to consider the significance of these aspects in overall
perspective. There is necessity of addressing various policy issues, which need attention
for sustainable growth of literacy rates. The objective of the program is to include all
children under education, where the number of non-nominated children is low and all
the illiterates are up to 35 years of age. However the situation of growth of literacy is
not an issue to covers only through the allocation of funds and opening of new primary,
upper primary, secondary and senior secondary schools as well as literacy centers.
There are various constraints in literacy program, which need to be addressed in the
requisite manner. For this purpose various policy measures are required to be taken at
the national and State level for addressing the quantitative and qualitative issues of
literacy, which are equally important and overlooking those would reflect over the
growth of literacy rate in sustainable manner, that are addressing the lacking areas,
quality of education, quality issues, the use of ICT in education remains limited, teacher
development and management, equity issues, drop out issues, governance and
management, budgetary constraints, coordination in government and private efforts etc.
The overall result of the present research has shown that the total literacy has
increased over the years. Though the literacy rate has increased in the district yet there
are only certain sections of society which have been benefited by this overall increase.
For example, in case of female, rural, scheduled caste and scheduled tribe, the position
of literacy is still critical.
Durga Kadel
254
References and Bibliography
Adisehia, M.S. (1981): "Adult Education faces Inequalities" Sangam Publishers, Madras.
Adinarisayan, P.Reddy (2004): "Literacy Retention & Socio-Economic Development", Sarup & Sons, New Delhi.
Adiseshia, M.S. (1994): "Education as a Tool for Economic Change", Yojana, pp. 18-20, Vol. 38.
Aggarwal, S.N. & Sinha, U.P. (1985): "Indian Population Problems,"Tata McGraw Hill Publishing Company Ltd., New Delhi, pp. 160-171.
Aggarwal, Y.P. & Murlidhar, V. (1986): "A Temporal Analysis of Literacy between Scheduled Castes and Non-Scheduled Castes Population in Maharashtra," (ed.) Education & Regional Development, Yatan Publication, New Delhi, pp. 271-295.
Ahmad, A. (1982): "Inter-Regional Inequity in Literacy Levels of Tribals & Caste Segments of Population in India, 1971," NIEPA, New Delhi.
Ahmad, A. (1986): "Socio-Cultural Change in a Developing Society: The Case of India", (eds.) M. Shafi & Mehdi Raza, Spectrum of Modern Geography, Concept Publishing Company, New Delhi, pp. 243-268.
Ansari, N.A. (1976): “Evaluation Study of Adult Literacy Project in the Union
Territory of Delhi", NCERT, New Delhi.
Ansari, N.A. (1984): "Adult Education in India," S.Chand & Co. Ltd. New Delhi.
Arun C. Mehta (2010): "Elementary Education in India Analytical Report 2007-08", National University of Educational Planning and Administration, New Delhi.
Banerjee, M. (1975): "Literacy in Singhbum, Bihar", Geographical Review of India, pp. 151-157, Vol. 37 No. 2.
Banerjee, R. (1997): "Why does not Children Complete Primary School: A Case Study of Low Income Neighborhood in Delhi?” Economic and Political Weekly, Vol.
XXXIV, No. 32, pp. 2053-2063.
Bell, W. James (1967): "A Comparison of Dropouts and Non-Dropouts on Participation in Social Activities", the Journal of Educational Research Vol. 60, No. 6, 248-251.
Betaille (1976): "A Turning Point for Literacy Proceedings of the International Symposium for Literacy", Paragon Press Oxford.
Bhandari, R.K. (1985): "Better Education, Better Nation, Yojana, Vol. 29, No. 7, pp.
4 - 8.
255
Bhardwaj, P.D. (1999): "Literacy in Himachal Pradesh", Population Geography, Vol. 21, No. 1 & 2, pp. 31-42.
Bhattacharya, A. (1978): "Population Geography of India, Shree Publishing House, New Delhi.
Bhatia, S.C. & Patel, B.K. (1983): "Research in Adult Education, Indian Adult Education Association, New Delhi.
Bhatnagar, Suresh (1983): "Indian Education: Today & Tomorrow," Loyal Book Depot, Near Govt. College, Meerut, pp. 80-89.
Bishwas, A., Dutta, S. & Singh, R.R. (1976): "The New Education Pattern in India," Vikas Publishing House Pvt. Ltd., New Delhi.
Bordia, Anil (ed.) (1975): "Formers Training & Functional Literacy, Indian Adult Education Association," New Delhi.
Carron, G. & Ngoc, C.T. (eds.) (1980): "Regional Disparities in Educational Development: A comparative Issue, International Institute for Educational Planning", UNESCO Press, Paris.
Chandra, R.C. (1980): "Distributional Pattern of Scheduled Caste Population in India," Population Geography, Vol. 2, No. 1, pp.78-79.
Chandra, R.C. (1986): "A Geography of Population: concepts, Determinants and patterns," Kalyani Publishers, New Delhi, pp. 171-186.
Chandra, R.C. & Sidhu, M.S. (1980): "Introduction to Population Geography", Kalyani Publishers, New Delhi, PP. 96-108.
Chaubey, P.K. & Chaubey, G. (1998): "Rural - Urban Disparity in Literacy: Inter-State Variation in India", Indian Journal of Regional Science, Vol. 30, No. 1, pp. 22-39.
Chib, S.S. (1994): "Changing Literacy Pattern in the Trans-Himalayan Tribal Tract of Kinnaur (H.P.): A Geographical Focus," The University Review (Jammu), pp. 49-62.
Chitnis, S. (1972): "Education for Equality: Case of Scheduled Castes," Economic & Political Weekly, Vol. 7, No. 31 & 33, pp. 1675-1681.
Chitnis, S. (1974): "Literacy and Educational Enrollment Among Scheduled Castes of Maharashtra", Tata Institute of Social Sciences, Bombay.
Clarke, J.I. (1972): "Population Geography", Pergamon Press.
Das, K. (1986): "Development of Education in India", Kalyani Publishers, New Delhi.
256
Datt, R. (1996): "Inequalities in Educational Development with Special Reference to Literacy Status and School Education", Journal of Educational Planning and Administration, Vol. 9, No. 3, PP. 225-269.
D' Souza & Victor, S. (1980): "Rural-Urban Disparity: Education", Demography India, Vol. 11, No. 2, pp. 202-205.
Disouza & Victor, S. (1982): "Urbanization & the Rural-Urban Difference in Literacy", Paper Presented at the Conference of the Indian Association for Population.
Devi, D.R. (1991): "Literacy: A Study of South Indian Districts", Demography India, Vol. 20, No. 1, pp. 103-112.
Dube, R.S. & Mishra, R.P. (1981): "Level of Education: A Versatile Indicator of Regional Development", Geographical Review of India, Vol. 43, No. 3, pp. 278-281.
Dutta, G. (1982): "Analysis of Literacy Rates in Southern District of West Bengal", Geographical Review of India, Vol. 44, No. 2, pp. 19-26.
Dutta, R.C. (1977): "Income Distribution and Economic Development in India since 1950-51", Indian Economic Journal, Vol. XXV, No. 2, pp. 140-164.
Dutta, S.C. (1962): New Dimensions in Social Education, Indian Adult Education Association, New Delhi.
Evevett, J.M. (1978): "Women and Social Change in India," Heritage Publishers, New Delhi.
Fraja, G.D. (2001): "Education Policies: Equity, Efficiency and Voting Equilibrium," The Economic Journal, Vol. III, No. 477, pp. 104-119.
George, A. (1978): "Literacy: Doorway to Liberation", Geographical Review of India, Vol. 4, pp. 134-143.
Ghosh, P.K. (1997): "Problems of Primary Education in West-Bengal", Yojana, Vol. 41 No. 9, pp. 25-27.
Ghosh, M. (2006): "Economic Growth and Human Development in Indian States", Economic and Political Weekly, Vol. XII, No. 30, pp. 3321-3329, 2006.
Gill, M.S. (1992): "Literacy in Punjab", the Geographer, Vol. 39, No.-1, pp. 41-53.
Golden, H.H. (1955): "Literacy & Social Change in Underdeveloped Countries", Rural Sociology, Vol. 20, pp. 1-7.
Gosal, G.S. (1964): "Literacy in India: An Interpretative Study", Geographical Review of India, Vol. 29, pp. 276-285.
Gosal, G.S. (1964): "Literacy in India: An Interpretative study", Rural Sociology, Vol. 29, No. 3, pp. 261-277.
257
Gosal, G.S. (1979): "Spatial Perspective on Literacy in India", in Mukerji, A.B. & Ahmad, A. (eds.), India Culture Society and Economy & Geographical Essays, Inter-India Publications, New Delhi, pp. 362-379.
Gosal, R.P.S. (1980): "Literacy in India‟s Scheduled Caste Population: A Geographical
Analysis", Population Geography, Vol. 23, No. 1 & 2, pp. 29-40.
Govinda, R. (2005): "Elementary Education: Progress and Challenges,”Yojana, Vol. 49.
Hajela, P.D. (1966): "Significance of Education in Social Development", Yojana, Vol. 40, no. 1, pp. 26-27.
Hazara, J. (1997): "Women & Literacy," Geographical Review of India, Vol. 59, No. 1, pp. 62-74.
Husain (1970): "Education Status and Differential Fertility in India", Social Biology, pp. 132-139.
Jalan, Jyotsna & Elena, G. (2005): "Improving Primary School Education in India: An impact Assessment of DPEP-1,” World Bank, Washington DC, and Mimeo.
Jolly, K.G. (1991): "Strategies to Attain Universal Literacy in India by 2001," Demography India, Vol. 20, No. 1, pp. 141-154.
Joshi, H. (2002): "Gender Related Education Development in Rajasthan 2000: A Geographical Analysis at Panchayat Samiti level, “Transactions, Institute of Indian Geographers, Vol. 24, No. 1-2, pp.11-12.
Kamat, A.R. (1972): "Primary Education: Participation and Wastage" Economic and Political Weekly, Vol. 7, No. 18.
Kaur, B. (2003): "Gender Disparity in Literacy in the Indian Punjab: 2001", the Education Review, pp. 6-9.
Khan, A.Q. (2004): "Regional Imbalances & Changing Pattern of Literacy in Jammu & Kashmir State (1961-2001)", Population Geography vol. 26, no. 1 & 2, pp. 49-60.
Kingdon, G.G. (2001): "The Gender Gap in Educational Attainment in India: How much can be Explained?” The Journal of Development Studies, Vol. 39, No. 2, pp. 25-53.
Kothari, Sadhana (1992): "Male-Female Literacy Differential- Among the Scheduled Tribe Population of India: 1961-1981", Paper Presented in IGU Congress at Washington D.C., U.S.A.
Krishan, G. (2002): "Women in Regional Education in India", Population Geography, Vol. 24, No. 1 & 2, pp. 99-104.
258
Krishan, G. & Chandna, R.C. (1974): "Patterns of Literacy in Haryana", Punjab University Research Bulletin (Arts), Vol. 5, No. 2, pp. 95-104.
Krishan, G & Shyam, M. (1973): Spatial Perspectives on Progress of Female Literacy in India", Geographical Review of India, Vol. 2, No. 1, pp. 52-57, 1973.
Krishan G. & Shyam, M (1977): "Literacy in India" Geographical Review of India, Vol. 39, pp. 117-25.
Kundu, A. & Raa, J.M. (1982): "Inequity in Educational Development Issues in Measurement Changing Structure and its Socio-Economic Correlates with Special Reference to India", Paper Presented at Regional Workshop on long-term Educational Planning, NIEPA New Delhi.
Mathur, B.B. (1985): "Geography of Literacy in India, A Bibliographical Note,” The
Avadh Journal of Social Sciences, Vol. 2, pp. 148-151.
Mcdougall (2000): "Gender Gap in Literacy in Uttar Pradesh: Questions for Decentralized Educational Planning", Economic and Political Weekly, Vol. XXV, No. 19, pp. 1649-58.
Mehta, B.C. (1996): "Free Primary Education", Economic and Political Weekly, Vol. XXXI, No. 16 & 17, pp. 1035.
Meenaxi, J. (2007): "Women Literacy in India" Omega Publications, New Delhi.
Mishra, L. (1988): "Literacy - A Victim of Many Prejudices, Literacy and learning", Directorate of Adult Education, Government of India, New Delhi, pp. 37-47.
Mishra, L. (1998): "National Literacy Mission: Retrospect and Prospect", Economic and Political Weekly, Vol. XXXIII, No. 44, pp. 2807-15.
Mishra, Ashok (1979): "The Status of Women: Literacy and Employment Progress of Womens Studies", Allied Publishers, New Delhi.
Mohanty, B.B. (2003): "Educational Progress of Scheduled Tribes: A Discursive Review", Man and Development, Vol. xxv, No. 2, pp. 91-106.
Moonis Raza, Ahmad A. & Nuna, S.C. (1985): "Educational development in India: Some Aspects of Equity", Second National Conference of IAEP, New Delhi Jan 5-6.
Mukerji, A.B. (1968): "Spatial Patterns of Literacy in Andhra Pradesh India International Geographical Congress, pp. 181-186.
Nanda, S.K. (ed.) (1991): "Indian Education and Its Problem Today, Kalyani Publishers, New Delhi, Vol. 111.
Narasimhan, R. (2004): "Characterizing Literacy - A Study of Western and Indian Literacy Experiences", Sage Publications, New Delhi.
259
Nayantara, S. (1993): "Education for the Girl Child", Yojana, Vol. 37, No. 10, pp. 9-13.
NIEPA (1983): "Women's Education in India: The Regional Dimensions", New Delhi.
Pal, M.N. (1975): "Regional Disparities in the Level of Education", Indian Journal of Regional Science, Vol. 11, No.1, pp. 12-38.
Paramita Majumdar (1999): "Spatial Patterns of Literacy in West Bengal: District Wise Analysis of 1991." Geographical Review of India, Vol. 61 No. 2, pp. 165-172.
Parwlekar, R.V. (1939): "Literacy in India," Mc Millan & Co.London, Chapters - 3 & 5.
Petrov, V. (1985): "Literacy and Education in India" Spotlight on Population, Progress Publishers, Moscow.
Prakash, Aggarwals Yash (1988): "Universalization of Elementary Education and Its Implications" Occasional Paper No.14, NIEPA, New Delhi.
Pundir, J.K. (1997): "Changing Patterns of Scheduled Caste", Rawat Publication, Jaipur.
Raju, S. (1988): "Female Literacy in India: The Urban Dimension", Economic and Political Weekly, Vol. XXIII, No. 44, pp. 57-64.
Raju, S. (2002): "Literacy in India: Current Scenario and Changes during the Last Decade", Demography India, Vol. 31, No. 1, PP. 51-64.
Ram, S. & Dabral, B.M. (1995): "Progress and Pattern of Literacy in Lahul and Spiti, (H.P.)", Geographical Review of India, Vol. 247, No. 2, PP. 22-27.
Rangachar, B. (1996): "Challenges for Education in the New Millennium", Regional and Society, Vol. 47, No. 1, pp. 128-38.
Rao, Nitya (1993): "Total Literacy Campaign: A Field Report", Economic and Political Weekly, Vol. XXVIII, No. 19, pp. 914-15.
Raza, M. & Aggarwal, Y.P. (1988): "An Analysis of Inequalities in the Levels of Literacy in India", in Raza, M. (ed.), Regional Development (Contributions to Indian Geography), Heritage Publishers, New Delhi, pp. 385-403.
Reddy, U.B. (1985): "Regional Disparities in Educational Development in India: An Inter-State Analysis", Geographical Review of India, Vol. 47, No. 2, pp. 22-27.
Ryba, R. (1979): "Territorial Patterns of Diversity in Education", Comparative Education, Vol. 15.
Sachhidananda (1968): "Education and Changes in Social Values," Man in India, Vol. 48, pp.68-71.
260
Sagar, P. (1990): "Spatial Patterns of literacy in India: 1981", Department of Geography, Punjab University- Chandigarh.
Sagar, P. (1981): "Regional Disparities in Literacy of India, 1981", Asian profile, Vol. 19, no. 3, pp. 253-66.
Samanta, G. (2003): "Gender Disparity in Literacy is West-Bengal,” The Deccan
Geography, Vol. 41, No. 1, pp. 31-42.
Sangwan, R.S. & Sangwan, Sneh (1995): "Sex Disparity and the Levels of Literacy Haryana: A Spatial Analysis", East-West Geographer, Vol. 6, No. 1, pp. 31-66.
Sapra, C.L. & Aggarwal, Yash (ed.) (1987): "Education in India: Some Critical Issues", National Book Organization, New Delhi.
Schuth, S.Katarina (1980): "Village Literacy and Its Correlates: A Mysore Case Study," in David E. Sopher (ed.) an Exploration of India: Geographical Perspective on Society and Culture, Cornell University Press, Ithaca, New York, pp. 191-212.
Schwartzberg, J.E. (1961): "Observations on the Progress of Literacy in India: 1951-61", Indian Population Bulletin, Office of the Register General, India, New Delhi, pp. 295-300.
Sen Gupta, P. (2002): "Enrollment, Drop Out and Grade Completion of Girl Children in West Bengal," Economic and Political Weekly Vol. xxxvii, No. 17, pp. 1621-37.
Shah, Maya (1981): "Economic Factors Explaining Variations in Literacy Rates in Rural Areas: A Case Study of Gujarat, University of Baroda.
Shah, S.Y. (1989): A Source Book on Adult Education: Directorate of Adult Education, Government of India, New Delhi.
Sharma, H.N. (2004): "Geographic Perspective on Literacy and Educational Levels in North-East India", in Neelam Grover & K.N. Singh (ed.) Cultural Geography: Form and Process, Concept Publishing Company, New Delhi.
Sharma, J.C. (1968): "Literacy in Western Rajasthan", Selected Papers, 21st International Geographical Congress, pp. 230-50.
Sharma, K.L. (1974): "Educational Inequalities among Rajasthan Scheduled Caste," Economic and Political Weekly, Vol. IX, No. 37, pp. 1589-92.
Siddiqui, F.A. (1977): "The Geography of Literacy in U.P.", Geographical Review of India, Vol. 39, No. 4, pp. 374-388.
Singh, D. (1977): "Literacy in Indian Cities," Indian Geographical Review, Vol. 42, pp 1-8.
Singh, N.K. (1979): "Education and Social Change", Rawat Publication, Jaipur.
261
Singh, Nina (1998): "Female Literacy in India: The Emerging Trends," Population Geography, Vol. 20, No. 1 & 2, pp. 23-36.
Singh, S.N. (1991): "Tribal Education In India", Uppal Publishing House, New Delhi.
Sobti, Renu (1998): "Education and Nutrition", Yojana, Vol. 42, No. 10, pp. 38-41.
Soper, D.E. (1980): "Sex Disparity in Indian Literacy", in Sopher, D.E. (ed.), An Exploration of India Geographical Perspectives on Society and Culture, Cornell University Press, Ithaca, New York, pp. 130-188.
Sundararaman, S. (1996): "Literacy Campaigns: Lessons for Women‟s Movement",
Economic and Political Weekly, Vol. XXXI, No. 2, pp.1193-97.
Tilak, B.G. (2004): "Free and Compulsory Education: Legislative Intervention", Economic and Political Weekly, Vol. XXXIV, No. 7, pp. 618-20.
Trewartha, G.T. (1977): "Tribals: Role of Women", Vol. 19, No. 33, pp. 23-24.
Vyas, V.S. (1967): "Factor influencing the Levels of Literacy", Arthvikas, Vol. 3, No. 1, pp. 15-18.
Williamson, W. (1977): "Patterns of Educational Inequality in West Germany", Comparative Education, Vol. 13, pp. 29-44.
Books
Singh, S.M. (2007): "Educational development in India", Adhyayam Publications, New Delhi.
Singh, S.M. (2007): "Education in Emerging Global Society,” Adhyayam Publications
New Delhi.
Chandna, R.C. (2018): Population Geography
Websites
www.onefivenine.com
https://azimpremjifoundation.org/
https://www.census2011.co.in/
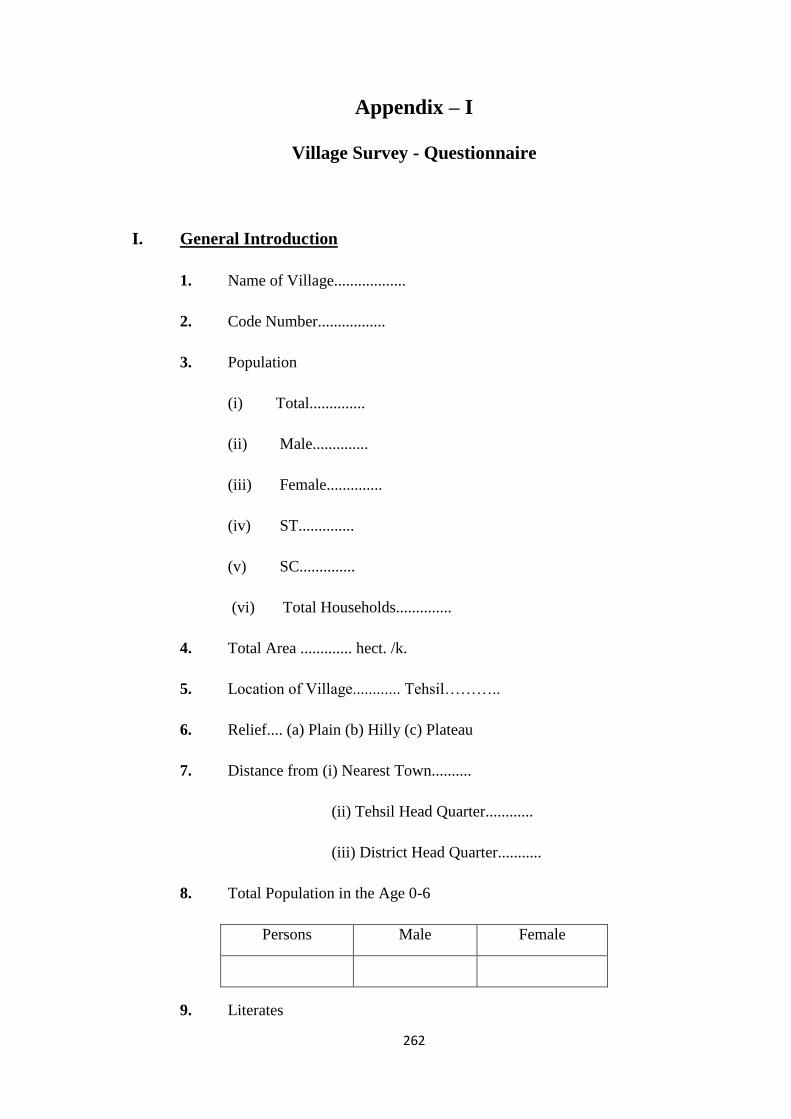
262
Appendix – I
Village Survey - Questionnaire
I. General Introduction
1. Name of Village..................
2. Code Number.................
3. Population
(i) Total..............
(ii) Male..............
(iii) Female..............
(iv) ST..............
(v) SC..............
(vi) Total Households..............
4. Total Area ............. hect. /k.
5. Location of Village............ Tehsil………..
6. Relief.... (a) Plain (b) Hilly (c) Plateau
7. Distance from (i) Nearest Town..........
(ii) Tehsil Head Quarter............
(iii) District Head Quarter...........
8. Total Population in the Age 0-6
Persons Male Female
9. Literates
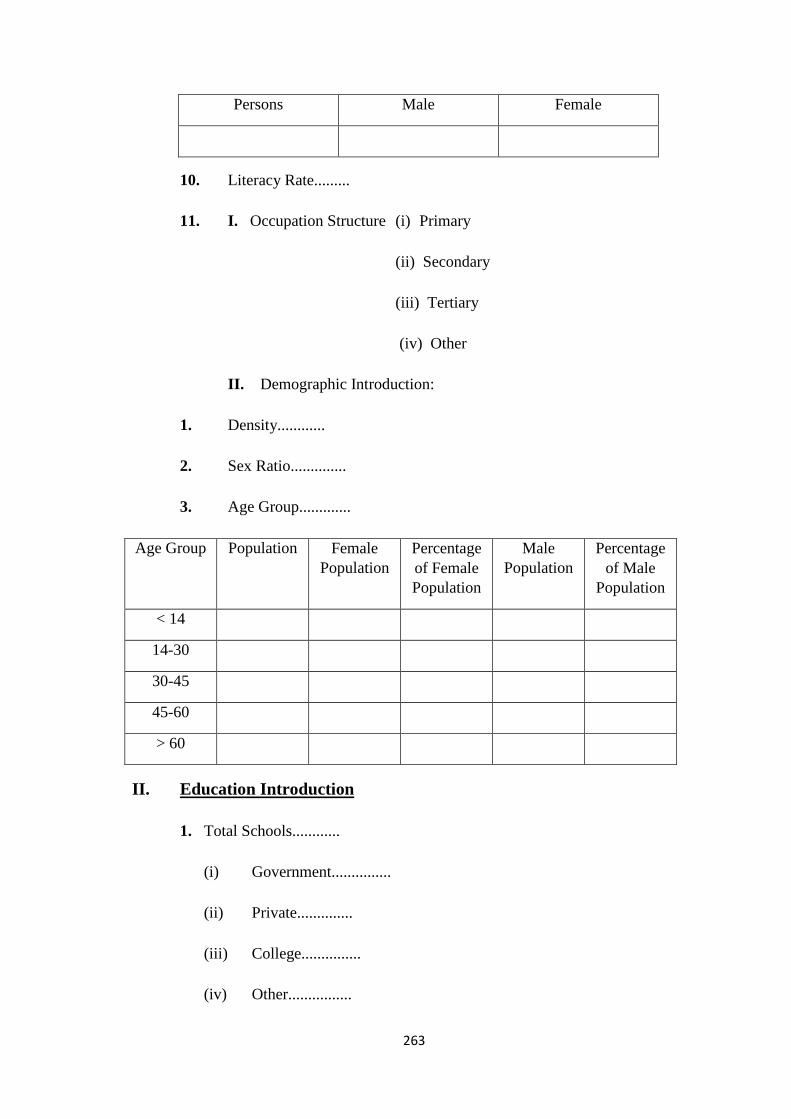
263
Persons Male Female
10. Literacy Rate.........
11. I. Occupation Structure (i) Primary
(ii) Secondary
(iii) Tertiary
(iv) Other
II. Demographic Introduction:
1. Density............
2. Sex Ratio..............
3. Age Group.............
Age Group Population Female Population
Percentage of Female Population
Male Population
Percentage of Male
Population
< 14
14-30
30-45
45-60
> 60
II. Education Introduction
1. Total Schools............
(i) Government...............
(ii) Private..............
(iii) College...............
(iv) Other................
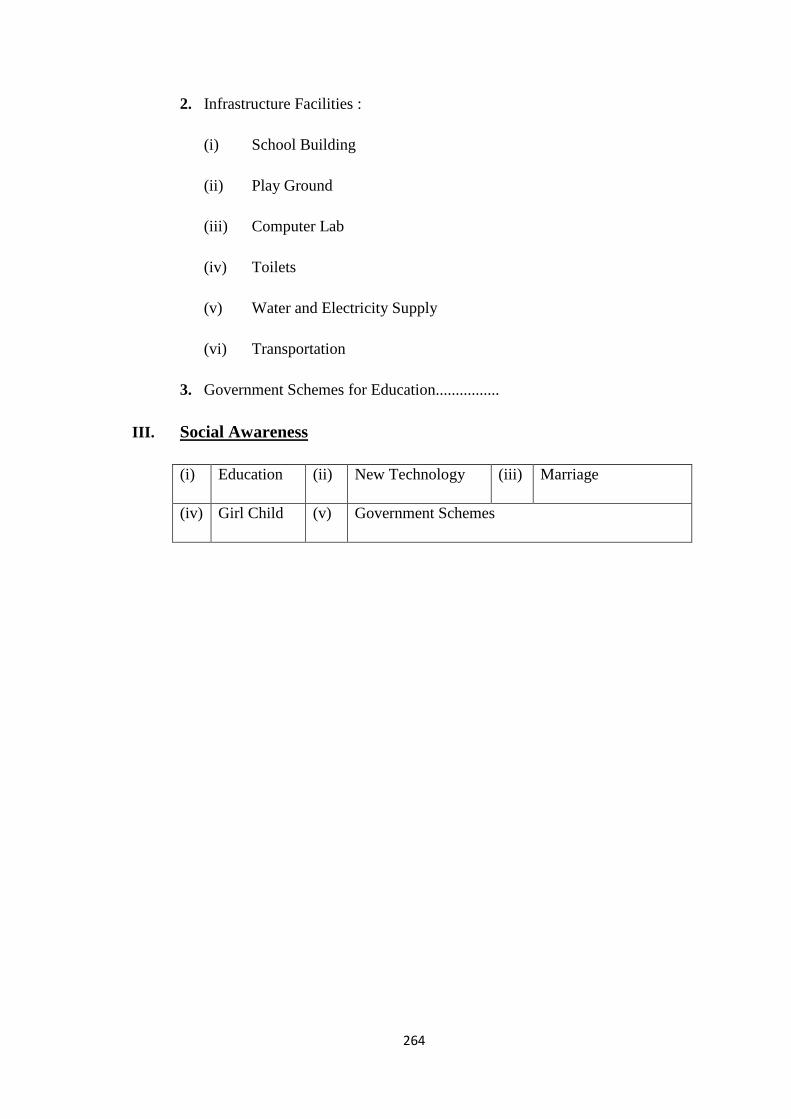
264
2. Infrastructure Facilities :
(i) School Building
(ii) Play Ground
(iii) Computer Lab
(iv) Toilets
(v) Water and Electricity Supply
(vi) Transportation
3. Government Schemes for Education................
III. Social Awareness
(i) Education (ii) New Technology (iii) Marriage
(iv) Girl Child (v) Government Schemes
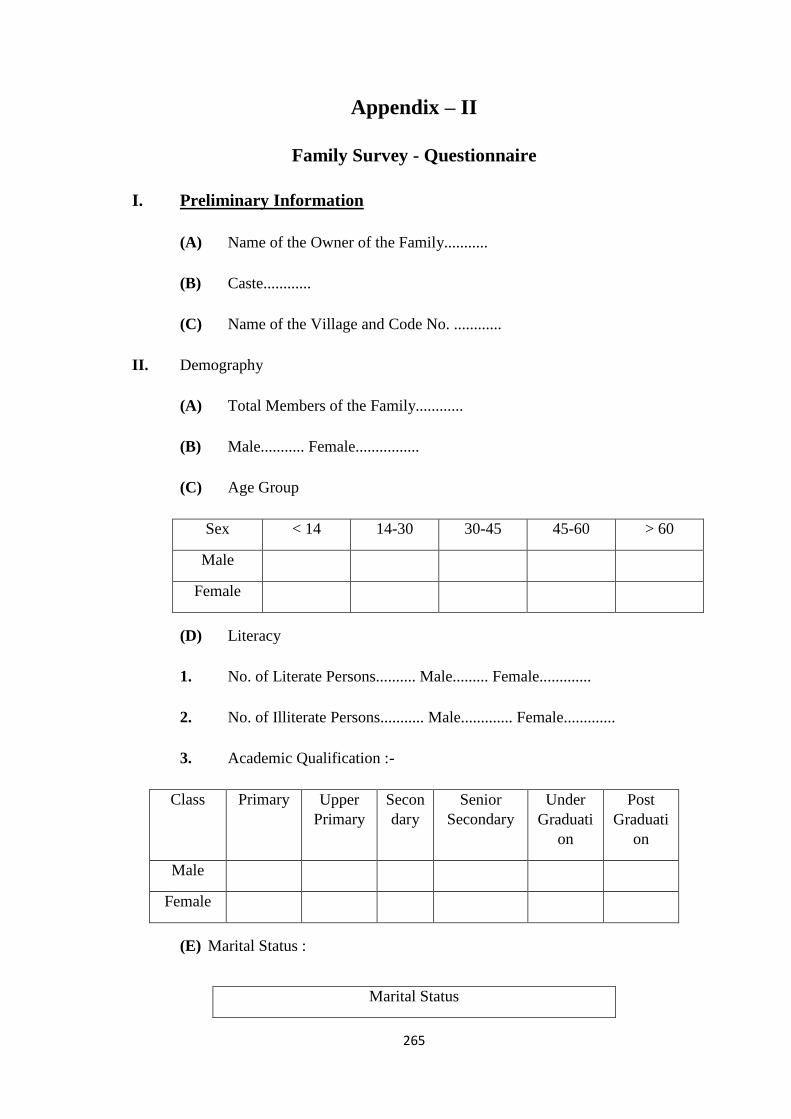
265
Appendix – II
Family Survey - Questionnaire
I. Preliminary Information
(A) Name of the Owner of the Family...........
(B) Caste............
(C) Name of the Village and Code No. ............
II. Demography
(A) Total Members of the Family............
(B) Male........... Female................
(C) Age Group
Sex < 14 14-30 30-45 45-60 > 60
Male
Female
(D) Literacy
1. No. of Literate Persons.......... Male......... Female.............
2. No. of Illiterate Persons........... Male............. Female.............
3. Academic Qualification :-
Class Primary Upper Primary
Secondary
Senior Secondary
Under Graduati
on
Post Graduati
on
Male
Female
(E) Marital Status :
Marital Status
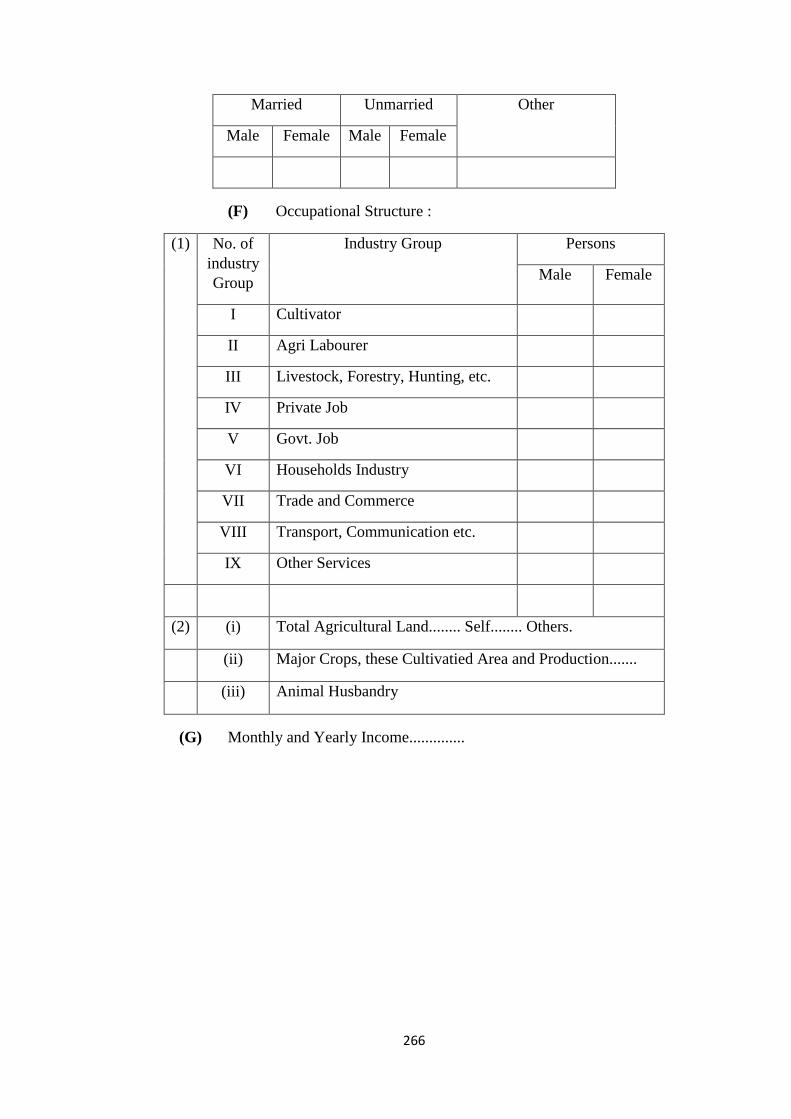
266
Married Unmarried Other
Male Female Male Female
(F) Occupational Structure :
(1) No. of industry Group
Industry Group Persons
Male Female
I Cultivator
II Agri Labourer
III Livestock, Forestry, Hunting, etc.
IV Private Job
V Govt. Job
VI Households Industry
VII Trade and Commerce
VIII Transport, Communication etc.
IX Other Services
(2) (i) Total Agricultural Land........ Self........ Others.
(ii) Major Crops, these Cultivatied Area and Production.......
(iii) Animal Husbandry
(G) Monthly and Yearly Income..............
14
P: ISSN NO.: 2321-290X RNI : UPBIL/2013/55327 VOL-6* ISSUE-1* (Part-1) September- 2018
E: ISSN NO.: 2349-980X Shrinkhla Ek Shodhparak Vaicharik Patrika
The Female Literacy Rate in Rajasthan
Durga Kadel Research Scholar, Deptt.of Geography, University of Kota, Kota, Rajasthan
Keywords: human resource, natural resource, National Development, nation, region, Education, Development, Literacy, social & Economic Development.
Introduction Literacy is not only a tool of personal development. But it is also a
means for social & Economic Development. It is main indicator in Human Development Index. If we are talking about female literacy rate in our State- Rajasthan, which is the basic parameter of social development. In female literacy rate the State is lagging behind in every perspective as we compare it with male literacy rate or with other states of India. But according to census 2011 the female literacy rate is 52.1% which is increased by 8.2 % from 2001.
The increasing female literacy rate is a good sign for us because it is a basic parameter. for analyzing the female progress and women status and autonomy in society. The education of women is closely inter related with their social position and corresponding changing in its character so It is a positive perspective.
I. Objectives of the Study The main objectives of our present work is as under:- 1. To analyze the increasing female literacy rate in state. 2. Causes behind the progress and find out new way for further
improvement. II. Study Area
The study Area is the Rajasthan which lies in north western part of the country and located between2303' to 30012' Northern latitudes 78017 eastern longitudes. The total geographical area is 3,42, 239 Sq. Kms. Rajasthan covers 10.74% of the total area of Country and also the largest state of India in terms of Area
Abstract The Development of any nation or region is indicated by the
level of education and that too of both genders. That's why 'Education for all' is strongly recommended and focused on by our government. Rajasthan has made a considerable progress in Female Literacy and with all the efforts the female literacy rate grew to 52.1% in 2011 from 43.9% in 2001.
Every Educated citizen of the country becomes its human resource and which by using its natural resource contribute in National Development. It is necessary for a person to be literate before he/she becomes educated.
The population commission of United Nation considers the ability to both read and write a simple language, a sufficient basis for classifying a person as literate. The census of India has adopted this definition.
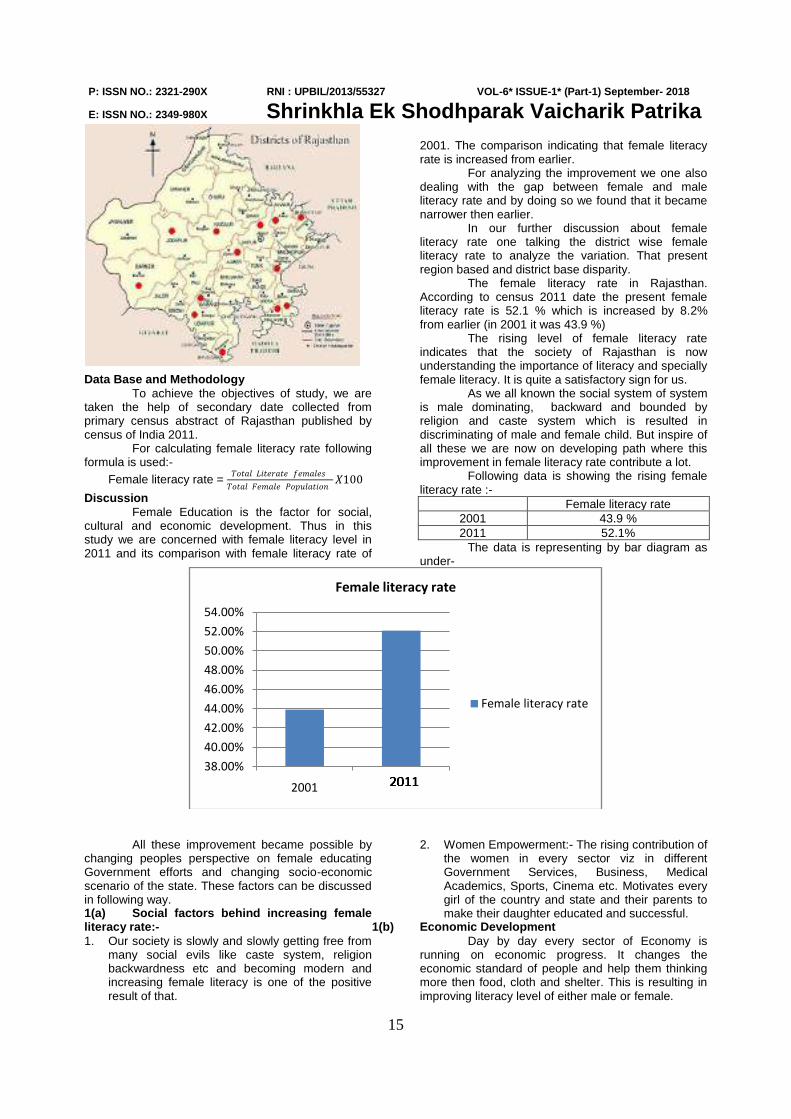
15
P: ISSN NO.: 2321-290X RNI : UPBIL/2013/55327 VOL-6* ISSUE-1* (Part-1) September- 2018
E: ISSN NO.: 2349-980X Shrinkhla Ek Shodhparak Vaicharik Patrika Data Base and Methodology
To achieve the objectives of study, we are taken the help of secondary date collected from primary census abstract of Rajasthan published by census of India 2011. For calculating female literacy rate following formula is used:-
Female literacy rate = 𝑇𝑜𝑡𝑎𝑙 𝐿𝑖𝑡𝑒𝑟𝑎𝑡𝑒 𝑓𝑒𝑚𝑎𝑙𝑒𝑠
𝑇𝑜𝑡𝑎𝑙 𝐹𝑒𝑚𝑎𝑙𝑒 𝑃𝑜𝑝𝑢𝑙𝑎𝑡𝑖𝑜𝑛𝑋100
Discussion Female Education is the factor for social,
cultural and economic development. Thus in this study we are concerned with female literacy level in 2011 and its comparison with female literacy rate of
2001. The comparison indicating that female literacy rate is increased from earlier.
For analyzing the improvement we one also dealing with the gap between female and male literacy rate and by doing so we found that it became narrower then earlier.
In our further discussion about female literacy rate one talking the district wise female literacy rate to analyze the variation. That present region based and district base disparity.
The female literacy rate in Rajasthan. According to census 2011 date the present female literacy rate is 52.1 % which is increased by 8.2% from earlier (in 2001 it was 43.9 %)
The rising level of female literacy rate indicates that the society of Rajasthan is now understanding the importance of literacy and specially female literacy. It is quite a satisfactory sign for us.
As we all known the social system of system is male dominating, backward and bounded by religion and caste system which is resulted in discriminating of male and female child. But inspire of all these we are now on developing path where this improvement in female literacy rate contribute a lot.
Following data is showing the rising female literacy rate :-
Female literacy rate 2001 43.9 % 2011 52.1%
The data is representing by bar diagram as under-
All these improvement became possible by changing peoples perspective on female educating Government efforts and changing socio-economic scenario of the state. These factors can be discussed in following way. 1(a) Social factors behind increasing female literacy rate:- 1. Our society is slowly and slowly getting free from
many social evils like caste system, religion backwardness etc and becoming modern and increasing female literacy is one of the positive result of that.
2. Women Empowerment:- The rising contribution of the women in every sector viz in different Government Services, Business, Medical Academics, Sports, Cinema etc. Motivates every girl of the country and state and their parents to make their daughter educated and successful.
1(b) Economic Development Day by day every sector of Economy is
running on economic progress. It changes the economic standard of people and help them thinking more then food, cloth and shelter. This is resulting in improving literacy level of either male or female.
38.00%
40.00%
42.00%
44.00%
46.00%
48.00%
50.00%
52.00%
54.00%
2001
Female literacy rate
Female literacy rate
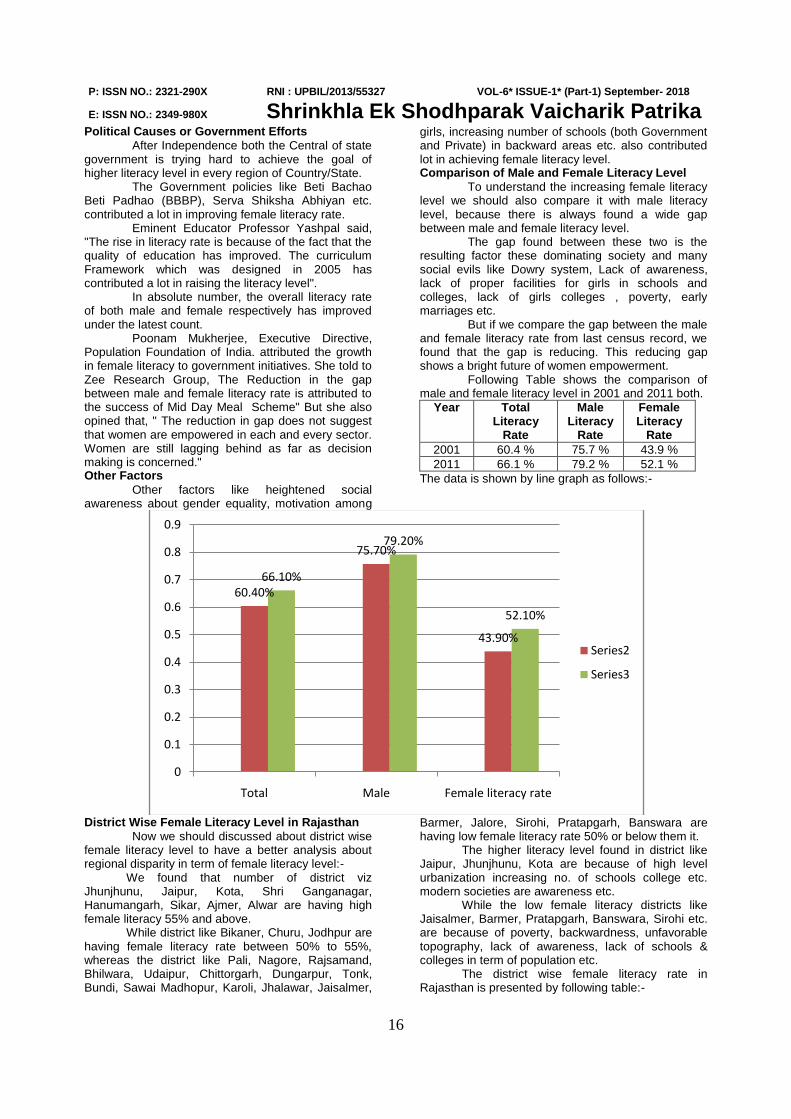
16
P: ISSN NO.: 2321-290X RNI : UPBIL/2013/55327 VOL-6* ISSUE-1* (Part-1) September- 2018
E: ISSN NO.: 2349-980X Shrinkhla Ek Shodhparak Vaicharik Patrika Political Causes or Government Efforts After Independence both the Central of state government is trying hard to achieve the goal of higher literacy level in every region of Country/State. The Government policies like Beti Bachao Beti Padhao (BBBP), Serva Shiksha Abhiyan etc. contributed a lot in improving female literacy rate. Eminent Educator Professor Yashpal said, "The rise in literacy rate is because of the fact that the quality of education has improved. The curriculum Framework which was designed in 2005 has contributed a lot in raising the literacy level". In absolute number, the overall literacy rate of both male and female respectively has improved under the latest count. Poonam Mukherjee, Executive Directive, Population Foundation of India. attributed the growth in female literacy to government initiatives. She told to Zee Research Group, The Reduction in the gap between male and female literacy rate is attributed to the success of Mid Day Meal Scheme" But she also opined that, " The reduction in gap does not suggest that women are empowered in each and every sector. Women are still lagging behind as far as decision making is concerned." Other Factors
Other factors like heightened social awareness about gender equality, motivation among
girls, increasing number of schools (both Government and Private) in backward areas etc. also contributed lot in achieving female literacy level. Comparison of Male and Female Literacy Level
To understand the increasing female literacy level we should also compare it with male literacy level, because there is always found a wide gap between male and female literacy level.
The gap found between these two is the resulting factor these dominating society and many social evils like Dowry system, Lack of awareness, lack of proper facilities for girls in schools and colleges, lack of girls colleges , poverty, early marriages etc.
But if we compare the gap between the male and female literacy rate from last census record, we found that the gap is reducing. This reducing gap shows a bright future of women empowerment.
Following Table shows the comparison of male and female literacy level in 2001 and 2011 both.
Year Total Literacy
Rate
Male Literacy
Rate
Female Literacy
Rate 2001 60.4 % 75.7 % 43.9 % 2011 66.1 % 79.2 % 52.1 %
The data is shown by line graph as follows:-
District Wise Female Literacy Level in Rajasthan Now we should discussed about district wise
female literacy level to have a better analysis about regional disparity in term of female literacy level:-
We found that number of district viz Jhunjhunu, Jaipur, Kota, Shri Ganganagar, Hanumangarh, Sikar, Ajmer, Alwar are having high female literacy 55% and above.
While district like Bikaner, Churu, Jodhpur are having female literacy rate between 50% to 55%, whereas the district like Pali, Nagore, Rajsamand, Bhilwara, Udaipur, Chittorgarh, Dungarpur, Tonk, Bundi, Sawai Madhopur, Karoli, Jhalawar, Jaisalmer,
Barmer, Jalore, Sirohi, Pratapgarh, Banswara are having low female literacy rate 50% or below them it.
The higher literacy level found in district like Jaipur, Jhunjhunu, Kota are because of high level urbanization increasing no. of schools college etc. modern societies are awareness etc.
While the low female literacy districts like Jaisalmer, Barmer, Pratapgarh, Banswara, Sirohi etc. are because of poverty, backwardness, unfavorable topography, lack of awareness, lack of schools & colleges in term of population etc.
The district wise female literacy rate in Rajasthan is presented by following table:-
60.40%
75.70%
43.90%
66.10%
79.20%
52.10%
0
0.1
0.2
0.3
0.4
0.5
0.6
0.7
0.8
0.9
Total Male Female literacy rate
Series2
Series3
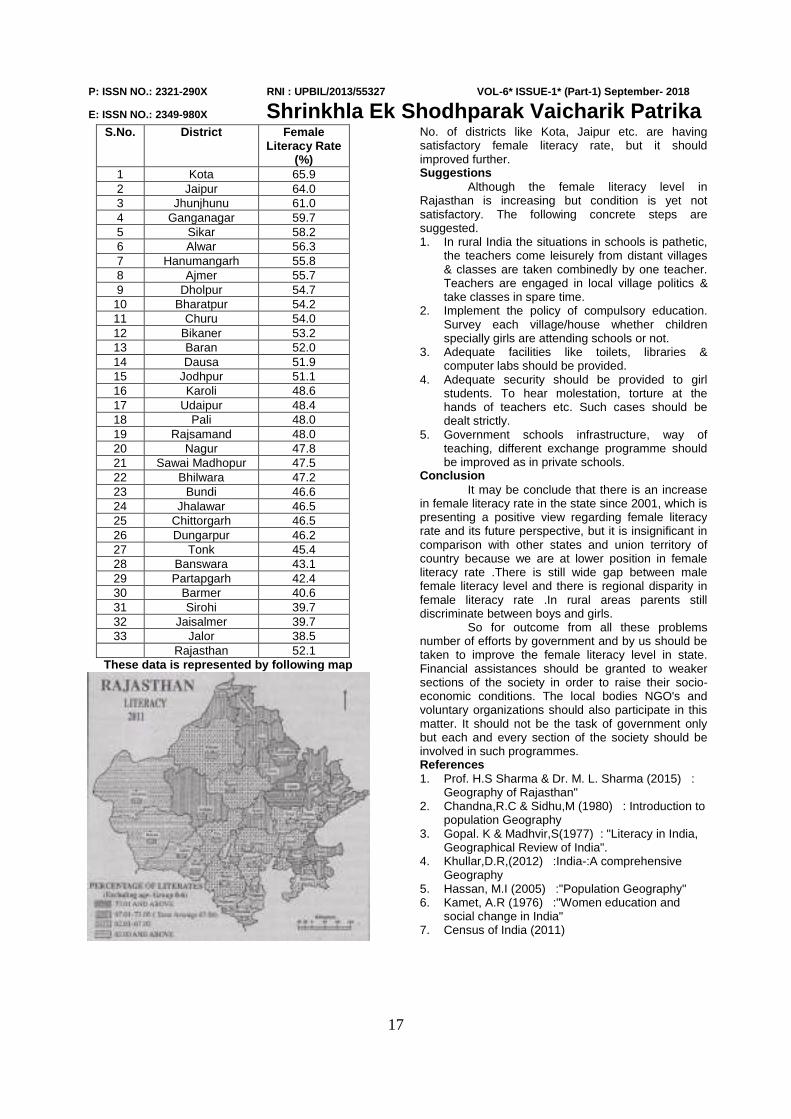
17
P: ISSN NO.: 2321-290X RNI : UPBIL/2013/55327 VOL-6* ISSUE-1* (Part-1) September- 2018
E: ISSN NO.: 2349-980X Shrinkhla Ek Shodhparak Vaicharik Patrika S.No. District Female
Literacy Rate (%)
1 Kota 65.9 2 Jaipur 64.0 3 Jhunjhunu 61.0 4 Ganganagar 59.7 5 Sikar 58.2 6 Alwar 56.3 7 Hanumangarh 55.8 8 Ajmer 55.7 9 Dholpur 54.7
10 Bharatpur 54.2 11 Churu 54.0 12 Bikaner 53.2 13 Baran 52.0 14 Dausa 51.9 15 Jodhpur 51.1 16 Karoli 48.6 17 Udaipur 48.4 18 Pali 48.0 19 Rajsamand 48.0 20 Nagur 47.8 21 Sawai Madhopur 47.5 22 Bhilwara 47.2 23 Bundi 46.6 24 Jhalawar 46.5 25 Chittorgarh 46.5 26 Dungarpur 46.2 27 Tonk 45.4 28 Banswara 43.1 29 Partapgarh 42.4 30 Barmer 40.6 31 Sirohi 39.7 32 Jaisalmer 39.7 33 Jalor 38.5
Rajasthan 52.1 These data is represented by following map
No. of districts like Kota, Jaipur etc. are having satisfactory female literacy rate, but it should improved further. Suggestions
Although the female literacy level in Rajasthan is increasing but condition is yet not satisfactory. The following concrete steps are suggested. 1. In rural India the situations in schools is pathetic,
the teachers come leisurely from distant villages & classes are taken combinedly by one teacher. Teachers are engaged in local village politics & take classes in spare time.
2. Implement the policy of compulsory education. Survey each village/house whether children specially girls are attending schools or not.
3. Adequate facilities like toilets, libraries & computer labs should be provided.
4. Adequate security should be provided to girl students. To hear molestation, torture at the hands of teachers etc. Such cases should be dealt strictly.
5. Government schools infrastructure, way of teaching, different exchange programme should be improved as in private schools.
Conclusion It may be conclude that there is an increase
in female literacy rate in the state since 2001, which is presenting a positive view regarding female literacy rate and its future perspective, but it is insignificant in comparison with other states and union territory of country because we are at lower position in female literacy rate .There is still wide gap between male female literacy level and there is regional disparity in female literacy rate .In rural areas parents still discriminate between boys and girls.
So for outcome from all these problems number of efforts by government and by us should be taken to improve the female literacy level in state. Financial assistances should be granted to weaker sections of the society in order to raise their socio-economic conditions. The local bodies NGO's and voluntary organizations should also participate in this matter. It should not be the task of government only but each and every section of the society should be involved in such programmes. References 1. Prof. H.S Sharma & Dr. M. L. Sharma (2015) :
Geography of Rajasthan" 2. Chandna,R.C & Sidhu,M (1980) : Introduction to
population Geography 3. Gopal. K & Madhvir,S(1977) : "Literacy in India,
Geographical Review of India". 4. Khullar,D.R,(2012) :India-:A comprehensive
Geography 5. Hassan, M.I (2005) :"Population Geography" 6. Kamet, A.R (1976) :"Women education and
social change in India" 7. Census of India (2011)
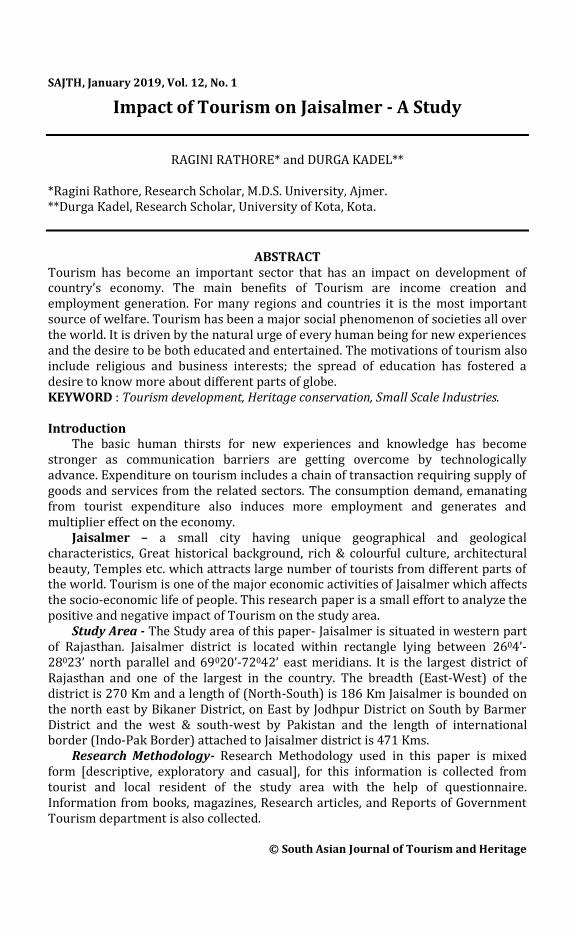
SAJTH, January 2019, Vol. 12, No. 1
© South Asian Journal of Tourism and Heritage
Impact of Tourism on Jaisalmer - A Study
RAGINI RATHORE* and DURGA KADEL**
*Ragini Rathore, Research Scholar, M.D.S. University, Ajmer. **Durga Kadel, Research Scholar, University of Kota, Kota.
ABSTRACT
Tourism has become an important sector that has an impact on development of country’s economy. The main benefits of Tourism are income creation and employment generation. For many regions and countries it is the most important source of welfare. Tourism has been a major social phenomenon of societies all over the world. It is driven by the natural urge of every human being for new experiences and the desire to be both educated and entertained. The motivations of tourism also include religious and business interests; the spread of education has fostered a desire to know more about different parts of globe. KEYWORD : Tourism development, Heritage conservation, Small Scale Industries.
Introduction
The basic human thirsts for new experiences and knowledge has become stronger as communication barriers are getting overcome by technologically advance. Expenditure on tourism includes a chain of transaction requiring supply of goods and services from the related sectors. The consumption demand, emanating from tourist expenditure also induces more employment and generates and multiplier effect on the economy.
Jaisalmer – a small city having unique geographical and geological characteristics, Great historical background, rich & colourful culture, architectural beauty, Temples etc. which attracts large number of tourists from different parts of the world. Tourism is one of the major economic activities of Jaisalmer which affects the socio-economic life of people. This research paper is a small effort to analyze the positive and negative impact of Tourism on the study area. Study Area - The Study area of this paper- Jaisalmer is situated in western part of Rajasthan. Jaisalmer district is located within rectangle lying between 2604’-28023’ north parallel and 69020’-72042’ east meridians. It is the largest district of Rajasthan and one of the largest in the country. The breadth (East-West) of the district is 270 Km and a length of (North-South) is 186 Km Jaisalmer is bounded on the north east by Bikaner District, on East by Jodhpur District on South by Barmer District and the west & south-west by Pakistan and the length of international border (Indo-Pak Border) attached to Jaisalmer district is 471 Kms.
Research Methodology- Research Methodology used in this paper is mixed form [descriptive, exploratory and casual], for this information is collected from tourist and local resident of the study area with the help of questionnaire. Information from books, magazines, Research articles, and Reports of Government Tourism department is also collected.
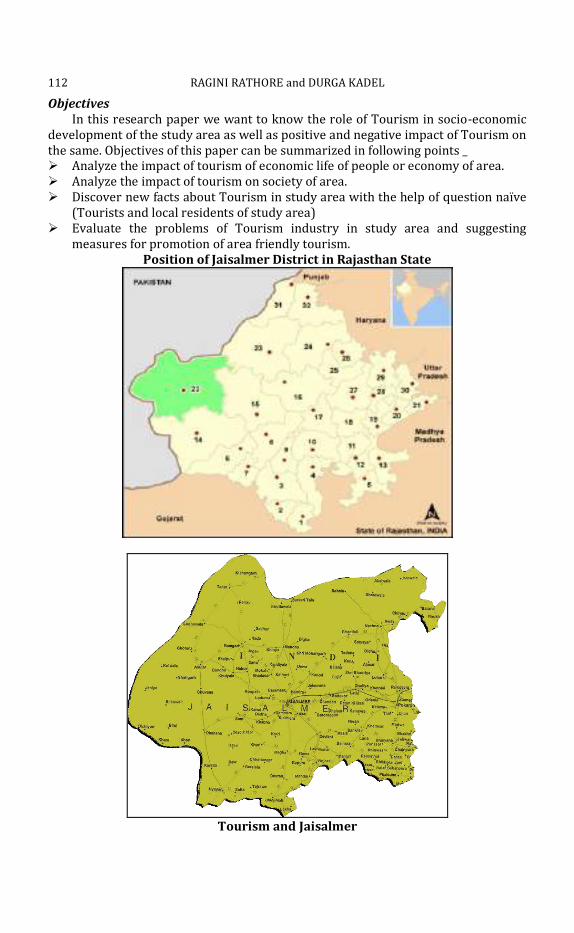
112 RAGINI RATHORE and DURGA KADEL
Objectives In this research paper we want to know the role of Tourism in socio-economic
development of the study area as well as positive and negative impact of Tourism on the same. Objectives of this paper can be summarized in following points _ ➢ Analyze the impact of tourism of economic life of people or economy of area. ➢ Analyze the impact of tourism on society of area. ➢ Discover new facts about Tourism in study area with the help of question naïve
(Tourists and local residents of study area) ➢ Evaluate the problems of Tourism industry in study area and suggesting
measures for promotion of area friendly tourism. Position of Jaisalmer District in Rajasthan State
Tourism and Jaisalmer
IMPACT OF TOURISM ON JAISALMER 113
Jaisalmer district entirely lies in the arid plains of Western Rajasthan,and in the heart of Thar desert.The city of Jaisalmer is a living fortress, perhaps the only one of its kind in India. The study area reflecting great medieval History, having colourful culture, Natural beauty etc. is a magical city which attracts large number of tourists not only from India, but from different parts of world. The city is regarded as one of the favourite tourist destination at global level.
The Famous torist spots which surprised the arrived tourists and making
the Jaisalmer a paradise for tourist are as under:- 1. Jaisalmer fort :- Built in 12th Century by the Bhati Rajput ruler Rao Jaisal, the
yellow Sandstone fortification that maintains the Rajmahal and several havellies, gateways and temples. Fort is known as ‘Sonar Quila’ located on the trikuta hill.
2. Patwa ki Haveli:- An Impressive example of intricate architecture that unwrap the passage of a wealthy trader, Guman Chand Patwa of the 19th century. Patwa ki Haveli is one of the must places to visit in Jaisalmer.
3. Salem Singh’s Haveli:- A distinct architecture that you will come across in Jaisalmer city is the Haveli of Salem Singh from 17th century.
4. Gadi Sar Lake:- Built in 14th century as a water conservation tank, the Gadi sagar lake is popular tourist hangout.
5. Sam Sand dunes:- Approximately 42 kms from the fort city of Jaisalmer ,the sam sand dunes in the out skirts is for sure the best recommended places to see in Jaisalmer.
6. Temples:- Tanot Mata Temple is located 150kms from city is maintained by BSF of India.
7. Jain Temple:- The Jaisalmer fort houses a group of Jain Temples that dates back to the 12th and 15th century.
8. Kuldhara Village:- Least explored place around Jaisalmer is located in outskirts is me ruins of Kuldhara village that dates back to the 13th century. The place still retains some fine architectural works like temples and step wells that assure a planned sattlement over 7 centuries.
9. Bada Bagh:- Located 6 kms away from Jaisalmer city, Bada bagh is a beautiful place that houses several cenotaphs of the royal families from the 16th to 20th century. It also maintains several other attractions like a garden a tank, a dam and the Govardhan Stambh(Pillar) .
10. Other attractions:- Other attractions incude Camel Safari, The Thar Heritage Museum, Khabha fort, Colourful culture,Desert Natinal park,Windmill Park, Nathmal Haveli, , Desert festival, Camping & cultural Evening, art, music etc. We askedthe tourist about the tourist spots and things of the area which they
like most and they mentioned following places & things of study area:- ➢ Sonar Fort ➢ Gadisar Lake ➢ Havellies ➢ Sanddues
All aforesaid places, parks, lake, market, music are acts like magnet to attract tourists.
114 RAGINI RATHORE and DURGA KADEL
Tourist Map of Jaisalmer
Images of Famous tourist spots of Jaisalmer
IMPACT OF TOURISM ON JAISALMER 115
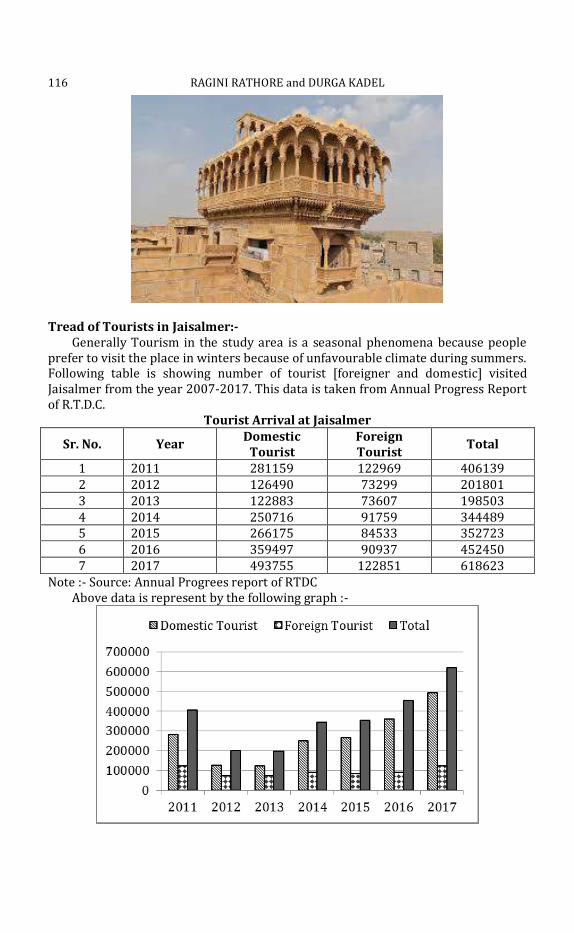
116 RAGINI RATHORE and DURGA KADEL
Tread of Tourists in Jaisalmer:-
Generally Tourism in the study area is a seasonal phenomena because people prefer to visit the place in winters because of unfavourable climate during summers. Following table is showing number of tourist [foreigner and domestic] visited Jaisalmer from the year 2007-2017. This data is taken from Annual Progress Report of R.T.D.C.
Tourist Arrival at Jaisalmer
Sr. No. Year Domestic
Tourist Foreign Tourist
Total
1 2011 281159 122969 406139 2 2012 126490 73299 201801 3 2013 122883 73607 198503 4 2014 250716 91759 344489 5 2015 266175 84533 352723 6 2016 359497 90937 452450 7 2017 493755 122851 618623
Note :- Source: Annual Progrees report of RTDC Above data is represent by the following graph :-
IMPACT OF TOURISM ON JAISALMER 117
If we look at above table and graph, we came to know that only during 2012 and 2013 the number of arrivals decreses, while in remaining years number of visiters increses. Impact of Tourism on Jaisalmer
If we looked on previous date or chart we can understand that number of arrivals are incresing year by year, Now the tourism sector became famous day by day in study area,Mass tourism are effecting the socio- economic life of people of Jaiselmar. The impact are both positive and negative. If we minimize the nagative impact, the Tourism sector can became important tool for socio- economic development of study area. We shall now discuss the Impact of Tourism on study area as under - (A) Positive Impact : Positive Impact of Tourism Sector in Jaisalmer can be
understand by following points. A.1. Economic Benefits:- Tourism Sector provides employment to local people,
earn foreign exchange, offer market for local goods & services, provide plateform for local articans etc. So in this way economic benefits are included in the important positive impact of toursim on Jaisalmer. It also promotes Trade and Industry (local),and help in Re-distribution of state income.
A.2. Social Development:-Tourism is nothing but an interaction of People of diverse cultural groups having their values, tastes and prefrances. Result of such interaction lead to knoweldge about other culture. This mix-up proves beneficial for people of study area, because they learn new languages and became open mind for new changes.We asked ceratin question related to positive social change brought by tourist activities to local people as well as tourist, they are discussed as under- ➢ We asked that are the local people communities getting benefit from tourism
activity, most of the respodends answered ‘Yes’. ➢ We also asked question that are tourist activities helps in promotion of local
artist,musicians and other workers by providing them a new and wide plateform, near about 80% people answered ‘Yes’.
➢ We put another question realed to social development that growth of tourism industry will be helpful in progress of place 70% of people answered ‘Yes’. A.3. Protection of Historical & Natural Resources:- Historical & Natural
Resourses in area like forts, Havellies, sanddunes etc. are used in better way to support Tourism sector, which in return gives protection of local heritage & natural resources as well as economic benefits to people. ➢ We put the quesiton to know about people’s perspective regarding this, we
asked them that the natural resources protection and tourism can be compatible, most of them said ‘Yes’ and few of them were in favour of ‘No’.
➢ Another question for revailing their views regarding compatibility of tourism and protection of historical places, here also most of people accepted the compatibility. So in this way we can say that toursim sector provides protection and better use
of avaiable Historical & natural resouces of the study area. A.4. Natinal Integretion:- If the people visit different places, the we-feeling
between the visitors and local residents increases, in this way tourism help in promoting national integration. If the people visit different nations then also feeling of brotherhood increases.
118 RAGINI RATHORE and DURGA KADEL
A.5. Development of Draught prone areas:- Jaisalmer is considered as a draught Prone area with having low rainfall, area is also agriculturaly and industrially backward. In this way tourism is the hope to improve economic life of the study area. It contribute in economic development without creating any pollution. B. Negative Impact of Tourism on study area
Inspite of contribution in Economic Developmet,uplift the society, Toursim also effect the study area in negative way. Following points imphases over negative impact of tourism sector on the study area.
B.1. Social-cultural pollution:- When local residents contact with tourist arrivals, their local language,culture,food habits modified and change. In this way tourism is creating soical cultural pollution. To know about opinion of Tourists, we asked them question that as under. ➢ Due to influx of tourists original culture of the area is negatively affected.Most of
them said ‘Yes’ Only few of them answered ‘No’. ➢ Another question we put related to commercilisation of culture due to tourist
contact was is the culture rituals of area became commercilised due to tourist contact. Near about 68% of them answered ‘Yes’.
✓ Avoiding Religious ritnals and moral values:- While tourist-entertaining themseleves avoid the religious values & ritnals of local area. Most of tourist are not accepting this neglegance but we observer that foreigners sometimes not aware about religious sentiments of local people.
✓ Problem of Intra racial merriage:- Sometimes coming tourist getting marry with local residents resulted in emergence of new race Intra racial marriage is incresing because of tourism.
✓ Historical places, monuments are losing their orignality:- Historical places, monuments etc. are now a days losing their original colour design etc. because these are now modified to serve toursits.We asked me questions to arrivals about this and 80% of them accepting this view.
✓ Crimes related to drugs,alcholism murdess,raps etc. are also seen on tourist places. B.2. Negative Impact of Tourism on Economy :- Economy is basically
supported by Tourism sector without creating pollution besides its economic benefits like employment generator, redistribution income, etc. But some of the economic impact of tourism cannot be categorized under positive impacts. ➢ Job provided by Tourism sector is often seasonal.
The Tourist arrivals in Jaisalmer are particularly in winter season. In summer season the Jobs provided by Tourism sector generally reduced.
➢ The Whole Economic benefits are not coming in the hand of local residents The People engaged in Tourism sector are outsider also; The Local residents are not getting the employment opportunities.
➢ Poor artisans depend on their art related to music, cottage industry, dance are not getting proper economic returns.
➢ The Development of Tourism infrastructure is contributed by Government in this way large % of investment become extra burden for Government Sector. Government also provide services to tourists at low price, Organizes different festivals to attract the Tourism in Study area.
IMPACT OF TOURISM ON JAISALMER 119
B.3. Over Dependence on Tourism :- Diversification in an economy is a sign of health, however if a region become dependent for its economic survival upon one Industry, It can put major stress upon this industry as well as the people involved in it to perform well Due to Tourism the price of local goods become high. Product of day to day need become expensive in area during Tourist season.
B. 4. Impact of Tourism on Environments & Animals :- Mass Tourism over specific or limited area generally having adverse effect over environment. ➢ Overnight parties- in Sand dunes, easy rules for Tourists lead to noise pollution. ➢ The Mass Tourism in lake disturbs marine eco system and create water
pollution. ➢ The Vehicles used by Tourists often create pollution. ➢ Use of animals for Safari like camel, Horse, Safari also leads to over use of
Livestock. ➢ If the garbage of Hotels is not properly decomposed and thrown by Tourists on
tourists spots also create environment problems. [IV] Problem of Tourism sector in Study Area
To attract large number of tourist for getting multi benefits, We have to improve infrastructure markets, transport system, Banking, Food & Sanitation in better way. All these need cooperation of local people and government in parallel way. We asked many questions to tourist regarding their satisfaction level from above mentioned facilities. ➢ At First we put question about traffic management of area, 60% of Tourist said
that it is not proper and should be improve. ➢ The Prices of same goods & services should be same everywhere to earn the
faith of tourists, But unfortunately tourists said they are not having any idea about this.
➢ One of the problems of Tourists was regarding over crowded markets. ➢ Tourists also mentioned some of the thing like garbage, dust, People lying on
road side, improper knowledge of guide, street animals from which they dissatisfied.
➢ Role of Government can be increased to improve Tourism facilities in area by favourable tourism policies.
Suggestions For Government 1) The Role of Government should increase to develop the infrastructure of study
area which can serve the “Guest” best. 2) Workshops, Seminars, Short Term courses for guides and local people should be
organized by government for improvement. 3) Role of Government Publication in to promote tourism in area should increase,
because mostly tourists source of information is Tour Operators. For Tourism Sector 1) Development of nearby Tourists places is also necessary to reduce over burden
on limited Tourist spots. 2) Price Stability of goods & services is also necessary to earn train of Tourist. 3) Proper Banking, Medical Facilities should be provided to tourists 4) Special offers for students and old age people by Tourism department can
maximize the arrival.
120 RAGINI RATHORE and DURGA KADEL
5) If off seasons Tourism department should organize festivals or feast to attract tourists.
6) Cleanness should improve in all the places like tourist spots, railway platform, Airport, Market etc. because frequent complaint regarding this is seen.
7) In spite of all these guides, Hotel Staff etc. should also make the tourist know about Do’s and Don’ts over the area, so they (Tourist) should aware about their moral duties.
8) Hotel Industry should also take care regarding safety food supply, better facilities for coming tourists, So They will again visit same place.
For Local Resident 1) People should come forward and make contribution to manage problems like
garbage etc., should behave in proper way to attract tourist. 2) More Involvement of local residents in Tourist activities, so that development of
whole area can be possible. Other 1) By adopting concept of Eco tourism which means perform tourism in the way
that will not harm environment the negative impact of Tourism can be minimize.
Conclusion Jaisalmer is having great potentiality to serve Tourists. City is having Great
Heritage & Natural beauty, Colorful culture, Fort, Havellies, Palaces, great art and music etc. All these things is more than enough to get attraction from tourists. If the problems regarding tourism sector is solved, the sector will support the economy in better way. Sustainable Tourism development can be assured in area by adopting concept of Eco-tourism.
References
Agarwal Prateek - Tourism and economic Growth and Development Mohit Publication, New Delhi
Bhati, Raghubir Singh(2006) - Vishav Prashidh Prayatam Sthal Jaisalmer [in Hindi ] Rajasthan Sahitya Sansthan
Bhatia A.K. (1978) - ‘Tourism in India’ History and Development. Discover Rajasthan (1997) - Department of Tourism Art & Culture Govt. of Rajasthan Designed & Produced by Appeal Advertising & Marketing Consultant, New Delhi
Sharma K.K. [2004] - Tourism and Socio Cultural Development, Sarop and Sons New Delhi
Pragati of Partivadam [2017-18] - Tourism Department Rajasthan Journal of Tourism and Hotel Management Ram Acharya [1977] - ‘Tourism in India R.B.S.A. Publishers Jaipur. Negi Jagmohan [1999] - Tourism Travel-Concepts and Principles, Gitanjali
Publishing House, New Delhi Khatri L.N. [2009] : Jaisalmer Folklore History & Architecture, Hindusthan Printing,
House Jodhpur Kumar Nirmal [1996]: Tourism and Economic Development ASH, Publishing
Corporation New Delhi.