Pattern Recognition and Machine Learning as a Morphology ...
189
Pattern Recognition and Machine Learning as a Morphology Characterization Tool for Assessment of Placental Health Anika Mukherjee A thesis submitted in partial fulfillment of the requirements for the Master’s degree in Interdisciplinary Health Sciences School of Interdisciplinary Health Sciences Faculty of Health Sciences University of Ottawa © Anika Mukherjee, Ottawa, Canada, 2021
-
Upload
khangminh22 -
Category
Documents
-
view
0 -
download
0
Transcript of Pattern Recognition and Machine Learning as a Morphology ...

Pattern Recognition and Machine Learning as a Morphology Characterization Tool for Assessment of Placental Health
Anika Mukherjee
A thesis submitted in partial fulfillment of the requirements for the Master’s degree in Interdisciplinary Health Sciences
School of Interdisciplinary Health Sciences Faculty of Health Sciences
University of Ottawa
© Anika Mukherjee, Ottawa, Canada, 2021

ii
Preface
iii
Abstract
Introduction: The placenta is a complex, disk-shaped organ vital to a successful pregnancy and
responsible for materno-fetal exchange of vital gases and biochemicals. Instances of compromised
placental development or function – collectively termed placenta dysfunction - underlies the most
common and devastating pregnancy complications observed in North America, including preeclampsia
(PE) and fetal growth restriction (FGR). A comprehensive histopathology examination of the placenta
following delivery can help clarify obstetrical disease etiology and progression and offers tremendous
potential in the identification of patients at risk of recurrence in subsequent pregnancies, as well as
patients at high risk of chronic diseases in later life. However, these types of examinations require a high
degree of specialized training and are resource intensive, limiting their availability to tertiary care
centers in large city centres. The development of machine learning algorithms tailored to placenta
histopathology applications may allow for automation and/or standardization of this important clinical
exam – expanding its appropriate usage and impact on the health of mothers and infants. The primary
objective of the current project is to develop and pilot the use of machine learning models capable of
placental disease classification using digital histopathology images of the placenta.
Methods: 1) A systematic review was conducted to identify the current methods being applied to
automate histopathology screening to inform experimental design for later components of the project.
Of 230 peer-reviewed articles retrieved in the search, 18 articles met all inclusion criteria and were used
to develop guidelines for best practices. 2) To facilitate machine learning model development on
placenta histopathology samples, a villi segmentation algorithm was developed to aid with feature
extraction by providing objective metrics to automatically quantify microscopic placenta images. The
segmentation algorithm applied colour clustering and a tophat transform to delineate the boundaries
between neighbouring villi. 3) As a proof-of-concept, 2 machine learning algorithms were tested to
evaluated their ability to predict the clinical outcome of preeclampsia (PE) using placental

iv
histopathology specimens collected through the Research Centre for Women’s and Infant’s Health
(RCWIH) BioBank. The sample set included digital images from 50 cases of early onset PE, 29 cases of
late onset PE and 69 controls with matching gestational ages. All images were pre-processed using patch
extraction, colour normalization, and image transformations. Features of interest were extracted using:
a) villi segmentation algorithm; b) SIFT keypoint descriptors (textural features); c) integrated feature
extraction (in the context of deep learning model development). Using the different methods of feature
extraction, two different machine learning approaches were compared - Support Vector Machine (SVM)
and Convolutional Neural Network (CNN, deep learning). To track model improvement during training,
cross validation on 20% of the total dataset was used (deep learning algorithm only) and the trained
algorithms were evaluated on a test dataset (20% of the original dataset previously unseen by the
model).
Results: From the systematic review, 5 key steps were found to be essential for machine learning model
development on histopathology images (image acquisition and preparation, image preprocessing,
feature extraction, pattern recognition and classification model training, and model testing) and
recommendations were provided for the optimal methods for each of the 5 steps. The segmentation
algorithm was able to correctly identify individual villi with an F1 score of 80.76% - a significantly better
performance than recently published methods. A maximum accuracy of 73% for the machine learning
experiments was obtained when using textural features (SIFT keypoint descriptors) in an SVM model,
using onset of PE disease (early vs. late) as the output classification of interest.
Conclusion: Three major outcomes came of this project: 1) the range of methods available to develop
automated screening tools for histopathology images with machine learning were consolidated and a
set of best practices were proposed to guide future projects, 2) a villi segmentation tool was developed
that can automatically segment all individual villi from an image and extract biologically relevant
features that can be used in machine learning model development, and 3) a prototype machine learning

v
classification tool for placenta histopathology was developed that was able to achieve moderate
classification accuracy when distinguishing cases of early onset PE and late onset PE cases from controls.
The collective body of work has made significant contributions to the fields of placenta pathology and
computer vision, laying the foundation for significant progress aimed at integrating machine learning
tools into the clinical setting of perinatal pathology.

vi
Acknowledgements
I owe the greatest thanks to my two co-supervisors Dr. Shannon Bainbridge-Whiteside and Dr.
David Grynspan for their exceptional guidance, patience, and insights. Both brought a unique flavor of
mentorship and together, left me with a rounded and enriching experience. Shannon, thank you for
providing me with endless support and being truly invested in the project at every step of the way.
Thank you for teaching me how to think critically and showing me what it takes to answer a research
question with integrity. I now feel closer to being able to wear the title of “scientist”. David, thank you
for helping me see the importance of the work we do and how this can impact real people in the
community. Thank you for teaching me to think abstractly about a problem and how to take novel
approaches to solving them. You were always there when I was struggling to see the bigger picture and
would always spark inspiration. I cannot reiterate enough how valuable both of your contributions were
to this project and to me.
A sincere thank you goes out to my thesis advisory committee members Dr. Adrian Chan, and
Dr. Raywat Deonandan for the time and effort they committed to this work. This project was
interdisciplinary in the truest sense of the word. It would have been impossible to complete without
both the clinical and pathology expertise as well as the computer science and statistical advice. Thank
you, Dr. Chan for always steering us in the right direction regarding our decisions for implementing
machine learning methods. With the wealth of options available, you helped us tremendously with
feeling comfortable in the judgement calls we were making. We look forward to future collaboration
with you and your team. Dr. Deonandan, thank you for offering your support with the planning and
execution of this project. Knowing we could turn to you for help with interpreting results was immensely
helpful. I would also like to thank Dr. Eran Ukwatta for attending our meetings and offering critical
assessment of the results and potential avenues for additional investigation.

vii
A huge thank you goes to Sina Salsabilli for his work on the automation of feature extraction
from placenta villi. A whole arm of our machine learning experiments would not have been possible
without his contribution. As well, I greatly appreciate the help of Michal Leckie and Purvasha Pratnaik
for their help collecting data and assessing the risk of bias in the systematic review. Undertaking a
review like this was no small task, and it was made much more manageable with their help. I would also
like to say thank you to the other members of our lab for their support and for making these past years a
lot of fun. Thank you, Dr. Samantha Benton, Jeremiah Gaudet, Philip Marshal, Fahmida Jahan, Sonia
Rose Dancey, Erika Mery, Amy Zeglinski-Spinney, Benjamin McLeod, Fadi Gorgi, Peter Pham, and Sapir
Fellus.
This work would not have been possible without the mothers at the Mount Sinai hospital in
Toronto who kindly consented for their placentas to be used for research into preeclampsia. A very
warm thank you goes out to them for making this research possible. They may not realize the magnitude
of their contribution or be able to benefit from the ultimate outcomes of the research, but they have
indirectly helped many future mothers who will be afflicted with PE.
I would like to give a very heartfelt thanks to my loved ones for their encouragement and
support. I appreciate my friends for being patient with me and understanding when I was feeling the
stress of writing a thesis. Having a support group of people who would unconditionally listen to my
challenges made it a lot easier to work through them. Lastly, I thank my parents and grandparents for
encouraging me to work hard and never stop learning. In moving to Canada, they paved a path for me to
do more than they could and that motivates me to instill passion in my work.

viii
Authorship Contribution
The following outline lists the contributions of various authors to the manuscripts presented in this
thesis.
Manuscript 1: A Systematic Review of Computer Aided Classification of Histopathology Images:
Recommendations for Best Practices
Dr. Shannon Bainbridge-Whiteside and Dr. David Grynspan were the principal investigators for the
study. Karine Fournier, Dr. Shannon Bainbridge-Whiteside validated the search strategy. Anika
Mukherjee, Dr. David Grynspan and Michal Leckie performed full title and abstract screening of 230
articles retrieved from a systematic literature search. Anika Mukherjee and Michal Leckie extracted and
compiled data from screened-in articles. Anika Mukherjee and Purvasha Pratnaik assessed the risk of
bias in the articles presented. The manuscript was prepared by Anika Mukherjee and reviewed and
edited by Dr. Shannon Bainbridge-Whiteside.
Manuscript 2: Automated segmentation of villi in histopathology images of placenta
Dr. Adrian Chan was the principal investigator for the study. This study was conceptualized by Dr. Adrian
Chan, Dr. Eran Ukwatta, Dr. Shannon Bainbridge-Whiteside, and Dr. David Grynspan. Whole slide images
from placenta tissue sections were manually annotated by Anika Mukherjee and validated by Dr. David
Grynspan. All codes for segmenting villi were written by Sina Salsabilli. The manuscript was prepared by
Sina Salsabilli and Anika Mukherjee and revised by Dr. Adrian Chan, Dr. Shannon Bainbridge-Whiteside,
and Dr. David Grynspan. This manuscript was published in Computers in Biology and Medicine (Comput
Biol Med. 2019 Aug 30;113:103420).
Manuscript 3: Application of Machine Learning to Classify Distinct Patterns of Placenta
Histopathology: A Proof-of-Concept Using Cases of Preeclampsia

ix
Dr. Shannon Bainbridge-Whiteside and Dr. David Grynspan were the principal investigators for the
study. Dr. Eran Ukwatta provided sponsorship for access to Compute Canada High Performance
Computing resources to be able to run the programs. Codes for data augmentation and machine
learning were written by Anika Mukherjee. Sina Salsabilli applied the code developed in Manuscript 2
and extracted clinically relevant features from segmented placenta villi. Anika Mukherjee extracted
textural features from the same samples for comparison with clinically relevant features. This
manuscript was prepared by Anika Mukherjee and reviewed by Dr. Shannon Bainbridge-Whiteside.

x
Ethics Statement
This study was granted research ethics approval by the University of Ottawa Office of Research Ethics
and Integrity. Anika Mukherjee was added as an additional co-investigator to perform a sub-analysis of
the data collected for the work presented in Leavey et. al 2016. Ethics approval was granted on August
24th, 2018 under the file H-08-18-1023 for the project titled Identification of Molecular Subclasses of PE.
Approval was renewed April 15th, 2019. Tri-Council Policy Statement: Ethical Conduct for Research
Involving Humans Course on Research Ethics (TCPS 2:CORE) was completed on September 26th, 2016.
Certificates of ethics approval for the study and TCPS 2: CORE course completion are included in
Appendix A.
xi
Table of Contents
Title Page.......................................................................................................................................................i
Preface..........................................................................................................................................................ii
Abstract...........................................................................................................................................iii
Acknowledgements........................................................................................................................vi
Authorship Contribution...............................................................................................................viii
Ethics Statement..............................................................................................................................x
Table of Contents............................................................................................................................xi
List of Abbreviations....................................................................................................................xviii
List of Figures................................................................................................................................xxii
List of Tables................................................................................................................................xxiv
Thesis Outline..............................................................................................................................xxvi
Chapter 1. Introduction................................................................................................................................1
1.1 The Human Placenta.................................................................................................................2
1.2 Placenta-Mediated Diseases of Pregnancy...............................................................................2
1.3 Preeclampsia.............................................................................................................................3
1.3.1 Clinical Burden of PE..............................................................................................3
1.3.2 Placental Disease in PE..........................................................................................4
1.3.3 Evidence of Disease Subclasses in PE.....................................................................4
1.4 The Role of the Histopathology Analysis in Understanding Placenta-Mediated Diseases........5

xii
1.4.1 Placental Histopathology in PE..............................................................................6
1.4.2 Current Challenges Faced in Applied Placenta Pathology.....................................8
1.5 Applying Machine Learning to Histopathology Specimens.......................................................9
1.5.1 Brief Overview of Machine Learning......................................................................9
1.5.2 Machine Learning in a Healthcare Setting...........................................................10
1.5.3 Machine Learning in the Context of Placental Histopathology............................11
1.6 Rationale.................................................................................................................................12
1.7 Hypothesis...............................................................................................................................12
1.8 Research Aims.........................................................................................................................13
1.9 Tables and Figures...................................................................................................................14
Chapter 2. (Manuscript 1) Computer Aided Classification of Histopathology Images: A Systematic Review
to Inform Best Practices..............................................................................................................................19
Abstract..........................................................................................................................................20
Introduction...................................................................................................................................22
Methods.........................................................................................................................................25
Search Strategy.................................................................................................................25
Inclusion/Exclusion Screening...........................................................................................25
Data Extraction.................................................................................................................25
Quality Assessment...........................................................................................................26
Results............................................................................................................................................26
Article Selection................................................................................................................26
xiii
Computer Vision Methodology ........................................................................................27
i. Primary Research Aim..........................................................................................27
ii. Image Acquisition (Computer Vision Workflow Step 1).......................................28
iii. Image Pre-processing (Computer Vision Workflow Step 2) ................................29
iv. Tissue Feature Extraction (Computer Vision Workflow Step 3) ..........................32
v. Pattern Recognition and Classifier Training
(Computer Vision Workflow Step 4) ...................................................................34
vi. Algorithm Testing (Computer Vision Workflow Step 5) ......................................35
Risk of Bias........................................................................................................................35
Discussion......................................................................................................................................38
i. Image Acquisition (Computer Vision Workflow Step 1) ........................................38
ii. Image Pre-processing (Computer Vision Workflow Step 2) ..................................41
iii. Tissue Feature Extraction (Computer Vision Workflow Step 3) ............................43
iv. Pattern Recognition and Classifier Training
(Computer Vision Workflow Step 4) .....................................................................44
v. Algorithm Testing (Computer Vision Workflow Step 5) ........................................46
Conclusion.....................................................................................................................................47
References.....................................................................................................................................48
Figures...........................................................................................................................................64
Figure Legends...............................................................................................................................66

xiv
Tables.............................................................................................................................................67
Supplementary Tables...................................................................................................................78
Chapter 3. (Manuscript 2) Automated Segmentation of Villi in Histopathology Images of Placenta.........80
Abstract..........................................................................................................................................81
1. Introduction.....................................................................................................................81
2. Methodology....................................................................................................................82
2.1. Placenta histopathology images...............................................................................82
2.2. Image segmentation.................................................................................................82
2.3. Image preprocessing.................................................................................................83
2.4. Color extraction........................................................................................................83
2.5. Boundary detection..................................................................................................84
2.6. Villi classification.......................................................................................................84
2.7. Detection of touching villi.........................................................................................85
2.8. Evaluation.................................................................................................................87
2.9. Comparison to a previous method...........................................................................87
3. Results...............................................................................................................................87
4. Discussion.........................................................................................................................88
5. Conclusion.........................................................................................................................89
Conflicts of interest........................................................................................................................89
Acknowledgements.......................................................................................................................89
References.....................................................................................................................................89

xv
Chapter 4. (Manuscript 3) Application of Machine Learning to Classify Distinct Patterns of Placenta
Histopathology: A Proof-of-Concept Using Cases of Preeclampsia............................................................90
Abstract..........................................................................................................................................91
Background....................................................................................................................................93
Methods.........................................................................................................................................96
Digital Image Dataset Acquisition and Patient Characteristics.........................................96
Supervised Machine Learning...........................................................................................96
Approach #1 – Semi-Automated Supervised Machine Learning.........................98
Approach #2 – Automated Supervised Machine Learning.................................100
Approach #3 - Supervised hierarchical feature machine learning
(deep learning) ..................................................................................................101
Results..........................................................................................................................................103
Conclusions..................................................................................................................................104
Competing Interests....................................................................................................................111
Author’s Contributions................................................................................................................111
Acknowledgements.....................................................................................................................112
References...................................................................................................................................113
Figures.........................................................................................................................................119
Figure Legends.............................................................................................................................122

xvi
Tables...........................................................................................................................................124
Chapter 5. General Discussion and Conclusions.......................................................................................134
5.1. General Discussion...............................................................................................................135
5.2. Clinical Impacts.....................................................................................................................138
5.3. Limitations and Future Directions........................................................................................140
5.4. Interdisciplinary Perspective................................................................................................142
5.5. Conclusion............................................................................................................................144
References................................................................................................................................................146
Appendices...............................................................................................................................................154
Appendix A. Preliminary Results from Unsupervised Machine Learning Experiments................154
A.1. Distinct clusters in dataset of placenta histopathology images.........................154
A.2. Clinical outcome overlay on histology-based clusters distribution....................155
A.3. Maternal vascular malperfusion severity overlay on histology-based clusters
distribution........................................................................................................156
Appendix B. Research Ethics Certificates.....................................................................................157
B.1. Letter of Administrative Approval from the University of Ottawa Office of Research
Ethics and Integrity..................................................................................................157
B.2. Certificate of Ethics Approval (Renewal) from the University of Ottawa Office of
Research Ethics and Integrity..................................................................................158
B.3. Certificate of Completion of TCPS 2: CORE Course..................................................159
Appendix C. Scholarly Achievements...........................................................................................160

xvii
C.1. Scholarship..............................................................................................................160
C.2. Publications.............................................................................................................160
C.3. Published Abstracts.................................................................................................160
C.4. Workshops...............................................................................................................161
C.5. Presentation............................................................................................................161
Appendix D. Permissions for Publication.....................................................................................162
D.1. Permission to include Automated Segmentation of Villi in Histopathology Images of
Placenta in a thesis..................................................................................................162

xviii
List of Abbreviations
AJCC American Joint Committee on Cancer
ANN Artificial Neural Networks
BRIEF Binary Robust Independent Elementary Features
CAD Computer Aided Diagnosis
CC Cytotrophoblasts Cells
CIE L*a*b* Commission internationale de l’éclairage – Lightness*, Red-Green*, Blue-
Yellow*
CHEO Children's Hospital of Eastern Ontario
CHTN Cooperative Human Tissue Network
CNN Convolutional Neural Network
CT Healthy Controls
CV Computer Vision
CVD Cardiovascular Disease
DAB 3,3’-Diaminobenzidine
DL Deep Learning
EO-PE Early Onset Preeclampsia
EVT Extravillous Cytotrophoblast

xix
FAST Features From Accelerated Segment Test
FGR Fetal Growth Restriction
FN False Negative
FP False Positive
GA Gestational Age
GLCM Grey-Level Co-Occurrence Matrix
H&E Hematoxylin and Eosin
HELLP Hemolysis, Elevated Liver Enzymes, Low Platelets
HSI Hue, Saturation, Intensity
HSV Hue, Saturation, Value
ISOMAP Isometric Feature Mapping
IUGR Intrauterine Growth Restriction
IV Intervillous Space
LBP Local Binary Pattern
LDA Linear Discriminant Analysis
LLE Local Linear Embedding
LOO Leave-One-Out Cross Validation
LO-PE Late Onset Preeclampsia

xx
LPQ Local Phase Quantization
LTSA Local Tangential Space Embedding
MeSH Medical Subject Headings
MCT Mesenchymal Connective Tissue
MDS Multiple-Dimensional Scaling
MIL Multiple Instance Learning
ML Machine Learning
MPFD Massive Perivillous Fibrin Deposition
MRP Mean Rank Plots
MVM Maternal Vascular Malperfusion
ORB Oriented FAST and Rotated BRIEF
PCA Principal Component Analysis
PE Preeclampsia
PMD Placenta Mediated Disease
RCWIH Research Centre for Women's And Infants Health
REB Research Ethics Board
RGB Red Green Blue
SA Spiral Arteries
xxi
SC Syncytiotrophoblast Cells
SE Structuring Element
SIFT Scale-Invariant Feature Transform
STR Villous Tree Stroma
SURF Speeded Up Robust Features
SVM Support Vector Machine
TCGA The Cancer Genome Atlas
TCPS 2: CORE Tri-Council Policy Statement: Ethical Conduct for Research Involving Humans
Course on Research Ethics
TMA Tissue Microarray
TN True Negative
TP True Positive
VC Villi Core
VPRS Variable Precision Rough Sets
VUE Villitis of Unknown Etiology
WSI Whole Slide Images
XAI Explainable Artificial Intelligence
xxii
List of Figures
Chapter 1
• Figure 1.1. Anatomy and histology of the maternal-fetal interface of the human placenta
• Figure 1.2. Placenta histopathology - lesions of maternal vascular malperfusion
Chapter 2
• Figure 2.1. 5-Step computer vision workflow for CAD development on digital histopathology
images
• Figure 2.2. Flow chart of article selection process
• Figure 2.3. Risk of bias summary
Chapter 3
• Figure 3.1. Block diagram of our methodology
• Figure 3.2. Classification of color content in H&E stained images
• Figure 3.3. Example of the red and dark purple class color extraction
• Figure 3.4. Removal of poor-quality areas and artefacts
• Figure 3.5. Breakdown of detection of touching villi
• Figure 3.6. Effect of structuring element characteristics on concavity detection
• Figure 3.7. Sample segmentation of villi
Chapter 4
• Figure 4.1. Machine learning workflow for each experimental approach tested
• Figure 4.2. Data augmentation strategies
• Figure 4.3. Performance confusion matrices for experimental machine learning models tested

xxiii
Appendices
• A.1. Two distinct visual clusters found in the dataset of placenta histopathology images
• A.2. Clinical outcome overlay on histology-based clusters distribution
• A.3. Maternal vascular malperfusion severity overlay on histology-based clusters distribution

xxiv
List of Tables
Chapter 1
• Table 1.1. Description of Tissue-Level Placenta Disease Processes and Associated Lesions
Chapter 2
• Table 2.1. Summary of articles included in analysis
• Table 2.2. Summary of cancer types analyzed
• Table 2.3. Summary of image pre-processing methods (Computer vision workflow stage 2)
• Table 2.4. Summary of feature extraction and dimension reduction methods (Computer vision
workflow stage 3)
• Table 2.5. Summary of classifiers and cross-validation methods (Computer vision workflow stage
4)
• Table 2.6. Summary of maximal performance metric according to different methods employed
(Computer vision workflow stage 5)
• Table 2.7. Recommendations for computer vision methodology on digital histopathology images
• Supplementary Table 2.0.1. MeSH terms and word variants searched in Medline
• Supplementary Table 2.0.2. MeSH terms and word variants searched in Embase
• Supplementary Table 2.0.3. MeSH terms and word variants searched in Scopus
• Supplementary Table 2.0.4. MeSH terms and word variants searched in IEEE Explore
Chapter 3
• Table 3.1. A comparison between our proposed method and the previous work

xxv
• Table 3.2. Overall F1 score and sensitivity of previous method, proposed method without
detection of touching villi algorithm, and proposed method with touching villi detection
algorithm
Chapter 4
• Table 4.1. Demographic characteristics of participants in study
• Table 4.2. Class labelling schemes used in machine learning models
• Table 4.3: Python libraries used for each Machine Learning Approach
• Table 4.4. CNN model architecture
• Table 4.5. Summary of performance metrics for all machine learning models tested

xxvi
Thesis Outline
Chapter 1: Introduction
The introduction provides the relevant background information and rationale for the thesis. Further, the
overarching hypothesis and specific research objectives are presented.
Chapter 2 (Manuscript 1): Computer Aided Classification of Histopathology Images: A
Systematic Review to Inform Best Practices
The first manuscript addresses specific research aim 1. To address the current gap in the literature, this
article presents a systematic review of machine learning methods previously published for used on
histopathology images.
Chapter 3 (Manuscript 2): Automated segmentation of villi in histopathology images of placenta
The second manuscript addresses specific research aim 2, sub-aim 1. This article presents a novel
approach to digitally segmenting individual villi from placenta histology slides. This manuscript has been
published (Comput Biol Med. 2019 Oct;113:103420).
Chapter 4 (Manuscript 3): Application of Machine Learning to Classify Distinct Patterns of
Placenta Histopathology: A Proof-of-Concept Using Cases of Preeclampsia
The third manuscript addresses specific research aim 2, sub-aim 2. This article tests three feature
extraction methods identified in Chapter 2 to develop a machine learning model capable of accurately
classifying placenta histopathology images from healthy controls and cases of preeclampsia.
Chapter 5: General Discussion
The discussion connects the findings from all three manuscripts with a critical interpretation of the
results in connection to the overarching hypothesis for the thesis. The significance of the findings as well

xxvii
as limitations and future directions are included in this chapter along with a discussion related to the
interdisciplinary nature of this project.

Chapter 1
Introduction
1

1.1 The Human Placenta
The human placenta is disk-shaped organ exclusively used throughout the gestational period by the
developing fetus. It is responsible for transporting all gases, nutrients and metabolites to the fetus,
ensuring appropriate development, growth and ultimately survival. The placenta further acts as a critical
endocrine organ, producing hormones that regulate essential maternal adaptations to pregnancy [1].
The human placenta can be divided into two functional compartments (Figure 1.1): the extravillous
compartment (the site of uterine attachment); and the villous compartment (the site of maternal-fetal
exchange). Extravillous cytotrophoblast (EVT) cells of the placenta invade the uterine wall and
participate in transforming the uterine spiral arteries into low-resistance vessels compatible with the
high placenta blood flow required to support rapid fetal growth in late gestation [2]. Maternal blood
exiting the uterine spiral arteries flows into the convoluted intervillous space, which is surrounded by
branching villous structures coated by a single multinucleated layer of fetal syncytiotrophoblast cells
(SC). Under the SC layer is a discontinuous layer of proliferative villous cytotrophoblast cells (CC) and
fetal capillaries embedded in the villous core made up of mesenchymal connective tissue [1]. These villi
are tree-like structures and are the site of exchange between maternal blood in the intervillous space
and fetal blood perfusing the dense capillary networks of the villi [3]. Histological sections of the
placenta show a series of cross-sections through these villous structures surrounded by the
“empty/white” intervillous space, which would normally be filled with maternal blood in vivo [4]. Across
gestation these villous structures continue to elongate and branch, increasing the maternal-fetal
exchange surface area of the organ and decreasing the thickness of the exchange barrier between the
maternal and fetal circulations [1].
1.2 Placenta-Mediated Diseases of Pregnancy
A healthy placenta is essential for a healthy pregnancy. Compromised placental development and/or
function can have significant impacts on the health of both the fetus and mother and are collectively
2

coined placenta-mediated diseases. Placenta-mediated diseases play a causal role in the majority of
serious obstetrical complications faced in our health care system today, including the most common
conditions of preeclampsia (PE) and fetal growth restriction (FGR). Collectively, placenta-mediated
diseases are responsible for half of all pre-term deliveries in Canada [5] and increase the risk of
complications in subsequent pregnancies [6]. This places a substantial burden on our health care
system, with each baby born pre-term as a result of placental disease costing the Ontario Health Care
System up to 50-times that of a healthy baby born at term ($6,500-$90,000 per neonate [7]). While
tremendous strides are being made in the early identification and management of pregnancies affected
by placenta-mediated disease, there is much that we still do not understand with regards to the
divergent underlying causes of these disorders.
1.3 Preeclampsia
1.3.1 Clinical Burden of PE
PE is a life-threatening disorder of pregnancy, characterized by new onset hypertension and multi-organ
dysfunction. This disorder affects 3-8% of all pregnancies and is responsible for 63,000 maternal deaths
worldwide per year [8]. FGR, defined as failure of a fetus to attain optimal intrauterine growth, is a
common co-morbidity in cases of PE. It places the fetus at high risk of pre-term delivery and perinatal
morbidity [9]. Furthermore, many of these babies demonstrate life-long health consequences, with
increased risk of obesity and cardiovascular disease (CVD) in later life [10]. The maternal health burden
of PE also extends well past the perinatal period, as PE is a significant risk factor for CVD in later life [11–
13]. Compared to uncomplicated pregnancies, women with PE have higher rates of premature CVD-
related death [11] and a 2-fold increased risk of future heart disease and stroke [14].
The placenta is central to the etiology of this disorder, and currently the only cure for PE is the delivery
of this organ. Clearly, if severe disease arises early in gestation this cure can put the fetus in
considerable danger due to the iatrogenic effects of preterm delivery. Conversely, if the pregnancy is
3

maintained, maternal health can become significantly compromised. In severe cases mothers can go in
to organ failure (ex. HELLP Syndrome) or go on to develop eclampsia – the onset of seizures due to
dangerously high blood pressure [15]. For this reason, a primary focus of maternal-fetal health research
is on better understanding the mechanisms of disease progression in PE and the identification of
effective prevention and intervention therapeutic options.
1.3.2 Placental Disease in PE
PE is most commonly described as a hypertensive disorder of pregnancy, but the underlying cause of the
disease is placenta mediated, particularly in severe disease [16–19]. Insufficient placental invasion of the
uterine wall and insufficient remodeling of the uterine spiral arteries is thought to results in poor blood
flow to the placenta [20,21]. The oxygen-starved placenta then releases a mix of stress-induced factors
(i.e. pro-inflammatory cytokines, anti-angiogenic factors) into the maternal circulation [22–25].These
factors, released at the level of the uterus, cause damage to the maternal immune and cardiovascular
systems, ultimately leading to clinical maternal disease [26,27]. In this well-characterised ‘two-stage’
model of PE [27], abnormalities in placental development and function early in pregnancy are translated
into pathologies within the mother at later stages of pregnancy. However, clinical presentation,
pregnancy outcomes and observed placental pathologies are all extremely variable between women
with PE [28–31], suggesting that this paradigm of pathophysiology may not be true for all cases of PE.
1.3.3 Evidence of Disease Subclasses in PE
PE is a highly heterogeneous disorder, with differences in the time of disease onset, severity of maternal
symptoms, impact on fetal growth trajectories, pregnancy outcomes and types of placental damage
observed during the placenta pathology examination [32]. The observations of clinical and pathological
heterogeneity observed across the spectrum of PE cases are now viewed as clues to the presence of
distinct subpopulations of PE patients. In this vein, it is hypothesized by several groups [29] that PE is a
4
spectral disorder with several possible underlying disease processes that converge to commonly cause
maternal disease. In the clinical context, PE subtypes are often acknowledged by separation of “early
onset” versus “late onset” disease. This is an important distinction, as women with early onset PE (<34
weeks) have a 20-fold higher rate of maternal mortality compared to women who develop PE closer to
term [33,34]. Fetal growth is more often adversely affected within this group, with ~ 20% of early onset
PE pregnancies demonstrating evidence of FGR [35]. However, this dichotomous split of PE patients still
cannot account for the all heterogeneity observed in PE. A vast “grey zone” of maternal and fetal
outcomes and long-term health risk blurs the line between these two groups.
Detailed placental profiling carried out by our research group recently has demonstrated the presence
of at least 3 distinct and clinically relevant PE subclasses with divergent underlying forms of placental
disease [18,36]. Using unsupervised clustering analysis of placental gene expression and placental
histopathology profiles, three different type of PE pathophysiology were described, including: 1)
“Canonical PE” – resulting from insufficient blood flow and hypoxia within the placenta; 2)
“Immunological PE” – resulting from heightened inflammatory response at the maternal-fetal interface;
and 3) “Maternal PE” – resulting from maternal maladaptation to pregnancy, with minimal involvement
of the placenta. The ability to clearly delineate the disease process underlying a woman’s PE diagnosis is
critical to the discovery of effective therapeutic interventions, and to best council patients with respect
to recurrence risks for future pregnancies and long-term health risks.
1.4 The Role of Histopathology Analysis in Understanding Placenta-Mediated Diseases
Standard of care for pregnancies impacted by a placenta-mediated disease includes the submission of
the placenta for a detailed pathology examination following delivery [37]. During this examination both
gross anatomical descriptions and microscopic observations from histopathology specimens are
recorded and summarized in a narrative pathology report which is included in both the mothers and
5

infants’ medical charts for interpretation by their clinical care teams [38]. These examinations can be
instrumental in understanding the underlying reason for the adverse pregnancy outcome, allowing the
visual damage to the placenta – termed “placental lesions” – to tell a story regarding the disease process
across pregnancy [16,39]. While the gross anatomical descriptions are useful, the bulk of this “story”
really comes from the observations made at the cellular level in the histopathology specimens.
To generate histopathology specimens, full thickness sections from the fixed placenta are mounted onto
glass slides and stained with chemical dyes that highlight morphological features of interest [40].
Hematoxylin and Eosin (H&E) is most commonly used because it stains all cellular components pink or
blue depending on whether they are acidophilic or basophilic [41]. Understanding the structural
morphology of the placenta in healthy cases and comparing them with the morphology in cases of
placenta-mediated disease can help determine which cellular and molecular processes are failing across
pregnancy and provide insight into how to best therapeutically target this disease in the future. In
practice, pathologists look for common visual patterns in histology slides and combine this information
with clinical findings to report on sources of disease progression [39]. Broadly, most placental lesions
can be classified according to ten broad categories of placental disease process, which include: Maternal
vascular malperfusion (MVM); maternal decidual vasculopathy; implantation site abnormalities;
ascending intrauterine infection; placental villous maldevelopment; fetal vascular malperfusion; utero-
placental separation; fibrinoid deposition; intervillous thrombi; and, chronic inflammation [42,43]. Brief
descriptions of these disease process categories, along with distinct placental lesions indicative of these
categories are detailed in Table 1.1.
1.4.1 Placental Histopathology in PE
The most common type of placental injury observed and reported in cases of PE is Maternal Vascular
Malperfusion (MVM) [16,44]. MVM represents a recognizable pattern of placental injury related to
6

altered uterine and intervillous blood flow dynamics and placental tissue oxygenation [45]. Historically
this constellation of lesions were thought to be the result of simple underperfusion of the placenta by
the poorly remodelled uterine spiral arteries, however more recent understanding of this type of
placental injury has expanded to include high velocity and turbulent blood flow into the intervillous
space [46]. Many of the hallmark placental lesions of MVM can be found throughout the villous
compartment of the placenta, each with a distinct visual appearance. Placental lesions associated with
MVM include: Placental Infarcts (glossy discoloured region of the placenta caused by necrosis,
thrombosis, or fibrin deposition [47]); Distal Villous Hypoplasia (sparse, widely spaced distal villi around
thin intermediate villi [48,49]); Increased Syncytial Knots (aggregates of syncytial nuclei on outer surface
of tertiary villi [50]); Advanced Villous Maturation (presence of mature appearing villi for gestational age
[51]); and, Villous Agglutination (clusters of fused terminal villi connected by fibrin or bridging syncytial
knots [16]) (Figure 1.2).
However, as indicated above, PE is highly heterogeneous in its clinical presentation, with variability
extending into the types of placental lesions observed across the spectrum of disease [36]. In fact, work
carried out by our group has indicated that the MVM lesions were restricted to the “canonical PE”
subtype, which encompassed many of the “early onset” cases. Conversely, the “immunological PE”
subclass instead demonstrated placental injury consistent with chronic inflammation and fibroid
deposition – histopathology lesions typically observed in the context of an allograft rejection, suggesting
a maternal-fetal immune incompatibility in this group of PE women. In this small subclass of PE,
accounting for approximately 12% of PE cases examined [18,36], the primary placental lesions observed
were villitis of unknown etiology (VUE) and massive perivillous fibrin deposition (MPFD). These two
lesions also carry a distinct visual appearance, with VUE displaying diffuse areas of lymphohistocytic
infiltration in the villous stroma [52,53] and MPFD characterized by extensive fibrinoid extracellular
material in the intervillous space [54]. Finally, in the third PE subclass identified, the “maternal PE”
7

subclass, very minimal evidence of placental histopathology was observed. The majority of cases had no
sign of placental injury, with some demonstrating very mild forms of MVM.
1.4.2 Current Challenges Faced in Applied Placenta Pathology
The use of placenta pathology examinations, and histopathology examination in particular, has offered
considerable insight into the complexity of placenta-mediated disease pathophysiology and is a highly
informative clinical tool for the management and counselling of patients following an adverse pregnancy
outcome [39,55]. However, this practice is not without its challenges and limitations. Unfortunately,
placenta pathology has historically been plagued by a lack of standardization in diagnostic definitions
and criteria, and institutional practices [56–58]. The Amsterdam Consensus, a working paper put out by
leading experts in this field [59], has sought to directly combat the issue of standardization through a
published series of diagnostic definitions and criteria to be followed around the globe. However, the
examinations proposed by this group require a high degree of sub-specialty training, primarily limiting
the clinical application and utility of these examinations to tertiary care centres.
Further, the placenta is a highly complex organ that is changing across gestation and whose appearance
can be altered by a variety of environmental factors like smoking and nutrition [60,61]. Perinatal
pathologists must consider a variety of clinical correlates when interpreting placental morphology in any
one case. They may analyze hundreds of tissue specimens in a day, most of which are complicated cases
[62,63]. This practice is both costly in hospital resources and can cause fatigue in the analyst. Studies on
clinician fatigue found that agreement between pathologists declined with increased levels of fatigue
[64,65].
In order to address some of these challenges, several clinical aids have been proposed and developed.
One such aid produced by our group is an online synoptic reporting tool that includes Amsterdam
Consensus definitions and diagnostic criteria, along with representative images of different placental
8

lesions [42,59]. While this tool certainly addresses issues of clinical practice standardization across users,
even those with lower levels of subspecialty training, it does not address the significant issue of
workload management and pathologist fatigue. Across all fields of health care there is a push to
incorporate computer aided diagnosis or artificial intelligence into standard of care workflows, to target
issues of resource allocation and practice standardization [62,66,67]. Based on the current challenges
faced in the area of placenta pathology, and the immense clinical utility to improve the health of
mothers and babies, this field is ripe for exploration into how this technology could be applied in the
context of placenta-mediated diseases.
1.5 Applying Machine Learning to Histopathology Specimens
1.5.1 Brief Overview of Machine Learning
Machine learning is the foundational building block for designing artificial intelligence and is based on
the notion that computer algorithms can identify patterns in data and create data-driven models with
minimal human involvement [68,69]. These models perform tasks such as retroactively classifying
existing data, predicting future trends based on old data, or identifying patterns in the data. Machine
learning differs from older methods of statistical modelling because it is developed using automatic rule-
building based on inherent characteristics in the data [70]. With older methods, bias could easily enter
into a model since the algorithm would be based on approximate interpretations of the data from the
developer or researcher. Machine learning addresses much of the bias problem because the algorithm
adapts directly to the data, effectively removing the intermediary bias introduced with human
interpretation of the data [71].
There are two broad categories of machine learning which differ in the structure of the data and
objective of the project [72,73]. Supervised machine learning models are trained on patterns in a
labelled dataset (ex. placenta histopathology images with associated case and control labels) [70,74].
9
The trained model can subsequently be provided with unlabelled data and make accurate label
predictions based on the learning it did in the training phase. Conversely, an unsupervised machine
learning model will identify patterns in unlabelled data (ex. placenta histopathology images with no
associated labels) in order to uncover structure in seemingly disordered data [70,75]. In this type of
learning, the model is trained uniquely on inherent characteristics of the dataset. Unsupervised machine
learning removes all human bias from the model and is often used to explore and identify novel patterns
in complex datasets.
A detailed discussion of the various methods used for supervised machine learning, particularity in the
context of histopathology image analysis, is provided in Chapter 2.
1.5.2 Machine Learning in a Healthcare Setting
Machine learning tools are currently being developed and applied in many different areas of healthcare,
including computerized diagnostic aids (CAD)[67,76–78], personalized medicine[79–82], and patient
decision aids [82]. The healthcare setting is ideal for the exploration and application of machine
learning, as there is a wealth of collected data, human health and disease is complex, and healthcare
resources are currently stretched to their limits. There is no question that artificial intelligence will be
completely integrated into all facets of the healthcare system of the future, likely bringing with it
considerable advances in screening, diagnosis, therapeutic interventions and patient engagement in
health decisions.
With these exciting advances, however, comes a number of challenges and concerns that will need to be
faced head on. First and foremost is the issue of patient privacy and confidentiality. Privacy regulation is
changing in a direction favorable for future secondary use of healthcare data that would benefit owners
of the data [83–87]. This push for publicly accessible healthcare data was born out of the desire for
transparency, advancement of knowledge generation, and research and development opportunities
10

[83,86]. As well, our need for human interaction, interpretation, and compassion in a healthcare setting
may become compromised in the realm of automation-driven healthcare. In order to combat this
problem, we must engage in societal dialog regarding the importance of placing audits and regulations
on the ways we allow new technologies to permeate the patient interactions with care providers.
Despite these concerns, significant success has been achieved by several groups leading the push to
profit from this new technology in a health care setting. In Chapter 2, a comprehensive overview of the
application of machine learning in the field of onco-histopathology is provided – highlighting the
advantage of using this technology to detect and classify a variety of tumors using digitally captured
histopathology images.
1.5.3 Machine Learning in the Context of Placental Histopathology
As detailed in Chapter 2, the application of machine learning to histopathology specimens has almost
exclusively fallen within the realm of onco-histopathology. To date, only a few groups have developed
automated tools to digitally assess components of the placenta, but in all instances these tools focused
on a small number of specific placental lesions (ex. syncytial knots, distal villous hypoplasia) and they did
not employ a machine learning approach [49,88]. The current MSc. thesis project specifically addresses
this gap in the literature, aiming to design an automated classification tool using machine learning on
placental histopathology images.
Having accurate computerized models that could classify placenta specimens in a matter of seconds
could improve issues of inter-observer variability, standardization of practice, and resource pressures.
Further, it would open the door to comprehensive pathology examination in low resource settings
where highly trained perinatal pathologists may not be available. From a research perspective,
computer-driven pattern recognition in placental histopathology images from cases of placenta-
11

mediated disease may help identify novel avenues of investigation as we seek to better understand the
underlying pathophysiology.
1.6 Rationale
The placenta is a vital organ of pregnancy, critical to fetal development and survival. Abnormalities in
the development and/or function of placenta can lead to an umbrella of placenta-mediated diseases of
pregnancy, including PE. Our ability to properly identify placental disease processes underlying
obstetrical complications, and properly council patients on issues of recurrence and long-term health
risks, heavily relies on highly trained perinatal pathologists to perform a comprehensive examination of
the placenta at the histological level following delivery. However, the clinical utility of this examination is
highly dependent on the subspecialty training on the reviewer and resources allocated. Further, this
field is plagued with issues of poor standardization and reviewer fatigue. Machine learning modelling
has been identified and tested as a tool to address similar limitations in other domains of pathology,
with the field of onco-pathology leading the charge in the development and application of automated
machine learning tools for clinical application. To date the application of similar machine learning tools
have been applied in a very limited scope to the field of obstetrics, with no clinical applications to date
focused on the examination of the placenta following delivery. If placenta image models are successful
in automatically detecting lesions of interest, they can help automate aspects of placenta pathology and
aid in the classification of placenta mediated diseases – ultimately addressing the previously mentioned
limitations.
1.7 Hypothesis
A computerized model developed with machine learning can recognize distinct morphological features
in human placenta histopathology images and could be applied to automate detection of placenta-
mediated diseases.
12

1.8 Research Aims
Research Aim 1: To perform a systematic review of the literature to identify different machine learning
methods that have been successfully applied to histopathology specimens.
• Sub-aim: To propose best practices for methodology selection when applying machine learning
models to histopathology related research questions.
Research Aim 2: To apply and compare different methods of supervised machine learning to detect
morphological features in human placenta histopathology images.
• Sub-aim 1: To develop an automated segmentation tool capable of identifying and extracting
unique features of relevance from individual chorionic villi structures in human placenta
histopathology images.
• Sub-aim 2: To apply and compare two supervised machine learning algorithms in the
classification of human placenta histopathology images from healthy controls and cases of PE.
In this thesis, a series of manuscripts will be presented, each of which addresses one of the research
aims and/or sub-aims.
13

1.9 Tables and Figures Table 1.1. Description of Tissue-Level Placenta Disease Processes and Associated Lesions
Category of placental disease
process
Description Representative lesions [42]
Maternal vascular malperfusion
(MVM)
A recognizable pattern of
placental injury related to
altered uterine and intervillous
blood flow dynamics and
placental tissue oxygenation
[45]
• Placental infarct
• Distal villous hypoplasia
• Accelerated villous
maturation
• Increased syncytial knots
• Villous agglutination
Maternal decidual vasculopathy Abnormal transformation of the
uterine vascular structure in the
decidua [89]
• Insufficient vessel
remodelling
• Fibrinoid necrosis
Implantation site abnormalities Abnormal trophoblast invasion
depth or site [90]
• Microscopic accreta
Ascending intrauterine infection Compromised cervical mucus
barrier, permitting ascension of
pathogens into the uterine
cavity [91]
• Maternal inflammatory
response (stage, grade)
• Fetal inflammatory
response (stage, grade)
Placental villous
maldevelopment
Either a predominance of non-
branching angiogenesis
resulting in long filamentous
• Chorangiosis
• Chorangiomas
14

terminal villi with unbranched
capillary loops or knob-like
clusters of richly developed and
hyper vascularized terminal villi
resulting from low-grade
hypoxia [92]
• Delayed villous maturation
Fetal vascular malperfusion An obstruction in fetal blood
flow in any location of the
placenta vascular tree from the
umbilical vessels to the terminal
villi [93]
• Avascular fibrotic villi
• Thrombosis
• Intramural fibrin
deposition
• Villous stromal-vascular
karyorrhexis
• Stem villous vascular
obliteration
• High grade fetal vascular
malperfusion
Utero-placental separation Premature separation of the
placenta from the uterine lining
likely due to abnormal
trophoblast invasion and
rupture of spiral arteries [94]
• Chorionic hemosiderosis
• Presence of retroplacental
adherent hematoma
15

Fibrinoid deposition Overabundance of
extracellularly deposited fibrin-
containing material within the
intervillous space [95]
• Increased focal perivillous
fibrin deposition
• Massive perivillous fibrin
deposition
Intervillous thrombi Pathologic coagulation of blood
within intervillous space which
often displaces chorionic villi
[96]
• Intervillous thrombi
Chronic inflammation Infiltration of lymphocytes,
plasma cells and histiocytes in
the villous tree, basal plate,
extraplacental chorioamniotic
membranes, and chorionic plate
of the placenta [97]
• Villitis of unknown etiology
• Chronic intervillositis
• Chronic plasma cell
deciduitis
• Chronic chorioamnionitis
(Grade, stage)
16

Figure 1.1. Anatomy and histology of the maternal-fetal interface of the human placenta. A.
Illustration of the interface between the villous compartment (fetal side) and the surrounding extra
villous compartment of the human placenta. Three types of differentiated trophoblasts cells are shown:
a multinucleated single cell layer of syncytiotrophoblast (SC) cells forming the boundary between the
villous tree and the intervillous space (IV), cytotrophoblasts (CC) within the villous tree stroma (STR), and
extravillous trophoblasts (EVT) anchoring the placenta to the decidua and remodelling the spiral arteries
(SA). B. Cross section of the villous tree at 40x magnification of terminal villi surrounded by intervillous
space.
Maternal Side
Fetal Side
Myometrium
Decidua
Blood
SA EVT
IV
SC
CC STR
IV
STR
SC
A.
B.
17

Figure 1.2. Placenta histopathology - lesions of maternal vascular malperfusion. Digital images of
placentas from PE pregnancies captured at 20X magnification in Aperio Scanscope. A) Placenta Infarcts:
villous crowding and coagulation in intervillous space observed in a week 31 placenta. B) Distal Villous
Hypoplasia: appearance of thin sparse intermediate villi surrounded by small terminal villi in a week 33
placenta. C) Increased Syncytial Knots: clusters of syncytiotrophoblast nuclei seen on outer layer of
terminal villi in a week 32 placenta. D) Advanced Villous Maturation: small villi with increased syncytial
knots and increased fibrin deposition observed for gestational age in a week 33 placenta. E) Villous
Agglutination: bridges formed between terminal villi with syncytial knots or intervillous fibrin in a week
29 placenta.
18

Chapter 2
Computer Aided Classification of Histopathology Images: A Systematic Review to Inform Best Practices
Mukherjee A1, Leckie M2,3, Patnaik P1, Chan ADC4, Grynspan D3,5, Bainbridge SA1,6.
11Interdisciplinary School of Health Sciences, University of Ottawa, Ottawa, Ontario, Canada. 2Department of Physiology, University of Toronto, Ontario, Canada. 3Department of Pathology and Laboratory Medicine, Children’s Hospital of Eastern Ontario, Ottawa, ON, Canada. 4Department of Systems and Computer Engineering, Carleton University, Ottawa, Ontario, Canada. 5Department of Pathology, Vernon Jubilee Hospital, Vernon, British Columbia, Canada. 6Department of Cellular and Molecular Medicine, University of Ottawa, Ottawa, Ontario, Canada.
This manuscript was formatted for submission to the peer-reviewed journal Archives of Pathology & Laboratory Medicine.
19

Abstract:
Context: Computer-aided diagnosis (CAD) has revolutionized several domains of medical image analysis
over the past few decades but has yet to be adopted into clinical pathology practice. Clinical
histopathology examination is a prime candidate for CAD-based applications, as issues of procedural and
diagnostic standardization have plagued this field for years due to the subjective nature and high
degrees of intra- and inter- personal/institutional discrepancies in reported diagnoses. A significant
deterrent to clinical adoption in pathology is the lack of a standardized protocol for CAD model
development for applications to histopathology images, which makes safety and efficacy testing a
challenge. Having a standard protocol for the development of such tools is necessary to provide a gold-
standard against which models can be evaluated, and once in place, it would facilitate their transition to
clinical use.
Objective: To conduct a systematic review of the current methods of CAD development and application
to histopathology image datasets and provide recommendations for best practice.
Data Sources: The databases Medline, Embase, Scopus, and IEEE Explore were used to identify all
applicable articles.
Methods: A total of 230 articles were retrieved from a MeSH term search in the 4 academic databases
listed above. After three authors conducted full text screening with moderate agreement (weighted
Kappa scores of 0.47-0.71), 18 articles remained to be analyzed. Articles were assessed for common
methodological elements and for the performance of machine learning classifiers on histopathology
image. The results reported, discussion in the articles, and information from current literature was used
to propose a set of recommendations to guide researchers in applying the 5 steps to develop machine
learning tools on histopathology images.
20

Results: All studies that passed through screening had 5 common methodological elements: image
acquisition, image preprocessing, tissue feature extraction, pattern recognition and classifier training,
and algorithm testing. One or more recommendations were proposed for each of the 5 elements based
on the findings in the articles and the available literature.
Conclusions: While a wide variety of approaches were used, all studies followed a 5-step workflow to
develop classification models for histopathology images. The articles assessed focused uniquely on
onco-histopathology images, but due to the adaptive nature of machine learning, the techniques
presented can be applied to datasets relevant to other disease states. The guidelines proposed should
be used to inform experimental design in future machine learning projects on histopathology images
across pathology domains.
21

Introduction:
Histopathology analysis is one of the primary methods for assessing disease progression in a variety of
tissues, but continues to face challenges in an ever evolving clinical environment1,2. Analysis of whole
slide images (WSI) captured from histological specimens requires pathologists to detect subtle visual
patterns in complex tissues, which can be challenging, time-consuming, and lead to high rates of inter-
observer reporting differences3,4. As such, a strong case has been made for the development and
integration of computer aided diagnostic (CAD) tools for clinical histopathology image analysis3,5,6. CAD
applications in the field of pathology use mathematical models to classify an input image according to a
clinical output of interest, such as diagnosis or prognosis, helping to standardize the evaluation of
clinical specimens and provide decision support for pathologists3–5. Historically, developing such
mathematical models on histopathology images was nearly impossible due to the complexity and size of
high-resolution WSI4,7,8. However, the increasing popularity and accessibility of machine learning (ML)
model development has rendered CAD applications within reach for this clinical domain9.
Supervised machine learning algorithms allow for automated model development with minimal human
intervention, with the model “learning” inherent characteristics in the training dataset.10–12 In the case
of histopathology image analysis, a branch of machine learning termed Computer Vision is applied, in
which the model is trained to recognize distinct visual features in the images that are unique to the
labeled clinical outcome of interest (i.e. diagnosis, prognosis, etc). 13–15 Once the model is adequately
trained, it can predict (i.e. classify) the clinical outcome of interest in a set of unseen and ultimately
unlabeled images, based on the absence or presence of these same visual characteristics16. Machine
learning model development and assessment, in the context of Computer Vision applications, typically
follows 5 fundamental steps 4 (Figure 1):
22

Step 1) Image acquisition and data preparation4,8,14,17,18 – Digital images are captured from clinical
specimens of interest. Tissue samples can be acquired from large public databases or from private
hospital collections. Images are annotated or labeled according to the desired clinical categories to be
predicted by the model. At this stage, all original annotated image data can be split into model training,
validation and testing datasets.
Step 2) Image pre-processing4,14 - Image transformations and data augmentation are conducted on all
images. These transformations help to normalize non-biological visual variations across specimens and
to augment the size of the original dataset to ensure robust model development.
Step 3) Tissue feature extraction4,14,17 – Automated extraction of visual features of interest is conducted,
ideally extracting features that may be different across the groups of clinical interest17. Dimension
reduction is often applied at this step4,19, aiming to reduce the computational power required to process
all of the data and remove redundant features.
Step 4) Pattern recognition and classifier training (model development)4,14,17,18 – An iterative process in
which the algorithm “learns” visual characteristics in each image, unique to the clinical labels applied to
the training dataset. The model is punished for errors in classification until the rate of correct
classification improves and reaches a stable classification accuracy4,20. The resulting product is a trained
classifier (model) that can predict a clinical classification label based on the rules adopted during
training. Cross-validation can be applied to fine-tune model training and can provide a reliable estimate
of classifier performance 21,22.
Step 5) Model testing4,14 - The developed classifier is tested on an unseen image dataset – the testing
subset22. Model classification performance is assessed through comparison of model outputs to ground
truth image labels.
23

Despite considerable advances in CAD-based research focused on clinical applications, to date we have
yet to see a translation of this technology into clinical practice. The highly technical language used in the
majority of papers on this topic, coupled to a lack of standardized protocols for the development,
application and assessment of histopathology-based CAD tools have certainly been limiting factors for
clinical translation. A 2013 survey on CAD support systems declared insufficient testing and validation as
the primary barrier for clinical adoption23, with the identification of published systematic methods for
developing and assessing the utility of these tools identified as key to overcoming this barrier. As such,
the purpose of this systematic review was to provide a comprehensive review of the CAD model
development and validation protocols that have been reported to date for clinical histopathology image
analysis. It is anticipated that by consolidating this information and proposing an accessible standard
guideline for best practices, the barriers for clinical adoption of CAD technology in histopathology can be
overcome.
In the current review, a systematic analysis of 18 articles which applied the above-mentioned Computer
Vision workflow for purposes of histopathology analysis is presented, including a comparison of model
performance according to methods used. The findings are an important first step in the identification of
the best practice for applying commuter-aided diagnosis in the clinical pathology environment.
24

Methods:
Search strategy
The York protocol for systematic reviews24 was employed, using a search of 4 primary biomedical,
clinical science, and engineering databases (Medline, Embase, Scopus, and IEEE). A combination of
relevant MeSH terms, keywords, and word variants were used (Supplementary Table 1). A scan of all
identified articles was performed to remove any duplicate articles.
Inclusion/Exclusion Screening
All articles were assembled in reference manager software (Mendeley), and 3 reviewers (A.M., D.G., and
M.L.) performed the initial screening of titles and abstracts for inclusion/exclusion criteria. Primary
inclusion/exclusion criteria were: 1) a primary research aim which included image segmentation or
image classification; 2) methods that were being applied to digital histopathology specimens from
humans; 3) primary objective related to clinical utility of CAD technology (not solely for the purpose of
basic scientific investigation). All tissue and disease subtypes were included provided they met the
above criteria. Conference proceedings, provided all other criteria were met, were included, however
reviews, book chapters, and papers discussing methods that are not routinely used in clinical pathology
practice (ex. focused exclusively on nuclear texture, immunohistochemistry quantification, or prognostic
immunohistochemistry) were excluded. The level of reviewer agreement was assessed by comparing
screening decisions from each reviewer and measured using a weighted Kappa score25. Disagreements
were resolved through joint discussion until a consensus was reached. Subsequently, a full-text
screening was performed by 2 reviewers (A.M and M.L.) on articles that passed the initial screening to
ensure they met the inclusion/exclusion criteria listed above.
Data Extraction
25

Following a full‐text screening of each article, author A.M. identified seven recurring methodological
themes: description of cancer tissue type (ex. brain, thyroid, etc.), image pre‐processing methods,
feature extraction methods, dimension reduction methods, classifier(s) used, cross‐validation method,
training/classifier performance. With this list of themes in mind, an excel data extraction template was
devised to enable consistent data collection from each article. The data extraction template contained
the list of studies on one axis and the list of common elements on the second axis so that the same raw
data would be collected for each study, regardless of the author extracting the data and regardless of
whether a method was absent in a particular article. Authors A.M. And M.L. systematically extracted
methods presented in each article along the dimensions in the excel template.
The raw data from the excel template was later refined (ex. Dimension Reduction was grouped with
Tissue Feature Extraction) to fit into the five standard steps of a computer vision workflow (Figure 1): 1)
Image Acquisition, Image Pre‐processing, Tissue Feature Extraction, Pattern Recognition and Classifier
Training, and Algorithm Testing. The results were then extracted into tables (Tables 2‐6) summarizing
the different methods used in each step along with which articles used said methods.
Quality Assessment
A risk of bias and assessed applicability analysis of each article was performed using the QUADAS‐II tool
for diagnostic tests of accuracy (under the Cochrane Guidelines for Systematic Reviews)26. To our
knowledge, there are no quality assessment tools unique to CAD‐based diagnostic application, however
the flexibility with QUADAS‐II tool allowed for customization of this analysis to the current literature
dataset. Reviewers A.M. and P.P. assessed the following categories for each paper: 1) Patient Selection,
2) Index Test (new diagnostic test), 3) Reference Standard (original validated protocol for diagnosis), and
4) Flow and Timing (process patient undergoes to compare reference standard and index test). Risk of
26

bias for articles for the Reference Standard and Flow and Timing criteria were judged to be unclear
when there was no information on how the pathologists assigned ground truth labels.
Results:
Article Selection
The initial article search yielded 230 articles, with 209 removed following screening of the title and
abstract and another 3 removed following full text screening for inclusion/exclusion criteria. Reviewer
agreement on the inclusion of articles during screening was moderate to good based on weighted kappa
scores27. Weighted kappa scores between reviewers were: 0.71 (A.M. ‐ D.G.), 0.55 (D.G. ‐ M.L.), and 0.47
(A.M. ‐ M.L). 10 articles were discussed for discrepancies in screening to reach a consensus on articles to
be included. The final dataset comprised of 18 articles that met the specific criteria outlined above
(Figure 2). A list of the papers included for analysis by author and year is included in Table 1. All 18
articles applied their methods to cancer‐related histopathology specimens including brain, breast, colon,
kidney, larynx, ovary, prostate, skin, and thyroid cancer (Table 2).
Computer Vision Methodology
i. Primary Research Aim
All articles analyzed had a primary research aim of automating diagnostic classification of clinical
histopathology images. Small differences in identified research objectives stemmed from differences in
tissue and/or disease subtypes included in the datasets. For example, prostatic adenocarcinoma severity
is measured using the Gleason scale28, so training labels/classifiers used were in reference to the
corresponding Gleason scores29,30. All articles used either a non‐biased approach, using textural patterns
in the histopathological images31, or relied on explicit segmentation of biologically relevant features (i.e.
nuclei)32. In individual instances, articles explored both approaches described above, along with many
different classifiers, and reported and compared the results from each33. Most papers used visual
27

elements of an image to train an image classifier, with the goal of automating prediction of clinical
diagnosis in unseen images (ex. Benign vs malignant tumor). However, Ninos et al.34 and Yu et al.35 used
their classifiers to predict patient survival rates, and were included as the methods used followed the
same 5‐step computer vision workflow described (Figure 1).
Image classification categories (i.e. labels) reported in the included papers were: Gleason score29,30,
benign vs malignant tumor33,36, glioblastoma stages37,38, American Joint Committee on Cancer (AJCC)
melanoma stages31, ovarian carcinoma subtypes39, renal carcinoma subtypes40, tumor vs non‐tumor35,41–
43, thyroid follicular adenoma vs. thyroid follicular carcinoma vs. healthy thyroid36, colorectal cancer
subtypes44, good vs. poor prognosis34,35, low vs. high grade laryngeal cancer45, and healthy thyroid vs.
papillary thyroid carcinoma32.
ii. Image Acquisition (Computer Vision Workflow Step 1)
A number of studies used large publicly available histopathology image databases for image acquisition.
These included the BreakHis dataset33,38, The Cancer Genome Atlas (TGCA)35,46,47, the Trans Canadian
Ovarian Cancer Dataset39, the Stanford TMA database35, the Cooperative Human Tissue Network
(CHTN)31 and the PETAACC‐3 dataset44. The articles that did not use a public database retrieved and
digitized a small number of archived samples from a local hospital or university29,34,36,45,48 or did not
specify the origin of the histopathology images used40–42,49,50. Sample sizes varied widely across studies
(Table 1), ranging from 7‐742 individual patients and 15‐21860 individual images, with some groups
failing to indicate the number of patient samples used37,43. Only Xu et al43. mentioned using a sample
size for each class that reflects the true prevalence of the lesion(s) in question.
Histopathology specimens were prepared from original tissue samples using standard procedure: tissue
fixation, embedding in paraffin wax, and sectioning with a microtome51. Embedded tissue sections were
then mounted on glass slides, stained with H&E, p63, Feulgen stain, or DAB, covered with a glass slip,
28

and digitally scanned. Images were taken with a light microscope paired with an RGB digital camera or
with a high‐resolution glass tissue slide scanner, most commonly at a magnification of 40X. Some
databases had previously acquired images at multiple resolutions (40X, 100X, 200X, 400X). The digital
image file types most commonly used were Whole Slide Images (WSI) and Tissue Microarrays (TMA),
and were in the SVS file format which contains a pyramid of images at multiple magnifications52. Images
included in the pyramid usually range from 240x240 pixels to 1024x768 pixels. SVS files of scanned
histopathology tissue were often greater than 1 Gb in size7.
iii. Image Pre‐processing (Computer Vision Workflow Step 2)
Image pre‐processing is the process of applying a series of transformations to images before feeding
them to a classifier. This step is often done in preparation for feature extraction to ensure all images are
uniform4. Four pre‐processing techniques were identified in the article dataset: 1) augmentation; 2)
colour transformations; 3) data cleaning; and, 4) automatic segmentation. All articles used some
combination of these four methods. Yang et al.36 did not report using any preprocessing on their data.
Table 3 contains a summary of image pre‐processing methods used in each article. Selective discarding
of poor‐quality tissue sections or images is included as a separate category in Table 3, however, for
simplicity it is categorized under data cleaning in the description below.
Data augmentation involves increasing the number of examples a classifier can learn from. Data
augmentation is achieved through random image transformations such as rotation, flipping, and
stretching at each round of training and/or by extracting multiple image patches from the original image
prior to training, increasing the size of the training dataset18,53. Data augmentation is particularly crucial
in computer vision applications, allowing developers to address the requirement for large training
datasets in the face of ethical and/or financial constraints which may limit the number of original patient
samples available for ML development53,54. This technique also provides an opportunity to address
29

inherent problems in a dataset, such as class imbalance. In this case, under‐represented clinical classes
can be specifically augmenting in the dataset, removing any possible bias introduced in the model
training phase through uneven class distribution54,55. In articles reviewed, fifteen of eighteen articles
reported using data augmentation in their workflow. The primary method of data augmentation was
multiple image patch extraction. Extracted image patches ranged in size from 32x32 to 2000x2000
pixels, sometimes capturing hundreds of small overlapping patches from across the original image, or
randomly selecting a small number (10‐20) of representative patches from each original image. In some
cases, the augmentation method used included the extraction of patches from the same image at
multiple magnifications33. Bayramoglu et al.38 also described rotating and flipping images as part of their
augmentation method, further helping a classifier learn more variations of image features.
Many articles reported manipulating the image colour in the pre‐processing step. Either the images
were converted to greyscale, or they were converted to HSI (Hue, Saturation, Intensity), HSV (Hue,
Saturation, Value), or CIE L*a*b* (Commission internationale de l’éclairage – Lightness*, Red‐Green*,
Blue‐Yellow*) colour spaces55,56. Converting images to greyscale reduces the complexity of an image,
reducing the image from 3‐4 channels (ex. red, green, blue (RGB)) to 1 channel (grey)55. Greyscaling
images also helps to highlight dark areas, which can facilitate segmenting objects of interest, such as
nuclei37,55. Non‐greyscale colour transformations, such as converting an RGB image to HSV format, were
used in one article that tried to mimic the process a pathologist would use to analyze images42. In this
article, colours closer to those interpreted by the human eye were chosen, rather than simply RGB
colours55. Three groups deconvolved the images into separate hematoxylin and eosin channels because
they found less redundancy in the features extracted from those channels as opposed to the RGB
channels. DiFranco et al.30 tested several colour channels to determine which (alone or in combination)
yielded better classification results and found that b* channel features from a CIE L*a*b* colour space
provided optimal results.
30
Data cleaning is another pre‐processing step that involves inspection of the data in order to remove
outliers and images containing little or unusable data4. In the case of histopathology images this could
include artefacts on slides, folds in tissue, areas of inconsistent staining57, or poor scanning quality52. To
mitigate this problem, several authors chose to have a pathologist manually select regions of interest
within slides30,33,34,38,42,48, discard images or patches of poor quality33,38,42,48, automatically discard images
containing too little information39,48, or exclude objects based on size threshold45. In the context of
computer vision, data cleaning may also include reducing the complexity of images. Articles in this
search reported using smoothing, noise reduction, and increasing contrast of image datasets to amplify
important patterns and facilitate feature selection. For histopathology images, normalization during the
data cleaning stage of pre‐processing can specifically address a common issue unique to histopathology
specimens ‐ differences in staining intensity58. Normalization involves modifying the intensity of the
pixels in an image by a scaling factor to achieve consistency between different images18,58,59. A common
approach was Min‐Max scaling, which shifts the possible pixel values to a consistent range for all
images60.
While some articles chose to classify images based on the global appearance of images, others felt it
more pertinent to segment objects of interest prior to classification. Automatic segmentation is used to
pre‐select and extract objects or regions of interest within an image that are relevant to the clinical
outcome (ex. nuclei from malignant cancer cells)61. Seven articles reported using segmentation to isolate
regions of interest in images prior to classifier training. Open source and commercial software packages,
such as CellProfiler, OpenCV, and MATLAB, are currently available to aid in image segmentation, and
were used in several of the reviewed articles33–35,37,39,40,62. Algorithms used to segment nuclei included
random field graph cut63, active contours64, fuzzy c‐means clustering65, PSO‐based Otsu level
thresholding66, density‐based clustering67, and curvelet transform29. Most of the algorithms described
above are available through free software such as ImageJ68, or can be implemented with common
31

coding languages such as Python. However, Curvelet transform was a novel method developed by Lin et
al.29
iv. Tissue Feature Extraction (Computer Vision Workflow Step 3)
Feature extraction involves converting an image from a raw set of pixels to a numeric representation of
an image with real‐world relevance (ex. number of cancerous nuclei in an image), or that is less
computationally expensive to analyze (ex. quantifying textures found in an image)4. In the reviewed
articles, global texture feature extraction30,31,33,36,41,42,44 or object level (clinically relevant) feature
extraction48,49 methods were employed, with some groups testing and comparing both
approaches29,34,35,37,39,40. As well, two articles extracted keypoint descriptors, which are points of interest
in an image that can be used to identify it at any scale33,43. Ninos et al.34 additionally included patient
information as a feature to train their classifier.
To carry out global textural and spatial feature extraction there are several programs available to
researchers, with the feature extraction toolboxes provided in MatLab and CellProfiler62 used in some
of the reviewed articles to extract over 9000 features30,31,34,35,40,43. Global features described in the
articles retrieved can be categorized into: Local Binary Pattern (LBP)69, Local Phase Quantization (LPQ)70,
Grey‐Level Co‐occurrence Matrix (GLCM)71, Haralick features71, wavelet features72, and Gabor features73,
and keypoint descriptors74,75. The most commonly used Keypoint descriptors include SIFT76, SURF77,
ORB78, FAST79, and BRIEF33,80. We direct the reader to Spanhol et al.33 for a description of LBP, LPQ,
GLCM, and keypoint features, and to the Appendix in Wang et al.48 for a brief description of Haralick
features, wavelet features, and Gabor features.
A total of 9 articles instead used an object level feature extraction approach, with common extracted
features including area, convexity, and circularity29,34,35,37,39,40,45,48,49. Object level features are attractive
for analysis on histopathology images because they are computed on objects pre‐determined to be
32

clinically relevant in an image (ex. nuclei, tumour regions)4,81. The drawback is that this step may
introduce human bias or error into a classifier if objects of interest are manually segmented, or if
thresholds for automatic thresholding are inappropriate. Object level features include elliptical, convex
hull, bounding box, boundary, and other shape features37. Table 1 in Fukuma et al.37 presents a
comprehensive list of object level features and their organization into the five categories listed above.
These shape features are commonly used to distinguish cancer and healthy samples in digital pathology,
and they describe shape elements such as area, perimeter, convexity, and eccentricity of an object48.
The articles we examined reported extracting between 10 – 9878 features per image. When too many
features are used, some may be redundant and no longer help the classification algorithm discriminate
between classes. In these cases, dimensionality reduction is used to reduce the length of the feature
vectors that describe each image and increase the efficiency of classification82. Dimension reduction
methods reported in the articles retrieved include: Greedy Hill Climbing83, Pearson’s Correlation84,
mRMR85, Linear Discriminant Analysis (LDA)86, Dissimilarity Matrix87, Fisher Score88, Wilcoxon’s
Correlation89, Variable Precision Rough Sets (VPRS)90, Mean Rank Plots (MRP)91, Principal Component
Analysis (PCA)92, Multiple‐Dimensional Scaling (MDS)93, Local Linear Embedding (LLE)94, Isometric
Feature Mapping (ISOMAP)95, Local Tangential Space Embedding (LTSA)96, Point Biserial Correlation97,
and Information Gain Ratio98. Yang et al.36 tested MDS, PCA, LLE, ISOMAP, and LTSA with 3 to 4000
dimensions and reported that ISOMAP performed the best. Jothi et al.99 described and tested the VPRS
based b‐reduct methods with a closest matching rule classifier and achieved 100% classification
accuracy. Rough Set Theory100 (the basis of VPRS) has previously been used to reduce image features in
various medical image types such as mammograms, Computed Tomography, and Magnetic Resonance
Images99. An alternative approach described by Yu et al.35 and Orlov et al.31 was to determine the
optimal number of features using the cross‐validation results. DiFranco et al.30 also used a random forest
classifier, which provides feature importance by counting the number of times a feature is selected in
33

each decision tree. (See Results – Classifiers and cross‐validation). Table 4 includes a summary of feature
extraction and dimensionality reduction methods included in each paper.
v. Pattern Recognition and Classifier Training (Computer Vision Workflow Step 4)
Classifier training is the fundamental stage in developing an ML model where it sets rules by which the
algorithm will distinguish between classes4. Fine‐tuning of the training is carried out using cross‐
validation methods which can provide a reliable estimate for how well the model is performing by
plotting a learning curve that shows the rate of improvement of performance on a portion of the
training data over rounds of training. A summary of classifiers and cross‐validation methods used in the
selected articles is included in Tables 5. Types of classifiers applied in the selected articles were: Support
Vector Machine (SVM)101, Nearest Neighbors102, Decision Tree103 and Random Forests104, Bayesian105,
Boosting106, Neural Networks107, Multiple Instance Learning (MIL)108, Discriminant Functions109, and
novel classifiers32. Differences between classifiers lie in the mathematical approach to creating a
decision boundary. Some articles chose to apply ensemble‐based learning, where the output from
multiple classifiers was used to improve the overall accuracy30. Support vector machine (SVM) was a
popular choice of classifier in the article dataset, appearing in at least one experiment in 11/18
articles29,30,33,35–37,39,42–44,48. The SVM classifier finds a set of hyperplanes in the n‐dimensional feature
space that has the longest distance to the nearest training points of other classes48. They can be paired
with different kernels (linear, quadratic, radial based Gaussian) to fit the data better. This classifier
works well for large feature spaces, which usually is the case for histopathological image data.
In 8 articles reviewed30,33–36,43,45,48, cross validation methods were used to fine tune the parameters used
during the training phase and assess computational needs using a learning curve, although some
articles29,31,32,37–40,44 only reported using cross validation to evaluate model performance (Computer
Vision Workflow Step 5) or employed both uses of cross validation34,36,43,45,48. Broadly, this method
34

involves splitting the training dataset into smaller training/validation sets (ex. training set split into 80%
for training and 20% for validation) and evaluating the rate of improvement of performance on the
portion of data reserved for validation in order to tune parameters and assess how much computing
resources are required for a project. Types of cross‐validation methods reported in the reviewed articles
included K‐fold110, Leave‐One‐Out (LOO)111, Sequential Backwards Selection112, Jackknife113, and
Bootstrap113. Differences between cross‐validation methods stem from how training dataset is split at
each round of training. LOO, Bootstrap and Jackknife cross‐validation involve testing every possible split
of data to obtain optimal results, whereas the others involve splitting the data into a discrete number of
portions for validation.
vi. Algorithm Testing (Computer Vision Workflow Step 5)
To assess the performance and generalizability of a developed ML model, an unseen test dataset is fed
into the model and the predicted output labels are compared against the “Ground Truth” labels of the
dataset. All articles reviewed were retrospective studies comparing image classification based on
manual pathology evaluation (ground truth) vs. ML model evaluation on the same task. ML model
performance was measured as a combination of true positives (TP), true negatives (TN), false positives
(FP), and false negatives (FN). These can be combined in many ways to punish errors that are less
acceptable in a given problem. In the articles analyzed, accuracy ((TP + TN) / number of images) was
most commonly used as the primary performance measure29,31,33,34,36–42,44,45,48,49. Reported accuracies for
the methods presented ranged from 65% ‐ 100%. Orlov et al.31, Wang et al.48, and Jothi et al.32 reported
achieving 100% accuracy in at least one developed model. They used a nearest neighbor classifier, an
SVM, and an SVM and Decision tree combination respectively to achieve these results. A summary of
the optimal model performance achieved in each article is summarized in Table 6.
Risk of Bias
35

The QUADAS‐II tool was used to assess the risk of bias and applicability of the included articles, with the
results summarized in Figure 3. Overall, the risk of bias was low for all articles, except for rare cases
where one of four categories of assessment were considered high risk37,40,42–44. In most cases, the reason
for the high risk of bias was that it was unclear whether or not patient selection was biased40,42–44.
Several of the articles accessed cancer histopathology images from a database of samples previously
collected, and authors did not disclose whether they recruited representative patients, whether patients
were randomly enrolled, or whether there were any inappropriate exclusions of patients. The articles by
Budinska et al.44, Mete et al.42, and Yu et al.35 were deemed to have a high risk of bias for the Patient
Selection criterion, as they did not describe how patients were selected and did not include a clinically
representative distribution of cases. Yu et al.35 explicitly stated in their discussion that because they
obtained their cases from a public database (TCGA), there was an overrepresentation of cases where
morphological patterns of disease were obvious and might not reflect what a pathologist would see in
clinical practice35.
For the most part, we found that articles scored low on the risk of bias for the Index Test criterion.
Contrary to a standard diagnostic test of accuracy, where a clinical researcher would be applying a new
test and comparing it to previous standards, in the articles retrieved, a computer performed the new
test analysis. An automated tool removes subjectivity and ensures the reproducibility of results. In some
articles, it was unclear whether regions of interest were selected or discarded systematically, so the risk
of bias for the index test criterion could not be definitively assessed. The article by Fukuma et al.37
demonstrated a high risk of bias, as they did not split their data into training and test sets and they did
not report results from all classifiers. If their classifier was evaluated on the same data it was trained on,
the accuracy would be falsely high. The assignment of ground truth labels was often unspecified in cases
where images were obtained as a secondary source from a database. Finally, there were few concerns
36

regarding the applicability of the articles to the original research question for this study, as very
stringent inclusion and exclusion criteria were applied to article selection in respect to this criterion.
37
Discussion:
The application of computer vision as a CAD aid in the field of clinical histopathology has tremendous
potential, yet the complexity and wide array of methods available in this domain make the translation of
these tools into the clinical environment a daunting task. One of the primary challenges in bringing
histopathology CAD tools to the market is the lack of standardization in the methods used to develop
the models, making it difficult to determine which models would be best suited and have the highest
performance metrics in a clinical setting23. While a large variety of methods were observed in the
systematic review of the literature on this topic, a clear 5-step workflow was identified as the common
thread to all studies (Figure 1). Interestingly, the application of a 5-step workflow was not used as an
explicit inclusion criterion for this review, but instead was an inherent characteristic of the all reviewed
study designs. While a clear consensus on best practices to be used within the 5-step workflow
framework was not apparent in the individual studies reviewed, the high-level overview provided
through this systematic evaluation has allowed for the generation of recommendations of current best
practices for each of the 5 workflow steps, as described below (Table 7).
Image Acquisition (Computer Vision Workflow Step 1)
The articles reviewed had a common research aim of developing a computerized model that can take a
histopathology image as an input and output a clinically relevant label of interest, such as diagnosis or
prognosis. Despite not having excluded any type of histopathology samples in the screening criteria, the
articles represented in the search were overwhelmingly focused on cancer diagnostic aids. This was not
surprising considering the large publicly available digital image databases dedicated to cancer-specific
pathologies (ex. The Cancer Genome Atlas), facilitating these types of CAD-application initiatives. A
considerable strength of using image datasets from these public repositories is access to large datasets
38

with minimal costs and often a high degree of quality control as it relates to image quality and
annotation – aspects that can be highly variable in smaller, institution-based collections. This can allow
for better model comparison across research groups as well. Unfortunately, similar large-scale, highly
annotated public image datasets for tissue types and pathologies outside of cancer are not currently
available, a considerable limitation that has no doubt hindered paralleled progress in the development
of CAD-based tools for other important clinical domains, such as perinatal pathology, dermatology,
gastrointestinal and hepatic pathology.
While there is no gold standard for sample size calculations that can be easily applied to determine
optimal numbers of patient samples required for ML model development, it is generally acknowledged
that model accuracy improves with increasing sample sizes114,115 116. The complexity of the machine
learning algorithm being used is an important consideration, with traditional machine learning models,
such as SVM, requiring fewer input images compared to more complex deep learning models. And
finally, in the context of histopathology datasets, the baseline degree of variability that may be observed
in the tissue of interest in both healthy and sick populations need to be considered, ensuring the dataset
used for training adequately represents this variability. A small number of studies have proposed
statistical methods for calculating optimal sample size, using either characteristics of the data such as
number of classes and number of features (model-based approach)117 or by learning from the rate at
which the model improves over training (inverse power law approach)118,119. However, even these
methods yield considerable variations in estimated sample sizes, in the magnitude of hundreds of
images, providing little clarity to a researcher requiring guidance in experimental design. In the reviewed
articles, digital image sample sizes ranged from 15 to > 21,000, originating from 7-742 distinct patient
samples – demonstrating a clear lack of guidance and consensus on sample size determination for ML
model development in this domain.
39

A clear description of how patient samples are selected for inclusion in a study and what parameters
were used for ground truth sample classification are also important considerations. To generate a robust
CAD model with widespread generalizability in the clinical context, one must be sure that the patient
samples being used for model development were truly representative of the clinical population of
interest and that the methods used to classify each sample were clear, appropriate and reproducible.
Unfortunately, these descriptions were often lacking in the reviewed articles on this topic, properly
described in only 4 of the 18 articles reviewed (Figure 3). Further, the highly subjective nature of
pathological evaluations – used as ground truth classification of images – must be considered. While in
the field of onco-pathology the degree of inter- and intra- evaluation variability may be lower, in other
fields of study this variability can be quite high and would therefore greatly impact the performance
metrics of the developed ML model.
Recommendation 1a: The use of highly annotated, publicly available digital image databases is the
current gold standard for image acquisition in the development of CAD-based machine learning model
development, allowing for wide access to large, high quality datasets. Consolidated efforts should be
undertaken to generate large scale, highly annotated digital image databases for tissue types and
pathologies outside of cancer to ensure the progress being made in the field of oncology can likewise be
realized in other domains of pathology.
Recommendation 1b: Researchers should aim to maximize the number of individual samples included
when developing machine learning models, applying data augmentation techniques to further increase
training sample size and assess data size impact on model development through the generation of
learning curves. Further efforts in this field should be focused on developing reliable methods of
samples size determinations for ML model development experiments.
40

Recommendation 1c: Groups developing CAD-based machine learning models for histopathology
purposes need to be explicit in how the image dataset was sourced and annotated.
Image Pre-processing (Computer Vision Workflow Step 2)
Image pre-processing includes 3 major activities, each of which was included to varying degrees in the
reviewed articles: 1) data augmentation, 2) image normalization, and 3) data cleaning. Of these three
activities, the biggest challenges in protocol standardization efforts will likely be focused on the first
two. As indicated previously, the development of a robust model requires a considerably large image
dataset in order to properly train the algorithm to detect class-specific differences in extracted features.
Unique to the realm of medical imaging, access to large, highly annotated image datasets of clinical
specimens can be a major limitation to CAD model development. An important technique used to
overcome this challenge is data augmentation. A common approach to data augmentation is the use of
a sliding window image patch extraction, in which a number of smaller overlapping images are captured
from across the entire original image. This method was employed in a total of 3 articles reviewed29,42,43,
augmenting dataset up to 7,000 fold. For researchers with limited access to samples, a sliding window
approach offers a fast and systematic way to augment data. A similar approach, which attempts to
mimic a pathologist’s approach, extracts a smaller number of image patches from distinct or
representative regions of the original image, and in the case of the reviewed articles, augmented
datasets by a factor of 10-3,000 fold40,44,45. Importantly, the process of data augmentation through patch
extraction also addresses another major barrier currently faced in histopathology image analysis – the
large file sizes of these high-resolution digital images. Scanned images used in histopathology analysis
often contain over a gigabyte of information7, presenting an enormous computational task. The use of
image patch extraction can reduce the size of these files to the magnitude of hundreds of kilobytes (or
41

hundreds- thousands of pixels squared), sizes that are compatible with current computing power
availability for most users. Further, opting for the development of a traditional machine learning
classifier (vs. a deep learning classifier) with pre-extracted image features, as seen in 15 of 18 articles
review, can also minimize the required computational power needed. Bayramoglu et. al. was the only
article to mention using image modifications such as rotation and flipping to their dataset as a form of
data augmentation. This is somewhat unsurprising, as it is a technique more commonly used in deep
learning where it is typically embedded in the training process as a random image generator that would
produce different transformations at each round of training31,38,45. Although this technique is useful in
increasing variability and size in a smaller dataset120, one must be careful when applying some image
manipulations (i.e. stretching), always keeping in mind the biological importance of morphological
features in the tissue of interest.
Image normalization is an important consideration when working with histopathology specimens.
Differences in tissue staining intensity and/or lighting differences in the captured digital images can have
a considerable impact on model classification accuracy. The articles reviewed combatted this problem
using a variety of image normalization strategies. In some of the articles reviewed, color transformation
processes were compared30,31,42,48, indicating that there was no clear choice for which colour space to
use. Orlov et. al. compared classifier performance using RGB, CIELab, and deconvolved H&E colour
spaces and found that the H and E colour space outperformed the other two by far, achieving an
accuracy of 95% compared to 75% and 72% for the RGB and LAB spaces, respectively. However, the
method of color normalization applied for any CAD model development will need consideration to
ensure that that the features of highest relevance are being adequately highlighted for classifier
training. In addition to image normalization, data cleaning includes routinely scanning for artifacts and
poor quality until automating the detection and removal of histopathology-specific artifacts becomes
commonplace and efficient. Data cleaning with manual removal of images or regions in 11/18 articles
42

and was used to ensure that the features subsequently extracted represent the true morphological
differences between groups, unconfounded by differences in staining or artifacts30–35,37,41,42,45,48.
Recommendation 2a: The adoption of sliding window image patch extraction is a reasonable data
augmentation approach to considerably increase the size of the training dataset, while minimizing
computational power required.
Recommendation 2b: Image modifications incorporated through a random image data generator during
classifier training can be used for deep learning experiments to increase size and variability of image
datasets.
Recommendation 2c: While model-specific considerations must be used, H&E channel and l*a*b* color
normalization methods demonstrate optimal results in their ability to best highlight distinct tissue
morphology in histopathology specimens used for ML model development.
Tissue Feature Extraction (Computer Vision Workflow Step 3)
Tissue feature extraction demonstrated the highest degree of methodological variability in the review of
the literature. If a fully automated approach is used for feature extraction, the introduction of human
bias into model development can be minimized. However, the mathematical descriptors used to identify
and extract features from each image may not necessarily be driven by the biology and/or
pathophysiology underlying disease mechanism. On the contrary, if manual or semi-automatic feature
extraction was guided by the expertise of a clinical pathologist - highlighting tissue areas or feature of
highest relevance - clarity on how classification decisions were being mediated by the ML model can
better be achieved. However, this method can be highly time-consuming and heavily influenced by
human biases. Interestingly, the performance of machine learning models was similar across both
43

feature extraction approaches in the reviewed literature, with some reviewed articles reporting
classification accuracy of 100% for both approaches. This would suggest that both approaches
demonstrate promise, and ultimately the developer will need weigh the pros and cons of each approach
considering the research question at hand. That being said, in order to move this technology into clinical
practice, a move towards full automation of feature extraction would likely be required to address
clinical work-load management. Moving forward, removing the feature extraction phase entirely, and
instead having feature extraction integrated into classifier development will likely yield the most robust
and clinically relevant CAD models. Historically, integrated feature extraction which is used in deep
learning, has demonstrated improved model performance when applied to non-medical image datasets
(ex. for facial recognition or self-driving cars) compared to traditional machine learning algorithms121–125.
Recommendation 3: Both manual/semi-automated and fully automated feature extraction methods
work well in histopathology-focused CAD tool development. A move towards fully automated, and
ultimately fully integrated, approaches to feature extraction is recommended to best accommodate
translation of these tools into a clinical setting.
Pattern Recognition and Classifier Training (Computer Vision Workflow Step 4)
Two distinct architectures for machine learning models exist, each with advantages and disadvantages:
1) traditional machine learning classifiers with extracted features, 2) deep learning classifiers with
integrated feature extraction. In the reviewed articles, multiple classifying algorithms were tested and
compared for both machine learning and deep learning algorithms. Support vector machine (SVM) and
probabilistic neural network were by far the most commonly used, and while SVM demonstrated the
highest ML model performance convolutional neural network (CNN) demonstrated the highest deep
learning performance metrics. Although deep learning algorithms have been shown to outperform
44

traditional classifiers on image classification tasks, a current limitation of this approach is the inability to
determine which image features were weighted more heavily in classification decisions. Deep learning is
suitable in practical situations where a very high level of accuracy is essential but may pose a challenge
in a clinical setting where it is crucial to be able to justify a diagnosis. However this limitation of deep
learning is the primary focus of explainable artificial intelligence (XAI), a relatively new but increasingly
important field of study, which will allow for the integration and understanding of deep learning models
in a healthcare setting 126,127.
Eight of 18 articles used cross-validation to assess the rate of improvement of classification accuracy
over the course of training, or the “learning”, by plotting a curve of error decrease over training
epochs30,33–36,43,45,48. Although several articles also reported using cross validation to evaluate model
performance (Table 5), the results are reported and a recommendation is provided in Computer Vision
Workflow Step 4 because the topic of whether it should be used for parameter tuning or model
evaluation appears to still be under debate, but a 2006 study addressing this problem found that using
cross validation to evaluate a model and test its generalizability to new data gives a “significantly biased
estimate of error” when it is also used to tune training algorithm parameters 128. Moreover, two of the
articles using cross-validation to estimate model performance highlighted the a major limitations to this
approach which is the potential for the model to overfit to the training data and fail at generalizing to
new data30,40. In the reviewed articles, the most widely used method of cross-validation for parameter
tuning, but not model evaluation were 5-fold cross validation and leave-one-out cross validation.
Recommendation 4a: Deep learning models represent optimal model architecture when working with
complex histopathology image data. However, due to current lack of transparency with deep learning
models and the computing resources required, traditional machine learning algorithms are currently
better for use with histopathology image data, with SVM classifiers shown to produce equally strong
performance metrics.
45
Recommendation 4b: 5-fold and leave-one out cross validation are common and reasonable methods
for fine tuning ML model development for histopathology application, helping to optimize model
parameters such as number of rounds of training, sample size, and computing resource allocation.
Algorithm Testing (Computer Vision Workflow Step 5)
Standard practice for ML model development is to reserve a portion of the available dataset as the “test
dataset”, used strictly for the purposes of final model performance assessment. In total, only 3 of 18
articles explicitly stated following this standard practice, with the size of the testing dataset ranging
from 0.016%-50% of the total dataset 40,43, in line with the industry standard of reserving at least 50% of
the data for training with room for adjustment if the dataset is too small129. Performance was reported
as accuracy in all articles except for 3, with other reported metrics including F-1 score and area under
the curve. As all these metrics are permutations of the true positives, true negatives, false positives, and
false negatives and can be interconverted, they are all reasonable to report. However standardizing
reporting guidelines would help with quick comparisons of results across studies.
Surprisingly, in 13 of the 18 articles reviewed, a separate testing dataset was not used to assess model
performance, or it was unclear in the text whether or not the data was split. Instead, these articles
(aside from the two where the data structure was unclear) reported using cross-validation to evaluate
model performance. While cross-validation can provide a reasonable estimate, true model performance
metrics are measured when the model is tested on a previously unseen dataset – allowing the
determination of a model’s generalizability. A likely cause for the adapted use of cross-validation for
evaluation purposes was small image dataset sizes128,129, however this is not typical of standard of ML
modelling workflows due to problems related to data overfitting, and ultimately inflated model
performance accuracy estimates.
46
Recommendation 5a: Ideal experimental design for ML model development for histopathology
application includes reserving 20% of the original dataset for model performance testing.
Recommendation 5b: Accuracy and F-1 score are standard model performance metrics that should be
routinely presented in articles on histopathology CAD-tool development. Standardization in reporting
practices will allow for head-to-head comparisons of developed models and expedite translation of
these tools into the clinical setting.
Conclusion:
The findings of the current systematic review highlight expanding and promising development of CAD-
based tools that can be applied in the domain of clinical histopathology. To date, this work has been
focused entirely in the realm of cancer pathologies, identifying the expansion of this technology into
other branches of pathology as important opportunities for the future. While CAD-based advances
show tremendous promise for clinical utility, rigorous research protocols must be developed which can
clearly demonstrate the value machine learning in a clinical setting in order to realize this clinical utility
of these tools. Recommendations provided in this research article should provide orientation for
researchers developing CAD tools and for clinical pathologists interested in adopting this technology into
their practice and should serve as a basis for the creation of evidence-based guidelines.
47

References:
1. Kamel HM. Trends and Challenges in Pathology Practice: Choices and necessities. Sultan Qaboos
Univ Med J. 2011;11(1):38-44. https://www.ncbi.nlm.nih.gov/pubmed/21509206.
2. Rabe K, Snir OL, Bossuyt V, Harigopal M, Celli R, Reisenbichler ES. Interobserver variability in
breast carcinoma grading results in prognostic stage differences. Hum Pathol. 2019.
doi:https://doi.org/10.1016/j.humpath.2019.09.006
3. Wang S, Yang DM, Rong R, et al. Artificial Intelligence in Lung Cancer Pathology Image Analysis.
Cancers (Basel). 2019;11(11). doi:10.3390/cancers11111673
4. Jimenez-del-Toro O, Otálora S, Andersson M, et al. Chapter 10 - Analysis of Histopathology
Images: From Traditional Machine Learning to Deep Learning. In: Depeursinge A, S. Al-Kadi O,
Mitchell JRBT-BTA, eds. Academic Press; 2017:281-314. doi:https://doi.org/10.1016/B978-0-12-
812133-7.00010-7
5. Hipp J, Flotte T, Monaco J, et al. Computer aided diagnostic tools aim to empower rather than
replace pathologists: Lessons learned from computational chess. J Pathol Inform. 2011;2:25.
doi:10.4103/2153-3539.82050
6. Bhargava R, Madabhushi A. Emerging Themes in Image Informatics and Molecular Analysis for
Digital Pathology. Annu Rev Biomed Eng. 2016;18:387-412. doi:10.1146/annurev-bioeng-112415-
114722
7. Komura D, Ishikawa S. Machine Learning Methods for Histopathological Image Analysis. Comput
Struct Biotechnol J. 2018;16:34-42. doi:https://doi.org/10.1016/j.csbj.2018.01.001
8. Huisman A, Looijen A, van den Brink SM, van Diest PJ. Creation of a fully digital pathology slide
48

archive by high-volume tissue slide scanning. Hum Pathol. 2010;41(5):751-757.
doi:10.1016/j.humpath.2009.08.026
9. Ilse M, Tomczak JM, Welling M. Chapter 22 - Deep multiple instance learning for digital
histopathology. In: Zhou SK, Rueckert D, Fichtinger GBT-H of MIC and CAI, eds. Academic Press;
2020:521-546. doi:https://doi.org/10.1016/B978-0-12-816176-0.00027-2
10. Michie D. “memo” functions and machine learning. Nature. 1968;218(5136):19-22.
doi:10.1038/218019a0
11. Langley P. Machine Learning as an Experimental Science.(Author abstract)(Editorial). Mach Learn.
1988;3(1):5. doi:10.1007/BF00115008
12. Baldi P. Bioinformatics : The Machine Learning Approach. (Brunak S, ed.). Cambridge, Mass.:
Cambridge, Mass. : MIT Press, c1998.; 1998.
13. Ikeuchi K, ed. Computer Vision BT - Computer Vision: A Reference Guide. In: Boston, MA:
Springer US; 2014:145. doi:10.1007/978-0-387-31439-6_100073
14. Klette author R. Concise Computer Vision : An Introduction into Theory and Algorithms. London :
Springer, 2014.; 2014.
15. Montoya JC, Muñoz CQG, Márquez FPG. Chapter 9 - Remote condition monitoring for
photovoltaic systems. In: Papaelias M, Márquez FPG, Karyotakis ABT-N-DT and CMT for REIA, eds.
Boston: Butterworth-Heinemann; 2020:133-142. doi:https://doi.org/10.1016/B978-0-08-101094-
5.00009-5
16. Kandemir M, Hamprecht FA. Computer-aided diagnosis from weak supervision: A benchmarking
study. Comput Med Imaging Graph. 2015;42:44-50.
doi:https://doi.org/10.1016/j.compmedimag.2014.11.010
49

17. Ritter author GX, Ritter GX. Handbook of Computer Vision Algorithms in Image Algebra. Second
edi. (Wilson JN, ed.). Boca Raton: Boca Raton : CRC Press, 2001.; 2001.
18. Khan author S. A Guide to Convolutional Neural Networks for Computer Vision. Vol # 15.
(Rahmani author H, Shah author SAA, Bennamoun author M (Mohammed), eds.). San Rafael,
California : Morgan & Claypool, 2018.; 2018.
19. Tsagkatakis G. Dimensionality Reduction and Sparse Representations in Computer Vision. Savakis
A, Amuso V, Cahill N, Rhody H, eds. 2011.
20. Masnadi-Shirazi H, Mahadevan V, Vasconcelos N. On the design of robust classifiers for computer
vision. In: 2010 IEEE Computer Society Conference on Computer Vision and Pattern Recognition. ;
2010:779-786. doi:10.1109/CVPR.2010.5540136
21. Lopez-del Rio A, Nonell-Canals A, Vidal D, Perera-Lluna A. Evaluation of Cross-Validation
Strategies in Sequence-Based Binding Prediction Using Deep Learning. J Chem Inf Model.
2019;59(4):1645-1657. doi:10.1021/acs.jcim.8b00663
22. Gutierrez author D. Machine Learning and Data Science: An Introduction to Statistical Learning
Methods with R. 1st editio. (Safari an OMC, ed.). Technics Publications, 2015.; 2015.
23. Belle A, Kon MA, Najarian K. Biomedical Informatics for Computer-Aided Decision Support
Systems: A Survey. Sci World J. 2013;2013:1-8. doi:10.1155/2013/769639
24. Tacconelli E. Book: Systematic reviews: CRD’s guidance for undertaking reviews in health care.
Lancet Infect Dis. 2010;10(4):226.
25. Cohen J. A Coefficient of Agreement for Nominal Scales. Educ Psychol Meas. 1960;20:37.
26. Whiting PF, Rutjes AWS, Westwood ME, et al. QUADAS-2: A Revised Tool for the Quality
50

Assessment of Diagnostic Accuracy Studies. Ann Intern Med. 2011;155(8):529-536.
doi:10.7326/0003-4819-155-8-201110180-00009
27. McHugh ML. Interrater reliability: the kappa statistic. Biochem medica. 2012;22(3):276-282.
https://www.ncbi.nlm.nih.gov/pubmed/23092060.
28. Hansel DE. The Gleason Grading System: The Approach that Changed Prostate Cancer
Assessment. J Urol. 2017;197(2):S140-S141. doi:10.1016/j.juro.2016.11.028
29. Lin WC, Li CC, Epstein JI, Veltri RW. Curvelet-based texture classification of critical Gleason
patterns of prostate histological images. 2016 IEEE 6th Int Conf Comput Adv Bio Med Sci. 2016:1-
6. doi:10.1109/ICCABS.2016.7802768
30. DiFranco MD, O’Hurley G, Kay EW, Watson RWG, Cunningham P. Ensemble based system for
whole-slide prostate cancer probability mapping using color texture features. Comput Med
Imaging Graph. 2011;35(7-8):629-645.
http://ovidsp.ovid.com/ovidweb.cgi?T=JS&PAGE=reference&D=med7&NEWS=N&AN=21269807.
31. Orlov N V, Weeraratna AT, Hewitt SM, et al. Automatic detection of melanoma progression by
histological analysis of secondary sites. Cytometry A. 2012;81(5):364-373.
http://ovidsp.ovid.com/ovidweb.cgi?T=JS&PAGE=reference&D=med7&NEWS=N&AN=22467531.
32. Angel Arul Jothi J, Mary Anita Rajam V. Effective segmentation of orphan annie-eye nuclei from
papillary thyroid carcinoma histopathology images using a probabilistic model and region-based
active contour. Biomed Signal Process Control. 2016;30:149-161. doi:10.1016/j.bspc.2016.06.008
33. F.A. S, L.S. O, C. P, et al. A Dataset for Breast Cancer Histopathological Image Classification. IEEE
Trans Biomed Eng. 2016;63(7):1455-1462. doi:10.1109/TBME.2015.2496264
34. Ninos K, Kostopoulos S, Kalatzis I, et al. Microscopy image analysis of p63 immunohistochemically
51

stained laryngeal cancer lesions for predicting patient 5-year survival. Eur Arch Oto-Rhino-
Laryngology. 2016;273(1):159-168. doi:10.1007/s00405-015-3747-x
35. K.-H. Y, C. Z, G.J. B, et al. Predicting non-small cell lung cancer prognosis by fully automated
microscopic pathology image features. Nat Commun. 2016;7:no pagination.
http://www.nature.com/ncomms/index.html.
36. L. Y, W. C, P. M, et al. High Throughput Analysis of Breast Cancer Specimens on the Grid. Vol 10. L.
Yang, Dept. of Electrical and Computer Eng., Rutgers Univ., Piscataway, NJ 08544, USA.;
2007:617-625.
http://ovidsp.ovid.com/ovidweb.cgi?T=JS&PAGE=reference&D=emed11&NEWS=N&AN=3503258
04.
37. Fukuma K, Prasath VBS, Kawanaka H, Aronow BJ, Takase H. A Study on Nuclei Segmentation,
Feature Extraction and Disease Stage Classification for Human Brain Histopathological Images. In:
Procedia Computer Science. Vol 96. ; 2016. doi:10.1016/j.procs.2016.08.164
38. Bayramoglu N, Kannala J, Heikkilä J. Deep learning for magnification independent breast cancer
histopathology image classification. 2016 23rd Int Conf Pattern Recognit. 2016:2440-2445.
doi:10.1109/ICPR.2016.7900002
39. Bentaieb A, Nosrati MS, Li-Chang H, Huntsman D, Hamarneh G. Clinically-inspired automatic
classification of ovarian carcinoma subtypes. J Pathol Inform. 2016;7(1). doi:10.4103/2153-
3539.186899
40. Waheed S, Moffitt RA, Chaudry Q, Young AN, Wang MD. Computer Aided Histopathological
Classification of Cancer Subtypes. 2007 IEEE 7th Int Symp Bioinforma Bioeng. 2007:503-508.
doi:10.1109/BIBE.2007.4375608
52

41. Doyle S, Rodriguez C, Madabhushi A, Tomaszeweski J, Feldman M. Detecting Prostatic
Adenocarcinoma From Digitized Histology Using a Multi-Scale Hierarchical Classification
Approach. 2006 Int Conf IEEE Eng Med Biol Soc. 2006:4759-4762.
doi:10.1109/IEMBS.2006.260188
42. Mete M, Xu X, Fan C y., Shafirstein G. Head and Neck Cancer Detection in Histopathological
Slides. Sixth IEEE Int Conf Data Min - Work. 2006:223-230. doi:10.1109/ICDMW.2006.90
43. Y. X, J.-Y. Z, E.I.C. C, et al. Weakly supervised histopathology cancer image segmentation and
classification. Med Image Anal. 2014;18(3):591-604.
http://ovidsp.ovid.com/ovidweb.cgi?T=JS&PAGE=reference&D=medl&NEWS=N&AN=24637156.
44. Budinská E, Bosman F, Popovici V. Experiments in molecular subtype recognition based on
histopathology images. 2016 IEEE 13th Int Symp Biomed Imaging. 2016:1168-1172.
doi:10.1109/ISBI.2016.7493474
45. K. N, S. K, K. S, et al. Computer-based image analysis system designed to differentiate between
low-grade and high-grade laryngeal cancer cases. Anal Quant Cytopathol Histopathol.
2013;35(5):261-272.
http://www.aqch.com/toc/auto_article_process.php?year=2013&page=261&id=23248&sn=0.
46. Weinstein JN, Collisson EA, Mills GB, et al. The Cancer Genome Atlas Pan-Cancer analysis project.
Nat Genet. 2013;45(10):1113-1120. doi:10.1038/ng.2764
47. Fukuma K, Surya Prasath VB, Kawanaka H, Aronow BJ, Takase H. A study on feature extraction
and disease stage classification for glioma pathology images. In: 2016 IEEE International
Conference on Fuzzy Systems, FUZZ-IEEE 2016. ; 2016. doi:10.1109/FUZZ-IEEE.2016.7737958
48. W. W, J.A. O, Wang W, Ozolek JA, Rohde GK. Detection and Classification of Thyroid Follicular
53

Lesions Based on Nuclear Structure from Histopathology Images. Vol 77. G. K. Rohde, Department
of Biomedical Engineering, HHC 122, 5000 Forbes Avenue, Pittsburgh, PA 15232, United States. E-
mail: [email protected]: Wiley-Liss Inc. (111 River Street, Hoboken NJ 07030-5774, United
States); 2010:485-494. doi:10.1002/cyto.a.20853
49. Angel Arul Jothi J, Mary Anita Rajam V. Effective segmentation and classification of thyroid
histopathology images. Appl Soft Comput J. 2015. doi:10.1016/j.asoc.2016.02.030
50. Xu Y, Zhu J-Y, Chang E, Tu Z. Multiple clustered instance learning for histopathology cancer image
classification, segmentation and clustering. In: Proceedings of the IEEE Computer Society
Conference on Computer Vision and Pattern Recognition. ; 2012.
doi:10.1109/CVPR.2012.6247772
51. Slaoui M, Fiette L. Histopathology Procedures: From Tissue Sampling to Histopathological
Evaluation. Methods Mol Biol. 2011;691:69-82. doi:10.1007/978-1-60761-849-2_4
52. Ameisen D, Deroulers C, Perrier V, et al. Towards better digital pathology workflows:
programming libraries for high-speed sharpness assessment of Whole Slide Images. Diagn Pathol.
2014;9(1):S3. doi:10.1186/1746-1596-9-S1-S3
53. Aggarwal 1st Lt. Pushkar. Data augmentation in dermatology image recognition using machine
learning. Ski Res Technol. 2019;25(6):815-820. doi:10.1111/srt.12726
54. Bang J, Hur T, Kim D, et al. Adaptive Data Boosting Technique for Robust Personalized Speech
Emotion in Emotionally-Imbalanced Small-Sample Environments. Sensors. 2018;18(11):3744.
doi:10.3390/s18113744
55. Solomon C. Fundamentals of Digital Image Processing : A Practical Approach with Examples in
Matlab. (Breckon T, ed.). Chichester: Chichester : Wiley-Blackwell, ©2011.; 2011.
54
56. CIE Recommendations on Uniform Color Spaces, Color-Difference Equations, and Metric Color
Terms. Color Res Appl. 1977;2(1):5-6. doi:10.1002/j.1520-6378.1977.tb00102.x
57. Lyon HO, De Leenheer AP, Horobin RW, et al. Standardization of reagents and methods used in
cytological and histological practice with emphasis on dyes, stains and chromogenic reagents.
Histochem J. 1994;26(7):533-544. doi:10.1007/BF00158587
58. Khan AM, Rajpoot N, Treanor D, Magee D. A nonlinear mapping approach to stain normalization
in digital histopathology images using image-specific color deconvolution. IEEE Trans Biomed Eng.
2014;61(6). doi:10.1109/TBME.2014.2303294
59. Roy S, kumar Jain A, Lal S, Kini J. A study about color normalization methods for histopathology
images. Micron. 2018;114:42-61. doi:https://doi.org/10.1016/j.micron.2018.07.005
60. Jayalakshmi T, Santhakumaran A. Statistical Normalization and Back Propagationfor
Classification. Int J Comput Theory Eng. 2011;3(1):89-93. doi:10.7763/IJCTE.2011.V3.288
61. He BS, Zhu F, Shi YG. Medical Image Segmentation. Adv Mater Res. 2013;760-762:1590-1593.
doi:10.4028/www.scientific.net/AMR.760-762.1590
62. Carpenter AE, Jones TR, Lamprecht MR, et al. CellProfiler: image analysis software for identifying
and quantifying cell phenotypes. Genome Biol. 2006;7(10):R100. doi:10.1186/gb-2006-7-10-r100
63. Blake 1956- A, Kohli P, Rother C. Markov Random Fields for Vision and Image Processing.
Cambridge, Mass.: Cambridge, Mass. : MIT Press, ©2011.; 2011.
64. Sakaridis C, Drakopoulos K, Maragos P. Theoretical Analysis of Active Contours on Graphs. SIAM J
Imaging Sci. 2017;10(3):1475-1510. doi:10.1137/16M1100101
65. Peizhuang W. Pattern Recognition with Fuzzy Objective Function Algorithms (James C. Bezdek).
55

SIAM Rev. 1983;25(3):442. doi:10.1137/1025116
66. Poli R, Kennedy J, Blackwell T. Particle swarm optimization. Swarm Intell. 2007;1(1):33-57.
doi:10.1007/s11721-007-0002-0
67. 13. Density-Based Clustering Algorithms. In: Data Clustering: Theory, Algorithms, and
Applications. ASA-SIAM Series on Statistics and Applied Mathematics. Society for Industrial and
Applied Mathematics; 2007:219-226. doi:doi:10.1137/1.9780898718348.ch13
68. Broeke author J. Image Processing with ImageJ - Second Edition. 2nd editio. (Pérez author J,
Pascau author J, Safari an OMC, eds.). Packt Publishing, 2015.; 2015.
69. Huang D, Shan C, Ardabilian M, Wang Y, Chen L. Local binary patterns and its application to facial
image analysis: A survey. IEEE Trans Syst Man Cybern Part C Appl Rev. 2011;41(6):765-781.
doi:10.1109/TSMCC.2011.2118750
70. Nanni L, Brahnam S, Lumini A. Local phase quantization descriptor for improving shape
retrieval/classification. Pattern Recognit Lett. 2012;33(16):2254-2260.
doi:10.1016/j.patrec.2012.07.007
71. Haralick RM, Shanmugam K, Dinstein I. Textural Features for Image Classification. IEEE Trans Syst
man Cybern. 1973;smc-3(No. 6):610-621. doi:10.1109/TSMC.1973.4309314
72. Pathak RS. The Wavelet Transform. Vol v.4. Amsterdam : Amsterdam ; 2009.
73. Schreier 1961- R. Understanding Delta-Sigma Data Converters. (Temes 1929- GC, John Wiley &
Sons publisher, eds.). Piscataway, NJ : Hoboken, N.J. : Piscataway, NJ : IEEE Press ; 2005.
74. Ünay D, Stanciu SG. An Evaluation on the Robustness of Five Popular Keypoint Descriptors to
Image Modifications Specific to Laser Scanning Microscopy. IEEE Access. 2018;6:40154-40164.
56

doi:10.1109/ACCESS.2018.2855264
75. A V, Hebbar D, Shekhar VS, Murthy KNB, Natarajan S. Two Novel Detector-Descriptor Based
Approaches for Face Recognition Using SIFT and SURF. Procedia Comput Sci. 2015;70(C):185-197.
doi:10.1016/j.procs.2015.10.070
76. Lowe D. Distinctive Image Features from Scale-Invariant Keypoints. Int J Comput Vis.
2004;60(2):91-110. doi:10.1023/B:VISI.0000029664.99615.94
77. Bay H, Ess A, Tuytelaars T, Van Gool L. Speeded-Up Robust Features (SURF). Comput Vis Image
Underst. 2008;110(3):346-359. doi:10.1016/j.cviu.2007.09.014
78. Rublee E, Rabaud V, Konolige K, Bradski G. ORB: An efficient alternative to SIFT or SURF. In:
Proceedings of the IEEE International Conference on Computer Vision. ; 2011:2564-2571.
doi:10.1109/ICCV.2011.6126544
79. Mair E, Hager GD, Burschka D, Suppa M, Hirzinger G. Adaptive and Generic Corner Detection
Based on the Accelerated Segment Test BT - Computer Vision – ECCV 2010. In: Daniilidis K,
Maragos P, Paragios N, eds. Berlin, Heidelberg: Springer Berlin Heidelberg; 2010:183-196.
80. Calonder M, Lepetit V, Ozuysal M, Trzcinski T, Strecha C, Fua P. BRIEF: Computing a Local Binary
Descriptor Very Fast. IEEE Trans Pattern Anal Mach Intell. 2012;34(7):1281-1298.
doi:10.1109/TPAMI.2011.222
81. Gurcan MN, Boucheron LE, Can A, Madabhushi A, Rajpoot NM, Yener B. Histopathological image
analysis: a review. IEEE Rev Biomed Eng. 2009;2:147-171. doi:10.1109/RBME.2009.2034865
82. Sarangi PK, Ravulakollu KK. Feature Extraction and Dimensionality Reduction in Pattern
Recognition Using Handwriten Odia Numerals. 2014;65(3).
57

83. Michalewicz Z. How to Solve It : Modern Heuristics. 2nd ed., r. (Fogel DB, ed.). Berlin : Berlin ;
2004.
84. Pearson K. Mathematical Contributions to the Theory of Evolution. X. Supplement to a Memoir
on Skew Variation. Philos Trans R Soc London Ser A, Contain Pap a Math or Phys Character.
1901;197(287-299):443-459. doi:10.1098/rsta.1901.0023
85. Papailiopoulos DS, Dimakis AG. Interference Alignment as a Rank Constrained Rank Minimization.
IEEE Trans Signal Process. 2012;60(8):4278-4288. doi:10.1109/TSP.2012.2197393
86. Fisher RA. THE USE OF MULTIPLE MEASUREMENTS IN TAXONOMIC PROBLEMS. Ann Hum Genet.
1936;7(2):179-188. doi:10.1111/j.1469-1809.1936.tb02137.x
87. Cacciatore S, Luchinat C, Tenori L. Knowledge discovery by accuracy maximization. Proc Natl Acad
Sci U S A. 2014;111(14):5117. doi:10.1073/pnas.1220873111
88. Duda RO. Pattern Classification. 2nd ed. (Hart PE, Stork DG, eds.). New York: New York : Wiley,
2001.; 2001.
89. Litchfield JT, Wilcoxon F. The Rank Correlation Method. Anal Chem. 1955;27(2):299-300.
doi:10.1021/ac60098a038
90. Ziarko W. Variable precision rough set model. J Comput Syst Sci. 1993;46(1):39-59.
doi:10.1016/0022-0000(93)90048-2
91. Iman RL, Davenport JM. Rank correlation plots for use with correlated input variables. Commun
Stat - Simul Comput. 1982;11(3):335-360. doi:10.1080/03610918208812266
92. Hess AS, Hess JR. Principal component analysis. Transfusion. 2018;58(7):1580-1582.
doi:10.1111/trf.14639
58

93. Kupper LL, Hafner KB. On assessing interrater agreement for multiple attribute responses.
Biometrics. 1989;45(3):957. doi:10.2307/2531695
94. Roweis ST, Saul LK. Nonlinear dimensionality reduction by locally linear embedding. Roweis ST,
ed. Science. 2000;290(5500):2323-2326. doi:10.1126/science.290.5500.2323
95. Wang C, Chen J, Sun Y, Shen X. Wireless Sensor Networks Localization with Isomap. In: 2009 IEEE
International Conference on Communications. ; 2009:1-5. doi:10.1109/ICC.2009.5199576
96. Teng L, Li H, Fu X, Chen W, Shen I-F. Dimension reduction of microarray data based on local
tangent space alignment. In: Fourth IEEE Conference on Cognitive Informatics 2005, ICCI 2005. ;
2005:154-159. doi:10.1109/COGINF.2005.1532627
97. Anderson JA. Point biserial correlation. Stata Tech Bull. 1994;3(17).
98. Kent JT. Information gain and a general measure of correlation. Biometrika. 1983;70(1):163-173.
doi:10.1093/biomet/70.1.163
99. Angel Arul Jothi J, Mary Anita Rajam V. Segmentation of Nuclei from Breast Histopathology
Images Using PSO-Based Otsu’s Multilevel Thresholding. Vol 325.; 2015. doi:10.1007/978-81-322-
2135-7_88
100. Inuiguchi M, Hirano S, Tsumoto 1963- S. Rough Set Theory and Granular Computing. Vol v. 125.
Berlin : Berlin ; 2003.
101. Guenther N, Schonlau M. Support Vector Machines. Stata J. 2016;16(4):917-937.
doi:10.1177/1536867X1601600407
102. Darrell T, Indyk P, Shakhnarovich G. Nearest-Neighbor Methods in Learning and Vision : Theory
and Practice. Cambridge, Mass.: Cambridge, Mass. : MIT Press, 2005; 2005.
59

103. Despontin M. Decision theory: An introduction to the mathematics of rationality: Ellis Horwood,
Chichester, 1986, 448 + pages, £55.00. Eur J Oper Res. 1987;29(2):212-213. doi:10.1016/0377-
2217(87)90113-5
104. Pavlov YL. Random Forests. Utrecht : Utrecht ; 2000.
105. Friedman N, Geiger D, Goldszmidt M. Bayesian Network Classifiers. Mach Learn. 1997;29(2):131-
163. doi:10.1023/A:1007465528199
106. Mayr, Binder, Gefeller, Schmid. The evolution of boosting algorithms. From machine learning to
statistical modelling. Methods Inf Med. 2014;53(6):419-41927. doi:10.3414/ME13-01-0122
107. De Wilde 1958- P. Neural Network Models : Theory and Projects. Second edi. London ; 1997.
108. Herrera F, Ventura S, Bello R, et al. Multiple Instance Learning : Foundations and Algorithms.
Cham: Cham : Springer, 2016.; 2016.
109. Lin J-Y, Ke H-R, Chien B-C, Yang W-P. Classifier design with feature selection and feature
extraction using layered genetic programming. Expert Syst Appl. 2008;34(2):1384-1393.
doi:10.1016/j.eswa.2007.01.006
110. Fushiki T. Estimation of prediction error by using K -fold cross-validation. Stat Comput.
2011;21(2):137-146. doi:10.1007/s11222-009-9153-8
111. Wong T-T. Performance evaluation of classification algorithms by k-fold and leave-one-out cross
validation. Pattern Recognit. 2015;48(9):2839-2846.
doi:https://doi.org/10.1016/j.patcog.2015.03.009
112. Ruan F, Qi J, Yan C, Tang H, Zhang T, Li H. Quantitative detection of harmful elements in alloy
steel by LIBS technique and sequential backward selection-random forest (SBS-RF). J Anal At
60
Spectrom. 2017;32(11):2194-2199. doi:10.1039/C7JA00231A
113. Efron B. The Jackknife, the Bootstrap, and Other Resampling Plans. Vol 38. (Mathematics S for I
and A, ed.). Philadelphia, Pa.: Philadelphia, Pa. : Society for Industrial and Applied Mathematics
SIAM, 3600 Market Street, Floor 6, Philadelphia, PA 19104, 1982.; 1982.
114. Cui Z, Gong G. The effect of machine learning regression algorithms and sample size on
individualized behavioral prediction with functional connectivity features. Neuroimage.
2018;178:622-637. doi:10.1016/j.neuroimage.2018.06.001
115. Vapnik V. The Nature of Statistical Learning Theory. Springer science & business media; 2013.
116. Byrd RH, Chin GM, Nocedal J, Wu Y. Sample size selection in optimization methods for machine
learning. Math Program. 2012;134(1):127-155.
117. Dobbin KK, Zhao Y, Simon RM. How large a training set is needed to develop a classifier for
microarray data? Clin Cancer Res. 2008;14(1):108-114. doi:10.1158/1078-0432.CCR-07-0443
118. Mukherjee S, Tamayo P, Rogers S, et al. Estimating dataset size requirements for classifying DNA
microarray data. J Comput Biol. 2003;10(2):119-142. doi:10.1089/106652703321825928
119. Figueroa RL, Zeng-Treitler Q, Kandula S, Ngo LH. Predicting sample size required for classification
performance. BMC Med Inform Decis Mak. 2012;12(1):8. doi:10.1186/1472-6947-12-8
120. Tran T, Pham T, Carneiro G, Palmer L, Reid I. A Bayesian Data Augmentation Approach for
Learning Deep Models. In: Guyon I, Luxburg U V, Bengio S, et al., eds. Advances in Neural
Information Processing Systems 30. Curran Associates, Inc.; 2017:2797-2806.
http://papers.nips.cc/paper/6872-a-bayesian-data-augmentation-approach-for-learning-deep-
models.pdf.
61

121. Sun Y, Wang X, Tang X. Deep learning face representation from predicting 10,000 classes. In:
Proceedings of the IEEE Conference on Computer Vision and Pattern Recognition. ; 2014:1891-
1898.
122. Krizhevsky A, Sutskever I, Hinton GE. ImageNet classification with deep convolutional neural
networks. In: Advances in Neural Information Processing Systems. Vol 2. ; 2012:1097-1105.
https://www.scopus.com/inward/record.uri?eid=2-s2.0-
84876231242&partnerID=40&md5=621b2cd1757ccc77341281f8a2f2ecaf.
123. Farabet C, Couprie C, Najman L, LeCun Y. Learning hierarchical features for scene labeling. IEEE
Trans Pattern Anal Mach Intell. 2012;35(8):1915-1929.
124. Burlina P, Billings S, Joshi N, Albayda J, Miller FW. Automated diagnosis of myositis from muscle
ultrasound: Exploring the use of machine learning and deep learning methods. PLoS One.
2017;12(8). doi:10.1371/journal.pone.0184059
125. Ciregan D, Meier U, Schmidhuber J. Multi-column deep neural networks for image classification.
In: 2012 IEEE Conference on Computer Vision and Pattern Recognition. IEEE; 2012:3642-3649.
126. Choo J, Liu S. Visual Analytics for Explainable Deep Learning. IEEE Comput Graph Appl.
2018;38(4):84-92. doi:10.1109/MCG.2018.042731661
127. Došilović FK, Brčić M, Hlupić N. Explainable artificial intelligence: A survey. In: 2018 41st
International Convention on Information and Communication Technology, Electronics and
Microelectronics (MIPRO). ; 2018:210-215. doi:10.23919/MIPRO.2018.8400040
128. Varma S, Simon R. Bias in error estimation when using cross-validation for model selection. BMC
Bioinformatics. 2006;7(1):91.
129. Chicco D. Ten quick tips for machine learning in computational biology. BioData Min.
62

2017;10(1):35. doi:10.1186/s13040-017-0155-3
63

Figures:
2.1.
2.2.
64

2.3.
A)
Study RISK OF BIAS APPLICABILITY CONCERNS PATIENT SELECTION
INDEX TEST
REFERENCE STANDARD
FLOW AND TIMING
PATIENT SELECTION
INDEX TEST
REFERENCE STANDARD
Spanhol et. al. ¡ ¡ ? ¡ ¡ ¡ ¡ Fukuma et. al. ? ¡ ? ? ¡ ¡ ¡ Orlov et. al. ? ¡ ? ? ¡ ¡ ¡ BenTaieb et. al. ¡ ¡ ¡ ¡ ¡ ¡ ¡ Waheed et. al. ¡ ? ? ? ¡ ? ¡ Ninos et. al. ? ¡ ¡ ¡ ¡ ¡ ¡ Lin et. al. ? ¡ ¡ ? ¡ ¡ ¡ Bayramoglu et. al.
? ¡ ? ? ¡ ¡ ?
Doyle et. al. ? ¡ ? ? ¡ ¡ ? Wang et. al. ¡ ¡ ¡ ¡ ¡ ¡ ¡ Jothi et. al. ¡ ¡ ¡ ¡ ¡ ¡ ¡ DiFranco et. al. ? ¡ ¡ ¡ ¡ ¡ ¡ Budinska et. al. ¡ ¡ ? ? ¡ ¡ ¡ Mete et. al. ¡ ¡ ? ¡ ¡ ¡ ¡ Yang et. al. ? ¡ ¡ ¡ ¡ ¡ ¡ Ninos et. al. ? ? ¡ ¡ ¡ ¡ ¡ Xu et. al. ¡ ¡ ¡ ¡ ¡ ¡ ¡ Yu et. al. ? ¡ ¡ ¡ ¡ ¡ ¡
¡Low Risk ¡High Risk ? Unclear Risk
B) C)
0% 20% 40% 60% 80% 100%
PATIENT SELECTION
INDEX TEST
REFERENCE STANDARD
FLOW AND TIMING
Proportion of studies with low, high or unclear RISK of BIAS
QUAD
AS-2 Dom
ain
0% 20% 40% 60% 80% 100%
PATIENTSELECTION
INDEX TEST
REFERENCESTANDARD
Proportion of studies with low, high, or unclearCONCERNS regarding APPLICABILITY
Low High Unclear
65

Figure Legends:
Figure 2.1. 5-Step computer vision workflow for CAD development on digital histopathology images.
Upper panels show the workflow elements common to each reviewed article and beneath each panel is
an example of the inputs (step 1), outputs (step 5), or tasks (steps 2-4) involved at each step.
Figure 2.2. Flow chart of article selection process. Medline, Embase, Scopus, and IEEE Explore were
searched for articles relating to CAD on histopathology images. After abstract and full text screening, 18
articles remained for review.
Figure 2.3. Risk of bias summary. Risk of bias and applicability were assessed along 7 criteria outlined in
the QUADAS-II tool. Low risk items are marked in green, high risk in red, and unclear in blue. A.
Summary of risk score for each article along 4 Risk of Bias dimensions and 3 Applicability Concerns
dimensions. B. Proportion of risk ratings along 4 Risk of Bias dimensions (Patient Selection, Index Test,
Reference Standard, Flow and Timing) across all articles. C. Proportion of risk ratings along 3
Applicability Concerns dimensions (Patient Selection, Index Test, Reference Standard) across all articles.
66

Tables:
Table 2.1. Summary of articles included in analysis
Authors Year Sample Size (patients) Sample Size (images)
1 Spanhol et. al. 2016 82 7909
2 Fukuma et. al. 2016 unknown 150
3 Orlov et. al. 2012 164 14208
4 BenTaieb et. al. 2016 80 ~9600
5 Waheed et. al. 2007 16 64
6 Ninos et. al. 2013 55 220
7 Lin et. al. 2016 16 1600
8 Bayramoglu et. al. 2016 82 7909
9 Doyle et. al. 2006 20 60
10 Wang et. al. 2010 10 200-400
11 Jothi et. al. 2016 12 219
12 DiFranco et. al. 2011 14 15
13 Budinska et. al. 2016 100 100
14 Mete et. al. 2006 7 7591
15 Yang et. al. 2007 300 3744
16 Ninos et. al. 2016 42 ~168
17 Yu et. al. 2016 1017 21860
18 Xu et. al. 2014 unknown 100
67

Table 2.2. Summary of cancer types analyzed
Tissue Type Proportion of Articles (n/18)[ref]
Brain 12
Breast 31,8,15
Colon/Rectum 218, 13
Kidney 15
Larynx 26,16
Ovary 14
Prostate 37,9,12
Skin 33,14,17
Thyroid 210,11
68

Table 2.3. Summary of image pre-processing methods (Computer vision workflow stage
2)
Preprocessing Method Proportion of Articles (n/18)[ref]
Data Augmentation 151,2,4,5,6,7,8,9,10,12,13,14,16,17,18
Color Transformations 112,3,6,9,10,11,12,13,14,16,17
Data Cleaning and Transformation 72,4,5,6,10,11,13
Automatic Segmentation 74,6,10,11,14,16,18
Selective Discarding of Poor-Quality Data 111,2,3,6,9,10,11,12,14,16,17
69

Table 2.4. Summary of feature extraction and dimension reduction methods (Computer
vision workflow stage 3)
Feature Extraction Proportion of Articles (n/18)[ref]
Textural/Topological Features 151,2,3,4,5,6,7,9,12,13,14,15,16,17,18
Object Level Features 92,4,5,6,7,10,11,16,17
Keypoint Descriptors 21,18
Other (Deep Learning) 216
Dimension Reduction Proportion of Articles (n/18)[ref]
None/Not applicable 101,2,5,7,8,9,10,13,14,18
Greedy Hill Climbing 13
Peason's Correlation 13
Minimum-Redundancy-Maximum Relevance 13
Linear Discriminant Analysis 14
Dissimilarity Matrix 14
Fisher Score 14
Wilcoxon's Correlation 26,16
Variable Precision Rough Sets 111
Mean Rank Plots 112
Principal Component Analysis 115
Multi-Dimensional Scaling 115
Local Linear Embedding 115
ISOMAP 115
70

Table 2.4. Summary of feature extraction and dimension reduction methods (Computer
vision workflow stage 3) cont.
Local Tangent Space Embedding 115
Point Biserial Correlation 116
Information Gain Ratio 117
71

Table 2.5. Summary of classifiers and cross-validation methods (Computer vision
workflow stage 4)
Classifier Proportion of Articles (n/18)[ref]
Support Vector Machine 111,2,4,7,10,12,13,14,15,17,18
Nearest Neighbors 51,3,10,13,15
Decision Trees and Random Forrest 61,2,9,12,15,17
Bayesian 35,15,17
Boosting 39,15,18
Neural Networks 43,6,8,16
Multiple Instance Learning 118
Discriminant Function 11
Novel Classifier 111
Ensemble Based/Hierarchical 57,9,12,13,15
Cross Validation Proportion of Articles (n/18)[ref]
Unspecified 29,14
K-fold 101,3*,8*,10**,11*,12,13*,15**,17,18**
Leave-One-Out 62*,4*,5*,6**,16**,17
Mean Decrease Gini 12
Sequential Backward Selection 16
Jackknife 17*
Bootstrap 116
*Used uniquely for model evaluation; **Used for evaluation and parameter tuning
72
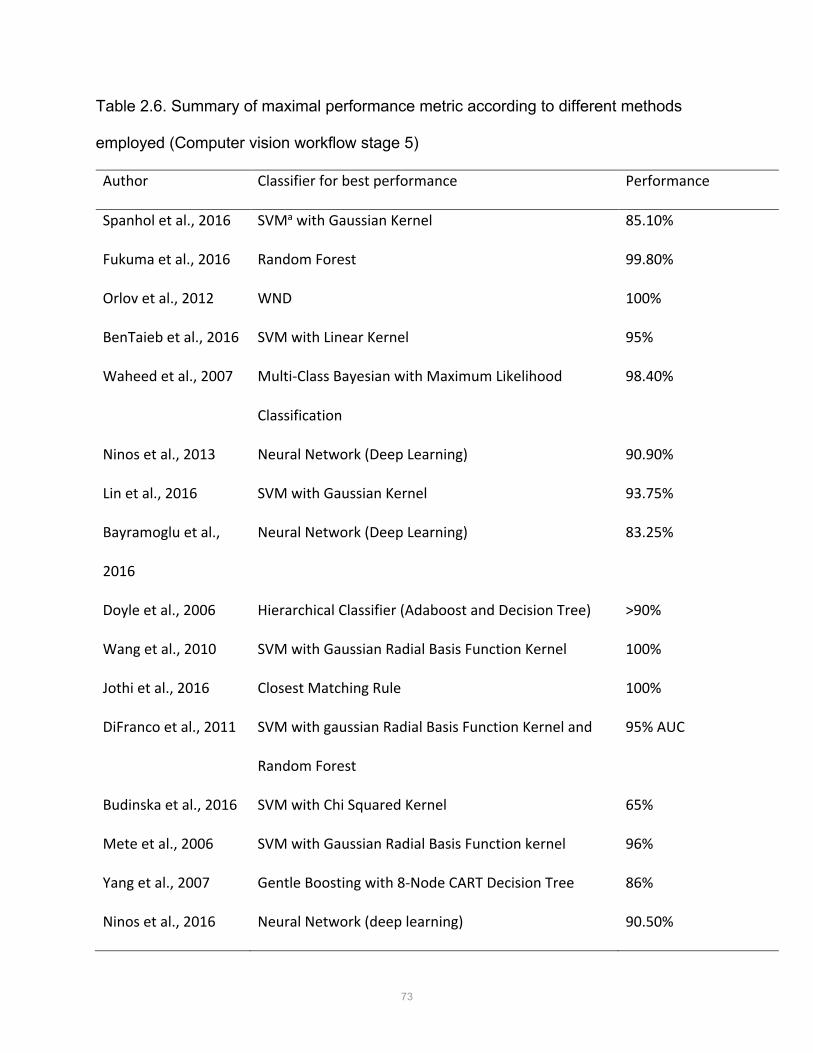
Table 2.6. Summary of maximal performance metric according to different methods
employed (Computer vision workflow stage 5)
Author Classifier for best performance Performance
Spanhol et al., 2016 SVMa with Gaussian Kernel 85.10%
Fukuma et al., 2016 Random Forest 99.80%
Orlov et al., 2012 WND 100%
BenTaieb et al., 2016 SVM with Linear Kernel 95%
Waheed et al., 2007 Multi-Class Bayesian with Maximum Likelihood
Classification
98.40%
Ninos et al., 2013 Neural Network (Deep Learning) 90.90%
Lin et al., 2016 SVM with Gaussian Kernel 93.75%
Bayramoglu et al.,
2016
Neural Network (Deep Learning) 83.25%
Doyle et al., 2006 Hierarchical Classifier (Adaboost and Decision Tree) >90%
Wang et al., 2010 SVM with Gaussian Radial Basis Function Kernel 100%
Jothi et al., 2016 Closest Matching Rule 100%
DiFranco et al., 2011 SVM with gaussian Radial Basis Function Kernel and
Random Forest
95% AUC
Budinska et al., 2016 SVM with Chi Squared Kernel 65%
Mete et al., 2006 SVM with Gaussian Radial Basis Function kernel 96%
Yang et al., 2007 Gentle Boosting with 8-Node CART Decision Tree 86%
Ninos et al., 2016 Neural Network (deep learning) 90.50%
73

Table 2.6. Summary of maximal performance metric according to different methods
employed (Computer vision workflow stage 5) cont.
Yu et al., 2016 SVM with Gaussian Kernel, Random Forrest, Breiman's
Random Forrest
81% AUC
Xu et al., 2014 Context-Constrained Multiple Clustered Instance
Learning
F =97.2%
74

Table 2.7. Recommendations for computer vision methodology on digital histopathology
images
Experiment Component Recommendation
1. Image Acquisition
(Computer Vision Workflow
Step 1)
a) Publicly available histopathology image datasets are
currently the best available in terms of size and
reproducibility of acquisition methods. Institutions
should work toward curating additional image datasets
for research use.
b) Learning curves should be used during model
development to assess whether an appropriate sample
size is being used.
c) To minimize the risk of bias, developers should be
explicit in the source of the histopathology images and
annotations.
2. Image Pre-processing
(Computer Vision Workflow
Step 12):
a) A sliding window approach to extract image patches
produces a larger dataset and represents the original
images the most.
b) An image data generator can be used for deep learning
experiments to increase the data size and variability.
Caution should be used with distortion and colour
manipulation as these factors are often important to
the appearance of histopathology images.
75

Table 2.7. Recommendations for computer vision methodology on digital histopathology
images cont.
Experiment Component Recommendation
2. Image Pre-processing
(Computer Vision Workflow
Step 2)
c) H&E stained histopathology images should be used,
and images should be manually inspected for quality.
3. Tissue Feature Extraction
(Computer Vision Workflow
Step 3)
a) Manual or semi-automated and fully automated
feature extraction performed well on histopathology
image datasets. If computing resources allow for fully
integrated feature extraction (with deep learning), this
technique has been shown to perform more
consistently on image data.
4. Pattern Recognition and
Classifier Training
(Computer Vision Workflow
Step 4)
a) Until decisions from deep learning models can be more
easily explained, the support vector machine classifier
should be used as it has been found to outperform
other classifiers on histopathology image data.
b) Cross-validation should be used during training so that
parameters such as sample size and resource allocation
can be tuned to optimize model performance and
computing resources required for training. 5-fold and
leave-one-out cross validation are commonly used.
76

Table 2.7. Recommendations for computer vision methodology on digital histopathology
images cont.
Experiment Component Recommendation
5. Algorithm Testing
(Computer Vision Workflow
Step 5)
a) Reserving 20% of the dataset for testing was the most
common data split used.
b) To facilitate comparison of model performance with
other machine learning models on histopathology data,
accuracy and/or F1-score should be used to report
model performance.
77

Supplementary Tables
Supplementary Table 2.0.1. MeSH terms and word variants searched in Medline
1. Visual pattern mining in histology image collections using bag of features.m_titl.
2. histological techniques/ or histocytochemistry/ or immunohistochemistry/
3. (histopathology adj2 imag*).tw,kf.
4. exp Diagnostic Imaging/
5. 2 and 4
6. histology ajd2 imag*.tw,kf.
7. 3 or 5
8. exp pattern recognition, automated/ or "neural networks (computer)"/ or support vector
machine/
9. (pattern adj2 (recognition? or classification?)).tw,kf.
10. image segmentation.tw,kf.
11. 8 or 9 or 10
12. 7 and 11
13. limit 12 to english language
Supplementary Table 2.0.2. MeSH terms and word variants searched in Embase
1. Visual pattern mining in histology image collections using bag of features.m_titl.
2. histology/ or immunohistology/ or immunohistochemistry/
3. (histopathology adj2 imag*).tw.
78

4. exp diagnostic imaging/
5. 2 and 4
6. 3 or 5
7. exp automated pattern recognition/ or exp artificial neural network/ or exp support vector
machine/
8. (pattern adj2 (recognition? or classification?)).tw.
9. image segmentation.tw.
10. 7 or 8 or 9
11. 6 and 10
Supplementary Table 2.0.3. MeSH terms and word variants searched in Scopus
1. TITLE-ABS-KEY ( ( histopathology W/2 imag* ) AND ( ( pattern W/2 ( recognition? OR
classification? ) ) OR image AND segmentation ) )
Supplementary Table 2.0.4. MeSH terms and word variants searched in IEEE Explore
1. histopathology image* AND (pattern recognition* or pattern classification*) in Basic
Search
79

Chapter 3
Automated Segmentation of Villi in Histopathology Images of Placenta
Salsabili S1, Mukherjee A2, Ukwatta E1,3, Chan ADC1, Bainbridge S2,4, Grynspan D5.
1Department of Systems and Computer Engineering, Carleton University, Ottawa, Ontario, Canada.
2Interdisciplinary School of Health Sciences, University of Ottawa, Ottawa, Ontario, Canada; Department of Pathology and Laboratory Medicine, Children's Hospital of Eastern Ontario, Ottawa, Ontario, Canada.
3School of Engineering, University of Guelph, Guelph, Ontario, Canada.
4Department of Cellular and Molecular Medicine, University of Ottawa, Ontario, Canada.
5Department of Pathology and Laboratory Medicine, Children's Hospital of Eastern Ontario and the University of Ottawa, Ontario, Canada.
This manuscript was published in Computers in Biology and Medicine in August 2019. Complete citation information for this manuscript is as follows: Comput Biol Med. 2019 Aug 30;113:103420. doi: 10.1016/j.compbiomed.2019.103420.
80

Computers in Biology and Medicine 113 (2019) 103420
Available online 30 August 20190010-4825/© 2019 Elsevier Ltd. All rights reserved.
Automated segmentation of villi in histopathology images of placenta
S. Salsabili a,*, A. Mukherjee b,c, E. Ukwatta a,d, A.D.C. Chan a, S. Bainbridge e,f, D. Grynspan g
a Department of Systems and Computer Engineering, Carleton University, Ottawa, Ontario, Canada b Interdisciplinary School of Health Sciences, University of Ottawa, Ottawa, Ontario, Canada c Department of Pathology and Laboratory Medicine, Children’s Hospital of Eastern Ontario, Ottawa, Ontario, Canada d School of Engineering, University of Guelph, Guelph, Ontario, Canada e Department of Cellular and Molecular Medicine, University of Ottawa, Ontario, Canada f Interdisciplinary School of Health Sciences, University of Ottawa, Ontario, Canada g Department of Pathology and Laboratory Medicine, Children’s Hospital of Eastern Ontario and the University of Ottawa, Ontario, Canada
A R T I C L E I N F O
Keywords: Histopathology Biomedical image processing Placenta Image segmentation Preeclampsia Color image processing
A B S T R A C T
Purpose: Manual analysis of clinical placenta pathology samples under the microscope is a costly and time- consuming task. Computer-aided diagnosis might offer a means to obtain fast and reliable results and also substantially reduce inter- and intra-rater variability. Here, we present a fully automated segmentation method that is capable of distinguishing the complex histological features of the human placenta (i.e., the chorionic villous structures). Methods: The proposed pipeline consists of multiple steps to segment individual placental villi structures in hematoxylin and eosin (H&E) stained placental images. Artifacts and undesired objects in the histological field of view are detected and excluded from further analysis. One of the challenges in our new algorithm is the detection and segmentation of touching villi in our dataset. The proposed algorithm uses the top-hat transformation to detect candidate concavities in each structure, which might represent two distinct villous structures in close proximity. The detected concavities are classified by extracting multiple features from each candidate concavity. Our proposed pipeline is evaluated against manual segmentations, confirmed by an expert pathologist, on 12 scans from three healthy control patients and nine patients diagnosed with preeclampsia, containing nearly 5000 individual villi. The results of our method are compared to a previously published method for villi segmentation. Results: Our algorithm detected placental villous structures with an F1 score of 80.76% and sensitivity of 82.18%. These values are substantially better than the previously published method, whose F1 score and sensitivity are 65.30% and 55.12%, respectively. Conclusion: Our method is capable of distinguishing the complex histological features of the human placenta (i.e., the chorionic villous structures), removing artifacts over a large histopathology sample of human placenta, and (importantly) account for touching adjacent villi structures. Compared to existing methods, our developed method yielded high accuracy in detecting villi in placental images.
1. Introduction
The human placenta is a vital organ of pregnancy, exchanging allgases, nutrients, and waste products between the mother and developing fetus. This complex organ is essential for fetal survival. Developmental abnormalities and/or in utero damage to this organ can have detri-mental short- and long-term health effects for both the mother and her fetus. Placental damage or dysfunction is known to play a central role in the development of fetal intrauterine growth restriction, pre-term birth, stillbirth, preeclampsia, and has also been linked to long term health
outcomes, such as premature cardiovascular disease in mothers and metabolic disturbances in offspring [1–8]. The effective application of placental histopathology following a poor pregnancy outcome can inform ongoing clinical management of mothers and neonates, and offer insight into etiology of placental disease, the risk of recurrence in future pregnancies, and may provide indications regarding which mothers and offspring are at highest risk of cardio-metabolic disease later in life [9–14]. However, unlike some other fields of clinical pathology, there are a limited number of perinatal pathologists who are highly special-ized in the field of placental histopathology, and the quality and
* Corresponding author.E-mail address: [email protected] (S. Salsabili).
Contents lists available at ScienceDirect
Computers in Biology and Medicine
journal homepage: http://www.elsevier.com/locate/compbiomed
https://doi.org/10.1016/j.compbiomed.2019.103420 Received 22 May 2019; Received in revised form 12 August 2019; Accepted 27 August 2019
81
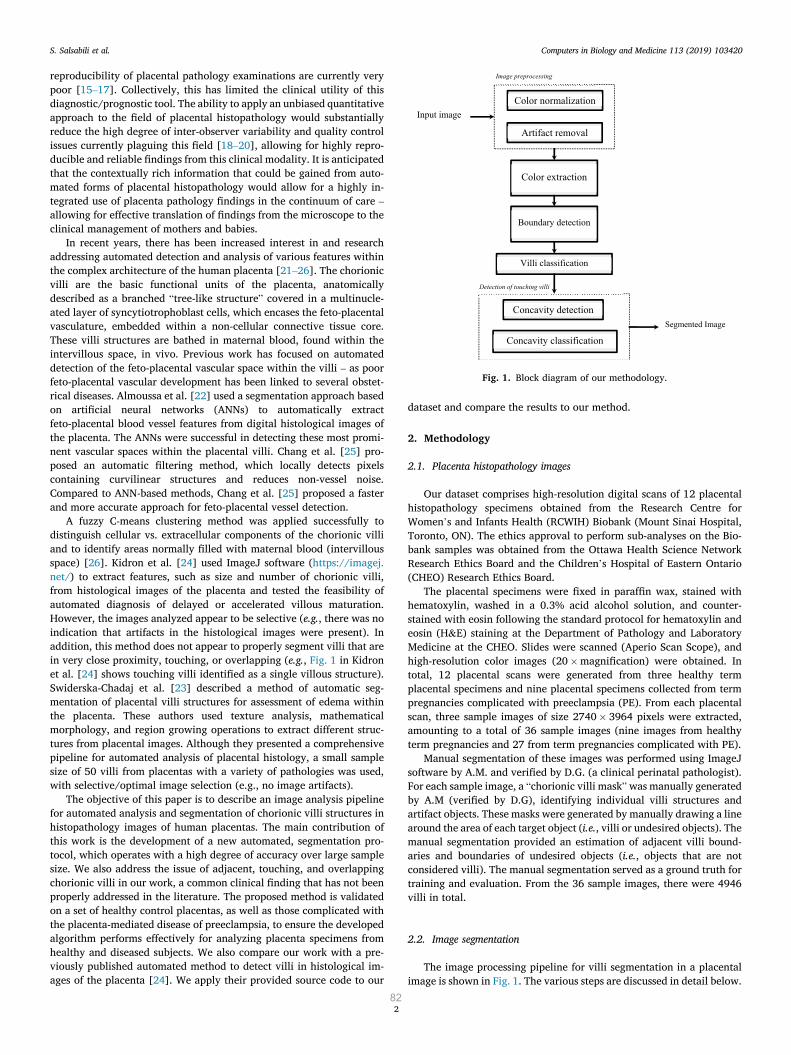
Computers in Biology and Medicine 113 (2019) 103420
2
reproducibility of placental pathology examinations are currently very poor [15–17]. Collectively, this has limited the clinical utility of this diagnostic/prognostic tool. The ability to apply an unbiased quantitative approach to the field of placental histopathology would substantially reduce the high degree of inter-observer variability and quality control issues currently plaguing this field [18–20], allowing for highly repro-ducible and reliable findings from this clinical modality. It is anticipated that the contextually rich information that could be gained from auto-mated forms of placental histopathology would allow for a highly in-tegrated use of placenta pathology findings in the continuum of care – allowing for effective translation of findings from the microscope to the clinical management of mothers and babies.
In recent years, there has been increased interest in and research addressing automated detection and analysis of various features within the complex architecture of the human placenta [21–26]. The chorionic villi are the basic functional units of the placenta, anatomically described as a branched “tree-like structure” covered in a multinucle-ated layer of syncytiotrophoblast cells, which encases the feto-placental vasculature, embedded within a non-cellular connective tissue core. These villi structures are bathed in maternal blood, found within the intervillous space, in vivo. Previous work has focused on automated detection of the feto-placental vascular space within the villi – as poor feto-placental vascular development has been linked to several obstet-rical diseases. Almoussa et al. [22] used a segmentation approach based on artificial neural networks (ANNs) to automatically extract feto-placental blood vessel features from digital histological images of the placenta. The ANNs were successful in detecting these most promi-nent vascular spaces within the placental villi. Chang et al. [25] pro-posed an automatic filtering method, which locally detects pixels containing curvilinear structures and reduces non-vessel noise. Compared to ANN-based methods, Chang et al. [25] proposed a faster and more accurate approach for feto-placental vessel detection.
A fuzzy C-means clustering method was applied successfully to distinguish cellular vs. extracellular components of the chorionic villi and to identify areas normally filled with maternal blood (intervillous space) [26]. Kidron et al. [24] used ImageJ software (https://imagej. net/) to extract features, such as size and number of chorionic villi, from histological images of the placenta and tested the feasibility of automated diagnosis of delayed or accelerated villous maturation. However, the images analyzed appear to be selective (e.g., there was no indication that artifacts in the histological images were present). In addition, this method does not appear to properly segment villi that are in very close proximity, touching, or overlapping (e.g., Fig. 1 in Kidron et al. [24] shows touching villi identified as a single villous structure). Swiderska-Chadaj et al. [23] described a method of automatic seg-mentation of placental villi structures for assessment of edema within the placenta. These authors used texture analysis, mathematical morphology, and region growing operations to extract different struc-tures from placental images. Although they presented a comprehensive pipeline for automated analysis of placental histology, a small sample size of 50 villi from placentas with a variety of pathologies was used, with selective/optimal image selection (e.g., no image artifacts).
The objective of this paper is to describe an image analysis pipeline for automated analysis and segmentation of chorionic villi structures in histopathology images of human placentas. The main contribution of this work is the development of a new automated, segmentation pro-tocol, which operates with a high degree of accuracy over large sample size. We also address the issue of adjacent, touching, and overlapping chorionic villi in our work, a common clinical finding that has not been properly addressed in the literature. The proposed method is validated on a set of healthy control placentas, as well as those complicated with the placenta-mediated disease of preeclampsia, to ensure the developed algorithm performs effectively for analyzing placenta specimens from healthy and diseased subjects. We also compare our work with a pre-viously published automated method to detect villi in histological im-ages of the placenta [24]. We apply their provided source code to our
dataset and compare the results to our method.
2. Methodology
2.1. Placenta histopathology images
Our dataset comprises high-resolution digital scans of 12 placental histopathology specimens obtained from the Research Centre for Women’s and Infants Health (RCWIH) Biobank (Mount Sinai Hospital, Toronto, ON). The ethics approval to perform sub-analyses on the Bio-bank samples was obtained from the Ottawa Health Science Network Research Ethics Board and the Children’s Hospital of Eastern Ontario (CHEO) Research Ethics Board.
The placental specimens were fixed in paraffin wax, stained with hematoxylin, washed in a 0.3% acid alcohol solution, and counter-stained with eosin following the standard protocol for hematoxylin and eosin (H&E) staining at the Department of Pathology and Laboratory Medicine at the CHEO. Slides were scanned (Aperio Scan Scope), and high-resolution color images (20 �magnification) were obtained. In total, 12 placental scans were generated from three healthy term placental specimens and nine placental specimens collected from term pregnancies complicated with preeclampsia (PE). From each placental scan, three sample images of size 2740 � 3964 pixels were extracted, amounting to a total of 36 sample images (nine images from healthy term pregnancies and 27 from term pregnancies complicated with PE).
Manual segmentation of these images was performed using ImageJ software by A.M. and verified by D.G. (a clinical perinatal pathologist). For each sample image, a “chorionic villi mask” was manually generated by A.M (verified by D.G), identifying individual villi structures and artifact objects. These masks were generated by manually drawing a line around the area of each target object (i.e., villi or undesired objects). The manual segmentation provided an estimation of adjacent villi bound-aries and boundaries of undesired objects (i.e., objects that are not considered villi). The manual segmentation served as a ground truth for training and evaluation. From the 36 sample images, there were 4946 villi in total.
2.2. Image segmentation
The image processing pipeline for villi segmentation in a placental image is shown in Fig. 1. The various steps are discussed in detail below.
Fig. 1. Block diagram of our methodology.
S. Salsabili et al.
82

Computers in Biology and Medicine 113 (2019) 103420
3
2.3. Image preprocessing
A number of factors can contribute to variations in the color content of histological images (e.g., histochemical staining time, amount of histology stain used, etc.). We applied a comprehensive color normali-zation [27] to input images to compensate for such variations. Imaging artifacts might also exist in the histological images. In our work, imaging artifacts appeared as darkened areas of the image, and therefore needed to be removed prior to segmentation of the villi boundary. In Fig. 4 a, examples of these imaging artifacts are identified with blue arrows. Using Equation (1), pixels that are part of the imaging artifacts were identified; the intensity of these pixels was then adjusted to be white. 8>>>>>><
>>>>>>:
bw1ðk; lÞ ¼��Iiðk; lÞ Ijðk; lÞ
�� � C1
bw2ðk; lÞ ¼ jIiðk; lÞj � C2BWartifact ¼ bw1 \ bw2
where
8<
:
i 6¼ ji; j 2 ðR; G; BÞk 2 ð1; mÞ; l 2 ð1; nÞ
(1)
In equation (1), I is an m � n � 3 intensity matrix and Ii ¼2
4a1;1 ⋯ a1;n⋮ ⋱ ⋮
am;1 ⋯ am;n
3
5 represents the ith matrix in RGB color space (i.e., red,
green, and blue). The constant c1 is a threshold to ensure that the in-tensity differences between the R, G, and B channels are small (i.e., detected pixel is essentially grey). The constant c2 is a threshold to ensure the detected pixels are relatively dark. The values assigned to c1
and c2 were 5 and 200, respectively, which were determined empiri-cally. The BWartifact is a binary mask, which is the intersection of the bw1 and bw2 binary masks and contains all of the pixels in I that are contaminated with artifacts, which are adjusted to be white.
2.4. Color extraction
Pixels in the histological images of the placenta were divided into
three classes based on color: red, white, and purple. Examples of these color classes and their subdivisions can be seen in Fig. 2. The first step in color classification is the extraction of the white class, found primarily outside of the villi, which is the maternal side of the placenta, called the intervillous space. This is deemed the background of the image. White spaces also exist within the core of some villi, primarily made of a non- cellular compartment of mesenchymal connective tissue (MCT) and/or tears in the connective tissue, which represent no specific tissue compartment. The white class is extracted using equation (2): 8>>>>>><
>>>>>>:
bw1ðk; lÞ ¼��Iiðk; lÞ Ijðk; lÞ
�� � C3
bw2ðk; lÞ ¼ jIij � THBWwhite ¼ bw1 \ bw2
where
8<
:
i 6¼ ji; j 2 ðR; G; BÞk 2 ð1; mÞ; l 2 ð1; nÞ
(2)
In equation (2), TH is a threshold, whose value is determined using Otsu’s method [28]. This threshold ensures that the extracted pixels have high intensities (close to white). The constant C3 is a threshold to ensure that the intensity difference between the R, G, and B channels is small. The value assigned to C3 was 15, which was determined empirically. The BWwhite is a binary mask, which is generated by the intersection of bw1 and bw2 binary masks, and contains the white class pixels.
The second step was the extraction of the red class. The red regions represent areas rich in fetal red blood cells, found within the feto- placental blood vessels encased within villi. In this work, all placental samples were washed several times during histological processing to remove blood from the tissue; however, some red blood cells often remain in each specimen. The combination of the red and white regions within the core of villi is referred to as the villi core (VC). The realization of the red class transformation is illustrated in Fig. 3. A transformed matrix T is computed (equation (3)), which highlights the red class, and a threshold is applied to extract the red class. The value for this threshold “TH” is determined using Otsu’s method [28].
Fig. 2. Classification of color content in H&E stained images, including: syncytiotrophoblasts cells (SC) and cytotrophoblasts cells (CC) in the purple class; non- cellular mesenchymal connective tissue (MCT) in the white class; and fetal red blood cells within the villi core vasculature in the red class.
S. Salsabili et al.
83

Computers in Biology and Medicine 113 (2019) 103420
4
�T≜IR meanðIG þ IBÞ
BWred ¼ ðT � THÞ(3)
The remaining pixels are assigned to the purple class, which repre-sents several other cellular compartments. The dark purple regions primarily identify the nuclei of the syncytiotrophoblasts cells (SC), cytotrophoblasts cells (CC), along with the nuclei of any supporting cells, which might be present in the mesenchyme connective tissue core (i.e., fibroblasts, immune cells). SCs and CCs are densely packed along the villi borders. Nuclei of mesenchymal support cells, on the other hand, have a sparse appearance in the core regions of the villi. There-fore, the dense appearance of dark purple areas in non-border regions of a contour indicates that this is likely a border subdividing two villi in close proximity within the contour. The light purple area identifies the cytoplasmic compartment of the SCs and CCs, along with mesenchymal support cells.
The purple class is further classified into dark purple and light purple classes. For simplicity, we call the dark purple class the “SC class”. Equation (4) is used to extract the SC class, where T is the transformed matrix, and “TH” is a threshold, whose value is determined using Otsu’s method [28]. The transformation of the purple class can be seen in Fig. 3. The remaining pixels are assigned to the light purple class. �
T≜IB meanðIG þ IRÞ
BWSC ¼ ðT � THÞ(4)
2.5. Boundary detection
After extraction of the color content, the input image was separated into the background (i.e., white class) and foreground (i.e., all classes excluding the white class). The foreground can be adopted as a rough estimate of the boundary of the objects in the image. The binary mask from the foreground was used as initial contours in the level set algo-rithm, based on the Chan-Vase formulation [29], to obtain the exact boundary of each contour. The algorithm accurately segments objects of interest (i.e., villi candidates).
2.6. Villi classification
To be considered “placental villi”, objects of interest needed to sur-pass a minimum threshold size of 1000 μm [2]. This threshold size was selected based upon well-established, healthy placenta villi dimensions previously described in the literature [30,31]. This villi size threshold is the same as the one used in work by Kidron et al. [24], which is of relevance as we are comparing our method to their method. Objects of interest <1000 μm [2] might include red and white blood cells found in the intervillous space, fibrin deposition, syncytial knots (pieces of apoptotic placenta shed from the villi surface), or artifacts from tissue processing and histological preparation.
It is important to note that there are undesired objects of interest >1000 μm [2], as demonstrated in Fig. 4a. Therefore, further descriptors
Fig. 3. Example of the red and dark purple class color extraction.
Fig. 4. a) Examples of artifacts and undesired objects. The blue arrows show the areas that are affected by artifacts and the red arrows show the undesired objects. b) the villi classification steps output that shows the removal of artifacts and undesired objects.
S. Salsabili et al.
84

Computers in Biology and Medicine 113 (2019) 103420
5
needed to be included in order to identify true placenta villi objects versus undesired objects. Mature placenta villi contain white and/or red regions within their core, indicative of the presence of connective tissue and fetal vasculature and/or fetal red blood cells (VC class). Moreover, placental villi are surrounded by a continuous layer of SC cells and a sparse underlying layer of CC cells, all of which contain dark purple nuclei (i.e., SC class). Conversely, undesired objects do not have these anatomical features and therefore demonstrate a considerably different density profile for the SC and VC classes. The SC and VC class density thresholds were tuned over the training set, using density profiles of the SC and VC class of true placenta villi objects (ground truth) – as iden-tified through manual segmentation.
2.7. Detection of touching villi
In this work, a novel approach was used to detect pairs of touching villi. The postulated boundary separating the two touching villi was identified using the presence of concavity at the site where the two villi meet, which is visually distinguishable from other concavities in a standard villous structure. Specifically, at these concave sites, you additionally see the dense presence of dark purple nuclei within the SC class. Fig. 5a shows a representative example of four placenta villi that are touching each other, with three red arrows highlighting the visual features of the concave sites of separation. In this work, villi separation boundaries were identified in two steps: 1) detection of candidate con-cavities through contour analysis, and 2) acceptance or rejection of each candidate concavity as a separate villous boundary, through color analysis (i.e., density of different color classes in the boundary area, and the density of color classes in the two resultant villi).
1) Detection of candidate concavities
The concavity detection step employs the top-hat transform, which isdefined as the subtraction of the original contour from its opening with a structuring element (SE) [32]. This definition of top-hat transform can be interpreted as an attempt to cover the areas within the contour by fitting a SE into the contour, under the condition that the entirety of the
SE remains within the boundary of the contour. The areas that cannot be covered by the fitted SE are the concavities/convexities in the contour. An example is shown in Fig. 5c, where the regions that are marked in red show convexities/concavities in the contour. The output of the top-hat transform (Fig. 5d) might contain the candidate concavity (Fig. 5e), which must satisfy two conditions: 1) the removal of the candidate concavity from the contour must divide the contour into two new con-tours, and 2) the size of each of these new contours must satisfy the minimum villi size threshold (i.e., 1000 μm [2]). Fig. 5e shows the target concavity, which satisfies these two conditions.
Identifying candidate concavities using the top-hat transform de-pends on the characteristics of the SE (i.e., size, shape, and alignment). Fig. 6 shows the effect of varying the characteristics of the SE on the detection of candidate concavities. In our work, an elliptical SE with different sizes and orientations (i.e., 0�, 45�, 90�, and 135�) is used to detect concavities in the contour.
The procedure of changing the characteristics of the SE is continued until a candidate concavity is identified, or the top-hat transform of the contour becomes equal to the contour itself. This might happen if the size of the structuring element becomes large enough that the opening of the contour with the SE can become zero (i.e., the contour is completely eroded by the structuring element). As a result, the top-hat transform of the contour (i.e., subtraction of the contour from its opening with a SE) becomes equal to its opening. If a candidate concavity is identified, the candidate concavity is removed to produce two new contours, and the concavity detection process is iteratively applied on these contours. Algorithm 1 shows the pseudocode for concavity detection.
2) Color analysis
Not all of the identified candidate concavities are actual separationboundaries between two villi. Only candidate concavities that possess certain color features are accepted as the separation boundaries. Based these color features, the border regions of a villous structure have: 1) a high density of SC cells and CC cells (i.e., SC class), and 2) sparse appearance of the VC class. Therefore, candidate concavities that have high SC-class density and low density of VC-class are labeled as sepa-
Fig. 5. (a) Examples of attachment areas in villi. (b) A sample contour and an elliptical-shape structuring element to be used in calculation of top-hat trans-form. (c) The interpretation of the top-hat transform by fitting the SE inside the contour. The areas that cannot be covered by SE are shown in red. These areas are the output of top-hat transform (d) The output of the top-hat transform, which represents all of the convexities and concavities in the contour. (e) The candidate concavity, which is the only concavity in the contour that its removal divide the original contour into two separate contours. (f) The resultant contours of removing the candidate concavity from the original contour. Both contour satisfied the min-imum size threshold of a villous.
S. Salsabili et al.
85

Computers in Biology and Medicine 113 (2019) 103420
6
Fig. 6. An example of detecting the candidate concavity by changing the characteristics of the SE. In this example, two rotation is considered for a given elliptical- shape structuring element (i.e., 0�, 45�). The size of the SE is changed for each rotation to the point that the top-hat transform of the input contour becomes equal to the input contour itself. As it can be seen in this figure, the candidate concavity cannot be detected in 0� rotation. On the other hand, in 45� rotation increasing the size of the SE leads to appearance of the candidate concavity in the top-hat transform of the contour.
S. Salsabili et al.
86

Computers in Biology and Medicine 113 (2019) 103420
7
ration boundaries. The thresholds for SC-class density and VC-class density were tuned over the training set of images, using the manual segmentation as ground truth.
2.8. Evaluation
Our data set consisted of nine images obtained from healthy term pregnancies and 27 placenta images from term pregnancies complicated with PE. We performed stratified 5-fold cross-validation, assigning the images into training and test sets with a 2:1 ratio (i.e., six images from healthy patients and 18 images from PE patients were assigned to the training set, and three images from healthy patients and nine images from PE patients were assigned to the test set).
Villi detection accuracy was determined using manual segmentation as ground truth. The F1 score and sensitivity were calculated based on the following definitions:
Sensitivity ¼ TP=ðTPþFNÞ (5)
F1 score ¼ ð2�TPÞ=ð2� TPþFPþFNÞ (6)
� True positive (TP): number of villous structures identified correctly� True negative (TN): number of objects in the binary mask generated
in the boundary detection step that are correctly labeled as otherobjects (i.e., non-villi)
� False positive (FP): number of villous structures identifiedincorrectly
� False negative (FN): number of villi structures identified in themanual segmentation that were not detected
For instance, if a contour contained two villi based on manual seg-mentation, and our algorithm correctly detected these two villi, the
algorithm scored two TPs. However, if the algorithm detected only one or none of the villi, the algorithm scored one TP and one FN, or two FNs, respectively. When a contour contained only one villus based on manual segmentation, but our algorithm detected two villi, the case was scored as one TP and one FP.
2.9. Comparison to a previous method
The results of our method were evaluated against a recently pub-lished method [24] for placenta villi segmentation, based on the ImageJ software platform. The authors of the previous method publicly pro-vided their source code online. In this previously published method, the authors extracted boundaries of villi to determine the number of existing villi in a given image, and standard color thresholding was used to segment the villi; we optimized this threshold over our training set. To achieve a fair comparison, we used the same values for the common thresholds in both methods (i.e., villi size threshold, which is set to 1000 μm [2]). We then evaluated their method by comparing algorithm-generated results with manual segmentation. We also eval-uate our method’s segmentation results against manual segmentation and compare it with generated results from the previous method.
As stated in section II.C, TNs are defined as the number of objects in the binary mask that correctly labeled as non-villous objects. TNs were not computed for this comparison method, as it does not have a similar binary mask that would allow for a sensible TN comparison.
3. Results
As is typically observed in clinically relevant image datasets, ourexperimental image dataset contained artifacts and undesired objects, including imaging artifacts and maternal red blood cells in the inter-villous space (12 out of 36 images were contaminated by imaging arti-facts (Fig. 4)). In the villi classification step, the contours were classified based on their size and density of VC class and SC class. The proposed pipeline was able to recognize desired contours with 92.86% accuracy
Fig. 7. Sample segmentation of villi, a) The original image, b) The manual segmentation. The boundary of a villous structure is annotated in blue. The red annotation shows undesired objects, c) The segmentation results of our proposed method. The boundaries of villi is annotated in green. d) The generated binary mask showing the final segmentation results.
S. Salsabili et al.
87

Computers in Biology and Medicine 113 (2019) 103420
8
(3625 out of 3904 contours were correctly identified). Concavity detection was an important step in the detection of
touching villi step. In comparison to manually identified concavities by experts, our algorithm detected concavities with an accuracy of 95.47% (3908 out of 4093 concavities were correctly identified).
Fig. 7 shows multiple sample segmentation of villi, which is per-formed by our proposed method. Table 1 shows the F1 scores, sensi-tivity, and truth table components of a recently published method [24] and the proposed method, separating the results for healthy control patients and patients diagnosed with PE. In Table 2, the overall results across all placental images are presented. In comparison to the previous method, our method yielded an F1 score and a sensitivity that are 15.46% and 27.06% higher, respectively. In order to highlight the impact that detection of touching villi has on the overall performance of our proposed method, the overall result of the proposed method without detection of touching villi is also included in Table 2.
As it is defined in Eq. (5), the sensitivity of a method depends on the total number of FNs. In this work, the majority of FN cases are generated when multiple villi are located in close proximity of each other, and the algorithm is not able to discern these as separate villi. As can be observed from the sensitivity column in Table 2, the difference gap between the previous work’s sensitivity and the proposed method without detection of touching villi step is 6.68%. The comparison be-tween the sensitivity of the proposed method with and without detection of touching villi shows a considerably large difference of 20.9%. The great improvement in sensitivity over the previous method is primarily achieved by applying the detection of touching villi step in our proposed algorithm.
The processing time required for a complete analysis of each image was approximately 21 min per image on a Core i7-6700 CPU at 3.4 GHz. We observed that this processing time is quite reasonable as the devel-oped algorithm can run in the background without the need for any user interactions. Although we have used parallel processing in the feature- based analysis stage, the rest of the programming code is not opti-mized. The villi density in each image and the convexity of the extracted contours were two of the most influential factors in the determination of the processing time required for each analysis. Most of the processing
time (approximately 80%) was required for the boundary detection step, which can be substantially improved by parallel (GPU) processing.
4. Discussion
An initial step for automated analysis of placental images is seg-menting the chorionic villi – the functional unit of the placenta – within the histological specimens. Villi segmentation allows extraction of key features (e.g., villi count, size distribution, shape feature) for an objec-tive assessment of placental images. Due to the complexity of villous structures and the presence of imaging artifacts, segmentation of indi-vidual villi in a placental image is a difficult task. However, the proposed method successfully identifies complex villous structures in a large se-ries of images with high accuracy. Our proposed method yielded an F1 score of 80.76% and sensitivity of 82.18% for a dataset comprising of 4946 sample villi, which considerably outperformed a previously pub-lished method [24].
Two major contributing factors in obtaining better results in our method compared to the previous method were: 1) comprehensive artifact removal; and 2) the ability to detect and properly segment touching villi. The second factor had a large influence on the results, particularly the sensitivity score. A commonly recognized feature of the placental disease in PE is “villous agglutination” – a condition in which neighboring villi structures adhere to one another [33]. This feature of placental images from pregnancies complicated with PE likely contrib-uted to the decreased performance of the previously published seg-mentation method when compared to healthy controls. Importantly, our algorithm yielded high and comparable performance when applied to histopathology cases from healthy controls (weighted average F1 score of 83.37%) or pathological cases of preeclampsia (weighted average F1 score of 79.61%) – providing confidence for the utility of this automated process in a clinical setting.
The most important limitation of our work was including connective tissue tears in VC. In our work, the calculation of fetal red blood cells density played a key role in multiple steps of our algorithm. The placental specimens used had been washed, so a considerable amount of red regions (fetal blood cells) inside placental vasculature (within the core of the villi structure) had been removed and replaced by white/ light pink regions. Therefore, we also included these white regions in the calculation of VC density. However, some included areas were related to connective tissue tears, which represent no particular tissue.
The long-term goal of our work is to develop an algorithm that has the ability to process the whole placenta scan. This can be achieved by block analysis. With the scans used in our dataset, on average, around 50 extracted images would be required to cover the whole scan. Although the presented pipeline has the potential to analyze the entire scans (i.e., analysis of ~50 images per scan), in our study, we only present the re-sults from three images from each placental scan. Manual segmentation,
Table 1 A comparison between our proposed method and the previous work. The results are presented for each fold for health term pregnancies and pregnancies complicated with PE. The TN row for the previously published work is not applicable as explained in section II.D.
Healthy Diagnosed with PE
fold #1 fold #2 fold #3 fold #4 fold #5 fold #1 fold #2 fold #3 fold #4 fold #5
Proposed method TP 227 255 246 228 247 421 532 518 541 572 TN 96 176 102 150 134 227 177 193 261 247 FP 50 69 68 46 57 128 141 131 132 161 FN 42 28 68 29 23 138 124 144 133 92 F1 score (%) 83.15 84.02 78.34 85.88 86.06 75.99 80.06 79.02 80.33 81.89 Sensitivity (%) 84.39 90.11 78.34 88.72 91.48 75.31 81.10 78.25 80.27 86.14
Previously published method [24] TP 133 209 163 170 189 253 370 312 331 410 TN – – – – – – – – – – FP 23 43 38 27 50 76 85 70 92 128 FN 136 74 151 87 81 306 286 350 343 254 F1 score (%) 62.59 78.13 63.30 74.89 74.26 56.98 66.61 59.77 60.35 68.22 Sensitivity (%) 49.44 73.85 51.91 66.15 70.00 45.26 56.40 47.13 49.11 61.75
Table 2 Overall F1 score and sensitivity of the previous method, the proposed method without detection of touching villi algorithm, and the proposed method with touching villi detection algorithm. The results are reported as the weighted average of five fold cross validation.
F1 score Sensitivity
Previously published method [24] 65.30% 55.12% Proposed method without detection of touching villi 74.58% 61.28% Proposed method with detection of touching villi 80.76% 82.18%
S. Salsabili et al.
88

Computers in Biology and Medicine 113 (2019) 103420
9
to establish a ground truth, is a time-consuming process, and it was believed that it was more important for this study to have images that better capture the variability across scans than within a scan.
5. Conclusion
In this study, a fully automated method for segmentation of chori-onic villi structures in histopathology images of the human placenta was presented. The proposed method has the ability to identify complex villous structures, including touching and overlapping villi, by per-forming color analysis on the detected concavities of the villi structures. Our proposed method yielded an F1 score of 80.76% and sensitivity of 82.18% for a dataset comprising of nearly 5000 sample villi, consider-ably higher performance than previously published methods. In addi-tion, the proposed method has a comparable performance on placental samples from healthy and pathological pregnancies, a critical consid-eration in determining clinical utility.
With the help of an accurate and robust automated analysis method, pathologists might be presented with a set of otherwise inaccessible morphometric values for each image, such as the distribution of specific structures (physically and class-wise) and presence or absence of certain histological features/findings within identified structures. The pathol-ogist can use these values to help make a final diagnosis. Although we focused only on histopathology images of the placenta, it might be possible to generalize this tool across multiple fields of clinical pathol-ogy. This could result in a marketable tool that would substantially reduce the subjectivity that exists in current practice.
Conflicts of interest
None.
Acknowledgments
This work is supported in part by the Ontario Trillium Scholarship (OTS) and Natural Sciences and Engineering Research Council (NSERC) of Canada.
References
[1] B. Huppertz, Placental pathology in pregnancy complications, Thromb. Res. (2011), https://doi.org/10.1016/S0049-3848(11)70026-3.
[2] R.I. Sava, K.L. March, C.J. Pepine, Hypertension in pregnancy: taking cues from pathophysiology for clinical practice, Clin. Cardiol. (2018), https://doi.org/ 10.1002/clc.22892.
[3] M. Kovo, L. Schreiber, A. Ben-Haroush, E. Gold, A. Golan, J. Bar, The placental component in early-onset and late-onset preeclampsia in relation to fetal growth restriction, Prenat. Diagn. (2012), https://doi.org/10.1002/pd.3872.
[4] J.M. Roberts, C. Escudero, The placenta in preeclampsia, Pregnancy Hypertens (2012), https://doi.org/10.1016/j.preghy.2012.01.001.
[5] T.K. Morgan, Role of the placenta in preterm birth: a review, Am. J. Perinatol. (2016), https://doi.org/10.1055/s-0035-1570379.
[6] R. Bukowski, M. Carpenter, D. Conway, et al., Causes of death among stillbirths, JAMA, J. Am. Med. Assoc. (2011), https://doi.org/10.1001/jama.2011.1823.
[7] L. Bellamy, J.-P. Casas, A.D. Hingorani, D.J. Williams, Pre-eclampsia and risk of cardiovascular disease and cancer in later life: systematic review and meta- analysis, BMJ (2007), https://doi.org/10.1136/bmj.39335.385301. BE.
[8] H a de Boo, J.E. Harding, The developmental origins of adult disease (Barker) hypothesis, Aust. N. Z. J. Obstet. Gynaecol. (2006), https://doi.org/10.1111/ j.1479-828X.2006.00506.x.
[9] R.W. Redline, Classification of placental lesions, Am. J. Obstet. Gynecol. 213 (4) (2015) S21–S28, https://doi.org/10.1016/j.ajog.2015.05.056.
[10] A. Chen, D.J. Roberts, Placental Pathologic Lesions with a Significant Recurrence Risk - what Not to Miss! APMIS, 2017.
[11] J.M. Catov, C.M. Scifres, S.N. Caritis, M. Bertolet, J. Larkin, W.T. Parks, Neonatal outcomes following preterm birth classified according to placental features, Am. J. Obstet. Gynecol. (2017), https://doi.org/10.1016/j.ajog.2016.12.022.
[12] M.T. Vinnars, J. Nasiell, G. Holmstr€om, M. Norman, M. Westgren, N. Papadogiannakis, Association between placental pathology and neonatal outcome in preeclampsia: a large cohort study, Hypertens. Pregnancy (2014), https://doi.org/10.3109/10641955.2013.842584.
[13] A.M. Roescher, A. Timmer, J.J.H.M. Erwich, A.F. Bos, Placental pathology, perinatal death, neonatal outcome, and neurological development: a systematic review, PLoS One (2014), https://doi.org/10.1371/journal.pone.0089419.
[14] K.M. Chisholm, A. Heerema-Mckenney, Fetal thrombotic vasculopathy: significance in liveborn children using proposed society for pediatric pathology diagnostic criteria, Am. J. Surg. Pathol. (2015), https://doi.org/10.1097/ PAS.0000000000000334.
[15] R.W. Redline, The clinical implications of placental diagnoses, Semin. Perinatol. 39 (1) (2015) 2–8, https://doi.org/10.1053/j.semperi.2014.10.002.
[16] P. Kelehan, A. Maes, E.M. Mckay, T.K. Morgan, P.G.J. Nikkels, Sampling and Definitions of Placental Lesions, vol. 140, 2016, https://doi.org/10.5858/ arpa.2015-0225-CC. July.
[17] R.W. Redline, Placental Pathology: A Systematic Approach with Clinical Correlations, vol. 22, 2008, pp. 86–91, https://doi.org/10.1016/j. placenta.2007.09.003.
[18] R.W. Redline, Villitis of unknown etiology: noninfectious chronic villitis in the placenta, Hum. Pathol. (2007), https://doi.org/10.1016/j.humpath.2007.05.025.
[19] G. Turowski, L.N. Berge, L.B. Helgadottir, E.M. Jacobsen, B. Roald, A new, clinically oriented, unifying and simple placental classification system, Placenta (2012), https://doi.org/10.1016/j.placenta.2012.10.002.
[20] B. Hargitai, Best practice NO 178: examination of the human placenta, J. Clin. Pathol. (2004), https://doi.org/10.1136/jcp.2003.014217.
[21] S.L. Warsof, P. Gohari, R.L. Berkowitz, J.C. Hobbins, The estimation of fetal weight by computer-assisted analysis, Am. J. Obstet. Gynecol. (1977), https://doi.org/ 10.1016/0002-9378(77)90058-8.
[22] N. Almoussa, B. Dutra, B. Lampe, et al., Automated vasculature extraction from placenta images, Proc. SPIE-Int. Soc. Opt. Eng. 7962 (2011), https://doi.org/ 10.1117/12.878343, 79621L-79621L - 10.
[23] Z. Swiderska-Chadaj, T. Markiewicz, R. Koktysz, S. Cierniak, Image processing methods for the structural detection and gradation of placental villi, Comput. Biol. Med. (April) (2017) 1–11, https://doi.org/10.1016/j.compbiomed.2017.08.004.
[24] D. Kidron, I. Vainer, Y. Fisher, R. Sharony, Automated image analysis of placental villi and syncytial knots in histological sections, Placenta 53 (2017) 113–118, https://doi.org/10.1016/j.placenta.2017.04.004.
[25] J.M. Chang, N. Huynh, M. Vazquez, C. Salafia, Vessel enhancement with multiscale and curvilinear filter matching for placenta images. International Conference on Systems, Signals, and Image Processing, 2013, pp. 125–128, https://doi.org/ 10.1109/IWSSIP.2013.6623469.
[26] P. Palee, B. Sharp, L. Noriega, N.J. Sebire, C. Platt, Image analysis of histological features in molar pregnancies, Expert Syst. Appl. 40 (17) (2013) 7151–7158, https://doi.org/10.1016/j.eswa.2013.06.034.
[27] G.D. Finlayson, B. Schiele, J.L. Crowley, Comprehensive colour image normalization, in: Lecture Notes in Computer Science (Including Subseries Lecture Notes in Artificial Intelligence and Lecture Notes in Bioinformatics), 1998, https:// doi.org/10.1007/BFb0055685.
[28] O. Nobuyuki, A threshold selection method from gray-level histograms, IEEE Trans. Syst. Man Cybern. (1979), https://doi.org/10.1109/TSMC.1979.4310076.
[29] T.F. Chan, L.A. Vese, Active contours without edges, IEEE Trans. Image Process. 10 (2) (2001) 266–277, https://doi.org/10.1109/83.902291.
[30] F. Stoz, R.A. Schuhmann, A. Schmid, Morphometric investigations of terminal villi of diabetic placentas in relation to the White classification of diabetes mellitus, J. Perinat. Med. 440 (1987) 193–198.
[31] S. Chaikitgosiyakul, M.J. Rijken, A. Muehlenbachs, et al., A morphometric and histological study of placental malaria shows significant changes to villous architecture in both Plasmodium falciparum and Plasmodium vivax infection, Malar. J. (2014) 1–13.
[32] R.M. Haralick, S.R. Sternberg, X. Zhuang, Image analysis using mathematical morphology, IEEE Trans. Pattern Anal. Mach. Intell. (1987), https://doi.org/ 10.1109/TPAMI.1987.4767941.
[33] M.W. Stark, L. Clark, R.D. Craver, Histologic differences in placentas of preeclamptic/eclamptic gestations by birthweight, placental weight, and time of onset, Pediatr. Dev. Pathol. 17 (3) (2014) 181–189, https://doi.org/10.2350/13- 09-1378-OA.1.
S. Salsabili et al.
89

Chapter 4
Application of Machine Learning to Classify Distinct Patterns of Placenta Histopathology: A Proof-of-Concept Using Cases of Preeclampsia
Mukherjee A1, Salsabilli S2, Ukwatta E2,3, Chan ADC2, Grynspan D4,5, Bainbridge SA1,6.
11Interdisciplinary School of Health Sciences, University of Ottawa, Ottawa, Ontario, Canada. 2Department of Systems and Computer Engineering, Carleton University, Ottawa, Ontario, Canada. 3Department of Biomedical Engineering, Guelph University, Guelph, Ontario, Canada. 4Department of Pathology and Laboratory Medicine, Children’s Hospital of Eastern Ontario, Ottawa, ON, Canada. 5Department of Pathology, Vernon Jubilee Hospital, Vernon, British Columbia, Canada. 6Department of Cellular and Molecular Medicine, University of Ottawa, Ottawa, Ontario, Canada.
This manuscript was formatted for submission to the peer-reviewed journal Journal of Pathology Informatics.
90

Abstract
Background: Placenta mediated diseases (PMD) affect up to 20% of pregnancies and are the leading
cause of maternal and fetal morbidity and mortality. Histopathology analysis is critical to understanding
the physiology underlying placenta-induced pregnancy complications. However, a major challenge in
perinatal pathology is the variable findings in histopathological analysis of the placenta. This finding is
particularly true of preeclampsia (PE) – one of the most severe types of placenta mediated diseases with
high heterogeneity in clinical presentation and underlying placental disease and damage. Given the
heterogeneity of PE, consistent histopathological analysis of these placentae may be improved through
the application of machine learning (ML) models which may be capable of differentiating distinct
subclasses of PE patients with divergent forms of placental disease. The current study sought to
determine the utility of ML to identify distinct patterns of placental disease, using cases of PE as a proof-
of-concept. More broadly, machine learning could be applied to the entirety of placental pathology,
lending to the development of computer-aided diagnostic tools in this field.
Methods: Supervised ML algorithms were used to develop classification models for the identification of
PE or PE subclasses using digital images of placenta histopathology specimens. Three experimental
designs were used to examine different feature extraction methods, ranging from a high degree of
human involvement through to fully integrated automation (deep learning). Classification performance
of each ML model was assessed, with the inclusion or omission of gestational age at delivery as an
additional feature used for classification purposes.
Results: All 3 experimental models achieved maximum performance in the classification of PE cases vs
controls (55-73%), with moderate performance in the identification of PE disease subclasses (41-73%).
The inclusion of gestational age at delivery as a feature of relevance typically increased model
91

performance. The deep learning method tested demonstrated the poorest performance on all
classification tasks (41%-55%).
Conclusions: The current study has determined that ML models can classify cases of PE with
considerable success. However, significant variability exists in model performance, depending on the
method of feature extraction used, and the reference labels being used (binary clinical outcome vs.
disease subclass classification). With additional validation, the automated screening tools presented
have the potential to optimize the time pathologists spend analyzing placenta histopathology images
and improve the agreement of diagnoses between pathologists.
Keywords: placenta, preeclampsia, pathology, histopathology, digital pathology, machine learning,
supervised machine learning, deep learning, support vector machine, convolutional neural networks,
image classification, medical imaging, computer vision, feature extraction, Whole-slide imaging
92

Background
Preeclampsia (PE) is a hypertensive disorder of pregnancy, clinically defined by new onset hypertension
after 20 weeks of gestation combined with evidence of maternal end organ dysfunction. [1,2] This
disorder affects 3-8% of all pregnancies, [3] and is a leading cause of maternal and infant mortality
worldwide. There is currently no cure for PE, other than delivery of the causative organ – the placenta.
[1] Rates of PE are increasing across North America, likely as a result of increased maternal age and/or
increased incidence of pre-disposing co-morbidities (i.e. chronic hypertension, obesity, diabetes). [3]
Preeclampsia is a highly heterogeneous placenta-mediated disorder, with a wide spectrum of clinical
presentation, observed placental pathologies and maternal and fetal health outcomes. [3–5] Mounting
evidence indicates this heterogeneity is the result of distinct PE disease subclasses with divergent
underlying placental and maternal pathophysiology. [6] Commonly, this pregnancy disorder is classified
according to time of disease onset and severity of maternal symptoms. [7,8] “Early-onset” or “severe”
PE is characterized by maternal symptom onset at less than 34 weeks of gestation, and is associated
with increased rates of pre-term delivery, fetal growth restriction and severe maternal complications
(i.e. HELLP) when compared to “late-onset” PE. [7] However, this simple dichotomous split of PE cases
does not completely resolve the high degree of heterogeneity observed, indicating further subclasses of
disease may exist. Work conducted by our group demonstrates the presence of at least three distinct
molecular subclasses of PE, each with a unique clinical and placenta pathology profile. [5,6] The largest
subclass (coined “canonical PE”) demonstrates placental gene expression and histopathology findings
consistent with maternal vascular malperfusion of the placenta, with a more severe maternal disease
phenotype and earlier delivery. [5] A smaller immunological subclass of PE was also identified,
demonstrating placental gene expression and histopathology findings consistent with an allograft
rejection of this critical organ of pregnancy. [5] Interestingly, this subclass of PE demonstrated the most
severe fetal phenotype of disease, with a large number of growth restricted infants in this subclass. The
93

final PE subclass previously described demonstrated minimal evidence of placental pathology, the
mildest degree of maternal disease, and normal fetal outcomes, and we speculate that in these cases
maternal maladaptation to pregnancy may be the underlying etiology of PE. [5]
The ability to critically evaluate the placenta at the histological level following a PE pregnancy, through
clinical placenta pathology examination, can help diagnose PE disease subtypes (underlying disease
etiology) and can inform the clinical team in regards to recurrence risk and/or future health risks for
both the mother and infant. [5,9] However, placenta pathology examinations are resource intensive
with requirements for sub-specialized pathologist expertise and heavy workload demands because of
high volume and complexity of placenta-mediated diseases. [10,11] Further, it is well documented that
clinical placenta pathology is plagued by a high degree of inter-observer variability – the result of
differences in institutional practices, pathologist sub-specialty training and lack of diagnostic and
practice standardization. [12,13] The Amsterdam collective has made tremendous strides towards
improving standardization of diagnostic criteria and reporting practices [14], however the integration of
diagnostic aids in this clinical field would no doubt improve the clinical utility of these examination and
relieve some of the workload pressures pathologists face [15] – freeing up resources for the examination
of more challenging cases. [13,16] More specifically, standardized automation of some aspects of the
placenta pathology examination may clarify some confusion surrounding the heterogeneity of a PE
diagnosis, leading to more personalized and effective post-partum counselling and intervention
strategies for women following a PE pregnancy. [17]
Computer-aided diagnostic (CAD) tools can assist physicians in interpreting medical images, and have
been shown to improve diagnostic efficiency and reproducibility in highly heterogeneous and complex
diseases, including tumor detection from histopathology slides, ischemic lesions from brain magnetic
resonance imaging, and tuberculosis screening from X-ray images. [15,18–21] While their clinical utility
has been clearly demonstrated for many forms of radiological images, the application of CAD to digital
94

histopathology images is still in its infancy – with very limited attempts to apply these techniques to
placenta pathology specimens in a research context. [22,23] Despite this, substantial efforts in the field
of onco-histopathology demonstrate considerable promise of CAD applications for automated disease
subclassification, staging/grading of disease, and prediction of disease trajectory (prognosis). [24] In
most cases, the CAD tools are developed using a supervised machine learning approach, in which a
computer is trained to recognized visual patterns (or features) in a large number of diagnostically-
labelled digital histopathology images (i.e. benign vs. malignant). [16,25–27] The lack of widely available,
highly annotated digital image banks of placenta-mediated disease cases, of a size required for machine
learning applications, has limited the progress of applying these same successful approaches to the
clinical placenta pathology domain.
In a proof-of principle, the current study sought to test and compare three different supervised machine
learning approaches to accurately identify PE disease and/or PE disease subtypes, using a highly
annotated dataset of digital placenta histopathology images from women who spanned the clinical
spectrum of PE. The approaches tested varied in degree of researcher-input, ranging from semi-
automated to fully integrated approaches, and included: 1) supervised machine learning on manually
extracted features of biological relevance (i.e. chorionic villi size and density); 2) supervised machine
learning on automatically extracted spatial and textural features in the images; and 3) supervised
hierarchical feature learning (deep learning). It was hypothesized that machine learning models trained
with the three image feature extraction approaches mentioned above would be capable of not only
automatically distinguishing cases of PE from controls, but also distinguish between subclasses of PE.
This study is an important first step in a move towards automating aspects of clinical placenta pathology
– an effort that will undoubtedly improve the reproducibility and utility of this important diagnostic
modality in cases of complex placenta-mediated disease.
95

Methods
Digital Image Dataset Acquisition and Patient Characteristics
This study has received research ethics board approval from the University of Ottawa Research Ethics
Board (H-08-18-1023) and Mount Sinai Hospital (13-0212-E). Original paraffin-embedded placenta
histopathology specimens were purchased from the Research Centre for Women’s and Infant’s Health
(RCWIH) Biobank at Mount Sinai hospital (Toronto, ON). A total of 148 specimens were collected from
patients with PE (n=79) and healthy controls (n=69), with each paraffin block containing four chorionic
villous biopsies from each quadrant of the placenta. As previously described by our group [5,6], the
collected PE specimens spanned the clinical spectrum of disease, including early-onset/severe cases of
PE (n=50) and late onset cases of PE (n=29) as well as cases with (n=33) and without (n=46) small for
gestational age infants (Table 4.1). Sectioned tissue was mounted on glass slides and stained following a
standard histopathology protocol with Hematoxylin and Eosin (H&E) at the Department of Pathology
and Laboratory Medicine at the Children’s Hospital of Eastern Ontario (CHEO). Slides were scanned at
20x magnification with an Aperio Scanscope digital scanner and saved in the SVS format.
Our group has previously carried out detailed characterization of the clinical and placental phenotype of
all cases used in the current study, and as such each digital image was linked to an annotated dataset
that included maternal and fetal clinical demographics, pregnancy outcome and molecular
subclassification of PE disease (based on gene expression and detailed histopathology profiling of each
placenta) (Table 4.2) [5,6]. This annotated dataset was used in the generation of the different class
labelling schemes, described below, that were used to supervise the developed machine learning
models.
Supervised Machine Learning
96

Three supervised machine learning approaches were tested, each with decreasing user-input during the
feature extraction phase of model development: 1) manually extracted features of biological relevance
(Approach #1 – semi-automatic); 2) automatically extracted spatial and textural features of unknown
biological relevance (Approach #2 – automatic); or 3) automatically extracted features of increasing
complexity in a hierarchical fashion (Approach #3 - deep learning). Approaches #1 and #2 were also
tested with the use of gestational age as an additional fed in feature to see if results would improve.
Approach #3 did not include gestational age, as with all deep learning models, features are
simultaneously extracted from the image and used to train the model, so only inherent features of the
image can be used. Figure 4.1. provides a summary of the machine learning workflow elements for each
approach.
For all three approaches applied, a series of different image class labels were tested to supervise the
learning. These included: a) Binary pregnancy outcome (CT, PE); b) Pregnancy outcome according to
disease onset/severity (CT, EO-PE, LO-PE); and, c) Molecular subclassification of PE (subclass 1 –
canonical PE, subclass 2 – inflammatory PE, subclass 3 – maternal PE). In all cases, labeled training
images (70% of total image dataset) were used to teach the model to recognize features of relevance to
each class, such that the model could then classify unseen and unlabeled images into their appropriate
output class (disease category). Through a feedback mechanism, which iteratively minimizes
classification errors, the model progressively improves at the task.
Machine learning models for approaches #1 and #2 were trained with Support Vector Machine (SVM)
classifiers [28] and the models for approach #3 were trained with Convolutional Neural Networks (CNNs)
[29]. All machine learning protocols and data processing was implemented in Python 2.7 except where
explicitly specified. Table 4.3 includes a summary of python libraries and modules used. Model
development was processed on a 1.8 GHz Intel Core i5 processor for all three machine learning
approaches.
97

Approach #1 – Semi-Automated Supervised Machine Learning
The semi-automated supervised machine learning approach was inspired by the clinical workflow that
perinatal pathologists typically use in the microscopic component of the clinical placenta pathology
exam. In this approach, all images were pre-segmented as previously describe to extract measurements
of morphological features believed to be of relevance to the pathophysiology of PE [30]. Subsequently
all machine learning was performed on these pre-extracted features, supervised according to the
different classification label schemes described (Table 4.2).
a) Image pre-processing
The image pre-processing and segmentation was conducted as previously described. [30] Briefly, color
normalization was performed in MATLAB with the Comprehensive Image Normalization approach
described in Finlayson et. al [31] to account for differences in staining intensity. Using K-means
clustering [32], three colour profiles (white, purple, and red) were extracted to delineate the
foreground, with the identification of intervillous space, trophoblastic nuclei (both syncytiotrophoblast
and cytotrophoblast) and the mesenchymal core of the villous tissue. Subsequently a top-hat transform
[33] was used to identify concave regions in the perimeter of objects to properly segment distinct villi
structures in each image.
b) Feature extraction
Using the pre-segmented images, measurements of four pre-defined villous structure features were
extracted, including: 1) average villi size (pixels2); 2) villi density (1/pixel); 3) syncytial trophoblast density
(1/pixel), and 4) average villi circularity (scale of 0-1 with 1 being a perfect circle). These specific features
were selected, in consultation with a trained perinatal pathologist (DG), due to their potential
morphological relevance to PE pathophysiology. Measurements were mean values from across the
98

entire whole-slide image. Feature measurement extraction was automated and implemented in
MATLAB as previously described. [30]
c) Machine learning model development
Extracted features were normalized using a Min-Max Scaler (SciKit Learn library, Python 2.7) to equally
weight the magnitude of each feature prior to being passed into the machine learning model. Following
normalization, samples were split into training (70%) and testing sets (30%) such that the model could
be tested on unseen data (SciKit Learn library, Python 2.7). The training set was labeled according to the
classification label scheme described above and the extracted features from each image were passed
through a support vector machine (SVM) learning model (SciKit Learn library, Python 2.7). The SVM
model was run three separate times, to test the 3 different classification labeling schemes: (a) CT, PE; (b)
CT, EO-PE, LO-PE; (c) subclass 1, 2, 3. The SVM model was also trained with each of these three
classification labeling schemes, taking into account gestational age at delivery as an additional feature of
relevance for each image. All six trained SVM models were applied to the unseen test data set
(remaining 30% of dataset), to assess the ability of the machine learning model to accurately classify the
unseen images. Classification performance metrics were visualized using confusion matrices (SciKit
Learn Library, Python 2.7), with outputs: true positives (TP), true negatives (TN), false positives (FP), and
false negatives (FN). Performance metrics of accuracy, precision, recall and F1 score were calculated
using classification outputs with the following equations:
(1) 𝐴𝑐𝑐𝑢𝑟𝑎𝑐𝑦 = !"#!$!"#!$#%"#%$
(2) 𝑃𝑟𝑒𝑐𝑖𝑠𝑖𝑜𝑛 = !"!"#%"
(3) 𝑅𝑒𝑐𝑎𝑙𝑙 = !"!"#%$
(4) 𝐹1𝑆𝑐𝑜𝑟𝑒 = 2 ∙ "&'()*)+,∙.'(/00"&'()*)+,#.'(/00
99

Approach #2 – Automated Supervised Machine Learning
In the second approach tested, feature identification and extraction was automated using SIFT keypoint
descriptors , based entirely on spatial and textural differences in the images, which may or may not have
biological relevance. [34] In this way, no human bias was introduced in the selection of features of
interest, however control was maintained with respect to the total number of key points identified
across the image set. This approach did not require a pre-segmentation step, further simplifying the
application of this approach.
a) Image pre-processing
All images were cropped to five overlapping 1200x1200 pixel patches (Figure 4.2), thereby increasing
the number of images available for training the machine learning model to 740, a method which has
been shown to improve classification accuracy. [35] Color on each image was normalized through
conversion to greyscale (SciKit Learn library, Python 2.7).
b) Feature extraction
Features were extracted using a scale-invariant feature transform (SIFT) – a well described feature
detection algorithm commonly used in computer vision (Open CV library, Python 2.7). Five hundred SIFT
keypoints were extracted per image, as per previously published protocols. [16] Images with fewer than
500 keypoints were excluded from model development for too little tissue-containing area, resulting in a
remaining dataset size of 624 images. Each SIFT keypoint descriptor contains 128 data points that
describe the texture at a particular point in an image, resulting in a matrix of dimensions 500x128
describing each image. The median value of each of the 128 features at each of the 500 keypoints in the
image was preserved to create a flat feature vector of dimensions 1x128 describing each image.
c) Machine learning model development
100

Feature normalization, training/test set splitting of data, SVM model testing according to the different
class labelling schemes and classifier performance measurements were carried out as described in
Approach #1.
Approach #3 - Supervised hierarchical feature machine learning (deep learning)
The final approach tested was entirely automated, with feature extraction integrated into the machine
learning model training process. Full integration is accomplished through deep learning, where a
convolutional neural network (CNN) is used to optimize and select image features that result in the best
classification accuracy. This approach requires the least human involvement, as the computer algorithm
executes the entire process after initial image pre-processing (for quality assurance and data
augmentation).
a) Image pre-processing
Whole-slide images were split into training (60%), validation (20%) and test (20%) sets for model
development. Images are cropped to 2400x2400 pixels to exclude areas on slides that did not contain
placental tissue. Deep learning models perform better with larger datasets, so it is common for
developers to augment data before training a machine learning model. [36][37] Therefore, 225 smaller
overlapping patches of 300x300 pixels were automatically extracted using a sliding window approach.
All patches were passed through an additional data augmentation phase, using a directory image data
generator (Keras Library, Python 2.7) which applies a random set of manipulations to the input images,
including: rescaling of pixel values to be between 0 and 1, flipping and rotating. To ensure that only
images that contained sufficient placental tissue were used in the deep learning approach, all images
that contained fewer than 500 detectable SIFT keypoints were excluded from model training.
b) Feature extraction and machine learning model development
101

The Keras CNN framework, with model architecture described in Table 4.4, was used to simultaneously
develop a model that can accurately discriminate between classes and optimize the features that
differentiate each class. The neural network used contained 15 layers comprising convolutional, pooling,
and dense layers. Loss functions are used to calculate the cost of errors in classification and are
integrated into the CNN models to drive improvements in classification at each round of training. A
binary cross entropy loss function was used to calculate the rate of error decline for binary classification
models (ex. CT, PE), and a categorical cross entropy loss function was used for multiple class models (ex.
CT, EO-PE, LO-PE). [37] The performance metric accuracy was captured at every round of training to be
able to track progress in model development. Fifty rounds of training were used, with early stopping
enabled if model accuracy was no longer improving with increased training. Every iteration of training
was evaluated on the validation set to track model improvement and for guidance on what parameters
could be adjusted to increase training accuracy. The final trained model was evaluated on the test
dataset. The entire CNN workflow was implemented in Python 2.7 with the Keras library. Confusion
matrices (Figure 4.3) were generated to analyze types of classification errors (ex. false positives vs. false
negatives).
102

Results
Performance metrics for all machine learning models developed and tested using both machine learning
approaches and all 3 feature extraction methods are presented in Figure 4.3 and Table 4.5 respectively.
The semi-automated and automated machine learning approaches (#1-2) yielded classification
accuracies that ranged from 55-73%, depending on which classification labelling scheme was used. The
semi-automated approach (approach #1) demonstrated the highest degree of classifying accuracy using
the categorical “pregnancy outcomes according to onset/severity” labelling scheme (CT, EO-PE, LO-PE),
whereas the automated approach (approach #2) had highest classification accuracy using the binary
“pregnancy outcomes” labelling scheme (CT vs. PE). In both cases, the addition of gestational age at
delivery into the model as an additional image feature improved the accuracy observed (73% accuracy
for both models). On the whole, the automated approach (approach #2) typically outperformed the
semi-automated approach across all class labelling schemes, however the differences in performance
were minimal. The deep learning modeling approach (approach #3) demonstrated the poorest
performance metrics across all classification labelling schemes, with accuracies ranging between 41-
55%, with the binary “pregnancy outcome” labelling scheme demonstrated the greatest classification
performance.
Machine learning models that utilized categorical class labelling schemes demonstrated one class that
contributed most to lower accuracies. After examination of confusion matrices normalized for class
imbalance, it appears that classes with the fewest representative cases were consistently poorly
classified. Across all three approaches, models demonstrated poor performance in the proper
classification of “LO-PE” (0-59% true positives) and “Molecular Cluster 3” (0-27% true positives). The
most accurately predicted classes varied across approaches. Using the approach which most closely
mimics a pathologist’s workflow (Approach #1), the model was best able to pick out placentas with PE,
using categorical pregnancy outcomes based on onset information (accuracy of 73%). Using the
103

automated machine learning approach (approach #2), the model was best able to classify placentas with
PE when a binary pregnancy outcome label was used (accuracy of 73%). In both approaches #1 and #2,
including gestational age as an additional feature resulted in better classification accuracy. Finally, using
the deep learning approach (approach #3), the model was best able to identify placentas labelled as
“PE” (accuracy of 55%), but was not able to distinguish between early-onset/severe and late-onset cases
of PE (accuracy <50%) or molecular subclass of PE (<50%).
Conclusions
In the current proof-of principle study, three different supervised ML approaches were applied to a
highly annotated placenta histopathology image dataset that included cases of PE that spanned the
clinical spectrum of disease. It was hypothesized that ML models would be capable of distinguishing
histological features within the placenta that could not only identify cases vs. controls but would further
be capable of distinguishing subclasses of PE disease. Both the semi-automated and automated
supervised machine learning models tested (approaches #1-2) demonstrated success in the classification
of cases vs controls, however, the ability to distinguish distinct subclasses of placental disease within the
PE cases was limited. Surprisingly, the highly robust deep learning model tested, demonstrated the
weakest classification performance on this dataset, correctly classifying only one half of the cases and
controls collectively. Despite the limited success of the described approaches, several avenues for
further optimization of the presented machine learning protocols have been identified. With reflection,
this body of work will no doubt serve as a solid foundation upon which to move this field forward.
The three approaches tested differed with regards to the degree of user engagement in the selection of
features, and in the complexity of features used in the ML model. In the first semi-automated approach,
there was a high degree of user input into which features would be used in the classification model, an
104

attempt to mimic most closely what is manually looked for by perinatal pathologists during a clinical
placenta pathology examination – namely morphological features deemed to be of relevance to PE
pathophysiology. As PE is often characterized by pathological features including placental infarcts,
syncytial knots, advanced villous maturation and villous agglutination [38], it was hypothesized that
measurements of size, shape and density of the villous structures within the tissue would be of
relevance for image classification. In order to capture these features, however, all images needed to be
pre-segmented to identify all distinct villous structures across each image. While our group has
developed an algorithm to automate this process [30], this is still a time-consuming pre-processing
effort which may limit integration into a clinically useful workflow. Despite this, this approach worked
quite well in distinguishing healthy and PE placentas as a binary outcome, with a mild increase in
classification performance when disease onset/severity was taken into account (accuracy of 73%).
However, the model demonstrated relatively poor performance in classifying images according to the
molecular subclass of disease (accuracy of 57%). This finding was unexpected by our group, as we have
previously demonstrated distinct placental pathology lesion profiles across these PE disease subtypes
[5]. This outcome may simply be the result of small sample size, as the smallest molecular subclass
(subclass 3) only had 12 cases included in the dataset, which significantly contributed to lowering the
average classification accuracy. It could be that this number is simply too small for training purposes in
ML models. In support, this same subclass was incorrectly classified by all three approaches tested. In
addition, the biased approach taken to identify features of interest inherently ignored morphological
features found to be of relevance to this small subclass of “immunologically-driven” PE, which is poorly
described in the mainstream literature on PE pathophysiology. In fact, our group has described placental
lesions of chronic inflammation (villitus of unknown etiology, massive perivillous fibrin deposition,
chronic deciduitis) as the predominant placental pathologies observed in this group [5] – all of which
would likely not be captured by the selected features used in this approach. An important evolution to
105

this approach moving forward would be to incorporate morphological measurements that may better
encompass the highly heterogeneous nature of placental lesions seen across the PE population.
The results obtained from the first approach do, however, provide a strong argument for the removal of
human bias in the selection of features that may differentiate cases from controls, and were the basis of
the automated approach (approach #2) and the deep learning approach (approach #3) tested. In these
approaches, a feature extraction algorithm (SIFT) or the model itself (CNN classifier) was used to detect
visual features of relevance in an unbiased fashion. It was anticipated that the deep learning models
would outperform the automated machine learning models, due to the exhaustive feature identification
process inherently built into deep learning classifiers – allowing for complex and interconnected
features to be identified and used for classification. Contrary to our expectations, the automated
machine learning approach yielded the best results of the two unbiased approaches (#2 and #3), with a
maximum accuracy of 73% in the classification of healthy and PE cases. Interestingly, similar
performance metrics were observed in the identification of PE subtypes, whether they be distinguished
based on disease onset/severity or molecular subclass of disease (accuracies of 69% and 68%
respectively). In both instances, classification errors were predominant to one PE subtype – either the
LO-PE or the molecular subclass 3 (immunological PE). LO-PE cases were usually misclassified as healthy
controls (Figure 3), and this could be explained by the fact that this subtype of PE is considered a milder
form and so visible effects in the placenta may be relatively small [7]. Molecular subclass 3 was
frequently misclassified as either of the other subclasses, which suggests that the reason was not due to
inherent characteristics of the images, but rather a sample size too small to properly train an ML
algorithm. Given that the classification errors have possible sources that could be mitigated, the
automated machine learning approach has the potential to yield stronger results with sample size
augmentation and model optimization.
106

Deep learning models have become the industry standard for image classification, due to the ability of
neural networks to model very complex data with a high degree of accuracy. [39] Neural networks train
on inherent characteristics in a dataset (i.e. raw pixel data) as opposed to features extracted by
investigators. Integrated feature extraction reduces the risk of bias, and automatically optimizes the
number and weight of features included in the model. [29] Given the size and complexity of placenta
histopathology images, it was expected that this classifier would achieve the best results. However, this
was not observed, with classification accuracies from this model hovering around 50%. These results
may be explained in part by an intrinsic disadvantage of deep learning models – the requirement for
extensive computational power. The presented deep learning models were allowed to “learn” across a
maximum of 50 epochs of training. Early stopping was used to halt the training process when
classification accuracy did not further improve over 10 consecutive rounds of training. Without enabling
early stopping, computer memory resources may be wasted when classification accuracy is no longer
improving. Future work, with access to increased computing power will enable a more complete training
phase to be executed for the deep learning models with a wider buffer for model stopping, likely
increasing model performance.
Moreover, a major improvement to our deep learning model may be achieved through the inclusion of a
transfer learning phase into our ML workflow. Transfer learning is a relatively new machine learning
paradigm that leverages auxiliary image data from additional sources in order to improve the
classification model. [40] In a transfer learning workflow, the deep learning model focuses the earlier
layers of the network, where it is learning low-level image information (ex. edges, contrast, etc.), on a
large and highly robust external image dataset (ex. ImageNet Large Scale Visual Recognition Challenge
datasets; http://www.image-net.org/). The model is then transferred to the dataset of interest for the
later layers of the network, where it is learning more complex image information and is interconnecting
different image features. In so doing, one can achieve high classification performance when the test
107

data set is limited in size [41] – a recognized limitation of the current study. Ongoing efforts by our
group are focused on optimizing this protocol to include transfer learning and increase computing
power by running the model through a remote server, as we anticipate this will significantly increase the
performance of this approach.
Gestational age at delivery was an important consideration for this study, as the histological appearance
of the placenta evolves across pregnancy. Across gestation the chorionic villous structures elongate and
branch, increasing the maternal-fetal exchange area of the placenta. [42] With this maturation comes
changes in shape and density of villous structures, as well as cellular composition of the structures seen
in a histopathology specimen. Placenta specimens used in the current study included a span of
gestational ages (25-40 weeks), including “immature” placentas delivered pre-term (<34 weeks). It was
anticipated that the visual difference could be a confounding factor in model development, because
visual differences between placentas belonging to difference classes (ex. PE vs. Control) could be
confused with visual differences between placentas of different gestational ages. Therefore, gestational
age at delivery was included as an extra image feature in approaches #1 and #2. Although the addition
of this feature generally improved classification accuracy, it is likely due to the fact that gestational age
is a good predictor of degree of placenta disease – with those cases with severe placental disease
needing to be delivered earlier in pregnancy. We offer that this may not be the best way to account for
this important attribute of each image. In future work it would be imperative to consider other ways to
transform the image data to account for gestational age at delivery. Prior to training, features can be
scaled by the gestational age rather than having it included as an additional feature. With this approach,
features would be scaled by a factor that represents how far from term the pregnancy was.
Alternatively, a multi-level classifier system could be used, where in the first level cases are stratified by
categories of gestational age, and in the second they are classified according to the different class label
schemes. As the deep learning model integrates feature extraction into the learning process, it was not
108

possible for us to incorporate gestational age at delivery into this model – an important consideration in
the interpretation of the deep learning performance metrics. This limitation could also be tackled in the
future by normalizing the features for gestational age in the pre-processing of CNN fine-tuning stages.
However, to do this a large image database of placenta histopathology images from different gestational
ages would be required to train each model on gestational age anatomical and histological norms.
As highlighted above, a major limitation of this study was sample size – a limitation that has hindered
considerable progress in this field in general. The image dataset used in the current study is likely one of
the largest highly annotated placenta histopathology image datasets specific to PE pathology currently
available. However, the complexity of the human placenta, the high degree of heterogeneity of
placental disease in PE [5], and the requirements for large datasets for effective ML model development
[43] have likely limited the success of the current project. There are no validated guidelines for the
minimum number of original images needed for ML model development, with sample sizes ranging from
7-14,000 in fields with the largest progress to date [44,45]. Having a minimum of 1000 image samples
per class has been proposed as a guideline, and this value is reflected in newer articles in the domain of
medical image ML [46]. According to this proposed best practice, the current study would be highly
underpowered, particularly for the smaller PE subclasses such as molecular subclass 3 (N=12). In an
attempt to tackle this limitation, we employed data augmentation techniques, such as patch extraction
and image distortion, both widely used in the field [35]. However, patch extractions and image
distortion can only increase the variability in the dataset by a finite amount. Patch extraction effectively
over represents the data already present with slight variation. A better approach is to obtain more
unique patient samples that would best represent the true degree of placental variability and
heterogeneity present in the PE population. Increasing training sample size has been shown to increase
classification accuracy on test data, as the model becomes more robust to unusual cases in the test
data. Further, we must consider that within one placenta the degree of heterogeneity of placental
109

pathology can be quite high, indicating that we need to consider how to best optimize sampling
procedures from this complex organ, as well as the methods to account for localized differences in
pathology across the placenta in all our ML approaches.
From a clinical perspective, we must be cognizant of limitations of CAD-based technologies, or
conversely, the benefits that come with human intuition and ability to place observed findings into a
broader biological context. This is particularly true for deep learning models, such as CNNs, which lack
transparency regarding how features of relevance were identified for extraction, and how they became
inter-related within the model. Despite being the industry standard for medical image classification
model development [18], CNNs learn features from images that cannot be clearly identified or even
understood at the human level. Therefore, even if the accuracy of prediction/diagnosis is high, it may be
difficult for the pathologist to explain the classification/diagnostic results to their colleagues or patients.
However, this limitation is being addressed head on in a newly emerging field devoted to explainability
and interpretation of the inner-workings and results of deep learning models [47]. There is no question
that with the pace at which this field is advancing, the integration of deep learning CAD-tools will
become the industry standard across all domains of medical imaging and will have a high degree of
applicability to histopathology analysis. As such, proof-of-concept studies such as this are integral in the
exploration of how this technology can be best harnessed to improve the health of different patient
populations.
The current study is an encouraging first attempt at applying ML tools to model the visual appearance of
the placenta in pregnancies with placenta-mediated disease. Given the moderate success achieved with
these early models, and the identification of concrete next steps for model optimization, there is
considerable enthusiasm that ML will be a viable approach to automate aspects of clinical placenta
pathology moving forward. In so doing, the identification of distinct disease subtypes at the time of
delivery may be easily achievable, clarifying underlying etiology of disease and promoting an
110

individualized approach to post-partum patient counselling. It would further enhance standardization in
this field and improve the quality of placental diagnoses taking place in remote sites that may lack the
required subspecialized training required for placenta pathology examination. The benefits made
possible through the integration of this technology into the realm of perinatal pathology should serve as
a strong motivation to build upon this body of work to achieve the goals of developing a large publicly
available histopathology image database specific to the placenta and the further development and
optimization of ML models that can be used to better understand the complexity of placenta-mediated
diseases.
Competing Interests
The authors declare that they have no competing interests.
Author’s Contributions
Dr. Shannon Bainbridge and Dr. David Grynspan were the principal investigators for the study and were
the primary contributors to the conceptualization, funding, and interpretation and presentation of data
for this manuscript. Dr. Adrian D.C. Chan and Dr. Eran Ukwatta consulted on technical aspects of ML
model development and experimental design and contributed to manuscript revision. Dr. Eran Ukwatta
provided sponsorship for access to Compute Canada High Performance Computing resources to be able
to run the programs. Codes for data augmentation and machine learning were written by Anika
Mukherjee. Sina Salsabilli applied the code developed in Salsabilli et. al. (2019) and extracted clinically
relevant features from segmented placenta villi. Anika Mukherjee extracted textural features from the
same samples for comparison with clinically relevant features. This manuscript was prepared by Anika
Mukherjee and Dr. Shannon Bainbridge and was reviewed by all co-authors.
111

Acknowledgements
The following funds were used to support the authors: Faculty of Health Sciences, University of Ottawa
(A.M., S.B.), Canadian Foundation for Innovation Leaders Opportunity Fund (S.B); Canadian Institute of
Health Research (CIHR) (130543 CIA – S.B); CIHR (142298 MOP – S.B).
112

References
[1] Mol BWJ, Roberts CT, Thangaratinam S, Magee LA, de Groot CJM, Hofmeyr GJ. Pre-eclampsia.
Lancet 2016;387:999–1011. https://doi.org/https://doi.org/10.1016/S0140-6736(15)00070-7.
[2] Tranquilli AL, Dekker G, Magee L, Roberts J, Sibai BM, Steyn W, et al. The classification, diagnosis
and management of the hypertensive disorders of pregnancy: A revised statement from the
ISSHP. Pregnancy Hypertens An Int J Women’s Cardiovasc Heal 2014;4:97–104.
https://doi.org/https://doi.org/10.1016/j.preghy.2014.02.001.
[3] Steegers EAP, von Dadelszen P, Duvekot JJ, Pijnenborg R. Pre-eclampsia. Lancet 2010;376:631–
44. https://doi.org/https://doi.org/10.1016/S0140-6736(10)60279-6.
[4] Nair TM. Statistical and artificial neural network-based analysis to understand complexity and
heterogeneity in preeclampsia. Comput Biol Chem 2018;75:222–30.
https://doi.org/10.1016/j.compbiolchem.2018.05.011.
[5] Benton SJ, Leavey K, Grynspan D, Cox BJ, Bainbridge SA. The clinical heterogeneity of
preeclampsia is related to both placental gene expression and placental histopathology. Am J
Obstet Gynecol 2018;219:604.e1-604.e25. https://doi.org/10.1016/j.ajog.2018.09.036.
[6] Leavey Katherine J, Benton Samantha C, Grynspan David A, Kingdom John J, Bainbridge
Shannon J, Cox Brian J. Unsupervised Placental Gene Expression Profiling Identifies Clinically
Relevant Subclasses of Human Preeclampsia. Hypertension 2016;68:137–47.
https://doi.org/10.1161/HYPERTENSIONAHA.116.07293.
[7] Staff AC, Redman CWG. The Differences Between Early- and Late-Onset Pre-eclampsia BT -
Preeclampsia: Basic, Genomic, and Clinical. In: Saito S, editor., Singapore: Springer Singapore;
2018, p. 157–72. https://doi.org/10.1007/978-981-10-5891-2_10.
113

[8] Ismail S. Anesthetic Management of Pregnant Patients with Hypertensive Disorders BT -
Obstetric Anesthesia for Co-morbid Conditions. In: Gunaydin B, Ismail S, editors., Cham: Springer
International Publishing; 2018, p. 17–30. https://doi.org/10.1007/978-3-319-93163-0_2.
[9] Weiner E, Mizrachi Y, Grinstein E, Feldstein O, Rymer-Haskel N, Juravel E, et al. The role of
placental histopathological lesions in predicting recurrence of preeclampsia. Prenat Diagn
2016;36:953–60. https://doi.org/10.1002/pd.4918.
[10] Stanek J. Comparison of placental pathology in preterm, late-preterm, near-term, and term
births. Am J Obstet Gynecol 2014;210:234.e1-234.e6.
https://doi.org/https://doi.org/10.1016/j.ajog.2013.10.015.
[11] Fuchs TJ, Buhmann JM. Computational pathology: Challenges and promises for tissue analysis.
Comput Med Imaging Graph 2011;35:515–30.
https://doi.org/10.1016/j.compmedimag.2011.02.006.
[12] Redline RW. Placental pathology: a systematic approach with clinical correlations. Placenta
2008;29 Suppl A:S86-91. https://doi.org/10.1016/j.placenta.2007.09.003.
[13] Gurcan MN, Boucheron LE, Can A, Madabhushi A, Rajpoot NM, Yener B. Histopathological image
analysis: a review. IEEE Rev Biomed Eng 2009;2:147–71.
https://doi.org/10.1109/RBME.2009.2034865.
[14] Khong TY, Mooney EE, Ariel I, Balmus NCM, Boyd TK, Brundler M-A, et al. Sampling and
Definitions of Placental Lesions: Amsterdam Placental Workshop Group Consensus Statement.
Arch Pathol Lab Med 2016;140:698–713. https://doi.org/10.5858/arpa.2015-0225-CC.
[15] Marques 1964- editor PM de A. Medical image analysis and informatics : computer-aided
diagnosis and therapy. Boca Raton : Taylor & Francis, 2018; 2018.
114
[16] F.A. S, L.S. O, C. P, Spanhol FA, Oliveira LS, Petitjean C, et al. A Dataset for Breast Cancer
Histopathological Image Classification. IEEE Trans Biomed Eng 2016;63:1455–62.
https://doi.org/10.1109/TBME.2015.2496264.
[17] Benton SJ, Lafreniere AJ, Grynspan D, Bainbridge SA. A synoptic framework and future directions
for placental pathology reporting. Placenta 2019;77:46–57.
https://doi.org/https://doi.org/10.1016/j.placenta.2019.01.009.
[18] Lundervold AS, Lundervold A. An overview of deep learning in medical imaging focusing on MRI. Z
Med Phys 2019;29:102–27. https://doi.org/https://doi.org/10.1016/j.zemedi.2018.11.002.
[19] Pasa F, Golkov V, Pfeiffer F, Cremers D, Pfeiffer D. Efficient Deep Network Architectures for Fast
Chest X-Ray Tuberculosis Screening and Visualization. Sci Rep 2019;9:6268.
https://doi.org/10.1038/s41598-019-42557-4.
[20] Hipp J, Flotte T, Monaco J, Cheng J, Madabhushi A, Yagi Y, et al. Computer aided diagnostic tools
aim to empower rather than replace pathologists: Lessons learned from computational chess. J
Pathol Inform 2011;2:25. https://doi.org/10.4103/2153-3539.82050.
[21] Warren Burhenne LJ, Wood SA, D’Orsi CJ, Feig SA, Kopans DB, O’Shaughnessy KF, et al. Potential
contribution of computer-aided detection to the sensitivity of screening mammography.
Radiology 2000;215:554–62. https://doi.org/10.1148/radiology.215.2.r00ma15554.
[22] van Ginneken B, Schaefer-Prokop CM, Prokop M. Computer-aided Diagnosis: How to Move from
the Laboratory to the Clinic. Radiology 2011;261:719–32.
https://doi.org/10.1148/radiol.11091710.
[23] Diiulio R. Clinical Pathology : The integration of existing pathology and information systems with
new digital capabilities is just beginning to transform pathology as it did radiology 2010:16–8.
115

[24] Wang S, Yang DM, Rong R, Zhan X, Fujimoto J, Liu H, et al. Artificial Intelligence in Lung Cancer
Pathology Image Analysis. Cancers (Basel) 2019;11. https://doi.org/10.3390/cancers11111673.
[25] Doyle S, Rodriguez C, Madabhushi A, Tomaszeweski J, Feldman M. Detecting Prostatic
Adenocarcinoma From Digitized Histology Using a Multi-Scale Hierarchical Classification
Approach. 2006 Int Conf IEEE Eng Med Biol Soc 2006:4759–62.
https://doi.org/10.1109/IEMBS.2006.260188.
[26] Fukuma K, Prasath VBS, Kawanaka H, Aronow BJ, Takase H. A Study on Nuclei Segmentation,
Feature Extraction and Disease Stage Classification for Human Brain Histopathological Images.
Procedia Comput. Sci., vol. 96, 2016. https://doi.org/10.1016/j.procs.2016.08.164.
[27] Ninos K, Kostopoulos S, Kalatzis I, Sidiropoulos K, Ravazoula P, Sakellaropoulos G, et al.
Microscopy image analysis of p63 immunohistochemically stained laryngeal cancer lesions for
predicting patient 5-year survival. Eur Arch Oto-Rhino-Laryngology 2016;273:159–68.
https://doi.org/10.1007/s00405-015-3747-x.
[28] Guenther N, Schonlau M. Support Vector Machines. Stata J 2016;16:917–37.
https://doi.org/10.1177/1536867X1601600407.
[29] De Wilde 1958- P. Neural network models : theory and projects. Second edi. London ; 1997.
[30] Salsabili S, Mukherjee A, Ukwatta E, Chan ADC, Bainbridge S, Grynspan D. Automated
segmentation of villi in histopathology images of placenta. Comput Biol Med 2019;113:103420.
https://doi.org/10.1016/j.compbiomed.2019.103420.
[31] Finlayson GD, Schiele B, Crowley JL. Comprehensive colour image normalization BT - Computer
Vision — ECCV’98. In: Burkhardt H, Neumann B, editors., Berlin, Heidelberg: Springer Berlin
Heidelberg; 1998, p. 475–90.
116

[32] Kumar author D. Machine Learning Series: K-Means Clustering in Python. 1st editio. Technics
Publications, 2019.; 2019.
[33] Bai X, Zhou F, Xue B. Image enhancement using multi scale image features extracted by top-hat
transform. Opt Laser Technol 2012;44:328–36.
https://doi.org/https://doi.org/10.1016/j.optlastec.2011.07.009.
[34] Lowe D. Distinctive Image Features from Scale-Invariant Keypoints. Int J Comput Vis 2004;60:91–
110. https://doi.org/10.1023/B:VISI.0000029664.99615.94.
[35] Fawzi A, Samulowitz H, Turaga D, Frossard P. Adaptive data augmentation for image
classification. 2016 IEEE Int. Conf. Image Process., 2016, p. 3688–92.
https://doi.org/10.1109/ICIP.2016.7533048.
[36] Hussain Z, Gimenez F, Yi D, Rubin D. Differential Data Augmentation Techniques for Medical
Imaging Classification Tasks. AMIA . Annu Symp Proceedings AMIA Symp 2017;2017:979.
[37] Golik P, Doetsch P, Ney H. Cross-entropy vs. squared error training: a theoretical and
experimental comparison. Interspeech, vol. 13, 2013, p. 1756–60.
[38] Redline RW, Boyd T, Campbell V, Hyde S, Kaplan C, Khong TY, et al. Maternal vascular
underperfusion: nosology and reproducibility of placental reaction patterns. Pediatr Dev Pathol
2004;7:237–49. https://doi.org/10.1007/s10024-003-8083-2.
[39] Krizhevsky A, Sutskever I, Hinton GE. ImageNet classification with deep convolutional neural
networks. Adv. Neural Inf. Process. Syst., vol. 2, 2012, p. 1097–105.
[40] Sarkar author D. Hands-on transfer learning with Python : implement advanced deep learning
and neural network models using tensorflow and keras. Birmingham ; 2018.
117

[41] Pan SJ, Yang Q. A Survey on Transfer Learning. IEEE Trans Knowl Data Eng 2010;22:1345–59.
https://doi.org/10.1109/TKDE.2009.191.
[42] Kaufmann P, Frank H-G. Chapter 10 - Placental Development. In: Polin RA, Fox WW, Abman
SHBT-F and NP (Third E, editors., W.B. Saunders; 2004, p. 85–97.
https://doi.org/https://doi.org/10.1016/B978-0-7216-9654-6.50013-8.
[43] Komura D, Ishikawa S. Machine Learning Methods for Histopathological Image Analysis. Comput
Struct Biotechnol J 2018;16:34–42. https://doi.org/https://doi.org/10.1016/j.csbj.2018.01.001.
[44] Xu Y, Zhu J-Y, Chang E, Tu Z. Multiple clustered instance learning for histopathology cancer image
classification, segmentation and clustering. Proc. IEEE Comput. Soc. Conf. Comput. Vis. Pattern
Recognit., 2012. https://doi.org/10.1109/CVPR.2012.6247772.
[45] Orlov N V, Weeraratna AT, Hewitt SM, Coletta CE, Delaney JD, Mark Eckley D, et al. Automatic
detection of melanoma progression by histological analysis of secondary sites. Cytometry A
2012;81:364–73.
[46] Cireşan DC, Meier U, Schmidhuber J. Transfer learning for Latin and Chinese characters with Deep
Neural Networks. 2012 Int. Jt. Conf. Neural Networks, 2012, p. 1–6.
https://doi.org/10.1109/IJCNN.2012.6252544.
[47] Choo J, Liu S. Visual Analytics for Explainable Deep Learning. IEEE Comput Graph Appl
2018;38:84–92. https://doi.org/10.1109/MCG.2018.042731661.
118

Figures
Figure 4.1.
A. Approach #1 - Semi-Automated Supervised Machine Learning
B. Approach # 2 – Automated Supervised Machine Learning
C. Approach # 3 - Supervised hierarchical feature machine learning (deep learning)
119

Figure 4.2.
A) Patch Extraction
B) Image manipulations
120

Figure 4.3.
121

Figure Legends
Figure 4.1. Machine learning workflow for each experimental approach tested. A) Approach #1 (semi-
automated) used manual selection and extraction of histological features deemed clinically relevant to
placenta mediated disease. B) Approach #2 (fully automated) used an unbiased approach to
automatically extract spatial and textural visual features at 500 SIFT points across each image. C)
Approach #3 (deep learning) was the most immune to feature selection bias as feature selection and
extraction was inherently incorporated within the classifier, with the model selecting image features
that produced optimal classification results. For all three approaches different class labels were tested,
including: the binary classes of control (CT) vs. preeclamptic case (PE); the categorical classes of CT vs.
early-onset/severe PE cases (EO-PE) vs. late-onset PE cases (LO-PE); and, the categorical classes of CT vs.
PE subclass 1 (Maternal) vs. PE subclass 2 (Canonical) vs. PE subclass 3 (Immunological).
Figure 4.2. Data augmentation strategies. A) Patch extraction was used to increase input image dataset
size in approaches #2 and #3. An initial patch was cropped at the center of each original image
(Approach # 2 - 2400 x2400 pixels; Approach #3 – 300x300 pixels). In approach #2 overlapping patches
cropped to 1200x1200 pixels were taken from the top right, top left, bottom right, and bottom left of
the 2400x2400 pixel crop, augmenting the samples size from 148 to 740. In approach #3, a sliding
window patch extraction method was applied, extracting 225 overlapping patches of 300x300 pixels
across the entire image. B) Further data augmentation was applied to the dataset for Approach #3 with
an image data generator to increase variability in the dataset. Sample image manipulations shown: i)
original image, ii) horizontal flip, iii) vertical flip, iv) 90° rotation, iv) 90° rotation + horizontal flip, v)
zoom.
Figure 4.3. Performance confusion matrices for experimental machine learning models tested.
Performance confusion matrices are presented for each combination of experimental machine learning
122

approach (#1-3; vertical axis) and class scheme (horizontal axis) tested. Outputs are presented as a grid
summarizing the distribution correctly vs. incorrectly classified images, normalized to the number of
true cases per class, with degree of correct classification colour coded ranging from white (poor
classification) through to green (good classification). Highest degree of model performance was seen for
Approaches #1 and #2, varied according to the class labelling scheme used.
123

Tables
Table 4.1. Demographic characteristics of participants in study
Control
(n=69)
Early Onset PE
(N=50)
Late Onset PE
(N=29)
Maternal Age (Y)a 33(5) 32(7) 34(6)
Gestational Age at delivery (weeks)a 34(5)
30(2) 36(2)
Fetal Sex (F)b 30/69 27/50 12/29
Birth Weight (g)a 2297(1092) 1102(342)
2390(622)
Birthweight Percentile (<10th Percentile)b 13/69 22/50 13/29
Placenta Weight Percentile (<10th
Percentile)b
19/69 42/50 14/29
Maternal Systolic Blood Pressurea 148(27)
169(14)
163(16)
Maternal Diastolic Blood Pressurea 90(17)
107(10) 102(10)
Mode of Delivery (C-section)b 45/69 47/50 17/29
124

PE Subclass 3
(N=12)
PE Subclass 1
(N=63)
PE Subclass 2
(N=59)
Maternal Age (Y)a 37 (4) 33 (5) 34 (6)
Gestational Age at delivery (weeks)a 34 (3) 36 (4) 31 (3)
Fetal Sex (F)b 7/12 28/63 27/59
Birth Weight (g)a 1742 (865) 3635 (940) 1288 (591)
Birthweight Percentile (<10th Percentile)b 4/12 8/63 27/59
Placenta Weight Percentile (<10th
Percentile)b
9/12 16/63 48/59
Maternal Systolic Blood Pressurea 164 (17) 153 (26) 168 (15)
Maternal Diastolic Blood Pressurea 100 (12) 95 (15) 107 (10)
Mode of Delivery (C-section)b 10/12 41/63 53/59
aResults presented as “mean (standard deviation)” for continuous variables
bResults presented as “count/clinical subset” for categorical variables
125

Table 4.2. Class labelling schemes used in machine learning models
Class Scheme Class Mode Labels
Pregnancy Outcome Binary PE, Control
Pregnancy Outcome with
Onset Information
Categorical PE Preterm, PE Term, Control
Molecular Clusters Categorical Molecular subclass 1, Molecular subclass 2,
Molecular subclass 3
126
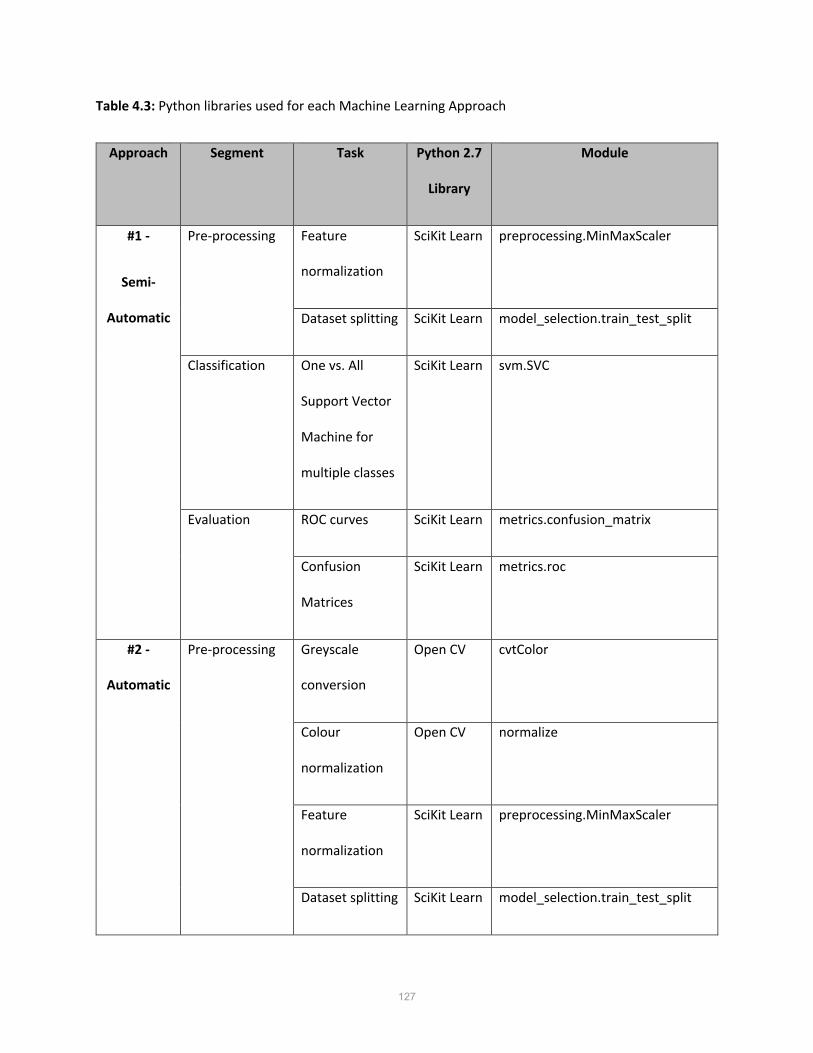
Table 4.3: Python libraries used for each Machine Learning Approach
Approach Segment Task Python 2.7
Library
Module
#1 -
Semi-
Automatic
Pre-processing Feature
normalization
SciKit Learn preprocessing.MinMaxScaler
Dataset splitting SciKit Learn model_selection.train_test_split
Classification One vs. All
Support Vector
Machine for
multiple classes
SciKit Learn svm.SVC
Evaluation ROC curves SciKit Learn metrics.confusion_matrix
Confusion
Matrices
SciKit Learn metrics.roc
#2 -
Automatic
Pre-processing Greyscale
conversion
Open CV cvtColor
Colour
normalization
Open CV normalize
Feature
normalization
SciKit Learn preprocessing.MinMaxScaler
Dataset splitting SciKit Learn model_selection.train_test_split
127

Feature
Extraction
SIFT keypoint
extraction
Open CV xfeatures2d.SIFT_create and
sift.detectAndCompute
Classification One vs. All
Support Vector
Machine for
multiple classes
SciKit Learn svm.SVC
Evaluation ROC curves SciKit Learn metrics.confusion_matrix
Confusion
Matrices
SciKit Learn metrics.roc
#3 –
Integrated
(deep
learning)
Pre-processing RGB Patch
Extraction
Open CV
and
OpenSlide,
PIL
Read_region, crop, convert
Minimum
keypoint
threshold
Open CV cvtcolor, normalize,
xfeatures2d.SIFT_create,
sift.detectAndCompute
Image Data
Generator
Keras preprocessing.image.ImageDataGe
nerator
Transfer
Learning
Keras Applications.VGG19
128

Feature
Extraction and
Classification
CNN Model Keras models.Sequential and
models.Model
CNN Layers Keras layers.Dropout, layers.Flatten,
layers.Dense, and
layers.GlobalAveragePooling2D
CNN optimizer Keras optimizers.SGD
Evaluation ROC curves SciKit Learn metrics.confusion_matrix
Confusion
Matrices
SciKit Learn metrics.roc
129

Table 4.4. CNN model architecture
Layer (type) Output Shape Param #
conv2d_1 (Conv2D) (None, 62, 62, 32) 896
max_pooling2d_1
(MaxPooling2)
(None, 31, 31, 32) 0
conv2d_2 (Conv2D) (None, 29, 29, 32) 9248
max_pooling2d_2
(MaxPooling2)
(None, 14, 14, 32) 0
flatten_1 (Flatten) (None, 6272) 0
dense_1 (Dense) (None, 128) 802944
dense_2 (Dense) (None, 3) 258
130

Table 4.5. Summary of performance metrics for all machine learning models tested
Approach Class
Scheme
Additional
Feature
Accuracy F1 Score
#1 - Semi-
Automatic
Pregnancy
Outcome
N/A 0.71
0.71
Pregnancy
Outcome
Gestational
Age
0.68
0.67
Pregnancy
Outcome
with Onset
Information
N/A 0.55 0.58
Pregnancy
Outcome
with Onset
Information
Gestational
Age
0.73
0.72
Molecular
Clusters
N/A 0.58
0.55
Molecular
Clusters
Gestational
Age
0.57
0.57
#2 - Automatic Pregnancy
Outcome
N/A 0.65 0.65
131

Pregnancy
Outcome
Gestational
Age
0.73
0.73
Pregnancy
Outcome
with Onset
Information
N/A 0.62
0.62
Pregnancy
Outcome
with Onset
Information
Gestational
Age
0.69
0.69
Molecular
Clusters
N/A 0.62
0.62
Molecular
Clusters
Gestational
Age
0.68 0.68
#3 – Integrated
(deep learning)
Pregnancy
Outcome
N/A 0.55 0.48
Pregnancy
Outcome
with Onset
Information
N/A 0.41 0.33
132

Molecular
Clusters
N/A 0.51 0.35
133

Chapter 5
General Discussion and Conclusions
134

5.1 General Discussion
The overarching hypothesis of the current MSc. thesis project was that a computerized model
developed with machine learning could recognize distinct morphological features in human placenta
histopathology images and could be applied to automate detection of placenta-mediated diseases. Not
only was this hypothesis proven with moderate success, but also several secondary research findings
came from this project and new questions were opened for future investigation. To ultimately test the
hypothesis in a proof-of-concept exercise, the best available machine learning methods for
histopathology image analysis were applied to automate the classification of healthy and diseased
placentas (Manuscript 3). However, in preparation for this experiment two crucial research aims first
needed completion: 1) a systematic evaluation of the different machine learning methods and pipelines
that have previously been applied to human histopathology specimens (Manuscript 1); and, 2) the
development of an automated villous structure segmentation tool capable of extracting morphological
features of interest from placental histopathology images (Manuscript 2). Not only were the outcomes
of these foundational projects necessary to test the overarching hypothesis, but they also produced
significant findings in their own respect.
In order to ensure the most applicable and effective machine learning models were tested in the context
of human placenta histopathology, a systematic review of all machine learning methods developed and
tested for histopathology applications was undertaken. Not surprisingly, very little work had been
carried out to-date focused uniquely on the placenta [98,99]. Instead, the vast majority of the literature
focused on the development and application of this technology in the context of the much broader field
of onco-histopathology [56,78,80,100,101]. What was surprising, however, was the lack of consensus
with regards to a “gold standard” pipeline for developing and applying machine learning models to
these types of clinical samples. Certainly, this is in part the result of differences in research question and
study design, however the systematic evaluation of all methods tested to date allowed for the
135

identification of an optimal standard workflow that could be adopted by other groups moving forward.
This standard workflow will simplify study design in future research endeavours, but importantly will
also allow for direct comparison of results across research groups and/or institutions. It would enable
direct comparisons of similar and dissimilar morphological features seen in pathological states across
different tissue beds and organs. Moreover, the highly interdisciplinary nature of these types of research
endeavours, with required expertise in clinical pathology, computer programming and health system
integration, makes for an intimidating and high commitment journey to embark on. Therefore, it is
hoped that the streamlined workflow presented can address some of these concerns and promote
advancement in this field.
An intriguing consideration when comparing different machine learning methods is the degree of user
input, or human involvement required or desired. Broadly, a review of the literature reveals three main
paradigms of human involvement, namely: 1) a semi-automated process with manual feature extraction
prior to model development; 2) an automated feature extraction process prior to model development
with minimal-to moderate human input;, and 3) feature extraction fully integrated into model
development, removing human input in feature selection and extraction. Given this finding, it was
desirable to investigate the utility and performance of machine learning models that employed these
different user-input paradigms. In the first paradigm, previous knowledge of the pathophysiology of
placenta-mediated disease could be used to inform which morphological features may be of highest
relevance in the development of a classification model. While this approach most closely mimics the
work carried out by a trained perinatal pathologist, it is also the method that carries with it the highest
degree of bias in model development. Whereas in paradigms 2 and 3 the features selected for extraction
may or may not be of known biological relevance, and user bias of which morphological features may be
of highest importance is minimized. However, the user’s ability to clearly delineate which features are
136

driving the learning model, and how they may be related to disease initiations and progression is
limited, particularly in the case of paradigm 3 (deep learning).
With the fast pace advancement of machine learning model development, particularly in the realm of
image analysis, there are readily available software packages that were used in the current project to
generate the classification models. However, our group collectively worked to develop in house
software capable of segmenting individual villous structures in a digital histopathology image of the
human placenta, such that we could manually extract features deemed to be of highest relevance to the
pathophysiology of PE (Manuscript 2). While the development of this software was necessary for the
stated purpose of the current project, the utility of this software extends far beyond the current
application. Through the application of this software program, researchers can easily extract
quantitative data describing the morphological structure of the placentas in their sample set. The output
metrics available can be highly informative as it relates to villous structure maturation, elongation and
branching – all process of normal placental aging. As such, this program could simply be used to assess
the “biological age” of a placenta in instances of both healthy and pathological pregnancies. These
metrics could also be used in large population-based correlation analysis, identifying basic placental
features that may be indicative of both short- and long-term health outcomes for both mothers and
their babies. A 2017 publication developed a similar software that could automatically segment villi [99],
however their attempt failed to address the issue of separate villi which appear connected in 2D
sections and the software was not able to achieved the level of accuracy achieved with our program
[88].
In the final manuscript of the thesis (Manuscript 3) a proof-of concept experiment was performed to
test the hypothesis that machine learning could be used to classify histopathology images of placentas
with and without placenta-mediated disease, specifically in the context of PE. The models developed
and tested in this body of work demonstrated a maximal performance of 73% accuracy in the
137

classification of PE placentas. This maximal performance was achieved when a semi-automated machine
learning model was used, with gestational age at delivery used as an additional inputted feature. While
this was a promising first foray into the application of machine learning technology for this purpose, the
results achieved were unexpected, particularly as it relates to the poor performance achieved using the
fully integrated, deep-learning model. As highlighted in Chapter 4 (Manuscript 3), several areas of
improvement and optimization steps have been identified to improve model development, which are
elaborated on in section 5.3 below. It is likely that with optimization the updated models will
outperform the current ones.
In summary, the primary outcomes of this research project were the development of evidence-based
guidelines for best practices when applying machine learning classification models to clinical
histopathology images, the development of automated software that can segment and extract
biologically-relevant features from all placental villi in a digital placenta histopathology image, and
piloting the application of machine learning to placenta histopathology images to distinguish
morphological features that differ between healthy and diseased placentas in the context of PE.
5.2 Clinical Impacts
One of the biggest criticisms heard regarding the clinical utility of placenta pathology examinations is
that the index pregnancy is over, so “what good comes from identifying underlying causes or subclasses
of placenta mediated disease following delivery?” However, this criticism is short-sighted. The placenta
serves as a visual diary of any aberrations in placental development and/or damage that have taken
place across the pregnancy. It allows both clinicians and researchers alike to gain a better understanding
of the different types of placental disease that underlie the most common obstetrical complications
seen today. It is only armed with this knowledge that effective etiology-driven screening programs and
therapeutic interventions can be developed and tested.
138

At the individual level, being given a concrete answer as to why a pregnancy has had an adverse
outcome can be instrumental in the healing process [102]. Further, there is well established evidence
that distinct forms of placental disease have a high degree of recurrence, and therefore the maternal
care team can use these results to counsel patients in regard to risks for future pregnancies [103]. Work
carried out by our group, as well as others [104–106], indicate that distinct lesions observed in the
placenta at the time of delivery are highly predictive of increased lifetime risk for cardiovascular disease
in the mother, further extending the possible counseling opportunities that can be provided to these
women.
As we gain further insight into the developmental origins of health and disease, the evidence is
becoming clear that the intrauterine environment plays a significant role in the plasticity and
programming of the developing fetuses major organ systems [107,108]. In fact, several groups have
identified the placenta as a “central culprit” to chronic disease in the offspring [109,110]. Therefore the
findings of placenta pathology examination can not only inform clinical management and counselling of
the mothers, but they can inform the neonatal health care team about the intrauterine environment the
infant was exposed to, and can possibly identify future health risks for the child, opening the door to
effective preventative initiatives.
The case for placenta pathology examination is clear – it has the potential to greatly improve the health
and wellbeing of mothers and their children. However, as outlined throughout this thesis, there are
considerable limitations to this clinical practice currently, including: lack of standardization, high degree
of inter-observer and inter-institutional variability, high degree of required sub-specialty training, and
pathologist burnout due to heavy workload demands. This is a clinical practice that is ripe for the
introduction of computer-aided diagnosis. Collectively, this project was a first step towards exploring
how machine learning models could be applied to automate some aspects of placenta histopathology
examinations in the context of placenta-mediated diseases. This body of work can serve as a starting
139
point for this field to expand and optimize the integration of this technology for these purposes, and
with more validation, can potentially develop into a commercially available tool that can be integrated
into the clinical workflow of perinatal pathologists across Canada.
5.3 Limitations and Future Directions
Although the machine learning experiment was successful as a pilot project, there were several
recognized limitations to the study design and obtained results which would need to be addressed and
optimized for adoption into clinical practice.
The biggest limitation in this project was that the heterogeneity of PE was not fully addressed in the
machine learning models, which is likely the greatest source of error in the machine learning models. In
this project, the goal was to predict a clinical diagnosis (PE) from histopathology samples of placentas of
the women diagnosed with the disease. While PE has been shown to be linked to placenta dysfunction,
it is not always the case where there are visible pathological lesions in the placenta. Moreover, the
placenta itself is a highly heterogeneous organ and one biopsy may not be indicative of the overall visual
pattern across the entire organ. The model was developed with the assumption that PE can be
consistently predicted solely based off placenta histopathology images – which is not the case in clinical
pathology practice. The simplified model of PE produced was useful in gauging whether placenta
mediated diseases can be classified with any degree of accuracy from histopathology images, but more
work needs to be done to develop a more rigorous model built around the clinical spectrum of PE . Two
possible future directions could address this limitation: 1) incorporating additional clinical features into
the model, along with the image features, in an attempt to improve classification accuracy; and, 2) train
the machine learning model to instead identify distinct types of placental lesions – using the identified
lesion as the label of interest, rather than the pregnancy outcome. Our lab is currently testing the latter
140

approach with a machine learning model that predicts the severity of MVM on placenta images from
cases of PE and IUGR.
Another considerable limitation of this project was the sample size available for training our machine
learning models. For machine learning model development, a large and robust dataset is preferable to
ensure the model is resilient to biological variation. While the placental histopathology image dataset
used [18] is likely one of the largest image datasets with PE enrichment (N=79), it is still quite modest in
size considering ideal image sample sizes for these applications have been proposed to be as high as
1000 images [111], with increased sample size consistently shown to improve classification accuracy
[111,112]. A concerted effort on the part of researchers and clinicians in this field must be made to
generate a publicly available image database specific to the placenta (healthy vs. diseased, different
gestational ages, etc.) to help move this field forward. This initiative is ongoing within our research
group. Further, the compilation of histopathology images collected from a variety of clinical/research
sites could combat the issue of inter-institution differences in the visual appearance of placental
histopathology specimens, resulting from differences in specimen preparation (ex. differences in
washing the tissue of maternal blood, differences in staining intensity, etc.). This would ensure that any
developed application could be applied successfully in pathology suites across the country and abroad.
As highlighted in Manuscript #3 (Chapter 4), the inclusion of a transfer learning phase into the deep
learning CNN model would likely significantly improve its performance. Transfer learning uses a pre-
established CNN model that has been partially trained on a large and robust image dataset, resulting in
the model being “pre-trained” to recognize low-level image features such as edges and textures [113–
116]. This partially pre-trained model is then fully trained on the dataset of interest to learn the more
complex aspects of the features in the image. This would allow more of the computing resources during
training be allocated toward learning actual differences across images. Transfer learning should improve
141
robustness to variation in image appearance in the dataset because the model would have been pre-
trained on a dataset with high variance.
Ongoing research endeavours [117–120], including those conducted by our research group [18,36,121],
have recently demonstrated that the clinical definition of PE, or even the binary description of early
onset vs late onset, may not sufficiently describe the different types of placental disease seen across the
spectrum of PE. Given that the clinical definition and understanding of this disease is still evolving, it is
possible that the success of training a model to detect a “PE placenta” based on visual appearance may
be limited. Instead, the application of an unsupervised, more exploratory approach, may be highly
informative in the discovery of novel classes of placental disease. In the unsupervised approach no
clinical labels would be used, and the goal would be to see how the images naturally cluster visually and
later try and connect these visual clusters to clinical phenotypes. This approach removes the initial bias
that all cases labeled “PE” are the same and instead allows investigators to assess each sample as a
unique case that could be labeled based on morphological differences in the placenta histopathology
specimen. Using this approach, we may better understand the distinct patterns of placental disease and
determine if they correlate or predict any clinical outcomes. This is an ongoing initiative within our
research group, with preliminary results included within Appendix A.
5.4 Interdisciplinary Perspective
The project presented in this thesis would not have been possible without an emphasis on the
interdisciplinary nature of the research aims. The strategy for designing experiments was entirely
dependent on the coming together of multiple experts from different disciplines to properly define and
collectively answer the research question. Experts in the domains of obstetrics, perinatal pathology,
placental biology and computer engineering worked hand in hand to identify a gap in clinical care that
could be addressed, design a project that would successfully address this gap, and work together to
142

interpret results and provide input on how to improve the machine learning models being developed to
ensure the technology was reflective of both biology and clinical findings. Without the sometimes
challenging, but ultimately highly rewarding, “out-of-the-box” discussion that took place during the
interdisciplinary project meetings, the development and proof-of-principal testing of this technology
would not have been possible.
In this research project, the two primary domains of study – perinatal/placenta pathology and machine
learning – stood to gain from the partnership. Applying novel technologies like machine learning to
investigate placenta mediated diseases can accelerate progress into understanding and curing placenta
mediated diseases like PE, by bringing out new ways of approaching a complex and unsolved problem.
The machine learning field also benefits tremendously from the development and testing of models on
digital images of a highly complicated organ of study – the placenta. Compared to solid tumors, the
histological features of the human placenta are highly complex, requiring new advances in machine
learning model development to properly identify and extract features of interest.
Although conducting an interdisciplinary project has been enriching to the team members and collective
domains involved, this type of project is still relatively new and not without challenges. All members
involved needed a minimum comfort level in each other’s domains for productive conversations about
the experiments and troubleshooting to take place, meaning a steep learning curve was involved on all
sides. Communication between all parties was crucial to ensure the protocols were technically sound for
a machine learning experiment and that the interpretation of results was clinically meaningful. As well,
the findings served to aid in the automated detection of placenta pathology lesions, as well as to test
multiple different machine learning algorithms, resulting in a question of the ultimate beneficiaries of
the work. Ultimately the decision was to present the work for the clinical pathology community (the
guidelines for machine learning methods in histopathology) and the biomedical imaging community (the
experiments in automated detection of placenta mediated disease from placenta histopathology slides).
143
Despite the challenges, we believe that continued focus on interdisciplinary collaboration between the
healthcare fields and machine learning developers will help to advance the field in many ways and
address issues such as clinical resource management/efficiency, diagnostic error and standardization of
clinical decision making to name a few. Overall this was a very rewarding way of carrying out science.
5.5 Conclusion
The ultimate goal of developing a prototype automated screening tool for placenta images with machine
learning was achieved, however, in the process, several crucial milestones needed to be achieved – each
proving to be a significant output for this project in their own respects. First a comprehensive review of
the literature was conducted to extract and synthesize the current methods being applied to similar
problems in histopathology imaging. It was found that the following 5 key steps were necessary to
develop a successful model: image acquisition and preparation, image preprocessing, feature extraction,
pattern recognition and classification training, and model testing. Not only did the review serve its
purpose of informing the experimental design for our machine learning model development, it also
provided a platform to publish a set of best practice guidelines that future researchers could apply to
any machine learning project on histopathology images. A secondary objective to testing machine
learning on placenta histopathology images was to assess whether or not more clinically relevant
features are better for model development and to do this, a reproducible method was needed to isolate
individual villi from placenta images and extract relevant features. To isolate individual villi from
placenta images was a project in its own right given the challenges of counting touching villi as separate
entities and was a significant outcome of this work – achieving a 15.46% higher F1 score when
compared with the previous standard approach. Finally, given a framework for model development
from the systematic review and both clinical feature extraction and textural feature extraction methods
(from previously published methods), machine learning models were developed on placenta
histopathology images to distinguish controls from cases of PE or PE split by early onset cases and late
144

onset cases – achieving a maximum classification accuracy of 73%. The moderate success of this proof-
of-concept presented opens the doors to further development in automated lesion detection and
classification of placenta histopathology images and considerable insight was gained into the next steps
needed to further validate such tools.
145

References
[1] Gude NM, Roberts CT, Kalionis B, King RG. Growth and function of the normal human placenta. Thromb Res 2004;114:397–407. https://doi.org/https://doi.org/10.1016/j.thromres.2004.06.038.
[2] Boyd JD, Hamilton WJ. The human placenta. vol. 212. Heffer; 1970.
[3] Benirschke K, Driscoll SG. The pathology of the human placenta. Placenta, Springer; 1967, p. 97–571.
[4] Avagliano L, Massa V, Bulfamante G Pietro. Histology of Human Placenta n.d.
[5] Brown H, Speechley K, Macnab J, Natale R, Campbell M. Maternal, fetal, and placental conditions associated with medically indicated late preterm and early term delivery: a retrospective study. BJOG An Int J Obstet Gynaecol 2016;123:763–70. https://doi.org/10.1111/1471-0528.13428.
[6] Hiersch L, Shinar S, Melamed N, Aviram A, Hadar E, Yogev Y, et al. Recurrent Placenta-Mediated Complications in Women With Three Consecutive Deliveries. Obstet Gynecol 2017;129:416–21. https://doi.org/10.1097/AOG.0000000000001890.
[7] Lim G, Tracey J, Boom N, Karmakar S, Wang J, Berthelot J-M, et al. CIHI survey: Hospital costs for preterm and small-for-gestational age babies in Canada. Healthc Q 2009;12:20–4.
[8] Vigil-De Gracia P. Maternal deaths due to eclampsia and HELLP syndrome. Int J Gynecol Obstet 2009;104:90–4. https://doi.org/10.1016/j.ijgo.2008.09.014.
[9] Mari G, Hanif F. Intrauterine Growth Restriction: How to Manage and When to Deliver. Clin Obstet Gynecol 2007;50:497–509. https://doi.org/10.1097/GRF.0b013e31804c96a9.
[10] Davis EF, Lazdam M, Lewandowski AJ, Worton SA, Kelly B, Kenworthy Y, et al. Cardiovascular risk factors in children and young adults born to preeclamptic pregnancies: a systematic review.(Report). Pediatrics 2012;129:e1552. https://doi.org/10.1542/peds.2011-3093.
[11] Mcdonald SD, Malinowski A, Zhou Q, Yusuf S, Devereaux PJ. Cardiovascular sequelae of preeclampsia/eclampsia: A systematic review and meta-analyses. Am Heart J 2008;156:918–30. https://doi.org/10.1016/j.ahj.2008.06.042.
[12] Smith GN, Pudwell J, Walker M, Wen S-W. Ten-Year, Thirty-Year, and Lifetime Cardiovascular Disease Risk Estimates Following a Pregnancy Complicated by Preeclampsia. J Obstet Gynaecol Canada 2012;34:830–5. https://doi.org/10.1016/S1701-2163(16)35381-6.
[13] Ahmed R, Dunford J, Mehran R, Robson S, Kunadian V. Pre-Eclampsia and Future Cardiovascular Risk Among Women. J Am Coll Cardiol 2014;63:1815–22. https://doi.org/10.1016/j.jacc.2014.02.529.
[14] Mongraw-Chaffin ML, Cirillo PM, Cohn BA. Preeclampsia and Cardiovascular Disease Death: Prospective Evidence From the Child Health and Development Studies Cohort. Hypertension 2010;56:166–71. https://doi.org/10.1161/HYPERTENSIONAHA.110.150078.
[15] Aloizos S, Seretis C, Liakos N, Aravosita P, Mystakelli C, Kanna E, et al. HELLP syndrome: Understanding and management of a pregnancy-specific disease. J Obstet Gynaecol (Lahore) 2013;33:331–7. https://doi.org/10.3109/01443615.2013.775231.
146

[16] Redline RW, Boyd T, Campbell V, Hyde S, Kaplan C, Khong TY, et al. Maternal vascular underperfusion: nosology and reproducibility of placental reaction patterns. Pediatr Dev Pathol 2004;7:237–49. https://doi.org/10.1007/s10024-003-8083-2.
[17] Starzyk KA, Salafia CM, Pezzullo JC, Lage JM, Parkash V, Vercruysse L, et al. Quantitative differences in arterial morphometry define the placental bed in preeclampsia. Hum Pathol 1997;28:353–8. https://doi.org/10.1016/s0046-8177(97)90135-0.
[18] Leavey Katherine J, Benton Samantha C, Grynspan David A, Kingdom John J, Bainbridge Shannon J, Cox Brian J. Unsupervised Placental Gene Expression Profiling Identifies Clinically Relevant Subclasses of Human Preeclampsia. Hypertension 2016;68:137–47. https://doi.org/10.1161/HYPERTENSIONAHA.116.07293.
[19] Babic I, Ferraro ZM, Garbedian K, Oulette A, Ball CG, Moretti F, et al. Intraplacental villous artery resistance indices and identification of placenta-mediated diseases. J Perinatol 2015;35:793–8. https://doi.org/10.1038/jp.2015.85.
[20] Goldman-Wohl D, Yagel S. Regulation of trophoblast invasion: from normal implantation to pre-eclampsia. Mol Cell Endocrinol 2002;187:233–8. https://doi.org/10.1016/s0303-7207(01)00687-6.
[21] Rampersad R, Nelson DM. Trophoblast biology, responses to hypoxia and placental dysfunction in preeclampsia. Front Biosci 2007;12:2447–56. https://doi.org/10.2741/2246.
[22] Redman CWG, Sargent IL. Circulating microparticles in normal pregnancy and pre-eclampsia. Placenta 2008;29 Suppl A:S73–7. https://doi.org/10.1016/j.placenta.2007.11.016.
[23] Sargent IL, Germain SJ, Sacks GP, Kumar S, Redman CWG. Trophoblast deportation and the maternal inflammatory response in pre-eclampsia. J Reprod Immunol 2003;59:153–60. https://doi.org/10.1016/s0165-0378(03)00044-5.
[24] Walsh SW. What causes endothelial cell activation in preeclamptic women? Am J Pathol 2006;169:1104–6. https://doi.org/10.2353/ajpath.2006.060713.
[25] Maynard SE, Min J-Y, Merchan J, Lim K-H, Li J, Mondal S, et al. Excess placental soluble fms-like tyrosine kinase 1 (sFlt1) may contribute to endothelial dysfunction, hypertension, and proteinuria in preeclampsia. J Clin Invest 2003;111:649–58. https://doi.org/10.1172/JCI17189.
[26] Brewster JA, Orsi NM, Gopichandran N, McShane P, Ekbote U V, Walker JJ. Gestational effects on host inflammatory response in normal and pre-eclamptic pregnancies. Eur J Obstet Gynecol Reprod Biol 2008;140:21–6. https://doi.org/10.1016/j.ejogrb.2007.12.020.
[27] Roberts JM, Hubel CA. The two stage model of preeclampsia: variations on the theme. Placenta 2009;30 Suppl A:S32–7. https://doi.org/10.1016/j.placenta.2008.11.009.
[28] Vinnars M-T, Wijnaendts LCD, Westgren M, Bolte AC, Papadogiannakis N, Nasiell J. Severe preeclampsia with and without HELLP differ with regard to placental pathology. Hypertens (Dallas, Tex 1979) 2008;51:1295–9. https://doi.org/10.1161/HYPERTENSIONAHA.107.104844.
[29] Huppertz B. Placental Origins of Preeclampsia: Challenging the Current Hypothesis. Hypertension 2008;51:970–5. https://doi.org/10.1161/HYPERTENSIONAHA.107.107607.
[30] Huppertz B. Placental pathology in pregnancy complications. Thromb Res 2011;127:S96–9.
147
https://doi.org/10.1016/S0049-3848(11)70026-3.
[31] Valensise Herbert P, Vasapollo Barbara P, Gagliardi Giulia P, Novelli Gian P. Early and Late Preeclampsia: Two Different Maternal Hemodynamic States in the Latent Phase of the Disease. Hypertension 2008;52:873–80. https://doi.org/10.1161/HYPERTENSIONAHA.108.117358.
[32] Gillon TER, Pels A, von Dadelszen P, MacDonell K, Magee LA. Hypertensive Disorders of Pregnancy: A Systematic Review of International Clinical Practice Guidelines. PLoS One 2014;9:e113715.
[33] Raymond D, Peterson E. A critical review of early-onset and late-onset preeclampsia. Obstet Gynecol Surv 2011;66:497–506. https://doi.org/10.1097/OGX.0b013e3182331028.
[34] Mackay AP, Berg CJ, Atrash HK. Pregnancy-related mortality from preeclampsia and eclampsia. Obstet Gynecol 2001;97:533–8. https://doi.org/10.1016/S0029-7844(00)01223-0.
[35] Long PA, Abell DA, Beischer NA. FETAL GROWTH RETARDATION AND PRE-ECLAMPSIA. BJOG An Int J Obstet Gynaecol 1980;87:13–8. https://doi.org/10.1111/j.1471-0528.1980.tb04419.x.
[36] Benton SJ, Leavey K, Grynspan D, Cox BJ, Bainbridge SA. The clinical heterogeneity of preeclampsia is related to both placental gene expression and placental histopathology. Am J Obstet Gynecol 2018;219:604.e1-604.e25. https://doi.org/10.1016/j.ajog.2018.09.036.
[37] Langston C, Kaplan C, Macpherson T, Manci E. Practice guideline for examination of the placenta. Arch Pathol Lab Med 1997;121:449–76.
[38] Khong editor TY, Mooney editor EE, Nikkels editor PGJ, Morgan editor TK, Gordijn editor SJ. Pathology of the placenta : a practical guide. Cham : Springer, 2019; 2019.
[39] Redline RW. Placental pathology: a systematic approach with clinical correlations. Placenta 2008;29 Suppl A:S86-91. https://doi.org/10.1016/j.placenta.2007.09.003.
[40] Slaoui M, Fiette L. Histopathology Procedures: From Tissue Sampling to Histopathological Evaluation. Methods Mol Biol 2011;691:69–82. https://doi.org/10.1007/978-1-60761-849-2_4.
[41] Alturkistani HA, Tashkandi FM, Mohammedsaleh ZM. Histological Stains: A Literature Review and Case Study. Glob J Health Sci 2015;8:72–9. https://doi.org/10.5539/gjhs.v8n3p72.
[42] Benton SJ, Lafreniere AJ, Grynspan D, Bainbridge SA. A synoptic framework and future directions for placental pathology reporting. Placenta 2019;77:46–57. https://doi.org/https://doi.org/10.1016/j.placenta.2019.01.009.
[43] Redline RW. Classification of placental lesions. Am J Obstet Gynecol 2015;213:S21–8. https://doi.org/https://doi.org/10.1016/j.ajog.2015.05.056.
[44] Stark MW, Clark L, Craver RD. Histologic Differences in Placentas of Preeclamptic/Eclamptic Gestations by Birthweight, Placental Weight, and Time of Onset. Pediatr Dev Pathol 2014;17:181–9. https://doi.org/10.2350/13-09-1378-OA.1.
[45] Ernst LM. Maternal vascular malperfusion of the placental bed. APMIS 2018;126:551–60. https://doi.org/10.1111/apm.12833.
[46] Kovo M, Schreiber L, Bar J. Placental vascular pathology as a mechanism of disease in pregnancy complications. Thromb Res 2013;131:S18–21. https://doi.org/https://doi.org/10.1016/S0049-
148

3848(13)70013-6.
[47] LITTLE WA. Placental infarction. Obstet Gynecol 1960;15:109–30.
[48] Fitzgerald B, Kingdom J, Keating S. Distal villous hypoplasia. Diagnostic Histopathol 2012;18:195–200.
[49] Mukherjee A, Chan ADC, Keating S, Redline RW, Fritsch MK, Machin GA, et al. The placental distal villous hypoplasia pattern: Interobserver agreement and automated fractal dimension as an objective metric. Pediatr Dev Pathol 2016;19. https://doi.org/10.2350/15-03-1619-OA.1.
[50] Jones CJ, Fox H. Syncytial knots and intervillous bridges in the human placenta: an ultrastructural study. J Anat 1977;124:275–86.
[51] Roberts DJ, Oliva E. Clinical significance of placental examination in perinatal medicine. J Matern Neonatal Med 2006;19:255–64. https://doi.org/10.1080/14767050600676349.
[52] Derricott H, Jones RL, Heazell AEP. Investigating the association of villitis of unknown etiology with stillbirth and fetal growth restriction – A systematic review. Placenta 2013;34:856–62. https://doi.org/https://doi.org/10.1016/j.placenta.2013.07.003.
[53] Kim J, Romero R, Kim MR, Kim YM, Friel L, Espinoza J, et al. Involvement of Hofbauer cells and maternal T cells in villitis of unknown aetiology. Histopathology 2008;52:457–64.
[54] Uxa R, Baczyk D, Kingdom JCP, Viero S, Casper R, Keating S. Genetic polymorphisms in the fibrinolytic system of placentas with massive perivillous fibrin deposition. Placenta 2010;31:499–505.
[55] Longtine MS, Nelson DM. Placental dysfunction and fetal programming: the importance of placental size, shape, histopathology, and molecular composition. Semin Reprod Med 2011;29:187–96. https://doi.org/10.1055/s-0031-1275515.
[56] Belle A, Kon MA, Najarian K. Biomedical Informatics for Computer-Aided Decision Support Systems: A Survey. Sci World J 2013;2013:1–8. https://doi.org/10.1155/2013/769639.
[57] Kamel HM. Trends and Challenges in Pathology Practice: Choices and necessities. Sultan Qaboos Univ Med J 2011;11:38–44.
[58] Rabe K, Snir OL, Bossuyt V, Harigopal M, Celli R, Reisenbichler ES. Interobserver variability in breast carcinoma grading results in prognostic stage differences. Hum Pathol 2019. https://doi.org/https://doi.org/10.1016/j.humpath.2019.09.006.
[59] Khong TY, Mooney EE, Ariel I, Balmus NCM, Boyd TK, Brundler M-A, et al. Sampling and Definitions of Placental Lesions: Amsterdam Placental Workshop Group Consensus Statement. Arch Pathol Lab Med 2016;140:698–713. https://doi.org/10.5858/arpa.2015-0225-CC.
[60] Soares MJ, Iqbal K, Kozai K. Hypoxia and Placental Development. Birth Defects Res 2017;109:1309–29. https://doi.org/10.1002/bdr2.1135.
[61] Duttaroy AK. Early nutrition and lifestyle factors : effects on first trimester placenta . Switzerland: Springer; 2016.
[62] Wang S, Yang DM, Rong R, Zhan X, Fujimoto J, Liu H, et al. Artificial Intelligence in Lung Cancer Pathology Image Analysis. Cancers (Basel) 2019;11. https://doi.org/10.3390/cancers11111673.
149

[63] Jimenez-del-Toro O, Otálora S, Andersson M, Eurén K, Hedlund M, Rousson M, et al. Chapter 10 - Analysis of Histopathology Images: From Traditional Machine Learning to Deep Learning. In: Depeursinge A, S. Al-Kadi O, Mitchell JRBT-BTA, editors., Academic Press; 2017, p. 281–314. https://doi.org/https://doi.org/10.1016/B978-0-12-812133-7.00010-7.
[64] Massad LS, Jeronimo J, Schiffman M, Group for the NI of HS for C and CP (NIH/ASCCP) R. Interobserver Agreement in the Assessment of Components of Colposcopic Grading. Obstet Gynecol 2008;111.
[65] Allison KH, Reisch LM, Carney PA, Weaver DL, Schnitt SJ, O’Malley FP, et al. Understanding diagnostic variability in breast pathology: lessons learned from an expert consensus review panel. Histopathology 2014;65:240–51. https://doi.org/10.1111/his.12387.
[66] Diiulio R. Clinical Pathology : The integration of existing pathology and information systems with new digital capabilities is just beginning to transform pathology as it did radiology 2010:16–8.
[67] van Ginneken B, Schaefer-Prokop CM, Prokop M. Computer-aided Diagnosis: How to Move from the Laboratory to the Clinic. Radiology 2011;261:719–32. https://doi.org/10.1148/radiol.11091710.
[68] Langley P. Machine Learning as an Experimental Science.(Author abstract)(Editorial). Mach Learn 1988;3:5. https://doi.org/10.1007/BF00115008.
[69] Baldi P. Bioinformatics : the machine learning approach. Cambridge, Mass.: Cambridge, Mass. : MIT Press, c1998.; 1998.
[70] Gutierrez author D. Machine Learning and Data Science: An Introduction to Statistical Learning Methods with R. 1st editio. Technics Publications, 2015.; 2015.
[71] Boulesteix A-L, Schmid M. Machine learning versus statistical modeling. Biometrical J 2014;56:588–93. https://doi.org/10.1002/bimj.201300226.
[72] Chaovalit P, Zhou L. Movie Review Mining: a Comparison between Supervised and Unsupervised Classification Approaches. Proc. 38th Annu. Hawaii Int. Conf. Syst. Sci., 2005, p. 112c-112c. https://doi.org/10.1109/HICSS.2005.445.
[73] Love BC. Comparing supervised and unsupervised category learning. Psychon Bull Rev 2002;9:829–35.
[74] Kotsiantis SB, Zaharakis I, Pintelas P. Supervised machine learning: A review of classification techniques. Emerg Artif Intell Appl Comput Eng 2007;160:3–24.
[75] Längkvist M, Karlsson L, Loutfi A. A review of unsupervised feature learning and deep learning for time-series modeling. Pattern Recognit Lett 2014;42:11–24.
[76] Chowriappa P, Dua S, Todorov Y. Introduction to Machine Learning in Healthcare Informatics BT - Machine Learning in Healthcare Informatics. In: Dua S, Acharya UR, Dua P, editors., Berlin, Heidelberg: Springer Berlin Heidelberg; 2014, p. 1–23. https://doi.org/10.1007/978-3-642-40017-9_1.
[77] Chen M, Hao Y, Hwang K, Wang L, Wang L. Disease Prediction by Machine Learning Over Big Data From Healthcare Communities. IEEE Access 2017;5:8869–79. https://doi.org/10.1109/ACCESS.2017.2694446.
150

[78] Hipp J, Flotte T, Monaco J, Cheng J, Madabhushi A, Yagi Y, et al. Computer aided diagnostic tools aim to empower rather than replace pathologists: Lessons learned from computational chess. J Pathol Inform 2011;2:25. https://doi.org/10.4103/2153-3539.82050.
[79] Deo RC. Machine learning in medicine. Circulation 2015;132:1920–30.
[80] Bhargava R, Madabhushi A. Emerging Themes in Image Informatics and Molecular Analysis for Digital Pathology. Annu Rev Biomed Eng 2016;18:387–412. https://doi.org/10.1146/annurev-bioeng-112415-114722.
[81] Wang F, Preininger A. AI in Health: State of the Art, Challenges, and Future Directions. Yearb Med Inf 2019;28:16–26. https://doi.org/10.1055/s-0039-1677908.
[82] Donsa K, Spat S, Beck P, Pieber TR, Holzinger A. Towards Personalization of Diabetes Therapy Using Computerized Decision Support and Machine Learning: Some Open Problems and Challenges BT - Smart Health: Open Problems and Future Challenges. In: Holzinger A, Röcker C, Ziefle M, editors., Cham: Springer International Publishing; 2015, p. 237–60. https://doi.org/10.1007/978-3-319-16226-3_10.
[83] El Emam K. Risk-based de-identification of health data. IEEE Secur Priv 2010;8:64–7.
[84] Rodgers SE, Demmler JC, Dsilva R, Lyons RA. Protecting health data privacy while using residence-based environment and demographic data. Heal Place 2012;18:209–17. https://doi.org/10.1016/j.healthplace.2011.09.006.
[85] Development. O for EC and. Health Data Governance: Privacy, Monitoring and Research . Paris: OECD Publishing; 2015. https://doi.org/10.1787/9789264244566-en.
[86] Dankar FK, El Emam K. The application of differential privacy to health data. Proc. 2012 Jt. EDBT/ICDT Work., ACM; 2012, p. 158–66.
[87] Yue X, Wang H, Jin D, Li M, Jiang W. Healthcare data gateways: found healthcare intelligence on blockchain with novel privacy risk control. J Med Syst 2016;40:218.
[88] Salsabili S, Mukherjee A, Ukwatta E, Chan ADC, Bainbridge S, Grynspan D. Automated segmentation of villi in histopathology images of placenta. Comput Biol Med 2019;113:103420. https://doi.org/10.1016/j.compbiomed.2019.103420.
[89] Zhang P. Decidual Vasculopathy in Preeclampsia and Spiral Artery Remodeling Revisited: Shallow Invasion versus Failure of Involution. AJP Rep 2018;8:e241–6. https://doi.org/10.1055/s-0038-1675348.
[90] Vahanian SA, Vintzileos AM. Placental implantation abnormalities: a modern approach. Curr Opin Obstet Gynecol 2016;28:477–84. https://doi.org/10.1097/GCO.0000000000000319.
[91] Racicot K, Cardenas I, Wünsche V, Aldo P, Guller S, Means RE, et al. Viral infection of the pregnant cervix predisposes to ascending bacterial infection. J Immunol 2013;191:934–41. https://doi.org/10.4049/jimmunol.1300661.
[92] Burton GJ, Baergen RN. Villous Maldevelopment. 6th ed. 2012. Berlin, Heidelberg: Springer Berlin Heidelberg; 2012. https://doi.org/10.1007/978-3-642-23941-0_15.
[93] Heider A. Fetal Vascular Malperfusion. Arch Pathol Lab Med 2017;141:1484–9. https://doi.org/10.5858/arpa.2017-0212-RA.
151

[94] Dommisse J, Tiltman AJ. Placental bed biopsies in placental abruption. Br J Obstet Gynaecol 1992;99:651–4. https://doi.org/10.1111/j.1471-0528.1992.tb13848.x.
[95] Kaufmann P, Huppertz B, Frank HG. The fibrinoids of the human placenta: origin, composition and functional relevance. Ann Anat 1996;178:485–501. https://doi.org/10.1016/S0940-9602(96)80102-6.
[96] Morgen EK, Fitzgerald B, Keating S. Intervillous Thrombosis BT - Pathology of the Placenta: A Practical Guide. In: Khong TY, Mooney EE, Nikkels PGJ, Morgan TK, Gordijn SJ, editors., Cham: Springer International Publishing; 2019, p. 67–76. https://doi.org/10.1007/978-3-319-97214-5_7.
[97] Kim CJ, Romero R, Chaemsaithong P, Kim J-S. Chronic inflammation of the placenta: definition, classification, pathogenesis, and clinical significance. Am J Obstet Gynecol 2015;213:S53–69. https://doi.org/https://doi.org/10.1016/j.ajog.2015.08.041.
[98] X. P, L. L, H. Y, Z. L, J. Y, L. Z, et al. Accurate segmentation of nuclei in pathological images via sparse reconstruction and deep convolutional networks. vol. 229. H. Yang, School of Automation, Beijing University of Posts and Telecommunications, Beijing, China. E-Mail: [email protected]: Elsevier B.V.; 2017. https://doi.org/10.1016/j.neucom.2016.08.103.
[99] Kidron D, Vainer I, Fisher Y, Sharony R. Automated image analysis of placental villi and syncytial knots in histological sections. Placenta 2017;53:113–8. https://doi.org/10.1016/j.placenta.2017.04.004.
[100] Shamir L, Delaney JD, Orlov N, Eckley DM, Goldberg IG. Pattern recognition software and techniques for biological image analysis. PLoS Comput Biol 2010;6:e1000974. https://doi.org/10.1371/journal.pcbi.1000974.
[101] Lisboa PJ, Taktak AFG. The use of artificial neural networks in decision support in cancer: A systematic review. Neural Networks 2006;19:408–15. https://doi.org/10.1016/j.neunet.2005.10.007.
[102] Guidelines for health care professionals supporting families experiencing a perinatal loss. Paediatr Child Health 2001;6:469–90.
[103] Weiner E, Rymer-Haskel N, Grinstein E, Feldstein O, Mizrachi Y, Schreiber L, et al. 571: Can placental vascular lesions predict reccurence of preeclampsia? Am J Obstet Gynecol 2016;214:S307–8. https://doi.org/https://doi.org/10.1016/j.ajog.2015.10.616.
[104] Thornburg KL, O’Tierney PF, Louey S. Review: The Placenta is a Programming Agent for Cardiovascular Disease.(Report). Placenta 2010;31:S54–9.
[105] Romagnuolo I, Sticchi E, Attanasio M, Grifoni E, Cioni G, Cellai AP, et al. Searching for a common mechanism for placenta-mediated pregnancy complications and cardiovascular disease: role of lipoprotein(a). Fertil Steril 2016;105:1287-1293.e3. https://doi.org/10.1016/j.fertnstert.2016.01.014.
[106] Siddiqui N, Hladunewich M. Understanding the Link Between the Placenta and Future Cardiovascular Disease. Trends Cardiovasc Med 2011;21:188–93. https://doi.org/10.1016/j.tcm.2012.05.008.
[107] Intrauterine Growth and Development 2012:1–18. https://doi.org/10.1002/9781118477076.ch1.
152

[108] Lee YQ, Collins CE, Gordon A, Rae KM, Pringle KG. The Relationship between Maternal Nutrition during Pregnancy and Offspring Kidney Structure and Function in Humans: A Systematic Review. Nutrients 2018;10. https://doi.org/10.3390/nu10020241.
[109] Burton GJ, Fowden AL, Thornburg KL. Placental Origins of Chronic Disease. Physiol Rev 2016;96:1509–65. https://doi.org/10.1152/physrev.00029.2015.
[110] Thornburg KL, Marshall N. The placenta is the center of the chronic disease universe. Am J Obstet Gynecol 2015;213:S14–20. https://doi.org/10.1016/j.ajog.2015.08.030.
[111] Cui Z, Gong G. The effect of machine learning regression algorithms and sample size on individualized behavioral prediction with functional connectivity features. Neuroimage 2018;178:622–37. https://doi.org/10.1016/j.neuroimage.2018.06.001.
[112] Vapnik V. The nature of statistical learning theory. Springer science & business media; 2013.
[113] Pan SJ, Yang Q. A Survey on Transfer Learning. IEEE Trans Knowl Data Eng 2010;22:1345–59. https://doi.org/10.1109/TKDE.2009.191.
[114] Sarkar author D. Hands-on transfer learning with Python : implement advanced deep learning and neural network models using tensorflow and keras. Birmingham ; 2018.
[115] Perlich C, Dalessandro B, Raeder T, Stitelman O, Provost F. Machine learning for targeted display advertising: transfer learning in action. Mach Learn 2014;95:103–27. https://doi.org/10.1007/s10994-013-5375-2.
[116] Fernandes J. Transfer Learning for Images Using PyTorch: Essential Training 2019.
[117] Nair TM. Statistical and artificial neural network-based analysis to understand complexity and heterogeneity in preeclampsia. Comput Biol Chem 2018;75:222–30. https://doi.org/10.1016/j.compbiolchem.2018.05.011.
[118] von Dadelszen P, Magee LA, Roberts JM. Subclassification of Preeclampsia. Hypertens Pregnancy 2003;22:143–8. https://doi.org/10.1081/PRG-120021060.
[119] Ogge G, Chaiworapongsa T, Romero R, Hussein Y, Kusanovic JP, Yeo L, et al. Placental lesions associated with maternal underperfusion are more frequent in early-onset than in late-onset preeclampsia. J Perinat Med 2011;39:641–52. https://doi.org/10.1515/JPM.2011.098.
[120] Egbor M, Ansari T, Morris N, Green CJ, Sibbons PD. Maternal medicine: Morphometric placental villous and vascular abnormalities in early-and late-onset pre-eclampsia with and without fetal growth restriction. BJOG An Int J Obstet Gynaecol 2006;113:580–9.
[121] Leavey K, Wilson SL, Bainbridge SA, Robinson WP, Cox BJ. Epigenetic regulation of placental gene expression in transcriptional subtypes of preeclampsia. Clin Epigenetics 2018;10:28. https://doi.org/10.1186/s13148-018-0463-6.
153

Appendices
Appendix A. Preliminary Results from Unsupervised Machine Learning Experiments
A.1. Two distinct visual clusters found in the dataset of placenta histopathology images. A. The median
500 SIFT descriptors for each image was clustered with a K-means clustering algorithm. Clusters are
plotted along the top 3 principal components with visual cluster 1 represented in orange and visual
cluster 2 represented in blue. B. Images found to be in visual cluster 1 are presented with an orange
border, and visual cluster 2 is presented with a blue border. C. A silhouette analysis was performed, and
2 clusters was found to be the optimal distribution of the data.
A.
C.
B.
154

A.2. Clinical outcome overlay on histology-based clusters distribution
• Cases of PE (purple) and controls (yellow) plotted on top 3 principal components with strong
representation of PE in histology cluster 2.
• Cases of early onset PE (turquoise), late onset PE (coral), and controls (yellow) plotted on top 3
principal components with strong representation of early onset PE in histology cluster 2.
54.65% 45.35%
33.52%66.48%
0.00%
20.00%
40.00%
60.00%
80.00%
100.00%
120.00%
1 2Pregnancy Outcome Percen
tage
Histology Cluster
Percentage of Pregnancy Outcome Within Histology Clusters
PE
Control
54.65% 45.35%
28.82%71.18%
42.06%
57.94%
0.00%20.00%40.00%60.00%80.00%100.00%120.00%140.00%160.00%180.00%200.00%
1 2
Pregnancy Outcome Percen
tage
Histology Cluster
Percentage of Pregnancy Outcome Within Histology Clusters
PE_term
PE_pre
Control
155

A.3. Maternal vascular malperfusion severity overlay on histology-based clusters distribution
• Severity of MVM plotted on top 3 principal components with an enrichment of higher severity
(scores of 3-5 and 6-8) in histology cluster 2.
54.96% 45.04%
31.92% 68.08%
31.93%
68.07%
0.00%20.00%40.00%60.00%80.00%100.00%120.00%140.00%160.00%180.00%200.00%
1 2
MVM
Score Percentage
Histology Cluster
Percent of MVM Scores Within Histology Clusters
"6-8"
"3-5"
"0-2"
156

Appendix B. Research Ethics Certificates
B.1. Letter of Administrative Approval from the University of Ottawa Office of Research Ethics and
Integrity
24/08/2018
Université d'OttawaBureau d'éthique et d'intégrité de la recherche
University of OttawaOffice of Research Ethics and Integrity
550, rue Cumberland, pièce 154 550 Cumberland Street, Room 154Ottawa (Ontario) K1N 6N5 Canada Ottawa, Ontario K1N 6N5 Canada
613-562-5387 • 613-562-5338 • / [email protected] [email protected] | www.recherche.uottawa.ca/deontologie www.recherche.uottawa.ca/ethics
Lettre d’approbation administrative | Letter of administrative approval
Numéro de dossier / Ethics File Number H-08-18-1023Titre du projet / Project Title Identification of Molecular
Subclasses of PreeclampsiaType de projet / Project Type Recherche de professeur /
Professor's research projectCÉR primaire / Primary REB Réseau de science de la santé
d'Ottawa (RSSO) / OttawaHealth Science Network (OHSN)
Statut du projet / Project Status Approuvé / ApprovedDate d'approbation (jj/mm/aaaa) / Approval Date (dd/mm/yyyy) 24/08/2018Date d'expiration (jj/mm/aaaa) / Expiry Date (dd/mm/yyyy) 18/10/2018
Équipe de recherche / Research TeamChercheur /Researcher Affiliation Role
ShannonBAINBRIDGE-WHITESIDE
École interdisciplinaire des sciences de la santé / InterdisciplinarySchool of Health Sciences
Chercheur Principal /Principal Investigator
Samantha BENTON Département de médecine cellulaire et moléculaire / Department ofCellular and Molecular Medicine
Co-chercheur /Co-investigator
Jeremiah GAUDET Assistant de recherche /Research Assistant
PascaleROBINEAU-CHARETTE
Département de médecine cellulaire et moléculaire / Department ofCellular and Molecular Medicine
Étudiant-chercheur /Student-researcher
Anika MUKHERJEE École interdisciplinaire des sciences de la santé / InterdisciplinarySchool of Health Sciences
Étudiant-chercheur /Student-researcher
Conditions spéciales ou commentaires / Special conditions or comments:
157

B.2. Certificate of Ethics Approval (Renewal) from the University of Ottawa Office of Research Ethics and
Integrity
15/04/2019
Université d'OttawaBureau d’éthique et d’intégrité de la recherche
University of OttawaOffice of Research Ethics and Integrity
550, rue Cumberland, pièce 154 550 Cumberland Street, Room 154Ottawa (Ontario) K1N 6N5 Canada Ottawa, Ontario K1N 6N5 Canada
613-562-5387 • 613-562-5338 • / [email protected] [email protected] | www.recherche.uottawa.ca/deontologie www.recherche.uottawa.ca/ethics
CERTIFICAT D'APPROBATION ÉTHIQUE | CERTIFICATE OF ETHICS APPROVAL
Numéro du dossier / Ethics File Number H-08-18-1023Titre du projet / Project Title Identification of Molecular
Subclasses of PreeclampsiaType de projet / Project Type Recherche de professeur /
Professor's research projectStatut du projet / Project Status Renouvelé / RenewedDate d'approbation (jj/mm/aaaa) / Approval Date (dd/mm/yyyy) 15/04/2019Date d'expiration (jj/mm/aaaa) / Expiry Date (dd/mm/yyyy) 18/10/2019
Équipe de recherche / Research TeamChercheur /Researcher Affiliation Role
ShannonBAINBRIDGE-WHITESIDE
École interdisciplinaire des sciences de la santé / InterdisciplinarySchool of Health Sciences
Chercheur Principal /Principal Investigator
Samantha BENTON Département de médecine cellulaire et moléculaire / Department ofCellular and Molecular Medicine
Co-chercheur /Co-investigator
Jeremiah GAUDET Assistant de recherche /Research Assistant
PascaleROBINEAU-CHARETTE
Département de médecine cellulaire et moléculaire / Department ofCellular and Molecular Medicine
Étudiant-chercheur /Student-researcher
Anika MUKHERJEE École interdisciplinaire des sciences de la santé / InterdisciplinarySchool of Health Sciences
Étudiant-chercheur /Student-researcher
Conditions spéciales ou commentaires / Special conditions or comments
158

B.3. Certificate of Completion of TCPS 2: CORE Course
PANEL ON RESEARCH ETHICS Navigating the ethics of human research
TCPS 2: CORE
Certificate of Completion
This document certifies that
has completed the Tri-Council Policy Statement: Ethical Conduct for Research Involving Humans
Course on Research Ethics (TCPS 2: CORE)
Date of Issue:
Anika Mukherjee
26 September, 2016
159

Appendix C. Scholarly Achievements
C.1. Scholarships
1. University of Ottawa Graduate Admission Scholarship (September 2016 – August 2018)
C.2. Publications
1. Salsabili, S., Mukherjee, A., Ukwatta, E., Chan, A. D. C., Bainbridge, S., & Grynspan, D. (2019).
Automated segmentation of villi in histopathology images of placenta. Computers in Biology and
Medicine, 113, 103420. doi: 10.1016/j.compbiomed.2019.103420
2. Mukherjee, A., Chan, A. D., Keating, S., Redline, R. W., Fritsch, M. K., Machin, G. A., Cornejo-
Palma, D., de Nanassy, J., El-Demellawy, D., von Dadelszen, P., Benton, SJ, Grynspan, D. (2016).
The Placental Distal Villous Hypoplasia Pattern: Interobserver Agreement and Automated Fractal
Dimension as an Objective Metric. Pediatric and Developmental Pathology, 19(1), 31–36. doi:
10.2350/15-03-1619-oa.1
C.3. Published Abstracts
1. Mukherjee A, Salsabili S, Chan ADC, Leckie M, Grynspan D, Bainbridge S. (2020). Modelling
Placenta Mediated Diseases with Supervised Machine Learning. Reproductive Sciences
27(1):171A.
2. Mukherjee A, Grynspan D, Bainbridge S. (2019). Clustering Preeclampsia Histopathology Images
with K-means Clustering for Pattern Recognition and Therapeutic Target Discovery.
Reproductive Sciences 26(Supp 1):177A.
3. Mukherjee A, Salsabili S, Chan ADC, Ukwatta E, Leckie M, Grynspan D, Bainbridge S. (2018).
Automating Segmentation of Placenta Tissue Images for Computer Aided Diagnosis and Creating
Objective Measures for Microscopic Components. Reproductive Sciences 25(Supp. 1):244A.
160

C.4. Workshops
1. Health Sciences Startup Bootcamp 2019. University of Ottawa. February 2019.
2. Quantitative 3D Microscopic Analysis of Isolated Human Peripheral Placental Villous Trees:
Theory and Practice. Ludwig-Maximilians-Universitat Munchen. February 2018.
C.5. Presentation
1. Modelling Placenta Mediated Diseases with Machine Learning. Poster presentation at the
Society of Reproductive Investigation 67th Annual Meeting, 2020.
2. Clustering Preeclampsia Histopathology Images with K-Means Clustering for Pattern Recognition
and Therapeutic Target Discovery. Poster presentation at the Society of Reproductive
Investigation 65th Annual Meeting, 2019.
3. Automating Segmentation of Placenta Tissue Images for Computer Aided Diagnosis and Creating
Objective Measures for Microscopic Components. Poster presentation at the Society of
Reproductive Investigation 66th Annual Meeting, 2018.
4. Women in Data Science Ottawa Conference 2018 – Panel Discussion. March 2018.
5. Pint of Science – Our Body. Co-presenter of presentation titled “The Placenta – The Most
Important Organ You Have Ever Owned” with Dr. Shannon Bainbridge. May 2018.
161

Appendix D. Permissions for Publication
D.1. Permission to include Automated Segmentation of Villi in Histopathology Images of Placenta in a
thesis
10/4/2019 Rightslink® by Copyright Clearance Center
https://s100.copyright.com/AppDispatchServlet#formTop 1/1
Title: Automated segmentation of villiin histopathology images ofplacenta
Author: S. Salsabili,A. Mukherjee,E.Ukwatta,A.D.C. Chan,S.Bainbridge,D. Grynspan
Publication: Computers in Biology andMedicine
Publisher: ElsevierDate: October 2019© 2019 Elsevier Ltd. All rights reserved.
LOGINLOGIN
If you're a copyright.comuser, you can login toRightsLink using yourcopyright.com credentials.Already a RightsLink user orwant to learn more?
Please note that, as the author of this Elsevier article, you retain the right to include it in a thesis ordissertation, provided it is not published commercially. Permission is not required, but please ensurethat you reference the journal as the original source. For more information on this and on your otherretained rights, please visit: https://www.elsevier.com/about/our-business/policies/copyright#Author-rights
Copyright © 2019 Copyright Clearance Center, Inc. All Rights Reserved. Privacy statement. Terms and Conditions. Comments? We would like to hear from you. E-mail us at [email protected]
162