PATHANAMTHITTA - Department of Town & Country Planning
116
DISTRICT URBANISATION REPORT PATHANAMTHITTA DEPARTMENT OF TOWN AND COUNTRY PLANNING - GOVERNMENT OF KERALA January 2011
-
Upload
khangminh22 -
Category
Documents
-
view
1 -
download
0
Transcript of PATHANAMTHITTA - Department of Town & Country Planning
DISTRICT URBANISATION REPORT
PATHANAMTHITTA
DEPARTMENT OF TOWN AND COUNTRY PLANNING - GOVERNMENT OF KERALA
January 2011
admin
Text Box
< CONTENTS >
admin
Text Box
PREFACE >>
PREFACE
Planning is a prerequisite for effective development. Development becomes comprehensivewhen growth centres are identified considering physical, social and economic variables of an area inan integrated manner. This indicates that planning of villages and towns are to be complementary.Second Administrative Reforms Commission (ARC) while interpreting the article 243 ZD of theConstitution of India states as follows. “This, in other words, means that the development needs ofthe rural and urban areas should be dealt with in an integrated manner and, therefore, the districtplan, which is a plan for a large area consisting of villages and towns, should take into account suchfactors as ‘spatial planning’, sharing of ‘physical and natural resources’, integrated development ofinfrastructure’ and ‘environmental conservation’. All these are important, because the relationshipbetween villages and towns is complementary. One needs the other. Many functions that the townsperform as seats of industry, trade and business and as providers of various services, including highereducation, specialized health care services, communication etc have an impact on the developmentand welfare of rural people. Similarly, the orderly growth of the urban centre is dependent on thekind of organic linkage it establishes with its rural hinterland”. Therefore a move of harmonizingurban and rural centres of an area can be said as a move of planned urbanisation of the area.
In this context, it is relevant to mention the 74th Amendment Act of the Constitution of India,which mandated the District Planning Committee to prepare a draft development plan for the district.As per Article 243 ZD of the Constitution, the District Planning Committee (DPC) shall consolidatePanchayat/Municipality Plans in the district and prepare draft development plan for the district as awhole. The Constitution also specifies that while preparing draft development plan due regard shallbe given to matters of common interest between panchayats and municipalities including spatialplanning, sharing of water and other physical and natural resources, the integrated development ofinfrastructure and environmental conservation. In this respect, the district of Kollam has conductedan important experiment of preparation of an Integrated District Development Plan (IDDP) for thedistrict. Through preparation of IDDP, the District Planning Committee of Kollam has become the firstever DPC in the country to own a District Development Plan as envisaged by the Constitution. Thispath-breaking venture has become a model in participatory district planning in a spatial platform. ThePlan was released during the international conference on district planning held at Kollam in August2009. The Plan is now sanctioned by Government of Kerala. As per G.O (Rt) 354/04/LSGD dated 01.02.07,the State Government have extended the project to the remaining districts in the state and the districtsof Alappuzha, Thrissur, Idukki, Palakkad and Wayanad were selected for extending the project in thefirst phase. However, even in these districts, preparation of IDDP is yet to be completed.
Preparation of such a plan will surely need decisions and commitment at various levels due tothe multiplicity of agencies involved and the vast spectrum of aspects to be addressed. However,delay in planning shall not affect development. Hence a step by step approach may be adopted inplanning. Therefore, the Department of Town and Country Planning evolved a sequence of planpreparation at district level, involving District Urbanisation Report (DUR), District Spatial Plan (DSP)and Integrated District Development Plan (IDDP).
The District Urbanisation Report defines the future spatial structure of a district, which isformulated by integrating hierarchy and activity pattern of urban and rural settlements and theconnectivity between them. The spatial structure of a district will act as a frame for the orderlydevelopment of urban centres and their rural hinterland subsequently leading to a plannedurbanisation.
The District Spatial Plan is a synergistic form of the District Urbanisation Report, since as a plan
admin
Text Box
<< BACK
admin
Text Box
< CONTENTS >
admin
Text Box
NEXT >>
it is congruent to a single unified physical design for the district through setting development goalsand objectives and formulating the development concept of the district. DSP will frame the generalpolicies and strategies and streamline directions of development of the district. The DevelopmentDirectives of DSP is carved in the spatial platform through the synthesis of findings of the analysis overthe spatial structure based on secondary sources of data. But it lacks the resource studies as co-ordination of various agencies remain as an uphill task.
The Integrated District Development Plan can be termed as the highest echelon of this seriesand manifest all features of the draft district development plan as envisaged in Article 243ZD of theConstitution of India. Democratisation of planning and translation of sectoral policies into spatialplans are the paramount qualities of IDDP as against DSP. IDDP comprises of two components; aPerspective Plan for 15-20 years and an Execution Plan for 5 years.
As said earlier, IDDP for Kollam District is already prepared under the leadership of the DistrictPlanning Committee, Kollam with the involvement of all the Local Governments in the district andSpecial Technical Advisory Committee for IDDP. The Department of Town and Country Planning gavetechnical support for Plan preparation besides coordinating the entire process in the role of nodalagency.
Now, the Department has prepared District Spatial Plans for the districts of Thrissur and Palakkadand District Urbanisation Reports for the districts of Thiruvananthapuram, Pathanamthitta, Alappuzha,Kottayam, Ernakulam, Idukki, Malappuram, Kozhikkode, Wayanad, Kannur and Kasaragod. The DistrictUrbanisation Report for Pathanamthitta is one among the series.
I take this opportunity to appreciate the officials of the Pathanamthitta District Office of theDepartment, headed by Smt. K.S. Girija in the preparation of this document. The State Project Cell forLDP-IDDP-SPP played anchor role in this regard, right from conceptualisation to shaping the end product.The toolkits and customised computer applications developed by the State Project Cell has enabledthe district offices to accomplish the task in a time bound manner. I also appreciate the consistentefforts of Sri. Jacob Easow, Senior Town Planner, Smt.Ushakumari.P.R, Town Planner, Sri. Baiju.K, DeputyTown Planner and other officials of the State Project Cell for design of the programme of DistrictUrbanisation Repotrs as well as for their efforts in vetting and finalising the District UrbanisationReport for Pathanamthitta.
This is a first step on the ladder leading to the draft development plan for the district as laiddown in the Constitution. It is hoped that the district of Pathanamthitta will further extend the DistrictUrbanisation Report into Integrated District Development Plan for the district.
Certainly, the District Urbanisation Report for Pathanamthitta will provide a framework fordevelopment as well as future planning of the district.
Thiruvananthapuram EAPEN VARUGHESE
11-02-2011 Chief Town Planner
admin
Text Box
NEXT >>
admin
Text Box
<< BACK
admin
Text Box
< CONTENTS >
ACKNOWLEDGEMENT
The District Urbanization Report, Pathanamthitta was prepared along with that of other thirteendistricts in the state as part of preparation of Spatial Development Plan for Kerala.
Sri.S.M.Vijayanand, Additional Chief Secretary, LSGD spent his very valuable time to review theprogress of this work and to give necessary guidance. I acknowledge, with sincere thanks, the co-operation and guidance of the Additional Chief Secretary.
I acknowledge, with sincere thanks, the guidance, motivation and supports given by Sri.EapenVarughese, Chief Town Planner, Department of Town and Country Plannng for preparation of thisreport.
This report was a joint effort of the district office and head office. The State Project Cell incharge of this work performed exemplary efforts in properly guiding the district team, impartingtraining to them and monitoring the progress of the work. I, hereby, acknowledge with thanks, thesincere attempts of the state level team headed by Sri. Jacob Easow, Senior Town Planner. I alsoacknowledge the valuable contributions rendered by, Smt. P.R.Ushakumari, Town Planner andSri.K.Baiju, Deputy Town Planner of State Project Cell.
The Senior Town Planners, viz. Sri.G.Mohanan, Smt.T.M.Sudha, Sri.K.Devarajan, Smt. Ann Jacoband Smt.Darley.D.S.Money took sincere efforts in shaping this report in this form. I also acknowledgetheir sincere attempts.
The district team performed an untiring task in timely completion of this report. The sincereand keen interest shown by Sri.P.Anilkumar, Deputy Town Planner, District Town & Country PlanningOffice, Pathanamthitta in giving perfection in this work deserve special mention.
I also acknowledge with thanks, the support given by each and every technical and administrativestaff of the district office and department who contributed their valuable service in bringing out thisreport in the present form.
Hope this effort of the department will help a long way in framing the future urbanizationscenario of the state and thereby help in properly steering the development activities of the state.
K.S.GIRIJA,Pathanamthitta Town Planner, Pathanamthitta11.02.2011 Department of Town and Country Plannng.
admin
Text Box
NEXT >>
admin
Text Box
<< BACK
admin
Text Box
< CONTENTS >
admin
Text Box
< CONTENTS >
Department of Town & Country Planning, KeralaDepartment of Town & Country Planning, Kerala
iv
CONTENTS
Chapter 1 Profile of the District 1
1.1 Administrative Divisions 1
1.2 Area and Population 4
1.3 Physiography 4
1.4 Physical Features 4
1.5 Socio-Economic Aspects 5
1.6 Inference 6
Chapter 2 History and Regional Linkages 7
2.1 Historical Background 7
2.2 Regional Linkages 8
2.3 Inference 9
Chapter 3 Population 10
3.1 Population Size 10
3.2 Growth of Population 10
3.3 Population Density 11
3.4 Sex Ratio 13
3.5 Population Concentration Pattern 13
3.6 Population Projection (Trend Based) 13
3.7 Inference 15
Chapter 4 Occupational Structure 16
4.1 Work Force of the District 16
4.2 Occupational Structure 17
4.3 Occupational Structure- Variation in Urban and Rural Areas 18
4.4 Occupational Structure- Estimation Of nine fold Classification of 2001 18
4.5 Spatial Distribution of the Major Classes of Workers 20
District Urbanisation Report - Pathanamthitta CONTENT
admin
Text Box
<< BACK
Department of Town & Country Planning, KeralaDepartment of Town & Country Planning, Kerala
4.6 Activity Pattern Based on Occupational Structure of workers 23
4.7 Occupational Structure- Temporal variation 25
4.8 Inference 26
Chapter 5 Land Use 27
5.1 Land Use pattern of Kerala State 27
5.2 Land use breakup of Pathanamthitta district 28
5.3 Regional land use study 28
5.4 Concentration pattern of land use 34
5.5 Analysis of Agriculture land use 44
5.6 Major agriculture activities 45
5.7 Major agriculture activities including plantation 48
5.8 Activity zones based on land use concentration pattern 49
5.9 Inference 53
Chapter 6 Functional Character of Settlements 54
6.1 Introduction 54
6.2 Character of Settlements 54
6.3 Inference 56
Chapter 7 Hierarchy of Settlements 577.1 Existing Hierarchy of Settlement 57
7.2 Suggested Hierarchy of Settlement 58
7.3 Character of Higher order settlements 65
7.4 Inference 65
Chapter 8 Urban Profile 66
8.1 Trend of Urbanization- Kerala 66
8.2 Census Urban Areas in Pathanamthitta District 678.3 Urban Population content 68
8.4 Growth Rate of Urban Population 68
8.5 Urban Settlements 1991 and 2001 69
CONTENT District Urbanisation Report - Pathanamthittav
Department of Town & Country Planning, KeralaDepartment of Town & Country Planning, Kerala
8.6 Future Urbanization Profile of the District 70
8.7 Urban Profile 72
8.8 Inference 72
Chapter 9 Activity Pattern 73
9.1 Introduction 73
9.2 Land use concentration pattern 73
9.3 Future urban profile 73
9.4 Functional classification 749.5 Determination of activity pattern 75
9.6 Inference 78
Chapter 10 Connectivity 79
10.1 Road network 79
10.2 Rail network 80
10.3 Waterways and airways 81
10.4 Proposed Transportation network 81
10.5 Inference 82
Chapter 11 Spatial structure 83
11.1 Spatial structure base on settlement studies 83
11.2 Activity pattern 83
11.3 Hierarchy of settlements 83
11.4 Connectivity 83
11.5 Spatial structure 84
Chapter 12 Summary of findings 87
viii viDistrict Urbanisation Report - Pathanamthitta CONTENT
Department of Town & Country Planning, KeralaDepartment of Town & Country Planning, Kerala
LIST OF TABLES
Table 1.1 Details of the Taluks of the district 2
Table 1.2 Block Panchayaths and Headquarters 2
Table 3.1 Projected District Population-Decreasing rate method 14
Table 3.2 Projected District Population-Apportionment method 15
Table 3.3 Final Population figure of Pathanamthitta district 15
Table 4.1 Details of workers from the Year 1981 to 2001 17
Table 4.2 Occupational structure of Pathanamthitta district 2001 17
Table 4.3 Workers classification-Urban Rural Area split up 18
Table 4.4 Estimated nine fold classification of workers-2001 19
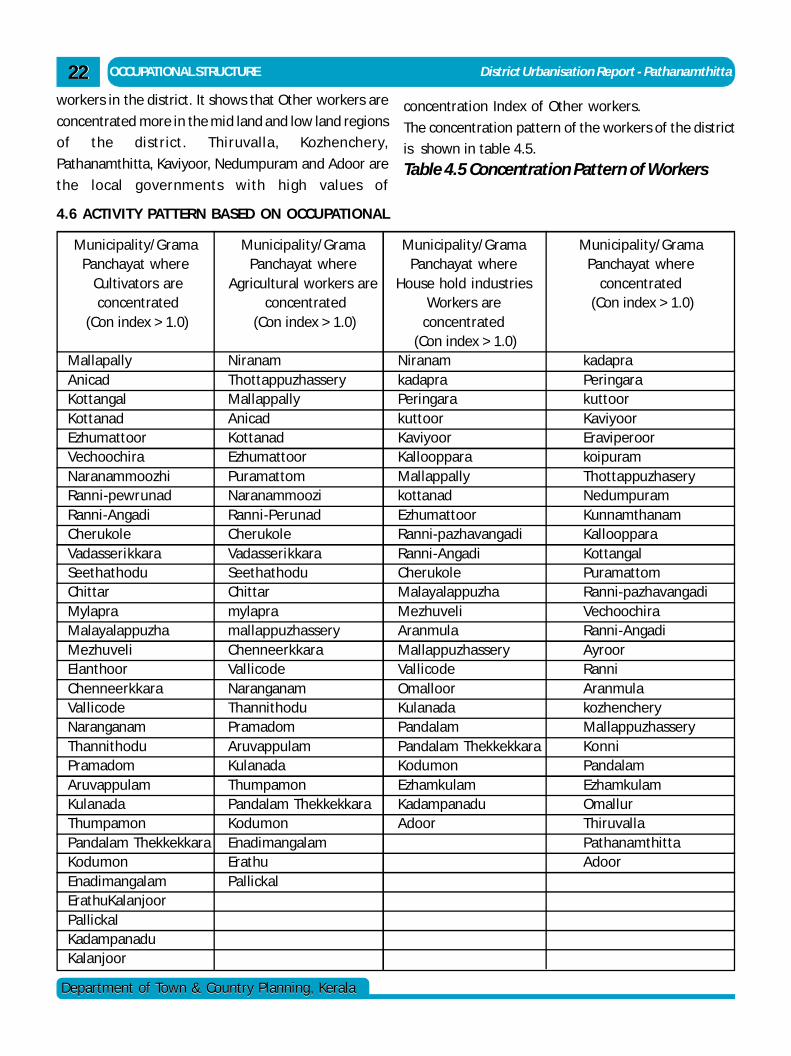
Table 4.5 Concentration Pattern of workers 22
Table 4.6 Activity pattern based on occupational structure of workers 24
Table 4.7 Four fold workers classification(2001)- Temporal Variation 25
Table 4.8 Four fold workers classification in Urban Area (2001)
Temporal variations 25
Table 4.9 Four fold workers classification in Rural Area –
Temporal variations 25
Table 5.1 Land use breakup of Kerala 27
Table 5.2 Land use break up of Pathanamthitta district 28
Table 5.3 Comparison of the land use breakup of Pathanamthitta
District and Kerala state 30
Table 5.4 Land use break up – Comparison with neighboring districts 31
Table 5.5 Breakup of Agriculture land use of Pathanamthitta district 44
Table 5.6 Break up of Agriculture land use( grouped into five major
Categories) of Pathanamthitta district 45
ixCONTENT District Urbanisation Report - Pathanamthittavii
Department of Town & Country Planning, KeralaDepartment of Town & Country Planning, Kerala
Table 5.7 Grouping of land use clarifications 49
Table 5.8 Criteria for determination of activity on land use 51
Table 5.9 Activity based on land use 51
Table 6.1 Functional character of LSGIs 55
Table 7.1 Identification of second order settlements 61
Table 7.2 Suggested Hierarchy of settlements 64
Table 7.3 Character of Higher order settlements 65
Table 8.1 Population figure (2001) of Kerala at a glance 66
Table 8.2 Trends of population growth of Kerala 1981-2001 66
Table 8.3 Trends in urbanization of Kerala-1981-2001 67
Table 8.4 District wise percentage of urban population 68
Table 8.5 Variation in urban population of the district 69
Table 8.6 Existing urban local bodies and future probable
urban local bodies 72
Table 8.7 Urban profile-phasing 72
Table 9.1 Classification of settlements for activity pattern. 75
Table 9.2 Activity Pattern - different combinations 75
Table 9.3 Activity pattern of LSGs of the district 76
Table 10.1 Details of roads (in Km) of the district 79
x viiiDistrict Urbanisation Report - Pathanamthitta CONTENT
Department of Town & Country Planning, KeralaDepartment of Town & Country Planning, Kerala
LIST OF FIGURES
Figure 1.1 Taluks of Pathanamthitta District 2
Figure 1.2 Block Panchayaths and Municipalities of the district 3
Figure 1.3 Grama Panchayaths and Municipalities of the District 3
Figure 1.4 Forest Area of the District 4
Figure 1.5 Important Water Bodies of the District 5
Figure 2.1 Location of district in the state 9
Figure 2.2 Important Road and Rail network of the district 9
Figure 3.1 Variation in size of population of the district 10
Figure 3.2 Comparison of population size with surrounding districts 10
Figure 3.3 Population growth rate-comparison with surrounding district and state 11
Figure 3.4 Population growth rate of LSGIs of the district (19991-20 11
Figure 3.5 Population density-comparison with surround in districts and state 12
Figure 3.6 Population density of the Municipalities andGrama Panchayaths of the district 12
Figure 3.7 Sex Ratio-Comparison with surrounding district and state 13
Figure 3.8 Sex Ratio (0-6) Comparison with surrounding district and state 13
Figure 3.9 Population concentration pattern 14
Figure 4.1 Main Workers and Marginal workers 16
Figure 4.2 Variation in numbers of workers (1981-2001) 16
Figure 4.3 Classification of main workers – 2001 17
Figure 4.4 Comparison of percentage of primary workers 18
xiCONTENT District Urbanisation Report - Pathanamthittaviii ixCONTENT District Urbanisation Report - Pathanamthittaix
Department of Town & Country Planning, KeralaDepartment of Town & Country Planning, Kerala
Figure 4.5 Workers classification- urban rural comparison 18
Figure 4.6 Estimated Nine fold classification of workers 2001 19
Figure 4.7 Concentration index of Cultivators 20
Figure 4.8 Concentration index of Agricultural labourers 20
Figure 4.9 Concentration index of H.H. Industrial workers 21
Figure 4.10 Concentration index of Other workers 21
Figure 4.11 Distribution of Concentration index of bothHouse hold industrial workers and Other workers 23
Figure 4.12 Distribution of Concentration index of both cultivators andAgricultural labuors 23
Figure 4.13 Activity pattern based on occupational structure of workers 25
Figure 5.1 Land use breakup of Kerala in percentage 27
Figure 5.2 Land use break up of Pathanamthitta district in percentage 28
Figure 5.3 Land use map of Pathanamthitta district 29
Figure 5.4 Percentage of land use of the district-Comparison with state figures 30
Figure 5.5 Percentage of Forest land use of the district-Comparison with surrounding districts 31
Figure 5.6 State share of Forest land use of the district-Comparison with surrounding districts 31
Figure 5.7 Percentage of Residential land use of the district-Comparison with surrounding districts 32
Figure 5.8 State share of Residential land use of the district-Comparison with surrounding districts 32
Figure 5.9 Percentage of Residential Agriculture mix land use of the district-Comparison with surrounding districts 32
xiix xDistrict Urbanisation Report - Pathanamthitta CONTENT
Department of Town & Country Planning, KeralaDepartment of Town & Country Planning, Kerala
Figure 5.10 State share of Residential Agriculture mix land use of the district-Comparison with surrounding districts. 32
Figure 5.11 Percentage of Agriculture land use of the district-Comparison with surrounding districts 33
Figure 5.12 State share of Agriculture land use of the district-Comparison with surrounding districts 33
Figure 5.13 Percentage of Plantation land use of the district-Comparison with surrounding districts 33
Figure 5.14 State share of Plantation land use of the district-Comparison with surrounding districts 33
Figure 5.15 Percentage of Agriculture and plantation Land uses togetherComparison with sorrounding districts 34
Figure 5.16 State share (in %) of Agriculture and Plantation Land uses togetherComparison with sorrounding districts 34
Figure 5.17 Concentration pattern of Forest land use 35
Figure 5.18 Variation in concentration index of Forest land use 35
Figure 5.19 Concentration pattern of Agricultural land use 36
Figure 5.20 Variation in concentration index of Agricultural land use 36
Figure 5.21 Concentration pattern of Agricultural land and Plantation together 37
Figure 5.22 Concentration pattern of Agricultural, Plantation andResidential Agriculture mix land use together 37
Figure 5.23 Concentration pattern of Plantations land use 38
Figure 5.24 Variation in concentration index of Plantations land use 38
Figure 5.25 Concentration pattern of Residential Agricultural mixed land use 39
Figure 5.26 Variation in concentration index of Residential Agricultural mixed land use 39
Figure 5.27 Concentration pattern of Residential land use 40
xiiiixCONTENT District Urbanisation Report - Pathanamthittaxi
Department of Town & Country Planning, KeralaDepartment of Town & Country Planning, Kerala
Figure 5.28 Variation in concentration index of Residential land use 40
Figure 5.29 Concentration pattern of Residential and Residential AgricultureLand use 41
Figure 5.30 Concentration pattern of Marshy land 41
Figure 5.31 Variation in concentration index of Marshy land 42
Figure 5.32 Concentration pattern of water bodies 42
Figure 5.33 Variation in concentration index of work bodies 43
Figure 5.34 Variation in concentration index of other land use 43
Figure 5.35 Break up of the agricultural land use of Pathanamthitta district 45
Figure 5.36 Break up of agricultural land use(grouped into five major categories)of Pathanamthitta district 45
Figure 5.37 Concentration pattern of rubber cultivation lands 46
Figure 5.38 Concentration pattern of cocunut cultivation lands 46
Figure 5.39 Concentration pattern of mixed crops cultivation lands 47
Figure 5.40 Concentration pattern of paddy cultivation lands 47
Figure 5.41 Concentration pattern of all major crops lands together 48
Figure 5.42 Concentration pattern of all major agricultural land together with plantations 48
Figure 5.43 Distribution of concentration index of urban land use 49
Figure 5.44 Distribution of concentration index of agricultural land use 50
Figure 5.45 Distribution of concentration index of forest land use 50
Figure 5.46 Distribution of concentration index of plantation land use 51
Figure 5.47 Activity pattern of the district based on the land use 52
xivx xiiDistrict Urbanisation Report - Pathanamthitta CONTENT
Department of Town & Country Planning, KeralaDepartment of Town & Country Planning, Kerala
Figure 6.1 Functional classifications of settlements 56
Figure 7.1 CFI against number of settlements 57
Figure 7.2 Existing Hierarchy of settlements 59
Figure 7.3 Suggested I order and Existing II order settlements 60
Figure 7.4 Identification of second order settlements 60
Figure 7.5 Spatial distribution of second order settlements 61
Figure 7.6 Service Settlements and Service Area of second order settlements 62
Figure 7.7 Third order settlements and service area 63
Figure 7.8 Service settlements and service area of third order settlements 63
Figure 7.9 Proposed hierarchy of settlements 64
Figure 8.1 Urban areas of the district 2001 67
Figure 8.2 Population growth rate of Municipalities andGrama Panchayaths 69
Figure 8.3 Variation in area (sq:km) of urban settlements 70
Figure 8.4 Future urbanization profile 72
Figure 9.1 Concentration pattern of land use of the district 73
Figure9.2 Future Urbanization profile of the district 74
Figure 9.3 Functional classification of settlements 74
Figure 9.4 Activity Pattern of the district 76
Figure 10.1 Major roads, railways and suggested Hierarchyof settlements 80
Figure 10.2 Schematic representation of road network 81
Figure 10.3 Proposed road network 82
Figure 11.1 Schemetic representation Spatial structure of the district. 85
Figure 11.2 Spatial structure of the district 86
xvixCONTENT District Urbanisation Report - Pathanamthittaxiii
Department of Town & Country Planning, KeralaDepartment of Town & Country Planning, Kerala
ANNEXES
Annex I Pathanamthitta district- population details 89
Annex II Population concentration pattern 90
Annex III Concentration index of major categories of workers 91
Annex IV Concentration index of land use (nine fold clarification) 92
Annex V Concentration index of major crops 93
Annex VI LSG wise agriculture activities 94
Annex VII Concentration index of major land use categories 95
Annex VIII Weightage of facilities 96
Annex IX Composits functiuonal index (CFI) of settlements 97
Annex X Service settlements and service population
of second order settlements 98
Annex XI Service area of 3rd order settlements- size of polygon 99
Annex XII Service settlements and service population of
third order settlements 100
Annex XIII Percentage of male workers in agricultural sector (201) 101
xvix xivDistrict Urbanisation Report - Pathanamthitta CONTENT
admin
Text Box
CHAPTER 1 >>
admin
Text Box
<< BACK
District Urbanisation Report - Pathanamthitta PROFILE OF THE DISTRICT
Department of Town & Country Planning, KeralaDepartment of Town & Country Planning, Kerala
11
Chapter 1PROFILE OF THE DISTRICT
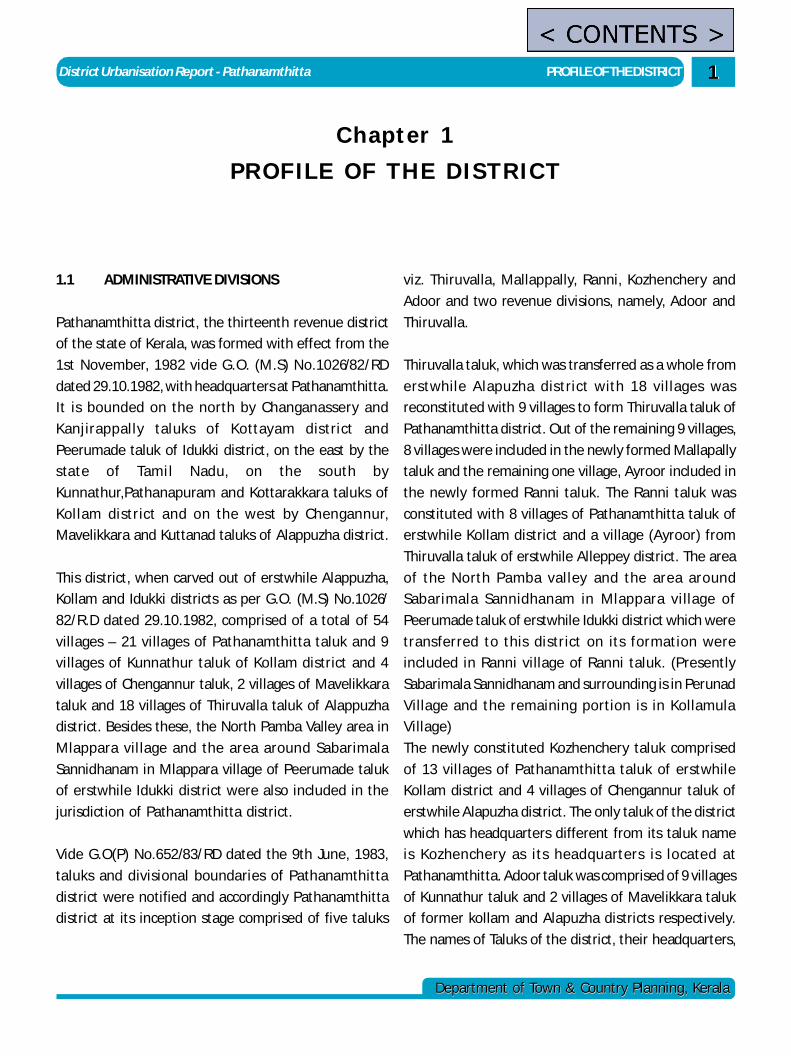
1.1 ADMINISTRATIVE DIVISIONS
Pathanamthitta district, the thirteenth revenue district
of the state of Kerala, was formed with effect from the
1st November, 1982 vide G.O. (M.S) No.1026/82/RD
dated 29.10.1982, with headquarters at Pathanamthitta.
It is bounded on the north by Changanassery and
Kanjirappally taluks of Kottayam district and
Peerumade taluk of Idukki district, on the east by the
state of Tamil Nadu, on the south by
Kunnathur,Pathanapuram and Kottarakkara taluks of
Kollam district and on the west by Chengannur,
Mavelikkara and Kuttanad taluks of Alappuzha district.
This district, when carved out of erstwhile Alappuzha,
Kollam and Idukki districts as per G.O. (M.S) No.1026/
82/R.D dated 29.10.1982, comprised of a total of 54
villages – 21 villages of Pathanamthitta taluk and 9
villages of Kunnathur taluk of Kollam district and 4
villages of Chengannur taluk, 2 villages of Mavelikkara
taluk and 18 villages of Thiruvalla taluk of Alappuzha
district. Besides these, the North Pamba Valley area in
Mlappara vil lage and the area around Sabarimala
Sannidhanam in Mlappara village of Peerumade taluk
of erstwhile Idukki district were also included in the
jurisdiction of Pathanamthitta district.
Vide G.O(P) No.652/83/RD dated the 9th June, 1983,
taluks and divisional boundaries of Pathanamthitta
district were notified and accordingly Pathanamthitta
district at its inception stage comprised of five taluks
viz. Thiruvalla, Mallappally, Ranni, Kozhenchery and
Adoor and two revenue divisions, namely, Adoor and
Thiruvalla.
Thiruvalla taluk, which was transferred as a whole from
erstwhile Alapuzha district with 18 villages was
reconstituted with 9 villages to form Thiruvalla taluk of
Pathanamthitta district. Out of the remaining 9 villages,
8 villages were included in the newly formed Mallapally
taluk and the remaining one village, Ayroor included in
the newly formed Ranni taluk. The Ranni taluk was
constituted with 8 villages of Pathanamthitta taluk of
erstwhile Kollam district and a village (Ayroor) from
Thiruvalla taluk of erstwhile Alleppey district. The area
of the North Pamba valley and the area around
Sabarimala Sannidhanam in Mlappara village of
Peerumade taluk of erstwhile Idukki district which were
transferred to this district on its formation were
included in Ranni village of Ranni taluk. (Presently
Sabarimala Sannidhanam and surrounding is in Perunad
Village and the remaining portion is in Kollamula
Village)
The newly constituted Kozhenchery taluk comprised
of 13 villages of Pathanamthitta taluk of erstwhile
Kollam district and 4 villages of Chengannur taluk of
erstwhile Alapuzha district. The only taluk of the district
which has headquarters different from its taluk name
is Kozhenchery as its headquarters is located at
Pathanamthitta. Adoor taluk was comprised of 9 villages
of Kunnathur taluk and 2 villages of Mavelikkara taluk
of former kollam and Alapuzha districts respectively.
The names of Taluks of the district, their headquarters,
admin
Text Box
< CONTENTS >
PROFILE OF THE DISTRICT District Urbanisation Report - Pathanamthitta22
Department of Town & Country Planning, KeralaDepartment of Town & Country Planning, Kerala
TABLE 1.2 Block Panchayats and Headquarters
Sl. No. Name of the Block Population 2001 Block Panchayat Name of Grama Panchayat / Panchayats (No.) Headquarters Muncipality where Block
Panchayat HQ situated
1 Elanthoor 108255 Elanthoor Elanthoor Grama Panchayat
2 Parakkod 208228 Parakkod Adoor Municipality.
3 Koipram 125377 Pullad Koipram Grama Panchayat
4 Konni 146937 Ilakolloor Pramadom Grama Panchayat
5 Kulanada 69710 Kulanada Kulanada Grama Panchayat
6 Pandalam 67071 Pandalam Pandalam Grama Panchayat
7 Mallappally 120201 Mallappally Mallappally Grama Panchayat
8 Ranni 172691 Mandirampadi Ranni Grama Panchayat
9 Pulikkeezh 91748 Valanjavattom Kadapra Grama Panchayat
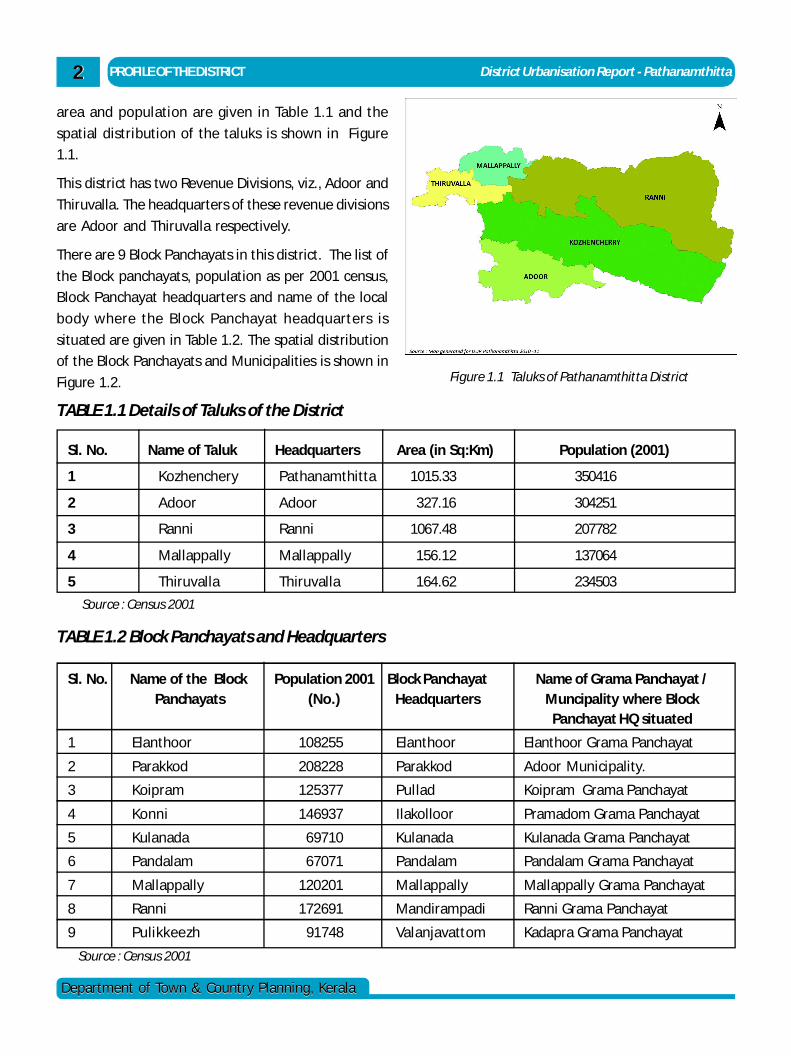
area and population are given in Table 1.1 and the
spatial distribution of the taluks is shown in Figure
1.1.
This district has two Revenue Divisions, viz., Adoor and
Thiruvalla. The headquarters of these revenue divisions
are Adoor and Thiruvalla respectively.
There are 9 Block Panchayats in this district. The list of
the Block panchayats, population as per 2001 census,
Block Panchayat headquarters and name of the local
body where the Block Panchayat headquarters is
situated are given in Table 1.2. The spatial distribution
of the Block Panchayats and Municipalities is shown in
Figure 1.2.
TABLE 1.1 Details of Taluks of the District
Source : Census 2001
Sl. No. Name of Taluk Headquarters Area (in Sq:Km) Population (2001)
1 Kozhenchery Pathanamthitta 1015.33 350416
2 Adoor Adoor 327.16 304251
3 Ranni Ranni 1067.48 207782
4 Mallappally Mallappally 156.12 137064
5 Thiruvalla Thiruvalla 164.62 234503
Source : Census 2001
Figure 1.1 Taluks of Pathanamthitta District
District Urbanisation Report - Pathanamthitta PROFILE OF THE DISTRICT
Department of Town & Country Planning, KeralaDepartment of Town & Country Planning, Kerala
33
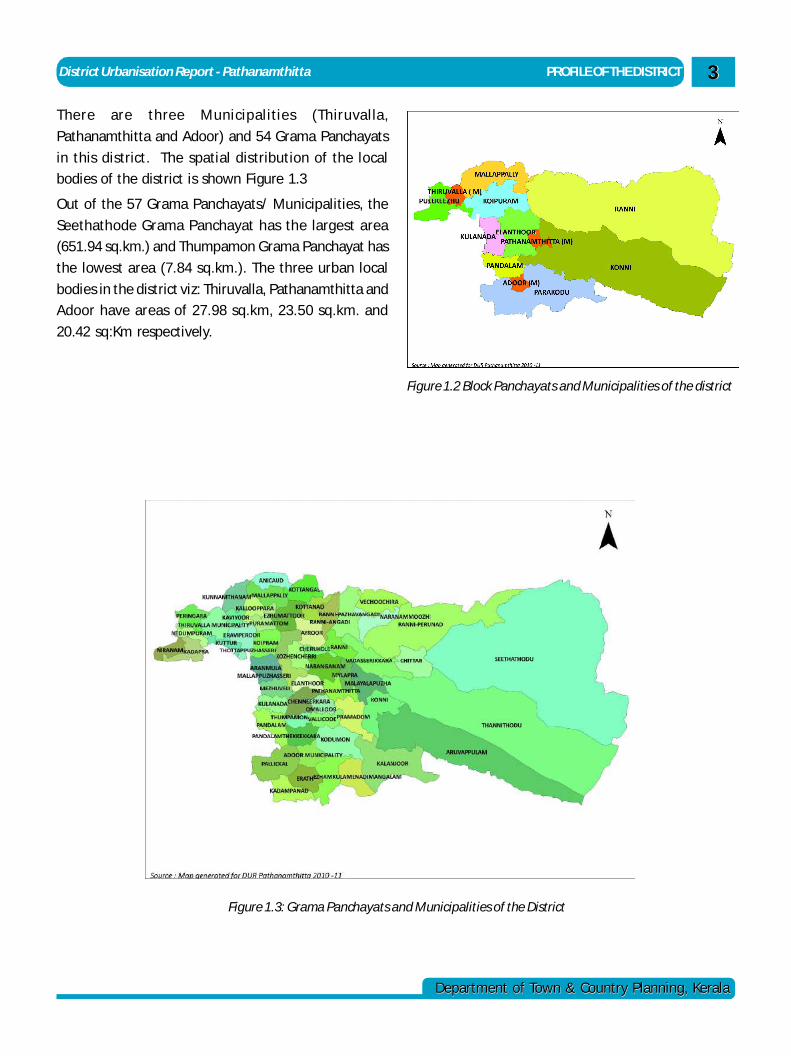
There are three Municipalities (Thiruvalla,
Pathanamthitta and Adoor) and 54 Grama Panchayats
in this district. The spatial distribution of the local
bodies of the district is shown Figure 1.3
Out of the 57 Grama Panchayats/ Municipalities, the
Seethathode Grama Panchayat has the largest area
(651.94 sq.km.) and Thumpamon Grama Panchayat has
the lowest area (7.84 sq.km.). The three urban local
bodies in the district viz: Thiruvalla, Pathanamthitta and
Adoor have areas of 27.98 sq.km, 23.50 sq.km. and
20.42 sq:Km respectively.
Figure 1.2 Block Panchayats and Municipalities of the district
Figure 1.3: Grama Panchayats and Municipalities of the District
PROFILE OF THE DISTRICT District Urbanisation Report - Pathanamthitta44
Department of Town & Country Planning, KeralaDepartment of Town & Country Planning, Kerala
1.2 AREA AND POPULATION
The total geographical area of Pathanamthitta district
is 2637 Sq;km, which accounts about 6% of the
geographical area of the state. The total population as
per 2001 census is 12,34,016 which is about 3% of total
population of the state. . The district placed in the 11th
position as far as the population size is concerned. The
population density of the district is 467 persons per
sq;km, which is below the state average of 819 persons
per Sq;km and ranked 12th among the districts of the
state as far as the population density concerned.
1.3 PHYSIOGRAPHY
The district slopes from east to west. The three major
categories of physiographic divisions seen in
Pathanamthitta district are lowland (areas below 7.5m
from MSL), midland (areas between 7.5m and 75m
above MSL) and highland (areas more than 75m above
MSL). The low land areas are seen in the western parts
of Thiruvalla Taluk and the highland areas are mainly in
Ranni and
Kozhencherry Taluks.
The midland areas are
seen in Thiruvalla,
M a l l a p p a l l y ,
Kozhencherry and
Adoor Taluks.
1.4 PHYSICAL
FEATURES:
1.4.1 Natural Sub-
Divisions:
Pathanamthitta is a
land locked district. The
western part of the
district (part of
Thiruvalla taluk) falls in
the upper Kuttanad
region of the state. The
eastern part of the
district is mainly hilly areas with dense reserve forest.
The district can be divided into three natural
geographical regions: the highland, the midland and
the lowland. The highland stretches through the
Western Ghats, where the hills are tall and covered
with thick forests. Western Ghats maintains an average
altitude of around 800 m. It descends to the smaller
hills of midland in the centre and finally to the lowland.
The lowland with its abundance of coconut trees lies
along the eastern borders of Alappuzha district.
1.4.2 Climate:
The climate of this district is tropical humid. The hot
season is from March to May and it is followed by South
West monsoon season from June to September. The
period from December to February is the North West
monsoon season. The average annual temperature is
26.61o C with mean maximum temperature 31.7o C and
minimum 21.4oC. The average annual rainfall is 3120
mm.
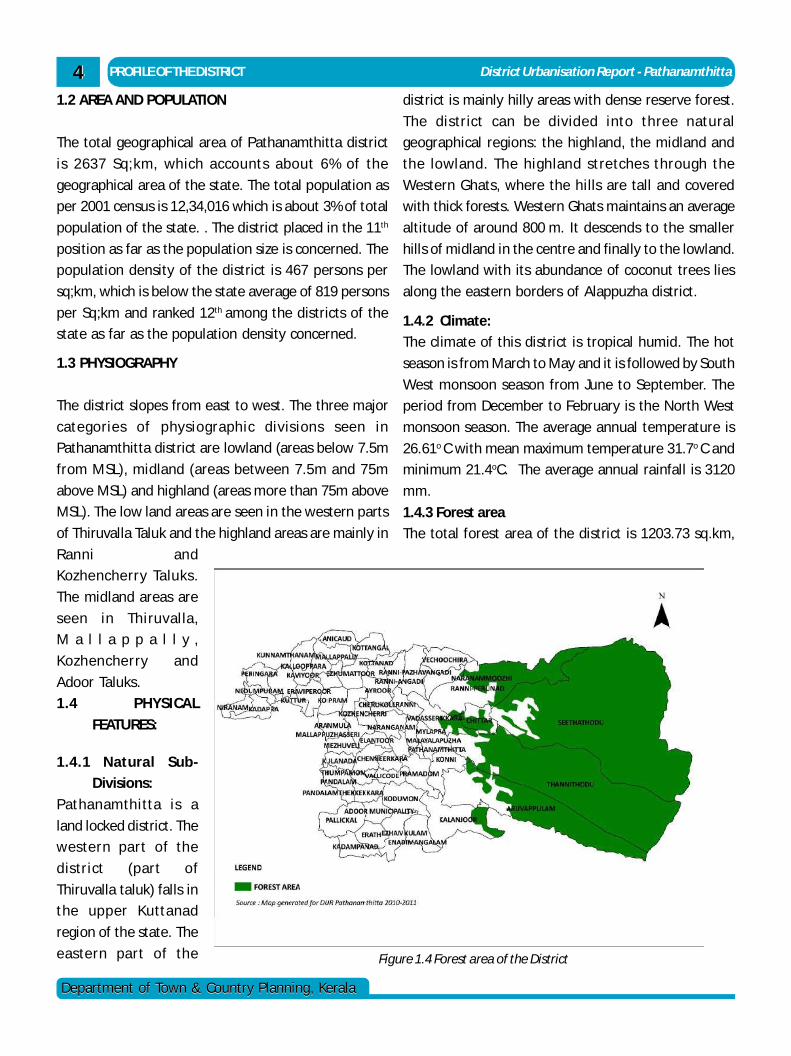
1.4.3 Forest area
The total forest area of the district is 1203.73 sq.km,
Figure 1.4 Forest area of the District
District Urbanisation Report - Pathanamthitta PROFILE OF THE DISTRICT
Department of Town & Country Planning, KeralaDepartment of Town & Country Planning, Kerala
55
which is 45.34% of the total
geographical area of the
district. Figure 1.4 shows the
spatial distribution of forest
area of Pathanamthitta
District. The forest area lies
in Kozhanchery and Ranni
taluks
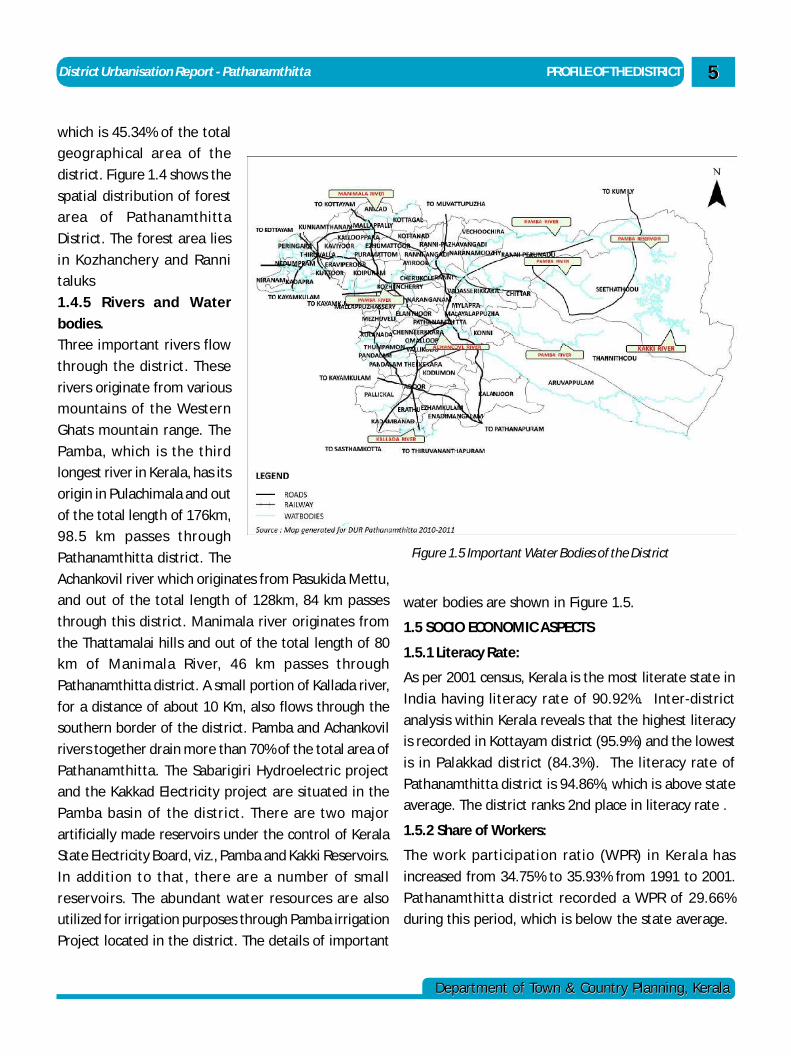
1.4.5 Rivers and Water
bodies.
Three important rivers flow
through the district. These
rivers originate from various
mountains of the Western
Ghats mountain range. The
Pamba, which is the third
longest river in Kerala, has its
origin in Pulachimala and out
of the total length of 176km,
98.5 km passes through
Pathanamthitta district. The
Achankovil river which originates from Pasukida Mettu,
and out of the total length of 128km, 84 km passes
through this district. Manimala river originates from
the Thattamalai hills and out of the total length of 80
km of Manimala River, 46 km passes through
Pathanamthitta district. A small portion of Kallada river,
for a distance of about 10 Km, also flows through the
southern border of the district. Pamba and Achankovil
rivers together drain more than 70% of the total area of
Pathanamthitta. The Sabarigiri Hydroelectric project
and the Kakkad Electricity project are situated in the
Pamba basin of the district. There are two major
artificially made reservoirs under the control of Kerala
State Electricity Board, viz., Pamba and Kakki Reservoirs.
In addition to that, there are a number of small
reservoirs. The abundant water resources are also
utilized for irrigation purposes through Pamba irrigation
Project located in the district. The details of important
water bodies are shown in Figure 1.5.
1.5 SOCIO ECONOMIC ASPECTS
1.5.1 Literacy Rate:
As per 2001 census, Kerala is the most literate state in
India having literacy rate of 90.92%. Inter-district
analysis within Kerala reveals that the highest literacy
is recorded in Kottayam district (95.9%) and the lowest
is in Palakkad district (84.3%). The literacy rate of
Pathanamthitta district is 94.86%, which is above state
average. The district ranks 2nd place in literacy rate .
1.5.2 Share of Workers:
The work participation ratio (WPR) in Kerala has
increased from 34.75% to 35.93% from 1991 to 2001.
Pathanamthitta district recorded a WPR of 29.66%
during this period, which is below the state average.
Figure 1.5 Important Water Bodies of the District
PROFILE OF THE DISTRICT District Urbanisation Report - Pathanamthitta66
Department of Town & Country Planning, KeralaDepartment of Town & Country Planning, Kerala
1.5.3 Gross State Domestic Product (GSDP):
GSDP district wise distribution as factor cost shows that
the Ernakulam district continues to have highest
income of Rs.33361.25 crore in 2009-10, while lowest
gross domestic product was recorded in Wayanad
district (Rs. 4378.24 crore). The GSDP of Pathanamthitta
district is Rs. 9008.78 crore, (3.91% of total GSDP of
State).
1.5.4 Per Capita Income (PCI):
The per capita income of Pathanamthitta has increased
from Rs.51752 in 2008-09 to Rs.56944 in 2009-10 with
growth rate of 10.13%. Compared to the state figure
the PCI is above the state average (ie, Rs.52984). With
respect to PCI, Pathanamthitta ranks 4th position in the
state.
1.6 INFERENCE
Pathanamthitta was formed in the year 1982. The
district has only 11th rank as far as the population size is
concerned and the density of population is less than
the state average. The physiography of the district
deserves special mention as it has all the three
divisions, namely high land, mid land and low land.
45.34 % of the geographical area of the district is forest.
The district has abundant water resources. The district
is one of the highly literate districts of the state. The
per capita income of the district is above the state
average.
admin
Text Box
< CONTENTS >
admin
Text Box
CHAPTER 2 >>
District Urbanisation Report - Pathanamthitta HISTORY AND REGIONAL LINKAGES
Department of Town & Country Planning, KeralaDepartment of Town & Country Planning, Kerala
77
Chapter 2HISTORY AND REGIONAL LINKAGES
2.1 HISTORICAL BACKGROUND
Pathanamthitta is a combination of two words –
Pathanam and Thitta – which mean an array of houses
on the river side. It is presumed that the region
presently under the district was formerly under the
Pandalam reign which had connections with the Pandya
Kingdom. The history of the district is sandwiched
between the history of erstwhile Quilon and Alleppey
districts. The pre-historic period of the district is
obscure. But some megalithic monuments such as the
dolmens, found in the Ranni reserve forest and
Enadimangalam village of present Adoor taluk, date
back to the Neolithic period. Yet some old relics,
reminiscent of pre-historic period, are found also in
some areas of Thiruvalla and Kadapra. Some
archaeological antiquities in the form of architecture,
inscriptions, mural paintings, historical monuments,
etc, found in the temples, rock-cut caves, churches,
etc. show clear picture about the historic period.
During the 1st century A.D, almost all the portions of
Quilon district formed a part of Ay Kingdom. The
southeastern portions upto Thiruvalla of erstwhile
Alleppey district were ruled by Ay kingdom with their
headquarters at South Travancore. The Kaviyoor Cave
Temple of Pallava style of architecture is some of the
earliest specimen of stone sculpture supposed to be
made in the 7th to the 9th century A.D. The inscriptions
engraved on the central shrine of Kaviyoor temple
depict details of the area in the Kali era of 4051 A.D and
4052 A.D. There are some epigraphical records assigned
to post-Portuguese period in the Orthodox Syrian
Church at Niranam. It is significant to note that Pliny,
the famous traveler of the 1st century A.D had described
in his famous book ‘Pereplus’ about Niranam
(Neleynda), the river Pamba (Baris) and about the
exporting pepper from Thiruvalla. Christianity had a
strong foothold in the district from the middle of the
1st century. In A.D 52, St. Thomas, one of the twelve
Apostles of Jesus Christ, landed at Mallankara and
founded seven churches in Malabar coast, one of which
is located at Niranam.
From the 9th to the 12th century A.D, Thiruvalla taluk
of the then Alleppey district was part of Nantuzhainad
and later it was merged to Odanad and subsequently
with Thekkumkur. In the early 19th century during the
reign of Balarama Varma and Velu Thampi Dalava, who
took keen interest in uplifting Quilon as an
administrative as well as commercial centre, organized
a rebellion at Quilon against the British force. As a result
of Kundara Proclamation issued by the Dalava on the
16th January 1809, thousands of people marched under
the banner of Velu Thampi Dalava. The British defeated
the local force and captured the fort of Udayagiri and
Padmanahbapuram. The ruler of Travancore became
helpless and ordered to capture the Dalava. Velu
Thampi Dalava decided not to surrender alive and
committed suicide at Mannadi in Kadampanadu village
of present Adoor taluk. During the reign of Rani
Parvathy Bai, Pandalam was annexed to Travancore in
1812 AD. The old principality here was known as Airur
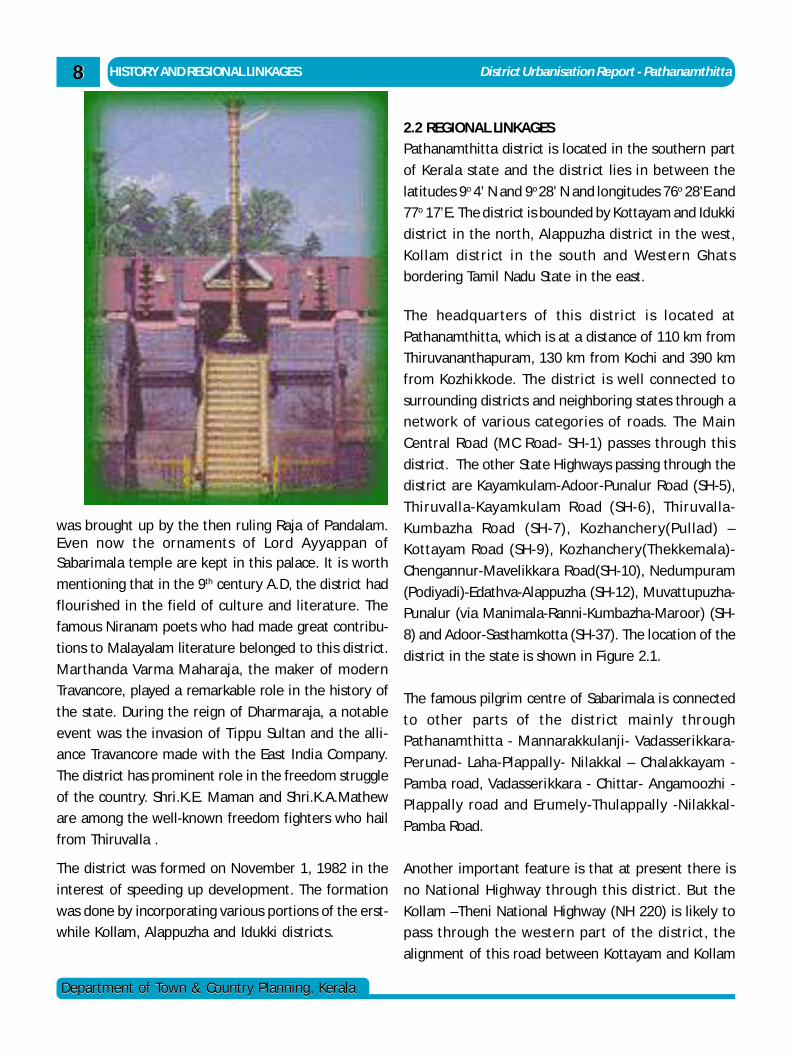
Swarupam.The palace of Pandalam Raja is closely associated withSabarimala temple. It is believed that Sree Ayyappan
admin
Text Box
<< CHAPTER 1
admin
Text Box
< CONTENTS >
HISTORY AND REGIONAL LINKAGES District Urbanisation Report - Pathanamthitta88
Department of Town & Country Planning, KeralaDepartment of Town & Country Planning, Kerala
was brought up by the then ruling Raja of Pandalam.Even now the ornaments of Lord Ayyappan ofSabarimala temple are kept in this palace. It is worth
mentioning that in the 9th century A.D, the district had
flourished in the field of culture and literature. The
famous Niranam poets who had made great contribu-
tions to Malayalam literature belonged to this district.
Marthanda Varma Maharaja, the maker of modern
Travancore, played a remarkable role in the history of
the state. During the reign of Dharmaraja, a notable
event was the invasion of Tippu Sultan and the alli-
ance Travancore made with the East India Company.
The district has prominent role in the freedom struggle
of the country. Shri.K.E. Maman and Shri.K.A.Mathew
are among the well-known freedom fighters who hail
from Thiruvalla .
The district was formed on November 1, 1982 in the
interest of speeding up development. The formation
was done by incorporating various portions of the erst-
while Kollam, Alappuzha and Idukki districts.
2.2 REGIONAL LINKAGES
Pathanamthitta district is located in the southern part
of Kerala state and the district lies in between the
latitudes 9o 4’ N and 9o 28’ N and longitudes 76o 28’E and
77o 17’E. The district is bounded by Kottayam and Idukki
district in the north, Alappuzha district in the west,
Kollam district in the south and Western Ghats
bordering Tamil Nadu State in the east.
The headquarters of this district is located at
Pathanamthitta, which is at a distance of 110 km from
Thiruvananthapuram, 130 km from Kochi and 390 km
from Kozhikkode. The district is well connected to
surrounding districts and neighboring states through a
network of various categories of roads. The Main
Central Road (MC Road- SH-1) passes through this
district. The other State Highways passing through the
district are Kayamkulam-Adoor-Punalur Road (SH-5),
Thiruvalla-Kayamkulam Road (SH-6), Thiruvalla-
Kumbazha Road (SH-7), Kozhanchery(Pullad) –
Kottayam Road (SH-9), Kozhanchery(Thekkemala)-
Chengannur-Mavelikkara Road(SH-10), Nedumpuram
(Podiyadi)-Edathva-Alappuzha (SH-12), Muvattupuzha-
Punalur (via Manimala-Ranni-Kumbazha-Maroor) (SH-
8) and Adoor-Sasthamkotta (SH-37). The location of the
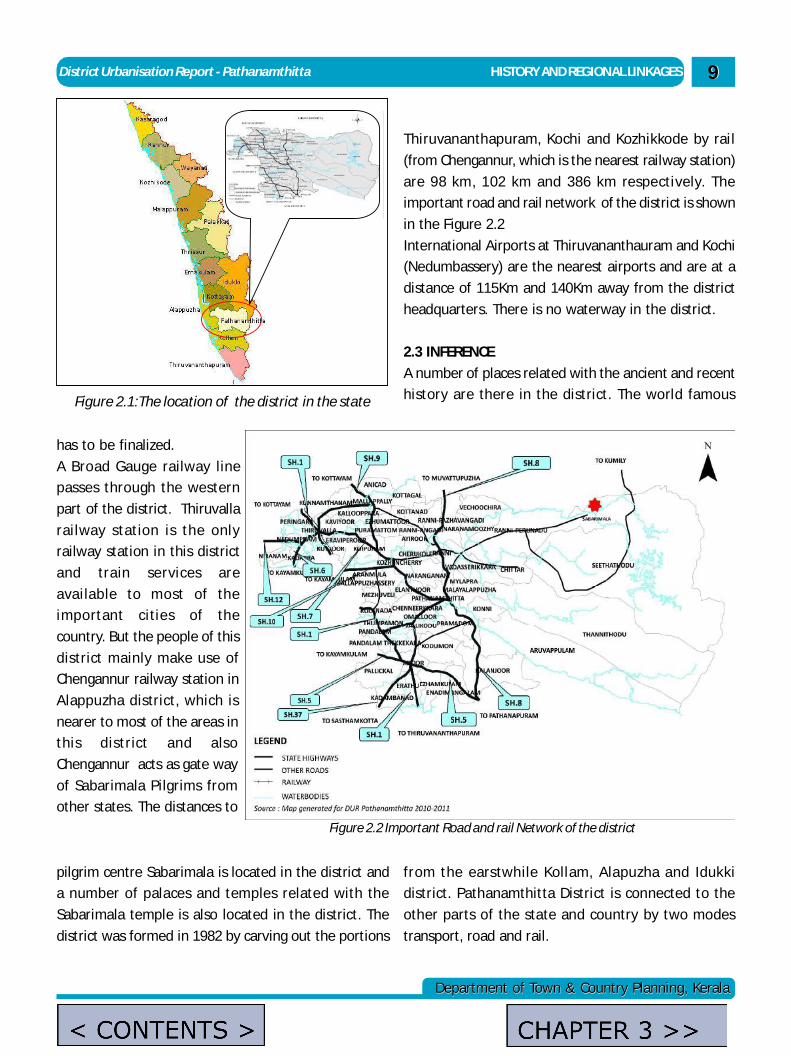
district in the state is shown in Figure 2.1.
The famous pilgrim centre of Sabarimala is connected
to other parts of the district mainly through
Pathanamthitta - Mannarakkulanji- Vadasserikkara-
Perunad- Laha-Plappally- Nilakkal – Chalakkayam -
Pamba road, Vadasserikkara - Chittar- Angamoozhi -
Plappally road and Erumely-Thulappally -Nilakkal-
Pamba Road.
Another important feature is that at present there is
no National Highway through this district. But the
Kollam –Theni National Highway (NH 220) is likely to
pass through the western part of the district, the
alignment of this road between Kottayam and Kollam
District Urbanisation Report - Pathanamthitta HISTORY AND REGIONAL LINKAGES
Department of Town & Country Planning, KeralaDepartment of Town & Country Planning, Kerala
99
has to be finalized.
A Broad Gauge railway line
passes through the western
part of the district. Thiruvalla
railway station is the only
railway station in this district
and train services are
available to most of the
important cities of the
country. But the people of this
district mainly make use of
Chengannur railway station in
Alappuzha district, which is
nearer to most of the areas in
this district and also
Chengannur acts as gate way
of Sabarimala Pilgrims from
other states. The distances to
Thiruvananthapuram, Kochi and Kozhikkode by rail
(from Chengannur, which is the nearest railway station)
are 98 km, 102 km and 386 km respectively. The
important road and rail network of the district is shown
in the Figure 2.2
International Airports at Thiruvananthauram and Kochi
(Nedumbassery) are the nearest airports and are at a
distance of 115Km and 140Km away from the district
headquarters. There is no waterway in the district.
2.3 INFERENCE
A number of places related with the ancient and recent
history are there in the district. The world famous
Figure 2.2 Important Road and rail Network of the district
Figure 2.1:The location of the district in the state
pilgrim centre Sabarimala is located in the district and
a number of palaces and temples related with the
Sabarimala temple is also located in the district. The
district was formed in 1982 by carving out the portions
from the earstwhile Kollam, Alapuzha and Idukki
district. Pathanamthitta District is connected to the
other parts of the state and country by two modes
transport, road and rail.
admin
Text Box
CHAPTER 3 >>
admin
Text Box
< CONTENTS >
POPULATION District Urbanisation Report - Pathanamthitta1010
Department of Town & Country Planning, KeralaDepartment of Town & Country Planning, Kerala
Chapter 3
POPULATION
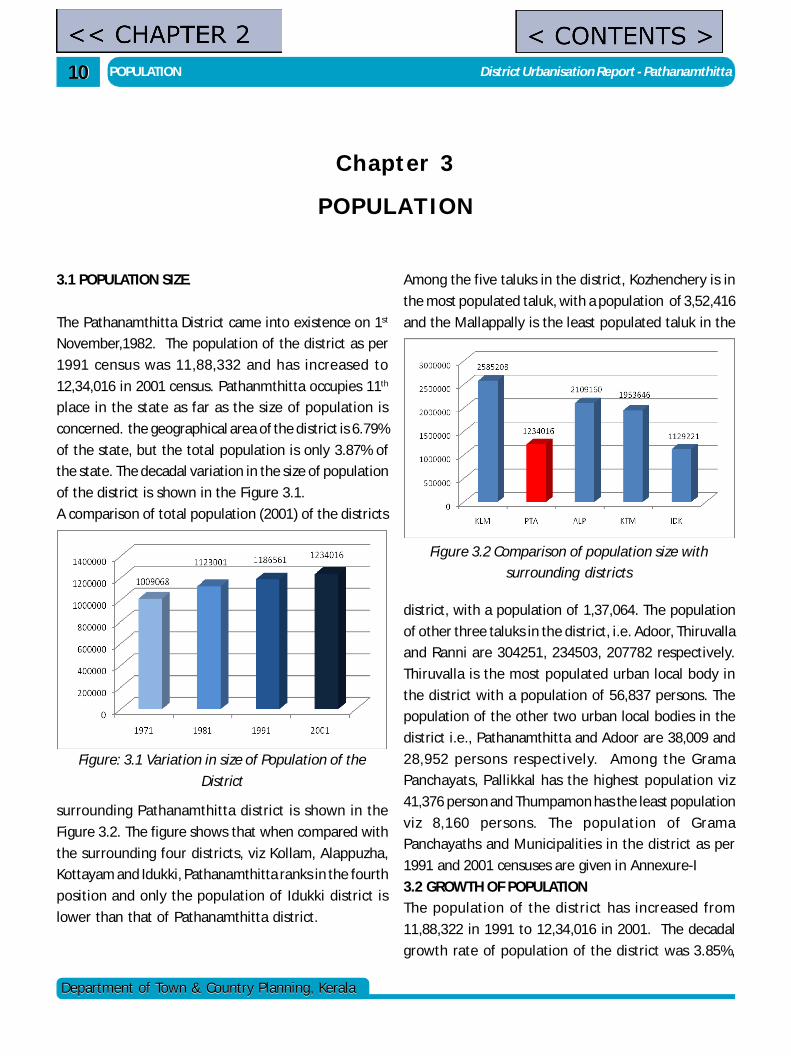
3.1 POPULATION SIZE.
The Pathanamthitta District came into existence on 1st
November,1982. The population of the district as per
1991 census was 11,88,332 and has increased to
12,34,016 in 2001 census. Pathanmthitta occupies 11th
place in the state as far as the size of population is
concerned. the geographical area of the district is 6.79%
of the state, but the total population is only 3.87% of
the state. The decadal variation in the size of population
of the district is shown in the Figure 3.1.
A comparison of total population (2001) of the districts
surrounding Pathanamthitta district is shown in the
Figure 3.2. The figure shows that when compared with
the surrounding four districts, viz Kollam, Alappuzha,
Kottayam and Idukki, Pathanamthitta ranks in the fourth
position and only the population of Idukki district is
lower than that of Pathanamthitta district.
Among the five taluks in the district, Kozhenchery is in
the most populated taluk, with a population of 3,52,416
and the Mallappally is the least populated taluk in the
district, with a population of 1,37,064. The population
of other three taluks in the district, i.e. Adoor, Thiruvalla
and Ranni are 304251, 234503, 207782 respectively.
Thiruvalla is the most populated urban local body in
the district with a population of 56,837 persons. The
population of the other two urban local bodies in the
district i.e., Pathanamthitta and Adoor are 38,009 and
28,952 persons respectively. Among the Grama
Panchayats, Pallikkal has the highest population viz
41,376 person and Thumpamon has the least population
viz 8,160 persons. The population of Grama
Panchayaths and Municipalities in the district as per
1991 and 2001 censuses are given in Annexure-I
3.2 GROWTH OF POPULATION
The population of the district has increased from
11,88,322 in 1991 to 12,34,016 in 2001. The decadal
growth rate of population of the district was 3.85%,
Figure: 3.1 Variation in size of Population of the
District
Figure 3.2 Comparison of population size with
surrounding districts
admin
Text Box
<< CHAPTER 2
admin
Text Box
< CONTENTS >
District Urbanisation Report - Pathanamthitta POPULATION
Department of Town & Country Planning, KeralaDepartment of Town & Country Planning, Kerala
1111
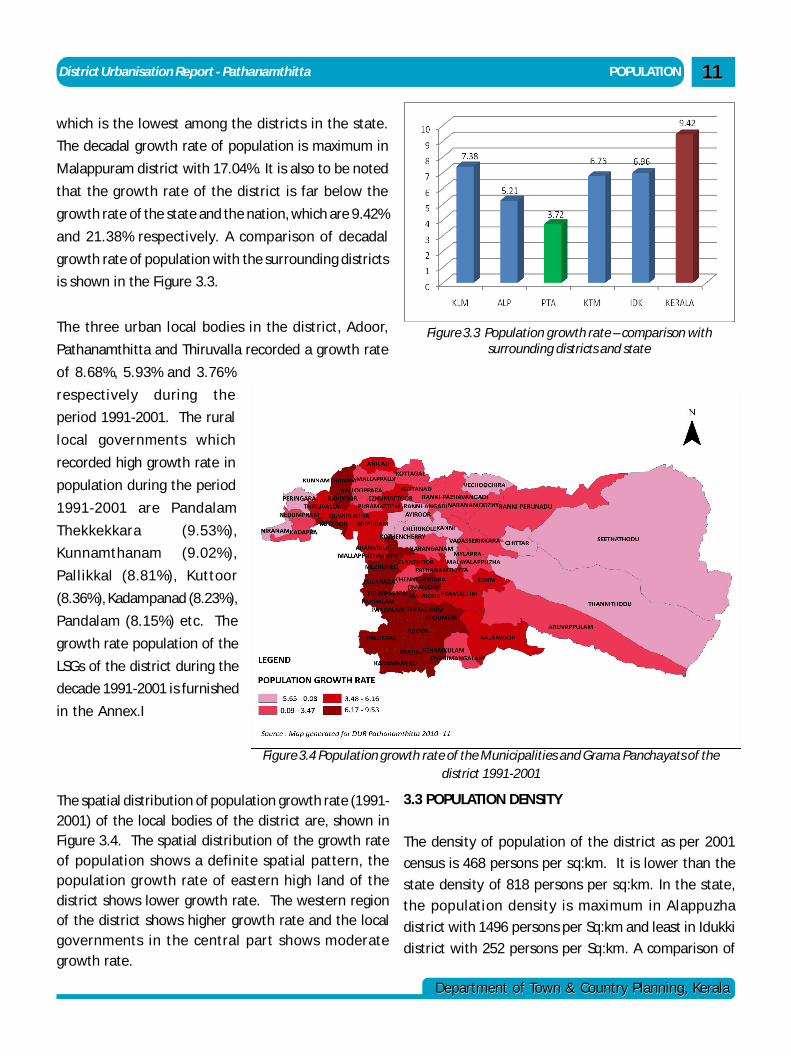
which is the lowest among the districts in the state.
The decadal growth rate of population is maximum in
Malappuram district with 17.04%. It is also to be noted
that the growth rate of the district is far below the
growth rate of the state and the nation, which are 9.42%
and 21.38% respectively. A comparison of decadal
growth rate of population with the surrounding districts
is shown in the Figure 3.3.
The three urban local bodies in the district, Adoor,
Pathanamthitta and Thiruvalla recorded a growth rate
of 8.68%, 5.93% and 3.76%
respectively during the
period 1991-2001. The rural
local governments which
recorded high growth rate in
population during the period
1991-2001 are Pandalam
Thekkekkara (9.53%),
Kunnamthanam (9.02%),
Pallikkal (8.81%), Kuttoor
(8.36%), Kadampanad (8.23%),
Pandalam (8.15%) etc. The
growth rate population of the
LSGs of the district during the
decade 1991-2001 is furnished
in the Annex.I
Figure 3.3 Population growth rate – comparison withsurrounding districts and state
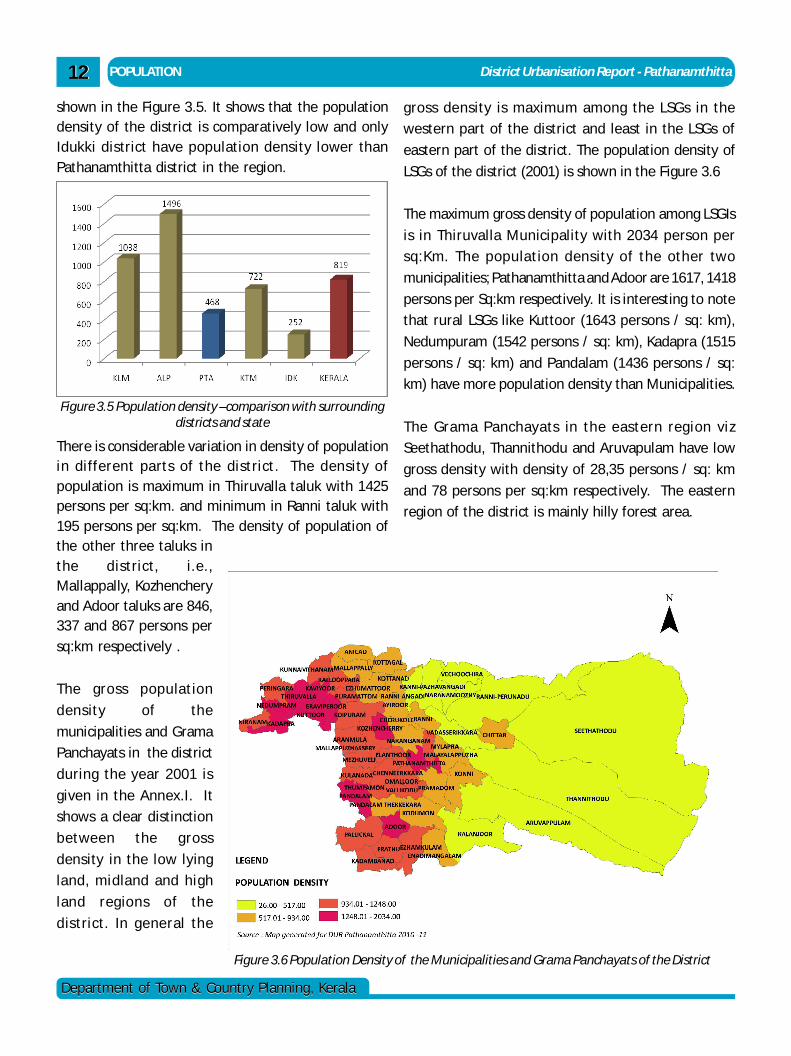
3.3 POPULATION DENSITY
The density of population of the district as per 2001
census is 468 persons per sq:km. It is lower than the
state density of 818 persons per sq:km. In the state,
the population density is maximum in Alappuzha
district with 1496 persons per Sq:km and least in Idukki
district with 252 persons per Sq:km. A comparison of
Figure 3.4 Population growth rate of the Municipalities and Grama Panchayats of thedistrict 1991-2001
The spatial distribution of population growth rate (1991-2001) of the local bodies of the district are, shown inFigure 3.4. The spatial distribution of the growth rateof population shows a definite spatial pattern, thepopulation growth rate of eastern high land of thedistrict shows lower growth rate. The western regionof the district shows higher growth rate and the localgovernments in the central part shows moderategrowth rate.
POPULATION District Urbanisation Report - Pathanamthitta1212
Department of Town & Country Planning, KeralaDepartment of Town & Country Planning, Kerala
shown in the Figure 3.5. It shows that the populationdensity of the district is comparatively low and onlyIdukki district have population density lower thanPathanamthitta district in the region.
gross density is maximum among the LSGs in the
western part of the district and least in the LSGs of
eastern part of the district. The population density of
LSGs of the district (2001) is shown in the Figure 3.6
The maximum gross density of population among LSGIs
is in Thiruvalla Municipality with 2034 person per
sq:Km. The population density of the other two
municipalities; Pathanamthitta and Adoor are 1617, 1418
persons per Sq:km respectively. It is interesting to note
that rural LSGs like Kuttoor (1643 persons / sq: km),
Nedumpuram (1542 persons / sq: km), Kadapra (1515
persons / sq: km) and Pandalam (1436 persons / sq:
km) have more population density than Municipalities.
The Grama Panchayats in the eastern region viz
Seethathodu, Thannithodu and Aruvapulam have low
gross density with density of 28,35 persons / sq: km
and 78 persons per sq:km respectively. The eastern
region of the district is mainly hilly forest area.
There is considerable variation in density of populationin different parts of the district. The density ofpopulation is maximum in Thiruvalla taluk with 1425persons per sq:km. and minimum in Ranni taluk with195 persons per sq:km. The density of population ofthe other three taluks inthe district, i.e.,Mallappally, Kozhencheryand Adoor taluks are 846,337 and 867 persons persq:km respectively .
The gross population
density of the
municipalities and Grama
Panchayats in the district
during the year 2001 is
given in the Annex.I. It
shows a clear distinction
between the gross
density in the low lying
land, midland and high
land regions of the
district. In general the
Figure 3.5 Population density –comparison with Figure 3.5 Population density –comparison with surroundingdistricts and state
Figure 3.6 Population Density of the Municipalities and Grama Panchayats of the District
District Urbanisation Report - Pathanamthitta POPULATION
Department of Town & Country Planning, KeralaDepartment of Town & Country Planning, Kerala
1313
The Grama Panchayaths with high population density
are Kuttoor (1516 persons / sq: km); Nedumpuram (1515
persons / sq: km); Kadapra (1479 persons / sq: km);
Kozhenchery (1475 persons / sq: km); Pandalam (1328
persons / sq: km); Eraaviperoor (1317 persons / sq: km);
Kaviyoor (1287 persons / sq: km). These Grama
Panchayaths are located in the western or central parts
of the district and are located adjacent to urban area or
major travel corridor.
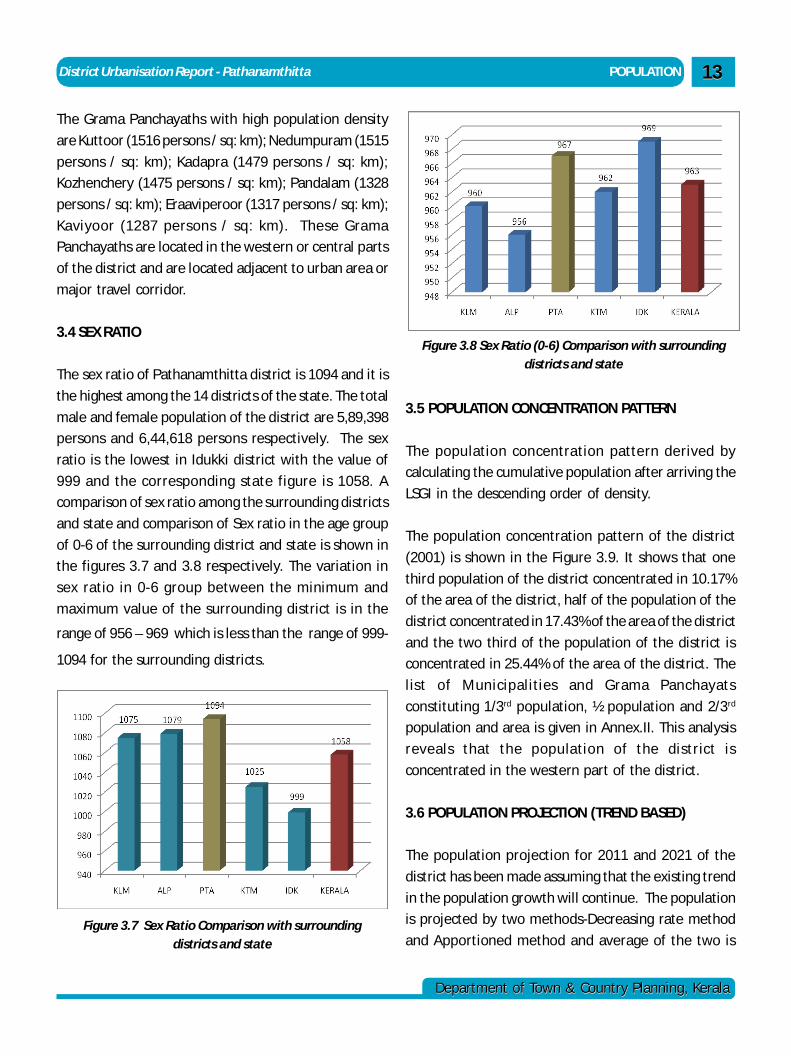
3.4 SEX RATIO
The sex ratio of Pathanamthitta district is 1094 and it is
the highest among the 14 districts of the state. The total
male and female population of the district are 5,89,398
persons and 6,44,618 persons respectively. The sex
ratio is the lowest in Idukki district with the value of
999 and the corresponding state figure is 1058. A
comparison of sex ratio among the surrounding districts
and state and comparison of Sex ratio in the age group
of 0-6 of the surrounding district and state is shown in
the figures 3.7 and 3.8 respectively. The variation in
sex ratio in 0-6 group between the minimum and
maximum value of the surrounding district is in the
range of 956 – 969 which is less than the range of 999-
1094 for the surrounding districts.
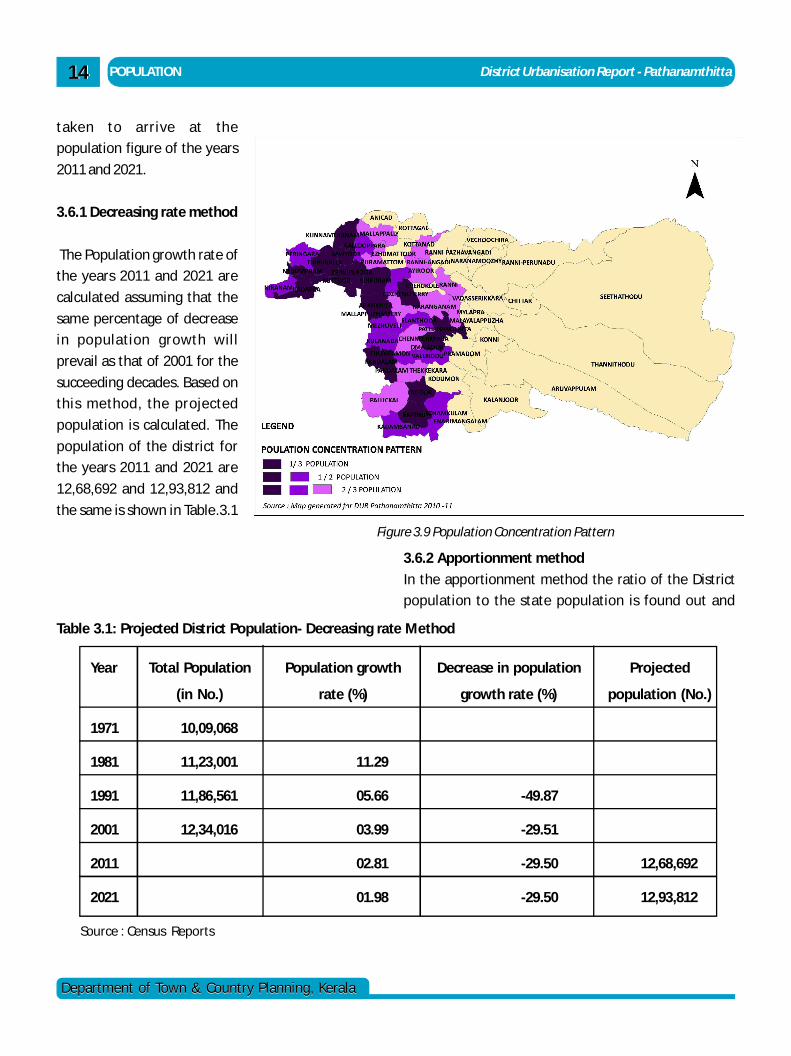
3.5 POPULATION CONCENTRATION PATTERN
The population concentration pattern derived by
calculating the cumulative population after arriving the
LSGI in the descending order of density.
The population concentration pattern of the district
(2001) is shown in the Figure 3.9. It shows that one
third population of the district concentrated in 10.17%
of the area of the district, half of the population of the
district concentrated in 17.43% of the area of the district
and the two third of the population of the district is
concentrated in 25.44% of the area of the district. The
list of Municipalities and Grama Panchayats
constituting 1/3rd population, ½ population and 2/3rd
population and area is given in Annex.II. This analysis
reveals that the population of the district is
concentrated in the western part of the district.
3.6 POPULATION PROJECTION (TREND BASED)
The population projection for 2011 and 2021 of the
district has been made assuming that the existing trend
in the population growth will continue. The population
is projected by two methods-Decreasing rate method
and Apportioned method and average of the two is
Figure 3.7 Sex Ratio Comparison with surrounding districts and state
Figure 3.8 Sex Ratio (0-6) Comparison with surrounding districts and state
POPULATION District Urbanisation Report - Pathanamthitta1414
Department of Town & Country Planning, KeralaDepartment of Town & Country Planning, Kerala
taken to arrive at the
population figure of the years
2011 and 2021.
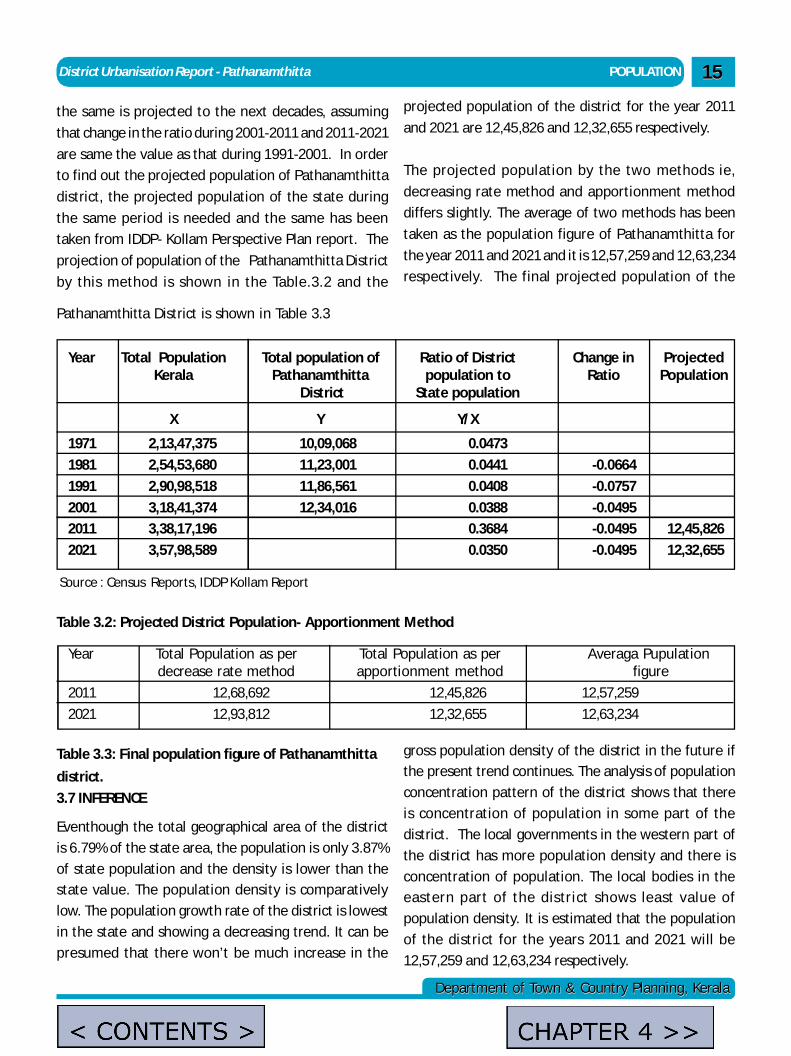
3.6.1 Decreasing rate method
The Population growth rate of
the years 2011 and 2021 are
calculated assuming that the
same percentage of decrease
in population growth will
prevail as that of 2001 for the
succeeding decades. Based on
this method, the projected
population is calculated. The
population of the district for
the years 2011 and 2021 are
12,68,692 and 12,93,812 and
the same is shown in Table.3.1
Year Total Population Population growth Decrease in population Projected
(in No.) rate (%) growth rate (%) population (No.)
1971 10,09,068
1981 11,23,001 11.29
1991 11,86,561 05.66 -49.87
2001 12,34,016 03.99 -29.51
2011 02.81 -29.50 12,68,692
2021 01.98 -29.50 12,93,812
Source : Census Reports
3.6.2 Apportionment method
In the apportionment method the ratio of the District
population to the state population is found out and
Table 3.1: Projected District Population- Decreasing rate Method
Figure 3.9 Population Concentration Pattern
District Urbanisation Report - Pathanamthitta POPULATION
Department of Town & Country Planning, KeralaDepartment of Town & Country Planning, Kerala
1515
the same is projected to the next decades, assuming
that change in the ratio during 2001-2011 and 2011-2021
are same the value as that during 1991-2001. In order
to find out the projected population of Pathanamthitta
district, the projected population of the state during
the same period is needed and the same has been
taken from IDDP- Kollam Perspective Plan report. The
projection of population of the Pathanamthitta District
by this method is shown in the Table.3.2 and the
Year Total Population Total population of Ratio of District Change in ProjectedKerala Pathanamthitta population to Ratio Population
District State population
X Y Y/X
1971 2,13,47,375 10,09,068 0.0473
1981 2,54,53,680 11,23,001 0.0441 -0.0664
1991 2,90,98,518 11,86,561 0.0408 -0.0757
2001 3,18,41,374 12,34,016 0.0388 -0.0495
2011 3,38,17,196 0.3684 -0.0495 12,45,826
2021 3,57,98,589 0.0350 -0.0495 12,32,655
Source : Census Reports, IDDP Kollam Report
Table 3.2: Projected District Population- Apportionment Method
Year Total Population as per Total Population as per Averaga Pupulationdecrease rate method apportionment method figure
2011 12,68,692 12,45,826 12,57,259
2021 12,93,812 12,32,655 12,63,234
projected population of the district for the year 2011
and 2021 are 12,45,826 and 12,32,655 respectively.
The projected population by the two methods ie,
decreasing rate method and apportionment method
differs slightly. The average of two methods has been
taken as the population figure of Pathanamthitta for
the year 2011 and 2021 and it is 12,57,259 and 12,63,234
respectively. The final projected population of the
gross population density of the district in the future ifthe present trend continues. The analysis of population
concentration pattern of the district shows that there
is concentration of population in some part of the
district. The local governments in the western part of
the district has more population density and there is
concentration of population. The local bodies in theeastern part of the district shows least value of
population density. It is estimated that the population
of the district for the years 2011 and 2021 will be
12,57,259 and 12,63,234 respectively.
Pathanamthitta District is shown in Table 3.3
Table 3.3: Final population figure of Pathanamthitta
district.
3.7 INFERENCE
Eventhough the total geographical area of the district
is 6.79% of the state area, the population is only 3.87%
of state population and the density is lower than thestate value. The population density is comparatively
low. The population growth rate of the district is lowest
in the state and showing a decreasing trend. It can be
presumed that there won’t be much increase in the
admin
Text Box
CHAPTER 4 >>
admin
Text Box
< CONTENTS >
OCCUPATIONAL STRUCTURE District Urbanisation Report - Pathanamthitta1616
Department of Town & Country Planning, KeralaDepartment of Town & Country Planning, Kerala
Chapter 4OCCUPATIONAL STRUCTURE
4.1 WORK FORCE OF THE DISTRICT
The work participation of a place is usually indicated
by work participation rate (WPR) which is the ratio of
total workers (main and marginal) to the total
population of the place and it is generally expressed as
a percentage. As per 2001 census, the work
participation rate of Pathanamthitta District is 29.66%.
This means that out of the total population of 12,31,577
persons of the district 3,66,049 persons are workers.
The work participation rate of Kerala State is 32.3% and
the Pathanamthitta district ranks 12th place in the state
as far as the Work Participation Rate is concerned and
only Malappuram (24%) and Kozhikode (28%) districts
are behind Pathanamthitta district. Among the districts
in the state, Idukki has the highest percentage of WPR
of 43% .
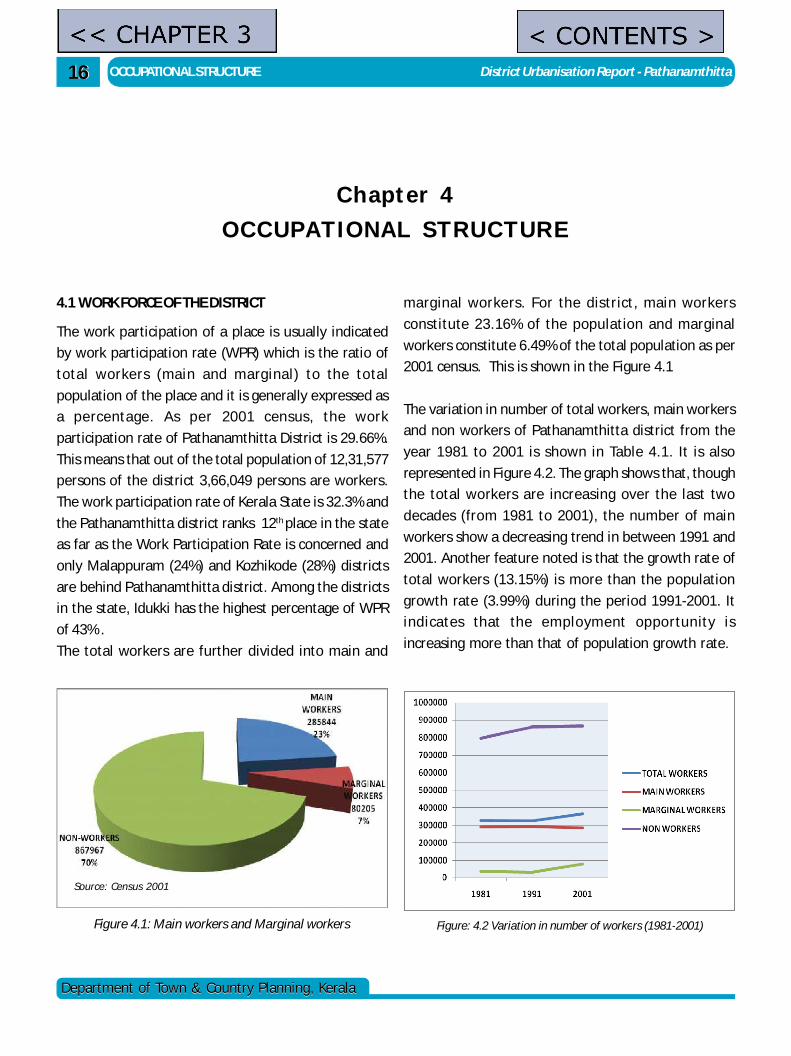
The total workers are further divided into main and
marginal workers. For the district, main workers
constitute 23.16% of the population and marginal
workers constitute 6.49% of the total population as per
2001 census. This is shown in the Figure 4.1
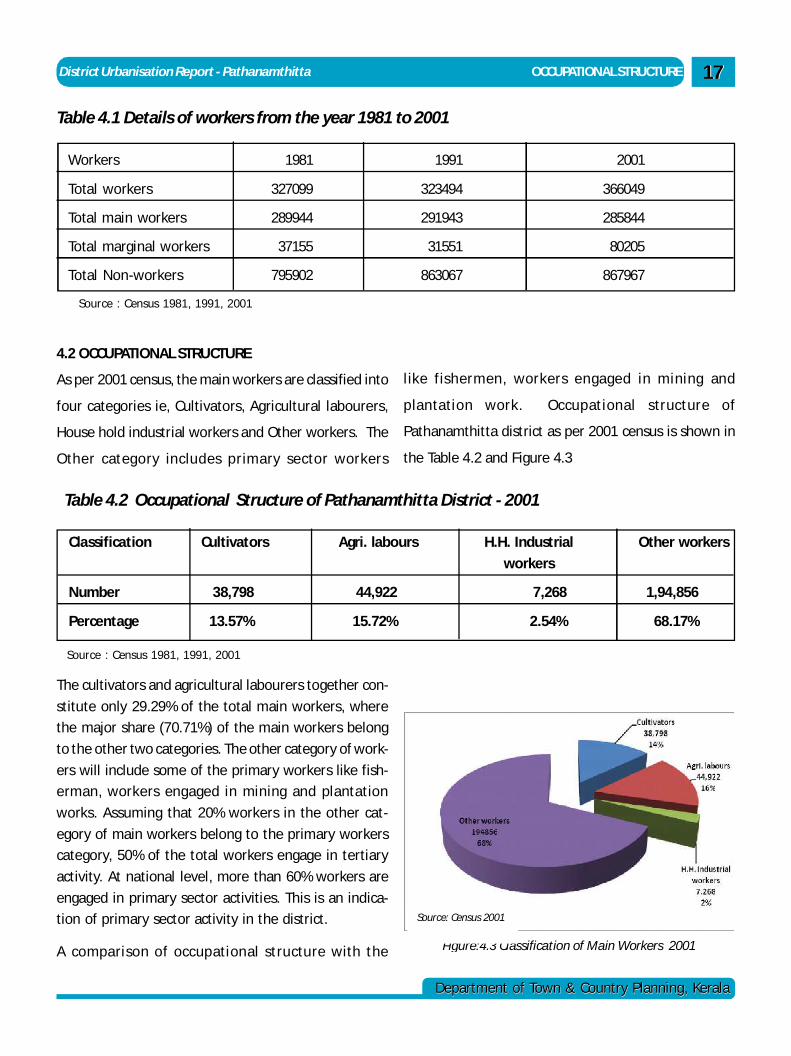
The variation in number of total workers, main workers
and non workers of Pathanamthitta district from the
year 1981 to 2001 is shown in Table 4.1. It is also
represented in Figure 4.2. The graph shows that, though
the total workers are increasing over the last two
decades (from 1981 to 2001), the number of main
workers show a decreasing trend in between 1991 and
2001. Another feature noted is that the growth rate of
total workers (13.15%) is more than the population
growth rate (3.99%) during the period 1991-2001. It
indicates that the employment opportunity is
increasing more than that of population growth rate.
Figure 4.1: Main workers and Marginal workers
Source: Census 2001
Figure: 4.2 Variation in number of workers (1981-2001)
admin
Text Box
<< CHAPTER 3
admin
Text Box
< CONTENTS >
District Urbanisation Report - Pathanamthitta OCCUPATIONAL STRUCTURE
Department of Town & Country Planning, KeralaDepartment of Town & Country Planning, Kerala
1717
Table 4.1 Details of workers from the year 1981 to 2001
4.2 OCCUPATIONAL STRUCTURE
As per 2001 census, the main workers are classified into
four categories ie, Cultivators, Agricultural labourers,
House hold industrial workers and Other workers. The
Other category includes primary sector workers
Table 4.2 Occupational Structure of Pathanamthitta District - 2001
l ike fishermen, workers engaged in mining and
plantation work. Occupational structure of
Pathanamthitta district as per 2001 census is shown in
the Table 4.2 and Figure 4.3
The cultivators and agricultural labourers together con-
stitute only 29.29% of the total main workers, where
the major share (70.71%) of the main workers belong
to the other two categories. The other category of work-
ers will include some of the primary workers like fish-
erman, workers engaged in mining and plantation
works. Assuming that 20% workers in the other cat-
egory of main workers belong to the primary workers
category, 50% of the total workers engage in tertiary
activity. At national level, more than 60% workers are
engaged in primary sector activities. This is an indica-
tion of primary sector activity in the district.
A comparison of occupational structure with the
Classification Cultivators Agri. labours H.H. Industrial Other workers
workers
Number 38,798 44,922 7,268 1,94,856
Percentage 13.57% 15.72% 2.54% 68.17%
Source : Census 1981, 1991, 2001
Workers 1981 1991 2001
Total workers 327099 323494 366049
Total main workers 289944 291943 285844
Total marginal workers 37155 31551 80205
Total Non-workers 795902 863067 867967
Source : Census 1981, 1991, 2001
Figure:4.3 Classification of Main Workers 2001
Source: Census 2001
OCCUPATIONAL STRUCTURE District Urbanisation Report - Pathanamthitta1818
Department of Town & Country Planning, KeralaDepartment of Town & Country Planning, Kerala
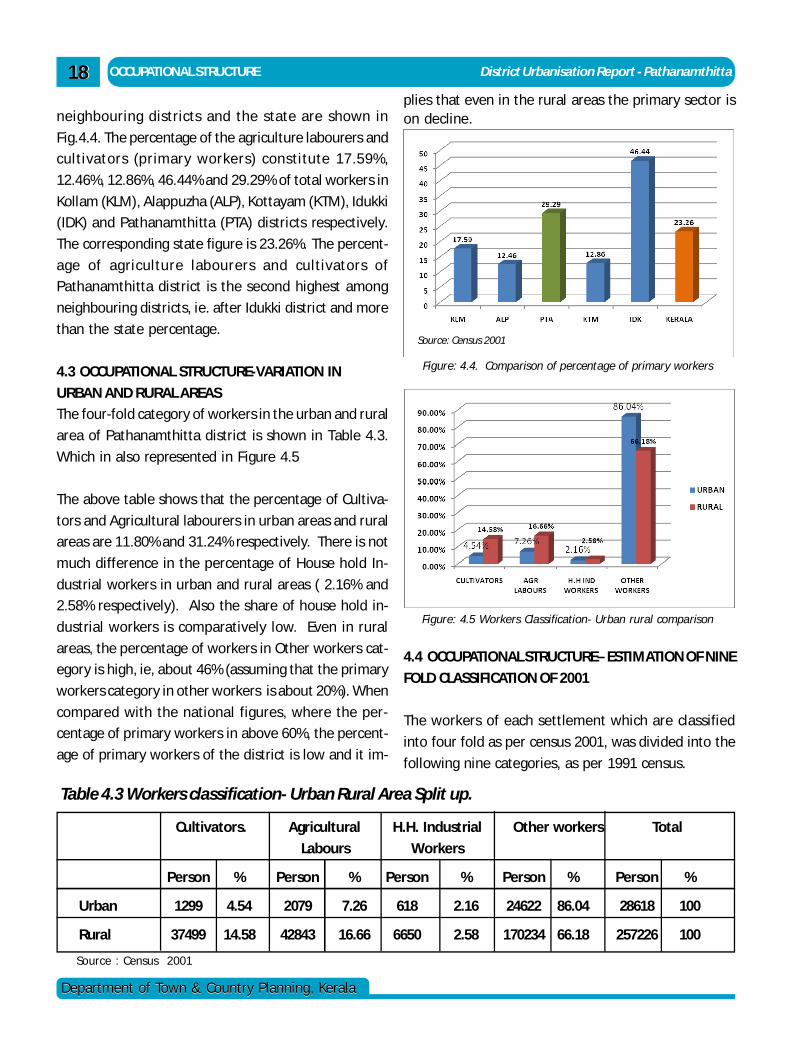
neighbouring districts and the state are shown in
Fig.4.4. The percentage of the agriculture labourers and
cultivators (primary workers) constitute 17.59%,
12.46%, 12.86%, 46.44% and 29.29% of total workers in
Kollam (KLM), Alappuzha (ALP), Kottayam (KTM), Idukki
(IDK) and Pathanamthitta (PTA) districts respectively.
The corresponding state figure is 23.26%. The percent-
age of agriculture labourers and cultivators of
Pathanamthitta district is the second highest among
neighbouring districts, ie. after Idukki district and more
than the state percentage.
4.3 OCCUPATIONAL STRUCTURE-VARIATION IN
URBAN AND RURAL AREAS
The four-fold category of workers in the urban and rural
area of Pathanamthitta district is shown in Table 4.3.
Which in also represented in Figure 4.5
The above table shows that the percentage of Cultiva-
tors and Agricultural labourers in urban areas and rural
areas are 11.80% and 31.24% respectively. There is not
much difference in the percentage of House hold In-
dustrial workers in urban and rural areas ( 2.16% and
2.58% respectively). Also the share of house hold in-
dustrial workers is comparatively low. Even in rural
areas, the percentage of workers in Other workers cat-
egory is high, ie, about 46% (assuming that the primary
workers category in other workers is about 20%). When
compared with the national figures, where the per-
centage of primary workers in above 60%, the percent-
age of primary workers of the district is low and it im-
Cultivators. Agricultural H.H. Industrial Other workers Total
Labours Workers
Person % Person % Person % Person % Person %
Urban 1299 4.54 2079 7.26 618 2.16 24622 86.04 28618 100
Rural 37499 14.58 42843 16.66 6650 2.58 170234 66.18 257226 100
Source : Census 2001
plies that even in the rural areas the primary sector ison decline.
Table 4.3 Workers classification- Urban Rural Area Split up.
4.4 OCCUPATIONAL STRUCTURE– ESTIMATION OF NINE
FOLD CLASSIFICATION OF 2001
The workers of each settlement which are classified
into four fold as per census 2001, was divided into the
following nine categories, as per 1991 census.
Source: Census 2001
Figure: 4.4. Comparison of percentage of primary workers
Figure: 4.5 Workers Classification- Urban rural comparison
District Urbanisation Report - Pathanamthitta OCCUPATIONAL STRUCTURE
Department of Town & Country Planning, KeralaDepartment of Town & Country Planning, Kerala
1919
1. Main Cultivators
2. Agricultural Labourers
3. Livestock, Forestry, Fishing, Hunting, Plantation,
Orchards, and allied activities
4. Mining and Quarrying
5. Manufacturing, Processing, servicing and repairs
in Household industries
6. Manufacturing, Processing
7. Trade and commerce
8. Transport storage and communications
9. Others
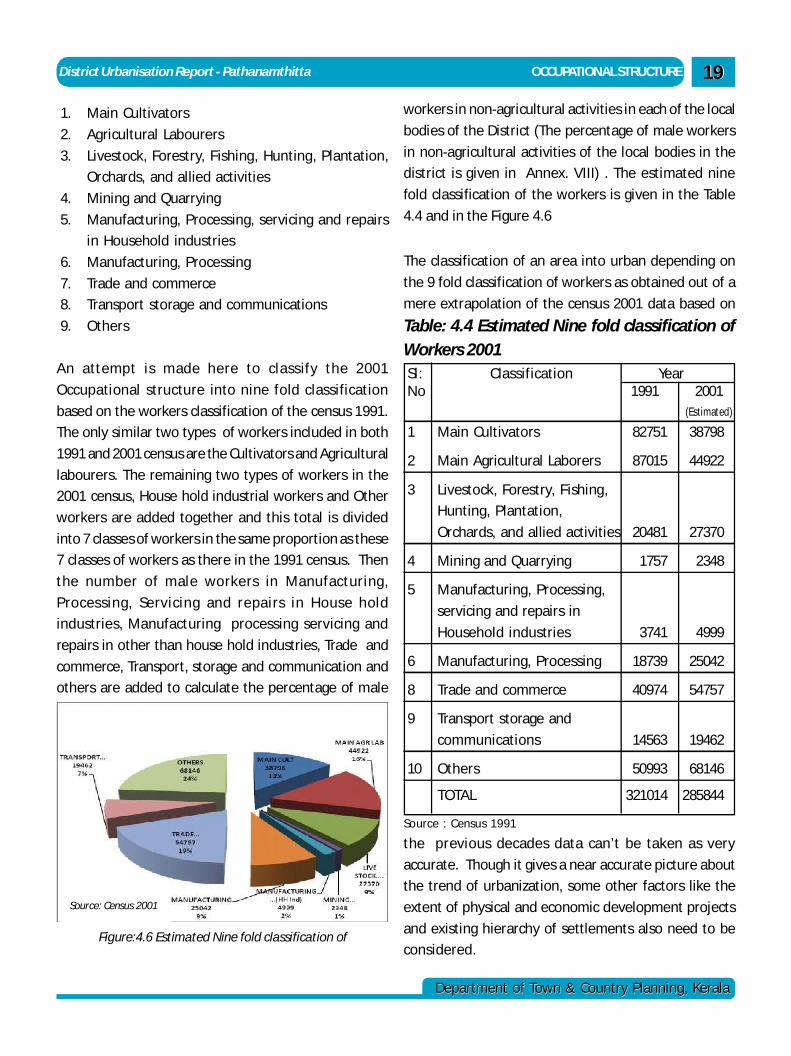
An attempt is made here to classify the 2001
Occupational structure into nine fold classification
based on the workers classification of the census 1991.
The only similar two types of workers included in both
1991 and 2001 census are the Cultivators and Agricultural
labourers. The remaining two types of workers in the
2001 census, House hold industrial workers and Other
workers are added together and this total is divided
into 7 classes of workers in the same proportion as these
7 classes of workers as there in the 1991 census. Then
the number of male workers in Manufacturing,
Processing, Servicing and repairs in House hold
industries, Manufacturing processing servicing and
repairs in other than house hold industries, Trade and
commerce, Transport, storage and communication and
others are added to calculate the percentage of male
workers in non-agricultural activities in each of the local
bodies of the District (The percentage of male workers
in non-agricultural activities of the local bodies in the
district is given in Annex. VIII) . The estimated nine
fold classification of the workers is given in the Table
4.4 and in the Figure 4.6
The classification of an area into urban depending on
the 9 fold classification of workers as obtained out of a
mere extrapolation of the census 2001 data based on
Figure:4.6 Estimated Nine fold classification of
Workers 2001
Source: Census 2001
the previous decades data can’t be taken as very
accurate. Though it gives a near accurate picture about
the trend of urbanization, some other factors like the
extent of physical and economic development projects
and existing hierarchy of settlements also need to be
considered.
Sl: Classification YearNo 1991 2001
(Estimated)
1 Main Cultivators 82751 38798
2 Main Agricultural Laborers 87015 44922
3 Livestock, Forestry, Fishing,
Hunting, Plantation,
Orchards, and allied activities 20481 27370
4 Mining and Quarrying 1757 2348
5 Manufacturing, Processing,
servicing and repairs in
Household industries 3741 4999
6 Manufacturing, Processing 18739 25042
8 Trade and commerce 40974 54757
9 Transport storage and
communications 14563 19462
10 Others 50993 68146
TOTAL 321014 285844
Source : Census 1991
Table: 4.4 Estimated Nine fold classification ofWorkers 2001
OCCUPATIONAL STRUCTURE District Urbanisation Report - Pathanamthitta2020
Department of Town & Country Planning, KeralaDepartment of Town & Country Planning, Kerala
OF MAJOR CLASSES OF
WORKERS
The Concentration index
(number of workers of a
particular class of workers in
a local body/total number of
workers)/ (number of
workers of the same class of
workers in the district/ total
number of workers in the
district) of the four classes of
workers viz: Cultivators,
Agricultural laborers, House
hold industrial workers and
Other workers are calculated
for each LSGs and its spatial
variation is analyzed.
Concentration index gives an
idea about where a particular
class of workers is
concentrated in the district.
The LSGs wise concentration
index of major class of
workers is given in Annex III.
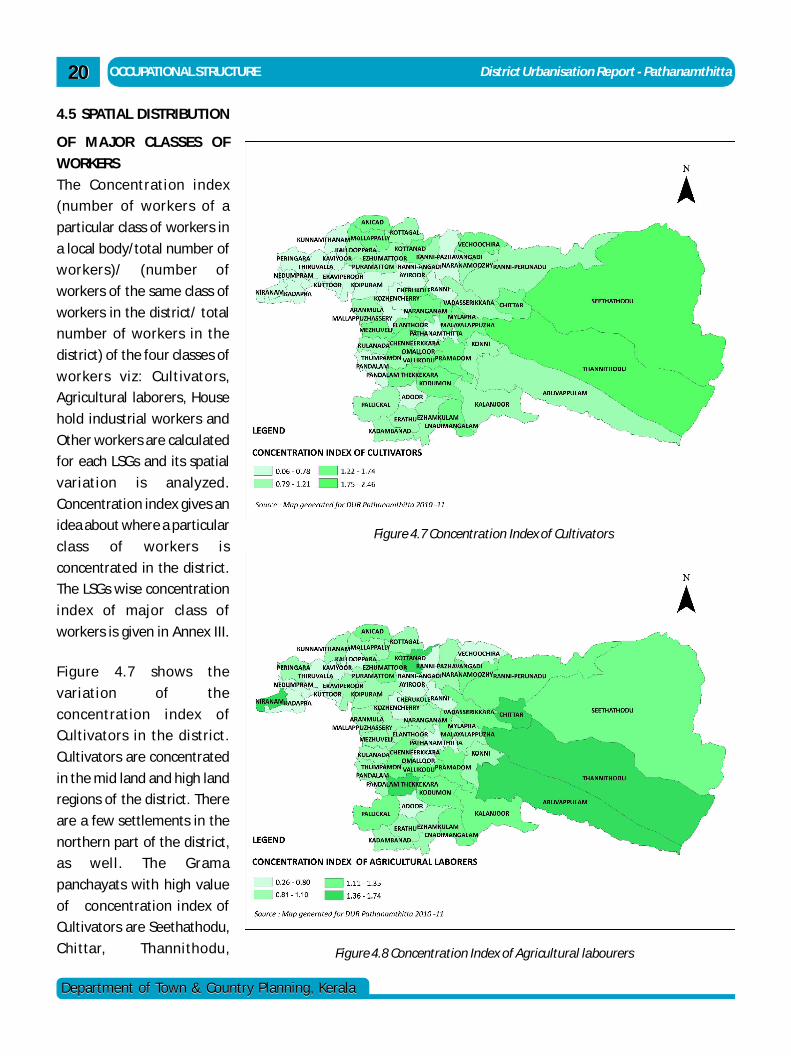
F igure 4.7 shows the
variation of the
concentration index of
Cultivators in the district.
Cultivators are concentrated
in the mid land and high land
regions of the district. There
are a few settlements in the
northern part of the district,
as well. The Grama
panchayats with high value
of concentration index of
Cultivators are Seethathodu,
Chittar, Thannithodu,
4.5 SPATIAL DISTRIBUTION
Figure 4.7 Concentration Index of Cultivators
Figure 4.8 Concentration Index of Agricultural labourers
District Urbanisation Report - Pathanamthitta OCCUPATIONAL STRUCTURE
Department of Town & Country Planning, KeralaDepartment of Town & Country Planning, Kerala
2121Pandalam Thekkekara,
Naranganam, Cherukole and
Kottanad.
Figure 4.8 shows the varia-
tion of the concentration in-
dex of Agricultural labourers
in the LSGs of the district.
There is no specific pattern
in the distribution of Agricul-
ture labourers and the local
bodies with high value of
concentration index is scat-
tered all over the district.
Niranam, Kottanad, Ranni-
Perunad, Chittar,
Thannithodu, Aruvappulam
and Pandalam-Thekkekara
are the local bodies with
high concentration of Agri-
cultural labourers.
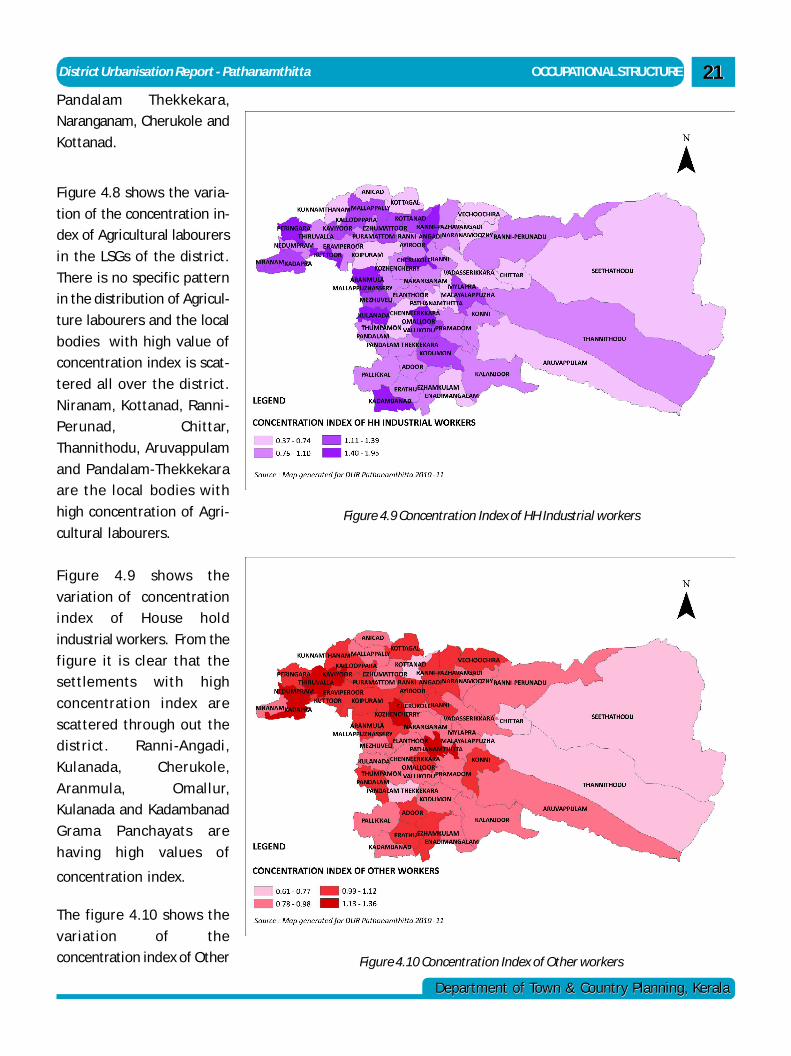
F igure 4.9 shows the
variation of concentration
index of House hold
industrial workers. From the
figure it is clear that the
settlements with high
concentration index are
scattered through out the
district. Ranni-Angadi,
Kulanada, Cherukole,
Aranmula, Omallur,
Kulanada and Kadambanad
Grama Panchayats are
having high values of
concentration index.
The figure 4.10 shows the
variation of the
concentration index of Other
Figure 4.9 Concentration Index of HH Industrial workers
Figure 4.10 Concentration Index of Other workers
OCCUPATIONAL STRUCTURE District Urbanisation Report - Pathanamthitta2222
Department of Town & Country Planning, KeralaDepartment of Town & Country Planning, Kerala
workers in the district. It shows that Other workers are
concentrated more in the mid land and low land regions
of the district. Thiruvalla, Kozhenchery,
Pathanamthitta, Kaviyoor, Nedumpuram and Adoor are
the local governments with high values of
Municipality/Grama Municipality/Grama Municipality/Grama Municipality/GramaPanchayat where Panchayat where Panchayat where Panchayat where
Cultivators are Agricultural workers are House hold industries concentrated concentrated concentrated Workers are (Con index > 1.0)
(Con index > 1.0) (Con index > 1.0) concentrated (Con index > 1.0)
Mallapally Niranam Niranam kadapraAnicad Thottappuzhassery kadapra PeringaraKottangal Mallappally Peringara kuttoorKottanad Anicad kuttoor KaviyoorEzhumattoor Kottanad Kaviyoor EraviperoorVechoochira Ezhumattoor Kallooppara koipuramNaranammoozhi Puramattom Mallappally ThottappuzhaseryRanni-pewrunad Naranammoozi kottanad NedumpuramRanni-Angadi Ranni-Perunad Ezhumattoor KunnamthanamCherukole Cherukole Ranni-pazhavangadi KalloopparaVadasserikkara Vadasserikkara Ranni-Angadi KottangalSeethathodu Seethathodu Cherukole PuramattomChittar Chittar Malayalappuzha Ranni-pazhavangadiMylapra mylapra Mezhuveli VechoochiraMalayalappuzha mallappuzhassery Aranmula Ranni-AngadiMezhuveli Chenneerkkara Mallappuzhassery AyroorElanthoor Vallicode Vallicode RanniChenneerkkara Naranganam Omalloor AranmulaVallicode Thannithodu Kulanada kozhencheryNaranganam Pramadom Pandalam MallappuzhasseryThannithodu Aruvappulam Pandalam Thekkekkara KonniPramadom Kulanada Kodumon PandalamAruvappulam Thumpamon Ezhamkulam EzhamkulamKulanada Pandalam Thekkekkara Kadampanadu OmallurThumpamon Kodumon Adoor ThiruvallaPandalam Thekkekkara Enadimangalam PathanamthittaKodumon Erathu AdoorEnadimangalam PallickalErathuKalanjoorPallickalKadampanaduKalanjoor
concentration Index of Other workers.
The concentration pattern of the workers of the district
is shown in table 4.5.
Table 4.5 Concentration Pattern of Workers
4.6 ACTIVITY PATTERN BASED ON OCCUPATIONAL
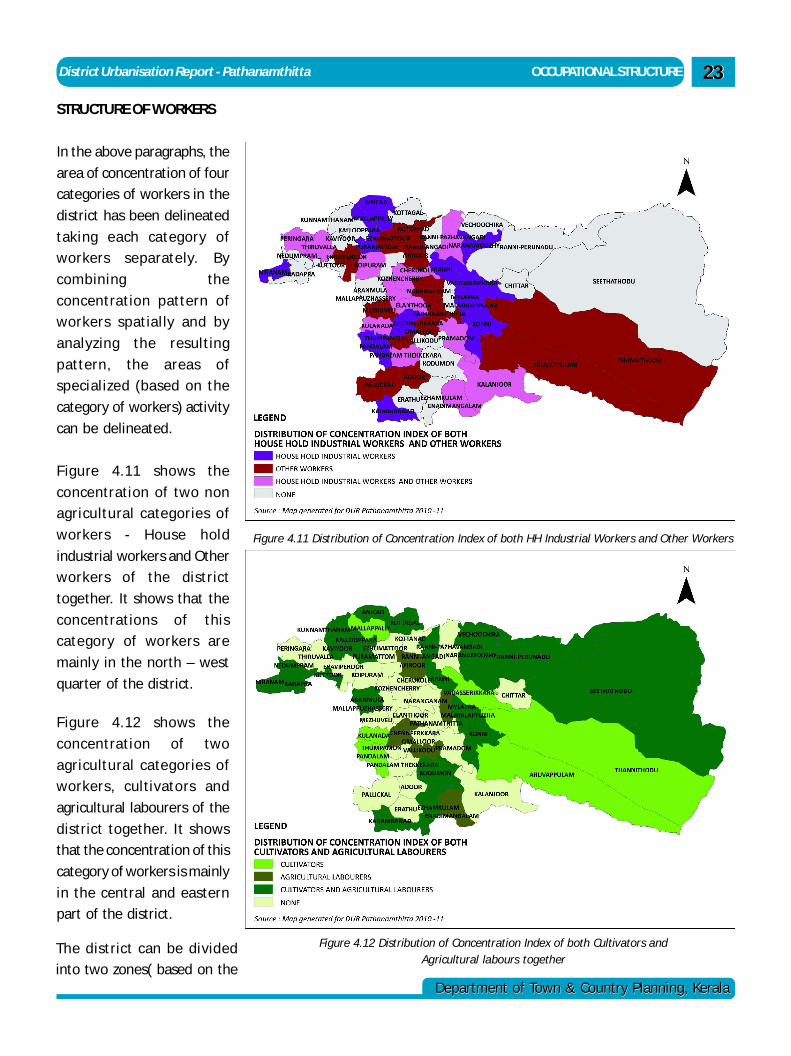
District Urbanisation Report - Pathanamthitta OCCUPATIONAL STRUCTURE
Department of Town & Country Planning, KeralaDepartment of Town & Country Planning, Kerala
2323
STRUCTURE OF WORKERS
In the above paragraphs, the
area of concentration of four
categories of workers in the
district has been delineated
taking each category of
workers separately. By
combining the
concentration pattern of
workers spatially and by
analyzing the resulting
pattern, the areas of
specialized (based on the
category of workers) activity
can be delineated.
F igure 4.11 shows the
concentration of two non
agricultural categories of
workers - House hold
industrial workers and Other
workers of the district
together. It shows that the
concentrations of this
category of workers are
mainly in the north – west
quarter of the district.
F igure 4.12 shows the
concentration of two
agricultural categories of
workers, cultivators and
agricultural labourers of the
district together. It shows
that the concentration of this
category of workers is mainly
in the central and eastern
part of the district.
The district can be divided
into two zones( based on the
Figure 4.11 Distribution of Concentration Index of both HH Industrial Workers and Other Workers
Figure 4.12 Distribution of Concentration Index of both Cultivators andAgricultural labours together
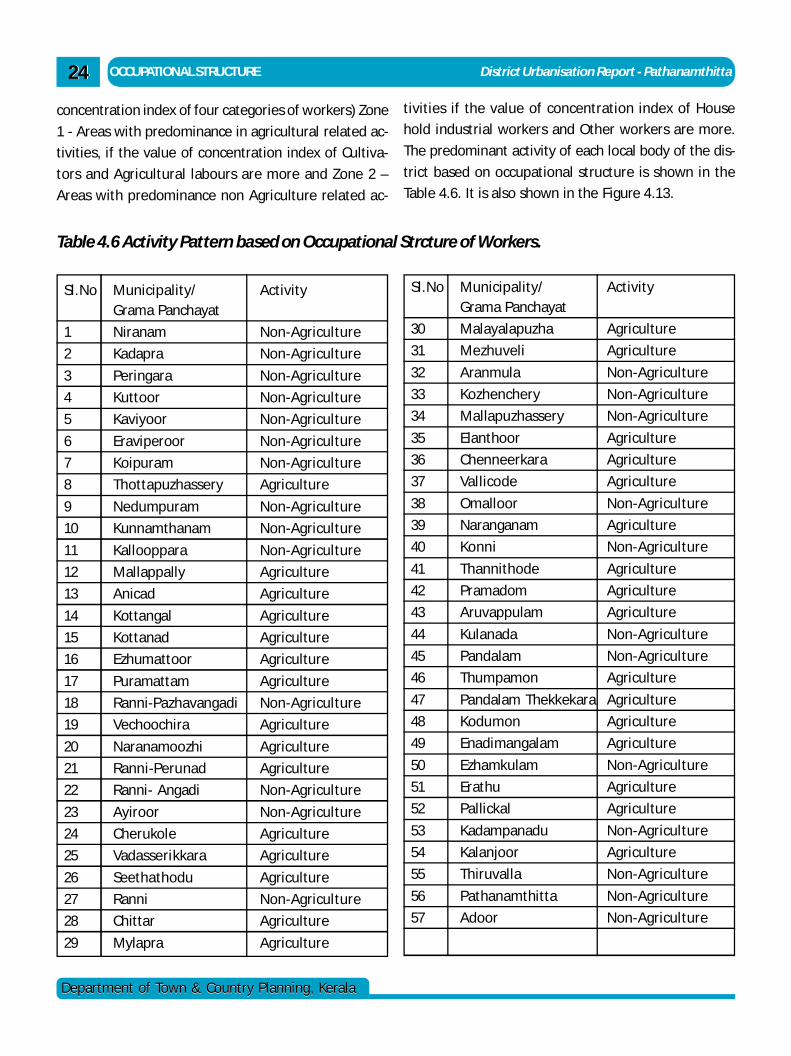
OCCUPATIONAL STRUCTURE District Urbanisation Report - Pathanamthitta2424
Department of Town & Country Planning, KeralaDepartment of Town & Country Planning, Kerala
concentration index of four categories of workers) Zone
1 - Areas with predominance in agricultural related ac-
tivities, if the value of concentration index of Cultiva-
tors and Agricultural labours are more and Zone 2 –
Areas with predominance non Agriculture related ac-
tivities if the value of concentration index of House
hold industrial workers and Other workers are more.
The predominant activity of each local body of the dis-
trict based on occupational structure is shown in the
Table 4.6. It is also shown in the Figure 4.13.
Table 4.6 Activity Pattern based on Occupational Strcture of Workers.
Sl.No Municipality/ ActivityGrama Panchayat
1 Niranam Non-Agriculture
2 Kadapra Non-Agriculture
3 Peringara Non-Agriculture
4 Kuttoor Non-Agriculture
5 Kaviyoor Non-Agriculture
6 Eraviperoor Non-Agriculture
7 Koipuram Non-Agriculture
8 Thottapuzhassery Agriculture
9 Nedumpuram Non-Agriculture
10 Kunnamthanam Non-Agriculture
11 Kallooppara Non-Agriculture
12 Mallappally Agriculture
13 Anicad Agriculture
14 Kottangal Agriculture
15 Kottanad Agriculture
16 Ezhumattoor Agriculture
17 Puramattam Agriculture
18 Ranni-Pazhavangadi Non-Agriculture
19 Vechoochira Agriculture
20 Naranamoozhi Agriculture
21 Ranni-Perunad Agriculture
22 Ranni- Angadi Non-Agriculture
23 Ayiroor Non-Agriculture
24 Cherukole Agriculture
25 Vadasserikkara Agriculture
26 Seethathodu Agriculture
27 Ranni Non-Agriculture
28 Chittar Agriculture
29 Mylapra Agriculture
Sl.No Municipality/ ActivityGrama Panchayat
30 Malayalapuzha Agriculture
31 Mezhuveli Agriculture
32 Aranmula Non-Agriculture
33 Kozhenchery Non-Agriculture
34 Mallapuzhassery Non-Agriculture
35 Elanthoor Agriculture
36 Chenneerkara Agriculture
37 Vallicode Agriculture
38 Omalloor Non-Agriculture
39 Naranganam Agriculture
40 Konni Non-Agriculture
41 Thannithode Agriculture
42 Pramadom Agriculture
43 Aruvappulam Agriculture
44 Kulanada Non-Agriculture
45 Pandalam Non-Agriculture
46 Thumpamon Agriculture
47 Pandalam Thekkekara Agriculture
48 Kodumon Agriculture
49 Enadimangalam Agriculture
50 Ezhamkulam Non-Agriculture
51 Erathu Agriculture
52 Pallickal Agriculture
53 Kadampanadu Non-Agriculture
54 Kalanjoor Agriculture
55 Thiruvalla Non-Agriculture
56 Pathanamthitta Non-Agriculture
57 Adoor Non-Agriculture
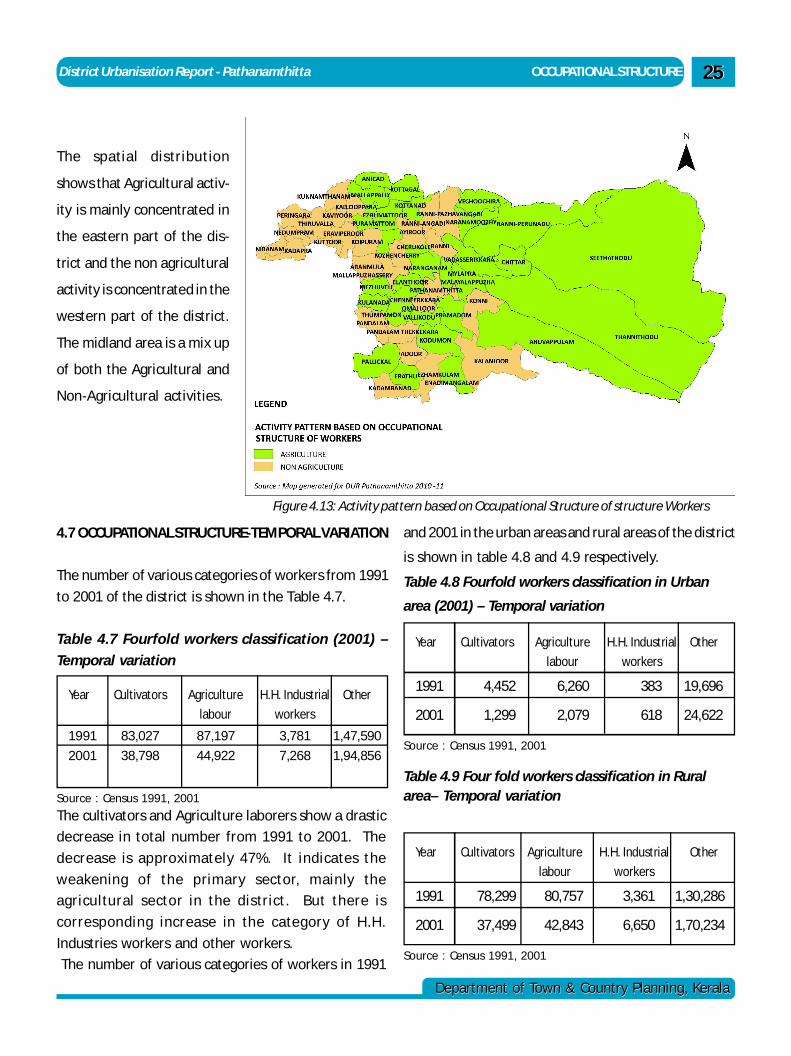
District Urbanisation Report - Pathanamthitta OCCUPATIONAL STRUCTURE
Department of Town & Country Planning, KeralaDepartment of Town & Country Planning, Kerala
2525
The spatial distribution
shows that Agricultural activ-
ity is mainly concentrated in
the eastern part of the dis-
trict and the non agricultural
activity is concentrated in the
western part of the district.
The midland area is a mix up
of both the Agricultural and
Non-Agricultural activities.
The cultivators and Agriculture laborers show a drastic
decrease in total number from 1991 to 2001. The
decrease is approximately 47%. It indicates the
weakening of the primary sector, mainly the
agricultural sector in the district. But there is
corresponding increase in the category of H.H.
Industries workers and other workers.
The number of various categories of workers in 1991
4.7 OCCUPATIONAL STRUCTURE-TEMPORAL VARIATION
The number of various categories of workers from 1991
to 2001 of the district is shown in the Table 4.7.
Table 4.7 Fourfold workers classification (2001) –
Temporal variation
Year Cultivators Agriculture H.H. Industrial Other
labour workers
1991 83,027 87,197 3,781 1,47,590
2001 38,798 44,922 7,268 1,94,856
Source : Census 1991, 2001
and 2001 in the urban areas and rural areas of the district
is shown in table 4.8 and 4.9 respectively.
Table 4.8 Fourfold workers classification in Urban
area (2001) – Temporal variation
Year Cultivators Agriculture H.H. Industrial Other
labour workers
1991 4,452 6,260 383 19,696
2001 1,299 2,079 618 24,622
Source : Census 1991, 2001
Year Cultivators Agriculture H.H. Industrial Other
labour workers
1991 78,299 80,757 3,361 1,30,286
2001 37,499 42,843 6,650 1,70,234
Source : Census 1991, 2001
Table 4.9 Four fold workers classification in Ruralarea– Temporal variation
Figure 4.13: Activity pattern based on Occupational Structure of structure Workers
OCCUPATIONAL STRUCTURE District Urbanisation Report - Pathanamthitta2626
Department of Town & Country Planning, KeralaDepartment of Town & Country Planning, Kerala
From the above tables, it is very clear that the number
of workers engaged in primary sector in rural area is
alarmingly decreasing, whereas the number of workers
in the other workers category is increasing. This has
resulted in the dilution of the rural nature of the rural
areas of the district as far as the occupational structure
is concerned.
In urban areas also, similar feature can be observed.
Workers engaged in H.H. Industry and other categories
are increasing rapidly. This has resulted in the
narrowing down of the boundary distinguishing the
character of rural and urban areas.
4.8 INFERENCE.
Pathanamthitta district ranks 12th place in the state as
far as the Work Participation Rate is concerned, as per
2001 census. Another feature noted is that the growth
rate of total workers (13.15%) is more than the
population growth rate (3.99%) during the period 1991-
2001. It indicates that the employment opportunity is
increasing more than that of population growth rate.
About 50% of the total workers are engaged in primary
sector activity but in the national level more than 60%
workers are engaged in primary sector activities. Even
in the rural area, the percentage of workers in other
workers category is high (46%). This implies that even
in rural areas, the primary sector is on decline and the
production sector is showing a declining trend. Study
of temporal variation of occupational structure shows
that the cultivators and Agriculture labourers show a
drastic decrease in total number from the year 1991 to
2001. The analysis of spatial distribution of workers
shows that Agricultural activity is mainly concentrated
in the eastern part of the district and non agricultural
activity is mainly concentrated in the western part of
the district. The middle part of the district shows a mix
up of both agricultural and non- agricultural activities.
admin
Text Box
< CONTENTS >
admin
Text Box
CHAPTER 5 >>
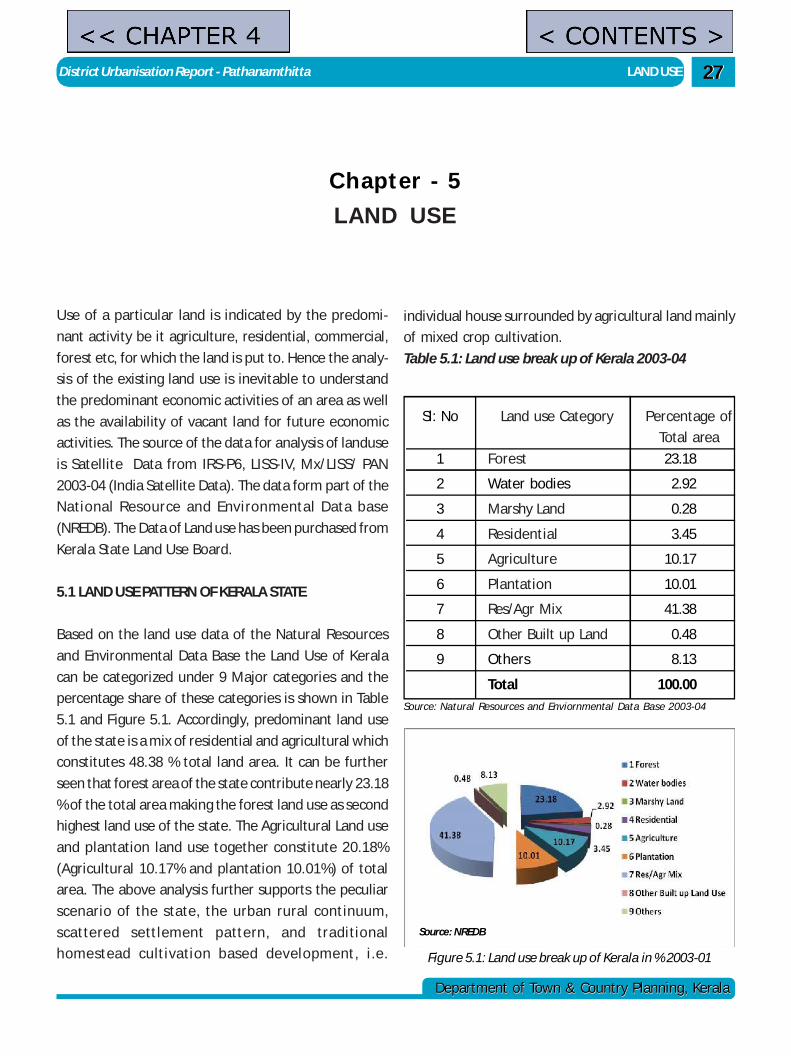
District Urbanisation Report - Pathanamthitta LAND USE
Department of Town & Country Planning, KeralaDepartment of Town & Country Planning, Kerala
2727
Chapter - 5LAND USE
Use of a particular land is indicated by the predomi-
nant activity be it agriculture, residential, commercial,
forest etc, for which the land is put to. Hence the analy-
sis of the existing land use is inevitable to understand
the predominant economic activities of an area as well
as the availability of vacant land for future economic
activities. The source of the data for analysis of landuse
is Satellite Data from IRS-P6, LISS-IV, Mx/LISS/ PAN
2003-04 (India Satellite Data). The data form part of the
National Resource and Environmental Data base
(NREDB). The Data of Land use has been purchased from
Kerala State Land Use Board.
5.1 LAND USE PATTERN OF KERALA STATE
Based on the land use data of the Natural Resources
and Environmental Data Base the Land Use of Kerala
can be categorized under 9 Major categories and the
percentage share of these categories is shown in Table
5.1 and Figure 5.1. Accordingly, predominant land use
of the state is a mix of residential and agricultural which
constitutes 48.38 % total land area. It can be further
seen that forest area of the state contribute nearly 23.18
% of the total area making the forest land use as second
highest land use of the state. The Agricultural Land use
and plantation land use together constitute 20.18%
(Agricultural 10.17% and plantation 10.01%) of total
area. The above analysis further supports the peculiar
scenario of the state, the urban rural continuum,
scattered settlement pattern, and traditional
homestead cultivation based development, i.e.
individual house surrounded by agricultural land mainly
of mixed crop cultivation.
Table 5.1: Land use break up of Kerala 2003-04
Sl: No Land use Category Percentage of
Total area
1 Forest 23.18
2 Water bodies 2.92
3 Marshy Land 0.28
4 Residential 3.45
5 Agriculture 10.17
6 Plantation 10.01
7 Res/Agr Mix 41.38
8 Other Built up Land 0.48
9 Others 8.13
Total 100.00Source: Natural Resources and Enviornmental Data Base 2003-04
Source: NREDB
Figure 5.1: Land use break up of Kerala in % 2003-01
admin
Text Box
< CONTENTS >
admin
Text Box
<< CHAPTER 4
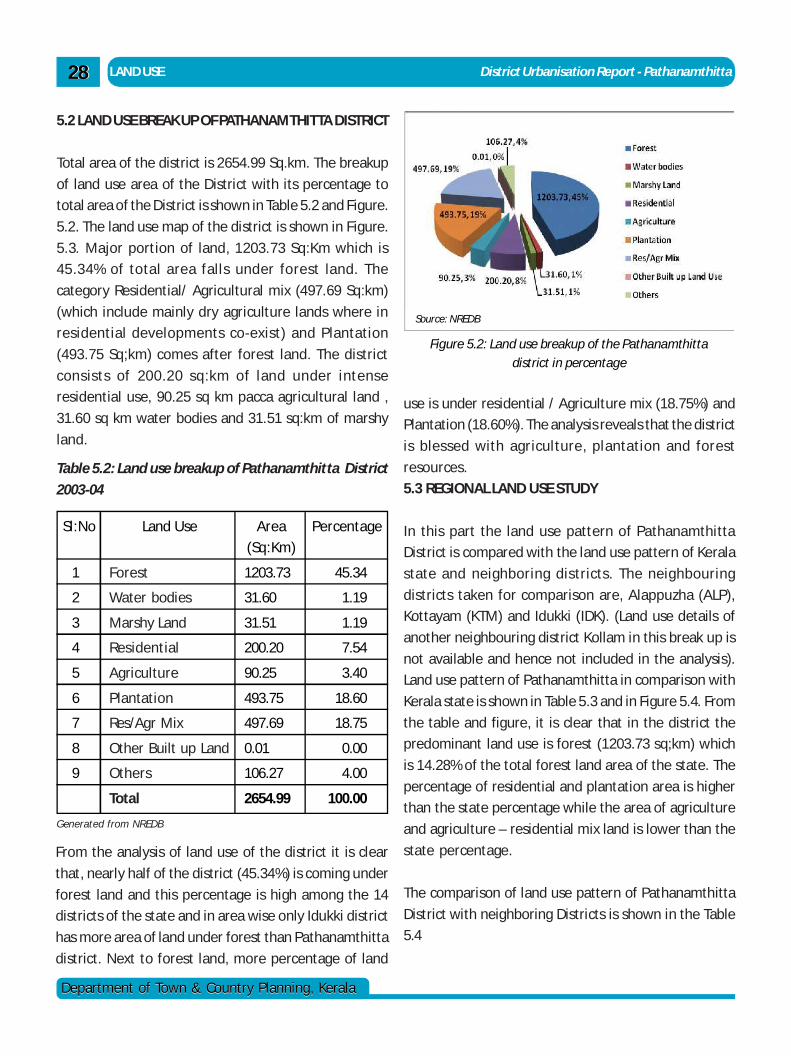
LAND USE District Urbanisation Report - Pathanamthitta2828
Department of Town & Country Planning, KeralaDepartment of Town & Country Planning, Kerala
5.2 LAND USE BREAK UP OF PATHANAMTHITTA DISTRICT
Total area of the district is 2654.99 Sq.km. The breakup
of land use area of the District with its percentage to
total area of the District is shown in Table 5.2 and Figure.
5.2. The land use map of the district is shown in Figure.
5.3. Major portion of land, 1203.73 Sq:Km which is
45.34% of total area falls under forest land. The
category Residential/ Agricultural mix (497.69 Sq:km)
(which include mainly dry agriculture lands where in
residential developments co-exist) and Plantation
(493.75 Sq;km) comes after forest land. The district
consists of 200.20 sq:km of land under intense
residential use, 90.25 sq km pacca agricultural land ,
31.60 sq km water bodies and 31.51 sq:km of marshy
land.
Table 5.2: Land use breakup of Pathanamthitta District
2003-04
use is under residential / Agriculture mix (18.75%) and
Plantation (18.60%). The analysis reveals that the district
is blessed with agriculture, plantation and forest
resources.
5.3 REGIONAL LAND USE STUDY
In this part the land use pattern of Pathanamthitta
District is compared with the land use pattern of Kerala
state and neighboring districts. The neighbouring
districts taken for comparison are, Alappuzha (ALP),
Kottayam (KTM) and Idukki (IDK). (Land use details of
another neighbouring district Kollam in this break up is
not available and hence not included in the analysis).
Land use pattern of Pathanamthitta in comparison with
Kerala state is shown in Table 5.3 and in Figure 5.4. From
the table and figure, it is clear that in the district the
predominant land use is forest (1203.73 sq;km) which
is 14.28% of the total forest land area of the state. The
percentage of residential and plantation area is higher
than the state percentage while the area of agriculture
and agriculture – residential mix land is lower than the
state percentage.
The comparison of land use pattern of Pathanamthitta
District with neighboring Districts is shown in the Table
5.4
Sl:No Land Use Area Percentage
(Sq:Km)
1 Forest 1203.73 45.34
2 Water bodies 31.60 1.19
3 Marshy Land 31.51 1.19
4 Residential 200.20 7.54
5 Agriculture 90.25 3.40
6 Plantation 493.75 18.60
7 Res/Agr Mix 497.69 18.75
8 Other Built up Land 0.01 0.00
9 Others 106.27 4.00
Total 2654.99 100.00
Generated from NREDB
From the analysis of land use of the district it is clear
that, nearly half of the district (45.34%) is coming under
forest land and this percentage is high among the 14
districts of the state and in area wise only Idukki district
has more area of land under forest than Pathanamthitta
district. Next to forest land, more percentage of land
Figure 5.2: Land use breakup of the Pathanamthitta district in percentage
Source: NREDB
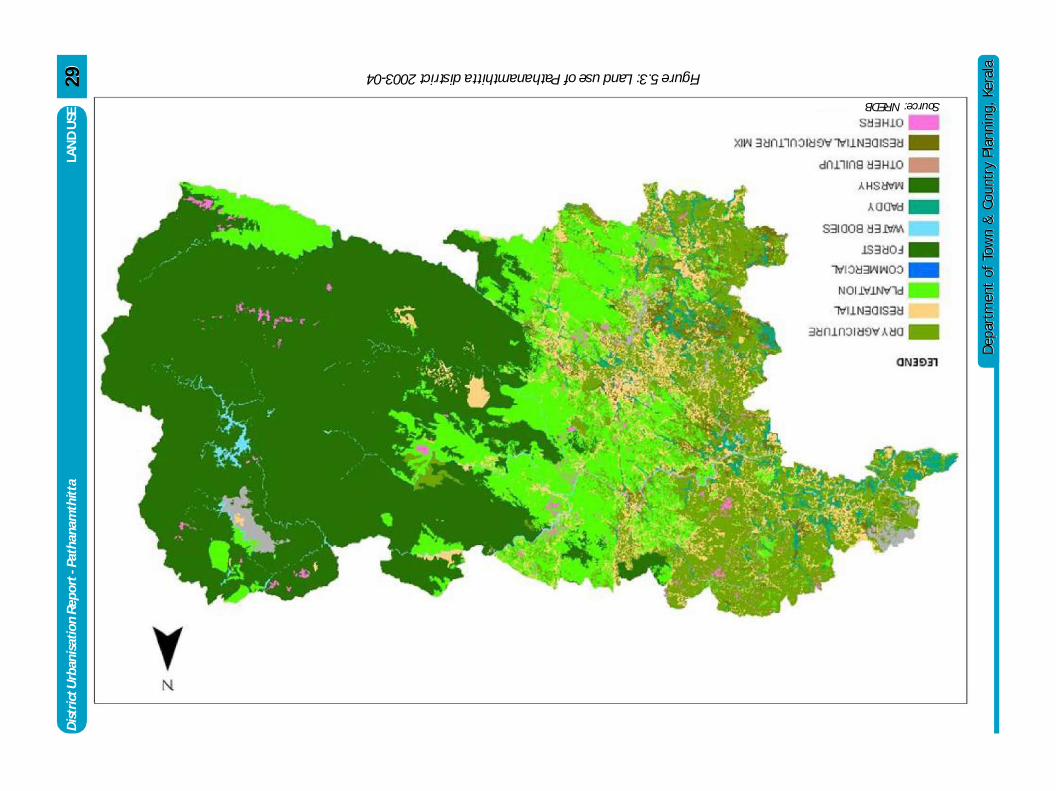
Dis
tric
t Urb
anis
atio
n Re
port
- Pa
than
amth
itta
LAN
D U
SE
Dep
artm
ent
of T
own
& C
ount
ry P
lann
ing,
Ker
ala
Dep
artm
ent
of T
own
& C
ount
ry P
lann
ing,
Ker
ala
2929
Source: NREDB
Figure 5.3: Land use of Pathanamthitta district 2003-04
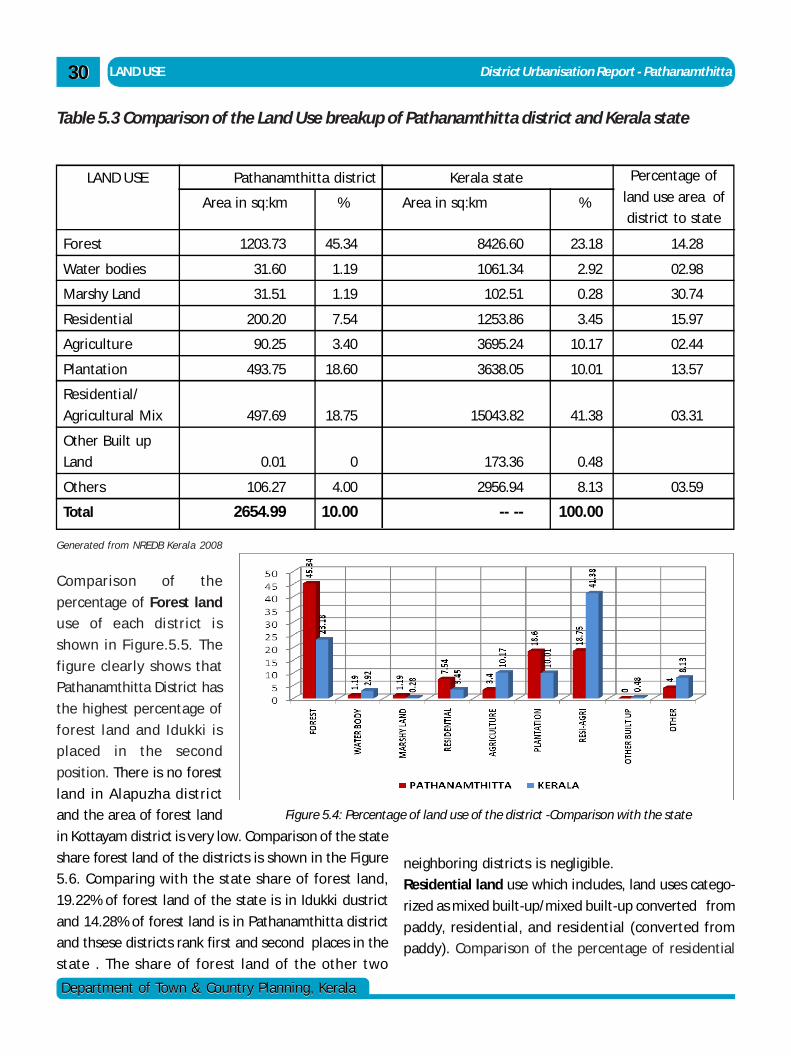
LAND USE District Urbanisation Report - Pathanamthitta3030
Department of Town & Country Planning, KeralaDepartment of Town & Country Planning, Kerala
Table 5.3 Comparison of the Land Use breakup of Pathanamthitta district and Kerala state
LAND USE Pathanamthitta district Kerala state
Area in sq:km % Area in sq:km %
Percentage of
land use area of
district to state
Forest 1203.73 45.34 8426.60 23.18 14.28
Water bodies 31.60 1.19 1061.34 2.92 02.98
Marshy Land 31.51 1.19 102.51 0.28 30.74
Residential 200.20 7.54 1253.86 3.45 15.97
Agriculture 90.25 3.40 3695.24 10.17 02.44
Plantation 493.75 18.60 3638.05 10.01 13.57
Residential/
Agricultural Mix 497.69 18.75 15043.82 41.38 03.31
Other Built up
Land 0.01 0 173.36 0.48
Others 106.27 4.00 2956.94 8.13 03.59
Total 2654.99 10.00 -- -- 100.00
Generated from NREDB Kerala 2008
Figure 5.4: Percentage of land use of the district -Comparison with the state
neighboring districts is negligible.
Residential land use which includes, land uses catego-
rized as mixed built-up/mixed built-up converted from
paddy, residential, and residential (converted from
paddy). Comparison of the percentage of residential
Comparison of the
percentage of Forest land
use of each district is
shown in F igure.5.5. The
figure clearly shows that
Pathanamthitta District has
the highest percentage of
forest land and Idukki is
placed in the second
position. There is no forest
land in Alapuzha district
and the area of forest land
in Kottayam district is very low. Comparison of the state
share forest land of the districts is shown in the Figure
5.6. Comparing with the state share of forest land,
19.22% of forest land of the state is in Idukki dustrict
and 14.28% of forest land is in Pathanamthitta district
and thsese districts rank first and second places in the
state . The share of forest land of the other two
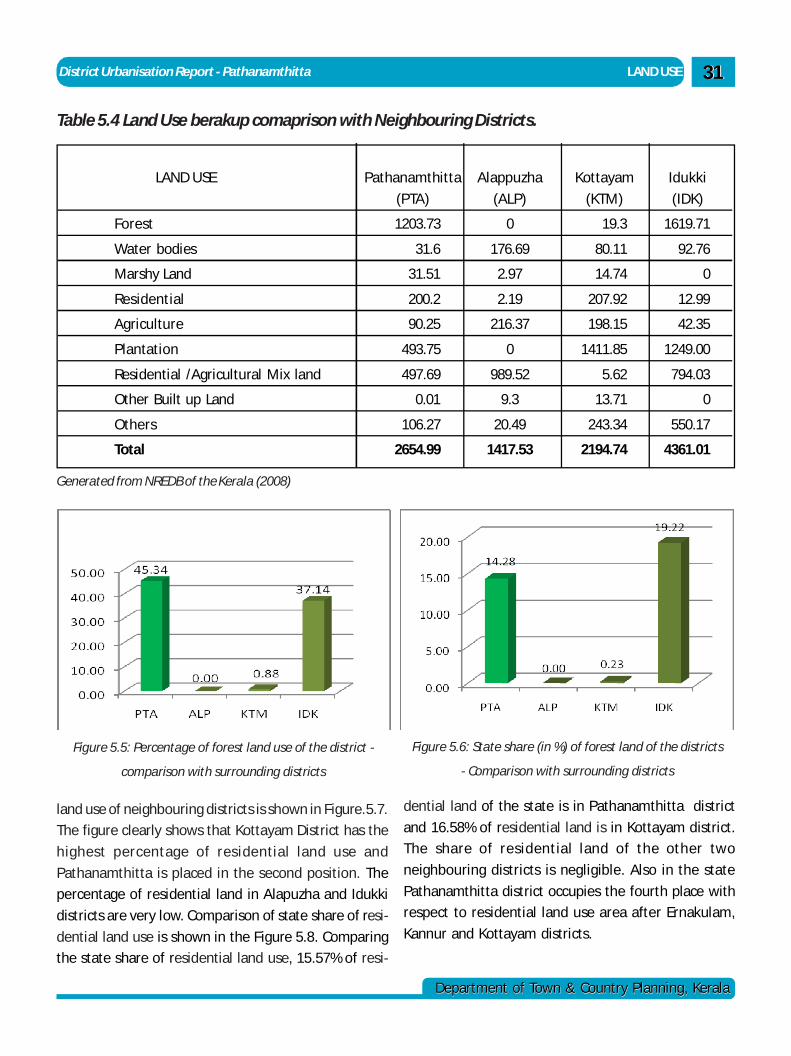
District Urbanisation Report - Pathanamthitta LAND USE
Department of Town & Country Planning, KeralaDepartment of Town & Country Planning, Kerala
3131
Figure 5.5: Percentage of forest land use of the district -
comparison with surrounding districts
Figure 5.6: State share (in %) of forest land of the districts
- Comparison with surrounding districts
land use of neighbouring districts is shown in Figure.5.7.
The figure clearly shows that Kottayam District has the
highest percentage of residential land use and
Pathanamthitta is placed in the second position. The
percentage of residential land in Alapuzha and Idukki
districts are very low. Comparison of state share of resi-
dential land use is shown in the Figure 5.8. Comparing
the state share of residential land use, 15.57% of resi-
dential land of the state is in Pathanamthitta district
and 16.58% of residential land is in Kottayam district.
The share of residential land of the other two
neighbouring districts is negligible. Also in the state
Pathanamthitta district occupies the fourth place with
respect to residential land use area after Ernakulam,
Kannur and Kottayam districts.
LAND USE Pathanamthitta Alappuzha Kottayam Idukki
(PTA) (ALP) (KTM) (IDK)
Forest 1203.73 0 19.3 1619.71
Water bodies 31.6 176.69 80.11 92.76
Marshy Land 31.51 2.97 14.74 0
Residential 200.2 2.19 207.92 12.99
Agriculture 90.25 216.37 198.15 42.35
Plantation 493.75 0 1411.85 1249.00
Residential /Agricultural Mix land 497.69 989.52 5.62 794.03
Other Built up Land 0.01 9.3 13.71 0
Others 106.27 20.49 243.34 550.17
Total 2654.99 1417.53 2194.74 4361.01
Generated from NREDB of the Kerala (2008)
Table 5.4 Land Use berakup comaprison with Neighbouring Districts.
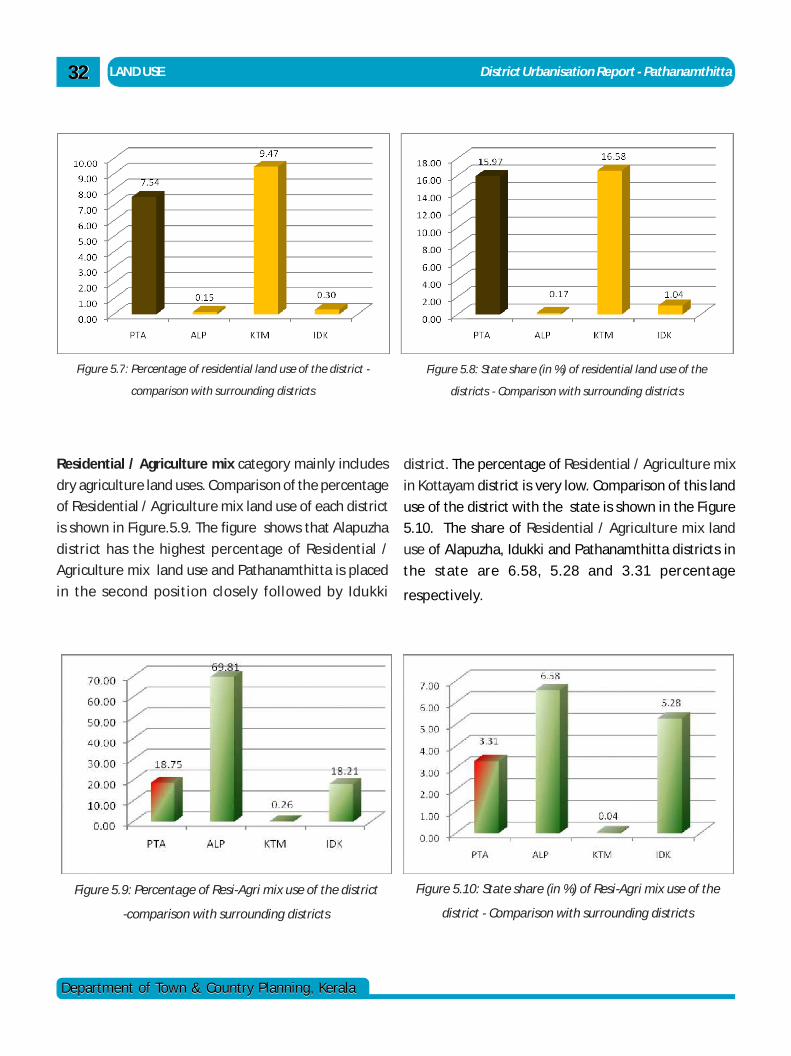
LAND USE District Urbanisation Report - Pathanamthitta3232
Department of Town & Country Planning, KeralaDepartment of Town & Country Planning, Kerala
Residential / Agriculture mix category mainly includes
dry agriculture land uses. Comparison of the percentage
of Residential / Agriculture mix land use of each district
is shown in Figure.5.9. The figure shows that Alapuzha
district has the highest percentage of Residential /
Agriculture mix land use and Pathanamthitta is placed
in the second position closely followed by Idukki
district. The percentage of Residential / Agriculture mix
in Kottayam district is very low. Comparison of this land
use of the district with the state is shown in the Figure
5.10. The share of Residential / Agriculture mix land
use of Alapuzha, Idukki and Pathanamthitta districts in
the state are 6.58, 5.28 and 3.31 percentage
respectively.
Figure 5.7: Percentage of residential land use of the district -
comparison with surrounding districts
Figure 5.8: State share (in %) of residential land use of the
districts - Comparison with surrounding districts
Figure 5.9: Percentage of Resi-Agri mix use of the district
-comparison with surrounding districts
Figure 5.10: State share (in %) of Resi-Agri mix use of the
district - Comparison with surrounding districts
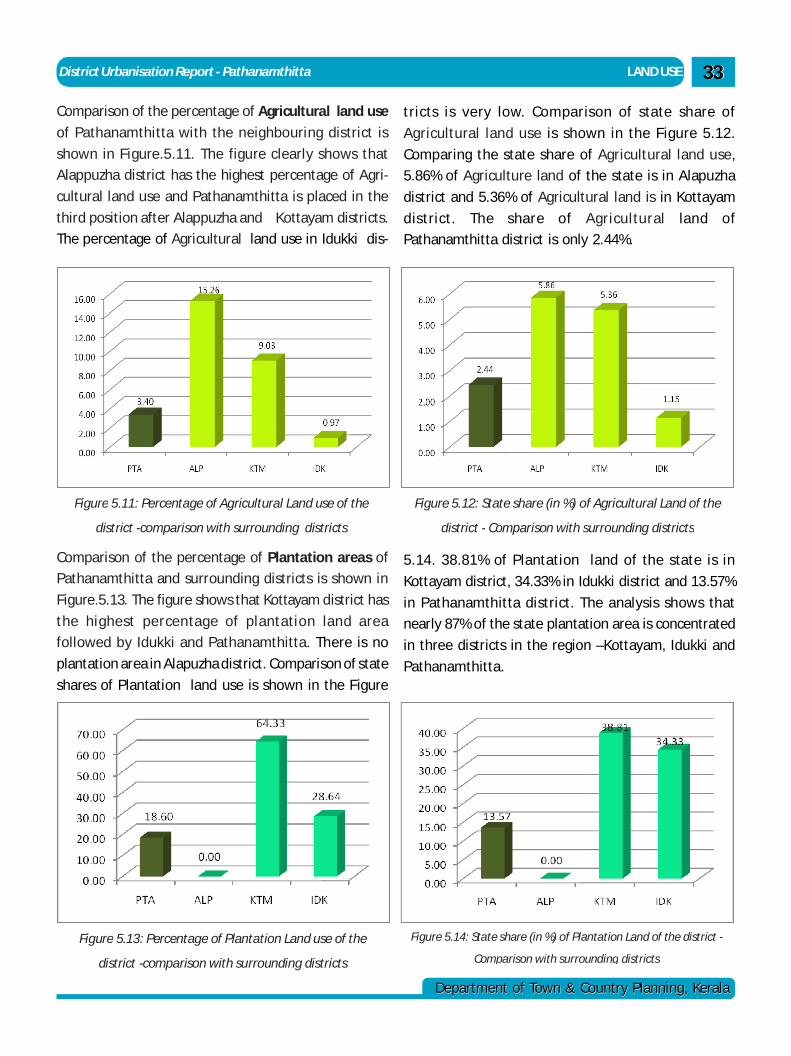
District Urbanisation Report - Pathanamthitta LAND USE
Department of Town & Country Planning, KeralaDepartment of Town & Country Planning, Kerala
3333
Comparison of the percentage of Agricultural land use
of Pathanamthitta with the neighbouring district is
shown in Figure.5.11. The figure clearly shows that
Alappuzha district has the highest percentage of Agri-
cultural land use and Pathanamthitta is placed in the
third position after Alappuzha and Kottayam districts.
The percentage of Agricultural land use in Idukki dis-
tricts is very low. Comparison of state share of
Agricultural land use is shown in the Figure 5.12.
Comparing the state share of Agricultural land use,
5.86% of Agriculture land of the state is in Alapuzha
district and 5.36% of Agricultural land is in Kottayam
district. The share of Agricultural land of
Pathanamthitta district is only 2.44%.
Figure 5.11: Percentage of Agricultural Land use of the
district -comparison with surrounding districts
Figure 5.12: State share (in %) of Agricultural Land of the
district - Comparison with surrounding districts
Comparison of the percentage of Plantation areas of
Pathanamthitta and surrounding districts is shown in
Figure.5.13. The figure shows that Kottayam district has
the highest percentage of plantation land area
followed by Idukki and Pathanamthitta. There is no
plantation area in Alapuzha district. Comparison of state
shares of Plantation land use is shown in the Figure
Figure 5.13: Percentage of Plantation Land use of the
district -comparison with surrounding districts
Figure 5.14: State share (in %) of Plantation Land of the district -
Comparison with surrounding districts
5.14. 38.81% of Plantation land of the state is in
Kottayam district, 34.33% in Idukki district and 13.57%
in Pathanamthitta district. The analysis shows that
nearly 87% of the state plantation area is concentrated
in three districts in the region –Kottayam, Idukki and
Pathanamthitta.
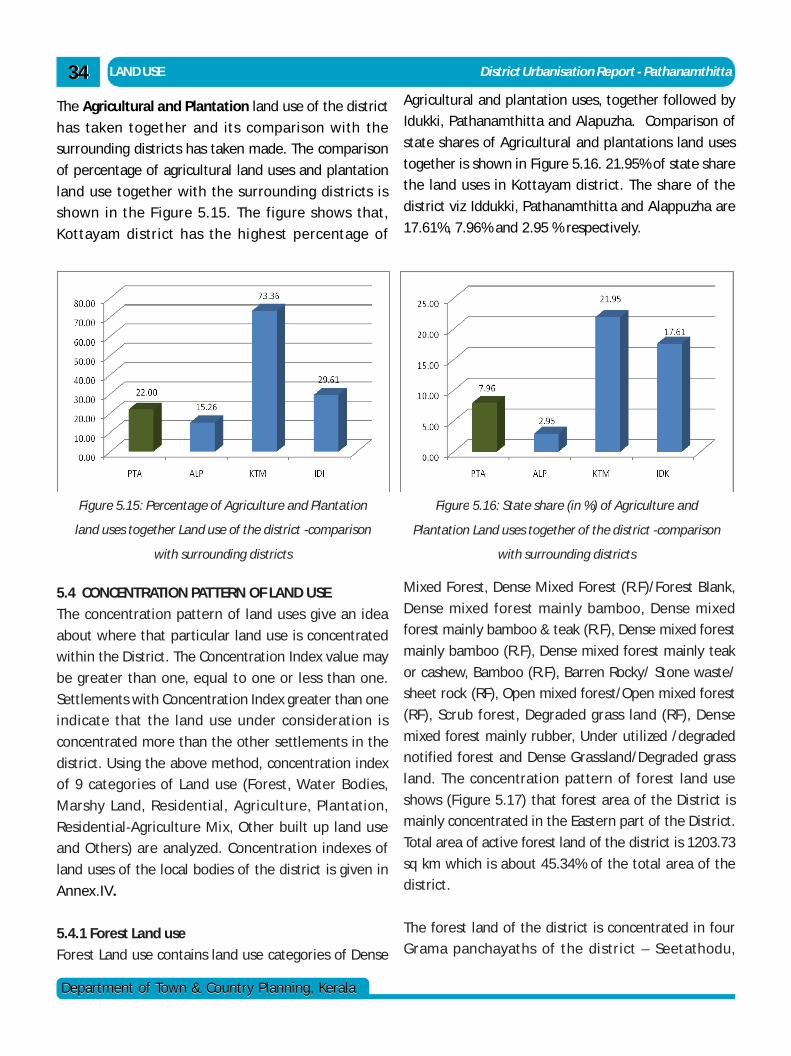
LAND USE District Urbanisation Report - Pathanamthitta3434
Department of Town & Country Planning, KeralaDepartment of Town & Country Planning, Kerala
The Agricultural and Plantation land use of the district
has taken together and its comparison with the
surrounding districts has taken made. The comparison
of percentage of agricultural land uses and plantation
land use together with the surrounding districts is
shown in the F igure 5.15. The figure shows that,
Kottayam district has the highest percentage of
5.4 CONCENTRATION PATTERN OF LAND USE
The concentration pattern of land uses give an idea
about where that particular land use is concentrated
within the District. The Concentration Index value may
be greater than one, equal to one or less than one.
Settlements with Concentration Index greater than one
indicate that the land use under consideration is
concentrated more than the other settlements in the
district. Using the above method, concentration index
of 9 categories of Land use (Forest, Water Bodies,
Marshy Land, Residential, Agriculture, Plantation,
Residential-Agriculture Mix, Other built up land use
and Others) are analyzed. Concentration indexes of
land uses of the local bodies of the district is given in
Annex.IV.
5.4.1 Forest Land use
Forest Land use contains land use categories of Dense
Agricultural and plantation uses, together followed by
Idukki, Pathanamthitta and Alapuzha. Comparison of
state shares of Agricultural and plantations land uses
together is shown in Figure 5.16. 21.95% of state share
the land uses in Kottayam district. The share of the
district viz Iddukki, Pathanamthitta and Alappuzha are
17.61%, 7.96% and 2.95 % respectively.
Figure 5.15: Percentage of Agriculture and Plantation
land uses together Land use of the district -comparison
with surrounding districts
Figure 5.16: State share (in %) of Agriculture and
Plantation Land uses together of the district -comparison
with surrounding districts
Mixed Forest, Dense Mixed Forest (R.F)/Forest Blank,
Dense mixed forest mainly bamboo, Dense mixed
forest mainly bamboo & teak (R.F), Dense mixed forest
mainly bamboo (R.F), Dense mixed forest mainly teak
or cashew, Bamboo (R.F), Barren Rocky/ Stone waste/
sheet rock (RF), Open mixed forest/Open mixed forest
(RF), Scrub forest, Degraded grass land (RF), Dense
mixed forest mainly rubber, Under utilized /degraded
notified forest and Dense Grassland/Degraded grass
land. The concentration pattern of forest land use
shows (Figure 5.17) that forest area of the District is
mainly concentrated in the Eastern part of the District.
Total area of active forest land of the district is 1203.73
sq km which is about 45.34% of the total area of the
district.
The forest land of the district is concentrated in four
Grama panchayaths of the district – Seetathodu,
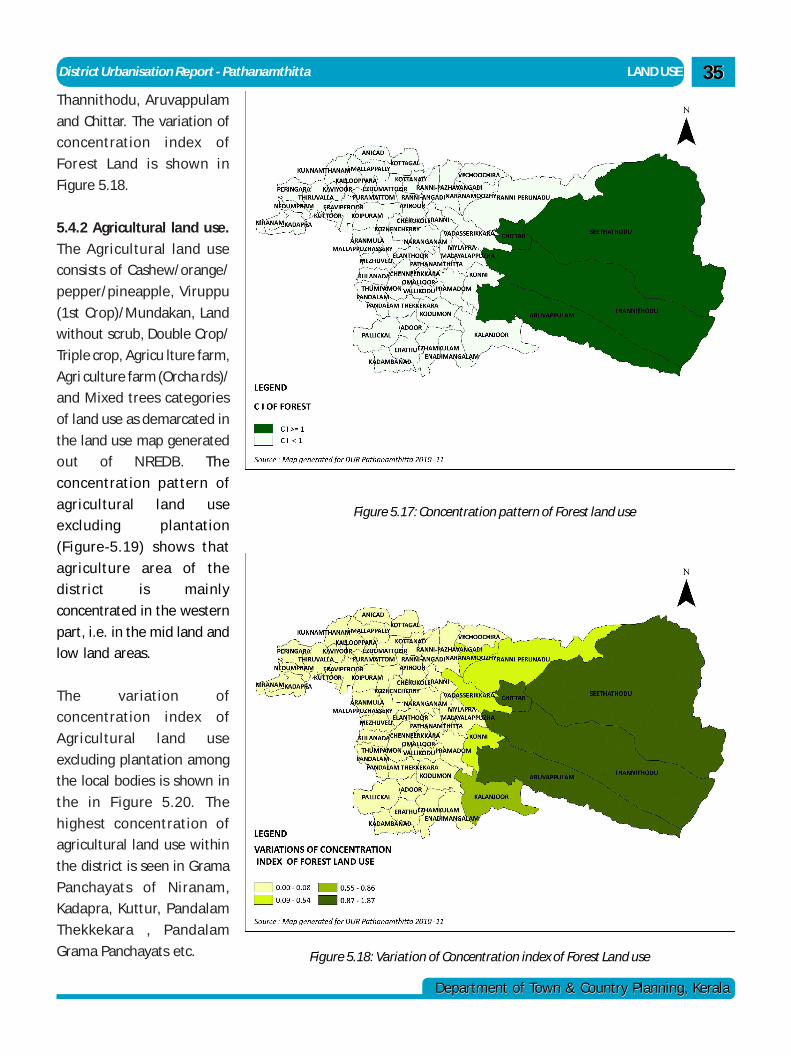
District Urbanisation Report - Pathanamthitta LAND USE
Department of Town & Country Planning, KeralaDepartment of Town & Country Planning, Kerala
3535Thannithodu, Aruvappulam
and Chittar. The variation of
concentration index of
Forest Land is shown in
Figure 5.18.
5.4.2 Agricultural land use.
The Agricultural land use
consists of Cashew/orange/
pepper/pineapple, Viruppu
(1st Crop)/Mundakan, Land
without scrub, Double Crop/
Triple crop, Agricu lture farm,
Agri culture farm (Orcha rds)/
and Mixed trees categories
of land use as demarcated in
the land use map generated
out of NREDB. The
concentration pattern of
agricultural land use
excluding plantation
(Figure-5.19) shows that
agriculture area of the
district is mainly
concentrated in the western
part, i.e. in the mid land and
low land areas.
The variation of
concentration index of
Agricultural land use
excluding plantation among
the local bodies is shown in
the in F igure 5.20. The
highest concentration of
agricultural land use within
the district is seen in Grama
Panchayats of Niranam,
Kadapra, Kuttur, Pandalam
Thekkekara , Pandalam
Grama Panchayats etc.
Figure 5.17: Concentration pattern of Forest land use
Figure 5.18: Variation of Concentration index of Forest Land use
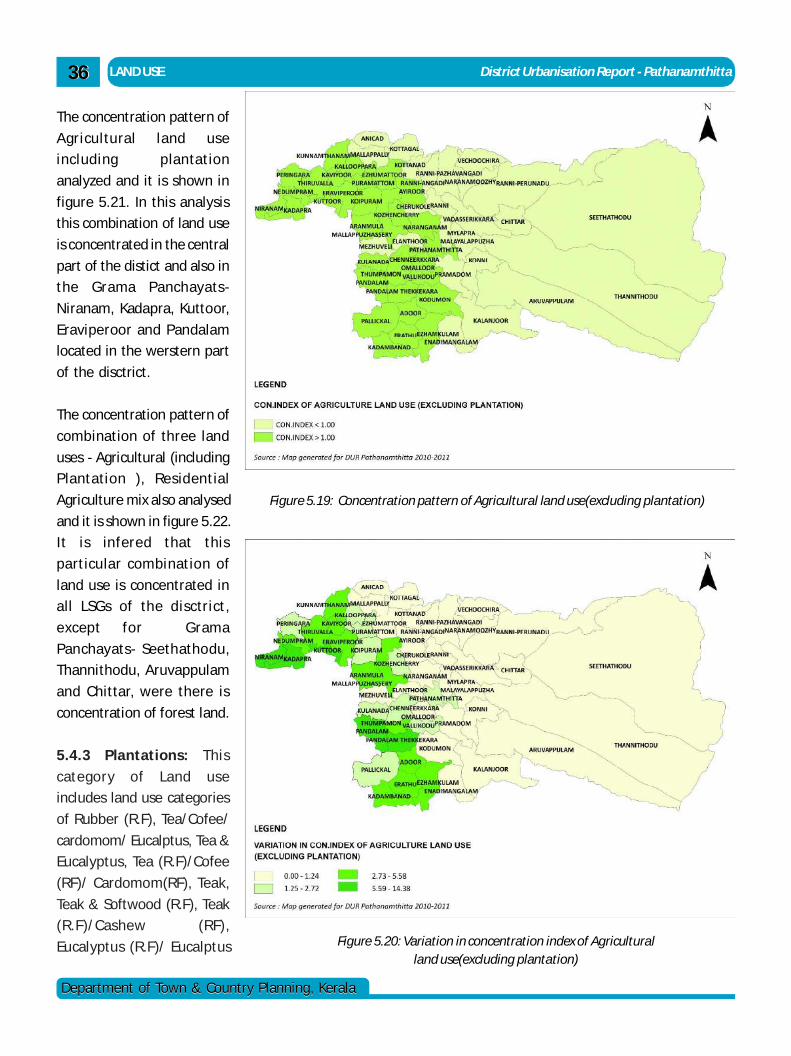
LAND USE District Urbanisation Report - Pathanamthitta3636
Department of Town & Country Planning, KeralaDepartment of Town & Country Planning, Kerala
The concentration pattern of
Agricultural land use
including plantation
analyzed and it is shown in
figure 5.21. In this analysis
this combination of land use
is concentrated in the central
part of the distict and also in
the Grama Panchayats-
Niranam, Kadapra, Kuttoor,
Eraviperoor and Pandalam
located in the werstern part
of the disctrict.
The concentration pattern of
combination of three land
uses - Agricultural (including
Plantation ), Residential
Agriculture mix also analysed
and it is shown in figure 5.22.
It is infered that this
particular combination of
land use is concentrated in
all LSGs of the disctrict,
except for Grama
Panchayats- Seethathodu,
Thannithodu, Aruvappulam
and Chittar, were there is
concentration of forest land.
5.4.3 Plantations: This
category of Land use
includes land use categories
of Rubber (R.F), Tea/Cofee/
cardomom/ Eucalptus, Tea &
Eucalyptus, Tea (R.F)/Cofee
(RF)/ Cardomom(RF), Teak,
Teak & Softwood (R.F), Teak
(R.F)/Cashew (RF),
Eucalyptus (R.F)/ Eucalptus
Figure 5.19: Concentration pattern of Agricultural land use(excluding plantation)
Figure 5.20: Variation in concentration index of Agriculturalland use(excluding plantation)
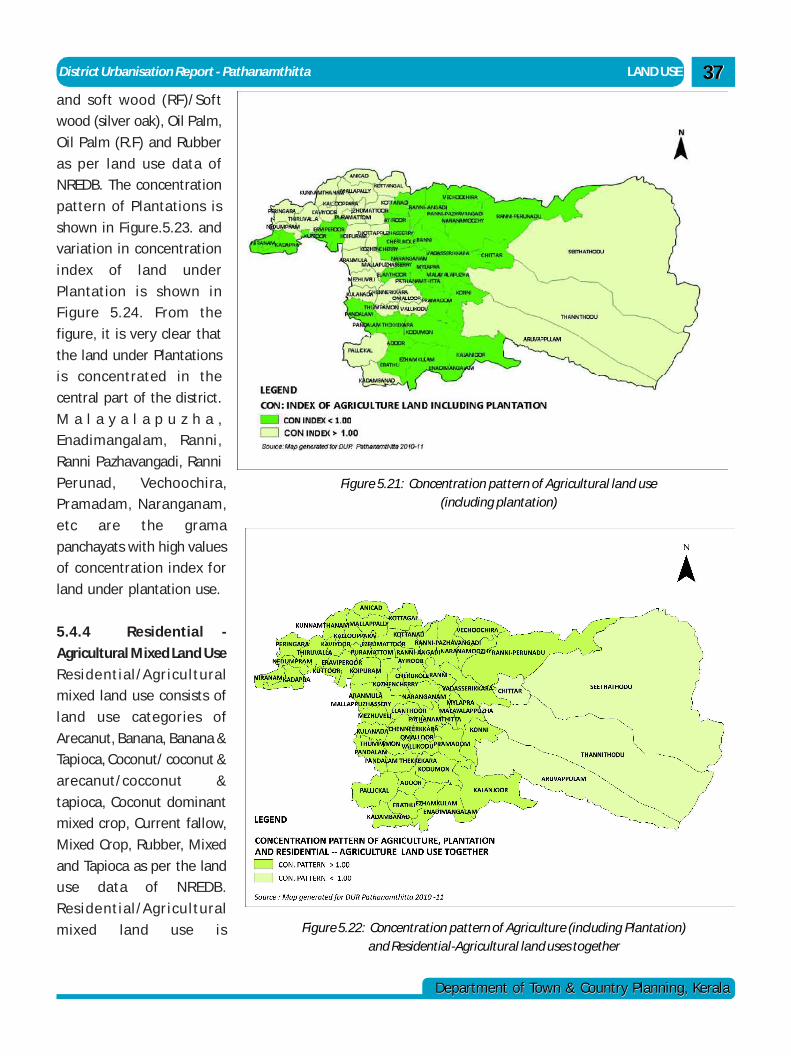
District Urbanisation Report - Pathanamthitta LAND USE
Department of Town & Country Planning, KeralaDepartment of Town & Country Planning, Kerala
3737and soft wood (RF)/Soft
wood (silver oak), Oil Palm,
Oil Palm (R.F) and Rubber
as per land use data of
NREDB. The concentration
pattern of Plantations is
shown in Figure.5.23. and
variation in concentration
index of land under
Plantation is shown in
F igure 5.24. From the
figure, it is very clear that
the land under Plantations
is concentrated in the
central part of the district.
M a l a y a l a p u z h a ,
Enadimangalam, Ranni,
Ranni Pazhavangadi, Ranni
Perunad, Vechoochira,
Pramadam, Naranganam,
etc are the grama
panchayats with high values
of concentration index for
land under plantation use.
5.4.4 Residential -
Agricultural Mixed Land Use
Residential/Agricu ltural
mixed land use consists of
land use categories of
Arecanut, Banana, Banana &
Tapioca, Coconut/ coconut &
arecanut/cocconut &
tapioca, Coconut dominant
mixed crop, Current fallow,
Mixed Crop, Rubber, Mixed
and Tapioca as per the land
use data of NREDB.
Residential/Agricu ltural
mixed land use is
Figure 5.21: Concentration pattern of Agricultural land use(including plantation)
Figure 5.22: Concentration pattern of Agriculture (including Plantation)and Residential-Agricultural land uses together
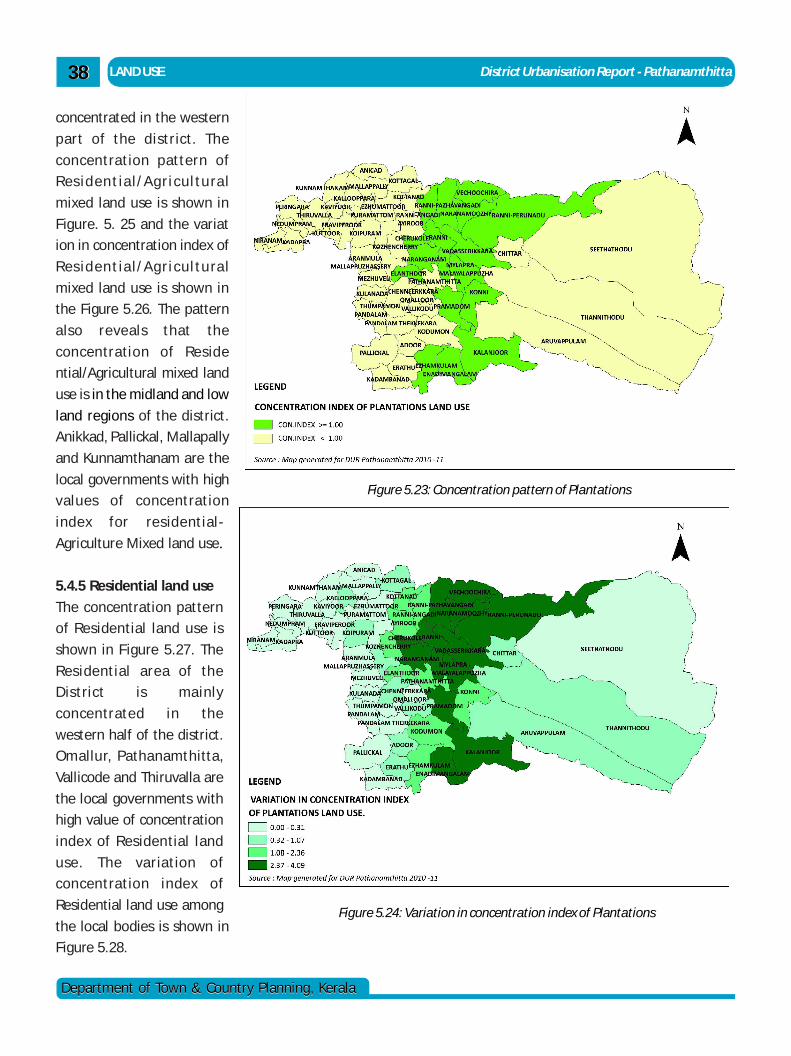
LAND USE District Urbanisation Report - Pathanamthitta3838
Department of Town & Country Planning, KeralaDepartment of Town & Country Planning, Kerala
concentrated in the western
part of the district. The
concentration pattern of
Res ident ia l/Ag ri cul tura l
mixed land use is shown in
Figure. 5. 25 and the variat
ion in concentration index of
Res ident ia l/Ag ri cul tura l
mixed land use is shown in
the Figure 5.26. The pattern
also reveals that the
concentration of Reside
ntial/Agricultural mixed land
use is in the midland and low
land regions of the district.
Anikkad, Pallickal, Mallapally
and Kunnamthanam are the
local governments with high
values of concentration
index for residential-
Agriculture Mixed land use.
5.4.5 Residential land use
The concentration pattern
of Residential land use is
shown in Figure 5.27. The
Residential area of the
District is mainly
concentrated in the
western half of the district.
Omallur, Pathanamthitta,
Vallicode and Thiruvalla are
the local governments with
high value of concentration
index of Residential land
use. The variation of
concentration index of
Residential land use among
the local bodies is shown in
Figure 5.28.
Figure 5.23: Concentration pattern of Plantations
Figure 5.24: Variation in concentration index of Plantations
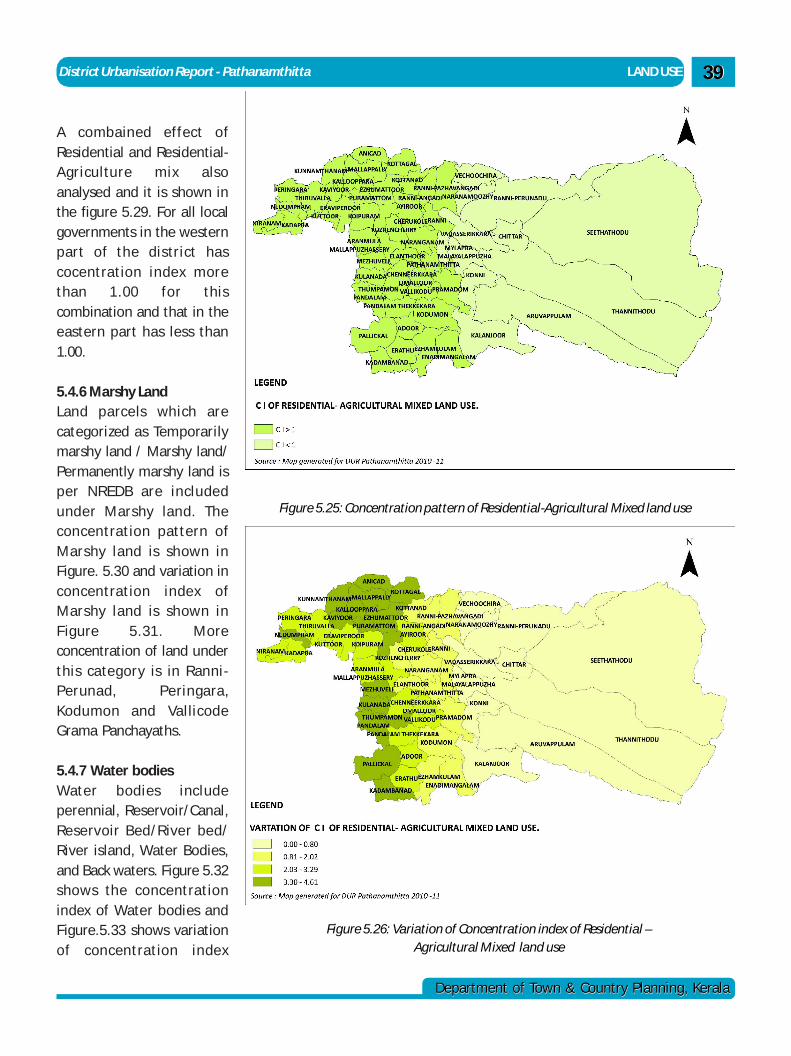
District Urbanisation Report - Pathanamthitta LAND USE
Department of Town & Country Planning, KeralaDepartment of Town & Country Planning, Kerala
3939
A combained effect ofResidential and Residential-Agriculture mix alsoanalysed and it is shown inthe figure 5.29. For all localgovernments in the westernpart of the district hascocentration index morethan 1.00 for thiscombination and that in theeastern part has less than1.00.
5.4.6 Marshy LandLand parcels which arecategorized as Temporarilymarshy land / Marshy land/Permanently marshy land isper NREDB are includedunder Marshy land. Theconcentration pattern ofMarshy land is shown inFigure. 5.30 and variation inconcentration index ofMarshy land is shown inF igure 5.31. Moreconcentration of land underthis category is in Ranni-Perunad, Peringara,Kodumon and VallicodeGrama Panchayaths.
5.4.7 Water bodiesWater bodies includeperennial, Reservoir/Canal,Reservoir Bed/River bed/River island, Water Bodies,and Back waters. Figure 5.32shows the concentrationindex of Water bodies andFigure.5.33 shows variationof concentration index
Figure 5.25: Concentration pattern of Residential-Agricultural Mixed land use
Figure 5.26: Variation of Concentration index of Residential –Agricultural Mixed land use
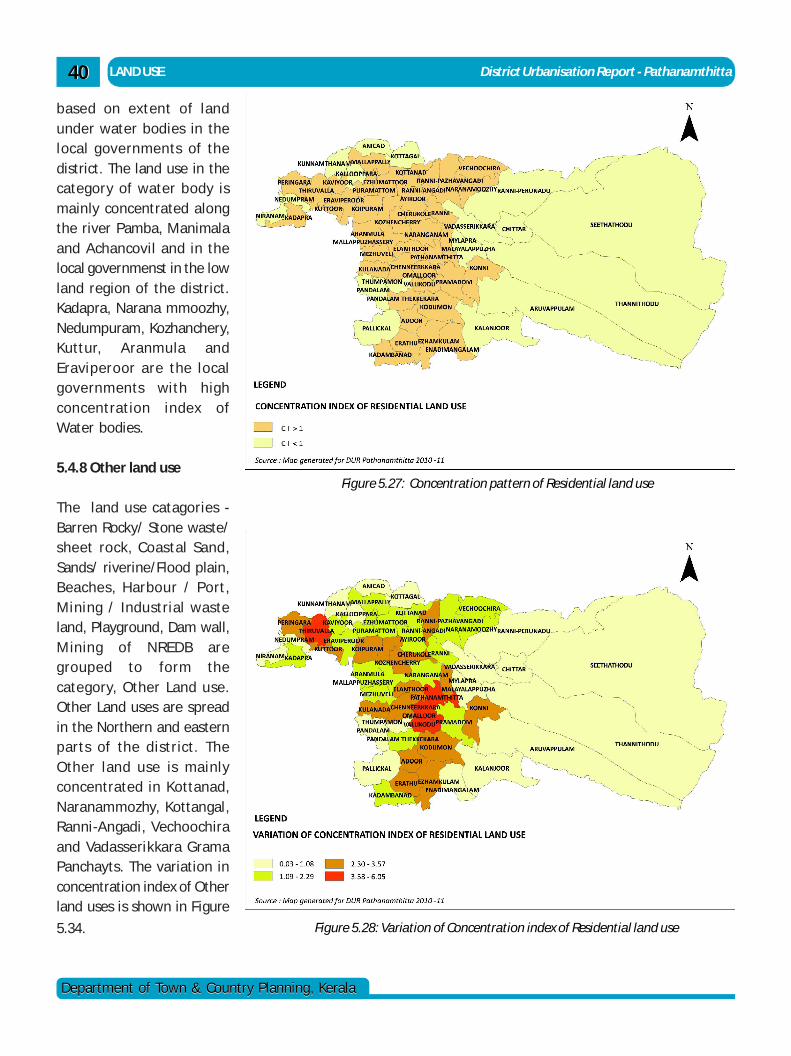
LAND USE District Urbanisation Report - Pathanamthitta4040
Department of Town & Country Planning, KeralaDepartment of Town & Country Planning, Kerala
based on extent of landunder water bodies in thelocal governments of thedistrict. The land use in thecategory of water body ismainly concentrated alongthe river Pamba, Manimalaand Achancovil and in thelocal governmenst in the lowland region of the district.Kadapra, Narana mmoozhy,Nedumpuram, Kozhanchery,Kuttur, Aranmula andEraviperoor are the localgovernments with highconcentration index ofWater bodies.
5.4.8 Other land use
The land use catagories -Barren Rocky/ Stone waste/sheet rock, Coastal Sand,Sands/ riverine/Flood plain,Beaches, Harbour / Port,Mining / Industrial wasteland, Playground, Dam wall,Mining of NREDB aregrouped to form thecategory, Other Land use.Other Land uses are spreadin the Northern and easternparts of the district. TheOther land use is mainlyconcentrated in Kottanad,Naranammozhy, Kottangal,Ranni-Angadi, Vechoochiraand Vadasserikkara GramaPanchayts. The variation inconcentration index of Otherland uses is shown in Figure
5.34.
Figure 5.27: Concentration pattern of Residential land use
Figure 5.28: Variation of Concentration index of Residential land use
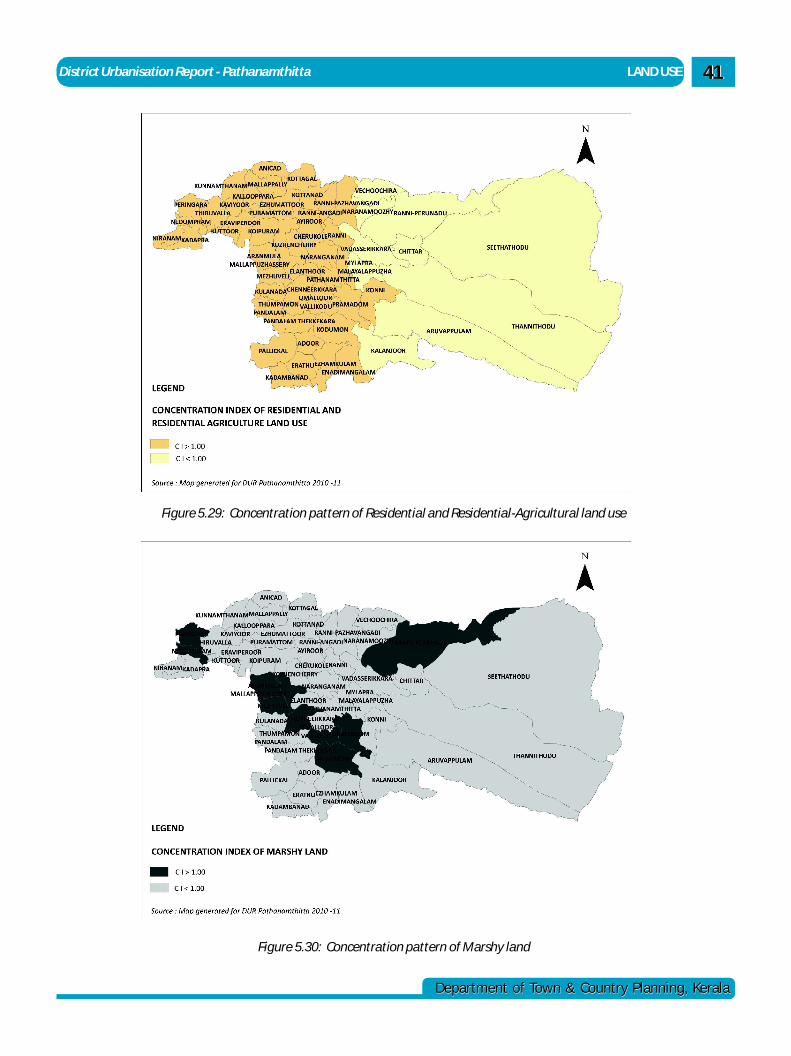
District Urbanisation Report - Pathanamthitta LAND USE
Department of Town & Country Planning, KeralaDepartment of Town & Country Planning, Kerala
4141
Figure 5.29: Concentration pattern of Residential and Residential-Agricultural land use
Figure 5.30: Concentration pattern of Marshy land
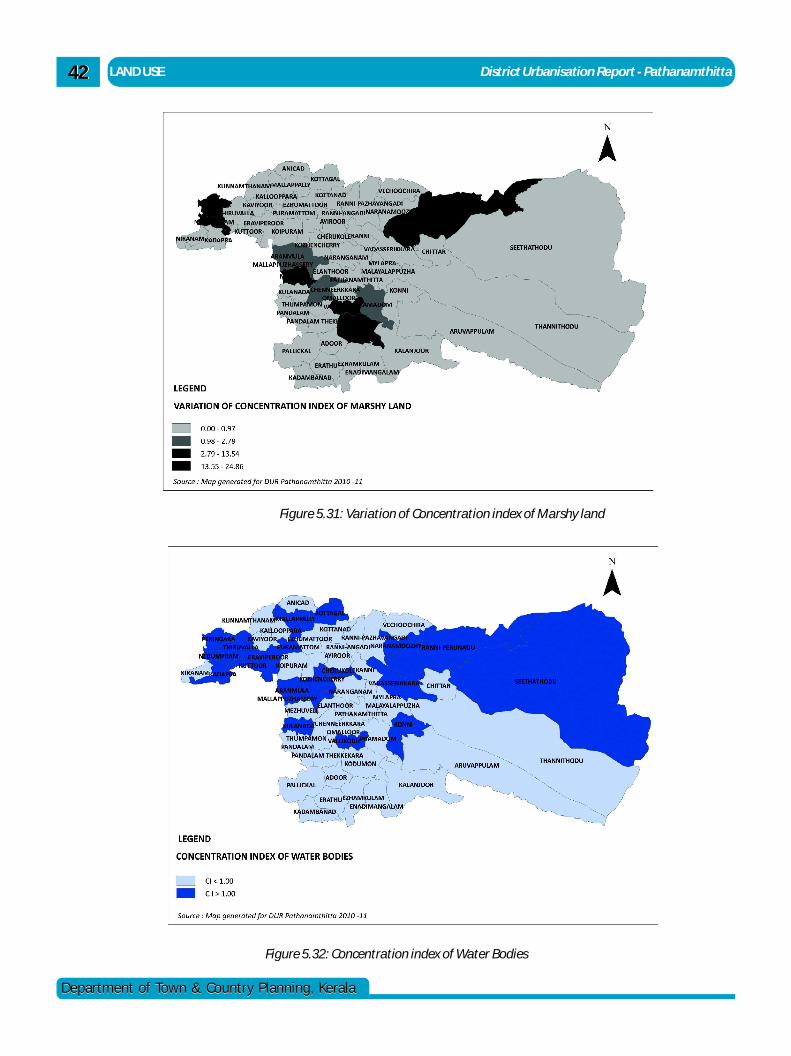
LAND USE District Urbanisation Report - Pathanamthitta4242
Department of Town & Country Planning, KeralaDepartment of Town & Country Planning, Kerala
Figure 5.31: Variation of Concentration index of Marshy land
Figure 5.32: Concentration index of Water Bodies
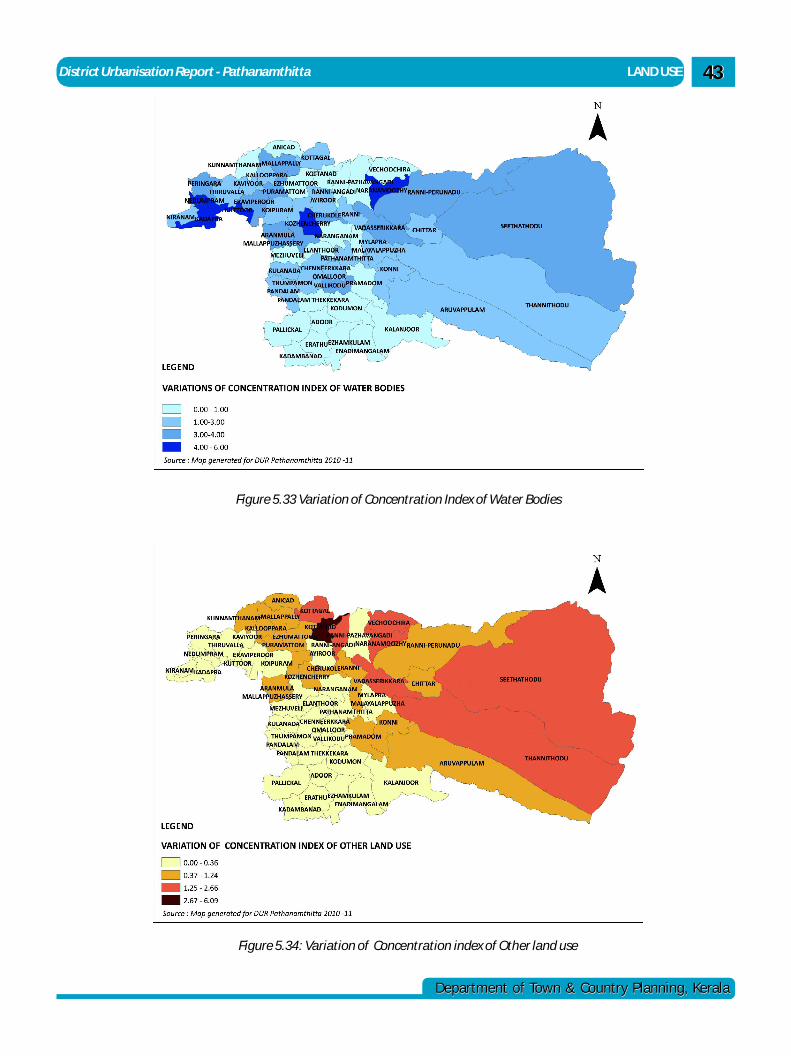
District Urbanisation Report - Pathanamthitta LAND USE
Department of Town & Country Planning, KeralaDepartment of Town & Country Planning, Kerala
4343
Figure 5.33 Variation of Concentration Index of Water Bodies
Figure 5.34: Variation of Concentration index of Other land use
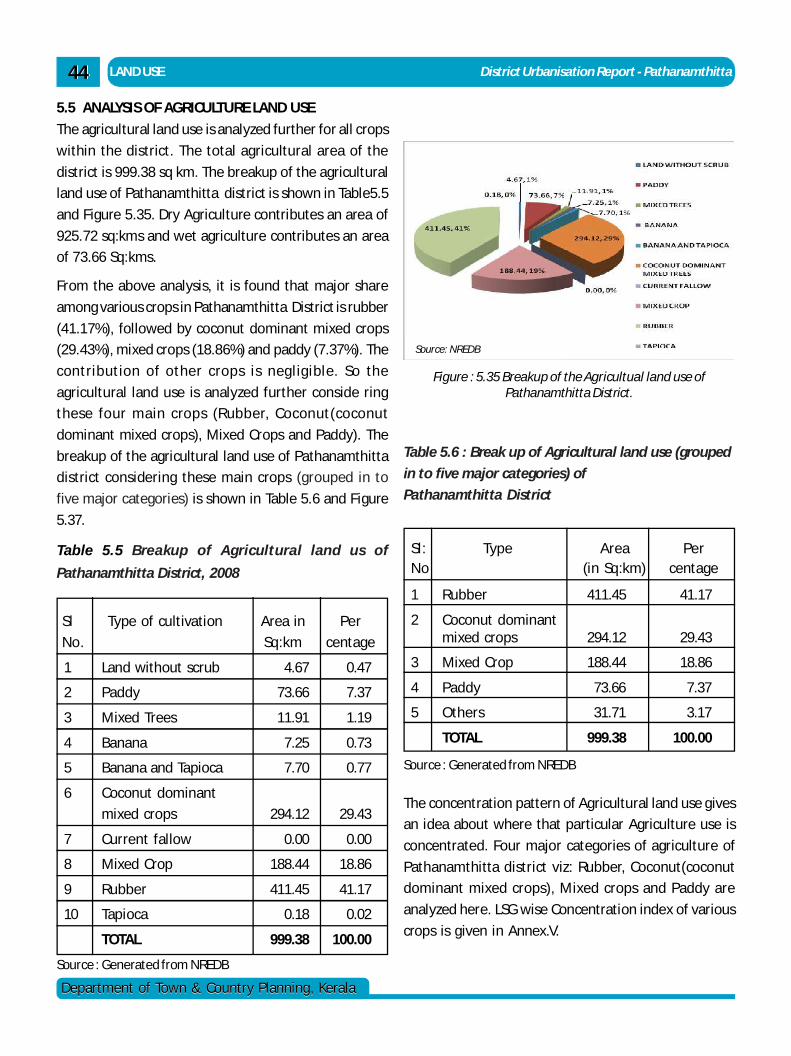
LAND USE District Urbanisation Report - Pathanamthitta4444
Department of Town & Country Planning, KeralaDepartment of Town & Country Planning, Kerala
Table 5.6 : Break up of Agricultural land use (grouped
in to five major categories) of
Pathanamthitta District
The concentration pattern of Agricultural land use gives
an idea about where that particular Agriculture use is
concentrated. Four major categories of agriculture of
Pathanamthitta district viz: Rubber, Coconut(coconut
dominant mixed crops), Mixed crops and Paddy are
analyzed here. LSG wise Concentration index of various
crops is given in Annex.V.
Sl: Type Area PerNo (in Sq:km) centage
1 Rubber 411.45 41.17
2 Coconut dominantmixed crops 294.12 29.43
3 Mixed Crop 188.44 18.86
4 Paddy 73.66 7.37
5 Others 31.71 3.17
TOTAL 999.38 100.00
Source : Generated from NREDB
5.5 ANALYSIS OF AGRICULTURE LAND USE
The agricultural land use is analyzed further for all crops
within the district. The total agricultural area of the
district is 999.38 sq km. The breakup of the agricultural
land use of Pathanamthitta district is shown in Table5.5
and Figure 5.35. Dry Agriculture contributes an area of
925.72 sq:kms and wet agriculture contributes an area
of 73.66 Sq:kms.
From the above analysis, it is found that major share
among various crops in Pathanamthitta District is rubber
(41.17%), followed by coconut dominant mixed crops
(29.43%), mixed crops (18.86%) and paddy (7.37%). The
contribution of other crops is negligible. So the
agricultural land use is analyzed further conside ring
these four main crops (Rubber, Coconut(coconut
dominant mixed crops), Mixed Crops and Paddy). The
breakup of the agricultural land use of Pathanamthitta
district considering these main crops (grouped in to
five major categories) is shown in Table 5.6 and Figure
5.37.
Source : Generated from NREDB
Sl Type of cultivation Area in Per
No. Sq:km centage
1 Land without scrub 4.67 0.47
2 Paddy 73.66 7.37
3 Mixed Trees 11.91 1.19
4 Banana 7.25 0.73
5 Banana and Tapioca 7.70 0.77
6 Coconut dominant
mixed crops 294.12 29.43
7 Current fallow 0.00 0.00
8 Mixed Crop 188.44 18.86
9 Rubber 411.45 41.17
10 Tapioca 0.18 0.02
TOTAL 999.38 100.00
Table 5.5 Breakup of Agricultural land us of
Pathanamthitta District, 2008
Source: NREDB
Figure : 5.35 Breakup of the Agricultual land use ofPathanamthitta District.
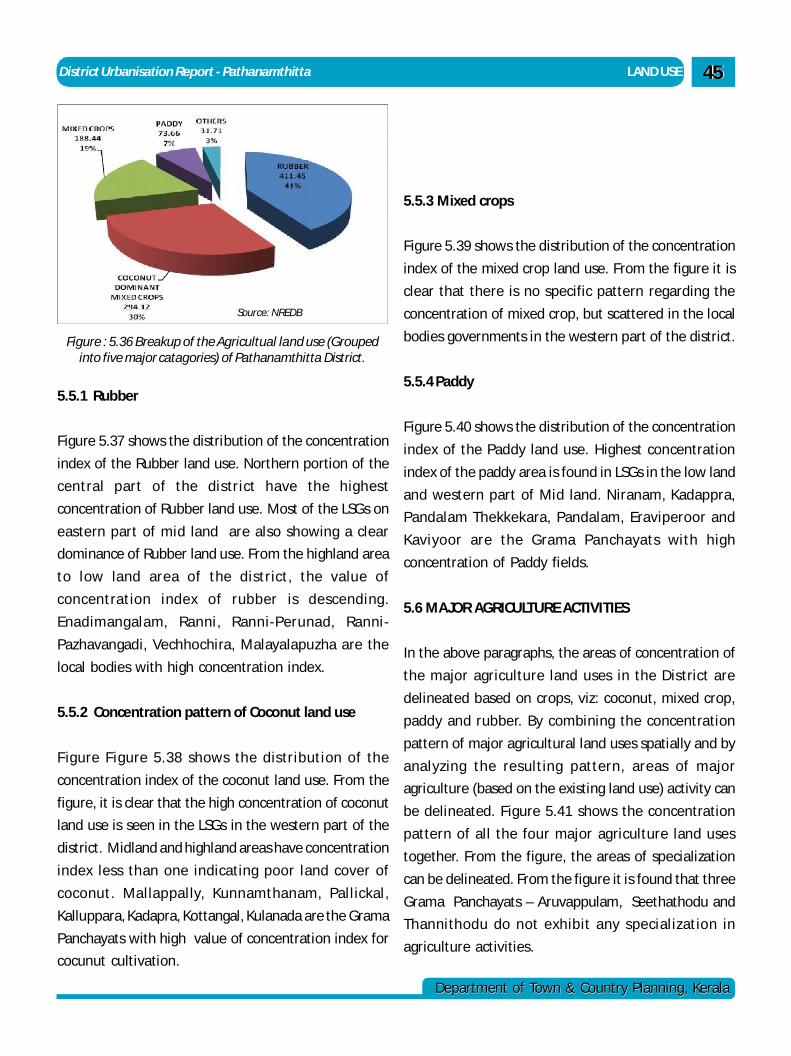
District Urbanisation Report - Pathanamthitta LAND USE
Department of Town & Country Planning, KeralaDepartment of Town & Country Planning, Kerala
4545
5.5.1 Rubber
Figure 5.37 shows the distribution of the concentration
index of the Rubber land use. Northern portion of the
central part of the district have the highest
concentration of Rubber land use. Most of the LSGs on
eastern part of mid land are also showing a clear
dominance of Rubber land use. From the highland area
to low land area of the district, the value of
concentration index of rubber is descending.
Enadimangalam, Ranni, Ranni-Perunad, Ranni-
Pazhavangadi, Vechhochira, Malayalapuzha are the
local bodies with high concentration index.
5.5.2 Concentration pattern of Coconut land use
F igure Figure 5.38 shows the distribution of the
concentration index of the coconut land use. From the
figure, it is clear that the high concentration of coconut
land use is seen in the LSGs in the western part of the
district. Midland and highland areas have concentration
index less than one indicating poor land cover of
coconut. Mallappally, Kunnamthanam, Pallickal,
Kalluppara, Kadapra, Kottangal, Kulanada are the Grama
Panchayats with high value of concentration index for
cocunut cultivation.
Figure 5.37: Breakup of Agricultural land use (grouped in
Source: NREDB
5.5.3 Mixed crops
Figure 5.39 shows the distribution of the concentration
index of the mixed crop land use. From the figure it is
clear that there is no specific pattern regarding the
concentration of mixed crop, but scattered in the local
bodies governments in the western part of the district.
5.5.4 Paddy
Figure 5.40 shows the distribution of the concentration
index of the Paddy land use. Highest concentration
index of the paddy area is found in LSGs in the low land
and western part of Mid land. Niranam, Kadappra,
Pandalam Thekkekara, Pandalam, Eraviperoor and
Kaviyoor are the Grama Panchayats with high
concentration of Paddy fields.
5.6 MAJOR AGRICULTURE ACTIVITIES
In the above paragraphs, the areas of concentration of
the major agriculture land uses in the District are
delineated based on crops, viz: coconut, mixed crop,
paddy and rubber. By combining the concentration
pattern of major agricultural land uses spatially and by
analyzing the resulting pattern, areas of major
agriculture (based on the existing land use) activity can
be delineated. Figure 5.41 shows the concentration
pattern of all the four major agriculture land uses
together. From the figure, the areas of specialization
can be delineated. From the figure it is found that three
Grama Panchayats – Aruvappulam, Seethathodu and
Thannithodu do not exhibit any specialization in
agriculture activities.
Figure : 5.36 Breakup of the Agricultual land use (Groupedinto five major catagories) of Pathanamthitta District.
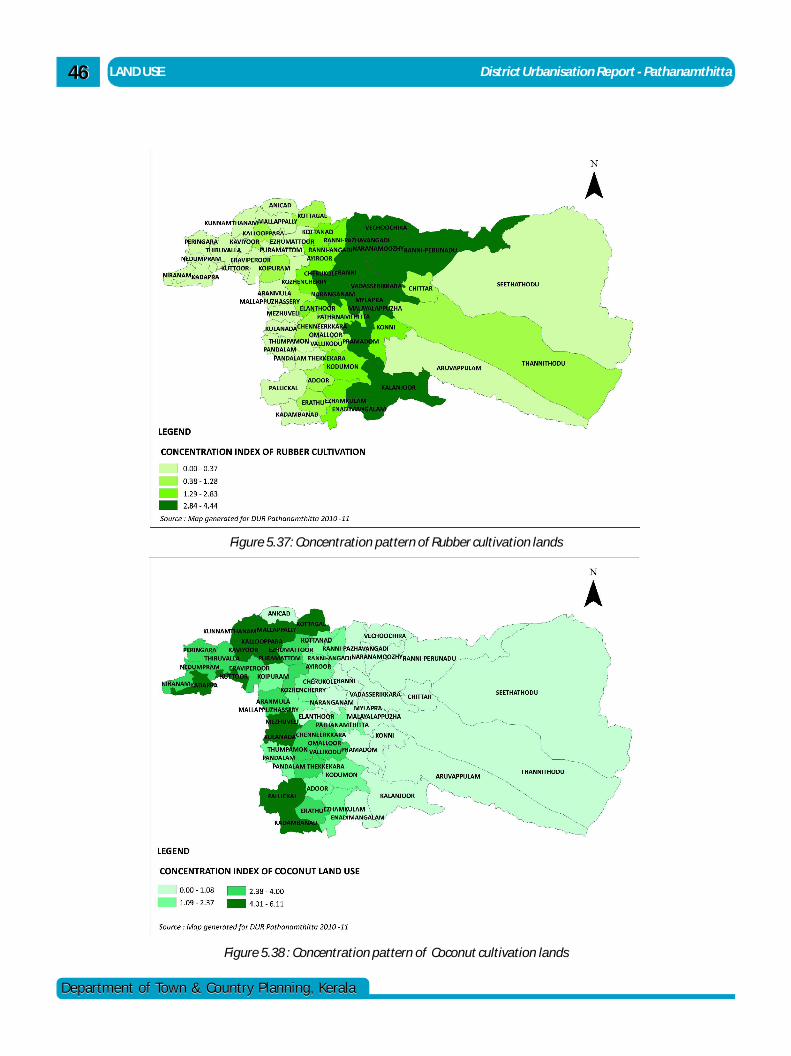
LAND USE District Urbanisation Report - Pathanamthitta4646
Department of Town & Country Planning, KeralaDepartment of Town & Country Planning, Kerala
Figure 5.37: Concentration pattern of Rubber cultivation lands
Figure 5.38 : Concentration pattern of Coconut cultivation lands
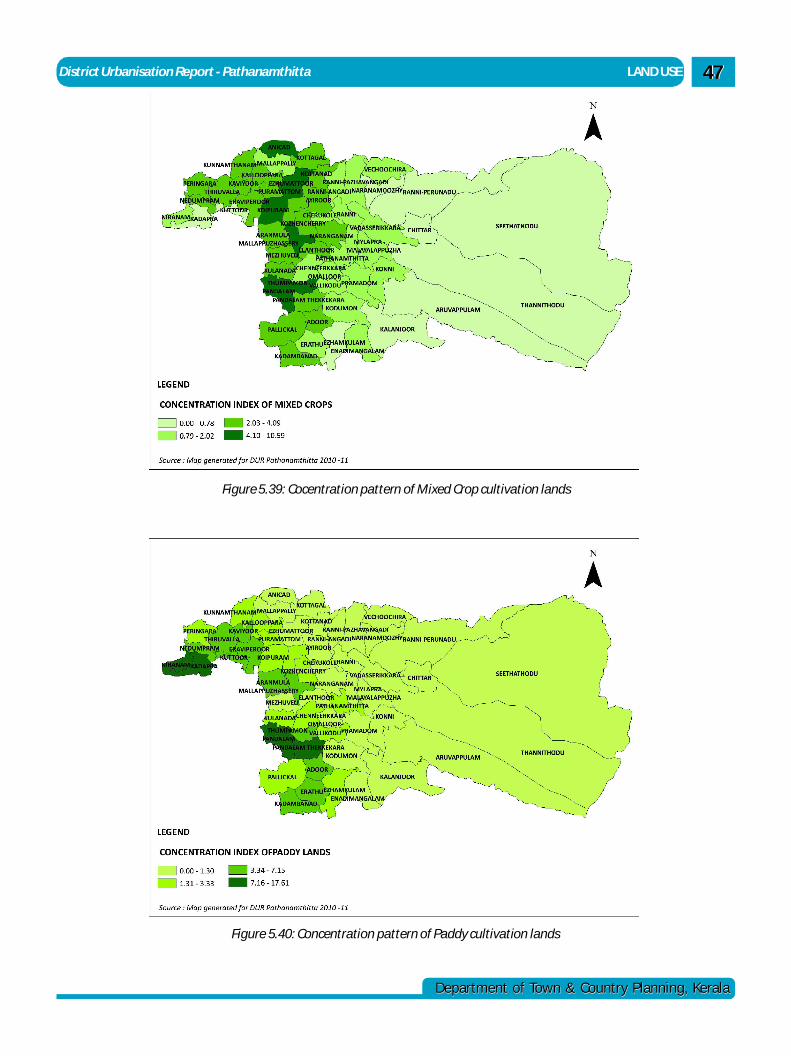
District Urbanisation Report - Pathanamthitta LAND USE
Department of Town & Country Planning, KeralaDepartment of Town & Country Planning, Kerala
4747
Figure 5.40: Concentration pattern of Paddy cultivation lands
Figure 5.39: Cocentration pattern of Mixed Crop cultivation lands
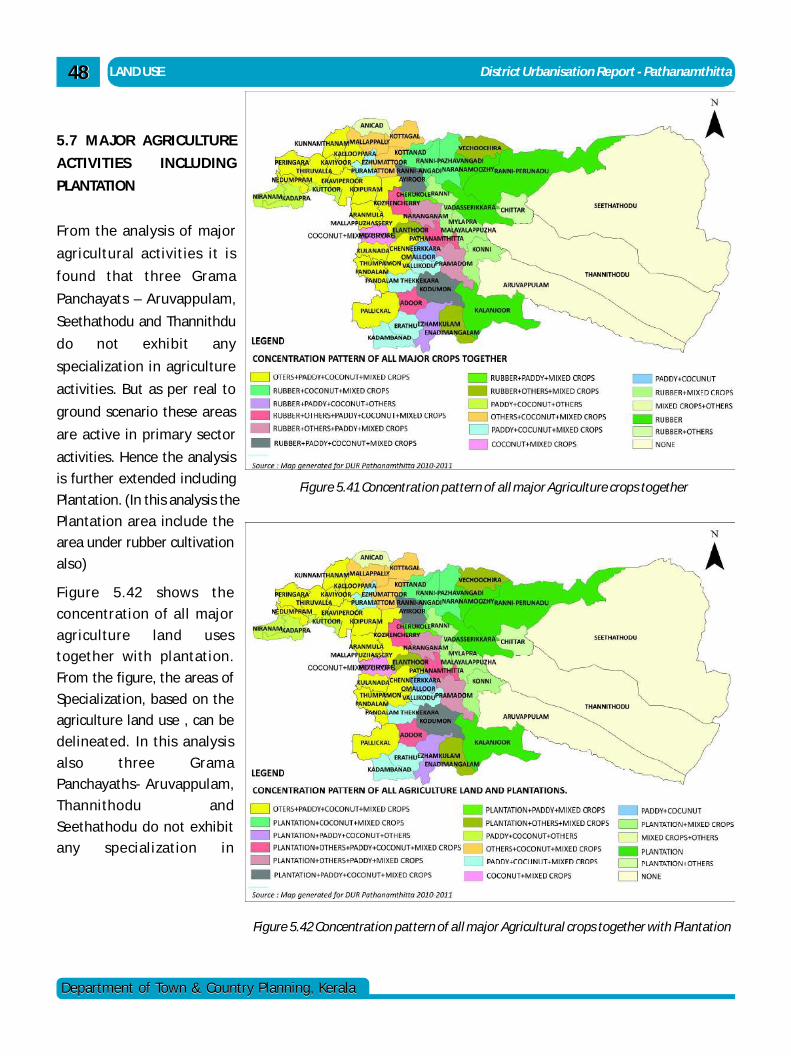
LAND USE District Urbanisation Report - Pathanamthitta4848
Department of Town & Country Planning, KeralaDepartment of Town & Country Planning, Kerala
5.7 MAJOR AGRICULTURE
ACTIVITIES INCLUDING
PLANTATION
From the analysis of major
agricultural activities it is
found that three Grama
Panchayats – Aruvappulam,
Seethathodu and Thannithdu
do not exhibit any
specialization in agriculture
activities. But as per real to
ground scenario these areas
are active in primary sector
activities. Hence the analysis
is further extended including
Plantation. (In this analysis the
Plantation area include the
area under rubber cultivation
also)
F igure 5.42 shows the
concentration of all major
agriculture land uses
together with plantation.
From the figure, the areas of
Specialization, based on the
agriculture land use , can be
delineated. In this analysis
also three Grama
Panchayaths- Aruvappulam,
Thannithodu and
Seethathodu do not exhibit
any specialization in
Figure 5.41 Concentration pattern of all major Agriculture crops together
Figure 5.42 Concentration pattern of all major Agricultural crops together with Plantation
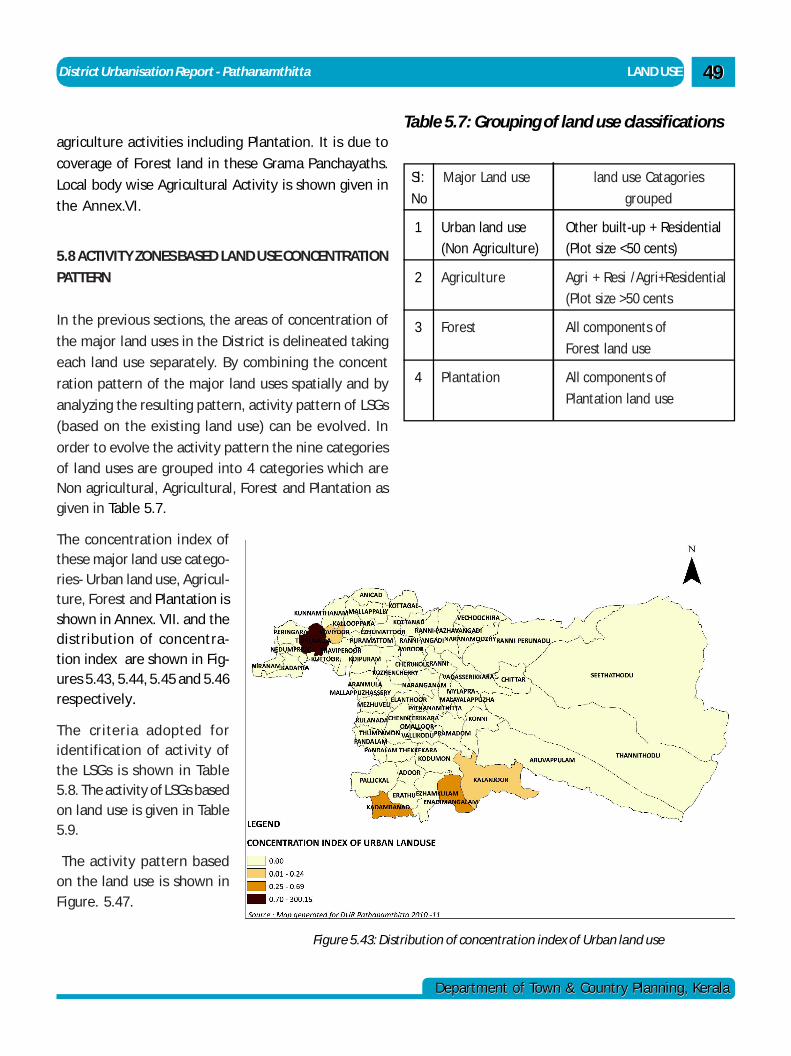
District Urbanisation Report - Pathanamthitta LAND USE
Department of Town & Country Planning, KeralaDepartment of Town & Country Planning, Kerala
4949
agriculture activities including Plantation. It is due to
coverage of Forest land in these Grama Panchayaths.
Local body wise Agricultural Activity is shown given in
the Annex.VI.
5.8 ACTIVITY ZONES BASED LAND USE CONCENTRATION
PATTERN
In the previous sections, the areas of concentration of
the major land uses in the District is delineated taking
each land use separately. By combining the concent
ration pattern of the major land uses spatially and by
analyzing the resulting pattern, activity pattern of LSGs
(based on the existing land use) can be evolved. In
order to evolve the activity pattern the nine categoriesof land uses are grouped into 4 categories which areNon agricultural, Agricultural, Forest and Plantation asgiven in Table 5.7.
The concentration index ofthese major land use catego-ries- Urban land use, Agricul-ture, Forest and Plantation isshown in Annex. VII. and thedistribution of concentra-tion index are shown in Fig-ures 5.43, 5.44, 5.45 and 5.46respectively.
The criteria adopted foridentification of activity ofthe LSGs is shown in Table5.8. The activity of LSGs basedon land use is given in Table5.9.
The activity pattern basedon the land use is shown inFigure. 5.47.
Sl: Major Land use land use Catagories
No grouped
1 Urban land use Other built-up + Residential
(Non Agriculture) (Plot size <50 cents)
2 Agriculture Agri + Resi /Agri+Residential
(Plot size >50 cents
3 Forest All components of
Forest land use
4 Plantation All components of
Plantation land use
Table 5.7: Grouping of land use classifications
Figure 5.43: Distribution of concentration index of Urban land use
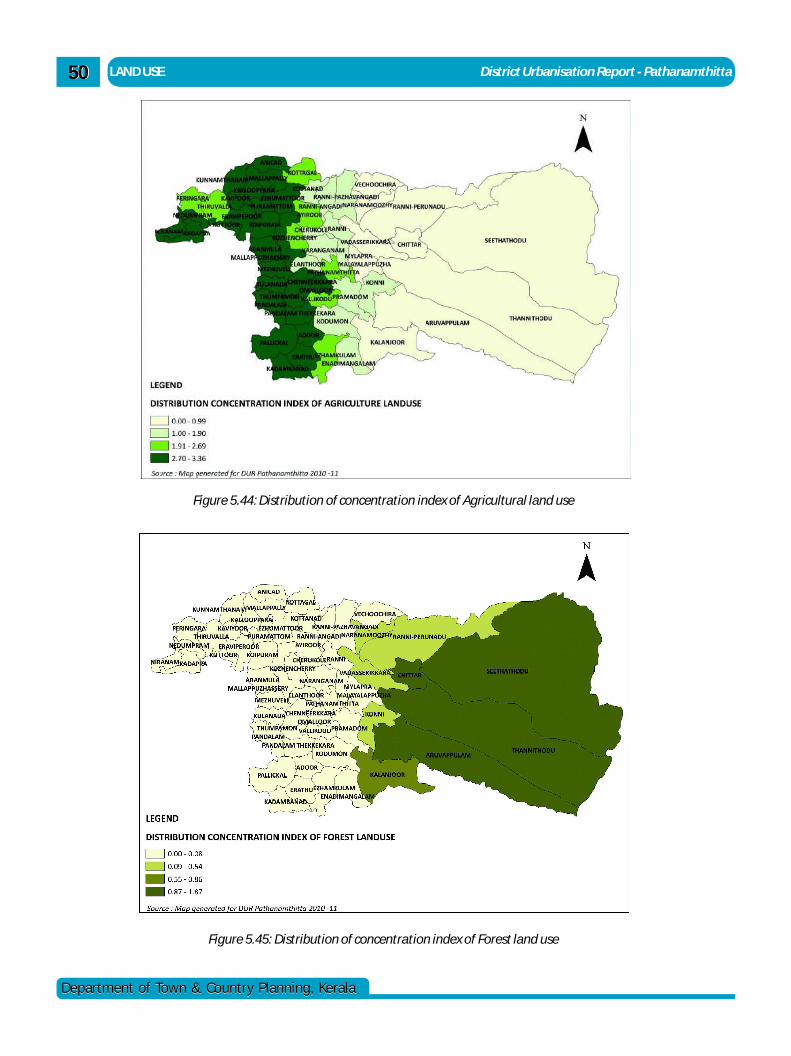
LAND USE District Urbanisation Report - Pathanamthitta5050
Department of Town & Country Planning, KeralaDepartment of Town & Country Planning, Kerala
Figure 5.44: Distribution of concentration index of Agricultural land use
Figure 5.45: Distribution of concentration index of Forest land use
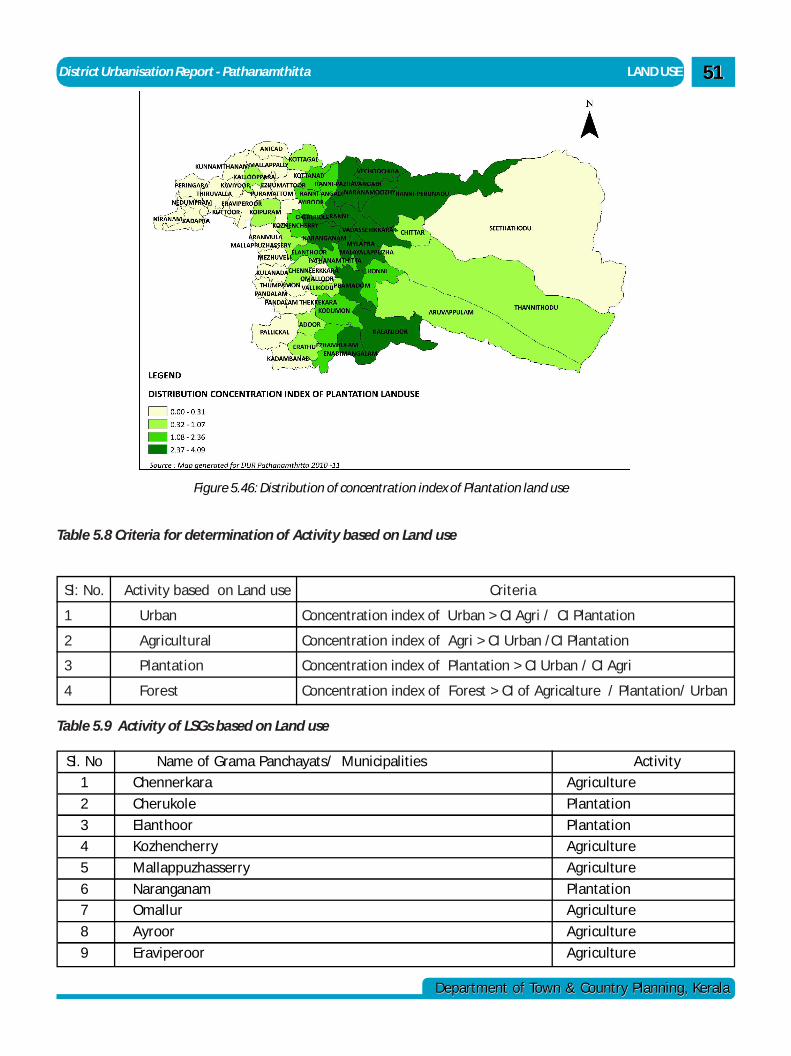
District Urbanisation Report - Pathanamthitta LAND USE
Department of Town & Country Planning, KeralaDepartment of Town & Country Planning, Kerala
5151
Sl: No. Activity based on Land use Criteria
1 Urban Concentration index of Urban > CI Agri / CI Plantation
2 Agricultural Concentration index of Agri > CI Urban /CI Plantation
3 Plantation Concentration index of Plantation > CI Urban / CI Agri
4 Forest Concentration index of Forest > CI of Agricalture / Plantation/ Urban
Table 5.8 Criteria for determination of Activity based on Land use
Figure 5.46: Distribution of concentration index of Plantation land use
Sl. No Name of Grama Panchayats/ Municipalities Activity
1 Chennerkara Agriculture
2 Cherukole Plantation
3 Elanthoor Plantation
4 Kozhencherry Agriculture
5 Mallappuzhasserry Agriculture
6 Naranganam Plantation
7 Omallur Agriculture
8 Ayroor Agriculture
9 Eraviperoor Agriculture
Table 5.9 Activity of LSGs based on Land use
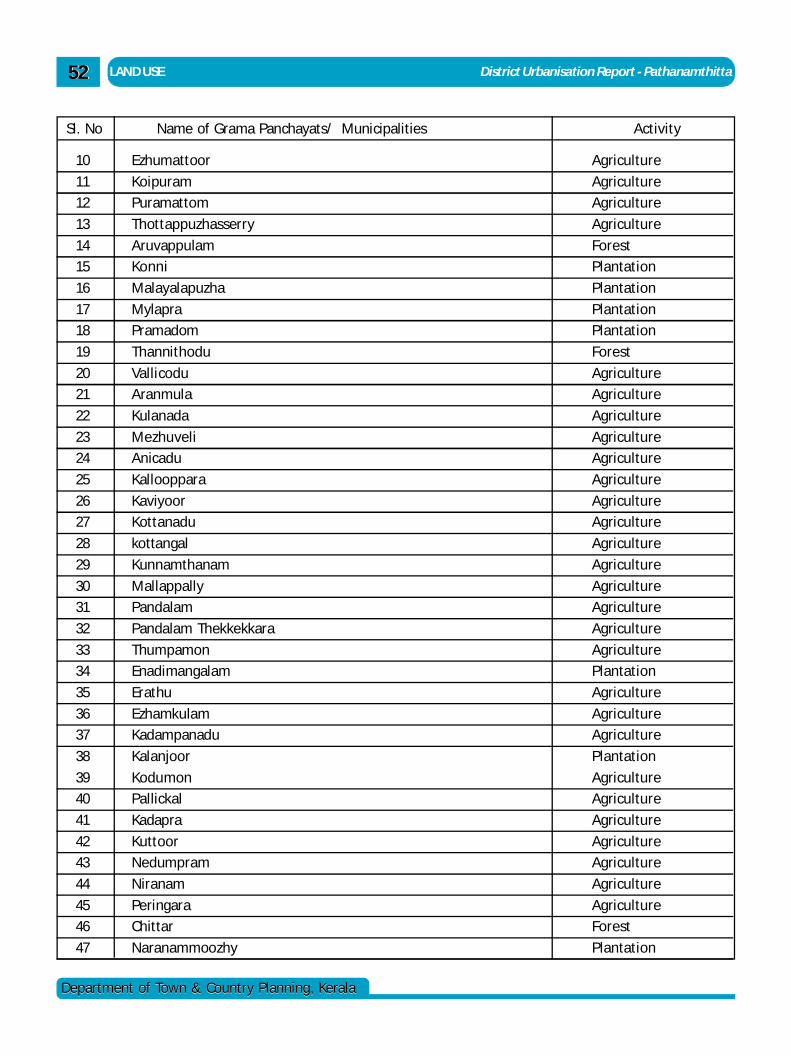
LAND USE District Urbanisation Report - Pathanamthitta5252
Department of Town & Country Planning, KeralaDepartment of Town & Country Planning, Kerala
10 Ezhumattoor Agriculture
11 Koipuram Agriculture
12 Puramattom Agriculture
13 Thottappuzhasserry Agriculture
14 Aruvappulam Forest
15 Konni Plantation
16 Malayalapuzha Plantation
17 Mylapra Plantation
18 Pramadom Plantation
19 Thannithodu Forest
20 Vallicodu Agriculture
21 Aranmula Agriculture
22 Kulanada Agriculture
23 Mezhuveli Agriculture
24 Anicadu Agriculture
25 Kallooppara Agriculture
26 Kaviyoor Agriculture
27 Kottanadu Agriculture
28 kottangal Agriculture
29 Kunnamthanam Agriculture
30 Mallappally Agriculture
31 Pandalam Agriculture
32 Pandalam Thekkekkara Agriculture
33 Thumpamon Agriculture
34 Enadimangalam Plantation
35 Erathu Agriculture
36 Ezhamkulam Agriculture
37 Kadampanadu Agriculture
38 Kalanjoor Plantation
39 Kodumon Agriculture
40 Pallickal Agriculture
41 Kadapra Agriculture
42 Kuttoor Agriculture
43 Nedumpram Agriculture
44 Niranam Agriculture
45 Peringara Agriculture
46 Chittar Forest
47 Naranammoozhy Plantation
Sl. No Name of Grama Panchayats/ Municipalities Activity
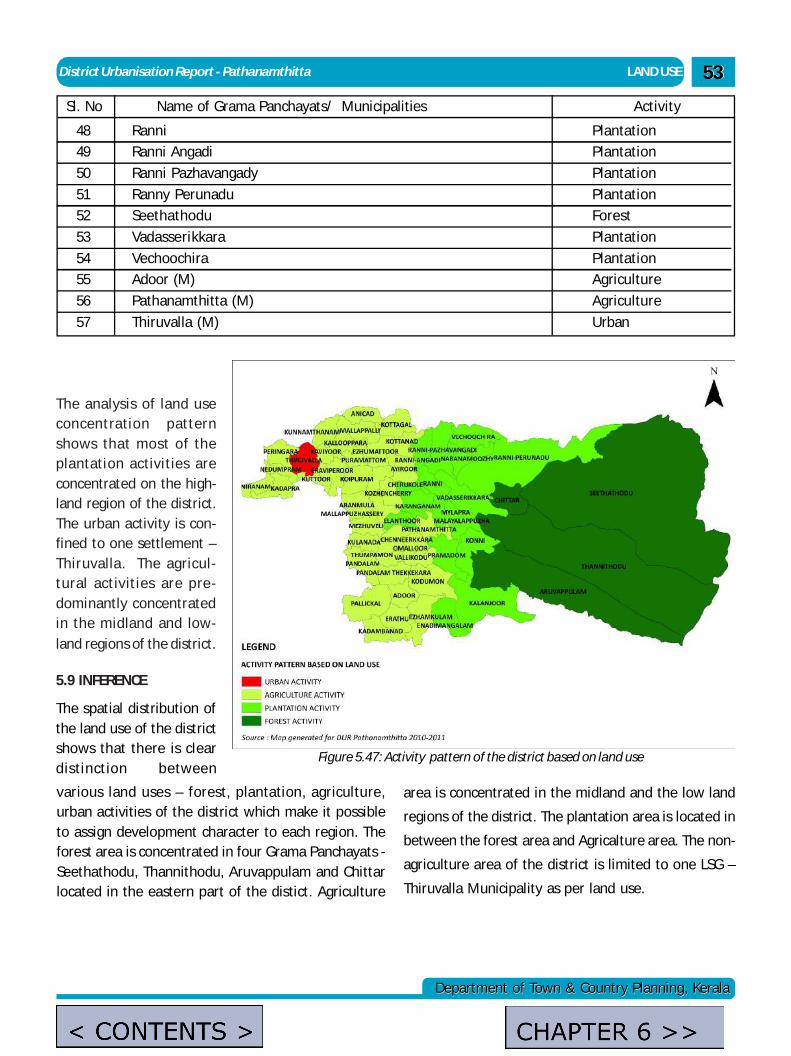
District Urbanisation Report - Pathanamthitta LAND USE
Department of Town & Country Planning, KeralaDepartment of Town & Country Planning, Kerala
5353
The analysis of land useconcentration patternshows that most of theplantation activities areconcentrated on the high-land region of the district.The urban activity is con-fined to one settlement –Thiruvalla. The agricul-tural activities are pre-dominantly concentratedin the midland and low-land regions of the district.
5.9 INFERENCE
The spatial distribution ofthe land use of the districtshows that there is cleardistinction between
area is concentrated in the midland and the low land
regions of the district. The plantation area is located in
between the forest area and Agricalture area. The non-
agriculture area of the district is limited to one LSG –
Thiruvalla Municipality as per land use.
Sl. No Name of Grama Panchayats/ Municipalities Activity
48 Ranni Plantation
49 Ranni Angadi Plantation
50 Ranni Pazhavangady Plantation
51 Ranny Perunadu Plantation
52 Seethathodu Forest
53 Vadasserikkara Plantation
54 Vechoochira Plantation
55 Adoor (M) Agriculture
56 Pathanamthitta (M) Agriculture
57 Thiruvalla (M) Urban
Figure 5.47: Activity pattern of the district based on land use
various land uses – forest, plantation, agriculture,urban activities of the district which make it possibleto assign development character to each region. Theforest area is concentrated in four Grama Panchayats -Seethathodu, Thannithodu, Aruvappulam and Chittarlocated in the eastern part of the distict. Agriculture
admin
Text Box
< CONTENTS >
admin
Text Box
CHAPTER 6 >>
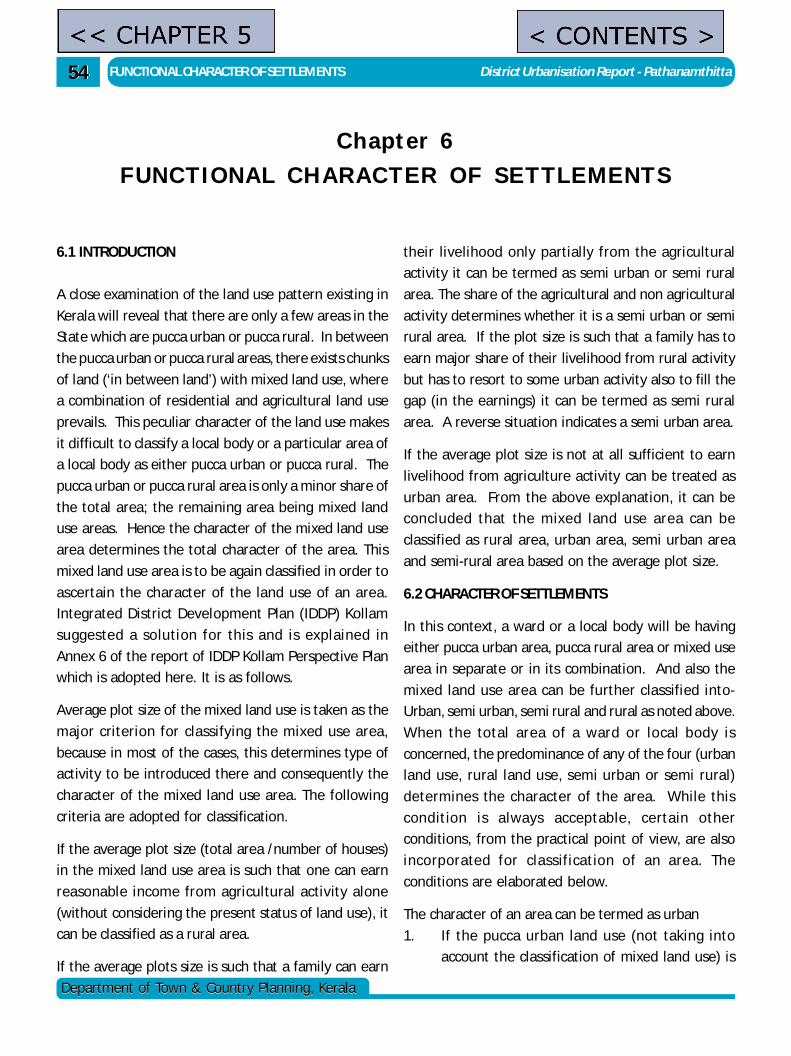
FUNCTIONAL CHARACTER OF SETTLEMENTS District Urbanisation Report - Pathanamthitta5454
Department of Town & Country Planning, KeralaDepartment of Town & Country Planning, Kerala
Chapter 6FUNCTIONAL CHARACTER OF SETTLEMENTS
6.1 INTRODUCTION
A close examination of the land use pattern existing in
Kerala will reveal that there are only a few areas in the
State which are pucca urban or pucca rural. In between
the pucca urban or pucca rural areas, there exists chunks
of land (‘in between land’) with mixed land use, where
a combination of residential and agricultural land use
prevails. This peculiar character of the land use makes
it difficult to classify a local body or a particular area of
a local body as either pucca urban or pucca rural. The
pucca urban or pucca rural area is only a minor share of
the total area; the remaining area being mixed land
use areas. Hence the character of the mixed land use
area determines the total character of the area. This
mixed land use area is to be again classified in order to
ascertain the character of the land use of an area.
Integrated District Development Plan (IDDP) Kollam
suggested a solution for this and is explained in
Annex 6 of the report of IDDP Kollam Perspective Plan
which is adopted here. It is as follows.
Average plot size of the mixed land use is taken as the
major criterion for classifying the mixed use area,
because in most of the cases, this determines type of
activity to be introduced there and consequently the
character of the mixed land use area. The following
criteria are adopted for classification.
If the average plot size (total area /number of houses)
in the mixed land use area is such that one can earn
reasonable income from agricultural activity alone
(without considering the present status of land use), it
can be classified as a rural area.
If the average plots size is such that a family can earn
their livelihood only partially from the agricultural
activity it can be termed as semi urban or semi rural
area. The share of the agricultural and non agricultural
activity determines whether it is a semi urban or semi
rural area. If the plot size is such that a family has to
earn major share of their livelihood from rural activity
but has to resort to some urban activity also to fill the
gap (in the earnings) it can be termed as semi rural
area. A reverse situation indicates a semi urban area.
If the average plot size is not at all sufficient to earn
livelihood from agriculture activity can be treated as
urban area. From the above explanation, it can be
concluded that the mixed land use area can be
classified as rural area, urban area, semi urban area
and semi-rural area based on the average plot size.
6.2 CHARACTER OF SETTLEMENTS
In this context, a ward or a local body will be having
either pucca urban area, pucca rural area or mixed use
area in separate or in its combination. And also the
mixed land use area can be further classified into-
Urban, semi urban, semi rural and rural as noted above.
When the total area of a ward or local body is
concerned, the predominance of any of the four (urban
land use, rural land use, semi urban or semi rural)
determines the character of the area. While this
condition is always acceptable, certain other
conditions, from the practical point of view, are also
incorporated for classification of an area. The
conditions are elaborated below.
The character of an area can be termed as urban
1. If the pucca urban land use (not taking into
account the classification of mixed land use) is
admin
Text Box
<< CHAPTER 5
admin
Text Box
< CONTENTS >
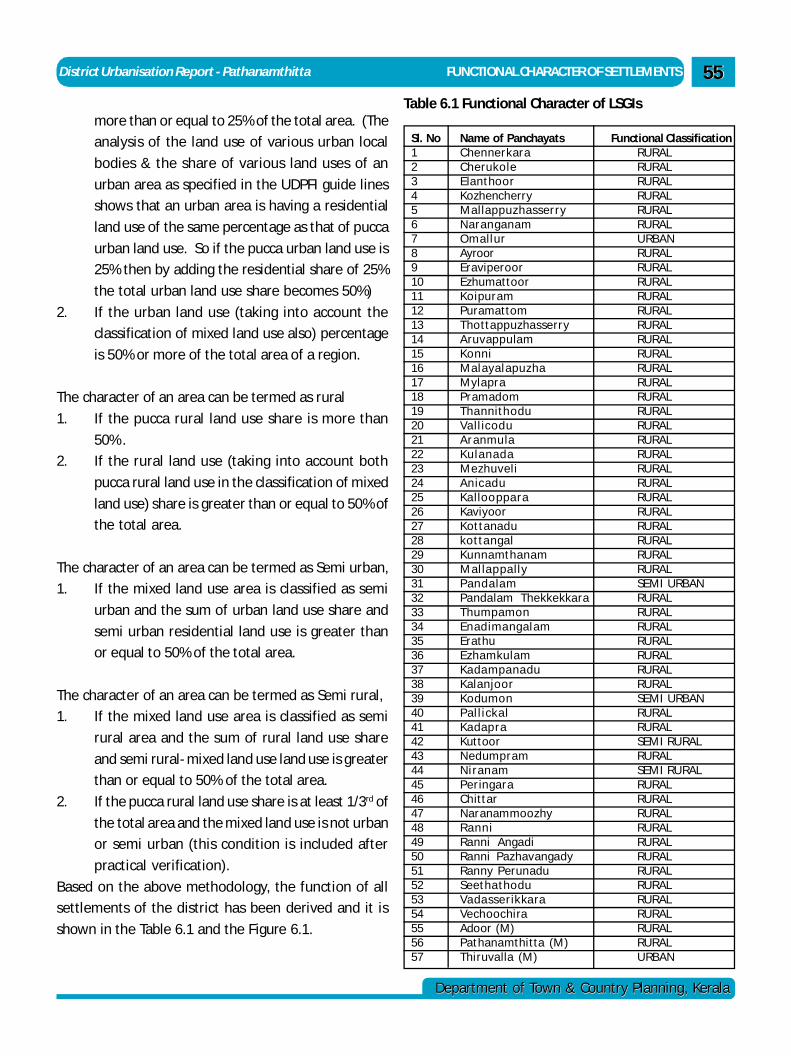
District Urbanisation Report - Pathanamthitta FUNCTIONAL CHARACTER OF SETTLEMENTS
Department of Town & Country Planning, KeralaDepartment of Town & Country Planning, Kerala
5555
more than or equal to 25% of the total area. (The
analysis of the land use of various urban local
bodies & the share of various land uses of an
urban area as specified in the UDPFI guide lines
shows that an urban area is having a residential
land use of the same percentage as that of pucca
urban land use. So if the pucca urban land use is
25% then by adding the residential share of 25%
the total urban land use share becomes 50%)
2. If the urban land use (taking into account the
classification of mixed land use also) percentage
is 50% or more of the total area of a region.
The character of an area can be termed as rural
1. If the pucca rural land use share is more than
50% .
2. If the rural land use (taking into account both
pucca rural land use in the classification of mixed
land use) share is greater than or equal to 50% of
the total area.
The character of an area can be termed as Semi urban,
1. If the mixed land use area is classified as semi
urban and the sum of urban land use share and
semi urban residential land use is greater than
or equal to 50% of the total area.
The character of an area can be termed as Semi rural,
1. If the mixed land use area is classified as semi
rural area and the sum of rural land use share
and semi rural- mixed land use land use is greater
than or equal to 50% of the total area.
2. If the pucca rural land use share is at least 1/3rd of
the total area and the mixed land use is not urban
or semi urban (this condition is included after
practical verification).
Based on the above methodology, the function of all
settlements of the district has been derived and it is
shown in the Table 6.1 and the Figure 6.1.
Table 6.1 Functional Character of LSGIs
Sl. No Name of Panchayats Functional Classification1 Chennerkara RURAL2 Cherukole RURAL3 Elanthoor RURAL4 Kozhencherry RURAL5 Mallappuz hasserry RURAL6 Naranganam RURAL7 Om allur URBAN8 Ayroor RURAL9 Eraviperoor RURAL10 Ezhumattoor RURAL11 Koipuram RURAL12 Puramattom RURAL13 Thottappuzhasserry RURAL14 Aruvappulam RURAL15 Konni RURAL16 Malayalapuz ha RURAL17 Mylapra RURAL18 Pramadom RURAL19 Tha nnithodu RURAL20 Va ll ic odu RURAL21 Aranmula RURAL22 Kula na da RURAL23 Mezhuveli RURAL24 Anic adu RURAL25 Ka lloo ppa ra RURAL26 Kaviyoor RURAL27 Kottanadu RURAL28 kotta ngal RURAL29 Kunnamthanam RURAL30 M al la ppa lly RURAL31 Panda la m SEMI URBAN32 Pandalam Thekkekkara RURAL33 Thumpamon RURAL34 Enadima ngalam RURAL35 Erathu RURAL36 Ezhamkulam RURAL37 Ka da mpa na du RURAL38 Kalanjoor RURAL39 Kodumon SEMI URBAN40 Pal l icka l RURAL41 Ka dapra RURAL42 Kuttoor SEMI RURAL43 Nedumpram RURAL44 Niranam SEMI RURAL45 Peringara RURAL46 Chittar RURAL47 Naranammoozhy RURAL48 Ra nni RURAL49 Ranni Angadi RURAL50 Ranni Pazhavangady RURAL51 Ranny Perunadu RURAL52 Seetha thodu RURAL53 Va da sserikka ra RURAL54 Vechoochira RURAL55 Adoor (M) RURAL56 Pathanamthitta (M) RURAL57 Thiruvalla (M) URBAN
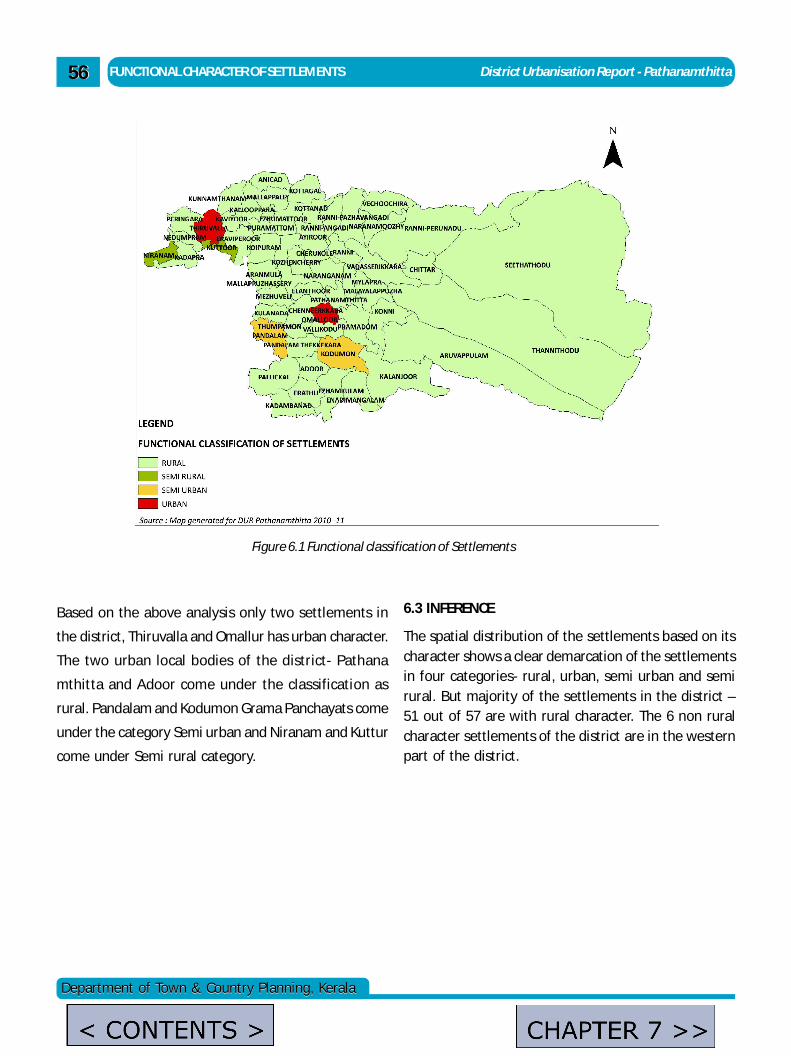
FUNCTIONAL CHARACTER OF SETTLEMENTS District Urbanisation Report - Pathanamthitta5656
Department of Town & Country Planning, KeralaDepartment of Town & Country Planning, Kerala
Based on the above analysis only two settlements in
the district, Thiruvalla and Omallur has urban character.
The two urban local bodies of the district- Pathana
mthitta and Adoor come under the classification as
rural. Pandalam and Kodumon Grama Panchayats come
under the category Semi urban and Niranam and Kuttur
come under Semi rural category.
Figure 6.1 Functional classification of Settlements
6.3 INFERENCE
The spatial distribution of the settlements based on itscharacter shows a clear demarcation of the settlementsin four categories- rural, urban, semi urban and semirural. But majority of the settlements in the district –51 out of 57 are with rural character. The 6 non ruralcharacter settlements of the district are in the westernpart of the district.
admin
Text Box
< CONTENTS >
admin
Text Box
CHAPTER 7 >>
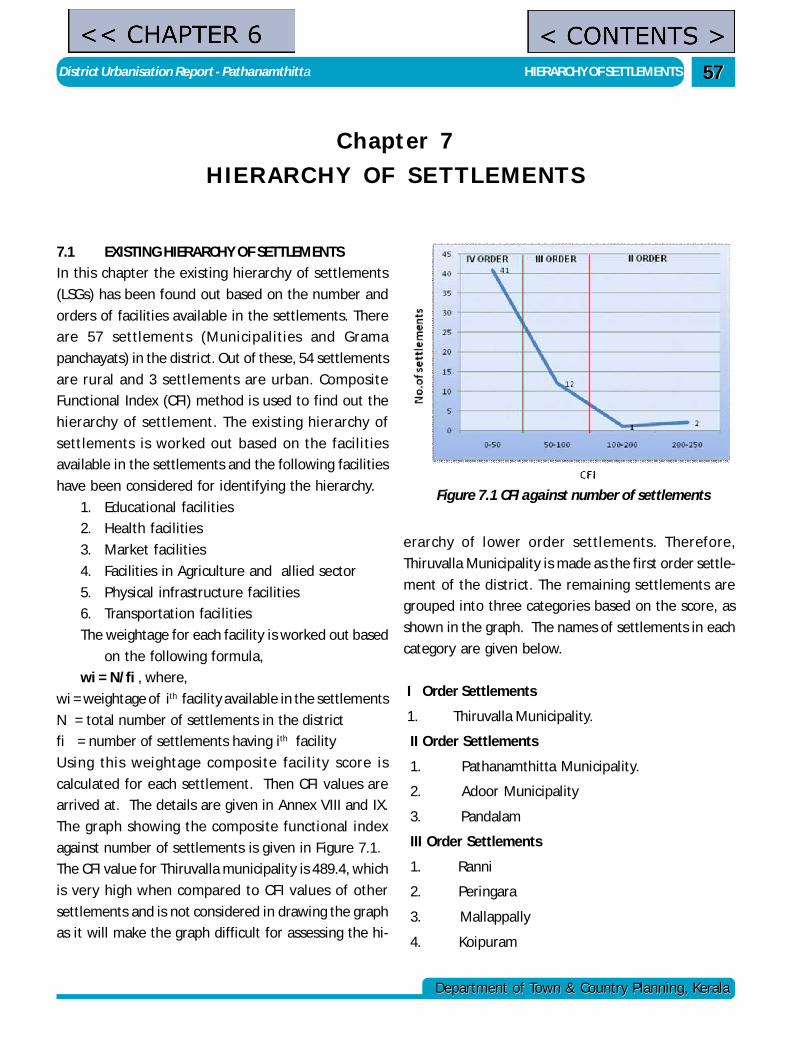
District Urbanisation Report - Pathanamthitta HIERARCHY OF SETTLEMENTS
Department of Town & Country Planning, KeralaDepartment of Town & Country Planning, Kerala
5757
Chapter 7HIERARCHY OF SETTLEMENTS
7.1 EXISTING HIERARCHY OF SETTLEMENTS
In this chapter the existing hierarchy of settlements
(LSGs) has been found out based on the number and
orders of facilities available in the settlements. There
are 57 settlements (Municipalities and Grama
panchayats) in the district. Out of these, 54 settlements
are rural and 3 settlements are urban. Composite
Functional Index (CFI) method is used to find out the
hierarchy of settlement. The existing hierarchy of
settlements is worked out based on the facilities
available in the settlements and the following facilities
have been considered for identifying the hierarchy.
1. Educational facilities
2. Health facilities
3. Market facilities
4. Facilities in Agriculture and allied sector
5. Physical infrastructure facilities
6. Transportation facilities
The weightage for each facility is worked out based
on the following formula,
wi = N/fi , where,
wi = weightage of ith facility available in the settlements
N = total number of settlements in the district
fi = number of settlements having ith facility
Using this weightage composite facility score is
calculated for each settlement. Then CFI values are
arrived at. The details are given in Annex VIII and IX.
The graph showing the composite functional index
against number of settlements is given in Figure 7.1.
The CFI value for Thiruvalla municipality is 489.4, which
is very high when compared to CFI values of other
settlements and is not considered in drawing the graph
as it will make the graph difficult for assessing the hi-
erarchy of lower order settlements. Therefore,
Thiruvalla Municipality is made as the first order settle-
ment of the district. The remaining settlements are
grouped into three categories based on the score, as
shown in the graph. The names of settlements in each
category are given below.
I Order Settlements
1. Thiruvalla Municipality.
II Order Settlements
1. Pathanamthitta Municipality.
2. Adoor Municipality
3. Pandalam
III Order Settlements
1. Ranni
2. Peringara
3. Mallappally
4. Koipuram
Figure 7.1 CFI against number of settlements
admin
Text Box
< CONTENTS >
admin
Text Box
<< CHAPTER 6
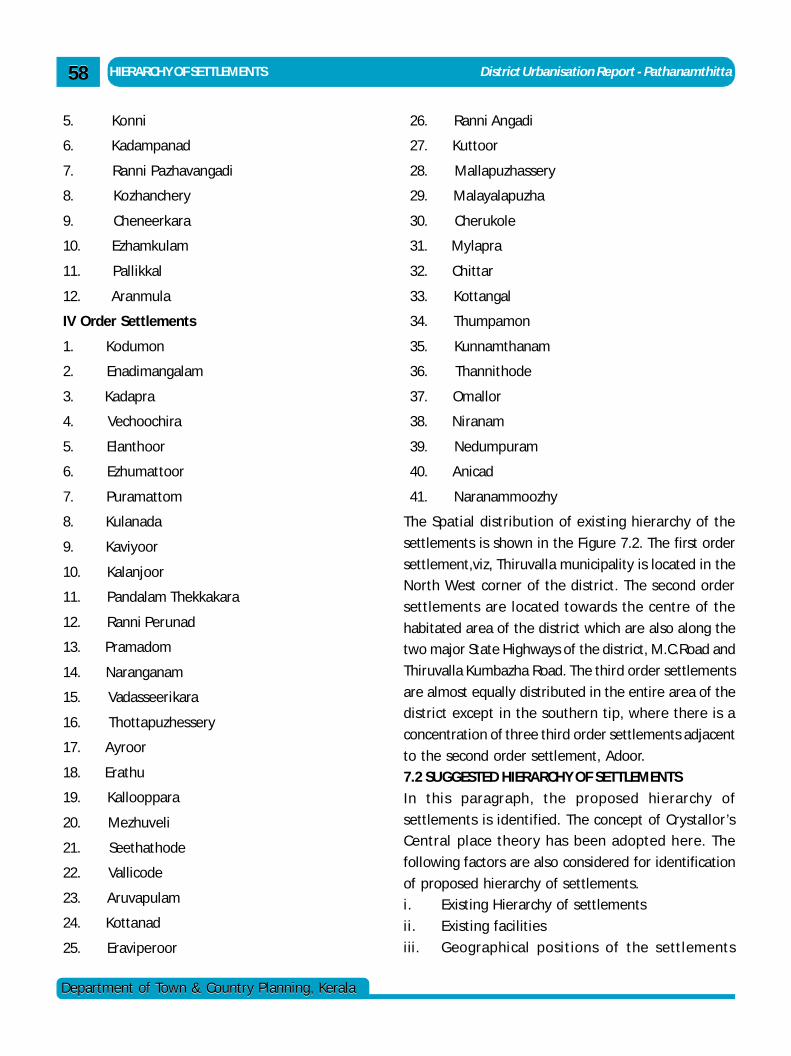
HIERARCHY OF SETTLEMENTS District Urbanisation Report - Pathanamthitta
Department of Town & Country Planning, KeralaDepartment of Town & Country Planning, Kerala
5858
5. Konni
6. Kadampanad
7. Ranni Pazhavangadi
8. Kozhanchery
9. Cheneerkara
10. Ezhamkulam
11. Pallikkal
12. Aranmula
IV Order Settlements
1. Kodumon
2. Enadimangalam
3. Kadapra
4. Vechoochira
5. Elanthoor
6. Ezhumattoor
7. Puramattom
8. Kulanada
9. Kaviyoor
10. Kalanjoor
11. Pandalam Thekkakara
12. Ranni Perunad
13. Pramadom
14. Naranganam
15. Vadasseerikara
16. Thottapuzhessery
17. Ayroor
18. Erathu
19. Kallooppara
20. Mezhuveli
21. Seethathode
22. Vallicode
23. Aruvapulam
24. Kottanad
25. Eraviperoor
26. Ranni Angadi
27. Kuttoor
28. Mallapuzhassery
29. Malayalapuzha
30. Cherukole
31. Mylapra
32. Chittar
33. Kottangal
34. Thumpamon
35. Kunnamthanam
36. Thannithode
37. Omallor
38. Niranam
39. Nedumpuram
40. Anicad
41. Naranammoozhy
The Spatial distribution of existing hierarchy of the
settlements is shown in the Figure 7.2. The first order
settlement,viz, Thiruvalla municipality is located in the
North West corner of the district. The second order
settlements are located towards the centre of the
habitated area of the district which are also along the
two major State Highways of the district, M.C.Road and
Thiruvalla Kumbazha Road. The third order settlements
are almost equally distributed in the entire area of the
district except in the southern tip, where there is a
concentration of three third order settlements adjacent
to the second order settlement, Adoor.
7.2 SUGGESTED HIERARCHY OF SETTLEMENTS
In this paragraph, the proposed hierarchy of
settlements is identified. The concept of Crystallor’s
Central place theory has been adopted here. The
following factors are also considered for identification
of proposed hierarchy of settlements.
i. Existing Hierarchy of settlements
ii. Existing facilities
iii. Geographical positions of the settlements
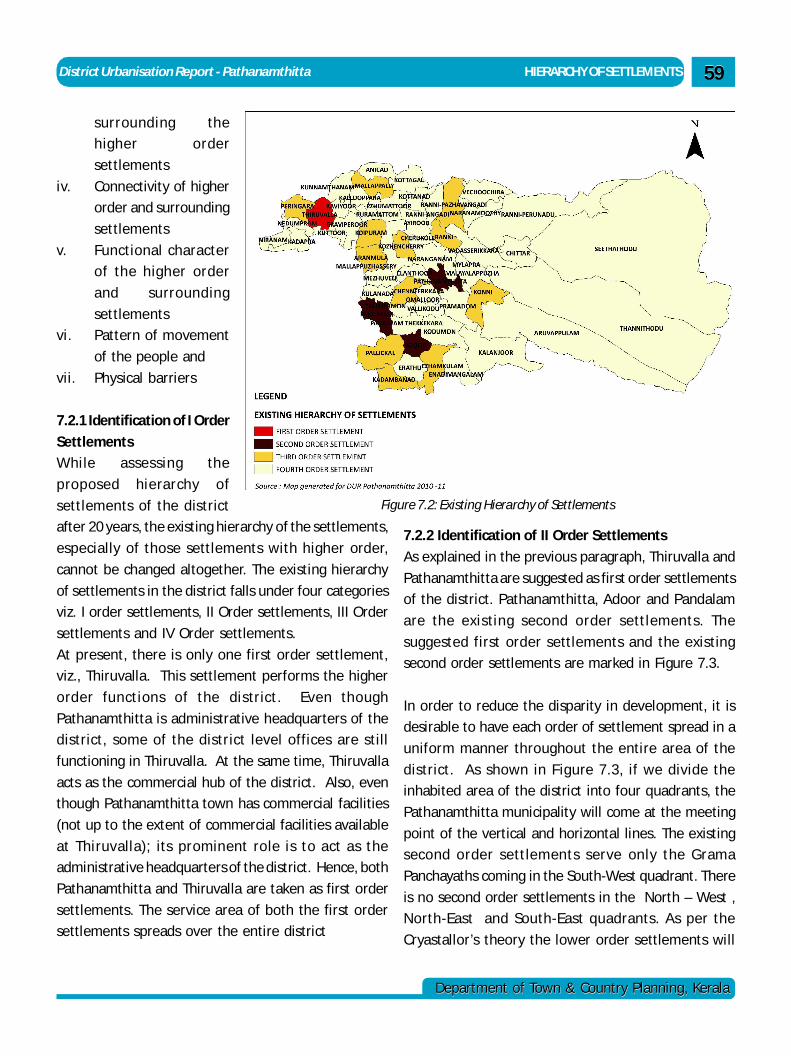
District Urbanisation Report - Pathanamthitta HIERARCHY OF SETTLEMENTS
Department of Town & Country Planning, KeralaDepartment of Town & Country Planning, Kerala
5959
surrounding the
higher order
settlements
iv. Connectivity of higher
order and surrounding
settlements
v. Functional character
of the higher order
and surrounding
settlements
vi. Pattern of movement
of the people and
vii. Physical barriers
7.2.1 Identification of I Order
Settlements
While assessing the
proposed hierarchy of
settlements of the district
after 20 years, the existing hierarchy of the settlements,
especially of those settlements with higher order,
cannot be changed altogether. The existing hierarchy
of settlements in the district falls under four categories
viz. I order settlements, II Order settlements, III Order
settlements and IV Order settlements.
At present, there is only one first order settlement,
viz., Thiruvalla. This settlement performs the higher
order functions of the district. Even though
Pathanamthitta is administrative headquarters of the
district, some of the district level offices are still
functioning in Thiruvalla. At the same time, Thiruvalla
acts as the commercial hub of the district. Also, even
though Pathanamthitta town has commercial facilities
(not up to the extent of commercial facilities available
at Thiruvalla); its prominent role is to act as the
administrative headquarters of the district. Hence, both
Pathanamthitta and Thiruvalla are taken as first order
settlements. The service area of both the first order
settlements spreads over the entire district
7.2.2 Identification of II Order Settlements
As explained in the previous paragraph, Thiruvalla and
Pathanamthitta are suggested as first order settlements
of the district. Pathanamthitta, Adoor and Pandalam
are the existing second order settlements. The
suggested first order settlements and the existing
second order settlements are marked in Figure 7.3.
In order to reduce the disparity in development, it is
desirable to have each order of settlement spread in a
uniform manner throughout the entire area of the
district. As shown in Figure 7.3, if we divide the
inhabited area of the district into four quadrants, the
Pathanamthitta municipality will come at the meeting
point of the vertical and horizontal lines. The existing
second order settlements serve only the Grama
Panchayaths coming in the South-West quadrant. There
is no second order settlements in the North – West ,
North-East and South-East quadrants. As per the
Cryastallor’s theory the lower order settlements will
Figure 7.2: Existing Hierarchy of Settlements
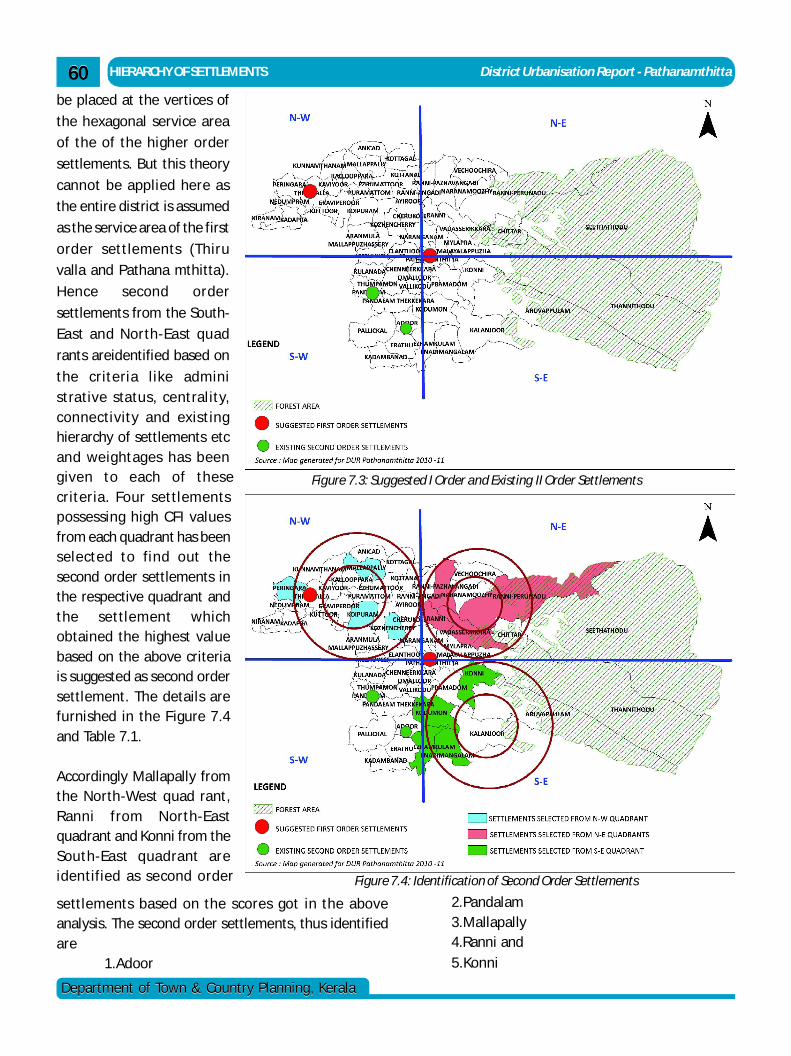
HIERARCHY OF SETTLEMENTS District Urbanisation Report - Pathanamthitta
Department of Town & Country Planning, KeralaDepartment of Town & Country Planning, Kerala
6060be placed at the vertices of
the hexagonal service area
of the of the higher order
settlements. But this theory
cannot be applied here as
the entire district is assumed
as the service area of the first
order settlements (Thiru
valla and Pathana mthitta).
Hence second order
settlements from the South-
East and North-East quad
rants areidentified based on
the criteria l ike administrative status, centrality,connectivity and existinghierarchy of settlements etcand weightages has beengiven to each of thesecriteria. Four settlementspossessing high CFI valuesfrom each quadrant has beenselected to find out thesecond order settlements inthe respective quadrant andthe settlement whichobtained the highest valuebased on the above criteriais suggested as second ordersettlement. The details arefurnished in the Figure 7.4and Table 7.1.
Accordingly Mallapally fromthe North-West quad rant,Ranni from North-Eastquadrant and Konni from theSouth-East quadrant areidentified as second order
settlements based on the scores got in the aboveanalysis. The second order settlements, thus identifiedare
1.Adoor
Figure 7.3: Suggested I Order and Existing II Order Settlements
Figure 7.4: Identification of Second Order Settlements
2.Pandalam3.Mallapally4.Ranni and5.Konni
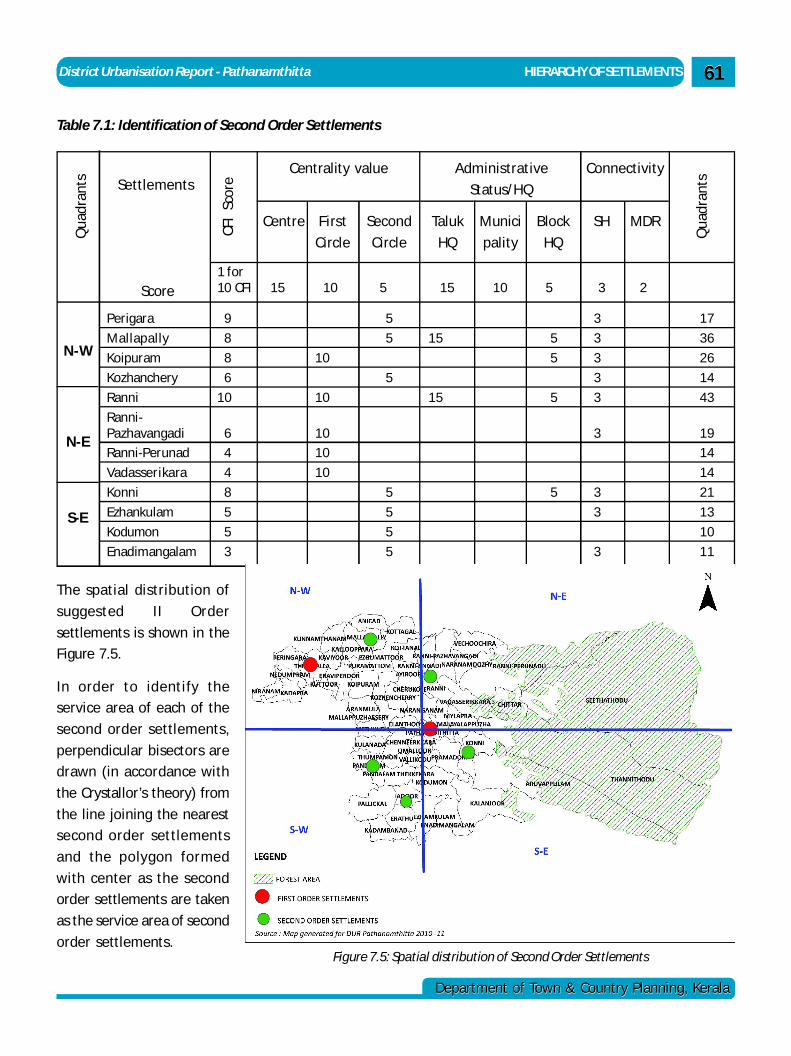
District Urbanisation Report - Pathanamthitta HIERARCHY OF SETTLEMENTS
Department of Town & Country Planning, KeralaDepartment of Town & Country Planning, Kerala
6161
The spatial distribution of
suggested II Order
settlements is shown in the
Figure 7.5.
In order to identify the
service area of each of the
second order settlements,
perpendicular bisectors are
drawn (in accordance with
the Crystallor’s theory) from
the line joining the nearest
second order settlements
and the polygon formed
with center as the second
order settlements are taken
as the service area of second
order settlements.
Qua
dran
ts Settlements
Score
CFI
Scor
e
Centrality value Administrative
Status/HQ
Connectivity
Qua
dran
ts
Centre First Second
Circle Circle
Taluk Munici Block
HQ pality HQ
SH MDR
1 for10 CFI 15 10 5 15 10 5 3 2
Perigara 9 5 3 17
Mallapally 8 5 15 5 3 36
Koipuram 8 10 5 3 26
Kozhanchery 6 5 3 14
Ranni 10 10 15 5 3 43
Ranni-Pazhavangadi 6 10 3 19
Ranni-Perunad 4 10 14
Vadasserikara 4 10 14
Konni 8 5 5 3 21
Ezhankulam 5 5 3 13
Kodumon 5 5 10
Enadimangalam 3 5 3 11
N-W
N-E
S-E
Table 7.1: Identification of Second Order Settlements
Figure 7.5: Spatial distribution of Second Order Settlements
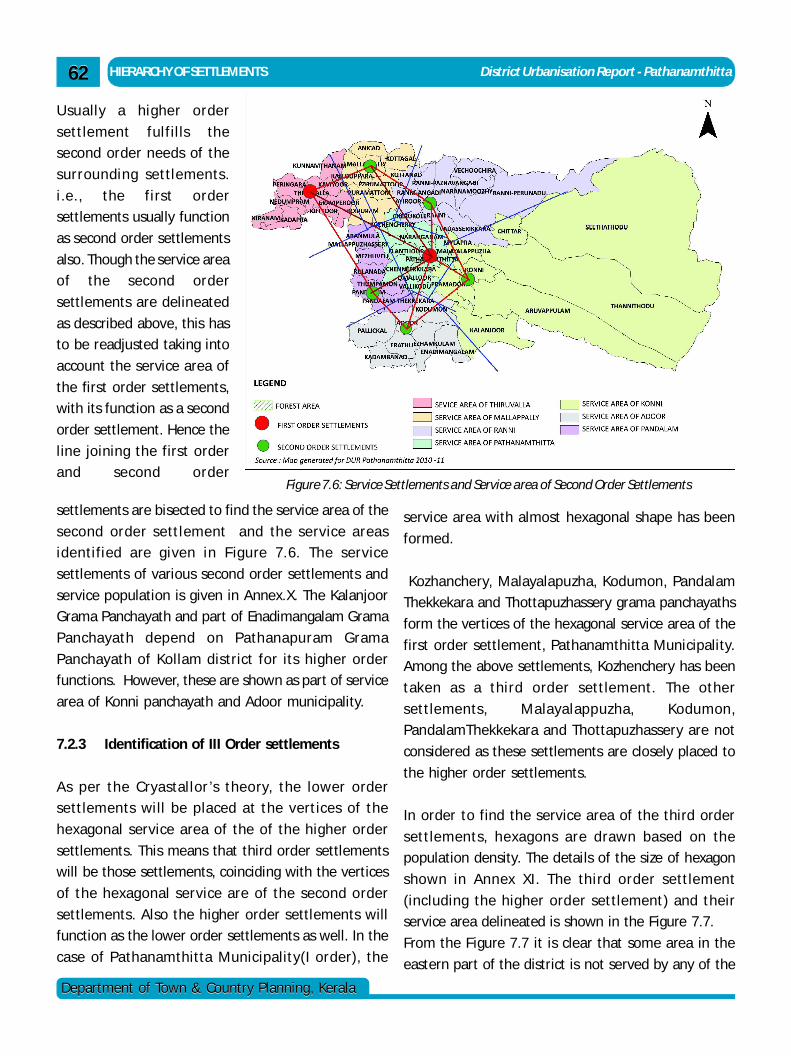
HIERARCHY OF SETTLEMENTS District Urbanisation Report - Pathanamthitta
Department of Town & Country Planning, KeralaDepartment of Town & Country Planning, Kerala
6262
Usually a higher order
settlement fulfil ls the
second order needs of the
surrounding settlements.
i.e., the first order
settlements usually function
as second order settlements
also. Though the service area
of the second order
settlements are delineated
as described above, this has
to be readjusted taking into
account the service area of
the first order settlements,
with its function as a second
order settlement. Hence the
line joining the first order
and second order
service area with almost hexagonal shape has been
formed.
Kozhanchery, Malayalapuzha, Kodumon, Pandalam
Thekkekara and Thottapuzhassery grama panchayaths
form the vertices of the hexagonal service area of the
first order settlement, Pathanamthitta Municipality.
Among the above settlements, Kozhenchery has been
taken as a third order settlement. The other
settlements, Malayalappuzha, Kodumon,
PandalamThekkekara and Thottapuzhassery are not
considered as these settlements are closely placed to
the higher order settlements.
In order to find the service area of the third order
settlements, hexagons are drawn based on the
population density. The details of the size of hexagon
shown in Annex XI. The third order settlement
(including the higher order settlement) and their
service area delineated is shown in the Figure 7.7.
From the Figure 7.7 it is clear that some area in the
eastern part of the district is not served by any of the
settlements are bisected to find the service area of the
second order settlement and the service areas
identified are given in F igure 7.6. The service
settlements of various second order settlements and
service population is given in Annex.X. The Kalanjoor
Grama Panchayath and part of Enadimangalam Grama
Panchayath depend on Pathanapuram Grama
Panchayath of Kollam district for its higher order
functions. However, these are shown as part of service
area of Konni panchayath and Adoor municipality.
7.2.3 Identification of III Order settlements
As per the Cryastallor ’s theory, the lower order
settlements will be placed at the vertices of the
hexagonal service area of the of the higher order
settlements. This means that third order settlements
will be those settlements, coinciding with the vertices
of the hexagonal service are of the second order
settlements. Also the higher order settlements will
function as the lower order settlements as well. In the
case of Pathanamthitta Municipality(I order), the
Figure 7.6: Service Settlements and Service area of Second Order Settlements
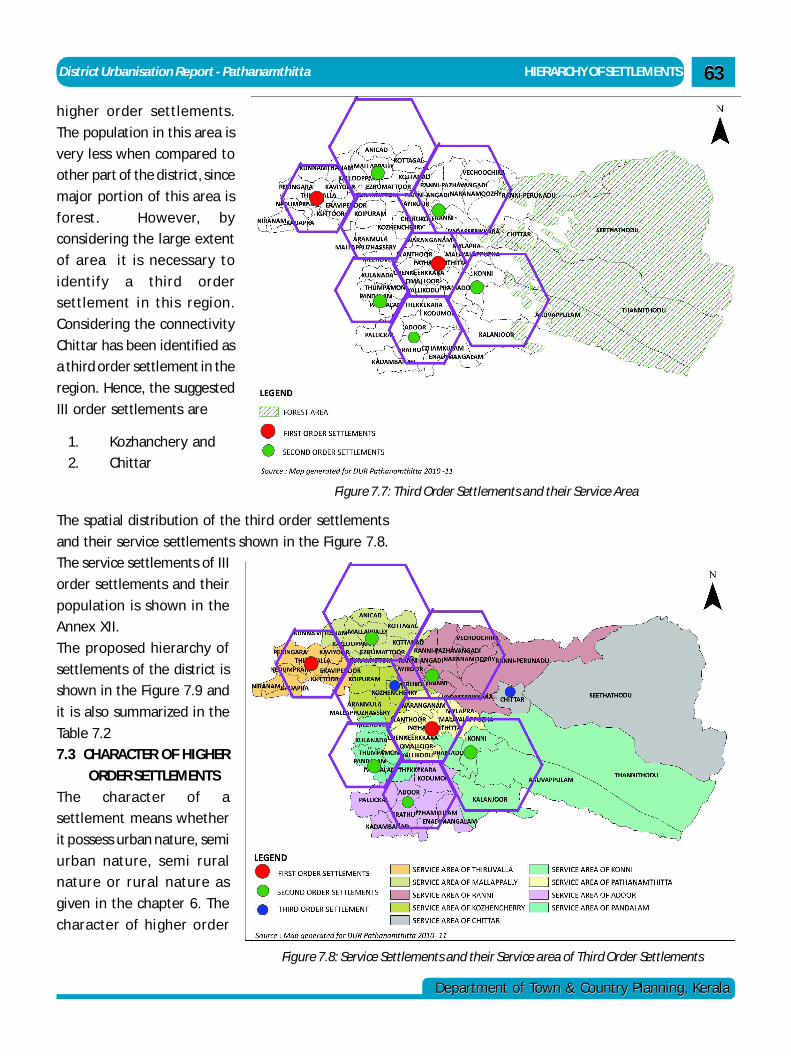
District Urbanisation Report - Pathanamthitta HIERARCHY OF SETTLEMENTS
Department of Town & Country Planning, KeralaDepartment of Town & Country Planning, Kerala
6363
higher order settlements.
The population in this area is
very less when compared to
other part of the district, since
major portion of this area is
forest. However, by
considering the large extent
of area it is necessary to
identify a third order
settlement in this region.
Considering the connectivity
Chittar has been identified as
a third order settlement in the
region. Hence, the suggested
III order settlements are
1. Kozhanchery and
2. Chittar
Figure 7.7: Third Order Settlements and their Service Area
The spatial distribution of the third order settlements
and their service settlements shown in the Figure 7.8.
The service settlements of III
order settlements and their
population is shown in the
Annex XII.
The proposed hierarchy of
settlements of the district is
shown in the Figure 7.9 and
it is also summarized in the
Table 7.2
7.3 CHARACTER OF HIGHER
ORDER SETTLEMENTS
The character of a
settlement means whether
it possess urban nature, semi
urban nature, semi rural
nature or rural nature as
given in the chapter 6. The
character of higher order
Figure 7.8: Service Settlements and their Service area of Third Order Settlements
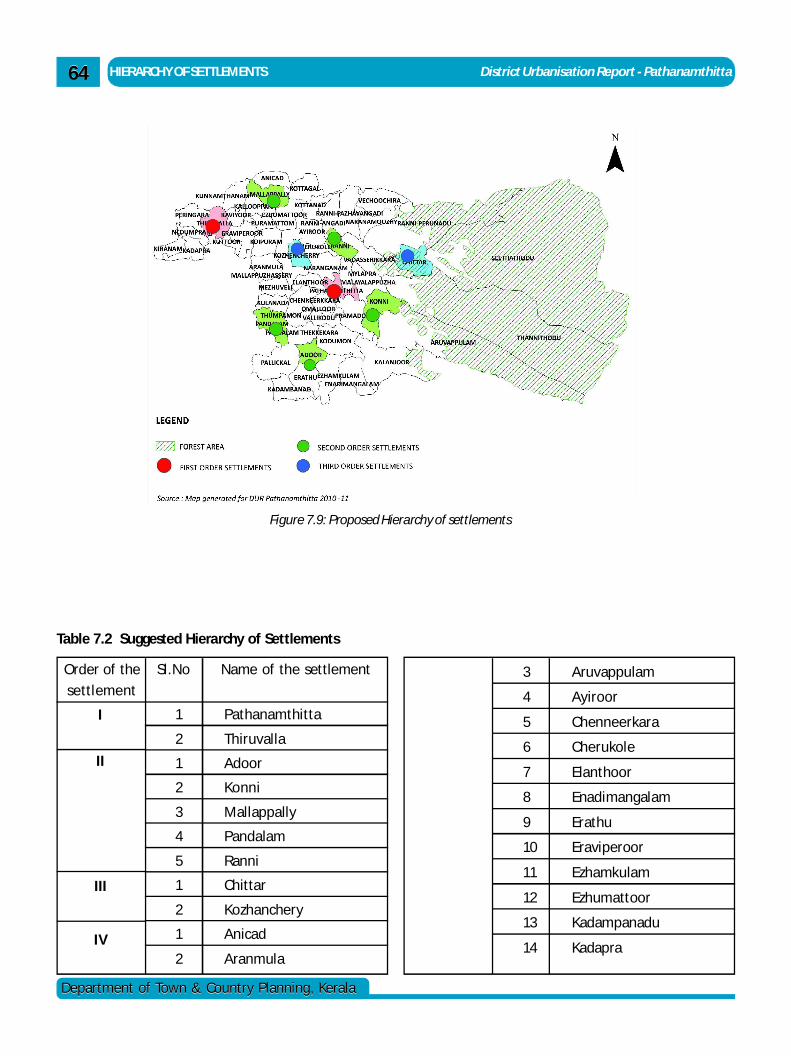
HIERARCHY OF SETTLEMENTS District Urbanisation Report - Pathanamthitta
Department of Town & Country Planning, KeralaDepartment of Town & Country Planning, Kerala
6464
Order of the Sl.No Name of the settlement
settlement
1 Pathanamthitta
2 Thiruvalla
1 Adoor
2 Konni
3 Mallappally
4 Pandalam
5 Ranni
1 Chittar
2 Kozhanchery
1 Anicad
2 Aranmula
I
II
III
IV
3 Aruvappulam
4 Ayiroor
5 Chenneerkara
6 Cherukole
7 Elanthoor
8 Enadimangalam
9 Erathu
10 Eraviperoor
11 Ezhamkulam
12 Ezhumattoor
13 Kadampanadu
14 Kadapra
Table 7.2 Suggested Hierarchy of Settlements
Figure 7.9: Proposed Hierarchy of settlements
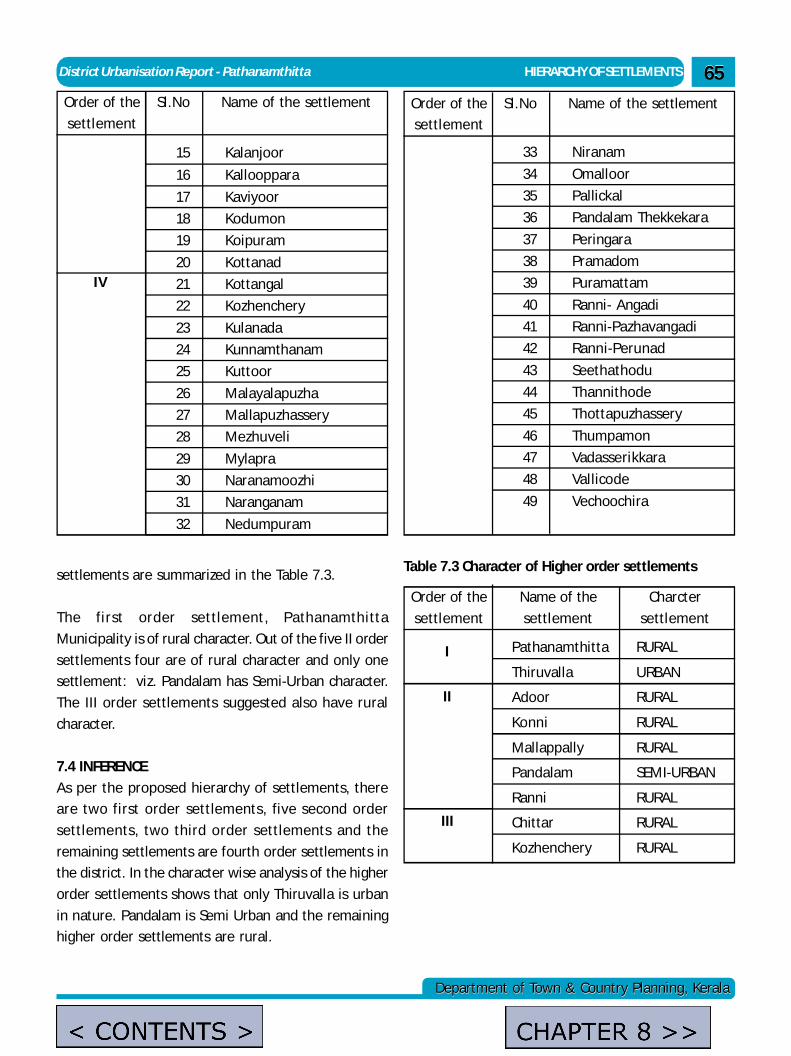
District Urbanisation Report - Pathanamthitta HIERARCHY OF SETTLEMENTS
Department of Town & Country Planning, KeralaDepartment of Town & Country Planning, Kerala
6565
15 Kalanjoor
16 Kallooppara
17 Kaviyoor
18 Kodumon
19 Koipuram
20 Kottanad
21 Kottangal
22 Kozhenchery
23 Kulanada
24 Kunnamthanam
25 Kuttoor
26 Malayalapuzha
27 Mallapuzhassery
28 Mezhuveli
29 Mylapra
30 Naranamoozhi
31 Naranganam
32 Nedumpuram
Order of the Sl.No Name of the settlement
settlement
IV
Order of the Sl.No Name of the settlement
settlement
33 Niranam
34 Omalloor
35 Pallickal
36 Pandalam Thekkekara
37 Peringara
38 Pramadom
39 Puramattam
40 Ranni- Angadi
41 Ranni-Pazhavangadi
42 Ranni-Perunad
43 Seethathodu
44 Thannithode
45 Thottapuzhassery
46 Thumpamon
47 Vadasserikkara
48 Vallicode
49 Vechoochira
settlements are summarized in the Table 7.3.
The first order settlement, Pathanamthitta
Municipality is of rural character. Out of the five II order
settlements four are of rural character and only one
settlement: viz. Pandalam has Semi-Urban character.
The III order settlements suggested also have rural
character.
7.4 INFERENCE
As per the proposed hierarchy of settlements, there
are two first order settlements, five second order
settlements, two third order settlements and the
remaining settlements are fourth order settlements in
the district. In the character wise analysis of the higher
order settlements shows that only Thiruvalla is urban
in nature. Pandalam is Semi Urban and the remaining
higher order settlements are rural.
Order of the Name of the Charcter
settlement settlement settlement
Pathanamthitta RURAL
Thiruvalla URBAN
Adoor RURAL
Konni RURAL
Mallappally RURAL
Pandalam SEMI-URBAN
Ranni RURAL
Chittar RURAL
Kozhenchery RURAL
I
II
III
Table 7.3 Character of Higher order settlements
admin
Text Box
< CONTENTS >
admin
Text Box
CHAPTER 8 >>
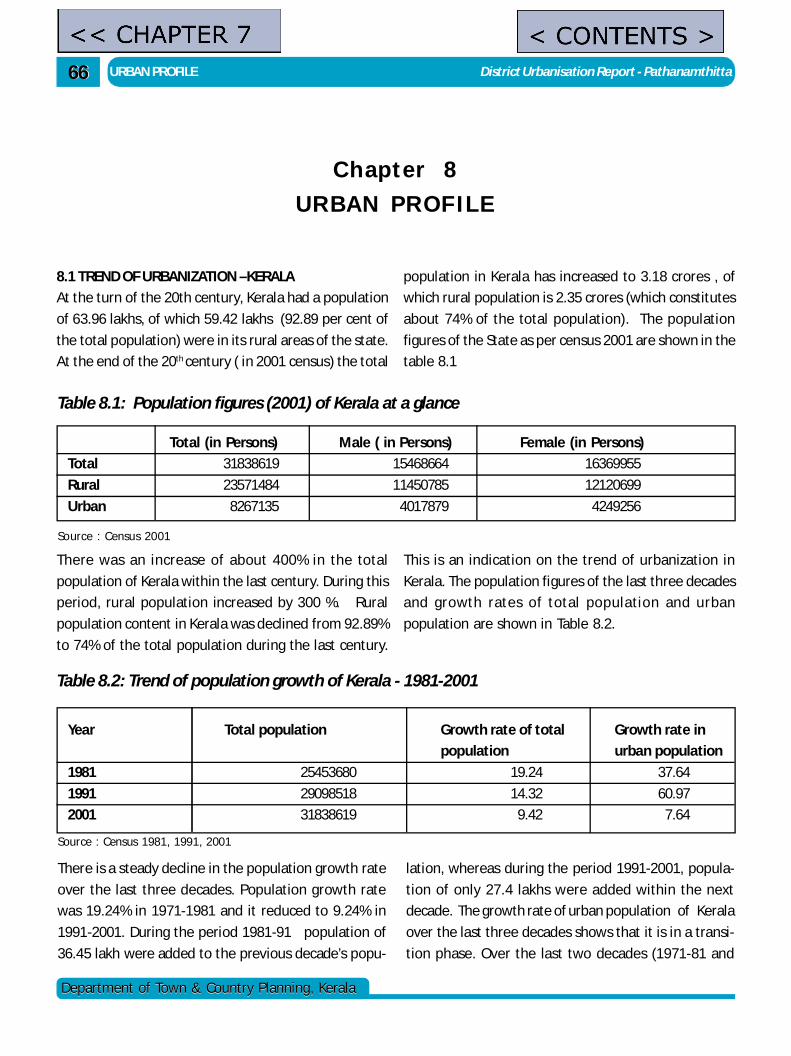
URBAN PROFILE District Urbanisation Report - Pathanamthitta6666
Department of Town & Country Planning, KeralaDepartment of Town & Country Planning, Kerala
Chapter 8URBAN PROFILE
8.1 TREND OF URBANIZATION –KERALA
At the turn of the 20th century, Kerala had a population
of 63.96 lakhs, of which 59.42 lakhs (92.89 per cent of
the total population) were in its rural areas of the state.
At the end of the 20th century ( in 2001 census) the total
population in Kerala has increased to 3.18 crores , of
which rural population is 2.35 crores (which constitutes
about 74% of the total population). The population
figures of the State as per census 2001 are shown in the
table 8.1
Table 8.1: Population figures (2001) of Kerala at a glance
There was an increase of about 400% in the total
population of Kerala within the last century. During this
period, rural population increased by 300 %. Rural
population content in Kerala was declined from 92.89%
to 74% of the total population during the last century.
This is an indication on the trend of urbanization in
Kerala. The population figures of the last three decades
and growth rates of total population and urban
population are shown in Table 8.2.
Table 8.2: Trend of population growth of Kerala - 1981-2001
Year Total population Growth rate of total Growth rate in
population urban population
1981 25453680 19.24 37.64
1991 29098518 14.32 60.97
2001 31838619 9.42 7.64
Source : Census 1981, 1991, 2001
Total (in Persons) Male ( in Persons) Female (in Persons)
Total 31838619 15468664 16369955
Rural 23571484 11450785 12120699
Urban 8267135 4017879 4249256
Source : Census 2001
There is a steady decline in the population growth rate
over the last three decades. Population growth rate
was 19.24% in 1971-1981 and it reduced to 9.24% in
1991-2001. During the period 1981-91 population of
36.45 lakh were added to the previous decade’s popu-
lation, whereas during the period 1991-2001, popula-
tion of only 27.4 lakhs were added within the next
decade. The growth rate of urban population of Kerala
over the last three decades shows that it is in a transi-
tion phase. Over the last two decades (1971-81 and
admin
Text Box
< CONTENTS >
admin
Text Box
<< CHAPTER 7
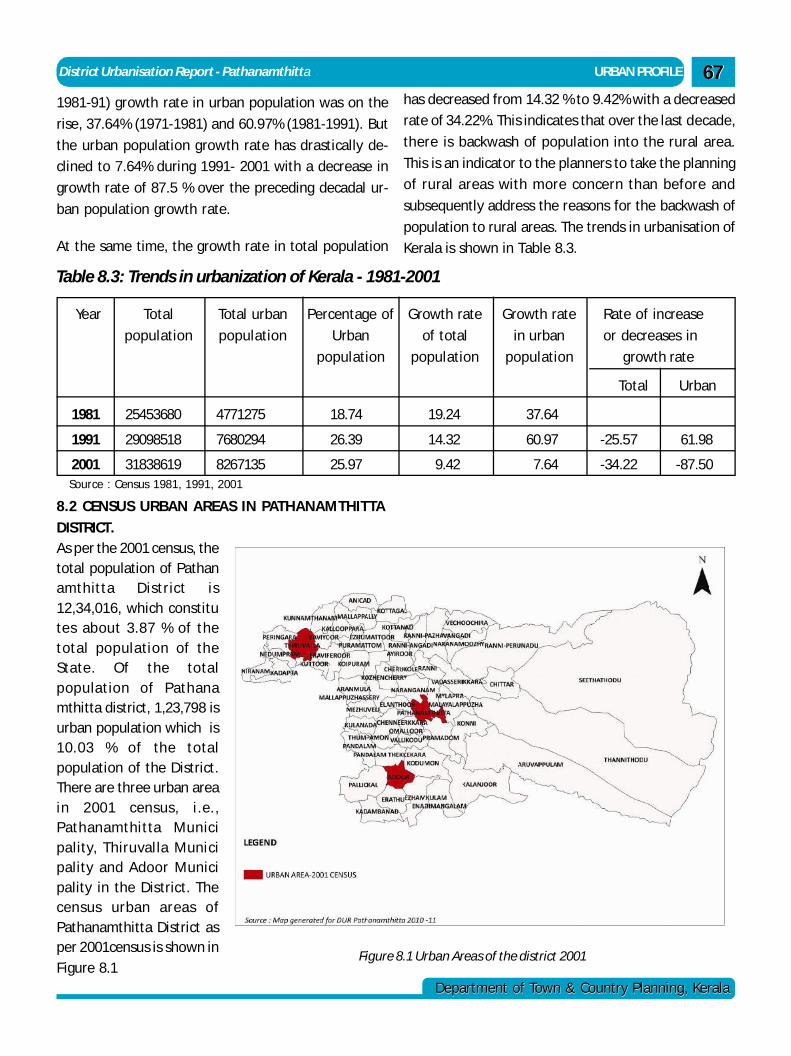
District Urbanisation Report - Pathanamthitta URBAN PROFILE
Department of Town & Country Planning, KeralaDepartment of Town & Country Planning, Kerala
6767
1981-91) growth rate in urban population was on the
rise, 37.64% (1971-1981) and 60.97% (1981-1991). But
the urban population growth rate has drastically de-
clined to 7.64% during 1991- 2001 with a decrease in
growth rate of 87.5 % over the preceding decadal ur-
ban population growth rate.
At the same time, the growth rate in total population
has decreased from 14.32 % to 9.42% with a decreased
rate of 34.22%. This indicates that over the last decade,
there is backwash of population into the rural area.
This is an indicator to the planners to take the planning
of rural areas with more concern than before and
subsequently address the reasons for the backwash of
population to rural areas. The trends in urbanisation of
Kerala is shown in Table 8.3.
8.2 CENSUS URBAN AREAS IN PATHANAMTHITTA
DISTRICT.As per the 2001 census, thetotal population of Pathanamthitta District is12,34,016, which constitutes about 3.87 % of thetotal population of theState. Of the totalpopulation of Pathanamthitta district, 1,23,798 isurban population which is10.03 % of the totalpopulation of the District.There are three urban areain 2001 census, i.e.,Pathanamthitta Municipality, Thiruvalla Municipality and Adoor Municipality in the District. Thecensus urban areas ofPathanamthitta District asper 2001census is shown inFigure 8.1
Year Total Total urban Percentage of Growth rate Growth rate Rate of increase
population population Urban of total in urban or decreases in
population population population growth rate
Total Urban
1981 25453680 4771275 18.74 19.24 37.64
1991 29098518 7680294 26.39 14.32 60.97 -25.57 61.98
2001 31838619 8267135 25.97 9.42 7.64 -34.22 -87.50Source : Census 1981, 1991, 2001
Table 8.3: Trends in urbanization of Kerala - 1981-2001
Figure 8.1 Urban Areas of the district 2001
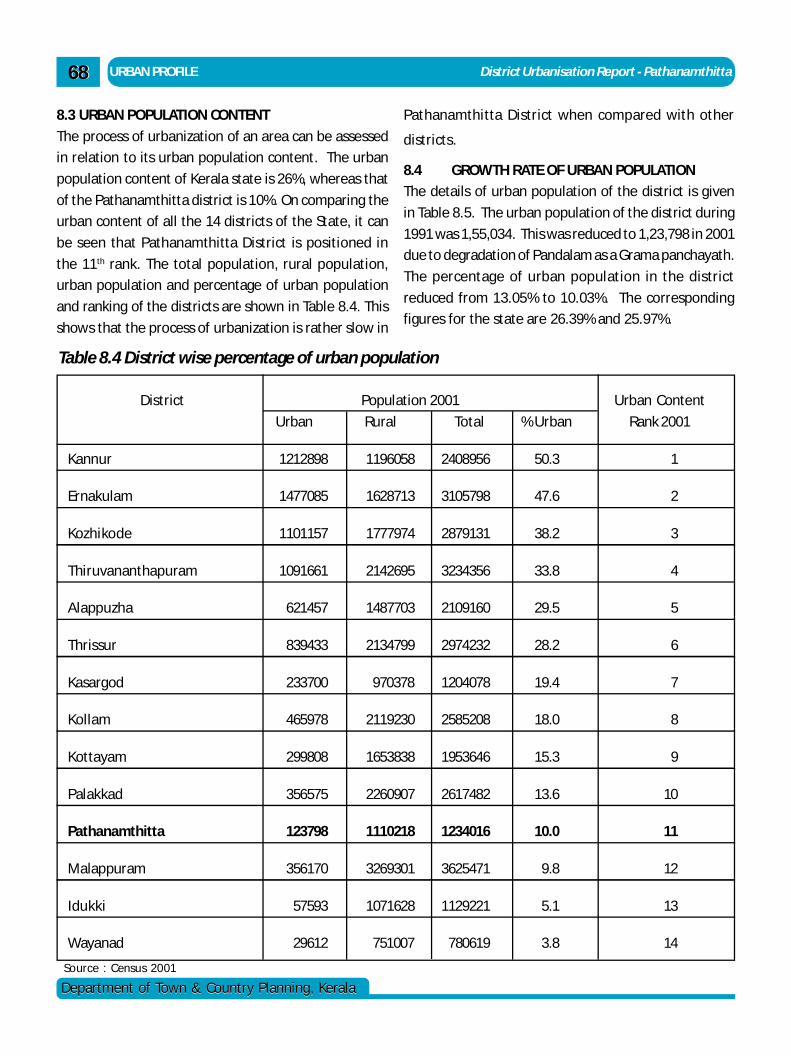
URBAN PROFILE District Urbanisation Report - Pathanamthitta6868
Department of Town & Country Planning, KeralaDepartment of Town & Country Planning, Kerala
8.3 URBAN POPULATION CONTENT
The process of urbanization of an area can be assessed
in relation to its urban population content. The urban
population content of Kerala state is 26%, whereas that
of the Pathanamthitta district is 10%. On comparing the
urban content of all the 14 districts of the State, it can
be seen that Pathanamthitta District is positioned in
the 11th rank. The total population, rural population,
urban population and percentage of urban population
and ranking of the districts are shown in Table 8.4. This
shows that the process of urbanization is rather slow in
District Population 2001 Urban Content
Urban Rural Total % Urban Rank 2001
Kannur 1212898 1196058 2408956 50.3 1
Ernakulam 1477085 1628713 3105798 47.6 2
Kozhikode 1101157 1777974 2879131 38.2 3
Thiruvananthapuram 1091661 2142695 3234356 33.8 4
Alappuzha 621457 1487703 2109160 29.5 5
Thrissur 839433 2134799 2974232 28.2 6
Kasargod 233700 970378 1204078 19.4 7
Kollam 465978 2119230 2585208 18.0 8
Kottayam 299808 1653838 1953646 15.3 9
Palakkad 356575 2260907 2617482 13.6 10
Pathanamthitta 123798 1110218 1234016 10.0 11
Malappuram 356170 3269301 3625471 9.8 12
Idukki 57593 1071628 1129221 5.1 13
Wayanad 29612 751007 780619 3.8 14
Source : Census 2001
Pathanamthitta District when compared with other
districts.
8.4 GROWTH RATE OF URBAN POPULATION
The details of urban population of the district is given
in Table 8.5. The urban population of the district during
1991 was 1,55,034. This was reduced to 1,23,798 in 2001
due to degradation of Pandalam as a Grama panchayath.
The percentage of urban population in the district
reduced from 13.05% to 10.03%. The corresponding
figures for the state are 26.39% and 25.97%.
Table 8.4 District wise percentage of urban population
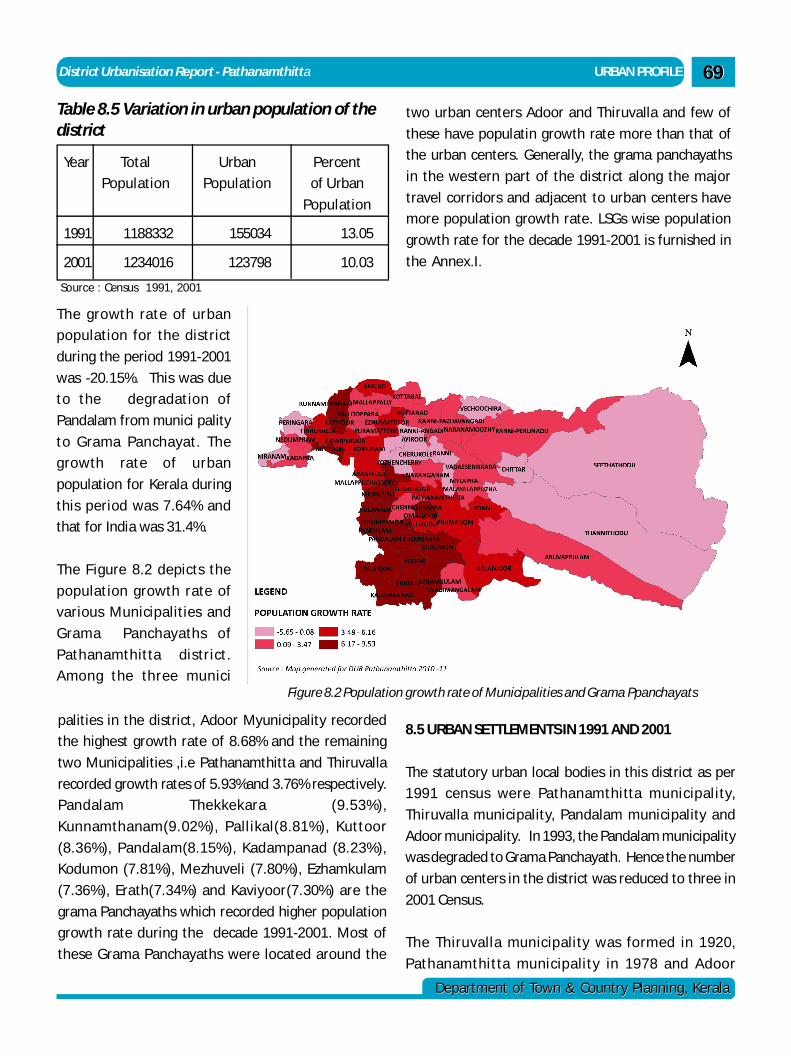
District Urbanisation Report - Pathanamthitta URBAN PROFILE
Department of Town & Country Planning, KeralaDepartment of Town & Country Planning, Kerala
6969
Table 8.5 Variation in urban population of thedistrict
Year Total Urban Percent
Population Population of Urban
Population
1991 1188332 155034 13.05
2001 1234016 123798 10.03
Source : Census 1991, 2001
two urban centers Adoor and Thiruvalla and few of
these have populatin growth rate more than that of
the urban centers. Generally, the grama panchayaths
in the western part of the district along the major
travel corridors and adjacent to urban centers have
more population growth rate. LSGs wise population
growth rate for the decade 1991-2001 is furnished in
the Annex.I.
8.5 URBAN SETTLEMENTS IN 1991 AND 2001
The statutory urban local bodies in this district as per
1991 census were Pathanamthitta municipality,
Thiruvalla municipality, Pandalam municipality and
Adoor municipality. In 1993, the Pandalam municipality
was degraded to Grama Panchayath. Hence the number
of urban centers in the district was reduced to three in
2001 Census.
The Thiruvalla municipality was formed in 1920,
Pathanamthitta municipality in 1978 and Adoor
The growth rate of urban
population for the district
during the period 1991-2001
was -20.15%. This was due
to the degradation of
Pandalam from munici pality
to Grama Panchayat. The
growth rate of urban
population for Kerala during
this period was 7.64% and
that for India was 31.4%.
The Figure 8.2 depicts the
population growth rate of
various Municipalities and
Grama Panchayaths of
Pathanamthitta district.
Among the three munici
palities in the district, Adoor Myunicipality recorded
the highest growth rate of 8.68% and the remaining
two Municipalities ,i.e Pathanamthitta and Thiruvalla
recorded growth rates of 5.93%and 3.76% respectively.
Pandalam Thekkekara (9.53%),
Kunnamthanam(9.02%), Pallikal(8.81%), Kuttoor
(8.36%), Pandalam(8.15%), Kadampanad (8.23%),
Kodumon (7.81%), Mezhuveli (7.80%), Ezhamkulam
(7.36%), Erath(7.34%) and Kaviyoor(7.30%) are the
grama Panchayaths which recorded higher population
growth rate during the decade 1991-2001. Most of
these Grama Panchayaths were located around the
Figure 8.2 Population growth rate of Municipalities and Grama Ppanchayats
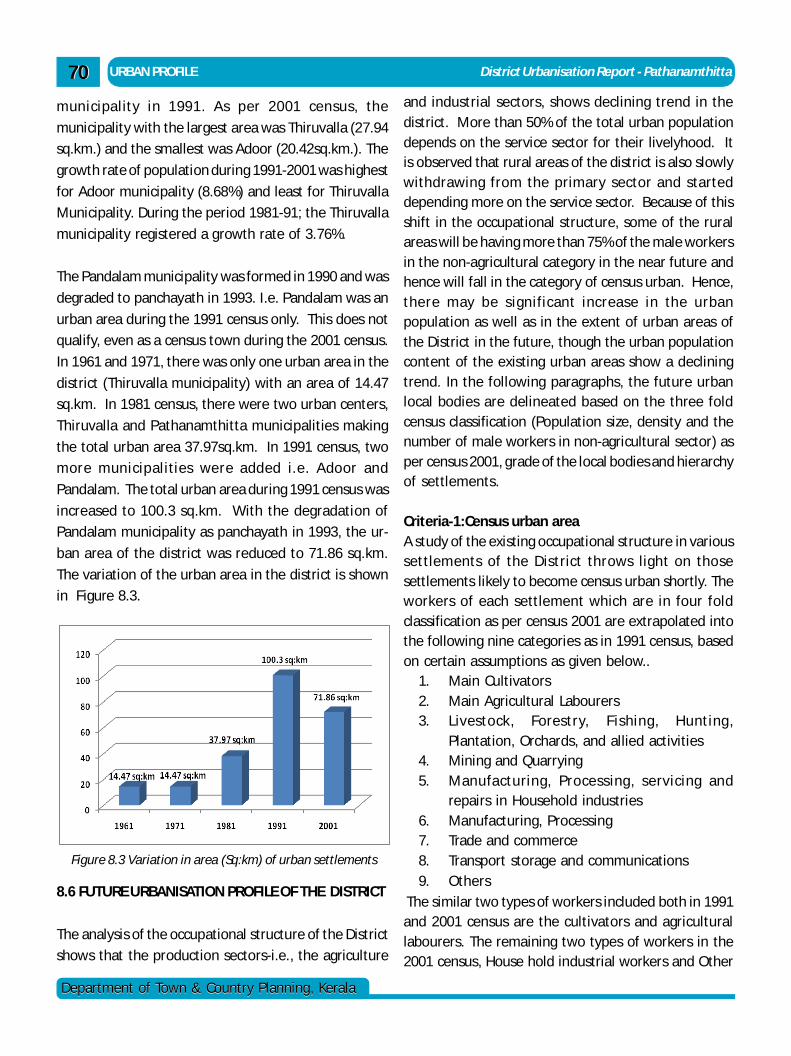
URBAN PROFILE District Urbanisation Report - Pathanamthitta7070
Department of Town & Country Planning, KeralaDepartment of Town & Country Planning, Kerala
municipality in 1991. As per 2001 census, the
municipality with the largest area was Thiruvalla (27.94
sq.km.) and the smallest was Adoor (20.42sq.km.). The
growth rate of population during 1991-2001 was highest
for Adoor municipality (8.68%) and least for Thiruvalla
Municipality. During the period 1981-91; the Thiruvalla
municipality registered a growth rate of 3.76%.
The Pandalam municipality was formed in 1990 and was
degraded to panchayath in 1993. I.e. Pandalam was an
urban area during the 1991 census only. This does not
qualify, even as a census town during the 2001 census.
In 1961 and 1971, there was only one urban area in the
district (Thiruvalla municipality) with an area of 14.47
sq.km. In 1981 census, there were two urban centers,
Thiruvalla and Pathanamthitta municipalities making
the total urban area 37.97sq.km. In 1991 census, two
more municipalities were added i.e. Adoor and
Pandalam. The total urban area during 1991 census was
increased to 100.3 sq.km. With the degradation of
Pandalam municipality as panchayath in 1993, the ur-
ban area of the district was reduced to 71.86 sq.km.
The variation of the urban area in the district is shown
in Figure 8.3.
Figure 8.3 Variation in area (Sq:km) of urban settlements
8.6 FUTURE URBANISATION PROFILE OF THE DISTRICT
The analysis of the occupational structure of the District
shows that the production sectors-i.e., the agriculture
and industrial sectors, shows declining trend in thedistrict. More than 50% of the total urban populationdepends on the service sector for their livelyhood. Itis observed that rural areas of the district is also slowlywithdrawing from the primary sector and starteddepending more on the service sector. Because of thisshift in the occupational structure, some of the ruralareas will be having more than 75% of the male workersin the non-agricultural category in the near future andhence will fall in the category of census urban. Hence,there may be significant increase in the urbanpopulation as well as in the extent of urban areas ofthe District in the future, though the urban populationcontent of the existing urban areas show a decliningtrend. In the following paragraphs, the future urbanlocal bodies are delineated based on the three foldcensus classification (Population size, density and thenumber of male workers in non-agricultural sector) asper census 2001, grade of the local bodies and hierarchyof settlements.
Criteria-1:Census urban areaA study of the existing occupational structure in varioussettlements of the District throws light on thosesettlements likely to become census urban shortly. Theworkers of each settlement which are in four foldclassification as per census 2001 are extrapolated intothe following nine categories as in 1991 census, basedon certain assumptions as given below..
1. Main Cultivators2. Main Agricultural Labourers3. Livestock, Forestry, Fishing, Hunting,
Plantation, Orchards, and allied activities4. Mining and Quarrying5. Manufacturing, Processing, servicing and
repairs in Household industries6. Manufacturing, Processing7. Trade and commerce8. Transport storage and communications9. Others
The similar two types of workers included both in 1991and 2001 census are the cultivators and agriculturallabourers. The remaining two types of workers in the2001 census, House hold industrial workers and Other
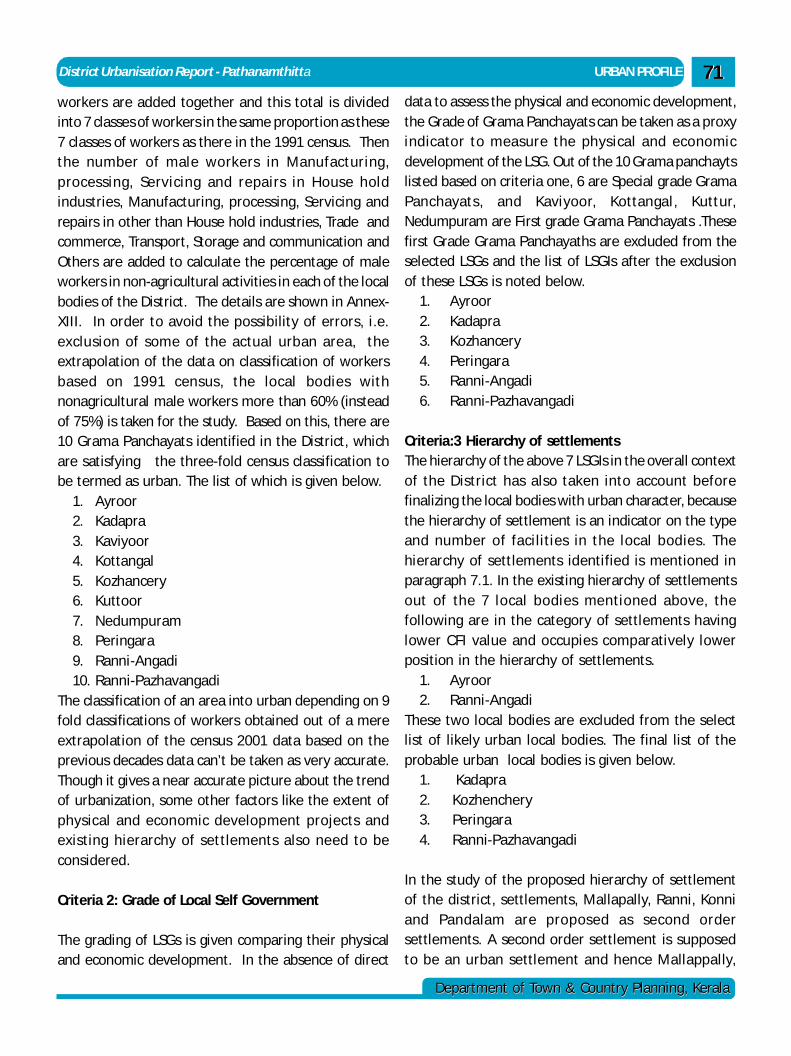
District Urbanisation Report - Pathanamthitta URBAN PROFILE
Department of Town & Country Planning, KeralaDepartment of Town & Country Planning, Kerala
7171workers are added together and this total is dividedinto 7 classes of workers in the same proportion as these7 classes of workers as there in the 1991 census. Thenthe number of male workers in Manufacturing,processing, Servicing and repairs in House holdindustries, Manufacturing, processing, Servicing andrepairs in other than House hold industries, Trade andcommerce, Transport, Storage and communication andOthers are added to calculate the percentage of maleworkers in non-agricultural activities in each of the localbodies of the District. The details are shown in Annex-XIII. In order to avoid the possibility of errors, i.e.exclusion of some of the actual urban area, theextrapolation of the data on classification of workersbased on 1991 census, the local bodies withnonagricultural male workers more than 60% (insteadof 75%) is taken for the study. Based on this, there are10 Grama Panchayats identified in the District, whichare satisfying the three-fold census classification tobe termed as urban. The list of which is given below.
1. Ayroor2. Kadapra3. Kaviyoor4. Kottangal5. Kozhancery6. Kuttoor7. Nedumpuram8. Peringara9. Ranni-Angadi10. Ranni-Pazhavangadi
The classification of an area into urban depending on 9fold classifications of workers obtained out of a mereextrapolation of the census 2001 data based on theprevious decades data can’t be taken as very accurate.Though it gives a near accurate picture about the trendof urbanization, some other factors like the extent ofphysical and economic development projects andexisting hierarchy of settlements also need to beconsidered.
Criteria 2: Grade of Local Self Government
The grading of LSGs is given comparing their physicaland economic development. In the absence of direct
data to assess the physical and economic development,the Grade of Grama Panchayats can be taken as a proxyindicator to measure the physical and economicdevelopment of the LSG. Out of the 10 Grama panchaytslisted based on criteria one, 6 are Special grade GramaPanchayats, and Kaviyoor, Kottangal, Kuttur,Nedumpuram are First grade Grama Panchayats .Thesefirst Grade Grama Panchayaths are excluded from theselected LSGs and the list of LSGIs after the exclusionof these LSGs is noted below.
1. Ayroor2. Kadapra3. Kozhancery4. Peringara5. Ranni-Angadi6. Ranni-Pazhavangadi
Criteria:3 Hierarchy of settlementsThe hierarchy of the above 7 LSGIs in the overall contextof the District has also taken into account beforefinalizing the local bodies with urban character, becausethe hierarchy of settlement is an indicator on the typeand number of facilities in the local bodies. Thehierarchy of settlements identified is mentioned inparagraph 7.1. In the existing hierarchy of settlementsout of the 7 local bodies mentioned above, thefollowing are in the category of settlements havinglower CFI value and occupies comparatively lowerposition in the hierarchy of settlements.
1. Ayroor2. Ranni-Angadi
These two local bodies are excluded from the selectlist of likely urban local bodies. The final list of theprobable urban local bodies is given below.
1. Kadapra2. Kozhenchery3. Peringara4. Ranni-Pazhavangadi
In the study of the proposed hierarchy of settlementof the district, settlements, Mallapally, Ranni, Konniand Pandalam are proposed as second ordersettlements. A second order settlement is supposedto be an urban settlement and hence Mallappally,
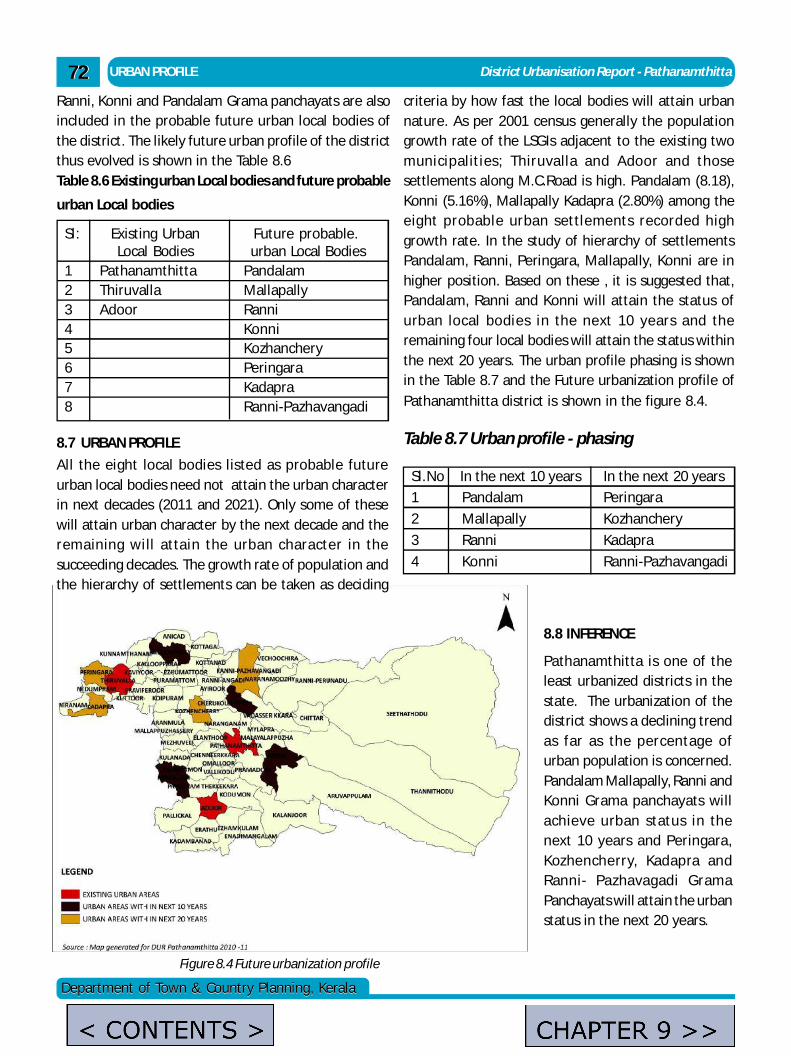
URBAN PROFILE District Urbanisation Report - Pathanamthitta7272
Department of Town & Country Planning, KeralaDepartment of Town & Country Planning, Kerala
Ranni, Konni and Pandalam Grama panchayats are alsoincluded in the probable future urban local bodies ofthe district. The likely future urban profile of the districtthus evolved is shown in the Table 8.6Table 8.6 Existing urban Local bodies and future probable
urban Local bodies
8.7 URBAN PROFILE
All the eight local bodies listed as probable futureurban local bodies need not attain the urban characterin next decades (2011 and 2021). Only some of thesewill attain urban character by the next decade and theremaining will attain the urban character in thesucceeding decades. The growth rate of population andthe hierarchy of settlements can be taken as deciding
Sl: Existing Urban Future probable.Local Bodies urban Local Bodies
1 Pathanamthitta Pandalam2 Thiruvalla Mallapally3 Adoor Ranni4 Konni5 Kozhanchery6 Peringara7 Kadapra8 Ranni-Pazhavangadi
criteria by how fast the local bodies will attain urbannature. As per 2001 census generally the populationgrowth rate of the LSGIs adjacent to the existing twomunicipalities; Thiruvalla and Adoor and thosesettlements along M.C.Road is high. Pandalam (8.18),Konni (5.16%), Mallapally Kadapra (2.80%) among theeight probable urban settlements recorded highgrowth rate. In the study of hierarchy of settlementsPandalam, Ranni, Peringara, Mallapally, Konni are inhigher position. Based on these , it is suggested that,Pandalam, Ranni and Konni will attain the status ofurban local bodies in the next 10 years and theremaining four local bodies will attain the status withinthe next 20 years. The urban profile phasing is shownin the Table 8.7 and the Future urbanization profile ofPathanamthitta district is shown in the figure 8.4.
Table 8.7 Urban profile - phasing
Sl.No In the next 10 years In the next 20 years
1 Pandalam Peringara
2 Mallapally Kozhanchery
3 Ranni Kadapra
4 Konni Ranni-Pazhavangadi
8.8 INFERENCE
Pathanamthitta is one of theleast urbanized districts in thestate. The urbanization of thedistrict shows a declining trendas far as the percentage ofurban population is concerned.Pandalam Mallapally, Ranni andKonni Grama panchayats willachieve urban status in thenext 10 years and Peringara,Kozhencherry, Kadapra andRanni- Pazhavagadi GramaPanchayats will attain the urbanstatus in the next 20 years.
Figure 8.4 Future urbanization profile
admin
Text Box
CHAPTER 9 >>
admin
Text Box
< CONTENTS >
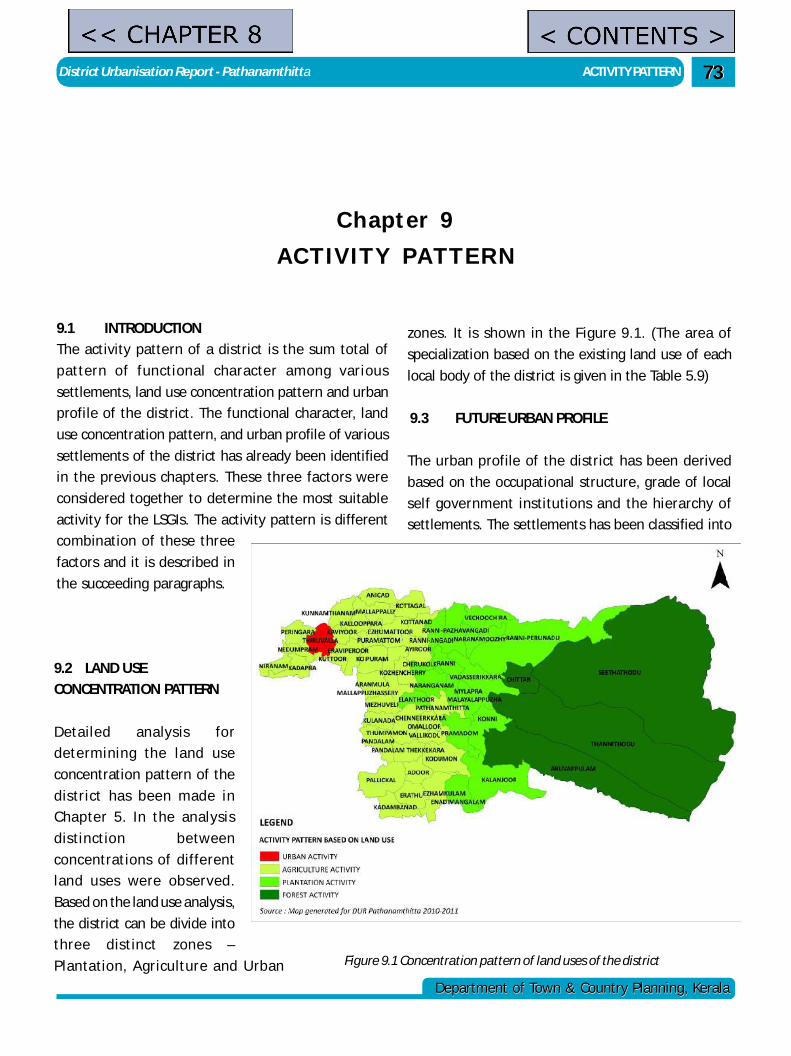
District Urbanisation Report - Pathanamthitta ACTIVITY PATTERN
Department of Town & Country Planning, KeralaDepartment of Town & Country Planning, Kerala
7373
Chapter 9ACTIVITY PATTERN
9.1 INTRODUCTION
The activity pattern of a district is the sum total of
pattern of functional character among various
settlements, land use concentration pattern and urban
profile of the district. The functional character, land
use concentration pattern, and urban profile of various
settlements of the district has already been identified
in the previous chapters. These three factors were
considered together to determine the most suitable
activity for the LSGIs. The activity pattern is different
combination of these three
factors and it is described in
the succeeding paragraphs.
zones. It is shown in the Figure 9.1. (The area of
specialization based on the existing land use of each
local body of the district is given in the Table 5.9)
9.3 FUTURE URBAN PROFILE
The urban profile of the district has been derived
based on the occupational structure, grade of local
self government institutions and the hierarchy of
settlements. The settlements has been classified into
9.2 LAND USE
CONCENTRATION PATTERN
Detailed analysis for
determining the land use
concentration pattern of the
district has been made in
Chapter 5. In the analysis
distinction between
concentrations of different
land uses were observed.
Based on the land use analysis,
the district can be divide into
three distinct zones –
Plantation, Agriculture and Urban Figure 9.1 Concentration pattern of land uses of the district
admin
Text Box
<< CHAPTER 8
admin
Text Box
< CONTENTS >
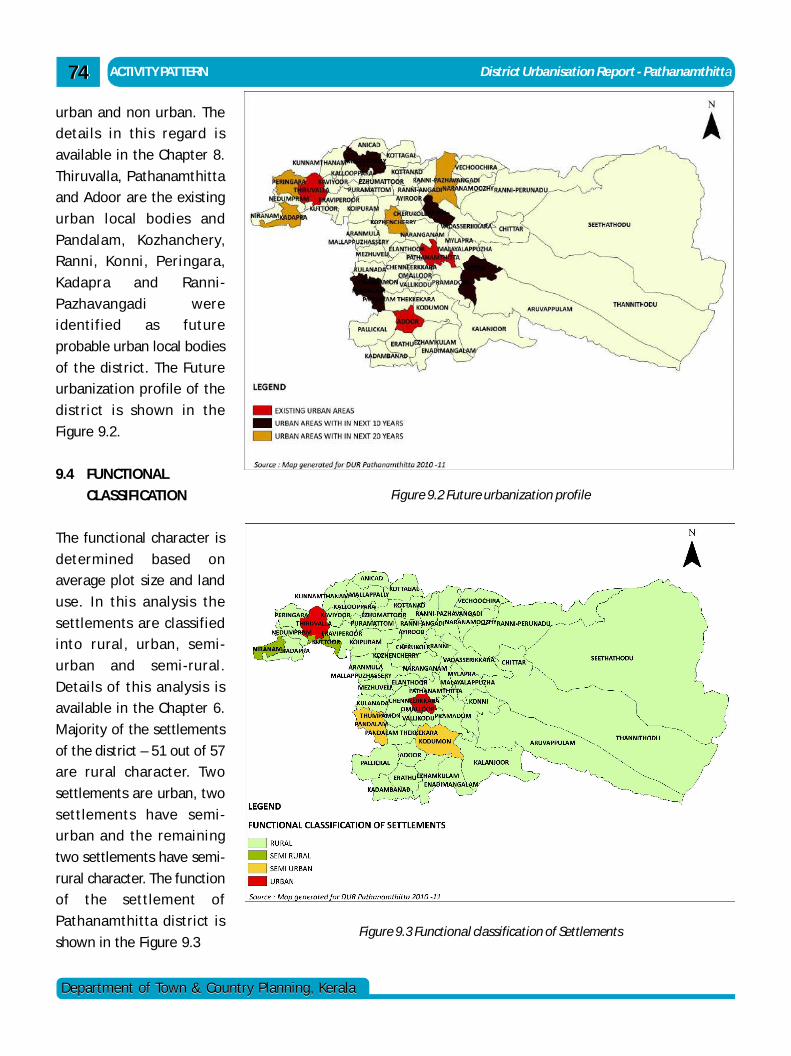
ACTIVITY PATTERN District Urbanisation Report - Pathanamthitta7474
Department of Town & Country Planning, KeralaDepartment of Town & Country Planning, Kerala
urban and non urban. The
details in this regard is
available in the Chapter 8.
Thiruvalla, Pathanamthitta
and Adoor are the existing
urban local bodies and
Pandalam, Kozhanchery,
Ranni, Konni, Peringara,
Kadapra and Ranni-
Pazhavangadi were
identified as future
probable urban local bodies
of the district. The Future
urbanization profile of the
district is shown in the
Figure 9.2.
9.4 FUNCTIONAL
CLASSIFICATION
The functional character is
determined based on
average plot size and land
use. In this analysis the
settlements are classified
into rural, urban, semi-
urban and semi-rural.
Details of this analysis is
available in the Chapter 6.
Majority of the settlements
of the district – 51 out of 57
are rural character. Two
settlements are urban, two
settlements have semi-
urban and the remaining
two settlements have semi-
rural character. The function
of the settlement of
Pathanamthitta district is
shown in the Figure 9.3
Figure 9.2 Future urbanization profile
Figure 9.3 Functional classification of Settlements
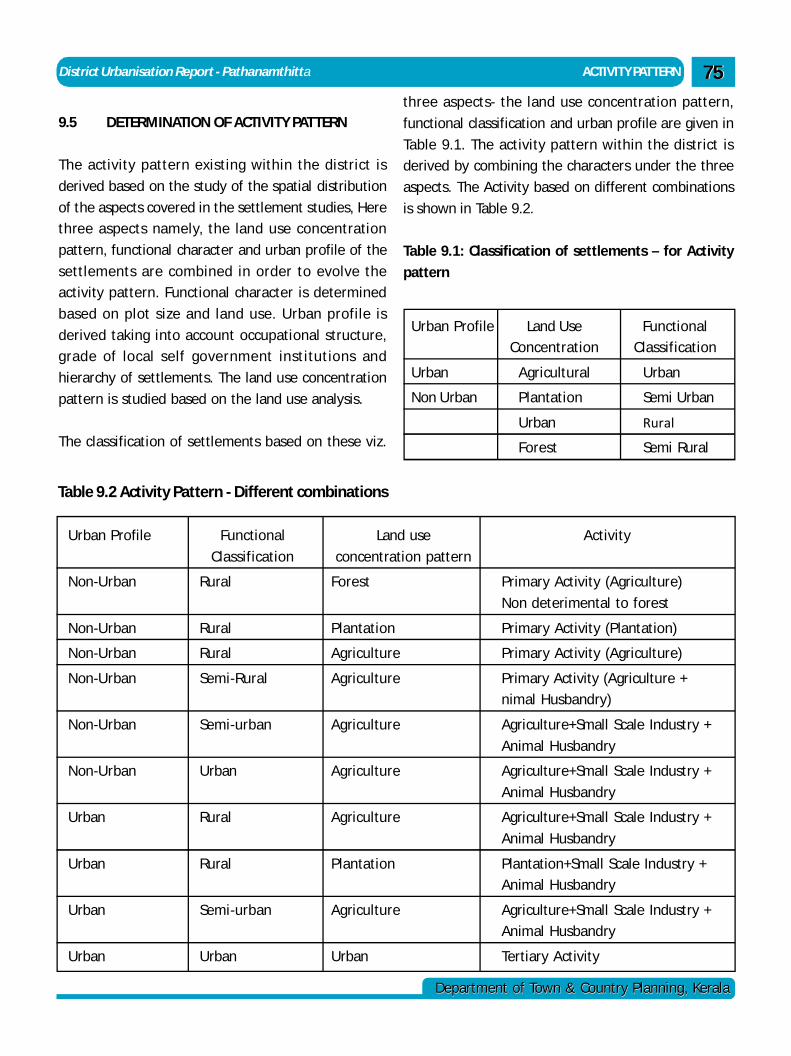
District Urbanisation Report - Pathanamthitta ACTIVITY PATTERN
Department of Town & Country Planning, KeralaDepartment of Town & Country Planning, Kerala
7575
9.5 DETERMINATION OF ACTIVITY PATTERN
The activity pattern existing within the district is
derived based on the study of the spatial distribution
of the aspects covered in the settlement studies, Here
three aspects namely, the land use concentration
pattern, functional character and urban profile of the
settlements are combined in order to evolve the
activity pattern. Functional character is determined
based on plot size and land use. Urban profile is
derived taking into account occupational structure,
grade of local self government institutions and
hierarchy of settlements. The land use concentration
pattern is studied based on the land use analysis.
The classification of settlements based on these viz.
Urban Profile Land Use Functional
Concentration Classification
Urban Agricultural Urban
Non Urban Plantation Semi Urban
Urban Rural
Forest Semi Rural
three aspects- the land use concentration pattern,
functional classification and urban profile are given in
Table 9.1. The activity pattern within the district is
derived by combining the characters under the three
aspects. The Activity based on different combinations
is shown in Table 9.2.
Table 9.1: Classification of settlements – for Activity
pattern
Urban Profile Functional Land use Activity
Classification concentration pattern
Non-Urban Rural Forest Primary Activity (Agriculture)
Non deterimental to forest
Non-Urban Rural Plantation Primary Activity (Plantation)
Non-Urban Rural Agriculture Primary Activity (Agriculture)
Non-Urban Semi-Rural Agriculture Primary Activity (Agriculture +
nimal Husbandry)
Non-Urban Semi-urban Agriculture Agriculture+Small Scale Industry +
Animal Husbandry
Non-Urban Urban Agriculture Agriculture+Small Scale Industry +
Animal Husbandry
Urban Rural Agriculture Agriculture+Small Scale Industry +
Animal Husbandry
Urban Rural Plantation Plantation+Small Scale Industry +
Animal Husbandry
Urban Semi-urban Agriculture Agriculture+Small Scale Industry +
Animal Husbandry
Urban Urban Urban Tertiary Activity
Table 9.2 Activity Pattern - Different combinations
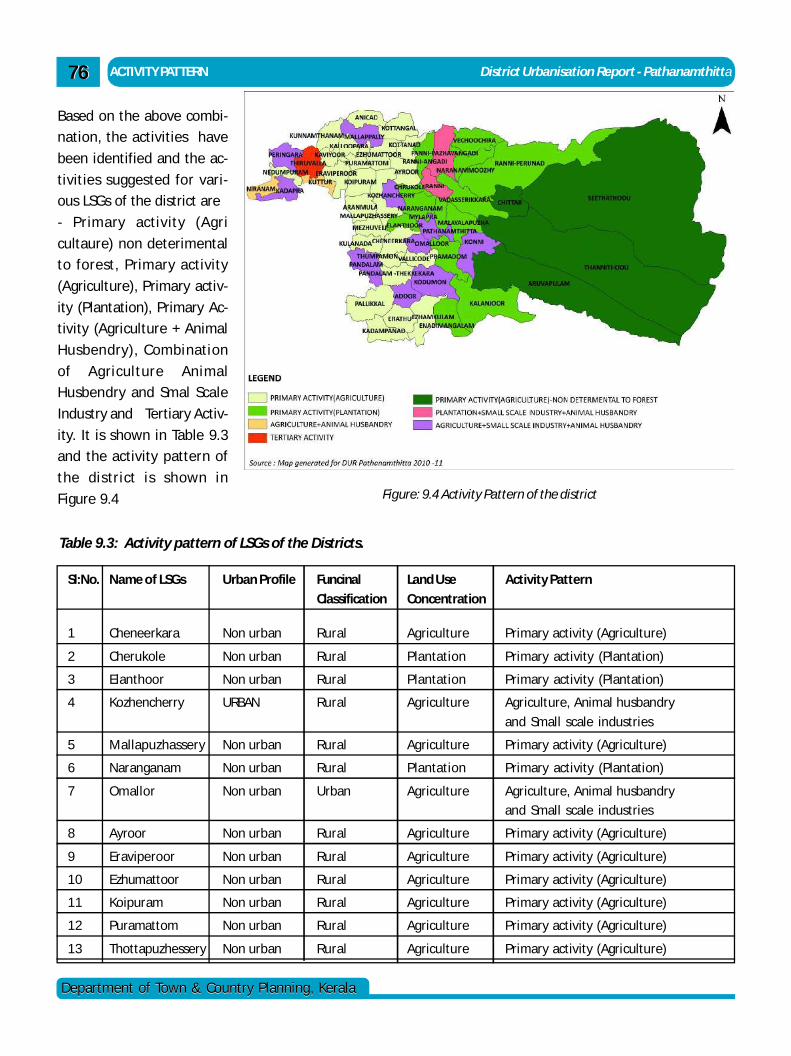
ACTIVITY PATTERN District Urbanisation Report - Pathanamthitta7676
Department of Town & Country Planning, KeralaDepartment of Town & Country Planning, Kerala
Based on the above combi-
nation, the activities have
been identified and the ac-
tivities suggested for vari-
ous LSGs of the district are
- Primary activity (Agri
cultaure) non deterimental
to forest, Primary activity
(Agriculture), Primary activ-
ity (Plantation), Primary Ac-
tivity (Agriculture + Animal
Husbendry), Combination
of Agriculture Animal
Husbendry and Smal Scale
Industry and Tertiary Activ-
ity. It is shown in Table 9.3
and the activity pattern of
the district is shown in
Figure 9.4
Table 9.3: Activity pattern of LSGs of the Districts.
Sl:No. Name of LSGs Urban Profile Funcinal Land Use Activity Pattern
Classification Concentration
1 Cheneerkara Non urban Rural Agriculture Primary activity (Agriculture)
2 Cherukole Non urban Rural Plantation Primary activity (Plantation)
3 Elanthoor Non urban Rural Plantation Primary activity (Plantation)
4 Kozhencherry URBAN Rural Agriculture Agriculture, Animal husbandry
and Small scale industries
5 Mallapuzhassery Non urban Rural Agriculture Primary activity (Agriculture)
6 Naranganam Non urban Rural Plantation Primary activity (Plantation)
7 Omallor Non urban Urban Agriculture Agriculture, Animal husbandryand Small scale industries
8 Ayroor Non urban Rural Agriculture Primary activity (Agriculture)
9 Eraviperoor Non urban Rural Agriculture Primary activity (Agriculture)
10 Ezhumattoor Non urban Rural Agriculture Primary activity (Agriculture)
11 Koipuram Non urban Rural Agriculture Primary activity (Agriculture)
12 Puramattom Non urban Rural Agriculture Primary activity (Agriculture)
13 Thottapuzhessery Non urban Rural Agriculture Primary activity (Agriculture)
Figure: 9.4 Activity Pattern of the district
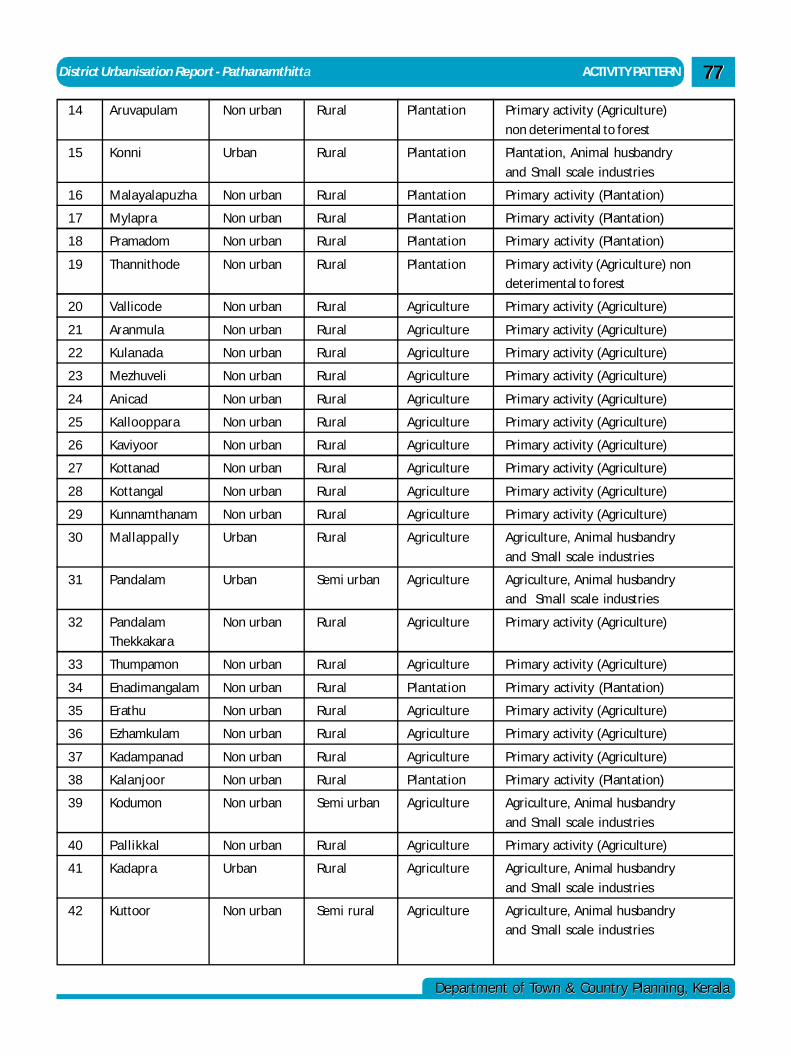
District Urbanisation Report - Pathanamthitta ACTIVITY PATTERN
Department of Town & Country Planning, KeralaDepartment of Town & Country Planning, Kerala
7777
14 Aruvapulam Non urban Rural Plantation Primary activity (Agriculture)
non deterimental to forest
15 Konni Urban Rural Plantation Plantation, Animal husbandry
and Small scale industries
16 Malayalapuzha Non urban Rural Plantation Primary activity (Plantation)
17 Mylapra Non urban Rural Plantation Primary activity (Plantation)
18 Pramadom Non urban Rural Plantation Primary activity (Plantation)
19 Thannithode Non urban Rural Plantation Primary activity (Agriculture) nondeterimental to forest
20 Vallicode Non urban Rural Agriculture Primary activity (Agriculture)
21 Aranmula Non urban Rural Agriculture Primary activity (Agriculture)
22 Kulanada Non urban Rural Agriculture Primary activity (Agriculture)
23 Mezhuveli Non urban Rural Agriculture Primary activity (Agriculture)
24 Anicad Non urban Rural Agriculture Primary activity (Agriculture)
25 Kallooppara Non urban Rural Agriculture Primary activity (Agriculture)
26 Kaviyoor Non urban Rural Agriculture Primary activity (Agriculture)
27 Kottanad Non urban Rural Agriculture Primary activity (Agriculture)
28 Kottangal Non urban Rural Agriculture Primary activity (Agriculture)
29 Kunnamthanam Non urban Rural Agriculture Primary activity (Agriculture)
30 Mallappally Urban Rural Agriculture Agriculture, Animal husbandry
and Small scale industries
31 Pandalam Urban Semi urban Agriculture Agriculture, Animal husbandryand Small scale industries
32 Pandalam Non urban Rural Agriculture Primary activity (Agriculture)Thekkakara
33 Thumpamon Non urban Rural Agriculture Primary activity (Agriculture)
34 Enadimangalam Non urban Rural Plantation Primary activity (Plantation)
35 Erathu Non urban Rural Agriculture Primary activity (Agriculture)
36 Ezhamkulam Non urban Rural Agriculture Primary activity (Agriculture)
37 Kadampanad Non urban Rural Agriculture Primary activity (Agriculture)
38 Kalanjoor Non urban Rural Plantation Primary activity (Plantation)
39 Kodumon Non urban Semi urban Agriculture Agriculture, Animal husbandry
and Small scale industries
40 Pallikkal Non urban Rural Agriculture Primary activity (Agriculture)
41 Kadapra Urban Rural Agriculture Agriculture, Animal husbandry
and Small scale industries
42 Kuttoor Non urban Semi rural Agriculture Agriculture, Animal husbandryand Small scale industries
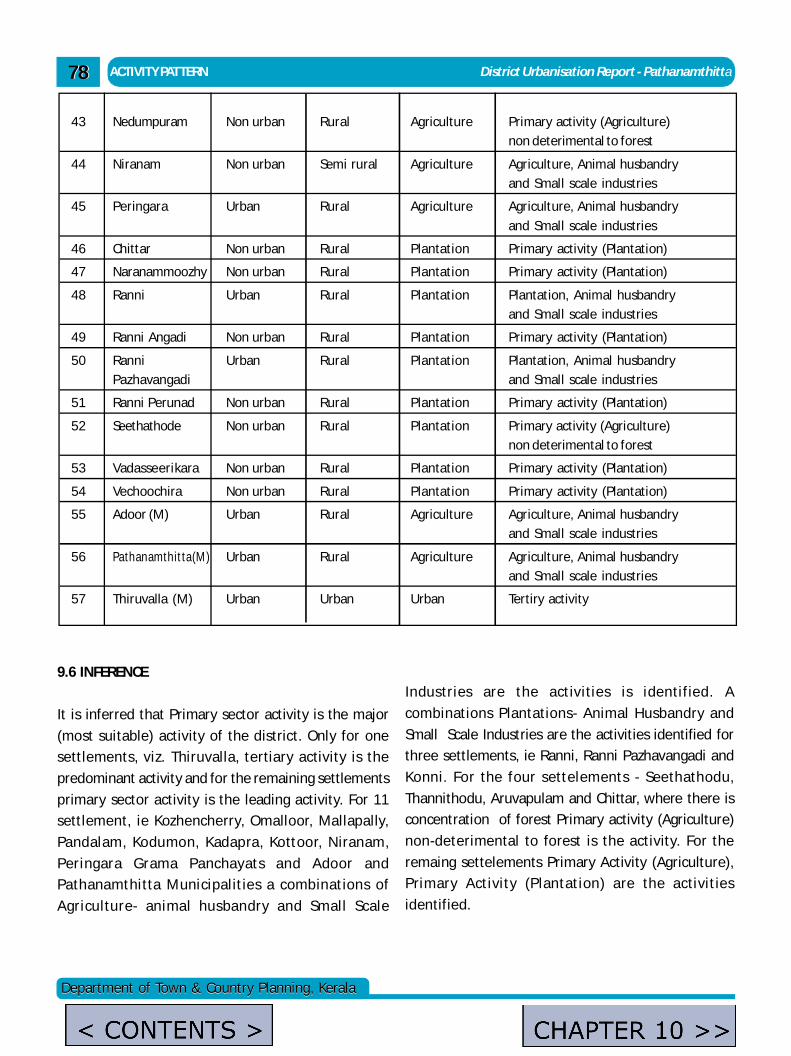
ACTIVITY PATTERN District Urbanisation Report - Pathanamthitta7878
Department of Town & Country Planning, KeralaDepartment of Town & Country Planning, Kerala
9.6 INFERENCE
It is inferred that Primary sector activity is the major
(most suitable) activity of the district. Only for one
settlements, viz. Thiruvalla, tertiary activity is the
predominant activity and for the remaining settlements
primary sector activity is the leading activity. For 11
settlement, ie Kozhencherry, Omalloor, Mallapally,
Pandalam, Kodumon, Kadapra, Kottoor, Niranam,
Peringara Grama Panchayats and Adoor and
Pathanamthitta Municipalities a combinations of
Agriculture- animal husbandry and Small Scale
43 Nedumpuram Non urban Rural Agriculture Primary activity (Agriculture)non deterimental to forest
44 Niranam Non urban Semi rural Agriculture Agriculture, Animal husbandryand Small scale industries
45 Peringara Urban Rural Agriculture Agriculture, Animal husbandry
and Small scale industries
46 Chittar Non urban Rural Plantation Primary activity (Plantation)
47 Naranammoozhy Non urban Rural Plantation Primary activity (Plantation)
48 Ranni Urban Rural Plantation Plantation, Animal husbandryand Small scale industries
49 Ranni Angadi Non urban Rural Plantation Primary activity (Plantation)
50 Ranni Urban Rural Plantation Plantation, Animal husbandryPazhavangadi and Small scale industries
51 Ranni Perunad Non urban Rural Plantation Primary activity (Plantation)
52 Seethathode Non urban Rural Plantation Primary activity (Agriculture)non deterimental to forest
53 Vadasseerikara Non urban Rural Plantation Primary activity (Plantation)
54 Vechoochira Non urban Rural Plantation Primary activity (Plantation)
55 Adoor (M) Urban Rural Agriculture Agriculture, Animal husbandryand Small scale industries
56 Pathanamthitta(M) Urban Rural Agriculture Agriculture, Animal husbandryand Small scale industries
57 Thiruvalla (M) Urban Urban Urban Tertiry activity
Industries are the activities is identified. A
combinations Plantations- Animal Husbandry and
Small Scale Industries are the activities identified for
three settlements, ie Ranni, Ranni Pazhavangadi and
Konni. For the four settelements - Seethathodu,
Thannithodu, Aruvapulam and Chittar, where there is
concentration of forest Primary activity (Agriculture)
non-deterimental to forest is the activity. For the
remaing settelements Primary Activity (Agriculture),
Primary Activity (Plantation) are the activities
identified.
admin
Text Box
< CONTENTS >
admin
Text Box
CHAPTER 10 >>
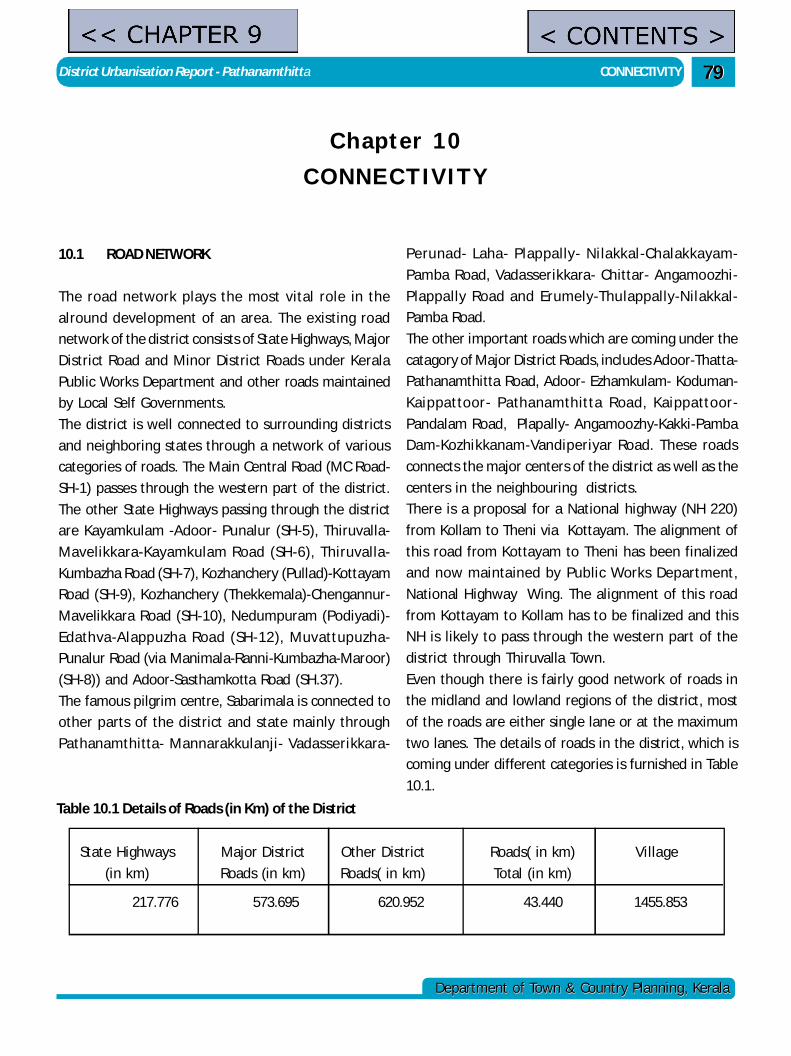
District Urbanisation Report - Pathanamthitta CONNECTIVITY
Department of Town & Country Planning, KeralaDepartment of Town & Country Planning, Kerala
7979
Chapter 10CONNECTIVITY
10.1 ROAD NETWORK
The road network plays the most vital role in the
alround development of an area. The existing road
network of the district consists of State Highways, Major
District Road and Minor District Roads under Kerala
Public Works Department and other roads maintained
by Local Self Governments.
The district is well connected to surrounding districts
and neighboring states through a network of various
categories of roads. The Main Central Road (MC Road-
SH-1) passes through the western part of the district.
The other State Highways passing through the district
are Kayamkulam -Adoor- Punalur (SH-5), Thiruvalla-
Mavelikkara-Kayamkulam Road (SH-6), Thiruvalla-
Kumbazha Road (SH-7), Kozhanchery (Pullad)-Kottayam
Road (SH-9), Kozhanchery (Thekkemala)-Chengannur-
Mavelikkara Road (SH-10), Nedumpuram (Podiyadi)-
Edathva-Alappuzha Road (SH-12), Muvattupuzha-
Punalur Road (via Manimala-Ranni-Kumbazha-Maroor)
(SH-8)) and Adoor-Sasthamkotta Road (SH.37).
The famous pilgrim centre, Sabarimala is connected to
other parts of the district and state mainly through
Pathanamthitta- Mannarakkulanji- Vadasserikkara-
Perunad- Laha- Plappally- Nilakkal-Chalakkayam-
Pamba Road, Vadasserikkara- Chittar- Angamoozhi-
Plappally Road and Erumely-Thulappally-Nilakkal-
Pamba Road.
The other important roads which are coming under the
catagory of Major District Roads, includes Adoor-Thatta-
Pathanamthitta Road, Adoor- Ezhamkulam- Koduman-
Kaippattoor- Pathanamthitta Road, Kaippattoor-
Pandalam Road, Plapally- Angamoozhy-Kakki-Pamba
Dam-Kozhikkanam-Vandiperiyar Road. These roads
connects the major centers of the district as well as the
centers in the neighbouring districts.
There is a proposal for a National highway (NH 220)
from Kollam to Theni via Kottayam. The alignment of
this road from Kottayam to Theni has been finalized
and now maintained by Public Works Department,
National Highway Wing. The alignment of this road
from Kottayam to Kollam has to be finalized and this
NH is likely to pass through the western part of the
district through Thiruvalla Town.
Even though there is fairly good network of roads in
the midland and lowland regions of the district, most
of the roads are either single lane or at the maximum
two lanes. The details of roads in the district, which is
coming under different categories is furnished in Table
10.1.
Table 10.1 Details of Roads (in Km) of the District
State Highways Major District Other District Roads( in km) Village
(in km) Roads (in km) Roads( in km) Total (in km)
217.776 573.695 620.952 43.440 1455.853
admin
Text Box
<< CHAPTER 9
admin
Text Box
< CONTENTS >
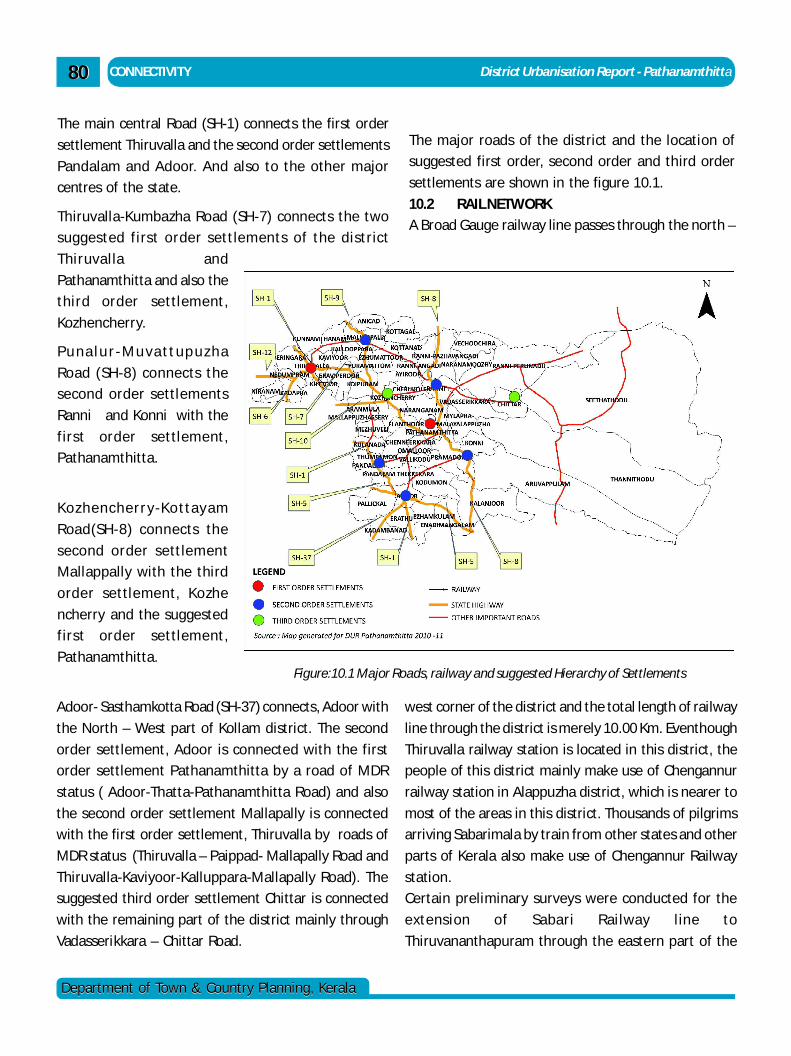
CONNECTIVITY District Urbanisation Report - Pathanamthitta8080
Department of Town & Country Planning, KeralaDepartment of Town & Country Planning, Kerala
The main central Road (SH-1) connects the first order
settlement Thiruvalla and the second order settlements
Pandalam and Adoor. And also to the other major
centres of the state.
Thiruvalla-Kumbazha Road (SH-7) connects the two
suggested first order settlements of the district
Thiruvalla and
Pathanamthitta and also the
third order settlement,
Kozhencherry.
Pu na l u r - Mu va tt up uz ha
Road (SH-8) connects the
second order settlements
Ranni and Konni with the
first order settlement,
Pathanamthitta.
Kozhencherry-Kottayam
Road(SH-8) connects the
second order settlement
Mallappally with the third
order settlement, Kozhe
ncherry and the suggested
first order settlement,
Pathanamthitta.
The major roads of the district and the location of
suggested first order, second order and third order
settlements are shown in the figure 10.1.
10.2 RAIL NETWORK
A Broad Gauge railway line passes through the north –
west corner of the district and the total length of railway
line through the district is merely 10.00 Km. Eventhough
Thiruvalla railway station is located in this district, the
people of this district mainly make use of Chengannur
railway station in Alappuzha district, which is nearer to
most of the areas in this district. Thousands of pilgrims
arriving Sabarimala by train from other states and other
parts of Kerala also make use of Chengannur Railway
station.
Certain preliminary surveys were conducted for the
extension of Sabari Railway line to
Thiruvananthapuram through the eastern part of the
Adoor- Sasthamkotta Road (SH-37) connects, Adoor with
the North – West part of Kollam district. The second
order settlement, Adoor is connected with the first
order settlement Pathanamthitta by a road of MDR
status ( Adoor-Thatta-Pathanamthitta Road) and also
the second order settlement Mallapally is connected
with the first order settlement, Thiruvalla by roads of
MDR status (Thiruvalla – Paippad- Mallapally Road and
Thiruvalla-Kaviyoor-Kalluppara-Mallapally Road). The
suggested third order settlement Chittar is connected
with the remaining part of the district mainly through
Vadasserikkara – Chittar Road.
Figure:10.1 Major Roads, railway and suggested Hierarchy of Settlements
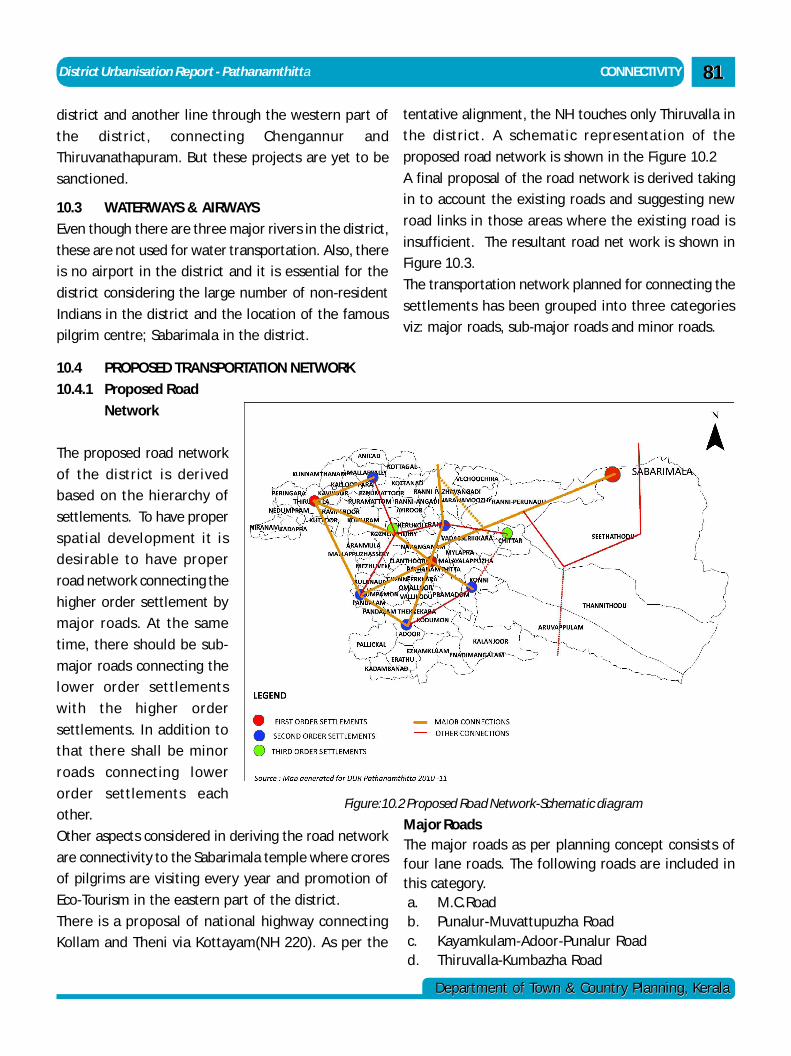
District Urbanisation Report - Pathanamthitta CONNECTIVITY
Department of Town & Country Planning, KeralaDepartment of Town & Country Planning, Kerala
8181
district and another line through the western part of
the district, connecting Chengannur and
Thiruvanathapuram. But these projects are yet to be
sanctioned.
10.3 WATERWAYS & AIRWAYS
Even though there are three major rivers in the district,
these are not used for water transportation. Also, there
is no airport in the district and it is essential for the
district considering the large number of non-resident
Indians in the district and the location of the famous
pilgrim centre; Sabarimala in the district.
10.4 PROPOSED TRANSPORTATION NETWORK
10.4.1 Proposed Road
Network
The proposed road network
of the district is derived
based on the hierarchy of
settlements. To have proper
spatial development it is
desirable to have proper
road network connecting the
higher order settlement by
major roads. At the same
time, there should be sub-
major roads connecting the
lower order settlements
with the higher order
settlements. In addition to
that there shall be minor
roads connecting lower
order settlements each
other.
Other aspects considered in deriving the road network
are connectivity to the Sabarimala temple where crores
of pilgrims are visiting every year and promotion of
Eco-Tourism in the eastern part of the district.
There is a proposal of national highway connecting
Kollam and Theni via Kottayam(NH 220). As per the
tentative alignment, the NH touches only Thiruvalla in
the district. A schematic representation of the
proposed road network is shown in the Figure 10.2
A final proposal of the road network is derived taking
in to account the existing roads and suggesting new
road links in those areas where the existing road is
insufficient. The resultant road net work is shown in
Figure 10.3.
The transportation network planned for connecting the
settlements has been grouped into three categories
viz: major roads, sub-major roads and minor roads.
Major RoadsThe major roads as per planning concept consists offour lane roads. The following roads are included inthis category.a. M.C.Roadb. Punalur-Muvattupuzha Roadc. Kayamkulam-Adoor-Punalur Roadd. Thiruvalla-Kumbazha Road
Figure:10.2 Proposed Road Network-Schematic diagram
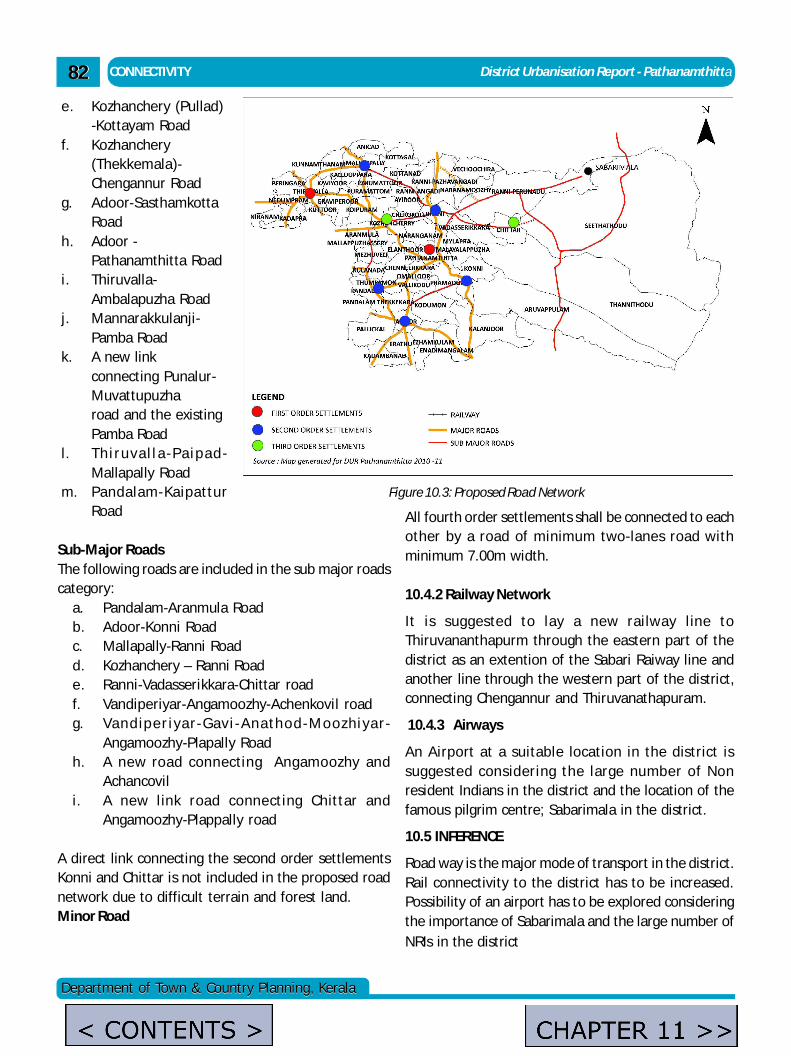
CONNECTIVITY District Urbanisation Report - Pathanamthitta8282
Department of Town & Country Planning, KeralaDepartment of Town & Country Planning, Kerala
e. Kozhanchery (Pullad)-Kottayam Road
f. Kozhanchery(Thekkemala)-Chengannur Road
g. Adoor-SasthamkottaRoad
h. Adoor -Pathanamthitta Road
i. Thiruvalla-Ambalapuzha Road
j. Mannarakkulanji-Pamba Road
k. A new linkconnecting Punalur-Muvattupuzharoad and the existingPamba Road
l. Th i ruva l l a -Pa i pad-Mallapally Road
m. Pandalam-KaipatturRoad
Sub-Major RoadsThe following roads are included in the sub major roadscategory:
a. Pandalam-Aranmula Roadb. Adoor-Konni Roadc. Mallapally-Ranni Roadd. Kozhanchery – Ranni Roade. Ranni-Vadasserikkara-Chittar roadf. Vandiperiyar-Angamoozhy-Achenkovil roadg. Vandiper i yar-Gav i -A nathod-Moozhi yar-
Angamoozhy-Plapally Roadh. A new road connecting Angamoozhy and
Achancovili. A new link road connecting Chittar and
Angamoozhy-Plappally road
A direct link connecting the second order settlementsKonni and Chittar is not included in the proposed roadnetwork due to difficult terrain and forest land.Minor Road
All fourth order settlements shall be connected to eachother by a road of minimum two-lanes road withminimum 7.00m width.
10.4.2 Railway Network
It is suggested to lay a new railway line toThiruvananthapurm through the eastern part of thedistrict as an extention of the Sabari Raiway line andanother line through the western part of the district,connecting Chengannur and Thiruvanathapuram.
10.4.3 Airways
An Airport at a suitable location in the district issuggested considering the large number of Nonresident Indians in the district and the location of thefamous pilgrim centre; Sabarimala in the district.
10.5 INFERENCE
Road way is the major mode of transport in the district.Rail connectivity to the district has to be increased.Possibility of an airport has to be explored consideringthe importance of Sabarimala and the large number ofNRIs in the district
Figure 10.3: Proposed Road Network
admin
Text Box
< CONTENTS >
admin
Text Box
CHAPTER 11 >>
District Urbanisation Report - Pathanamthitta SPATIAL STRUCTURE
Department of Town & Country Planning, KeralaDepartment of Town & Country Planning, Kerala
8383
Chapter - 11SPATIAL STRUCTURE
11.1 SPATIAL STRUCTURE BASED ON SETTLEMENT
STUDIES
The spatial structure gives a frame work for
determining the location of future development
activities rationally. The spatial structure of the district
has been evolved by integrating the activity pattern,
the hierarchy of settlements and the regional
connectivity plan. In the settlement analysis the
following aspects pertaining to settlements of the
district were studied
1. Land use distribution
2. Population distribution
3. Occupational structure
4. Functional character
5. Hierarchy of settlements
6. Urban profile
11.2 ACTIVITY PATTERN
The activity pattern existing within the district is
derived based on the study of the spatial distribution
of the aspects covered in the settlement studies. Here,
three aspects namely, the land use concentration
pattern, the functional character and the urban profile,
which cover all the aspects taken for the study of the
settlements are combined in order to evolve the
activity pattern (the Functional character is determined
based on plot size and land use, the Urban profile is
derived taking into account occupational structure,
status of the LSGs and hierarchy of settlements and the
Land use concentration pattern is studied based on the
land use analysis). Details regarding determination of
Activity pattern of the settlements is given in chapter.9
and the activity pattern of the district is shown in the
Figure 9.4.
11.3 HIERARCHY OF SETTLEMENTS
As per the settlement analysis, the settlements in the
district were grouped into four hierarchies; first order,
second order, third order and fourth order. The
suggested 1st order settlements of the district are
Pathanamthitta and Thiruvalla and the suggested 2nd
order settlements are Pandalam, Ranni, Konni, Adoor
and Mallapally. Kozhanchery and Chittar are the
suggested 3rd order settlements. The remaining Grama
Panchayats are classified as 4 th order settlements. The
proposed hierarchy of settlements is shown in the
Figure 7.9.
11.4 CONNECTIVITY
The proposed road network of the district is derived
based on the hierarchy of settlements. Connectivity
to the famous pilgrim centre Sabarimala and promotion
of Eco-tourism in the settlements of the eastern part
of district also considered. The road network is
proposed so as to ensure proper connection among
the higher order settlements by major roads. Sub-major
roads and minor roads were also proposed connecting
the lower order settlements. Besides, connection with
the surrounding districts are also considered a final
proposal of the road network has been derived taking
into account those existing roads and suggesting new
road links in those areas where the existing road is
insufficient. Details regarding connectivity among
admin
Text Box
<< CHAPTER 10
admin
Text Box
< CONTENTS >
SPATIAL STRUCTURE District Urbanisation Report - Pathanamthitta8484
Department of Town & Country Planning, KeralaDepartment of Town & Country Planning, Kerala
settlements is available in the Chapter 10 and the
proposed road network is shown in Figure 10.3.
11.5 SPATIAL STRUCTURE
The spatial structure of the district is obtained by
overlaying the activity pattern, road network and
hierarchy of settlements. Figure 11.1 is a schematic
diagram and the Figure 11.2 is the detai led map
showing the Spatial structure of the district.
Agriculture related activities are identified as suitable
activity for most of settlements of the district. Primary
activity (Plantation) is proposed for the most of the
settlements in the eastern part of the district and
Primary activity (Agriculture) is proposed for most of
the settlements in the midland area of the district.
Tertiary activity is proposed for three urban settlements
of the district; Thiruvalla, Pathanamthitta and Adoor.
Combination of Agriculture and non Agriculture
activities are proposed for the remaining settlements.
Most of the urban settlements are located in the
western part of the district and the eastern part of the
district is predominantly plantation/forest area. Two
settlements; Thiruvalla and Pathanamthitta are
suggested as first order settlements. The other higher
order settlements (except Chittar) are proposed in the
western part of the district. Chittar is proposed as a
third order settlement in the eastern part considering
large unserved area covered mostly by forest.
There is good net work of State Highways and Major
district roads in the midland and low land regions of
the district and all the first order and second order
settlements are connected by State highways. The road
network is proposed in such a manner that there shall
be least disturbance to the eastern part especially the
forest area. But few connections to this area is
proposed to ensure good connectivity to Sabarimala,
connecting to the neighbouring districts and to promote
Eco-Tourism in the settlements in the eastern part of
the district where there is enough potential for the
same.
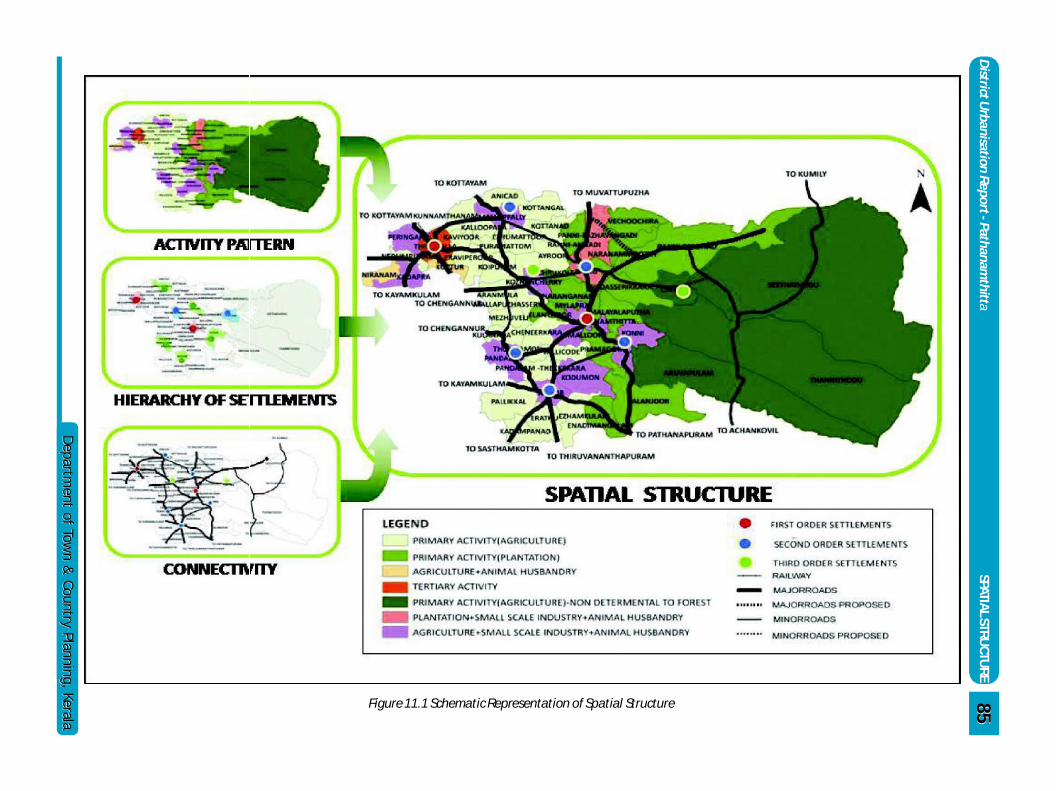
District U
rbanisation Report - Pathanamthitta
SPATIAL STRUCTU
RE
Departm
ent of Town &
Country Planning, KeralaD
epartment of Tow
n & Country Planning, Kerala
8585Figure 11.1 Schematic Representation of Spatial Structure
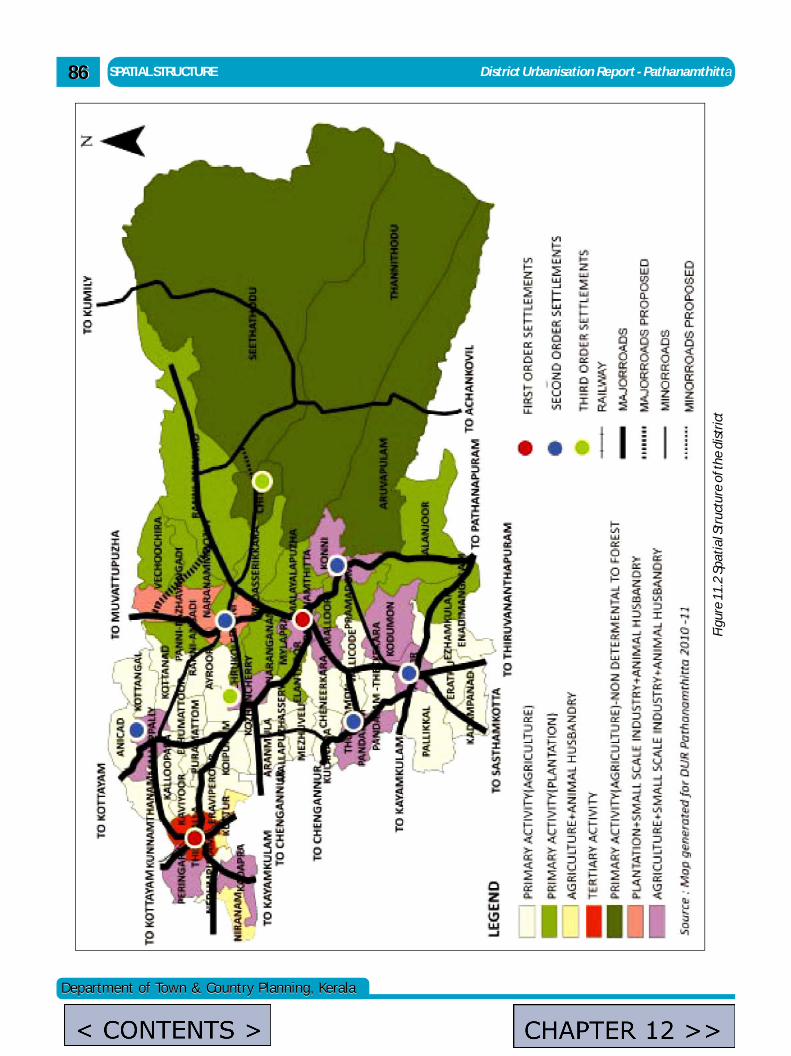
SPATIAL STRUCTURE District Urbanisation Report - Pathanamthitta8686
Department of Town & Country Planning, KeralaDepartment of Town & Country Planning, Kerala
Figu
re 1
1.2
Spat
ial S
truc
ture
of t
he d
istr
ict
admin
Text Box
< CONTENTS >
admin
Text Box
CHAPTER 12 >>
District Urbanisation Report - Pathanamthitta SUMMARY OF FINDINGS
Department of Town & Country Planning, KeralaDepartment of Town & Country Planning, Kerala
8787
Chapter 12SUMMARY OF FINDINGS
In the study on urbanization of Pathanamthitta district
detailed analysis has been made regarding the regional
linkages, population, occupational structure, land use
and connectivity of the district. Based on the analysis,
the land use concentration pattern, functional
character of settlement, hierarchy of settlements,
urban profile and proposed road network etc are
arrived at. Based on the land use concentration pattern,
functional character and urban profile of settlements,
the Activity pattern of the settlements is identified.
Finally based on the Activity pattern, Hierarchy of
settlements and Proposed road network, the Spatial
structure of the district are derived. A summary of
findings of the study is furnished below.
1. Population growth rate of the district is the lowest
in the state. An increase of only about 30,000 is
expected by 2021 in total population.
3. The population growth rate pattern among LSGs
of the District shows that growth rate is the
highest in those LSGs located in the western or
central part of the district, which are adjacent to
major travel corridors or adjacent to the existing
urban settlements.
3. The Work Participation Rate of the district is very
low when compared with the state figures. Low
work force participation rate indicates decline in
local economic activities both rural and urban in
the District. But during the period 1991-2001 the
growth rate of total workers (13.15%) is more than
the population growth rate (3.99%). It indicates
that the employment opportunity is increasing
more than that of population growth rate.
4. A shift (towards service sector) in the
occupational structure of the rural areas shows in
the urbanisation trend of the rural areas. There is
dilution in the rural nature of the rural areas of
the district as far as the occupational structure is
considered. Irrespective of rural or urban areas,
the share of Other workers category in the work
force is increasing. This resulted in narrowing
down of the boundary distinguishing the
character of rural and urban areas in terms of
occupational structure.
5. About 50% of the total workers are engaged in
tertiary activity. Even in the rural areas, the
percentage of workers in Other workers category
is high (46%). This implies that even in rural areas,
the primary sector is on decline and the
production sector is showing a declining trend.
Study of temporal variation of occupational
structure shows that the cultivators and
Agriculture labourers show a drastic decrease in
total number from 1991 to 2001.
6. The existing land use pattern of the District shows
that 45.29% of the total district area is coming
under forest land, 29.18% of land is under
agricultural use and 18.58% of total area is
plantation. The spatial distribution of the land
use of the district shows that forest area has a
concentration in the eastern part of the district.
Agriculture area is concentrated in the midland
and the low land regions of the district. The
plantation area is in between the agriculture land
and forest land. The non-agriculture area of the
district is limited to few pocket and scattered and
admin
Text Box
<< CHAPTER 11
admin
Text Box
< CONTENTS >
SUMMARY OF FINDINGS District Urbanisation Report - Pathanamthitta8888
Department of Town & Country Planning, KeralaDepartment of Town & Country Planning, Kerala
its extent is nominal. The general character of
settlements show that most of them are rural in
nature, indicating that there is scope for
developing the agriculture sector as the main
economic base of the District.
7. The district is blessed with potential water
resources and tourism potential spots.
8. The spatial distribution of the settlements based
on its functional character shows a clear
demarcation of the settlements in four
categories- rural, urban, semi urban and semi
rural. But majority of the settlements in the
district – 51 out of 57 are rural character. The 6 non
rural character settlements of the district-
Omalloor (urban), Pandalam (Semi urban),
Kodumon (Semi urban), Kuttoor (Semi rural),
Niranam (Semi rural) and Thiruvalla (Urban) are
located in the western part of the district.
9. As per the existing hierarchy of settlements,
Thiruvalla is the I st order settlements and
Pathanamtitta, Adoor and Pandalam are the IInd
order settlements. Ranni, Peringara, Mallappally,
Koipuram, Konni, Kadampanadu, Ranni-
Pazhavangadi, Kozhecherry, Cheneerkkara,
Ezhamkulam, Pallickal and Aranmula are the IIIrd
order settlements. The remaining 41 settlements
are IVth order settlements.
10. As derived in the proposed hierarchy of
settlements, there are two first order
settlements- Thiruvalla and Pathanamthitta, five
second order settlements- Adoor, Pandalam,
Mallapally, Ranni and Konni, two third order
settlements- Kozhanchery and Chittar. The
remaining settlements are fourth order
settlements. In the functional character wise
analysis of the higher order settlements, only
Thiruvalla is urban in nature. Pandalam is Semi
Urban and the remaining higher order
settlements are rural.
11. Pathanamthitta is one of the least urbanized
districts in the state.
12. In the analysis of the activity pattern of the
district, it is inferred that Primary sector activity
is the major (most suitable) activity identified for
the district. Only for three settlements Thiruvalla,
Pathanamthitta and Adoor tertiary activity was
identified as the most suitable activity and for
the remaining settlements primary sector activity
is identified as most suitable activity.
13. Road way is the major mode of transport in the
district. Rail connectivity to the district has to be
increased. Possibility of an airport has to be
explored considering the importance of
Sabarimala and NRI’s in the district.
14. Thiruvalla, Pathanamthitta and Adoor are the
present urban local Governments of the districts.
Pandalam Mallapally, Ranni and Konni Grama
panchayaths will achieve urban status in the next
10 years and Peringara, Kozhencherry, Kadapra
and Ranni- Pazhavagadi Grama panchayaths will
attain the urban status in the next 20 years.
admin
Text Box
< CONTENTS >
admin
Text Box
ANNEX-01 >>
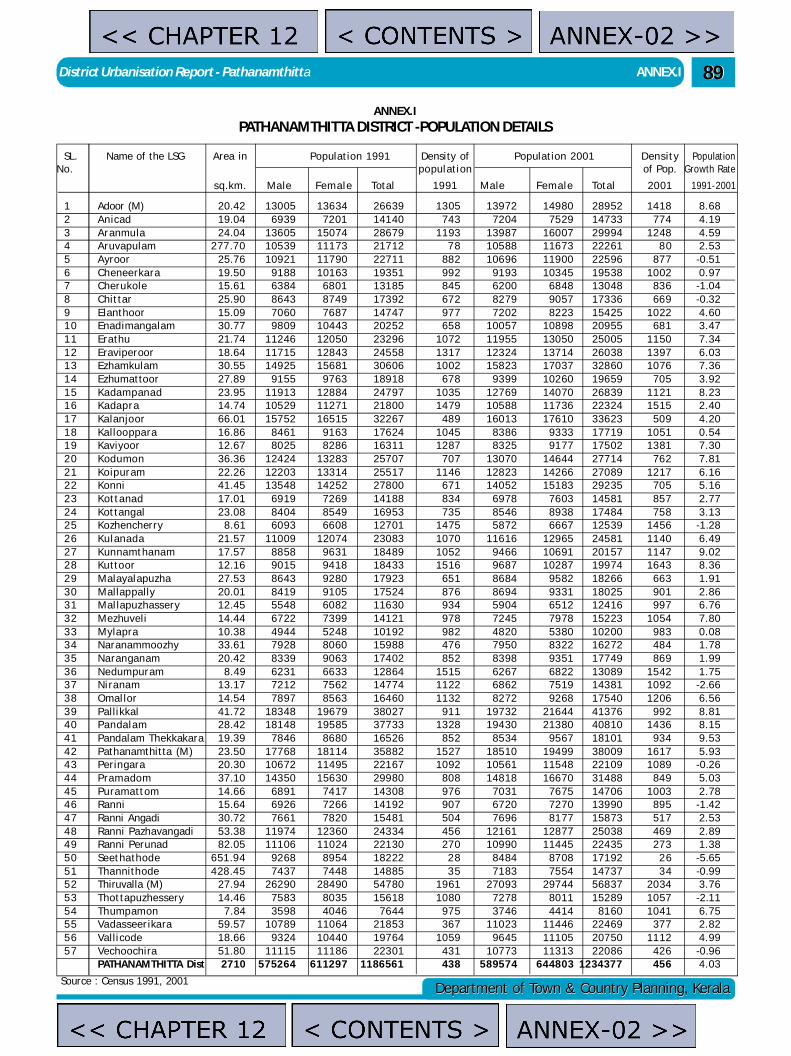
District Urbanisation Report - Pathanamthitta ANNEX.I
Department of Town & Country Planning, KeralaDepartment of Town & Country Planning, Kerala
8989
1 Adoor (M) 20.42 13005 13634 26639 1305 13972 14980 28952 1418 8.682 Anicad 19.04 6939 7201 14140 743 7204 7529 14733 774 4.193 Aranmula 24.04 13605 15074 28679 1193 13987 16007 29994 1248 4.594 Aruvapulam 277.70 10539 11173 21712 7 8 10588 11673 22261 8 0 2.535 Ayroor 25.76 10921 11790 22711 882 10696 11900 22596 877 -0.516 Cheneerkara 19.50 9188 10163 19351 992 9193 10345 19538 1002 0.977 Cherukole 15.61 6384 6801 13185 845 6200 6848 13048 836 -1.048 Chittar 25.90 8643 8749 17392 672 8279 9057 17336 669 -0.329 Elanthoor 15.09 7060 7687 14747 977 7202 8223 15425 1022 4.601 0 Enadimangalam 30.77 9809 10443 20252 658 10057 10898 20955 681 3.471 1 Erathu 21.74 11246 12050 23296 1072 11955 13050 25005 1150 7.341 2 Eraviperoor 18.64 11715 12843 24558 1317 12324 13714 26038 1397 6.031 3 Ezhamkulam 30.55 14925 15681 30606 1002 15823 17037 32860 1076 7.361 4 Ezhumattoor 27.89 9155 9763 18918 678 9399 10260 19659 705 3.921 5 Kadampanad 23.95 11913 12884 24797 1035 12769 14070 26839 1121 8.231 6 Kadapra 14.74 10529 11271 21800 1479 10588 11736 22324 1515 2.401 7 Kalanjoor 66.01 15752 16515 32267 489 16013 17610 33623 509 4.201 8 Kallooppara 16.86 8461 9163 17624 1045 8386 9333 17719 1051 0.541 9 Kaviyoor 12.67 8025 8286 16311 1287 8325 9177 17502 1381 7.302 0 Kodumon 36.36 12424 13283 25707 707 13070 14644 27714 762 7.812 1 Koipuram 22.26 12203 13314 25517 1146 12823 14266 27089 1217 6.162 2 Konni 41.45 13548 14252 27800 671 14052 15183 29235 705 5.162 3 Kottanad 17.01 6919 7269 14188 834 6978 7603 14581 857 2.772 4 Kottangal 23.08 8404 8549 16953 735 8546 8938 17484 758 3.132 5 Kozhencherry 8.61 6093 6608 12701 1475 5872 6667 12539 1456 -1.282 6 Kulanada 21.57 11009 12074 23083 1070 11616 12965 24581 1140 6.492 7 Kunnamthanam 17.57 8858 9631 18489 1052 9466 10691 20157 1147 9.022 8 Kuttoor 12.16 9015 9418 18433 1516 9687 10287 19974 1643 8.362 9 Malayalapuzha 27.53 8643 9280 17923 651 8684 9582 18266 663 1.913 0 Mallappally 20.01 8419 9105 17524 876 8694 9331 18025 901 2.863 1 Mal lapuzhassery 12.45 5548 6082 11630 934 5904 6512 12416 997 6.763 2 Mezhuveli 14.44 6722 7399 14121 978 7245 7978 15223 1054 7.803 3 Mylapra 10.38 4944 5248 10192 982 4820 5380 10200 983 0.083 4 Naranammoozhy 33.61 7928 8060 15988 476 7950 8322 16272 484 1.783 5 Naranganam 20.42 8339 9063 17402 852 8398 9351 17749 869 1.993 6 Nedumpuram 8.49 6231 6633 12864 1515 6267 6822 13089 1542 1.753 7 Niranam 13.17 7212 7562 14774 1122 6862 7519 14381 1092 -2.663 8 Omal lor 14.54 7897 8563 16460 1132 8272 9268 17540 1206 6.563 9 Pallikkal 41.72 18348 19679 38027 911 19732 21644 41376 992 8.814 0 Pandalam 28.42 18148 19585 37733 1328 19430 21380 40810 1436 8.154 1 Pandalam Thekkakara 19.39 7846 8680 16526 852 8534 9567 18101 934 9.534 2 Pathanamthitta (M) 23.50 17768 18114 35882 1527 18510 19499 38009 1617 5.934 3 Peringara 20.30 10672 11495 22167 1092 10561 11548 22109 1089 -0.264 4 Pramadom 37.10 14350 15630 29980 808 14818 16670 31488 849 5.034 5 Puramattom 14.66 6891 7417 14308 976 7031 7675 14706 1003 2.784 6 Ranni 15.64 6926 7266 14192 907 6720 7270 13990 895 -1.424 7 Ranni Angadi 30.72 7661 7820 15481 504 7696 8177 15873 517 2.534 8 Ranni Pazhavangadi 53.38 11974 12360 24334 456 12161 12877 25038 469 2.894 9 Ranni Perunad 82.05 11106 11024 22130 270 10990 11445 22435 273 1.385 0 Seethathode 651.94 9268 8954 18222 2 8 8484 8708 17192 2 6 -5.655 1 Thannithode 428.45 7437 7448 14885 3 5 7183 7554 14737 3 4 -0.995 2 Thiruvalla (M) 27.94 26290 28490 54780 1961 27093 29744 56837 2034 3.765 3 Thottapuzhessery 14.46 7583 8035 15618 1080 7278 8011 15289 1057 -2.115 4 Thumpamon 7.84 3598 4046 7644 975 3746 4414 8160 1041 6.755 5 Vadasseer ikara 59.57 10789 11064 21853 367 11023 11446 22469 377 2.825 6 Valli code 18.66 9324 10440 19764 1059 9645 11105 20750 1112 4.995 7 Vechoochira 51.80 11115 11186 22301 431 10773 11313 22086 426 -0.96
PATHANAMTHITTA Dist 2710 575264 611297 1186561 438 589574 644803 1234377 456 4.03
ANNEX.IPATHANAMTHITTA DISTRICT -POPULATION DETAILS
SL. Name of the LSG Area in Population 1991 Density of Population 2001 Density PopulationNo. population of Pop. Growth Rate
sq.km. Male Female Total 1991 Male Female Total 2001 1991- 2001
Source : Census 1991, 2001
admin
Text Box
ANNEX-02 >>
admin
Text Box
<< CHAPTER 12
admin
Text Box
ANNEX-02 >>
admin
Text Box
< CONTENTS >
admin
Text Box
< CONTENTS >
admin
Text Box
<< CHAPTER 12
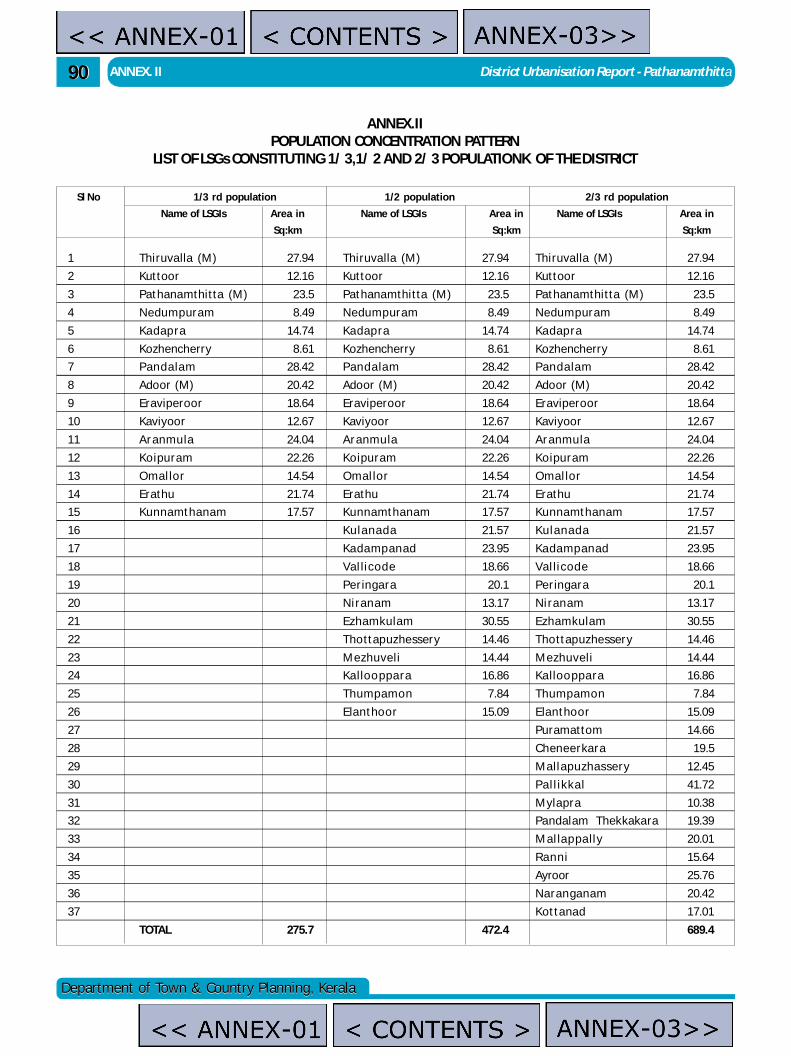
ANNEX. II District Urbanisation Report - Pathanamthitta9090
Department of Town & Country Planning, KeralaDepartment of Town & Country Planning, Kerala
ANNEX.IIPOPULATION CONCENTRATION PATTERN
LIST OF LSGs CONSTITUTING 1/ 3,1/ 2 AND 2/ 3 POPULATIONK OF THE DISTRICT
Sl No 1/3 rd population 1/2 population 2/3 rd population
Name of LSGIs Area in Name of LSGIs Area in Name of LSGIs Area in
Sq:km Sq:km Sq:km
1 Thiruvalla (M) 27.94 Thiruvalla (M) 27.94 Thiruvalla (M) 27.94
2 Kuttoor 12.16 Kuttoor 12.16 Kuttoor 12.16
3 Pathanamthitta (M) 23.5 Pathanamthitta (M) 23.5 Pathanamthitta (M) 23.5
4 Nedumpuram 8.49 Nedumpuram 8.49 Nedumpuram 8.49
5 Ka dapra 14.74 Ka dapra 14.74 Ka dapra 14.74
6 Kozhencherry 8.61 Kozhencherry 8.61 Kozhencherry 8.61
7 Panda la m 28.42 Panda la m 28.42 Panda la m 28.42
8 Adoor (M) 20.42 Adoor (M) 20.42 Adoor (M) 20.42
9 Eraviperoor 18.64 Eraviperoor 18.64 Eraviperoor 18.64
10 Kaviyoor 12.67 Kaviyoor 12.67 Kaviyoor 12.67
11 Aranmula 24.04 Aranmula 24.04 Aranmula 24.04
12 Koipuram 22.26 Koipuram 22.26 Koipuram 22.26
13 Omallor 14.54 Omallor 14.54 Omallor 14.54
14 Erathu 21.74 Erathu 21.74 Erathu 21.74
15 Kunnamthanam 17.57 Kunnamthanam 17.57 Kunnamthanam 17.57
16 Kula na da 21.57 Kula na da 21.57
17 Ka da mpanad 23.95 Ka da mpanad 23.95
18 Val lic ode 18.66 Val lic ode 18.66
19 Peringara 20.1 Peringara 20.1
20 Niranam 13.17 Niranam 13.17
21 Ezhamkulam 30.55 Ezhamkulam 30.55
22 Thottapuzhessery 14.46 Thottapuzhessery 14.46
23 Mezhuveli 14.44 Mezhuveli 14.44
24 Ka lloo ppa ra 16.86 Ka lloo ppa ra 16.86
25 Thumpamon 7.84 Thumpamon 7.84
26 Elanthoor 15.09 Elanthoor 15.09
27 Puramattom 14.66
28 Cheneerkara 19.5
29 Mallapuzhassery 12.45
30 Pa l l ikka l 41.72
31 Mylapra 10.38
32 Pandalam Thekkakara 19.39
33 M al la ppa lly 20.01
34 Ra nni 15.64
35 Ayroor 25.76
36 Naranganam 20.42
37 Kottanad 17.01
TOTAL 275.7 472.4 689.4
admin
Text Box
ANNEX-03>>
admin
Text Box
< CONTENTS >
admin
Text Box
ANNEX-03>>
admin
Text Box
< CONTENTS >
admin
Text Box
<< ANNEX-01
admin
Text Box
<< ANNEX-01
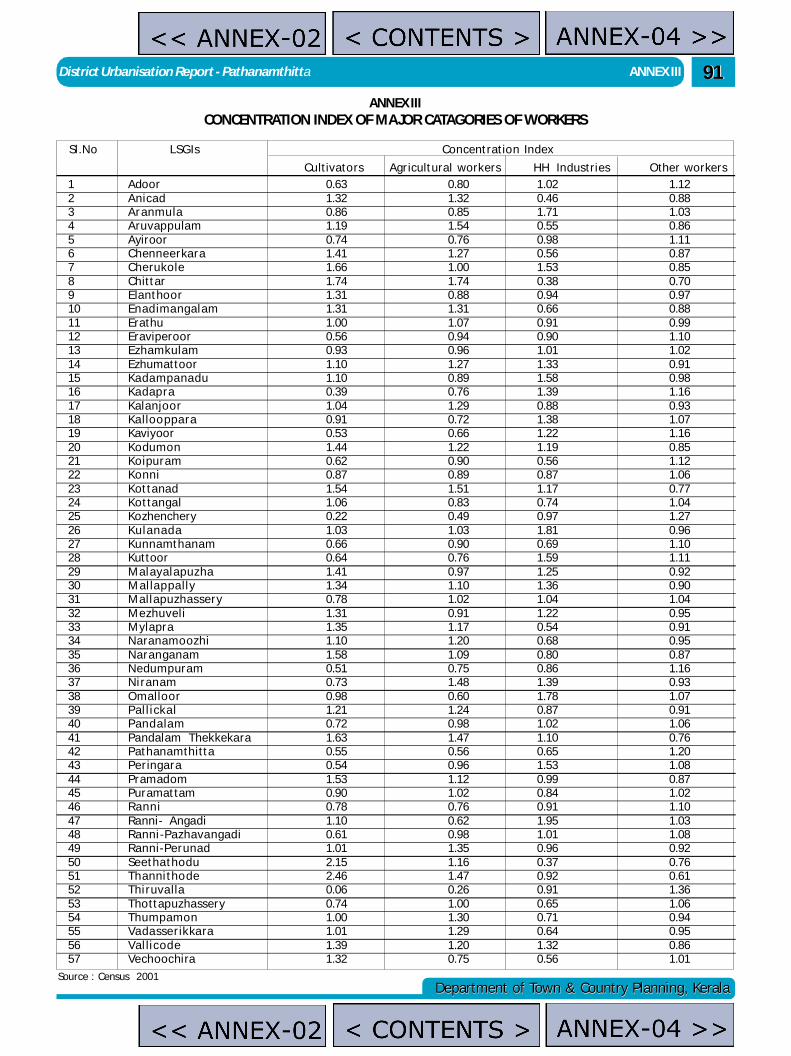
District Urbanisation Report - Pathanamthitta ANNEX III
Department of Town & Country Planning, KeralaDepartment of Town & Country Planning, Kerala
9191
ANNEX IIICONCENTRATION INDEX OF MAJOR CATAGORIES OF WORKERS
Sl.No LSGIs Concentration Index
Cultivators Agricultural workers HH Industries Other workers1 Adoor 0.63 0.80 1.02 1.122 Anicad 1.32 1.32 0.46 0.883 Aranmula 0.86 0.85 1.71 1.034 Aruvappulam 1.19 1.54 0.55 0.865 Ayiroor 0.74 0.76 0.98 1.116 Chenneerkara 1.41 1.27 0.56 0.877 Cherukole 1.66 1.00 1.53 0.858 Chittar 1.74 1.74 0.38 0.709 Elanthoor 1.31 0.88 0.94 0.9710 Enadima ngalam 1.31 1.31 0.66 0.8811 Erathu 1.00 1.07 0.91 0.9912 Eraviperoor 0.56 0.94 0.90 1.1013 Ezhamkulam 0.93 0.96 1.01 1.0214 Ezhumattoor 1.10 1.27 1.33 0.9115 Ka da mpa na du 1.10 0.89 1.58 0.9816 Ka dapra 0.39 0.76 1.39 1.1617 Kalanjoor 1.04 1.29 0.88 0.9318 Ka lloo ppa ra 0.91 0.72 1.38 1.0719 Kaviyoor 0.53 0.66 1.22 1.1620 Kodumon 1.44 1.22 1.19 0.8521 Koipuram 0.62 0.90 0.56 1.1222 Konni 0.87 0.89 0.87 1.0623 Kottanad 1.54 1.51 1.17 0.7724 Kottangal 1.06 0.83 0.74 1.0425 Kozhenchery 0.22 0.49 0.97 1.2726 Kula na da 1.03 1.03 1.81 0.9627 Kunnamthanam 0.66 0.90 0.69 1.1028 Kuttoor 0.64 0.76 1.59 1.1129 Malayalapuz ha 1.41 0.97 1.25 0.9230 M al la ppa lly 1.34 1.10 1.36 0.9031 Mallapuzhassery 0.78 1.02 1.04 1.0432 Mezhuveli 1.31 0.91 1.22 0.9533 Mylapra 1.35 1.17 0.54 0.9134 Naranamoozhi 1.10 1.20 0.68 0.9535 Naranganam 1.58 1.09 0.80 0.8736 Nedumpuram 0.51 0.75 0.86 1.1637 Niranam 0.73 1.48 1.39 0.9338 Omalloor 0.98 0.60 1.78 1.0739 Pal l icka l 1.21 1.24 0.87 0.9140 Panda la m 0.72 0.98 1.02 1.0641 Pandalam Thekkekara 1.63 1.47 1.10 0.7642 Pathanamthitta 0.55 0.56 0.65 1.2043 Peringara 0.54 0.96 1.53 1.0844 Pramadom 1.53 1.12 0.99 0.8745 Puramattam 0.90 1.02 0.84 1.0246 Ra nni 0.78 0.76 0.91 1.1047 Ranni- Angadi 1.10 0.62 1.95 1.0348 Ranni-Pazhava ngadi 0.61 0.98 1.01 1.0849 Ranni-Perunad 1.01 1.35 0.96 0.9250 Seetha thodu 2.15 1.16 0.37 0.7651 Thannitho de 2.46 1.47 0.92 0.6152 Thiruva lla 0.06 0.26 0.91 1.3653 Thottapuzhassery 0.74 1.00 0.65 1.0654 Thumpamon 1.00 1.30 0.71 0.9455 Va da sserikka ra 1.01 1.29 0.64 0.9556 Val lic ode 1.39 1.20 1.32 0.8657 Vechoochira 1.32 0.75 0.56 1.01
Source : Census 2001
admin
Text Box
< CONTENTS >
admin
Text Box
ANNEX-04 >>
admin
Text Box
<< ANNEX-02
admin
Text Box
<< ANNEX-02
admin
Text Box
ANNEX-04 >>
admin
Text Box
< CONTENTS >
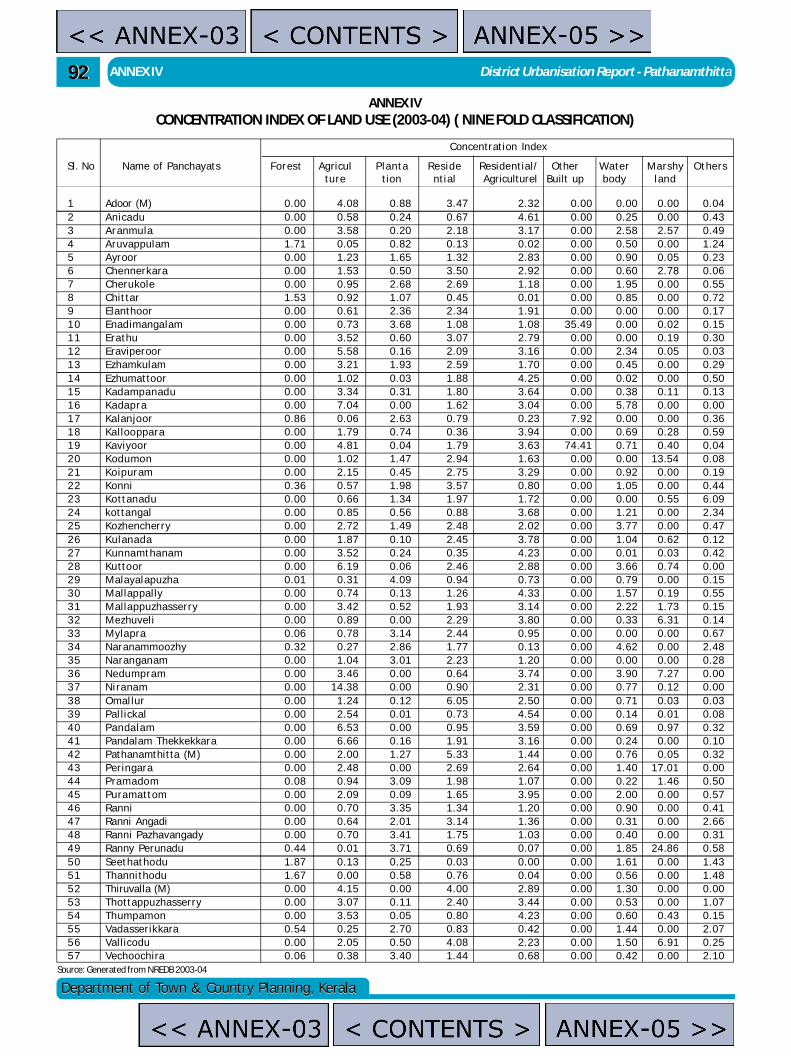
ANNEX IV District Urbanisation Report - Pathanamthitta9292
Department of Town & Country Planning, KeralaDepartment of Town & Country Planning, Kerala
ANNEX IVCONCENTRATION INDEX OF LAND USE (2003-04) ( NINE FOLD CLASSIFICATION)
Sl. No Name of Panchayats Forest Agricul Planta Reside Residential/ Other Water Marshy Othersture tion ntial Agriculturel Built up body land
Concentration Index
1 Adoor (M) 0.00 4.08 0.88 3.47 2.32 0.00 0.00 0.00 0.042 Anicadu 0.00 0.58 0.24 0.67 4.61 0.00 0.25 0.00 0.433 Aranmula 0.00 3.58 0.20 2.18 3.17 0.00 2.58 2.57 0.494 Aruvappulam 1.71 0.05 0.82 0.13 0.02 0.00 0.50 0.00 1.245 Ayroor 0.00 1.23 1.65 1.32 2.83 0.00 0.90 0.05 0.236 Chennerkara 0.00 1.53 0.50 3.50 2.92 0.00 0.60 2.78 0.067 Cherukole 0.00 0.95 2.68 2.69 1.18 0.00 1.95 0.00 0.558 Chittar 1.53 0.92 1.07 0.45 0.01 0.00 0.85 0.00 0.729 Elanthoor 0.00 0.61 2.36 2.34 1.91 0.00 0.00 0.00 0.171 0 Enadimangalam 0.00 0.73 3.68 1.08 1.08 35.49 0.00 0.02 0.151 1 Erathu 0.00 3.52 0.60 3.07 2.79 0.00 0.00 0.19 0.301 2 Eraviperoor 0.00 5.58 0.16 2.09 3.16 0.00 2.34 0.05 0.031 3 Ezhamkulam 0.00 3.21 1.93 2.59 1.70 0.00 0.45 0.00 0.291 4 Ezhumattoor 0.00 1.02 0.03 1.88 4.25 0.00 0.02 0.00 0.501 5 Kadampanadu 0.00 3.34 0.31 1.80 3.64 0.00 0.38 0.11 0.131 6 Kadapra 0.00 7.04 0.00 1.62 3.04 0.00 5.78 0.00 0.001 7 Kalanjoor 0.86 0.06 2.63 0.79 0.23 7.92 0.00 0.00 0.361 8 Kallooppara 0.00 1.79 0.74 0.36 3.94 0.00 0.69 0.28 0.591 9 Kaviyoor 0.00 4.81 0.04 1.79 3.63 74.41 0.71 0.40 0.042 0 Kodumon 0.00 1.02 1.47 2.94 1.63 0.00 0.00 13.54 0.082 1 Koipuram 0.00 2.15 0.45 2.75 3.29 0.00 0.92 0.00 0.192 2 Konni 0.36 0.57 1.98 3.57 0.80 0.00 1.05 0.00 0.442 3 Kottanadu 0.00 0.66 1.34 1.97 1.72 0.00 0.00 0.55 6.092 4 kottangal 0.00 0.85 0.56 0.88 3.68 0.00 1.21 0.00 2.342 5 Kozhencherry 0.00 2.72 1.49 2.48 2.02 0.00 3.77 0.00 0.472 6 Kulanada 0.00 1.87 0.10 2.45 3.78 0.00 1.04 0.62 0.122 7 Kunnamthanam 0.00 3.52 0.24 0.35 4.23 0.00 0.01 0.03 0.422 8 Kuttoor 0.00 6.19 0.06 2.46 2.88 0.00 3.66 0.74 0.002 9 Malayalapuzha 0.01 0.31 4.09 0.94 0.73 0.00 0.79 0.00 0.153 0 Mallappally 0.00 0.74 0.13 1.26 4.33 0.00 1.57 0.19 0.553 1 Mallappuzhasserry 0.00 3.42 0.52 1.93 3.14 0.00 2.22 1.73 0.153 2 Mezhuveli 0.00 0.89 0.00 2.29 3.80 0.00 0.33 6.31 0.143 3 Mylapra 0.06 0.78 3.14 2.44 0.95 0.00 0.00 0.00 0.673 4 Naranammoozhy 0.32 0.27 2.86 1.77 0.13 0.00 4.62 0.00 2.483 5 Naranganam 0.00 1.04 3.01 2.23 1.20 0.00 0.00 0.00 0.283 6 Nedumpram 0.00 3.46 0.00 0.64 3.74 0.00 3.90 7.27 0.003 7 Niranam 0.00 14.38 0.00 0.90 2.31 0.00 0.77 0.12 0.003 8 Omal lur 0.00 1.24 0.12 6.05 2.50 0.00 0.71 0.03 0.033 9 Pal lickal 0.00 2.54 0.01 0.73 4.54 0.00 0.14 0.01 0.084 0 Pandalam 0.00 6.53 0.00 0.95 3.59 0.00 0.69 0.97 0.324 1 Pandalam Thekkekkara 0.00 6.66 0.16 1.91 3.16 0.00 0.24 0.00 0.104 2 Pathanamthitta (M) 0.00 2.00 1.27 5.33 1.44 0.00 0.76 0.05 0.324 3 Peringara 0.00 2.48 0.00 2.69 2.64 0.00 1.40 17.01 0.004 4 Pramadom 0.08 0.94 3.09 1.98 1.07 0.00 0.22 1.46 0.504 5 Puramattom 0.00 2.09 0.09 1.65 3.95 0.00 2.00 0.00 0.574 6 Ranni 0.00 0.70 3.35 1.34 1.20 0.00 0.90 0.00 0.414 7 Ranni Angadi 0.00 0.64 2.01 3.14 1.36 0.00 0.31 0.00 2.664 8 Ranni Pazhavangady 0.00 0.70 3.41 1.75 1.03 0.00 0.40 0.00 0.314 9 Ranny Perunadu 0.44 0.01 3.71 0.69 0.07 0.00 1.85 24.86 0.585 0 Seethathodu 1.87 0.13 0.25 0.03 0.00 0.00 1.61 0.00 1.435 1 Thannithodu 1.67 0.00 0.58 0.76 0.04 0.00 0.56 0.00 1.485 2 Thiruvalla (M) 0.00 4.15 0.00 4.00 2.89 0.00 1.30 0.00 0.005 3 Thottappuzhasserry 0.00 3.07 0.11 2.40 3.44 0.00 0.53 0.00 1.075 4 Thumpamon 0.00 3.53 0.05 0.80 4.23 0.00 0.60 0.43 0.155 5 Vadasserikkara 0.54 0.25 2.70 0.83 0.42 0.00 1.44 0.00 2.075 6 Vallicodu 0.00 2.05 0.50 4.08 2.23 0.00 1.50 6.91 0.255 7 Vechoochira 0.06 0.38 3.40 1.44 0.68 0.00 0.42 0.00 2.10
Source: Generated from NREDB 2003-04
admin
Text Box
<< ANNEX-03
admin
Text Box
<< ANNEX-03
admin
Text Box
ANNEX-05 >>
admin
Text Box
< CONTENTS >
admin
Text Box
< CONTENTS >
admin
Text Box
ANNEX-05 >>
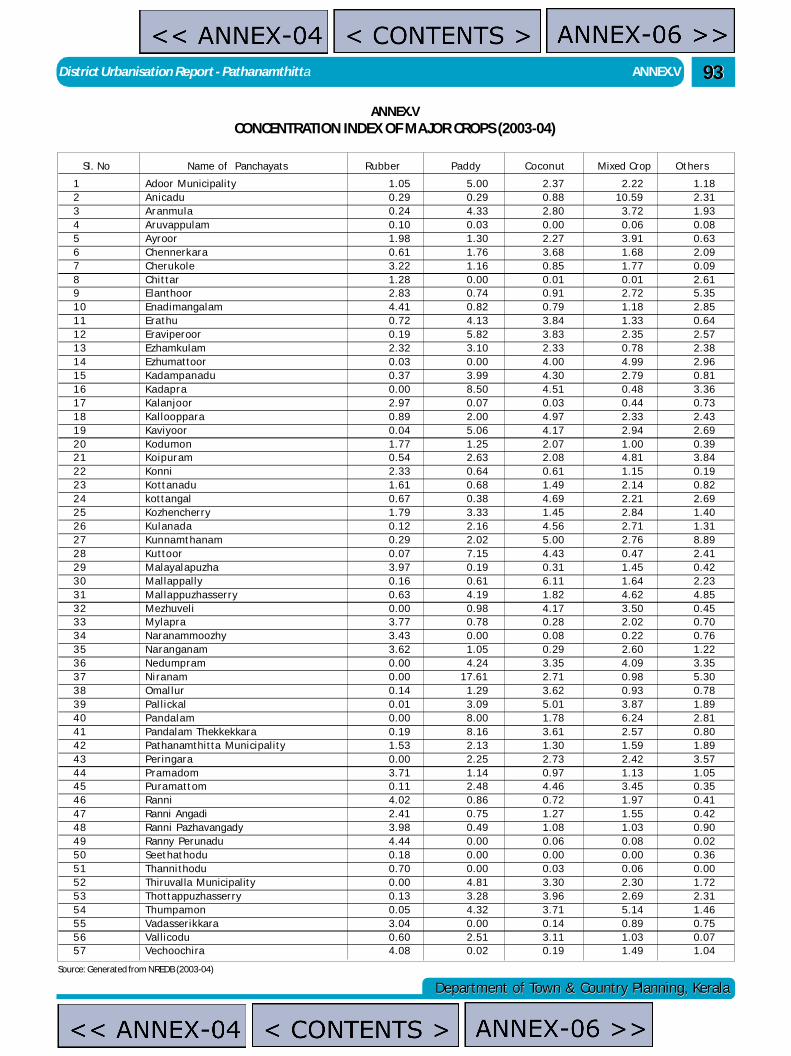
District Urbanisation Report - Pathanamthitta ANNEX.V
Department of Town & Country Planning, KeralaDepartment of Town & Country Planning, Kerala
9393
ANNEX.VCONCENTRATION INDEX OF MAJOR CROPS (2003-04)
Sl. No Name of Panchayats Rubber Paddy Coconut Mixed Crop Others
1 Adoor Municipality 1.05 5.00 2.37 2.22 1.182 Anicadu 0.29 0.29 0.88 10.59 2.313 Aranmula 0.24 4.33 2.80 3.72 1.934 Aruvappulam 0.10 0.03 0.00 0.06 0.085 Ayroor 1.98 1.30 2.27 3.91 0.636 Chennerkara 0.61 1.76 3.68 1.68 2.097 Cherukole 3.22 1.16 0.85 1.77 0.098 Chittar 1.28 0.00 0.01 0.01 2.619 Elanthoor 2.83 0.74 0.91 2.72 5.351 0 Enadimangalam 4.41 0.82 0.79 1.18 2.851 1 Erathu 0.72 4.13 3.84 1.33 0.641 2 Eraviperoor 0.19 5.82 3.83 2.35 2.571 3 Ezhamkulam 2.32 3.10 2.33 0.78 2.381 4 Ezhumattoor 0.03 0.00 4.00 4.99 2.961 5 Kadampanadu 0.37 3.99 4.30 2.79 0.811 6 Kadapra 0.00 8.50 4.51 0.48 3.361 7 Kalanjoor 2.97 0.07 0.03 0.44 0.731 8 Kallooppara 0.89 2.00 4.97 2.33 2.431 9 Kaviyoor 0.04 5.06 4.17 2.94 2.692 0 Kodumon 1.77 1.25 2.07 1.00 0.392 1 Koipuram 0.54 2.63 2.08 4.81 3.842 2 Konni 2.33 0.64 0.61 1.15 0.192 3 Kottanadu 1.61 0.68 1.49 2.14 0.822 4 kottangal 0.67 0.38 4.69 2.21 2.692 5 Kozhencherry 1.79 3.33 1.45 2.84 1.402 6 Kulanada 0.12 2.16 4.56 2.71 1.312 7 Kunnamthanam 0.29 2.02 5.00 2.76 8.892 8 Kuttoor 0.07 7.15 4.43 0.47 2.412 9 Malayalapuzha 3.97 0.19 0.31 1.45 0.423 0 Mallappally 0.16 0.61 6.11 1.64 2.233 1 Mallappuzhasserry 0.63 4.19 1.82 4.62 4.853 2 Mezhuveli 0.00 0.98 4.17 3.50 0.453 3 Mylapra 3.77 0.78 0.28 2.02 0.703 4 Naranammoozhy 3.43 0.00 0.08 0.22 0.763 5 Naranganam 3.62 1.05 0.29 2.60 1.223 6 Nedumpram 0.00 4.24 3.35 4.09 3.353 7 Niranam 0.00 17.61 2.71 0.98 5.303 8 Omal lur 0.14 1.29 3.62 0.93 0.783 9 Pal lickal 0.01 3.09 5.01 3.87 1.894 0 Pandalam 0.00 8.00 1.78 6.24 2.814 1 Pandalam Thekkekkara 0.19 8.16 3.61 2.57 0.804 2 Pathanamthitta Municipality 1.53 2.13 1.30 1.59 1.894 3 Peringara 0.00 2.25 2.73 2.42 3.574 4 Pramadom 3.71 1.14 0.97 1.13 1.054 5 Puramattom 0.11 2.48 4.46 3.45 0.354 6 Ranni 4.02 0.86 0.72 1.97 0.414 7 Ranni Angadi 2.41 0.75 1.27 1.55 0.424 8 Ranni Pazhavangady 3.98 0.49 1.08 1.03 0.904 9 Ranny Perunadu 4.44 0.00 0.06 0.08 0.025 0 Seethathodu 0.18 0.00 0.00 0.00 0.365 1 Thannithodu 0.70 0.00 0.03 0.06 0.005 2 Thiruvalla Municipality 0.00 4.81 3.30 2.30 1.725 3 Thottappuzhasserry 0.13 3.28 3.96 2.69 2.315 4 Thumpamon 0.05 4.32 3.71 5.14 1.465 5 Vadasserikkara 3.04 0.00 0.14 0.89 0.755 6 Vallicodu 0.60 2.51 3.11 1.03 0.075 7 Vechoochira 4.08 0.02 0.19 1.49 1.04
Source: Generated from NREDB (2003-04)
admin
Text Box
<< ANNEX-04
admin
Text Box
ANNEX-06 >>
admin
Text Box
<< ANNEX-04
admin
Text Box
< CONTENTS >
admin
Text Box
ANNEX-06 >>
admin
Text Box
< CONTENTS >

ANNEX. VI District Urbanisation Report - Pathanamthitta9494
Department of Town & Country Planning, KeralaDepartment of Town & Country Planning, Kerala
ANNEX. VILSG WISE AGRICULTURE ACTIVITIES
Sl.No NAME Agricultural Activity1 Cheneerkara Other crops+Paddy+Coconut+Mixed Crops2 Cherukole Plantation+Paddy+Mixed Crops3 Elanthoor Plantation+Other crops+Mixed Crops4 Kozhencherry Plantation+Other crops+Paddy+Coconut+Mixed Crops5 Mallapuzhassery Other crops+Paddy+Coconut+Mixed Crops6 Naranganam Plantation+Other crops+Paddy+Mixed Crops7 Omallor Paddy+Coconut8 Ayroor Plantation+Paddy+Coconut+Mixed Crops9 Eraviperoor Others+Paddy+Coconut+Mixed Crops10 Ezhumattoor Other crops+Coconut+Mixed Crops11 Koipuram Other crops+Paddy+Coconut+Mixed Crops12 Puramattom Paddy+Coconut+Mixed Crops13 Thottapuzhessery Other crops+Paddy+Coconut+Mixed Crops14 Aruvapulam No ne15 Konni Plantation+Mixed crops16 Malayalapuz ha Plantation+Mixed crops17 Mylapra Plantation+Mixed crops18 Pramadom Plantation+Others+Paddy+Mixed Crops19 Thannitho de No ne20 Val lic ode Paddy+Coconut+Mixed Crops21 Aranmula Other crops+Paddy+Coconut+Mixed Crops22 Kula na da Other crops+Paddy+Coconut+Mixed Crops23 Mezhuveli Coconut+Mixed Crops24 Anicad Other crops+Mixed Crops25 Ka lloo ppa ra Other crops+Paddy+Coconut+Mixed Crops26 Kaviyoor Other crops+Paddy+Coconut+Mixed Crops27 Kottanad Plantation+Coconut+Mixed Crops28 Kottangal Other crops+Coconut+Mixed Crops29 Kunnamthanam Other crops+Paddy+Coconut+Mixed Crops30 M al la ppa lly Other crops+Coconut+Mixed Crops31 Panda la m Other crops+Paddy+Coconut+Mixed Crops32 Pandalam Thekkakara Paddy+Coconut+Mixed Crops33 Thumpamon Other crops+Paddy+Coconut+Mixed Crops34 Enadima ngalam Plantation+Other crops+Mixed Crops35 Erathu Paddy+Coconut+Mixed Crops36 Ezhamkulam Plantation+Other crops+Paddy+Coconut37 Ka da mpanad Paddy+Coconut+Mixed Crops38 Kalanjoor Plantation39 Kodumon Plantation+Paddy+Coconut+Mixed Crops40 Pa l l ikka l Other crops+Paddy+Coconut+Mixed Crops41 Ka dapra Other crops+Paddy+Coconut42 Kuttoor Other crops+Paddy+Coconut43 Nedumpuram Other crops+Paddy+Coconut+Mixed Crops44 Niranam Other crops+Paddy+Coconut45 Peringara Other crops+Paddy+Coconut+Mixed Crops46 Chittar Plantation+Other crops47 Naranammoozhy Plantation48 Ra nni Plantation+Mixed crops49 Ranni Angadi Plantation+Coconut+Mixed Crops50 Ranni Pazhavangadi Plantation+Coconut+Mixed Crops51 Ranni Perunad Plantation52 Seethathode No ne53 Vadasseer ikara Plantation54 Vechoochira Plantation+Other crops+Mixed Crops55 Adoor Munci Other crops+Paddy+Coconut+Mixed Crops56 Pathanamthitta Mun. Plantation+Other crops+Paddy+Coconut+Mixed Crops57 Thiruvalla Mun. Other crops+Paddy+Coconut+Mixed Crops
admin
Text Box
< CONTENTS >
admin
Text Box
< CONTENTS >
admin
Text Box
<< ANNEX-05
admin
Text Box
ANNEX-07 >>
admin
Text Box
ANNEX-07 >>
admin
Text Box
<< ANNEX-05
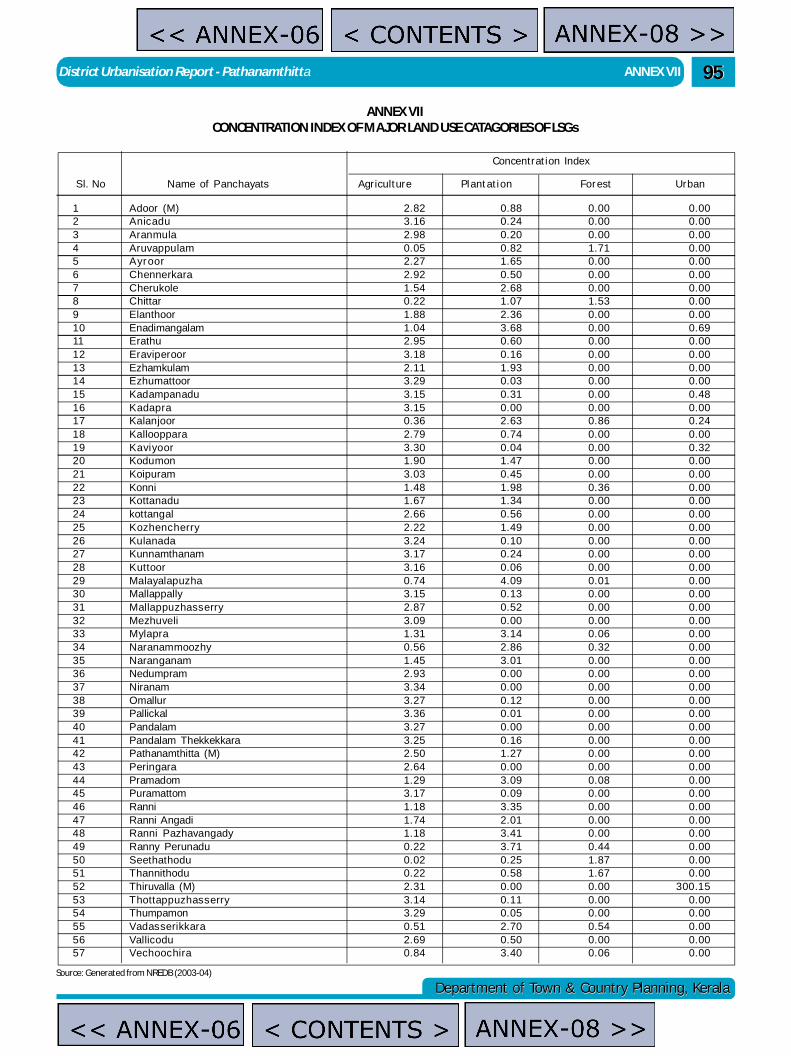
District Urbanisation Report - Pathanamthitta ANNEX VII
Department of Town & Country Planning, KeralaDepartment of Town & Country Planning, Kerala
9595
ANNEX VIICONCENTRATION INDEX OF MAJOR LAND USE CATAGORIES OF LSGs
Sl. No Name of Panchayats Agriculture Plantation Forest Urban
Concentration Index
1 Adoor (M) 2.82 0.88 0.00 0.002 Anicadu 3.16 0.24 0.00 0.003 Aranmula 2.98 0.20 0.00 0.004 Aruvappulam 0.05 0.82 1.71 0.005 Ayroor 2.27 1.65 0.00 0.006 Chennerkara 2.92 0.50 0.00 0.007 Cherukole 1.54 2.68 0.00 0.008 Chittar 0.22 1.07 1.53 0.009 Elanthoor 1.88 2.36 0.00 0.0010 Enadimangalam 1.04 3.68 0.00 0.6911 Erathu 2.95 0.60 0.00 0.0012 Eraviperoor 3.18 0.16 0.00 0.0013 Ezhamkulam 2.11 1.93 0.00 0.0014 Ezhumattoor 3.29 0.03 0.00 0.0015 Kadampanadu 3.15 0.31 0.00 0.4816 Kadapra 3.15 0.00 0.00 0.0017 Kalanjoor 0.36 2.63 0.86 0.2418 Kallooppara 2.79 0.74 0.00 0.0019 Kaviyoor 3.30 0.04 0.00 0.3220 Kodumon 1.90 1.47 0.00 0.0021 Koipuram 3.03 0.45 0.00 0.0022 Konni 1.48 1.98 0.36 0.0023 Kottanadu 1.67 1.34 0.00 0.0024 kottangal 2.66 0.56 0.00 0.0025 Kozhencherry 2.22 1.49 0.00 0.0026 Kulanada 3.24 0.10 0.00 0.0027 Kunnamthanam 3.17 0.24 0.00 0.0028 Kuttoor 3.16 0.06 0.00 0.0029 Malayalapuzha 0.74 4.09 0.01 0.0030 Mallappally 3.15 0.13 0.00 0.0031 Mallappuzhasserry 2.87 0.52 0.00 0.0032 Mezhuveli 3.09 0.00 0.00 0.0033 Mylapra 1.31 3.14 0.06 0.0034 Naranammoozhy 0.56 2.86 0.32 0.0035 Naranganam 1.45 3.01 0.00 0.0036 Nedumpram 2.93 0.00 0.00 0.0037 Niranam 3.34 0.00 0.00 0.0038 Omallur 3.27 0.12 0.00 0.0039 Pallickal 3.36 0.01 0.00 0.0040 Pandalam 3.27 0.00 0.00 0.0041 Pandalam Thekkekkara 3.25 0.16 0.00 0.0042 Pathanamthitta (M) 2.50 1.27 0.00 0.0043 Peringara 2.64 0.00 0.00 0.0044 Pramadom 1.29 3.09 0.08 0.0045 Puramattom 3.17 0.09 0.00 0.0046 Ranni 1.18 3.35 0.00 0.0047 Ranni Angadi 1.74 2.01 0.00 0.0048 Ranni Pazhavangady 1.18 3.41 0.00 0.0049 Ranny Perunadu 0.22 3.71 0.44 0.0050 Seethathodu 0.02 0.25 1.87 0.0051 Thannithodu 0.22 0.58 1.67 0.0052 Thiruvalla (M) 2.31 0.00 0.00 300.1553 Thottappuzhasserry 3.14 0.11 0.00 0.0054 Thumpamon 3.29 0.05 0.00 0.0055 Vadasserikkara 0.51 2.70 0.54 0.0056 Vallicodu 2.69 0.50 0.00 0.0057 Vechoochira 0.84 3.40 0.06 0.00
Source: Generated from NREDB (2003-04)
admin
Text Box
ANNEX-08 >>
admin
Text Box
< CONTENTS >
admin
Text Box
ANNEX-08 >>
admin
Text Box
<< ANNEX-06
admin
Text Box
< CONTENTS >
admin
Text Box
<< ANNEX-06
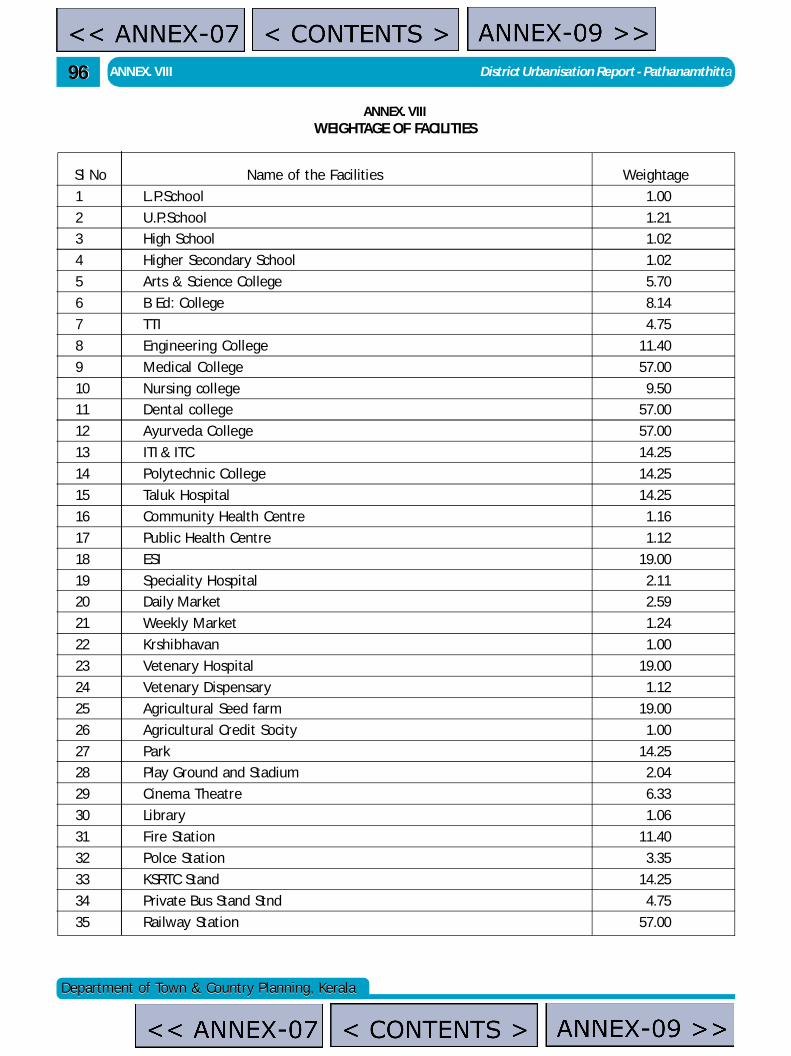
ANNEX. VIII District Urbanisation Report - Pathanamthitta9696
Department of Town & Country Planning, KeralaDepartment of Town & Country Planning, Kerala
ANNEX. VIIIWEIGHTAGE OF FACILITIES
Sl No Name of the Facilities Weightage
1 L.P.School 1.00
2 U.P.School 1.21
3 High School 1.02
4 Higher Secondary School 1.02
5 Arts & Science College 5.70
6 B Ed: College 8.14
7 TTI 4.75
8 Engineering College 11.40
9 Medical College 57.00
10 Nursing college 9.50
11 Dental college 57.00
12 Ayurveda College 57.00
13 ITI & ITC 14.25
14 Polytechnic College 14.25
15 Taluk Hospital 14.25
16 Community Health Centre 1.16
17 Public Health Centre 1.12
18 ESI 19.00
19 Speciality Hospital 2.11
20 Daily Market 2.59
21 Weekly Market 1.24
22 Krshibhavan 1.00
23 Vetenary Hospital 19.00
24 Vetenary Dispensary 1.12
25 Agricultural Seed farm 19.00
26 Agricultural Credit Socity 1.00
27 Park 14.25
28 Play Ground and Stadium 2.04
29 Cinema Theatre 6.33
30 Library 1.06
31 Fire Station 11.40
32 Polce Station 3.35
33 KSRTC Stand 14.25
34 Private Bus Stand Stnd 4.75
35 Railway Station 57.00
admin
Text Box
<< ANNEX-07
admin
Text Box
< CONTENTS >
admin
Text Box
ANNEX-09 >>
admin
Text Box
ANNEX-09 >>
admin
Text Box
<< ANNEX-07
admin
Text Box
< CONTENTS >
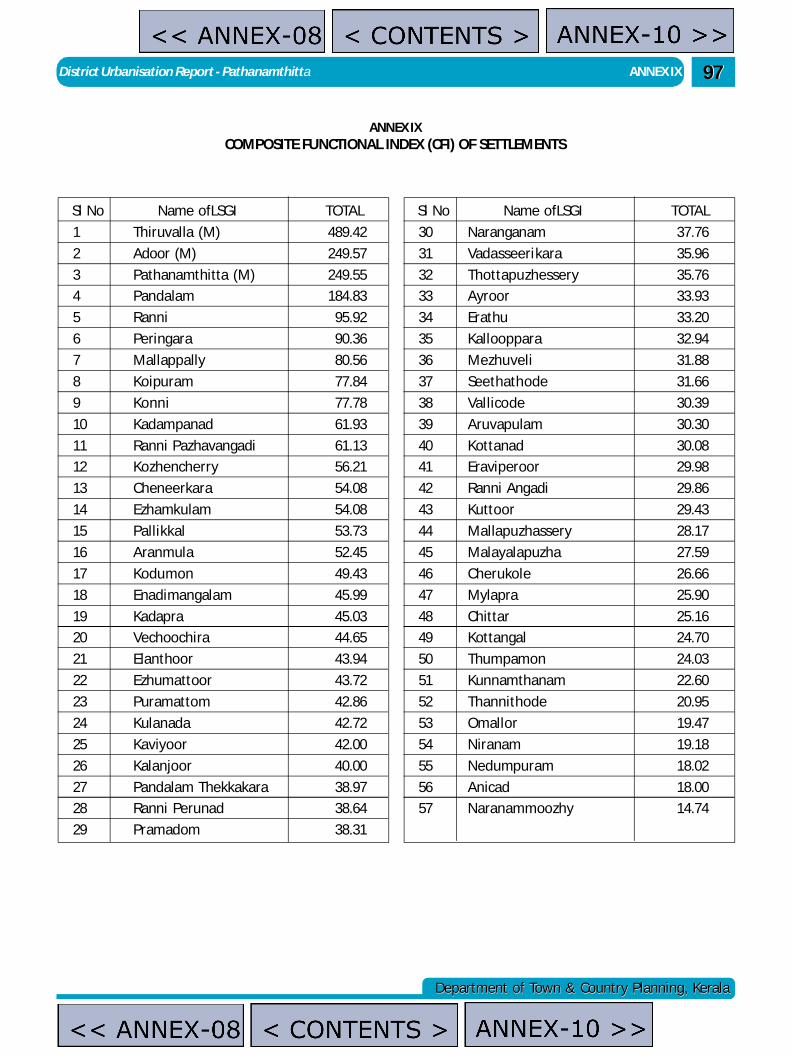
District Urbanisation Report - Pathanamthitta ANNEX IX
Department of Town & Country Planning, KeralaDepartment of Town & Country Planning, Kerala
9797
ANNEX IXCOMPOSITE FUNCTIONAL INDEX (CFI) OF SETTLEMENTS
Sl No Name ofLSGI TOTAL
1 Thiruvalla (M) 489.42
2 Adoor (M) 249.57
3 Pathanamthitta (M) 249.55
4 Pandalam 184.83
5 Ranni 95.92
6 Peringara 90.36
7 Mallappally 80.56
8 Koipuram 77.84
9 Konni 77.78
10 Kadampanad 61.93
11 Ranni Pazhavangadi 61.13
12 Kozhencherry 56.21
13 Cheneerkara 54.08
14 Ezhamkulam 54.08
15 Pallikkal 53.73
16 Aranmula 52.45
17 Kodumon 49.43
18 Enadimangalam 45.99
19 Kadapra 45.03
20 Vechoochira 44.65
21 Elanthoor 43.94
22 Ezhumattoor 43.72
23 Puramattom 42.86
24 Kulanada 42.72
25 Kaviyoor 42.00
26 Kalanjoor 40.00
27 Pandalam Thekkakara 38.97
28 Ranni Perunad 38.64
29 Pramadom 38.31
Sl No Name ofLSGI TOTAL
30 Naranganam 37.76
31 Vadasseerikara 35.96
32 Thottapuzhessery 35.76
33 Ayroor 33.93
34 Erathu 33.20
35 Kallooppara 32.94
36 Mezhuveli 31.88
37 Seethathode 31.66
38 Vallicode 30.39
39 Aruvapulam 30.30
40 Kottanad 30.08
41 Eraviperoor 29.98
42 Ranni Angadi 29.86
43 Kuttoor 29.43
44 Mallapuzhassery 28.17
45 Malayalapuzha 27.59
46 Cherukole 26.66
47 Mylapra 25.90
48 Chittar 25.16
49 Kottangal 24.70
50 Thumpamon 24.03
51 Kunnamthanam 22.60
52 Thannithode 20.95
53 Omallor 19.47
54 Niranam 19.18
55 Nedumpuram 18.02
56 Anicad 18.00
57 Naranammoozhy 14.74
admin
Text Box
<< ANNEX-08
admin
Text Box
< CONTENTS >
admin
Text Box
ANNEX-10 >>
admin
Text Box
ANNEX-10 >>
admin
Text Box
<< ANNEX-08
admin
Text Box
< CONTENTS >
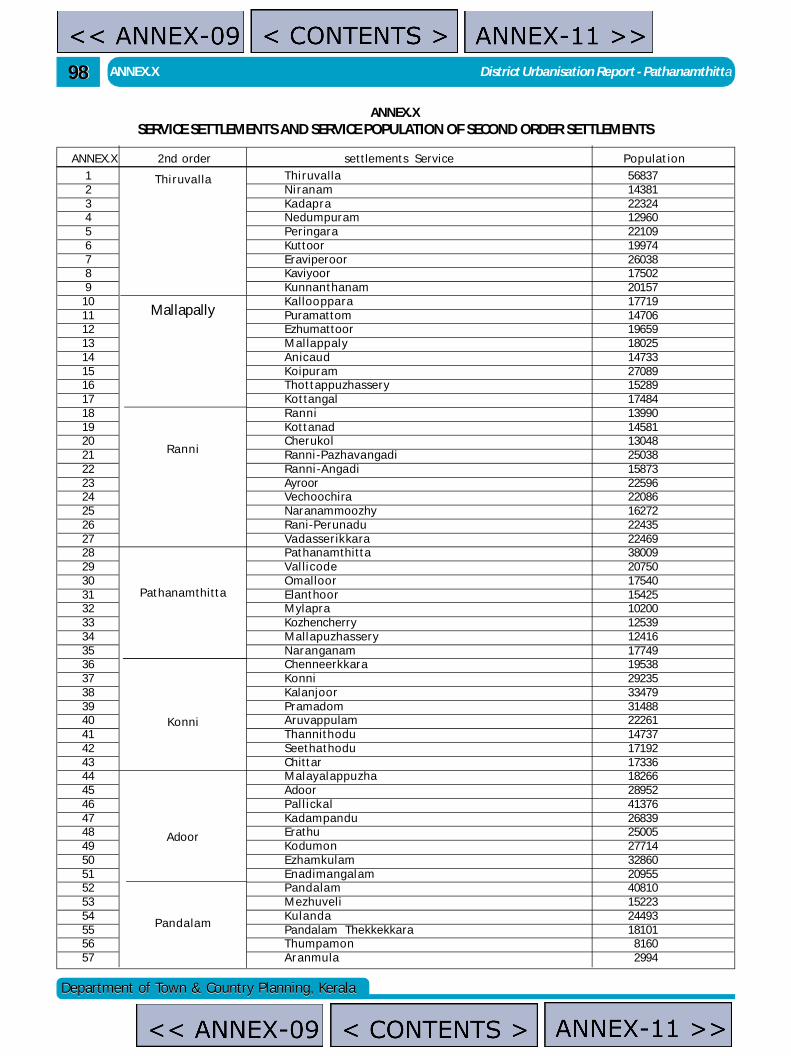
ANNEX.X District Urbanisation Report - Pathanamthitta9898
Department of Town & Country Planning, KeralaDepartment of Town & Country Planning, Kerala
ANNEX.XSERVICE SETTLEMENTS AND SERVICE POPULATION OF SECOND ORDER SETTLEMENTS
ANNEX.X 2nd order settlements Service Populat ion123456789
101112131415161718192021222324252627282930313233343536373839404142434445464748495051525354555657
Thiruva lla 56837Niranam 14381Ka dapra 22324Nedumpuram 12960Peringara 22109Kuttoor 19974Eraviperoor 26038Kaviyoor 17502Kunnanthanam 20157Ka lloo ppa ra 17719Puramattom 14706Ezhumattoor 19659M al la ppaly 18025Anic aud 14733Koipuram 27089Thottappuzhassery 15289Kottangal 17484Ra nni 13990Kottanad 14581Cherukol 13048Ranni-Pazhava ngadi 25038Ra nni-Anga di 15873Ayroor 22596Vechoochira 22086Naranammoozhy 16272Rani-Perunadu 22435Va da sserikka ra 22469Pathanamthitta 38009Val lic ode 20750Omalloor 17540Elanthoor 15425Mylapra 10200Kozhencherry 12539Mallapuzhassery 12416Naranganam 17749Chenneerkkara 19538Konni 29235Kalanjoor 33479Pramadom 31488Aruvappulam 22261Tha nnithodu 14737Seetha thodu 17192Chittar 17336Malayalappuzha 18266Adoor 28952Pal l icka l 41376Ka dam pandu 26839Erathu 25005Kodumon 27714Ezhamkulam 32860Enadima ngalam 20955Panda la m 40810Mezhuveli 15223Kula nda 24493Pandalam Thekkekkara 18101Thumpamon 8160Aranmula 2994
Thiruva lla
Mallapally
Ra nni
Pathanamthitta
Konni
Adoor
Panda la m
admin
Text Box
< CONTENTS >
admin
Text Box
<< ANNEX-09
admin
Text Box
ANNEX-11 >>
admin
Text Box
ANNEX-11 >>
admin
Text Box
<< ANNEX-09
admin
Text Box
< CONTENTS >
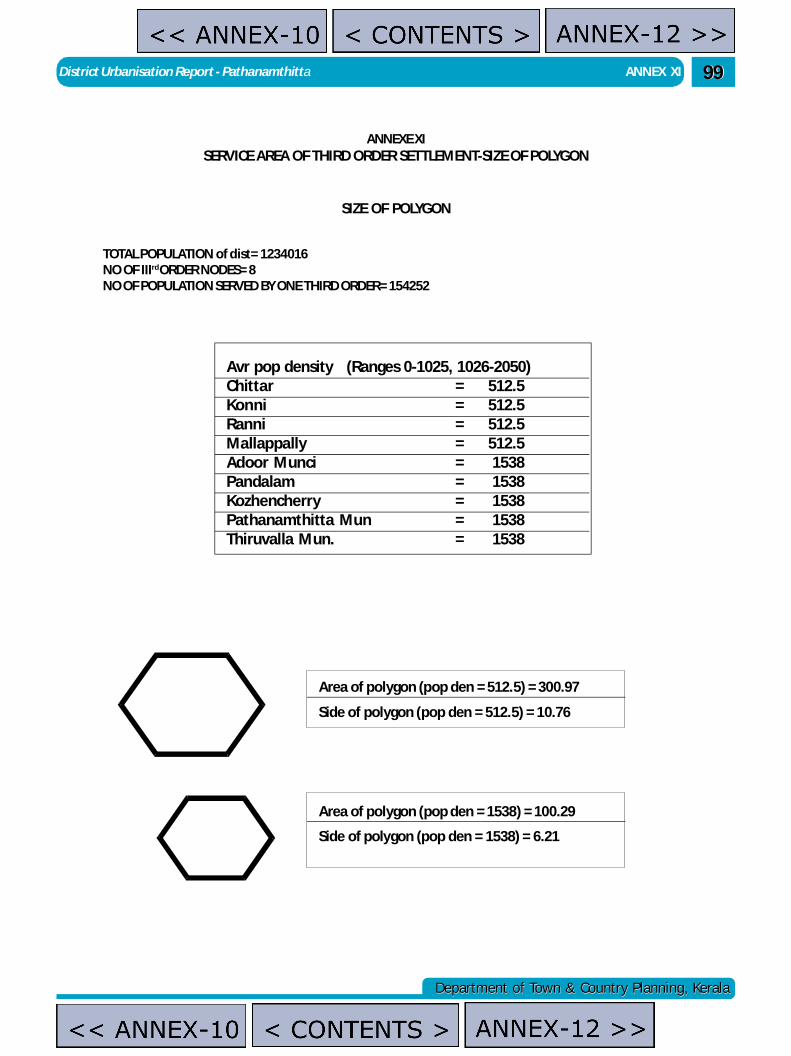
District Urbanisation Report - Pathanamthitta ANNEX XI
Department of Town & Country Planning, KeralaDepartment of Town & Country Planning, Kerala
9999
ANNEXE XISERVICE AREA OF THIRD ORDER SETTLEMENT-SIZE OF POLYGON
SIZE OF POLYGON
TOTAL POPULATION of dist= 1234016NO OF IIIrd ORDER NODES= 8NO OF POPULATION SERVED BY ONE THIRD ORDER= 154252
Avr pop density (Ranges 0-1025, 1026-2050)Chittar = 512.5Konni = 512.5Ranni = 512.5Mallappally = 512.5Adoor Munci = 1538Pandalam = 1538Kozhencherry = 1538Pathanamthitta Mun = 1538Thiruvalla Mun. = 1538
Area of polygon (pop den = 512.5) = 300.97
Side of polygon (pop den = 512.5) = 10.76
Area of polygon (pop den = 1538) = 100.29
Side of polygon (pop den = 1538) = 6.21
admin
Text Box
ANNEX-12 >>
admin
Text Box
<< ANNEX-10
admin
Text Box
<< ANNEX-10
admin
Text Box
< CONTENTS >
admin
Text Box
< CONTENTS >
admin
Text Box
ANNEX-12 >>
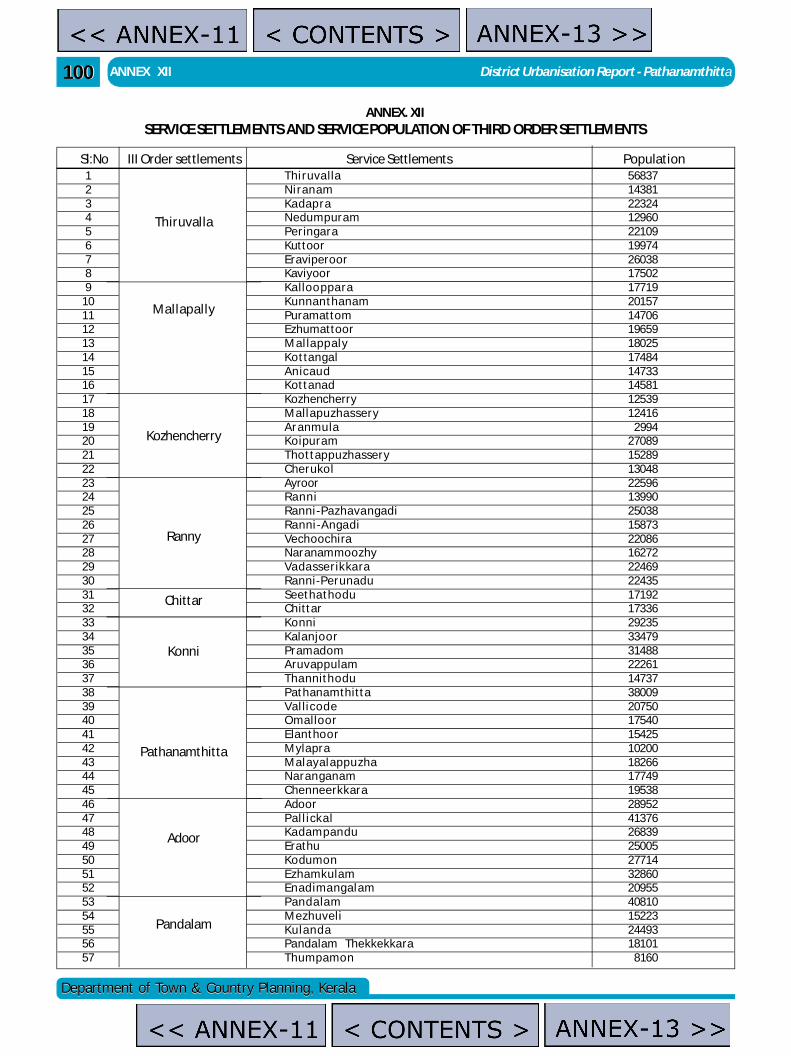
ANNEX XII District Urbanisation Report - Pathanamthitta100100
Department of Town & Country Planning, KeralaDepartment of Town & Country Planning, Kerala
ANNEX. XIISERVICE SETTLEMENTS AND SERVICE POPULATION OF THIRD ORDER SETTLEMENTS
Sl:No III Order settlements Service Settlements Population123456789
101112131415161718192021222324252627282930313233343536373839404142434445464748495051525354555657
Thiruva lla 56837Niranam 14381Ka dapra 22324Nedumpuram 12960Peringara 22109Kuttoor 19974Eraviperoor 26038Kaviyoor 17502Ka lloo ppa ra 17719Kunnanthanam 20157Puramattom 14706Ezhumattoor 19659M al la ppaly 18025Kottangal 17484Anic aud 14733Kottanad 14581Kozhencherry 12539Mallapuzhassery 12416Aranmula 2994Koipuram 27089Thottappuzhassery 15289Cherukol 13048Ayroor 22596Ra nni 13990Ranni-Pazhava ngadi 25038Ra nni-Anga di 15873Vechoochira 22086Naranammoozhy 16272Va da sserikka ra 22469Ranni-Perunadu 22435Seetha thodu 17192Chittar 17336Konni 29235Kalanjoor 33479Pramadom 31488Aruvappulam 22261Tha nnithodu 14737Pathanamthitta 38009Val lic ode 20750Omalloor 17540Elanthoor 15425Mylapra 10200Malayalappuzha 18266Naranganam 17749Chenneerkkara 19538Adoor 28952Pal l icka l 41376Ka dam pandu 26839Erathu 25005Kodumon 27714Ezhamkulam 32860Enadima ngalam 20955Panda la m 40810Mezhuveli 15223Kula nda 24493Pandalam Thekkekkara 18101Thumpamon 8160
Thiruvalla
Mallapally
Kozhencherry
Ranny
Chittar
Konni
Pathanamthitta
Adoor
Pandalam
admin
Text Box
ANNEX-13 >>
admin
Text Box
< CONTENTS >
admin
Text Box
< CONTENTS >
admin
Text Box
<< ANNEX-11
admin
Text Box
ANNEX-13 >>
admin
Text Box
<< ANNEX-11
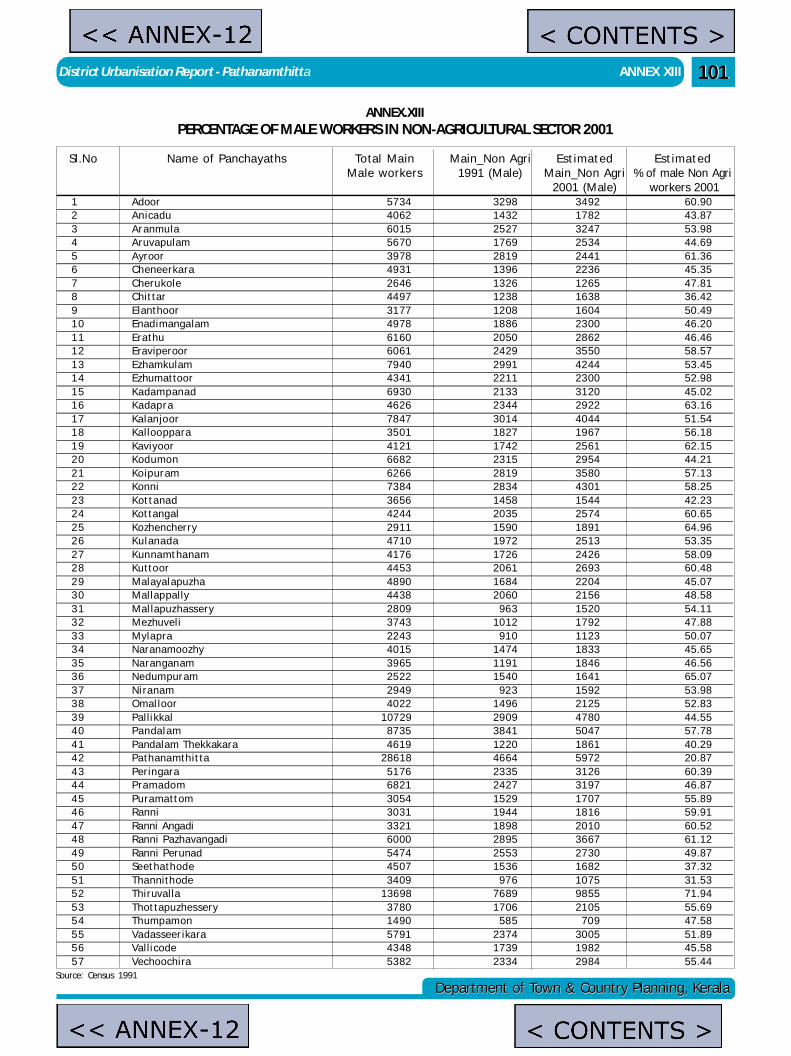
District Urbanisation Report - Pathanamthitta ANNEX XIII
Department of Town & Country Planning, KeralaDepartment of Town & Country Planning, Kerala
101101
ANNEX.XIIIPERCENTAGE OF MALE WORKERS IN NON-AGRICULTURAL SECTOR 2001
Sl.No Name of Panchayaths Total Main Main_Non Agri Est imated Est imatedMale workers 1991 (Male) Main_Non Agri % of male Non Agri
2001 (Male) workers 20011 Adoor 5734 3298 3492 60.902 Anicadu 4062 1432 1782 43.873 Aranmula 6015 2527 3247 53.984 Aruvapulam 5670 1769 2534 44.695 Ayroor 3978 2819 2441 61.366 Cheneerkara 4931 1396 2236 45.357 Cherukole 2646 1326 1265 47.818 Chittar 4497 1238 1638 36.429 Elanthoor 3177 1208 1604 50.491 0 Enadimangalam 4978 1886 2300 46.201 1 Erathu 6160 2050 2862 46.461 2 Eraviperoor 6061 2429 3550 58.571 3 Ezhamkulam 7940 2991 4244 53.451 4 Ezhumattoor 4341 2211 2300 52.981 5 Kadampanad 6930 2133 3120 45.021 6 Kadapra 4626 2344 2922 63.161 7 Kalanjoor 7847 3014 4044 51.541 8 Kallooppara 3501 1827 1967 56.181 9 Kaviyoor 4121 1742 2561 62.152 0 Kodumon 6682 2315 2954 44.212 1 Koipuram 6266 2819 3580 57.132 2 Konni 7384 2834 4301 58.252 3 Kottanad 3656 1458 1544 42.232 4 Kottangal 4244 2035 2574 60.652 5 Kozhencherry 2911 1590 1891 64.962 6 Kulanada 4710 1972 2513 53.352 7 Kunnamthanam 4176 1726 2426 58.092 8 Kuttoor 4453 2061 2693 60.482 9 Malayalapuzha 4890 1684 2204 45.073 0 Mallappally 4438 2060 2156 48.583 1 Mal lapuzhassery 2809 963 1520 54.113 2 Mezhuveli 3743 1012 1792 47.883 3 Mylapra 2243 910 1123 50.073 4 Naranamoozhy 4015 1474 1833 45.653 5 Naranganam 3965 1191 1846 46.563 6 Nedumpuram 2522 1540 1641 65.073 7 Niranam 2949 923 1592 53.983 8 Omal loor 4022 1496 2125 52.833 9 Pallikkal 10729 2909 4780 44.554 0 Pandalam 8735 3841 5047 57.784 1 Pandalam Thekkakara 4619 1220 1861 40.294 2 Pathanamthitta 28618 4664 5972 20.874 3 Peringara 5176 2335 3126 60.394 4 Pramadom 6821 2427 3197 46.874 5 Puramattom 3054 1529 1707 55.894 6 Ranni 3031 1944 1816 59.914 7 Ranni Angadi 3321 1898 2010 60.524 8 Ranni Pazhavangadi 6000 2895 3667 61.124 9 Ranni Perunad 5474 2553 2730 49.875 0 Seethathode 4507 1536 1682 37.325 1 Thannithode 3409 976 1075 31.535 2 Thiruvalla 13698 7689 9855 71.945 3 Thottapuzhessery 3780 1706 2105 55.695 4 Thumpamon 1490 585 709 47.585 5 Vadasseer ikara 5791 2374 3005 51.895 6 Valli code 4348 1739 1982 45.585 7 Vechoochira 5382 2334 2984 55.44
Source: Census 1991
admin
Text Box
< CONTENTS >
admin
Text Box
<< ANNEX-12
admin
Text Box
< CONTENTS >
admin
Text Box
<< ANNEX-12