MALAPPURAM - Department of Town & Country Planning
114
DISTRICT URBANISATION REPORT MALAPPURAM DEPARTMENT OF TOWN AND COUNTRY PLANNING - GOVERNMENT OF KERALA January 2011
-
Upload
khangminh22 -
Category
Documents
-
view
0 -
download
0
Transcript of MALAPPURAM - Department of Town & Country Planning
DISTRICT URBANISATION REPORT
MALAPPURAM
DEPARTMENT OF TOWN AND COUNTRY PLANNING - GOVERNMENT OF KERALA
January 2011
admin
Text Box
< CONTENTS >
admin
Text Box
PREFACE >>
PREFACE
Planning is a prerequisite for effective development. Development becomes comprehensive whengrowth centres are identified considering physical, social and economic variables of an area in an integratedmanner. This indicates that planning of villages and towns are to be complementary. Second AdministrativeReforms Commission (ARC) while interpreting the article 243 ZD of the Constitution of India states asfollows. “This, in other words, means that the development needs of the rural and urban areas should bedealt with in an integrated manner and, therefore, the district plan, which is a plan for a large areaconsisting of villages and towns, should take into account such factors as ‘spatial planning’, sharing of‘physical and natural resources’, integrated development of infrastructure’ and ‘environmentalconservation’. All these are important, because the relationship between villages and towns iscomplementary. One needs the other. Many functions that the towns perform as seats of industry, tradeand business and as providers of various services, including higher education, specialized health careservices, communication etc have an impact on the development and welfare of rural people. Similarly,the orderly growth of the urban centre is dependent on the kind of organic linkage it establishes with itsrural hinterland”. Therefore a move of harmonizing urban and rural centres of an area can be said as amove of planned urbanisation of the area.
In this context, it is relevant to mention the 74th Amendment Act of the Constitution of India, whichmandated the District Planning Committee to prepare a draft development plan for the district. As perArticle 243 ZD of the Constitution, the District Planning Committee (DPC) shall consolidate Panchayat/Municipality Plans in the district and prepare draft development plan for the district as a whole. TheConstitution also specifies that while preparing draft development plan due regard shall be given tomatters of common interest between panchayats and municipalities including spatial planning, sharing ofwater and other physical and natural resources, the integrated development of infrastructure andenvironmental conservation. In this respect, the district of Kollam has conducted an important experimentof preparation of an Integrated District Development Plan (IDDP) for the district. Through preparation ofIDDP, the District Planning Committee of Kollam has become the first ever DPC in the country to own aDistrict Development Plan as envisaged by the Constitution. This path-breaking venture has become amodel in participatory district planning in a spatial platform. The Plan was released during the internationalconference on district planning held at Kollam in August 2009. The Plan is now sanctioned by Governmentof Kerala. As per G.O (Rt) 354/04/LSGD dated 01.02.07, the State Government have extended the project tothe remaining districts in the state and the districts of Alappuzha, Thrissur, Idukki, Palakkad and Wayanadwere selected for extending the project in the first phase. However, even in these districts, preparation ofIDDP is yet to be completed.
Preparation of such a plan will surely need decisions and commitment at various levels due to themultiplicity of agencies involved and the vast spectrum of aspects to be addressed. However, delay inplanning shall not affect development. Hence a step by step approach may be adopted in planning.Therefore, the Department of Town and Country Planning evolved a sequence of plan preparation atdistrict level, involving District Urbanisation Report (DUR), District Spatial Plan (DSP) and Integrated DistrictDevelopment Plan (IDDP).
The District Urbanisation Report defines the future spatial structure of a district, which is formulatedby integrating hierarchy and activity pattern of urban and rural settlements and the connectivity betweenthem. The spatial structure of a district will act as a frame for the orderly development of urban centresand their rural hinterland subsequently leading to a planned urbanisation.
admin
Text Box
< CONTENTS >
admin
Text Box
<< BACK
admin
Text Box
NEXT >>
The District Spatial Plan is a synergistic form of the District Urbanisation Report, since as a plan it iscongruent to a single unified physical design for the district through setting development goals and objectivesand formulating the development concept of the district. DSP will frame the general policies and strategies andstreamline directions of development of the district. The Development Directives of DSP is carved in the spatialplatform through the synthesis of findings of the analysis over the spatial structure based on secondary sourcesof data. But it lacks the resource studies as co-ordination of various agencies remain as an uphill task.
The Integrated District Development Plan can be termed as the highest echelon of this series and manifestall features of the draft district development plan as envisaged in Article 243ZD of the Constitution of India.Democratisation of planning and translation of sectoral policies into spatial plans are the paramount qualities ofIDDP as against DSP. IDDP comprises of two components; a Perspective Plan for 15-20 years and an Execution Planfor 5 years.
As said earlier, IDDP for Kollam District is already prepared under the leadership of the District PlanningCommittee, Kollam with the involvement of all the Local Governments in the district and Special TechnicalAdvisory Committee for IDDP. The Department of Town and Country Planning gave technical support for Planpreparation besides coordinating the entire process in the role of nodal agency.
Now, the Department has prepared District Spatial Plans for the districts of Thrissur and Palakkad andDistrict Urbanisation Reports for the districts of Thiruvananthapuram, Pathanamthitta, Alappuzha, Kottayam,Ernakulam, Idukki, Malappuram, Kozhikkode, Wayanad, Kannur and Kasaragod. The District Urbanisation Reportfor Malappuram is one among the series.
I take this opportunity to appreciate the officials of the Malappuram District Office of the Department,especially by Sri.V.K.Mohandas, Town Planner and Smt.Isha. P.A, Deputy Town Planner in the preparation of thisdocument. The State Project Cell for LDP-IDDP-SPP played anchor role in this regard, right from conceptualisationto shaping the end product. The toolkits and customised computer applications developed by the State ProjectCell has enabled the district offices to accomplish the task in a time bound manner. I also appreciate the consistentefforts of Sri. Jacob Easow, Senior Town Planner, Smt.Ushakumari.P.R, Town Planner, Sri. Baiju.K, Deputy TownPlanner and other officials of the State Project Cell. I also appreciate the officials of the circle headed bySri.G.Mohanan, Senior Town Planner for their efforts in vetting and finalising the District Urbanisation Report forMalappuram.
This is a first step on the ladder leading to the draft development plan for the district as laid down in theConstitution. It is hoped that the district of Malappuram will further extend the District Urbanisation Report intoIntegrated District Development Plan for the district.
Certainly, the District Urbanisation Report for Malappuram will provide a framework for development aswell as future planning of the district.
Thiruvananthapuram Eapen Varughese
11- 02-2011 Chief Town Planner
admin
Text Box
<< BACK
admin
Text Box
< CONTENTS >
admin
Text Box
NEXT >>
ACKNOWLEDGEMENTS
The District Urbanisation Report, Malappuram district is prepared as part of the State Perspective Plan forKerala. In this connection, the level of urbanisation in the district, the functional character and hierarchy ofsettlements etc are studied in detail and the probable future urban profile is derived. The future spatial strutureof the district is formulated through integrating hierarchy and activity pattern of settlements in the district andthe connectivity between them. In other words, the function and hierarchy of various settlements and therequired connectivity between settlements within the district is determined through deriving the spatial struture.It is hoped that the District Urbanisation Report will pave way for the planned development of the district byrendering the broad frame work for Planning and Development. The methodology for the study has been evolvedthrough a number of discussions and workshops and the same methodology is adopted for all districts in thestate for compatibility of results for comparison.
We have heavily relied on statistical data from various development departments. Their readiness toshare the data is gratefully acknowledged. Sri. Eapen Varughese, the Chief Town Planner and Sri. G. Mohanan,Senior Town Planner gave necessary directions. The guidance and inspiration given by Sri. Jacob Easow, SeniorTown Planner, Smt. Ushakumari P.R, Town Planner and Sri. Baiju.K, Deputy Town Planner of the State Project Cellis gratefully acknowledged without which this work would not have been possible. The other staff of the StateProject Cell also have been highly helpful in giving various inputs for the study.
Sri. K.M. Gopakumar and Sri. V.K. Mohandas contributed to the work as District Town Planners during thecurrency of this project. The assistance offered by the statistical wing and Smt. Jamseera. C.P, Planning Assistantis remarkable. The efforts put in by Sri. Saheer Poovanthodi, Town Planning Surveyor in the preparation of thereport needs special mention. All the staff of the District Town & Country Planning Office need to be speciallyacknowledged for their keen participation in various stages without which this work would not have beencompleted in the present form and time frame.
Malappuram Isha. P.A.10-2-2011 Deputy Town Planner in charge of Town Planner
Town Planning Office, Malappuram,
admin
Text Box
<< BACK
admin
Text Box
< CONTENTS >
admin
Text Box
NEXT >>
admin
Text Box
< CONTENTS >
District Urbanisation Report - Malappuram CONTENTS
Department of Town & Country Planning, KeralaDepartment of Town & Country Planning, Kerala
iviv
CONTENTS
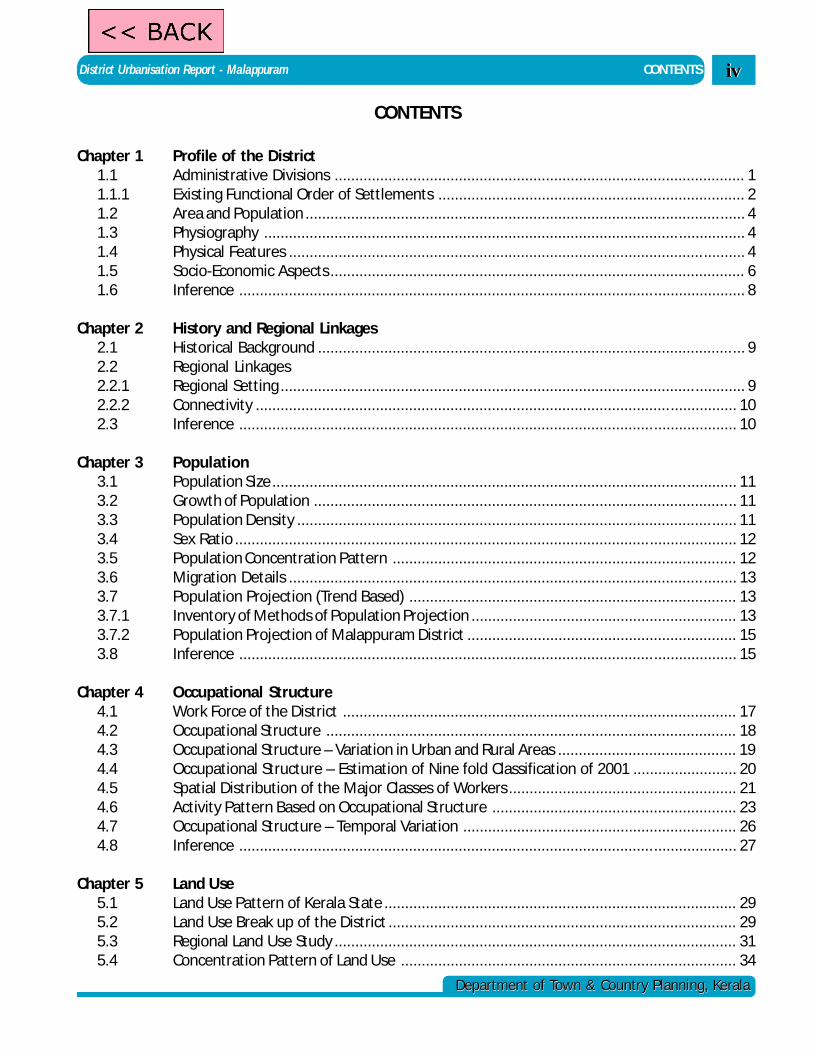
Chapter 1 Profile of the District1.1 Administrative Divisions ................................................................................................... 11.1.1 Existing Functional Order of Settlements .......................................................................... 21.2 Area and Population .......................................................................................................... 41.3 Physiography .................................................................................................................... 41.4 Physical Features .............................................................................................................. 41.5 Socio-Economic Aspects .................................................................................................... 61.6 Inference .......................................................................................................................... 8
Chapter 2 History and Regional Linkages2.1 Historical Background ....................................................................................................... 92.2 Regional Linkages2.2.1 Regional Setting ................................................................................................................ 92.2.2 Connectivity .................................................................................................................... 102.3 Inference ........................................................................................................................ 10
Chapter 3 Population3.1 Population Size ................................................................................................................ 113.2 Growth of Population ...................................................................................................... 113.3 Population Density .......................................................................................................... 113.4 Sex Ratio ......................................................................................................................... 123.5 Population Concentration Pattern ................................................................................... 123.6 Migration Details ............................................................................................................ 133.7 Population Projection (Trend Based) ............................................................................... 133.7.1 Inventory of Methods of Population Projection ................................................................ 133.7.2 Population Projection of Malappuram District ................................................................. 153.8 Inference ........................................................................................................................ 15
Chapter 4 Occupational Structure4.1 Work Force of the District ............................................................................................... 174.2 Occupational Structure ................................................................................................... 184.3 Occupational Structure – Variation in Urban and Rural Areas ........................................... 194.4 Occupational Structure – Estimation of Nine fold Classification of 2001 ......................... 204.5 Spatial Distribution of the Major Classes of Workers ....................................................... 214.6 Activity Pattern Based on Occupational Structure ........................................................... 234.7 Occupational Structure – Temporal Variation .................................................................. 264.8 Inference ........................................................................................................................ 27
Chapter 5 Land Use5.1 Land Use Pattern of Kerala State ..................................................................................... 295.2 Land Use Break up of the District .................................................................................... 295.3 Regional Land Use Study ................................................................................................. 315.4 Concentration Pattern of Land Use ................................................................................. 34
admin
Text Box
<< BACK
CONTENTS District Urbanisation Report -Malappuam
Department of Town & Country Planning, KeralaDepartment of Town & Country Planning, Kerala
vv
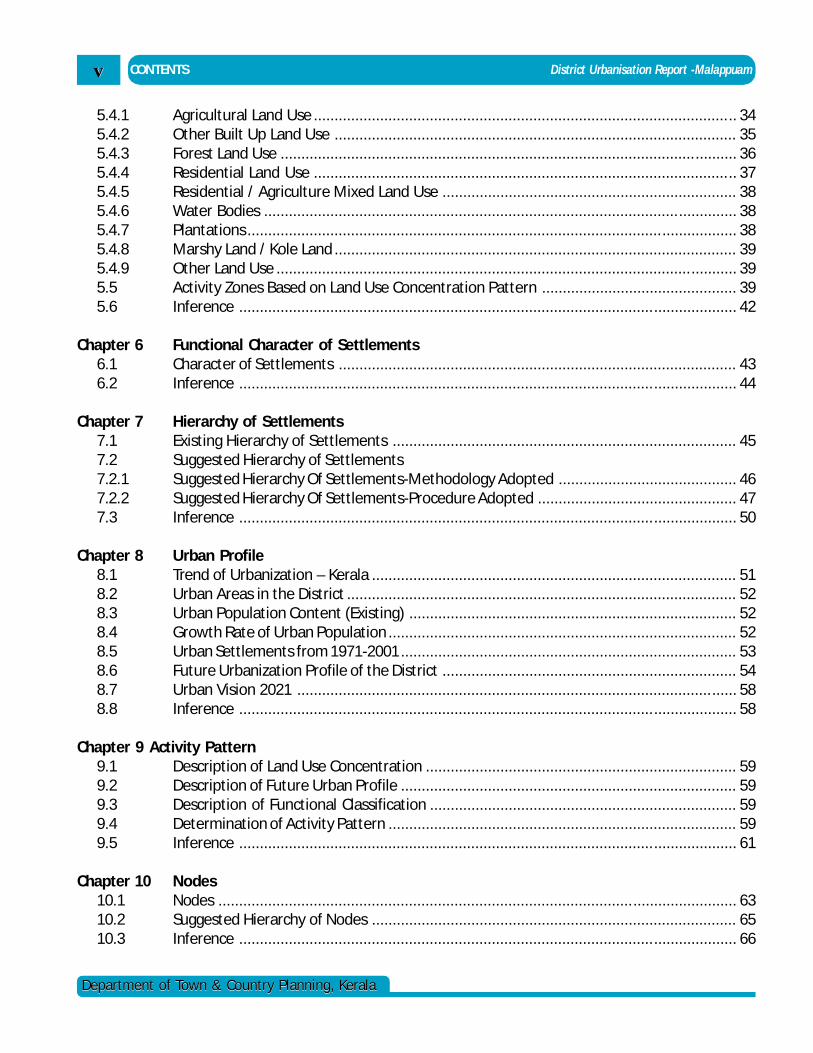
5.4.1 Agricultural Land Use ...................................................................................................... 345.4.2 Other Built Up Land Use ................................................................................................. 355.4.3 Forest Land Use .............................................................................................................. 365.4.4 Residential Land Use ...................................................................................................... 375.4.5 Residential / Agriculture Mixed Land Use ....................................................................... 385.4.6 Water Bodies .................................................................................................................. 385.4.7 Plantations ...................................................................................................................... 385.4.8 Marshy Land / Kole Land ................................................................................................. 395.4.9 Other Land Use ............................................................................................................... 395.5 Activity Zones Based on Land Use Concentration Pattern ............................................... 395.6 Inference ........................................................................................................................ 42
Chapter 6 Functional Character of Settlements6.1 Character of Settlements ................................................................................................ 436.2 Inference ........................................................................................................................ 44
Chapter 7 Hierarchy of Settlements7.1 Existing Hierarchy of Settlements ................................................................................... 457.2 Suggested Hierarchy of Settlements7.2.1 Suggested Hierarchy Of Settlements-Methodology Adopted ........................................... 467.2.2 Suggested Hierarchy Of Settlements-Procedure Adopted ................................................ 477.3 Inference ........................................................................................................................ 50
Chapter 8 Urban Profile8.1 Trend of Urbanization – Kerala ........................................................................................ 518.2 Urban Areas in the District .............................................................................................. 528.3 Urban Population Content (Existing) ............................................................................... 528.4 Growth Rate of Urban Population .................................................................................... 528.5 Urban Settlements from 1971-2001................................................................................. 538.6 Future Urbanization Profile of the District ....................................................................... 548.7 Urban Vision 2021 .......................................................................................................... 588.8 Inference ........................................................................................................................ 58
Chapter 9 Activity Pattern9.1 Description of Land Use Concentration ........................................................................... 599.2 Description of Future Urban Profile ................................................................................. 599.3 Description of Functional Classification .......................................................................... 599.4 Determination of Activity Pattern .................................................................................... 599.5 Inference ........................................................................................................................ 61
Chapter 10 Nodes10.1 Nodes ............................................................................................................................. 6310.2 Suggested Hierarchy of Nodes ........................................................................................ 6510.3 Inference ........................................................................................................................ 66
District Urbanisation Report - Malappuram CONTENTS
Department of Town & Country Planning, KeralaDepartment of Town & Country Planning, Kerala
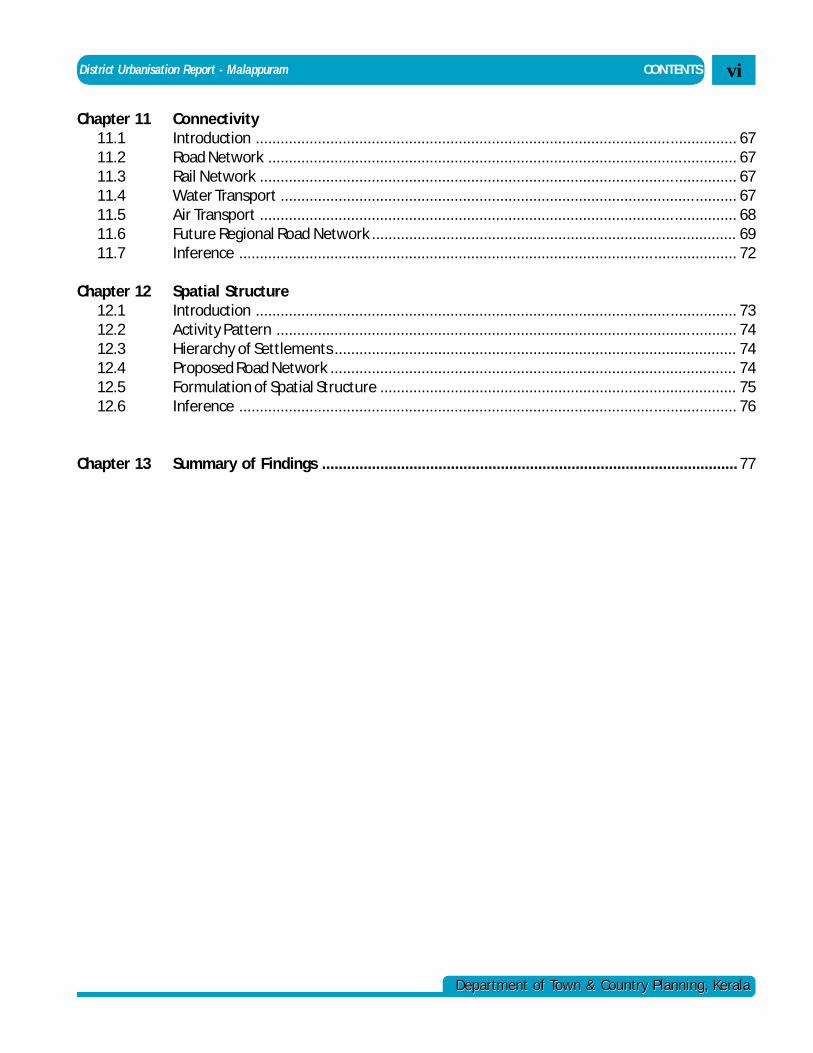
Chapter 11 Connectivity11.1 Introduction .................................................................................................................... 6711.2 Road Network ................................................................................................................. 6711.3 Rail Network ................................................................................................................... 6711.4 Water Transport .............................................................................................................. 6711.5 Air Transport ................................................................................................................... 6811.6 Future Regional Road Network ........................................................................................ 6911.7 Inference ........................................................................................................................ 72
Chapter 12 Spatial Structure12.1 Introduction .................................................................................................................... 7312.2 Activity Pattern ............................................................................................................... 7412.3 Hierarchy of Settlements ................................................................................................. 7412.4 Proposed Road Network .................................................................................................. 7412.5 Formulation of Spatial Structure ...................................................................................... 7512.6 Inference ........................................................................................................................ 76
Chapter 13 Summary of Findings .................................................................................................... 77
vi
CONTENTS District Urbanisation Report -Malappuam
Department of Town & Country Planning, KeralaDepartment of Town & Country Planning, Kerala
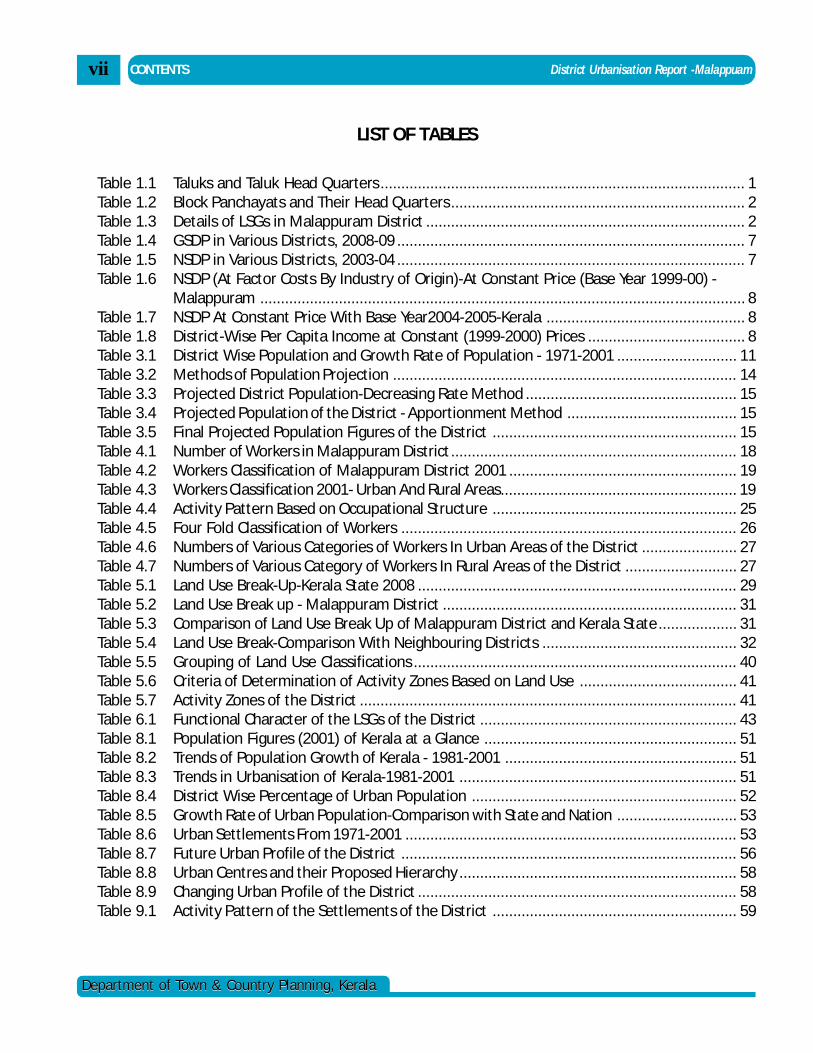
LIST OF TABLES
Table 1.1 Taluks and Taluk Head Quarters ........................................................................................ 1Table 1.2 Block Panchayats and Their Head Quarters ....................................................................... 2Table 1.3 Details of LSGs in Malappuram District ............................................................................. 2Table 1.4 GSDP in Various Districts, 2008-09 .................................................................................... 7Table 1.5 NSDP in Various Districts, 2003-04 .................................................................................... 7Table 1.6 NSDP (At Factor Costs By Industry of Origin)-At Constant Price (Base Year 1999-00) -
Malappuram ..................................................................................................................... 8Table 1.7 NSDP At Constant Price With Base Year2004-2005-Kerala ................................................ 8Table 1.8 District-Wise Per Capita Income at Constant (1999-2000) Prices ...................................... 8Table 3.1 District Wise Population and Growth Rate of Population - 1971-2001 ............................. 11Table 3.2 Methods of Population Projection ................................................................................... 14Table 3.3 Projected District Population-Decreasing Rate Method ................................................... 15Table 3.4 Projected Population of the District - Apportionment Method ......................................... 15Table 3.5 Final Projected Population Figures of the District ........................................................... 15Table 4.1 Number of Workers in Malappuram District..................................................................... 18Table 4.2 Workers Classification of Malappuram District 2001 ....................................................... 19Table 4.3 Workers Classification 2001- Urban And Rural Areas......................................................... 19Table 4.4 Activity Pattern Based on Occupational Structure ........................................................... 25Table 4.5 Four Fold Classification of Workers ................................................................................. 26Table 4.6 Numbers of Various Categories of Workers In Urban Areas of the District ....................... 27Table 4.7 Numbers of Various Category of Workers In Rural Areas of the District ........................... 27Table 5.1 Land Use Break-Up-Kerala State 2008 ............................................................................. 29Table 5.2 Land Use Break up - Malappuram District ....................................................................... 31Table 5.3 Comparison of Land Use Break Up of Malappuram District and Kerala State................... 31Table 5.4 Land Use Break-Comparison With Neighbouring Districts ............................................... 32Table 5.5 Grouping of Land Use Classifications .............................................................................. 40Table 5.6 Criteria of Determination of Activity Zones Based on Land Use ...................................... 41Table 5.7 Activity Zones of the District ........................................................................................... 41Table 6.1 Functional Character of the LSGs of the District .............................................................. 43Table 8.1 Population Figures (2001) of Kerala at a Glance ............................................................. 51Table 8.2 Trends of Population Growth of Kerala - 1981-2001 ........................................................ 51Table 8.3 Trends in Urbanisation of Kerala-1981-2001 ................................................................... 51Table 8.4 District Wise Percentage of Urban Population ................................................................ 52Table 8.5 Growth Rate of Urban Population-Comparison with State and Nation ............................. 53Table 8.6 Urban Settlements From 1971-2001 ................................................................................ 53Table 8.7 Future Urban Profile of the District ................................................................................. 56Table 8.8 Urban Centres and their Proposed Hierarchy ................................................................... 58Table 8.9 Changing Urban Profile of the District ............................................................................. 58Table 9.1 Activity Pattern of the Settlements of the District ........................................................... 59
vii
District Urbanisation Report - Malappuram CONTENTS
Department of Town & Country Planning, KeralaDepartment of Town & Country Planning, Kerala
10.1 Hierarchy of Nodes ......................................................................................................... 6310.2 Proposed Hierarchy of Nodes .......................................................................................... 6610.1 Important Connections Shown in the Conceptual Road Network ..................................... 70
viii
CONTENTS District Urbanisation Report -Malappuam
Department of Town & Country Planning, KeralaDepartment of Town & Country Planning, Kerala
LIST OF FIGURES
Fig 1.1 Location of Malappuram ................................................................................................... 1Fig 1.2 Taluks in Malappuram District .......................................................................................... 1Fig 1.3 Block Panchayats in Malappuram District ......................................................................... 2Fig 1.4 Physiographical Divisions of the District ........................................................................... 4Fig 1.5 Spatial Distribution of the Water Bodies of Malappuram District ...................................... 6Fig 1.6 Temporal Variation of Sectoral Distribution of NSDP-Malappuram District ........................ 8Fig 1.7 Temporal Variation of Sectoral Distribution of NSDP-Kerala State ...................................... 8Fig 2.1 Regional Setting of Malappuram District ......................................................................... 10Fig 2.2 Regional Linkages ........................................................................................................... 10Fig 3.1 Rural-Urban Composition of Population-Malappuram District ......................................... 11Fig 3.2 Rural-Urban Composition of Population Destiny-Malappuram District ............................ 12Fig 3.3 Variation of Population Density ....................................................................................... 12Fig 3.4 Population Concentration Pattern 2001 ........................................................................... 12Fig 4.1 Work Participation Rate-Malappuram District 2001 ........................................................ 17Fig 4.2 Main, Marginal and Non Workers Malappuram District 2001............................................ 17Fig 4.3 Main Workers and Marginal Workers-Temporal Variation ................................................. 17Fig 4.4 Nine Fold Classification of Workers-1991 Malappuram District ....................................... 18Fig 4.5 Workers Classification 1991-Malappuram District ........................................................... 18Fig 4.6 Classification of main Workers 2001-Malappuram District .............................................. 19Fig 4.7 Classification of Workers in Urban Areas-Malappuram District-2001 .............................. 19Fig 4.8 Classification of Workers in Rural Areas-Malappuram District-2001 ............................... 19Fig 4.9 Nine Fold Classification of Workers 2001 ........................................................................ 20Fig 4.10 Workers Classification 2001-Malappuram District ........................................................... 20Fig 4.11 LSG Wise Distribution of Workers Based On 9 Fold Classification For 2001(Estimated) ... 21Fig 4.12 LSG Wise Distribution of Workers (Primary, Secondary, Tertiary) For 2001(Estimated) ..... 21Fig 4.13 Variation of Concentration Index of Agricultural Labourers ............................................. 22Fig 4.14 Variation of Concentration Index of Cultivators ............................................................... 22Fig 4.15 Variation of Concentration Index of HH Industrial Workers .............................................. 22Fig 4.16 Variation of Concentration Index of Other Workers ......................................................... 22Fig 4.17 LSGs Wise Distribution of Primary Workers ..................................................................... 23Fig 4.18 LSGs Wise Distribution of Secondary Workers ................................................................. 23Fig 4.19 LSGs Wise Distribution of Tertiary Workers ..................................................................... 23Fig 4.20 Activity Pattern Based on Occupational Structure ........................................................... 24Fig 4.21 Variation in the Number of Different Category of Workers in Urban Areas ....................... 27Fig 4.22 Variation in the Number of Different Category of Workers in Rural Areas ........................ 27Fig 5.1 Land Use Breakup-Kerala State ....................................................................................... 29Fig 5.2 Land Use Map-Malappuram District ................................................................................ 30Fig 5.3 Percentage of Land Use Breakup-Malappuram District ................................................... 31Fig 5.4 Comaparison of the Percentage Share of Forest Land Use of the State in Surrounding
District ............................................................................................................................ 32
ix
District Urbanisation Report - Malappuram CONTENTS
Department of Town & Country Planning, KeralaDepartment of Town & Country Planning, Kerala
Fig 5.5 Forest Land Use Comparison With Surrounding Districts ................................................. 32Fig 5.6 Comparison of the Percentage Share of Land Marked as Marshy Land of the State in
Malappuram and Surrounding District ............................................................................. 32Fig 5.7 Percentage Share of Marshy Land-Comparison With Surrounding Districts ..................... 32Fig 5.8 Comparison of the Percentage Share of Residential Land Use in District of Kerala-
Malappuram and Surrounding Districts ........................................................................... 33Fig 5.9 Comparison of Percentage Share of Residential Land Use in Malappuram & Surrounding
Districts .......................................................................................................................... 33Fig 5.10 Comparison of Percentage Share of Agricultural Land Use of the State - Malappuram &
Surrounding Districts ....................................................................................................... 33Fig 5.11 Percentage Share of Agriculture Land Use-Malappuram & Surrounding Districts ............ 33Fig 5.12 Comparison of Population Land Use Malappuram & Surrounding Districts ...................... 33Fig 5.13 Comparison of the Percentage Share of State Res/Agr Mix Land Use of the State in
Malappuram & Surrounding ............................................................................................ 34Fig 5.14 Percentage of Res/Agr Mix Land Use in the Districts ...................................................... 34Fig 5.15 Concentration Pattern of Agricultural Land Use .............................................................. 35Fig 5.16 Variation of Concentration Index of Agricultural Land Use among LSGs of Malappuram
District ............................................................................................................................ 35Fig 5.17 Concentration Pattern of Other built Up Land Use .......................................................... 35Fig 5.18 Variation of concentration Index of Other Built up land Use among LSGs of Malappuram
District ............................................................................................................................ 36Fig 5.19 Concentration Pattern of Forest Land Use in LSGs of Malappuram District ...................... 36Fig 5.20 Variation of Concentration index of Forest Land Use Among LSGs of Malappuram District .... 37Fig 5.21 Concentration Pattern of Residential Land Use ............................................................... 37Fig 5.22 Variation of Concentration Index of Residential Land Use Among LSGs of Malappuram
District ............................................................................................................................ 37Fig 5.23 Concentration Pattern of Res/Agri Mixed Land Use ......................................................... 38Fig 5.24 Concentration Pattern of Water Body .............................................................................. 38Fig 5.25 Concentration Pattern of Plantation Land Use ................................................................. 39Fig 5.26 Concentration Pattern of Marshy Land / Kole Land Use .................................................. 39Fig 5.27 Concentration Pattern of Other Land Use ........................................................................ 39Fig 5.28 Concentration Pattern of Urban Land Use ....................................................................... 40Fig 5.29 Concentration Pattern of Agricultural Land Use .............................................................. 40Fig 5.30 Concentration Pattern of Forest Land Use ....................................................................... 40Fig 5.31 Concentration Pattern of Plantation Land Use ................................................................. 41Fig 5.32 Activity Zones Based On Land Use Concentration ........................................................... 41Fig 6.1 Functional Classification of the LSGs of the District ........................................................ 44Fig 7.1 CFI Vs Frequency Graph................................................................................................... 45Fig 7.2 Existing Hierarchy of Settlements ................................................................................... 46Fig 7.3 Existing 1st and 2nd Order Settlements ............................................................................. 47Fig 7.4 Existing Third Order Settlements ..................................................................................... 48Fig 7.5 Proposed Third Order Settlements Based on Four Criteria ............................................... 48
x
CONTENTS District Urbanisation Report -Malappuam
Department of Town & Country Planning, KeralaDepartment of Town & Country Planning, Kerala
Fig 7.6 Size of Service Area Polygone of 3rd Order Settlemets ..................................................... 49Fig 7.7 Determination of 3rd Order Settlements-Hexagons Adjusted ............................................ 49Fig 7.8 Suggested Hierarchy of Settlements ................................................................................ 50Fig 8.1 Urban Areas of the Malappuram District ......................................................................... 52Fig 8.2 Decadal Variation of urban Population in the District ...................................................... 52Fig 8.3 Comparison of Growth Rate of Urban and District Population ......................................... 53Fig 8.4 Growth Rate of Population-LSG wise Variation ................................................................ 53Fig 8.5 Future Urbanisation Profile 2021 ..................................................................................... 57Fig 9.1 Activity Pattern of the Settlements of the District ........................................................... 61Fig 10.1 Spatial Distribution of Nodes .......................................................................................... 65Fig 10.2 Suggested Hierarchy of Nodes ........................................................................................ 65Fig 11.1 Transportation Network (Existing)-Malappuram District .................................................. 68Fig 11.2 Conceptual Road Network Based On Hierarchy of Settlements ....................................... 69Fig 11.3 Proposed Regional Road Network ................................................................................... 72Fig 12.1 Formulation of Spatial Structure ...................................................................................... 73Fig 12.2 Activity Pattern - Malappuram District ............................................................................ 74Fig 12.3 Proposed Hierarchy of Settlements - Malappuram District .............................................. 74Fig 12.4 Proposed Road Network - Malappuram District ............................................................... 75Fig 12.5 Formulation of Spatial Structure ...................................................................................... 75Fig 12.6 Spatial Structure - Malappuram District ........................................................................... 76
xi
District Urbanisation Report - Malappuram CONTENTS
Department of Town & Country Planning, KeralaDepartment of Town & Country Planning, Kerala
ANNEXES
Annexe 1 Taluks and Villages in Malappuram District .................................................................... 79
Annexe 2 Population projection of Kerala ....................................................................................... 81
Annexe 3 Estimation of Nine fold classification of workers for 2001 ............................................... 83
Annexe 4 List of LSGs with CI of various land uses greater than one .............................................. 86
Annexe 5 Concentration index of Urban, Agriculture, Forest and Plantation land use ..................... 89
Annexe 6A Weightage of facilities .................................................................................................... 91
Annexe 6B Composite functional index (CFI) of settlements ............................................................. 92
Annexe 7 Existing hierarchy of settlements .................................................................................... 94
Annexe 8 Centrality and connectivity ............................................................................................. 96
Annexe 9 Determination of third order settlement from NE sub region ......................................... 102
Annexe 10 Deteremination of third order settlement from SE sub region........................................ 102
Annexe 11 Suggested hierarchy of settlements .............................................................................. 103
xii
admin
Text Box
<< BACK
admin
Text Box
CHAPTER 1 >>
Department of Town & Country Planning, KeralaDepartment of Town & Country Planning, Kerala
1District Urbanisation Report -Malappuram PROFILE OF THE DISTRICT
100 Grama Panchayats, 7 Municipalities, 15 Block
Panchayats and one District Panchayat are the local
self government institutions in the district.
The names of the block panchayats and the
block headquarters are listed in Table 1.2.
Chapter 1 PROFILE OF THE DISTRICT
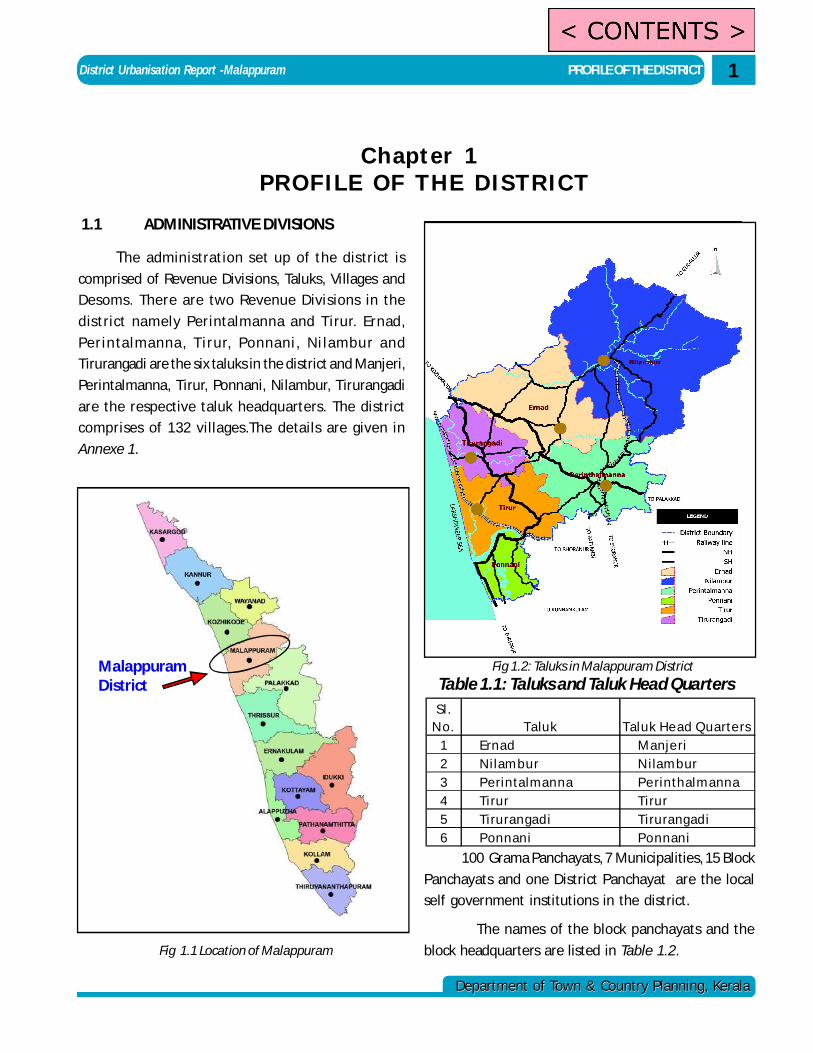
Fig 1.2: Taluks in Malappuram District
The administration set up of the district is
comprised of Revenue Divisions, Taluks, Villages and
Desoms. There are two Revenue Divisions in the
district namely Perintalmanna and T irur. Ernad,
Perintalmanna, T irur, Ponnani , Ni lambur and
Tirurangadi are the six taluks in the district and Manjeri,
Perintalmanna, Tirur, Ponnani, Nilambur, Tirurangadi
are the respective taluk headquarters. The district
comprises of 132 villages.The details are given in
Annexe 1.
Fig 1.1 Location of Malappuram
Table 1.1: Taluks and Taluk Head QuartersSl.
N o. Taluk Taluk He ad Quarte rs1 Ernad Manje ri2 N i lam bur N i lam bur3 Perintalm anna Pe rinthalm anna4 Tirur Tirur5 Tirurangadi Tirurangadi6 Ponnani Ponnani
1.1 ADMINISTRATIVE DIVISIONS
MalappuramDistrict
admin
Text Box
< CONTENTS >
2
Department of Town & Country Planning, KeralaDepartment of Town & Country Planning, Kerala
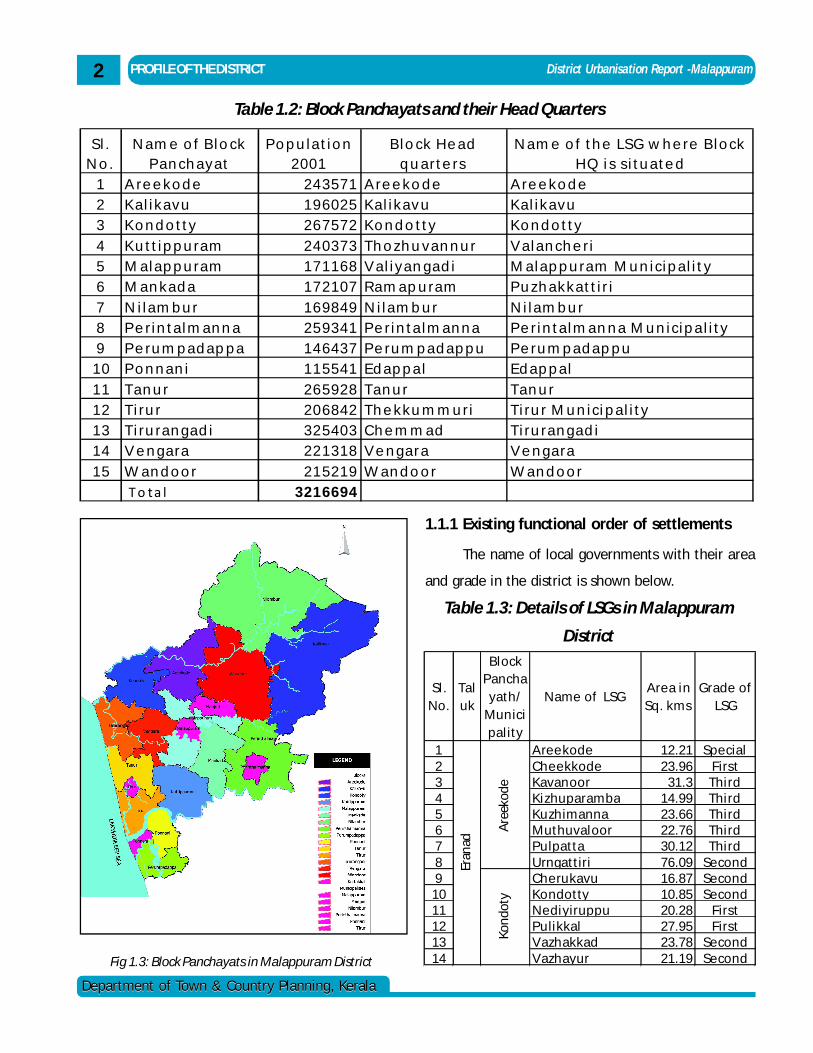
Fig 1.3: Block Panchayats in Malappuram District
Table 1.2: Block Panchayats and their Head Quarters
PROFILE OF THE DISTRICT District Urbanisation Report -Malappuram
The name of local governments with their area
and grade in the district is shown below.
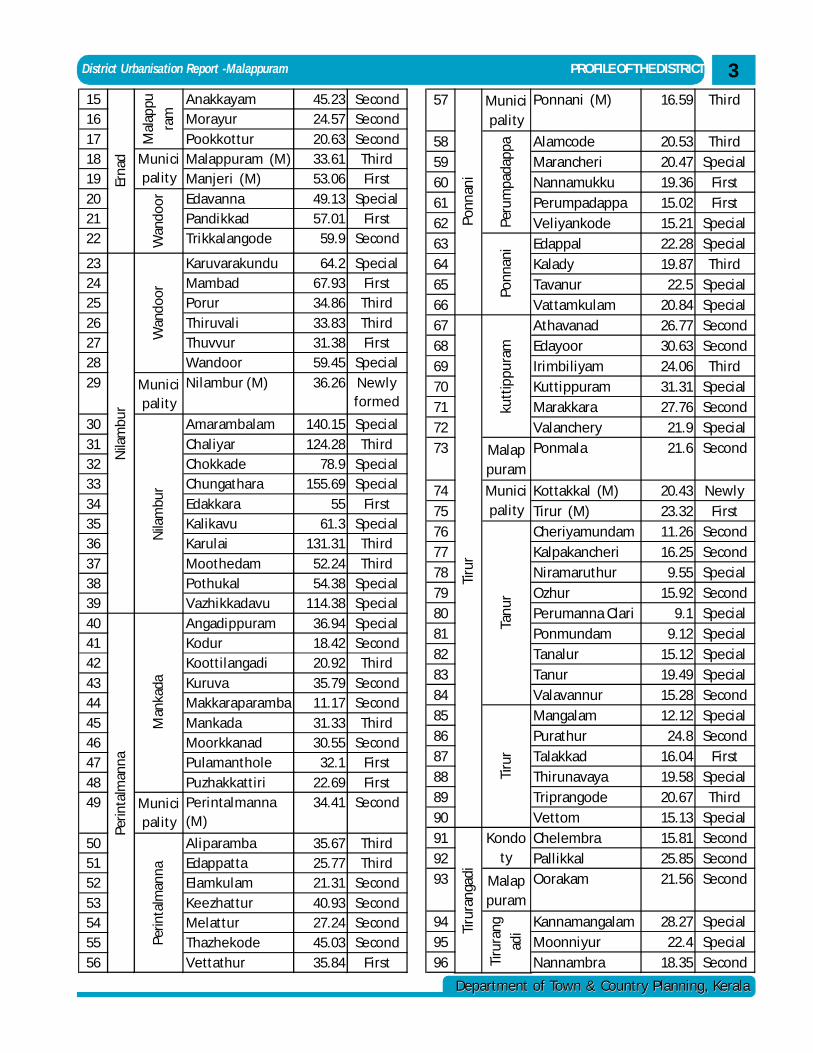
Table 1.3: Details of LSGs in Malappuram
District
Sl. No.
Taluk
Block Pancha
yath/Municipality
N ame of LSGArea in Sq. kms
Grade of LSG
1 A ree kode 12.21 Special2 Cheekkode 23.96 First3 Kavanoor 31.3 Third4 Kizhuparamba 14.99 Third5 Kuzhimanna 23.66 Third6 Muthuvaloor 22.76 Third7 Pulpatta 30.12 Third8 Urngattiri 76.09 Second9 Cherukavu 16.87 Second
10 Kondotty 10.85 Second11 N ediyiruppu 20.28 First12 Pulikkal 27.95 First13 V azhakkad 23.78 Second14 V azhayur 21.19 Second
Eran
ad
Are
ekod
eKo
ndot
y
S l . N o .
N a m e o f B l o ck P a n ch a y a t
P o p u l a t i o n 2001
B l o ck H e a d q u a rte rs
N a m e o f th e LS G w h e re B l o ck H Q i s s i tu a te d
1 A re e k o d e 24 3571 A re e k o d e A re e k o d e2 K a l i k a v u 19 6025 K a l i k a v u K a l i k a v u3 K o n d o tty 26 7572 K o n d o tty K o n d o tty4 K u tt i p p u ra m 24 0373 T h o z h u v a n n u r V a l a n ch e ri5 M a l a p p u ra m 17 1168 V a l i y a n g a d i M a l a p p u ra m M u n i c i p a l i t y6 M a n k a d a 17 2107 R a m a p u ra m P u z h a k k a tt i r i7 N i l a m b u r 16 9849 N i l a m b u r N i l a m b u r8 P e ri n ta l m a n n a 25 9341 P e ri n ta l m a n n a P e ri n ta l m a n n a M u n i c i p a l i ty9 P e ru m p a d a p p a 14 6437 P e ru m p a d a p p u P e ru m p a d a p p u
10 P o n n a n i 11 5541 E d a p p a l E d a p p a l11 T a n u r 26 5928 T a n u r T a n u r12 T i ru r 20 6842 T h e k k u m m u ri T i ru r M u n i c i p a l i ty13 T i ru ra n g a d i 32 5403 C h e m m a d T i ru ra n g a d i14 V e n g a ra 22 1318 V e n g a ra V e n g a ra15 W a n d o o r 21 5219 W a n d o o r W a n d o o r
To ta l 321 6694
1.1.1 Existing functional order of settlements
Department of Town & Country Planning, KeralaDepartment of Town & Country Planning, Kerala
3District Urbanisation Report -Malappuram PROFILE OF THE DISTRICT
15 Anakkayam 45.23 Second16 Morayur 24.57 Second17 Pookkottur 20.63 Second18 Malappuram (M) 33.61 Third19 Manjeri (M) 53.06 First20 Edavanna 49.13 Special21 Pandikkad 57.01 First22 Trikkalangode 59.9 Second
23 Karuvarakundu 64.2 Special24 Mambad 67.93 First25 Porur 34.86 Third26 Thiruvali 33.83 Third27 Thuvvur 31.38 First28 Wandoor 59.45 Special29 Munici
pality
Nilambur (M) 36.26 Newly formed
30 Amarambalam 140.15 Special31 Chaliyar 124.28 Third32 Chokkade 78.9 Special33 Chungathara 155.69 Special34 Edakkara 55 First35 Kalikavu 61.3 Special36 Karulai 131.31 Third37 Moothedam 52.24 Third38 Pothukal 54.38 Special39 Vazhikkadavu 114.38 Special40 Angadippuram 36.94 Special41 Kodur 18.42 Second42 Koottilangadi 20.92 Third43 Kuruva 35.79 Second44 Makkaraparamba 11.17 Second45 Mankada 31.33 Third46 Moorkkanad 30.55 Second47 Pulamanthole 32.1 First48 Puzhakkattiri 22.69 First49 Munici
palityPerintalmanna (M)
34.41 Second
50 Aliparamba 35.67 Third51 Edappatta 25.77 Third52 Elamkulam 21.31 Second53 Keezhattur 40.93 Second54 Melattur 27.24 Second55 Thazhekode 45.03 Second56 Vettathur 35.84 First
Nila
mbu
r
Perin
talm
anna
Man
kada
Perin
talm
anna
Mal
appu
ram
Municipality
Wan
door
Erna
dN
ilam
bur
Wan
door
57 Municipality
Ponnani (M) 16.59 Third
58 Alamcode 20.53 Third59 Marancheri 20.47 Special60 Nannamukku 19.36 First61 Perumpadappa 15.02 First62 Veliyankode 15.21 Special63 Edappal 22.28 Special64 Kalady 19.87 Third65 Tavanur 22.5 Special66 Vattamkulam 20.84 Special67 Athavanad 26.77 Second68 Edayoor 30.63 Second69 Irimbiliyam 24.06 Third70 Kuttippuram 31.31 Special71 Marakkara 27.76 Second72 Valanchery 21.9 Special73 Malap
puram
Ponmala 21.6 Second
74 Kottakkal (M) 20.43 Newly 75 Tirur (M) 23.32 First76 Cheriyamundam 11.26 Second77 Kalpakancheri 16.25 Second78 Niramaruthur 9.55 Special79 Ozhur 15.92 Second80 Perumanna Clari 9.1 Special81 Ponmundam 9.12 Special82 Tanalur 15.12 Special83 Tanur 19.49 Special84 Valavannur 15.28 Second85 Mangalam 12.12 Special86 Purathur 24.8 Second87 Talakkad 16.04 First88 Thirunavaya 19.58 Special89 Triprangode 20.67 Third90 Vettom 15.13 Special91 Chelembra 15.81 Second92 Pallikkal 25.85 Second93 Malap
puram
Oorakam 21.56 Second
94 Kannamangalam 28.27 Special95 Moonniyur 22.4 Special96 Nannambra 18.35 Second
Ponn
ani
Peru
mpa
dapp
aPo
nnan
i
Tiru
rang
adi
Tiru
rang
adi
Kondoty
Tiru
r
kutt
ippu
ram
Municipality
Tanu
rTi
rur
4
Department of Town & Country Planning, KeralaDepartment of Town & Country Planning, Kerala
PROFILE OF THE DISTRICT District Urbanisation Report -Malappuram
97 Parappanangadi 22.25 Special98 Peruvallur 19 Special99 Thenhippalam 16.19 Special
100 Tirurangadi 17.73 Special101 Vall ikkunnu 25.14 First102 Abdu Rahim an
Nagar14.83 First
103 Edarikode 15.28 Third104 Othukkungal 17.28 Third105 Parappur 15.11 First106 Thennala 10 Second107 Vengara 18.66 Special
Tiru
rang
adi Ti
rura
ngad
iV
enga
ra
1.2 AREA AND POPULATION
With a total area of 3550 sqkm Malappuram
district accounts for 9.13% of the geographical area of
Kerala state. With a total population of over 36 lakhs
(as per Census 2001), it has over 11.39% of total
population of state. Population density of Malappuram
district is 1021 persons/sq. km, which is above state
average (819 persons/sq. km) and is ranked 5th in the
state as per census 2001.
1.3 PHYSIOGRAPHY
As the name suggests, Malappuram is a districtwith hilly terraced tract. The streams that meanderthe hills reach the coconut fringed sea coast. Thetopography of the district is highly undulating. It startsfrom the hill tops covered with thick forests on theeast along the Nilgiris and gradually slopes down tothe valleys and the small hills, before finally endingon the sandy flat of cocunut grooves in the west. Thesea coast of the district extents to 70 km. The majorforest area is concentrated in Nilambur and Wandoorblocks and Melattur in the western ghats.
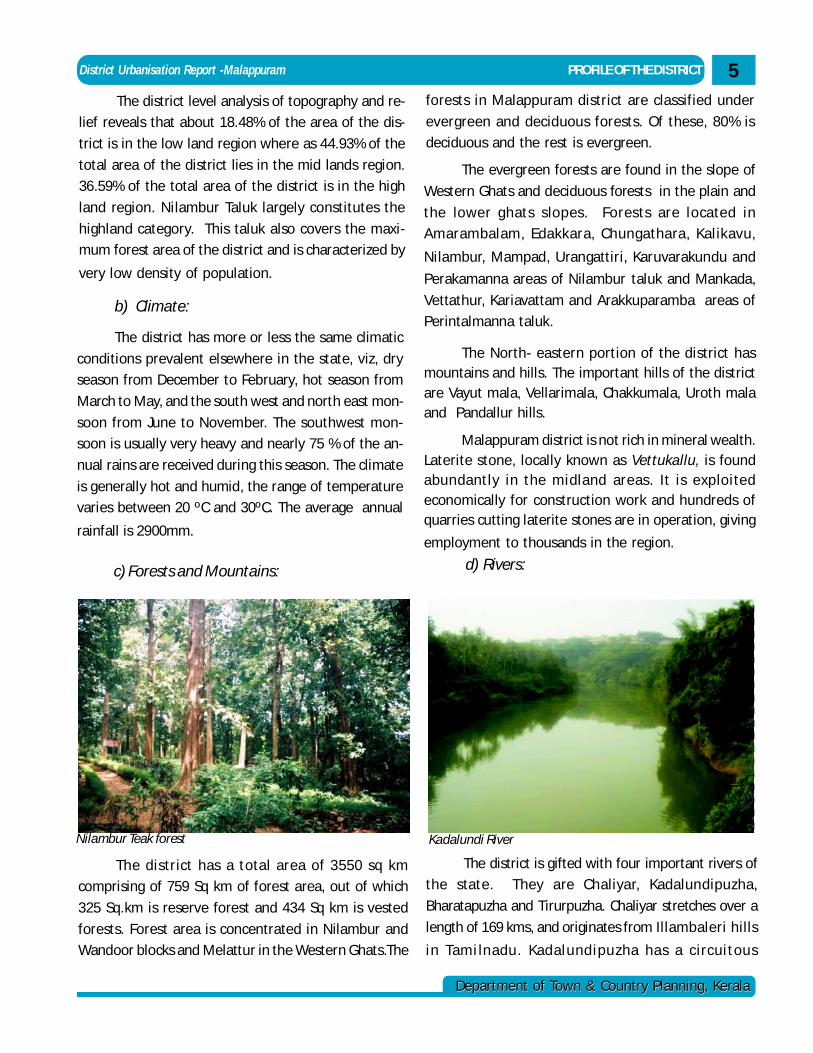
1.4 PHYSICAL FEATURES
a) Natural Sub-Divisions:
Similar to the other parts of the state,
Malappuram district also consists of three natural divi-
sions, low land, mid land and high land. The low land
stretches along the seacoast, the midland in the cen-
tral area and the highland region towards the eastern
and north eastern parts. Nilambur taluk lies completely
in the highland region, Eranad and Perinthalmanna
Taluks lie in the midland region and Ponnani Taluk lies
in the lowland region where as Tirur and Tirurangadi
Taluks lie both in lowland and midland regions.
Fig 1.4 Physiographical divisions of the district
View from Kottakunnu - Malappuram
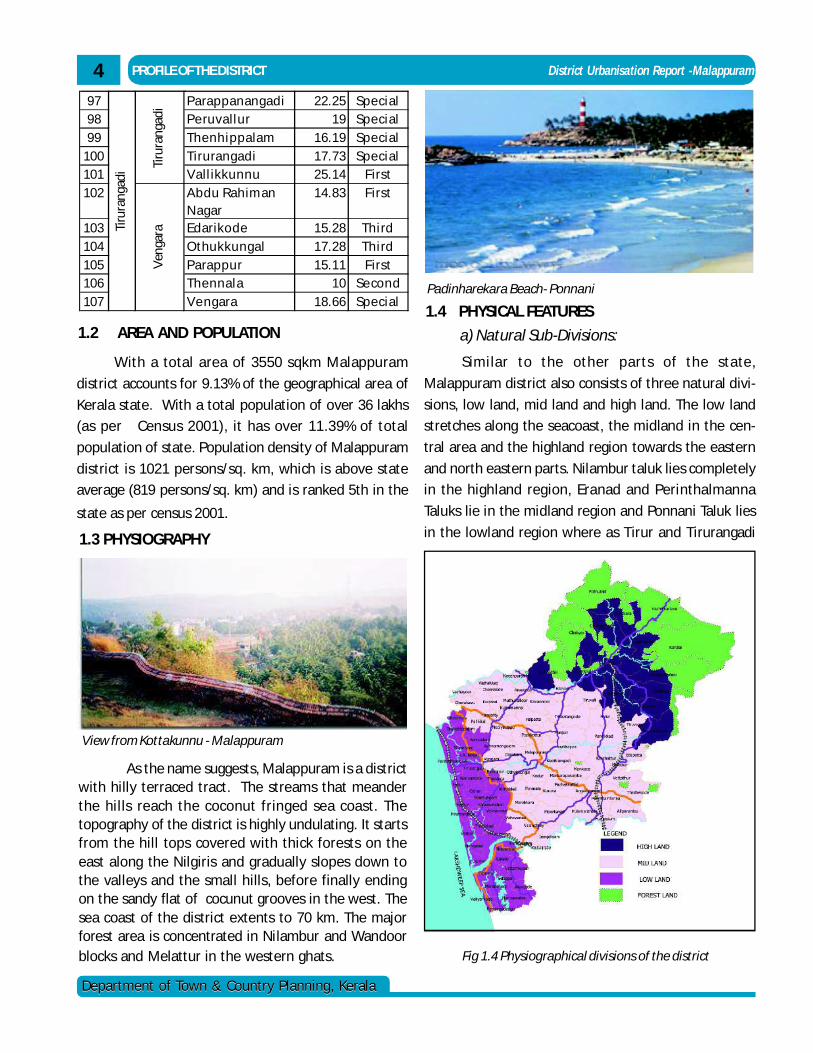
Padinharekara Beach- Ponnani
Department of Town & Country Planning, KeralaDepartment of Town & Country Planning, Kerala
5District Urbanisation Report -Malappuram PROFILE OF THE DISTRICT
The district level analysis of topography and re-
lief reveals that about 18.48% of the area of the dis-
trict is in the low land region where as 44.93% of the
total area of the district lies in the mid lands region.
36.59% of the total area of the district is in the high
land region. Nilambur Taluk largely constitutes the
highland category. This taluk also covers the maxi-
mum forest area of the district and is characterized by
very low density of population.
b) Climate:
The district has more or less the same climatic
conditions prevalent elsewhere in the state, viz, dry
season from December to February, hot season from
March to May, and the south west and north east mon-
soon from June to November. The southwest mon-
soon is usually very heavy and nearly 75 % of the an-
nual rains are received during this season. The climate
is generally hot and humid, the range of temperature
varies between 20 ºC and 30ºC. The average annual
rainfall is 2900mm.
c) Forests and Mountains:
The district has a total area of 3550 sq km
comprising of 759 Sq km of forest area, out of which
325 Sq.km is reserve forest and 434 Sq km is vested
forests. Forest area is concentrated in Nilambur and
Wandoor blocks and Melattur in the Western Ghats.The
The evergreen forests are found in the slope of
Western Ghats and deciduous forests in the plain and
the lower ghats slopes. Forests are located in
Amarambalam, Edakkara, Chungathara, Kalikavu,
Nilambur, Mampad, Urangattiri, Karuvarakundu and
Perakamanna areas of Nilambur taluk and Mankada,
Vettathur, Kariavattam and Arakkuparamba areas of
Perintalmanna taluk.
The North- eastern portion of the district hasmountains and hills. The important hills of the districtare Vayut mala, Vellarimala, Chakkumala, Uroth malaand Pandallur hills.
Malappuram district is not rich in mineral wealth.Laterite stone, locally known as Vettukallu, is foundabundantly in the midland areas. It is exploitedeconomically for construction work and hundreds ofquarries cutting laterite stones are in operation, giving
employment to thousands in the region.
Nilambur Teak forest
d) Rivers:
Kadalundi River
forests in Malappuram district are classified under
evergreen and deciduous forests. Of these, 80% is
deciduous and the rest is evergreen.
The district is gifted with four important rivers of
the state. They are Chaliyar, Kadalundipuzha,
Bharatapuzha and Tirurpuzha. Chaliyar stretches over a
length of 169 kms, and originates from Illambaleri hills
in Tami lnadu. Kadalundipuzha has a circuitous
PROFILE OF THE DISTRICT District Urbanisation Report - Malappuram6
Department of Town & Country Planning, KeralaDepartment of Town & Country Planning, Kerala
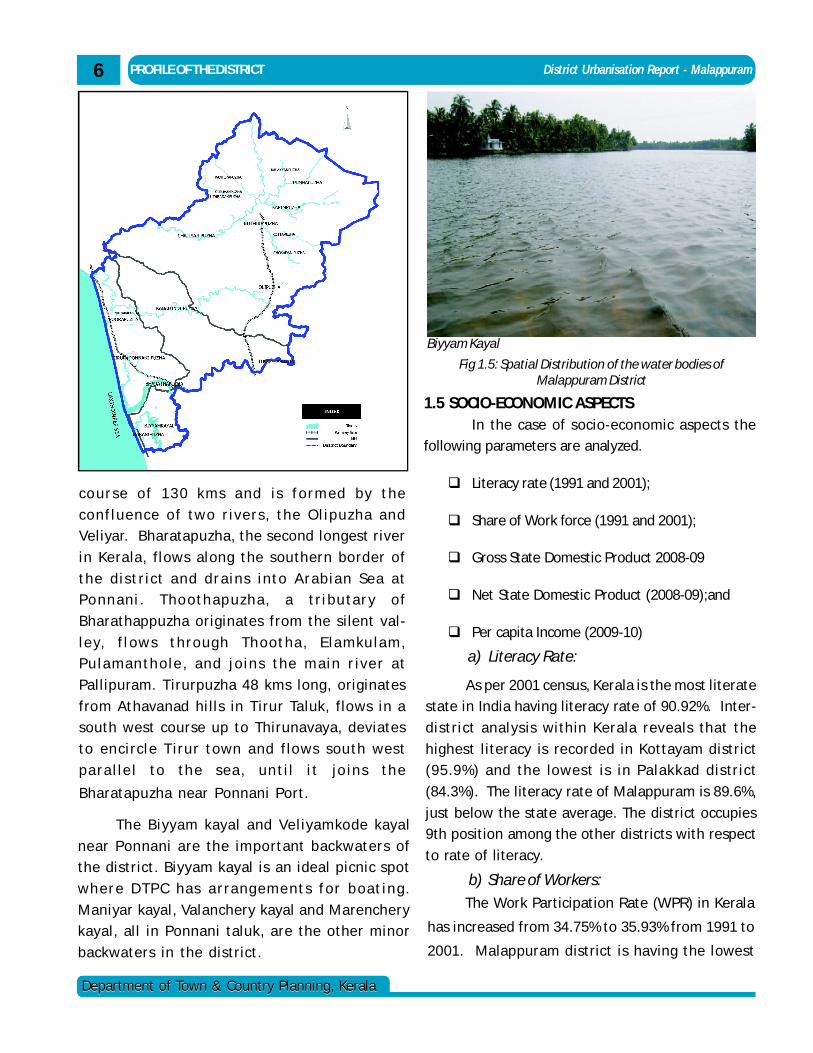
The Biyyam kayal and Vel iyamkode kayal
near Ponnani are the important backwaters of
the district. Biyyam kayal is an ideal picnic spot
wh er e D TP C has a rra ng em e nt s f or b oat i n g .
Maniyar kayal, Valanchery kayal and Marenchery
kayal, all in Ponnani taluk, are the other minor
backwaters in the district.
Fig 1.5: Spatial Distribution of the water bodies ofMalappuram District
1.5 SOCIO-ECONOMIC ASPECTSIn the case of socio-economic aspects the
following parameters are analyzed.
Literacy rate (1991 and 2001);
Share of Work force (1991 and 2001);
Gross State Domestic Product 2008-09
Net State Domestic Product (2008-09);and
Per capita Income (2009-10)
The Work Participation Rate (WPR) in Kerala
has increased from 34.75% to 35.93% from 1991 to
2001. Malappuram district is having the lowest
a) Literacy Rate:
As per 2001 census, Kerala is the most literate
state in India having literacy rate of 90.92%. Inter-
district analysis within Kerala reveals that the
highest l iteracy is recorded in Kottayam district
(95.9%) and the lowest is in Palakkad district
(84.3%). The literacy rate of Malappuram is 89.6%,
just below the state average. The district occupies
9th position among the other districts with respect
to rate of literacy.
Biyyam Kayal
co ur se of 13 0 km s a nd i s f orm ed by t he
conf l uence of two r i v ers , the Ol i puzha and
Veliyar. Bharatapuzha, the second longest river
in Kerala, flows along the southern border of
the d i s t r i ct a nd dr a i ns i nto A rabi a n Sea at
P o nn ani . T ho oth ap uzh a, a tr i bu tar y of
Bharathappuzha originates from the silent val-
l e y, f l ow s t hroug h Th oot ha , E l a m ku l a m ,
P u l a m an th ol e , and j o i n s the m ai n r i v e r at
Pallipuram. T irurpuzha 48 kms long, originates
from Athavanad hi lls in T irur Taluk, flows in a
south west course up to Thirunavaya, deviates
to encircl e T irur town and f lows south west
pa ra l l e l to th e sea , un t i l i t jo i n s th e
Bharatapuzha near Ponnani Port.
b) Share of Workers:
District Urbanisation Report - Malappuram PROFILE OF THE DISTRICT
Department of Town & Country Planning, KeralaDepartment of Town & Country Planning, Kerala
7
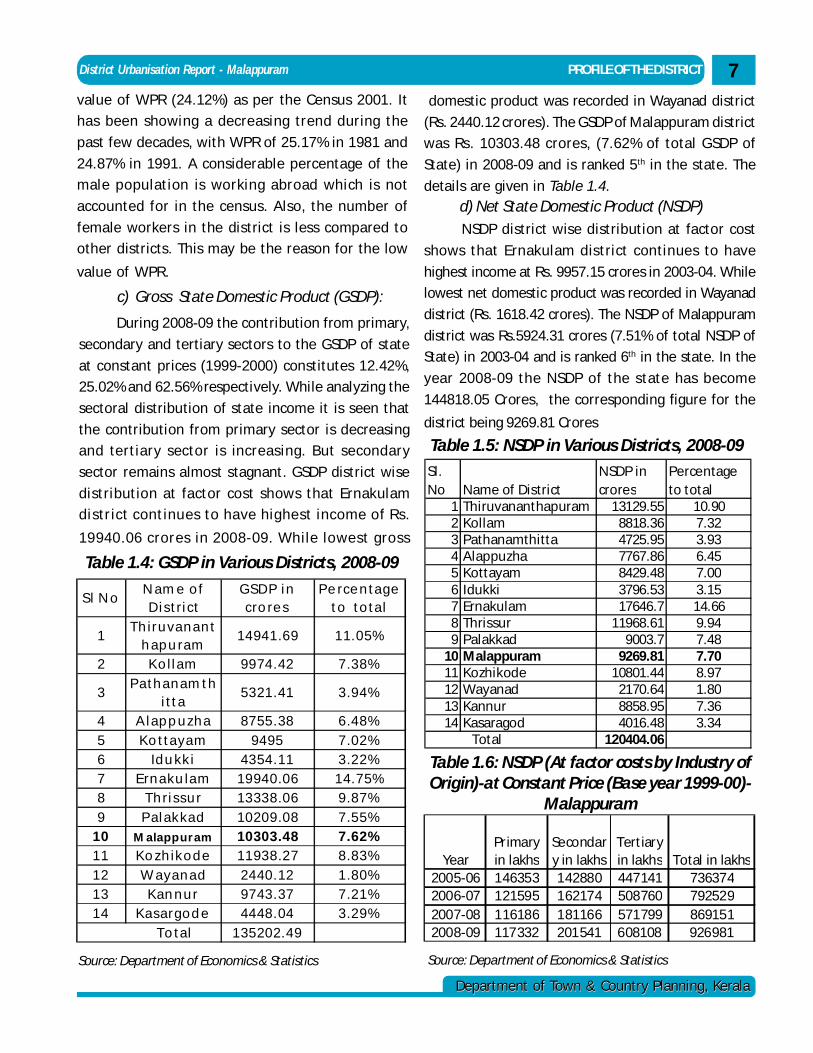
c) Gross State Domestic Product (GSDP):
During 2008-09 the contribution from primary,
secondary and tertiary sectors to the GSDP of state
at constant prices (1999-2000) constitutes 12.42%,
25.02% and 62.56% respectively. While analyzing the
sectoral distribution of state income it is seen that
the contribution from primary sector is decreasing
and tertiary sector is increasing. But secondary
sector remains almost stagnant. GSDP district wise
distribution at factor cost shows that Ernakulam
district continues to have highest income of Rs.
19940.06 crores in 2008-09. While lowest gross
Table 1.4: GSDP in Various Districts, 2008-09
S l N oN am e o f D i s tri ct
G S D P i n cro re s
P e rce n ta g e to to ta l
1T h iru v a n a n t
h ap u ram14941.69 11.05%
2 K o l l am 9974.42 7.38%
3P a th a n am th
i tta5321.41 3.94%
4 A l ap p u z h a 8755.38 6.48%5 K o tta y a m 9495 7.02%6 Id u k k i 4354.11 3.22%7 E rn a k u la m 19940.06 14.75%8 T h ri s s u r 13338.06 9.87%9 P al ak k a d 10209.08 7.55%
10 M alap p u r am 10303.48 7.62%11 K o z h ik o d e 11938.27 8.83%12 W a y a n a d 2440.12 1.80%13 K an n u r 9743.37 7.21%14 K a s argo d e 4448.04 3.29%
135202.49 To ta l
Source: Department of Economics & Statistics
NSDP district wise distribution at factor cost
shows that Ernakulam district continues to have
highest income at Rs. 9957.15 crores in 2003-04. While
lowest net domestic product was recorded in Wayanad
district (Rs. 1618.42 crores). The NSDP of Malappuram
district was Rs.5924.31 crores (7.51% of total NSDP of
State) in 2003-04 and is ranked 6th in the state. In the
year 2008-09 the NSDP of the state has become
144818.05 Crores, the corresponding figure for the
district being 9269.81 Crores
Table 1.5: NSDP in Various Districts, 2008-09
Sl. No Name of District
NSDP in crores
Percentage to total
1 Thiruvananthapuram 13129.55 10.902 Kollam 8818.36 7.323 Pathanamthitta 4725.95 3.934 Alappuzha 7767.86 6.455 Kottayam 8429.48 7.006 Idukki 3796.53 3.157 Ernakulam 17646.7 14.668 Thrissur 11968.61 9.949 Palakkad 9003.7 7.48
10 Malappuram 9269.81 7.7011 Kozhikode 10801.44 8.9712 Wayanad 2170.64 1.8013 Kannur 8858.95 7.3614 Kasaragod 4016.48 3.34
Total 120404.06
value of WPR (24.12%) as per the Census 2001. It
has been showing a decreasing trend during the
past few decades, with WPR of 25.17% in 1981 and
24.87% in 1991. A considerable percentage of the
male population is working abroad which is not
accounted for in the census. Also, the number of
female workers in the district is less compared to
other districts. This may be the reason for the low
value of WPR.
d) Net State Domestic Product (NSDP)
domestic product was recorded in Wayanad district
(Rs. 2440.12 crores). The GSDP of Malappuram district
was Rs. 10303.48 crores, (7.62% of total GSDP of
State) in 2008-09 and is ranked 5th in the state. The
details are given in Table 1.4.
Table 1.6: NSDP (At factor costs by Industry ofOrigin)-at Constant Price (Base year 1999-00)-
Malappuram
YearPrimary in lakhs
Secondary in lakhs
Tertiary in lakhs Total in lakhs
2005-06 146353 142880 447141 7363742006-07 121595 162174 508760 7925292007-08 116186 181166 571799 8691512008-09 117332 201541 608108 926981
Source: Department of Economics & Statistics
Department of Town & Country Planning, Kerala
88
Department of Town & Country Planning, KeralaDepartment of Town & Country Planning, Kerala
PROFILE OF THE DISTRICT District Urbanisation Report -Malappuram
Source: Department of Economics & Statistics
Sl. N o
District2008-09(P)
Rank
2009-10(Q)
Rank
Grow th Rate
(% )2008-09
1Thiruvananth
apuram52266 3 57563 3 10.14
2 Kollam 44914 10 48795 11 8.64
3Pathanam thi
tta51752 4 56994 4 10.13
4 A lappuzha 48549 7 53535 6 10.275 Kottayam 56190 2 61668 2 9.756 Idukki 49705 6 51367 7 3.347 Ernakulam 71548 1 79553 1 11.198 Thrissur 51071 5 56087 5 9.829 Palakkad 44769 11 49825 10 11.29
10 M alappuram 31900 14 33783 14 5.911 Kozhikode 46585 9 50389 9 8.1612 W ayanad 40096 12 38341 13 -4.3813 Kannur 47808 8 50623 8 5.8914 Kasaragod 40013 13 44588 12 11.44
STATE 48655 52984 8.9P - P rovis ional, Q - Quick Es tim ate
P - Provisional, Q - Quick EstimateSource: Economic Review 2010
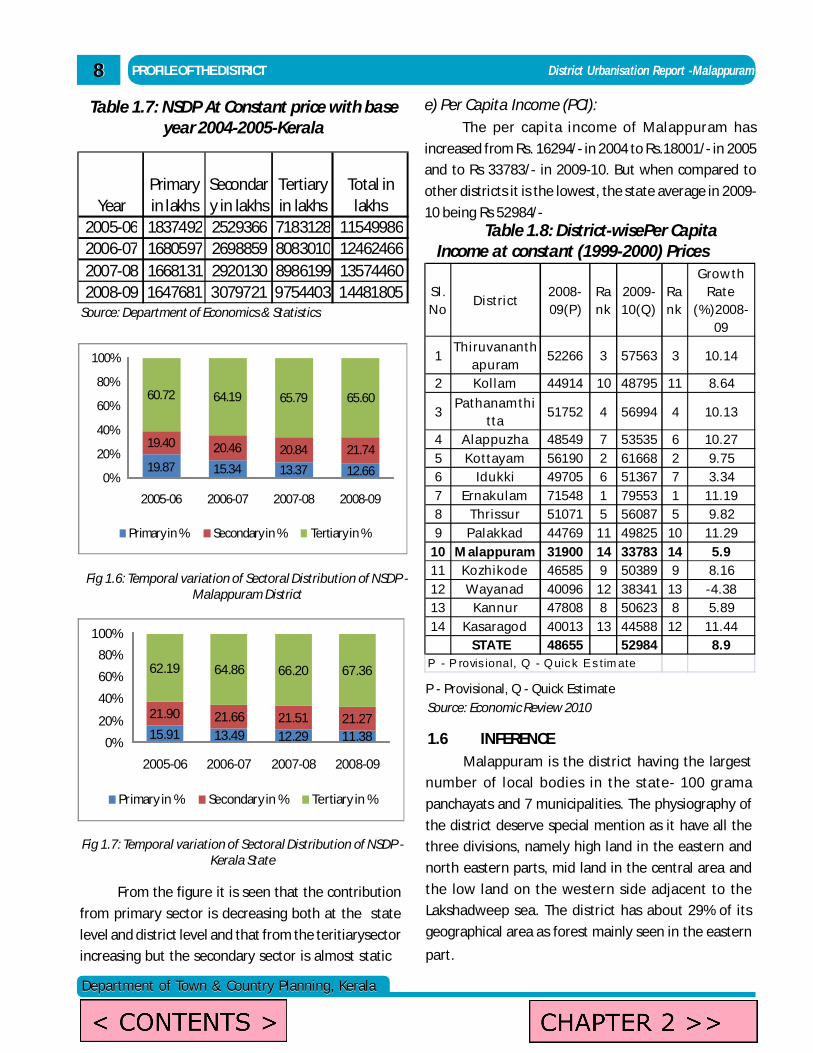
1.6 INFERENCEMalappuram is the district having the largest
number of local bodies in the state- 100 grama
panchayats and 7 municipalities. The physiography of
the district deserve special mention as it have all the
three divisions, namely high land in the eastern and
north eastern parts, mid land in the central area and
the low land on the western side adjacent to the
Lakshadweep sea. The district has about 29% of its
geographical area as forest mainly seen in the eastern
part.
19.87 15.34 13.37 12.66
19.40 20.46 20.84 21.74
60.72 64.19 65.79 65.60
0%
20%
40%
60%
80%
100%
2005-06 2006-07 2007-08 2008-09
Primary in % Secondary in % Tertiary in %
Fig 1.6: Temporal variation of Sectoral Distribution of NSDP -Malappuram District
15.91 13.49 12.29 11.38
21.90 21.66 21.51 21.27
62.19 64.86 66.20 67.36
0%
20%
40%
60%
80%
100%
2005-06 2006-07 2007-08 2008-09
Primary in % Secondary in % Tertiary in %
Fig 1.7: Temporal variation of Sectoral Distribution of NSDP -Kerala State
From the figure it is seen that the contribution
from primary sector is decreasing both at the state
level and district level and that from the teritiarysector
increasing but the secondary sector is almost static
Table 1.7: NSDP At Constant price with baseyear 2004-2005-Kerala
YearPrimary in lakhs
Secondary in lakhs
Tertiary in lakhs
Total in lakhs
2005-06 1837492 2529366 7183128 115499862006-07 1680597 2698859 8083010 124624662007-08 1668131 2920130 8986199 135744602008-09 1647681 3079721 9754403 14481805
e) Per Capita Income (PCI):The per capita income of Malappuram has
increased from Rs. 16294/- in 2004 to Rs.18001/- in 2005
and to Rs 33783/- in 2009-10. But when compared to
other districts it is the lowest, the state average in 2009-
10 being Rs 52984/-Table 1.8: District-wisePer Capita
Income at constant (1999-2000) Prices
admin
Text Box
< CONTENTS >
admin
Text Box
CHAPTER 2 >>
District Urbanisation Report - Malappuram HISTORY AND REGIONAL LINKAGES
Department of Town & Country Planning, KeralaDepartment of Town & Country Planning, Kerala
9
Chapter 2HISTORY AND REGIONAL LINKAGES
2.1 HISTORICAL BACKGROUND
The ancient history of the district is obscure.
During the Sangam period, the district formed part of
Chera Empire. The inscriptional evidence found at
the Triprangode temple indicates that Godaravi of the
Chera empire had his sway over this region. The rulers
of Ernad were the ancestors of Zamorins and the later
history of the district is interwoven with the history of
Zamorin rulers. Zamorin or Samuthiri originally
belonged to Nediyirippu in Ernad Taluk of the district,
before shifting his seat to Calicut. Zamorins later
conquered over Prappanad and Vettattunad (Tanur).
The war with the Valluvakonathiri ended in
establishing Zamorin’s superiority and gave him the
honour of presiding over the Mamangam, as the
protector of Mamangam. By 1400 AD Zamorins
established control over the entire district.
The Mysorian invasion during the period 1766
– 93 had political overturn in Malabar. Manjeri was the
headquarters of Hyder Ali’s troop. Later in 1788, Tippu
Sulthan descended in Kerala with large army and
established his authority in Malabar and made Feroke
his Capital. But signing of treaty on SreeRangapattanam
in 1792 resulted in the collapse of Mysorian throne and
the large tract of Malabar, which were under the
authority of Mysorians were ceded to the British.
Thereafter the district was under direct control of the
British and Zamorins were vested with the power to
administer over the region. In October 1798, the British
East India Company assumed full control of the region
covered by the Zamorin. Thereafter British Collectors
ruled Malabar, which included the present Malappuram
district.
2.2 REGIONAL LINKAGES
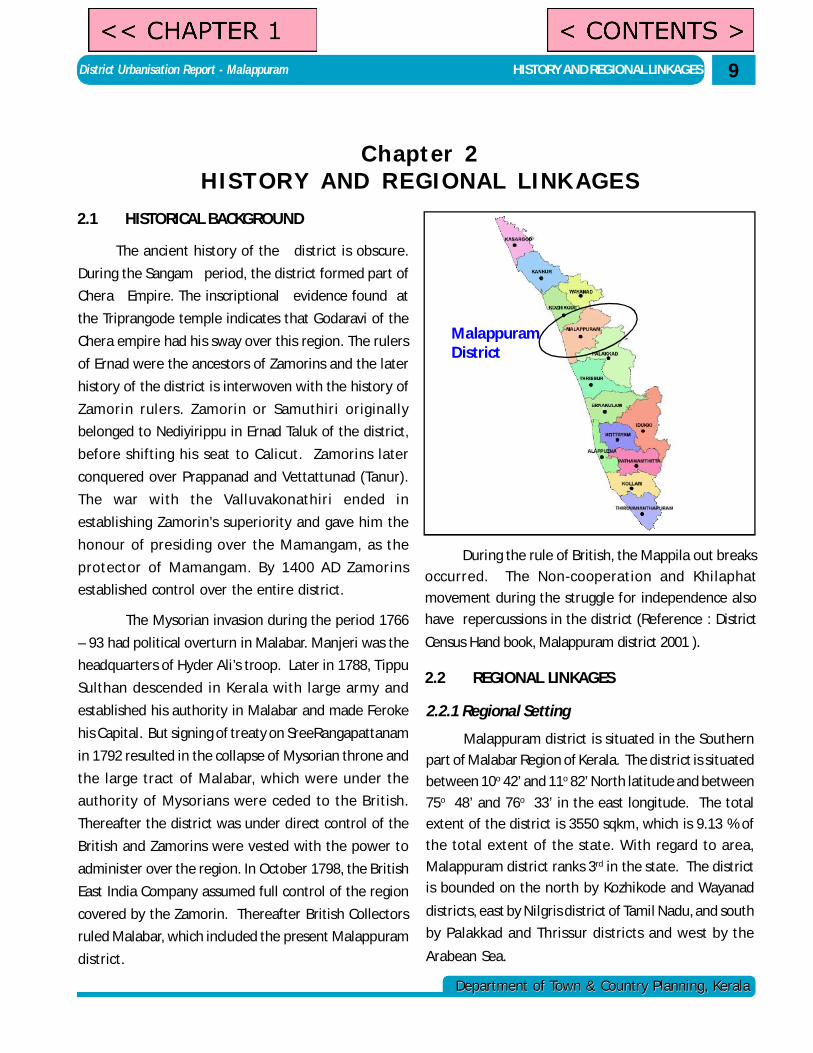
2.2.1 Regional Setting
Malappuram district is situated in the Southern
part of Malabar Region of Kerala. The district is situated
between 10o 42’ and 11o 82’ North latitude and between
75o 48’ and 76o 33’ in the east longitude. The total
extent of the district is 3550 sqkm, which is 9.13 % of
the total extent of the state. With regard to area,
Malappuram district ranks 3rd in the state. The district
is bounded on the north by Kozhikode and Wayanad
districts, east by Nilgris district of Tamil Nadu, and south
by Palakkad and Thrissur districts and west by the
Arabean Sea.
During the rule of British, the Mappila out breaks
occurred. The Non-cooperation and Khilaphat
movement during the struggle for independence also
have repercussions in the district (Reference : District
Census Hand book, Malappuram district 2001 ).
MalappuramDistrict
admin
Text Box
< CONTENTS >
admin
Text Box
<< CHAPTER 1
District Urbanisation Report - Malappuram10
Department of Town & Country Planning, KeralaDepartment of Town & Country Planning, Kerala
HISTORY AND REGIONAL LINKAGES
Fig 2.1: Regional setting of Malappuram District
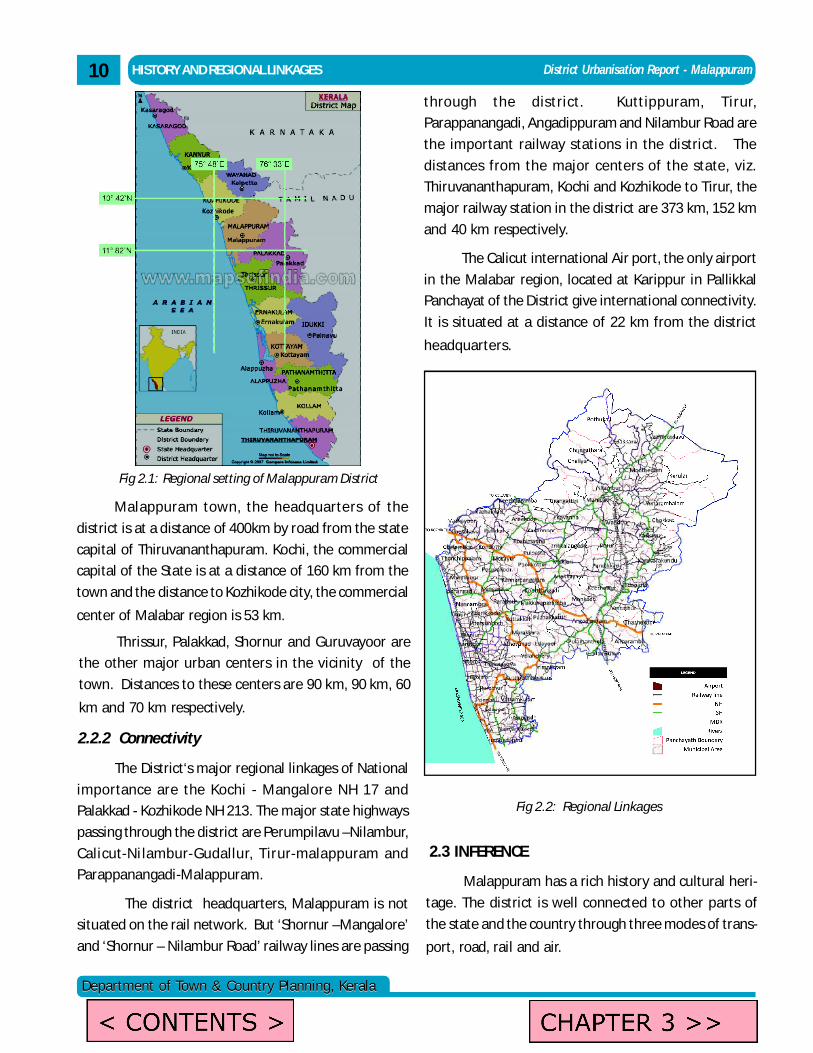
The District‘s major regional linkages of National
importance are the Kochi - Mangalore NH 17 and
Palakkad - Kozhikode NH 213. The major state highways
passing through the district are Perumpilavu –Nilambur,
Calicut-Ni lambur-Gudallur, Tirur-malappuram and
Parappanangadi-Malappuram.
The district headquarters, Malappuram is not
situated on the rail network. But ‘Shornur –Mangalore’
and ‘Shornur – Nilambur Road’ railway lines are passing
Malappuram town, the headquarters of the
district is at a distance of 400km by road from the state
capital of Thiruvananthapuram. Kochi, the commercial
capital of the State is at a distance of 160 km from the
town and the distance to Kozhikode city, the commercial
center of Malabar region is 53 km.
Thrissur, Palakkad, Shornur and Guruvayoor are
the other major urban centers in the vicinity of the
town. Distances to these centers are 90 km, 90 km, 60
km and 70 km respectively.
2.2.2 Connectivity
Fig 2.2: Regional Linkages
through the district. Kuttippuram, Tirur,
Parappanangadi, Angadippuram and Nilambur Road are
the important railway stations in the district. The
distances from the major centers of the state, viz.
Thiruvananthapuram, Kochi and Kozhikode to Tirur, the
major railway station in the district are 373 km, 152 km
and 40 km respectively.
The Calicut international Air port, the only airport
in the Malabar region, located at Karippur in Pallikkal
Panchayat of the District give international connectivity.
It is situated at a distance of 22 km from the district
headquarters.
2.3 INFERENCE
Malappuram has a rich history and cultural heri-
tage. The district is well connected to other parts of
the state and the country through three modes of trans-
port, road, rail and air.
admin
Text Box
< CONTENTS >
admin
Text Box
CHAPTER 3 >>
District Urbanisation Report - Malappuram
Department of Town & Country Planning, KeralaDepartment of Town & Country Planning, Kerala
11POPULATION
Chapter 3POPULATION
3.1 POPULATION SIZEThe population of the district as per 2001 Census
is 36,25,471, with a break up of 17,54,576 males and
18,70,895 females. The district has recorded the highest
population and highest rate of growth of population in
the state during the last two decades. The district
having 9.13% of the total geographical area of the
state accommodates 11.39% of the total population of
the state.
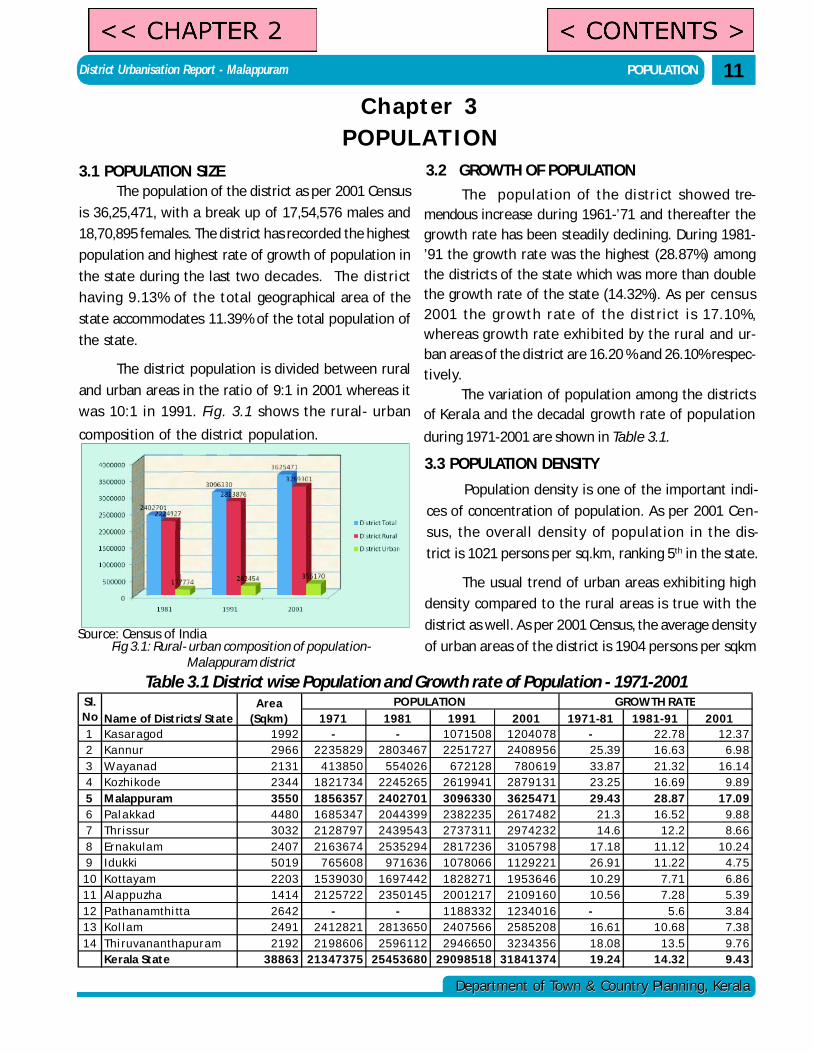
The district population is divided between rural
and urban areas in the ratio of 9:1 in 2001 whereas it
was 10:1 in 1991. Fig. 3.1 shows the rural- urban
composition of the district population.
Fig 3.1: Rural- urban composition of population-Malappuram district
Source: Census of India
3.2 GROWTH OF POPULATION
The population of the district showed tre-mendous increase during 1961-’71 and thereafter thegrowth rate has been steadily declining. During 1981-’91 the growth rate was the highest (28.87%) amongthe districts of the state which was more than doublethe growth rate of the state (14.32%). As per census2001 the growth rate of the district is 17.10%,whereas growth rate exhibited by the rural and ur-ban areas of the district are 16.20 % and 26.10% respec-tively.
Table 3.1 District wise Population and Growth rate of Population - 1971-2001
The variation of population among the districtsof Kerala and the decadal growth rate of population
during 1971-2001 are shown in Table 3.1.
1971 1981 19 91 2001 197 1-81 1981-911991-2001
1 Ka s a ra god 1992 - - 1071508 12040 78 - 22.78 12.3 72 Ka nnur 2966 22 35829 2803467 2251727 24089 56 25.39 16.63 6.9 83 W a ya na d 2131 4 13850 554026 672128 780 619 33.87 21.32 16.1 44 Kozhikode 2344 18 21734 2245265 2619941 28791 31 23.25 16.69 9.8 95 Malappuram 3550 18 56357 2402701 3096330 36254 71 29.43 28.87 17.0 96 Pa l a kka d 4480 16 85347 2044399 2382235 26174 82 21.3 16.52 9.8 87 Thris s ur 3032 21 28797 2439543 2737311 29742 32 14.6 12.2 8.6 68 Erna kula m 2407 21 63674 2535294 2817236 31057 98 17.18 11.12 10.2 49 Idukki 5019 7 65608 971636 1078066 11292 21 26.91 11.22 4.7 5
10 Kotta ya m 2203 15 39030 1697442 1828271 19536 46 10.29 7.71 6.8 611 Al a ppuzha 1414 21 25722 2350145 2001217 21091 60 10.56 7.28 5.3 912 Pa tha na mthi tta 2642 - - 1188332 12340 16 - 5.6 3.8 413 Kol la m 2491 24 12821 2813650 2407566 25852 08 16.61 10.68 7.3 814 Thi ruva na ntha pura m 2192 21 98606 2596112 2946650 32343 56 18.08 13.5 9.7 6
Kerala State 38863 213 47375 25453680 29098518 31841 374 19.24 14.32 9.4 3
Nam e of Districts/StateArea
(Sqkm )
PO PULATIO N GROW TH RATESl.No
3.3 POPULATION DENSITY
Population density is one of the important indi-
ces of concentration of population. As per 2001 Cen-
sus, the overall density of population in the dis-
trict is 1021 persons per sq.km, ranking 5th in the state.
The usual trend of urban areas exhibiting high
density compared to the rural areas is true with the
district as well. As per 2001 Census, the average density
of urban areas of the district is 1904 persons per sqkm
admin
Text Box
<< CHAPTER 2
admin
Text Box
< CONTENTS >
District Urbanisation Report - Malappuram12
Department of Town & Country Planning, KeralaDepartment of Town & Country Planning, Kerala
POPULATION
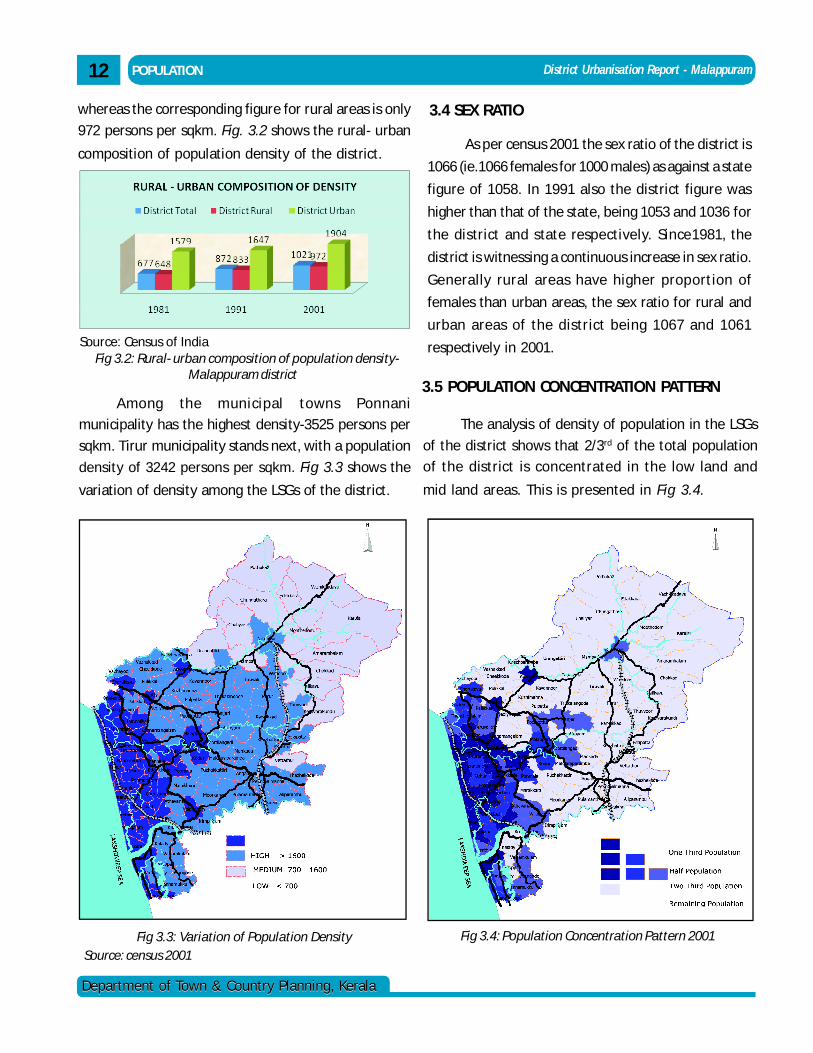
Fig 3.2: Rural- urban composition of population density-Malappuram district
Source: Census of India
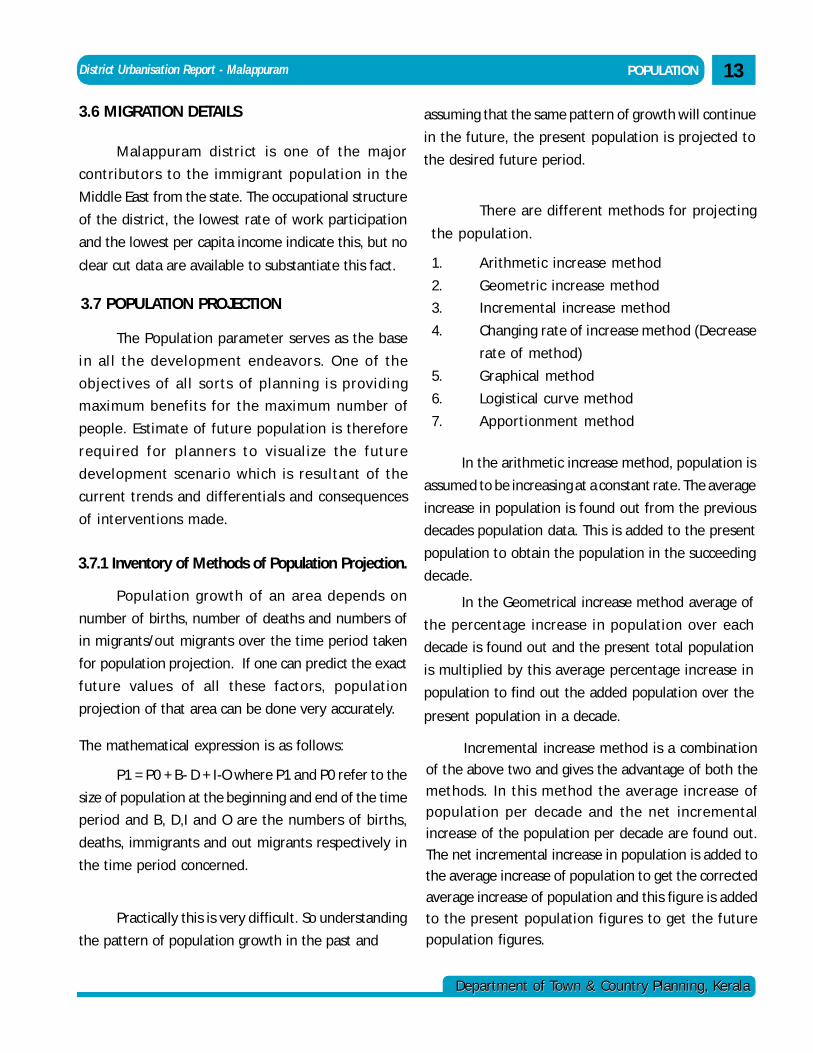
Among the municipal towns Ponnani
municipality has the highest density-3525 persons per
sqkm. Tirur municipality stands next, with a population
density of 3242 persons per sqkm. Fig 3.3 shows the
variation of density among the LSGs of the district.
Source: census 2001 Fig 3.3: Variation of Population Density
3.4 SEX RATIO
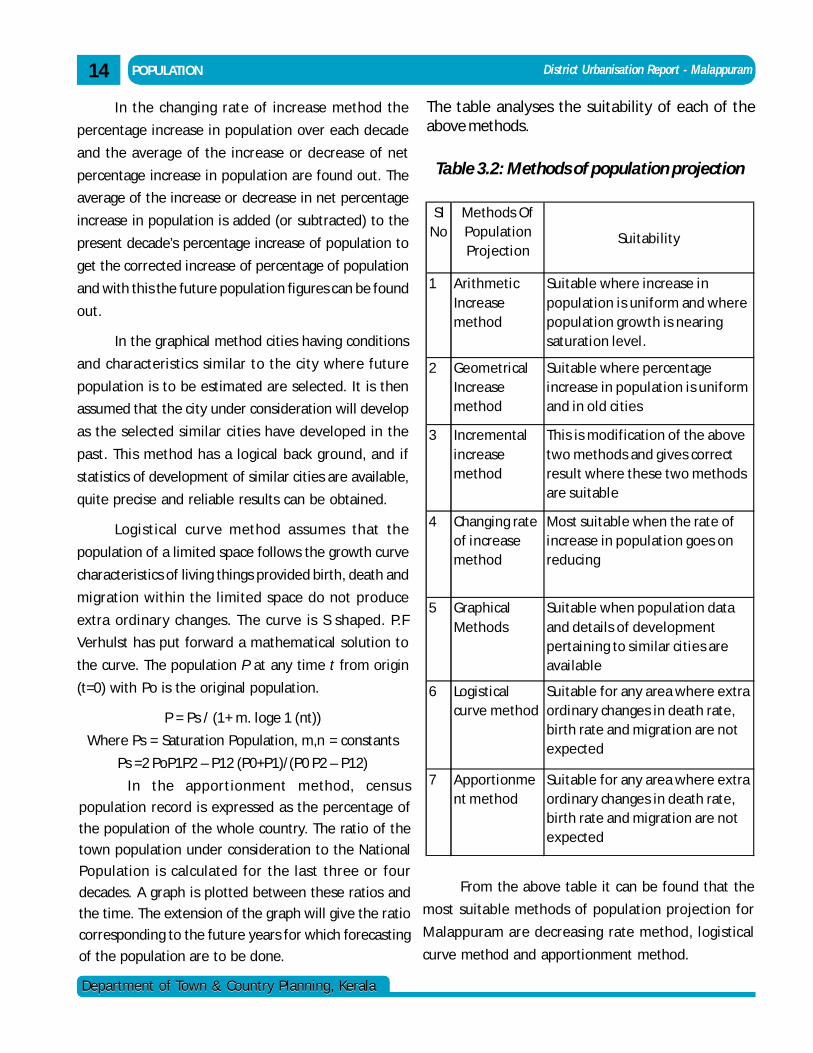
3.5 POPULATION CONCENTRATION PATTERN
The analysis of density of population in the LSGs
of the district shows that 2/3rd of the total population
of the district is concentrated in the low land and
mid land areas. This is presented in Fig 3.4.
Fig 3.4: Population Concentration Pattern 2001
whereas the corresponding figure for rural areas is only
972 persons per sqkm. Fig. 3.2 shows the rural- urban
composition of population density of the district.As per census 2001 the sex ratio of the district is
1066 (ie.1066 females for 1000 males) as against a state
figure of 1058. In 1991 also the district figure was
higher than that of the state, being 1053 and 1036 for
the district and state respectively. Since1981, the
district is witnessing a continuous increase in sex ratio.
Generally rural areas have higher proportion of
females than urban areas, the sex ratio for rural and
urban areas of the district being 1067 and 1061
respectively in 2001.
District Urbanisation Report - Malappuram
Department of Town & Country Planning, KeralaDepartment of Town & Country Planning, Kerala
13POPULATION
3.7.1 Inventory of Methods of Population Projection.
Population growth of an area depends on
number of births, number of deaths and numbers of
in migrants/out migrants over the time period taken
for population projection. If one can predict the exact
future values of all these factors, population
projection of that area can be done very accurately.
The mathematical expression is as follows:
P1 = P0 + B- D + I-O where P1 and P0 refer to the
size of population at the beginning and end of the time
period and B, D,I and O are the numbers of births,
deaths, immigrants and out migrants respectively in
the time period concerned.
Practically this is very difficult. So understanding
the pattern of population growth in the past and
There are different methods for projecting
the population.
1. Arithmetic increase method
2. Geometric increase method
3. Incremental increase method
4. Changing rate of increase method (Decrease
rate of method)
5. Graphical method
6. Logistical curve method
7. Apportionment method
3.6 MIGRATION DETAILS
Malappuram district is one of the major
contributors to the immigrant population in the
Middle East from the state. The occupational structure
of the district, the lowest rate of work participation
and the lowest per capita income indicate this, but no
clear cut data are available to substantiate this fact.
3.7 POPULATION PROJECTION
The Population parameter serves as the base
in al l the development endeavors. One of the
objectives of all sorts of planning is providing
maximum benefits for the maximum number of
people. Estimate of future population is therefore
required for planners to visual ize the future
development scenario which is resultant of the
current trends and differentials and consequences
of interventions made.
In the arithmetic increase method, population is
assumed to be increasing at a constant rate. The average
increase in population is found out from the previous
decades population data. This is added to the present
population to obtain the population in the succeeding
decade.
In the Geometrical increase method average of
the percentage increase in population over each
decade is found out and the present total population
is multiplied by this average percentage increase in
population to find out the added population over the
present population in a decade.
Incremental increase method is a combination
of the above two and gives the advantage of both the
methods. In this method the average increase of
population per decade and the net incremental
increase of the population per decade are found out.
The net incremental increase in population is added to
the average increase of population to get the corrected
average increase of population and this figure is added
to the present population figures to get the future
population figures.
assuming that the same pattern of growth will continue
in the future, the present population is projected to
the desired future period.
District Urbanisation Report - Malappuram14
Department of Town & Country Planning, KeralaDepartment of Town & Country Planning, Kerala
POPULATION
In the apportionment method, census
population record is expressed as the percentage of
the population of the whole country. The ratio of the
town population under consideration to the National
Population is calculated for the last three or four
decades. A graph is plotted between these ratios and
the time. The extension of the graph will give the ratio
corresponding to the future years for which forecasting
of the population are to be done.
The table analyses the suitability of each of theabove methods.
Table 3.2: Methods of population projection
Sl No
Methods Of Population Projection
Suitability
1 Arithmetic Increase method
Suitable where increase in population is uniform and where population growth is nearing saturation level.
2 Geometrical Increase method
Suitable where percentage increase in population is uniform and in old cities
3 Incremental increase method
This is modification of the above two methods and gives correct result where these two methods are suitable
4 Changing rate of increase method
Most suitable when the rate of increase in population goes on reducing
5 Graphical Methods
Suitable when population data and details of development pertaining to similar cities are available
6 Logistical curve method
Suitable for any area where extra ordinary changes in death rate, birth rate and migration are not expected
7 Apportionment method
Suitable for any area where extra ordinary changes in death rate, birth rate and migration are not expected
From the above table it can be found that the
most suitable methods of population projection for
Malappuram are decreasing rate method, logistical
curve method and apportionment method.
In the changing rate of increase method the
percentage increase in population over each decade
and the average of the increase or decrease of net
percentage increase in population are found out. The
average of the increase or decrease in net percentage
increase in population is added (or subtracted) to the
present decade’s percentage increase of population to
get the corrected increase of percentage of population
and with this the future population figures can be found
out.
In the graphical method cities having conditions
and characteristics similar to the city where future
population is to be estimated are selected. It is then
assumed that the city under consideration will develop
as the selected similar cities have developed in the
past. This method has a logical back ground, and if
statistics of development of similar cities are available,
quite precise and reliable results can be obtained.
Logistical curve method assumes that the
population of a limited space follows the growth curve
characteristics of living things provided birth, death and
migration within the limited space do not produce
extra ordinary changes. The curve is S shaped. P.F
Verhulst has put forward a mathematical solution to
the curve. The population P at any time t from origin
(t=0) with Po is the original population.
P = Ps / (1+ m. loge 1 (nt))
Where Ps = Saturation Population, m,n = constants
Ps =2 PoP1P2 – P12 (P0+P1)/(P0 P2 – P12)
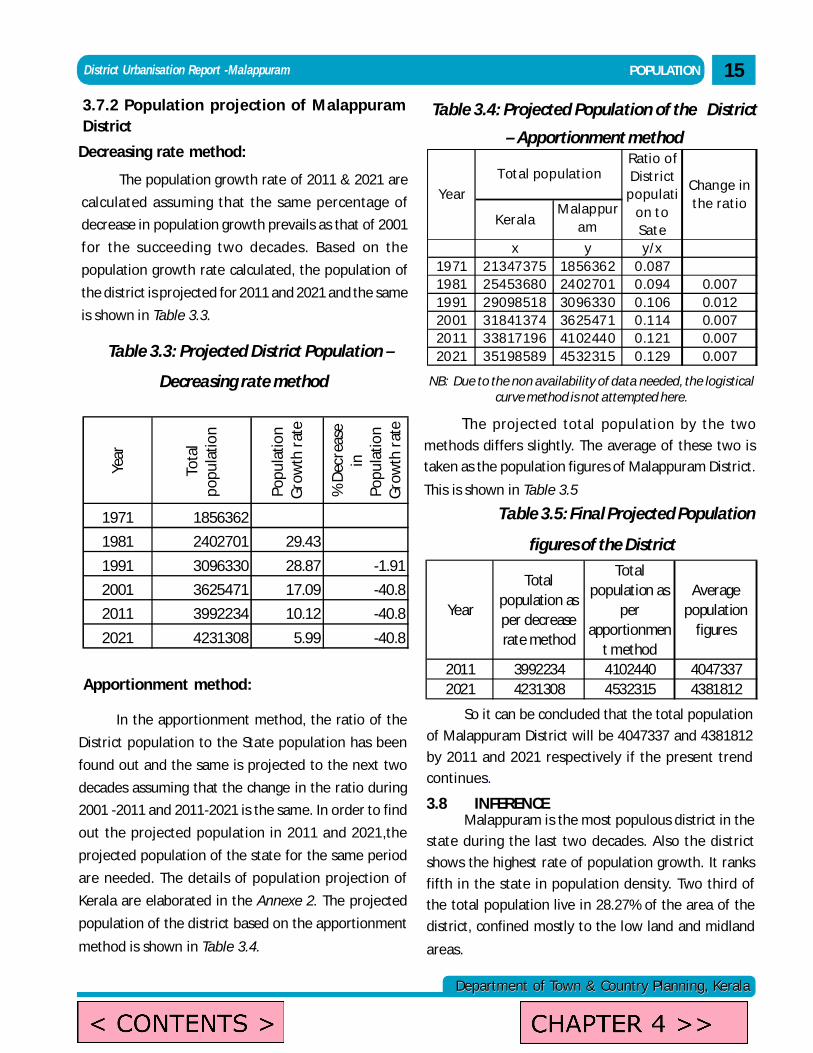
Department of Town & Country Planning, KeralaDepartment of Town & Country Planning, Kerala
District Urbanisation Report -Malappuram 15POPULATION
3.7.2 Population projection of MalappuramDistrict
Decreasing rate method:
The population growth rate of 2011 & 2021 are
calculated assuming that the same percentage of
decrease in population growth prevails as that of 2001
for the succeeding two decades. Based on the
population growth rate calculated, the population of
the district is projected for 2011 and 2021 and the same
is shown in Table 3.3.
Table 3.3: Projected District Population –
Decreasing rate method
Apportionment method:
In the apportionment method, the ratio of the
District population to the State population has been
found out and the same is projected to the next two
decades assuming that the change in the ratio during
2001 -2011 and 2011-2021 is the same. In order to find
out the projected population in 2011 and 2021,the
projected population of the state for the same period
are needed. The details of population projection of
Kerala are elaborated in the Annexe 2. The projected
population of the district based on the apportionment
method is shown in Table 3.4.
Year
Tota
l po
pula
tion
Popu
latio
n G
row
th r
ate
% D
ecre
ase
in
Popu
latio
n G
row
th r
ate
1971 1856362
1981 2402701 29.43
1991 3096330 28.87 -1.91
2001 3625471 17.09 -40.8
2011 3992234 10.12 -40.8
2021 4231308 5.99 -40.8
Table 3.4: Projected Population of the District
– Apportionment method
NB: Due to the non availability of data needed, the logisticalcurve method is not attempted here.
Table 3.5: Final Projected Population
figures of the District
KeralaMalappur
am Districtx y y/x
19 71 21347375 18 5636 2 0.08719 81 25453680 24 0270 1 0.094 0.00719 91 29098518 30 9633 0 0.106 0.01220 01 31841374 36 2547 1 0.114 0.00720 11 33817196 41 0244 0 0.121 0.00720 21 35198589 45 3231 5 0.129 0.007
Year
Total populationRatio of District
population to Sate
Change in the ratio
Year
Total population as per decrease rate method
Total population as
per apportionmen
t method
Average population
figures
2011 3992234 4102440 40473372021 4231308 4532315 4381812
So it can be concluded that the total population
of Malappuram District will be 4047337 and 4381812
by 2011 and 2021 respectively if the present trend
continues.
Malappuram is the most populous district in the
state during the last two decades. Also the district
shows the highest rate of population growth. It ranks
fifth in the state in population density. Two third of
the total population live in 28.27% of the area of the
district, confined mostly to the low land and midland
areas.
3.8 INFERENCE
The projected total population by the two
methods differs slightly. The average of these two is
taken as the population figures of Malappuram District.
This is shown in Table 3.5
admin
Text Box
< CONTENTS >
admin
Text Box
CHAPTER 4 >>
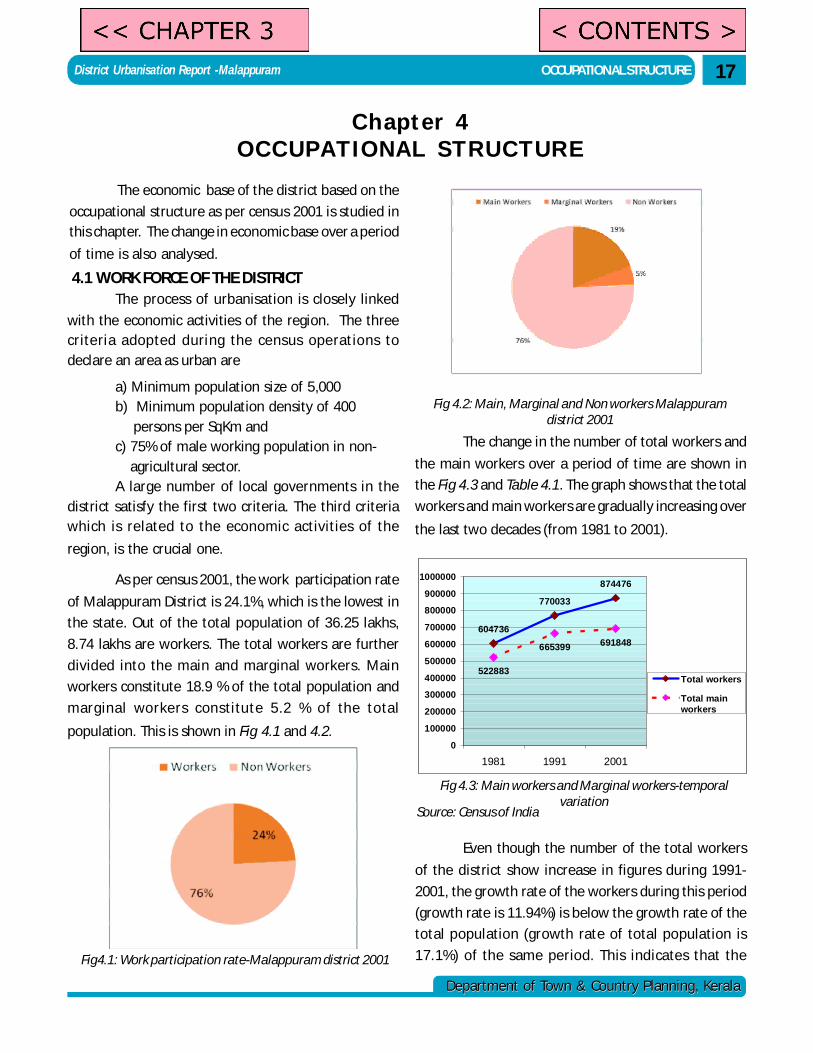
Department of Town & Country Planning, KeralaDepartment of Town & Country Planning, Kerala
District Urbanisation Report -Malappuram 17OCCUPATIONAL STRUCTURE
Chapter 4OCCUPATIONAL STRUCTURE
The economic base of the district based on the
occupational structure as per census 2001 is studied inthis chapter. The change in economic base over a period
of time is also analysed.
4.1 WORK FORCE OF THE DISTRICTThe process of urbanisation is closely linked
with the economic activities of the region. The threecriteria adopted during the census operations todeclare an area as urban are
a) Minimum population size of 5,000b) Minimum population density of 400 persons per SqKm andc) 75% of male working population in non- agricultural sector.A large number of local governments in the
district satisfy the first two criteria. The third criteriawhich is related to the economic activities of the
region, is the crucial one.
As per census 2001, the work participation rate
of Malappuram District is 24.1%, which is the lowest in
the state. Out of the total population of 36.25 lakhs,
8.74 lakhs are workers. The total workers are further
divided into the main and marginal workers. Main
workers constitute 18.9 % of the total population and
marginal workers constitute 5.2 % of the total
population. This is shown in Fig 4.1 and 4.2.
Fig4.1: Work participation rate-Malappuram district 2001
Fig 4.2: Main, Marginal and Non workers Malappuramdistrict 2001
The change in the number of total workers and
the main workers over a period of time are shown in
the Fig 4.3 and Table 4.1. The graph shows that the total
workers and main workers are gradually increasing over
the last two decades (from 1981 to 2001).
604736
770033
874476
522883
665399 691848
0
100000
200000
300000
400000
500000
600000
700000
800000
900000
1000000
1981 1991 2001
Total workers
Total mainworkers
Fig 4.3: Main workers and Marginal workers-temporalvariation
Source: Census of India
Even though the number of the total workers
of the district show increase in figures during 1991-
2001, the growth rate of the workers during this period
(growth rate is 11.94%) is below the growth rate of the
total population (growth rate of total population is
17.1%) of the same period. This indicates that the
admin
Text Box
<< CHAPTER 3
admin
Text Box
< CONTENTS >
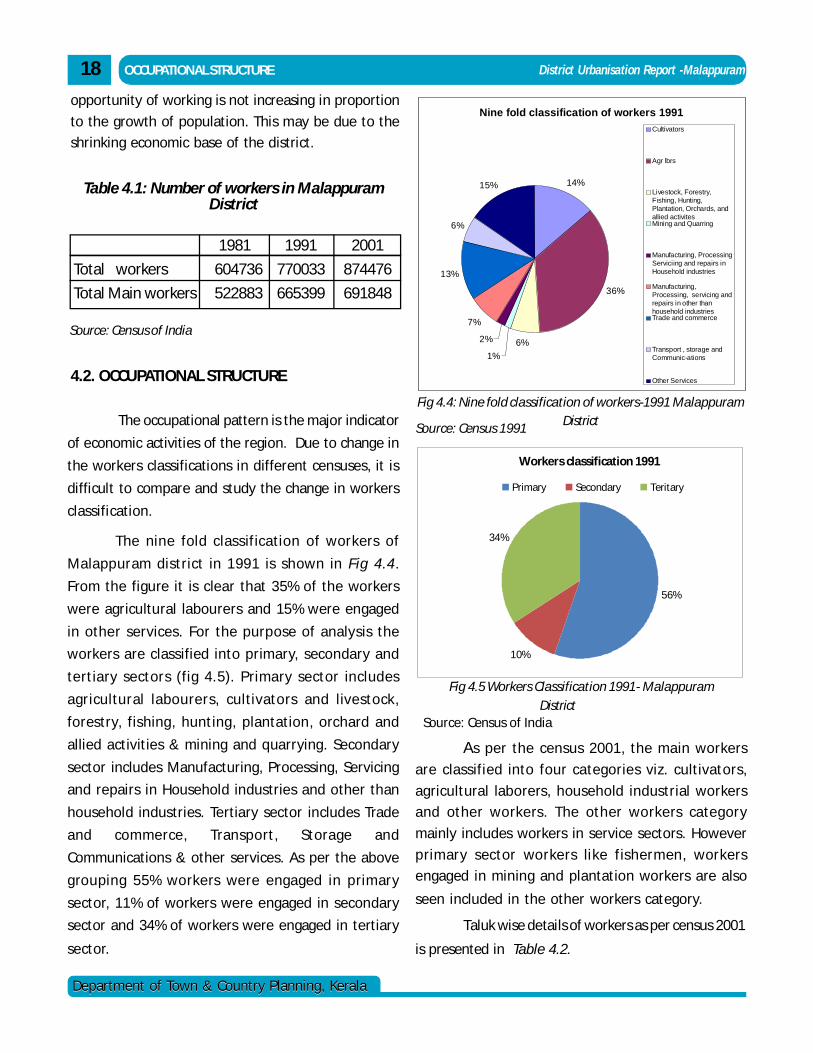
Department of Town & Country Planning, KeralaDepartment of Town & Country Planning, Kerala
District Urbanisation Report -Malappuram18 OCCUPATIONAL STRUCTURE
Table 4.1: Number of workers in MalappuramDistrict
4.2. OCCUPATIONAL STRUCTURE
The occupational pattern is the major indicator
of economic activities of the region. Due to change in
the workers classifications in different censuses, it is
difficult to compare and study the change in workers
classification.
The nine fold classification of workers of
Malappuram district in 1991 is shown in Fig 4.4.
From the figure it is clear that 35% of the workers
were agricultural labourers and 15% were engaged
in other services. For the purpose of analysis the
workers are classified into primary, secondary and
tertiary sectors (fig 4.5). Primary sector includes
agricultural labourers, cultivators and livestock,
forestry, fishing, hunting, plantation, orchard and
allied activities & mining and quarrying. Secondary
sector includes Manufacturing, Processing, Servicing
and repairs in Household industries and other than
household industries. Tertiary sector includes Trade
and commerce, Transport, Storage and
Communications & other services. As per the above
grouping 55% workers were engaged in primary
sector, 11% of workers were engaged in secondary
sector and 34% of workers were engaged in tertiary
sector.
Source: Census of India
2001
874476
691848
Total workers
Total Main workers
1981
604736
522883
1991
770033
665399
Nine fold classification of workers 1991
14%
36%
6%1%
2%
7%
13%
6%
15%
Cultivators
Agr lbrs
Livestock, Forestry,Fishing, Hunting,Plantation, Orchards, andallied activites Mining and Quarring
Manufacturing, ProcessingServiciing and repairs in Household industries
Manufacturing,Processing, servicing andrepairs in other thanhousehold industriesTrade and commerce
Transport , storage andCommunic-ations
Other Services
Fig 4.4: Nine fold classification of workers-1991 MalappuramDistrict
Workers classification 1991
56%
10%
34%
Primary Secondary Teritary
Fig 4.5 Workers Classification 1991- MalappuramDistrict
As per the census 2001, the main workers
are classified into four categories viz. cultivators,
agricultural laborers, household industrial workers
and other workers. The other workers category
mainly includes workers in service sectors. However
primary sector workers like fishermen, workers
engaged in mining and plantation workers are also
seen included in the other workers category.
opportunity of working is not increasing in proportion
to the growth of population. This may be due to the
shrinking economic base of the district.
Source: Census 1991
Source: Census of India
Taluk wise details of workers as per census 2001
is presented in Table 4.2.
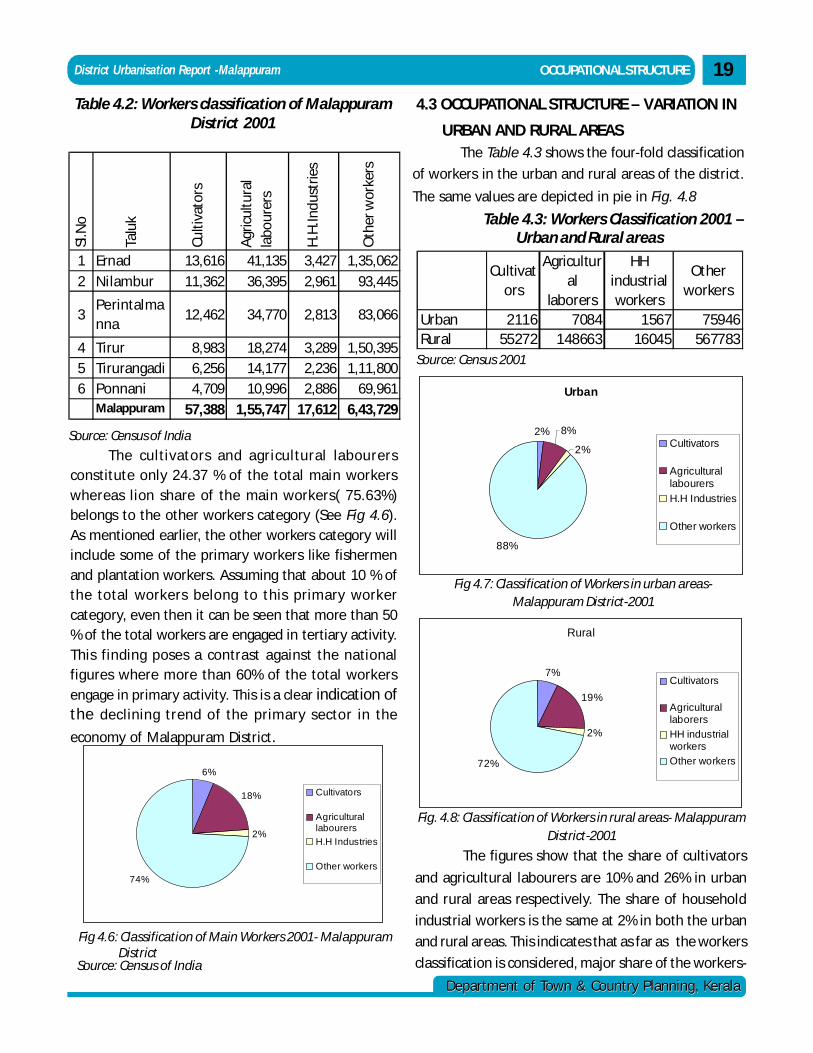
Department of Town & Country Planning, KeralaDepartment of Town & Country Planning, Kerala
District Urbanisation Report -Malappuram
Table 4.2: Workers classification of MalappuramDistrict 2001
Sl.N
o
Talu
k
Culti
vato
rs
Agr
icul
tura
l la
bour
ers
H.H
.Indu
strie
s
Oth
er w
orke
rs
1 Ernad 13,616 41,135 3,427 1,35,0622 Nilambur 11,362 36,395 2,961 93,445
3Perintalmanna
12,462 34,770 2,813 83,066
4 Tirur 8,983 18,274 3,289 1,50,3955 Tirurangadi 6,256 14,177 2,236 1,11,8006 Ponnani 4,709 10,996 2,886 69,961
Malappuram Dist
57,388 1,55,747 17,612 6,43,729
Source: Census of India
The cultivators and agricultural labourersconstitute only 24.37 % of the total main workerswhereas lion share of the main workers( 75.63%)belongs to the other workers category (See Fig 4.6).As mentioned earlier, the other workers category willinclude some of the primary workers like fishermenand plantation workers. Assuming that about 10 % ofthe total workers belong to this primary workercategory, even then it can be seen that more than 50% of the total workers are engaged in tertiary activity.This finding poses a contrast against the nationalfigures where more than 60% of the total workersengage in primary activity. This is a clear indication ofthe declining trend of the primary sector in the
economy of Malappuram District.
Urban
2% 8%
2%
88%
Cultivators
AgriculturallabourersH.H Industries
Other workers
Fig 4.7: Classification of Workers in urban areas-Malappuram District-2001
Rural
7%
19%
2%
72%
Cultivators
AgriculturallaborersHH industrialworkersOther workers
Fig. 4.8: Classification of Workers in rural areas- MalappuramDistrict-2001
6%
18%
2%
74%
Cultivators
AgriculturallabourersH.H Industries
Other workers
Fig 4.6: Classification of Main Workers 2001- Malappuram District
Source: Census of India
4.3 OCCUPATIONAL STRUCTURE – VARIATION IN
URBAN AND RURAL AREASThe Table 4.3 shows the four-fold classification
of workers in the urban and rural areas of the district.
The same values are depicted in pie in Fig. 4.8
Table 4.3: Workers Classification 2001 –Urban and Rural areas
Cultivators
Agricultural
laborers
HH industrial workers
Other workers
Urban 2116 7084 1567 75946Rural 55272 148663 16045 567783
Source: Census 2001
The figures show that the share of cultivators
and agricultural labourers are 10% and 26% in urban
and rural areas respectively. The share of household
industrial workers is the same at 2% in both the urban
and rural areas. This indicates that as far as the workers
classification is considered, major share of the workers-
OCCUPATIONAL STRUCTURE 19
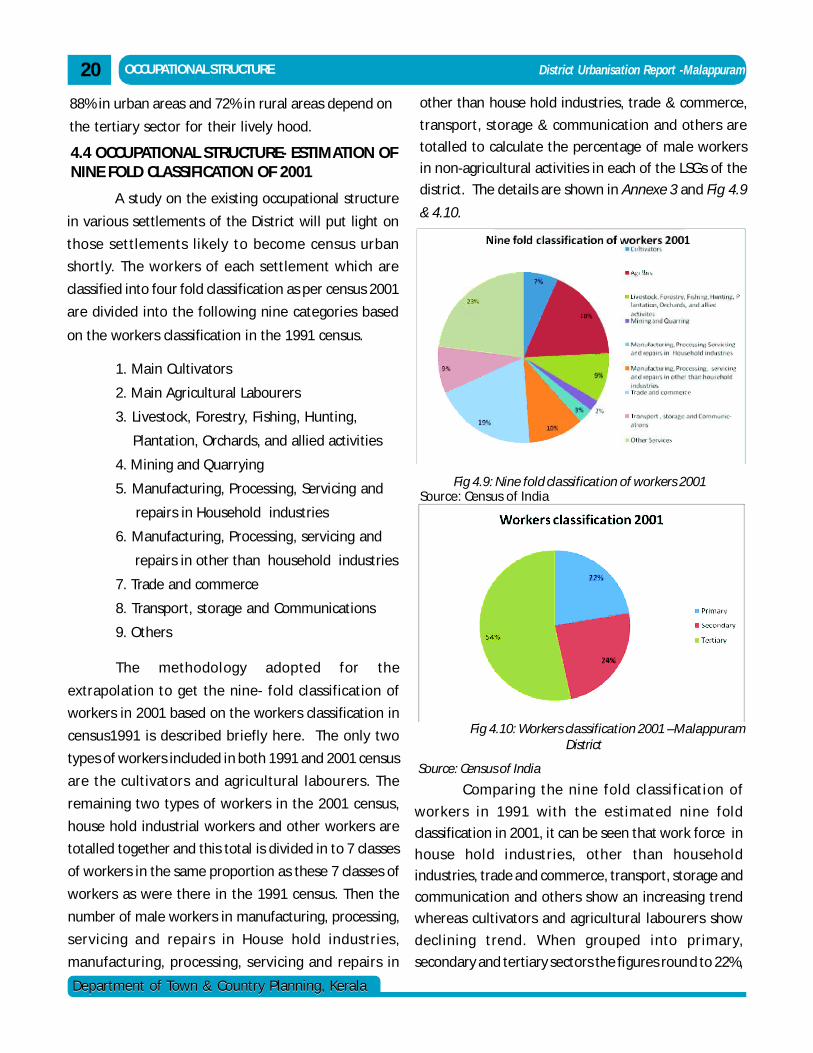
Department of Town & Country Planning, KeralaDepartment of Town & Country Planning, Kerala
District Urbanisation Report -Malappuram20 OCCUPATIONAL STRUCTURE
4.4 OCCUPATIONAL STRUCTURE- ESTIMATION OFNINE FOLD CLASSIFICATION OF 2001
A study on the existing occupational structure
in various settlements of the District will put light on
those settlements likely to become census urban
shortly. The workers of each settlement which are
classified into four fold classification as per census 2001
are divided into the following nine categories based
on the workers classification in the 1991 census.
1. Main Cultivators
2. Main Agricultural Labourers
3. Livestock, Forestry, Fishing, Hunting,
Plantation, Orchards, and allied activities
4. Mining and Quarrying
5. Manufacturing, Processing, Servicing and
repairs in Household industries
6. Manufacturing, Processing, servicing and
repairs in other than household industries
7. Trade and commerce
8. Transport, storage and Communications
9. Others
The methodology adopted for the
extrapolation to get the nine- fold classification of
workers in 2001 based on the workers classification in
census1991 is described briefly here. The only two
types of workers included in both 1991 and 2001 census
are the cultivators and agricultural labourers. The
remaining two types of workers in the 2001 census,
house hold industrial workers and other workers are
totalled together and this total is divided in to 7 classes
of workers in the same proportion as these 7 classes of
workers as were there in the 1991 census. Then the
number of male workers in manufacturing, processing,
servicing and repairs in House hold industries,
manufacturing, processing, servicing and repairs in
Fig 4.9: Nine fold classification of workers 2001
Fig 4.10: Workers classification 2001 –MalappuramDistrict
Source: Census of India
other than house hold industries, trade & commerce,
transport, storage & communication and others are
totalled to calculate the percentage of male workers
in non-agricultural activities in each of the LSGs of the
district. The details are shown in Annexe 3 and Fig 4.9
& 4.10.
Comparing the nine fold classification of
workers in 1991 with the estimated nine fold
classification in 2001, it can be seen that work force in
house hold industries, other than household
industries, trade and commerce, transport, storage and
communication and others show an increasing trend
whereas cultivators and agricultural labourers show
declining trend. When grouped into primary,
secondary and tertiary sectors the figures round to 22%,
88% in urban areas and 72% in rural areas depend on
the tertiary sector for their lively hood.
Source: Census of India
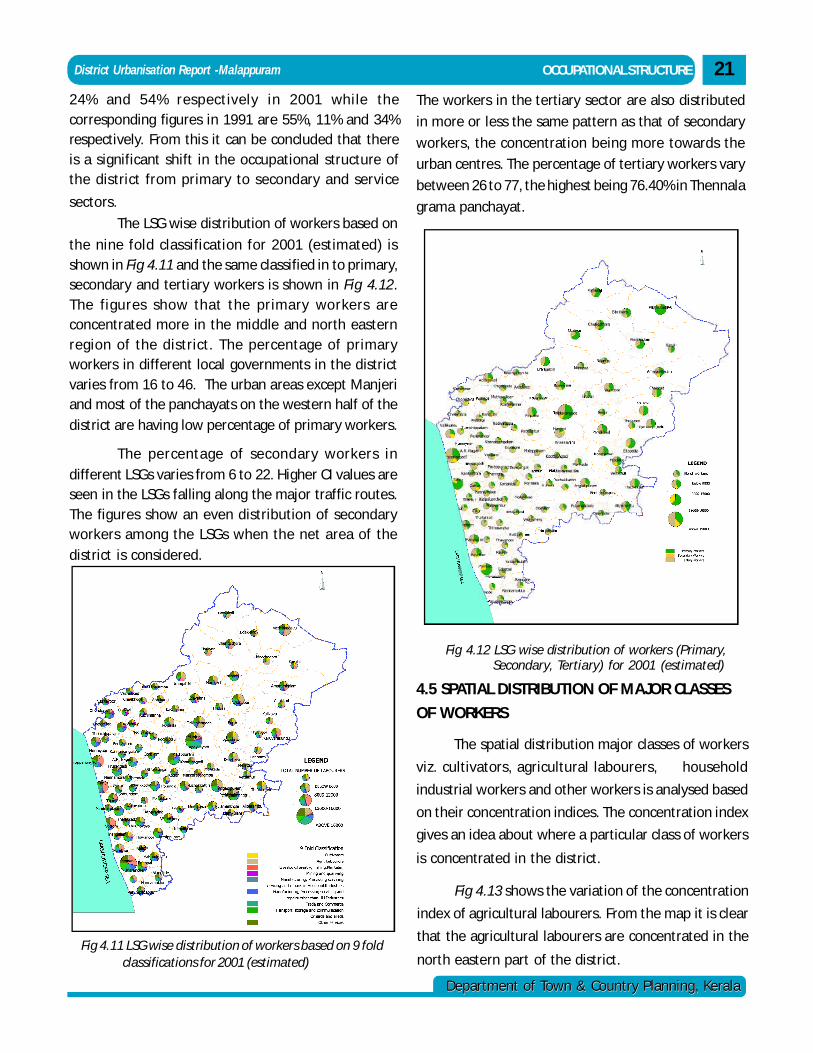
Department of Town & Country Planning, KeralaDepartment of Town & Country Planning, Kerala
District Urbanisation Report -Malappuram
Fig 4.11 LSG wise distribution of workers based on 9 fold
21OCCUPATIONAL STRUCTURE
The LSG wise distribution of workers based on
the nine fold classification for 2001 (estimated) isshown in Fig 4.11 and the same classified in to primary,secondary and tertiary workers is shown in Fig 4.12.The figures show that the primary workers areconcentrated more in the middle and north easternregion of the district. The percentage of primaryworkers in different local governments in the districtvaries from 16 to 46. The urban areas except Manjeriand most of the panchayats on the western half of thedistrict are having low percentage of primary workers.
The percentage of secondary workers indifferent LSGs varies from 6 to 22. Higher CI values areseen in the LSGs falling along the major traffic routes.The figures show an even distribution of secondaryworkers among the LSGs when the net area of thedistrict is considered.
Fig 4.12 LSG wise distribution of workers (Primary,Secondary, Tertiary) for 2001 (estimated)
classifications for 2001 (estimated)
24% and 54% respectively in 2001 while thecorresponding figures in 1991 are 55%, 11% and 34%respectively. From this it can be concluded that thereis a significant shift in the occupational structure ofthe district from primary to secondary and service
sectors.
The workers in the tertiary sector are also distributed
in more or less the same pattern as that of secondary
workers, the concentration being more towards the
urban centres. The percentage of tertiary workers vary
between 26 to 77, the highest being 76.40% in Thennala
grama panchayat.
4.5 SPATIAL DISTRIBUTION OF MAJOR CLASSES
OF WORKERS
The spatial distribution major classes of workers
viz. cultivators, agricultural labourers, household
industrial workers and other workers is analysed based
on their concentration indices. The concentration index
gives an idea about where a particular class of workers
is concentrated in the district.
Fig 4.13 shows the variation of the concentration
index of agricultural labourers. From the map it is clear
that the agricultural labourers are concentrated in the
north eastern part of the district.
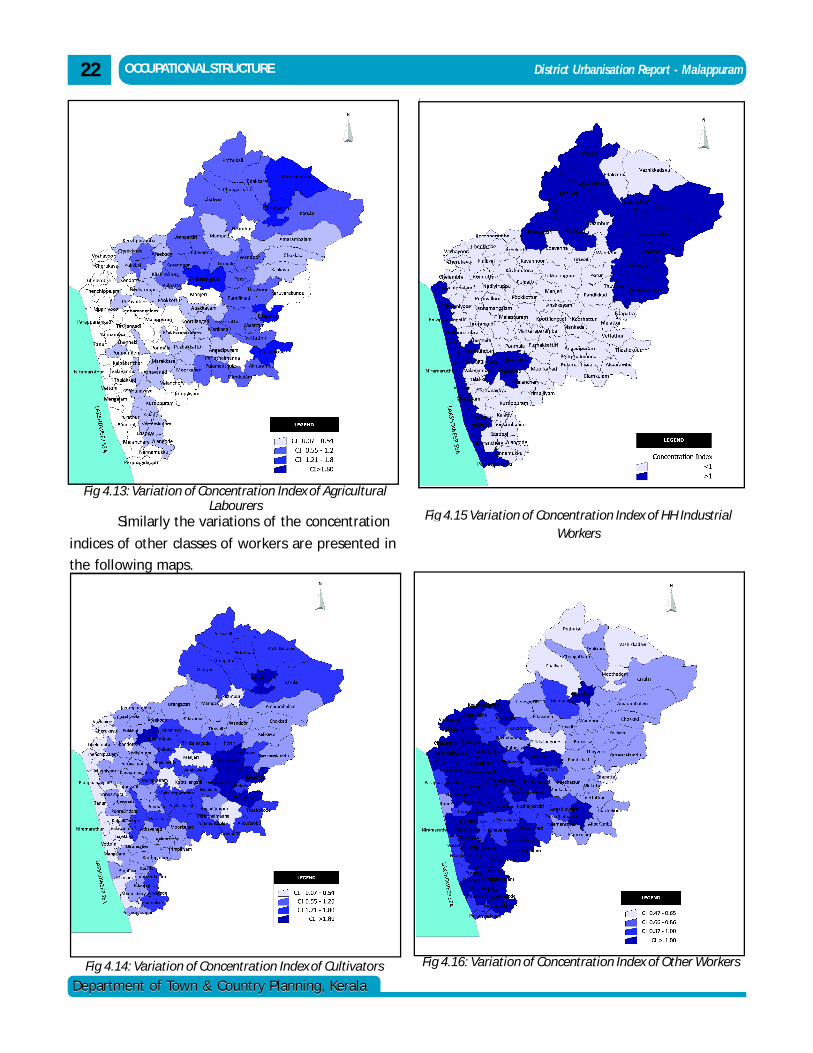
District Urbanisation Report - Malappuram
Department of Town & Country Planning, KeralaDepartment of Town & Country Planning, Kerala
Similarly the variations of the concentration
indices of other classes of workers are presented in
the following maps.
22 OCCUPATIONAL STRUCTURE
Fig 4.13: Variation of Concentration Index of AgriculturalLabourers
Fig 4.14: Variation of Concentration Index of Cultivators
Fig 4.15 Variation of Concentration Index of HH IndustrialWorkers
Fig 4.16: Variation of Concentration Index of Other Workers
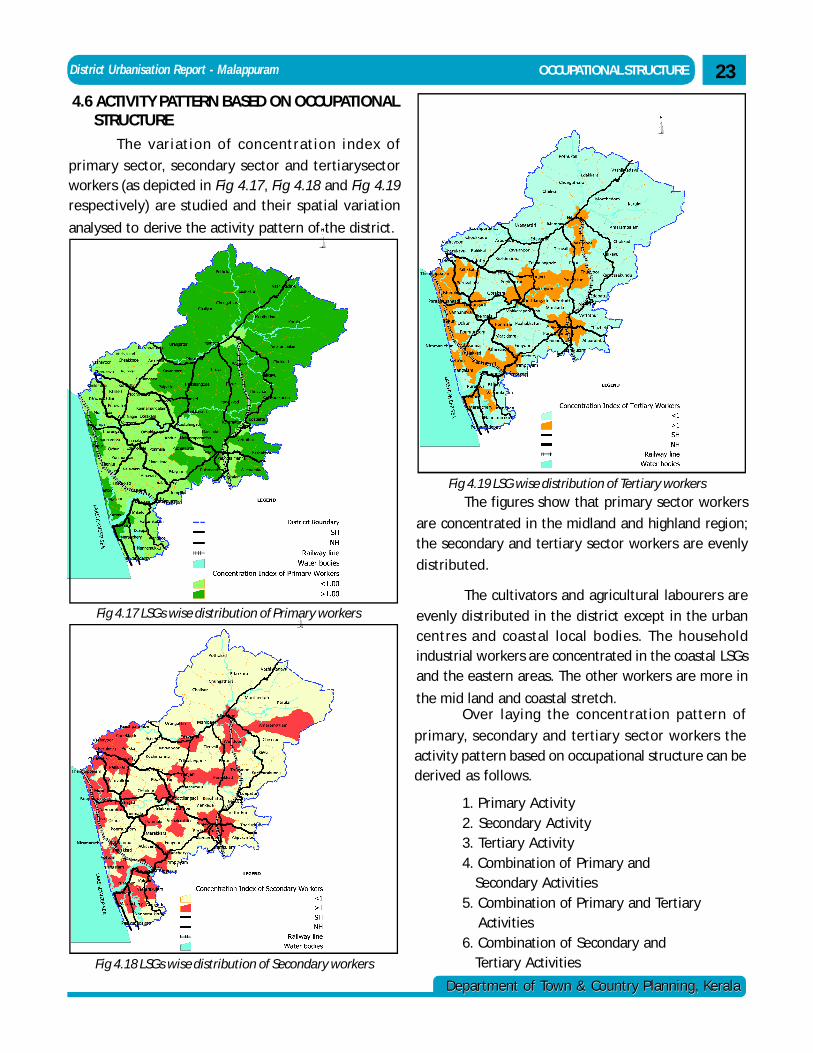
District Urbanisation Report - Malappuram
Department of Town & Country Planning, KeralaDepartment of Town & Country Planning, Kerala
23OCCUPATIONAL STRUCTURE
The variation of concentration index of
primary sector, secondary sector and tertiarysectorworkers (as depicted in Fig 4.17, Fig 4.18 and Fig 4.19respectively) are studied and their spatial variation
analysed to derive the activity pattern of the district.
Fig 4.17 LSGs wise distribution of Primary workers
Fig 4.18 LSGs wise distribution of Secondary workers
Fig 4.19 LSG wise distribution of Tertiary workersThe figures show that primary sector workers
are concentrated in the midland and highland region;the secondary and tertiary sector workers are evenly
distributed.
The cultivators and agricultural labourers areevenly distributed in the district except in the urbancentres and coastal local bodies. The householdindustrial workers are concentrated in the coastal LSGsand the eastern areas. The other workers are more in
the mid land and coastal stretch.Over laying the concentration pattern of
primary, secondary and tertiary sector workers theactivity pattern based on occupational structure can bederived as follows.
1. Primary Activity2. Secondary Activity3. Tertiary Activity4. Combination of Primary and Secondary Activities5. Combination of Primary and Tertiary Activities6. Combination of Secondary and Tertiary Activities
4.6 ACTIVITY PATTERN BASED ON OCCUPATIONALSTRUCTURE
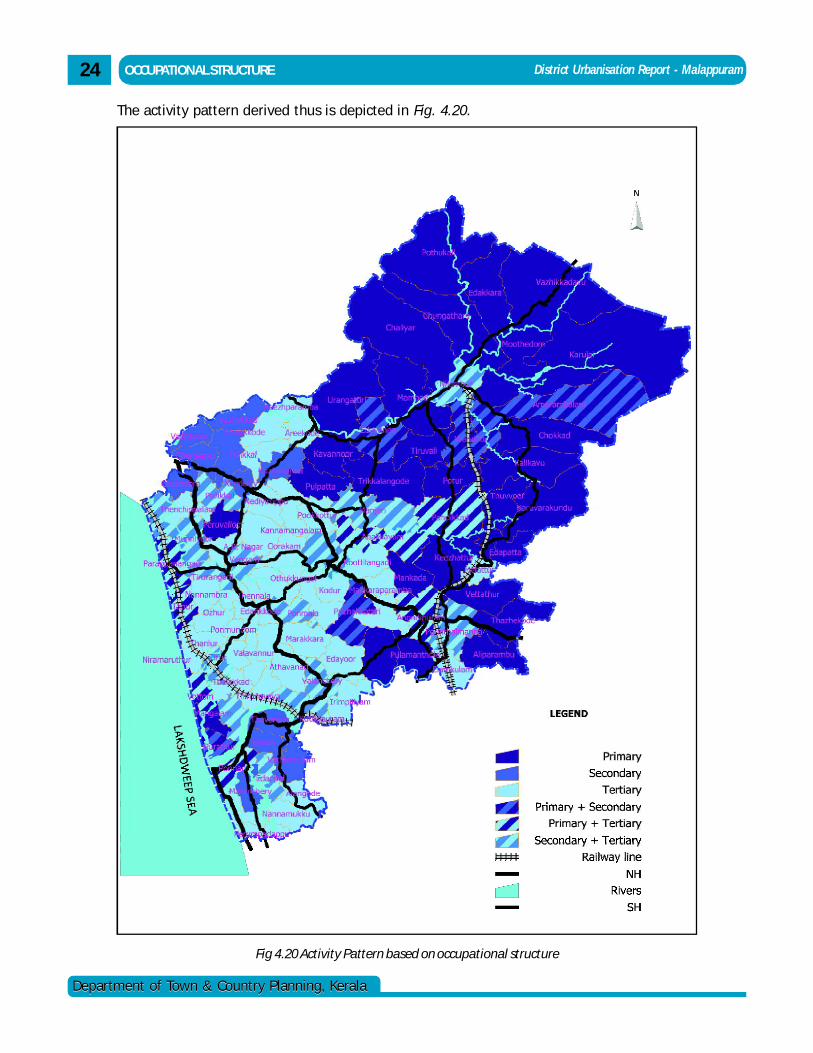
District Urbanisation Report - Malappuram
Department of Town & Country Planning, KeralaDepartment of Town & Country Planning, Kerala
24 OCCUPATIONAL STRUCTURE
The activity pattern derived thus is depicted in Fig. 4.20.
Fig 4.20 Activity Pattern based on occupational structure
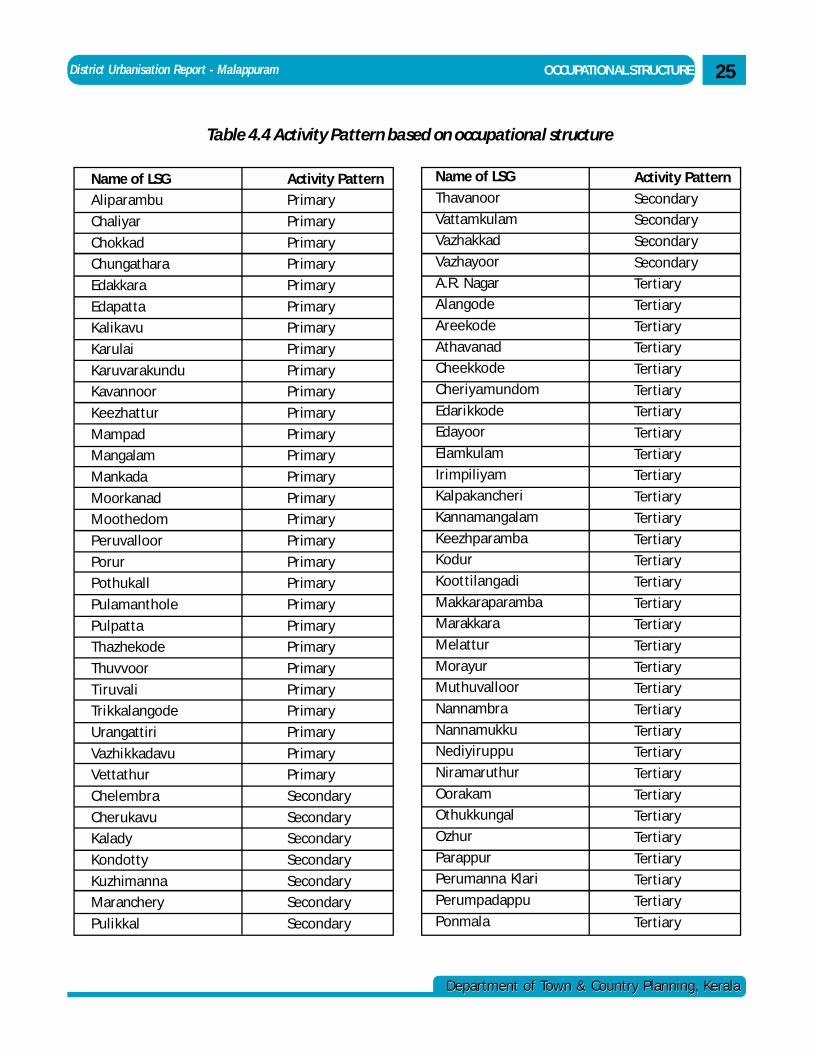
District Urbanisation Report - Malappuram
Department of Town & Country Planning, KeralaDepartment of Town & Country Planning, Kerala
25OCCUPATIONAL STRUCTURE
Table 4.4 Activity Pattern based on occupational structure
Activity Pattern
Secondary
Secondary
Secondary
Secondary
Tertiary
Tertiary
Tertiary
Tertiary
Tertiary
Tertiary
Tertiary
Tertiary
Tertiary
Tertiary
Tertiary
Tertiary
Tertiary
Tertiary
Tertiary
Tertiary
Tertiary
Tertiary
Tertiary
Tertiary
Tertiary
Tertiary
Tertiary
Tertiary
Tertiary
Tertiary
Tertiary
Tertiary
Tertiary
Tertiary
Tertiary
Name of LSG
Thavanoor
Vattamkulam
Vazhakkad
Vazhayoor
A.R. Nagar
Alangode
Areekode
Athavanad
Cheekkode
Cheriyamundom
Edarikkode
Edayoor
Elamkulam
Irimpiliyam
Kalpakancheri
Kannamangalam
Keezhparamba
Kodur
Koottilangadi
Makkaraparamba
Marakkara
Melattur
Morayur
Muthuvalloor
Nannambra
Nannamukku
Nediyiruppu
Niramaruthur
Oorakam
Othukkungal
Ozhur
Parappur
Perumanna Klari
Perumpadappu
Ponmala
Name of LSG
Aliparambu
Chaliyar
Chokkad
Chungathara
Edakkara
Edapatta
Kalikavu
Karulai
Karuvarakundu
Kavannoor
Keezhattur
Mampad
Mangalam
Mankada
Moorkanad
Moothedom
Peruvalloor
Porur
Pothukall
Pulamanthole
Pulpatta
Thazhekode
Thuvvoor
Tiruvali
Trikkalangode
Urangattiri
Vazhikkadavu
Vettathur
Chelembra
Cherukavu
Kalady
Kondotty
Kuzhimanna
Maranchery
Pulikkal
Activity Pattern
Primary
Primary
Primary
Primary
Primary
Primary
Primary
Primary
Primary
Primary
Primary
Primary
Primary
Primary
Primary
Primary
Primary
Primary
Primary
Primary
Primary
Primary
Primary
Primary
Primary
Primary
Primary
Primary
Secondary
Secondary
Secondary
Secondary
Secondary
Secondary
Secondary
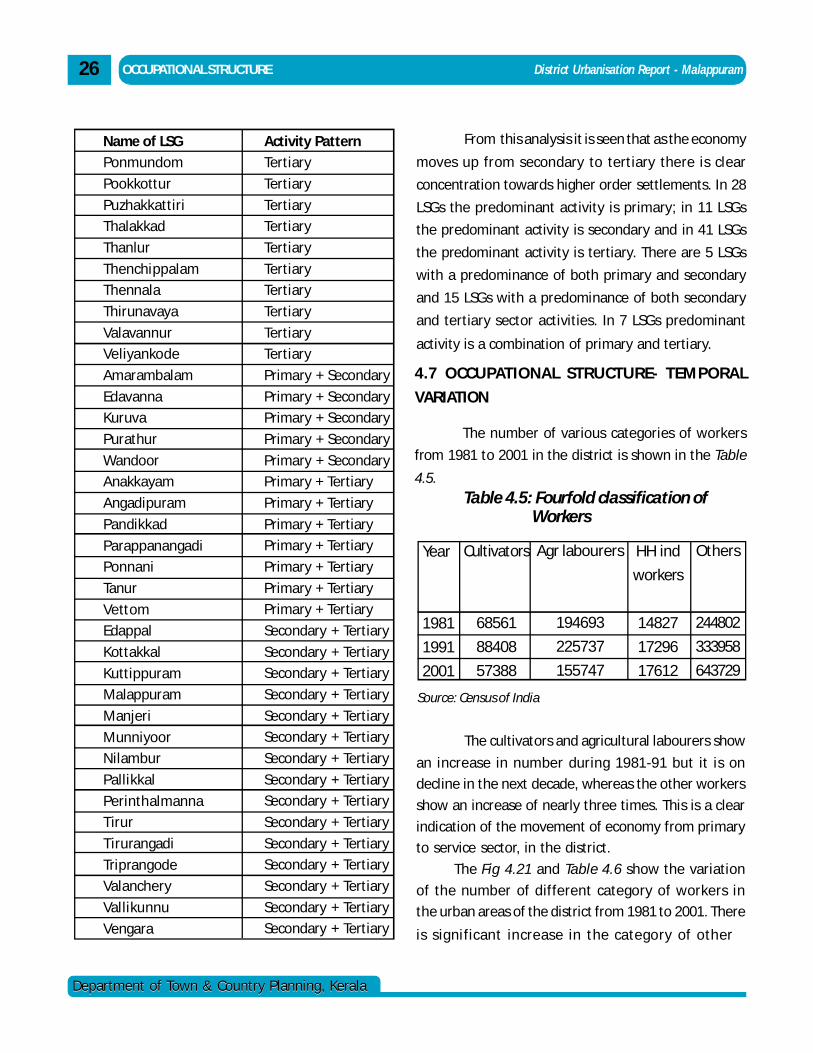
District Urbanisation Report - Malappuram
Department of Town & Country Planning, KeralaDepartment of Town & Country Planning, Kerala
OCCUPATIONAL STRUCTURE26
From this analysis it is seen that as the economy
moves up from secondary to tertiary there is clear
concentration towards higher order settlements. In 28
LSGs the predominant activity is primary; in 11 LSGs
the predominant activity is secondary and in 41 LSGs
the predominant activity is tertiary. There are 5 LSGs
with a predominance of both primary and secondary
and 15 LSGs with a predominance of both secondary
and tertiary sector activities. In 7 LSGs predominant
activity is a combination of primary and tertiary.
4.7 OCCUPATIONAL STRUCTURE- TEMPORAL
VARIATION
The number of various categories of workers
from 1981 to 2001 in the district is shown in the Table
4.5.
The cultivators and agricultural labourers show
an increase in number during 1981-91 but it is on
decline in the next decade, whereas the other workers
show an increase of nearly three times. This is a clear
indication of the movement of economy from primary
to service sector, in the district.
The Fig 4.21 and Table 4.6 show the variation
of the number of different category of workers in
the urban areas of the district from 1981 to 2001. There
is significant increase in the category of other
Source: Census of India
Table 4.5: Fourfold classification ofWorkers
Year
1981
1991
2001
Cultivators
68561
88408
57388
HH ind
workers
14827
17296
17612
Others
244802
333958
643729
Agr labourers
194693
225737
155747
Activity Pattern
Tertiary
Tertiary
Tertiary
Tertiary
Tertiary
Tertiary
Tertiary
Tertiary
Tertiary
Tertiary
Primary + Secondary
Primary + Secondary
Primary + Secondary
Primary + Secondary
Primary + Secondary
Primary + Tertiary
Primary + Tertiary
Primary + Tertiary
Primary + Tertiary
Primary + Tertiary
Primary + Tertiary
Primary + Tertiary
Secondary + Tertiary
Secondary + Tertiary
Secondary + Tertiary
Secondary + Tertiary
Secondary + Tertiary
Secondary + Tertiary
Secondary + Tertiary
Secondary + Tertiary
Secondary + Tertiary
Secondary + Tertiary
Secondary + Tertiary
Secondary + Tertiary
Secondary + Tertiary
Secondary + Tertiary
Secondary + Tertiary
Name of LSG
Ponmundom
Pookkottur
Puzhakkattiri
Thalakkad
Thanlur
Thenchippalam
Thennala
Thirunavaya
Valavannur
Veliyankode
Amarambalam
Edavanna
Kuruva
Purathur
Wandoor
Anakkayam
Angadipuram
Pandikkad
Parappanangadi
Ponnani
Tanur
Vettom
Edappal
Kottakkal
Kuttippuram
Malappuram
Manjeri
Munniyoor
Nilambur
Pallikkal
Perinthalmanna
Tirur
Tirurangadi
Triprangode
Valanchery
Vallikunnu
Vengara
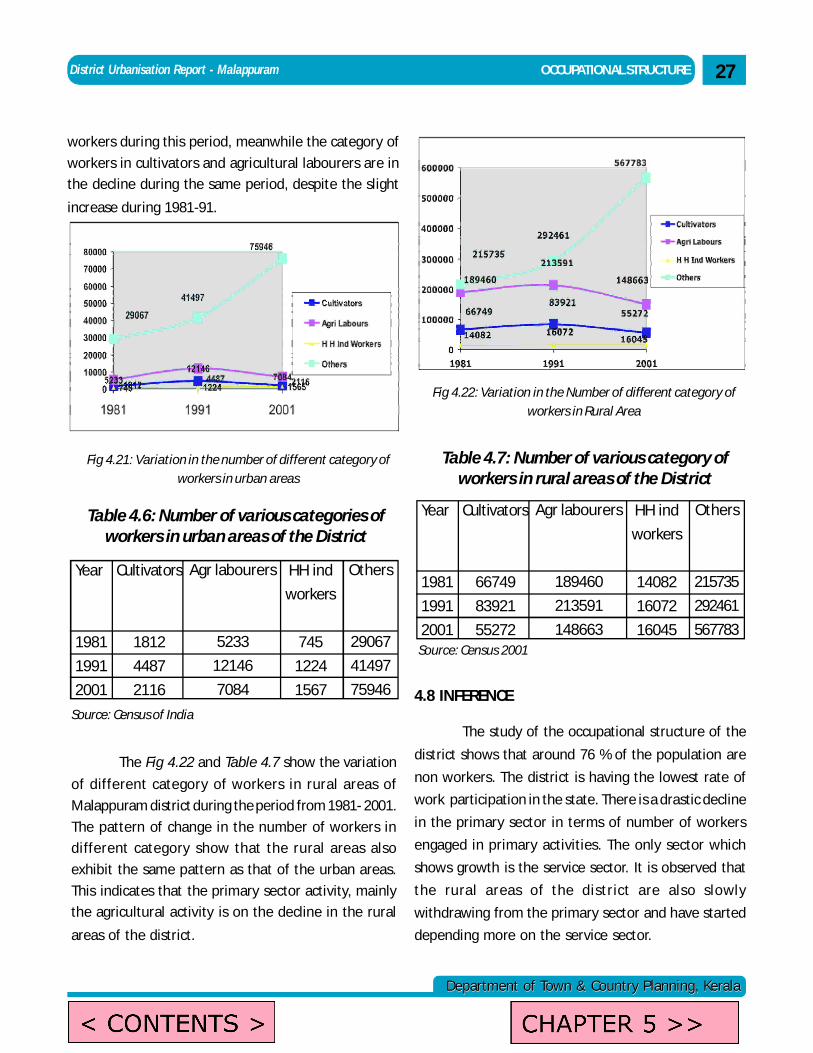
District Urbanisation Report - Malappuram
Department of Town & Country Planning, KeralaDepartment of Town & Country Planning, Kerala
27OCCUPATIONAL STRUCTURE
Table 4.7: Number of various category ofworkers in rural areas of the District
4.8 INFERENCE
The study of the occupational structure of the
district shows that around 76 % of the population are
non workers. The district is having the lowest rate of
work participation in the state. There is a drastic decline
in the primary sector in terms of number of workers
engaged in primary activities. The only sector which
shows growth is the service sector. It is observed that
the rural areas of the district are also slowly
withdrawing from the primary sector and have started
depending more on the service sector.
Table 4.6: Number of various categories ofworkers in urban areas of the District
Source: Census of India
The Fig 4.22 and Table 4.7 show the variation
of different category of workers in rural areas of
Malappuram district during the period from 1981- 2001.
The pattern of change in the number of workers in
different category show that the rural areas also
exhibit the same pattern as that of the urban areas.
This indicates that the primary sector activity, mainly
the agricultural activity is on the decline in the rural
areas of the district.
Fig 4.22: Variation in the Number of different category ofworkers in Rural Area
Fig 4.21: Variation in the number of different category ofworkers in urban areas
workers during this period, meanwhile the category of
workers in cultivators and agricultural labourers are in
the decline during the same period, despite the slight
increase during 1981-91.
Year
1981
1991
2001
Cultivators
66749
83921
55272
HH ind
workers
14082
16072
16045
Others
215735
292461
567783
Agr labourers
189460
213591
148663Source: Census 2001
Year
1981
1991
2001
Cultivators
1812
4487
2116
HH ind
workers
745
1224
1567
Others
29067
41497
75946
Agr labourers
5233
12146
7084
admin
Text Box
CHAPTER 5 >>
admin
Text Box
< CONTENTS >
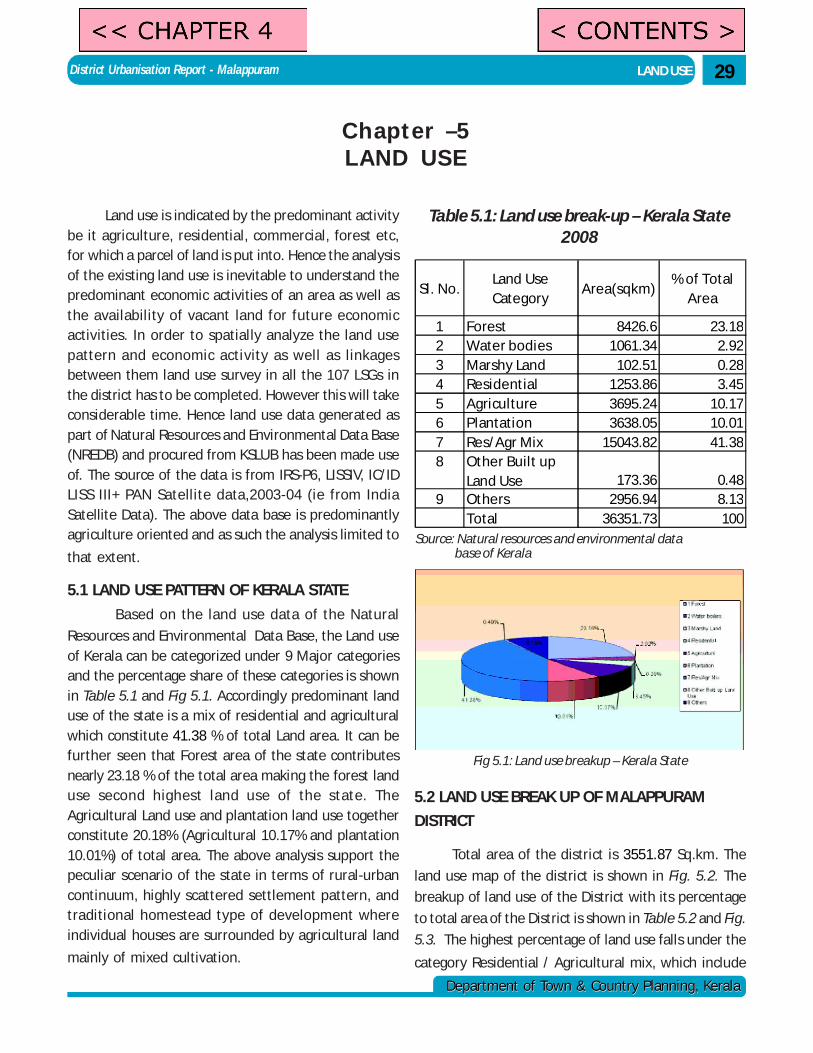
District Urbanisation Report - Malappuram
Department of Town & Country Planning, KeralaDepartment of Town & Country Planning, Kerala
Chapter –5LAND USE
Land use is indicated by the predominant activitybe it agriculture, residential, commercial, forest etc,for which a parcel of land is put into. Hence the analysisof the existing land use is inevitable to understand thepredominant economic activities of an area as well asthe availability of vacant land for future economicactivities. In order to spatially analyze the land usepattern and economic activity as well as linkagesbetween them land use survey in all the 107 LSGs inthe district has to be completed. However this will takeconsiderable time. Hence land use data generated aspart of Natural Resources and Environmental Data Base(NREDB) and procured from KSLUB has been made useof. The source of the data is from IRS-P6, LISSIV, IC/IDLISS III+ PAN Satellite data,2003-04 (ie from IndiaSatellite Data). The above data base is predominantlyagriculture oriented and as such the analysis limited to
that extent.
5.1 LAND USE PATTERN OF KERALA STATE
Based on the land use data of the Natural
Resources and Environmental Data Base, the Land useof Kerala can be categorized under 9 Major categoriesand the percentage share of these categories is shownin Table 5.1 and Fig 5.1. Accordingly predominant landuse of the state is a mix of residential and agriculturalwhich constitute 41.38 % of total Land area. It can befurther seen that Forest area of the state contributesnearly 23.18 % of the total area making the forest landuse second highest land use of the state. TheAgricultural Land use and plantation land use togetherconstitute 20.18% (Agricultural 10.17% and plantation10.01%) of total area. The above analysis support thepeculiar scenario of the state in terms of rural-urbancontinuum, highly scattered settlement pattern, andtraditional homestead type of development whereindividual houses are surrounded by agricultural land
mainly of mixed cultivation.
LAND USE 29
Sl. No.Land Use Category
Area(sqkm)% of Total
Area
1 Forest 8426.6 23.182 Water bodies 1061.34 2.923 Marshy Land 102.51 0.284 Residential 1253.86 3.455 Agriculture 3695.24 10.176 Plantation 3638.05 10.017 Res/Agr Mix 15043.82 41.388 Other Built up
Land Use 173.36 0.489 Others 2956.94 8.13
Total 36351.73 100
Table 5.1: Land use break-up – Kerala State2008
Source: Natural resources and environmental database of Kerala
Fig 5.1: Land use breakup – Kerala State
5.2 LAND USE BREAK UP OF MALAPPURAM
DISTRICT
Total area of the district is 3551.87 Sq.km. The
land use map of the district is shown in Fig. 5.2. The
breakup of land use of the District with its percentage
to total area of the District is shown in Table 5.2 and Fig.
5.3. The highest percentage of land use falls under the
category Residential / Agricultural mix, which include
admin
Text Box
< CONTENTS >
admin
Text Box
<< CHAPTER 4
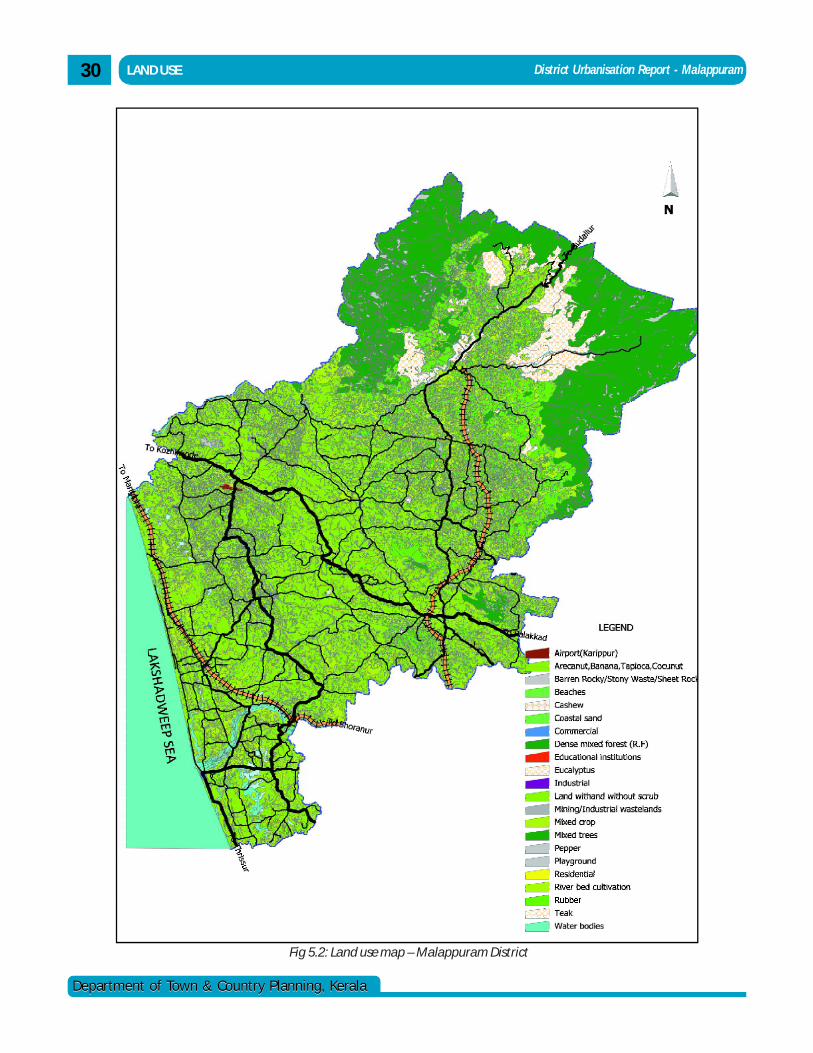
District Urbanisation Report - Malappuram
Department of Town & Country Planning, KeralaDepartment of Town & Country Planning, Kerala
LAND USE30
Fig 5.2: Land use map – Malappuram District
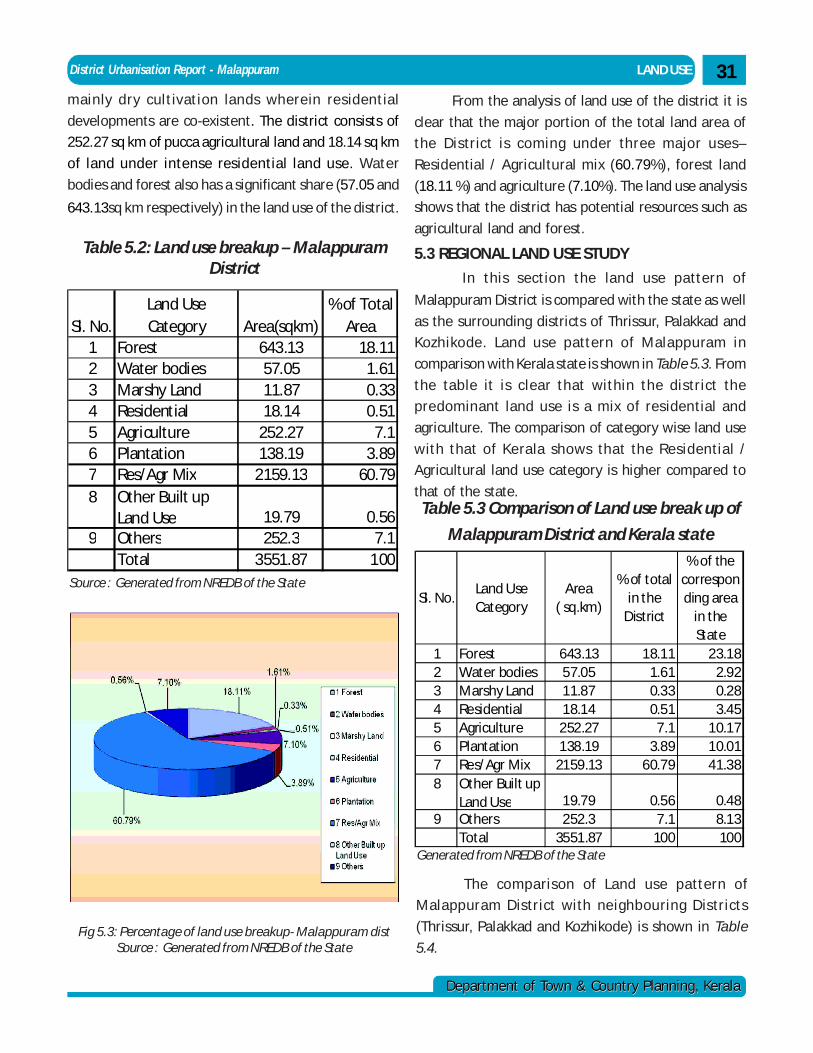
District Urbanisation Report - Malappuram
Department of Town & Country Planning, KeralaDepartment of Town & Country Planning, Kerala
Source : Generated from NREDB of the State
Fig 5.3: Percentage of land use breakup- Malappuram distSource : Generated from NREDB of the State
LAND USE 31mainly dry cultivation lands wherein residential
developments are co-existent. The district consists of
252.27 sq km of pucca agricultural land and 18.14 sq km
of land under intense residential land use. Water
bodies and forest also has a significant share (57.05 and
643.13sq km respectively) in the land use of the district.
Sl. No.Land Use Category Area(sqkm)
% of Total Area
1 Forest 643.13 18.112 Water bodies 57.05 1.613 Marshy Land 11.87 0.334 Residential 18.14 0.515 Agriculture 252.27 7.16 Plantation 138.19 3.897 Res/Agr Mix 2159.13 60.798 Other Built up
Land Use 19.79 0.569 Others 252.3 7.1
Total 3551.87 100
Table 5.2: Land use breakup – MalappuramDistrict
From the analysis of land use of the district it is
clear that the major portion of the total land area of
the District is coming under three major uses–
Residential / Agricultural mix (60.79%), forest land
(18.11 %) and agriculture (7.10%). The land use analysis
shows that the district has potential resources such as
agricultural land and forest.
5.3 REGIONAL LAND USE STUDY
In this section the land use pattern of
Malappuram District is compared with the state as well
as the surrounding districts of Thrissur, Palakkad and
Kozhikode. Land use pattern of Malappuram in
comparison with Kerala state is shown in Table 5.3. From
the table it is clear that within the district the
predominant land use is a mix of residential and
agriculture. The comparison of category wise land use
with that of Kerala shows that the Residential /
Agricultural land use category is higher compared to
that of the state.
The comparison of Land use pattern of
Malappuram District with neighbouring Districts
(Thrissur, Palakkad and Kozhikode) is shown in Table
5.4.
Generated from NREDB of the State
Sl. No.Land Use Category
Area ( sq.km)
% of total in the
District
% of the corresponding area
in the State
1 Forest 643.13 18.11 23.182 Water bodies 57.05 1.61 2.923 Marshy Land 11.87 0.33 0.284 Residential 18.14 0.51 3.455 Agriculture 252.27 7.1 10.176 Plantation 138.19 3.89 10.017 Res/Agr Mix 2159.13 60.79 41.388 Other Built up
Land Use 19.79 0.56 0.489 Others 252.3 7.1 8.13
Total 3551.87 100 100
Table 5.3 Comparison of Land use break up of
Malappuram District and Kerala state
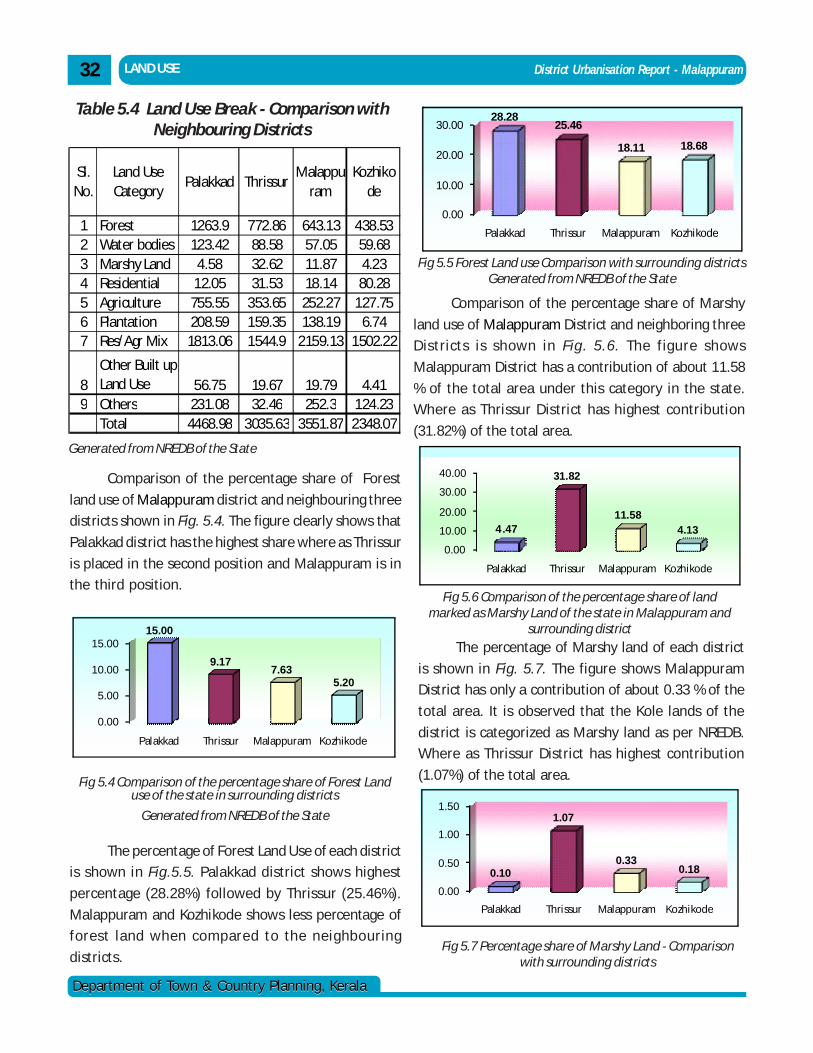
District Urbanisation Report - Malappuram
Department of Town & Country Planning, KeralaDepartment of Town & Country Planning, Kerala
LAND USE32
Sl. No.
Land Use Category
Palakkad ThrissurMalappu
ramKozhiko
de
1 Forest 1263.9 772.86 643.13 438.532 Water bodies 123.42 88.58 57.05 59.683 Marshy Land 4.58 32.62 11.87 4.234 Residential 12.05 31.53 18.14 80.285 Agriculture 755.55 353.65 252.27 127.756 Plantation 208.59 159.35 138.19 6.747 Res/Agr Mix 1813.06 1544.9 2159.13 1502.22
8Other Built up Land Use 56.75 19.67 19.79 4.41
9 Others 231.08 32.46 252.3 124.23Total 4468.98 3035.63 3551.87 2348.07
Table 5.4 Land Use Break - Comparison withNeighbouring Districts
Generated from NREDB of the State
Comparison of the percentage share of Forest
land use of Malappuram district and neighbouring three
districts shown in Fig. 5.4. The figure clearly shows that
Palakkad district has the highest share where as Thrissur
is placed in the second position and Malappuram is in
the third position.
The percentage of Forest Land Use of each district
is shown in Fig.5.5. Palakkad district shows highest
percentage (28.28%) followed by Thrissur (25.46%).
Malappuram and Kozhikode shows less percentage of
forest land when compared to the neighbouring
districts.
Fig 5.4 Comparison of the percentage share of Forest Landuse of the state in surrounding districts
Generated from NREDB of the State
Fig 5.5 Forest Land use Comparison with surrounding districtsGenerated from NREDB of the State
Comparison of the percentage share of Marshy
land use of Malappuram District and neighboring three
Districts is shown in Fig. 5.6. The figure shows
Malappuram District has a contribution of about 11.58
% of the total area under this category in the state.
Where as Thrissur District has highest contribution
(31.82%) of the total area.
Fig 5.6 Comparison of the percentage share of landmarked as Marshy Land of the state in Malappuram and
surrounding districtThe percentage of Marshy land of each district
is shown in Fig. 5.7. The figure shows Malappuram
District has only a contribution of about 0.33 % of the
total area. It is observed that the Kole lands of the
district is categorized as Marshy land as per NREDB.
Where as Thrissur District has highest contribution
(1.07%) of the total area.
Fig 5.7 Percentage share of Marshy Land - Comparisonwith surrounding districts
0.00
5.00
10.00
15.00
Palakkad Thrissur Malappuram Kozhikode
15.00
9.177.63
5.20
0.00
10.00
20.00
30.00
Palakkad Thrissur Malappuram Kozhikode
28.2825.46
18.11 18.68
0.00
10.00
20.00
30.00
40.00
Palakkad Thrissur Malappuram Kozhikode
4 .47
31.82
11.584.13
0.00
0.50
1.00
1.50
Palakkad Thrissur Malappuram Kozhikode
0.10
1.07
0.330.18
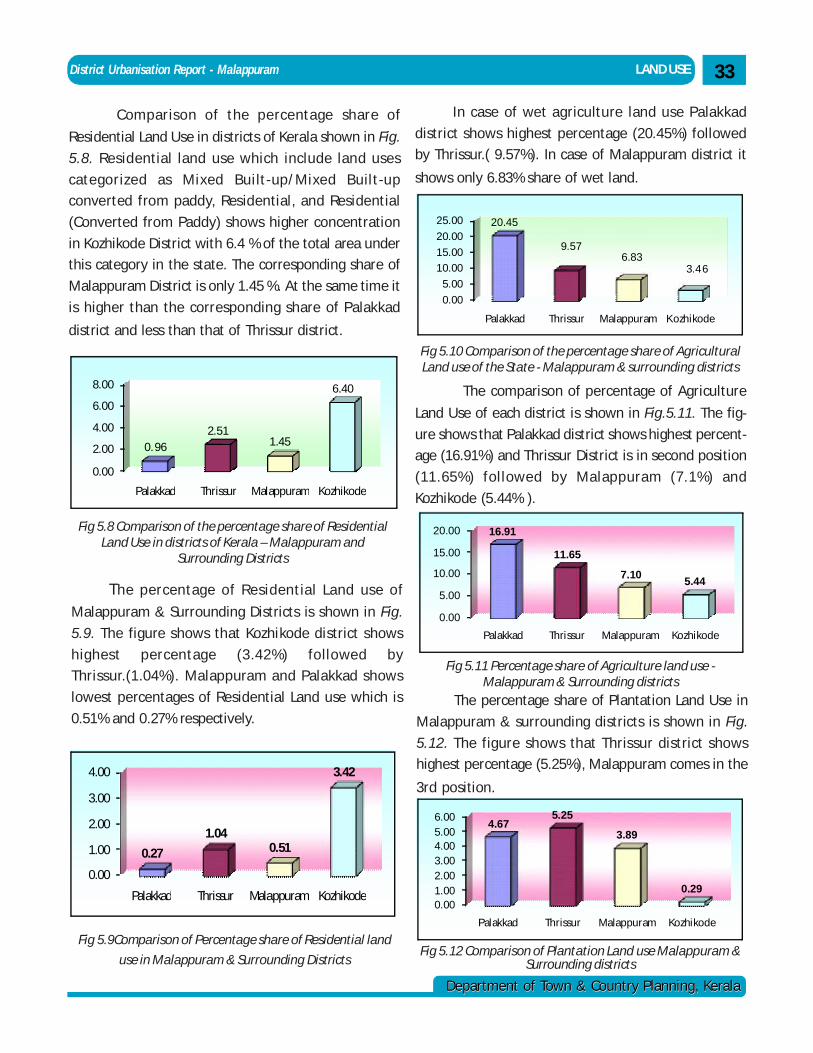
District Urbanisation Report - Malappuram
Department of Town & Country Planning, KeralaDepartment of Town & Country Planning, Kerala
LAND USE 33
Comparison of the percentage share of
Residential Land Use in districts of Kerala shown in Fig.
5.8. Residential land use which include land uses
categorized as Mixed Built-up/Mixed Built-up
converted from paddy, Residential, and Residential
(Converted from Paddy) shows higher concentration
in Kozhikode District with 6.4 % of the total area under
this category in the state. The corresponding share of
Malappuram District is only 1.45 %. At the same time it
is higher than the corresponding share of Palakkad
district and less than that of Thrissur district.
0.00
2.00
4.00
6.00
8.00
Palakkad Thrissur Malappuram Kozhikode
0.962.51
1.45
6.40
Fig 5.8 Comparison of the percentage share of ResidentialLand Use in districts of Kerala – Malappuram and
Surrounding Districts
The percentage of Residential Land use of
Malappuram & Surrounding Districts is shown in Fig.
5.9. The figure shows that Kozhikode district shows
highest percentage (3.42%) followed by
Thrissur.(1.04%). Malappuram and Palakkad shows
lowest percentages of Residential Land use which is
0.51% and 0.27% respectively.
0.00
1.00
2.00
3.00
4.00
Palakkad Thrissur Malappuram Kozhikode
0.27
1.040.51
3.42
Fig 5.9Comparison of Percentage share of Residential land
use in Malappuram & Surrounding Districts
In case of wet agriculture land use Palakkad
district shows highest percentage (20.45%) followed
by Thrissur.( 9.57%). In case of Malappuram district it
shows only 6.83% share of wet land.
0.00
5.00
10.0015.00
20.00
25.00
Palakkad Thrissur Malappuram K ozhikode
20.45
9.576.83
3.4 6
Fig 5.10 Comparison of the percentage share of AgriculturalLand use of the State - Malappuram & surrounding districts
The comparison of percentage of Agriculture
Land Use of each district is shown in Fig.5.11. The fig-
ure shows that Palakkad district shows highest percent-
age (16.91%) and Thrissur District is in second position
(11.65%) followed by Malappuram (7.1%) and
Kozhikode (5.44% ).
0.00
5.00
10.00
15.00
20.00
Palakkad Thrissur Malappuram Kozhikode
16.91
11.65
7.105.44
Fig 5.11 Percentage share of Agriculture land use -Malappuram & Surrounding districts
The percentage share of Plantation Land Use in
Malappuram & surrounding districts is shown in Fig.
5.12. The figure shows that Thrissur district shows
highest percentage (5.25%), Malappuram comes in the
3rd position.
0.001.002.003.004.005.006.00
Palakkad Thrissur Malappuram Kozhikode
4.675.25
3.89
0.29
Fig 5.12 Comparison of Plantation Land use Malappuram &Surrounding districts
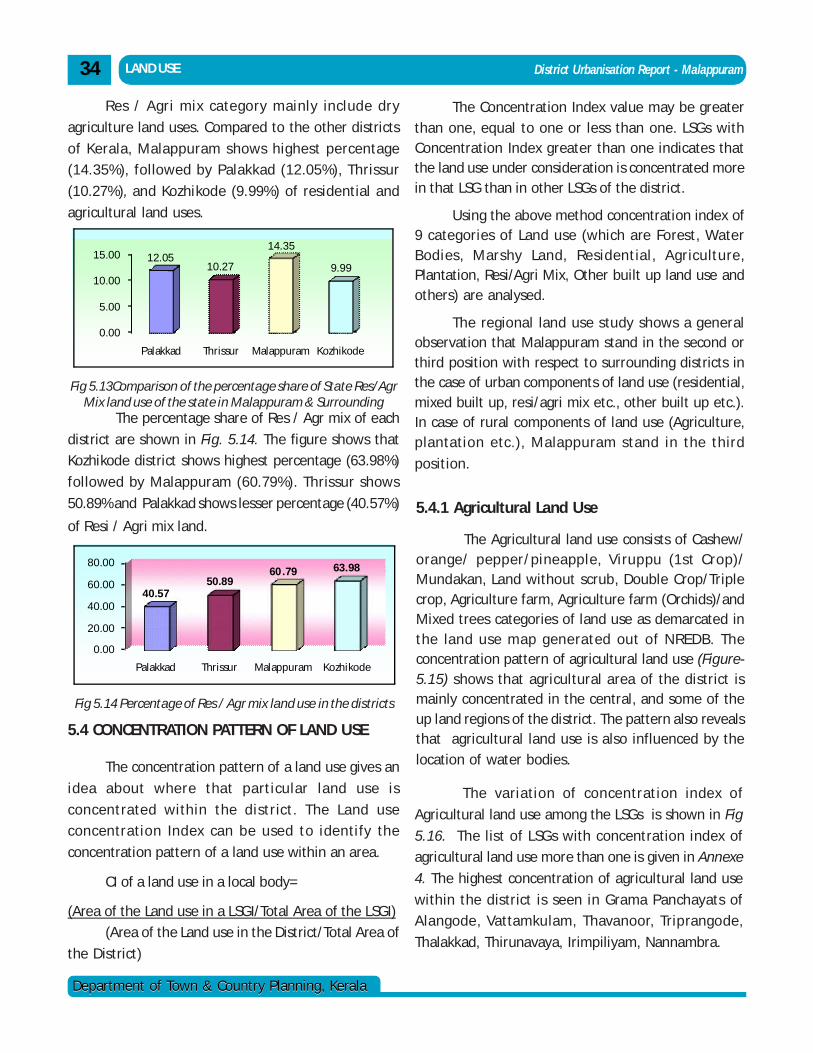
District Urbanisation Report - Malappuram
Department of Town & Country Planning, KeralaDepartment of Town & Country Planning, Kerala
LAND USE34
Res / Agri mix category mainly include dry
agriculture land uses. Compared to the other districts
of Kerala, Malappuram shows highest percentage
(14.35%), followed by Palakkad (12.05%), Thrissur
(10.27%), and Kozhikode (9.99%) of residential and
agricultural land uses.
0.00
5.00
10.00
15.00
Palakkad Thrissur Malappuram Kozhikode
12.0510.27
14.35
9.99
The percentage share of Res / Agr mix of each
district are shown in Fig. 5.14. The figure shows that
Kozhikode district shows highest percentage (63.98%)
followed by Malappuram (60.79%). Thrissur shows
50.89% and Palakkad shows lesser percentage (40.57%)
of Resi / Agri mix land.
0.00
20.00
40.00
60.00
80.00
Palakkad Thrissur Malappuram Kozhikode
40.5750.89
60 .79 63.98
Fig 5.14 Percentage of Res / Agr mix land use in the districts
Fig 5.13Comparison of the percentage share of State Res/AgrMix land use of the state in Malappuram & Surrounding
5.4 CONCENTRATION PATTERN OF LAND USE
The concentration pattern of a land use gives an
idea about where that particular land use is
concentrated within the district. The Land use
concentration Index can be used to identify the
concentration pattern of a land use within an area.
CI of a land use in a local body=
(Area of the Land use in a LSGI/Total Area of the LSGI)
(Area of the Land use in the District/Total Area of
the District)
The Concentration Index value may be greaterthan one, equal to one or less than one. LSGs withConcentration Index greater than one indicates thatthe land use under consideration is concentrated morein that LSG than in other LSGs of the district.
Using the above method concentration index of9 categories of Land use (which are Forest, WaterBodies, Marshy Land, Residential, Agriculture,Plantation, Resi/Agri Mix, Other built up land use andothers) are analysed.
The regional land use study shows a generalobservation that Malappuram stand in the second orthird position with respect to surrounding districts inthe case of urban components of land use (residential,mixed built up, resi/agri mix etc., other built up etc.).In case of rural components of land use (Agriculture,plantation etc.), Malappuram stand in the third
position.
5.4.1 Agricultural Land Use
The Agricultural land use consists of Cashew/orange/ pepper/pineapple, Viruppu (1st Crop)/Mundakan, Land without scrub, Double Crop/Triplecrop, Agriculture farm, Agriculture farm (Orchids)/andMixed trees categories of land use as demarcated inthe land use map generated out of NREDB. Theconcentration pattern of agricultural land use (Figure-5.15) shows that agricultural area of the district ismainly concentrated in the central, and some of theup land regions of the district. The pattern also revealsthat agricultural land use is also influenced by thelocation of water bodies.
The variation of concentration index of
Agricultural land use among the LSGs is shown in Fig
5.16. The list of LSGs with concentration index of
agricultural land use more than one is given in Annexe
4. The highest concentration of agricultural land use
within the district is seen in Grama Panchayats of
Alangode, Vattamkulam, Thavanoor, Triprangode,
Thalakkad, Thirunavaya, Irimpiliyam, Nannambra.
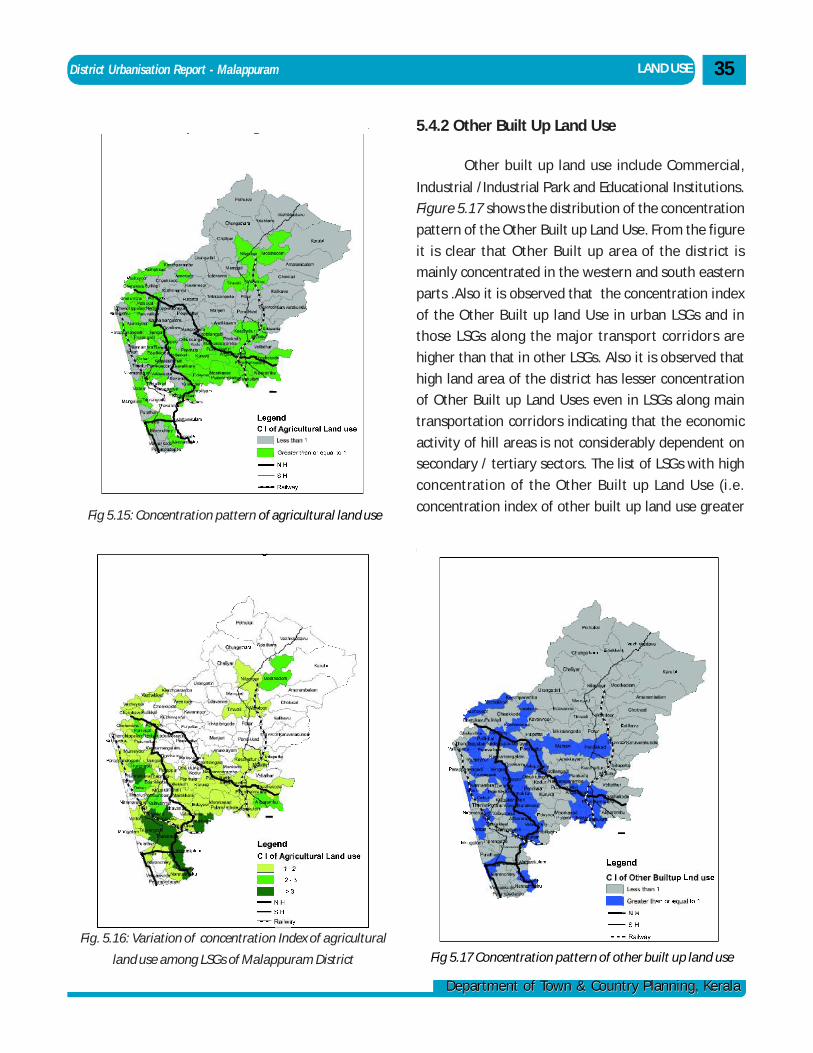
District Urbanisation Report - Malappuram
Department of Town & Country Planning, KeralaDepartment of Town & Country Planning, Kerala
LAND USE 35
Fig 5.15: Concentration pattern of agricultural land use
Fig. 5.16: Variation of concentration Index of agricultural
land use among LSGs of Malappuram District
5.4.2 Other Built Up Land Use
Other built up land use include Commercial,
Industrial /Industrial Park and Educational Institutions.
Figure 5.17 shows the distribution of the concentration
pattern of the Other Built up Land Use. From the figure
it is clear that Other Built up area of the district is
mainly concentrated in the western and south eastern
parts .Also it is observed that the concentration index
of the Other Built up land Use in urban LSGs and in
those LSGs along the major transport corridors are
higher than that in other LSGs. Also it is observed that
high land area of the district has lesser concentration
of Other Built up Land Uses even in LSGs along main
transportation corridors indicating that the economic
activity of hill areas is not considerably dependent on
secondary / tertiary sectors. The list of LSGs with high
concentration of the Other Built up Land Use (i.e.
concentration index of other built up land use greater
Fig 5.17 Concentration pattern of other built up land use
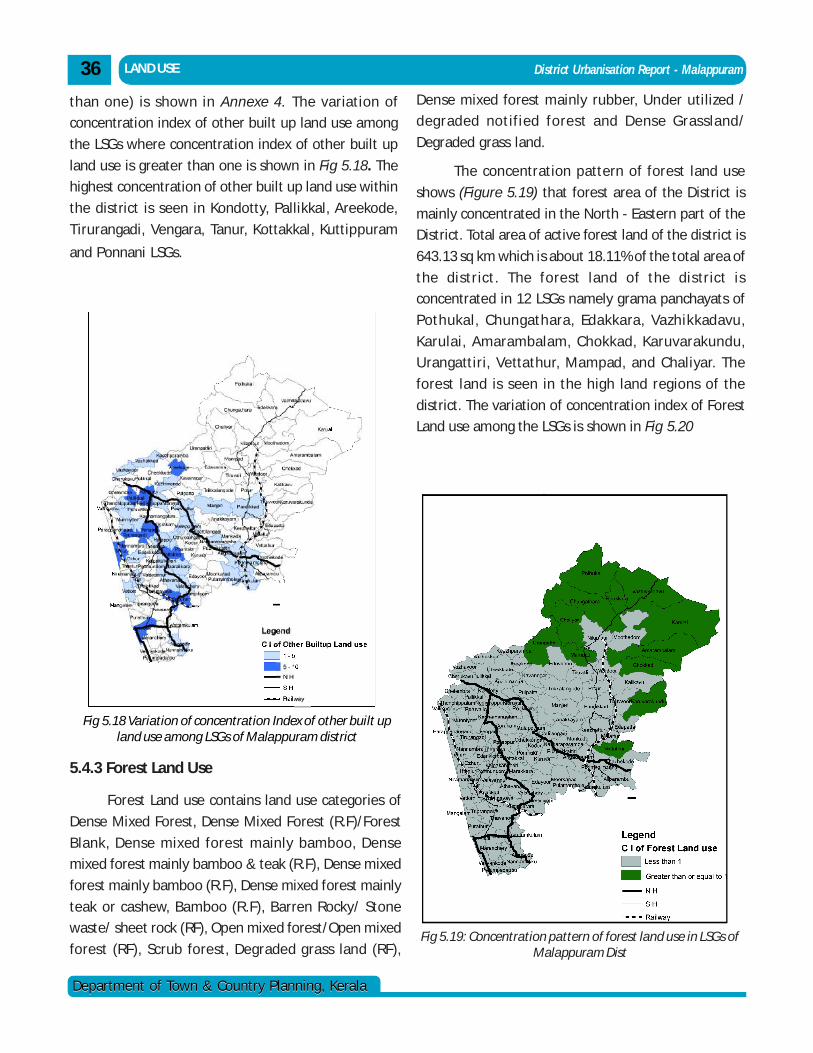
District Urbanisation Report - Malappuram
Department of Town & Country Planning, KeralaDepartment of Town & Country Planning, Kerala
Fig 5.19: Concentration pattern of forest land use in LSGs ofMalappuram Dist
LAND USE36
Fig 5.18 Variation of concentration Index of other built upland use among LSGs of Malappuram district
5.4.3 Forest Land Use
Forest Land use contains land use categories of
Dense Mixed Forest, Dense Mixed Forest (R.F)/Forest
Blank, Dense mixed forest mainly bamboo, Dense
mixed forest mainly bamboo & teak (R.F), Dense mixed
forest mainly bamboo (R.F), Dense mixed forest mainly
teak or cashew, Bamboo (R.F), Barren Rocky/ Stone
waste/ sheet rock (RF), Open mixed forest/Open mixed
forest (RF), Scrub forest, Degraded grass land (RF),
than one) is shown in Annexe 4. The variation of
concentration index of other built up land use among
the LSGs where concentration index of other built up
land use is greater than one is shown in Fig 5.18. The
highest concentration of other built up land use within
the district is seen in Kondotty, Pallikkal, Areekode,
Tirurangadi, Vengara, Tanur, Kottakkal, Kuttippuram
and Ponnani LSGs.
Dense mixed forest mainly rubber, Under utilized /
degraded notified forest and Dense Grassland/
Degraded grass land.
The concentration pattern of forest land use
shows (Figure 5.19) that forest area of the District is
mainly concentrated in the North - Eastern part of the
District. Total area of active forest land of the district is
643.13 sq km which is about 18.11% of the total area of
the district. The forest land of the district is
concentrated in 12 LSGs namely grama panchayats of
Pothukal, Chungathara, Edakkara, Vazhikkadavu,
Karulai, Amarambalam, Chokkad, Karuvarakundu,
Urangattiri, Vettathur, Mampad, and Chaliyar. The
forest land is seen in the high land regions of the
district. The variation of concentration index of Forest
Land use among the LSGs is shown in Fig 5.20
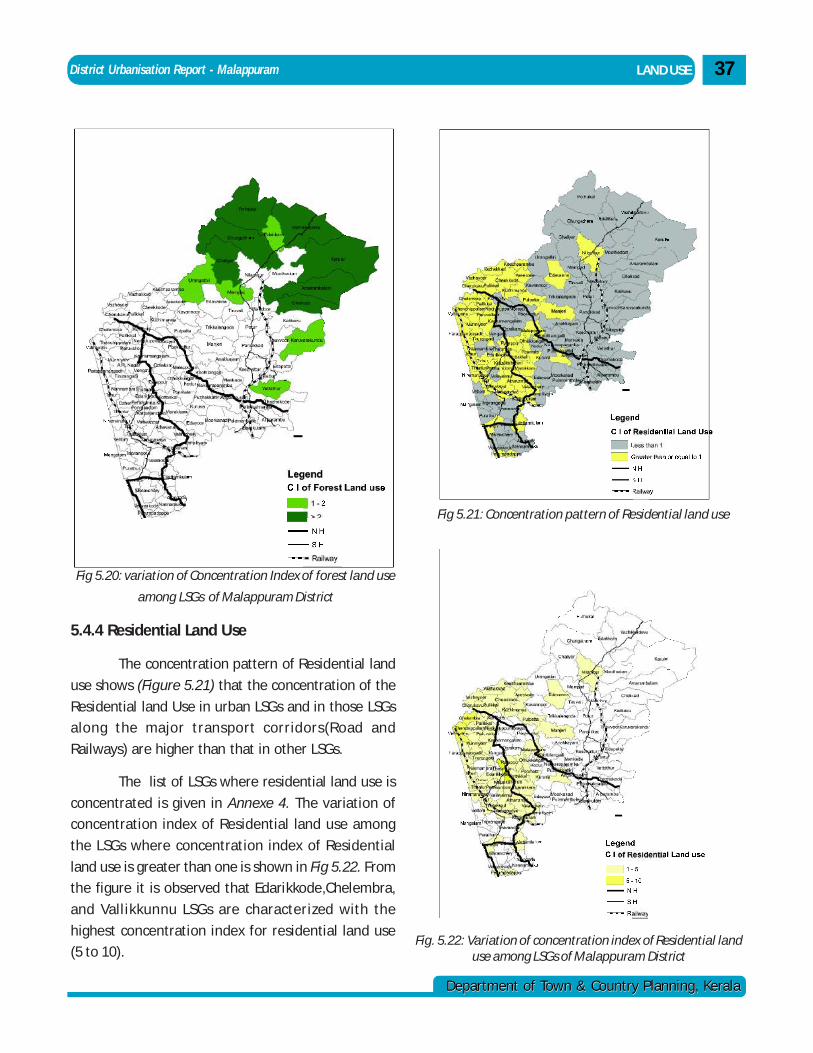
District Urbanisation Report - Malappuram
Department of Town & Country Planning, KeralaDepartment of Town & Country Planning, Kerala
LAND USE 37
Fig 5.20: variation of Concentration Index of forest land use
among LSGs of Malappuram District
5.4.4 Residential Land Use
The concentration pattern of Residential land
use shows (Figure 5.21) that the concentration of the
Residential land Use in urban LSGs and in those LSGs
along the major transport corridors(Road and
Railways) are higher than that in other LSGs.
The list of LSGs where residential land use is
concentrated is given in Annexe 4. The variation of
concentration index of Residential land use among
the LSGs where concentration index of Residential
land use is greater than one is shown in Fig 5.22. From
the figure it is observed that Edarikkode,Chelembra,
and Vallikkunnu LSGs are characterized with the
highest concentration index for residential land use
(5 to 10).
Fig 5.21: Concentration pattern of Residential land use
Fig. 5.22: Variation of concentration index of Residential landuse among LSGs of Malappuram District
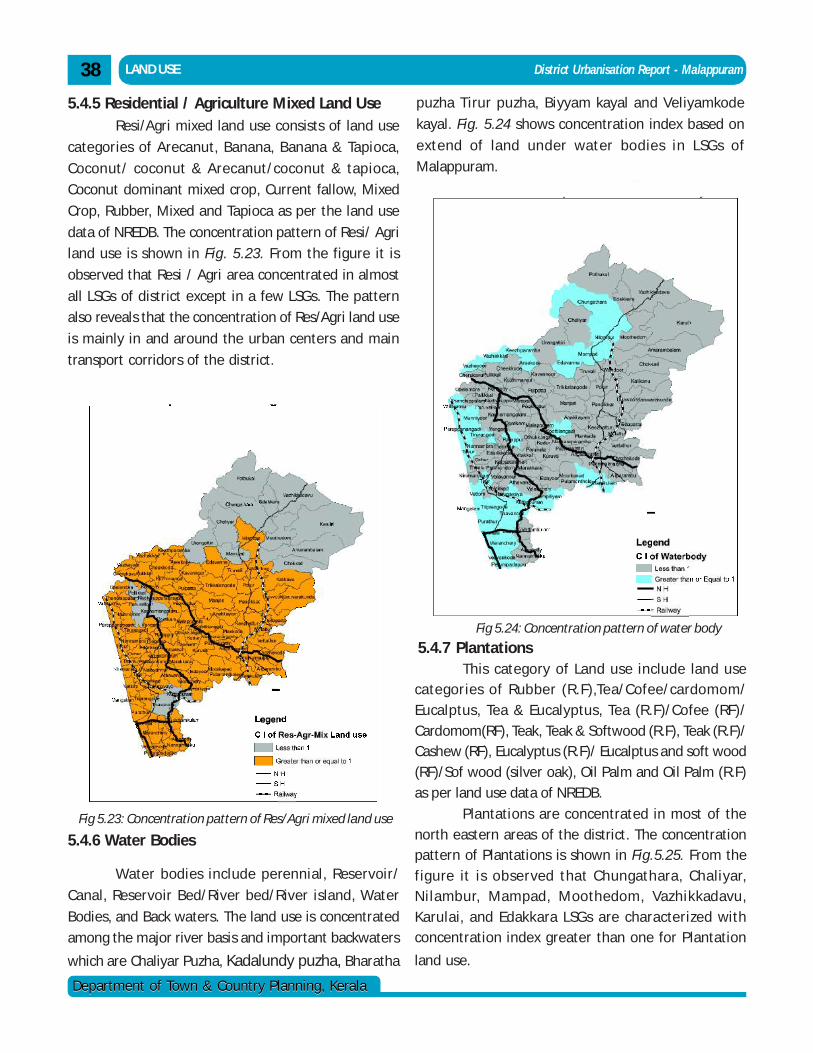
District Urbanisation Report - Malappuram
Department of Town & Country Planning, KeralaDepartment of Town & Country Planning, Kerala
LAND USE38
Fig 5.23: Concentration pattern of Res/Agri mixed land use
5.4.6 Water Bodies
Water bodies include perennial, Reservoir/
Canal, Reservoir Bed/River bed/River island, Water
Bodies, and Back waters. The land use is concentrated
among the major river basis and important backwaters
which are Chaliyar Puzha, Kadalundy puzha, Bharatha
This category of Land use include land usecategories of Rubber (R.F),Tea/Cofee/cardomom/Eucalptus, Tea & Eucalyptus, Tea (R.F)/Cofee (RF)/Cardomom(RF), Teak, Teak & Softwood (R.F), Teak (R.F)/Cashew (RF), Eucalyptus (R.F)/ Eucalptus and soft wood(RF)/Sof wood (silver oak), Oil Palm and Oil Palm (R.F)as per land use data of NREDB.
Plantations are concentrated in most of thenorth eastern areas of the district. The concentrationpattern of Plantations is shown in Fig.5.25. From thefigure it is observed that Chungathara, Chaliyar,Nilambur, Mampad, Moothedom, Vazhikkadavu,Karulai, and Edakkara LSGs are characterized withconcentration index greater than one for Plantation
land use.
5.4.5 Residential / Agriculture Mixed Land UseResi/Agri mixed land use consists of land use
categories of Arecanut, Banana, Banana & Tapioca,
Coconut/ coconut & Arecanut/coconut & tapioca,
Coconut dominant mixed crop, Current fallow, Mixed
Crop, Rubber, Mixed and Tapioca as per the land use
data of NREDB. The concentration pattern of Resi/ Agri
land use is shown in Fig. 5.23. From the figure it is
observed that Resi / Agri area concentrated in almost
all LSGs of district except in a few LSGs. The pattern
also reveals that the concentration of Res/Agri land use
is mainly in and around the urban centers and main
transport corridors of the district.
puzha Tirur puzha, Biyyam kayal and Veliyamkode
kayal. Fig. 5.24 shows concentration index based on
extend of land under water bodies in LSGs of
Malappuram.
Fig 5.24: Concentration pattern of water body
5.4.7 Plantations
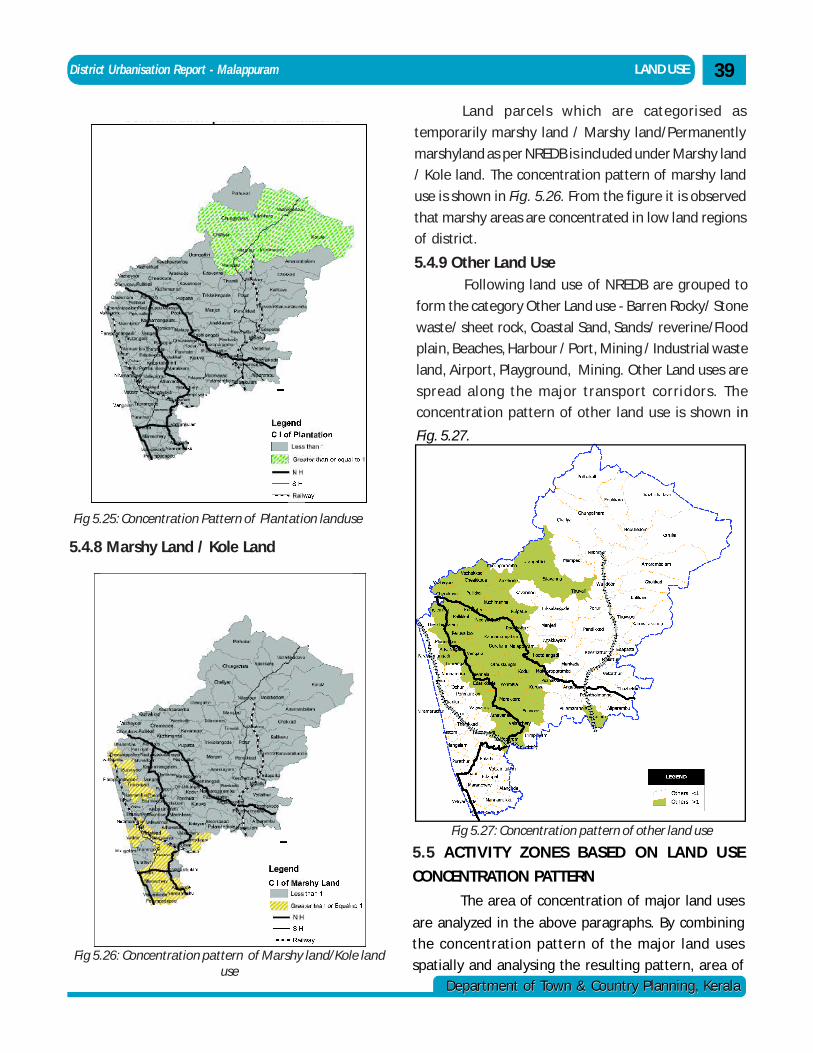
District Urbanisation Report - Malappuram
Department of Town & Country Planning, KeralaDepartment of Town & Country Planning, Kerala
LAND USE 39
5.4.8 Marshy Land / Kole Land
Fig 5.25: Concentration Pattern of Plantation landuse
Fig 5.26: Concentration pattern of Marshy land/Kole landuse
Following land use of NREDB are grouped to
form the category Other Land use - Barren Rocky/ Stone
waste/ sheet rock, Coastal Sand, Sands/ reverine/Flood
plain, Beaches, Harbour / Port, Mining / Industrial waste
land, Airport, Playground, Mining. Other Land uses are
spread along the major transport corridors. The
concentration pattern of other land use is shown in
Fig. 5.27.
Land parcels which are categorised as
temporarily marshy land / Marshy land/Permanently
marshyland as per NREDB is included under Marshy land
/ Kole land. The concentration pattern of marshy land
use is shown in Fig. 5.26. From the figure it is observed
that marshy areas are concentrated in low land regions
of district.
Fig 5.27: Concentration pattern of other land use
5.5 ACTIVITY ZONES BASED ON LAND USE
CONCENTRATION PATTERN
The area of concentration of major land uses
are analyzed in the above paragraphs. By combining
the concentration pattern of the major land uses
spatially and analysing the resulting pattern, area of
5.4.9 Other Land Use
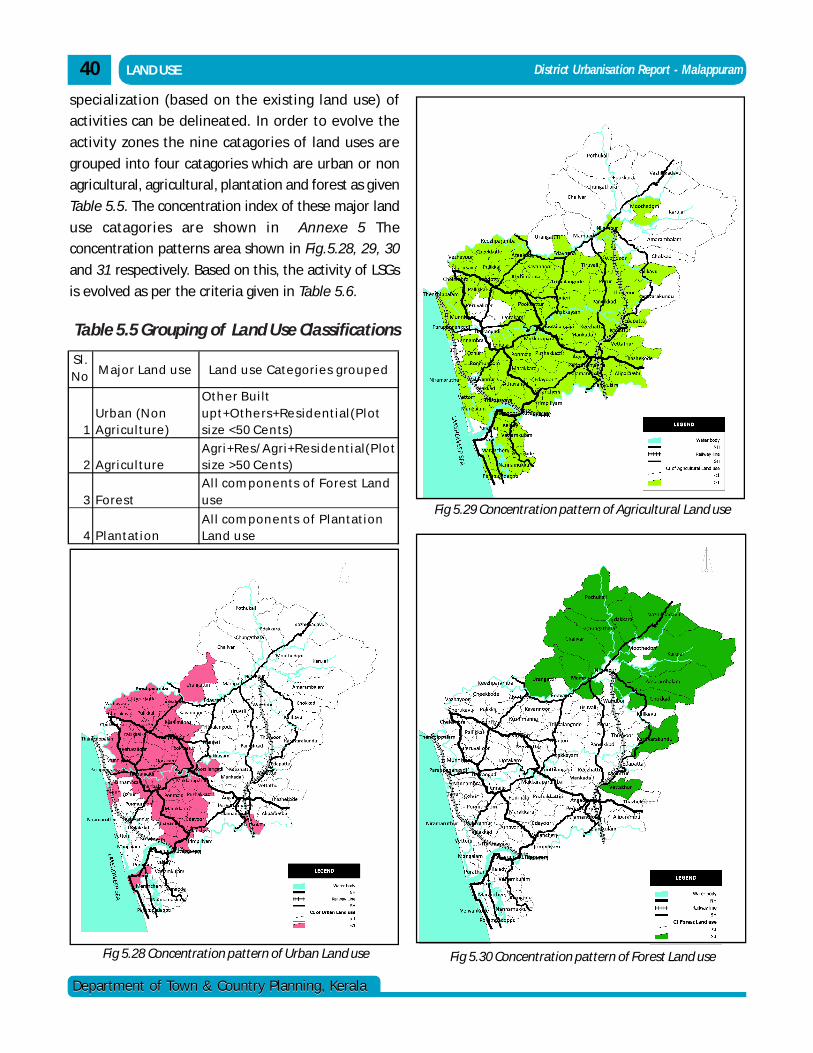
District Urbanisation Report - Malappuram
Department of Town & Country Planning, KeralaDepartment of Town & Country Planning, Kerala
LAND USE40
Sl . N o
.
M ajor Land u se Land u se Cate g orie s g ro up e d
1Urban (N on A gricu l ture )
O th e r B u i lt upt+O the rs+Re sid e ntial (P lot s ize <50 C e n ts)
2 A gricu l tureA gri+R e s/A g ri+R e side ntial(P lo t s ize >50 C e n ts)
3 Fore stA l l com pon e nts o f Fore st Land use
4 P lantationA l l com pon e nts o f P lantation Land u se
Table 5.5 Grouping of Land Use Classifications
specialization (based on the existing land use) of
activities can be delineated. In order to evolve the
activity zones the nine catagories of land uses are
grouped into four catagories which are urban or non
agricultural, agricultural, plantation and forest as given
Table 5.5. The concentration index of these major land
use catagories are shown in Annexe 5 The
concentration patterns area shown in Fig.5.28, 29, 30
and 31 respectively. Based on this, the activity of LSGs
is evolved as per the criteria given in Table 5.6.
Fig 5.28 Concentration pattern of Urban Land use
Fig 5.29 Concentration pattern of Agricultural Land use
Fig 5.30 Concentration pattern of Forest Land use
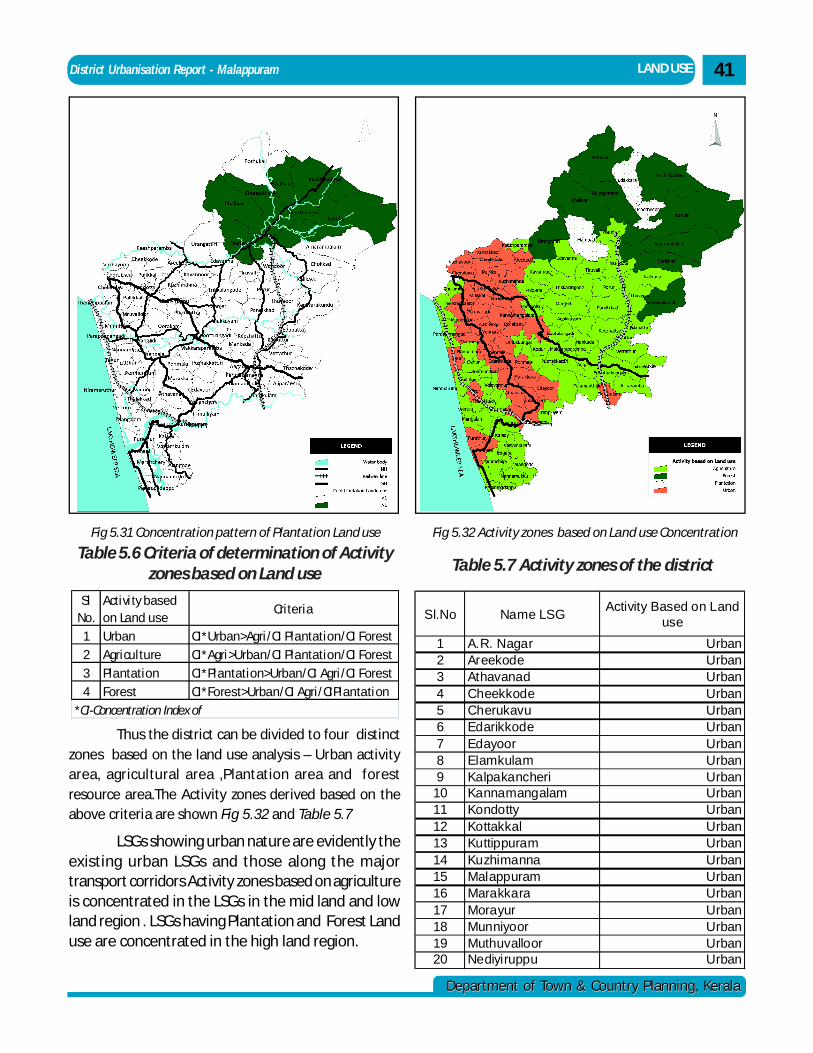
District Urbanisation Report - Malappuram
Department of Town & Country Planning, KeralaDepartment of Town & Country Planning, Kerala
LAND USE 41
Thus the district can be divided to four distinctzones based on the land use analysis – Urban activityarea, agricultural area ,Plantation area and forestresource area.The Activity zones derived based on theabove criteria are shown Fig 5.32 and Table 5.7
LSGs showing urban nature are evidently theexisting urban LSGs and those along the majortransport corridors Activity zones based on agricultureis concentrated in the LSGs in the mid land and lowland region . LSGs having Plantation and Forest Landuse are concentrated in the high land region.
Fig 5.31 Concentration pattern of Plantation Land use
Sl No.
Activity based on Land use
Criteria
1 Urban CI*Urban>Agri/CI Plantation/CI Forest2 Agriculture CI*Agri>Urban/CI Plantation/CI Forest3 Plantation CI*Plantation>Urban/CI Agri/CI Forest4 Forest CI*Forest>Urban/CI Agri/CIPlantation
*CI-Concentration Index of
Table 5.6 Criteria of determination of Activityzones based on Land use
Fig 5.32 Activity zones based on Land use Concentration
Sl.No Name LSG Activity Based on Land use
1 A.R. Nagar Urban2 Areekode Urban3 Athavanad Urban4 Cheekkode Urban5 Cherukavu Urban6 Edarikkode Urban7 Edayoor Urban8 Elamkulam Urban9 Kalpakancheri Urban10 Kannamangalam Urban11 Kondotty Urban12 Kottakkal Urban13 Kuttippuram Urban14 Kuzhimanna Urban15 Malappuram Urban16 Marakkara Urban17 Morayur Urban18 Munniyoor Urban19 Muthuvalloor Urban20 Nediyiruppu Urban
Table 5.7 Activity zones of the district
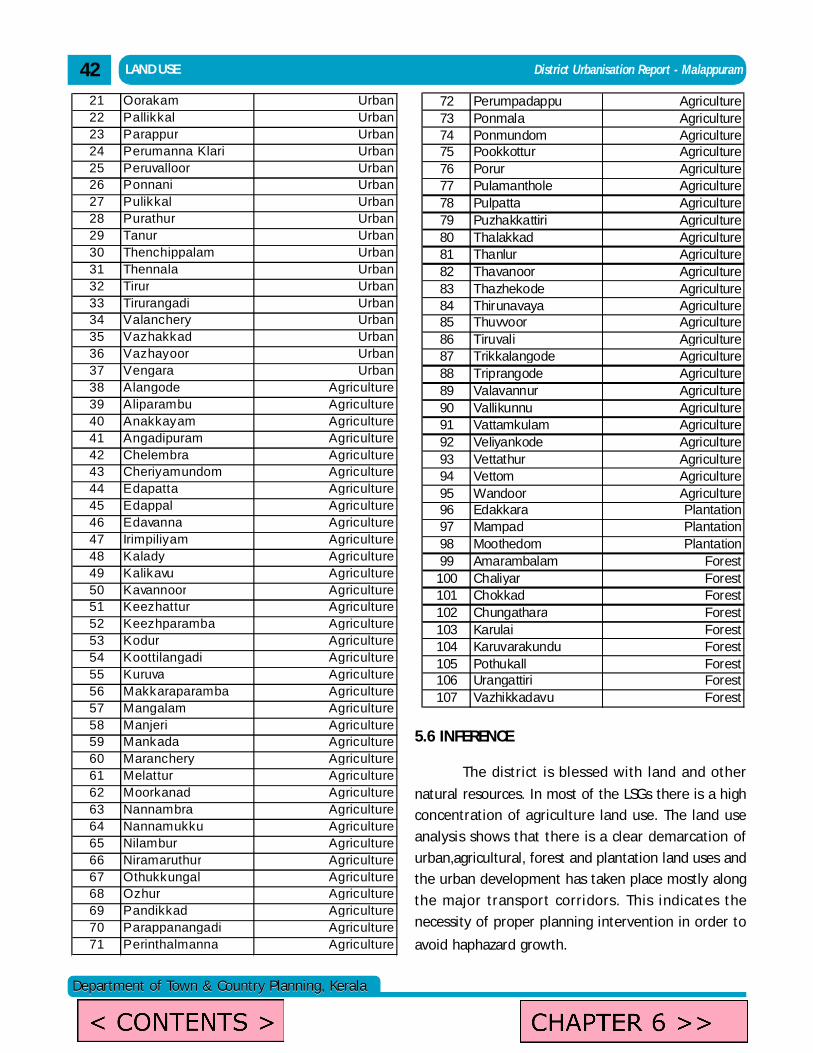
District Urbanisation Report - Malappuram
Department of Town & Country Planning, KeralaDepartment of Town & Country Planning, Kerala
LAND USE42
5.6 INFERENCE
The district is blessed with land and other
natural resources. In most of the LSGs there is a high
concentration of agriculture land use. The land use
analysis shows that there is a clear demarcation of
urban,agricultural, forest and plantation land uses and
the urban development has taken place mostly along
the major transport corridors. This indicates the
necessity of proper planning intervention in order to
avoid haphazard growth.
72 Perumpadappu Agriculture73 Ponmala Agriculture74 Ponmundom Agriculture75 Pookkottur Agriculture76 Porur Agriculture77 Pulamanthole Agriculture78 Pulpatta Agriculture79 Puzhakkattiri Agriculture80 Thalakkad Agriculture81 Thanlur Agriculture82 Thavanoor Agriculture83 Thazhekode Agriculture84 Thirunavaya Agriculture85 Thuvvoor Agriculture86 Tiruvali Agriculture87 Trikkalangode Agriculture88 Triprangode Agriculture89 Valavannur Agriculture90 Vallikunnu Agriculture91 Vattamkulam Agriculture92 Veliyankode Agriculture93 Vettathur Agriculture94 Vettom Agriculture95 Wandoor Agriculture96 Edakkara Plantation97 Mampad Plantation98 Moothedom Plantation99 Amarambalam Forest100 Chaliyar Forest101 Chokkad Forest102 Chungathara Forest103 Karulai Forest104 Karuvarakundu Forest105 Pothukall Forest106 Urangattiri Forest107 Vazhikkadavu Forest
21 Oorakam Urban22 Pallikkal Urban23 Parappur Urban24 Perumanna Klari Urban25 Peruvalloor Urban26 Ponnani Urban27 Pulikkal Urban28 Purathur Urban29 Tanur Urban30 Thenchippalam Urban31 Thennala Urban32 Tirur Urban33 Tirurangadi Urban34 Valanchery Urban35 Vazhakkad Urban36 Vazhayoor Urban37 Vengara Urban38 Alangode Agriculture39 Aliparambu Agriculture40 Anakkayam Agriculture41 Angadipuram Agriculture42 Chelembra Agriculture43 Cheriyamundom Agriculture44 Edapatta Agriculture45 Edappal Agriculture46 Edavanna Agriculture47 Irimpiliyam Agriculture48 Kalady Agriculture49 Kalikavu Agriculture50 Kavannoor Agriculture51 Keezhattur Agriculture52 Keezhparamba Agriculture53 Kodur Agriculture54 Koottilangadi Agriculture55 Kuruva Agriculture56 Makkaraparamba Agriculture57 Mangalam Agriculture58 Manjeri Agriculture59 Mankada Agriculture60 Maranchery Agriculture61 Melattur Agriculture62 Moorkanad Agriculture63 Nannambra Agriculture64 Nannamukku Agriculture65 Nilambur Agriculture66 Niramaruthur Agriculture67 Othukkungal Agriculture68 Ozhur Agriculture69 Pandikkad Agriculture70 Parappanangadi Agriculture71 Perinthalmanna Agriculture
admin
Text Box
CHAPTER 6 >>
admin
Text Box
< CONTENTS >
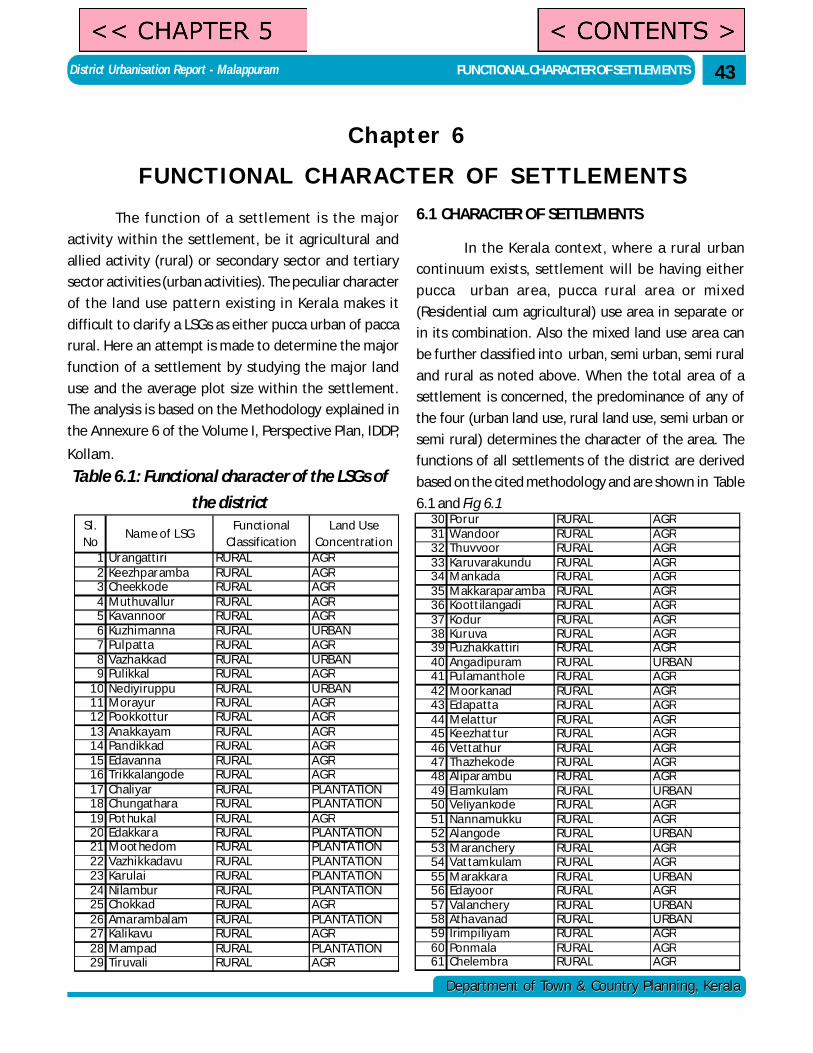
District Urbanisation Report - Malappuram
Department of Town & Country Planning, KeralaDepartment of Town & Country Planning, Kerala
Chapter 6
FUNCTIONAL CHARACTER OF SETTLEMENTSThe function of a settlement is the major
activity within the settlement, be it agricultural and
allied activity (rural) or secondary sector and tertiary
sector activities (urban activities). The peculiar character
of the land use pattern existing in Kerala makes it
difficult to clarify a LSGs as either pucca urban of pacca
rural. Here an attempt is made to determine the major
function of a settlement by studying the major land
use and the average plot size within the settlement.
The analysis is based on the Methodology explained in
the Annexure 6 of the Volume I, Perspective Plan, IDDP,
Kollam.
FUNCTIONAL CHARACTER OF SETTLEMENTS 43
Table 6.1: Functional character of the LSGs of
the district
6.1 CHARACTER OF SETTLEMENTS
In the Kerala context, where a rural urban
continuum exists, settlement will be having either
pucca urban area, pucca rural area or mixed
(Residential cum agricultural) use area in separate or
in its combination. Also the mixed land use area can
be further classified into urban, semi urban, semi rural
and rural as noted above. When the total area of a
settlement is concerned, the predominance of any of
the four (urban land use, rural land use, semi urban or
semi rural) determines the character of the area. The
functions of all settlements of the district are derived
based on the cited methodology and are shown in Table
6.1 and Fig 6.1
Sl. No
Name of LSGFunctional
ClassificationLand Use
Concentration1 Urangattiri RURAL AGR2 Keezhparamba RURAL AGR3 Cheekkode RURAL AGR4 Muthuvallur RURAL AGR5 Kavannoor RURAL AGR6 Kuzhimanna RURAL URBAN7 Pulpatta RURAL AGR8 Vazhakkad RURAL URBAN9 Pulikkal RURAL AGR
10 Nediyiruppu RURAL URBAN11 Morayur RURAL AGR12 Pookkottur RURAL AGR13 Anakkayam RURAL AGR14 Pandikkad RURAL AGR15 Edavanna RURAL AGR16 Trikkalangode RURAL AGR17 Chaliyar RURAL PLANTATION18 Chungathara RURAL PLANTATION19 Pothukal RURAL AGR20 Edakkara RURAL PLANTATION21 Moothedom RURAL PLANTATION22 Vazhikkadavu RURAL PLANTATION23 Karulai RURAL PLANTATION24 Nilambur RURAL PLANTATION25 Chokkad RURAL AGR26 Amarambalam RURAL PLANTATION27 Kalikavu RURAL AGR28 Mampad RURAL PLANTATION29 Tiruvali RURAL AGR
30 Porur RURAL AGR31 Wandoor RURAL AGR32 Thuvvoor RURAL AGR33 Ka ruvarakundu RURAL AGR34 Mankada RURAL AGR35 Makkaraparamba RURAL AGR36 Koottilangadi RURAL AGR37 Kodur RURAL AGR38 Kuruva RURAL AGR39 Puzhakka ttiri RURAL AGR40 Angadipuram RURAL URBAN41 Pulamanthole RURAL AGR42 Moorkanad RURAL AGR43 Edapatta RURAL AGR44 Melattur RURAL AGR45 Keezhattur RURAL AGR46 Vettathur RURAL AGR47 Thazhekode RURAL AGR48 Aliparambu RURAL AGR49 Elamkulam RURAL URBAN50 Veliyankode RURAL AGR51 Nannamukku RURAL AGR52 Alangode RURAL URBAN53 Maranchery RURAL AGR54 Vattamkulam RURAL AGR55 Marakkara RURAL URBAN56 Edayoor RURAL AGR57 Valanchery RURAL URBAN58 Athavanad RURAL URBAN59 Irimpiliyam RURAL AGR60 Ponmala RURAL AGR61 Chelembra RURAL AGR
admin
Text Box
< CONTENTS >
admin
Text Box
<< CHAPTER 5
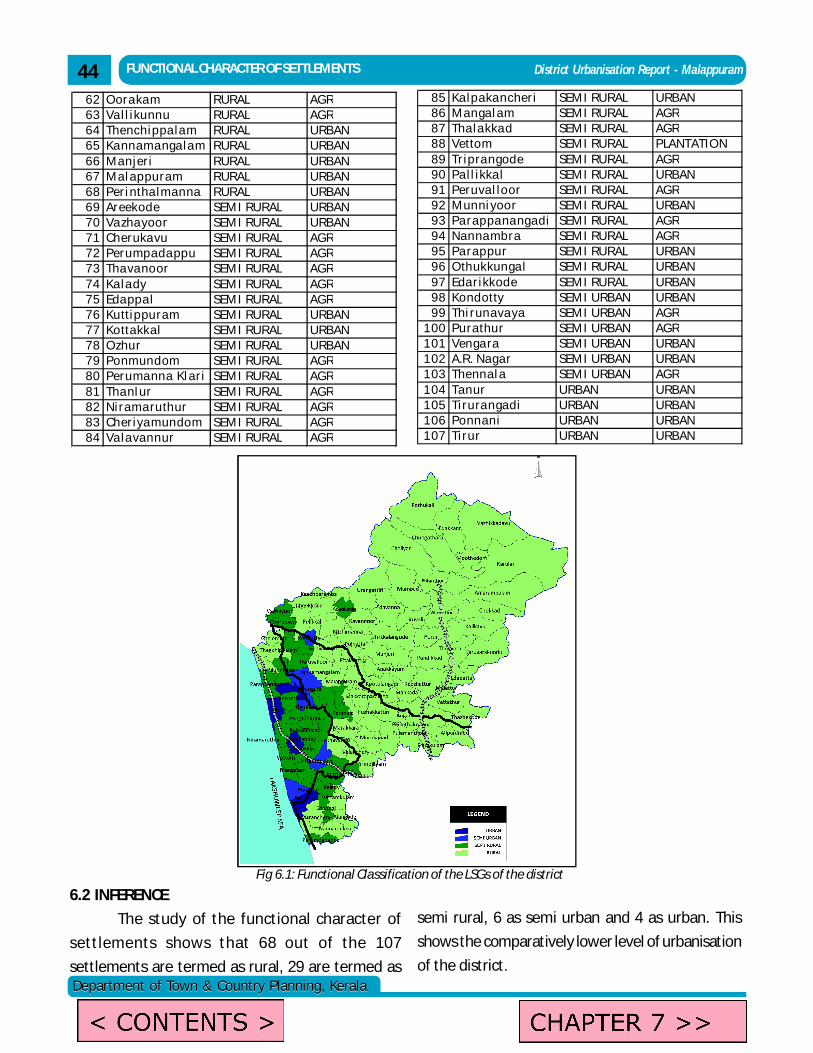
District Urbanisation Report - Malappuram
Department of Town & Country Planning, KeralaDepartment of Town & Country Planning, Kerala
Fig 6.1: Functional Classification of the LSGs of the district
The study of the functional character of
settlements shows that 68 out of the 107
settlements are termed as rural, 29 are termed as
FUNCTIONAL CHARACTER OF SETTLEMENTS4462 Oora ka m RURAL AGR63 Va l l ikunnu RURAL AGR64 Thenchippa la m RURAL URBAN65 Ka nnama nga la m RURAL URBAN66 Manjeri RURAL URBAN67 Mal appuram RURAL URBAN68 Peri ntha lmanna RURAL URBAN69 Areekode SEMI RURAL URBAN70 Va zha yoor SEMI RURAL URBAN71 Cheruka vu SEMI RURAL AGR72 Perumpada ppu SEMI RURAL AGR73 Tha va noor SEMI RURAL AGR74 Ka la dy SEMI RURAL AGR75 Eda ppa l SEMI RURAL AGR76 Kuttippuram SEMI RURAL URBAN77 Kottakka l SEMI RURAL URBAN78 Ozhur SEMI RURAL URBAN79 Ponmundom SEMI RURAL AGR80 Peruma nna Kl ari SEMI RURAL AGR81 Tha nl ur SEMI RURAL AGR82 Nirama ruthur SEMI RURAL AGR83 Cheriya mundom SEMI RURAL AGR84 Va la vannur SEMI RURAL AGR
85 Ka lpaka ncheri SEMI RURAL URBAN86 Manga l am SEMI RURAL AGR87 Tha la kka d SEMI RURAL AGR88 Vettom SEMI RURAL PLANTATION89 Tripra ngode SEMI RURAL AGR90 Pa l l ikka l SEMI RURAL URBAN91 Peruva l loor SEMI RURAL AGR92 Munni yoor SEMI RURAL URBAN93 Pa rappa na ngadi SEMI RURAL AGR94 Nanna mbra SEMI RURAL AGR95 Pa rappur SEMI RURAL URBAN96 Othukkunga l SEMI RURAL URBAN97 Eda rikkode SEMI RURAL URBAN98 Kondotty SEMI URBAN URBAN99 Thi runava ya SEMI URBAN AGR
100 Purathur SEMI URBAN AGR101 Venga ra SEMI URBAN URBAN102 A.R. Nagar SEMI URBAN URBAN103 Thenna l a SEMI URBAN AGR104 Tanur URBAN URBAN105 Tirura ngadi URBAN URBAN106 Ponnani URBAN URBAN107 Tirur URBAN URBAN
semi rural, 6 as semi urban and 4 as urban. This
shows the comparatively lower level of urbanisation
of the district.
6.2 INFERENCE
admin
Text Box
< CONTENTS >
admin
Text Box
CHAPTER 7 >>
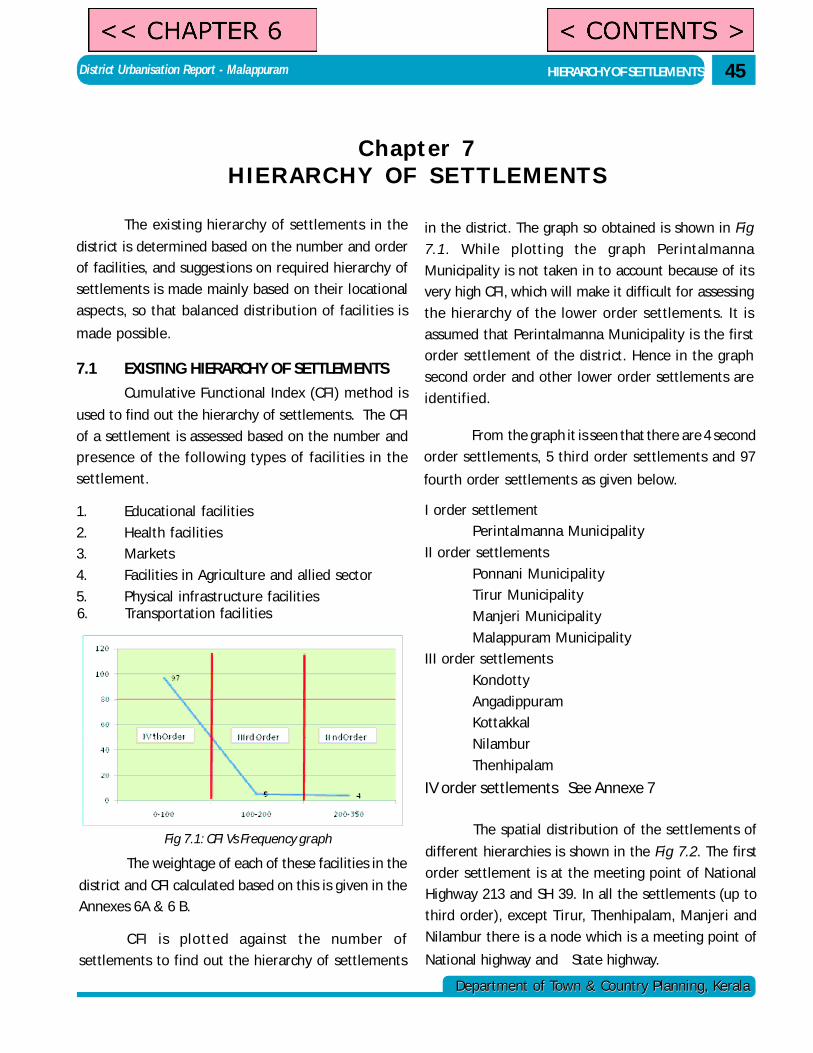
District Urbanisation Report - Malappuram
Department of Town & Country Planning, KeralaDepartment of Town & Country Planning, Kerala
Chapter 7HIERARCHY OF SETTLEMENTS
The existing hierarchy of settlements in the
district is determined based on the number and order
of facilities, and suggestions on required hierarchy of
settlements is made mainly based on their locational
aspects, so that balanced distribution of facilities is
made possible.
7.1 EXISTING HIERARCHY OF SETTLEMENTS
Cumulative Functional Index (CFI) method is
used to find out the hierarchy of settlements. The CFI
of a settlement is assessed based on the number and
presence of the following types of facilities in the
settlement.
1. Educational facilities
2. Health facilities
3. Markets
4. Facilities in Agriculture and allied sector
5. Physical infrastructure facilities
Fig 7.1: CFI Vs Frequency graph
HIERARCHY OF SETTLEMENTS 45
6. Transportation facilities
The weightage of each of these facilities in the
district and CFI calculated based on this is given in the
Annexes 6A & 6 B.
CFI is plotted against the number of
settlements to find out the hierarchy of settlements
in the district. The graph so obtained is shown in Fig
7.1. While plotting the graph Perintalmanna
Municipality is not taken in to account because of its
very high CFI, which will make it difficult for assessing
the hierarchy of the lower order settlements. It is
assumed that Perintalmanna Municipality is the first
order settlement of the district. Hence in the graph
second order and other lower order settlements are
identified.
From the graph it is seen that there are 4 second
order settlements, 5 third order settlements and 97
fourth order settlements as given below.
I order settlement
Perintalmanna Municipality
II order settlements
Ponnani Municipality
Tirur Municipality
Manjeri Municipality
Malappuram Municipality
III order settlements
Kondotty
Angadippuram
Kottakkal
Nilambur
Thenhipalam
IV order settlements See Annexe 7
The spatial distribution of the settlements of
different hierarchies is shown in the Fig 7.2. The first
order settlement is at the meeting point of National
Highway 213 and SH 39. In all the settlements (up to
third order), except Tirur, Thenhipalam, Manjeri and
Nilambur there is a node which is a meeting point of
National highway and State highway.
admin
Text Box
< CONTENTS >
admin
Text Box
<< CHAPTER 6
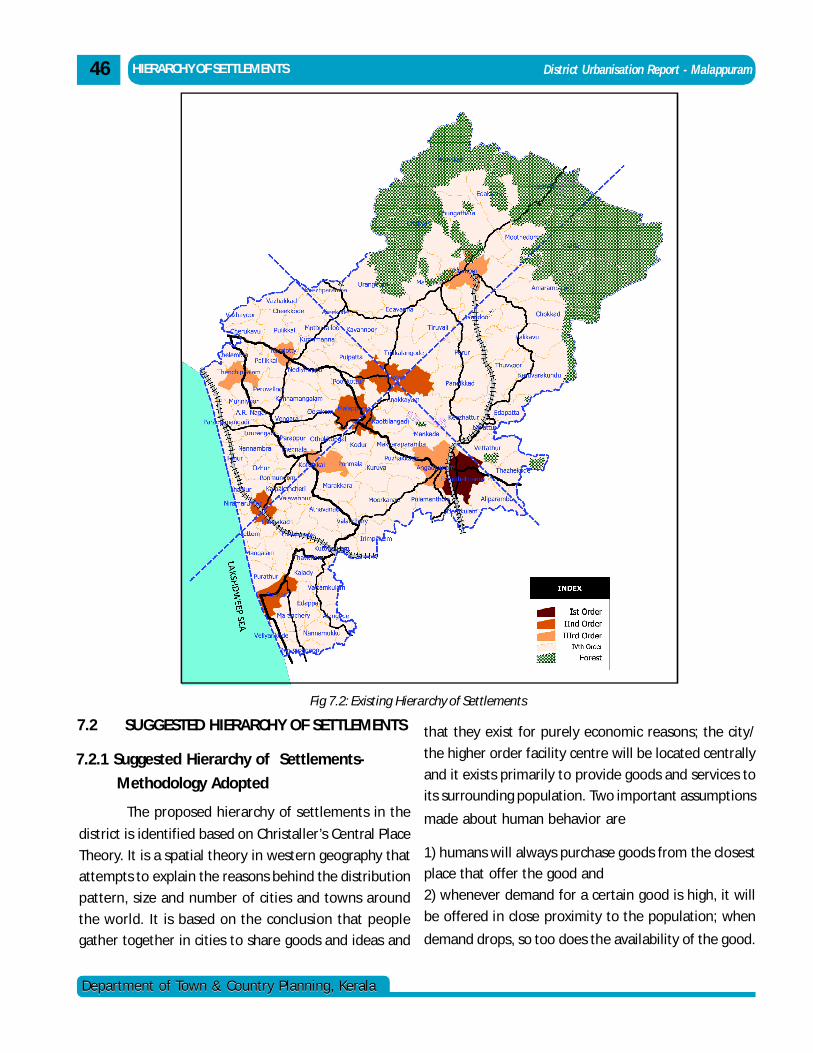
District Urbanisation Report - Malappuram
Department of Town & Country Planning, KeralaDepartment of Town & Country Planning, Kerala
7.2 SUGGESTED HIERARCHY OF SETTLEMENTS
The proposed hierarchy of settlements in the
district is identified based on Christaller’s Central Place
Theory. It is a spatial theory in western geography that
attempts to explain the reasons behind the distribution
pattern, size and number of cities and towns around
the world. It is based on the conclusion that people
gather together in cities to share goods and ideas and
HIERARCHY OF SETTLEMENTS
Fig 7.2: Existing Hierarchy of Settlements
46
7.2.1 Suggested Hierarchy of Settlements-
Methodology Adopted
that they exist for purely economic reasons; the city/
the higher order facility centre will be located centrally
and it exists primarily to provide goods and services to
its surrounding population. Two important assumptions
made about human behavior are
1) humans will always purchase goods from the closest
place that offer the good and
2) whenever demand for a certain good is high, it will
be offered in close proximity to the population; when
demand drops, so too does the availability of the good.
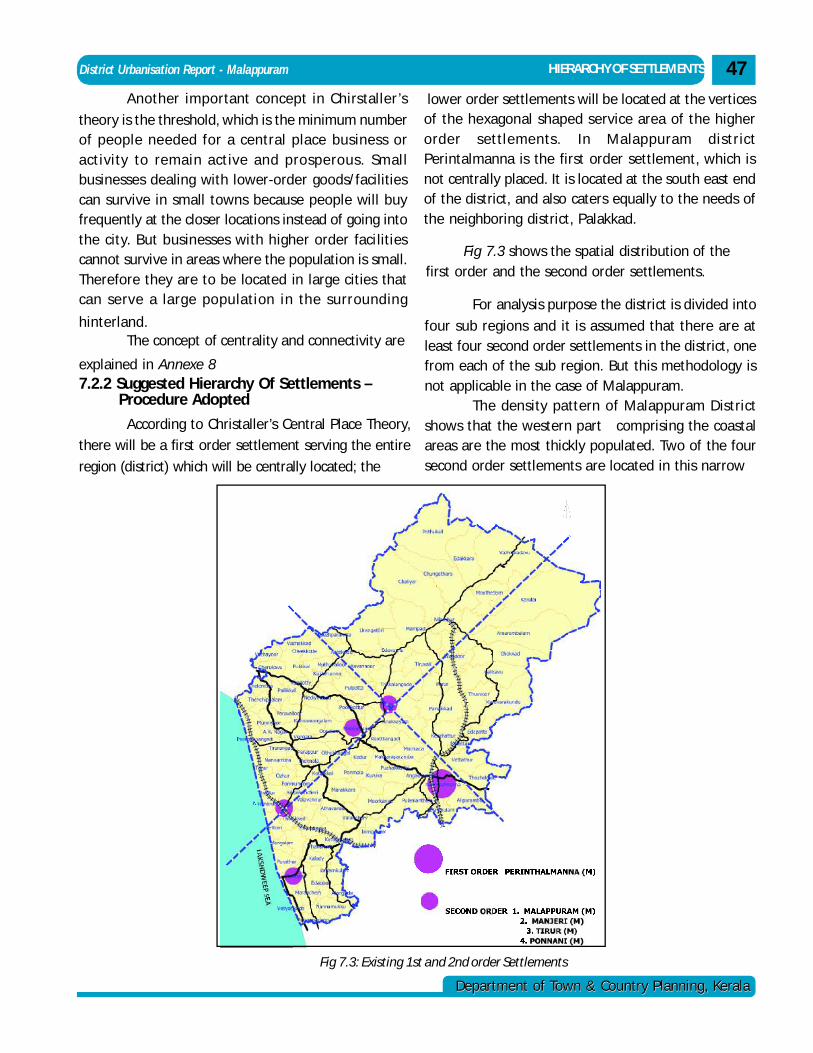
District Urbanisation Report - Malappuram
Department of Town & Country Planning, KeralaDepartment of Town & Country Planning, Kerala
Another important concept in Chirstaller’s
theory is the threshold, which is the minimum numberof people needed for a central place business oractivity to remain active and prosperous. Smallbusinesses dealing with lower-order goods/facilitiescan survive in small towns because people will buyfrequently at the closer locations instead of going intothe city. But businesses with higher order facilitiescannot survive in areas where the population is small.Therefore they are to be located in large cities thatcan serve a large population in the surrounding
hinterland.The concept of centrality and connectivity are
explained in Annexe 8
According to Christaller’s Central Place Theory,
there will be a first order settlement serving the entire
region (district) which will be centrally located; the
HIERARCHY OF SETTLEMENTS 47
Fig 7.3 shows the spatial distribution of thefirst order and the second order settlements.
For analysis purpose the district is divided into
four sub regions and it is assumed that there are atleast four second order settlements in the district, onefrom each of the sub region. But this methodology isnot applicable in the case of Malappuram.
The density pattern of Malappuram Districtshows that the western part comprising the coastalareas are the most thickly populated. Two of the foursecond order settlements are located in this narrow
7.2.2 Suggested Hierarchy Of Settlements – Procedure Adopted
lower order settlements will be located at the verticesof the hexagonal shaped service area of the higherorder settlements. In Malappuram districtPerintalmanna is the first order settlement, which isnot centrally placed. It is located at the south east endof the district, and also caters equally to the needs ofthe neighboring district, Palakkad.
Fig 7.3: Existing 1st and 2nd order Settlements
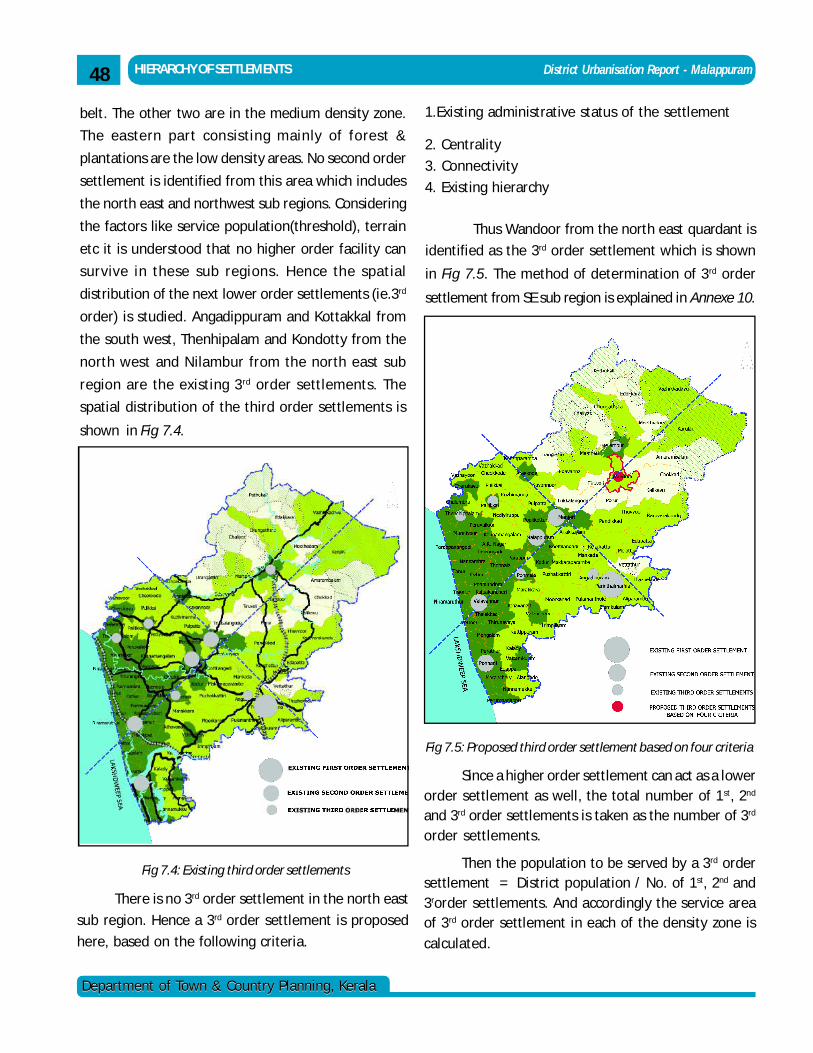
District Urbanisation Report - Malappuram
Department of Town & Country Planning, KeralaDepartment of Town & Country Planning, Kerala
HIERARCHY OF SETTLEMENTS48
Fig 7.4: Existing third order settlements
Thus Wandoor from the north east quardant is
identified as the 3rd order settlement which is shown
in Fig 7.5. The method of determination of 3rd order
settlement from SE sub region is explained in Annexe 10.
Fig 7.5: Proposed third order settlement based on four criteria
belt. The other two are in the medium density zone.
The eastern part consisting mainly of forest &
plantations are the low density areas. No second order
settlement is identified from this area which includes
the north east and northwest sub regions. Considering
the factors like service population(threshold), terrain
etc it is understood that no higher order facility can
survive in these sub regions. Hence the spatial
distribution of the next lower order settlements (ie.3rd
order) is studied. Angadippuram and Kottakkal from
the south west, Thenhipalam and Kondotty from the
north west and Nilambur from the north east sub
region are the existing 3rd order settlements. The
spatial distribution of the third order settlements is
shown in Fig 7.4.
1.Existing administrative status of the settlement
2. Centrality
3. Connectivity
4. Existing hierarchy
Since a higher order settlement can act as a lowerorder settlement as well, the total number of 1st, 2nd
and 3rd order settlements is taken as the number of 3rd
order settlements.
Then the population to be served by a 3rd ordersettlement = District population / No. of 1st, 2nd and3rorder settlements. And accordingly the service areaof 3rd order settlement in each of the density zone iscalculated.
There is no 3rd order settlement in the north east
sub region. Hence a 3rd order settlement is proposed
here, based on the following criteria.
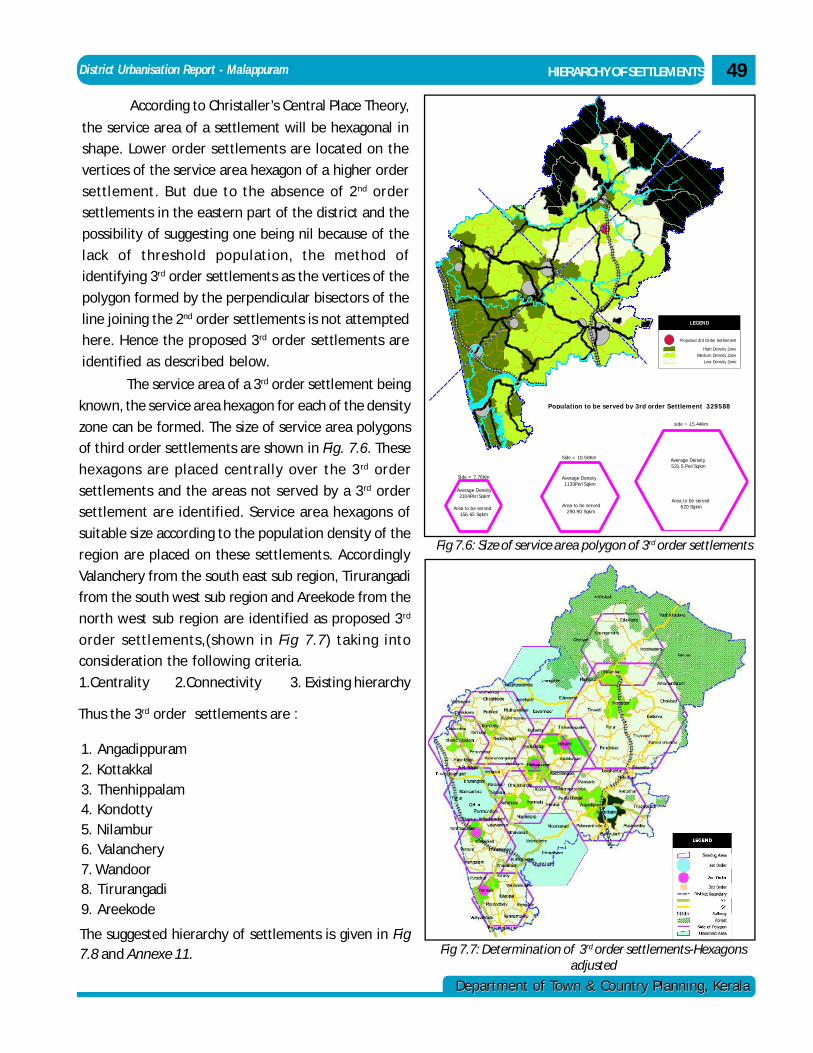
District Urbanisation Report - Malappuram
Department of Town & Country Planning, KeralaDepartment of Town & Country Planning, Kerala
HIERARCHY OF SETTLEMENTS 49
According to Christaller’s Central Place Theory,
the service area of a settlement will be hexagonal in
shape. Lower order settlements are located on the
vertices of the service area hexagon of a higher order
settlement. But due to the absence of 2nd order
settlements in the eastern part of the district and the
possibility of suggesting one being nil because of the
lack of threshold population, the method of
identifying 3rd order settlements as the vertices of the
polygon formed by the perpendicular bisectors of the
line joining the 2nd order settlements is not attempted
here. Hence the proposed 3rd order settlements are
identified as described below.
Fig 7.6: Size of service area polygon of 3rd order settlements
LEGEND
Proposed 3rd Order Settlement
High Density ZoneMedium Density Zone
Low Density Zone
Side = 7.76Km
Average Density 2104Per/Sqkm
Area to be served 156.65 Sqkm
Side = 10.58Km
Average Density 1133Per/Sqkm
Area to be served290.90 Sqkm
side = 15.44Km
Average Density 531.5 Per/Sqkm
Area to be served 620 Sqkm
Population to be served by 3rd order Settlement 329588
Fig 7.7: Determination of 3rd order settlements-Hexagonsadjusted
The service area of a 3rd order settlement being
known, the service area hexagon for each of the density
zone can be formed. The size of service area polygons
of third order settlements are shown in Fig. 7.6. These
hexagons are placed centrally over the 3 rd order
settlements and the areas not served by a 3rd order
settlement are identified. Service area hexagons of
suitable size according to the population density of the
region are placed on these settlements. Accordingly
Valanchery from the south east sub region, Tirurangadi
from the south west sub region and Areekode from the
north west sub region are identified as proposed 3rd
order settlements,(shown in Fig 7.7) taking into
consideration the following criteria.
1.Centrality 2.Connectivity 3. Existing hierarchy
1. Angadippuram2. Kottakkal3. Thenhippalam4. Kondotty5. Nilambur6. Valanchery7. Wandoor8. Tirurangadi9. Areekode
The suggested hierarchy of settlements is given in Fig7.8 and Annexe 11.
Thus the 3rd order settlements are :
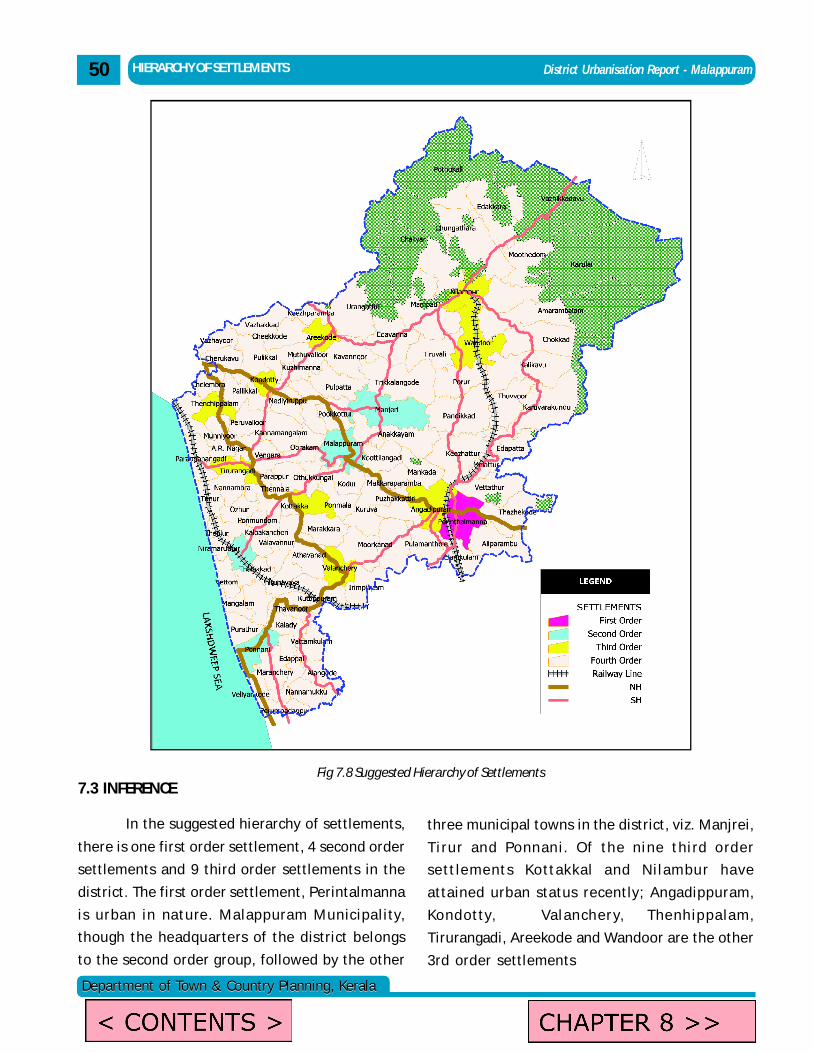
District Urbanisation Report - Malappuram
Department of Town & Country Planning, KeralaDepartment of Town & Country Planning, Kerala
7.3 INFERENCE
In the suggested hierarchy of settlements,
there is one first order settlement, 4 second order
settlements and 9 third order settlements in the
district. The first order settlement, Perintalmanna
is urban in nature. Malappuram Municipal i ty,
though the headquarters of the district belongs
to the second order group, followed by the other
Fig 7.8 Suggested Hierarchy of Settlements
50 HIERARCHY OF SETTLEMENTS
three municipal towns in the district, viz. Manjrei,
T i rur and Ponnani . Of the ni ne thi rd order
sett lements Kottakkal and N i l am bur have
attained urban status recently; Angadippuram,
Kondotty, Val anchery, Thenhippa lam,
Tirurangadi, Areekode and Wandoor are the other
3rd order settlements
admin
Text Box
< CONTENTS >
admin
Text Box
CHAPTER 8 >>
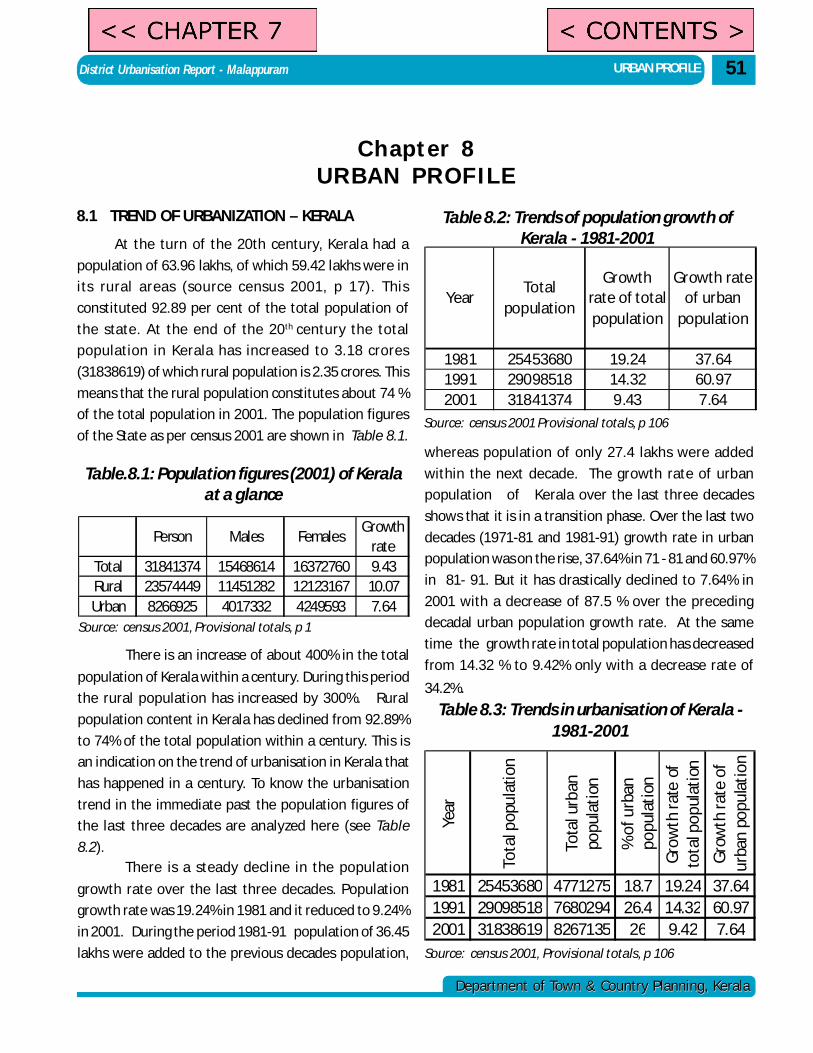
District Urbanisation Report - Malappuram
Department of Town & Country Planning, KeralaDepartment of Town & Country Planning, Kerala
URBAN PROFILE
Chapter 8URBAN PROFILE
At the turn of the 20th century, Kerala had a
population of 63.96 lakhs, of which 59.42 lakhs were in
its rural areas (source census 2001, p 17). This
constituted 92.89 per cent of the total population of
the state. At the end of the 20th century the total
population in Kerala has increased to 3.18 crores
(31838619) of which rural population is 2.35 crores. This
means that the rural population constitutes about 74 %
of the total population in 2001. The population figures
of the State as per census 2001 are shown in Table 8.1.
Table.8.1: Population figures (2001) of Keralaat a glance
Source: census 2001, Provisional totals, p 1
There is an increase of about 400% in the total
population of Kerala within a century. During this period
the rural population has increased by 300%. Rural
population content in Kerala has declined from 92.89%
to 74% of the total population within a century. This is
an indication on the trend of urbanisation in Kerala that
has happened in a century. To know the urbanisation
trend in the immediate past the population figures of
the last three decades are analyzed here (see Table
8.2).
Table 8.2: Trends of population growth ofKerala - 1981-2001
Source: census 2001 Provisional totals, p 106
There is a steady decline in the population
growth rate over the last three decades. Population
growth rate was 19.24% in 1981 and it reduced to 9.24%
in 2001. During the period 1981-91 population of 36.45
lakhs were added to the previous decades population,
51
8.1 TREND OF URBANIZATION – KERALA
Table 8.3: Trends in urbanisation of Kerala -1981-2001
Source: census 2001, Provisional totals, p 106
Year
Tota
l pop
ulat
ion
Tota
l urb
an
popu
lati
on
% o
f urb
an
popu
lati
on
Gro
wth
rat
e of
to
tal p
opul
atio
n
Gro
wth
rate
of
urba
n po
pula
tion
1981 25453680 4771275 18.7 19.24 37.641991 29098518 7680294 26.4 14.32 60.972001 31838619 8267135 26 9.42 7.64
Person Males FemalesGrowth
rateTotal 31841374 15468614 16372760 9.43Rural 23574449 11451282 12123167 10.07Urban 8266925 4017332 4249593 7.64
YearTotal
population
Growth rate of total population
Growth rate of urban
population
1981 25453680 19.24 37.641991 29098518 14.32 60.972001 31841374 9.43 7.64
whereas population of only 27.4 lakhs were added
within the next decade. The growth rate of urban
population of Kerala over the last three decades
shows that it is in a transition phase. Over the last two
decades (1971-81 and 1981-91) growth rate in urban
population was on the rise, 37.64% in 71 - 81 and 60.97%
in 81- 91. But it has drastically declined to 7.64% in
2001 with a decrease of 87.5 % over the preceding
decadal urban population growth rate. At the same
time the growth rate in total population has decreased
from 14.32 % to 9.42% only with a decrease rate of
34.2%.
admin
Text Box
<< CHAPTER 7
admin
Text Box
< CONTENTS >
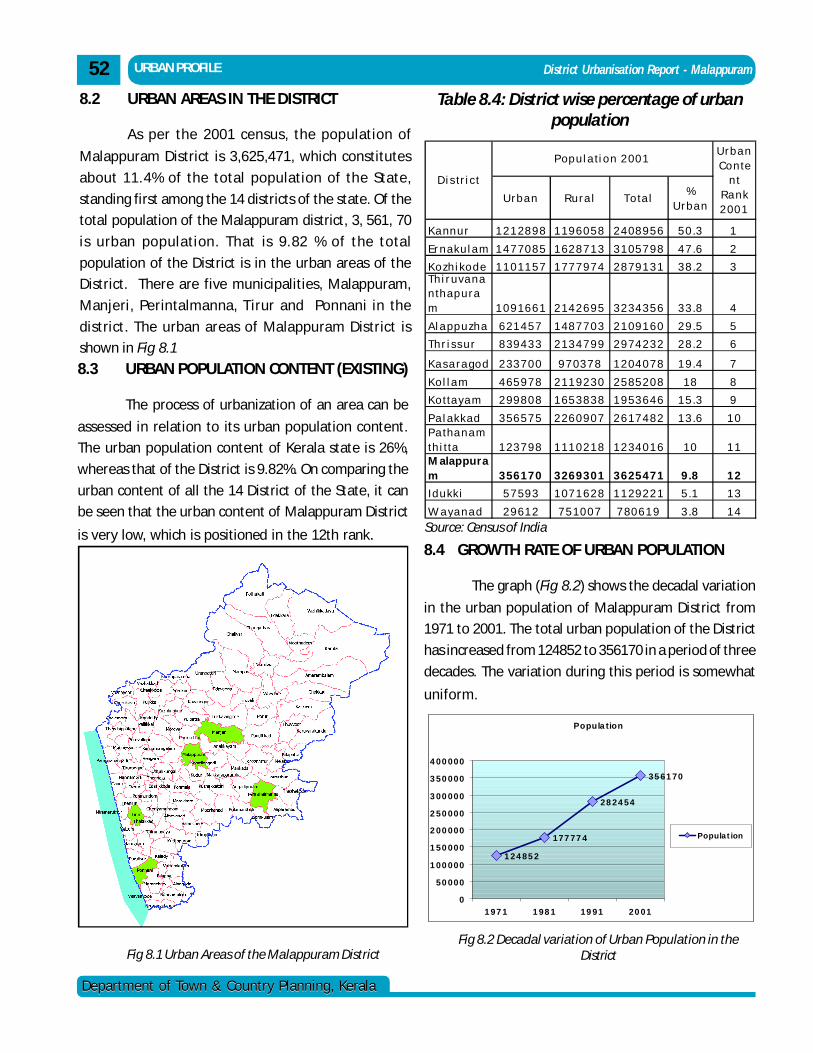
District Urbanisation Report - Malappuram
Department of Town & Country Planning, KeralaDepartment of Town & Country Planning, Kerala
URBAN PROFILE
Table 8.4: District wise percentage of urbanpopulation
8.4 GROWTH RATE OF URBAN POPULATION
The graph (Fig 8.2) shows the decadal variation
in the urban population of Malappuram District from
1971 to 2001. The total urban population of the District
has increased from 124852 to 356170 in a period of three
decades. The variation during this period is somewhat
uniform.
Population
124852
177774
282454
356170
0
50000
100000
150000
200000
250000
300000
350000
400000
1971 1981 1991 2001
Population
Source: Census of India
Fig 8.1 Urban Areas of the Malappuram District
8.2 URBAN AREAS IN THE DISTRICT
As per the 2001 census, the population of
Malappuram District is 3,625,471, which constitutes
about 11.4% of the total population of the State,
standing first among the 14 districts of the state. Of the
total population of the Malappuram district, 3, 561, 70
is urban population. That is 9.82 % of the total
population of the District is in the urban areas of the
District. There are five municipalities, Malappuram,
Manjeri, Perintalmanna, Tirur and Ponnani in the
district. The urban areas of Malappuram District is
shown in Fig 8.1
8.3 URBAN POPULATION CONTENT (EXISTING)
The process of urbanization of an area can be
assessed in relation to its urban population content.
The urban population content of Kerala state is 26%,
whereas that of the District is 9.82%. On comparing the
urban content of all the 14 District of the State, it can
be seen that the urban content of Malappuram District
is very low, which is positioned in the 12th rank.
52
Urb a n R u ra l To ta l%
Urb a n
K a nn u r 1 2 1 2 8 9 8 1 1 9 6 0 5 8 2 4 0 8 9 5 6 5 0 .3 1
Er n a k u l a m 1 4 7 7 0 8 5 1 6 2 8 7 1 3 3 1 0 5 7 9 8 4 7 .6 2
K o zh i ko d e 1 1 0 1 1 5 7 1 7 7 7 9 7 4 2 8 7 9 1 3 1 3 8 .2 3Th i r u va n an th a p u ram 1 0 9 1 6 6 1 2 1 4 2 6 9 5 3 2 3 4 3 5 6 3 3 .8 4
Al a pp u zh a 6 2 1 4 5 7 1 4 8 7 7 0 3 2 1 0 9 1 6 0 2 9 .5 5
Th r i s s u r 8 3 9 4 3 3 2 1 3 4 7 9 9 2 9 7 4 2 3 2 2 8 .2 6
K a s a ra go d 2 3 3 7 0 0 9 7 0 3 7 8 1 2 0 4 0 7 8 1 9 .4 7
K o l l a m 4 6 5 9 7 8 2 1 1 9 2 3 0 2 5 8 5 2 0 8 1 8 8
K o tta ya m 2 9 9 8 0 8 1 6 5 3 8 3 8 1 9 5 3 6 4 6 1 5 .3 9
P a l a k k a d 3 5 6 5 7 5 2 2 6 0 9 0 7 2 6 1 7 4 8 2 1 3 .6 1 0P a tha n a mth i tta 1 2 3 7 9 8 1 1 1 0 2 1 8 1 2 3 4 0 1 6 1 0 1 1M alap pu r am 3 5 6 1 7 0 3 2 6 9 3 0 1 3 6 2 5 4 7 1 9 .8 1 2
I d u kk i 5 7 5 9 3 1 0 7 1 6 2 8 1 1 2 9 2 2 1 5 .1 1 3
W a ya n a d 2 9 6 1 2 7 5 1 0 0 7 7 8 0 6 1 9 3 .8 1 4
D i s tr i c t
P op u l a ti o n 2 0 0 1Urb a n Co n te
n t R a n k 2 0 0 1
Fig 8.2 Decadal variation of Urban Population in theDistrict
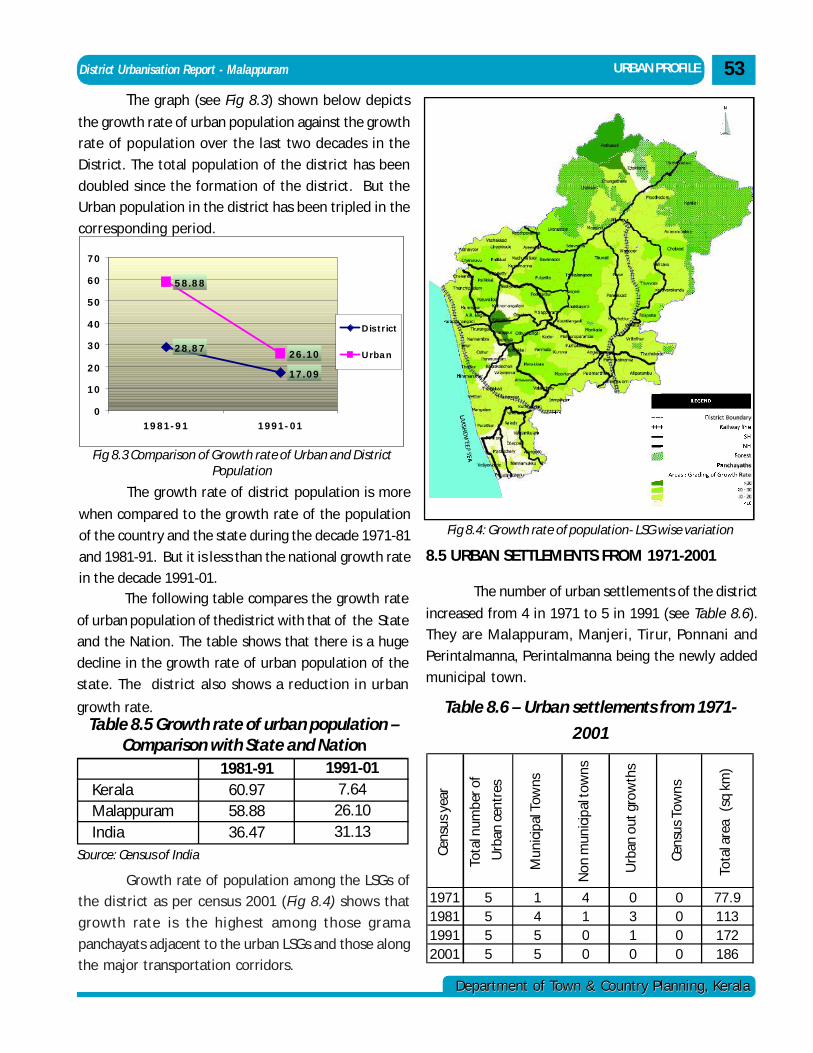
District Urbanisation Report - Malappuram
Department of Town & Country Planning, KeralaDepartment of Town & Country Planning, Kerala
URBAN PROFILE
The graph (see Fig 8.3) shown below depicts
the growth rate of urban population against the growth
rate of population over the last two decades in the
District. The total population of the district has been
doubled since the formation of the district. But the
Urban population in the district has been tripled in the
corresponding period.
The growth rate of district population is more
when compared to the growth rate of the population
of the country and the state during the decade 1971-81
and 1981-91. But it is less than the national growth rate
in the decade 1991-01.
53
28.87
17.09
58.88
26.10
0
10
20
30
40
50
60
70
1981-91 1991-01
District
Urban
Fig 8.3 Comparison of Growth rate of Urban and DistrictPopulation
The following table compares the growth rate
of urban population of thedistrict with that of the State
and the Nation. The table shows that there is a huge
decline in the growth rate of urban population of the
state. The district also shows a reduction in urban
growth rate.Table 8.5 Growth rate of urban population –
Comparison with State and Nation
KeralaMalappuramIndia
1981-9160.9758.8836.47
1991-017.64
26.1031.13
Source: Census of India
Growth rate of population among the LSGs of
the district as per census 2001 (Fig 8.4) shows that
growth rate is the highest among those grama
panchayats adjacent to the urban LSGs and those along
the major transportation corridors.
Fig 8.4: Growth rate of population- LSG wise variation
8.5 URBAN SETTLEMENTS FROM 1971-2001
The number of urban settlements of the district
increased from 4 in 1971 to 5 in 1991 (see Table 8.6).
They are Malappuram, Manjeri, Tirur, Ponnani and
Perintalmanna, Perintalmanna being the newly added
municipal town.
Cens
us y
ear
Tota
l num
ber o
f
Urb
an c
entr
es
Mun
icip
al T
owns
Non
mun
icip
al to
wns
Urb
an o
ut g
row
ths
Cens
us T
owns
Tota
l are
a (
sq k
m)
1971 5 1 4 0 0 77.91981 5 4 1 3 0 1131991 5 5 0 1 0 1722001 5 5 0 0 0 186
Table 8.6 – Urban settlements from 1971-
2001
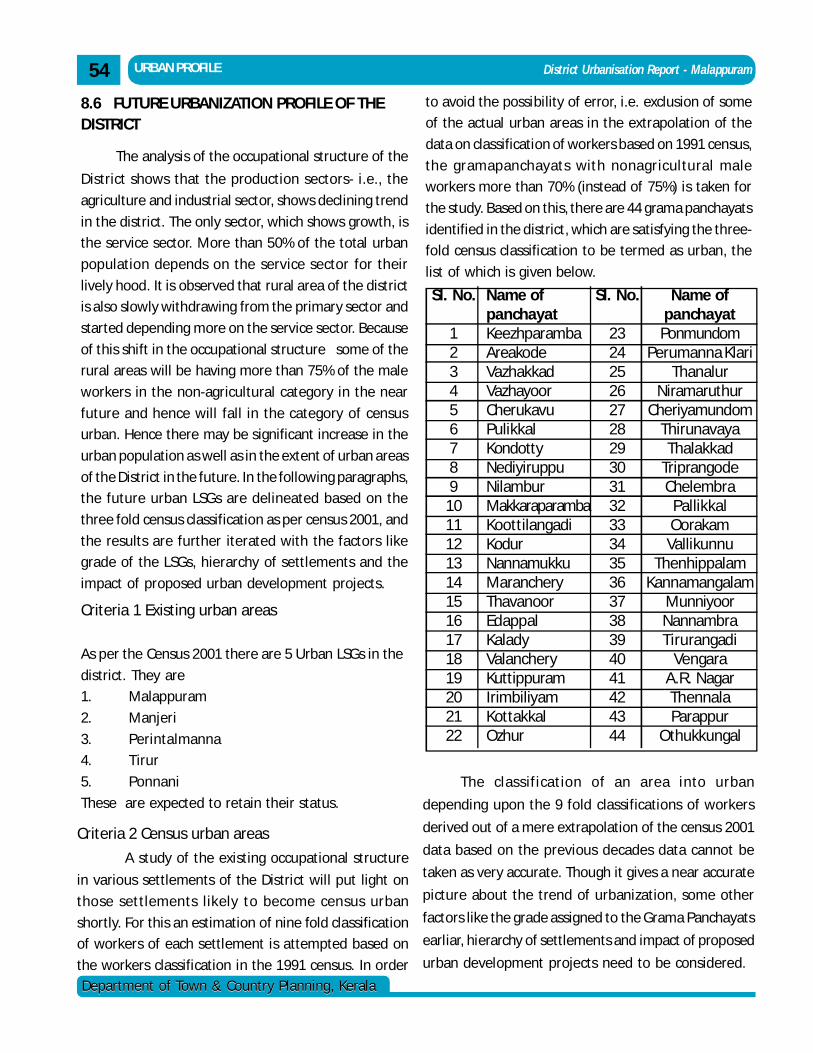
District Urbanisation Report - Malappuram
Department of Town & Country Planning, KeralaDepartment of Town & Country Planning, Kerala
URBAN PROFILE
Criteria 1 Existing urban areas
As per the Census 2001 there are 5 Urban LSGs in the
district. They are
1. Malappuram
2. Manjeri
3. Perintalmanna
4. Tirur
5. Ponnani
These are expected to retain their status.
8.6 FUTURE URBANIZATION PROFILE OF THEDISTRICT
The analysis of the occupational structure of the
District shows that the production sectors- i.e., the
agriculture and industrial sector, shows declining trend
in the district. The only sector, which shows growth, is
the service sector. More than 50% of the total urban
population depends on the service sector for their
lively hood. It is observed that rural area of the district
is also slowly withdrawing from the primary sector and
started depending more on the service sector. Because
of this shift in the occupational structure some of the
rural areas will be having more than 75% of the male
workers in the non-agricultural category in the near
future and hence will fall in the category of census
urban. Hence there may be significant increase in the
urban population as well as in the extent of urban areas
of the District in the future. In the following paragraphs,
the future urban LSGs are delineated based on the
three fold census classification as per census 2001, and
the results are further iterated with the factors like
grade of the LSGs, hierarchy of settlements and the
impact of proposed urban development projects.
54
Criteria 2 Census urban areas
A study of the existing occupational structure
in various settlements of the District will put light on
those settlements likely to become census urban
shortly. For this an estimation of nine fold classification
of workers of each settlement is attempted based on
the workers classification in the 1991 census. In order
to avoid the possibility of error, i.e. exclusion of some
of the actual urban areas in the extrapolation of the
data on classification of workers based on 1991 census,
the gramapanchayats with nonagricultural male
workers more than 70% (instead of 75%) is taken for
the study. Based on this, there are 44 grama panchayats
identified in the district, which are satisfying the three-
fold census classification to be termed as urban, the
list of which is given below.
Sl. No.
123456789
10111213141516171819202122
Name ofpanchayatKeezhparambaAreakodeVazhakkadVazhayoorCherukavuPulikkalKondottyNediyiruppuNilamburMakkaraparambaKoottilangadiKodurNannamukkuMarancheryThavanoorEdappalKaladyValancheryKuttippuramIrimbiliyamKottakkalOzhur
Sl. No.
23242526272829303132333435363738394041424344
Name ofpanchayat
PonmundomPerumanna Klari
ThanalurNiramaruthur
CheriyamundomThirunavayaThalakkad
TriprangodeChelembra
PallikkalOorakam
VallikunnuThenhippalam
KannamangalamMunniyoorNannambraTirurangadi
VengaraA.R. NagarThennalaParappur
Othukkungal
The classification of an area into urban
depending upon the 9 fold classifications of workers
derived out of a mere extrapolation of the census 2001
data based on the previous decades data cannot be
taken as very accurate. Though it gives a near accurate
picture about the trend of urbanization, some other
factors like the grade assigned to the Grama Panchayats
earliar, hierarchy of settlements and impact of proposed
urban development projects need to be considered.
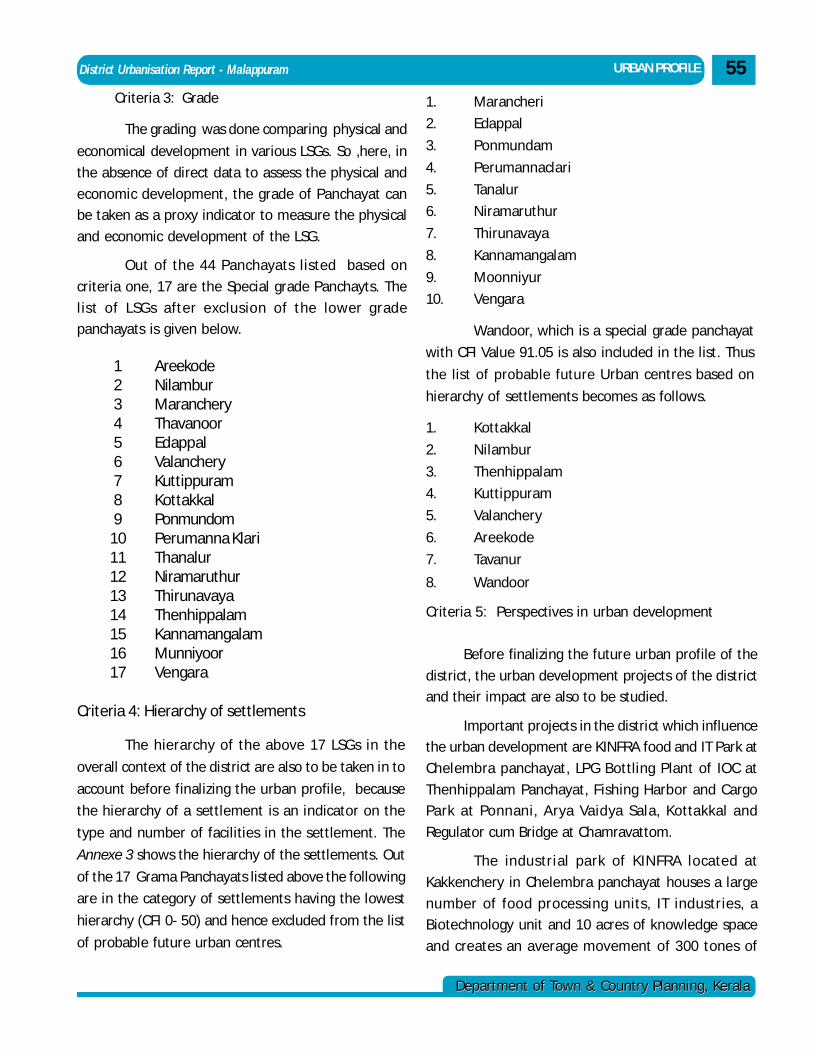
District Urbanisation Report - Malappuram
Department of Town & Country Planning, KeralaDepartment of Town & Country Planning, Kerala
URBAN PROFILE 55
Criteria 3: Grade
The grading was done comparing physical and
economical development in various LSGs. So ,here, in
the absence of direct data to assess the physical and
economic development, the grade of Panchayat can
be taken as a proxy indicator to measure the physical
and economic development of the LSG.
Out of the 44 Panchayats listed based on
criteria one, 17 are the Special grade Panchayts. The
list of LSGs after exclusion of the lower grade
panchayats is given below.
AreekodeNilamburMarancheryThavanoorEdappalValancheryKuttippuramKottakkalPonmundomPerumanna KlariThanalurNiramaruthurThirunavayaThenhippalamKannamangalamMunniyoorVengara
123456789
1011121314151617
Criteria 4: Hierarchy of settlements
The hierarchy of the above 17 LSGs in the
overall context of the district are also to be taken in to
account before finalizing the urban profile, because
the hierarchy of a settlement is an indicator on the
type and number of facilities in the settlement. The
Annexe 3 shows the hierarchy of the settlements. Out
of the 17 Grama Panchayats listed above the following
are in the category of settlements having the lowest
hierarchy (CFI 0- 50) and hence excluded from the list
of probable future urban centres.
1. Marancheri
2. Edappal
3. Ponmundam
4. Perumannaclari
5. Tanalur
6. Niramaruthur
7. Thirunavaya
8. Kannamangalam
9. Moonniyur
10. Vengara
Wandoor, which is a special grade panchayat
with CFI Value 91.05 is also included in the list. Thus
the list of probable future Urban centres based on
hierarchy of settlements becomes as follows.
1. Kottakkal
2. Nilambur
3. Thenhippalam
4. Kuttippuram
5. Valanchery
6. Areekode
7. Tavanur
8. Wandoor
Criteria 5: Perspectives in urban development
Before finalizing the future urban profile of the
district, the urban development projects of the district
and their impact are also to be studied.
Important projects in the district which influence
the urban development are KINFRA food and IT Park at
Chelembra panchayat, LPG Bottling Plant of IOC at
Thenhippalam Panchayat, Fishing Harbor and Cargo
Park at Ponnani, Arya Vaidya Sala, Kottakkal and
Regulator cum Bridge at Chamravattom.
The industrial park of KINFRA located at
Kakkenchery in Chelembra panchayat houses a large
number of food processing units, IT industries, a
Biotechnology unit and 10 acres of knowledge space
and creates an average movement of 300 tones of
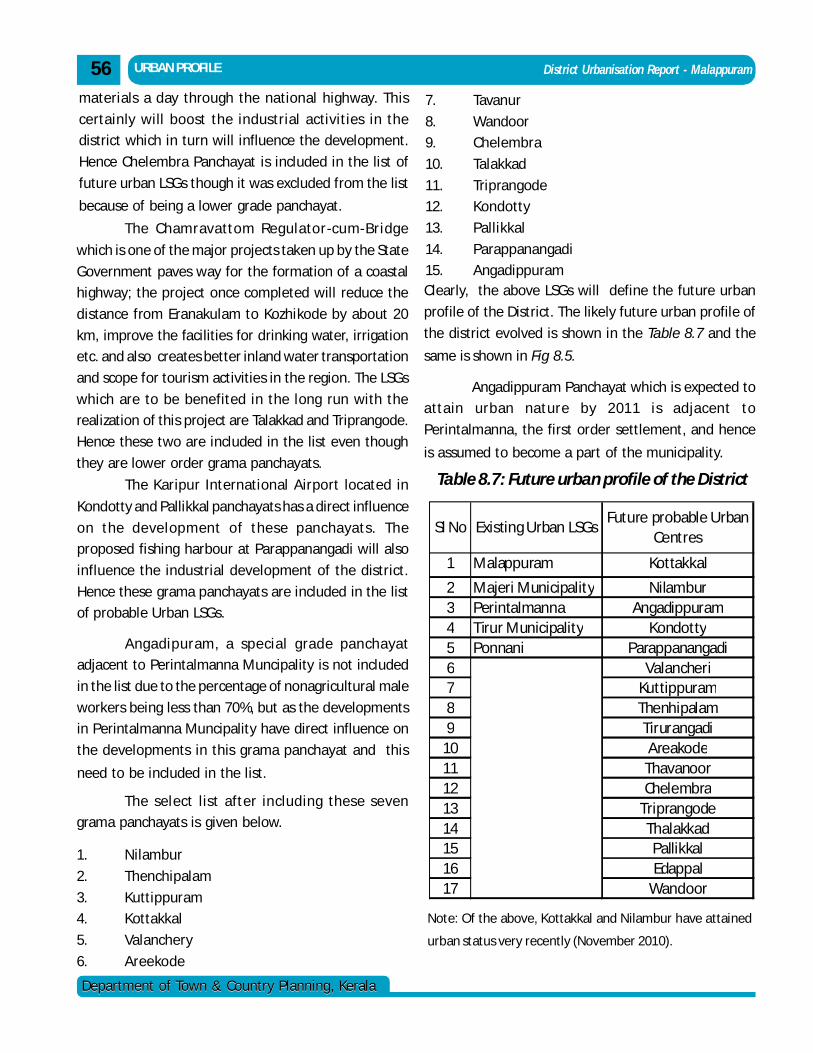
District Urbanisation Report - Malappuram
Department of Town & Country Planning, KeralaDepartment of Town & Country Planning, Kerala
URBAN PROFILE56materials a day through the national highway. This
certainly will boost the industrial activities in the
district which in turn will influence the development.
Hence Chelembra Panchayat is included in the list of
future urban LSGs though it was excluded from the list
because of being a lower grade panchayat.
The Chamravattom Regulator-cum-Bridge
which is one of the major projects taken up by the State
Government paves way for the formation of a coastal
highway; the project once completed will reduce the
distance from Eranakulam to Kozhikode by about 20
km, improve the facilities for drinking water, irrigation
etc. and also creates better inland water transportation
and scope for tourism activities in the region. The LSGs
which are to be benefited in the long run with the
realization of this project are Talakkad and Triprangode.
Hence these two are included in the list even though
they are lower order grama panchayats.
The Karipur International Airport located in
Kondotty and Pallikkal panchayats has a direct influence
on the development of these panchayats. The
proposed fishing harbour at Parappanangadi will also
influence the industrial development of the district.
Hence these grama panchayats are included in the list
of probable Urban LSGs.
Angadipuram, a special grade panchayat
adjacent to Perintalmanna Muncipality is not included
in the list due to the percentage of nonagricultural male
workers being less than 70%, but as the developments
in Perintalmanna Muncipality have direct influence on
the developments in this grama panchayat and this
need to be included in the list.
The select list after including these seven
grama panchayats is given below.
1. Nilambur
2. Thenchipalam
3. Kuttippuram
4. Kottakkal
5. Valanchery
6. Areekode
7. Tavanur
8. Wandoor
9. Chelembra
10. Talakkad
11. Triprangode
12. Kondotty
13. Pallikkal
14. Parappanangadi
15. AngadippuramClearly, the above LSGs will define the future urban
profile of the District. The likely future urban profile of
the district evolved is shown in the Table 8.7 and the
same is shown in Fig 8.5.
Angadippuram Panchayat which is expected to
attain urban nature by 2011 is adjacent to
Perintalmanna, the first order settlement, and hence
is assumed to become a part of the municipality.
Table 8.7: Future urban profile of the District
Sl No Existing Urban LSGsFuture probable Urban
Centres
1 Malappuram Kottakkal
2 Majeri Municipality Nilambur3 Perintalmanna Angadippuram4 Tirur Municipality Kondotty5 Ponnani Parappanangadi6 Valancheri7 Kuttippuram8 Thenhipalam9 Tirurangadi
10 Areakode11 Thavanoor12 Chelembra13 Triprangode14 Thalakkad15 Pallikkal16 Edappal17 Wandoor
Note: Of the above, Kottakkal and Nilambur have attained
urban status very recently (November 2010).
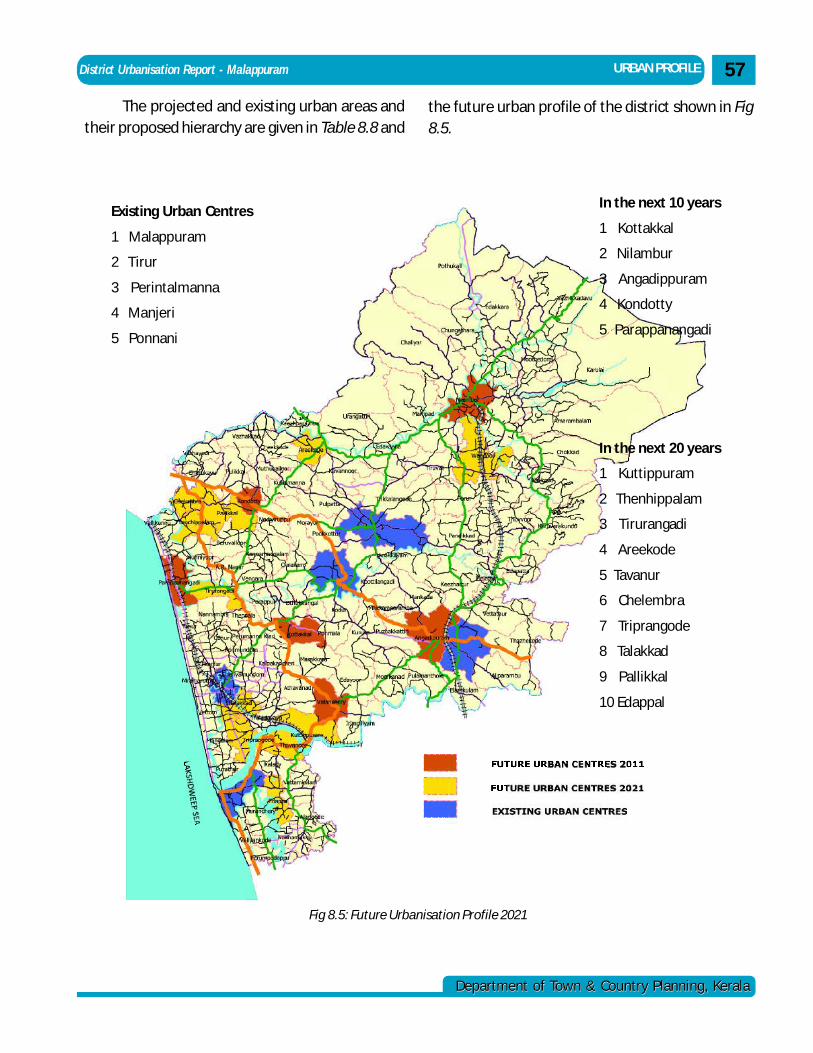
District Urbanisation Report - Malappuram
Department of Town & Country Planning, KeralaDepartment of Town & Country Planning, Kerala
URBAN PROFILE 57
The projected and existing urban areas andtheir proposed hierarchy are given in Table 8.8 and
the future urban profile of the district shown in Fig8.5.
Existing Urban Centres
1 Malappuram
2 Tirur
3 Perintalmanna
4 Manjeri
5 Ponnani
In the next 10 years
1 Kottakkal
2 Nilambur
3 Angadippuram
4 Kondotty
5 Parappanangadi
In the next 20 years
1 Kuttippuram
2 Thenhippalam
3 Tirurangadi
4 Areekode
5 Tavanur
6 Chelembra
7 Triprangode
8 Talakkad
9 Pallikkal
10 Edappal
Fig 8.5: Future Urbanisation Profile 2021
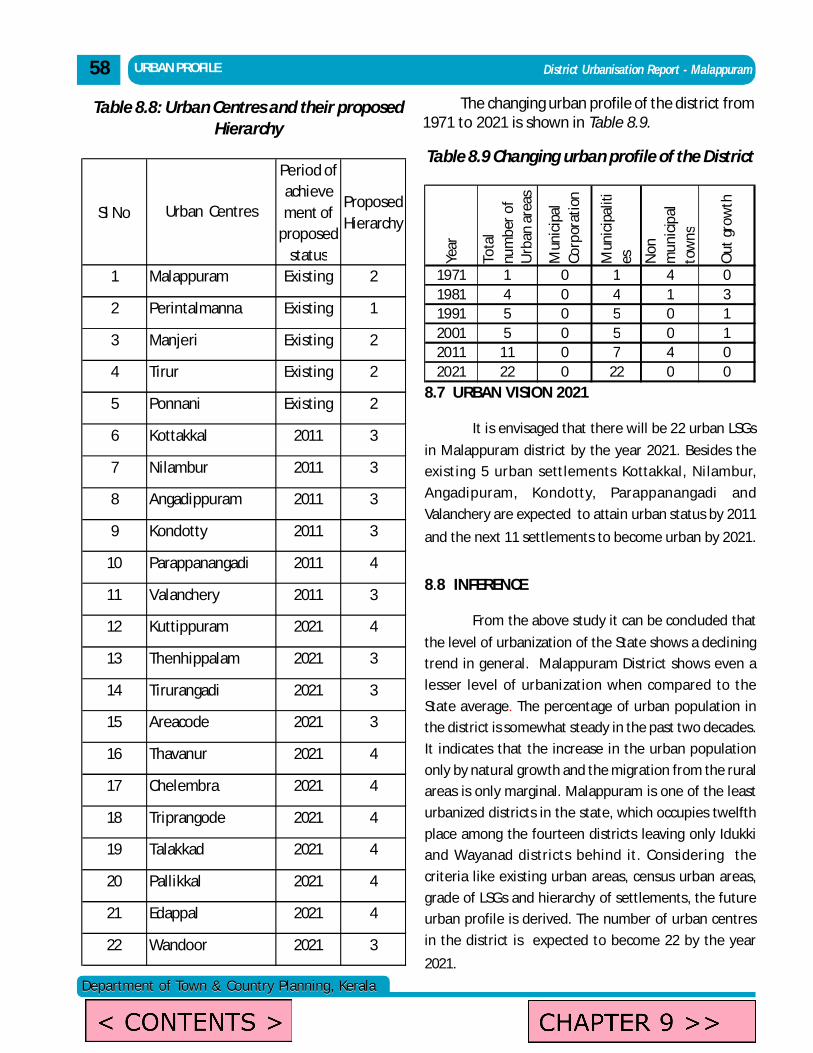
District Urbanisation Report - Malappuram
Department of Town & Country Planning, KeralaDepartment of Town & Country Planning, Kerala
URBAN PROFILE58
Table 8.8: Urban Centres and their proposedHierarchy
Table 8.9 Changing urban profile of the District
Year
Tota
l nu
mbe
r of
U
rban
are
as
Mun
icip
al
Corp
orat
ion
Mun
icip
aliti
es Non
m
unic
ipal
to
wns
Out
gro
wth
1971 1 0 1 4 01981 4 0 4 1 31991 5 0 5 0 12001 5 0 5 0 12011 11 0 7 4 02021 22 0 22 0 0
The changing urban profile of the district from1971 to 2021 is shown in Table 8.9.
8.7 URBAN VISION 2021
It is envisaged that there will be 22 urban LSGs
in Malappuram district by the year 2021. Besides the
existing 5 urban settlements Kottakkal, Nilambur,
Angadipuram, Kondotty, Parappanangadi and
Valanchery are expected to attain urban status by 2011
and the next 11 settlements to become urban by 2021.
8.8 INFERENCE
From the above study it can be concluded that
the level of urbanization of the State shows a declining
trend in general. Malappuram District shows even a
lesser level of urbanization when compared to the
State average. The percentage of urban population in
the district is somewhat steady in the past two decades.
It indicates that the increase in the urban population
only by natural growth and the migration from the rural
areas is only marginal. Malappuram is one of the least
urbanized districts in the state, which occupies twelfth
place among the fourteen districts leaving only Idukki
and Wayanad districts behind it. Considering the
criteria like existing urban areas, census urban areas,
grade of LSGs and hierarchy of settlements, the future
urban profile is derived. The number of urban centres
in the district is expected to become 22 by the year
2021.
Sl No
Period of achievement of
proposed status
Proposed Hierarchy
1 Existing 2
2 Existing 1
3 Existing 2
4 Existing 2
5 Existing 2
6 2011 3
7 2011 3
8 2011 3
9 2011 3
10 2011 4
11 2011 3
12 2021 4
13 2021 3
14 2021 3
15 2021 3
16 2021 4
17 2021 4
18 2021 4
19 2021 4
20 2021 4
21 2021 4
22 2021 3
Triprangode
Talakkad
Pallikkal
Edappal
Wandoor
Thavanur
Chelembra
Ponnani
Kottakkal
Nilambur
Kondotty
Parappanangadi
Valanchery
Angadippuram
Kuttippuram
Thenhippalam
Tirurangadi
Areacode
Urban Centres
Malappuram
Perintalmanna
Manjeri
Tirur
admin
Text Box
CHAPTER 9 >>
admin
Text Box
< CONTENTS >
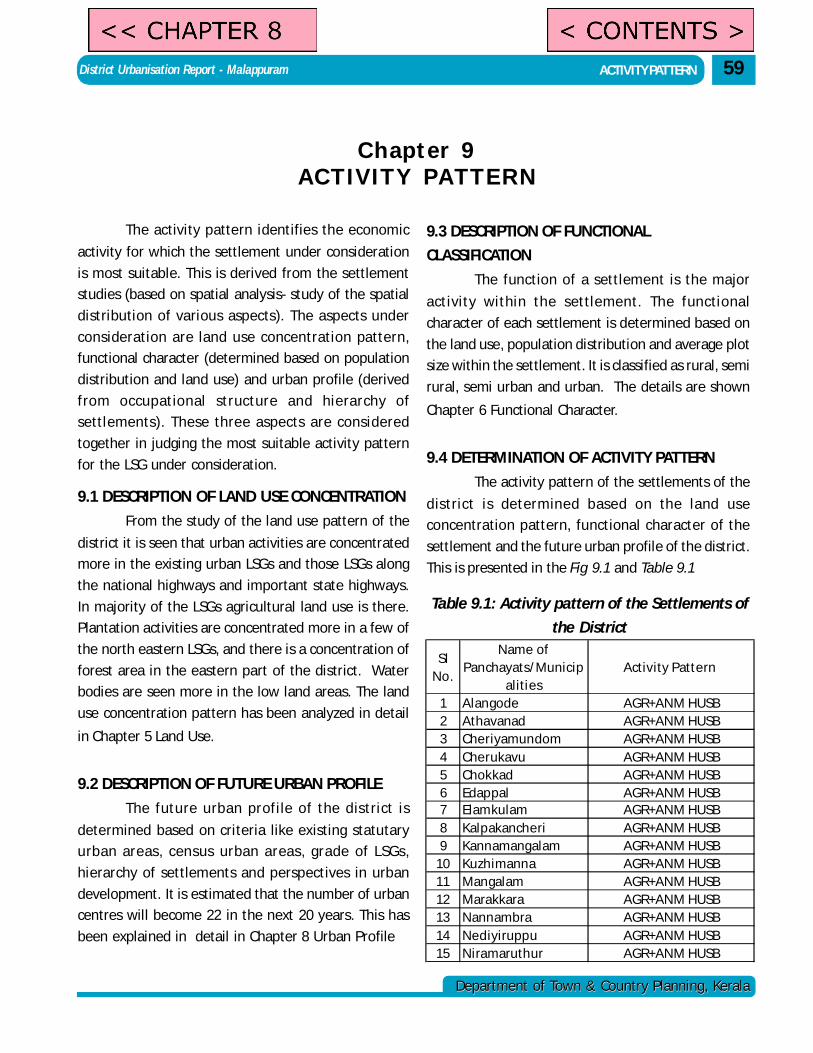
District Urbanisation Report - Malappuram
Department of Town & Country Planning, KeralaDepartment of Town & Country Planning, Kerala
Chapter 9ACTIVITY PATTERN
The activity pattern identifies the economic
activity for which the settlement under consideration
is most suitable. This is derived from the settlement
studies (based on spatial analysis- study of the spatial
distribution of various aspects). The aspects under
consideration are land use concentration pattern,
functional character (determined based on population
distribution and land use) and urban profile (derived
from occupational structure and hierarchy of
settlements). These three aspects are considered
together in judging the most suitable activity pattern
for the LSG under consideration.
9.1 DESCRIPTION OF LAND USE CONCENTRATION
From the study of the land use pattern of the
district it is seen that urban activities are concentrated
more in the existing urban LSGs and those LSGs along
the national highways and important state highways.
In majority of the LSGs agricultural land use is there.
Plantation activities are concentrated more in a few of
the north eastern LSGs, and there is a concentration of
forest area in the eastern part of the district. Water
bodies are seen more in the low land areas. The land
use concentration pattern has been analyzed in detail
in Chapter 5 Land Use.
9.2 DESCRIPTION OF FUTURE URBAN PROFILE
The future urban profile of the district is
determined based on criteria like existing statutary
urban areas, census urban areas, grade of LSGs,
hierarchy of settlements and perspectives in urban
development. It is estimated that the number of urban
centres will become 22 in the next 20 years. This has
been explained in detail in Chapter 8 Urban Profile
59ACTIVITY PATTERN
9.3 DESCRIPTION OF FUNCTIONAL
CLASSIFICATION
The function of a settlement is the major
activity within the settlement. The functional
character of each settlement is determined based on
the land use, population distribution and average plot
size within the settlement. It is classified as rural, semi
rural, semi urban and urban. The details are shown
Chapter 6 Functional Character.
9.4 DETERMINATION OF ACTIVITY PATTERN
The activity pattern of the settlements of the
district is determined based on the land use
concentration pattern, functional character of the
settlement and the future urban profile of the district.
This is presented in the Fig 9.1 and Table 9.1
Table 9.1: Activity pattern of the Settlements of
the District
Sl No.
Name of Panchayats/Municip
alitiesActivity Pattern
1 Alangode AGR+ANM HUSB2 Athavanad AGR+ANM HUSB3 Cheriyamundom AGR+ANM HUSB4 Cherukavu AGR+ANM HUSB5 Chokkad AGR+ANM HUSB6 Edappal AGR+ANM HUSB7 Elamkulam AGR+ANM HUSB8 Kalpakancheri AGR+ANM HUSB9 Kannamangalam AGR+ANM HUSB
10 Kuzhimanna AGR+ANM HUSB11 Mangalam AGR+ANM HUSB12 Marakkara AGR+ANM HUSB13 Nannambra AGR+ANM HUSB14 Nediyiruppu AGR+ANM HUSB15 Niramaruthur AGR+ANM HUSB
admin
Text Box
< CONTENTS >
admin
Text Box
<< CHAPTER 8
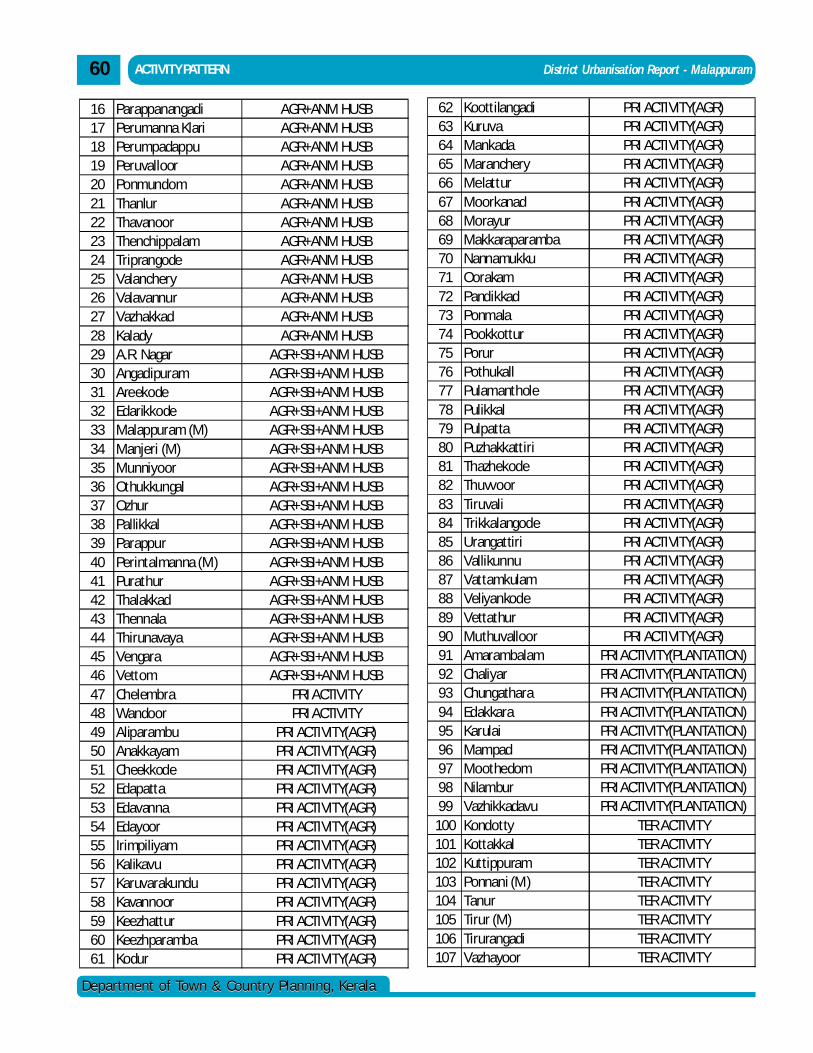
District Urbanisation Report - Malappuram
Department of Town & Country Planning, KeralaDepartment of Town & Country Planning, Kerala
ACTIVITY PATTERN60
62 Koottilangadi PRI ACTIVITY(AGR)63 Kuruva PRI ACTIVITY(AGR)64 Mankada PRI ACTIVITY(AGR)65 Maranchery PRI ACTIVITY(AGR)66 Melattur PRI ACTIVITY(AGR)67 Moorkanad PRI ACTIVITY(AGR)68 Morayur PRI ACTIVITY(AGR)69 Makkaraparamba PRI ACTIVITY(AGR)70 Nannamukku PRI ACTIVITY(AGR)71 Oorakam PRI ACTIVITY(AGR)72 Pandikkad PRI ACTIVITY(AGR)73 Ponmala PRI ACTIVITY(AGR)74 Pookkottur PRI ACTIVITY(AGR)75 Porur PRI ACTIVITY(AGR)76 Pothukall PRI ACTIVITY(AGR)77 Pulamanthole PRI ACTIVITY(AGR)78 Pulikkal PRI ACTIVITY(AGR)79 Pulpatta PRI ACTIVITY(AGR)80 Puzhakkattiri PRI ACTIVITY(AGR)81 Thazhekode PRI ACTIVITY(AGR)82 Thuvvoor PRI ACTIVITY(AGR)83 Tiruvali PRI ACTIVITY(AGR)84 Trikkalangode PRI ACTIVITY(AGR)85 Urangattiri PRI ACTIVITY(AGR)86 Vallikunnu PRI ACTIVITY(AGR)87 Vattamkulam PRI ACTIVITY(AGR)88 Veliyankode PRI ACTIVITY(AGR)89 Vettathur PRI ACTIVITY(AGR)90 Muthuvalloor PRI ACTIVITY(AGR)91 Amarambalam PRI ACTIVITY(PLANTATION)92 Chaliyar PRI ACTIVITY(PLANTATION)93 Chungathara PRI ACTIVITY(PLANTATION)94 Edakkara PRI ACTIVITY(PLANTATION)95 Karulai PRI ACTIVITY(PLANTATION)96 Mampad PRI ACTIVITY(PLANTATION)97 Moothedom PRI ACTIVITY(PLANTATION)98 Nilambur PRI ACTIVITY(PLANTATION)99 Vazhikkadavu PRI ACTIVITY(PLANTATION)100 Kondotty TER ACTIVITY101 Kottakkal TER ACTIVITY102 Kuttippuram TER ACTIVITY103 Ponnani (M) TER ACTIVITY104 Tanur TER ACTIVITY105 Tirur (M) TER ACTIVITY106 Tirurangadi TER ACTIVITY107 Vazhayoor TER ACTIVITY
16 Parappanangadi AGR+ANM HUSB17 Perumanna Klari AGR+ANM HUSB18 Perumpadappu AGR+ANM HUSB19 Peruvalloor AGR+ANM HUSB20 Ponmundom AGR+ANM HUSB21 Thanlur AGR+ANM HUSB22 Thavanoor AGR+ANM HUSB23 Thenchippalam AGR+ANM HUSB24 Triprangode AGR+ANM HUSB25 Valanchery AGR+ANM HUSB26 Valavannur AGR+ANM HUSB27 Vazhakkad AGR+ANM HUSB28 Kalady AGR+ANM HUSB29 A.R. Nagar AGR+SSI+ANM HUSB30 Angadipuram AGR+SSI+ANM HUSB31 Areekode AGR+SSI+ANM HUSB32 Edarikkode AGR+SSI+ANM HUSB33 Malappuram (M) AGR+SSI+ANM HUSB34 Manjeri (M) AGR+SSI+ANM HUSB35 Munniyoor AGR+SSI+ANM HUSB36 Othukkungal AGR+SSI+ANM HUSB37 Ozhur AGR+SSI+ANM HUSB38 Pallikkal AGR+SSI+ANM HUSB39 Parappur AGR+SSI+ANM HUSB40 Perintalmanna (M) AGR+SSI+ANM HUSB41 Purathur AGR+SSI+ANM HUSB42 Thalakkad AGR+SSI+ANM HUSB43 Thennala AGR+SSI+ANM HUSB44 Thirunavaya AGR+SSI+ANM HUSB45 Vengara AGR+SSI+ANM HUSB46 Vettom AGR+SSI+ANM HUSB47 Chelembra PRI ACTIVITY48 Wandoor PRI ACTIVITY49 Aliparambu PRI ACTIVITY(AGR)50 Anakkayam PRI ACTIVITY(AGR)51 Cheekkode PRI ACTIVITY(AGR)52 Edapatta PRI ACTIVITY(AGR)53 Edavanna PRI ACTIVITY(AGR)54 Edayoor PRI ACTIVITY(AGR)55 Irimpiliyam PRI ACTIVITY(AGR)56 Kalikavu PRI ACTIVITY(AGR)57 Karuvarakundu PRI ACTIVITY(AGR)58 Kavannoor PRI ACTIVITY(AGR)59 Keezhattur PRI ACTIVITY(AGR)60 Keezhparamba PRI ACTIVITY(AGR)61 Kodur PRI ACTIVITY(AGR)
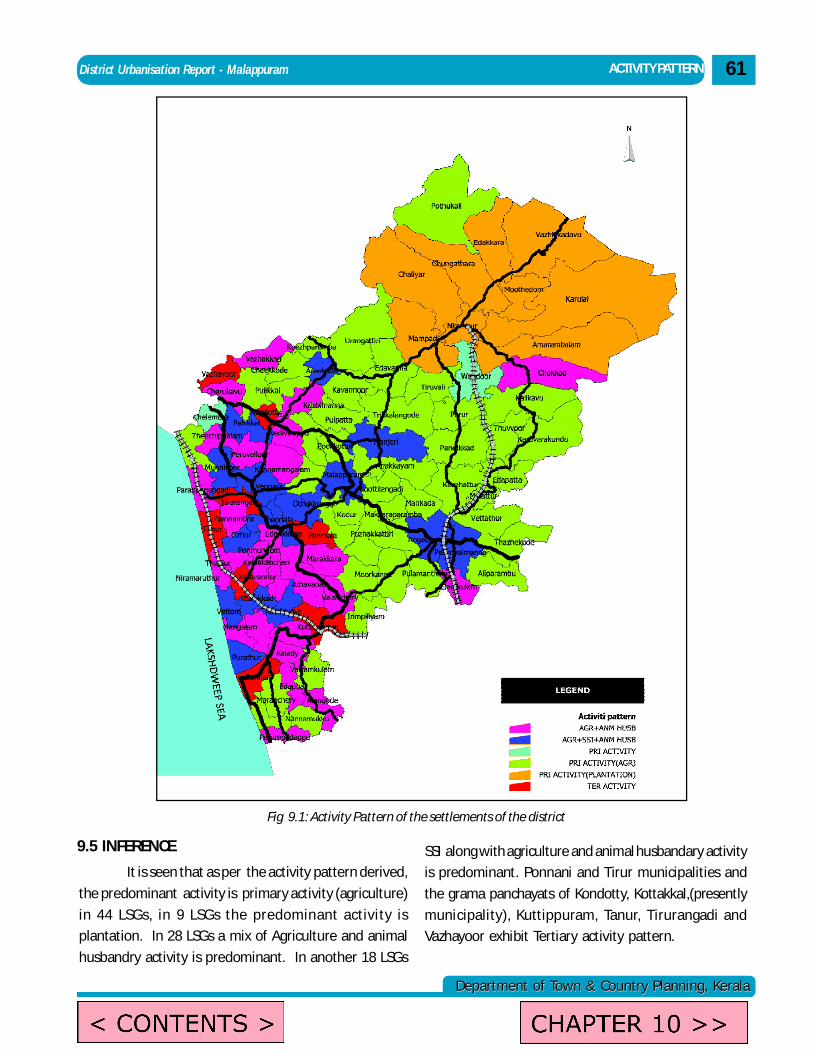
District Urbanisation Report - Malappuram
Department of Town & Country Planning, KeralaDepartment of Town & Country Planning, Kerala
ACTIVITY PATTERN 61
Fig 9.1: Activity Pattern of the settlements of the district
It is seen that as per the activity pattern derived,
the predominant activity is primary activity (agriculture)
in 44 LSGs, in 9 LSGs the predominant activity is
plantation. In 28 LSGs a mix of Agriculture and animal
husbandry activity is predominant. In another 18 LSGs
SSI along with agriculture and animal husbandary activity
is predominant. Ponnani and Tirur municipalities and
the grama panchayats of Kondotty, Kottakkal,(presently
municipality), Kuttippuram, Tanur, Tirurangadi and
Vazhayoor exhibit Tertiary activity pattern.
9.5 INFERENCE
admin
Text Box
< CONTENTS >
admin
Text Box
CHAPTER 10 >>
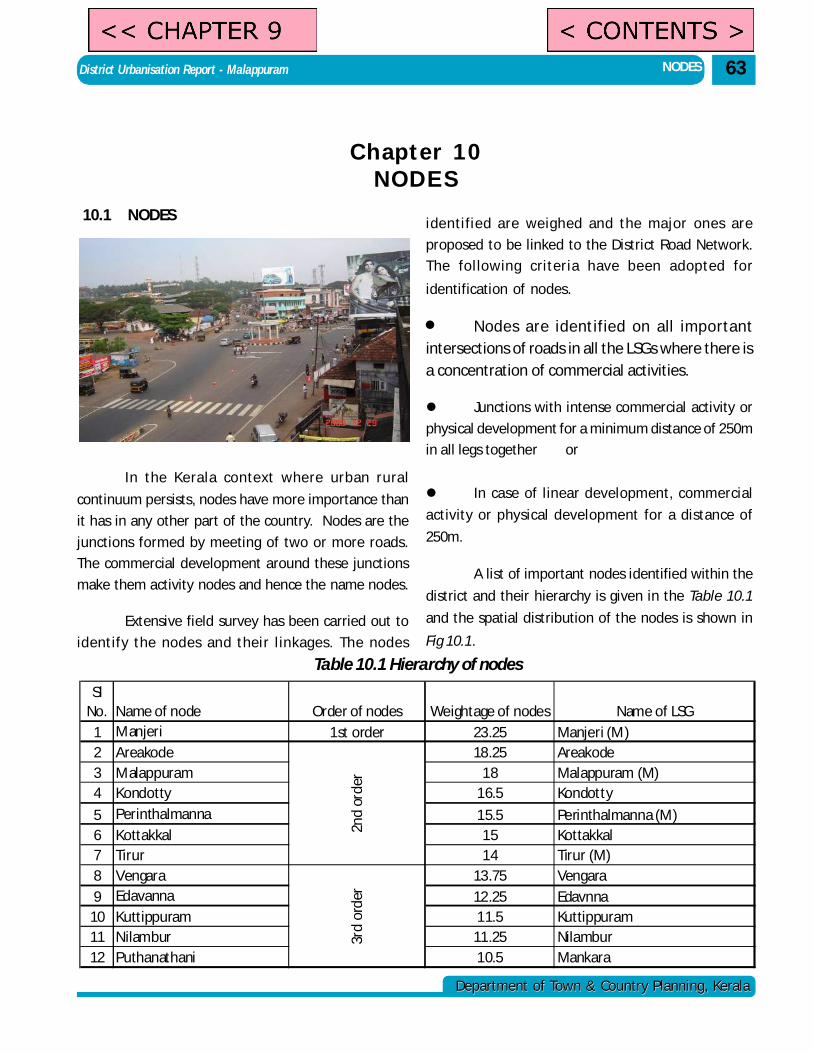
District Urbanisation Report - Malappuram
Department of Town & Country Planning, KeralaDepartment of Town & Country Planning, Kerala
Chapter 10NODES
In the Kerala context where urban rural
continuum persists, nodes have more importance than
it has in any other part of the country. Nodes are the
junctions formed by meeting of two or more roads.
The commercial development around these junctions
make them activity nodes and hence the name nodes.
Extensive field survey has been carried out to
identify the nodes and their l inkages. The nodes
NODES 63
identified are weighed and the major ones are
proposed to be linked to the District Road Network.
The following criteria have been adopted for
identification of nodes.
Nodes are identified on all importantintersections of roads in all the LSGs where there isa concentration of commercial activities.
Junctions with intense commercial activity or
physical development for a minimum distance of 250m
in all legs together or
In case of linear development, commercial
activity or physical development for a distance of
250m.
A list of important nodes identified within the
district and their hierarchy is given in the Table 10.1
and the spatial distribution of the nodes is shown in
Fig 10.1.
10.1 NODES
Table 10.1 Hierarchy of nodes
Sl No. Name of node Order of nodes Weightage of nodes Name of LSG
1 Manjeri 1st order 23.25 Manjeri (M)2 Areakode 18.25 Areakode 3 Malappuram 18 Malappuram (M)4 Kondotty 16.5 Kondotty
5 Perinthalmanna 15.5 Perinthalmanna (M)6 Kottakkal 15 Kottakkal 7 Tirur 14 Tirur (M)8 Vengara 13.75 Vengara 9 Edavanna 12.25 Edavnna
10 Kuttippuram 11.5 Kuttippuram 11 Nilambur 11.25 Nilambur 12 Puthanathani 10.5 Mankara
2nd
orde
r 3r
d or
der
admin
Text Box
<< CHAPTER 9
admin
Text Box
< CONTENTS >
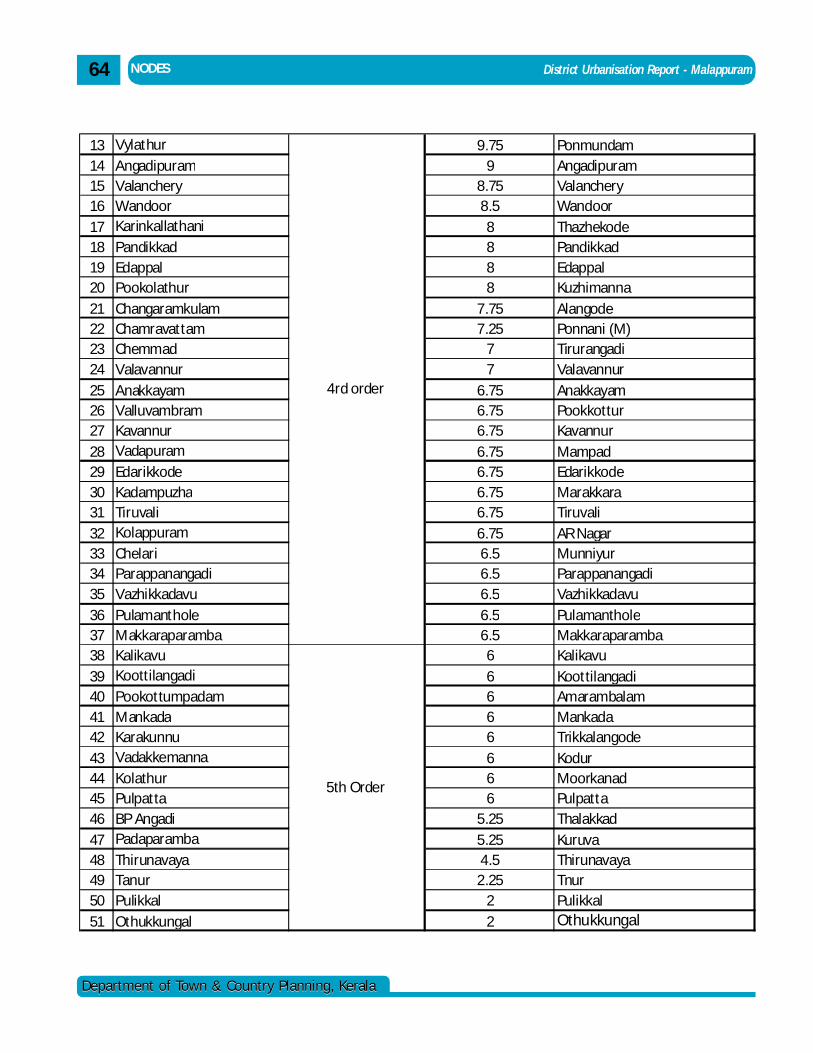
District Urbanisation Report - Malappuram
Department of Town & Country Planning, KeralaDepartment of Town & Country Planning, Kerala
NODES64
13 Vylathur 9.75 Ponmundam 14 Angadipuram 9 Angadipuram 15 Valanchery 8.75 Valanchery 16 Wandoor 8.5 Wandoor 17 Karinkallathani 8 Thazhekode 18 Pandikkad 8 Pandikkad 19 Edappal 8 Edappal 20 Pookolathur 8 Kuzhimanna21 Changaramkulam 7.75 Alangode 22 Chamravattam 7.25 Ponnani (M)23 Chemmad 7 Tirurangadi 24 Valavannur 7 Valavannur 25 Anakkayam 6.75 Anakkayam 26 Valluvambram 6.75 Pookkottur 27 Kavannur 6.75 Kavannur 28 Vadapuram 6.75 Mampad 29 Edarikkode 6.75 Edarikkode 30 Kadampuzha 6.75 Marakkara 31 Tiruvali 6.75 Tiruvali 32 Kolappuram 6.75 AR Nagar 33 Chelari 6.5 Munniyur34 Parappanangadi 6.5 Parappanangadi 35 Vazhikkadavu 6.5 Vazhikkadavu36 Pulamanthole 6.5 Pulamanthole37 Makkaraparamba 6.5 Makkaraparamba 38 Kalikavu 6 Kalikavu 39 Koottilangadi 6 Koottilangadi 40 Pookottumpadam 6 Amarambalam 41 Mankada 6 Mankada 42 Karakunnu 6 Trikkalangode 43 Vadakkemanna 6 Kodur 44 Kolathur 6 Moorkanad 45 Pulpatta 6 Pulpatta 46 BP Angadi 5.25 Thalakkad 47 Padaparamba 5.25 Kuruva 48 Thirunavaya 4.5 Thirunavaya 49 Tanur 2.25 Tnur 50 Pulikkal 2 Pulikkal 51 Othukkungal 2 Othukkungal
4rd order
5th Order
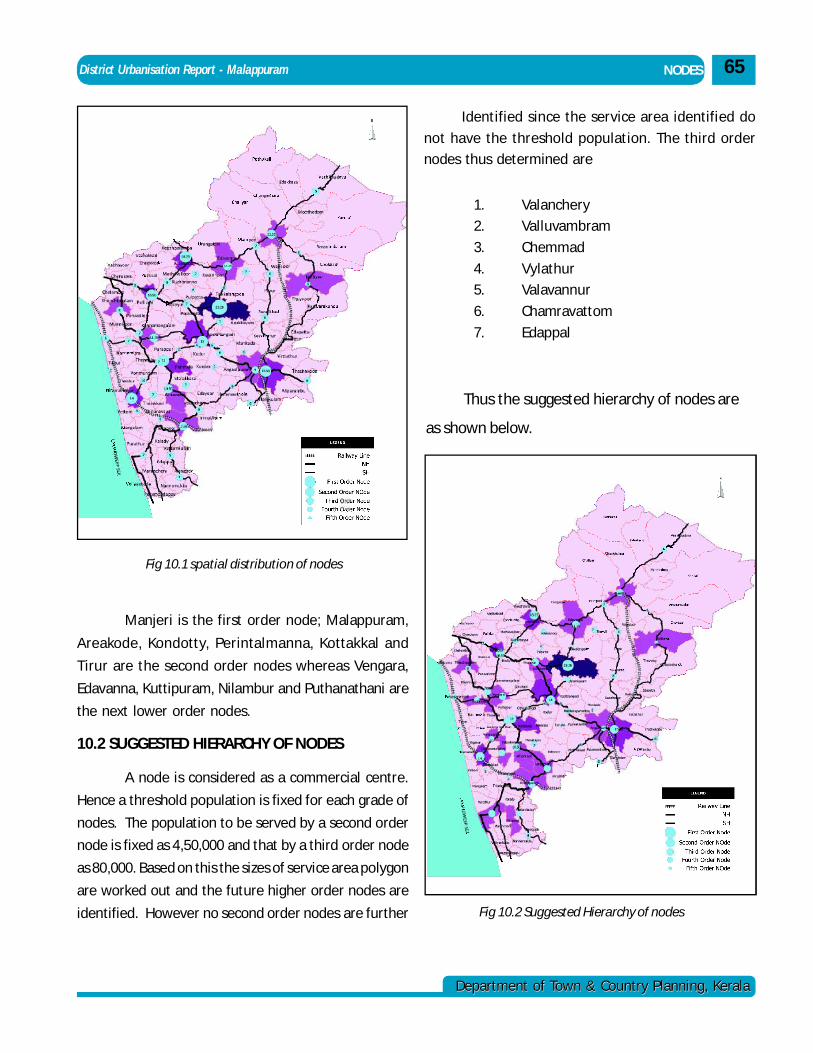
District Urbanisation Report - Malappuram
Department of Town & Country Planning, KeralaDepartment of Town & Country Planning, Kerala
Fig 10.1 spatial distribution of nodes
NODES 65
Manjeri is the first order node; Malappuram,
Areakode, Kondotty, Perintalmanna, Kottakkal and
Tirur are the second order nodes whereas Vengara,
Edavanna, Kuttipuram, Nilambur and Puthanathani are
the next lower order nodes.
10.2 SUGGESTED HIERARCHY OF NODES
A node is considered as a commercial centre.
Hence a threshold population is fixed for each grade of
nodes. The population to be served by a second order
node is fixed as 4,50,000 and that by a third order node
as 80,000. Based on this the sizes of service area polygon
are worked out and the future higher order nodes are
identified. However no second order nodes are further
Thus the suggested hierarchy of nodes are
as shown below.
Fig 10.2 Suggested Hierarchy of nodes
Identified since the service area identified do
not have the threshold population. The third order
nodes thus determined are
1. Valanchery
2. Valluvambram
3. Chemmad
4. Vylathur
5. Valavannur
6. Chamravattom
7. Edappal
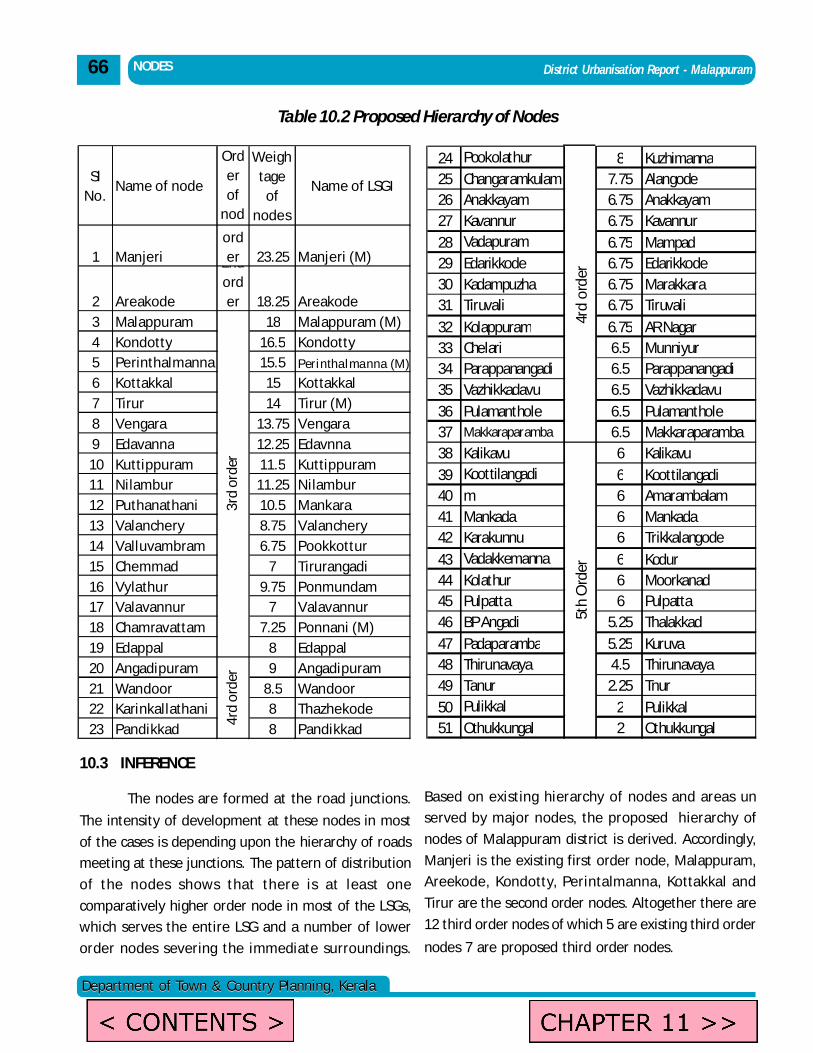
District Urbanisation Report - Malappuram
Department of Town & Country Planning, KeralaDepartment of Town & Country Planning, Kerala
Table 10.2 Proposed Hierarchy of Nodes
NODES66
10.3 INFERENCE
The nodes are formed at the road junctions.
The intensity of development at these nodes in most
of the cases is depending upon the hierarchy of roads
meeting at these junctions. The pattern of distribution
of the nodes shows that there is at least one
comparatively higher order node in most of the LSGs,
which serves the entire LSG and a number of lower
order nodes severing the immediate surroundings.
Based on existing hierarchy of nodes and areas un
served by major nodes, the proposed hierarchy of
nodes of Malappuram district is derived. Accordingly,
Manjeri is the existing first order node, Malappuram,
Areekode, Kondotty, Perintalmanna, Kottakkal and
Tirur are the second order nodes. Altogether there are
12 third order nodes of which 5 are existing third order
nodes 7 are proposed third order nodes.
Sl No.
Name of node
Order of
nod
Weightage
of nodes
Name of LSGI
1 Manjeri
1st order 23.25 Manjeri (M)
2 Areakode
2nd order 18.25 Areakode
3 Malappuram 18 Malappuram (M)4 Kondotty 16.5 Kondotty 5 Perinthalmanna 15.5 Perinthalmanna (M)
6 Kottakkal 15 Kottakkal 7 Tirur 14 Tirur (M)8 Vengara 13.75 Vengara 9 Edavanna 12.25 Edavnna 10 Kuttippuram 11.5 Kuttippuram 11 Nilambur 11.25 Nilambur 12 Puthanathani 10.5 Mankara 13 Valanchery 8.75 Valanchery 14 Valluvambram 6.75 Pookkottur 15 Chemmad 7 Tirurangadi 16 Vylathur 9.75 Ponmundam 17 Valavannur 7 Valavannur 18 Chamravattam 7.25 Ponnani (M)19 Edappal 8 Edappal 20 Angadipuram 9 Angadipuram 21 Wandoor 8.5 Wandoor 22 Karinkallathani 8 Thazhekode 23 Pandikkad 8 Pandikkad
3rd
orde
r 4r
d or
der
24 Pookolathur 8 Kuzhimanna25 Changaramkulam 7.75 Alangode 26 Anakkayam 6.75 Anakkayam 27 Kavannur 6.75 Kavannur 28 Vadapuram 6.75 Mampad 29 Edarikkode 6.75 Edarikkode 30 Kadampuzha 6.75 Marakkara 31 Tiruvali 6.75 Tiruvali 32 Kolappuram 6.75 AR Nagar 33 Chelari 6.5 Munniyur 34 Parappanangadi 6.5 Parappanangadi 35 Vazhikkadavu 6.5 Vazhikkadavu36 Pulamanthole 6.5 Pulamanthole37 Makkaraparamba 6.5 Makkaraparamba 38 Kalikavu 6 Kalikavu 39 Koottilangadi 6 Koottilangadi 40 m 6 Amarambalam 41 Mankada 6 Mankada 42 Karakunnu 6 Trikkalangode 43 Vadakkemanna 6 Kodur 44 Kolathur 6 Moorkanad 45 Pulpatta 6 Pulpatta 46 BP Angadi 5.25 Thalakkad 47 Padaparamba 5.25 Kuruva 48 Thirunavaya 4.5 Thirunavaya 49 Tanur 2.25 Tnur 50 Pulikkal 2 Pulikkal 51 Othukkungal 2 Othukkungal
5th
Ord
er
4rd
orde
r
admin
Text Box
< CONTENTS >
admin
Text Box
CHAPTER 11 >>
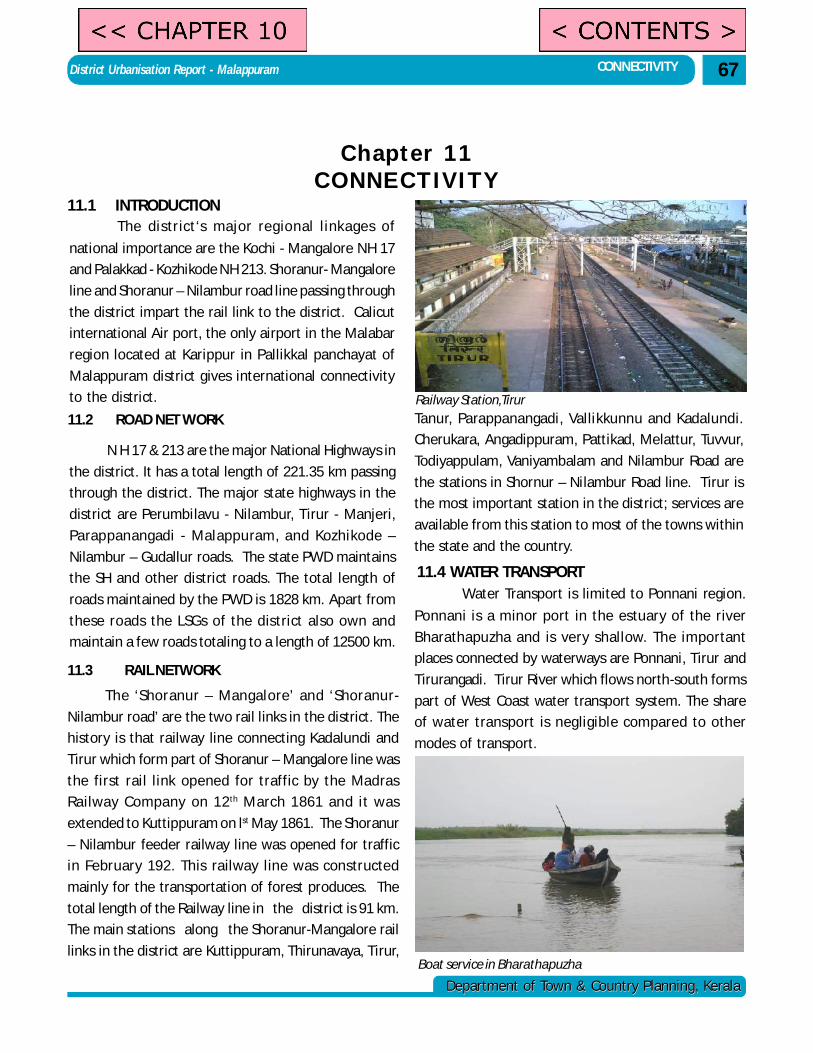
District Urbanisation Report - Malappuram
Department of Town & Country Planning, KeralaDepartment of Town & Country Planning, Kerala
Chapter 11CONNECTIVITY
11.1 INTRODUCTION
CONNECTIVITY 67
11.3 RAIL NETWORK
The ‘Shoranur – Mangalore’ and ‘Shoranur-
Nilambur road’ are the two rail links in the district. The
history is that railway line connecting Kadalundi and
Tirur which form part of Shoranur – Mangalore line was
the first rail link opened for traffic by the Madras
Railway Company on 12th March 1861 and it was
extended to Kuttippuram on lst May 1861. The Shoranur
– Nilambur feeder railway line was opened for traffic
in February 192. This railway line was constructed
mainly for the transportation of forest produces. The
total length of the Railway line in the district is 91 km.
The main stations along the Shoranur-Mangalore rail
links in the district are Kuttippuram, Thirunavaya, Tirur,
N H 17 & 213 are the major National Highways in
the district. It has a total length of 221.35 km passing
through the district. The major state highways in the
district are Perumbilavu - Nilambur, Tirur - Manjeri,
Parappanangadi - Malappuram, and Kozhikode –
Nilambur – Gudallur roads. The state PWD maintains
the SH and other district roads. The total length of
roads maintained by the PWD is 1828 km. Apart from
these roads the LSGs of the district also own and
maintain a few roads totaling to a length of 12500 km.
11.2 ROAD NET WORK
The district‘s major regional l inkages of
national importance are the Kochi - Mangalore NH 17
and Palakkad - Kozhikode NH 213. Shoranur- Mangalore
line and Shoranur – Nilambur road line passing through
the district impart the rail link to the district. Calicut
international Air port, the only airport in the Malabar
region located at Karippur in Pallikkal panchayat of
Malappuram district gives international connectivity
to the district.
Tanur, Parappanangadi, Vallikkunnu and Kadalundi.
Cherukara, Angadippuram, Pattikad, Melattur, Tuvvur,
Todiyappulam, Vaniyambalam and Nilambur Road are
the stations in Shornur – Nilambur Road line. Tirur is
the most important station in the district; services are
available from this station to most of the towns within
the state and the country.
11.4 WATER TRANSPORTWater Transport is limited to Ponnani region.
Ponnani is a minor port in the estuary of the river
Bharathapuzha and is very shallow. The important
places connected by waterways are Ponnani, Tirur and
Tirurangadi. Tirur River which flows north-south forms
part of West Coast water transport system. The share
of water transport is negligible compared to other
modes of transport.
Railway Station,Tirur
Boat service in Bharathapuzha
admin
Text Box
< CONTENTS >
admin
Text Box
<< CHAPTER 10
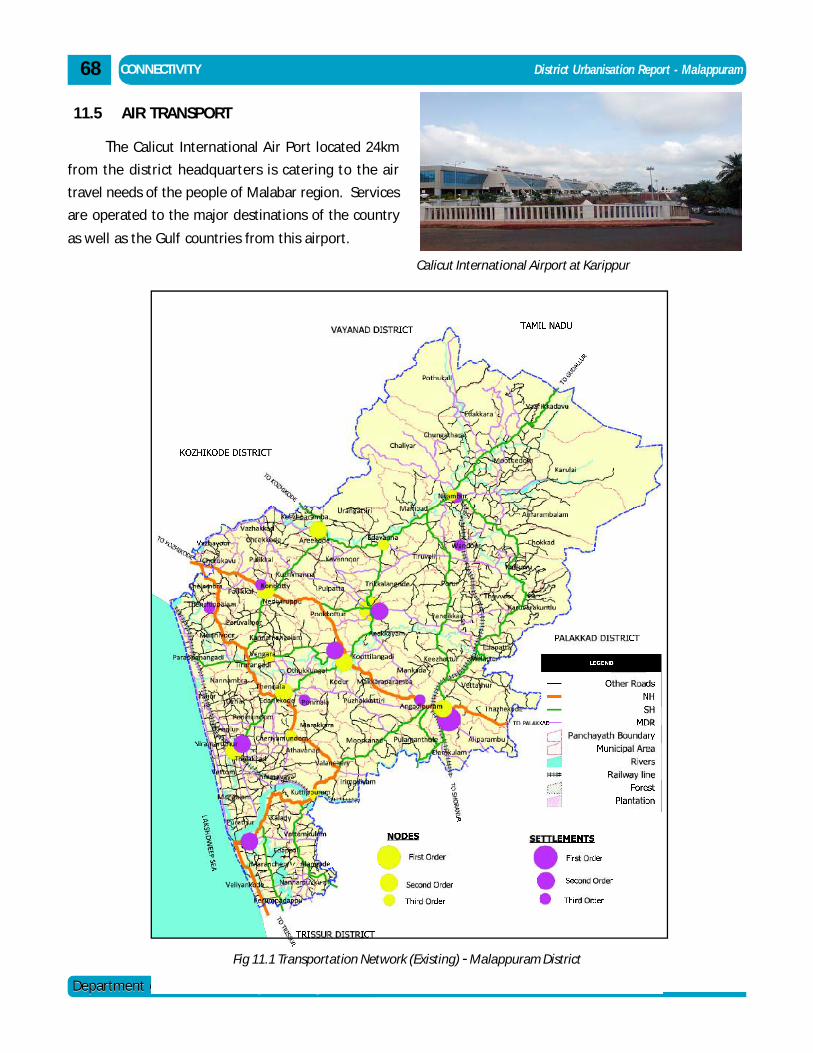
District Urbanisation Report - Malappuram
Department of Town & Country Planning, KeralaDepartment of Town & Country Planning, Kerala
The Calicut International Air Port located 24km
from the district headquarters is catering to the air
travel needs of the people of Malabar region. Services
are operated to the major destinations of the country
as well as the Gulf countries from this airport.
Calicut International Airport at Karippur
CONNECTIVITY68
Fig 11.1 Transportation Network (Existing) - Malappuram District
11.5 AIR TRANSPORT
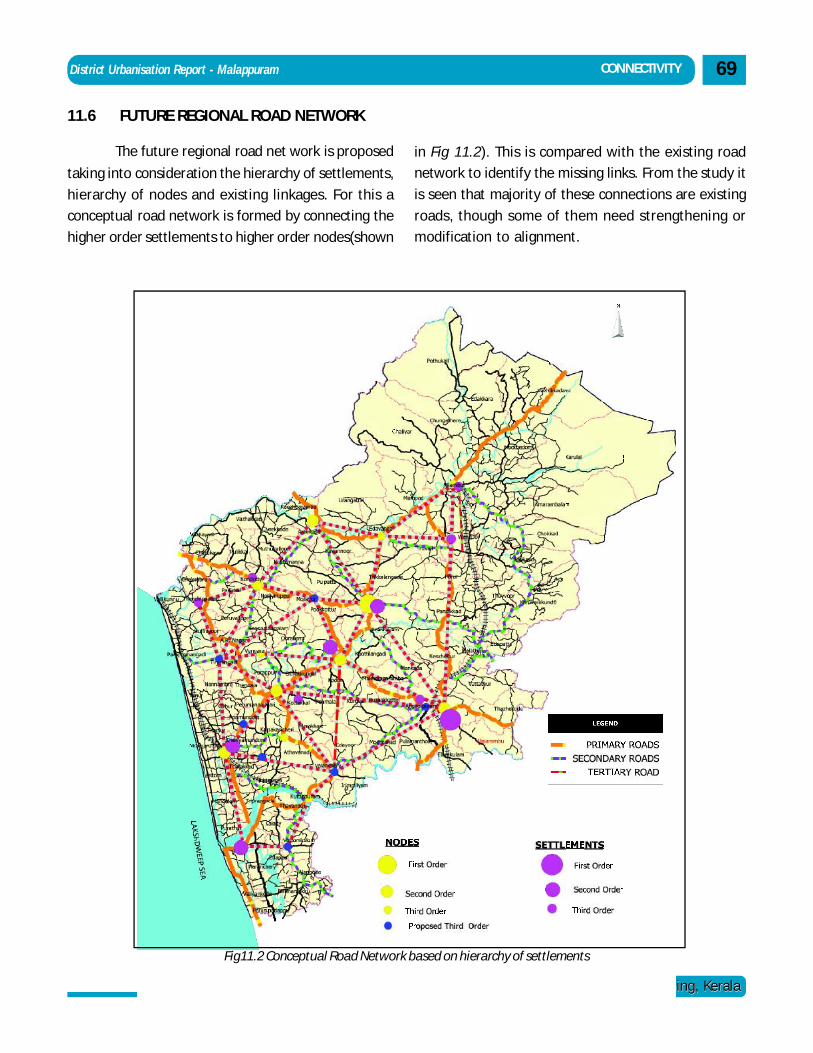
District Urbanisation Report - Malappuram
Department of Town & Country Planning, KeralaDepartment of Town & Country Planning, Kerala
11.6 FUTURE REGIONAL ROAD NETWORK
The future regional road net work is proposed
taking into consideration the hierarchy of settlements,
hierarchy of nodes and existing linkages. For this a
conceptual road network is formed by connecting the
higher order settlements to higher order nodes(shown
in Fig 11.2). This is compared with the existing road
network to identify the missing links. From the study it
is seen that majority of these connections are existing
roads, though some of them need strengthening or
modification to alignment.
Fig11.2 Conceptual Road Network based on hierarchy of settlements
69CONNECTIVITY
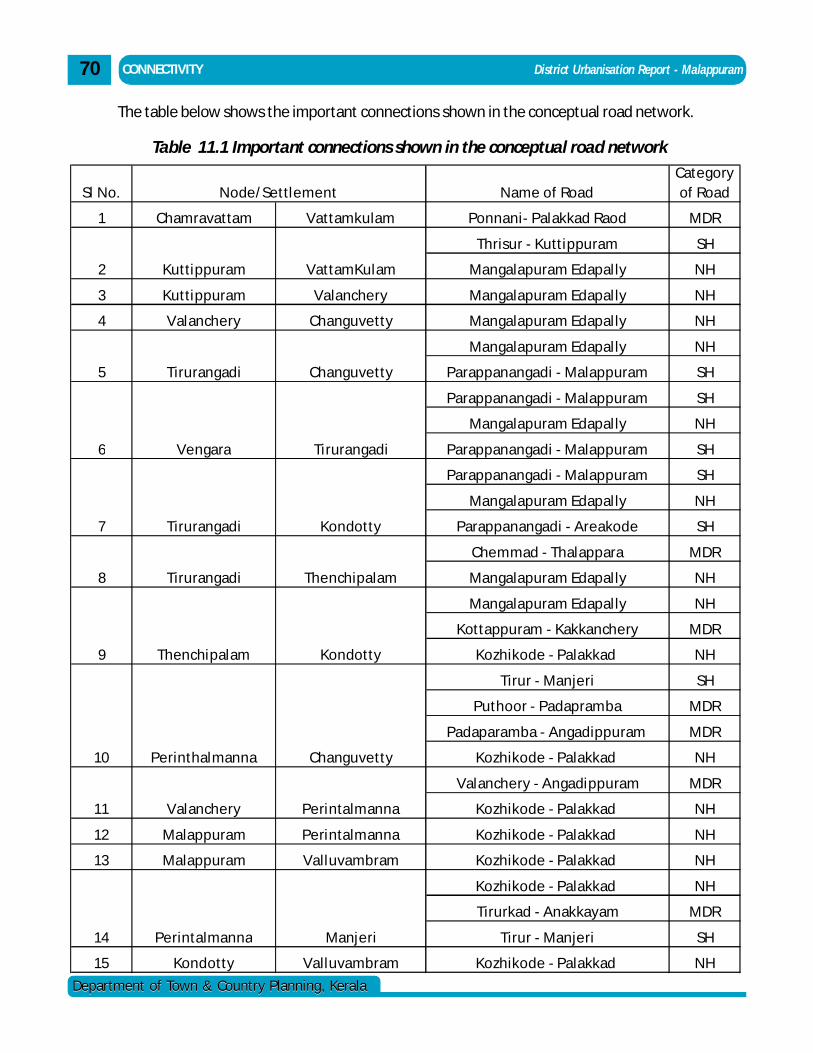
District Urbanisation Report - Malappuram
Department of Town & Country Planning, KeralaDepartment of Town & Country Planning, Kerala
The table below shows the important connections shown in the conceptual road network.
CONNECTIVITY
Table 11.1 Important connections shown in the conceptual road network
Sl No. Name of RoadCategory of Road
1 Chamravattam Vattamkulam Ponnani- Palakkad Raod MDR
Thrisur - Kuttippuram SH
Mangalapuram Edapally NH
3 Kuttippuram Valanchery Mangalapuram Edapally NH
4 Valanchery Changuvetty Mangalapuram Edapally NH
Mangalapuram Edapally NH
Parappanangadi - Malappuram SH
Parappanangadi - Malappuram SH
Mangalapuram Edapally NH
Parappanangadi - Malappuram SH
Parappanangadi - Malappuram SH
Mangalapuram Edapally NH
Parappanangadi - Areakode SH
Chemmad - Thalappara MDR
Mangalapuram Edapally NH
Mangalapuram Edapally NH
Kottappuram - Kakkanchery MDR
Kozhikode - Palakkad NH
Tirur - Manjeri SH
Puthoor - Padapramba MDR
Padaparamba - Angadippuram MDR
Kozhikode - Palakkad NH
Valanchery - Angadippuram MDR
Kozhikode - Palakkad NH
12 Malappuram Perintalmanna Kozhikode - Palakkad NH
13 Malappuram Valluvambram Kozhikode - Palakkad NH
Kozhikode - Palakkad NH
Tirurkad - Anakkayam MDR
Tirur - Manjeri SH
15 Kondotty Valluvambram Kozhikode - Palakkad NH
14 Perintalmanna Manjeri
10 Perinthalmanna Changuvetty
11 Valanchery Perintalmanna
8 Tirurangadi Thenchipalam
9 Thenchipalam Kondotty
6 Vengara Tirurangadi
7 Tirurangadi Kondotty
Node/Settlement
2 Kuttippuram VattamKulam
5 Tirurangadi Changuvetty
70
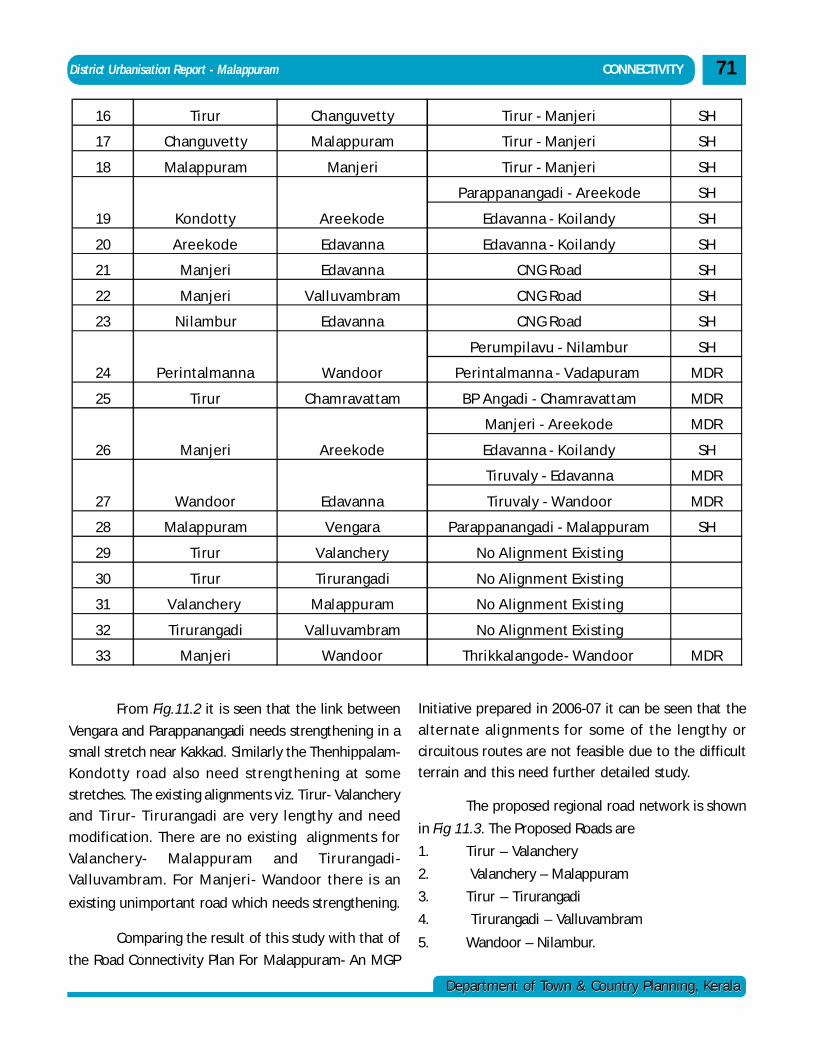
District Urbanisation Report - Malappuram
Department of Town & Country Planning, KeralaDepartment of Town & Country Planning, Kerala
71
From Fig.11.2 it is seen that the link between
Vengara and Parappanangadi needs strengthening in a
small stretch near Kakkad. Similarly the Thenhippalam-
Kondotty road also need strengthening at some
stretches. The existing alignments viz. Tirur- Valanchery
and Tirur- Tirurangadi are very lengthy and need
modification. There are no existing alignments for
Valanchery- Malappuram and T irurangadi-
Valluvambram. For Manjeri- Wandoor there is an
existing unimportant road which needs strengthening.
Comparing the result of this study with that of
the Road Connectivity Plan For Malappuram- An MGP
Initiative prepared in 2006-07 it can be seen that the
alternate alignments for some of the lengthy or
circuitous routes are not feasible due to the difficult
terrain and this need further detailed study.
The proposed regional road network is shown
in Fig 11.3. The Proposed Roads are
1. Tirur – Valanchery
2. Valanchery – Malappuram
3. Tirur – Tirurangadi
4. Tirurangadi – Valluvambram
5. Wandoor – Nilambur.
16 Tirur Changuvetty Tirur - Manjeri SH
17 Changuvetty Malappuram Tirur - Manjeri SH
18 Malappuram Manjeri Tirur - Manjeri SH
Parappanangadi - Areekode SH
Edavanna - Koilandy SH
20 Areekode Edavanna Edavanna - Koilandy SH
21 Manjeri Edavanna CNG Road SH
22 Manjeri Valluvambram CNG Road SH
23 Nilambur Edavanna CNG Road SH
Perumpilavu - Nilambur SH
Perintalmanna - Vadapuram MDR
25 Tirur Chamravattam BP Angadi - Chamravattam MDR
Manjeri - Areekode MDR
Edavanna - Koilandy SH
Tiruvaly - Edavanna MDR
Tiruvaly - Wandoor MDR
28 Malappuram Vengara Parappanangadi - Malappuram SH
29 Tirur Valanchery No Alignment Existing
30 Tirur Tirurangadi No Alignment Existing
31 Valanchery Malappuram No Alignment Existing
32 Tirurangadi Valluvambram No Alignment Existing
33 Manjeri Wandoor Thrikkalangode- Wandoor MDR
19 Kondotty Areekode
27 Wandoor Edavanna
24 Perintalmanna Wandoor
26 Manjeri Areekode
CONNECTIVITY
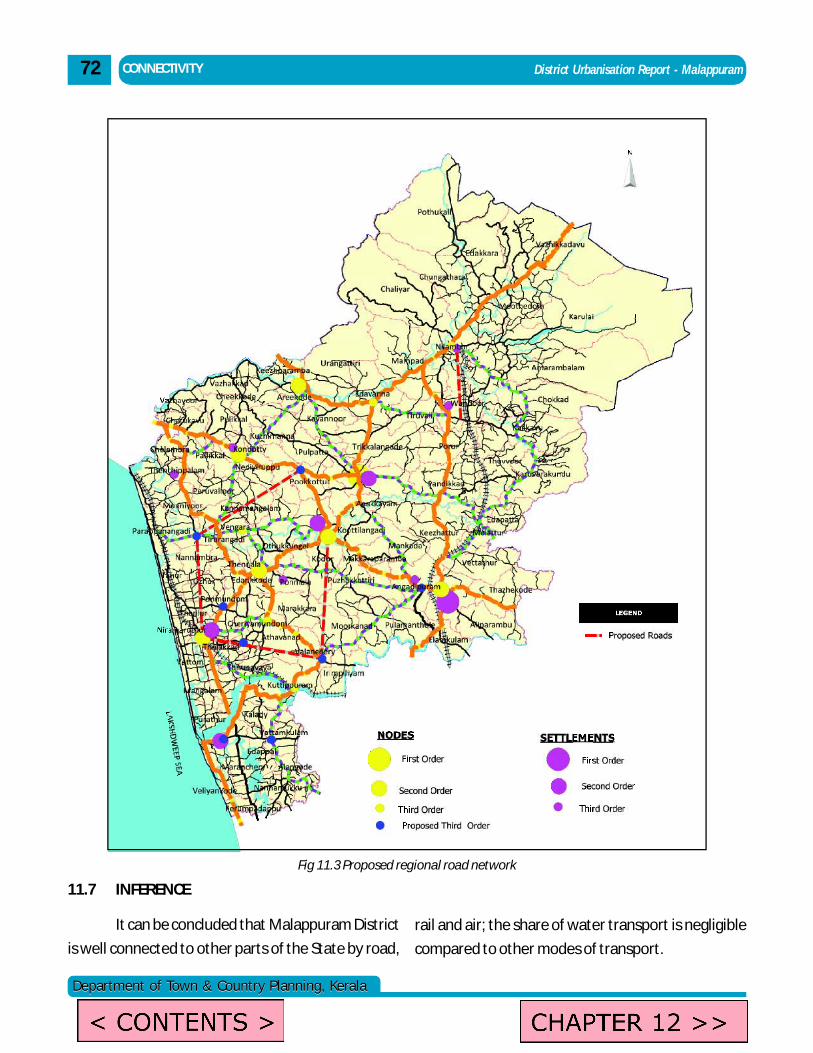
District Urbanisation Report - Malappuram
Department of Town & Country Planning, KeralaDepartment of Town & Country Planning, Kerala
Fig 11.3 Proposed regional road network
11.7 INFERENCE
It can be concluded that Malappuram District
is well connected to other parts of the State by road,
rail and air; the share of water transport is negligible
compared to other modes of transport.
CONNECTIVITY72
admin
Text Box
CHAPTER 12 >>
admin
Text Box
< CONTENTS >
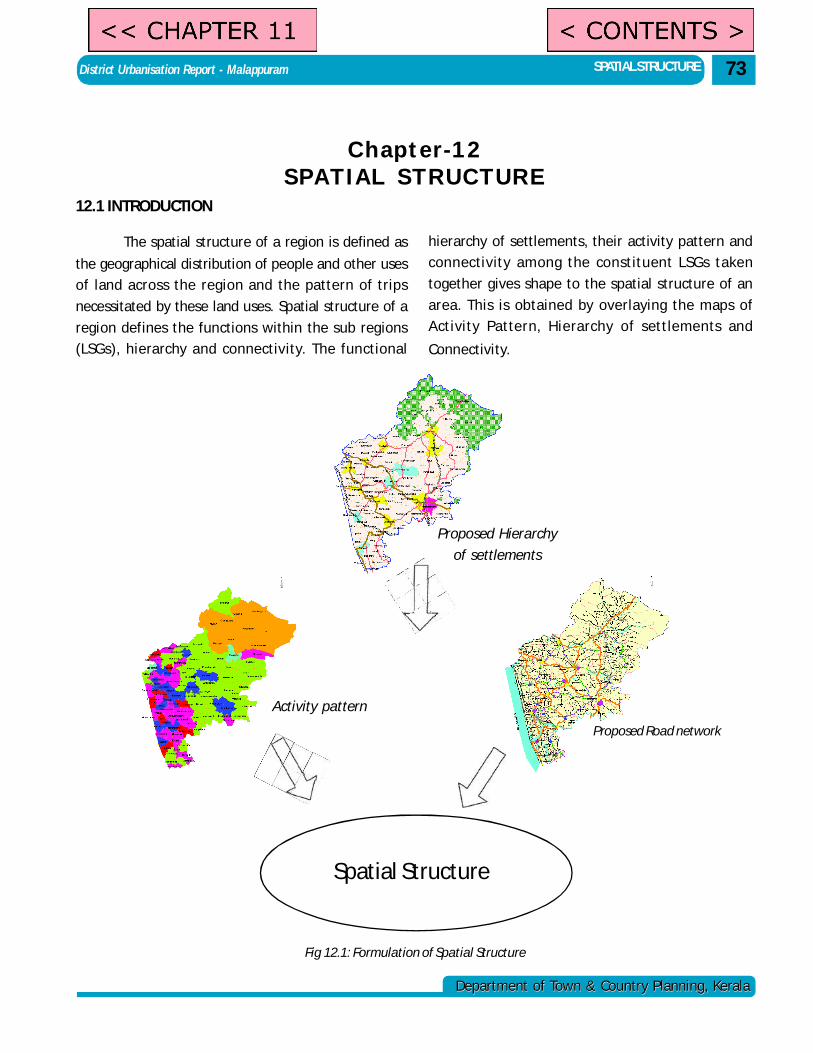
District Urbanisation Report - Malappuram
Department of Town & Country Planning, KeralaDepartment of Town & Country Planning, Kerala
Chapter-12SPATIAL STRUCTURE
12.1 INTRODUCTION
The spatial structure of a region is defined as
the geographical distribution of people and other uses
of land across the region and the pattern of trips
necessitated by these land uses. Spatial structure of a
region defines the functions within the sub regions
(LSGs), hierarchy and connectivity. The functional
Fig 12.1: Formulation of Spatial Structure
SPATIAL STRUCTURE 73
hierarchy of settlements, their activity pattern and
connectivity among the constituent LSGs taken
together gives shape to the spatial structure of an
area. This is obtained by overlaying the maps of
Activity Pattern, Hierarchy of settlements and
Connectivity.
Spatial Structure
Proposed Hierarchy
of settlements
Activity pattern
Proposed Road network
admin
Text Box
<< CHAPTER 11
admin
Text Box
< CONTENTS >
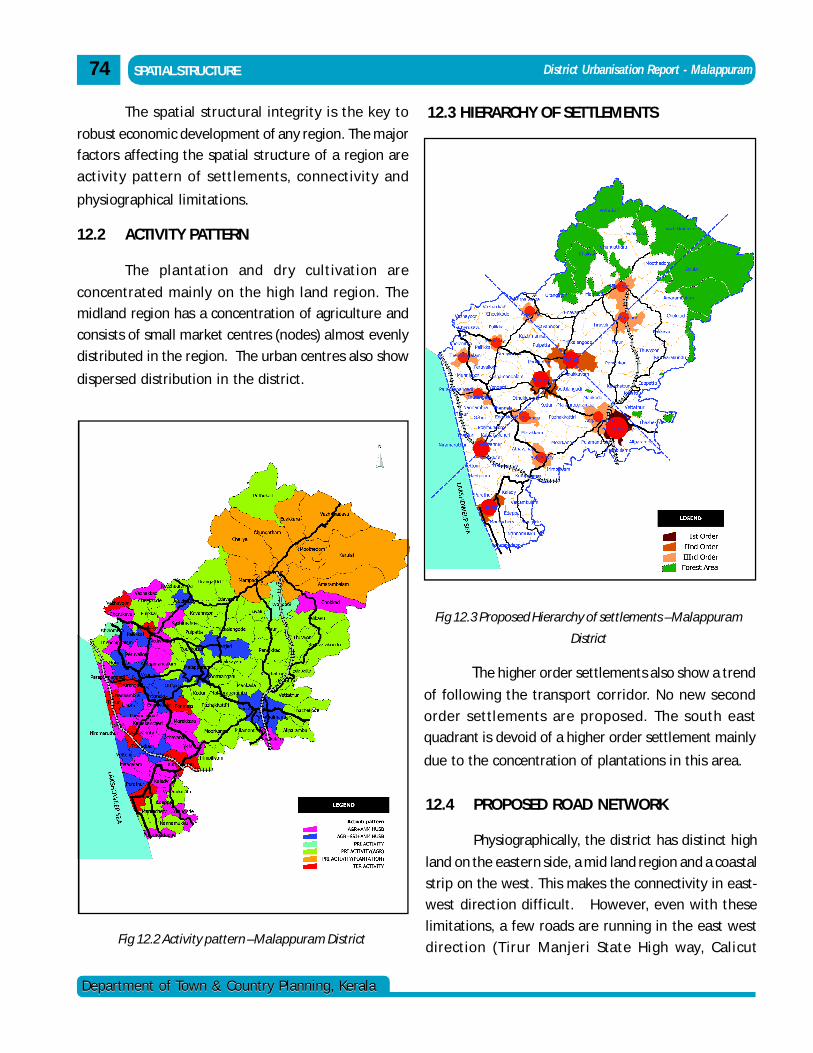
District Urbanisation Report - Malappuram
Department of Town & Country Planning, KeralaDepartment of Town & Country Planning, Kerala
12.3 HIERARCHY OF SETTLEMENTS
The higher order settlements also show a trend
of following the transport corridor. No new second
order settlements are proposed. The south east
quadrant is devoid of a higher order settlement mainly
due to the concentration of plantations in this area.
Fig 12.3 Proposed Hierarchy of settlements –Malappuram
District
The spatial structural integrity is the key to
robust economic development of any region. The major
factors affecting the spatial structure of a region are
activity pattern of settlements, connectivity and
physiographical limitations.
12.2 ACTIVITY PATTERN
The plantation and dry cultivation are
concentrated mainly on the high land region. The
midland region has a concentration of agriculture and
consists of small market centres (nodes) almost evenly
distributed in the region. The urban centres also show
dispersed distribution in the district.
Fig 12.2 Activity pattern –Malappuram District
SPATIAL STRUCTURE74
12.4 PROPOSED ROAD NETWORK
Physiographically, the district has distinct high
land on the eastern side, a mid land region and a coastal
strip on the west. This makes the connectivity in east-
west direction difficult. However, even with these
limitations, a few roads are running in the east west
direction (T irur Manjeri State High way, Calicut
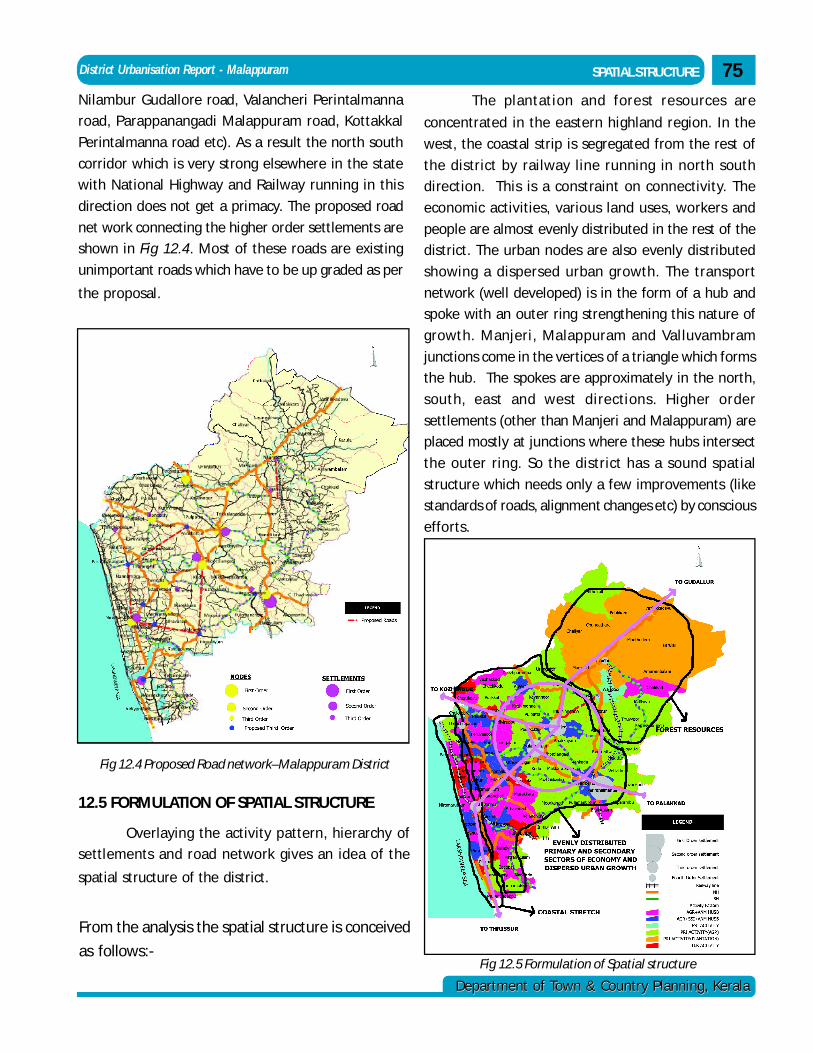
District Urbanisation Report - Malappuram
Department of Town & Country Planning, KeralaDepartment of Town & Country Planning, Kerala
SPATIAL STRUCTURE 75Nilambur Gudallore road, Valancheri Perintalmanna
road, Parappanangadi Malappuram road, Kottakkal
Perintalmanna road etc). As a result the north south
corridor which is very strong elsewhere in the state
with National Highway and Railway running in this
direction does not get a primacy. The proposed road
net work connecting the higher order settlements are
shown in Fig 12.4. Most of these roads are existing
unimportant roads which have to be up graded as per
the proposal.
Fig 12.4 Proposed Road network–Malappuram District
12.5 FORMULATION OF SPATIAL STRUCTURE
Overlaying the activity pattern, hierarchy of
settlements and road network gives an idea of the
spatial structure of the district.
From the analysis the spatial structure is conceived
as follows:-
The plantation and forest resources are
concentrated in the eastern highland region. In the
west, the coastal strip is segregated from the rest of
the district by railway line running in north south
direction. This is a constraint on connectivity. The
economic activities, various land uses, workers and
people are almost evenly distributed in the rest of the
district. The urban nodes are also evenly distributed
showing a dispersed urban growth. The transport
network (well developed) is in the form of a hub and
spoke with an outer ring strengthening this nature of
growth. Manjeri, Malappuram and Valluvambram
junctions come in the vertices of a triangle which forms
the hub. The spokes are approximately in the north,
south, east and west directions. Higher order
settlements (other than Manjeri and Malappuram) are
placed mostly at junctions where these hubs intersect
the outer ring. So the district has a sound spatial
structure which needs only a few improvements (like
standards of roads, alignment changes etc) by conscious
efforts.
Fig 12.5 Formulation of Spatial structure
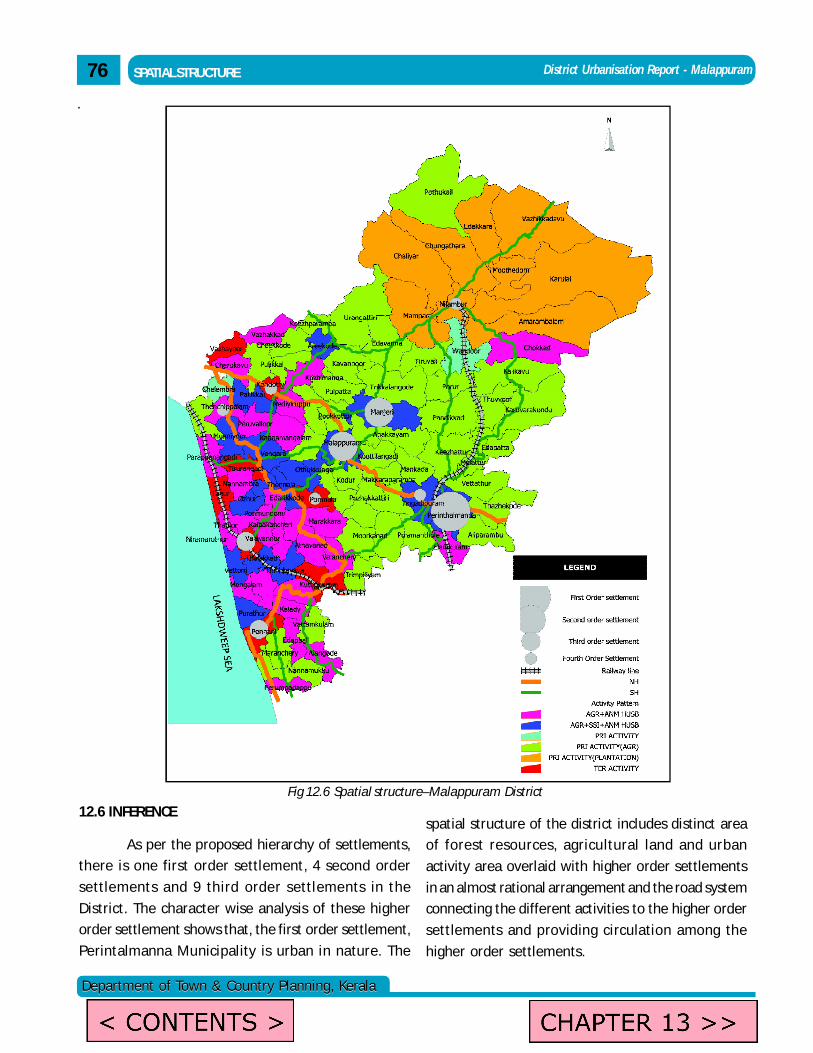
District Urbanisation Report - Malappuram
Department of Town & Country Planning, KeralaDepartment of Town & Country Planning, Kerala
Fig 12.6 Spatial structure–Malappuram District
SPATIAL STRUCTURE76
.
12.6 INFERENCE
As per the proposed hierarchy of settlements,
there is one first order settlement, 4 second order
settlements and 9 third order settlements in the
District. The character wise analysis of these higher
order settlement shows that, the first order settlement,
Perintalmanna Municipality is urban in nature. The
spatial structure of the district includes distinct area
of forest resources, agricultural land and urban
activity area overlaid with higher order settlements
in an almost rational arrangement and the road system
connecting the different activities to the higher order
settlements and providing circulation among the
higher order settlements.
admin
Text Box
< CONTENTS >
admin
Text Box
CHAPTER 13 >>
District Urbanisation Report - Malappuram
Department of Town & Country Planning, KeralaDepartment of Town & Country Planning, Kerala
Chapter 13SUMMARY OF FINDINGS
Malappuram is the district having the largest
number of LSGs in the state- 100 grama panchayats and
7 municipalities. The physiography of the district
deserve special mention as it have all the three
divisions, namely high land in the eastern and north
eastern parts, mid land in the central area and low land
on the western side adjacent to the lakshadweep sea.
The district has about 29% of its geographical area as
forest, mainly seen in the eastern part of the district.
The district has a rich history and cultural
heritage. It has a distinct position in the history of
freedom struggle. The district is well connected to other
parts of the state and the country through three modes
of transport, viz. road, rail and air.
Malappuram is the most populous district in
the state, and also shows the highest rate of growth of
population. It ranks fifth in the state in population
density. Two third of the total population live in 28.27%
of the area of the district, confined mostly to the low
land and midland areas.
The study of the occupational structure of the
district shows that around 76 % of the population are
non workers. The district is having the lowest rate of
work participation in the state. With respect to number
of workers, there is a drastic decline in the primary
sector, mainly agriculture. The only sector which shows
growth is the service sector. It is observed that the rural
areas of the district is also slowly withdrawing from
the primary sector and have started depending more
on the service sector.
The district is blessed with land and other
natural resources. In most of the LSGs there is a high
concentration of agriculture land use. The land use
analysis shows that urban development has taken place
mostly along the major transport corridors. This
indicates the necessity of proper planning intervention
in order to avoid haphazard growth.
The study of the functional character of
settlements show that out of the 107 settlements 68
are rural, 29 are semi rural, 6 are semi urban and 4 are
urban. This shows the comparatively lower level of
urbanisation of the district.
In the suggested hierarchy of settlements,
there is one first order settlement, 4 second order
SUMMARY OF FINDINGS 77
settlements and third order settlements in the District.
The first order settlement, Perinthalmanna is urban in
nature. Malappuram Municipality, though the
headquarters of the district, belongs to the second
order group, followed by the other three municipal
towns in the district, viz. Manjeri, Tirur and Ponnani.
Of the nine third order settlements Kottakkal and
Nilambur have attained urban status recently;
Angadippuram, Kondotty and Valanchery are expected
to attain urban status by 2011 and Thenhippalam,
Tirurangadi, Areekode and Wandoor in 2021
respectively.
The District shows a lesser level of urbanization
when compared to the State average. The percentage
of urban population in the district is somewhat steady
in the past two decades. It indicates that the increase
in the urban population is only by natural growth and
the migration from the rural areas is only marginal.
Malappuram is one of the least urbanized districts in
the state, which occupies twelfth place among the
fourteen districts leaving only Idukki and Wayanad
districts behind it.
admin
Text Box
<< CHAPTER 12
admin
Text Box
< CONTENTS >
admin
Text Box
<< CHAPTER 12
admin
Text Box
< CONTENTS >
District Urbanisation Report - Malappuram
Department of Town & Country Planning, KeralaDepartment of Town & Country Planning, Kerala
SUMMARY OF FINDINGS78
Considering the functional character, future
urban profile and land use concentration in the LSGs,
suitable activity patterns are assigned to settlements
in the district. Activity pattern of 44 LSGs is agriculture,
in 9 LSGs the predominant activity is plantation. In 28
LSGs a mix of agriculture and animal husbandry activity
is predominant whereas there is a predominance of
small scale industries also in addition to these two in
another 18 LSGs; Ponnani and Tirur municipalities and
the grama panchayats of Kondotty, Kottakkal(presently
municipality), Kuttippuram, Tanur, Tirurangadi and
Vazhayoor exhibit Tertiary activity pattern.
The pattern of distribution of the nodes shows
that there is at least one comparatively higher order
node in most of the LSGs, which serves the entire LSG
and a number of lower order nodes serving the
immediate surroundings. Based on existing hierarchy
of nodes and areas un served by major nodes, the
proposed hierarchy of nodes of Malappuram district
is derived. Accordingly, Manjeri is the existing first
order node, Malappuram, Areekode, Kondotty,
Perintalmanna, Kottakkal and Tirur are the second
The district is well connected to other parts of
the state by road, rail and air; the share of water
transport is negligible compared to other modes of
transport. The future regional road net work is
proposed taking into consideration the hierarchy of
settlements, hierarchy of nodes and existing linkages.
For this a conceptual road network is formed by
connecting the higher order settlements to higher
order nodes (shown in Fig 11.2). This is compared with
the existing road network to identify the missing links.
From the study it is seen that majority of these
connections are existing roads, though some of them
need strengthening or modification to alignment. The
Tirur-Valanchery, Tirur-T irurangadi, T irurangadi-
Valluvambram, Valanchery- Malappuram and
Wandoor- Nilambur are the proposed roads. The
Proposed connectivity net work is shown in Fig 11.2
The spatial structure of the district is
determined by synergically linking the hierarchy of
settlements and nodes, connectivity and the activity
pattern of settlements. The spatial structure of
Malappuram, thus evolved is depicted in Fig 12.6 of
Chapter 12. It includes distinct area of forest resources,
agricultural land and urban activity area overlaid with
higher order settlements in an almost rational
arrangement and the road system connecting the
different activities to the higher order settlements
and providing circulation among the higher order
settlements.
Considering the criteria like existing urban
areas, census urban areas, grade of LSGs and hierarchy
of settlements, the future urban profile is derived.It
is envisaged that there will be 22 urban LSGs in
Malappuram district by the year 2021. Besides the
existing 5 urban settlements Kottakkal, Nilambur,
Angadipuram, Kondotty, Parappanangadi and
Valanchery are expected to attain urban status by 2011
and the next 11 settlements to become urban by 2021.
order nodes. Altogether there are 12 third order nodes
of which 5 are existing third order nodes 7 are proposed
third order nodes.
admin
Text Box
< CONTENTS >
admin
Text Box
ANNEXES >>
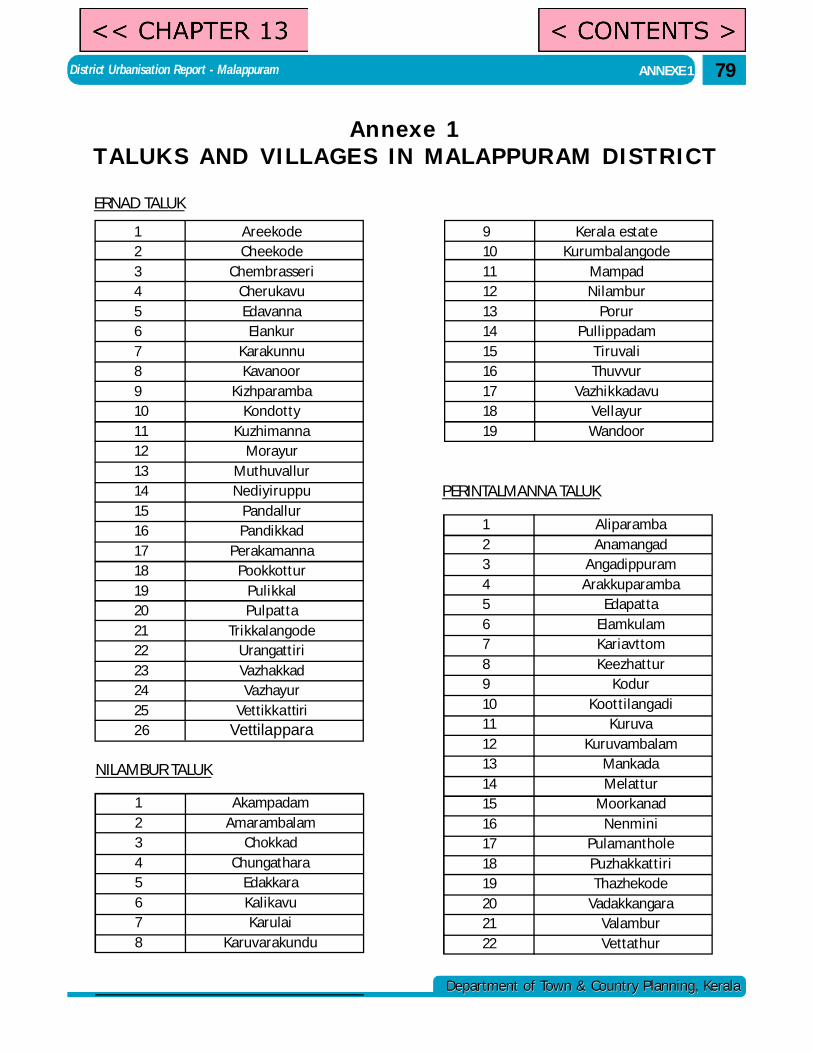
District Urbanisation Report - Malappuram
Department of Town & Country Planning, KeralaDepartment of Town & Country Planning, Kerala
ANNEXE 1 79
ERNAD TALUK
1 Akampadam2 Amarambalam3 Chokkad4 Chungathara5 Edakkara6 Kalikavu7 Karulai8 Karuvarakundu
PERINTALMANNA TALUK
Annexe 1TALUKS AND VILLAGES IN MALAPPURAM DISTRICT
NILAMBUR TALUK
1 Areekode2 Cheekode3 Chembrasseri4 Cherukavu5 Edavanna6 Elankur7 Karakunnu8 Kavanoor9 Kizhparamba10 Kondotty11 Kuzhimanna12 Morayur13 Muthuvallur14 Nediyiruppu15 Pandallur16 Pandikkad17 Perakamanna18 Pookkottur19 Pulikkal20 Pulpatta21 Trikkalangode22 Urangattiri23 Vazhakkad24 Vazhayur25 Vettikkattiri26 Vettilappara
9 Kerala estate10 Kurumbalangode11 Mampad12 Nilambur13 Porur14 Pullippadam15 Tiruvali16 Thuvvur17 Vazhikkadavu18 Vellayur19 Wandoor
1 Aliparamba2 Anamangad3 Angadippuram4 Arakkuparamba5 Edapatta6 Elamkulam7 Kariavttom8 Keezhattur9 Kodur10 Koottilangadi11 Kuruva12 Kuruvambalam13 Mankada14 Melattur15 Moorkanad16 Nenmini17 Pulamanthole18 Puzhakkattiri19 Thazhekode20 Vadakkangara21 Valambur22 Vettathur
admin
Text Box
<< CHAPTER 13
admin
Text Box
< CONTENTS >
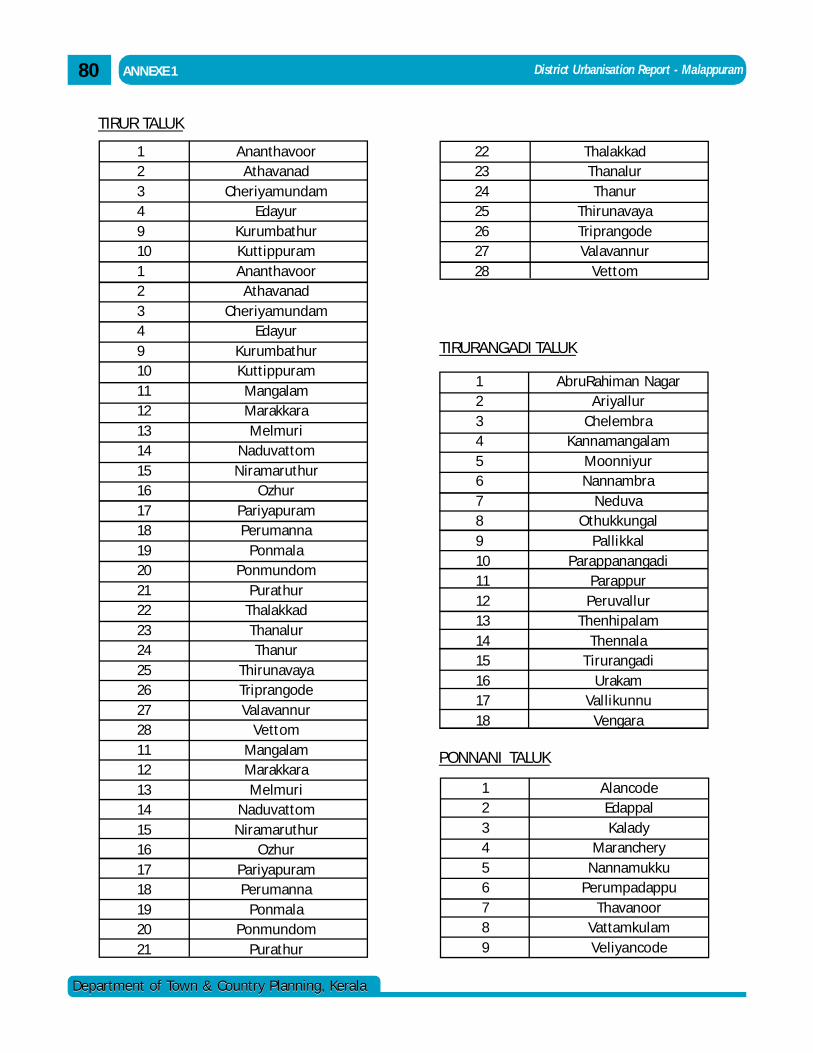
District Urbanisation Report - Malappuram
Department of Town & Country Planning, KeralaDepartment of Town & Country Planning, Kerala
PONNANI TALUK
ANNEXE 180
TIRUR TALUK
1 Ananthavoor2 Athavanad3 Cheriyamundam4 Edayur9 Kurumbathur10 Kuttippuram1 Ananthavoor2 Athavanad3 Cheriyamundam4 Edayur9 Kurumbathur10 Kuttippuram11 Mangalam12 Marakkara13 Melmuri14 Naduvattom15 Niramaruthur16 Ozhur17 Pariyapuram18 Perumanna19 Ponmala20 Ponmundom21 Purathur22 Thalakkad23 Thanalur24 Thanur25 Thirunavaya26 Triprangode27 Valavannur28 Vettom11 Mangalam12 Marakkara13 Melmuri14 Naduvattom15 Niramaruthur16 Ozhur17 Pariyapuram18 Perumanna19 Ponmala20 Ponmundom21 Purathur
22 Thalakkad23 Thanalur24 Thanur25 Thirunavaya26 Triprangode27 Valavannur28 Vettom
1 Alancode2 Edappal3 Kalady4 Maranchery5 Nannamukku6 Perumpadappu7 Thavanoor8 Vattamkulam9 Veliyancode
TIRURANGADI TALUK
1 AbruRahiman Nagar2 Ariyallur3 Chelembra4 Kannamangalam5 Moonniyur6 Nannambra7 Neduva8 Othukkungal9 Pallikkal10 Parappanangadi11 Parappur12 Peruvallur13 Thenhipalam14 Thennala15 Tirurangadi16 Urakam17 Vallikunnu18 Vengara
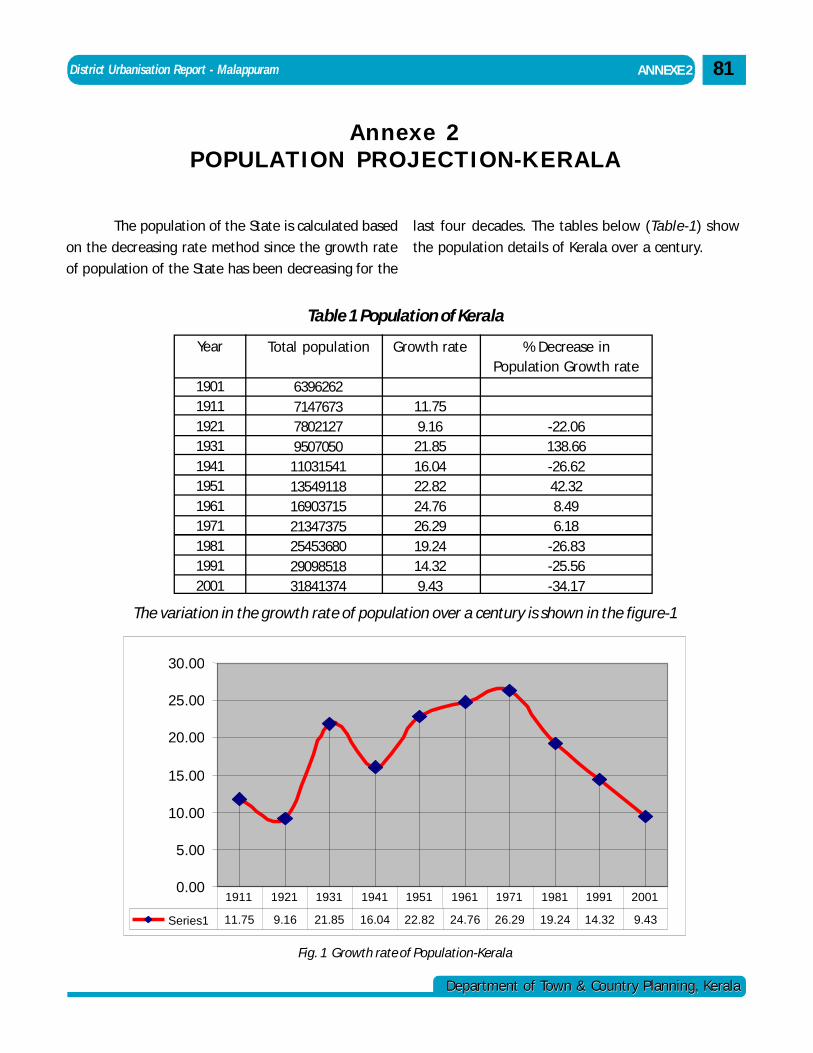
District Urbanisation Report - Malappuram
Department of Town & Country Planning, KeralaDepartment of Town & Country Planning, Kerala
Annexe 2POPULATION PROJECTION-KERALA
Table 1 Population of Kerala
The population of the State is calculated based
on the decreasing rate method since the growth rate
of population of the State has been decreasing for the
last four decades. The tables below (Table-1) show
the population details of Kerala over a century.
The variation in the growth rate of population over a century is shown in the figure-1
0.00
5.00
10.00
15.00
20.00
25.00
30.00
Series1 11.75 9.16 21.85 16.04 22.82 24.76 26.29 19.24 14.32 9.43
1911 1921 1931 1941 1951 1961 1971 1981 1991 2001
Fig. 1 Growth rate of Population-Kerala
ANNEXE 2 81
Year
19011911192119311941195119611971198119912001
Total population
6396262714767378021279507050
11031541135491181690371521347375254536802909851831841374
Growth rate
11.759.16
21.8516.0422.8224.7626.2919.2414.329.43
% Decrease inPopulation Growth rate
-22.06138.66-26.6242.328.496.18
-26.83-25.56-34.17
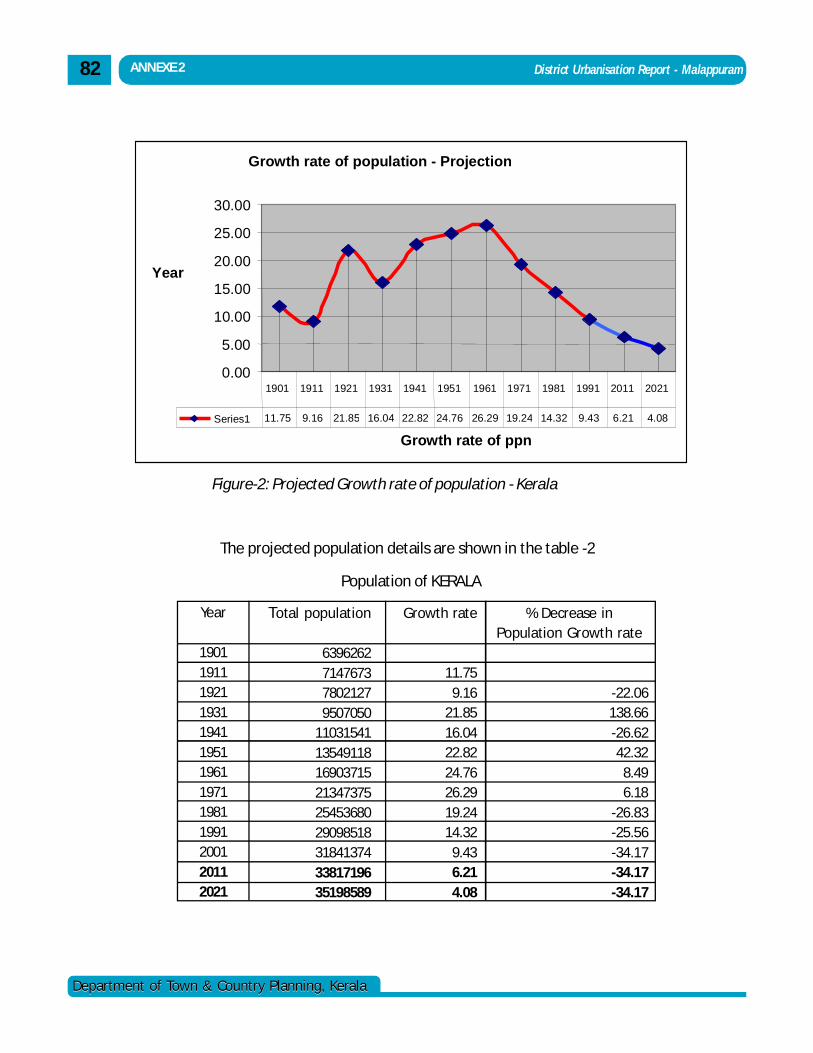
District Urbanisation Report - Malappuram
Department of Town & Country Planning, KeralaDepartment of Town & Country Planning, Kerala
Growth rate of population - Projection
0.00
5.00
10.00
15.00
20.00
25.00
30.00
Growth rate of ppn
Year
Series1 11.75 9.16 21.85 16.04 22.82 24.76 26.29 19.24 14.32 9.43 6.21 4.08
1901 1911 1921 1931 1941 1951 1961 1971 1981 1991 2011 2021
Figure-2: Projected Growth rate of population - Kerala
The projected population details are shown in the table -2
Population of KERALA
ANNEXE 282
Year
1901191119211931194119511961197119811991200120112021
Total population
6396262714767378021279507050
110315411354911816903715213473752545368029098518318413743381719635198589
Growth rate
11.75
9.1621.8516.0422.8224.7626.2919.2414.32
9.436.214.08
% Decrease inPopulation Growth rate
-22.06138.66-26.6242.32
8.496.18
-26.83-25.56-34.17-34.17-34.17
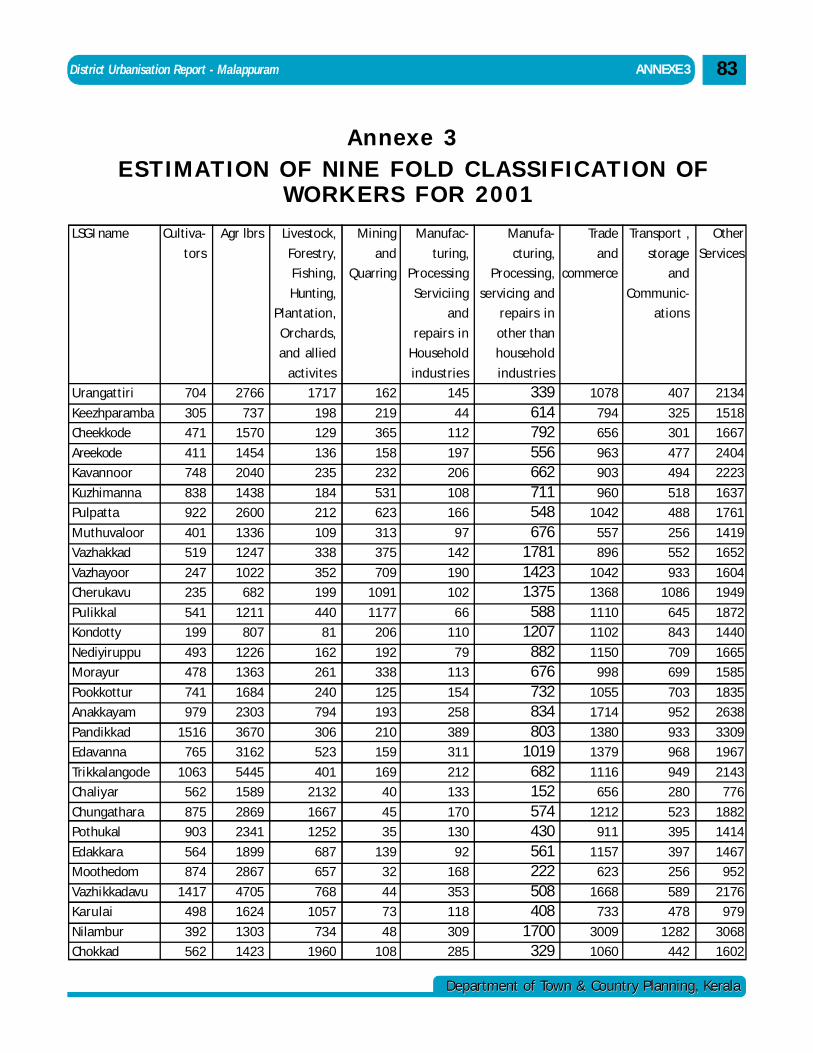
District Urbanisation Report - Malappuram
Department of Town & Country Planning, KeralaDepartment of Town & Country Planning, Kerala
ESTIMATION OF NINE FOLD CLASSIFICATION OFWORKERS FOR 2001
Annexe 3
ANNEXE 3 83
LSGI name
Urangattiri
Keezhparamba
Cheekkode
Areekode
Kavannoor
Kuzhimanna
Pulpatta
Muthuvaloor
Vazhakkad
Vazhayoor
Cherukavu
Pulikkal
Kondotty
Nediyiruppu
Morayur
Pookkottur
Anakkayam
Pandikkad
Edavanna
Trikkalangode
Chaliyar
Chungathara
Pothukal
Edakkara
Moothedom
Vazhikkadavu
Karulai
Nilambur
Chokkad
Cultiva-
tors
704
305
471
411
748
838
922
401
519
247
235
541
199
493
478
741
979
1516
765
1063
562
875
903
564
874
1417
498
392
562
Agr lbrs
2766
737
1570
1454
2040
1438
2600
1336
1247
1022
682
1211
807
1226
1363
1684
2303
3670
3162
5445
1589
2869
2341
1899
2867
4705
1624
1303
1423
Livestock,
Forestry,
Fishing,
Hunting,
Plantation,
Orchards,
and allied
activites
1717
198
129
136
235
184
212
109
338
352
199
440
81
162
261
240
794
306
523
401
2132
1667
1252
687
657
768
1057
734
1960
Mining
and
Quarring
162
219
365
158
232
531
623
313
375
709
1091
1177
206
192
338
125
193
210
159
169
40
45
35
139
32
44
73
48
108
Manufac-
turing,
Processing
Serviciing
and
repairs in
Household
industries
145
44
112
197
206
108
166
97
142
190
102
66
110
79
113
154
258
389
311
212
133
170
130
92
168
353
118
309
285
Manufa-
cturing,
Processing,
servicing and
repairs in
other than
household
industries
339614792556662711548676
178114231375
5881207
882676732834803
1019682152574430561222508408
1700329
Trade
and
commerce
1078
794
656
963
903
960
1042
557
896
1042
1368
1110
1102
1150
998
1055
1714
1380
1379
1116
656
1212
911
1157
623
1668
733
3009
1060
Transport ,
storage
and
Communic-
ations
407
325
301
477
494
518
488
256
552
933
1086
645
843
709
699
703
952
933
968
949
280
523
395
397
256
589
478
1282
442
Other
Services
2134
1518
1667
2404
2223
1637
1761
1419
1652
1604
1949
1872
1440
1665
1585
1835
2638
3309
1967
2143
776
1882
1414
1467
952
2176
979
3068
1602
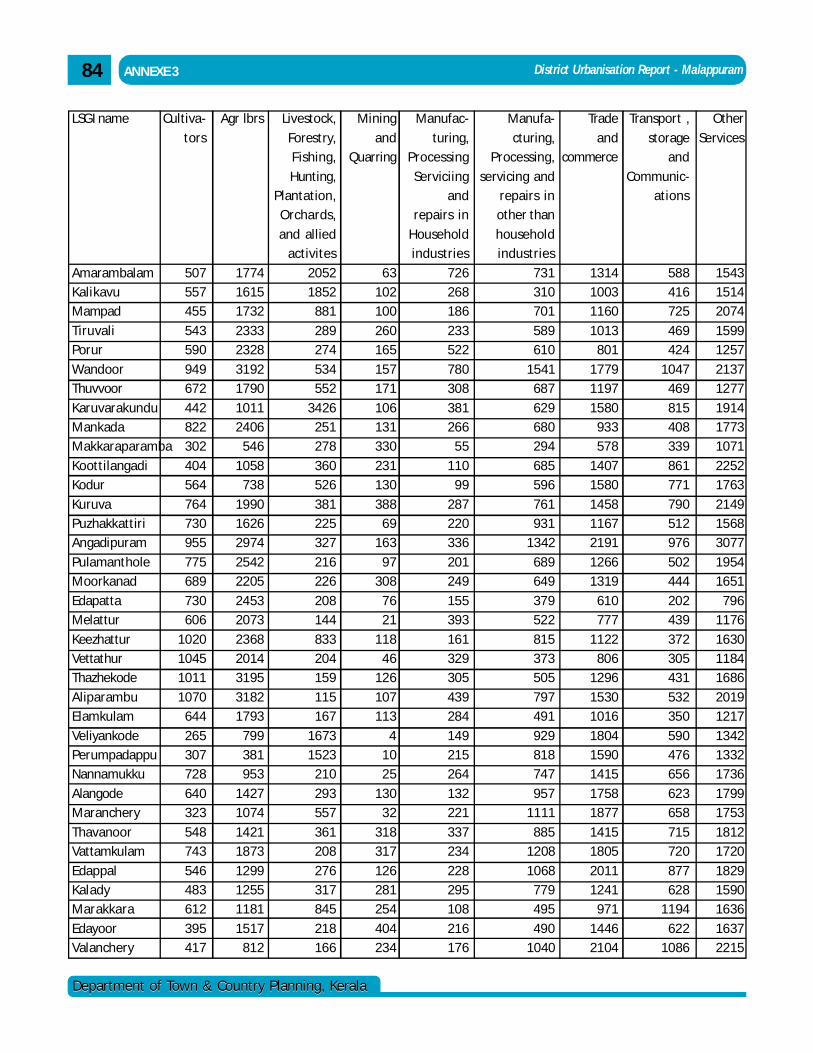
District Urbanisation Report - Malappuram
Department of Town & Country Planning, KeralaDepartment of Town & Country Planning, Kerala
ANNEXE 384
LSGI name
AmarambalamKalikavuMampad
TiruvaliPorur
WandoorThuvvoor
KaruvarakunduMankadaMakkaraparamba
KoottilangadiKodur
KuruvaPuzhakkattiriAngadipuram
PulamantholeMoorkanad
EdapattaMelattur
KeezhatturVettathurThazhekode
AliparambuElamkulam
VeliyankodePerumpadappuNannamukku
AlangodeMaranchery
ThavanoorVattamkulam
EdappalKaladyMarakkara
EdayoorValanchery
Cultiva-
tors
507557455
543590
949672
442822302
404564
764730955
775689
730606
102010451011
1070644
265307728
640323
548743
546483612
395417
Agr lbrs
177416151732
23332328
31921790
10112406
546
1058738
199016262974
25422205
24532073
236820143195
31821793
799381953
14271074
14211873
129912551181
1517812
Livestock,
Forestry,Fishing,
Hunting,Plantation,
Orchards,
and alliedactivites
20521852
881
289274
534552
3426251278
360526
381225327
216226
208144
833204159
115167
16731523
210
293557
361208
276317845
218166
Mining
andQuarring
63102100
260165
157171
106131330
231130
38869
163
97308
7621
11846
126
107113
41025
13032
318317
126281254
404234
Manufac-
turing,Processing
Serviciingand
repairs in
Householdindustries
726268186
233522
780308
381266
55
11099
287220336
201249
155393
161329305
439284
149215264
132221
337234
228295108
216176
Manufa-
cturing,Processing,
servicing andrepairs inother than
householdindustries
731310701
589610
1541687
629680294
685596
761931
1342
689649
379522
815373505
797491
929818747
9571111
8851208
1068779495
4901040
Trade
andcommerce
131410031160
1013801
17791197
1580933578
14071580
145811672191
12661319
610777
1122806
1296
15301016
180415901415
17581877
14151805
20111241
971
14462104
Transport ,
storageand
Communic-ations
588416725
469424
1047469
815408339
861771
790512976
502444
202439
372305431
532350
590476656
623658
715720
877628
1194
6221086
Other
Services
154315142074
15991257
21371277
191417731071
22521763
214915683077
19541651
7961176
163011841686
20191217
134213321736
17991753
18121720
182915901636
16372215
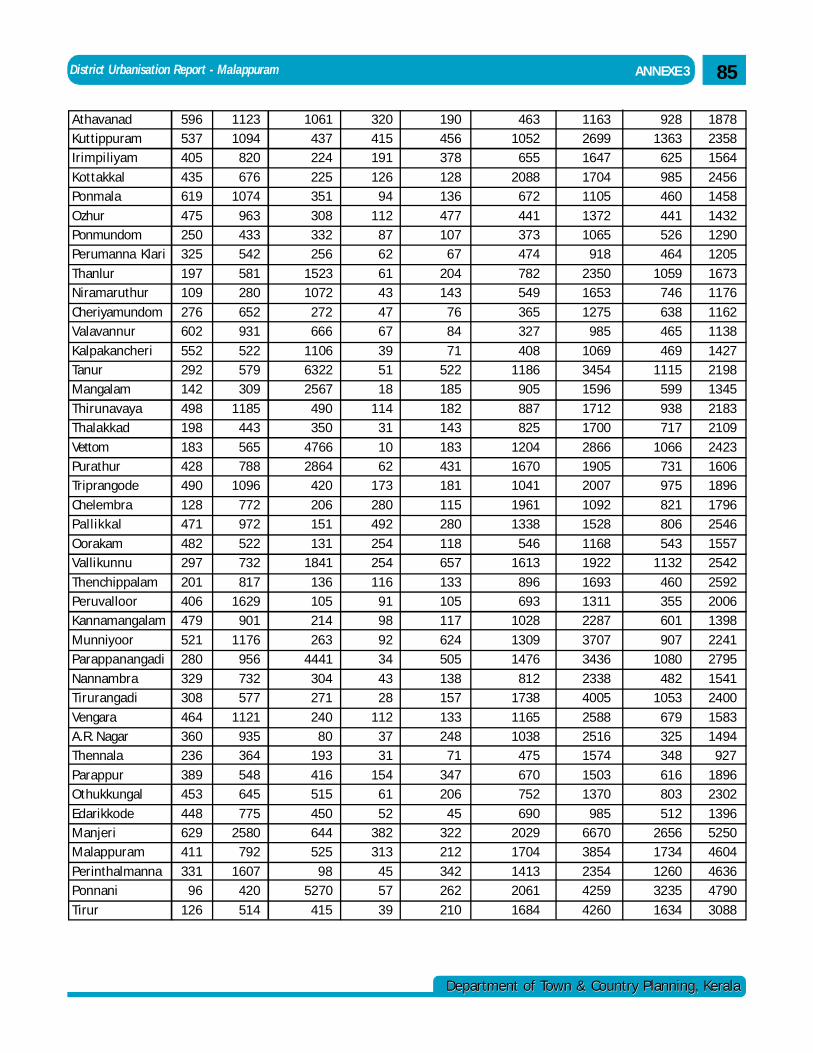
District Urbanisation Report - Malappuram
Department of Town & Country Planning, KeralaDepartment of Town & Country Planning, Kerala
ANNEXE 3 85
596537405
435619
475250325
197109
276602
552292142
498198
183428490
128471
482297
201406479
521280
329308
464360236
389453
448629411
33196
126
11231094
820
6761074
963433542
581280
652931
522579309
1185443
565788
1096
772972
522732
8171629
901
1176956
732577
1121935364
548645
7752580
792
1607420
514
320415191
12694
1128762
6143
4767
395118
11431
1062
173
280492
254254
1169198
9234
4328
1123731
15461
52382313
4557
39
4631052
655
2088672
441373474
782549
365327
4081186
905
887825
120416701041
19611338
5461613
896693
1028
13091476
8121738
11651038
475
670752
69020291704
14132061
1684
116326991647
17041105
13721065
918
23501653
1275985
106934541596
17121700
286619052007
10921528
11681922
169313112287
37073436
23384005
258825161574
15031370
98566703854
23544259
4260
9281363
625
985460
441526464
1059746
638465
4691115
599
938717
1066731975
821806
5431132
460355601
9071080
4821053
679325348
616803
51226561734
12603235
1634
187823581564
24561458
143212901205
16731176
11621138
142721981345
21832109
242316061896
17962546
15572542
259220061398
22412795
15412400
15831494
927
18962302
139652504604
46364790
3088
AthavanadKuttippuramIrimpiliyam
KottakkalPonmala
OzhurPonmundomPerumanna Klari
ThanlurNiramaruthur
CheriyamundomValavannur
KalpakancheriTanurMangalam
ThirunavayaThalakkad
VettomPurathurTriprangode
ChelembraPallikkal
OorakamVallikunnu
ThenchippalamPeruvalloorKannamangalam
MunniyoorParappanangadi
NannambraTirurangadi
VengaraA.R. NagarThennala
ParappurOthukkungal
EdarikkodeManjeriMalappuram
PerinthalmannaPonnani
Tirur
1061437224
225351
308332256
15231072
272666
110663222567
490350
47662864
420
206151
1311841
136105214
2634441
304271
24080
193
416515
450644525
985270
415
190456378
128136
477107
67
204143
7684
71522185
182143
183431181
115280
118657
133105117
624505
138157
133248
71
347206
45322212
342262
210
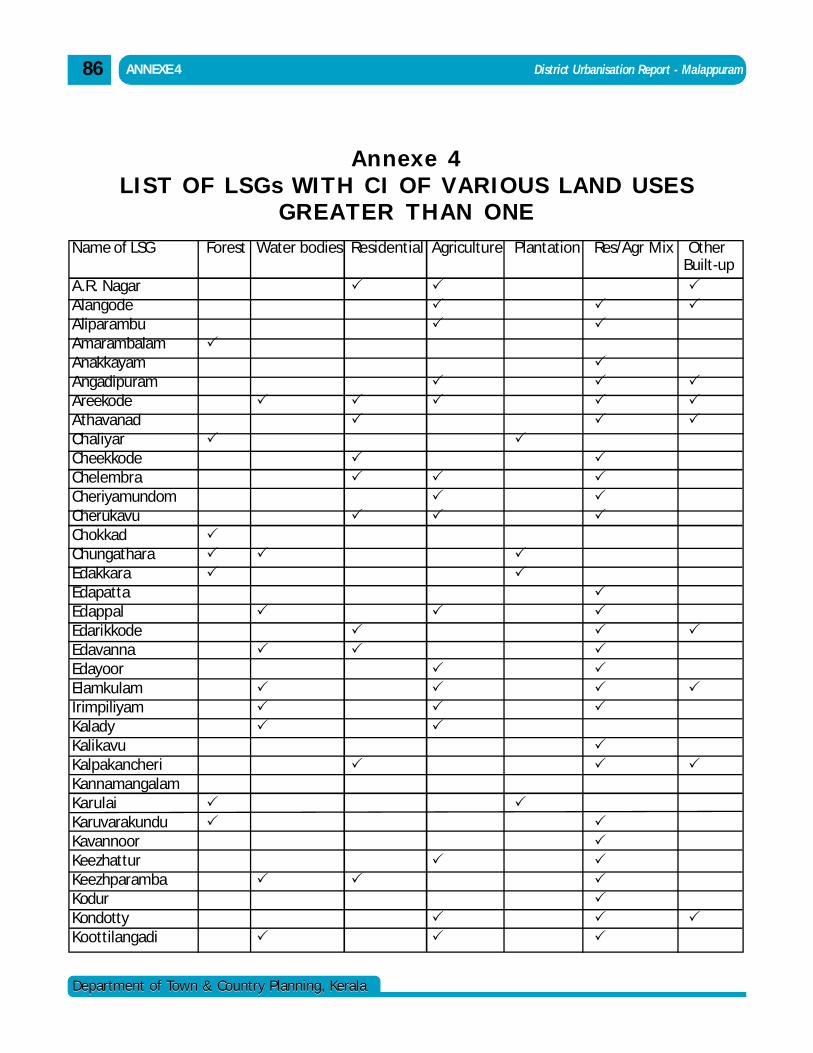
District Urbanisation Report - Malappuram
Department of Town & Country Planning, KeralaDepartment of Town & Country Planning, Kerala
ANNEXE 486
Annexe 4LIST OF LSGs WITH CI OF VARIOUS LAND USES
GREATER THAN ONEName of LSG Forest Water bodies Residential Agriculture Plantation Res/Agr Mix Other
A.R. Nagar Alangode Aliparambu Amarambalam Anakkayam Angadipuram Areekode Athavanad Chaliyar Cheekkode Chelembra Cheriyamundom Cherukavu Chokkad Chungathara Edakkara Edapatta Edappal Edarikkode Edavanna Edayoor Elamkulam Irimpiliyam Kalady Kalikavu Kalpakancheri KannamangalamKarulai Karuvarakundu Kavannoor Keezhattur Keezhparamba Kodur Kondotty Koottilangadi
Built-up
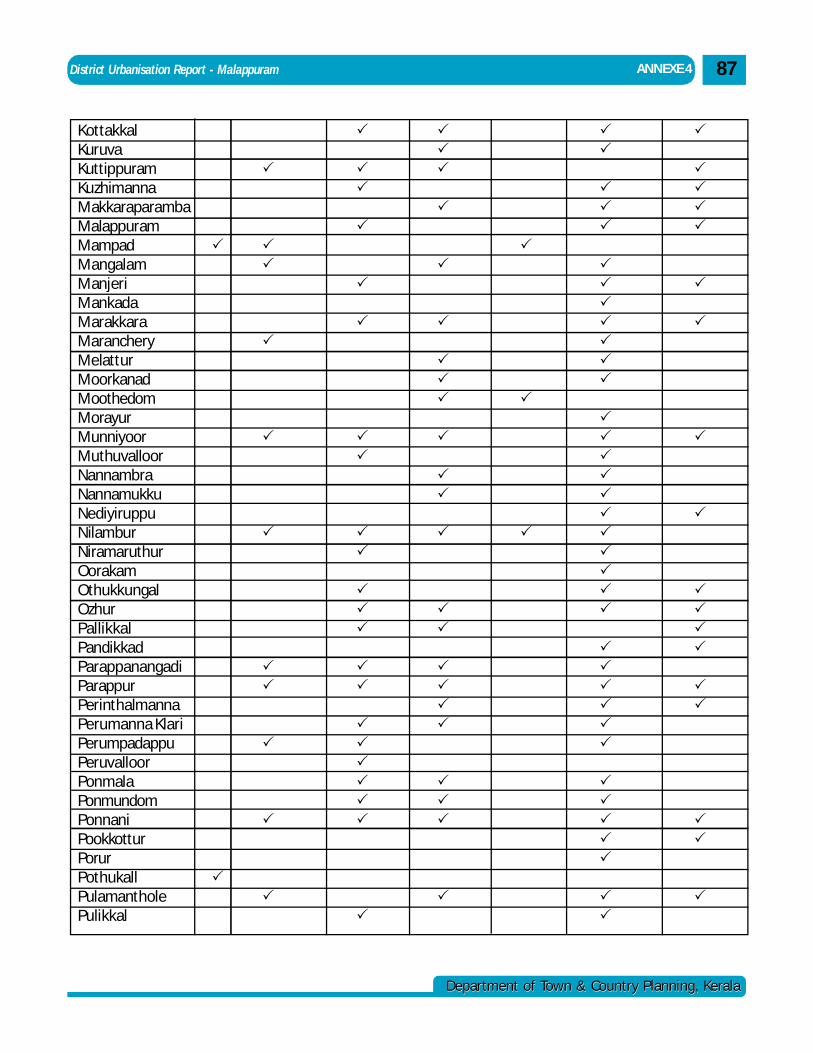
District Urbanisation Report - Malappuram
Department of Town & Country Planning, KeralaDepartment of Town & Country Planning, Kerala
ANNEXE 4 87
Kottakkal Kuruva Kuttippuram Kuzhimanna Makkaraparamba Malappuram Mampad Mangalam Manjeri Mankada Marakkara Maranchery Melattur Moorkanad Moothedom Morayur Munniyoor Muthuvalloor Nannambra Nannamukku Nediyiruppu Nilambur Niramaruthur Oorakam Othukkungal Ozhur Pallikkal Pandikkad Parappanangadi Parappur Perinthalmanna Perumanna Klari Perumpadappu Peruvalloor Ponmala Ponmundom Ponnani Pookkottur Porur Pothukall Pulamanthole Pulikkal
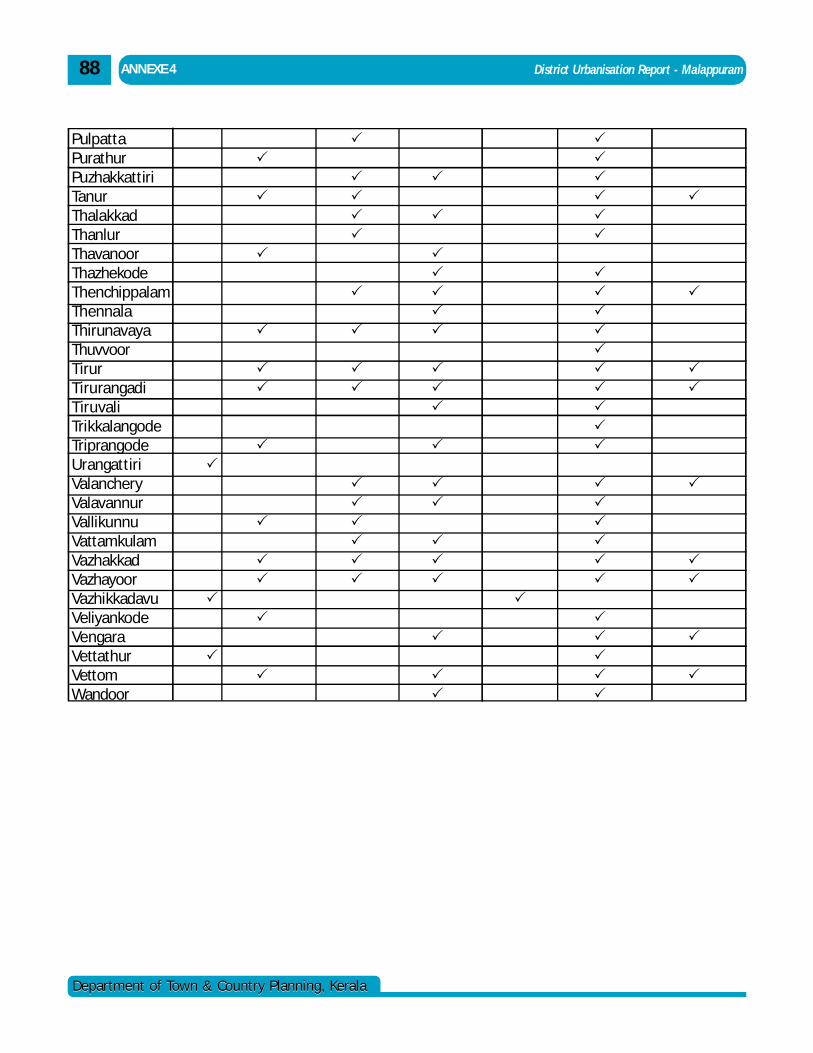
District Urbanisation Report - Malappuram
Department of Town & Country Planning, KeralaDepartment of Town & Country Planning, Kerala
ANNEXE 488
Pulpatta Purathur Puzhakkattiri Tanur Thalakkad Thanlur Thavanoor Thazhekode Thenchippalam Thennala Thirunavaya Thuvvoor Tirur Tirurangadi Tiruvali Trikkalangode Triprangode Urangattiri Valanchery Valavannur Vallikunnu Vattamkulam Vazhakkad Vazhayoor Vazhikkadavu Veliyankode Vengara Vettathur Vettom Wandoor
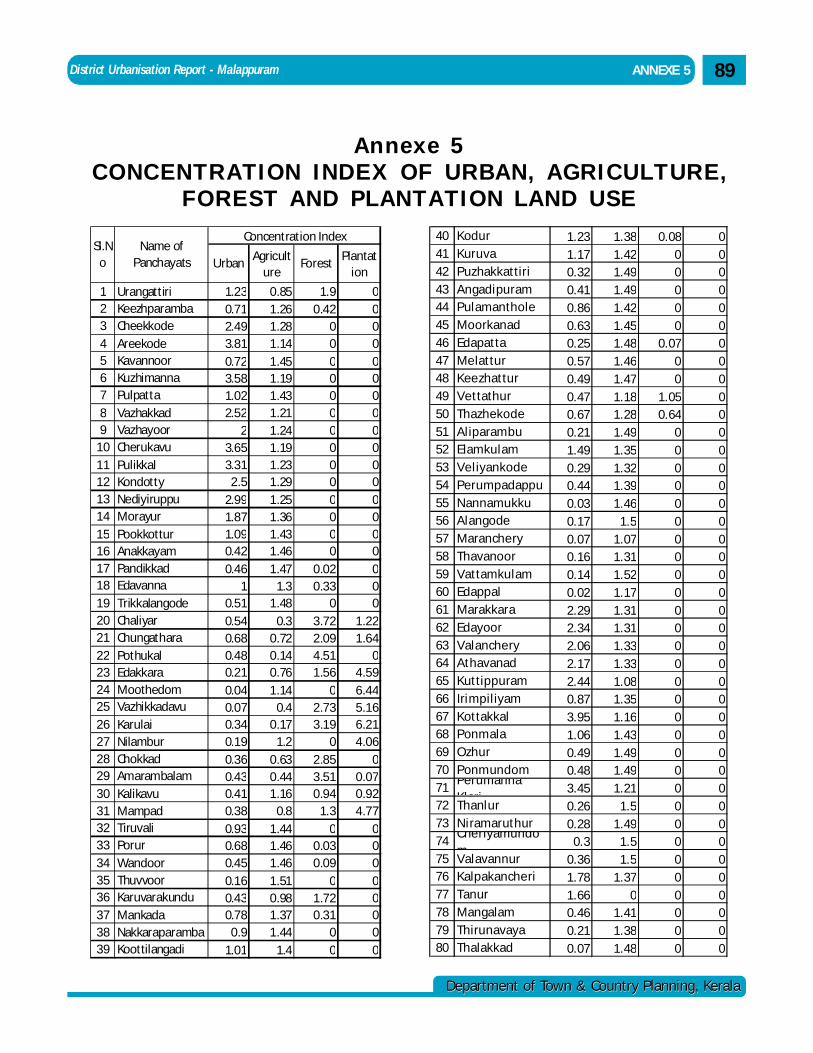
District Urbanisation Report - Malappuram
Department of Town & Country Planning, KeralaDepartment of Town & Country Planning, Kerala
89 ANNEXE 5
Annexe 5CONCENTRATION INDEX OF URBAN, AGRICULTURE,
FOREST AND PLANTATION LAND USE40 Kodur 1.23 1.38 0.08 041 Kuruva 1.17 1.42 0 042 Puzhakkattiri 0.32 1.49 0 043 Angadipuram 0.41 1.49 0 044 Pulamanthole 0.86 1.42 0 045 Moorkanad 0.63 1.45 0 046 Edapatta 0.25 1.48 0.07 047 Melattur 0.57 1.46 0 048 Keezhattur 0.49 1.47 0 049 Vettathur 0.47 1.18 1.05 050 Thazhekode 0.67 1.28 0.64 051 Aliparambu 0.21 1.49 0 052 Elamkulam 1.49 1.35 0 053 Veliyankode 0.29 1.32 0 054 Perumpadappu 0.44 1.39 0 055 Nannamukku 0.03 1.46 0 056 Alangode 0.17 1.5 0 057 Maranchery 0.07 1.07 0 058 Thavanoor 0.16 1.31 0 059 Vattamkulam 0.14 1.52 0 060 Edappal 0.02 1.17 0 061 Marakkara 2.29 1.31 0 062 Edayoor 2.34 1.31 0 063 Valanchery 2.06 1.33 0 064 Athavanad 2.17 1.33 0 065 Kuttippuram 2.44 1.08 0 066 Irimpiliyam 0.87 1.35 0 067 Kottakkal 3.95 1.16 0 068 Ponmala 1.06 1.43 0 069 Ozhur 0.49 1.49 0 070 Ponmundom 0.48 1.49 0 071
Perumanna Klari
3.45 1.21 0 072 Thanlur 0.26 1.5 0 073 Niramaruthur 0.28 1.49 0 074
Cheriyamundom
0.3 1.5 0 075 Valavannur 0.36 1.5 0 076 Kalpakancheri 1.78 1.37 0 077 Tanur 1.66 0 0 078 Mangalam 0.46 1.41 0 079 Thirunavaya 0.21 1.38 0 080 Thalakkad 0.07 1.48 0 0
UrbanAgricult
ureForest
Plantation
1 Urangattiri 1.23 0.85 1.9 02 Keezhparamba 0.71 1.26 0.42 03 Cheekkode 2.49 1.28 0 04 Areekode 3.81 1.14 0 05 Kavannoor 0.72 1.45 0 06 Kuzhimanna 3.58 1.19 0 07 Pulpatta 1.02 1.43 0 08 Vazhakkad 2.52 1.21 0 09 Vazhayoor 2 1.24 0 0
10 Cherukavu 3.65 1.19 0 011 Pulikkal 3.31 1.23 0 012 Kondotty 2.5 1.29 0 013 Nediyiruppu 2.99 1.25 0 014 Morayur 1.87 1.36 0 015 Pookkottur 1.09 1.43 0 016 Anakkayam 0.42 1.46 0 017 Pandikkad 0.46 1.47 0.02 018 Edavanna 1 1.3 0.33 019 Trikkalangode 0.51 1.48 0 020 Chaliyar 0.54 0.3 3.72 1.2221 Chungathara 0.68 0.72 2.09 1.6422 Pothukal 0.48 0.14 4.51 023 Edakkara 0.21 0.76 1.56 4.5924 Moothedom 0.04 1.14 0 6.4425 Vazhikkadavu 0.07 0.4 2.73 5.1626 Karulai 0.34 0.17 3.19 6.2127 Nilambur 0.19 1.2 0 4.0628 Chokkad 0.36 0.63 2.85 029 Amarambalam 0.43 0.44 3.51 0.0730 Kalikavu 0.41 1.16 0.94 0.9231 Mampad 0.38 0.8 1.3 4.7732 Tiruvali 0.93 1.44 0 033 Porur 0.68 1.46 0.03 034 Wandoor 0.45 1.46 0.09 035 Thuvvoor 0.16 1.51 0 036 Karuvarakundu 0.43 0.98 1.72 037 Mankada 0.78 1.37 0.31 038 Nakkaraparamba 0.9 1.44 0 039 Koottilangadi 1.01 1.4 0 0
Sl.No
Name of Panchayats
Concentration Index
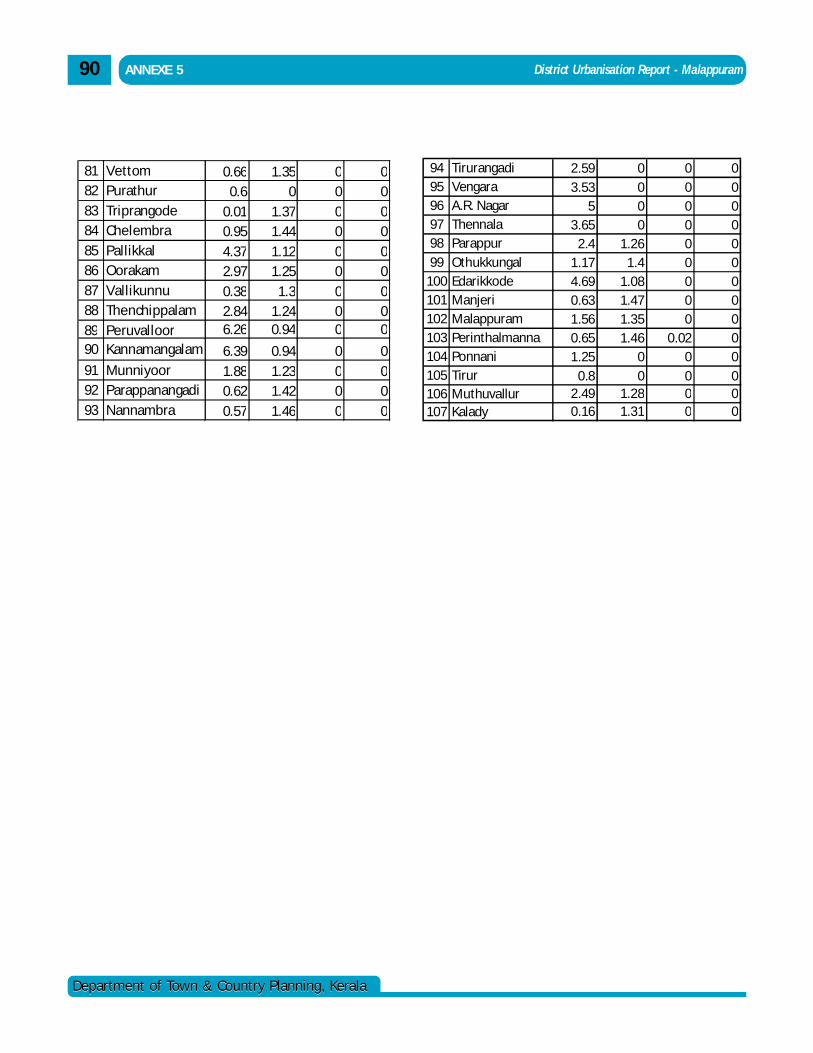
District Urbanisation Report - Malappuram
Department of Town & Country Planning, KeralaDepartment of Town & Country Planning, Kerala
ANNEXE 590
81 Vettom 0.66 1.35 0 082 Purathur 0.6 0 0 083 Triprangode 0.01 1.37 0 084 Chelembra 0.95 1.44 0 085 Pallikkal 4.37 1.12 0 086 Oorakam 2.97 1.25 0 087 Vallikunnu 0.38 1.3 0 088 Thenchippalam 2.84 1.24 0 089 Peruvalloor 6.26 0.94 0 090 Kannamangalam 6.39 0.94 0 091 Munniyoor 1.88 1.23 0 092 Parappanangadi 0.62 1.42 0 093 Nannambra 0.57 1.46 0 0
94 Tirurangadi 2.59 0 0 095 Vengara 3.53 0 0 096 A.R. Nagar 5 0 0 097 Thennala 3.65 0 0 098 Parappur 2.4 1.26 0 099 Othukkungal 1.17 1.4 0 0
100 Edarikkode 4.69 1.08 0 0101 Manjeri 0.63 1.47 0 0102 Malappuram 1.56 1.35 0 0103 Perinthalmanna 0.65 1.46 0.02 0104 Ponnani 1.25 0 0 0105 Tirur 0.8 0 0 0106 Muthuvallur 2.49 1.28 0 0107 Kalady 0.16 1.31 0 0
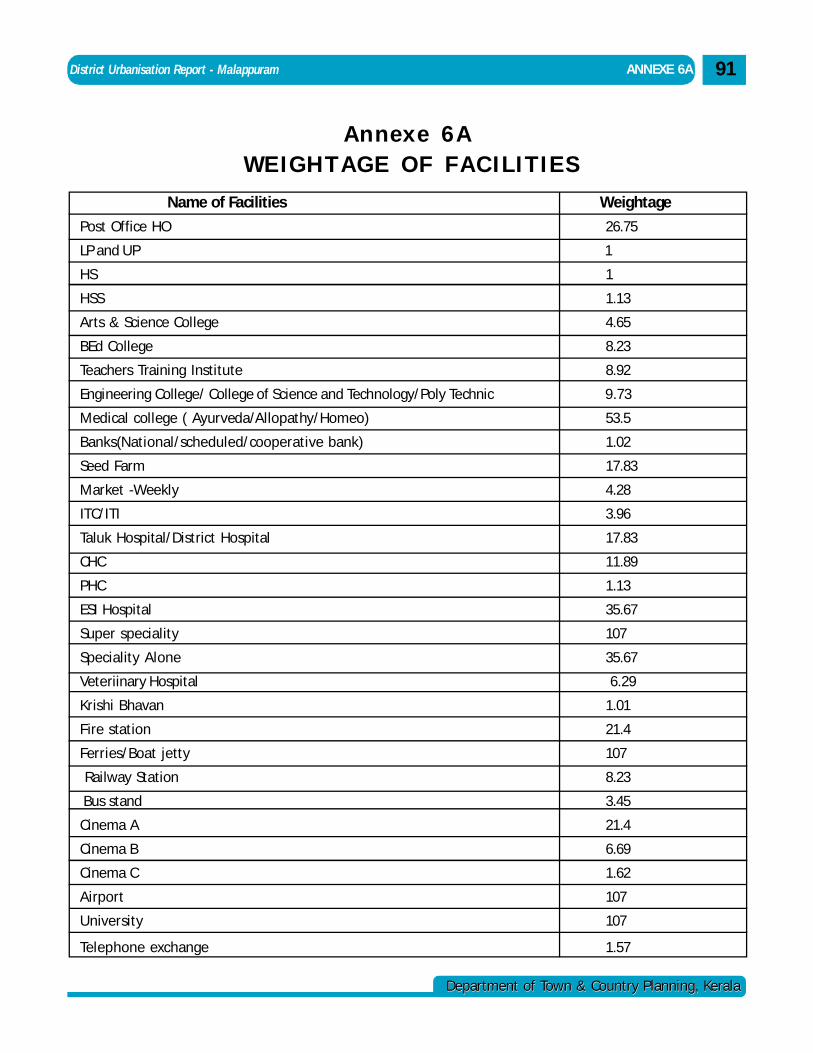
District Urbanisation Report - Malappuram
Department of Town & Country Planning, KeralaDepartment of Town & Country Planning, Kerala
WEIGHTAGE OF FACILITIESAnnexe 6A
Name of Facilities Weightage
Post Office HO 26.75
LP and UP 1
HS 1
HSS 1.13
Arts & Science College 4.65
BEd College 8.23
Teachers Training Institute 8.92
Engineering College/ College of Science and Technology/Poly Technic 9.73
Medical college ( Ayurveda/Allopathy/Homeo) 53.5
Banks(National/scheduled/cooperative bank) 1.02
Seed Farm 17.83
Market -Weekly 4.28
ITC/ITI 3.96
Taluk Hospital/District Hospital 17.83
CHC 11.89
PHC 1.13
ESI Hospital 35.67
Super speciality 107
Speciality Alone 35.67
Veteriinary Hospital 6.29
Krishi Bhavan 1.01
Fire station 21.4
Ferries/Boat jetty 107
Railway Station 8.23
Bus stand 3.45
Cinema A 21.4
Cinema B 6.69
Cinema C 1.62
Airport 107
University 107
Telephone exchange 1.57
ANNEXE 6A 91
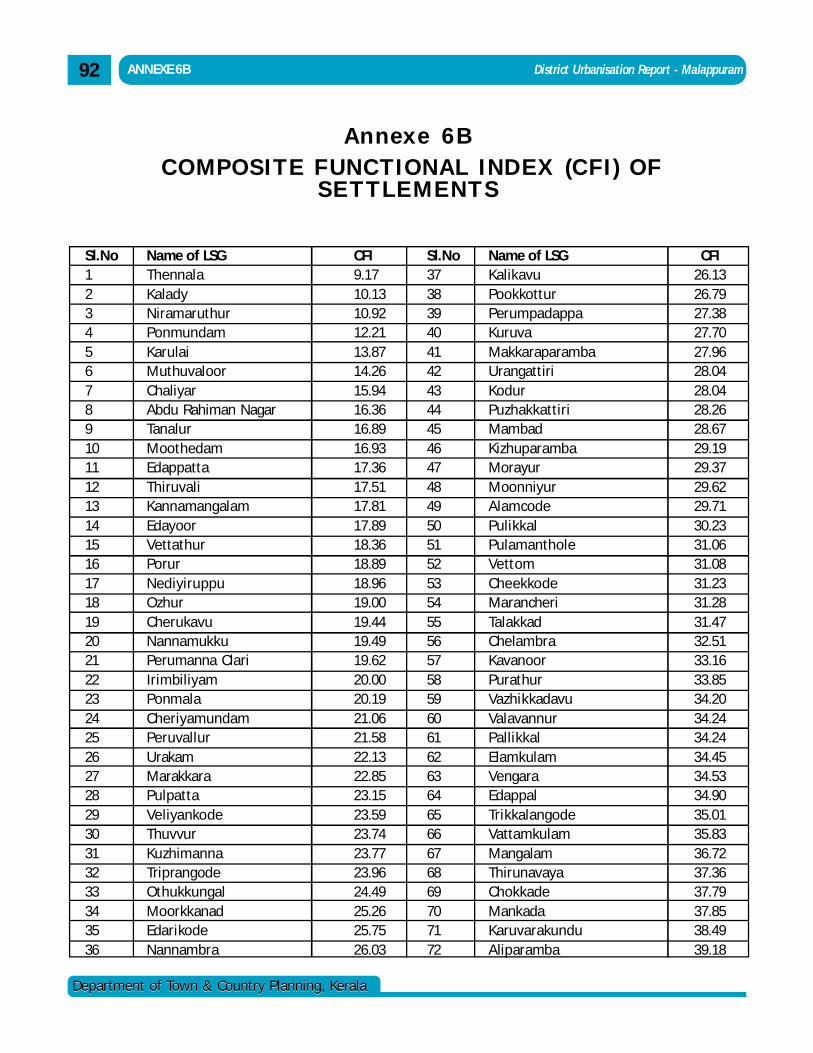
District Urbanisation Report - Malappuram
Department of Town & Country Planning, KeralaDepartment of Town & Country Planning, Kerala
92 ANNEXE 6B
Annexe 6B COMPOSITE FUNCTIONAL INDEX (CFI) OF
SETTLEMENTS
Sl.No Name of LSG CFI Sl.No Name of LSG CFI1 Thennala 9.17 37 Kalikavu 26.132 Kalady 10.13 38 Pookkottur 26.793 Niramaruthur 10.92 39 Perumpadappa 27.384 Ponmundam 12.21 40 Kuruva 27.705 Karulai 13.87 41 Makkaraparamba 27.966 Muthuvaloor 14.26 42 Urangattiri 28.047 Chaliyar 15.94 43 Kodur 28.048 Abdu Rahiman Nagar 16.36 44 Puzhakkattiri 28.269 Tanalur 16.89 45 Mambad 28.6710 Moothedam 16.93 46 Kizhuparamba 29.1911 Edappatta 17.36 47 Morayur 29.3712 Thiruvali 17.51 48 Moonniyur 29.6213 Kannamangalam 17.81 49 Alamcode 29.7114 Edayoor 17.89 50 Pulikkal 30.2315 Vettathur 18.36 51 Pulamanthole 31.0616 Porur 18.89 52 Vettom 31.0817 Nediyiruppu 18.96 53 Cheekkode 31.2318 Ozhur 19.00 54 Marancheri 31.2819 Cherukavu 19.44 55 Talakkad 31.4720 Nannamukku 19.49 56 Chelambra 32.5121 Perumanna Clari 19.62 57 Kavanoor 33.1622 Irimbiliyam 20.00 58 Purathur 33.8523 Ponmala 20.19 59 Vazhikkadavu 34.2024 Cheriyamundam 21.06 60 Valavannur 34.2425 Peruvallur 21.58 61 Pallikkal 34.2426 Urakam 22.13 62 Elamkulam 34.4527 Marakkara 22.85 63 Vengara 34.5328 Pulpatta 23.15 64 Edappal 34.9029 Veliyankode 23.59 65 Trikkalangode 35.0130 Thuvvur 23.74 66 Vattamkulam 35.8331 Kuzhimanna 23.77 67 Mangalam 36.7232 Triprangode 23.96 68 Thirunavaya 37.3633 Othukkungal 24.49 69 Chokkade 37.7934 Moorkkanad 25.26 70 Mankada 37.8535 Edarikode 25.75 71 Karuvarakundu 38.4936 Nannambra 26.03 72 Aliparamba 39.18
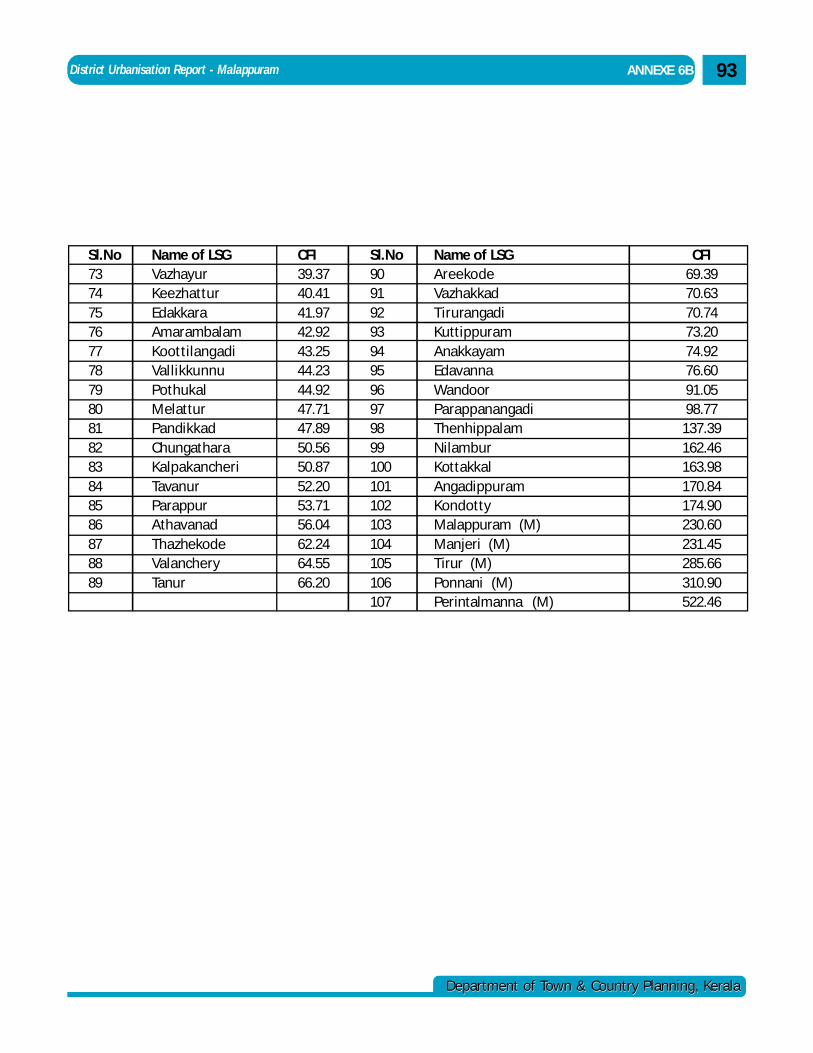
District Urbanisation Report - Malappuram
Department of Town & Country Planning, KeralaDepartment of Town & Country Planning, Kerala
Sl.No Name of LSG CFI Sl.No Name of LSG CFI73 Vazhayur 39.37 90 Areekode 69.3974 Keezhattur 40.41 91 Vazhakkad 70.6375 Edakkara 41.97 92 Tirurangadi 70.7476 Amarambalam 42.92 93 Kuttippuram 73.2077 Koottilangadi 43.25 94 Anakkayam 74.9278 Vallikkunnu 44.23 95 Edavanna 76.6079 Pothukal 44.92 96 Wandoor 91.0580 Melattur 47.71 97 Parappanangadi 98.7781 Pandikkad 47.89 98 Thenhippalam 137.3982 Chungathara 50.56 99 Nilambur 162.4683 Kalpakancheri 50.87 100 Kottakkal 163.9884 Tavanur 52.20 101 Angadippuram 170.8485 Parappur 53.71 102 Kondotty 174.9086 Athavanad 56.04 103 Malappuram (M) 230.6087 Thazhekode 62.24 104 Manjeri (M) 231.4588 Valanchery 64.55 105 Tirur (M) 285.6689 Tanur 66.20 106 Ponnani (M) 310.90
107 Perintalmanna (M) 522.46
93 ANNEXE 6B
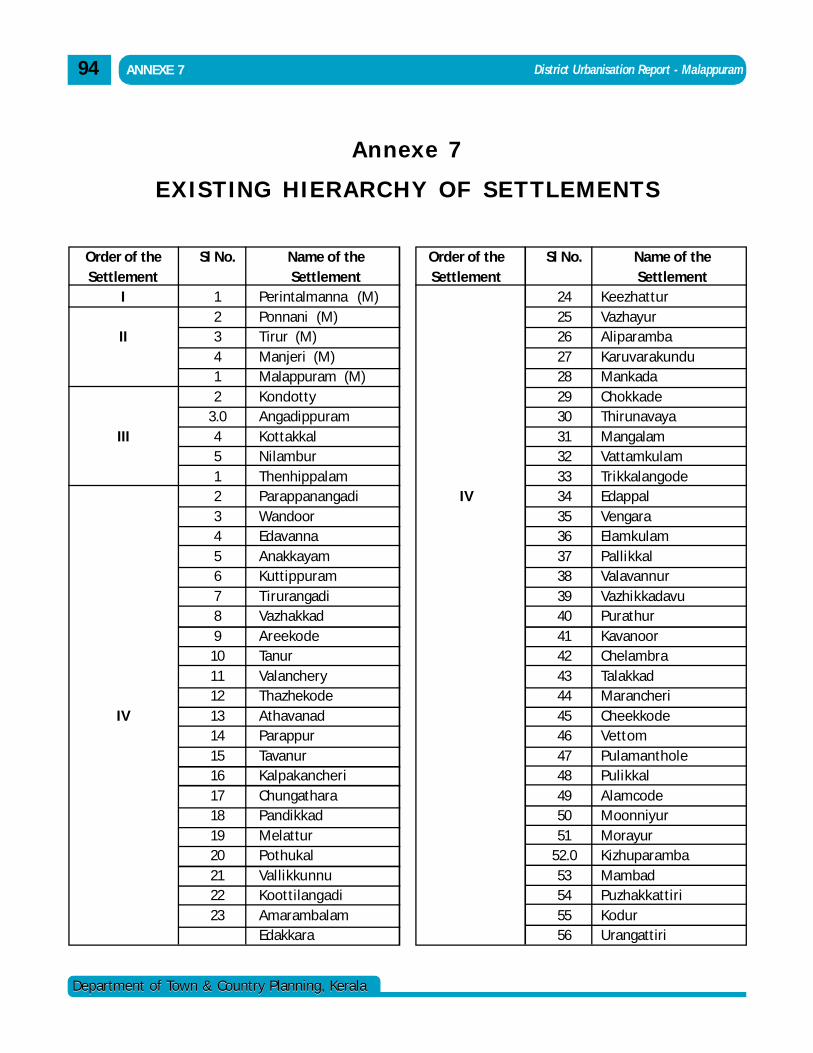
District Urbanisation Report - Malappuram
Department of Town & Country Planning, KeralaDepartment of Town & Country Planning, Kerala
94 ANNEXE 7
Annexe 7EXISTING HIERARCHY OF SETTLEMENTS
Order of theSettlement
I
II
III
IV
Sl No.
24252627282930313233343536373839404142434445464748495051
52.053545556
Name of theSettlement
KeezhatturVazhayurAliparambaKaruvarakunduMankadaChokkadeThirunavayaMangalamVattamkulamTrikkalangodeEdappalVengaraElamkulamPallikkalValavannurVazhikkadavuPurathurKavanoorChelambraTalakkadMarancheriCheekkodeVettomPulamantholePulikkalAlamcodeMoonniyurMorayurKizhuparambaMambadPuzhakkattiriKodurUrangattiri
Order of theSettlement
IV
Sl No.
123412
3.045123456789
1011121314151617181920212223
Name of theSettlement
Perintalmanna (M)Ponnani (M)Tirur (M)Manjeri (M)Malappuram (M)KondottyAngadippuramKottakkalNilamburThenhippalamParappanangadiWandoorEdavannaAnakkayamKuttippuramTirurangadiVazhakkadAreekodeTanurValancheryThazhekodeAthavanadParappurTavanurKalpakancheriChungatharaPandikkadMelatturPothukalVallikkunnuKoottilangadiAmarambalamEdakkara
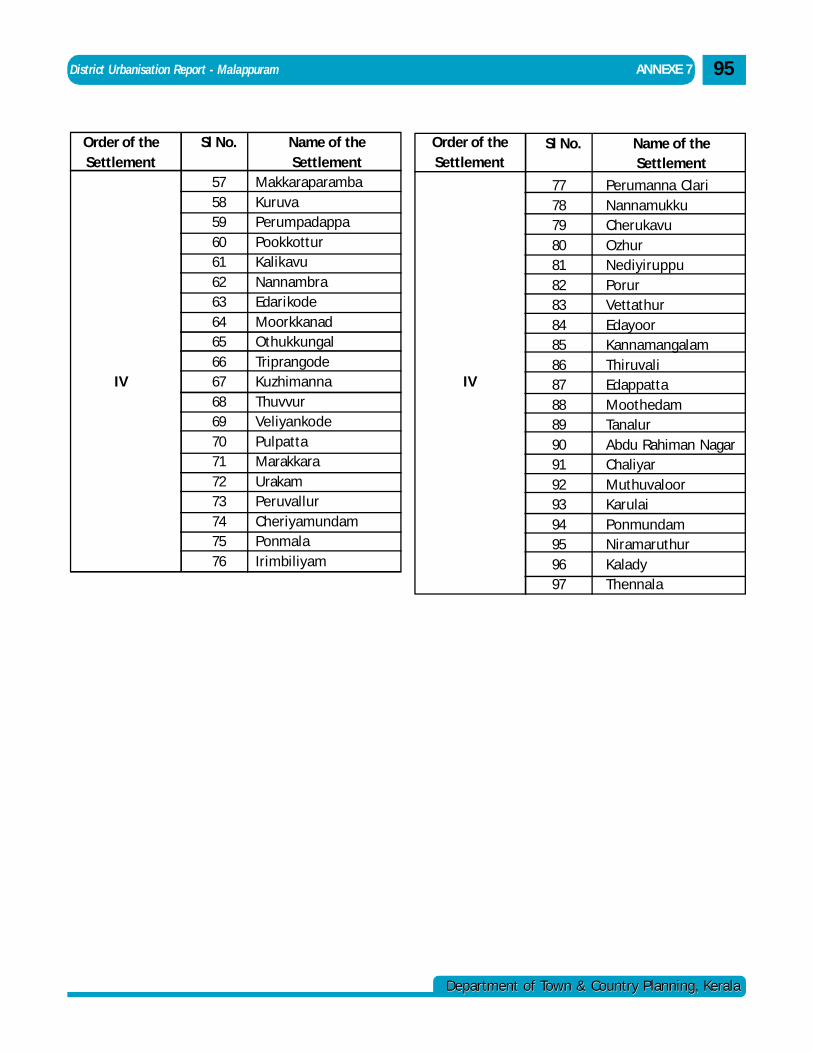
District Urbanisation Report - Malappuram
Department of Town & Country Planning, KeralaDepartment of Town & Country Planning, Kerala
95 ANNEXE 7
Order of theSettlement
IV
777879808182838485868788899091929394959697
Perumanna ClariNannamukkuCherukavuOzhurNediyiruppuPorurVettathurEdayoorKannamangalamThiruvaliEdappattaMoothedamTanalurAbdu Rahiman NagarChaliyarMuthuvaloorKarulaiPonmundamNiramaruthurKaladyThennala
Sl No. Name of theSettlement
Order of theSettlement
IV
Sl No.
5758596061626364656667686970717273747576
Name of theSettlement
MakkaraparambaKuruvaPerumpadappaPookkotturKalikavuNannambraEdarikodeMoorkkanadOthukkungalTriprangodeKuzhimannaThuvvurVeliyankodePulpattaMarakkaraUrakamPeruvallurCheriyamundamPonmalaIrimbiliyam
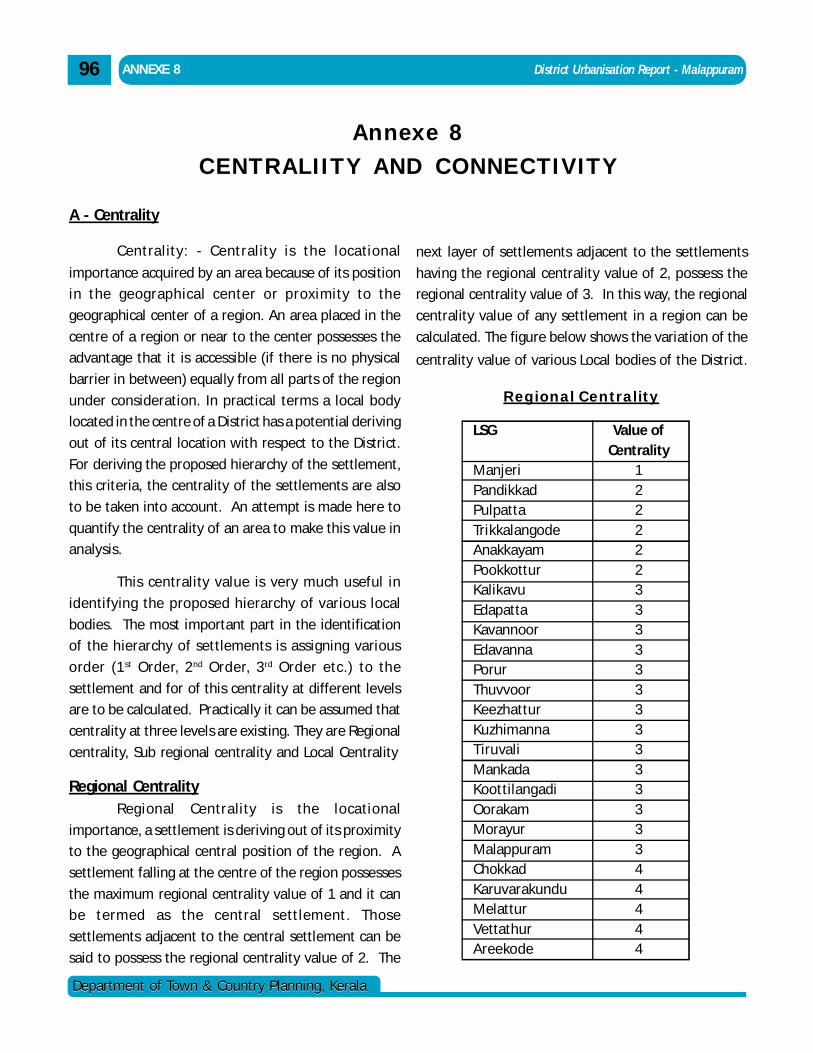
District Urbanisation Report - Malappuram
Department of Town & Country Planning, KeralaDepartment of Town & Country Planning, Kerala
96 ANNEXE 8
Annexe 8CENTRALIITY AND CONNECTIVITY
A - Centrality
Centrality: - Centrality is the locational
importance acquired by an area because of its position
in the geographical center or proximity to the
geographical center of a region. An area placed in the
centre of a region or near to the center possesses the
advantage that it is accessible (if there is no physical
barrier in between) equally from all parts of the region
under consideration. In practical terms a local body
located in the centre of a District has a potential deriving
out of its central location with respect to the District.
For deriving the proposed hierarchy of the settlement,
this criteria, the centrality of the settlements are also
to be taken into account. An attempt is made here to
quantify the centrality of an area to make this value in
analysis.
This centrality value is very much useful in
identifying the proposed hierarchy of various local
bodies. The most important part in the identification
of the hierarchy of settlements is assigning various
order (1st Order, 2nd Order, 3 rd Order etc.) to the
settlement and for of this centrality at different levels
are to be calculated. Practically it can be assumed that
centrality at three levels are existing. They are Regional
centrality, Sub regional centrality and Local Centrality
Regional CentralityRegional Centrality is the locational
importance, a settlement is deriving out of its proximity
to the geographical central position of the region. A
settlement falling at the centre of the region possesses
the maximum regional centrality value of 1 and it can
be termed as the central settlement. Those
settlements adjacent to the central settlement can be
said to possess the regional centrality value of 2. The
next layer of settlements adjacent to the settlements
having the regional centrality value of 2, possess the
regional centrality value of 3. In this way, the regional
centrality value of any settlement in a region can be
calculated. The figure below shows the variation of the
centrality value of various Local bodies of the District.
Regional Centrality
LSG
ManjeriPandikkadPulpattaTrikkalangodeAnakkayamPookkotturKalikavuEdapattaKavannoorEdavannaPorurThuvvoorKeezhatturKuzhimannaTiruvaliMankadaKoottilangadiOorakamMorayurMalappuramChokkadKaruvarakunduMelatturVettathurAreekode
Value ofCentrality
1222223333333333333344444
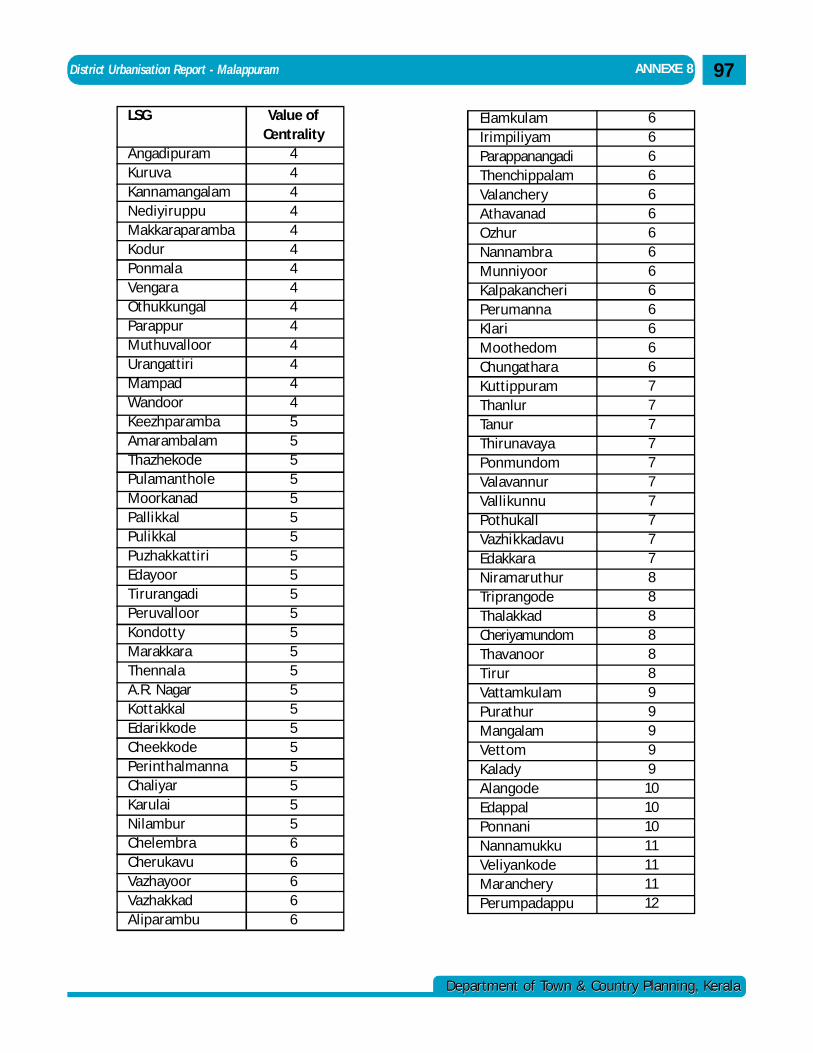
District Urbanisation Report - Malappuram
Department of Town & Country Planning, KeralaDepartment of Town & Country Planning, Kerala
97 ANNEXE 8
LSG
AngadipuramKuruvaKannamangalamNediyiruppuMakkaraparambaKodurPonmalaVengaraOthukkungalParappurMuthuvalloorUrangattiriMampadWandoorKeezhparambaAmarambalamThazhekodePulamantholeMoorkanadPallikkalPulikkalPuzhakkattiriEdayoorTirurangadiPeruvalloorKondottyMarakkaraThennalaA.R. NagarKottakkalEdarikkodeCheekkodePerinthalmannaChaliyarKarulaiNilamburChelembraCherukavuVazhayoorVazhakkadAliparambu
Value ofCentrality
44444444444444555555555555555555555566666
ElamkulamIrimpiliyamParappanangadiThenchippalamValancheryAthavanadOzhurNannambraMunniyoorKalpakancheriPerumannaKlariMoothedomChungatharaKuttippuramThanlurTanurThirunavayaPonmundomValavannurVallikunnuPothukallVazhikkadavuEdakkaraNiramaruthurTriprangodeThalakkadCheriyamundomThavanoorTirurVattamkulamPurathurMangalamVettomKaladyAlangodeEdappalPonnaniNannamukkuVeliyankodeMarancheryPerumpadappu
66666666666666777777777788888899999
10101011111112
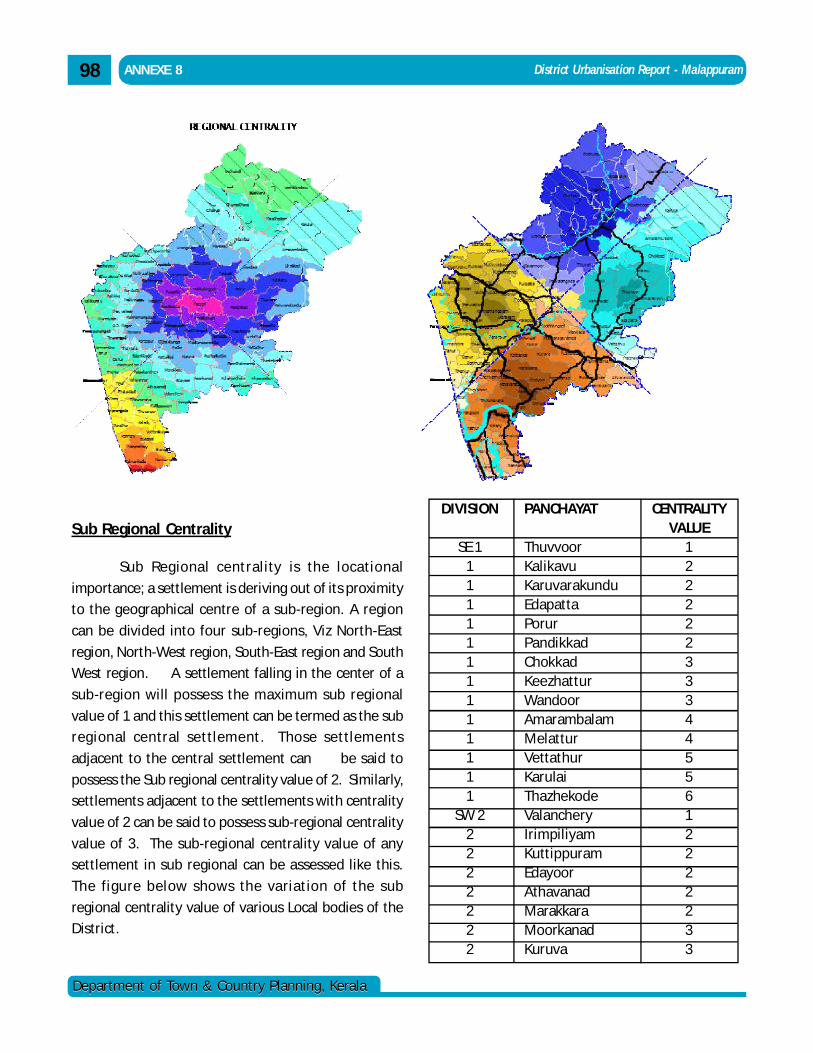
District Urbanisation Report - Malappuram
Department of Town & Country Planning, KeralaDepartment of Town & Country Planning, Kerala
98 ANNEXE 8
Sub Regional Centrality
Sub Regional centrality is the locational
importance; a settlement is deriving out of its proximity
to the geographical centre of a sub-region. A region
can be divided into four sub-regions, Viz North-East
region, North-West region, South-East region and South
West region. A settlement falling in the center of a
sub-region will possess the maximum sub regional
value of 1 and this settlement can be termed as the sub
regional central settlement. Those settlements
adjacent to the central settlement can be said to
possess the Sub regional centrality value of 2. Similarly,
settlements adjacent to the settlements with centrality
value of 2 can be said to possess sub-regional centrality
value of 3. The sub-regional centrality value of any
settlement in sub regional can be assessed like this.
The figure below shows the variation of the sub
regional centrality value of various Local bodies of the
District.
CENTRALITYVALUE
1222223334455612222233
PANCHAYAT
ThuvvoorKalikavuKaruvarakunduEdapattaPorurPandikkadChokkadKeezhatturWandoorAmarambalamMelatturVettathurKarulaiThazhekodeValancheryIrimpiliyamKuttippuramEdayoorAthavanadMarakkaraMoorkanadKuruva
DIVISION
SE 11111111111111
SW 22222222
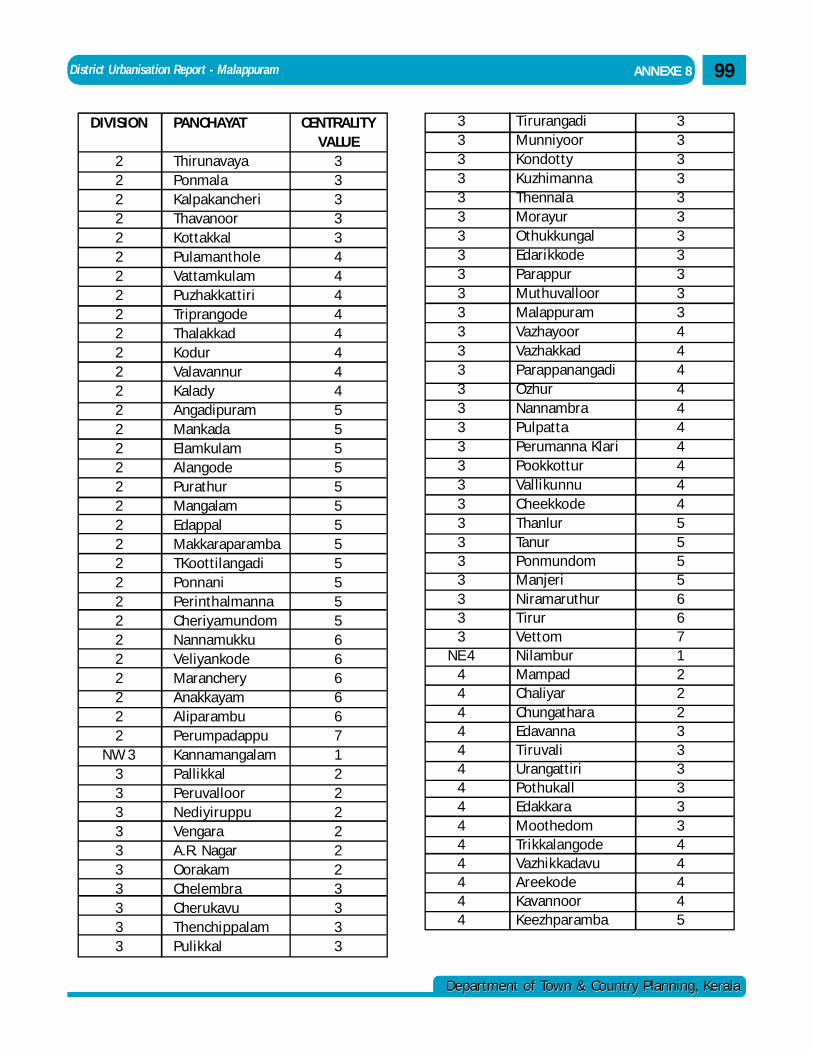
District Urbanisation Report - Malappuram
Department of Town & Country Planning, KeralaDepartment of Town & Country Planning, Kerala
99 ANNEXE 8
3333333333344444444445555667122233333344445
TirurangadiMunniyoorKondottyKuzhimannaThennalaMorayurOthukkungalEdarikkodeParappurMuthuvalloorMalappuramVazhayoorVazhakkadParappanangadiOzhurNannambraPulpattaPerumanna KlariPookkotturVallikunnuCheekkodeThanlurTanurPonmundomManjeriNiramaruthurTirurVettomNilamburMampadChaliyarChungatharaEdavannaTiruvaliUrangattiriPothukallEdakkaraMoothedomTrikkalangodeVazhikkadavuAreekodeKavannoorKeezhparamba
3333333333333333333333333333
NE 444444444444444
CENTRALITYVALUE
333334444444455555555555566666712222223333
PANCHAYAT
ThirunavayaPonmalaKalpakancheriThavanoorKottakkalPulamantholeVattamkulamPuzhakkattiriTriprangodeThalakkadKodurValavannurKaladyAngadipuramMankadaElamkulamAlangodePurathurMangalamEdappalMakkaraparambaTKoottilangadiPonnaniPerinthalmannaCheriyamundomNannamukkuVeliyankodeMarancheryAnakkayamAliparambuPerumpadappuKannamangalamPallikkalPeruvalloorNediyiruppuVengaraA.R. NagarOorakamChelembraCherukavuThenchippalamPulikkal
DIVISION
2222222222222222222222222222222
NW 33333333333
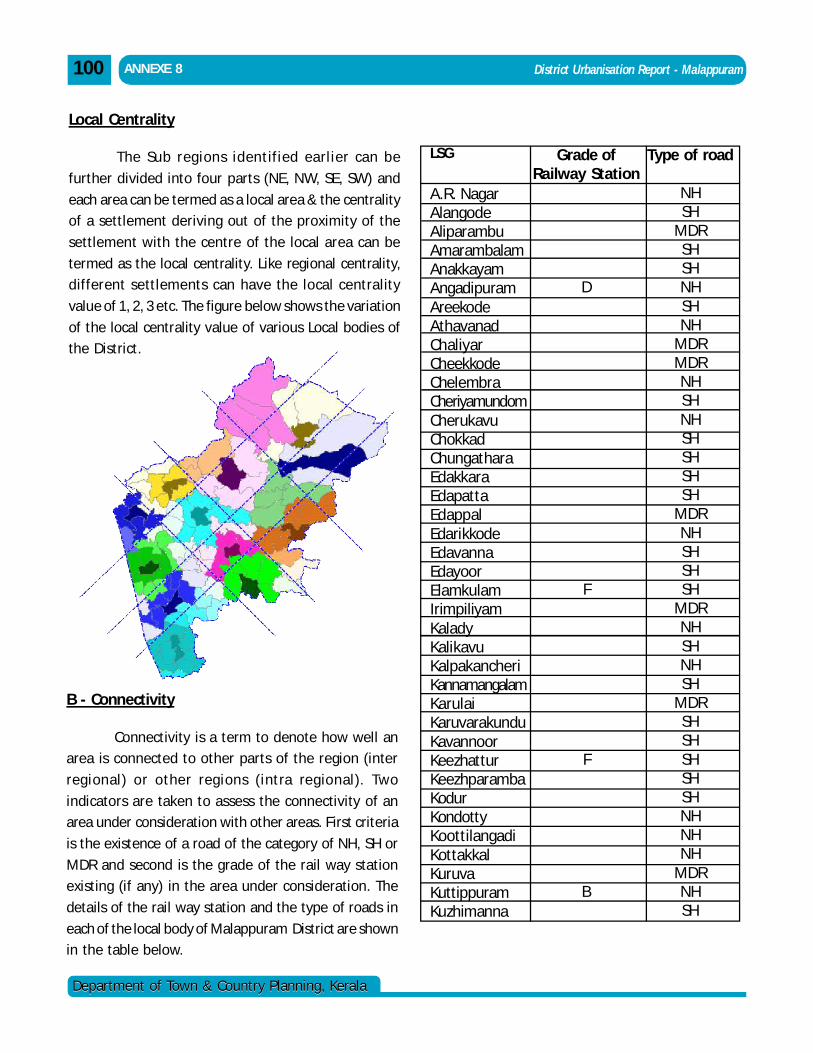
District Urbanisation Report - Malappuram
Department of Town & Country Planning, KeralaDepartment of Town & Country Planning, Kerala
100 ANNEXE 8
B - Connectivity
Connectivity is a term to denote how well an
area is connected to other parts of the region (inter
regional) or other regions (intra regional). Two
indicators are taken to assess the connectivity of an
area under consideration with other areas. First criteria
is the existence of a road of the category of NH, SH or
MDR and second is the grade of the rail way station
existing (if any) in the area under consideration. The
details of the rail way station and the type of roads in
each of the local body of Malappuram District are shown
in the table below.
Local Centrality
The Sub regions identified earlier can be
further divided into four parts (NE, NW, SE, SW) and
each area can be termed as a local area & the centrality
of a settlement deriving out of the proximity of the
settlement with the centre of the local area can be
termed as the local centrality. Like regional centrality,
different settlements can have the local centrality
value of 1, 2, 3 etc. The figure below shows the variation
of the local centrality value of various Local bodies of
the District.
Type of road
NHSH
MDRSHSHNHSHNH
MDRMDRNHSHNHSHSHSHSH
MDRNHSHSHSH
MDRNHSHNHSH
MDRSHSHSHSHSHNHNHNH
MDRNHSH
Grade ofRailway Station
D
F
F
B
LSG
A.R. NagarAlangodeAliparambuAmarambalamAnakkayamAngadipuramAreekodeAthavanadChaliyarCheekkodeChelembraCheriyamundomCherukavuChokkadChungatharaEdakkaraEdapattaEdappalEdarikkodeEdavannaEdayoorElamkulamIrimpiliyamKaladyKalikavuKalpakancheriKannamangalamKarulaiKaruvarakunduKavannoorKeezhatturKeezhparambaKodurKondottyKoottilangadiKottakkalKuruvaKuttippuramKuzhimanna
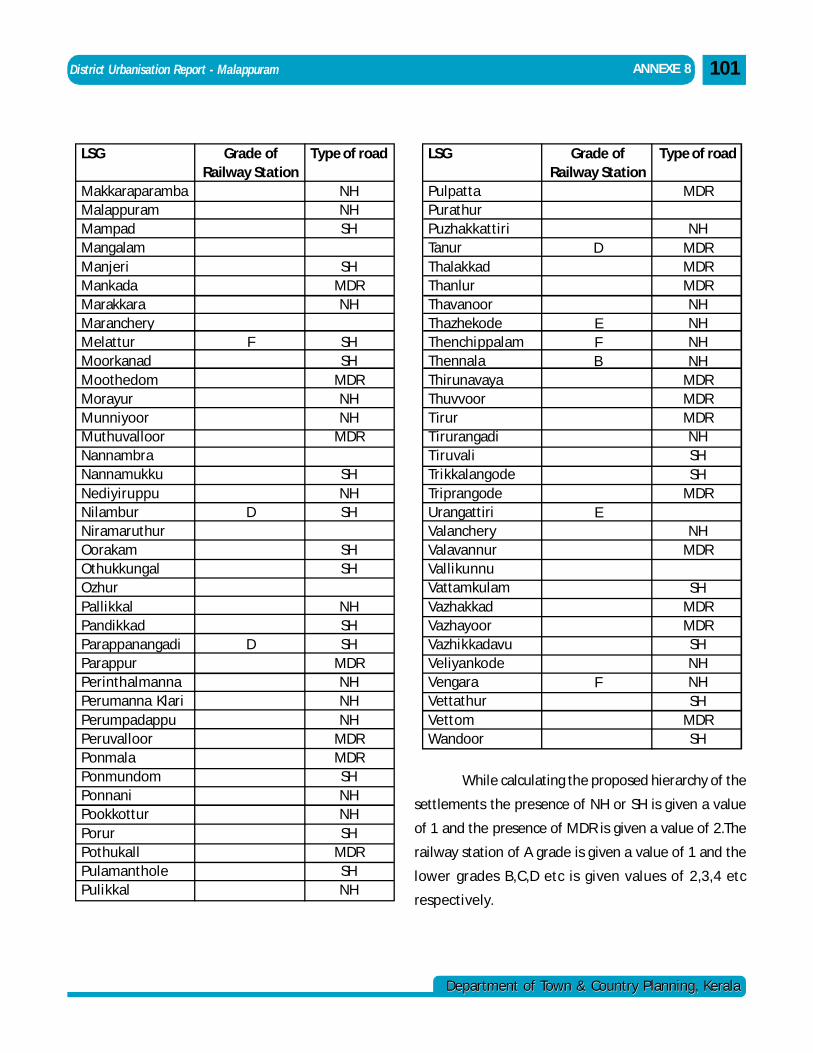
District Urbanisation Report - Malappuram
Department of Town & Country Planning, KeralaDepartment of Town & Country Planning, Kerala
101 ANNEXE 8
While calculating the proposed hierarchy of the
settlements the presence of NH or SH is given a value
of 1 and the presence of MDR is given a value of 2.The
railway station of A grade is given a value of 1 and the
lower grades B,C,D etc is given values of 2,3,4 etc
respectively.
Grade ofRailway Station
F
D
D
Type of road
MDR
NHMDRMDRMDRNHNHNHNH
MDRMDRMDRNHSHSH
MDR
NHMDR
SHMDRMDRSHNHNHSH
MDRSH
Grade ofRailway Station
D
EFB
E
F
LSG
PulpattaPurathurPuzhakkattiriTanurThalakkadThanlurThavanoorThazhekodeThenchippalamThennalaThirunavayaThuvvoorTirurTirurangadiTiruvaliTrikkalangodeTriprangodeUrangattiriValancheryValavannurVallikunnuVattamkulamVazhakkadVazhayoorVazhikkadavuVeliyankodeVengaraVettathurVettomWandoor
Type of road
NHNHSH
SHMDRNH
SHSH
MDRNHNH
MDR
SHNHSH
SHSH
NHSHSH
MDRNHNHNH
MDRMDRSHNHNHSH
MDRSHNH
LSG
MakkaraparambaMalappuramMampadMangalamManjeriMankadaMarakkaraMarancheryMelatturMoorkanadMoothedomMorayurMunniyoorMuthuvalloorNannambraNannamukkuNediyiruppuNilamburNiramaruthurOorakamOthukkungalOzhurPallikkalPandikkadParappanangadiParappurPerinthalmannaPerumanna KlariPerumpadappuPeruvalloorPonmalaPonmundomPonnaniPookkotturPorurPothukallPulamantholePulikkal
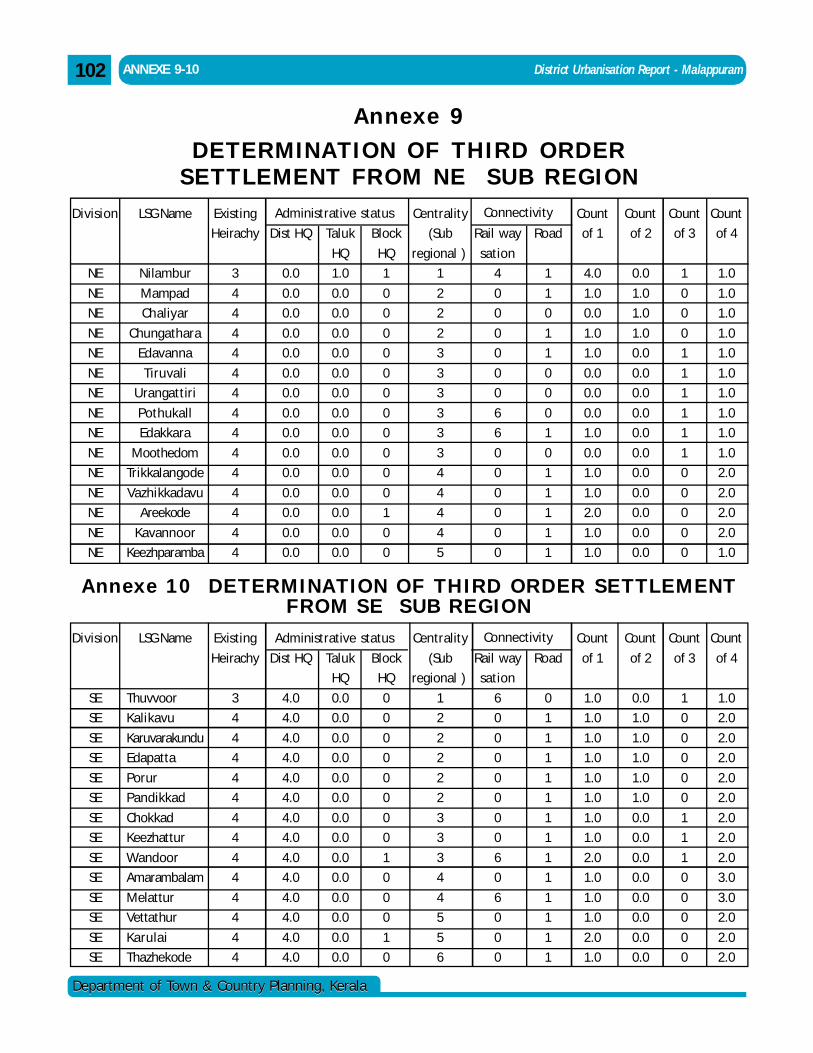
District Urbanisation Report - Malappuram
Department of Town & Country Planning, KeralaDepartment of Town & Country Planning, Kerala
ANNEXE 9-10102
Annexe 9DETERMINATION OF THIRD ORDER
SETTLEMENT FROM NE SUB REGION
Annexe 10 DETERMINATION OF THIRD ORDER SETTLEMENTFROM SE SUB REGION
Division
NE
NE
NE
NE
NE
NE
NE
NE
NE
NE
NE
NE
NE
NE
NE
LSG Name
Nilambur
Mampad
Chaliyar
Chungathara
Edavanna
Tiruvali
Urangattiri
Pothukall
Edakkara
Moothedom
Trikkalangode
Vazhikkadavu
Areekode
Kavannoor
Keezhparamba
Existing
Heirachy
3
4
4
4
4
4
4
4
4
4
4
4
4
4
4
Dist HQ
0.0
0.0
0.0
0.0
0.0
0.0
0.0
0.0
0.0
0.0
0.0
0.0
0.0
0.0
0.0
Taluk
HQ
1.0
0.0
0.0
0.0
0.0
0.0
0.0
0.0
0.0
0.0
0.0
0.0
0.0
0.0
0.0
Block
HQ
1
0
0
0
0
0
0
0
0
0
0
0
1
0
0
Centrality
(Sub
regional )
1
2
2
2
3
3
3
3
3
3
4
4
4
4
5
Rail way
sation
4
0
0
0
0
0
0
6
6
0
0
0
0
0
0
Road
1
1
0
1
1
0
0
0
1
0
1
1
1
1
1
Count
of 1
4.0
1.0
0.0
1.0
1.0
0.0
0.0
0.0
1.0
0.0
1.0
1.0
2.0
1.0
1.0
Count
of 2
0.0
1.0
1.0
1.0
0.0
0.0
0.0
0.0
0.0
0.0
0.0
0.0
0.0
0.0
0.0
Count
of 3
1
0
0
0
1
1
1
1
1
1
0
0
0
0
0
Count
of 4
1.0
1.0
1.0
1.0
1.0
1.0
1.0
1.0
1.0
1.0
2.0
2.0
2.0
2.0
1.0
Administrative status Connectivity
Existing
Heirachy
3
4
4
4
4
4
4
4
4
4
4
4
4
4
Dist HQ
4.0
4.0
4.0
4.0
4.0
4.0
4.0
4.0
4.0
4.0
4.0
4.0
4.0
4.0
Count
of 1
1.0
1.0
1.0
1.0
1.0
1.0
1.0
1.0
2.0
1.0
1.0
1.0
2.0
1.0
Count
of 2
0.0
1.0
1.0
1.0
1.0
1.0
0.0
0.0
0.0
0.0
0.0
0.0
0.0
0.0
Division
SE
SE
SE
SE
SE
SE
SE
SE
SE
SE
SE
SE
SE
SE
LSG Name
Thuvvoor
Kalikavu
Karuvarakundu
Edapatta
Porur
Pandikkad
Chokkad
Keezhattur
Wandoor
Amarambalam
Melattur
Vettathur
Karulai
Thazhekode
Taluk
HQ
0.0
0.0
0.0
0.0
0.0
0.0
0.0
0.0
0.0
0.0
0.0
0.0
0.0
0.0
Block
HQ
0
0
0
0
0
0
0
0
1
0
0
0
1
0
Centrality
(Sub
regional )
1
2
2
2
2
2
3
3
3
4
4
5
5
6
Rail way
sation
6
0
0
0
0
0
0
0
6
0
6
0
0
0
Road
0
1
1
1
1
1
1
1
1
1
1
1
1
1
Count
of 3
1
0
0
0
0
0
1
1
1
0
0
0
0
0
Count
of 4
1.0
2.0
2.0
2.0
2.0
2.0
2.0
2.0
2.0
3.0
3.0
2.0
2.0
2.0
Administrative status Connectivity
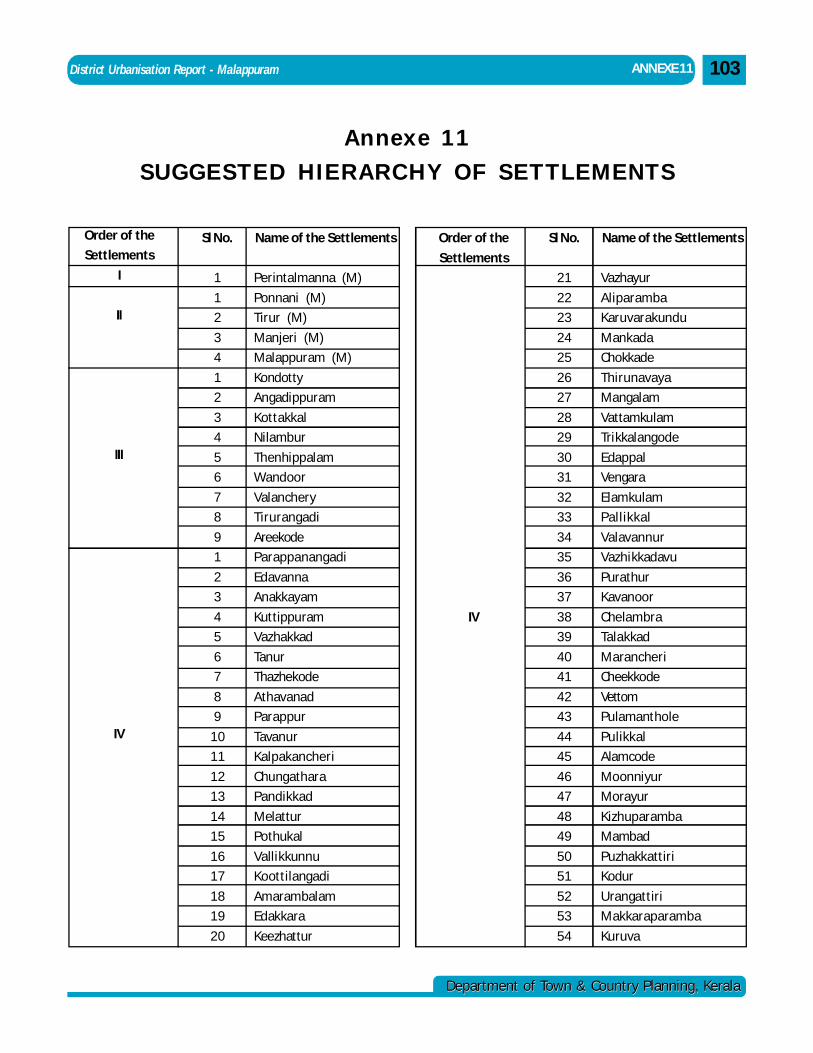
District Urbanisation Report - Malappuram
Department of Town & Country Planning, KeralaDepartment of Town & Country Planning, Kerala
Order of the
Settlements
I
II
III
IV
ANNEXE 11 103
Annexe 11SUGGESTED HIERARCHY OF SETTLEMENTS
Sl No.
1
1
2
3
4
1
2
3
4
5
6
7
8
9
1
2
3
4
5
6
7
8
9
10
11
12
13
14
15
16
17
18
19
20
Name of the Settlements
Perintalmanna (M)
Ponnani (M)
Tirur (M)
Manjeri (M)
Malappuram (M)
Kondotty
Angadippuram
Kottakkal
Nilambur
Thenhippalam
Wandoor
Valanchery
Tirurangadi
Areekode
Parappanangadi
Edavanna
Anakkayam
Kuttippuram
Vazhakkad
Tanur
Thazhekode
Athavanad
Parappur
Tavanur
Kalpakancheri
Chungathara
Pandikkad
Melattur
Pothukal
Vallikkunnu
Koottilangadi
Amarambalam
Edakkara
Keezhattur
Sl No.
21
22
23
24
25
26
27
28
29
30
31
32
33
34
35
36
37
38
39
40
41
42
43
44
45
46
47
48
49
50
51
52
53
54
Name of the Settlements
Vazhayur
Aliparamba
Karuvarakundu
Mankada
Chokkade
Thirunavaya
Mangalam
Vattamkulam
Trikkalangode
Edappal
Vengara
Elamkulam
Pallikkal
Valavannur
Vazhikkadavu
Purathur
Kavanoor
Chelambra
Talakkad
Marancheri
Cheekkode
Vettom
Pulamanthole
Pulikkal
Alamcode
Moonniyur
Morayur
Kizhuparamba
Mambad
Puzhakkattiri
Kodur
Urangattiri
Makkaraparamba
Kuruva
Order of the
Settlements
IV
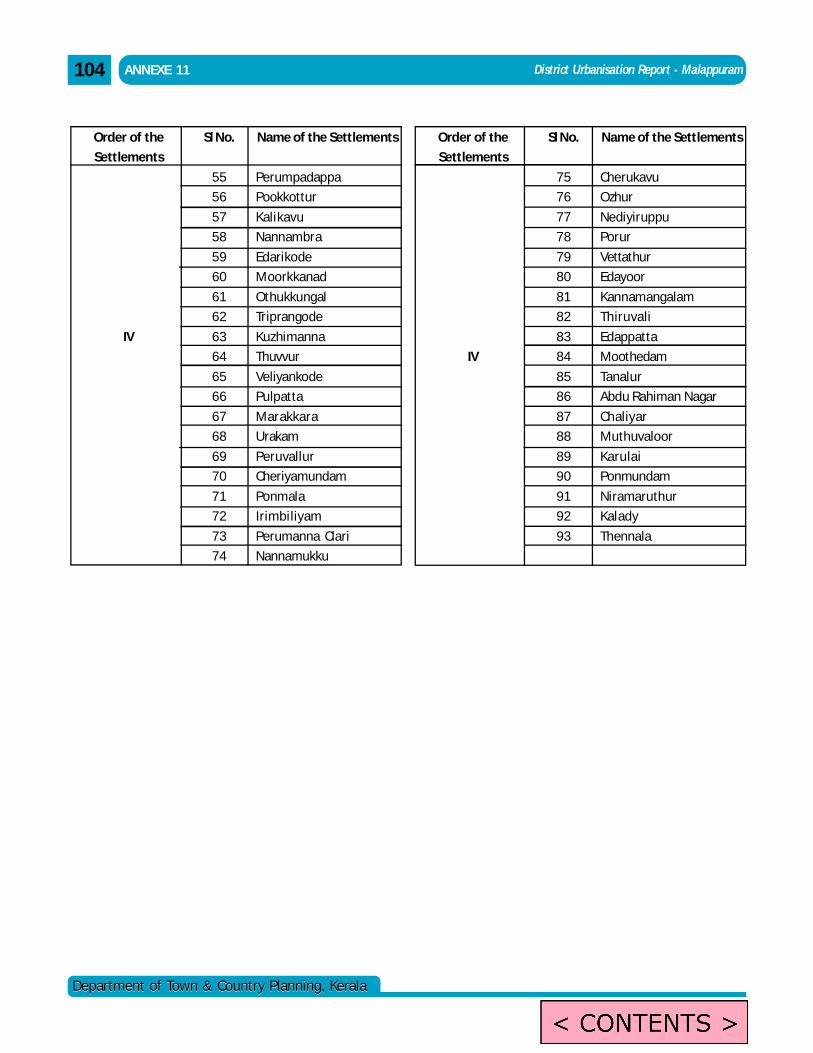
District Urbanisation Report - Malappuram
Department of Town & Country Planning, KeralaDepartment of Town & Country Planning, Kerala
ANNEXE 11104
Sl No.
55
56
57
58
59
60
61
62
63
64
65
66
67
68
69
70
71
72
73
74
Name of the Settlements
Perumpadappa
Pookkottur
Kalikavu
Nannambra
Edarikode
Moorkkanad
Othukkungal
Triprangode
Kuzhimanna
Thuvvur
Veliyankode
Pulpatta
Marakkara
Urakam
Peruvallur
Cheriyamundam
Ponmala
Irimbiliyam
Perumanna Clari
Nannamukku
Order of the
Settlements
IV
Sl No.
75
76
77
78
79
80
81
82
83
84
85
86
87
88
89
90
91
92
93
Name of the Settlements
Cherukavu
Ozhur
Nediyiruppu
Porur
Vettathur
Edayoor
Kannamangalam
Thiruvali
Edappatta
Moothedam
Tanalur
Abdu Rahiman Nagar
Chaliyar
Muthuvaloor
Karulai
Ponmundam
Niramaruthur
Kalady
Thennala
Order of the
Settlements
IV
admin
Text Box
< CONTENTS >