K A S A R A G O D - Department of Town & Country Planning
96
DISTRICT URBANISATION REPORT K A S A R A G O D DEPARTMENT OF TOWN AND COUNTRY PLANNING - GOVERNMENT OF KERALA January 2011
-
Upload
khangminh22 -
Category
Documents
-
view
4 -
download
0
Transcript of K A S A R A G O D - Department of Town & Country Planning
DISTRICT URBANISATION REPORT
K A S A R A G O D
DEPARTMENT OF TOWN AND COUNTRY PLANNING - GOVERNMENT OF KERALA
January 2011
admin
Text Box
< CONTENTS >
admin
Text Box
PREFACE >>

PREFACE
Planning is a prerequisite for effective development. Development becomes comprehensive whengrowth centres are identified considering physical, social and economic variables of an area in an integratedmanner. This indicates that planning of villages and towns are to be complementary. Second AdministrativeReforms Commission (ARC) while interpreting the article 243 ZD of the Constitution of India states asfollows. “This, in other words, means that the development needs of the rural and urban areas should bedealt with in an integrated manner and, therefore, the district plan, which is a plan for a large area consistingof villages and towns, should take into account such factors as ‘spatial planning’, sharing of ‘physical andnatural resources’, integrated development of infrastructure’ and ‘environmental conservation’. All theseare important, because the relationship between villages and towns is complementary. One needs theother. Many functions that the towns perform as seats of industry, trade and business and as providers ofvarious services, including higher education, specialized health care services, communication etc have animpact on the development and welfare of rural people. Similarly, the orderly growth of the urban centreis dependent on the kind of organic linkage it establishes with its rural hinterland”. Therefore a move ofharmonizing urban and rural centres of an area can be said as a move of planned urbanisation of the area.
In this context, it is relevant to mention the 74th Amendment Act of the Constitution of India, whichmandated the District Planning Committee to prepare a draft development plan for the district. As perArticle 243 ZD of the Constitution, the District Planning Committee (DPC) shall consolidate Panchayat/Municipality Plans in the district and prepare draft development plan for the district as a whole. TheConstitution also specifies that while preparing draft development plan due regard shall be given to mattersof common interest between panchayats and municipalities including spatial planning, sharing of waterand other physical and natural resources, the integrated development of infrastructure and environmentalconservation. In this respect, the district of Kollam has conducted an important experiment of preparationof an Integrated District Development Plan (IDDP) for the district. Through preparation of IDDP, the DistrictPlanning Committee of Kollam has become the first ever DPC in the country to own a District DevelopmentPlan as envisaged by the Constitution. This path-breaking venture has become a model in participatorydistrict planning in a spatial platform. The Plan was released during the international conference on districtplanning held at Kollam in August 2009. The Plan is now sanctioned by Government of Kerala. As per G.O(Rt) 354/04/LSGD dated 01.02.07, the State Government have extended the project to the remaining districtsin the state and the districts of Alappuzha, Thrissur, Idukki, Palakkad and Wayanad were selected forextending the project in the first phase. However, even in these districts, preparation of IDDP is yet to becompleted.
Preparation of such a plan will surely need decisions and commitment at various levels due to themultiplicity of agencies involved and the vast spectrum of aspects to be addressed. However, delay inplanning shall not affect development. Hence a step by step approach may be adopted in planning.Therefore, the Department of Town and Country Planning evolved a sequence of plan preparation at districtlevel, involving District Urbanisation Report (DUR), District Spatial Plan (DSP) and Integrated DistrictDevelopment Plan (IDDP).
The District Urbanisation Report defines the future spatial structure of a district, which is formulatedby integrating hierarchy and activity pattern of urban and rural settlements and the connectivity betweenthem. The spatial structure of a district will act as a frame for the orderly development of urban centres andtheir rural hinterland subsequently leading to a planned urbanisation.
admin
Text Box
<< BACK
admin
Text Box
< CONTENTS >
admin
Text Box
NEXT >>

The District Spatial Plan is a synergistic form of the District Urbanisation Report, since as a plan it iscongruent to a single unified physical design for the district through setting development goals and objectivesand formulating the development concept of the district. DSP will frame the general policies and strategies andstreamline directions of development of the district. The Development Directives of DSP is carved in the spatialplatform through the synthesis of findings of the analysis over the spatial structure based on secondary sourcesof data. But it lacks the resource studies as co-ordination of various agencies remain as an uphill task.
The Integrated District Development Plan can be termed as the highest echelon of this series and manifestall features of the draft district development plan as envisaged in Article 243ZD of the Constitution of India.Democratisation of planning and translation of sectoral policies into spatial plans are the paramount qualities ofIDDP as against DSP. IDDP comprises of two components; a Perspective Plan for 15-20 years and an Execution Planfor 5 years.
As said earlier, IDDP for Kollam District is already prepared under the leadership of the District PlanningCommittee, Kollam with the involvement of all the Local Governments in the district and Special TechnicalAdvisory Committee for IDDP. The Department of Town and Country Planning gave technical support for Planpreparation besides coordinating the entire process in the role of nodal agency.
Now, the Department has prepared District Spatial Plans for the districts of Thrissur and Palakkad andDistrict Urbanisation Reports for the districts of Thiruvananthapuram, Pathanamthitta, Alappuzha, Kottayam,Ernakulam, Idukki, Malappuram, Kozhikkode, Wayanad, Kannur and Kasaragod. The District Urbanisation Reportfor Kasaragod is one among the series.
I take this opportunity to appreciate the officials of the Kasaragod District Office of the Department,headed by Sri. K.M.Gopakumar, in the preparation of this document. The State Project Cell for LDP-IDDP-SPPplayed anchor role in this regard, right from conceptualisation to shaping the end product. The toolkits andcustomised computer applications developed by the State Project Cell has enabled the district offices toaccomplish the task in a time bound manner. I also appreciate the consistent efforts of Sri. Jacob Easow, SeniorTown Planner, Smt.Ushakumari.P.R, Town Planner, Sri. Baiju.K, Deputy Town Planner and other officials of theState Project Cell. I also appreciate the officials of the circle headed bySri.G. Mohanan, Senior Town Planner for their efforts in vetting and finalising the District Urbanisation Report forKasaragod.
This is a first step on the ladder leading to the draft development plan for the district as laid down in theConstitution. It is hoped that the district of Kasaragod will further extend the District Urbanisation Report intoIntegrated District Development Plan for the district.
Certainly, the District Urbanisation Report for Kasaragod will provide a framework for development as wellas future planning of the district.
Thiruvananthapuram Eapen Varughese
11- 02-2011 Chief Town Planner
admin
Text Box
< CONTENTS >
admin
Text Box
NEXT >>
admin
Text Box
<< BACK

ACKNOWLEDGEMENTS
The District Urbanisation Report, Kasaragod district is prepared as part of the State PerspectivePlan for Kerala. The level of urbanisation in the district, functional character and hierarchy ofsettlements etc are studied in detail and projection of future urban profile is attempted at. Themethodology for the study has evolved through a number of discussions and workshops. The samemethodology is adopted for all districts in the state for compatibility of results for comparison.
We have heavily relied on statistical data from various development departments. Theirreadiness to share the data is gratefully acknowledged. Sri. Eapen Varughese, Chief Town Planner,Sri. G. Mohanan and Sri. Jacob Easow, Senior Town Planners gave necessary directions and guidancewithout which this work would not have been possible. The officers and staff in the State Project Cellhave been highly helpful in giving various inputs for the study and prompt in vetting the draft report.
Sri. M.O. Stanley, Sri. K. Mohandas and Sri. K.V. Abdul Malik contributed to the work as District TownPlanners during the currency of this project. Sri. Jimmichan Mathew and Smt. Adeline Antony, DeputyTown Planners were key to the successful completion of this study. Their contribution is gratefullyacknowledged. Sri. K.P. Nidhish, Asst. Town Planner and Smt. Reshma V. Shankaran, StatisticalInvestigator, have assisted in the various stages of this work. The efforts put in by Sri. Selvaraj. J,Peon of this office with his expertise in GIS, which was an indispensable skill in this study needsspecial mention. All the staff of the District Town & Country Planning Office need to be speciallyacknowledged for their keen participation in various stages without which this work would not havebeen completed in the present form and time frame.
Kasaragod K.M. Gopakumar09-02-2011 District Town Planner
Kasaragod
admin
Text Box
< CONTENTS >
admin
Text Box
<< BACK
admin
Text Box
< CONTENTS >
admin
Text Box
<< BACK
admin
Text Box
< CONTENTS >
admin
Text Box
NEXT >>
admin
Text Box
< CONTENTS >

CONTENTS
Chapter 1 Profile of the District1.0 Introduction ...................................................................................................................... 11.1 Area and Population.......................................................................................................... 11.2 Administrative Divisions ................................................................................................... 21.3 Physiography .................................................................................................................... 41.4 Physical Features .............................................................................................................. 41.5 Socio-Economic Aspects ........................................................................................................61.6 Status of Infrastructure ..................................................................................................... 71.7 Inference .......................................................................................................................... 8
Chapter 2 History and Regional Linkages2.1 Historical Background ....................................................................................................... 92.2 Regional Linkages ............................................................................................................. 92.3 Inference ........................................................................................................................ 10
Chapter 3 Population3.1 Population Size................................................................................................................ 11
3.1.1 Census Findings – Population and its distribution.............................................................. 11 3.2 Growth of Population ......................................................................................................... 13
3.3 Population Density .......................................................................................................... 133.4 Sex Ratio ......................................................................................................................... 143.5 Population Concentration Pattern ................................................................................... 153.6 Migration Details ............................................................................................................ 153.7 Population Projection (Trend Based) ............................................................................... 153.7.1 Inventory of methods of population projection....................................................................153.7.2 Population projection of Kasaragod District....................................................................... 173.7.3 Projection of Rural-Urban Break up..................................................................................... 183.8 Inference ........................................................................................................................ 18
Chapter 4 Occupational Structure4.1 Work Force of the District ............................................................................................... 194.2 Occupational Structure.................................................................................................... 204.3 Occupational Structure – Variation in Urban and Rural Areas............................................ 214.4 Temporal Variation.............................................................................................................. 224.5 Occupational Structure – Estimation of Nine fold Classification of 2001 ......................... 234.6 Spatial Distribution of the Major Classes of Workers....................................................... 244.7 Activity Pattern Based on Occupational Structure of Workers .......................................... 264.8 Inference ........................................................................................................................ 26
Department of Town & Country Planning, KeralaDepartment of Town & Country Planning, Kerala
CONTENTS District Urbanisation Report - Kasaragod
Department of Town & Country Planning, KeralaDepartment of Town & Country Planning, Kerala
vivi
admin
Text Box
<< BACK

District Urbanisation Report - Kasaragod CONTENTS
Department of Town & Country Planning, KeralaDepartment of Town & Country Planning, Kerala
Chapter 5 Land Use5.1 Land Use Pattern of Kerala State ..................................................................................... 275.2 Land Use break up of the Kasaragod District ................................................................... 285.3 Regional Land Use Study ................................................................................................. 285.4 Concentration Pattern of Land Uses ................................................................................ 31
5.4.1 Forest Land Use................................................................................................................... 33 5.4.2. Agricultural Land Use...........................................................................................................33 5.4.3. Plantation Land use..............................................................................................................34 5.4.4. Water bodies........................................................................................................................34 5.4.5. Residential Land use................................................................................ ............................. 34 5.4.6 Residential/Agriculture Mixed Landuse.............................................................................. 35 5.4.7. Other Built up Land use...................................................................................................... 35
5.5. Analysis of Agricultural Land Use .................................................................................... 365.6 Activity Zones based on concentration index .................................................................. 365.7. Inference..............................................................................................................................38
Chapter 6 Functional Character of Settlements6.1 Character of Settlements ................................................................................................ 396.2 Inference ........................................................................................................................ 40
Chapter 7 Hierarchy of Settlements7.1 Existing Hierarchy of Settlements ................................................................................... 417.2 Suggested Hierarchy of Settlements................................................................................ 427.3 Character of Higher Order Settlements ........................................................................... 487.4 Inference ........................................................................................................................ 48
Chapter 8 Urban Profile8.1 Trend of Urbanization – Kerala ........................................................................................ 498.2 Urban Areas in the District .............................................................................................. 508.3 Urban Population Content (Existing) ............................................................................... 508.4 Growth Rate of Urban Population.................................................................................... 518.5 Urban Settlements from 1971-2001................................................................................. 518.6 Future Urbanization Profile of the District ....................................................................... 528.7 Projection of Urban Population of Kasaragod District ...................................................... 558.8 Urban Pofile......................................................................................................................... 568.9 Inference ........................................................................................................................ 57
Chapter 9 Activity Pattern9.1 Activity Pattern ............................................................................................................... 589.2 Description of Land use concentration pattern ................................................................ 589.3 Description of future Urban profile ................................................................................. 589.4 Description of functional clssification ............................................................................. 59
9.4.1 Tertiary Activity.................................................................................................................... 629.4.2 Primary Activity.................................................................................................................... 629.5 Inference ........................................................................................................................ 62
Chapter 10 Nodes10.1 Nodes ............................................................................................................................. 6310.2 Concept .......................................................................................................................... 6310.3 Inference ........................................................................................................................ 64
Department of Town & Country Planning, KeralaDepartment of Town & Country Planning, Kerala
viivii

Chapter 11 Connectivity11.1 Introduction .................................................................................................................... 6511.2 Rail network .................................................................................................................... 6511.3 Road Transport and communication network................................................................... 6511.4 Concept .......................................................................................................................... 6611.5 Proposed network ........................................................................................................... 6711.6 Inference............................................................................................................................. 67
Chapter 12 Spatial Structure12.1 Spatial Structure, ............................................................................................................. 6812.2 Activity pattern ............................................................................................................... 6812.3 Hierachy of settlements .................................................................................................. 6912.4 Proposed road network ................................................................................................... 6912.5 Formulation of spatial structre............................................................................................ 7012.5 Inference ........................................................................................................................ 70
Chapter 13 Summary of Findings
CONTENTS District Urbanisation Report - Kasaragod
Department of Town & Country Planning, KeralaDepartment of Town & Country Planning, Kerala
viiiviii

Chapter 1 Profile of the DistrictTable. 1.1 Taluk and Taluk Headquarters ........................................................................................... 2Table.1.2 Block Panchayats, Muncipalities their Headquarters......................................................... 2Table.1.3 Grama Panchayts in Kasaragod District............................................................................. 3Table.1.4 Average rain full during 2004 ............................................................................................ 4Table.1.5 Rivers in Kasaragod district: Origin and length ................................................................. 5
Table.1.6 Literacy.................................................................................................................................. 6Table.1.7 Length of PWD roads (in km) based on type of the road for the period 1990-2000............ 7
Table.1.8 Educational facilities in Kasaragod, 2009............................................................................ 7 Table. 1.9 Health care institutions, Kasaragod – 2009.......................................................................... 8 Table.1.10 Electrical Sub stations, Kasaragod........................................................................................ 8
Chapter 2 History and Regional LinkagesTable.2.1 Distances to different towns from Kasaragod ................................................................. 10
Chapter 3 Population Table.3.1 Decadal variations in the Urban Population of Kasaragod District from 1971 to 2001 ..... 13 Table.3.2 Growth of Population 1991 to 2001 ................................................................................. 13 Table.3.3 Sex ratio in Kerala state and Kasaragod District .............................................................. 15 Table.3.4 Sex ratio 1991-2001 ........................................................................................................ 15 Table.3.5 Suitability of population projection methods ................................................................... 17 Table.3.6 Projected District Population – Decreasing rate method ................................................. 17 Table.3.7 Projected District Population – Apportionment method ................................................... 18 Table.3.8 Final Projected Population figures of the District ............................................................ 18 Table.3.9 Projected Urban - Rural Population of Kasaragod. .......................................................... 18
Chapter 4 Occupational StructureTable.4.1 Decadal variation of workers content-1981-2001 ............................................................ 20Table.4.2 Workers Classifications- District and Taluk ..................................................................... 20Table.4.3 Workers Classification – Urban and Rural area - 2001..................................................... 21Table.4.4 Activity pattern based on occupational structure of workers ........................................... 21Table.4.5 Occupational Structure 1981-2001 .................................................................................. 22Table.4.6 Numbers of various categories of workers in urban area. ................................................ 22Table.4.7 Number of various categories of workers in rural area .................................................... 22Table.4.8 Estimation of Nine fold classification of workers - 2001 .................................................. 23Table.4.9 Distribution of Workers by Sex in Four Categories of Economic Activity in Taluks, 2001....24Table.4.10 Distribution of workers by sex in four categories of economic activity of urban
agglomerations/towns, 2001. ......................................................................................... 25
LIST OF TABLES
District Urbanisation Report - Kasaragod LIST OF TABLES
Department of Town & Country Planning, KeralaDepartment of Town & Country Planning, Kerala
ixix

Chapter 5 Land UseTable.5.1 Land use break-up – Kerala State .................................................................................... 27Table.5.2 Kasaragod District Land Use pattern by category (Area in hectors) ................................. 28Table.5.3 Comparison of Land use break up of Kasaragod District and Kerala state ....................... 28Table.5.4 Land use break up comparison with neighbouring Districts............................................... 28
Table.5.5 Concentration index of various land uses........................................................................... 32 Table.5.6 showing Activity Zones of Kasaragod District.................................................................... 38
Chapter 6 Functional Character of SettlementsTable.6.1 Functional character of settlements ............................................................................... 39
Chapter 7 Hierarchy of SettlementsTable.7.1 CFI Calculation ................................................................................................................ 41Table.7.2 Second order settlements, their service area & service population ................................. 45Table.7.3 Service Area of Third Order Settlements & Service Population ........................................ 47
Chapter 8 Urban ProfileTable.8.1 Showing Population of Kerala in 2001 ............................................................................. 49Table.8.2 Showing Trends of population growth of Kerala 1981-2001 ............................................. 49Table.8.3 showing Trends in urbanization of Kerala –1981-2001 .................................................... 49Table.8.4 District wise percentage of urban population.................................................................. 50Table.8.5 Growth rate of urban population – Comparison with state .............................................. 51Table.8.6 Number of urban areas ................................................................................................... 52Table.8.7 List of Local Bodies ......................................................................................................... 53Table.8.8 Projected Urban profile of the District ............................................................................. 55Table.8.9 Population projection of Existing urban area - Kasaragod District ................................... 55Table.8.10 Projected Population of proposed urban area.................................................................. 56
Table.8.11 Projected Urban - Population of Kasaragod. ...............................................................56 Table.8.12 Character and hierarchy of urban local bodies ................................................................ 57 Table.8.13 Administrative status of urban local bodies....................................................................... 57 Table.8.14 Changing urban profile of the District................................................................................ 57
Chapter 9 Activity PatternTable.9.1 Determination of Activity pattern .................................................................................... 60Table.9.2 Activity pattern – Kasaragod district ............................................................................... 61
Chapter 10 NodesTable.10.1 Hierarchy of nodes with node Values. ............................................................................ 63
Chapter 11 ConnectivityTable.11.1 Distribution of roads in Kasaragod district, length in km ................................................. 65
Chapter 12 Spatial StructureChapter 13 Summary of Findings
LIST OF TABLES District Urbanisation Report - Kasaragod
Department of Town & Country Planning, KeralaDepartment of Town & Country Planning, Kerala
xx

LIST OF FIGURES
Chapter 1 Profile of the District Fig. 1.1 Kerala Map showing Kasaragod distirct............................................................................... 1
Fig. 1.2 Taluks and their headquarters ........................................................................................... 2Fig. 1.3 Blocks Panchayats , Municipalities and their Head Quarters............................................. 2Fig. 1.4 District Map showing all Panchayats in 1991 ................................................................... 3Fig. 1.5 District Map showing all Panchayats in 2001 ................................................................... 3Fig. 1.6 Physiography of the District.................................................................................................. 4Fig. 1.7 Physical setting of Kasaragod district ............................................................................... 4Fig. 1.8 Forest in Kasaragod District. ............................................................................................. 5Fig. 1.9 Rivers in Kasaragod District .............................................................................................. 5
Chapter 2 History and Regional LinkagesFig. 2.1 Regional Setting of Kasaragod .......................................................................................... 9Fig. 2.2 District Map showing all Panchayats 2001 ...................................................................... 10Fig. 2.3 Road, Railway Network and important junctions................................................................ 10
Chapter 3 PopulationFig. 3.1 District map showing Municipal census town and urban agglomeration ......................... 13Fig. 3.2 Distribution of PPN growth rate 1991..................................................................................13Fig. 3.3 Distribution of PPN growth rate 2001..................................................................................13
Fig. 3.4 Population Density 2001..................................................................................................... 14Fig. 3.5 Population Density Map of Kasaragod District ................................................................ 14Fig. 3.6 The population concentration pattern of the district ......................................................... 15
Chapter 4 Occupational StructureFig. 4.1 Main workers, 2001........................................................................................................ 19Fig. 4.2 Work force participation rate, 2001 ................................................................................. 19Fig. 4.3 Number of total workers and main workers 1981-2001...................................................... 19Fig. 4.4 Classification of the Total workers .................................................................................. 20
Fig. 4.5 Occupational Structure (Kasaragod Taluk).......................................................................... 20 Fig. 4.6 Occupational Structure (Hosdurg Taluk)..............................................................................20
Fig. 4.7 Classification of the Main workers in - urban area and rural area .................................. 21Fig.4.8 Temporal variation of category of workers ...................................................................... 22Fig.4.9 Variation in the number of diddferent category of workers in Urban area. ....................... 22Fig.4.10 Variation in the number of different category of workers in rural area............................. 22
Fig.4.11 Distribution of Workers of Kasaragod District.................................................................... 26
Chapter 5 Land UseFig.5.1 Land use break-up – Kerala State .................................................................................... 27Fig.5.2 Land use Kasaragod District............................................................................................... 29Fig.5.3 Forest Land use comparison with surrounding districts .................................................. 30
Department of Town & Country Planning, KeralaDepartment of Town & Country Planning, Kerala
District Urbanisation Report - Kasaragod LIST OF FIGURES
Department of Town & Country Planning, KeralaDepartment of Town & Country Planning, Kerala
xixi

Fig.5.4 Comparison of the percentage share of Forest Land use of the state in surroundingdistricts ........................................................................................................................... 30
Fig.5.5 Residential Land use comparison with surrounding districts .......................................... 30 Fig.5.6 Comparison of Percentage share of Residential land use in Kasaragod & Surrounding
Districts................................................................................................................................30
Fig.5.7 Agriculture Land use comparison with surrounding districts ........................................... 30Fig.5.8. Comparison of Percentage share of Residential land use in Kasaragod & Surrounding
Districts.................................................................................................................................30Fig.5.9 Plantation Land use comparison with surrounding districts ............................................. 31Fig.5.10 Comparison of Percentage share of Plantation land use in Kasaragod & Surrounding
Districts............................................................................................................................... 31Fig.5.11 Res/Agri Mix Land use comparison with surrounding districts ......................................... 31Fig.5.12 Comparison of Percentage share of Res/Agri Mix land use in Kasaragod & Surrounding
Districts .......................................................................................................................... 31Fig.5.13 Concentration of forest land use in Kasaragod District based on CI ................................ 33Fig.5.14 Concentration of agriculture land use in Kasaragod District based on CI........................ 33Fig.5.15 Concentration Index of Plantation land use Kasaragod District based on CI.................... 34Fig.5.16 Concentration Index of Residential land use...................................................................... 35Fig.5.17 Concentration pattern of Resi/Agri Mixedland use........................................................... 35Fig.5.18 Concentration pattern of Other built up land use............................................................. 36Fig.5.19 Break up of agricultural land use Kasaragod Dist.............................................................. 36Fig.5.20 Agricutural and other built up land uses............................................................................. 37Fig.5.21 Agricutural other built up, Forest and Plantation land uses............................................... 37Fig.5.22 Residential and Residential/ Agriculture mix land uses.....................................................37Fig.5.23 Activity Zones of Kasaragod District...................................................................................38
Chapter 6 Functional Character of SettlementsFig.6.1 Functional Character of settlements ............................................................................... 40
Chapter 7 Hierarchy of SettlementsFig.7.1 CFI Vs Frequency graph ................................................................................................... 41Fig.7.2 The spatial distribution of the settlements. .................................................................... 42Fig.7.3 Spatial Distribution of settlements of different hierarchies ............................................. 42Fig.7.4 Existing 1st & IInd Order Settlements ................................................................................ 43Fig.7.5 Projected IInd order settlements ....................................................................................... 44Fig.7.6 Service area of IInd order Settlements .............................................................................. 45Fig.7.7 Service area of the IIIrd order settlements (Adjusted)....................................................... 46Fig.7.8 Service area of the 3rd order including proposed (Adjusted) ........................................... 46Fig.7.9 Proposed Hierarchies of Settlements .............................................................................. 48
Chapter 8 Urban ProfileFig.8.1 showing Trends in urbanization of Kerala –1981-2001 .................................................... 49Fig.8.2 Total urban population during various decades ............................................................... 50Fig.8.3 District map showing Municipal census town and Urban agglomeration ......................... 50Fig.8.4 Decadal variation of urban population, Kasaragod .......................................................... 51
LIST OF FIGURES District Urbanisation Report - Kasaragod
Department of Town & Country Planning, KeralaDepartment of Town & Country Planning, Kerala
xiixii

Fig.8.5 Map showing Population Growth Rate- Comparison with District .................................. 52Fig.8.6 Map showing Grade of local bodies................................................................................... 53Fig.8.7 Urban centres based on all the four criteria including hierarchy of settlements............... 54Fig.8.8 Ratio of Total Urban to District population ...................................................................... 55Fig.8.9 Projected total population in the existing urban area ...................................................... 55Fig.8.10 Ratio of total population of the proposed urban area and district population .................. 56Fig.8.11 Projected populations in the proposed urban area .......................................................... 56Fig.8.12 Total urban population .................................................................................................... 56Fig.8.13 Future Urban Profile ........................................................................................................ 56
Chapter 9 Activity PatternFig.9.1 Land use concentration – Kasaragod district ................................................................... 58Fig.9.2 Future Urban profile – Kasaragod district ........................................................................ 59Fig.9.3 Functional classification – Kasaragod district.................................................................... 59Fig.9.4 Activity Pattern- Kasaragod District.....................................................................................62
Chapter 10 NodesFig.10.1 Existing Road, Railway Network and important Junctions .............................................. 64Fig.10.2 Weightage of junction .................................................................................................... 64
Chapter 11 ConnectivityFig.11.1 Showing Existing Road Network in Kasaragod ................................................................. 66Fig.11.2 Existing Road, Railway and Important Junctions.............................................................. 66Fig.11.3 Proposed Hierarchy of settlements ................................................................................. 66Fig.11.4 Schematic concept map of Kasaragod District.................................................................. 67Fig.11.5 Proposed Road network .................................................................................................. 67
Chapter 12 Spatial StructureFig.12.1 Formulation of Spatial Structure, .................................................................................... 68Fig.12.2 Activity pattern –Kasaragod District ................................................................................ 68Fig.12.3 Proposed Hierarchy of settlements –Kasaragod District ................................................. 69Fig.12.4 Proposed Road network .................................................................................................. 70Fig.12.5 Spatial Structure of Kasaragod district ............................................................................... 70
Chapter 13 Summary of Findings
District Urbanisation Report - Kasaragod LIST OF FIGURES
Department of Town & Country Planning, KeralaDepartment of Town & Country Planning, Kerala
xiiixiii

LIST OF ANNEXES
Annexe- 1 - LSGs Block Panchayats Wise............................................................................................. 73Annexe - 2A - Weightage of Facilities...................................................................................................... 74
Annexe - 2B -CFI of settlements............................................................................................................... 75Annexe - 3 - Heirarchy of settlements...................................................................................................... 76Annexe - 4 - Concentration index of various land uses............................................................................ 77Annexe - 5 - Population Projection.............................................................................................................78Annexe- 6A
Population projection of urban area (Existing)........................................................................80Annexe 6B
Projected population of the urban areas (proposed)...............................................................80Annexe -7 -Concept Centrality & Connectivity.......................................................................................... 81
LIST OF ANNEXES District Urbanisation Report - Kasaragod
Department of Town & Country Planning, KeralaDepartment of Town & Country Planning, Kerala
xivxiv
admin
Text Box
<< BACK
admin
Text Box
CHAPTER 1 >>

Department of Town & Country Planning, KeralaDepartment of Town & Country Planning, Kerala
District Urbanisation Report - Kasaragod PROFILE OF THE DISTRICT 11
Chapter - IPROFILE OF THE DISTRICT
“Meeting point of multiple cultures and languages,drawing vital energy from the port city of Mangaloreand the high ranges of Kodagu, Kasaragod has a uniqueposition as spatial ground of cultural amalgamation.”
1.0 INTRODUCTION
The level of urbanization is not only an indicator ofeconomic development but considered a stimulatorof growth. The settlement pattern in the state has notbeen in line with that of other states in the countrydue to various physical, cultural and socio-economicreasons. For example, the number of urbansettlements decreased from 197 in 1991 to 159 in 2001in the state contrary to the national experience ofincrease in urban settlements. However, the urbanagglomerations increased from 9 in 1981 to 17 in 2001.The population growth rate in urban local bodiesmostly had been on the decline in the state, butshowing an increased growth in peri urban areas. Allthese indicate a dispersed urban growth with blurredboundaries between urban and rural settlementsreinforcing the popularly held concept of rurbancontinuum. The urbanization pattern of the state needsa thorough examination which necessitates the studyof urbanization of each district.
The district of Kasaragod has a slightly differentstory to tell in this regard. The district shows a highergrowth rate of urbanization when compared to stateaverage which may be due to a lower level ofurbanization to start with compared to other regionsin the state. The urban population also shows aninclining trend in the district. Along with this, the
Fig 1.1 Kerala Map showing Kasaragod distirct
growth rate in pre urban areas is also on the rise. Allthese factors necessitate a detailed study ofurbanization pattern and extent in the district.1.1 AREA AND POPULATION
The Kasaragod district has a total area of 1992Sq.km. It accounts for 5.13 percentage of the total areaof the state with a total population of 12, 04,078persons, (as per 2001 census), that is approximatelyover 4.7% of total population of state. Populationdensity of Kasaragod district is 604 per/sq.km, which isbelow state average. Kasaragod is ranked 12th in thestate as per 2001 census.
admin
Text Box
< CONTENTS >

PROFILE OF THE DISTRICT District Urbanisation Report - Kasaragod22
Department of Town & Country Planning, KeralaDepartment of Town & Country Planning, Kerala
Name of Taluk Taluk Head Quarters
Kasaragod Kasaragod
Hosdurg Kanhangad
Table 1.1 Taluk and Taluk Head quarters.
1.2 ADMINISTRATIVE DIVISIONSThe district is divided into 75 Villages in two Taluks,
Kasaragod and Kanhangad. The Collectorate functions atthe Civil Station at Vidyanagar in Chengala Panchayat, 5kmaway from the Kasaragod town. Kasaragod is the onlyrevenue division in the district and has its head quarters atKanhangad. During 1991-2001, two more Grama Panchayatswere formed in the District, bifurcating Bedadaka intoBedadeka and Kuttikole , and Panathady into Panathadyand Kallar Grama Panchayats, thus increasing the totalnumber of Grama Panchayats to 39. These two newlyformed Grama Panchyats came into being with effect fromthe 1st October 2000 vide G.O. (Ms) No. 266/99 LSGD dated29-12-1999. Further, Nileswaram was made to be aMunicipality in 2010, reducing the number of panchayatsto 38. The District has 6 block panchayats, and threeMunicipalities. The name of the Blocks, Block headquarters and Block wise distribution of population isshown in the Table 1.2 and Fig 1.3.
Source: Census Report, 2001
Table 1.2 Block panchayats, Municipalities and their Head Quarters
Name of Block Panchayat/
Head Quarters
Name of Panchayat where
Municipality Block Head Quarters is
situated
1 Kasaragod Kasaragod Kasaragod Municipality
2 Manjeswaram Manjeswaram Manjeswaram
3 Kanhangad Kanhangad Kanhangad Municipality
4 Nileswaram Nileswaram Nileswaram Municipality
5 Karadka Mulleria Karadka
6 Parappa Parappa Kinanoor-Karindalam
7 Kasaragod Municipality Kasaragod Kasaragod Municipality
8 Kanhangad Municipality Kanhangad Kanhangad Municipality
9 Nileswaram MunicipalityNileswaram Nileswaram Municipality
Sl.No.
Fig 1.2 Taluks and their headquarters
DAKSHINA KANNADA DISTRICTKarnataka State
KODAGU DISTRICTKarnataka State
KANNUR DISTRICT
KODAGU DISTRICTKarnataka State
DAKSHINA KANNADA DISTRICTKarnataka State
KANNUR DISTRICT
Fig 1.3 Blocks Panchayats ,Municipalities and their Head Quarters

Department of Town & Country Planning, KeralaDepartment of Town & Country Planning, Kerala
District Urbanisation Report - Kasaragod PROFILE OF THE DISTRICT 33
Table 1.3 Grama Panchayats in Kasaragod District.
Sl.No. LSGs Grade
1 Chengala Special2 Chemnad First3 Badiadka Special4 Madhur Special5 Mogral – Puthur Special6 Kumbla Special
1 Mangalpady Special2 Vorkady First3 Puthige First4 Meenja First5 Manjeshwaram Special6 Paivalike First7 Enmakaje First
Kanhangad
1 Udma Special2 Ajanur Special3 Madikai First4 Pallikkara Special5 Pullur - Periya First
1 Cheruvathur Special2 Kayyur – Cheemeni First3 Pilicode First4 Trikaripur First5 Padne First6 Valiyaparamba First
1 Bedadka Special2 Bellur First3 Delampady First4 Karadka First5 Kumbadaje First6 Kuttikol First7 Muliyar First
1 Balal First2 East Eleri First3 Kinanoor-Karindalam First4 Kallar First5 Kodom belur First6 Panathady First7 West Eleri First
Karadka Block Panchayat
Parappa Block Panchayat
Kasaragod Block Panchayat
Manjeswaram Block Panchayat
Kanhangad Block Panchayat
Nileshwaram Block Panchayat
The 6 Block panchayats are divided into 38 GramaPanchayats as follows:
Fig 1.4 District Map showing all Panchayats in 1991
DAKSHINA KANNADA DISTRICTKarnataka State
KODAGUDISTRICT
Karnataka State
KANNUR DISTRICT
Fig 1.5 District Map showing all Panchayats in 2001
DAKSHINA KANNADA DISTRICTKarnataka State
KODAGU DISTRICTKarnataka State
KANNUR DISTRICT
PROFILE OF THE DISTRICT District Urbanisation Report - Kasaragod44
Department of Town & Country Planning, KeralaDepartment of Town & Country Planning, Kerala
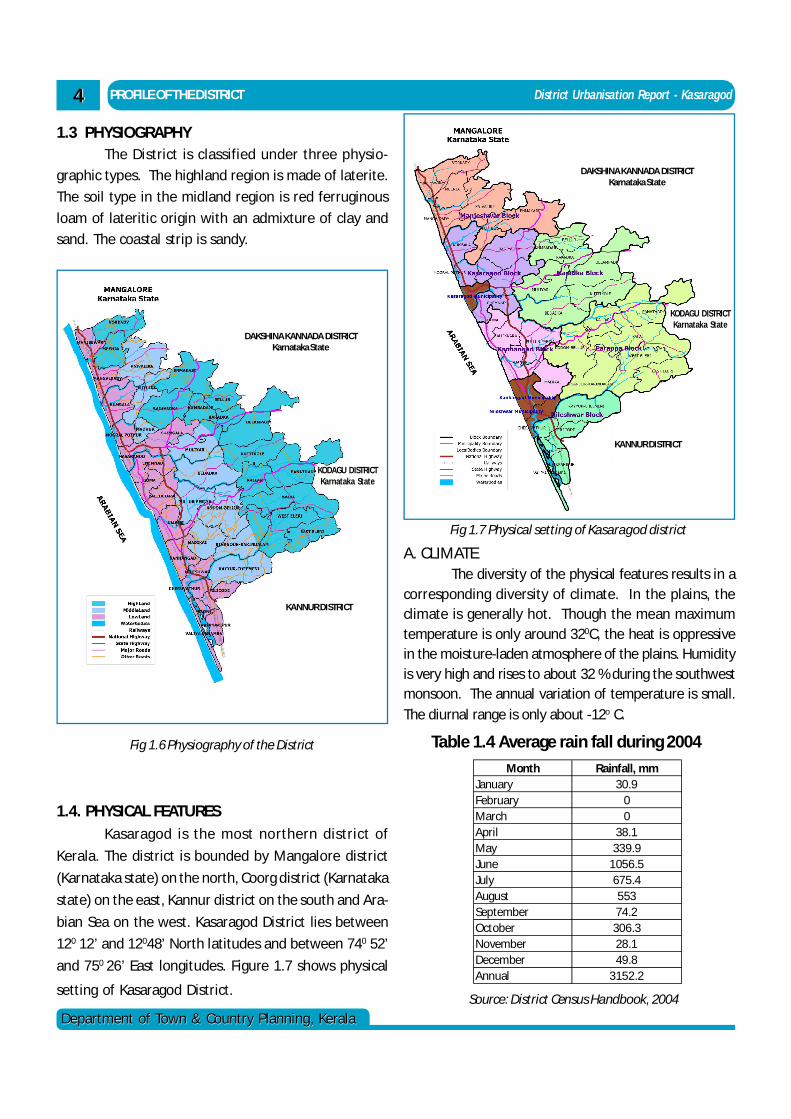
1.4. PHYSICAL FEATURESKasaragod is the most northern district of
Kerala. The district is bounded by Mangalore district(Karnataka state) on the north, Coorg district (Karnatakastate) on the east, Kannur district on the south and Ara-bian Sea on the west. Kasaragod District lies between120 12’ and 12048’ North latitudes and between 740 52’and 750 26’ East longitudes. Figure 1.7 shows physical
setting of Kasaragod District.
A. CLIMATEThe diversity of the physical features results in a
corresponding diversity of climate. In the plains, theclimate is generally hot. Though the mean maximumtemperature is only around 320C, the heat is oppressivein the moisture-laden atmosphere of the plains. Humidityis very high and rises to about 32 % during the southwestmonsoon. The annual variation of temperature is small.The diurnal range is only about -12o C.
Table 1.4 Average rain fall during 2004Month Rainfall, mm
January 30.9February 0March 0April 38.1May 339.9June 1056.5July 675.4August 553September 74.2October 306.3November 28.1December 49.8Annual 3152.2
Source: District Census Handbook, 2004
1.3 PHYSIOGRAPHYThe District is classified under three physio-
graphic types. The highland region is made of laterite.The soil type in the midland region is red ferruginousloam of lateritic origin with an admixture of clay andsand. The coastal strip is sandy.
Fig 1.6 Physiography of the District
DAKSHINA KANNADA DISTRICTKarnataka State
KODAGU DISTRICTKarnataka State
KANNUR DISTRICT
Fig 1.7 Physical setting of Kasaragod district
DAKSHINA KANNADA DISTRICTKarnataka State
KODAGU DISTRICTKarnataka State
KANNUR DISTRICT

District Urbanisation Report - Thiruvananthapuram REGIONAL ASPECTS
Department of Town & Country Planning, KeralaDepartment of Town & Country Planning, Kerala
55The South-West monsoon starts towards the
end of May or the beginning of June-heralded bythunder-storms and holds till September when therains fade out. October brings in the North-Eastmonsoon. Dry weather sets in the end of December.December and January are the coolest months of theyear. February, March, and April are generally very hot.Table 1.4 shows the average rainfall during the year2004.
B. FORESTKasaragod district has a forest area of 117.54.sq.kms,falling under the Kannur Forest Division. Reserve foreststretches to 86.02 sq.kms, and vested forest to 31.52sq.kms, in two ranges-Kasaragod and Kanhangad.
Table 1.5 Rivers in Kasaragod district:Origin and length
Source: District Census Handbook 2004
Total Navigable
1 Manjeshwar Kadandur hills 16 32 Uppala Kudipadi hills 50 -
3 Shiriya Kanakad hills 61 54 Kumbala Yedanad 11 35 Mogral Kanlur village 34 -6 Chandragiri Patti forests 105 137 Kalnad Chetianchal 8 -8 Bekal Kaniyadka 25 -9 Chitari Kundiya 25 -
10 Nileshwar Kinanur 47 1111 Kariangode Padinalkad 64 2412 Kavvayi Cheemeni 23 10
Length in kmSl.no. Name of river Place of origin
C. RIVERS
There are 12 rivers in this District. All the rivers areflowing westwards.The District is blessed withbeautiful backwaters Kumbala, Kalanad, Bekal, Chittariand Kavvai. Kavvai is the longest kayal in Malabar. Ithas been identified as a wetland of national importancewith an area of 21.92sq.km. It connects 8 panchayatsand one Municipality. Fig 1.9 and Table 1.5 shows riversin Kasaragod District.
D. MOUNTAINSThe chief hill ranges in this district are
Kottamcheri hill and Ranipuram. Kottamcheri hill is abeautiful picnic centre, which is also ideal for trekking.“Talakkaveri” in the Brahmagiri Mountains of Coorg isquite near Kottamcheri hills.The former Madathumala is known as Ranipuram. Lying780 m above sea level, it is only 9 km from Panathurwhich is 48km east of Kanhangad. The extensive forestof Madathumala merges with the forest of Karnataka.The natural beauty is comparable to that of hill stationslike Ooty.
The forest produces are shegai bark, sheakoy,cardamom, canes, fibers, etc. Sambar, the fastest deer,is seen in some areas.
KODAGU DISTRICTKarnataka State
Figure 1.8 Forest in Kasaragod District.
DAKSHINA KANNADA DISTRICTKarnataka State
KANNUR DISTRICT

PROFILE OF THE DISTRICT District Urbanisation Report - Kasaragod66
Department of Town & Country Planning, KeralaDepartment of Town & Country Planning, Kerala
E. NATURAL SUB DIVISIONSThe District can be classified into five depending onterrain as follows:-1.Lowland within 20m of MSL consisting of paddy fields.2.Mid land within an elevation of 20m to 200m MSL.3.Moderately elevated highlands within MSL 100m to 300 m4.Highland with 50% slope and lying between MSL 300mto 600m.5.Hill areas at elevation of 800m and above from MSL.
Three soil types are available in the district. Thehighland region has laterite. Red ferruginous loam oflateritic origin with admixture of clay and sand is seenin the midland. The coastal strip is sandy.1.5. SOCIO-ECONOMIC ASPECTSA.LITERACY RATEAs per 2001 census, Kerala is the most literate state in Indiahaving literacy rate of 90.92%. The Saksharatha programmeof the government was well received and due to the zealouscampaign conducted by the Government as well asvoluntary organizations, and the level of literacy has amarked improvement. As per the statistics, Kasaragod ispositioned 11th among the 14th Districts in the stateregarding literacy rate. Achievements of Kasaragod on theliteracy front might not seem impressive at the first glance.But the innovative programme drafted and implementedin the district by the District Literacy Mission and itsachievement compared to the base line has won the SatyanMaitre Award 2006 of the National Literacy Mission, forimplementing literacy and continuous literacy programmesin the best manner. As per available statistics, the districthas 896,367 literates, of which 464,844 are male and 431521are female. B. WORK FORCE PARTICIPATION RATIO
The work participation ratio (WPR) in Kerala hasincreased from 34.75 to 35.93 during 1991 to 2001.Kasaragod District recorded 34.75 of WPR during 2001,which is below the state average.C. POTENTIAL OF THE DISTRICT
The potential of a district depends primarilyon the resource endowment and connectivity.
Persons Percentage Male Percentage Female Percentage
T 896367 74.49 464844 79.08 431523 70.1R 713595 73.59 371861 78.3 341734 69.08U 182772 78.19 92983 82.39 89789 74.28T 447722 72.66 236585 77.58 211137 67.84R 372883 71.71 198284 76.91 174599 66.61U 74839 77.77 38301 81.21 36538 74.46T 448645 76.41 228259 80.72 220386 72.41R 340712 75.77 173577 79.96 167135 71.87U 107933 78.49 54682 83.23 53251 74.16
Kasaragod District
Kasaragod Taluk
Hosdurg Taluk
Table 1.6 Literacy
T-Total, R-Rural,U. Urban.
Source: Census handbook –2001.
Fig 1.9 Rivers in Kasaragod District
DAKSHINA KANNADA DISTRICTKarnataka State
KODAGU DISTRICTKarnataka State
KANNUR DISTRICT

Department of Town & Country Planning, KeralaDepartment of Town & Country Planning, Kerala
District Urbanisation Report - Kasaragod PROFILE OF THE DISTRICT 77
YearState
HighwayMajor District
RoadsOther District
RoadsVillage Roads.
1990-91 28 85 545 2531991-92 28 85 379 4541992-93 28.97 84.59 376.69 466.561993-94 28.97 84.56 376.42 482.821994-95 28.97 84.56 376.42 544.071995-96 28.97 84560 376.42 726.271996-97 142.78 1.25 324.076 557.7731997-98 249.84 1.25 283.281 527.1631998-99 227-485 273.857 134.13 251.843
1999-2000 227.49 273.857 254.815 161.357
Table 1.7 Length of PWD roads (in km) based on type of the road for the period 1990-2000.
Sl.No. Institutions Govt: Aided Unaided Total1 Lower Primary School 158 80 5 2432 Upper primary school 92 56 1 1493 High School 51 25 8 844 Vocational Higher
Secondary School 16 6 - 225 Higher Secondary School 51 13 17 816 Colleges 2 3 10 157 Engineering Colleges 2 28 Teachers Training 1 3 49 Teacher Education Centre 1 - 4 5
10 Special School for blind 1 - - 111 Special School for deaf 1 112 Poly Technic 2 1 313 I.T.I/ITC 1 0 7 814 Food Crafts Institute 1 115 Agricultural College 1 116 Agricultural Research
Institute 1 117 Central Plantation
Research Institute 1 118 Arabic College 1 119 Sanskrit College 1 1
20Junior nursing health training school 1 1
21 Kendriya Vidyalaya 2 222 Navodaya Vidyalaya 1 123 CBSE Schools 20 20
Table 1.8 Educational facilities in Kasaragod, 2009
The District is blessed with many resources likeagricultural produces, minerals, horticultural produces,Cattle & Livestock, forest produces etc. The majoragricultural products include rice,coconut,banana,groundnut, cotton etc, and offer amajor share of employment. There are opportunitiesfor development of tourism with tourist spots like BakelFort, Kottamcherry, Ranipuram etc.
D.PER CAPITA INCOME (PCI)The per capita income of Kasaragod District is
Rs.27584- and the per capita income of Kerala state isRs.31642/- as in 2001 Census.
E.SHARE OF WORKERS:The work force participation Ratio (WPR) in
Kerala has increased from 34.75% to 35.93% from 1991to 2001. In the District 78.4 percent of workers are Mainworkers and 21.6 percent are Marginal workers in 2001census. The District has the highest percentage ofworkers in house hold industry (12.1. percent) in 2001census.1.6 STATUS OF INFRASTRUCTUREA. ROAD LENGTH
Statistics reveals that with a total road lengthof 21937.76 km, Kerala state accounts for 3.78% of thatof the nation. Out of which, the share of Kasaragod isonly 5.39%.B. EDUCATIONAL FACILITIES:The district has 606 schools constituting 4.94 % of 12274schools in the state. In the case of higher educationfacilities Kasaragod District has 17 Colleges.
C. HEALTH INSTITUTIONSThere are 2748 health institution in Kerala under public
sector, out of which 153 are in Kasaragod. Table 1.9
shows the details of modern medical facilities in
Kasaragod District.
Source: Executive Engineer PWD, Kasaragod-2009

PROFILE OF THE DISTRICT District Urbanisation Report - Kasaragod88
Department of Town & Country Planning, KeralaDepartment of Town & Country Planning, Kerala
Table 1.10 Electrical Sub stations, KasaragodD. WATER SUPPLY AND IRRIGATIONThe water supply schemes in the District are
directly operated by Kerala Water Authority. There are12 major rivers flowing through the District. Theserivers are the major sources for the water supplyschemes. Due to salt-water intrusion some of the riversare not dependable during summer.Kerala Water Authority has completed 99 rural watersupply schemes with a total capacity of 31.816 Mld tocover almost all the Panchayaths of the District. Theseschemes provide 11897 domestic connections and 2925street taps connections. There are 496 energized Talukwells with a connection of 1279 public taps maintainedby KWA. In addition 1155 bore wells were constructedby KWA. In irrigation sector, an area of 7429 hectors ofland is irrigated.Compared to the state averages, Kasaragod is abackward District in terms of educational facilities.E. ELECTRICITY
The Kerala State Electricity board undertakesdistribution of electric power in the District. Becauseof the non-availability of adequate power supply, thedistrict is dependent to a major extent on the supplyfrom the neighboring Karnataka state. The district hasonly one power generation project which is a dieselplant situated at Mylatti under Kasaragod PowerCorporation Ltd., with a capacity of 20MW. It has two220KV Sub Stations one each at Kanhangad andKasaragod. The following table shows Electrical Sub
Stations with their capacity.
1.7. INFERENCEKasaragod, the northern most district, acts as a
confluence of Kannada, Tulu and Keralite cultures. Thedistrict is less urbanized and less populated comparedto most other districts in the state. The physiographyand climate of the district is typical to Kerala withhighland, midland and coastal strip. Forest cover is lessthan state average. The district is rich in its waterresources with twelve rivers running through thedistrict. The social backwardness of the district isevident from lower literacy, WPR and per capita incomecompared to the state averages. The infrastructure isalso not up to the mark with lower road density, severeshortage of higher education facilities and higher orderhealth care facilities. Even with the abundance of waterresources, areas of scarcity do exist.
Table 1.9 Health care institutions, Kasaragod – 2009
Sl.No Name of Sub station Capacity1 Kasaragod 110KV2 Kubanoor 110KV3 Manjeshwarar 110KV4 Mylatti 220KV5 Mulleria 110KV6 Kanhangad 110KV7 Cheruvathur 110KV8 Cherupuzha 110KV9 Trikaripur 33KV
Source: KSEB, Kasaragod
TB centre
LC /NFCP Unit
Govt. Pvt Govt Pvt Govt Pvt Govt. Pvt Govt. Pvt Govt. Govt.
3 60 - 22 45 - 11 - 249 - 1 5
Family Welfare centre
Hospitals DispensariesPrimary health
centersCommunity
Health centre
admin
Text Box
< CONTENTS >
admin
Text Box
CHAPTER 2 >>

Department of Town & Country Planning, KeralaDepartment of Town & Country Planning, Kerala
District Urbanisation Report - Kasaragod HISTORY AND REGIONAL LINKAGES 99
Chapter - 2HISTORY AND REGIONAL LINKAGES
2.1 HISTORICAL BACKGROUNDThe name Kasaragod is said to be derived from
the word ‘kusirakood’ (kanjirakootam) meaningNuxvomica forests. Lying on the North Western coastof the state, Kasaragod has attracted many famoustravellers from time immemorial. The Arab traderswho visited the place, being an important tradecentre, between 9th and 14th centuries called the placeHarkwillia. Barbose, the Portuguese traveller whovisited Kumbala, near Kasaragod in 1514 has reportedexport of rice to Male Island and import of coir fromthere. Dr. Francis Buccanan, the family doctor of LordWellesly, visited Kasaragod in 1800. In the traveloguehe mentions about political and communal featuresof places like Athiparamba, Kavvai, Nileswaram, Bekal,Chandragiri and Manjeswaram. Earlier this region wasunder the Nayaks, the vassals of Vijayanagar empireand it was in their times the forts of Bekal andChandragiri were constructed. Hyder Ali of Mysoreconquered Bednoor in 1763. Failure to capture
the floor of Madras Governor’s Council demanding themerger of Kasaragod taluk with the Malabar district, ithad to be withdrawn due to stiff resistance of themembers from Karnataka. In 1927, a politicalconvention held at Kozhikode, passed a resolutionstressing the above demand. Thanks to the effortsmade by many eminent persons like K.P.Kesava Menon,Kasaragod became part of Kerala following thereorganization of state on linguistic basis and formationof Kerala on the first November 1956. Kasaragod is oneof the two new districts formed in Kerala State duringthe inter-census period 1981-1991. It is the mostnorthern district of the State and was formed on the24th May,1984 combining Kasaragod and Hosdurg taluksfrom the Kannur District as per G.O.(MS)No.520/84/RDdated, 19-5-1984. The main intention of the formationof the district was bestowing maximum attention onthe development of backward areas in Kasaragod.2.2 REGIONAL LINKAGES
Kasaragod, the most northern district of Kerala,
Fig.2.1 Regional Setting of Kasaragod
Thalassery fort put an end to his plansto conquer the entire Kerala. After hisdeath in 1782, his son, Tippu Sulthancontinued the campaign andconquered Malabar. Tippu surrenderedMalabar excluding Thulunadu (Canara)to the British by Sreerangapattanamtreaty of 1792. The British hadhegemony over the place since thedeath of Tippu Sulthan in 1799.Kasaragod was part of Bekal taluk in thesouth Canara district of Bombaypresidency. Kasaragod taluk came intobeing when Bekal taluk was includedin the Madras presidency on 16th April1882. Though Vengayil KunhiramanNayanar moved a resolution in 1913 on
admin
Text Box
<< CHAPTER 1
admin
Text Box
< CONTENTS >

Department of Town & Country Planning, KeralaDepartment of Town & Country Planning, Kerala
HISTORY AND REGIONAL LINKAGES District Urbanisation Report - Kasaragod1010
Town By rail (km) By road (km)
Thiruvananthapuram 588 631Kochi 366 412Kozhikode 175 206Mangalore 46 51
Table 2.1 Distances to different towns from Kasaragod
Fig 2.2District Map showing all Panchayats 2001
About hundred buses, both KSRTC and Privateservices are plying to various important stations likeBombay, Bangalore and Mangalore from Kasaragod.Kasaragod railway station is a main station in SouthernRailway. About 15 express trains stop at this station. It isin the shortest route from Kerala to Bombay via. KonkanRailway. Both the State and Central Governments pro-pose to develop the ‘Bekal fort’ area by acquiring 330Acres of land around Bekal fort and providing touristfacilities. Kasaragod will be the ‘gateway’ for the Bekalbound tourists. The District is well connected by roadsand railways to other parts of the country. The nearestairports are at Mangalore and Kozhikode which are 55km and 215 km respectively from Kasaragod.
2.3 INFERENCEMangalore is the nearest city and the people
of the district depend on it for tertiary level functions.In the South end Kannur, even though a lesser orderregional centre compared to Mangalore, is more easilyaccessible for such functions.
Kasaragod District lies between 120 12’ and 120 48’ northlatitudes and between 740 52’ and 750 26’ eastlongitudes. Kasaragod is the farthest District from thestate head quarters. The National Highway-17 passesthrough the district from Cheruvathur to Thalappadi, adistance of about 85.9 km. Besides, there are about227.485 Kms of State Highway, 1273.357 Kms of Majordistricts roads and 254.815 Kms of other District roadsand 161.357 Kms of village roads under the control ofPublic Works Department in the district. The Railwaylines from Shornur to Mangalore passes through theentire length of the district along the coast enteringthe district about 3km south of Trikaripur railway stationand leaving the district about 5km north ofManjeshwaram Railway Station. The district has a 116Km long railway line. The distances from Kasaragod toimportant towns are as follows.
bounded by Mangalore and South Kanara in the north,Coorg in the east, Arabian Sea in the west and Kannurin the south, was formed in 1984.
DAKSHINA KANNADA DISTRICTKarnataka State
KODAGU DISTRICTKarnataka State
KANNUR DISTRICT
Fig.2.3 Road, Railway Network and important junctions.
DAKSHINA KANNADA DISTRICTKarnataka State
KODAGU DISTRICTKarnataka State
KANNUR DISTRICT
admin
Text Box
< CONTENTS >
admin
Text Box
CHAPTER 3 >>

Department of Town & Country Planning, KeralaDepartment of Town & Country Planning, Kerala
District Urbanisation Report - Kasaragod POPULATION 1111
Chapter - 3POPULATION
3.1 POPULATION SIZE
As per the 2001 census, the population of KasaragodDistrict is 1203342 which constitute about 3.78% of thetotal population of the State. Of the total populationof the Kasaragod District 233745 is urban population.That is 19.42% of the total population of the District isin the census urban area of the District. There aretenurban areas, namely Kasaragod , Kanhangad andNileshwar Municipalities , five Census townsBangramanjeshwar, Hosabettu, Manjeshwar, Kuduluand Udma in the District and 2 Urban Outgrowthcenters Cheruvathur and Perole. The census urbanareas of Kasaragod District are shown in the Fig: 3.1. .
3.1.1 CENSUS FINDINGS – POPULATION AND ITS DISTRIBUTIONA). DISTRIBUTION OF POPULATION IN RURAL AND URBAN AREAS
The population of the district has increasedfrom 1,071,508 in 1991 to 1,203,342 in 2001 with 587,763males and 615,579 females. The district with 5.13 percent of the total geographical area of the Stateaccommodates 3.728 per cent of the population. Thedistrict is sub-divided into two Taluks, Kasaragod andHosdurg. Kasaragod Taluk has retained the position ofthe most populous taluk of the district both in 1991 and2001 Census with 540,274 and 616,176 personsrespectively. From 50.42 per cent of the District’spopulation in 1991, it increased to 51.21 per cent in2001. Rural-Urban classification is necessary forunderstanding the process of urbanization in thedistrict. The district’s population is divided betweenrural and urban areas in the ratio of 4:1 in 2001. It was5:1 in 1991. The urban population has increased from176, 26 in 1991 to 233,745 in 2001, i.e. from 16.45 percent to 19.41 per cent. Kasaragod Taluk is less urbanizedthan Hosdurg Taluk. The urban population of KasaragodTaluk was 58,012 in 1991. It was only 10.74 per cent ofpopulation of the district in 2001; the urban populationhas increased to 15.59 with the formation of 3 moreCensus Towns Hosabettu, Bangramanjeshwar andKudlu. In 2001 Census, Kasaragod Taluk has becomemore urbanized with four Census Towns and oneStatutory Town. It has 41.16 per cent of the urbanpopulation of the district. The rural-urban ratio ofpopulation in the taluk has increased from 8:1 in 1991to 5:1 in 2001. In Hosdurg Taluk, in 1991 there werethreeCensus Towns and one Statutory Town. In 1991 it had22.25 per cent of the urban population of the taluk and
Fig. 3.1 District map showing Municipal census town and urban agglomeration
DAKSHINA KANNADA DISTRICTKarnataka State
KODAGUDISTRICT
KarnatakaState
KANNUR DISTRICT
admin
Text Box
<< CHAPTER 2
admin
Text Box
< CONTENTS >

Department of Town & Country Planning, KeralaDepartment of Town & Country Planning, Kerala
POPULATION District Urbanisation Report - Kasaragod1212
67.08 per cent of the urban population of the district.Its rural-urban ratio in 1991 was 4:1 with the additionof Udma Census Town in 2001; urban population hasincreased from 18,214 to 137,508 in 2001 and urban ratiofrom 4:1 to 3:1 in 2001. But the share of the urbanpopulation of Hosdurg Taluk in the district has comedown from 67.08 per cent in 1991 to 58.84 per cent in2001, but continues to be the more urbanized taluk.The urban population, is distributed in 2 StationaryTowns and 5 Census Towns. Kanhangad Municipalitywith 65,503 persons is the most populous town in thedistrict. Including the three Out-growths ofCheruvathur, Nileshwar and Perole, its populationcomes to 129,367 and among these Nileswar is nowupgraded as Municipality in 2010.All the towns in the district have above 5,000populations. Among census Towns, Kudlu Census Townis the most populous with 23,328 persons. In thedistrict, the rural population of 969,597 accounting for80.59 per cent of the total population, is distributed in112 villages of 2 Taluks. Kasaragod Taluk (66.96 per cent)accommodates 520,783 rural population, forming 53.67per cent of the total rural population. The 37 Villagesof Hosdurg Taluk have 449,658 rural population forming46.33 per cent of total rural population.B). SIZE, CLASS AND STATUS OF TOWNS:Classification of towns in each census is based on itspopulation in the particular census. With the growth/decline of population the towns may change their size-classes. In addition to this, certain towns cease to existdue to merging with other towns and declassificationof towns as rural area, and new towns may be formed.There are 7 towns in 2001 Census. Urban status of noneof the towns of the district has changed during 1991-2001. For classification of towns, six size-classes havebeen formed. The Size-Class-I with population 100,000and above is the highest Size-Class and Size-Class-VIwith less than 5,000 populations is the lowest Size-Class. In 1991, there was no Class-I Town in Kasaragod
III and one Town each in Class-IV and Class-V. Thenumber of towns in Class-II and Class-III has decreasedto one each in 2001. There are no Class-IV Towns andthe number of Class-I and Class-V Towns has increasedby one and three respectively. The decline in numberof Class III and Class-IV Towns were on account ofdeclassification of Cheruvathur, Nileshwar and PeroleCensus Towns. Kanhangad Municipality which was aClass-II Town in 1991 was elevated to the status of Class-I in 2001.( Nileswar is now upgraded as Municipality in2010). Among the seven Towns of 2001, one Town eachis in Class-I, II and III and four Towns are Class-V.Kasaragod Municipality and Kudlu CT are Class-II andClass-III towns respectively while Manjeshwar CT,Hosabettu CT, Bangaramanjeshwar CT and Udma CT areClass-V Towns.
C). VILLAGES BY POPULATION SIZE
Villages in the district are classified into sevenpopulation Size-Classes. A vil lage with averagepopulation of 8,664 falls in the Population Size-class of5000-9999. 33 villages of the district fall in this range.There are 35 villages below and 44 villages above thissize-class. There are no small size vil lages withpopulation below 1000. 5 villages are in the Size-classof 1000-1999, 30 villages in 2000-4999, 33 villages in5000—9999 and 44 in 10,000+. Large size villages withpopulation above 10,000 constitute 39.29 per cent ofthe total number of villages. The number of villageswith less than 5000 population comes to 31.25 per cent.It is seen that villages in the district are evenlydistributed among the three Size-Classes of 1000-4999,5000-9999 and 10,000+.Among the Taluks, the percentage of large sized villageswith population above 1,000 is the highest in HosdurgTaluk (62.16 per cent) while in Kasaragod Taluk, 36 percent of the villages are in the population Size Class 2000-4999. In Hosdurg Taluk 89.19 per cent of the villagesarehaving population above 5000 as against 58.7 per centin Kasaragod Taluk.District. There were 2 Towns each in Class-II and Class-

Department of Town & Country Planning, KeralaDepartment of Town & Country Planning, Kerala
District Urbanisation Report - Kasaragod POPULATION 1313
YearTotal
PopulationUrban
Population Percent of Urban Population
1971 683020 113929 16.681981 872741 43137 4.941991 1071508 176226 16.642001 1204078 233700 19.4
Table 3.1 Decadal variations in the Urban Population of Kasaragod District from 1971 to 2001
District Name
1991 2001Alapuzha 7.28 5.21Ernakulam 11.12 9.09Idukki 11.22 6.96Kannur 16.63 7.13Kasaragod 22.78 12.3Kollam 10.68 7.33Kottayam 7.71 6.76Kozhikode 16.69 9.87Malapuram 28.87 17.22Palakkad 16.52 9.86Pathanamthitta 5.6 3.72Thiruvananthapuram 13.5 9.78Thrissur 12.2 8.7Wayanad 21.32 17.04
Population Growth Rate
Table 3.2 Growth of Population 1991 to 2001
3.3 POPULATION DENSITYOne of the important indices of population
concentration is the density of population. It is definedas the number of persons per square kilometre. Theoverall density of population per square kilometer inKasaragod District is 604 persons. It was 538 in 1991.The district had 10th place in density of population in1991. In 2001, with an average density of 604 persons,the district holds the same rank. The urban density isusually higher than the rural density; Kasaragod Districttoo shows higher urban density of 1862 persons persq.km. The rural density is 520 persons per sq.km. Thedensity of population in the district is depicted below:
While the Villages in Kasaragod Taluk are small, thevillages in Hosdurg Taluk are comparatively larger in size.3.2 GROWTH OF POPULATION
The table no 3.1 show the decadal variation inthe urban content of the Kasaragod District. The figuresin the table show that urban content of the population.
Fig 3.3 Distribution of PPN growth rate 2001
Fig 3.2 Distribution of PPN growth rate 1991

Department of Town & Country Planning, KeralaDepartment of Town & Country Planning, Kerala
POPULATION District Urbanisation Report - Kasaragod1414
3.4 SEX RATIOSex ratio is defined as the number of females
per 1000 males in the Population. In 1991 Census,Kasaragod District had a sex ratio of 1026 females per1000 males as against 1036 females per 1000 males forthe state. The sex-ratio trend shows that the sex ratioof the district had declined during the first five censusesof 1901 to 1941. During these forty years, sex ratio haddeclined from 1060 to 1039. In 1951, the sex ratiowitnessed a rise. In 1961 and 1971, the sex ratio again
declined. The sex ratio had gone below 1000 in 1971.Since 1981, the district is witnessing continuousincrease in sex ratio. During 1901-2001, the sex ratio atthe state level has increased by 54 points while at thedistrict level it has declined by 13 points. Statement-1shows the sex ratio of the state/the district in 1901 and2001.
Within the district, sex-ratio varied from 1020 inKasaragod Taluk to 1076 in Hosdurg Taluk. Generallyrural areas have higher proportion of females than theurban areas. Kasaragod District does not confirm tothis pattern. The sex ratio figures for the rural and theurban areas of the district were 1023 and 1045respectively in 1991. The rural sex ratio of HosdurgTaluk(1046) was higher than the urban sex ratio of thedistrict (1045). In all the taluks and Towns, sex ratiowas in favour of females. In 2001 Census the sex ratioof the district is 1047 females per 1000 males. Increasein sex ratio is seen in both rural and urban areas of thedistrict in 2001. The urban sex ratio has increased to1070 in 2001. Within the district, considerable increasein sex ratio is seen in Kasaragod and Hosdurg Taluks. Inthe rural areas of Kasaragod Taluk, the sex ratio hasincreased from 1003 in 1991 to 1018 in 2001. In HosdurgTaluk sex ratio has increased from 1046 in 1991 to 1071in 2001. Among the towns of Hosdurg Taluk,Cheruvathur census Town had the highest sex ratio of1087 females per 1000 males. All the Towns ofHosdurgTaluk had sex ratio higher than the urban sexratio of the district (1045) in 1991. In Kasaragod Talukboth the Towns-Kasaragod Municipality andManjeshwar CT- had lower sex ratio than the districturban sex ratio. In the case of Kasaragod Municipalitythe sex ratio is lower than the Taluk urban sex ratioalso. In 2001 Census, the urban sex ratio of KasaragodTaluk is 1041. Table 3.4 shows 1991 and 2001 sex ratio of
the district and the Taluks.
Fig 3.4 Population Density 2001
Fig: 3.5 Population Density Map of Kasaragod District
DAKSHINA KANNADA DISTRICTKarnataka State
KODAGU DISTRICTKarnataka State
KANNUR DISTRICT

Department of Town & Country Planning, KeralaDepartment of Town & Country Planning, Kerala
District Urbanisation Report - Kasaragod POPULATION 1515
State / District Total/Rural/Urban
1991 2001
1 2 3 4
Kasaragod District Total 1026 1047
Rural 1023 1042
Urban 1045 1070
Kasaragod Taluk Total 1004 1021
Rural 1003 1018
Urban 1015 1041
Hosdurg Taluk Total 1049 1076
Rural 1046 1071
Urban 1061 1091
Sex -ratio
Table: 3.4 Sex ratio 1991-2001
3.5 POPULATION CONCENTRATION PATTERN
The population concentration pattern isderived by calculating the cumulative population afterarranging the LSGs in the descending order of netresidential density (total population/ habitable areaobtained by subtracting the area of water bodies,forest, paddy and other inhabitable area from the LSGsarea). The population concentration pattern ofKasaragod district is shown in Fig 3.6.
Table 3.3 Sex ratio in Kerala state andKasaragod District
Rural/Urban 1991 2001
1 2 3 4Total 1004 1058
Kerala State Rural 1008 1059Urban 953 1058
Sex -ratioState/DistrictTotal/
3.6 MIGRATION DETAILSKasaragod district experiences temporary out
migration of workers to the Middle East countries.However, clear statistics is not available on this.Likewise, population growth figures indicate thepresence of out migration from urban areas to periurban areas. For this also conclusive data are notavailable.3.7 POPULATION PROJECTION (TREND BASED)3.7.1 INVENTORY OF METHODS OF
POPULATION PROJECTION
Population growth of an area depends on number ofbirth, number of death, number of in migrants and outmigrants over a time period taken for the populationprojection. If one can predict the exact future valuesof all these factors, population projection of that areacan be done very accurately. The mathematicalexpression is as follows:
DAKSHINA KANNADA DISTRICTKarnataka State
KODAGU DISTRICTKarnataka State
KANNUR DISTRICT
Fig 3.6 The population concentration pattern of the district

Department of Town & Country Planning, KeralaDepartment of Town & Country Planning, Kerala
POPULATION District Urbanisation Report - Kasaragod1616
P1 = P0 + B - D + I - Owhere P1 and P0 refers to the size of population at thebeginning and end of a time period and B, D,I and O arethe number of births , deaths , immigrants and outmigrants respectively in the time period concerned.Practically this is very difficult .So population projectionis usually done by understanding the pattern ofpopulation growth in the past and assuming the samepattern of growth will continue in the future, thepresent population is projected to the desired futureperiod.
Different methods are there for projecting thepopulation.1. Arithmetic increase method2. Geometric increase method3. Incremental increase method4. Changing rate of increase method (Decrease rate of method)5. Graphical method6. Logistical curve method7. Apportionment method
In the arithmetic increase method, populationis assumed to be increasing at a constant rate. Theaverage increase in population found out from theprevious decade’s population data is added to thepresent population figures to obtain the population inthe succeeding decades.
In the Geometrical increase method averageof the percentage increase in population over eachdecade is found out and the present total population ismultiplied by this average percentage increase inpopulation to find out the added population over thepresent population in a decade.
Incremental increase method is a combinationof the above two and gives the advantage of both themethods. In this method the average increase ofpopulation per decade and the net incrementalincrease of the population per decade are found out.The net incremental increase in population is added to
the average increase of population to get the correctedaverage increase of population and this figure is addedto the present population figures to get the future
population figures.
In the changing rate of increase method, thepercentage increase in population over each decadeand the average of the increase or decrease of netpercentage increase in population are found out. Theaverage of the increase or decrease in net percentageincrease in population is added (or subtracted) to thepresent decade’s percentage increase of population toget the corrected increase of percentage of populationand with this the future population figures can be found
out.
In the graphical method cities having conditionsand characteristics similar to the city where futurepopulation is to be estimated are selected. It is thenassumed that the city under consideration will developas the selected similar cities have developed in thepast. This method has a logical back ground, and ifstatistics of development of similar cities are available,quite precise and reliable results can be obtained.statistics of development of similar cities are available,quite precise and reliable results can be obtained.Logistical curve method assumes that the populationof a l imited space follows the growth curvecharacteristics of living things provided birth, death andmigration within the limited space do not produceextra ordinary changes. The curve is S shaped. P.FVerhulst has put forward a mathematical solution tothe curve. The population P at any time t from origin
(t=0) with Po is the original population.P = Ps / (1+ m. loge 1 (nt))Where Ps = Saturation Population, m, n = a constantPs =2 PoP1P2 – P12 (P0+P1)/ (P0 P2 – P12)In the apportionment method, census populationrecord is expressed as the percentage of the populationof the whole country. The ratio of the town populationunder consideration to the National Population is

Department of Town & Country Planning, KeralaDepartment of Town & Country Planning, Kerala
District Urbanisation Report - Kasaragod POPULATION 1717
calculated for the last three or four decades. A graph isplotted between these ratios and the time .Theextension of the graph will give the ratio correspondingto the future years for which forecasting of thepopulation are to be done.
Table 3.5 Suitability of population projection methods
Sl NoMethod Of Population Projection Suitability
1 Arithmetic Increase method Suitable where increase in population is uniform and where population growth is nearing saturation level.
2 Geometrical Increase method Suitable where percentage increase in population is uniform and in old cities
3 Incremental increase method This is modification of the above two methods and gives correct result where these two methods are suitable
4 Changing rate of increase method Most suitable when the rate of increase in population goes on reducing
5 Graphical Methods Suitable when population data and details of development pertaining to similar cities are available
6 Logistical curve method Suitable for any area where extra ordinary changes in death rate, birth rate and migration are not expected
7 Apportionment method Suitable for any area where extra ordinary changes in death rate, birth rate and migration are not expected
From the above table one can see that the mostsuitable methods of population projection forKasaragod are decreasing rate method, Logistical Curvemethod and apportionment method.
3.7.2 POPULATION PROJECTION OF KASARAGODDISTRICT
A. DECREASING RATE METHOD:The population growth rate of 2011 & 2021 are
calculated assuming that the same percentage ofdecrease in population growth prevails as that of 2001
Table no 3.6: Projected DistrictPopulation – Decreasing rate
method
Year Total population
Population Growth rate
% Decrease in Population Growth rate
1971 6830201981 872741 27.81991 1071508 22.78 -18.012001 1203342 12.37 -45.682011 1285005 6.72 -45.682021 1331923 3.65 -45.68
for the succeeding two decades. Based on thepopulation growth rate calculated, the population ofthe District is projected for 2011 and 2021 and the sameis shown in table 3.6.

Department of Town & Country Planning, KeralaDepartment of Town & Country Planning, Kerala
POPULATION District Urbanisation Report - Kasaragod1818
3.7.3 PROJECTION OF RURAL – URBANBREAK UP
The following table shows the rural-urbanbreakup of the District population 2011 & 2021.
Table: 3.9 Projected Urban - RuralPopulation of Kasaragod.
1971 1981 1991 2001 2011 2021
District 682030 872741 1071508 1204078 1298663 1366374
Urban 113929 43137 176226 237700 276795 675708
Rural 568101 829604 895282 970378 1021868 690666
Urban/Rural 20.05 5.2 19.68 24.08 27.08 97.83
Kerala Kasaragod Distx y y /x
1971 21347375 683020 0.0321981 25453680 872741 0.0343 0.002292
1991 29098518 1071568 0.0368 0.0025362001 31838619 1203342 0.0378 0.0009912011 33817196 1312321 0.0388 0.000991
2021 35198589 1400825 0.0398 0.000991
YearRatio of District
population to Sate Population
Change in the ratio
Total population
Table no 3.7: Projected District Population –Apportionment method
YearTotal population as per decrease rate
method
Total population as per apportionment
method
Average population
figures
2011 1285005 1312321 12986632021 1331923 1400825 1366374
Table 3.8: Final Projected Populationfigures of the District
NB: Due to the non availability of data needed, thelogistical curve method is not attempted here.The projected total population by the two methodsdiffers slightly. The average of these two is taken asthe population figures of Kasaragod District. This isshown in table 3.8
So it can be concluded that the total populationof Kasaragod District will be 1298663 and 1366374 on2011 and 2021 respectively.
B.APPORTIONMENT METHOD:In the apportionment method the ratio of the
District population to the State population has beenfound out and the same is projected to the next twodecades assuming the change in the ratio during 2001 -2011 and 2011-2021 is same the value as that during2001-2011. In order to find out the projected populationin 2011 and 2021, the projected population of the Stateduring the same years are needed. The detail of thepopulation projection of Kerala is elaborated in theAnnex 5. The projected population of the District basedon the apportionment method is shown in table 3.7.
3.8 INFERENCEIt is estimated that the total population of the
district increases by about 94584 population in the
coming 10 years and from there it increases by less than
67711 population in the succeeding 10 years (by 2021)
with a growth rate of 6.72 during 2001-2011 & 3.65 during
2011-2021. The analysis shows that during the same
period (2001 to 2021) the urban content of the total
population make a very significant increase. It is
expected that the urban population will be increased
1.18 times in the next 20 years. This is mainly due to
the attaining of urban nature by some of the rural localbodies and subsequently the population in these local
bodies is being treated as urban.
admin
Text Box
< CONTENTS >
admin
Text Box
CHAPTER 4 >>

Department of Town & Country Planning, KeralaDepartment of Town & Country Planning, Kerala
District Urbanisation Report - Kasaragod OCCUPATIONAL STRUCTURE 1919
Chapter - 4OCCUPATIONAL STRUCTURE
4.1 WORK FORCE OF THE DISTRICTAs per census 2001, the work force participation
rate of Kasaragod District is 34.7%. Out of the total populationof 12.04 lakhs, 4.18 lakhs are total workers. The total workersare further divided into the main and marginal workers.Main workers constitute 27.21 % of the total populationand marginal workers constitute 7.48 % of the totalpopulation. Whereas, in Census 1991, the work forceparticipation rate of Kasaragod District was 30.56% only. Outof the total population of 10.7 lakhs, 3.27 lakhs populationswere workers. Main workers constituted 27.69 % of the
total population and marginal workers constituted only 2.87% of the total population. The change in the number oftotal workers and the main workers over a period of timeare shown in the fig 4.3 and table 4.1. It is evident from thegraph that a major change occurred in the occupationalstructure of Kasaragod District in the last decade. The mainworkers content as a percentage of total population hasbeen almost steady (27.21% and 27.69%) and the marginalworkers increased from 2.87% to 7.48%. Ie.1.76 % decreasein the main workers content and 160.63 % increase in themarginal workers content.
Fig4.1: Main workers, 2001 Fig 4.2 Work force participation rate, 2001
Fig: 4.3, Number of total workers and main workers 1981-2001
27654 30796
89566
291284
357296
417845
263630
326500 327762
050000
100000150000200000250000300000350000400000450000
1981 1991 2001
Workers
Year
Number of Workers 1981-2001
Total Marginal Workers
Total Workers
Total Main Workers
Main Workers
Non Workers
Marginal Workers Non Workers
Workers
admin
Text Box
<< CHAPTER 3
admin
Text Box
< CONTENTS >

Department of Town & Country Planning, KeralaDepartment of Town & Country Planning, Kerala
OCCUPATIONAL STRUCTURE District Urbanisation Report - Kasaragod2020
Table 4.1: Decadal variation of workerscontent-1981-2001
The graph shows that, though the total workers
are gradually increasing over last three decades (from1981 to 2001), the number of main workers also showsan increasing trend in between 1991 and 2001 indicatinga slightly good picture about the current economic baseof the District. The number of the total workers of thedistrict shows increase in figures during 1991-2001, thegrowth rate of the workers during this period (growthrate is 16.95%) is greater the growth rate of the totalpopulation (Growth rate of total population is 12.37%)of the same period. This indicates that the opportunityof employment is increasing more than in proportionto the growth of population. However, a large increasein the number of marginal workers compared to mainworkers indicates the gradual shift from the agriculturalsector and the emerging opportunities in the marginal
sector.
4.2 OCCUPATIONAL STRUCTUREAs per the census 2001, the main workers are
classified in to four categories viz. cultivators,agricultural labourers, household industrial workersand other workers. The other workers category mainlyincludes the primary sector workers like fishermen,workers engaged in mining and plantation workers.
Table No 4.2 Workers Classifications-District and Taluk
Fig 4.4: Classification of the Total workers
Workers 1981 1991 2001Total Workers 291284 357296 417711Total Main Workers 263630 326500 328145Total Marginal Workers 27654 30796 89566
CultivatorsAgr.
labourersHH industrial workers
Other workers
Kasaragod dist. 19974 41840 50096 305801
Kasaragod Taluk 10173 14112 37459 156654
Hosdurg Taluk 9801 27728 12637 149147
5%
6%
17%
72%
Occupational Structure (Kasaragod Taluk)
Cultivators
Agr. laborers
HH industrial workers
Other workers
Fig 4.5: Occupational Structure (Kasaragod Taluk)
5%
14%
6%
75%
Occupational Structure (Hosdurg Taluk)
Cultivators
Agr. laborers
HH industrial workers
Other workers
Fig 4.6: Occupational Structure (Hosdurg Taluk)
Labourers
Labourers
Labourers

Department of Town & Country Planning, KeralaDepartment of Town & Country Planning, Kerala
District Urbanisation Report - Kasaragod OCCUPATIONAL STRUCTURE 2121
Table No 4.3 Workers Classification –Urban and Rural area - 2001
Cultivators Agricultural HH industrial Other
labourers workers workers
Rural 18265 36075 41957 245513
Urban 1709 5765 8139 60288 Fig 4.7: Classification of the Main workers in -urban area and rural area
Sl. No: LSGI name Primary Secondary Teritiary pattern1 BELLUR 49.12 28.7 22.18 Primary2 KUMBADAJE 37.52 37.48 25 Secondary3 MANGALPADY 16.01 35.87 48.12 Secondary4 VORKADY 23.77 55.06 21.18 Secondary5 PUTHIGE 30.87 41.29 27.83 Secondary6 MEENJA 12.36 63.65 23.99 Tertiary7 MANJESWAR 12.86 48.23 38.91 Tertiary8 KUMBALA 25.29 34.76 39.95 Secondary9 PAIVALIKE 35.01 8.65 56.34 Secondary10 ENMAKAJE 42.74 34.4 22.86 Primary11 BADIYADKA 32.87 35.24 31.89 Secondary12 MULIYAR 36.85 27.86 35.29 Secondary13 KARADKA 27.06 34.36 38.58 Secondary14 DELAMPADY 40.15 29.82 30.03 Primary15 CHENGALA 17.16 38.27 44.56 Secondary16 CHEMNAD 26.29 30.95 42.76 Secondary17 BEDADKA 49.79 26.71 23.5 Primary18 MADHUR 14.35 43.98 41.67 Tertiary19 MOGRAL PUTHUR 19.44 35.34 45.22 Secondary20 KUTTIKOLE 52 25.45 22.56 Primary21 UDMA 23.92 27.75 48.32 Secondary22 AJANUR 25.41 33.78 40.82 Secondary23 BALAL 72.44 5.29 22.27 Primary24 KODOM-BELLUR 52.02 19.59 28.39 Primary25 MADIKAI 37.27 43.85 18.87 Secondary26 PALLIKKARA 24.55 30.79 44.66 Secondary27 PANATHADY 56.72 13.1 30.19 Primary28 PULLUR PERIYA 42.71 29.26 28.04 Primary29 KALLAR 64.31 10.8 24.89 Primary30 CHERUVATHUR 22.51 39.46 38.03 Secondary31 KAYYUR-CHEEMENI 41.37 31.28 27.35 Primary32 NILESHWAR 20.72 35.62 43.66 Secondary33 EAST ELERI 57.16 8.47 34.37 Primary34 PILICODE 32.29 34.95 32.76 Secondary35 WEST ELERI 56.03 9.29 34.69 Primary36 KINANOOR 48.04 22.12 29.83 Primary
KARINDALAM37 THRIKKARIPUR 18.48 28.1 53.42 Secondary38 PADNE 31.3 21.45 47.24 Secondary39 VALIYA PARAMBA 64.16 11.72 24.12 Primary40 KASARAGOD 10.72 22.65 66.62 Tertiary41 KANHANGAD 22.14 33.06 44.79 Secondary
Workers percentage in Activity
Labourers
The cultivators and agricultural labourersconstitute only 15% of the total workers (417711)whereas lion share of the main workers (85%) belongsto the other workers category (See fig 4.4). Asmentioned earlier other workers category will includesome of the primary workers like fishermen, workersengaged in mining and plantation workers. Assume that15 % of the other workers belong to this primary workercategory. Even then one can say that, 73 % of the totalworkers engage in tertiary activity. These findings posea contrast against the national figures where more than60% of the total workers engage in primary activity. Thisis a clear indication of the declining trend of the primary
sector in Kasaragod District.
4.3. OCCUPATIONAL STRUCTURE - VARIATION IN URBAN AND RURAL AREA
The table number 4.3 shows the four-foldcategory of workers in the urban and rural area of theDistrict. The same values are depicted in pie in figure4.7. The above chart shows that the cultivators andagricultural labourers share are 10% and 16% in urbanarea and rural area respectively. The householdindustrial workers share is at 11% & 12%. This indicatesthat as far as the workers classification is considered,all most 90% the workers in urban area depends on thetertiary sector for their livelihood. Household industrialsector share in both urban and rural area is very low at11% to 12% of the total workers.
Table No 4.4 Activity pattern based onoccupational structure of workers

Department of Town & Country Planning, KeralaDepartment of Town & Country Planning, Kerala
OCCUPATIONAL STRUCTURE District Urbanisation Report - Kasaragod2222
Table 4.5 Occupational Structure 1981-2001Cultivators Agr labourers HH ind workers Others
1981 36960 72499 4431 1497401991 41562 80612 1887 2024392001 19974 41840 50096 305801
Fig 4.8: Temporal variation of category of workers
Cultivators and agricultural labourers show drasticdecrease in total numbers (a decrease of approximately52%) during the period from 1991 to 2001, whereasother workers show an increase of 26.75%. This is a clearindication of the weakening of the primary, mainly theagricultural, sector in the district.
Table 4.6 Numbers of various categoriesof workers in urban area
Year Cultivators Agri Labourers H H Ind Workers Others1981 184 494 147 103091991 2860 8195 578 395692001 1709 5765 8139 60288
Table 4.7: Number of various categories of workers in rural area
Year Cultivators Agri Labours H H Ind Workers Others1981 36779 72005 4284 1394911991 38702 72417 1309 1628702001 18265 36075 41957 245513
Fig 4.9. Variation in the number of different category of workers in Urban area.
Fig 4.10. Variation in the number of differentcategory of workers in rural area
The fig 4.8 and table 4.6 and 4.7 shows the variation of thenumber of different category of workers in the urban areafrom 1981 to 2001. There is significant increase in thecategory of other workers during this period, meanwhilethe category of workers in cultivators and agriculturallabourers are in the decline during the same period.Thefig 4.9 and fig 4.10 shows the variation of different categoryof workers in rural area during the period from 1981- 2001.The rural areas also exhibit almost the same pattern ofchange in the number of workers in different categoriesas that of the urban area. This indicates that the primarysector activity, mainly the agricultural activity is on thedecline in the rural area of the District.
4.4. TEMPORAL VARIATIONThe number of various categories of workers from1981 to 2001 in the district is shown in table 4.5.

Department of Town & Country Planning, KeralaDepartment of Town & Country Planning, Kerala
District Urbanisation Report - Kasaragod OCCUPATIONAL STRUCTURE 2323
4.5. Occupational Structure – Estimation ofNine fold Classification of 2001 The nine fold classification of workers is estimated in table 4.8.
Table No 4.8 Estimation of Nine fold classification of workers - 2001LSGI name
Livestock, Forestry, Manufacturing, Fishing, Manufacturing, Processing, Hunting, Processing, Servicing and
Plantation, Mining servicing and repairs TransportOrchards, and repairs i n in other than storage andand allied Quarrying Household household Trade and Communic Other
Sl. No: Cultivators Agr lbrs activites industries industries commerce -ations Services1 BELLUR 185 696 1416 47 30 1265 418 132 4872 KUMBADAJE 316 375 1451 178 25 1937 434 138 8553 MANGALPADY 858 596 683 150 62 4574 3278 1136 20074 VORKADY 1156 1184 410 167 94 6109 992 333 11255 PUTHIGE 524 665 1054 152 32 2816 752 278 9926 MEENJA 471 366 327 80 9 5903 984 374 9007 MANJESWAR 473 576 741 106 72 6534 3019 821 15768 KUMBALA 839 529 2017 133 59 4460 2918 717 17129 PAIVALIKE 472 595 3543 347 141 651 2693 822 3905
10 ENMAKAJE 556 230 4059 124 74 3702 823 342 142611 BADIYADKA 658 951 2262 314 161 3675 1393 537 182512 MULIYAR 310 511 1719 265 58 1597 819 315 129813 KARADKA 238 324 1530 153 127 2376 904 448 163014 DELAMPADY 410 360 2885 119 54 2542 1202 314 121815 CHENGALA 607 1075 620 483 276 4374 2787 1051 213916 CHEMNAD 846 1505 1013 448 51 3461 2693 821 195717 BEDADKA 655 944 3447 310 145 2252 446 449 148718 MADHUR 458 803 376 183 123 4711 1852 1069 183319 MOGRAL PUTHUR 298 359 519 129 7 2002 1267 406 106320 KUTTIKOLE 593 1246 3228 293 79 2108 419 419 136021 UDMA 225 395 1742 148 21 2571 2212 761 179822 AJANUR 497 2118 1099 453 109 4376 2892 981 209423 BALAL 603 762 5277 72 79 334 722 215 110524 KODOM-BELLUR 1587 2922 2306 191 114 2262 1264 648 180725 MADIKAI 661 2339 193 468 299 2990 557 241 81926 PALLIKKARA 780 1139 478 497 57 2452 1755 757 184827 PANATHADY 148 284 4380 111 52 948 432 446 168328 PULLUR PERIYA 1259 2849 127 344 53 2504 866 419 149529 KALLAR 516 933 2838 73 33 614 278 291 109030 CHERUVATHUR 107 851 921 219 193 2882 1497 665 101231 KAYYUR-CHEEMENI 673 2524 516 990 41 1776 820 391 124432 NILESHWAR 242 1443 854 218 209 3937 2497 704 214933 EAST ELERI 63 70 4821 87 60 587 1166 333 148034 PILICODE 374 2220 121 670 69 2199 910 418 142635 WEST ELERI 217 259 5255 193 37 720 1274 467 180736 KINANOOR-KARINDALAM 591 1340 3140 332 28 1975 1064 415 167037 THRIKKARIPUR 279 1189 370 177 59 2558 2791 610 191138 PADNE 176 1002 548 37 16 1130 1596 231 77839 VALIYA PARAMBA 164 628 1836 8 18 454 563 67 35840 KASARAGOD 77 336 1279 36 105 3433 4594 2571 334741 KANHANGAD 643 2476 1772 628 293 6382 4557 1479 3858
9 fold classification of workers as per 2001 census

Department of Town & Country Planning, KeralaDepartment of Town & Country Planning, Kerala
OCCUPATIONAL STRUCTURE District Urbanisation Report - Kasaragod2424
Persons/Males/
Females
Culti
vato
rs
Agrl.
Labo
urer
s
Hose
hold
nd
ustr
y w
orke
rs
Oth
er w
orke
rs
1 2 3 4 5 6 7 8 9
Persons 417711 19974 41840 305801Males 289518 16678 27899 238085
Females 128193 3296 13941 67716Persons 218398 10173 14112 156654Males 149586 8844 11168 126083
Females 68812 1329 2944 30571Persons 199313 9801 27728 149147Males 139932 7834 16731 112002
Females 59381 1967 10997 37145
Category of workers
District
Kasaragod
Total
Total
Hosdurg
Civic Status
Total Workers
(Main Marginal
Total/ Rural/ Urban
Name of Taluk
Total
Table 4.9 Distribution of Workers by Sex in Four Categories ofEconomic Activity in Taluks, 2001
4.6. SPATIAL DISTRIBUTION OF THE MAJOR CLASSES OF WORKERS The spatial distribution of major classes ofworkers is analyzed in the following tables.a) By Sex in Four Categories of Economic Activity inTaluks, 2001.
Taluk-wise distribution of total workers andcategory of workers by sex are highlighted in the table.By category of workers, other workers constitute 72.9per cent of the total workers. Cultivators, AgriculturalLabourers and Household Industry Workers constitute5.0 per cent, 10.1 per cent and 12.1 per cent respectively.
At Taluk level Hosdurg Taluk has the highestpercentage of other workers (74.7 %). In the categories
of cultivators and household industry workers, the
percentage of workers is more in Kasaragod Taluk.
Coming to Agricultural Labourers, Hosdurg has 13.9 per
cent as against Kasaragod with 6.5 per cent. The
percentage of total workers in the district is 34.7 per
cent, with Kasaragod taluk having 35.4% and Hosdurg
Taluk having 33.9 % respectively. The percentage of
female workers is more in Kasaragod Taluk (22.3 per
cent).
(Source: Census report-2001)

Department of Town & Country Planning, KeralaDepartment of Town & Country Planning, Kerala
District Urbanisation Report - Kasaragod OCCUPATIONAL STRUCTURE 2525
Table 4.10 Distribution of workers by sex in four categories of economic activity of urbanagglomerations/towns, 2001.
b). by sex in four categories of economic activity of urban agglomerations/towns, 2001.
The census of constituent units of UA is given
separately. Out of the two Urban Agglomerations in thedistrict Kasaragod UA has the highest percentage of
household industry workers at 9.7 Percentage and otherworkers at 86.2 Percentage. Coming to Municipalities,Kasaragod Municipality has the highest percentage of
CultivatorsAgrl.
Labourers
Hosehold industry workers
1 2 3 4 5 6 7 81 Bangara persons 5636 2113 36 22 610
Manjeshwar Males 2763 1407 30 15 47Females 2873 706 6 7 563
2 Hosabettu Persons 5916 2078 37 41 543(CT) Males 2913 1424 31 30 34
Females 3003 654 6 11 5093 Kanhangad Persons 129364 42736 1257 4823 3713
UA* Males 61954 29721 979 2894 1196Females 67410 13015 278 1929 2517
4(i)
Kanhangad Persons 65499 22079 798 2498 2098
(M)+ Males 31599 15442 591 1560 730Females 33900 6637 207 938 1368
5 Kanhangad Persons 129364 42736 1257 4823 3713(M+OG) Males 61954 29721 979 3713 1196
Females 67410 13015 278 1110 25176 Kasaragod Persons 76011 23628 251 721 2292
UA* Males 37232 17803 218 603 409Females 38779 5825 33 118 1883
7(a)
Kasaragod Persons 52683 15804 116 330 939
(M) Males 25698 12275 105 293 160Females 26985 3529 11 37 779
8 Kudlu Persons 23328 7824 135 361 1353(CT) Males 11534 5528 113 310 249
Females 11794 2296 22 81 11049 Manjeshwar Persons 8674 3025 63 51 721
(CT) Males 4256 2000 53 28 70
Total No. of Workers (Main +
Marginal)
Category of workers
Sl.No.Name of CD
BlockPersons/Males/Females
Total population

Department of Town & Country Planning, KeralaDepartment of Town & Country Planning, Kerala
OCCUPATIONAL STRUCTURE District Urbanisation Report - Kasaragod2626
other workers at 91.3 percentage. Kudlu CT, which is aconstituent of Kasaragod UA, has 76.0 percent otherworkers. The other CTs such as Bangara manjeshwar,Hosabettu, Manjeshwar, Udma have 68.5 percent, 70.4per cent, 72.7 per cent and 83.2 percent other workersrespectively. Between two Municipalities, in otherfemale workers, Kasaragod Municipality dominates
with 76.7 per cent. In household industry thepercentage of females is much higher than the malesin both Kasaragod and Kanhangad Municipalities.
4.7 ACTIVITY PATTERN BASED ON OCCUPATIONAL STRUCTURE OF WORKERS
The activity pattern of the LSGs is studied basedon occupational structure alone as follows. Forclassification, percentage of workers engaged insecondary and tertiary activities are consideredtogether. If this percentage is less than 60, the localbody is supposed to have primary activity pattern. Ifthe value is between 60 and 85, the activity pattern istaken as secondary and if the value exceeds 85, theLSGs is classified to be tertiary.
4.8 INFERENCEThe backbone of any economy is the production
sector. The analysis of the occupational structure of theDistrict shows a very alarming situation regarding theeconomic base of the district. The production sector including the agriculture andindustrial sector shows declining trend in the district.The only sector, which shows growth, is the servicesector. More than 50% of the urban population dependson the service sector for their livelihood. It is observedthat rural area of the district is also slowly withdrawingfrom the primary sector and started depending moreon the service sector.Fig 4.11 Distribution of Workers of Kasaragod District
DAKSHINA KANNADA DISTRICTKarnataka State
KODAGU DISTRICTKarnataka State
KANNUR DISTRICT
admin
Text Box
< CONTENTS >
admin
Text Box
CHAPTER 5 >>

Department of Town & Country Planning, KeralaDepartment of Town & Country Planning, Kerala
District Urbanisation Report - Kasaragod LAND USE 2727
Chapter - 5LAND USE
Use of a percent of land is indicated by the
predominant activity, be it agriculture, residential,
commercial, forest etc, for which the land is put to.
Hence the analysis of the existing land use is inevitable
to understand the predominant economic activities ofan area as well as the availability of vacant land for future
economic activities. In order to spatially analyze the
land use pattern and economic activity as well as
linkages between them land use survey in all the 38
local bodies in the district has to be completed.
However this will take considerable time period. The
source of the data is from IRS-P6, LISSIV, IC/ID LISS III+
PAN Satellite for the analysis (year 2003-04). The above
data base is predominantly agriculture oriented and as
such the analysis limited to that extent.
5.1 LAND USE PATTERN OF KERALA STATE
Based on the land use data of the Natural
Resources and Enviornmental Data Base the Land use
of Kerala can be categorized under 9 Major categories
and the percentage share of these categories is shown
in Table (5.1) and Fig 5.1. Accordingly predominant land
use of the state is a mix of residential and agricultural
which constitute 48.38 % total Land area. It can be further
seen that Forest area of the state contribute nearly 23.18
% of the total area making the forest land use as second
highest land use of the state. The Agricultural Land useand plantation land use together constitute 20.18%
(Agricultural 10.17% and plantation 10.01%) of total
area. The above analysis further support the real to
ground peculiar scenario of the state in terms of urban
Table 5.1: Land use break-up – Kerala State
3 Marshy Land 0.28
5 Agriculture 10.176 Plantation 10.01
8 Other Built up Land Use 0.489 Others 8.13
Total 100
7 Res/Agr Mix 41.38
2 Water bodies 2.92
4 Residential 3.45
SI No Land use Category % Of Total Area
1 Forest 23.18
Fig 5.1: Land use break-up – Kerala State
rural continuum, highly scattered settlement pattern,
and traditional homestead type of development
admin
Text Box
< CONTENTS >
admin
Text Box
<< CHAPTER 4

Department of Town & Country Planning, KeralaDepartment of Town & Country Planning, Kerala
LAND USE District Urbanisation Report - Kasaragod2828
Table 5.2 Kasaragod District Land Use patternby category
5.3. REGIONAL LAND USE STUDYClearly the process of land use analysis of
Kasaragod District shall starts with an insight to thewhole Kerala state and neighbouring Districts (Kannur,Wayanad and Kozhikode). In this section an attempt hasbeen made compare the land use pattern of Kasaragod
District with the state as well as with surrounding
districts of Kannur, Wayanad and Kozhikode. Land usepattern of Kasaragod in comparison with Kerala state is
No Landuse % of total in the Dist.
Percentage of the corresponding area
inthe state
1 Forest 1.26 23.182 Waterbodies 4.62 2.923 Marshy land 0 0.284 Residential 5.71 3.455 Agriculture 11.8 10.176 Plantation 0.66 10.017 Res/Agr Mix 59.33 41.388 Other Built-up
Landuse5.82 0.48
9 Others 10.8 8.13
Table 5.3 Comparison of Land use break up ofKasaragod District and Kerala state
Generated from NREDB of the State
No Landuse Kozhikode Wayanad Kannur Kasaragod
1 Forest 438.53 845.29 435.35 106.092 Waterbodies 59.68 11.88 79.75 49.053 Marshy land 4.23 0 0 04 Residential 80.28 17.62 218.63 71.655 Agriculture 127.75 241.16 665.11 436.226 Plantation 6.74 140.86 0.76 24.067 Res/Agr Mix 1502.22 140.86 1320.8 974.388 Other Built-up
Landuse 4.41 2.56 0.68 10.1
9 Others 124.23 728.76 242.88 319.31Total 2348.07 2128.99 2963.96 1990.85
Table 5.4 Land use break up in comparisonwith neighbouring districts
Generated from NREDB of the State
No Landuse % of total in the Dist.
Kasaragod
1 Forest 1.26 106.092 Waterbodies 4.62 49.053 Marshy land 0 04 Residential 5.71 71.655 Agriculture 11.8 436.226 Plantation 0.66 24.067 Res/Agr Mix 59.33 974.388 Other Built-up
Landuse5.82
10.1
9 Others 10.8 319.31
5.2 LAND USE BREAKUP OF KASARAGOD DISTRICT
Total area of the district is 1992 Sq.Km. The
breakup of landuse area of the district with itspercentage to total area of the district is shown in Table5.2. The land utilization pattern exhibits thecharacteristics of the district in terms of its growth,development and activity pattern. It also indirectlyindicates the extent of land available for futuredevelopment. The highest landuse falls under thecategory of Residential/Agricultural mix, which includemainly dry agriculture lands where in residentialdevelopments are co-existent.
shown district the predominant land use is mix ofresidential and agriculture. The share of Agriculturalland use category is higher compared to state. Thecomparison of Land use pattern of Kasaragod Districtwith neighbouring Districts (Kannur, Wayanad and
Kozhikode), is shown in Table 5.4.

Department of Town & Country Planning, KeralaDepartment of Town & Country Planning, Kerala
District Urbanisation Report - Kasaragod LAND USE 2929
Fig 5.2: Land use Kasaragod District
DAKSHINA KANNADA DISTRICTKarnataka State
KODAGU DISTRICTKarnataka State
KANNUR DISTRICT

Department of Town & Country Planning, KeralaDepartment of Town & Country Planning, Kerala
LAND USE District Urbanisation Report - Kasaragod3030
Fig 5.3 Forest Land use comparison with surrounding districts
Comparison of the Forest land use(Sq.Km) of KasaragodDistrict and neighbouring three Districts shown in Fig.5.3. The figure clearly shows that Wayanad District hasthe highest share where as Kasragod is placed in thelast position.
The percentage of Forest Land Use of eachdistrict is shown in Fig.5.4 . Wayanad district showshighest percentage (10.03%) followed by Kozhikode(5.2%).and Kannur(5.17%). Kasaragod shows leastpercentage of forest land compared to the other 3districts.
Fig 5.4 Comparison of the percentage share of Forest Land
use of the state in surrounding districts
106.09
435.35
845.29
438.53
Kasaragod Kannur Wayanad Kozhikode
FOREST LAND DISTRICT WISE COMPARISON (SQ KM)
1.26
5.17
10.03
5.2
Kasaragod Kannur Wayanad Kozhikode
FOREST LAND % DISTRICT WISE COMPARISON
Fig 5.5 Residential Land use comparison with surrounding districts
71.65
218.63
17.62
80.28
Kasaragod Kannur Wayanad Kozhikode
RESIDENTIAL LAND DISTRICT WISE COMPARISON (SQ KM)
Fig 5.6 Comparison of Percentage share of Residentialland use in Kasaragod & Surrounding Districts
5.71
17.44
1.4
6.4
Kasaragod Kannur Wayanad Kozhikode
RESIDENTIAL LAND % DISTRICT WISE COMPARISON
The percentage of Residential Land use ofKasaragod & Surrounding Districts is shown in Fig. 5.6The figure shows that Kannur district shows highestpercentage (17.44%) followed by Kozhikode(6.4%)andKasaragod(5.71%). Wayanad has the lowest percentage.
Fig 5.7 Agriculture Land use comparison with
surrounding districts
436.22
665.11
241.16
127.75
Kasaragod Kannur Wayanad Kozhikode
AGRICULTURE LAND DISTRICT WISE COMPARISON (SQ KM)
The comparison of percentage of AgricultureLand Use of each district is shown in Fig.5.8. The figureshows that Kannur district shows highest percentage(18%) and Kasaragod District is in second position(11.8%) followed by Wayanad and Kozhikode.
Fig 5.8 Comparison of Percentage share of Residential land
use in Kasaragod & Surrounding Districts
11.8
18
6.53
3.46
Kasaragod Kannur Wayanad Kozhikode
AGRICULTURE LAND % DISTRICT WISE COMPARISON

Department of Town & Country Planning, KeralaDepartment of Town & Country Planning, Kerala
District Urbanisation Report - Kasaragod LAND USE 3131
Department of Town & Country Planning, KeralaDepartment of Town & Country Planning, Kerala
Fig 5.9 Plantation Land use comparison with surrounding districts
The percentage share of Plantation Land Use inKasaragod & surrounding districts is shown in Fig. 5.10.The figure shows that Wayanad district shows highestpercentage (3.87%) . Among the near by districts ,Kasaragod falls under 2nd position.
24.06
0.76
140.86
6.74
Kasaragod Kannur Wayanad Kozhikode
PLANTATION LAND DISTRICT WISE COMPARISON (SQ KM)
Fig 5.10 Comparison of Percentage share of Plantation landuse in Kasaragod & Surrounding Districts
0.66
0.02
3.87
0.19
Kasaragod Kannur Wayanad Kozhikode
PLANTATION LAND % DISTRICT WISE COMPARISON
Fig 5.11 Res/Agri Mix Land use comparison
with surrounding districts
974.38
1320.8
140.86
1502.22
Kasaragod Kannur Wayanad Kozhikode
RESI/AGRI MIX LAND DISTRICT WISE COMPARISON (SQ KM)
Res / Agri mix category mainly include dryagriculture land uses. Comparing to the other districts,Kozhikode shows the highest %(Fig. 5.12) of mix ofresidential and agricultural land uses(9.99%) followedby Kannur(8.78%). Kasaragode falls in the 3rdposition(6.48%)
Fig 5.12 Comparison of Percentage share of Res/Agri Mix land
use in Kasaragod & Surrounding Districts
6.48
8.78
0.94
9.99
Kasaragod Kannur Wayanad Kozhikode
RESI/AGRI MIX LAND % DISTRICT WISE COMPARISON
5.4.CONCENTRATION PATTERN OF LAND USESThe concentration pattern of a land uses gives an ideaabout where that particular land uses is concentratedwithin the District. The Concentration Index value maybe greater than one, equal to one or less than one.The concentration index of various land uses, i.e. forest,urban, agriculture, plantation and water body arecalculated from the land use data for LSG’s and given in
Annexe 4.Using the above method concentration index of 9categories of Land use (which are Forest, Water Bodies,Marshy Land, Residential, Agriculture, Plantation, Resi/Agri Mix, Other built up land use and Others) are
analysed.
The regional land use study shows a generalobservation that Kasragod stand in the third positionwith respect to surrounding district in the case of urbancomponents of land use (residential, resi/agri mix etc.)and second position in the case of rural components ofthe land use ( Agriculture, plantation etc.)

Department of Town & Country Planning, KeralaDepartment of Town & Country Planning, Kerala
LAND USE District Urbanisation Report - Kasaragod3232
CI of Forest CI of Urban CI of Agr CI of Plantation CI of water body1 BELLUR 4.82 0 0.92 0 0.142 KUMBADAJE 0 0 1.08 10.23 0.33 MANGALPADY 0 0 1.21 0 1.44 VORKADY 0 0 1.1 0 0.145 PUTHIGE 0 0.08 1.19 0 1.086 MEENJA 0 0 0.96 0 0.427 MANJESWAR 0 0 1.28 0 1.048 KUMBALA 0 0.9 1.19 0 2.499 PAIVALIKE 0 0 0.99 0 0.3910 ENMAKAJE 0.37 0.18 0.97 0.09 0.5211 BADIYADKA 0.1 0.01 1 1.42 0.2312 MULIYAR 0 0 1.07 1.79 1.1313 KARADKA 0.29 0 1.08 5.28 0.4414 DELAMPADY 9.82 0 0.33 6.72 0.8915 CHENGALA 0 0 1.07 0.69 0.7916 CHEMNAD 0 1.99 0.98 0 1.3917 BEDADKA 0 1.6 0.78 0 118 MADHUR 0 0.14 1.25 0 0.2319 MOGRAL PUTHUR 0 1.85 1.22 0 220 KUTTIKOLE 2.13 0 0.96 0.26 0.1521 UDMA 0 0.35 1.08 0 0.8922 AJANUR 0 1.28 1.09 0 2.2523 BALAL 1.61 0.39 1.01 6.27 0.0824 KODOM-BELLUR 0 1 1.08 0 0.1225 MADIKAI 0 0.79 0.82 0 0.2426 PALLIKKARA 0 0.31 0.84 0 1.7527 PANATHADY 4.56 0 0.98 0 0.1828 PULLUR PERIYA 0 0.42 0.76 0 0.3729 KALLAR 2.8 0 1.05 0.27 0.730 CHERUVATHUR 0 0.45 1.14 0 4.5131 KAYYUR-CHEEMENI 0 0 1.05 0 0.8432 NILESHWAR 0 2.23 1.04 0 3.0233 EAST ELERI 0 0 1.27 0 0.3234 PILICODE 0 8.64 1.08 0 0.0835 WEST ELERI 0.69 0 1.18 0 0.536 KINANOOR-KARINDALAM 0.01 0.43 1.12 0 0.5337 THRIKKARIPUR 0 19.21 1.04 0 3.3138 PADNE 0 17.72 0.89 0 8.4939 VALIYA PARAMBA 0 1.78 0.64 0 18.7940 KASARAGOD 0 16.71 0.91 0 6.8641 KANHANGAD 0 2.53 1.16 0 0.82
Concentration Index
Sl. No Name of Panchayats
Table 5.5 Concentration index of various land uses

Department of Town & Country Planning, KeralaDepartment of Town & Country Planning, Kerala
District Urbanisation Report - Kasaragod LAND USE 3333
5.4.1 FOREST LAND USEForest Land use contains land use categories
of Dense Mixed Forest, Dense Mixed Forest (R.F)/Forest Blank, Dense mixed forest mainly bamboo,Dense mixed forest mainly bamboo & teak (R.F), Densemixed forest mainly bamboo (R.F), Dense mixed forestmainly teak or cashew, Bamboo (R.F), Barren Rocky/Stone waste/ sheet rock (RF), Open mixed forest/Open mixed forest (RF), Scrub forest, Degraded grassland (RF), Dense mixed forest mainly rubber, Underutilized / degraded notified forest and DenseGrassland/Degraded Degraded grass land.
The concentration index of forest land use shows(Figure 5.13) that forest area of the District is mainlyconcentrated in the South - Eastern part of the District.Kasragod district has a forest area of 117.54 Sq.Km. , fallingunder the Kannur Forest Division. Reserve foreststretches to 86.02 sq.kms, and vested forest to 31.52sq.kms, in two ranges-Kasaragod and Kanhangad
The forest land use is concentrated in Bellur,Delampady, Kuttikole, Balal, Panathady and Kallarpanchayats.
Fig 5.13 Concentration of Forest land use in KasaragodDistrict based on CI
Fig 5.14 Concentration of Agriculture land use inKasaragod District based on CI
5.4.2. AGRICULTURAL LAND USEThe Agricultural land use consists of Cashew/orange/pepper/pineapple, Viruppu (1st Crop)/ Mundakan, Landwithout scrub, Double Crop/Triple crop, Agriculturefarm, Agriculture farm (Orchads)/and Mixed treescatagories of land use ,as demarketed in the landusemap generated out of NREDB. The concentration indexof agricultural land use (Figure-5.14) shows thatagricultural area of the District is mainly concentratedin the central, and some of the up land regions of theDistrict. The pattern also reveals that the concentrationpattern of agricultural land use is also influenced bythe location of water bodiesThe variation of concentration index of Agricultural landuse among the local bodies where concentration index ofagricultural land use is greater than 1 is shown in fig 5.14.

Department of Town & Country Planning, KeralaDepartment of Town & Country Planning, Kerala
LAND USE District Urbanisation Report - Kasaragod3434
Kumbadaje, Mangalpady, Vorkadi, Puthige,
Manjeswar, Kumbala, Badiyadka, Muliyar, Karadka,Chengala, Madhur, Mogral-Puthur, Udma, Ajanur, Balal,Kodom-Bellur, Kallar, Cheruvathur, Kayyur-Cheemeni,East eleri, Pilicode, West eleri, Kinanoor-karindalam andThrikkaripur panchayats and Nileswar and Kasaragodmunicipalties are predominant agricultural land uses.
5.4.3. PLANTATION LAND USEThis category of Land use include land use
categories of Rubber (R.F), Tea/Cofee/cardomom/Eucalptus, Tea & Eucalyptus, Tea (R.F)/Cofee (RF)/Cardomom(RF), Teak, Teak & Softwood (R.F), Teak (R.F)/Cashew (RF), Eucalyptus (R.F)/ Eucalptus and soft wood(RF)/Sof wood (silver oak), Oil Palm and Oil Palm (R.F)
as per land use data of NREDB.
Plantations are spreaded in most of the east /south east areas of the district. The concentration In-
dex of Plantations is shown in Fig.5.15.
Plantation land uses are concentrated inKumbadaje, Badiyadka, Muliyar, Karadka, Delampadyand Balal panchayats.
5.4.4. WATER BODIES
Water bodies include perennial, Reservoir/Canal, Reservoir Bed/River bed/River island, WaterBodies, and Back waters. The land use is concentratedamong the major river basis which are backwaters
Kumbala, Kalanad, Bekal, Chittari and Kavvai.
Valiyaparamba, Padne, Thrikkaripur, Nileswar,Cheruvathur, Pallikkara, Ajanur, Mogral-Puthur,Bedadka, Chemnad, Muliyar, Kumbala, Manjeswar,Puthige and Mangalpadi panchayats and Kasaragodmunicipality have concentration of water bodies.
5.4.5. RESIDENTIAL LAND USE
The concentration of Residential land use in theDistrict is mainly concentrated in the coastal panchayats, along the Shornur-Mangalore railway line, and in theSouth-east areas. The variation of the concentrationindex of Residential land use where concentrationindex of Residential land use is greater than one is
shown in Fig 5.16.
Mangalpady, Puthige, Mogral Puthur,Chemnad, Udma, Pallikara, Pilicode, Padne,Valiyaparamba, Thrikkaripur, Delampady, Kallar, Balal,Kinanoor-Karindalam and East Eleri panchayats andKasaragod and Kanhagad Municipalities haveconcentration of residential landuse.
Fig 5.15 Concentration of Plantation land use inKasaragod District based on CI
DAKSHINA KANNADA DISTRICTKarnataka State
KANNUR DISTRICT
KODAGU DISTRICTKarnataka State

Department of Town & Country Planning, KeralaDepartment of Town & Country Planning, Kerala
District Urbanisation Report - Kasaragod LAND USE 3535
KODAGUDISTRICT
KarnatakaState
DAKSHINA KANNADA DISTRICTKarnataka State
KANNUR DISTRICT
Concentration index of Residential land use
5.4.6 RESIDENTIAL/AGRICULTURE MIXED LANDUSE
Resi/Agri mixed land use consists of land usecategories of Arecanut, Banana, Banana & Tapioca,Coconut/ coconut & arecanut/coconut & tapioca,Coconut dominant mixed crop, Current fallow, MixedCrop, Rubber, Mixed and Tapioca as per the land usedata of NREDB. Resi / Agri land use is concentrated inthe North/North-west and Southern areas of thedistrict.The variation of the concentration index of Res/Agr. land use where concentration index of Res/Agr. landuse is greater than one is shown in Fig 5.17.
DAKSHINA KANNADA DISTRICTKarnataka State
KODAGUDISTRICTKarnataka
State
KANNUR DISTRICT
Fig 5.17 Concentration of Res/ Agri Mixed land use in
Kasaragod District based on CI
Fig 5.16 Concentration of Index Residential land use in
Kasaragod District based on CI
Eleri panchayats and Kasaragod, Kanhagad andNileshwar Municipalities have concentration of Resi/Agri landuse.
5.4.7. OTHER BUILT UP LAND USEOther built up land use include Commercial, Industrial/Industrial Park and Educational Institutions.
The concentration index of the Other Built up Land Usein the panchayats and Municipalities along the majortransport corridors are higher than that in other areas.The high land area of the district has lesserconcentration of Other Built up Land Uses indicatingthat the economic activity of hill areas is notconsiderably dependent on secondary / tertiary sectors.
Vorkady, Manjeswar, Meenja, Mangalpady, Paivalika,Kumbala, Puthige, Mogral Puthur, Madhur, Badyadka,Chengala, Kumbadaje ,Chemnad, Udma,
Padne,Panthady, Balal, Kinanoor-Karindalam, Ajanur,Cheruvathur, Kayyur-Cheemeni, West Eleri and East

Department of Town & Country Planning, KeralaDepartment of Town & Country Planning, Kerala
LAND USE District Urbanisation Report - Kasaragod3636
From the above Figure it is found that majorcontributor among various crops in Kasaragod Districtis Coconut (25.73%) followed by Areca nut (7.63%),Cashew (4.83%), Paddy (4.23%) and Pepper (2.77%).
Other crops contribute only 1.13%.
In Kasaragod paddy cultivation is very low andthe history tells that all the paddy land were convertedfor coconut cultivation . In recent years whenthe coconut price had gone down due to the cheapcoconut oil import, people have started to switch overto Arecanut, Cashew, Rubber and other cash crops.The cultivations of these crops are mainly done byclearing the forest on the Western Ghats hillslopes. Even in the hill slopes coconut cultivation isdone in terrace. So the agricultural landuse isanalysed further considering these Six maincrops(Coconut, Rubber, Cashew, Arecanut, Paddy andPepper).
5.6 ACTIVITY ZONES BASED ON CONCENTRATION INDEX
The area of concentration of major land usesare analyzed in the above paragraphs. By combiningthe concentration pattern of the major land usesspatially and analysing the resulting pattern, area ofspecialisation (based on the existing land use) of
activities can be delineated.
The other built up land use includescommercial, industrial, institutional etc land uses,higher order functions in short. Fig.5.20 depictsconcentration of agricultural land use against theconcentration of other built up land use. From thefigure clear distinction between areas put intoagricultural activities and commercial/industrialactivities is evident.
The analysis of agricultural, other built up,forest and plantation land uses taken together is
KODAGUDISTRICT
KarnatakaState
DAKSHINA KANNADA DISTRICTKarnataka State
KANNUR DISTRICT
Fig 5.18 Concentration of Other buitl up land use in
Kasaragod District based on CI
Vorkady, Paivalika, Mogral Puthur, Madhur,Chengala,Muliya , Kumbadaje, Bellur, Chemnad,Udma,Pallikara, Pilicode,Padne, Ajanur, Madikai,Cheruvathur,Thrikkaripur and Kasaragod, Kanhagad andNileshwar Municipalities have concentration of Otherbuilt up landuse.
5.5.ANALYSIS OF AGRICULTURAL LAND USEThe agricultural landuse is analyzed further for
all crops within the district. The breakup of agriculturalland use of Kasaragod is shown in fig.5.19
Fig 5.19 Break up of agricultural land use Kasaragod Dist.
7.63 %
4.83 %
0.08 %
2.77 %
4.23 %
25.73 %
1.05 %
Arecanut
Cashew
Rubber
Pepper
Paddy
Coconut
Plantain
Source: Department of Statistics.Kasaragod

Department of Town & Country Planning, KeralaDepartment of Town & Country Planning, Kerala
District Urbanisation Report - Kasaragod LAND USE 3737
Department of Town & Country Planning, KeralaDepartment of Town & Country Planning, Kerala
Fig 5.21 Agricutural other built up, Forest andPlantation land uses
DAKSHINA KANNADA DISTRICTKarnataka State
KODAGUDISTRICT
KarnatakaState
KANNUR DISTRICT
Fig 5.22 Residential and Residential/ Agriculture
mix land uses
DAKSHINA KANNADA DISTRICTKarnataka State
KODAGU DISTRICTKarnataka State
KANNUR DISTRICT
The residential and residential/agriculture mix
land uses are taken together in figure 5.22 . The figureshows ubiquitous nature of homestead agriculture aselsewhere in the state.
Thus the district can be divided to three distinctzones (Figurer 5.23 ) based on the land use analysisUrban activity area, agricultural area and forestresource area.
attempted in figure 5.21. The analysis shows proximityof forest and plantation land uses and their cleardemarcation from agricultural and commercial/industrial land uses.
Fig 5.20 Agricutural and other built up land uses
DAKSHINA KANNADA DISTRICTKarnataka State
KODAGU DISTRICTKarnataka State
KANNUR DISTRICT

Department of Town & Country Planning, KeralaDepartment of Town & Country Planning, Kerala
LAND USE District Urbanisation Report - Kasaragod3838
Fig 5.23 Activity Zones of Kasaragod District
DAKSHINA KANNADA DISTRICTKarnataka State
KODAGUDISTRICT
KarnatakaState
KANNUR DISTRICT
S l.n o . N am e o f lo c al b o d y A c tiv ity zo n e1 BELLUR Fo rest r eso u r ce2 K UM BA D A JE Fo rest r eso u r ce3 M A N G A LP A D Y Ur b an a ct iv ity4 VO R K A D Y Ur b an a ct iv ity5 P UTH IG E Ur b an a ct iv ity6 M EEN JA Ur b an a ct iv ity7 M A N JES W A R Ur b an a ct iv ity8 K UM BA LA Ur b an a ct iv ity9 P A IVA LIK E Ur b an a ct iv ity
10 EN M A K A JE A g ric u lt u ra l11 BA D IYA D K A A g ric u lt u ra l12 M ULIYA R A g ric u lt u ra l13 K A R A DK A A g ric u lt u ra l14 D ELA M P A D Y Fo rest r eso u r ce15 CH EN G A LA Ur b an a ct iv ity16 CH EM N A D Ur b an a ct iv ity17 BED A D K A A g ric u lt u ra l18 M A D H UR Ur b an a ct iv ity19 M O G R A L P UTH UR Ur b an a ct iv ity20 K UTTIK O LE Fo rest r eso u r ce21 UDM A Ur b an a ct iv ity22 A JA N UR Ur b an a ct iv ity23 BA LA L Fo rest r eso u r ce24 K O D O M -B ELLUR A g ric u lt u ra l25 M A D IK A I Ur b an a ct iv ity26 P A LL IK K A R A Ur b an a ct iv ity27 P A N A TH A D Y Fo rest r eso u r ce28 P ULLUR P ER IYA A g ric u lt u ra l29 K A LLA R A g ric u lt u ra l30 CH ERUVA TH UR Ur b an a ct iv ity31 K A YYUR -CH EEM EN I A g ric u lt u ra l32 N ILES HW A R Ur b an a ct iv ity33 EA S T ELE RI Ur b an a ct iv ity34 P ILICO D E A g ric u lt u ra l35 W ES T E LER I Ur b an a ct iv ity36 K IN A N O O R-K A RIN D A LA M A g ric u lt u ra l37 TH RIK K A RIP UR Ur b an a ct iv ity38 P A D N E Ur b an a ct iv ity39 VA LIYA P A R A M B A A g ric u lt u ra l40 K A S A R A GO D Ur b an a ct iv ity41 K A N H A N GA D Ur b an a ct iv ity
Table 5.6 Table showing Activity ZonesofKasaragod District
5.7. INFERENCEThe overall land use pattern of the district is
not much in variance with the land use pattern of thestate. A large extent of neutral land use indicates avail-ability of land for future economic and physical growth.A dispersed residential and agricultural mixed growth
is evident as elsewhere in the state. The agricultural activ-ity zone is mostly in the high land and mid land. The urbandevelopment has taken place mostly on the coastal stripand the west part of the mid land. Secondary level growthcentres have developed mostly in the mid land area.
admin
Text Box
< CONTENTS >
admin
Text Box
CHAPTER 6 >>

Department of Town & Country Planning, KeralaDepartment of Town & Country Planning, Kerala
District Urbanisation Report - Kasaragod FUNCTIONAL CHARACTER OF SETTLEMENTS 3939
Chapter -6FUNCTIONAL CHARACTER OF SETTLEMENTS
1 BELLUR RURAL2 KUMBADAJE RURAL3 MANGALPADY RURAL4 VORKADY RURAL5 PUTHIGE RURAL6 MEENJA RURAL7 MANJESWAR RURAL8 KUMBALA RURAL9 PAIVALIKE RURAL10 ENMAKAJE RURAL11 BADIYADKA RURAL12 MULIYAR RURAL13 KARADKA RURAL14 DELAMPADY RURAL15 CHENGALA RURAL16 CHEMNAD RURAL17 BEDADKA RURAL18 MADHUR RURAL19 MOGRAL PUTHUR RURAL20 KUTTIKOLE RURAL21 UDMA RURAL22 AJANUR SEMIRURAL23 BALAL RURAL24 KODOM-BELLUR RURAL25 MADIKAI RURAL26 PALLIKKARA SEMIRURAL27 PANATHADY RURAL28 PULLUR PERIYA RURAL29 KALLAR RURAL30 CHERUVATHUR RURAL31 KAYYUR-CHEEMENI RURAL32 NILESHWAR RURAL33 EAST ELERI RURAL34 PILICODE RURAL35 WEST ELERI RURAL36 KINANOOR-KARINDALAM RURAL37 THRIKKARIPUR RURAL38 PADNE SEMIRURAL39 VALIYA PARAMBA RURAL40 KASARAGOD URBAN41 KANHANGAD SEMIRURAL
Name of PanchayatsFn
ClassificationSl. No
6.1 CHARACTER OF SETTLEMENTSThe function of a settlement is the major activity
within the settlement, be it agricultural and allied activity(rural) or secondary sector and tertiary sectoractivities(urban activities). Here an attempt is made todetermine the major function of a settlement by study-ing the major land use and the average plot size withinthe settlement.
In the Kerala context, a ward or a local body willbe having either pucca urban area, pucca rural area ormixed (Residential cum agricultural) land use area inseparate or in combination. Also the mixed land usearea can be further classified into – Urban, semi urban,semi rural and rural based on the average plot size. Whenthe total area of a ward or local body is concerned, thepredominance of any of the four (urban land use, ruralland use, semi urban or semi rural) determines thecharacter of the area.The character of an area can be termed as urban:1.If the pucca urban land use is >= 25% of the total area.2.If the urban land use (taking to account the classificationof mixed land use) share is >= 50% of the total area.The character of an area can be termed as rural:1.If the pucca rural land use is > 50% of the total area.2.If the rural land use (taking to account the classificationof mixed land use) share is >= 50% of the total area.The character of an area can be termed as Semi urban:1.Urban land use share + semi urban residential landuse (mixed land use in classified as semi urban)is >= 50% of the total area.The character of an area can be termed as Semi rural:1. Rural land use share + mixed land use is categoryof as semi rural >= 50% of the total area.
The functional character of Grama Panchayatsin Kasaragod district is shown in Table 6.1 and Fig 6.1.
Table 6.1 Functional character of settlements
admin
Text Box
<< CHAPTER 5
admin
Text Box
< CONTENTS >

Department of Town & Country Planning, KeralaDepartment of Town & Country Planning, Kerala
FUNCTIONAL CHARACTER OF SETTLEMENTS District Urbanisation Report - Kasaragod4040
2. If the pucca land useshare is at least 1/3rd of thetotal area and the mixedland use is not urban or semiurban.
6.2 INFERENCE
Thirty six (out of fourtyone settlements) are classifiedas rural- Four settlements(Pallikara, Ajanur, Padne, andKanhagad are on transition-classified as Semi Rural andonly one settlement–Kasaragod -is qualified asurban. This shows thecomparatively lower level ofurbanisation of the district. Fig 6.1.Functional Character of settlements
DAKSHINA KANNADA DISTRICTKarnataka State
KODAGU DISTRICTKarnataka State
KANNUR DISTRICT
admin
Text Box
CHAPTER 7 >>
admin
Text Box
< CONTENTS >

District Urbanisation Report - Kasaragod HIERARCHY OF SETTLEMENTS 4141
Department of Town & Country Planning, KeralaDepartment of Town & Country Planning, Kerala
7.1 EXISTING HIERARCHY OF SETTLEMENTSCumulative functional Index (CFI) method is used
to find out the Hierarchy of Settlement. The CFI of asettlement is assessed based on the number and presenceof the following types of facilities in the settlement.1. Educational facilities2. Health facilities3. Market4. Facilities in agriculture5. Physical Infrastructure facilities6. Transportation facilitiesWeightage of each of the facilities in the district andCFI calculated based on this is given in table 7.1.
Sl. No LSGs Name CFI
Sl. No LSGs Name CFI
Sl. No LSGs Name CFI
1 Kumbadaje 19.34 15 Kuttikole 35.5 29 Kayyur-cheemeni 57.02
2 Vorkady 21.14 16 Panathady 35.67 30 Pullur periya 57.56
3 Puthige 21.28 17 Kallar 36.63 31 Udma 62.12
4 Bellur 22.26 18 Kodom-bellur 37.68 32 Ajanur 69.47
5 Meenja 23.1 19 Muliyar 39.69 33 East eleri 70.09
6 Valiya paramba 23.13 20 Enmakaje 40.02 34 Chemnad 71.657 Mogral puthur 26.84 21
Kinanoor-karindalam 40.02 35 Chengala 72.43
8 Badiyadka 28.55 22 Paivalike 43.58 36 West eleri 72.569 Madhur 31.6 23 Karadka 45.4 37 Cheruvathur 76.04
10 Pilicode 34.31 24 Kumbala 46.54 38 Thrikkaripur 101.7211 Madikai 34.67 25 Padne 48.64 39 Nileshwar(M) 104.86
12 Delampady 34.71 26 Manjeswar 52.18 40 Kanhangad (M) 190.18
13 Bedadka 34.72 27 Mangalpady 53.66 41 Kasaragod (M) 228.3414 Balal 34.78 28 Pallikkara 56.65
Fig. 7.1. CFI Vs Frequency graph
I. First Order settlementKasaragod Municipality.
II. Second Order SettlementKanhangad Municipality.
III Third Order settlementThrikkarpurNileshwar
IV Fourth Order settlement
CFI is plotted against the number of settlements to findout the hierarchy of settlement in the District. The graph,so obtained is shown in figure 7.1. While plotting thegraph Kasaragod Municipality is not taken in to accountbecause of its very high CFI, which will make it difficult toassess the hierarchy of lower order settlements of theDistrict from the graph. Hence, the second order and otherlower order settlements are identified in the graph.
Chapter - 7HIERARCHY OF SETTLEMENTS
Table.7.1 CFI Calculation Sl.No. LSGs Name
1 Manjeswar2 Mangalpady3 Pallikkara4 Cheemeni5 Pullur Periya6 Udma7 Ajanur8 East Eleri9 Chemnad10 Chengala11 West Eleri12 Cheruvathur
admin
Text Box
< CONTENTS >
admin
Text Box
<< CHAPTER 6

HIERARCHY OF SETTLEMENTS District Urbanisation Report - Kasaragod4242
Department of Town & Country Planning, KeralaDepartment of Town & Country Planning, Kerala
Fig. 7.2 The spatial distribution of the settlements.
Fig.7.3. Spatial Distribution of settlements of differenthierarchies
7.2 SUGGESTED HIERARCHY OF SETTLEMENTSA) METHODOLOGY ADOPTED
The following methodology was adopted tosuggest the proposed hierarchy.
According to Crystallor’s Central place theoryspatial distribution of settlements of varioushierarchies shall be centrally located (as far as possible)with respect to the service area or service populationto be served. Theoretically speaking, there will be onefirst order settlement serving the entire region(District). The service area of a settlement is hexagonalin shape as per Crystallor’s theory. But practically inthe case of Kasaragod, the service area of the first ordersettlement (Kasaragod Municipality being the only one)cannot be taken as hexagonal but it is actually the entiredistrict. This puts a limitation on the identification ofsecond order settlements by Crystallor’s Central Place
DAKSHINA KANNADA DISTRICTKarnataka State
KODAGUDISTRICT
KarnatakaState
KANNUR DISTRICT
From the above it is obtained that there is onesecond order settlement with CFI between 150 and 300,two third order settlements with CFI between 100 and150, twelve fourth order settlements with CFI between50 and 100, twenty five fifth order settlements withCFI between 0 and 50. The names of the settlements invarious hierarchies are as identified above.
V. Fifth Order settlement
Sl. No. LSGs Name Sl. No. LSGs Name Sl. No. LSGs Name
1 Kumbadaje 10 Pilicode 19 Muliyar2 Vorkady 11 Madikai 20 Enmakaje3 Puthige 12 Delampady 21 Kinanoor-karindalam4 Bellur 13 Bedadka 22 Paivalike5 Meenja 14 Balal 23 Karadka6 Valiya paramba 15 Kuttikole 24 Kumbala7 Mogral puthur 16 Panathady 25 Padne8 Badiyadka 17 Kallar9 Madhur 18 Kodom-Bellur

District Urbanisation Report - Kasaragod HIERARCHY OF SETTLEMENTS 4343
Department of Town & Country Planning, KeralaDepartment of Town & Country Planning, Kerala
settlements . This means that in the proposal also thefirst order settlement is invariably taken as KasaragodMunicipality. Kanhangad Municipality is taken as the IIorder settlement. The first order settlement and thesecond order settlement are marked in the district mapand it is shown in Fig 7.4. From the figure it is clear thatthere are no existing second order settlements fromSouth -East and North - East division of the region. Asper Cryastallor’s theory the lower order settlementswill be placed at the vertices of the hexagonal servicearea of the higher order. This cannot be applied here asthe entire district is assumed as the service area of thefirst order settlement (Kasaragod Municipality). willbe placed at the vertices of the hexagonal service areaof the higher order. This cannot be applied here as theentire district is assumed as the service area of the firstorder settlement (Kasaragod Municipality).
Fig 7.4. Existing 1st & IInd Order Settlements
DAKSHINA KANNADA DISTRICTKarnataka State
KODAGUDISTRICT
KarnatakaState
KANNUR DISTRICT
theory. The Crystallor’s Central Place theory stipulatesthat the lower order settlements are placed at thevertices of the hexagonal shaped service area of thehigher order settlement. But here the service area ofthe first order settlement is the entire district and henceit is assumed that there are at least four second ordersettlements one from each of the sub regions (North-East division, North-West division, South-West divisionand South-East division) of the district. The service areasof the second order settlements are delineated bydrawing the perpendicular bisectors to the straight lineconnecting the second order settlements. This area mayform a hexagon or part of hexagon in shape. The verticesof the hexagon determine the location of the next lowersettlements i.e. the third order settlement. The servicearea of the third order settlement can be delineated ashexagonal in shape. The remaining settlements of theDistrict are assumed to be having the lowest order, i.e.the fourth order.B). PROCEDURE ADOPTED IDENTIFICATION OFSECOND ORDER SETTLEMENTS
While assessing the proposed hierarchy ofsettlements of the District after 20 years (based on themethod explained earlier), the existing hierarchy ofthe settlements, especially of those settlements withhigher order, cannot be shuffled altogether. Theexisting hierarchy of the settlements in KasaragodDistrict show that the settlements here falls under fivehierarchies viz. I order settlement, II Ordersettlements, III order settlements, IV Ordersettlements and V order settlements. Thosesettlements in the first three orders as per the existinghierarchy of settlements are taken as such with a slightmodification while identifying the proposed hierarchyof settlements. The modification is that the existing IIand III order settlements are combined together andtaken as the second order settlements in the proposedhierarchy of settlements because there is lessdifference between the weightage value of these two

HIERARCHY OF SETTLEMENTS District Urbanisation Report - Kasaragod4444
Department of Town & Country Planning, KeralaDepartment of Town & Country Planning, KeralaFig 7.5: Projected 2nd order settlements
In order to identify the service area of each ofthe second order settlements, perpendicular bisectorsare drawn (in accordance with the Crystallors theory)from the line joining nearest second order settlementsand the polygon formed with centre as the second ordersettlements are taken as service area of the secondorder settlement under consideration (see fig 7.6).Usually a higher order settlement fulfils the secondorder needs of the surrounding settlements. That isthe first order settlements usually function as secondorder settlement also. And hence, though the servicearea of the second order settlements are delineatedas described above, this has to be readjusted taking into account the service area of the first order settlement.When, it functions as a second order settlement.
The service areas of various second ordersettlements and the population served is given in table7.2 below.
Fig 7.6 Service area of IInd order Settlements
DAKSHINA KANNADA DISTRICTKarnataka State
KODAGU DISTRICTKarnataka State
KANNUR DISTRICT
DAKSHINA KANNADA DISTRICTKarnataka State
KODAGU DISTRICTKarnataka State
KANNUR DISTRICT
And hence a second order settlement is identified fromSouth -East and North -East division based on thefollowing criteria1. Administrative status of the settlements2. Centrality3. Connectivity4. Existing hierarchy(The methodology to assess the relative values ofcentrality and connectivity is explained in Annexe-7).The settlements with maximum preferred values in theabove criteria in each of the division are taken as thesecond order settlement from the division (SeeAnnexe-3). Accordingly Karadka from the N-E divisionand West Eleri from the S-E division are identified asthe second order settlements. The second ordersettlements are1. Kasaragod 2. Kanhangad3. Karadka 4. West EleriThe spatial distribution of the second order settlementsare given in fig 7.5.

District Urbanisation Report - Kasaragod HIERARCHY OF SETTLEMENTS 4545
Department of Town & Country Planning, KeralaDepartment of Town & Country Planning, Kerala
Table 7.2 Second order settlements, their service area & service population
2001 2021 2021 20211 Chemnad 20585 54381 40.112 Chengala 36942 54432 53.793 Kasaragod (M) 47967 59728 16.684 Kumbala 23642 45582 40.185 Madhur 45578 38405 26.046 Mangalpady 32325 49207 36.37 Manjeswar 20584 41921 24.48 Meenja 39663 23360 44.919 Mogral Puthur 22307 25089 14.24
10 Pallikkara 32211 45009 39.0911 Puthige 25806 21669 39.6112 Udma 19005 39747 24.541 Badiyadka 14173 35409 67.792 Bellur 19095 11481 64.593 Delampady 31181 25745 49.854 Enmakaje 31203 29989 78.235 Karadka 22687 22799 41.176 Kumbadaje 22109 16083 31.037 Muliyar 26816 25336 34.278 Paivalike 22609 35384 72.519 Vorkady 52634 27059 45.41 Balal 43362 26568 93.22 East Eleri 26427 27936 62.523 Kallar 22327 21745 60.834 Kuttikole 35026 26829 665 Panathady 24618 25314 79.796 West Eleri 65503 33534 77.451 Ajanur 10117 51721 27.832 Bedadka 23845 30250 85.493 Cheruvathur 40168 29111 18.374 Kanhangad (M) 20091 74332 39.545 Kayyur-Cheemeni 47922 25656 72.76 Kinanoor-Karindalam 26657 29284 77.497 Kodom-Bellur 33843 36682 95.448 Madikai 23412 23358 51.839 Nileshwar 19162 36553 26.23
10 Padne 25653 21567 13.3911 Pilicode 23338 26484 26.7712 Pullur Periya 29551 30430 63.25
Sl. NoSecond Order Settlements
NumberService Settlements
Karadka
242507
Population Area (Sq. km)
4 Kanhangad (M) 371693
Total Service Population
3 West Eleri
217263
1 Kasaragod (M)
366615
2
498530
229285
161926
469823

HIERARCHY OF SETTLEMENTS District Urbanisation Report - Kasaragod4646
Department of Town & Country Planning, KeralaDepartment of Town & Country Planning, Kerala
C). IDENTIFICATION OF THIRD ORDER SETTLEMENTS.As per Crystallor’s theory, the lower order settlementswill fall in the vertices of the hexagonal service area ofthe higher order settlements. This means that the thirdorder settlements will be those settlements coincidingwith the vertices of the hexagonal service area of thesecond order settlements. The settlements falling inthe vertices of the polygon are Kodom Bellur and PullurPeriya. These settlements are adjusted after comparingthe existing hierarchy of nearby settlements. KodomBellur and Pallikkara are taken as the third ordersettlements. Theoretically the service area of each ofthese third order settlements will be uniform andhexagonal in shape. Four hexagonal of equal shapewith the third order settlement as the centre are fixed.As per Crystallor’s theory the higher order settlementswill function as the lower order settlements as well.And hence the service area of the higher ordersettlements (of first order settlements and the second
Fig 7.8 Service area of the 3rd order includingproposed (Adjusted)
In order to identify the service settlements, thepolygons so formed are adjusted for the administrativeboundary of the settlements close to the polygon.The service settlements of the third order settlementsare shown in fig 7.8 below and the same with theserved population is shown in table 7.3.
DAKSHINA KANNADA DISTRICTKarnataka State
KODAGU DISTRICTKarnataka State
KANNUR DISTRICT
Fig 7.7 Service area of the 3rd order settlements (Adjusted)
KODAGU DISTRICTKarnataka State
KANNUR DISTRICT
DAKSHINA KANNADA DISTRICTKarnataka State
order settlements), when it function as the third ordersettlement also are to be delineated. The service areaof these higher order settlements is also hexagonal inshape. The third order settlements (including thehigher order settlements) and their service areas areso delineated. The spatial distribution of the third ordersettlements and the adjusted service area are shownin (Fig 7.7). The third order settlements are:1. Mangalpady 6. Thrikkaripur2. Pallikara3. Kodom Bellur4. Panathady5. Kayyur-Cheemeni

District Urbanisation Report - Kasaragod HIERARCHY OF SETTLEMENTS 4747
Department of Town & Country Planning, KeralaDepartment of Town & Country Planning, Kerala
Table 7.3 Service Area of Third Order Settlements & Service Population
Sl. No Third Order Settlements Number Service Settlements2001 2021 (Sq. Km) 2001 2021
1 Kumbala 23642 45582 40.182 Mangalpady 32325 49207 36.33 Manjeswar 20584 41921 24.44 Meenja 39663 23360 44.915 Puthige 25806 21669 39.616 Paivalike 22609 35384 72.517 Vorkady 52634 27059 45.41 Chengala 36942 54432 53.792 Kasaragod (M) 47967 59728 16.683 Madhur 45578 38405 26.044 Mogral Puthur 22307 25089 14.241 Badiyadka 14173 35409 67.792 Bellur 19095 11481 64.593 Delampady 31181 25745 49.854 Enmakaje 31203 29989 78.235 Karadka 22687 22799 41.176 Kumbadaje 22109 16083 31.037 Muliyar 26816 25336 34.271 Chemnad 20585 54381 40.112 Pallikkara 32211 45009 39.093 Udma 19005 39747 24.544 Ajanur 10117 51721 27.835 Pullur Periya 29551 30430 63.251 Kallar 22327 21745 60.832 Bedadka 23845 30250 85.493 Kodom-Bellur 33843 36682 95.441 Kuttikole 35026 26829 662 Panathady 24618 25314 79.791 Balal 43362 26568 93.22 East Eleri 26427 27936 62.523 West Eleri 65503 33534 77.451 Kayyur Cheemeni 47922 25656 72.72 Kinanoor Karindalam 26657 29284 77.493 Pilicode 23338 26484 26.771 Cheruvathur 40168 29111 18.372 Kanhangad (M) 20091 74332 39.543 Madikai 23412 23358 51.834 Nileshwar 19162 36553 26.23
8 Kayyur-Cheemeni
9 Kanhangad (M)
5 Kodom-Bellur
6 Panathady
7 West Eleri
102833 163354
1 Mangalpady
2 Kasaragod (M)
3 Karadka
4 Pallikkara
59644 52143
135292 88038
97917 81424
167264 166842
111469 221288
80015 88677
Population Area Total Service Population
217263 244182
152794 177654
1 Padne 25653 21567 13.39 73587 759622 Thrikkaripur 35897 40736 23.313 Valiya Paramba 12037 13659 16.14
10 Thrikkaripur

HIERARCHY OF SETTLEMENTS District Urbanisation Report - Kasaragod4848
Department of Town & Country Planning, KeralaDepartment of Town & Country Planning, Kerala
7.3 CHARACTER OF HIGHER ORDER SETTLEMENTS
The term character of a settlement, meanswhether it possess urban nature, semi urban nature,semi rural or rural nature. The character of the higherorder settlements is given in Annexe 3.
Fig 7.9 Proposed Hierarchies of Settlements
KANNUR DISTRICT
DAKSHINA KANNADA DISTRICTKarnataka State
KODAGU DISTRICTKarnataka State
There are 10 higher order settlements and inwhich 2 only are in urban nature viz Kasaragodmunicipality and Kanhangad municipality. AlthoughKaradka and West Eleri are Rural settlements, theyare shown in the category of 2nd order settlements, asthey fall under the North-East and South-Eastquadrants.
7.4 INFERENCE
The organic growth of settlements in thedistrict can be explained in the backdrop ofphysiographical features and the development ofconnectivity options. A north – south corridor is veryprominent (in the form of railway line and nationalhighway) in the state and the situation is not differentin Kasaragod district also. The major limitation inapplying Crystallor’s theory in this region is theundulating terrain and clearly identifiablephysiographical divisions violating the basicassumption of plain terrain with easy accessibility informulating the theory. However, within this limitation,the order of the settlements is projected. The firstorder and third order settlements are almost same asthose evolved through organic growth. Thedevelopment of second order settlements, especiallyKaradka and West Eleri needs conscious efforts, mainlyin the development of East – West connectivity.
admin
Text Box
< CONTENTS >
admin
Text Box
CHAPTER 8 >>

Department of Town & Country Planning, KeralaDepartment of Town & Country Planning, Kerala
District Urbanisation Report - Kasaragod URBAN PROFILE 4949
Trends of population growth of Kerala –1981-2001
Chapter-8URBAN PROFILE
8.1 TREND OF URBANIZATION - KERALA
At the turn of the 21st century, Kerala had apopulation of 63.96 lakhs, of which 59.42 lakhs were inits rural areas (Source census 2001,). This constituted92.89 per cent of the total population of the state. Atthe end of the 20th century the total population inKerala has increased to 3.18 crores (31838619) of whichrural population is 2.35 crores . This means that therural population constitutes about 74% of the totalpopulation on 2001. The population figures of the State
as per census 2001 are shown in the table 8.1
Population figures (2001) of Kerala at a glance.
Person Males Females Growth rateTotal 31838619 15468664 16369955 9.42Rural 23571484 11450785 12120699 10.05Urban 8267135 4017879 4249256 7.64
Source: Census 2001
There is an increase of about 400% in the totalpopulation of Kerala within a century. During thisperiod rural population has increased by 300%. Ruralpopulation content in kerala has declined from 92.89%to 74% of the total population within a century. This isan indication on the trend of urbanization in Keralathat has happened in a century. The population figuresof the last three decades are analysed (see table 8.2).
Source: Census 2001
Table 8.2 Showing Trends of population growth of Kerala 1981-2001
Year Total populationGrowth rate of
total populationGrowth rate in urban
population
1981 25453680 19.24 37.641991 29098518 14.32 60.972001 31838619 9.42 7.64
There is a steady decline in the populationgrowth rate over the last three decades. Populationgrowth rate was 19.24% in 1981 and it reduced to 9.24%in 2001. During the period 1981-91 a population of 36.45lakhs was added to the previous decade’s population,whereas during the period 1991-2001 a population ofonly 27.4 lakhs was added within the next decade. Thegrowth rate of urban population of Kerala over the lastthree decades shows that it is in a transition phase.Over the last two decades (1971-81 and 1981-91) growthrate in urban population was on the rise, 37.64% in 1981and 60.97% in 1991. But the urban population growthrate has drastically declined to 7.64% in 2001 with adecrease of 87.5% over the preceding decadal urbanpopulation growth rate.
Trends in urbanization of Kerala –1981-2001.Total Total urban Percentage of Growth rate of Growth rate in
population population urban population total population urban population1981 25453680 4771275 16.74 19.24 37.041991 29098518 7600294 26.89 14.82 60.972001 31833610 8267135 25.07 0.42 7.64
Year
Source: Census: 2001
Table 8.3 showing Trends in urbanizationof Kerala –1981-2001
Fig: 8.1 showing Trends in urbanization of Kerala –1981-2001
Table 8.1 Showing Population of Kerala in 2001
admin
Text Box
< CONTENTS >
admin
Text Box
<< CHAPTER 7

Department of Town & Country Planning, KeralaDepartment of Town & Country Planning, Kerala
URBAN PROFILE District Urbanisation Report - Kasaragod5050
Fig: 8.2 Total urban population during various decades
At the same time the growth rate in totalpopulation has decreased from 14.32% to 9.42% onlywith a decrease rate of 34.2%. This indicates that overthe last decade there is back wash of population intothe rural area. This is an indicator to the planners totake the planning of rural areas with more concern thanbefore and subsequently address the reasons for thebackwash of population to rural areas.
8.2. URBAN AREAS IN THE DISTRICTAs per the 2001 census, the population of
Kasaragod District is 1203342 which constitute about3.78% of the total population of the State. Of the totalpopulation of the Kasaragod District 233745 is urbanpopulation. That is 19.41% of the total population ofthe District is in the census urban area of the District.There are 10 urban areas. There are Kasaragod andKanhangad Municipalities and 5 Census townsBangraManjeshwar, Hosabettu, Manjeshwar, Kuduluand Udma. Further there are 3 Urban Outgrowthcentres, Cheruvathur, Perole and Nileshwar. The censusurban areas of Kasaragod District are shown in the figure8.3
Fig.8.3 District map showing Municipal census townand Urban agglomeration
The urban population of Kerala state is 26%, whereasthat of the District is 18%. On comparing the urbancontent of all the 14 District of the State, it can be seenfrom the table 8.4. that Kasaragod District is positionedin the 7th rank. This shown that the process ofurbanization is rather slow in Kasaragod District.in the7th rank. This shows that the process of urbanizationis rather slow in Kasaragod District.
District Urban Rural Total % UrbanKannur 1212898 1196058 2408956 50.3 1Ernakulam 1477085 1628713 3105798 47.6 2Kozhikode 1101157 1777974 2879131 38.2 3Trivandrum 1091661 2142695 3234356 33.8 4Alappuzha 621457 1487703 2109160 29.5 5Thrissur 839433 2134799 2974232 28.2 6Kasaragod 233745 969597 1203342 19.4 7Kollam 465078 2110230 2585208 18 8Kottayam 200808 1653833 1953646 15.3 9Palakkad 356575 2260907 2617482 13.6 10Pathanamthitta 123798 110218 1234016 10 11Malappuram 356170 3269301 3625471 9.8 12Idukki 57593 1071628 1129221 5.1 13Wayanad. 29612 751007 780619 3.8 14
Population-2001 Urban content Rank-2001
Table 8.4 District wise percentage of urban population
DAKSHINA KANNADA DISTRICTKarnataka State
KODAGU DISTRICTKarnataka State
KANNUR DISTRICT
8.3. URBAN POPULATION CONTENT (EXISTING)The process of urbanization of an area can be
assessed in relation to its urban population content.

Department of Town & Country Planning, KeralaDepartment of Town & Country Planning, Kerala
District Urbanisation Report - Kasaragod URBAN PROFILE 5151
Fig 8.4 Decadal variation of urban population, Kasaragod
8.4 GROWTH RATE OF URBAN POPULATION
The graph above (see fig 8.4) shows the decadalvariation in the urban population of Kasaraod District (forselected areas only) from 1971 to 2001.The total Urbanpopulation of the District has increased from 113929 to 233745in a period of four decades. The variation during this periodwas not uniform. A decrease in the urban population isobserved from 1971 to 1981, but during the period from 1991to 2001 there is an increase in the urban population.
The graph (see fig 8.5) shown below depictsthe growth rate of urban population against the growthrate of population over the last three decades in theDistrict. When the population growth rate of theDistrict has declined from 22.78 to 12.37, the urbanpopulation growth rate has decreased from 308.53 to32.61 during the same period (1991-2001) indicating apossibility of migration of population from the urbanareas of the District. The growth rate of urbanpopulation has come down from an abnormalpercentage of 308.53 during 1981-1991 to 32.61
percentage during 1991-2001. The main reason for theabnormal urban growth rate in 1991 was due toclassification of several villages as towns.
Analysing the above graphs, we shall come to aconclusion that there was an in-migration to the urbanarea during 1981-91 for better job opportunities and livingenvironment. But, during 1991-01 either the additionaljob opportunities created was just enough for the normalgrowth of population living inside the urban areas or theextra work population were unable to settle in the urbanarea due to lack of residential facilities inside the urbanarea. The growth of urban population of the State showsthe pattern of shrinking of urban population growth ratefigures during 1981 to 2001.
The following table compares the growth rateof urban population of the State and the District. Thisshows that there is a huge decline in the growth rate ofurban population of Kerala, more or less the samepattern is seen here in Kasaragod also.
1981-91 1991-01Kerala 60.89 7.69
Kasaragod 308.53 32.61
Table 8.5 Growth rate of urban population – Comparison with state
8.5 .URBAN SETTLEMENTS – FROM 1971 TO 2001The number of urban settlements is given in
table 8.6. The total area was 125.5 sq.km in 2001. From1991 to 2001 it has increased from 7 to 10. In the areaalso there was an increase from 104.78 to 125.5 sq.km.It can be concluded that the level of urbanization ofthe State shows a declining trend in general. KasaragodDistrict shows a high level of urbanization whencompared to the State average. And also, the level ofurbanization shows a slight inclining trend within theDistrict. The urban areas of the district shows lowergrowth rate of population whereas the rural areassurrounding the urban areas show significantly higherFig 8.5: Map showing Population Growth
Rate- Comparison with District

Department of Town & Country Planning, KeralaDepartment of Town & Country Planning, Kerala
URBAN PROFILE District Urbanisation Report - Kasaragod5252
Census year
Total number of Urban area
Municipal Towns
Non municipal towns
Urban out growth
Census Town
Total area (sq km)
1971 5 1 4 0 0 98.11981 5 4 0 1 0 16.671991 7 2 0 1 4 104.782001 10 2 0 3 5 125.5
Table 8.6 Number of urban areas
A.CRITERIA-1: CENSUS URBAN AREAA study on the existing occupational structure
in various settlements of the District will put light onthose settlements likely to become census urbanshortly. The workers of each settlement which areclassified in to four fold classification as per census 2001are divided in to the following nine categories basedon the workers classification in the 1991 census.
1.Main Cultivators2.Main Agricultural Laborers3.Livestock, Forestry, Fishing, Hunting, Plantation, Orchards, and allied activates4. Mining and Quarrying5. Manufacturing, Processing, Servicing and repairs in Household industries6. Manufacturing, Processing, servicing and repairs in other than household industries7. Trade and commerce8. Transport storage and Communications9. Others
The methodology adopted for theextrapolation to get the nine fold classification ofworkers in 2001 based on the workers classification incensus1991 is described briefly here. The only twotypes of workers included in both 1991 and 2001 censusare the cultivators and agricultural labourers. Theremaining two types of workers in the 2001 census,House hold industrial workers and other workers aretotalled together and this total is divided in to 7 classesof workers in the same proportion as these 7 classes ofworkers as there in the 1991 census. Then the numberof male workers in manufacturing, processing, servicingand repairs in House hold industries, manufacturing,processing, servicing and repairs in other than household industries, trade & commerce, transport, storage
8.6. FUTURE URBANIZATION PROFILE OF THE DISTRICTThe analysis of the occupational structure of
the District shows that the production sectors- i.e., theagriculture and industrial sector, shows declining trendin the district. The only sector, which shows growth, isthe service sector. More than 50% of the total urbanpopulation depends on the service sector for theirlivelihood. It is observed that rural area of the districtis also slowly withdrawing from the primary sector andstarted depending more on the service sector. Becauseof this shift in the occupational structure some of therural areas will be having more than 75 % of the maleworkers in the non-agricultural category in the nearfuture and hence will fall in the category of censusurban. Hence there may be significant increase in theurban populations as well as in the extent of urbanareas of the District in the future, though the urbanpopulations content of the existing urban areas show adecreasing trend. In the following paragraphs, thefuture urban local bodies are delineated based on the
three fold census classification as per census 2001, andthe result are further iterated with the factors likeimpact of proposed urban development projects, gradeof the local bodies and hierarchy of settlements.
growth rate indicating possible out migration of peoplefrom the urban areas to the surrounding rural areas.From the above study it is clear that the level ofurbanization of the State shows a decreasing trend ingeneral Kasaragod District shows a high level ofurbanization when compared to the State average. Andalso, the level of urbanization shows a slight incliningtrend within the District. The urban areas of the districtshows lower rate of population whereas the rural areassurrounding the urban areas show significantly highergrowth rate indicating possible out migration of peoplefrom the urban areas to the surrounding ruralsettlements.

Department of Town & Country Planning, KeralaDepartment of Town & Country Planning, Kerala
District Urbanisation Report - Kasaragod URBAN PROFILE 5353
Table 8.7 List of Local Bodies
Sl. No LSGs Name Sl. No LSGs Name1 Mangalpady 10 Cheruvathur2 Vorkady 11 Nileshwar3 Meenja 12 Thrikaripur4 Manjeswar 13 Kasaragod (M)5 Chengala 14 Kanhangad (M)6 Madhur7 Mogral Puthur8 Uduma9 Pallikkara
The classification of an area into urbandepending 9 fold classifications of workers obtainedout of a mere extrapolation of the census 2001 databased on the previous decades data can’t be taken asvery accurate. Though it gives a near accurate pictureabout the trend of urbanization, some other factorslike the extent of physical and economic development,future in urban development projects and existinghierarchy of settlements needs to be considered.
B. CRITERIA 2: GRADE OF LOCAL BODIESThe grading of local bodies is given comparing
their physical and economical development. So herein the absence of direct data to assess the physical andeconomic development, the grade of Panchayat canbe taken as a proxy indicator to measure the physicaland economic development of the local body.Out of the 14 Panchayats listed based on criteria one, 9are special grade Panchayats.The remaining areexcluded from the selected local bodies and the list of
local bodies after the exclusion are noted down.1. Mangalpady2. Manjeswar3. Chengala4. Madhur5. Mogral puthur.6. Uduma7. Pallikkara.8. Cheruvathur9. Neeleswar10. Kanhangad.(M)11. Kasaragod (M}
Before finalizing the future urban local bodiesof the District, the urban development Project of theDistrict and its impact are also to be studied.
Fig 8.6: Map showing Grade of Local Bodies
DAKSHINA KANNADA DISTRICTKarnataka State
KODAGUDISTRICTKarnataka
State
KANNUR DISTRICT
& communication and others are totalled to calculate thepercentage of male workers in non-agricultural activitiesin each of the local bodies of the District. In order to avoidthe possibility of error, i.e. exclusion of some of the actualurban area, the extrapolation of the data on classificationof workers based on 1991 census, the local bodies withnon agricultural male workers more than 70% (instead of75%) is taken for the study. Based on this, there are 14local bodies identified in the District, which are satisfyingthe three-fold census classification to be termed as urban.The list of which is given below.

Department of Town & Country Planning, KeralaDepartment of Town & Country Planning, Kerala
URBAN PROFILE District Urbanisation Report - Kasaragod5454
1. Mangalpady2. Manjeswar3. Chengala4. Madhur5. Mogral puthur.6. Uduma7. Pallikkara.8. Cheruvathur9. Neeleswar10. Kayyur Cheemeni.11. West Eleri12. Karadka
Clearly the above local bodies define the future urbanprofile of the District (fig 8.7).
Fig 8.7 Urban centres based on all the four criteriaincluding hierarchy of settlements
C. CRITERIA: 3: PERSPECTIVE IN URBAN DEVELOPMENT
The perspective in urban development of theDistrict shows that the major urban developmentprojects envisaged in the District as of now are mainly1. Cheemeni Hydro Electric Project at Kayoor -Chemmeni Panchayat,2. Hindustan Aeronautics Ltd. at Madhur Panchayat.3. Tourism project at Bekal, Pallikkara Panchayat.4. Development of N.H 17.5. I.T.Park at Seethangoli, Puthige Panchayat.These mega projects are proposed in variousPanchayat which will help Kasaragod emerge asKerala’s new investment destination. List of localbodies after the inclusion are noted down.1. Mangalpady2. Manjeswar3. Chengala4. Madhur5. Mogral puthur.6. Uduma7. Pallikkara.8. Cheruvathur9. Neeleswar10. Kayyur cheemani.11. Puthinge.12. Kanhangad.(M)13. Kasaragod (M)
D. CRITERIA: 4: HIERARCHY OF SETTLEMENTThe hierarchy of the above 13 local bodies in theoverall context of the District is also to be taken into account before finalizing the local bodies withurban character, because the hierarchy of local bodyis an indicator on the type and number of facilitiesin the local bodies. The settlements with the top CFIvalues are included in the above list and so thesecan be considered as the final list of the probableurban local bodies and is given below:

Department of Town & Country Planning, KeralaDepartment of Town & Country Planning, Kerala
District Urbanisation Report - Kasaragod URBAN PROFILE 5555
Department of Town & Country Planning, KeralaDepartment of Town & Country Planning, Kerala
Table no 8.8: Projected Urban profile of the District
Fig 8.8 Ratio of Total Urban to District population
Fig 8.9 Projected total population in the existing urban area
1971 1981 1991 2001 2011 2021
Kasaragod District 683020 872741 1071508 1204078 1E+06 1366374
Kasaragod Municipality 34984 43137 50126 52683 59975 63570
Kanhangad Municipality -- - 57165 65503 74639 76639
Total urban Population 34984 43137 107291 118186 134614 140209
Table 8.9: Population projection of Existingurban area - Kasaragod District
A. POPULATION PROJECTION OF THE EXISTINGURBAN AREA
Urban population of the existing urban areais projected assuming that the ratio of the urbanpopulation to the District population doesn’t decreasefurther due to the introduction of the proposed urbandevelopment projects in the urban areas. Theprojected population figures of the existing urban areabased on this assumption are shown in the fig 8.9 and
table 8.9.
B.POPULATION PROJECTION OF THE PROPOSED URBAN AREA :
The ratio of the total population of theproposed urban area and total population of districtis shown below. This table shows an increasing trendin the population in the proposed urban area withrespect to the increase in district population. Thesame trend is assumed to be continued in these localbodies in the succeeding decades also and thepopulation is projected accordingly (see Annexe – 6B).
District Urbanisation Report - Kasaragod URBAN PROFILE 55
Sl No Existing Proposed1 Kasaragod (M) Mangalpadi..2 Kanhangad (M) Manjaswaram.3 Chengla.4 Madhur.5 Mogral Puthur.6 Uduma.7 Pallikara.8 Neeleswaram..9 Cheruvathoor.10 Puthige11 Kayoor Cheemeni.12 Karadka
13 West Eleri
Karadka and West Eleri are Rural in nature, but theyhave been included as they fall under the North-Eastand South-West quadrants. Hence a conscious effortshould be taken to develope them into future urbancentres, otherwise they have to depend on distanturban centres for their services.8.7 PROJECTION OF URBAN POPULATION OF KASARAGOD DISTRICT.
The total urban population of the district will bethe sum of the projected population of the urban area(existing and proposed) during 2011 and 2021.The list ofthe existing and proposed urban areas of the District isshown in table 8.8. The projection of urban population ofthe District is made under two phases. First the populationof the existing urban area of the District is projected andthen the population of the proposed urban area is derived.These two projections are summed up to get the futureurban population of the District.

Department of Town & Country Planning, KeralaDepartment of Town & Country Planning, Kerala
URBAN PROFILE District Urbanisation Report - Kasaragod5656
Fig 8.10 Ratio of total population of the proposed urban area and district population
The projected population of the urban areas (proposed)is shown in table 8.10
Table 8.10 Projected Population of proposedurban area
The total urban population of the District iscalculated adding the projected urban population ofthe existing and proposed urban area of the District.
Fig 8.11 Projected populations in the proposed urban area
1971 1981 1991 2001 2011 2021
District 683020 872741 1071508 1204078 1298663 1366374
Urban 113929 43137 176226 233700 276795 675708
% of urban population 16.68 4.94 16.64 19.4 29.31 49.45
Fig 8.12 Total urban population
The result is shown in table and the same is plotted inthe fig 8.128.8. URBAN PROFILE
The Spatial distribution of the urban local bodies(by 2021) shows that most of it is situated along the NH-47 & SH evenly distributed throughout the District. Theprojected and existing urban area, their own characterand their proposed hierarchy are given in table 8.12
Fig 8.13 Future Urban Profile
Table: 8.11 Projected Urban - Population ofKasaragod
Sl No Local Bodies 2011 20211 Neeleswaram.. 36703 365532 Cheruvathoor. 29231 291113 Chengla. 544324 Pallikara. 450095 Manjaswaram. 419216 Mangalpadi.. ------ 492077 Madhur. ------ 384058 Mogral Puthur. ------ 250899 Uduma. ------ 39747
10 Puthige ------ 2166911 Kayoor Cheemeni. ------ 2565612 Karadka ------ 2279913 West Eleri ------ 33534
Total (Urban Area Proposed)
242181 463132

Department of Town & Country Planning, KeralaDepartment of Town & Country Planning, Kerala
District Urbanisation Report - Kasaragod URBAN PROFILE 5757
Table 8.12: Character and hierarchy ofurban local bodies
Table 8.13 Administrative status of urbanlocal bodies
The changing urban profile of the District from 1971 to
2021 is shown in table 8.14.
The administrative status of various local bodiesis shown in table 8.13.
Table 8.14 Changing urban profile ofthe District
8.9. INFERENCE
It can be concluded that the level ofurbanization of the State shows a declining trend ingeneral. Kasaragod District shows a high level ofurbanization when compared to the State average. Andalso, the level of urbanization shows a slight incliningtrend within the District. The urban areas of the districtshows lower growth rate of population whereas therural areas surrounding the urban areas showsignificantly higher growth rate indicating possible outmigration of people from the urban areas to thesurrounding areas.
From the above study it can be concluded thatthe level of urbanization of the State shows a decreasingtrend in general. Kasaragod District shows a high levelof urbanization when compared to the State average.And also, the level of urbanization shows a slightinclining trend within the District. The urban areas ofthe district shows lower rate of population whereasthe rural areas surrounding the urban areas showsignificantly higher growth rate indicating possible outmigration of people from the urban areas to thesurrounding rural settlements.
Census year
Total number of Urban area
Municipal
Towns
Non municipal
towns
Urban out
growth
Census Town
1971 5 1 4 0 0
1981 5 4 0 1 0
1991 7 2 0 1 4
2001 10 2 0 3 5
2011 4 2 0 0 0
2021 13 2 0 0 0
Sl.No Name Projected Hierarchy of settlement
1 Kasaragod Municipality 12 Kanhangad Municipality 23 Nileshwaram 34 Cheruvathur 45 Chengala 46 Pallikkara 47 Manjeshwar 48 Mangalpadi 49 Madhur 510 Mogral Puthur 511 Uduma 412 Puthige 513 Kayyur Chemeni 414 Karadka 215 West Eleri 2
Existing Proposed
1Kasaragod Municipality Municipality Existing urban
2 Kanhangad Municipality
Municipality Existing urban
3 Nileshwaram Grama Panchayat 2011
4 Cheruvathur Grama Panchayat 2011
5 Chengala Grama Panchayat 2021
6 Pallikkara Grama Panchayat 2021
7 Manjeshwar Grama Panchayat 2021
8 Mangalpadi Grama Panchayat 2021
9 Madhur Grama Panchayat 2021
10 Mogral Puthur Grama Panchayat 2021
11 Karadka Grama Panchayat 2021
12 West Eleri Grama Panchayat 2021
Administrative StatusNameSl. No
Year of Achievement
admin
Text Box
CHAPTER 9 >>
admin
Text Box
< CONTENTS >

Department of Town & Country Planning, KeralaDepartment of Town & Country Planning, Kerala
ACTIVITY PATTERN District Urbanisation Report - Kasaragod5858
9.1 ACTIVITY PATTERN
The activity pattern existing within the districtis derived based on the study of the spatial distributionof the aspects covered in the settlement studies. Herethree aspects namely, the land use concentrationpattern, functional character and urban profile, whichcover all the aspects taken for the study of thesettlements are combined in order to evolve theactivity pattern (functional character is determinedbased on population distribution and land use, Urbanprofile is derived taking onto account occupationalstructure and hierarchy of settlements, the land useconcentration pattern is studied based on the land use
analysis).
9.2 DESCRIPTION OF LAND USE CONCENTRATION PATTERN
The concentration pattern of a land use gives anidea about where that particular land use isconcentrated within the district. The concentrationpattern of a land use can be ascertained by theconcentration index of that land use. The concentrationindex of a particular land use is calculated as follows:
C.I. = (Area of that land use in a local body/Total area ofthe local body)
(Area of that land use of the District/Total area ofthe District)
The concentration index value may be greater than one,equal to one or less than one. Grama Panchayats withconcentration index greater than one indicates that theland use under consideration is concentrated more
Chapter - 9ACTIVITY PATTERN
in those Grama Panchayats areas than other localbodies in the district. The predominant land use
concentration in various Grama Panchayats is given in
Fig 9.1.
9.3 DESCRIPTION OF FUTURE URBAN PROFILE
The future urban profile is worked out basedon the study of hierarchy of settlements, service area,potential for development etc.
Fig 9.1 Land use concentration – Kasaragod district
DAKSHINA KANNADA DISTRICTKarnataka State
KODAGUDISTRICT
KarnatakaState
KANNUR DISTRICT
admin
Text Box
< CONTENTS >
admin
Text Box
<< CHAPTER 8

Department of Town & Country Planning, KeralaDepartment of Town & Country Planning, Kerala
District Urbanisation Report - Kasaragod ACTIVITY PATTERN 5959
Fig 9.3 Functional classification – Kasaragod district
DAKSHINA KANNADA DISTRICTKarnataka State
KODAGU DISTRICTKarnataka State
KANNUR DISTRICT
Fig 9.2 Future Urban profile – Kasaragod district
9.4 DESCRIPTION OF FUNCTIONAL CLASSIFICATIONThe functional classification is studied based
on land use, population distribution and the averageplot size in the settlement. The functional classification
is shown in Fig. 9.3 . Once the functional character, landuse concentration pattern and urban profile aredetermined, they are considered together anddetermine the activity suitable for a space.

Department of Town & Country Planning, KeralaDepartment of Town & Country Planning, Kerala
ACTIVITY PATTERN District Urbanisation Report - Kasaragod6060
Urban Profile Functional character LandUse concentration ActivityNon Urban Rural Plantation Primary Activity(Planatation)
Urban Profile LandUse concentration Functional classification ActivityUrban Non Agricultural UrbanNon urban Agricultural Semi urban
Forest RuralSemi rural
Urban Profile Functional character LandUse concentration ActivityUrban Urban Urban Tertiary activity
Urban Profile Functional character LandUse concentration ActivityNon Urban Rural Agriculture Primary Activity(Agriculture)
Urban Profile Functional character LandUse concentration ActivityNon Urban Semi Rural Agriculture/ Plantation Primary Activity
(Agriculture/Animal Husbandry)
Urban Profile Functional character LandUse concentration ActivityNon Urban Semi Urban Urban (Small scale industries
/Animal Husbandry)
Combination 1
Combination 2
Combination 3
Combination 4
Combination 5
Table 9.1 Determination of Activity pattern

Department of Town & Country Planning, KeralaDepartment of Town & Country Planning, Kerala
District Urbanisation Report - Kasaragod ACTIVITY PATTERN 6161
The activity pattern of the district so arrived is shown in Table 9.2 and Fig 9.4
Table 9.2 Activity pattern – Kasaragod district
Sl. No Name of Panchayats Urban Profile Fn Classification Land Use Conc Activity Pattern1 BELLUR NON URBAN RURAL AGR PRI ACTIVITY(AGR)2 KUMBADAJE NON URBAN RURAL PLANTATION PRI ACTIVITY(PLANTATION)3 MANGALPADY URBAN RURAL AGR PRI ACTIVITY4 VORKADY NON URBAN RURAL AGR PRI ACTIVITY(AGR)5 PUTHIGE URBAN RURAL AGR PRI ACTIVITY6 MEENJA NON URBAN RURAL AGR PRI ACTIVITY(AGR)7 MANJESWAR URBAN URBAN AGR TER ACTIVITY8 KUMBALA NON URBAN RURAL AGR PRI ACTIVITY(AGR)9 PAIVALIKE NON URBAN RURAL AGR PRI ACTIVITY(AGR)10 ENMAKAJE NON URBAN RURAL AGR PRI ACTIVITY(AGR)11 BADIYADKA NON URBAN RURAL PLANTATION PRI ACTIVITY(PLANTATION)12 MULIYAR NON URBAN RURAL PLANTATION PRI ACTIVITY(PLANTATION)13 KARADKA URBAN RURAL PLANTATION PRI ACTIVITY(PLANTATION)14 DELAMPADY NON URBAN RURAL PLANTATION PRI ACTIVITY(PLANTATION)15 CHENGALA URBAN RURAL AGR PRI ACTIVITY16 CHEMNAD NON URBAN RURAL URBAN TER ACTIVITY17 BEDADKA NON URBAN RURAL URBAN PRI ACTIVITY18 MADHUR URBAN RURAL AGR PRI ACTIVITY19 MOGRAL PUTHUR URBAN RURAL URBAN TER ACTIVITY20 KUTTIKOLE NON URBAN RURAL AGR PRI ACTIVITY(AGR)21 UDMA URBAN URBAN AGR PRI ACTIVITY (AGR)22 AJANUR NON URBAN SEMI RURAL URBAN PRI ACTIVITY23 BALAL NON URBAN RURAL PLANTATION PRI ACTIVITY(PLANTATION)24 KODOM-BELLUR NON URBAN RURAL AGR PRI ACTIVITY(AGR)25 MADIKAI NON URBAN RURAL AGR PRI ACTIVITY(AGR)26 PALLIKKARA URBAN SEMI RURAL AGR AGR+ANM HUSB27 PANATHADY NON URBAN RURAL AGR PRI ACTIVITY(AGR)28 PULLUR PERIYA NON URBAN RURAL AGR PRI ACTIVITY(AGR)29 KALLAR NON URBAN RURAL AGR PRI ACTIVITY(AGR)30 CHERUVATHUR URBAN RURAL AGR PRI ACTIVITY31 KAYYUR-CHEEMENI URBAN RURAL AGR PRI ACTIVITY32 NILESHWAR URBAN RURAL URBAN TER ACTIVITY33 EAST ELERI NON URBAN RURAL AGR PRI ACTIVITY(AGR)34 PILICODE NON URBAN RURAL URBAN PRI ACTIVITY35 WEST ELERI URBAN RURAL AGR PRI ACTIVITY(AGR)36 KINANOOR-KARINDALAM NON URBAN RURAL AGR PRI ACTIVITY(AGR)37 THRIKKARIPUR NON URBAN RURAL URBAN TER ACTIVITY38 PADNE NON URBAN SEMI RURAL URBAN PRI ACTIVITY39 VALIYA PARAMBA NON URBAN RURAL URBAN PRI ACTIVITY40 KASARAGOD URBAN URBAN URBAN TER ACTIVITY

Department of Town & Country Planning, KeralaDepartment of Town & Country Planning, Kerala
ACTIVITY PATTERN District Urbanisation Report - Kasaragod6262
Fig 9.4 Activity pattern – Kasaragod district
9.4.1 TERTIARY ACTIVITYTertiary activities (i.e. urban service sector
oriented economic activities) are considered to be idealfor Manjeswar, Chemnad, Mogral-Puthur, Nileswar,Thrikkaripur, Kasaragod and Kanhangad. Out of these,Kasaragod, Kanhangad and Nileswar are already urbanlocal bodies.
9.4.2 PRIMARY ACTIVITYAll other local bodies constitute the rural
hinterland of the above mentioned local bodies whereurban activities are considered ideal and shall haveproduction base in agriculture and plantation.
9.5 INFERENCE
Considering functional character, future urbanprofile and land use concentration of the local bodies,suitable activity patterns are assigned to thesettlements. This activity pattern guides in formulatingspatial structure of the District.
DAKSHINA KANNADA DISTRICTKarnataka State
KODAGU DISTRICTKarnataka State
KANNUR DISTRICTARABIAN SEA
MANGALOREKarnataka State
admin
Text Box
< CONTENTS >
admin
Text Box
CHAPTER 10 >>

Department of Town & Country Planning, KeralaDepartment of Town & Country Planning, Kerala
District Urbanisation Report - Kasaragod NODES 6363
Chapter - 10NODES
10.1 NODESIn the Kerala context where urban rural
continuum persists, each local body is having at leastone node. The agglomeration of activity area aroundone or more (adjacent) road junctions which act ascommercial centre of a local body is termed here as anode. The node need not be confined fully within alocal body area and in most of the cases its service areagoes beyond the boundary of the local body withinwhich it locates. In certain cases the nodes maybelocated at the meeting point of the boundary of one ortwo local bodies. This means that the nodes have anentity independent of the local body area whichnecessitates a separate study than the settlementstudy. The hierarchies of nodes are determined by theextent of activity taking place there.
The number and type of shops, the number ofpeople using the node, the business turnover and theextent of traffic, all determine the extent of activityand hence the hierarchy of nodes. But extensive surveyand study are required to assess all these factors of thenode.However the extent of activity in a node can bedetermined by a proxy indicator denoted by thehierarchy of roads meeting at that place.
10.2 THE CONCEPT
IDDP Kollam report has been referred and theconcept and methodology mentioned in Annexe 14 hasbeen adopted here.
The hierarchy of the nodes in the descendingorder of Weightage is shown in Table10.1 Accordinglythe nodes (selected) of the Kasaragod District can becategorized in to five.
Sl. No: Name of Local body Junctions NodeValue1 Chengala Cherkkala Jn. 11.252 Ajanur Mavumgal Jn. 8.53 Kodom-bellur Odayamchal Jn. 84 Cheruvathur Cheruvathur Jn. 7.755 Madikkai Chalakkadav Jn. 7.56 Pullur periya Periya Jn. 7.57 Badiyadka Badiyadka Junctioin 78 Chemnadu Chattamchal Jn. 79 Manjeswar Hozangady Jn. 7
10 Kanhangad Kanhangad South Jn. 6.7511 Karadka Karadka Jn. 6.7512 East eleri Chittarikkal Jn. 613 Kuttikole Kuttikkol Jn. 614 Muliyar Bovikkanam Jn. 615 Pilicode Kalikkadav Jn. 616 Puthige Seethamgoly Jn. 617 Vorkady Vorkady Jn. 618 West eleri Bheemanadi Jn. 619 Bellur Nettanike Jn. 5.2520 Kumbala Kumbala Jn. 5.2521 Mangalpady Kaikkamba(Uppla) Jn. 5.2522 Mogral puthur CPCRI Jn. 5.2523 Nileshwaram Nileshwar Jn. 5.2524 Kayyur-cheemeni Chemeni Jn. 525 Madhur Uliyathadukka Jn. 526 Meenja Miyappadav Jn. 527 Balal Vellarikkund Jn. 4.528 Delampady Kottiyadi Jn. 4.529 Kallar Chullikkara Jn. 4.530 Kinanoor-karindalam Parappa Jn. 4.531 Paivalike Paivalike Jn. 4.532 Pallikara Bakel Jn. 4.533 Panathady Malkkallu Jn. 4.534 Thrikkaripur Thrikkarippur Nadakkav Jn. 4.535 Udma Uduma Jn. 4.536 Enmakaje Perla Jn. 3.7537 Kumbadaje Kumbadaje Jn. 3.7538 Bedadka Bedakam Jn. 3.25
Table 10.1. Hierarchy of nodes with nodeValues.
The list of the nodes within the Kasaragod District isgiven below:
admin
Text Box
< CONTENTS >
admin
Text Box
<< CHAPTER 9

Department of Town & Country Planning, KeralaDepartment of Town & Country Planning, Kerala
NODES District Urbanisation Report - Kasaragod6464
Fig 10.1 District map showing the Raod, Railway
Network and important Junctions
10.3 INFERENCEThe study of the hierarchy of nodes of the
district shows that there are no Nodes of 1st order Nodevalue- only IInd, IIIrd and IVth order node values arefound in Kasaragod district. Fig 10.1 shows thatCherkkala Jn. in Chengala Panchayat is a IInd orderNode, serving the surrounding population and potential
DAKSHINA KANNADA DISTRICTKarnataka State
KODAGU DISTRICTKarnataka State
KANNUR DISTRICT
Fig 10.2 Weightage ofjunction
growth centre of the district. The next order growthcentres may be Mavumgal, Odayamchal, Cheruvathur,Chalakadav, Periya, Bediyadka, Chattamchal,Hozangady, Kanhangad South, Karadka, Chittarikal,Kuttikol, Bovikkanam, Kalikkadav, Seethamgoly,Vorkady and Bheemanadi
admin
Text Box
CHAPTER 11 >>
admin
Text Box
< CONTENTS >

Department of Town & Country Planning, KeralaDepartment of Town & Country Planning, Kerala
District Urbanisation Report - Thiruvananthapuram CONNECTIVITY 6565
11.1 INTRODUCTIONKasaragod District is well connected by railroad
and waterway network. Kasaragod is well connectedto important places in the country by rail network.Major towns were developed along the railroad.Kasaragod railway station is located at Kasaragod town,8kms away from the District Head Quarters, Vidyanagar.The nearest airport is at Mangalapuram. The nearestInternational airport is at Karipur, 200 kms away fromKasaragod.
11.2. RAIL NETWORKKasaragod district is located in the Mangalore-
Shornur railway line of southern railway. A major thruston the rail transport network happened with theopening of Konkan Railway, providing direct access fromthis region to Bombay. The Shornur-Mangalore broadgauge Railway line connects 12 Panchayats and threeMunicipalities of the District covering a distance of 81kmthrough the coastal belt of the District. There are 10railway stations and one halt station in the district. Thenew Konkan Railway link reduces the distance toMumbai by 800 kms and makes this the shortest routefor Keralalites to Mumbai, the Commercial hub of India.The Shornur-Mangalore broad gauge line adds to theregional linkage of the town. It directly links Kasaragodwith Mangalore in the north and Kannur in the south.The rail to South passes along the Bekal TourismDevelopment Project area.11.3. ROAD TRANSPORT AND COMMUNICATION NETWORK
The major linkage within the district is providedby road network. The district possesses a completehierarchy of roads from national highway to villageroads. It has a total road length of 6594.80 kms,
comprising 85.90kms of National Highway, 141.78 kmsof State Highway 1182.30kms of major districts roadsand 5184.82km of village roads. All the interior parts ofthe district are connected to urban centers by busservice.
Table 11.1 distribution of roads in Kasaragoddistrict, length in km
(Source: Executive Engineer PWD, Kasaragod)
State PWD
High way
Roads
1 2 3 4 5 6 7 8 9
Kanhangad 20.1 34.2 90. 18 670.95 70.78 841.09 1582.8 22.958
Nileshwar 19.2 25.18 323.4 548.7 95.231 486.82 1130.7 37.117
Kasaragod 17 25.6 288.3 531.39 106.64 544.93 1183 10.98
Manjeshwar 14.3 52.11 244.6 544.86 216.42 1210.1 1971.4 28.55
Block total 70.6 137.1 946.4 2295.9 489.07 2082.9 5867.9 99.605
Kasaragod/ Muncipality
6.2 0 5.3 66.204 4.361 4.883 75.428 6
Kanhangad/Municipality
9.1 4.7 6.3 135.85 7.9 97.757 741.51 5
District 85.9 141.8 1182 2497.9 501.33 2185.6 6184.8 110.61
Railway track
Blocks/ Municipalities
National high way
Panchayat road Total
Kasaragod is located along National Highway17 leading to Mangalore. The town is well connectedwith major urban centres in the state by rail and roads.S.H-32 to Kalladukka leads to Badiadukka, Perla Vitlaand further to Karnataka State. The Jalsoor road passesthrough Muliyar and leads to Sulliya. The hill producesfruits and vegetables which are brought from thesecentres to Kasaragod town for trading. The Puthur andSulliya in Karnataka are famous for educationalinstitutions and trade and commerce.
Chapter - 11CONNECTIVITY
admin
Text Box
< CONTENTS >
admin
Text Box
<< CHAPTER 10

Department of Town & Country Planning, KeralaDepartment of Town & Country Planning, Kerala
CONNECTIVITY District Urbanisation Report - Kasaragod6666
Fig: 11.1 showing Existing Road Network in Kasaragod
11.4 CONCEPT
The proposed road network of the district is
derived based on the hierarchy of settlementsand nodes. The road network should connect the higher
order of settlements and nodes to each other.
At the same time, there should be sub major roads
connecting the lower order settlements with the
higher order settlements, and also minor roads
connecting lower order settlements with each
other.
A final proposal of the road network is derived taking
into account those existing roads and suggesting new
road links in those areas, where the existing road is
insufficient.
Fig: 11.2 Existing Road, Railway and Important Junctions
Fig: 11.3 Proposed Hierarchy of settlements
DAKSHINA KANNADA DISTRICTKarnataka State
KODAGU DISTRICTKarnataka State
KANNUR DISTRICT
DAKSHINA KANNADA DISTRICTKarnataka State
KODAGU DISTRICTKarnataka State
KANNUR DISTRICT

Department of Town & Country Planning, KeralaDepartment of Town & Country Planning, Kerala
District Urbanisation Report - Thiruvananthapuram CONNECTIVITY 6767
Fig: 11.4 Schematic Concept map of Kasaragod District
11.5 PROPOSED ROAD NETWORK
Fig: 11.5 Proposed Road network
11.6 INFERENCE
Kasaragod and Kanhangad are already in the
National Highway and also have good connectivity to
the service hinterland. Whereas, Karadka and West
Eleri lacks proper connectivity to first order
settlements as well as to their hinterlands. There are
existing unimportant roads , connecting the IInd and
IIIrd order settlements of West eleri, Panathady,
Karadka ,which have to up graded.
Also a proposal is made to convert the
minor road connecting the 3rd order settlements of
Thrikkaripur and Kayyur-Cheemeni, to a major
road, as it crosses the National Highway and is
important to the development of the settlements.
DAKSHINA KANNADA DISTRICTKarnataka State
KODAGU DISTRICTKarnataka State
KANNUR DISTRICT
DAKSHINA KANNADA DISTRICTKarnataka State
KODAGU DISTRICTKarnataka State
KANNUR DISTRICT
admin
Text Box
CHAPTER 12 >>
admin
Text Box
< CONTENTS >

Department of Town & Country Planning, KeralaDepartment of Town & Country Planning, Kerala
SPATIAL STRUCTURE District Urbanisation Report - Kasaragod6868
The major factors affecting the spatial structureof a region are activity pattern of settlements,connectivity and physiographical limitations.
Chapter - 12SPATIAL STRUCTURE
12.1 SPATIAL STRUCTURESpatial structure of a region defines the
functions within the subregions(Grama Panchayats),hierarchy and connectivity. This is obtained byoverlaying the maps of Activity Pattern, Hierarchy ofsettlements and Connectivity.
Fig 12.1 Formulation of Spatial Structure
12.2 ACTIVITY PATTERNFig 12.2 shows the Activity pattern of KasaragodDistrict.
The plantation and dry cultivation areconcentrated mainly on the high land region. Themidland region has a concentration of agriculture andconsists of small market centres (nodes) almost evenlydistributed in the region. The urban centres are mostly
ConnectivityActivitypattern
Hierarchy ofsettelments
Spatialstructure
Fig 12.2 Activity pattern –Kasaragod District
DAKSHINA KANNADA DISTRICTKarnataka State
KODAGU DISTRICTKarnataka
State
KANNUR DISTRICT
concentrated on the coastal stretch, mainly due to thepresence of strong transport corridor in this directionand area.
The forest resources and plantations areconcentrated mostly on the eastern high altitude areas.The urban activity is mainly on the coastal area (due toplain terrain and proximity to north – south transportcorridor) and the agriculture is concentrated in themidland region.
admin
Text Box
<< CHAPTER 11
admin
Text Box
< CONTENTS >

Department of Town & Country Planning, KeralaDepartment of Town & Country Planning, Kerala
District Urbanisation Report - Kasaragod SPATIAL STRUCTURE 6969
Fig 12.3 Proposed Hierarchy of settlements –Kasaragod District
12.3 HIERARCHY OF SETTLEMENTS
Fig 12.3 shows the Proposed Hierarchy of settlementsof Kasaragod District.
The higher order settlements also show a trendof following the transport corridor. The two newlyproposed second order settlements Karadka and WestEleri are on the north east and south east quadrants.
The proposed second order settlements includeKasaragod, Kanhangad, Karadka and West Eleri. Thepresence of number of urban centres clustered aroundthe national highway is not a desirable trend. This hashappened mainly due to the fact that NationalHighways are used even at the level of collector streetsin the state in many places. This cluster of urban centres,mainly on the coastal strip poses environmental threatsto these fragile areas and needs to be addressed toproperly in the perspective and development plans.
12.4 PROPOSED ROAD NETWORKPhysiographically, the district has distinct high
land on the eastern side, a mid land region and a coastalstrip on the west. This makes the connectivity in east-west direction difficult. As a result the north southcorridor is very strong (as elsewhere in the state) withNational Highway and Railway running in this direction.The roads in the east west direction, State highways(Hosdrg-Panathur road and Cherkala-Jalsoor road) havelower standards and capacity compared to the NationalHighway.Kasaragod and Kanhangad are already in theNational Highway and also have good connectivity tothe service hinterland. Whereas, Karadka (servingNorth-East quadrant) and West Eleri (serving South-Eastquadrant) lacks proper connectivity to first ordersettlements as well as to their hinterlands.Strengthening these linkages shall help improve thespatial structure of the district and facilitate economicdevelopment of the region.
The proposed road net work connecting thehigher order settlements are shown in Fig. 12.4. Mostof these roads are existing unimportant roads whichhave to up graded as per the proposal.
DAKSHINA KANNADA DISTRICTKarnataka State
KODAGUDISTRICT
KarnatakaState
KANNUR DISTRICT
Fig 12.4 Proposed Road network
DAKSHINA KANNADA DISTRICTKarnataka State
KODAGUDISTRICT
KarnatakaState
KANNUR DISTRICT

Department of Town & Country Planning, KeralaDepartment of Town & Country Planning, Kerala
SPATIAL STRUCTURE District Urbanisation Report - Kasaragod7070
12.5 FORMULATION OF SPATIAL STRUCTURE
Overlaying the activity pattern, hierarchy ofsettlements and road network gives an idea of thespatial structure of the district.
From the analysis need for an internalcirculation system connecting Kanhangad, Kasaragod,West Eleri and Karadka is quite evident. Out of thisKanhangad and Kasaragod are well connected.Kasaragod to Karadka link need be strengthened andWest Eleri to Karadka and West Eleri to Kanhangad needto be provided.
12.6 INFERENCE
As per the proposed hierarchy of settlements,there is one first order settlement, 3 second order
settlements and 6 third order settlements in theDistrict. The character wise analysis of these higherorder settlement shows that, the first order settlement,Kasaragod Municipality is urban in nature. Of the Threesecond order settlements, Kanhangad Municipality isexisting urban area; West Eleri and Karadka areproposed to attain urban character by 2020 and shallrequire conscious efforts in improving connectivitylinkages. The spatial structure of the district includesdistinct area of forest resources, agricultural land andurban activity area overlaid with higher ordersettlements in an almost rational arrangement and theroad system connecting the different activities to thehigher order settlements and providing circulation
among the higher order settlements.
Fig 12.5. Spatial structure of Kasaragod District
DAKSHINA KANNADA DISTRICTKarnataka State
KODAGU DISTRICTKarnataka State
KANNUR DISTRICT
admin
Text Box
< CONTENTS >
admin
Text Box
CHAPTER 13 >>

Department of Town & Country Planning, KeralaDepartment of Town & Country Planning, Kerala
District Urbanisation Report - Kasaragod SUMMARY OF FINDINGS 7171
Chapter - 13SUMMARY OF FINDINGS
Kasaragod, the northern most district acts as aconfluence of Kannada, Tulu and Keralite cultures. Thedistrict is less urbanized and less populated comparedto most other districts in the state. The physiographyand climate of the district is typical to Kerala withhighland, midland and coastal strip. Forest cover is lessthan state average. The district is rich in its waterresources with twelve rivers running through thedistrict. The social backwardness of the district isevident from lower literacy, WPR and per capita incomecompared to the state averages. The infrastructure isalso not up to the mark with lower road density, severeshortage of higher education facilities and higher orderhealth care facilities. Even with the abundance of waterresources, areas of scarcity do exist. Mangalore is thenearest city and the people of the district depend on itfor tertiary level functions. In the south end Kannur,even though a lesser order regional centre comparedto Mangalore, is more easily accessible for suchfunctions.
It is estimated that the total population of thedistrict increases by about 94584 population in thecoming 10 years and from there it increases by less than67711 population in the succeeding 10 years (by 2021)with a growth rate of 6.72 during 2001-2011 & 3.65 during2011-2021. The analysis shows that during the sameperiod (2001 to 2021) the urban content of the totalpopulation make a very significant increase. It isexpected that the urban population will be increased1.18 times in the next 20 years. This is mainly due tothe attaining of urban nature by some of the rural localbodies and subsequently the population in these localbodies is being treated as urban.
The analysis of the occupational structure of
the District shows a very alarming situation regardingthe economic base of the district. The production sectorincluding the agriculture and industrial sector showsdeclining trend in the district. The only sector, whichshows growth, is the service sector. More than 50% ofthe urban population depends on the service sectorfor their livelihood. It is observed that rural area of thedistrict is also slowly withdrawing from the primarysector and started depending more on the servicesector.
The overall land use pattern of the district isnot much in variance with the land use pattern of thestate. A large extent of neutral land use indicatesavailability of land for future economic and physicalgrowth. A dispersed residential and agricultural mixedgrowth is evident as elsewhere in the state. Theagricultural activity zone is mostly in the high land andmid land. The urban development has taken placemostly on the coastal strip and the west part of the midland. Secondary level growth centres have developedmostly in the mid land area.
Study of functional character of the differentsettlements in the district reveals that thirty six (out offorty one) settlements are classified as rural. Foursettlements are on transition, classified as semi ruraland only one settlement is qualified as urban. Thisshows the comparatively lower level of urbanisationof the district.
The organic growth of settlements in thedistrict can be explained in the backdrop ofphysiographical features and the development ofconnectivity options. A north – south corridor is veryprominent (in the form of railway line and nationalhighway) in the state and the situation is not different
admin
Text Box
<< CHAPTER 12
admin
Text Box
< CONTENTS >

Department of Town & Country Planning, KeralaDepartment of Town & Country Planning, Kerala
SUMMARY OF FINDINGS District Urbanisation Report - Kasaragod7272
in Kasaragod district also. The major limitation inapplying Crystallor’s theory in this region is theundulating terrain and clearly identifiablephysiographical divisions violating the basicassumption of plain terrain with easy accessibility informulating the theory. However, within this limitation,the order of the settlements is projected. The firstorder and third order settlements are almost same asthose evolved through organic growth. Thedevelopment of second order settlements, especiallyKaradka and West Eleri needs conscious efforts, mainlyin the development of East – West connectivity.
It is evident that the level of urbanization ofthe State shows a declining trend in general. KasaragodDistrict shows a high level of urbanization whencompared to the State average. And also, the level ofurbanization shows a slight inclining trend within theDistrict. The urban areas of the district shows lowergrowth rate of population whereas the rural areassurrounding the urban areas show significantly highergrowth rate indicating possible out migration of peoplefrom the urban areas to the surrounding areas.
From the above study it can be concluded thatthe level of urbanization of the State shows adecreasing trend in general. Kasaragod District shows
a high level of urbanization when compared to the Stateaverage. And also, the level of urbanization shows aslight inclining trend within the District. The urbanareas of the district shows lower rate of populationwhereas the rural areas surrounding the urban areasshow significantly higher growth rate indicatingpossible out migration of people from the urban areasto the surrounding rural settlements.
Considering functional character, future urbanprofile and land use concentration of the local bodies,suitable activity patterns are assigned to thesettlements. This activity pattern guides in formulatingspatial structure of the District.
The study of the hierarchy of settlement of thedistrict shows that Kasaragod Municipality is thehighest order settlement in the district as expected.The first order settlement is Kasaragod Municipality,the district head quarters. The second ordersettlements are one Municipality and third ordersettlements are Thrikkaripur and Neeliswar Panchayatalong the National High Way in the district. The fourthorder settlements are mainly along the State High Way.The spatial structure of the district needs improvementby improved connectivity to mid land and high landregions.
admin
Text Box
< CONTENTS >
admin
Text Box
ANNEXES >>

District Urbanisation Report - Kasaragod ANNEXES
Department of Town & Country Planning, KeralaDepartment of Town & Country Planning, Kerala
7373
ANNEXE- 1 - LSGs BLOCK PANCHAYAT WISE
Sl.No. LSGs Grade
1 Chengala Special2 Chemnad First3 Badiadka Special4 Madhur Special5 Mogral – Puthur Special6 Kumbla Special
1 Mangalpady Special2 Vorkady First3 Puthige First4 Meenja First5 Manjeshwaram Special6 Paivalike First7 Enmakaje First
Kanhangad
1 Udma Special2 Ajanur Special3 Madikai First4 Pallikkara Special5 Pullur - Periya First
1 Cheruvathur Special2 Kayyur – Cheemeni First3 Pilicode First4 Trikaripur First5 Padne First6 Valiyaparamba First
1 Bedadka Special2 Bellur First3 Delampady First4 Karadka First5 Kumbadaje First6 Kuttikol First7 Muliyar First
1 Balal First2 East Eleri First3 Kinanoor-Karindalam First4 Kallar First5 Kodom belur First6 Panathady First7 West Eleri First
Karadka Block Panchayat
Parappa Block Panchayat
Kasaragod Block Panchayat
Manjeswaram Block Panchayat
Kanhangad Block Panchayat
Nileshwaram Block Panchayat
admin
Text Box
<< CHAPTER 13
admin
Text Box
< CONTENTS >

ANNEXES District Urbanisation Report - Kasaragod
Department of Town & Country Planning, KeralaDepartment of Town & Country Planning, Kerala
7474
ANNEXE - 2A - WEIGHTAGE OF FACILITIES
Name of Facilities WeightagePost Office HO 1LP and UP 1HS 1HSS 1.4Arts & Science College 7.2BEd College 11.8Teachers Training Institute 5.2Engineering College/ College of Science and Technology/Poly Technic 6.7Medical college ( Ayurveda/Allopathy/Homeo) 18.8Banks(National/scheduled/cooperative bank) 1Seed Farm 10.4Market -Weekly 5.9ITC/ITI 9.4Taluk Hospital 31.3CHC 4.1PHC 1.3ESI Hospital 94Super speciality 0Speciality Alone 2.6Veteriinary Hospital 1Krishi Bhavan 1Hatcheries 23.5Fire station 47Ferries/Boat jetty 0 Railway Station 5.5 Bus stand 5.5Cinema Theatre- A 47Cinema Theatre- B 1.5Cinema Theatre- C 0Airport 0University 0Telephone exchange 1.2

District Urbanisation Report - Kasaragod ANNEXES
Department of Town & Country Planning, KeralaDepartment of Town & Country Planning, Kerala
7575
ANNEXE - 2B -CFI OF SETTLEMENTS
Sl. No: LSGs Name CFI1 KUMBADAJE 19.342 VORKADY 21.143 PUTHIGE 21.284 BELLUR 22.265 MEENJA 23.106 VALIYA PARAMBA 23.137 MOGRAL PUTHUR 26.848 BADIYADKA 28.559 MADHUR 31.6010 PILICODE 34.3111 MADIKAI 34.6712 DELAMPADY 34.7113 BEDADKA 34.7214 BALAL 34.7815 KUTTIKOLE 35.5016 PANATHADY 35.6717 KALLAR 36.6318 KODOM-BELLUR 37.6819 MULIYAR 39.6920 ENMAKAJE 40.0221 KINANOOR-KARINDALAM 40.0222 PAIVALIKE 43.5823 KARADKA 45.4024 KUMBALA 46.5425 PADNE 48.6426 MANJESWAR 52.1827 MANGALPADY 53.6628 PALLIKKARA 56.6529 KAYYUR-CHEEMENI 57.0230 PULLUR PERIYA 57.5631 UDMA 62.1232 AJANUR 69.4733 EAST ELERI 70.0934 CHEMNAD 71.6535 CHENGALA 72.4336 WEST ELERI 72.5637 CHERUVATHUR 76.0438 THRIKKARIPUR 101.7239 NILESHWAR 104.8640 KANHANGAD 190.1841 KASARAGOD 228.34

ANNEXES District Urbanisation Report - Kasaragod
Department of Town & Country Planning, KeralaDepartment of Town & Country Planning, Kerala
7676
ANNEXE - 3- HIERARCHY OF SETTLEMENTS
Order of Settlement Sl. No. LSGs NameIst Order 1 KASARAGOD (M)IInd Order 1 KANHANGAD (M)
2 KARADKA3 WEST ELERI
IIIrd Order 1 THRIKKARIPUR2 MANGALPADY3 PALLIKKARA4 KODOM-BELLUR5 PANATHADY6 KAYYUR-CHEEMENI
IVth Order 1 MANJESWAR2 PULLUR PERIYA3 UDMA4 AJANUR5 EAST ELERI6 CHEMNAD7 CHENGALA8 CHERUVATHUR9 NILESHWAR
Vth Order 1 KUMBADAJE2 VORKADY3 PUTHIGE4 BELLUR5 MEENJA6 VALIYA PARAMBA7 MOGRAL PUTHUR8 BADIYADKA9 MADHUR10 PILICODE11 MADIKAI12 DELAMPADY13 BEDADKA14 BALAL15 KUTTIKOLE16 KALLAR17 MULIYAR18 ENMAKAJE19 KINANOOR-KARINDALAM20 PAIVALIKE21 KUMBALA22 PADNE

District Urbanisation Report - Kasaragod ANNEXES
Department of Town & Country Planning, KeralaDepartment of Town & Country Planning, Kerala
7777
ANNEXE - 4 - CONCENTRATION INDEX OF VARIOUS LAND USES
CI of Forest CI of Urban CI of Agr CI of Plantation CI of water body1 BELLUR 4.82 0 0.92 0 0.142 KUMBADAJE 0 0 1.08 10.23 0.33 MANGALPADY 0 0 1.21 0 1.44 VORKADY 0 0 1.1 0 0.145 PUTHIGE 0 0.08 1.19 0 1.086 MEENJA 0 0 0.96 0 0.427 MANJESWAR 0 0 1.28 0 1.048 KUMBALA 0 0.9 1.19 0 2.499 PAIVALIKE 0 0 0.99 0 0.3910 ENMAKAJE 0.37 0.18 0.97 0.09 0.5211 BADIYADKA 0.1 0.01 1 1.42 0.2312 MULIYAR 0 0 1.07 1.79 1.1313 KARADKA 0.29 0 1.08 5.28 0.4414 DELAMPADY 9.82 0 0.33 6.72 0.8915 CHENGALA 0 0 1.07 0.69 0.7916 CHEMNAD 0 1.99 0.98 0 1.3917 BEDADKA 0 1.6 0.78 0 118 MADHUR 0 0.14 1.25 0 0.2319 MOGRAL PUTHUR 0 1.85 1.22 0 220 KUTTIKOLE 2.13 0 0.96 0.26 0.1521 UDMA 0 0.35 1.08 0 0.8922 AJANUR 0 1.28 1.09 0 2.2523 BALAL 1.61 0.39 1.01 6.27 0.0824 KODOM-BELLUR 0 1 1.08 0 0.1225 MADIKAI 0 0.79 0.82 0 0.2426 PALLIKKARA 0 0.31 0.84 0 1.7527 PANATHADY 4.56 0 0.98 0 0.1828 PULLUR PERIYA 0 0.42 0.76 0 0.3729 KALLAR 2.8 0 1.05 0.27 0.730 CHERUVATHUR 0 0.45 1.14 0 4.5131 KAYYUR-CHEEMENI 0 0 1.05 0 0.8432 NILESHWAR 0 2.23 1.04 0 3.0233 EAST ELERI 0 0 1.27 0 0.3234 PILICODE 0 8.64 1.08 0 0.0835 WEST ELERI 0.69 0 1.18 0 0.536 KINANOOR-KARINDALAM 0.01 0.43 1.12 0 0.5337 THRIKKARIPUR 0 19.21 1.04 0 3.3138 PADNE 0 17.72 0.89 0 8.4939 VALIYA PARAMBA 0 1.78 0.64 0 18.7940 KASARAGOD 0 16.71 0.91 0 6.8641 KANHANGAD 0 2.53 1.16 0 0.82
Concentration IndexSl. No Name of Panchayats

ANNEXES District Urbanisation Report - Kasaragod
Department of Town & Country Planning, KeralaDepartment of Town & Country Planning, Kerala
7878
ANNEXE - 5 - POPULATION PROJECTION
Method-1- Decreasing rate method
Year Ppn Growth rate % decrease in1971 683020 Ppn growth rate1981 872741 27.781991 1071508 22.78 -18.012001 1204078 12.37 -45.682011 1285005 6.72 -45.682021 1331923 3.65 -45.68
Method 2-Apportionment method
Year State ppn Ppn Ratio Change in ratiox y y/x
1971 21347375 683020 0.03201981 25453680 872741 0.0343 0.0022921991 29098518 1071508 0.0368 0.0025362001 31841374 1204078 0.0378 0.0009912011 33817196 1312321 0.0388 0.0009912021 35198589 1400825 0.0398 0.000991
Projection -FinalYear Average ppn Growth rate1971 6830201981 872741 27.781991 1071508 22.782001 1204078 12.372011 1298663 7.862021 1366374 5.21
LSGs name Distribution of projected PPn ratio PPn density 2001 PPn density 2021 population -2021
BELLUR 11480.66 0.00840228 156.63 177.75KUMBADAJE 16083.36 0.011770832 456.75 518.32MANGALPADY 49206.70 0.036012617 1194.55 1355.56VORKADY 27059.03 0.019803534 525.22 596.01PUTHIGE 21668.79 0.015858607 482.08 547.05MEENJA 23359.62 0.017096069 458.36 520.14MANJESWAR 41921.36 0.030680737 1514.02 1718.09

District Urbanisation Report - Kasaragod ANNEXES
Department of Town & Country Planning, KeralaDepartment of Town & Country Planning, Kerala
7979LSGs name Distribution of projected PPn ratio PPn density 2001 PPn density 2021
population -2021KUMBALA 45582.19 0.033359965 999.70 1134.45PAIVALIKE 35383.84 0.025896163 430.02 487.99ENMAKAJE 29989.06 0.021947914 337.81 383.34BADIYADKA 35408.81 0.025914434 460.29 522.33MULIYAR 25336.42 0.018542819 651.50 739.32KARADKA 22799.04 0.016685796 488.00 553.78DELAMPADY 25744.95 0.018841803 455.11 516.45CHENGALA 54432.40 0.03983712 891.75 1011.94CHEMNAD 54381.34 0.039799747 1194.76 1355.8BEDADKA 30250.06 0.022138931 311.81 353.84MADHUR 38404.65 0.028106983 1299.65 1474.83MOGRAL PUTHUR 25089.04 0.018361767 1552.60 1761.87KUTTIKOLE 26828.67 0.019634941 358.21 406.5UDMA 39747.10 0.029089478 1427.30 1619.69AJANUR 51721.39 0.037853029 1637.73 1858.48BALAL 26567.67 0.019443923 251.20 285.06KODOM-BELLUR 36682.04 0.026846267 338.69 384.35MADIKAI 23358.49 0.017095238 397.14 450.68PALLIKKARA 45009.12 0.032940557 1014.66 1151.42PANATHADY 25313.73 0.018526208 279.57 317.25PULLUR PERIYA 30430.49 0.022270982 423.97 481.11KALLAR 21744.82 0.015914251 315.01 357.47CHERUVATHUR 29110.73 0.021305098 1396.46 1584.69KAYYUR-CHEEMENI 25656.43 0.018777023 310.99 352.91NILESHWAR 36552.67 0.026751589 1228.02 1393.54EAST ELERI 27936.22 0.020445519 393.76 446.84PILICODE 26483.69 0.019382465 871.80 989.3WEST ELERI 33534.14 0.02454243 381.55 432.98KINANOOR-KARINDALAM 29284.35 0.021432166 333.02 377.91THRIKKARIPUR 40735.50 0.029812853 1539.98 1747.55PADNE 21566.66 0.015783861 1419.34 1610.65VALIYA PARAMBA 13659.45 0.009996861 745.79 846.31KASARAGOD 59728.46 0.043713115 3155.52 3580.84KANHANGAD 74332.05 0.054400961 1656.63 1879.92

ANNEXES District Urbanisation Report - Kasaragod
Department of Town & Country Planning, KeralaDepartment of Town & Country Planning, Kerala
8080
ANNEXE- 6A- POPULATION PROJECTION OF URBAN AREAS (EXISITNG)
Local bodies 1971 1981 1991 2001 2011 2021Kasaragod District 683020 872741 1071508 1204078 1298663 1366374Kasaragod Municipality 34984 43137 50126 52683 59975 63570Kanhangad Municipality — - 57165 65503 74639 76639
Total urban Population 34984 43137 107291 118186 134614 140209
ANNEXE 6B- PROJECTED POPULATION OF THE URBAN AREAS (PROPOSED)
Sl No Local Bodies 2011 20211 Neeleswaram.. 36703 365532 Cheruvathoor. 29231 291113 Chengla. 544324 Pallikara. 450095 Manjaswaram. 419216 Mangalpadi.. ——— 492077 Madhur. ——— 384058 Mogral Puthur. ——— 250899 Uduma. ——— 3974710 Puthige ——— 2166911 Kayoor Cheemeni. ——— 2565612 Karadka ——— 2279913 West Eleri ——— 33534
Total (Urban Area Proposed)242181 463132

District Urbanisation Report - Kasaragod ANNEXES
Department of Town & Country Planning, KeralaDepartment of Town & Country Planning, Kerala
8181
ANNEXE - 7 -CONCEPT CENTRALITY & CONNECTIVITY
Regional Centrality
LSGs name Value of CentralityBEDADKA 1CHEMNAD 2KALLAR 2KODOM-BELLUR 2KUTTIKOLE 2MULIYAR 2PALLIKKARA 2PULLUR PERIYA 2AJANUR 3BALAL 3CHENGALA 3DELAMPADY 3KARADKA 3KASARAGOD 3KINANOOR-KARINDALAM 3MADIKAI 3PANATHADY 3UDMA 3BADIYADKA 4BELLUR 4KANHANGAD 4KAYYUR-CHEEMENI 4KUMBADAJE 4MADHUR 4WEST ELERI 4CHERUVATHUR 5EAST ELERI 5ENMAKAJE 5MOGRAL PUTHUR 5NILESHWAR 5PILICODE 5PUTHIGE 5KUMBALA 6PADNE 6PAIVALIKE 6THRIKKARIPUR 6VALIYA PARAMBA 6MANGALPADY 7MEENJA 7MANJESWAR 8VORKADY 8

ANNEXES District Urbanisation Report - Kasaragod
Department of Town & Country Planning, KeralaDepartment of Town & Country Planning, Kerala
8282
Sub Region CentralityLSGs name Centrality ValueDivision 1. (S-E)BALAL 1KALLAR 2PANATHADY 2WEST ELERI 2BEDADKA 3KUTTIKOLE 3EAST ELERI 3Divison 2. (S-W)MADIKAI 1KODOM-BELLUR 2PULLUR PERIYA 2AJANUR 2KINANOOR-KARINDALAM 2KANHANGAD 2NILESHWAR 2KAYYUR-CHEEMENI 3CHERUVATHUR 3PILICODE 4PADNE 4THRIKKARIPUR 5VALIYA PARAMBA 5Division 3. (N-W)PUTHIGE 1MADHUR 2MOGRAL PUTHUR 2KUMBALA 2CHENGALA 3KASARAGOD 3MANGALPADY 3MEENJA 3CHEMNAD 4MANJESWAR 4PALLIKKARA 5UDMA 5Division 4. (N-E)ENMAKAJE 1BADIYADKA 2BELLUR 2KUMBADAJE 2KARADKA 3PAIVALIKE 3MULIYAR 4DELAMPADY 4VORKADY 4

District Urbanisation Report - Kasaragod ANNEXES
Department of Town & Country Planning, KeralaDepartment of Town & Country Planning, Kerala
8383
Conectivity
LSGs name Grade of Railway Station Type of Road
AJANUR NH, SH, MDRBADIYADKA SH, MDRBALAL MDRBEDADKA MDRBELLUR MDRCHEMNAD NH, SH, MDRCHENGALA NH, SH, MDRCHERUVATHUR E NH, MDRDELAMPADY SH, MDREAST ELERI MDRENMAKAJE SH, MDRKALLAR SH, MDRKANHANGAD E NH, SH, MDRKARADKA SH, MDRKASARAGOD B NH, SH, MDRKAYYUR-CHEEMENI MDRKINANOOR-KARINDALAM MDRKODOM-BELLUR SH, MDRKUMBADAJE MDRKUMBALA E NH, MDRKUTTIKOLE MDRMADHUR MDRMADIKAI MDRMANGALPADY E NH, MDRMANJESWAR E NH, MDRMEENJA SH, MDRMOGRAL PUTHUR NH, MDRMULIYAR SH, MDRNILESHWAR E NH, MDRPADNE MDRPAIVALIKE SH, MDRPALLIKKARA E NH, SH, MDRPANATHADY SH, MDRPILICODE NH, MDRPULLUR PERIYA NH, SH, MDRPUTHIGE SH, MDRTHRIKKARIPUR E MDRUDMA E SH, MDRVALIYA PARAMBAVORKADY SH, MDRWEST ELERI MDR
admin
Text Box
< CONTENTS >