Passive, 2-Stage Biofilter Treatment Systems for Reduction of ...
37
PD-Sw205w 1 PD-Sw205w 1 FOSNRS 2: Passive, 2-Stage Biofilter Treatment Systems for Reduction of Nitrogen from OWS – Pilot Study Results April 7, 2014 Josefin Hirst, P.E. The Florida Onsite Sewage Nitrogen Reduction Strategies (FOSNRS) Project SSSA Onsite Wastewater Conference April 7-8, 2014 Hazen and Sawyer, P.C.
-
Upload
khangminh22 -
Category
Documents
-
view
2 -
download
0
Transcript of Passive, 2-Stage Biofilter Treatment Systems for Reduction of ...
PD-S
w20
5w
1
PD-S
w20
5w
1
FOSNRS 2: Passive, 2-Stage BiofilterTreatment Systems for Reduction of Nitrogen from OWS – Pilot Study ResultsApril 7, 2014Josefin Hirst, P.E.
The Florida Onsite Sewage Nitrogen Reduction Strategies (FOSNRS) Project
SSSA Onsite Wastewater ConferenceApril 7-8, 2014
Hazen and Sawyer, P.C.
PD-S
w20
5w
2
Presentation overview
■ FOSNRS Task A: Nitrogen treatment and reduction options for Florida
■ Pilot test results■ Summary■ Questions and answers

PD-S
w20
5w
3
PD-S
w20
5w
3
FOSNRS Task A: Nitrogen treatment and reduction options for Florida

PD-S
w20
5w
4
Review of biological nitrogen reduction for onsite wastewater treatment
Primary Treatment
Mineralization of organic Nto
ammonia (NH4)
Nitrification
Ammonia oxidized to nitrate (NO3)
by nitrifying bacteria, requires oxygen
Denitrification
Nitrate converted to N2 gas by denitrifying bacteria in
anoxic environment; requires supply of electron donor
Dispersal
Effluent discharge to thesoil or landscape for final treatment

PD-S
w20
5w
5
What are “Passive” nitrogen reduction systems (PNRS)?
■ Most current N-reducing onsite systems are mechanical treatment units, with pumps, blowers, controls
■ Passive definition for this project: Passive nitrogen reduction systems (PNRS) are OSTDS that reduce effluent N using reactive media for denitrification and a single liquid pump, if necessary.
■ Earlier work showed feasibility of bench-scale “passive” two stage biofiltration concepts (Smith et. al., 2008)
Treatment MediaEffluent TN
(mg/L)TN
Reduction (%)Zeolite & Sulfur Media 2.2 97Expanded Clay & Sulfur 2.6 96.2

PD-S
w20
5w
6
Task A was designed to further the concepts developed in previous work
■ Developed detailed performance data for passive biofiltration designs with various media configurations
■ Produced scalable design criteria from pilot scale biofilters for subsequent full-scale testing
■ Evaluated single pass and recirculating stage 1 biofilters
■ Evaluated twenty-two biofilters consisting of nine unsaturated Stage 1 biofilters, nine saturated Stage 2 biofilters, and four vertically stacked biofilter designs.

PD-S
w20
5w
7
A unique pilot facility was constructed at UF research center
■ University of Florida, Institute for Food & Agricultural Sciences (IFAS)
■ 475 acres of land in SE Hillsborough County
■ Facility conducts agricultural research & trials for vegetables, fruit and ornamental plants
■ Experts in soil and water science onsite
Source: http://gcrec.ifas.ufl.edu/
PD-S
w20
5w
8
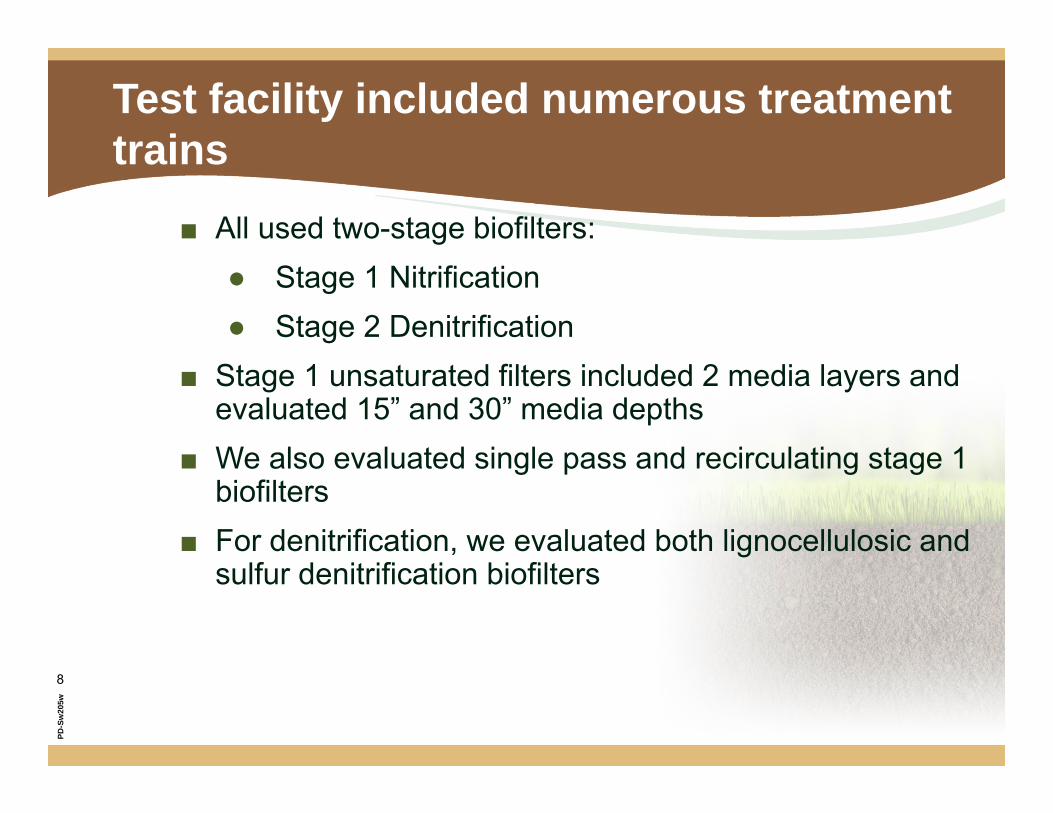
Test facility included numerous treatment trains
■ All used two-stage biofilters:● Stage 1 Nitrification● Stage 2 Denitrification
■ Stage 1 unsaturated filters included 2 media layers and evaluated 15” and 30” media depths
■ We also evaluated single pass and recirculating stage 1 biofilters
■ For denitrification, we evaluated both lignocellulosic and sulfur denitrification biofilters
PD-S
w20
5w
9
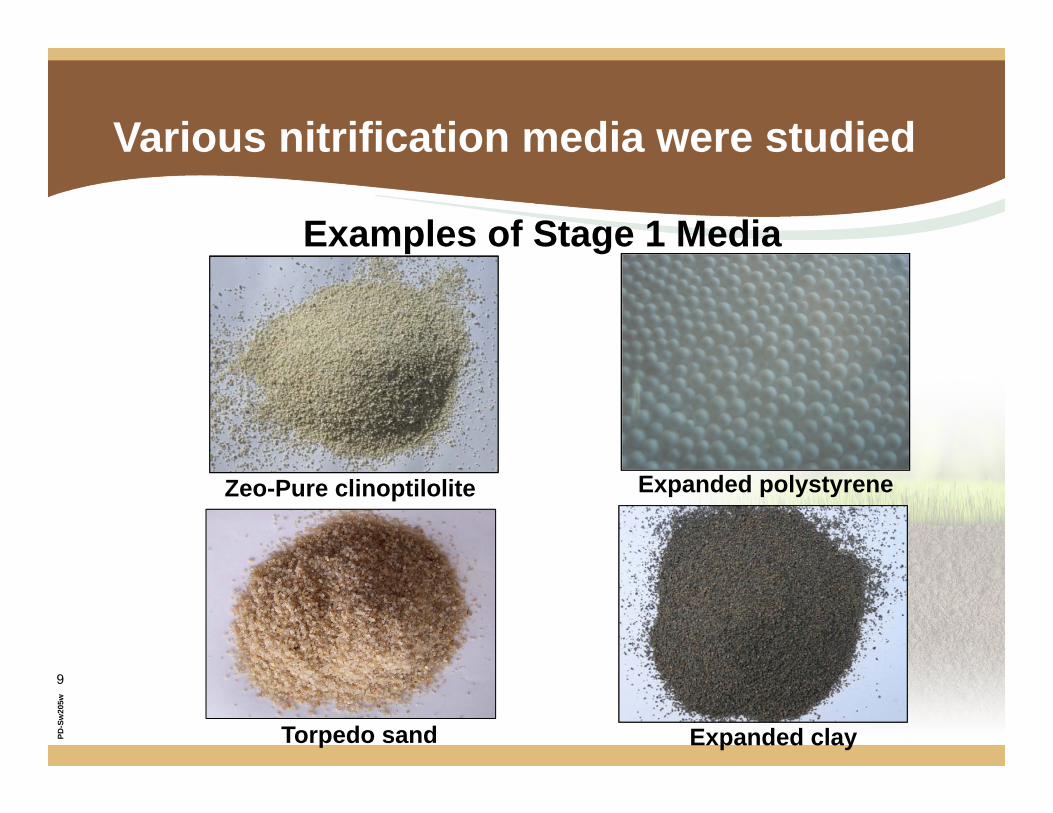
Various nitrification media were studied
Zeo-Pure clinoptilolite Expanded polystyrene
Examples of Stage 1 Media
Expanded clayTorpedo sand

PD-S
w20
5w
10
Various denitrification media were also studied
Elemental Sulfur
Lignocellulosics
Examples of Stage 2 Media
Oyster shell (alkalinity amendment)
PD-S
w20
5w
11
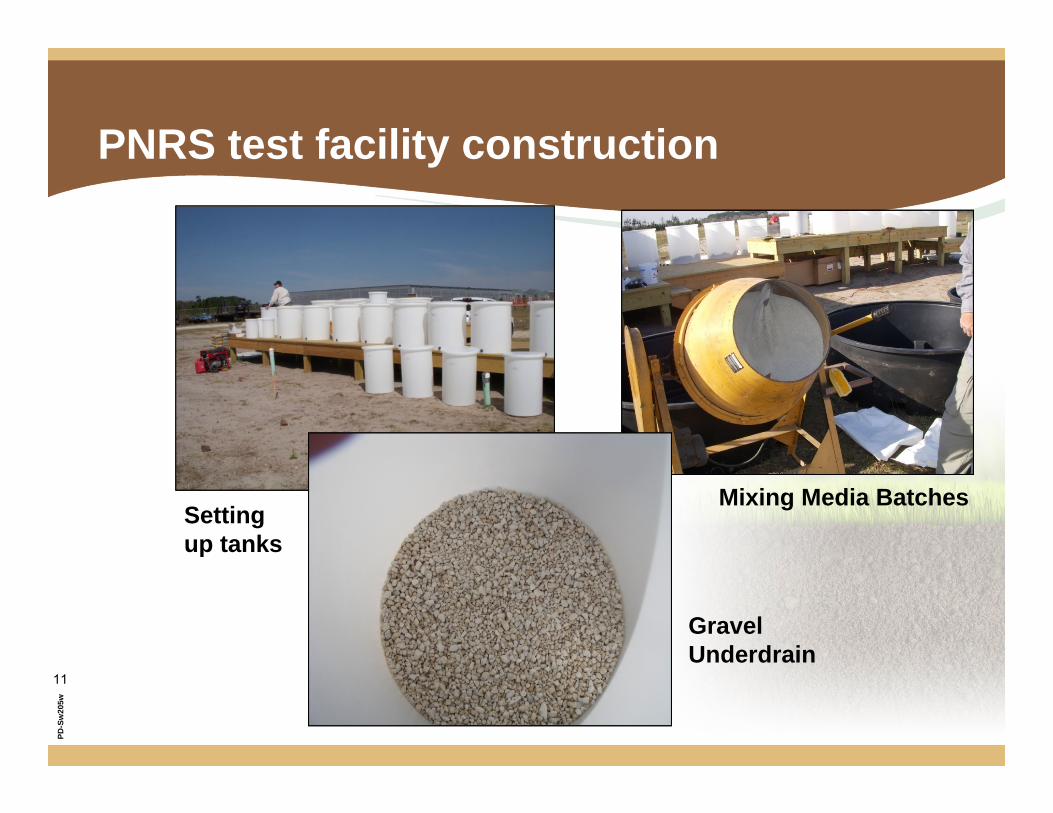
PNRS test facility construction
Setting up tanks
Mixing Media Batches
Gravel Underdrain
PD-S
w20
5w
12
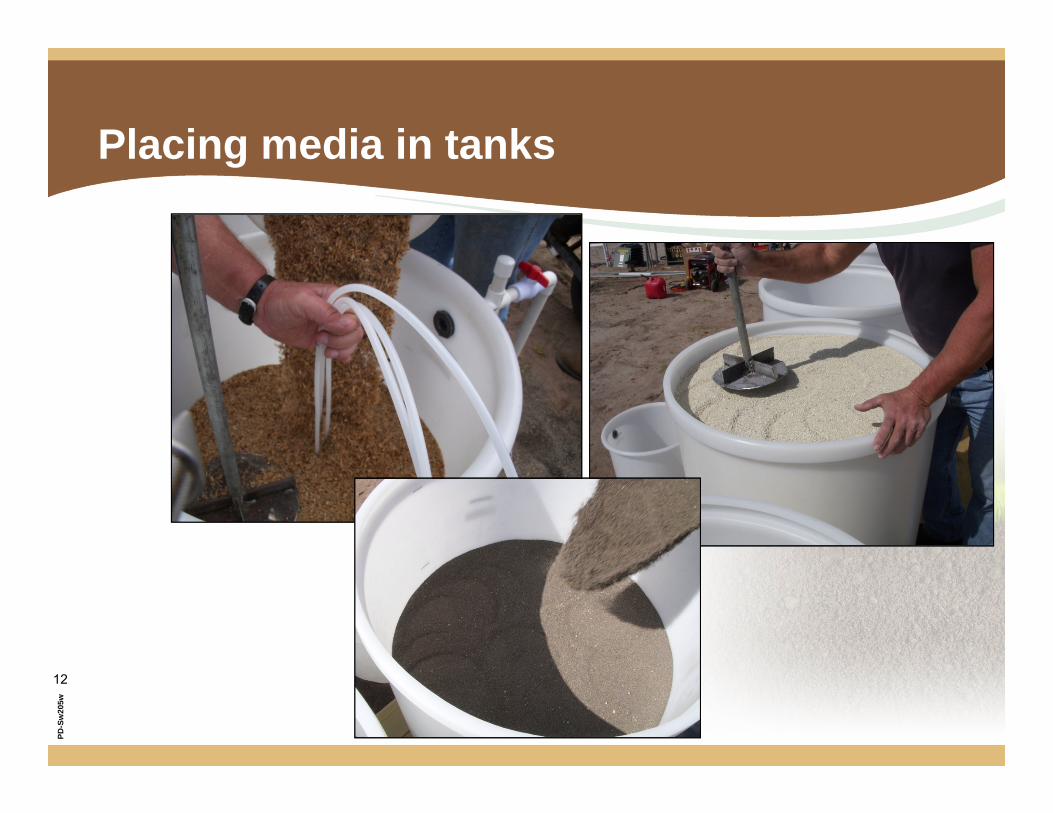
Placing media in tanks

PD-S
w20
5w
13
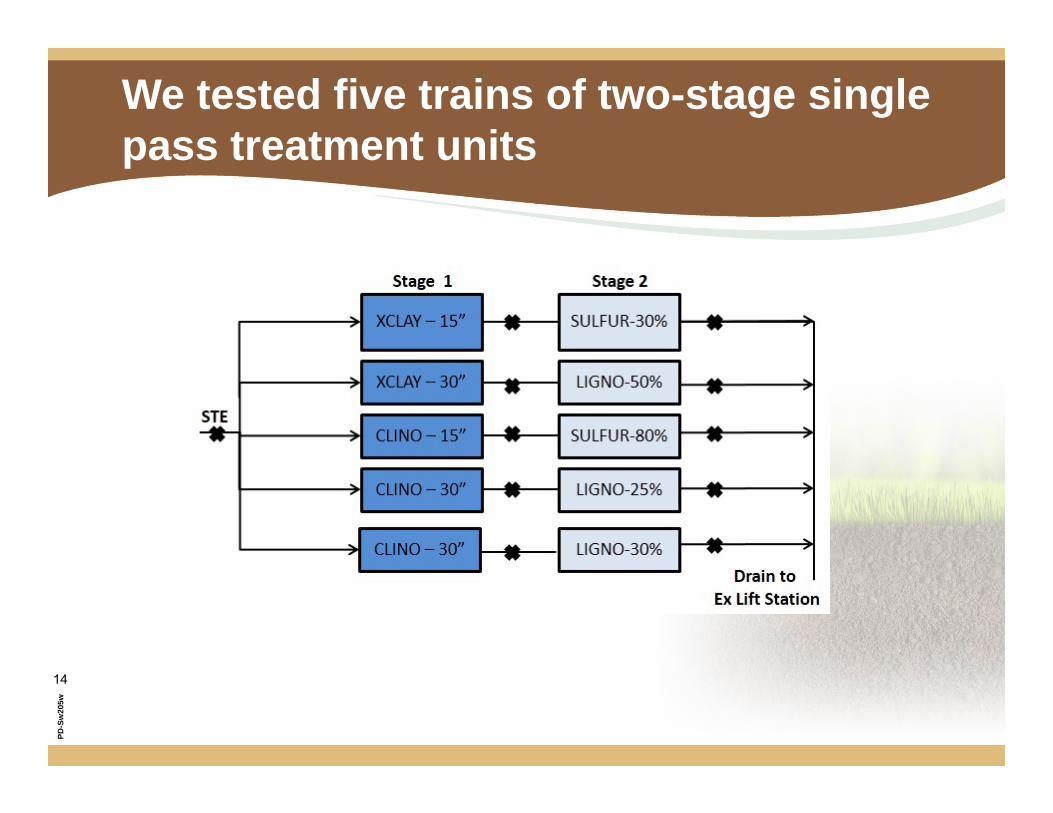
Two stage single pass biofilters
Stage 1 HLR 3 gal/d-ft2
Stage 2 HLR 5.6 gal/d-ft2
PD-S
w20
5w
14
We tested five trains of two-stage single pass treatment units
PD-S
w20
5w
15
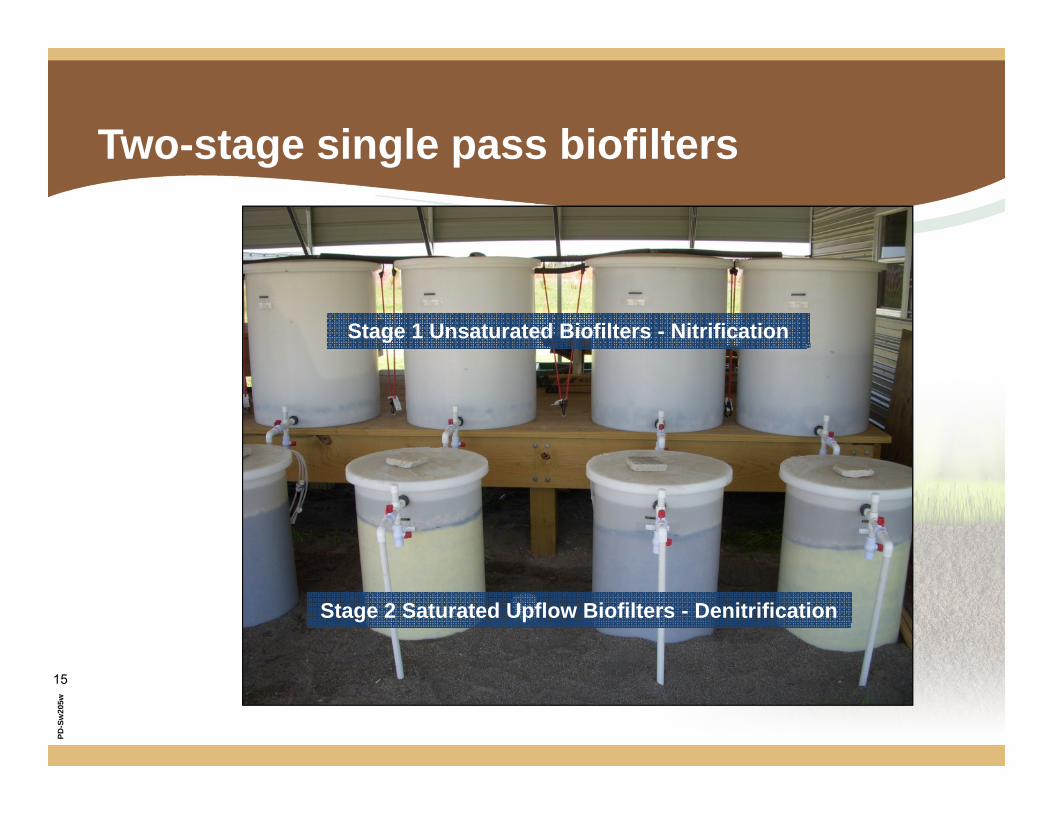
Two-stage single pass biofilters
Stage 1 Unsaturated Biofilters - Nitrification
Stage 2 Saturated Upflow Biofilters - Denitrification

PD-S
w20
5w
16
Stage 1 recirculating biofilters schematic
Nitrified EffluentHolding Tank
Stage 1 HLR 3 gal/d-ft2
Recycle Ratio 3:1
Stage 1

PD-S
w20
5w
17
Horizontal stage 2 biofilters schematic
Peristaltic Pump
Sample Ports
Nitrified Effluent
Nitrified Effluent
Stage 2 HLR 10 gal/d-ft2
PD-S
w20
5w
18
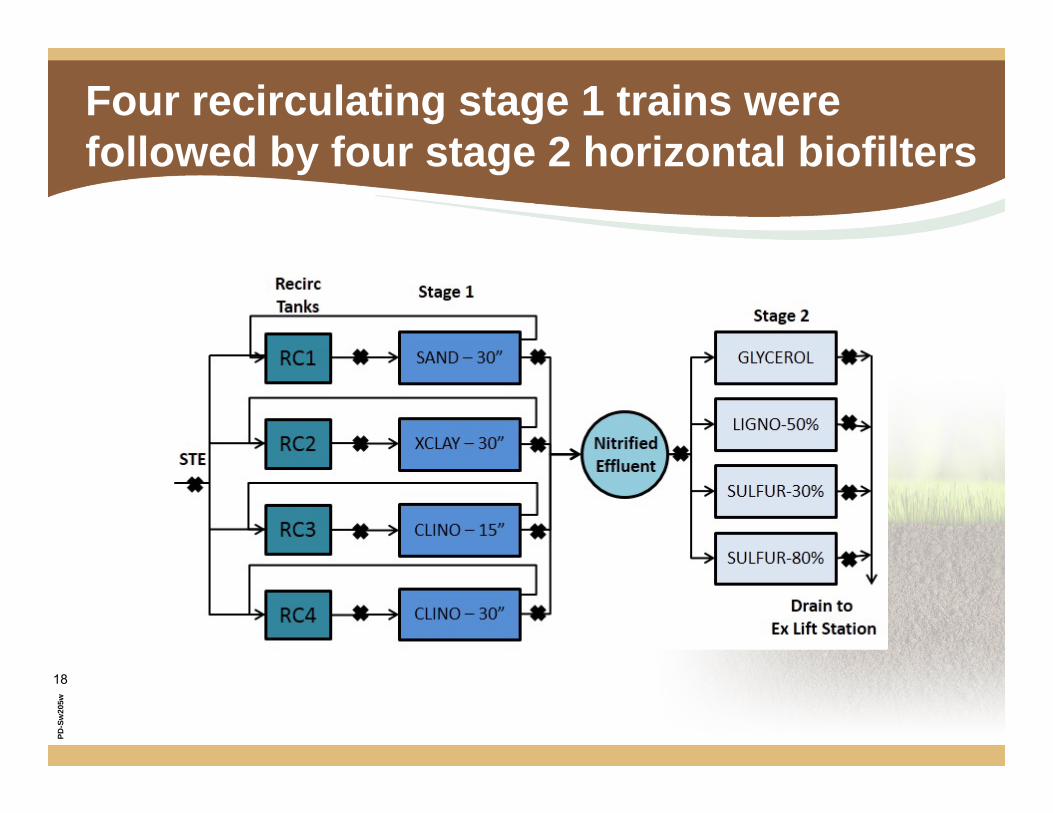
Four recirculating stage 1 trains were followed by four stage 2 horizontal biofilters

PD-S
w20
5w
19
Stage 1 recirculating biofilters & Stage 2 horizontal saturated biofilters
Stage 2 Saturated Biofilters - Denitrification
Stage 1 Unsaturated Biofilters -Nitrification
Pump Tank
Nitrified Effluent
Pump Tank

PD-S
w20
5w
20
PD-S
w20
5w
20
Pilot test results

PD-S
w20
5w
21
PNRS pilot testing influent STE quality
cBOD5 TSS TN TKN NH3‐NTotal
Alkalinity
Septic ta
nk efflue
nt (STE) n 10 10 9 10 9 9
mean 66.8 90.9 55.5 55.8 46.3 332
std. dev. 27.0 136.1 19.9 18.8 19.1 87
min 22 15 30 30 20 210
max 94 467 80 80 67 430
PD-S
w20
5w
22
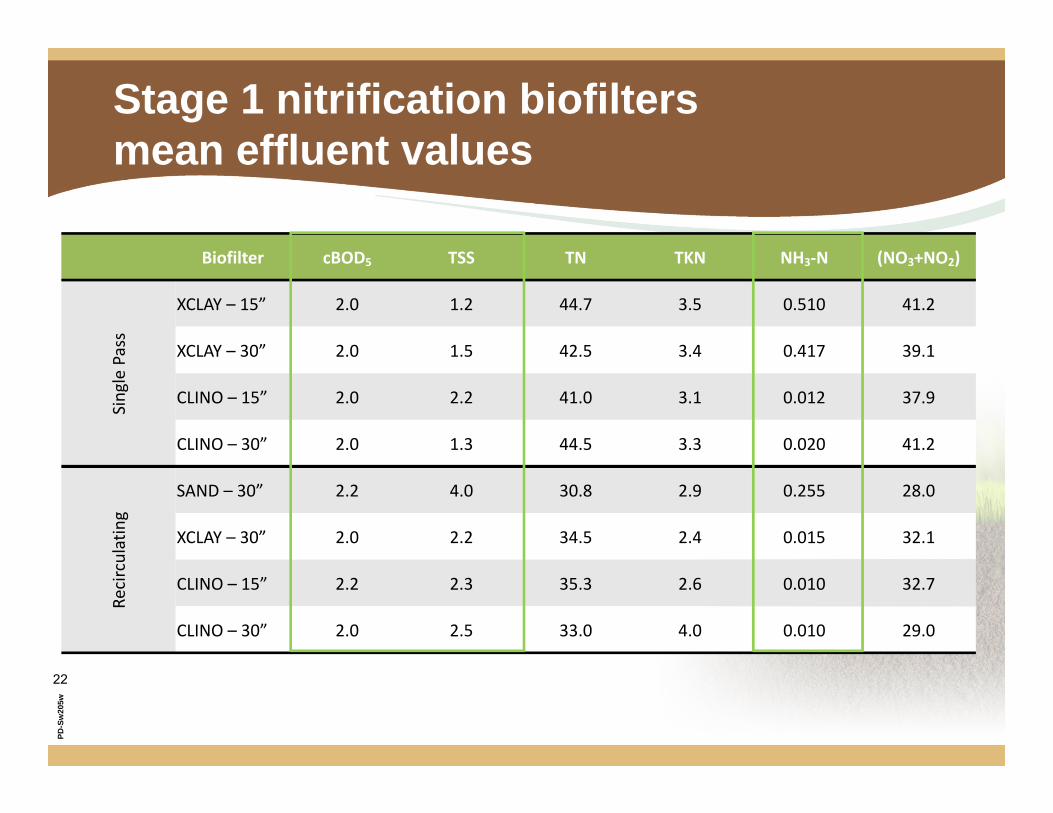
Stage 1 nitrification biofilters mean effluent values
Biofilter cBOD5 TSS TN TKN NH3‐N (NO3+NO2)
Single Pass
XCLAY – 15” 2.0 1.2 44.7 3.5 0.510 41.2
XCLAY – 30” 2.0 1.5 42.5 3.4 0.417 39.1
CLINO – 15” 2.0 2.2 41.0 3.1 0.012 37.9
CLINO – 30” 2.0 1.3 44.5 3.3 0.020 41.2
Recirculating
SAND – 30” 2.2 4.0 30.8 2.9 0.255 28.0
XCLAY – 30” 2.0 2.2 34.5 2.4 0.015 32.1
CLINO – 15” 2.2 2.3 35.3 2.6 0.010 32.7
CLINO – 30” 2.0 2.5 33.0 4.0 0.010 29.0

PD-S
w20
5w
23
Stage 1 single pass biofilters nitrogen time series
Single Pass Expanded Clay: 30 inch depth Single Pass Clinoptilolite: 30 inch depth
CLINO – 30”XCLAY – 30”
PD-S
w20
5w
24
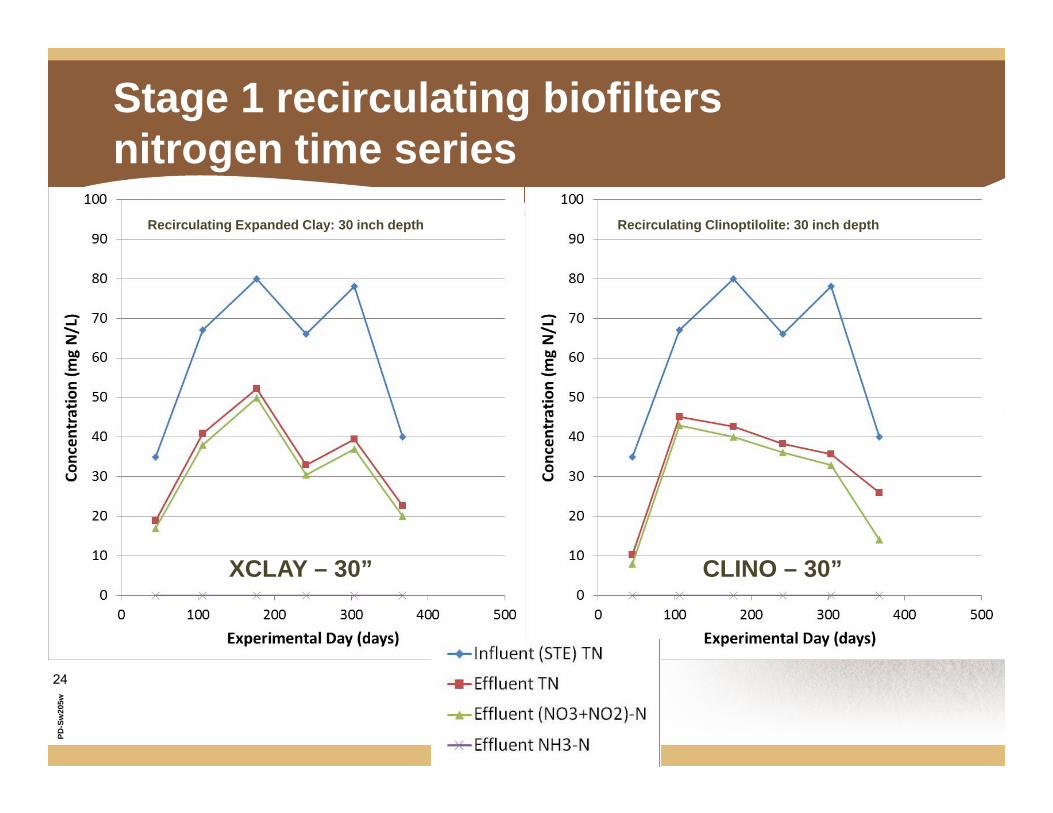
Recirculating Expanded Clay: 30 inch depth
Stage 1 recirculating biofilters nitrogen time series
CLINO – 30”XCLAY – 30”
Recirculating Clinoptilolite: 30 inch depth

PD-S
w20
5w
25
UNSAT-EC1
UNSAT-EC3
UNSAT-CL1
UNSAT-CL3
UNSAT-CL5
UNSAT-SA2
UNSAT-EC4
UNSAT-CL2
UNSAT-CL4
Nitr
ate
& N
itrite
Nitr
ogen
, mg/
L
0
5
10
15
20
25
30
35
40
45
50
55
60
65
70
75
Quartiles: shaded boxMedian: solid lineMean: dotted line
_
_
UNSAT-EC1
UNSAT-EC3
UNSAT-CL1
UNSAT-CL3
UNSAT-CL5
UNSAT-SA2
UNSAT-EC4
UNSAT-CL2
UNSAT-CL4
Amm
onia
Nitr
ogen
, mg/
L
0.0
0.1
0.2
0.3
0.4
0.5
0.6
0.7
0.8
0.9
1.0
1.1
1.2
1.3
1.4
1.5
Quartiles: shaded boxMedian: solid lineMean: dotted line
_
_
Stage 1 nitrification biofilters effluentnitrogen box and whisker plots
Single Pass Recirculating Single Pass Recirculating
Am
mon
ia N
itrog
en, m
g N
/L
Nitr
ate
& N
itrite
Nitr
ogen
, mg
N/L

PD-S
w20
5w
26
Stage 2 denitrification biofilters mean effluent values
Biofilter C‐BOD5 TSS TN TKN NH3‐N (NO3+NO2)
Upflow
SULFUR‐30% 2.0 2.8 1.3 1.2 0.32 0.075
LIGNO‐50% 61.0 1.5 8.3 2.2 0.87 6.18
SULFUR‐80% 6.0 6.2 2.6 2.6 1.14 0.047
LIGNO‐25% 2.0 3.0 17.3 3.1 0.62 14.2
LIGNO‐30% 4.5 7.5 5.9 5.6 4.71 0.22
Horizon
tal
SULFUR‐80% 13.3 1.5 2.5 2.4 1.35 0.11
SULFUR‐30% 8.5 3.5 1.6 1.6 0.58 0.035
LIGNO‐50% 89.5 13.0 10.0 10.0 0.27 0.020
GLYCEROL 10 2.5 3.8 3.8 3.12 0.07

PD-S
w20
5w
27
Stage 2 upflow single pass biofilters nitrogen time series
SULFUR-80%LIGNO-50%

PD-S
w20
5w
28
Stage 2 horizontal biofilters nitrogen time series
SULFUR-80%LIGNO-50%

PD-S
w20
5w
29
DENIT-SU4
DENIT-LS3DENIT-S
U3DENIT-LS2DENIT-LS4DENIT-S
U1DENIT-S
U2DENIT-LS1DENIT-G
L1
Nitr
ate
& N
itrite
Nitr
ogen
, mg/
L
0.0
0.1
0.2
0.3
0.4
0.5
0.6
0.7
DENIT-SU4
DENIT-LS3DENIT-S
U3DENIT-LS2DENIT-LS4DENIT-S
U1DENIT-S
U2DENIT-LS1DENIT-G
L1
Tota
l Nitr
ogen
, mg/
L
0
2
4
6
8
10
12
14
16
18
20
22
24
26
28Quartiles: shaded boxMedian: solid lineMean: dotted line
Stage 2 denitrification biofilters effluentnitrogen box and whisker plots
Mean = 14.2
Upflow HorizontalUpflow Horizontal
Nitr
ate
& N
itrite
Nitr
ogen
, mg
N/L
Tota
l Nitr
ogen
, mg
N/L
PD-S
w20
5w
30
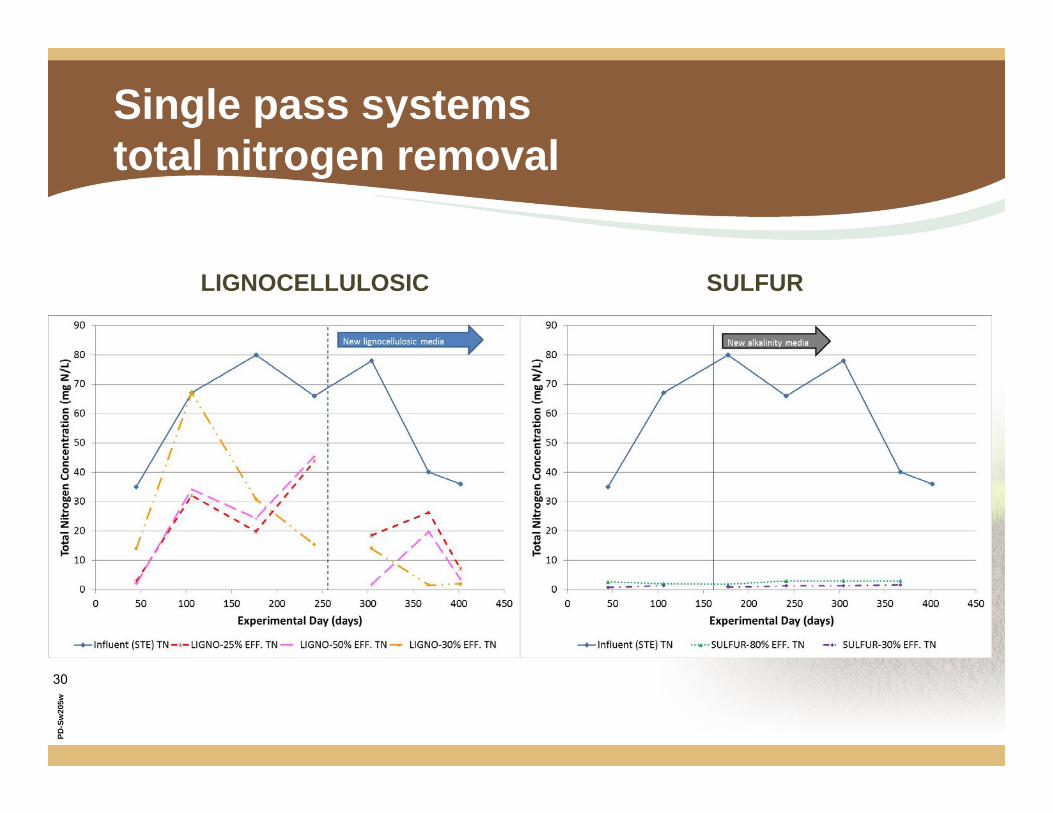
Single pass systemstotal nitrogen removal
SULFURLIGNOCELLULOSIC

PD-S
w20
5w
31
Recirculating systemstotal nitrogen removal
SULFURLIGNOCELLULOSIC
PD-S
w20
5w
32
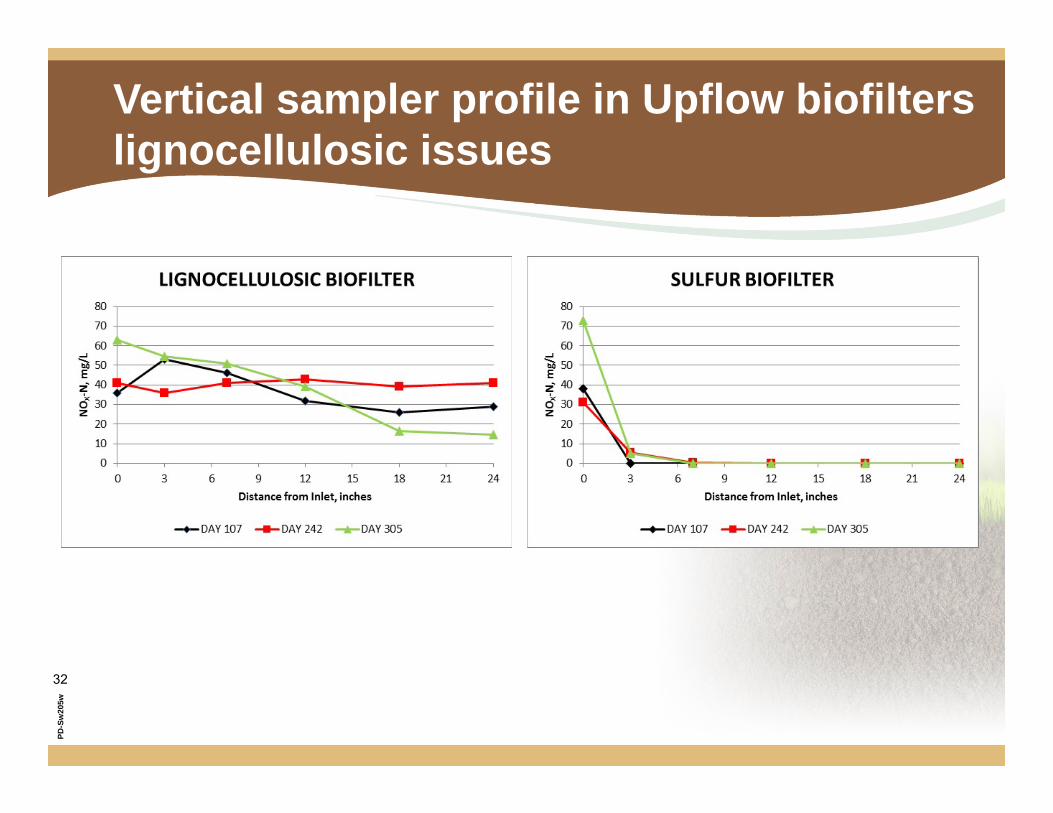
Vertical sampler profile in Upflow biofilterslignocellulosic issues

PD-S
w20
5w
33
Lignocellulosic biofilters hydraulic retention time issues
PD-S
w20
5w
34
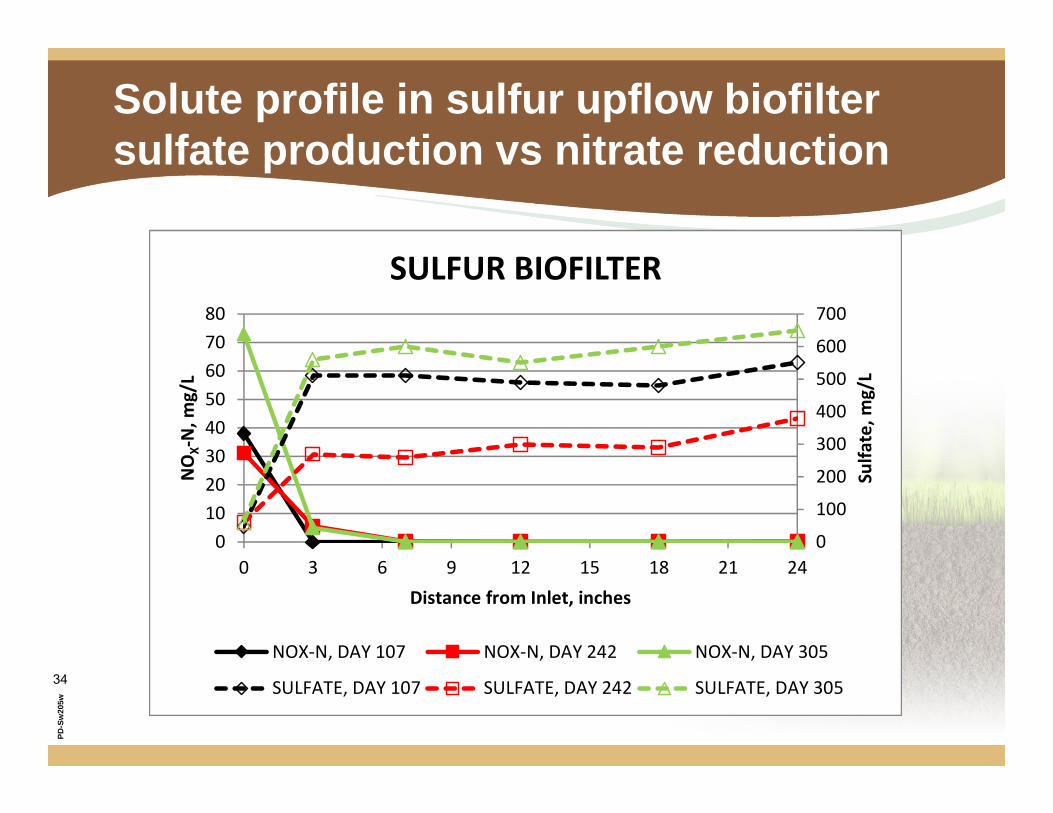
Solute profile in sulfur upflow biofiltersulfate production vs nitrate reduction
0
100
200
300
400
500
600
700
01020304050607080
0 3 6 9 12 15 18 21 24
Sulfa
te, m
g/L
NOX‐N, m
g/L
Distance from Inlet, inches
SULFUR BIOFILTER
NOX‐N, DAY 107 NOX‐N, DAY 242 NOX‐N, DAY 305
SULFATE, DAY 107 SULFATE, DAY 242 SULFATE, DAY 305
PD-S
w20
5w
35
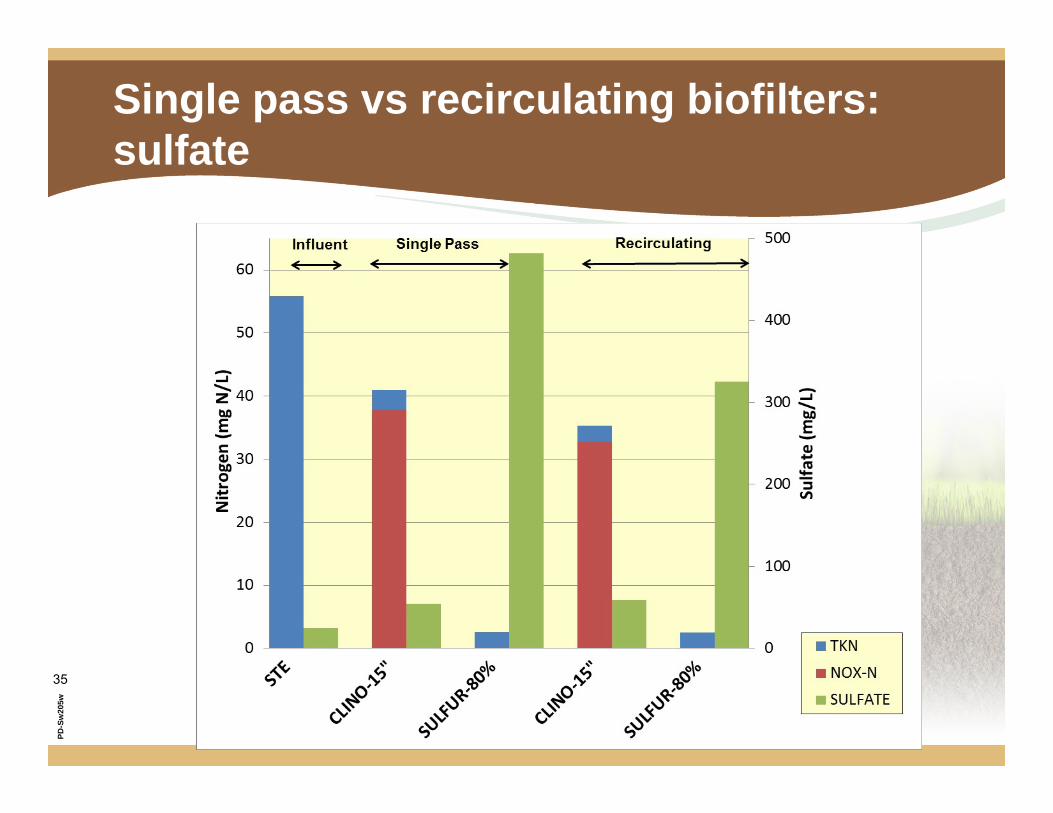
Single pass vs recirculating biofilters: sulfate

PD-S
w20
5w
36
Lessons learned from pilot test
■ Encouraging results from pilot PNRS; several system configurations capable of > 95% N reduction
■ Sulfate production vs nitrate reduction
■ Highly reactive elemental sulfur media
■ Lignocellulosic retention time issues
■ Recommended evaluation of combination lignocellulosic and elemental sulfur denitrification systems for full-scale treatment units

PD-S
w20
5w
37
PD-S
w20
5w
37
Questions?Josefin Edeback-Hirst, P.E.Hazen and Sawyer, P.C.10002 Princess Palm Avenue, Suite 200Tampa, FL [email protected]