
Stolen Elections vs Stolen Votes: Politicization through Elections in Russia 2011-12
©(2006) Swiss Political Science Review 12(4): 191-215
Party Potential and the Pattern of Party Competition in the 2003 Swiss Federal Elections
Georg LUTZUniversity of Berne
Abstract
This article explores both the party potential of the five major parties in Switzerland at the 2003 elections and how well the parties actually did in relation to how well they could have done. A party’s electoral potential depends on both the probability of the electorate voting for the party and on the probability of individual voters participating in an election. The analysis shows that the SVP and the CVP were successful in mobilising their potential voters in the 2003 elections, while the FDP did almost as badly as they could have done. However, compared to the potential of the FDP or the SP, the overall potential of the SVP is limited. For the SVP, issue specific factors account for the mobilising success. This is especially the case for its stands against the EU and asylum seekers. The CVP profited from the Ruth Metzler effect, who was a key figure in the 2003 CVP campaign. Keywords: party potentials, party competition, electoral success
Introduction
After an election we know how successful a party was compared to the previous election: some parties will have won and some parties will have lost votes and seats. In this article I do not try to explain why some people voted for one party or another. Rather, the article tackles the questions of how well parties have done in relation to how well they could have done, and why some parties mobilised their potential voters better than others. My underlying idea is that each party has a certain potential volume of voters who could be expected to vote for them. This potential is higher than the actual vote share, because some of the potential voters will have voted for another party. The party potentials are likely to overlap the party potential of other parties. If there is a big gap between the party potential and the actual vote, the party did not do very well in mobilizing its potential. On the other hand, if the gap is very small, the party did fairly well in mobilizing the potential voters.
How do we find out about the party potentials, or how well a party could have done? In a number of recent electoral surveys, a new concept for de-termining closeness to a certain party has been used. Voters were asked what the probability is that they would ever vote for a specific party. Each voter thus has a certain probability of voting for a particular party. This question is asked for

192 GEORG LUTZ
all the relevant parties in an election. This probability could be very low, e.g., an individual may never vote for party x, and it can be very high, e.g., an individual would very likely vote for party x. In between are the voters whose probability of voting for that party lies between 0 and 1.
This concept implies that voters can have a strong likelihood of voting for more than one party. Different from the concept of party identification, which assumes that voters feel, if at all, close to only one party, the probability of voting question allows for a high likelihood of voting for more than one party.1 Analyses of this question show, that there is indeed a fair amount of overlap between the probabilities of voting for different parties (van der Eijk and Franklin 1996). It is also possible that some citizens do not have a very high probability of voting for any one particular party. In this case it would be likely that such a respondent abstains.
Another aspect of this concept has to be taken into account: voters not only have a certain probability of voting for party x or y, but they also have a certain probability of participating in an election. Some voters may always vote, no matter how unimportant their vote is, while others may never vote. In between these two extremes are the voters who vote in some, but not in all, elections. This makes the puzzle more complicated, because estimates of party potentials have to take into account not only the probability of voting for a certain party, but also the probability of participation. Previous studies in Switzerland have shown that the success of a party depends both on how well they attracted voters from other parties, as well as how well they did in mobilizing their voter base (Lutz 2003, 2006; Selb and Lachat 2004).
At this point it might be useful to discuss the nature of the problem, as well as some of the theoretical and methodological aspects we are trying to solve here. We would like to know how well a particular party could potentially do in relation to how well that party actually performed in a given election. This question is speculative in nature, which dictates that any answer to it must remain hypothetical in nature. Based on survey questions about probabilities of voting for different parties, and based on probabilities of participation, we may be able to find some indication about the overall potential of a party. However, this does not tell us anything about the reasons why a party did well or what a party would need to do better in future. Strictly speaking, it does not tell us anything about the future potential either (see Lutz and Marsh forthcoming; Grofman, Owen, and Collet 1999 for a methodological discussion). Why, then, is this question worth asking at all?
1 The assumption of a one dimensional party ID has been critizised before. Studies have shown that individuals can feel close to more than one party at the same time (Greene 2005; Katz 1979; Niemi, Wright, and Powell 1987; Schoen and Weins 2005; Weisberg 1980).
PARTY POTENTIALS AND PARTY COMPETITION 193
We think it is an important question for various reasons. Several studies have observed an overall dealignment of voters’ ties to parties. Voters do not base their vote choice on long established party ties to the same extent as in the past (Dalton 2000). One consequence of this declining partisanship is an increased volatility between elections (Bartolini and Mair 1990). The Swiss party system, which has changed significantly over the past fifteen years (BFS 2006), is in line with this overall trend. The previously very stable national and cantonal party systems, which were established after the introduction of proportional representation (PR) in 1919, have been broken up in a relatively short period of time beginning in the 1990s (Ladner 2004). These aggregated changes suggest important changes in individual level behaviour. Although it is difficult to reveal the trend of declining partisanship in Switzerland, due to the lack of or inconsistent measures of partisanship, it is likely that the aggregate change in the structure of party competition reflects a much larger change in individual voting behaviour. On the individual level, we would expect an increased number of voters who do not consistently support the same party as well as a higher number of citizens who sometimes vote and sometimes do not. When partisan ties decline, we would also expect that more voters have a high probability of voting for several parties, and hence, we should find a stronger overlap between the different parties’ potentials. Additionally, we would expect an increasing number of citizens who show only low probabilities of voting for all parties, and therefore become nonvoters. It is, however, impossible to find out about such trends, because comparable data over time is not available.
For Switzerland, the question of the potential of parties has some practical relevance. The everyday pattern of party competition between the major parties is not only determined by the current strength of the parties, but also by fears about potential future losses. A party will make assumptions about from which other parties it may gain additional voters. It is likely that parties try to adjust their policy positions and campaign strategies relative to the policy positions of their perceived closest contenders, or in other words, to those parties who from their perspective may have an overlapping voter potential. This is especially true for the three main centre-right wing parties, the liberal party (FDP – Freisinnig-Demokratische Partei der Schweiz), the Christian Democratic Party (CVP – Christlich-Demokratische Volkspartei der Schweiz) and the Swiss People’s party (SVP - Schweizerische Volkspartei).
The party blocks have been very stable in Switzerland for a very long time (BFS 2006). In the centre-right wing camp, vote shares of the SVP went up, while the vote shares of the FDP, CVP, and smaller parties went down. This, of course, does not allow for the drawing of conclusions about individual behaviour, but it seems more likely that voters switched within, rather than between blocks (see Lutz 2003). The SVP has always run a strategy of attacking not only the left

194 GEORG LUTZ
parties, but also the parties that were relatively close to them. This has been done on the grounds that there are far more voters to be won from the parties close to them than from leftist parties. And, facing the threat of further gains by the SVP, the FDP and the CVP have moved some of their policies towards those of the SVP. They fear that, without such a policy-shift, the SVP could make further electoral gains at their expense. Furthermore, fears about future gains has lead the parliament to not only give the SVP a second seat in the 7 seat federal coun-cil, but also to vote the informal leader of the SVP, Christoph Blocher, into the government. The strategy behind this move was to include the main opposition actor into the government to weaken the overall capacity of the SVP to mobilize protest voters that are unsatisfied with current policies or with the government in general. We can expect a similar trend within the left parties. The vote share of the Social-Democrat party (SP – Sozialdemokratische Partei der Schweiz) went down while the vote share of the Green party increased. Compared to the competition between the centre-right wing parties, the SP and the Greens are not fighting each other as strongly and openly.
The article is divided into three parts. The first part discusses methodo-logical issues related to the probability of voting for a party. Part Two of the article explores the party potentials among the voters for each of the five largest parties in Switzerland (SVP, SP, FDP, CVP, Green party), as well as the pattern of party competition (i.e. the party potential overlap) at the 2003 Swiss national elections. In the last section of this part we consider the impact of non-voters as well. Finally, Part Three tries to find out why some parties did well in getting out the vote and others did not.
The probability of voting
The survey data used in this analysis comes from the 2003 Swiss election study. I used the post-election sample, which includes 5891 interviews. The sample is not representative of the entire country because, in a number of cantons the sample size was increased in order to get a sufficient number of interviews to allow for an in-depth analysis of some cantons. In order to account for this sample bias, we have re-weighted the data.2
The main survey questions used in this article are about the probability of voting for a party. Respondents were asked what the probability of voting for a particular party was. The scale offered to the respondents ranged from 0,
2 A further weighting had to be used to adjust for the overreporting of participation and vote choice. While in reality 45% of the citizens participated, the participation rate in the sample was 68%. The SP voters are overrepresented while the Greens and the FDP are underrepresented (for details see Selb and Lachat 2004).
PARTY POTENTIALS AND PARTY COMPETITION 195
indicating a very low probability of voting for a particular party, to 10, indicating a very high probability of voting for a particular party. This question was asked for seven parties, however, we only included the questions about the probability of voting for the four major governmental parties, the FDP, CVP, SVP and SP, and the Green party. We limit the scope in this way because the other parties only compete in a limited number of cantons, and their vote share is too small to get a sufficient number of survey respondents in order to run a meaningful analysis.
The next point to clarify is what the probability of voting actually means. Does it mean that somebody indicating a probability of 5 has a 50-50 chance of voting for a party, and that somebody indicating a probability of 3 would vote for that party 3 times out of 10 elections? If so, the scale could be treated as a linear scale. This, however, may not be true.
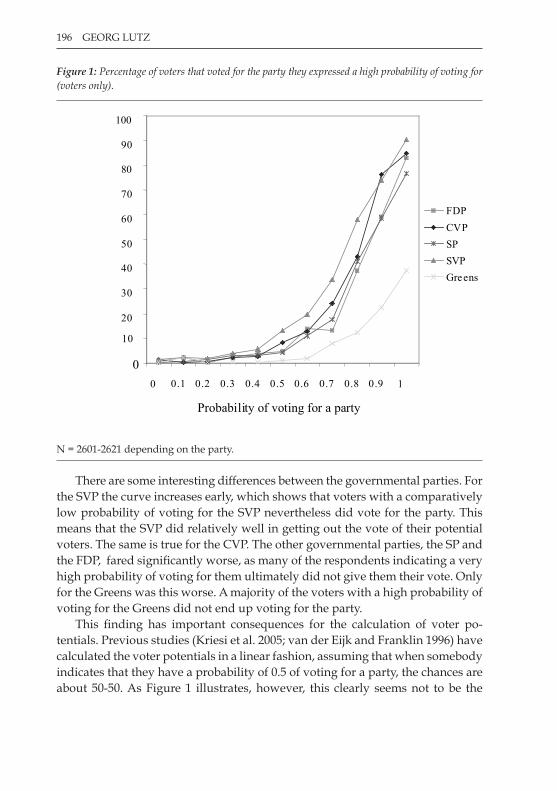
Figure 1 shows the relationship between the probability of voting and the actual vote choice. Specifically, the lines show the answers to questions regarding the probability of voting for a certain party relative to the actual voting decision of respondents in regards to that party. For example, the point above the 1.0 in the figure for each party means that about 40% of the respondents that indicated a probability of 1.0 of voting for the Greens actually voted for the Greens.
The figure reveals an overall trend and some first interesting differences. In general, the relationship between the probability of voting question and the actual voting decisions of respondents is not at all linear.3 We can see that of all the respondents who indicated a probability of voting for a party lower than 0.5 (or 5 on the 0-10 scale), hardly anybody voted for that party. In fact, less than 20% of the voters who indicated a probability of 0.5 or 0.6 actually voted for the party in question., With certain parties, more than 50% of the respondents voted for the party in question only when the probability of voting for that party reached the level of 0.8 or above. Even of those voters who show a full probability (i.e., 1) of voting for a party, only 90% actually voted for the corresponding party. However, this holds true only for the four major governmental parties. In the case of the Green party, a mere 40% of the respondents with a probability of 1 of voting for the Greens actually did vote for the party.
3 Some other surveys asked about sympathy scores (on a scale from 0-10 instead of the probability of voting questions). Interestingly enough, when one compares sympathy with the actual vote choice, the outcome is almost exactly the same (see Pettersen and Rose forthcoming).
196 GEORG LUTZ
Figure 1: Percentage of voters that voted for the party they expressed a high probability of voting for (voters only).
0
100
200
300
400
500
600
700
80
900
100
0 0.1 1
0 .22
0.33
0.44
0.55
0.66
0.77
0.88
0.99
1
FDP
CVP
SP
SVP
Greens
Probability of voting for a party
N = 2601-2621 depending on the party.
There are some interesting differences between the governmental parties. For the SVP the curve increases early, which shows that voters with a comparatively low probability of voting for the SVP nevertheless did vote for the party. This means that the SVP did relatively well in getting out the vote of their potential voters. The same is true for the CVP. The other governmental parties, the SP and the FDP, fared significantly worse, as many of the respondents indicating a very high probability of voting for them ultimately did not give them their vote. Only for the Greens was this worse. A majority of the voters with a high probability of voting for the Greens did not end up voting for the party.
This finding has important consequences for the calculation of voter po-tentials. Previous studies (Kriesi et al. 2005; van der Eijk and Franklin 1996) have calculated the voter potentials in a linear fashion, assuming that when somebody indicates that they have a probability of 0.5 of voting for a party, the chances are about 50-50. As Figure 1 illustrates, however, this clearly seems not to be the
PARTY POTENTIALS AND PARTY COMPETITION 197
case. For all parties, a probability of voting for a party of 50% means that on average less than 10% of the respondents actually end up voting for that party.
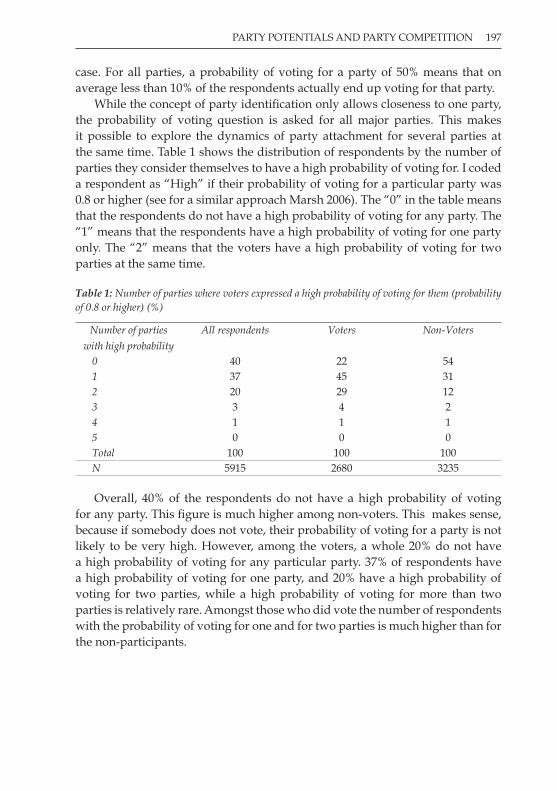
While the concept of party identification only allows closeness to one party, the probability of voting question is asked for all major parties. This makes it possible to explore the dynamics of party attachment for several parties at the same time. Table 1 shows the distribution of respondents by the number of parties they consider themselves to have a high probability of voting for. I coded a respondent as “High” if their probability of voting for a particular party was 0.8 or higher (see for a similar approach Marsh 2006). The “0” in the table means that the respondents do not have a high probability of voting for any party. The “1” means that the respondents have a high probability of voting for one party only. The “2” means that the voters have a high probability of voting for two parties at the same time.
Table 1: Number of parties where voters expressed a high probability of voting for them (probability of 0.8 or higher) (%)
Number of parties with high probability
All respondents Voters Non-Voters
0 40 22 541 37 45 312 20 29 123 3 4 24 1 1 15 0 0 0Total 100 100 100N 5915 2680 3235
Overall, 40% of the respondents do not have a high probability of voting for any party. This figure is much higher among non-voters. This makes sense, because if somebody does not vote, their probability of voting for a party is not likely to be very high. However, among the voters, a whole 20% do not have a high probability of voting for any particular party. 37% of respondents have a high probability of voting for one party, and 20% have a high probability of voting for two parties, while a high probability of voting for more than two parties is relatively rare. Amongst those who did vote the number of respondents with the probability of voting for one and for two parties is much higher than for the non-participants.
198 GEORG LUTZ
Estimating party potential in Swiss elections
Party potentials of actual voters
In the next step, we will look at the party potentials and their overlaps for those respondents who actually voted. Further, we will explore how well the parties did in relation to how well they could have done. Based on the analysis of figure 1, it makes no sense to treat the probability of voting question as a linear indication of how likely someone is to vote for a party. Below a probability of 0.5, very few people ultimately end up giving their vote to the corresponding party. So when somebody indicates a probability of voting for a party of 0.4 or lower, the chance that they will vote for the corresponding party is extremely unlikely. At the 0.5 level and slightly above, some respondents actually voted for a party, but the number is still very low. Only from the 0.8 level did more than 50% of the voters actually vote for the party they indicated to have such a high probability of voting for.
I therefore used the 0.8 and 0.5 levels as thresholds to group the different voters. I called the 0.8 probability threshold the “reliable potential”, indicating that with a probability to vote of 0.8 or above, the number of voters who will potentially vote for that particular party is high. With a probability of lower than 0.5, it becomes extremely unlikely that somebody will vote for that particular party, so they need not to be taken into account. The second threshold therefore was used to indicate a probability of voting for a party of 0.5 or higher.4 However, given that even below 0.8 it will be very difficult to mobilise all presumptive voters, I assumed that the potential between 0.5 and 0.7 is only half of those voters because it will be extremely unlikely that a party would possible get out more than half of those voters. Therefore, the maximum potential was calculated as followed:
Maximum potential = Number of respondents with p higher than 0.8 of voting for that party
(which is equal to the reliable potential) + half of the voters with p between 0.5 and 0.7.
4 One way to calculate the potentials would be to use the approach specified in Lachat and Selb (2005) and van der Eijk and Franklin (1996). The potentials in those studies were calculated by giving everybody with a probability of 1 the score of 1, with a probability of 0.9, a score of 0.9, and so on. Those values were added and the totals were applied to all the respondents. With such an approach, the potentials of some parties become very large. Especially when considering the fact that below a probability of 0.5 hardly anybody votes for that party, this method overestimates the actual potential. Therefore, a different strategy has been applied which uses this two step weighting. Thresholds of 0.8 and 0.5, instead of giving different weights to different probabilities, were used in order to isolate figures that point to a clear indication of behaviour.

PARTY POTENTIALS AND PARTY COMPETITION 199
Table 2 also shows the two mobilisation ratios, which indicate the percentage of voters within the reliable or the maximum potential that actually voted for the corresponding party. For example, the figure of 77% for the SVP means that 77% of the voters with a probability of 0.8 or higher of voting for the SVP actually did vote SVP.
Table 2: Vote share of the different parties, party potentials and mobilisation ratios (voters only (%)).
Vote share
2003
Reliable
potential
Mobilisation
ratio I
Maximum
Potential
Mobilisation
ratio II
N
SVP 27 27 77 36 68 696FDP 17 23 56 41 40 609CVP 14 15 64 30 44 380SP 23 32 61 45 49 838Greens 8 24 24 37 18 636
Looking at the different parties, we can see that the SVP has a reliable potential of 27%. This reliable potential is about the size of the actual vote share. Within this reliable potential, 77% of the voters actually voted for the SVP. The maximum potential at the 2003 elections was 36%: if in addition to all the reliable voters half of the voters with a probability of 0.5 to 0.7 of voting for the SVP would have voted SVP, the SVP would have gained 36% of the votes. The overall mobilisation ratio was 68%. These figures show that the SVP, which has by far the highest mobilisation ratio, did mobilise its potential very well relative to the other parties.
The FDP has a reliable potential of 23%, but has the lowest mobilisation ratio within the reliable potential of all four governmental parties. Just over half of the voters with a high probability of voting for the FDP did actually vote for the FDP. In other words, the FDP did very badly in relation to how well the party could have done at the 2003 elections. On the other hand, the maximum potential of the FDP shows that a lot of people would potentially vote for the FDP. Given its high maximum potential then, the FDP’s actual performance points to poor mobilization, as only 40% of the FDP “Sympathisers” actually voted for the FDP.
The CVP has a reliable potential of 15%. Despite this being by far the smallest potential of the four major parties, it performed, relatively speaking, fairly well, as 64% of the voters with a high probability of voting for the CVP did actually vote for them. The CVP’s maximum potential is lower than the FDP’s maximum potential, although both parties are competing for the political centre. This shows that although the two parties have similarly low vote shares, the

200 GEORG LUTZ
potentials for the two parties are quite different. Nevertheless the CVP did fairly well in mobilising its potential voters.
The SP has the highest reliable potential, and managed to mobilise fairly well within that potential. The SP also has the highest maximum potential, and again managed to mobilise their potential voters very well. The Greens did much worse relative to how they could have done. They have a high reliable and maximum potential, however, they did very badly in mobilising this potential. This has to do with the fact that there is a large overlap between the potential SP and the potential Green voters, as will be explained in the next section.
These overall differences may hide some cantonal differences. Especially between language regions, we can expect a significant amount of variation between the parties. The SVP has been very successful in the German speaking area. They have not (yet), however, managed to be equally successful in the French and Italian speaking cantons. Therefore, we can expect that both the SVP’s potential, as well as its mobilisation ratio, is smaller in the French and Italian speaking parts than in the German speaking areas. For the other parties, we would then expect slightly better in the French and Italian speaking areas.
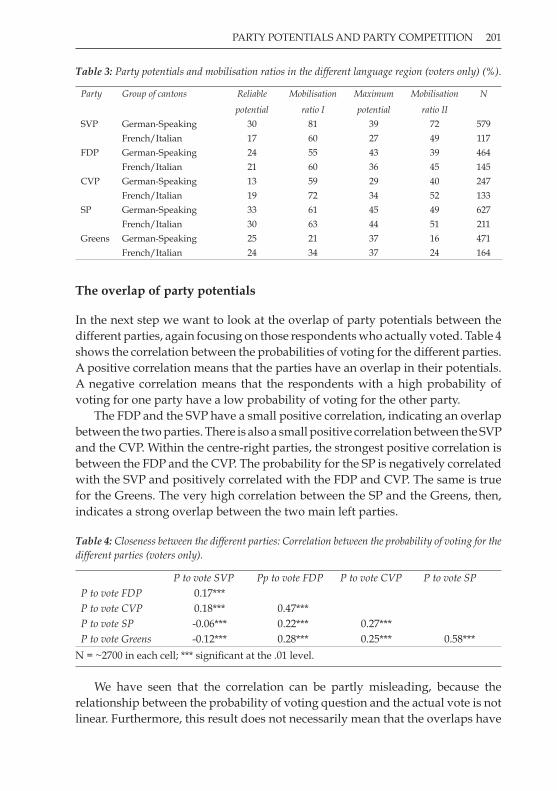
Table 3 shows the differences between language regions. The SVP does indeed have a much smaller potential in the French and Italian speaking cantons than in the German speaking cantons, which corresponds with the smaller vote share of the SVP in that area of Switzerland. The expectation that its mobilisation ratio is lower than that of the other parties in the region is confirmed. In the French and Italian speaking areas, the SVP did not manage to mobilise its potential as well as they did in the German speaking areas. Surprisingly this does not lead to a significantly higher party potential for the other parties. Only the CVP has a significantly higher potential in the French and Italian speaking areas than in the German speaking areas. This, however, is based on the fact that many of the traditional CVP strongholds are in the French and Italian speaking areas (Valais, Fribourg, Ticino). The CVP however had a much lower mobilisation ratio in the German speaking areas than in the French and Italian speaking areas.
PARTY POTENTIALS AND PARTY COMPETITION 201
Table 3: Party potentials and mobilisation ratios in the different language region (voters only) (%).
Party Group of cantons Reliable
potential
Mobilisation
ratio I
Maximum
potential
Mobilisation
ratio II
N
SVP German-Speaking 30 81 39 72 579French/Italian 17 60 27 49 117
FDP German-Speaking 24 55 43 39 464French/Italian 21 60 36 45 145
CVP German-Speaking 13 59 29 40 247French/Italian 19 72 34 52 133
SP German-Speaking 33 61 45 49 627French/Italian 30 63 44 51 211
Greens German-Speaking 25 21 37 16 471French/Italian 24 34 37 24 164
The overlap of party potentials
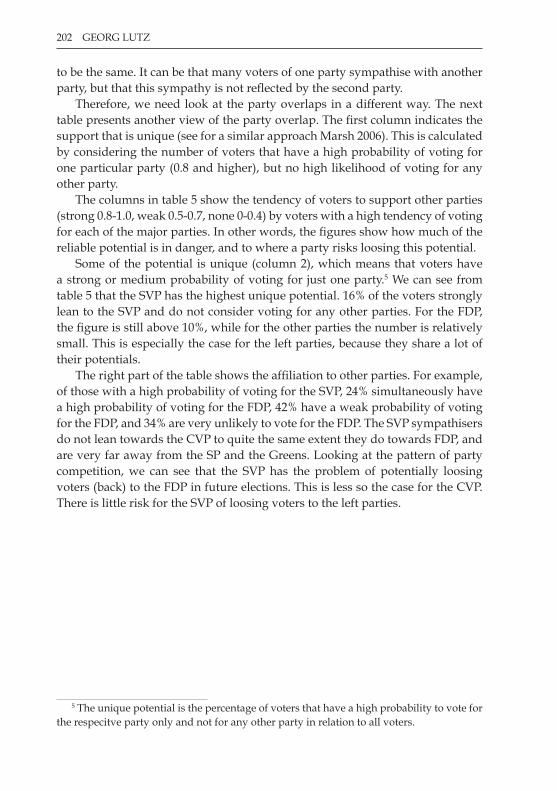
In the next step we want to look at the overlap of party potentials between the different parties, again focusing on those respondents who actually voted. Table 4 shows the correlation between the probabilities of voting for the different parties. A positive correlation means that the parties have an overlap in their potentials. A negative correlation means that the respondents with a high probability of voting for one party have a low probability of voting for the other party.
The FDP and the SVP have a small positive correlation, indicating an overlap between the two parties. There is also a small positive correlation between the SVP and the CVP. Within the centre-right parties, the strongest positive correlation is between the FDP and the CVP. The probability for the SP is negatively correlated with the SVP and positively correlated with the FDP and CVP. The same is true for the Greens. The very high correlation between the SP and the Greens, then, indicates a strong overlap between the two main left parties.
Table 4: Closeness between the different parties: Correlation between the probability of voting for the different parties (voters only).
P to vote SVP Pp to vote FDP P to vote CVP P to vote SPP to vote FDP 0.17***P to vote CVP 0.18*** 0.47***P to vote SP -0.06*** 0.22*** 0.27***P to vote Greens -0.12*** 0.28*** 0.25*** 0.58***
N = ~2700 in each cell; *** significant at the .01 level.
We have seen that the correlation can be partly misleading, because the relationship between the probability of voting question and the actual vote is not linear. Furthermore, this result does not necessarily mean that the overlaps have
202 GEORG LUTZ
to be the same. It can be that many voters of one party sympathise with another party, but that this sympathy is not reflected by the second party.
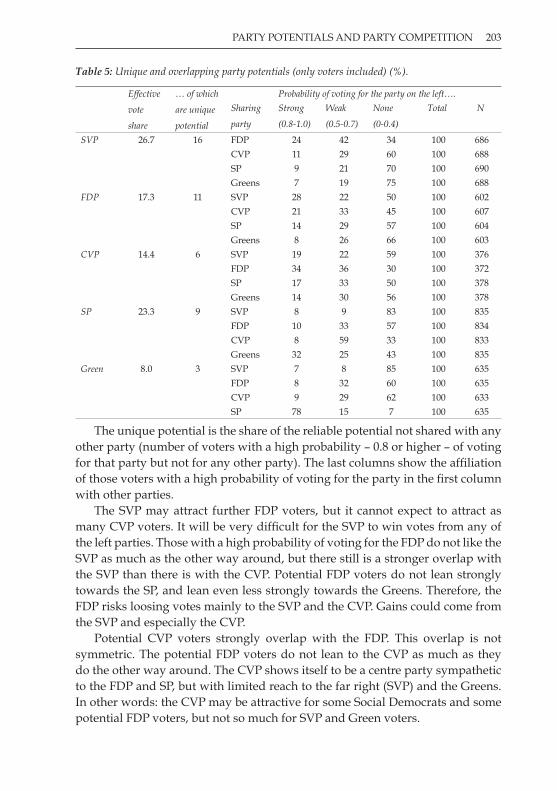
Therefore, we need look at the party overlaps in a different way. The next table presents another view of the party overlap. The first column indicates the support that is unique (see for a similar approach Marsh 2006). This is calculated by considering the number of voters that have a high probability of voting for one particular party (0.8 and higher), but no high likelihood of voting for any other party.
The columns in table 5 show the tendency of voters to support other parties (strong 0.8-1.0, weak 0.5-0.7, none 0-0.4) by voters with a high tendency of voting for each of the major parties. In other words, the figures show how much of the reliable potential is in danger, and to where a party risks loosing this potential.
Some of the potential is unique (column 2), which means that voters have a strong or medium probability of voting for just one party.5 We can see from table 5 that the SVP has the highest unique potential. 16% of the voters strongly lean to the SVP and do not consider voting for any other parties. For the FDP, the figure is still above 10%, while for the other parties the number is relatively small. This is especially the case for the left parties, because they share a lot of their potentials.
The right part of the table shows the affiliation to other parties. For example, of those with a high probability of voting for the SVP, 24% simultaneously have a high probability of voting for the FDP, 42% have a weak probability of voting for the FDP, and 34% are very unlikely to vote for the FDP. The SVP sympathisers do not lean towards the CVP to quite the same extent they do towards FDP, and are very far away from the SP and the Greens. Looking at the pattern of party competition, we can see that the SVP has the problem of potentially loosing voters (back) to the FDP in future elections. This is less so the case for the CVP. There is little risk for the SVP of loosing voters to the left parties.
5 The unique potential is the percentage of voters that have a high probability to vote for the respecitve party only and not for any other party in relation to all voters.
PARTY POTENTIALS AND PARTY COMPETITION 203
Table 5: Unique and overlapping party potentials (only voters included) (%).
Effective
vote
share
… of which
are unique
potential
Probability of voting for the party on the left….
Sharing
party
Strong
(0.8-1.0)
Weak
(0.5-0.7)
None
(0-0.4)
Total N
SVP 26.7 16 FDP 24 42 34 100 686CVP 11 29 60 100 688SP 9 21 70 100 690Greens 7 19 75 100 688
FDP 17.3 11 SVP 28 22 50 100 602CVP 21 33 45 100 607SP 14 29 57 100 604Greens 8 26 66 100 603
CVP 14.4 6 SVP 19 22 59 100 376FDP 34 36 30 100 372SP 17 33 50 100 378Greens 14 30 56 100 378
SP 23.3 9 SVP 8 9 83 100 835FDP 10 33 57 100 834CVP 8 59 33 100 833Greens 32 25 43 100 835
Green 8.0 3 SVP 7 8 85 100 635FDP 8 32 60 100 635CVP 9 29 62 100 633SP 78 15 7 100 635
The unique potential is the share of the reliable potential not shared with any other party (number of voters with a high probability – 0.8 or higher – of voting for that party but not for any other party). The last columns show the affiliation of those voters with a high probability of voting for the party in the first column with other parties.
The SVP may attract further FDP voters, but it cannot expect to attract as many CVP voters. It will be very difficult for the SVP to win votes from any of the left parties. Those with a high probability of voting for the FDP do not like the SVP as much as the other way around, but there still is a stronger overlap with the SVP than there is with the CVP. Potential FDP voters do not lean strongly towards the SP, and lean even less strongly towards the Greens. Therefore, the FDP risks loosing votes mainly to the SVP and the CVP. Gains could come from the SVP and especially the CVP.
Potential CVP voters strongly overlap with the FDP. This overlap is not symmetric. The potential FDP voters do not lean to the CVP as much as they do the other way around. The CVP shows itself to be a centre party sympathetic to the FDP and SP, but with limited reach to the far right (SVP) and the Greens. In other words: the CVP may be attractive for some Social Democrats and some potential FDP voters, but not so much for SVP and Green voters.
204 GEORG LUTZ
Potential SP and Green voters strongly dislike the SVP. SP voters have some sympathy for the CVP, little for the FDP, and hardly any for the SVP. Green voters mainly have sympathy for the SP. The pattern of overlap is interesting. Almost all Green voters have a high probability of voting for the SP, but this is not the case the other way around. 40% of the SP voters have a low probability of voting for the Greens. Differences also exist in the overlap with the CVP. The Greens have a very limited overlap with any party but the SP. For the pattern of party competition, this means that the Greens can win and loose votes almost exclusively from potential Social Democratic voters. The SP risks losing voters to the CVP. However, it has a limited capacity for winning votes from any party but the Greens.
Taking non-voters into account
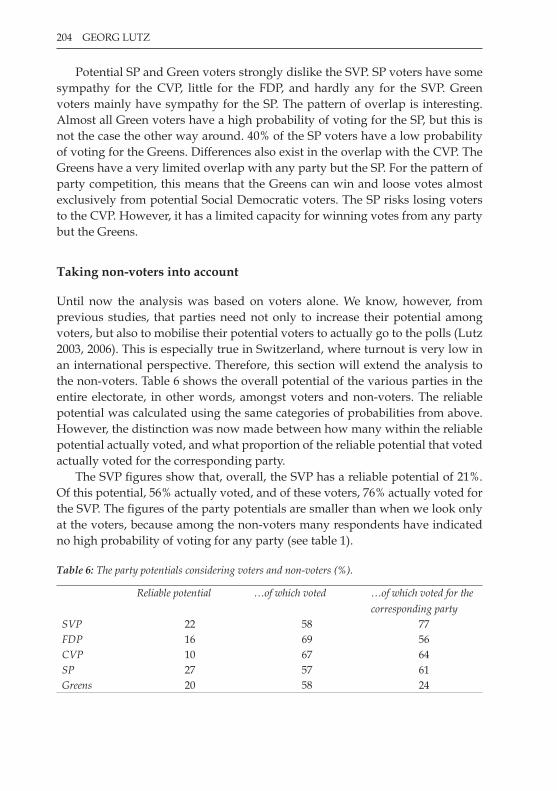
Until now the analysis was based on voters alone. We know, however, from previous studies, that parties need not only to increase their potential among voters, but also to mobilise their potential voters to actually go to the polls (Lutz 2003, 2006). This is especially true in Switzerland, where turnout is very low in an international perspective. Therefore, this section will extend the analysis to the non-voters. Table 6 shows the overall potential of the various parties in the entire electorate, in other words, amongst voters and non-voters. The reliable potential was calculated using the same categories of probabilities from above. However, the distinction was now made between how many within the reliable potential actually voted, and what proportion of the reliable potential that voted actually voted for the corresponding party.
The SVP figures show that, overall, the SVP has a reliable potential of 21%. Of this potential, 56% actually voted, and of these voters, 76% actually voted for the SVP. The figures of the party potentials are smaller than when we look only at the voters, because among the non-voters many respondents have indicated no high probability of voting for any party (see table 1).
Table 6: The party potentials considering voters and non-voters (%).
Reliable potential …of which voted …of which voted for the corresponding party
SVP 22 58 77FDP 16 69 56CVP 10 67 64SP 27 57 61Greens 20 58 24
PARTY POTENTIALS AND PARTY COMPETITION 205
The SVP has a low number of people indicating a high probability of voting for the SVP that effectively went to the polls. However, the SVP was by far the best in mobilising its potential voters. The FDP and CVP have the highest number of people with a high probability of voting for them that actually went to the polls, but they were not as good as the SVP in inducing those voters to ultimately vote for them. The SP had the lowest number of potential voters that went to the polls. The Greens were also particularly bad in getting out the vote. For all the parties, the maximum potential of voting is around 50%. Within this potential, the number of people that voted SP or SVP respectively was much higher than the number of people who voted for FDP or CVP.
Why did some parties perform better than others?
Although we have a clearer picture of both the parties’ potential and their subsequent performance, we still do not know why some did better than others in mobilising their voters. For the SVP, the mobilisation ratio of the reliable potential was 77%, while for the Green party it was only 24%. The SVP thus did significantly better in mobilizing its potential voters than did the Green party. To explain these differences in the mobilisation ratio will be the goal of this last section.
The following analysis will consider for each of the five parties included in the analysis what made their potential voters vote for that party. While some respondents had a high probability of voting for a party and ultimately did vote for that party, some respondents had a high probability of voting for a party but did not vote for that party.
I have a number of hypotheses for why somebody would (or would not) vote for a party, although he/she had a high probability of doing so.
The first possibility to consider is that respondents also had a high probability of voting for another party. This is an obvious and simple explanation. We can see from table 1 that about 30% of the voters had a high probability of voting for more than one party. We therefore expect that those who did not vote for the party where they have a high probability did vote for a second party where they also had a high probability of voting for. We included dummy variables for each of the other parties.
The second possibility to consider is that another party is viewed as being more competent to solve the most pressing problem. Voters have concerns and parties try to respond to those concerns. However, not all parties may be equally well suited to take care of a voter’s concern. Voters may vote for a party because they believe that the party is able to solve the most important and pressing issues. This issue salience may vary from voter to voter. For example, a likely FDP voter may think
206 GEORG LUTZ
that the number of foreigners in Switzerland is the most important problem of the day, and the SVP is the party best suited to properly face this problem. In this case the respective voter would rather vote for the SVP, even though he is in general more likely to vote for the FDP. In the survey the respondents were asked what they thought the biggest political problem of the nowadays was. They were then asked which party, in their view, was the party best able to solve that problem. We expect that if a party other than their own was mentioned as the party that was able to solve the most important problem, this would influence the likelihood that the respondent would be mobilised to vote for that party.
The third possibility to consider is issue specific mobilisation. The position on some issues may make people vote for one party instead of another. Previous research has shown that the position on specific issues has a mobilising effect. This is especially true for the questions of asylum regulations and the EU for the SVP vote (Kriesi et al. 2005). However, we could assume that some issues were relevant for other parties. For example, clear positions on social issues may help the Social Democrats mobilize their voter base, and clear positions on environmental issues may do the same for the Greens. Issues that were included were the position on premiums for health insurance, increasing the pension age, the admission of asylum seekers, the EU membership and nuclear energy.
The fourth possibility to consider is sympathy with political leaders. Some voters base their choice on the evaluation of key political figures and vote for a party if they like one of the leaders or believe that they are especially competent. Sympathy scores for four leading politicians, one for each party, were included in the survey (Micheline Calmy-Rey, Christoph Blocher, Ruth Metzler, and Pascal Couchepin). We expect that high sympathy scores for one of the leading figures of a party would have a positive mobilisation effect. So for the Social democrats, we would expect that a high likeability effect for Micheline Calmy-Rey would have a positive effect on the mobilisation ratio. For the SVP, Christoph Blocher may have such an effect, while the same may be true for the CVP’s Ruth Metzler and for the FDP’s Pascal Couchepin. Disliking a political leader can also have a significant effect in the opposite direction. Somebody may not vote for party precisely because he does not sympathies with one of its key figures.
A further possibility to consider is that of non-regular participation. Following the findings in table 6, we looked at how frequently somebody participates in national elections. Some voters may participate very frequently, while others may hardly ever participate. This may vary among the potential voters, especially for the SVP. It is possible that it did well precisely because it managed to mobilise some of the irregular voters. Therefore, we would expect that the SVP would have a high number of non-regular voters, which can partly explain the high mobilisation ratio (Lutz 2003).
PARTY POTENTIALS AND PARTY COMPETITION 207
We know that different parties are attractive to different social groups. Selb and Lachat (2004) showed that, for example, younger people were more likely to vote for the Green party and the CVP than older people, men were more likely to vote for the SVP than women, and respondents with higher education were less likely to vote for the SVP. Furthermore, we can expect differences between the language regions. In the German speaking area it is likely that the SVP mobilised its potential voters better than in the French speaking area. Language region, age, and education, as well as gender, were therefore included as additional variables.
I ran a logit regression model for each group of potential voters of a party. The dependent variable is a dummy variable, where the variable gets a value of 1 when somebody had a high probability of voting for a party and actually voted for that party, and a value of 0 when somebody had a high probability of voting for that party but did not vote for that party. Logit regressions were calculated for each of the different parties.
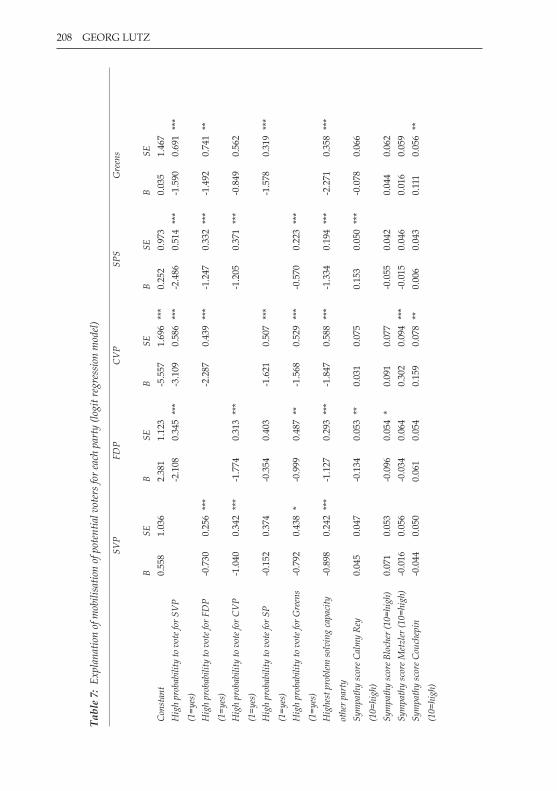
The findings confirm some of the hypotheses. Having a high probability of voting for another party explains to a large extent why parties may have fallen short in mobilising potential voters. If significant, the effects are, as expected, always negative. However, there are some differences: If there is a significant negative relationship we can see that a party lost some votes to the respective party. If we look at the potential SVP voters, we can see that having a high probability of voting for the FDP and the CVP explains why potential SVP voters did not vote for the SVP. Having a high probability of voting for the SP does not make it less likely that somebody would vote for the SVP. A high probability of voting for the Greens, however, makes it less likely that somebody would vote for the SVP. The FDP has a similar pattern. If a voter has some ties to the SVP and the CVP, as well as the Green party, it is less likely that that voter will vote for the FDP. Having a high probability of voting for the SP does not have a significant effect. For the FDP a high probability of voting for the SVP and the CVP explains why the FDP did not mobilise its voters very well. However, this is also true for the Greens. For potential CVP and SP voters having a high probability of voting for any of the other parties under observation showed a significant impact, so those two parties ‘lost’ potential voters to all other parties. The Green party lost mostly to the SP, but also to the SVP and the FDP.
208 GEORG LUTZ
Tab
le 7
: E
xpla
nati
on o
f mob
ilisa
tion
of p
oten
tial
vot
ers
for
each
par
ty (l
ogit
reg
ress
ion
mod
el)
SV
P
FD
P
C
VP
SPS
G
reen
s
B
SE
BSE
B
SE
BSE
B
SE
Con
stan
t0.
558
1.03
62.
381
1.12
3-5
.557
1.69
6**
*0.
252
0.97
30.
035
1.46
7H
igh
prob
abili
ty to
vot
e fo
r SV
P
(1=
yes)
-2.1
080.
345
***
-3.1
090.
586
***
-2.4
860.
514
***
-1.5
900.
691
***
Hig
h pr
obab
ility
to v
ote
for
FDP
(1=
yes)
-0.7
300.
256
***
-2.2
870.
439
***
-1.2
470.
332
***
-1.4
920.
741
**
Hig
h pr
obab
ility
to v
ote
for
CV
P
(1=
yes)
-1.0
400.
342
***
-1.7
740.
313
***
-1.2
050.
371
***
-0.8
490.
562
Hig
h pr
obab
ility
to v
ote
for
SP
(1=
yes)
-0.1
520.
374
-0.3
540.
403
-1.6
210.
507
***
-1.5
780.
319
***
Hig
h pr
obab
ility
to v
ote
for
Gre
ens
(1=
yes)
-0.7
920.
438
*-0
.999
0.48
7**
-1.5
680.
529
***
-0.5
700.
223
***
Hig
hest
pro
blem
sol
ving
cap
acit
y
othe
r pa
rty
-0.8
980.
242
***
-1.1
270.
293
***
-1.8
470.
588
***
-1.3
340.
194
***
-2.2
710.
358
***
Sym
path
y sc
ore
Cal
my
Rey
(10=
high
)
0.04
50.
047
-0.1
340.
053
**0.
031
0.07
50.
153
0.05
0**
*-0
.078
0.06
6
Sym
path
y sc
ore
Blo
cher
(10=
high
)0.
071
0.05
3-0
.096
0.05
4*
0.09
10.
077
-0.0
550.
042
0.04
40.
062
Sym
path
y sc
ore
Met
zler
(10=
high
)-0
.016
0.05
6-0
.034
0.06
40.
302
0.09
4**
*-0
.015
0.04
60.
016
0.05
9Sy
mpa
thy
scor
e C
ouch
epin
(10=
high
)
-0.0
440.
050
0.06
10.
054
0.15
90.
078
**0.
006
0.04
30.
111
0.05
6**
PARTY POTENTIALS AND PARTY COMPETITION 209
Opi
nion
on
unem
ploy
men
t (4=
stat
e
shou
ld b
e m
ore
acti
ve)
0.15
00.
161
-0.1
620.
161
0.39
50.
251
0.12
60.
147
-0.1
360.
198
Hea
lth
Insu
ranc
e (4
=in
com
e
depe
nden
t pre
miu
m)
0.05
30.
125
-0.0
330.
136
0.58
80.
208
***
-0.0
090.
112
0.02
10.
152
Pen
sion
age
(4=
incr
easi
ng p
ensi
on
age)
0.21
70.
133
-0.0
920.
137
0.18
60.
216
0.02
80.
126
0.12
10.
175
Asy
lum
see
kers
(4=
no to
ughe
r
regu
lati
ons)
-0.4
420.
159
***
-0.0
180.
154
-0.0
230.
254
-0.1
800.
105
*-0
.051
0.15
5
EU
(5=
stro
ngly
aga
inst
)0.
214
0.09
7**
-0.1
900.
099
*0.
021
0.14
8-0
.058
0.08
0-0
.072
0.10
7N
ucle
ar p
ower
(5=
stro
ngly
aga
inst
)-0
.031
0.08
9-0
.140
0.09
80.
131
0.14
0-0
.088
0.08
70.
373
0.14
7**
Freq
uenc
y of
Par
tici
pati
on-0
.347
0.15
2**
0.54
00.
231
**0.
588
0.28
8**
-0.0
450.
147
0.10
20.
203
Lang
uage
reg
ion
(1=
Fren
ch/I
talia
n)-0
.803
0.29
0**
*-0
.153
0.30
00.
738
0.39
6*
0.03
00.
219
0.76
10.
275
***
Gen
der
dum
my
(1=
mal
e)0.
343
0.24
70.
035
0.26
70.
282
0.36
7-0
.065
0.18
6-0
.006
0.24
6A
ge-0
.008
0.00
70.
012
0.00
70.
004
0.01
10.
006
0.00
6-0
.041
0.00
9**
*E
duca
tion
dum
my
(1=
high
)-0
.443
0.26
3
0.06
20.
262
0.
150
0.41
2
-0.1
450.
192
-0
.075
0.25
4
Nag
elke
rke
Pse
udo
R2
0.30
30.
484
0.56
90.
326
0.33
5M
cFad
den
Pse
udo
R2
0.20
80.
326
0.41
10.
207
0.23
0N
595
503
305
707
537
Dep
ende
nt v
aria
ble:
Vot
ed fo
r th
e pa
rty
one
has
a hi
gh p
roba
bilit
y to
vot
e fo
r (1
) or
not (
0), c
alcu
late
d fo
r ea
ch o
f the
par
ties.
210 GEORG LUTZ
That another party is more capable of solving the most important problems of the day can fully explain why some people did not vote for a party for which they had a high probability of voting for. This holds true, as expected, for all parties.
Surprisingly, a strong sympathy for Christoph Blocher did not seem to have an additional mobilising effect for potential SVP voters.6 Pascal Couchepin also did not have a significant positive effect for the FDP. For the CVP and the SP, we had such positive effects: having high sympathy scores for Ruth Metzler made it more likely for potential voters to vote for the CVP, and liking Micheline Calmy-Rey made it more likely that potential SP voters voted for the SP. Equally interesting is the significant negative effect of Christoph Blocher on potential FDP voters. Christoph Blocher does not have an additional positive effect for potential SVP voters whereas a dislike for Christoph Blocher makes potential FDP voters vote for the FDP (and likely not the SVP). This makes sense when we know how much Christoph Blocher polarizes the voters into supporters and detractors. A bit puzzling is the finding that a strong sympathy for Micheline Calmy-Rey made it unlikely that a potential FDP voter would actually vote for the FDP. Even more puzzling is the finding that liking Pascal Couchepin has a positive effect on getting out the Green vote.
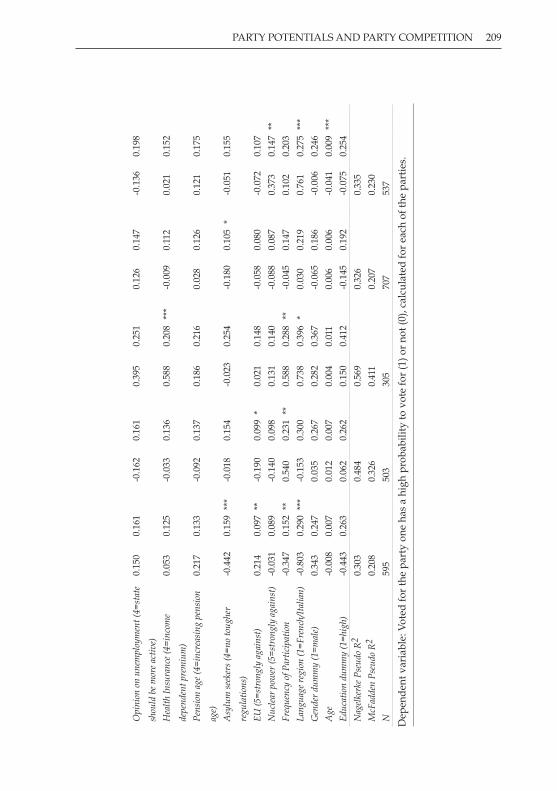
With a few important exceptions, issues do not play an important role. Being strongly against the EU, and even more importantly, being strongly in favour of further asylum restrictions, helped to get out the SVP vote. This finding confirms the findings of other studies (Holzer and Linder 2003; Kriesi and Sciarini 2003; Lachat and Selb 2005) that the SVP’s clear position on those two issues explains to a large extent why the party has been so successful in the last 10 years. However, for the SP we find an effect on regulations for asylum seekers in the same direction. Being in favour of tougher regulations makes it more likely for somebody to vote SP. The position on the health insurance has a positive impact in getting out the CVP vote. And finally, the opposition to nuclear energy has a positive effect for the Green vote. It is likely that the position on nuclear energy differentiates the SP from the Green voters: Green voters are clearly against nuclear energy.
Frequency of participation is significant for the SVP, FDP and CVP, however, not in the same way. For the SVP it was positive, in the sense of getting out the vote, to have many non-regular voters, while for the CVP and FDP it was positive to have many habitual voters. In other words, the SVP was especially
6 When I ran a model that exluded the issue variables, the sympathy for Christoph Blocher had a signifcant effect. However, the effects disappers when the issues positions are included into the model.
PARTY POTENTIALS AND PARTY COMPETITION 211
attractive for non-regular voters, and the FDP and CVP for regular voters. This variable did not have an effect for SP and Green voters.
The language region dummy confirms the findings from Table 3: The SVP did well in the Swiss German area, the CVP and the Greens in the French and Italian areas. Putting this the other way around, it means that the SVP still has a chance to mobilise further voters in the French part, while the CVP and the Greens have used their potential in the French and Italian cantons (however may have some more votes to win in the German area). Gender and education did not make any difference for any of the parties. Age only made a difference in one case: the Green Party did very well in mobilising young voters.
Conclusion
The main question of this article sought to explain was how well the parties have done electorally in relation to how well they could have done. Although this does not allow us to draw conclusion about future elections directly, we can gain some insights about challenges the different parties may face. The analysis shows substantial differences between the parties. To starting with, the overall picture shows that the SVP did a very good job in mobilising its voter potential. However, the analysis shows as well that the SVP seemed to have come closer to its limits than any of the other parties, especially in the German speaking area. Many of the SVP voters have a high probability of voting for other parties, especially the FDP. The reverse is not true to the same extent. Many of the other parties’ voters are not likely to vote for the SVP. Having done well in mobilising its potential voters in 2003 means that it could be difficult for it to tap the same potential at a next election. Among the non-voters, the SVP still has many sympathisers, more than any other party. The number of citizens with a high probability of voting for a party effectively going to the polls is lowest for the SVP. However, those voters not only need to be convinced to vote for the SVP, they also need to be convinced that going to the polls is useful.
The FDP did very badly in mobilising its potential, which brought the party its worse election result since 1848. Positively speaking, it almost cannot get any worse. The FDP still has a large potential which it can gain back, and mainly SVP voters could possibly vote FDP in the future again. The FDP has a more limited potential among the non-voters too.
The CVP did very well at the last election, but the party has by far the smallest potential of all the major parties. Under these circumstances, it will be very difficult for the CVP to ever get back to its previous strength. Having done well at the last elections means that doing well again is more difficult for the

212 GEORG LUTZ
CVP than for other parties. The potential among the non-voters is not as high as it is for the SVP.
The left has a large potential. Especially among FDP and CVP sympathisers, there are many voters with a high probability of voting for the SP. Both left parties have a very strong overlap among themselves. So gains of one party will likely come at the cost of the other party. This confirms the observation that in the past the vote share of the SP went down when the vote share of the Green party went up, and vice-versa. Only in the recent elections have both parties managed to gain votes at the same time.
What are the consequences for the current pattern of party competition? For the SVP, the biggest challenge will be to maintain its vote share at forthcoming elections. Its potential electorate has a tendency to disappear, and those that are less likely to participate need to be convinced that it makes sense to go to the polls. The SVP has a lot of sympathizers among the non-voters, more than the other parties, but getting out the vote may be more difficult than converting voters.
For the other parties this means that the threat from the SVP is not as big as they may think. The SVP has gained many votes from the other parties in previous years, but this process has its limits. While the FDP and the SP have a lot of sympathizers among all voters, this is not true for the SVP. A lot of voters from the other parties are very unlikely to ever vote for the SVP.
For the FDP to grow, the party needs to attract current SVP voters to again vote for their party. However, they risk loosing voters to the SP with such a move. Many of the FDP voters have sympathy for the SVP and the SP, and even to some extent for the Greens. For the CVP, moving to the right is probably not a successful strategy, because with a shift to the right there is not much to win, but more to loose on the left.
For the SP, this means that the party is attractive for more centre voters than the party may believe, especially for FDP voters. However, this would require a policy shift that is accompanied with a loss on the left. The Green party is clearly a left party with a large overlap towards the SP, but with a limited overlap to any other party. A repositioning of the party towards the centre as some of the cantonal branches have done therefore does not seem to be a very promising strategy.
Why some parties did better than others is explored at the end of the arti-cle. One of the main reasons why someone did not vote for the party he/she has a high probability of voting for was because the person had a high prob-ability of voting for another party. If someone feels that another party is more capable of solving the most pressing problems of the day, this can explain why that perspon did not vote for the party where she/he had a high probability of voting for. Sympathy for political leaders can likewise be important. Especially
PARTY POTENTIALS AND PARTY COMPETITION 213
the CVP could profit from the “Metzler effect”. Having a strong sympathy for Ruth Metzler, who was one of the key figures in the campaign, explains why the CVP has done well in mobilising potential voters. A similar effect was observed for Micheline Calmy-Rey and the SP. Surprisingly, Christoph Blocher does not have an additional effect on getting out the SVP vote, but a dislike for Christoph Blocher made it more likely that a potential FDP voter voted for the FDP. Issues were important in some cases, especially the position of the SVP against the EU and against asylum seekers, and the position of the Green party against nuclear energy.
References
Bartolini, Stefano, and Peter Mair. (1990). Identity, Competition, and Electoral Availability. The stabilisation of European electorates 1885-1985. Cambridge: Cambridge University Press.
BFS, Bundesamt für Statistik. (2006). Nationalratswahlen 2003. Übersicht und Analyse. Neu-châtel: Bundesamt für Statistik.
Campbell, Angus, Philip E. Converse, Warren E. Miller, and Donald E. Stokes. (1960). The American Voter. New York: John Wiley.
Dalton, Russell J. (2000). ‘‘The Decline of Party Identifications’’, in Russel J. Dalton and Martin P. Wattenberg (eds.). Parties without Partisans. Political Change in Advanced Industrial Democracies. Oxford: Oxford University Press. pp.19-36.
Greene, Steven. (2005). ‘‘The Structure of Partisan Attitudes: Reexamining Partisan Dimension-ality and Ambivalence’’, Political Psychology 26(5): 809-822.
Grofman, Bernard, Guillermo Owen, and Christian Collet. (1999). ‘‘Rethinking the partisan effects of higher turnout: So what‘s the question?’’, Public Choice 99(3): 357-376.
Holzer, Thomas and Wolf Linder. (2003). ‘‘Der Wahlentscheid im Wechselspiel zwischen Par-teiidentifikation und Schafragenorientierung.’’, in Pascal Sciarini, Sibylle Hardmeier and Adrian Vatter (eds.). Schweizer Wahlen 1999. Bern: Haupt, pp.85-122.
Katz, Richard S. (1979). ‘‘The dimensionality of party identification’’, Comparative Politics 11(2): 147-163.
Kriesi, Hanspeter, Romain Lachat, Peter Selb, Simon Bornschier, and Marc Helbing, (eds). (2005). Der Aufstieg der SVP. Zürich: Verlag Neue Zürcher Zeitung.
Kriesi Hanspeter and Pascal Sciarini. (2003). ‘‘Auswirkungen von Sachpräferenzen auf den Wahlentscheid’’, in Pascal Sciarini, Sibylle Hardmeier and Adrian Vatter (eds.). Schweizer Wahlen 1999. Bern: Haupt, pp.321-368.
Lachat, Romain, and Peter Selb. (2005). ‘‘Schweiz’’ in Hanspeter Kriesi, Romain Lachat, Peter Selb, Sibylle Bornschier and Marc Helbing (eds.). Der Aufstieg der SVP. Zürich: Verlag Neue Zürcher Zeitung, pp.41-58.
Ladner, Andreas. (2004). Stabilität und Wandel. Konfliktlinien, Parteiorganisationen und Par-teiensysteme. Opladen: Leske und Budrich.
Lutz, Georg. (2003). ‘‘Mobilisierung als Schlüsselfaktor für den Wahlerfolg?’’ in Pascal Sciarini, Sibylle Hardmeier and Adrian Vatter (eds.). Schweizer Wahlen 1999. Bern: Haupt, pp.59-84.
214 GEORG LUTZ
Lutz, Georg. (2006). Participation, Information and Democracy. Hamburg: Lit-Verlag.
Lutz, Georg, and Michael Marsh. (forthcoming). ‘‘Introduction: Consequences of low turnout.‘‘ Electoral Studies.
Marsh, Michael. (2006). ‘‘Stability and Change in the Structure of Electoral Competition 1989-2002’’ in Diane Payne, John Garry and Niamh Hardiman (eds.) Facing change in a new Ireland: An analysis of Irish social and political attitudes. Dublin: Liverpool University Press.
Niemi, Richard G., Stephen Wright, and Linda W. Powell. (1987). ‘‘Multiple Party Identifiers and the Measurement of Party Identification’’, The Journal of Politics 49(4): 1093-1103.
Pettersen, Per Arnt, and Lawrence E. Rose. (forthcoming). ‘‘The Dog that Didn‘t Bark: Would turnout of non-votes make a difference?’’ Electoral Studies.
Schoen, Harald, and Cornelia Weins. (2005). ‘‘Der sozialpsychologische Ansatz zur Erklärung von Wahlverhalten’’ in Jürgen W. Falter and Harald Schoen (eds.). Handbuch Wahlforschung. Wiesbaden: VS Verlag, pp.187-242.
Selb, Peter, and Romain Lachat. (2004). Wahlen 2003. Die Entwicklung des Wahlverhaltens. Institut für Politikwissenschaft der Universität Zürich.
van der Eijk, Cees, and Mark N. Franklin, eds. (1996). Choosing Europe? The European Electorate and National Poilitics in the Face of Union. Ann Arbor: The University of Michigan Press.
Weisberg, Herbert F. (1980). ‘‘A Multidimensional Conceptualization of Party Identification’’, Political Behavior 2(1): 33-60.
Potentiels des partis et structure de concurrence partisane lors des élections au Conseil national de 2003 en Suisse
Cet article analyse le potentiel partisan des cinq plus grands partis de Suisse lors des élections au Conseil national de 2003. Plus précisément, il se penche sur les résultats de ces partis en comparaison avec les résultats escomptés. Le potentiel d’un parti dépend du nombre d’électeurs prêts à voter pour lui et dans quelle mesure ces électeurs potentiels votent effectivement. L’analyse démontre que, lors des élections au Conseil national de 2003, l’UDC et le PDC ont tiré profit de leur potentiel avec le plus grand succès. A l’opposé, le PRD a très mal utilisé son potentiel. Le potentiel de L’UDC est par contre limité, bien plus que ce n’est le cas pour le PRD et le PS. Le potentiel de l’UDC a pu être idéalement utilisé grâce à sa position claire contre l’UE et en faveur de restrictions plus fortes dans le droit d’asile. Le PDC a pu profiter de l’effet "Ruth Metzler" qui a su mobiliser les électeurs en faveur du parti.
PARTY POTENTIALS AND PARTY COMPETITION 215
Parteipotentiale und die Struktur der Parteienkonkurrenz bei den Nationalratswahlen 2003 in der Schweiz
Der Artikel untersucht die Parteipotentiale der fünf grössten Parteien in der Schweiz bei den Nationalratswahlen 2003 und wie gut die Parteien abgeschnitten haben, im Vergleich zu wie gut sie hätten abschneiden können. Das Potential einer Partei hängt davon ab wieviele Wähler der Partei je die Stimme geben würden und mit welcher Wahrscheinlichkeit die potentiellen Wähler überhaupt wählen gehen. Die Analyse zeigt, dass bei den Nationalratswahlen 2003 SVP und CVP am erfolgreichsten ihr Potential ausgeschöpft haben. Die FDP hingegen hat ihr Partei sehr schlecht ausgeschöpft. Das Potential der SVP ist hingegen beschränkt, beschränkter etwa als das Potential von FDP und SP. Die SVP hat ihr Potential vor allem gut ausgeschöpft durch die klare Position gegen die EU und für stärkere Einschränkungen des Asylrechts. Die CVP konnte vom Ruth Metzler Effekt profitieren, die Wähler für die CVP mobilisiert hat.
Georg Lutz studied political science and history at the University of Berne where he received his doctorate in 2004. He currently works at the Institute of Political Science there. His main focus in research and teaching is on political behaviour and political institutions in comparative perspective.
Address for correspondence: Georg Lutz, University of Berne, Institue of Political Science, Lerchenweg 36, 3000 Bern 9; E-mail: [email protected]
Copyright © 2022 FDOKUMEN