
Parties, Congress, and the Stock Market
31
Parties, Congress, and the Stock Market Matthias Ederer José Fernández-Albertos Victor Lapuente QoG WORKING PAPER SERIES 2008:24 THE QUALITY OF GOVERNMENT INSTITUTE Department of Political Science University of Gothenburg Box 711 SE 405 30 GÖTEBORG November 2008 ISSN 1653-8919 © 2008 by Matthias Ederer, José Fernándoz-Albertos and Victor Lapuente. All rights reserved.
Transcript of Parties, Congress, and the Stock Market

Parties, Congress, and the Stock Market
Matthias Ederer
José Fernández-Albertos
Victor Lapuente
QoG WORKING PAPER SERIES 2008:24
THE QUALITY OF GOVERNMENT INSTITUTE Department of Political Science
University of Gothenburg Box 711
SE 405 30 GÖTEBORG
November 2008
ISSN 1653-8919
© 2008 by Matthias Ederer, José Fernándoz-Albertos and Victor Lapuente. All rights reserved.

Parties, Congress, and the Stock Market Matthias Ederer, José Fernández-Albertos and Victor Lapuente QoG Working Paper Series 2008:24 November 2008 ISSN 1653-8919

1
Parties, Congress, and the Stock Market
Matthias Ederer
Goldman Sachs International (London)
José Fernández-Albertos
Institut Barcelona d’Estudis Internacionals (IBEI) [email protected]
Víctor Lapuente
The Quality of Government Institute (Göteborg University)
Abstract Recent literature in both finance and political science has identified a series of systematic patterns in the way stock market responds to significant political events. The lack of a common theoretical core as well as the use of different empirical specifications in two literatures which hardly cross-reference each other has led to contradictory results. Several relevant questions arise: do stock markets really prefer Republicans or Democrats? Is divided government somehow better or worse for the stock market?
We develop a theoretical framework to comprehend two under-theorized mechanisms through which political factors affect stock market performance: redistributive and regulatory policies. Two main predictions follow from the model: stock market performs better under Democratic Presidencies and under Divided Government. We then test them by looking at monthly changes in US stock market performance from the 1870s until today. We control for all relevant variables used in both previous literatures and subject the results to robustness checks. In addition, we complement our results with historical narratives of stock market regulation –from public policy scholars and economic historians-, which show the mechanisms of the theory in operation.
Paper prepared for
Midwest Political Science Association Annual National Conference, Chicago,
3-6 April 2008
This Draft: March 2008

2
1. The Political Puzzle of the Stock Market
The impact of political factors over stock market behavior has been increasingly
capturing academic interest within both finance and political science literatures. Does
the stock market do better when a Republican is President or when a Democrat is? Is
divided government better or worse for equities? So far, almost all possible
contradictory results have been found. In relation to stock market returns, Democrat
incumbents may lead to a significant decrease (Leblang and Mukherjee 2005,
Snowberg, Wolfers and Zitzewitz 2007), to a statistically insignificant decrease
(Mukherjee and Leblang 2007), to a significant but almost negligible increase
(Campbell and Li 2004), and to a significant and substantial increase (Hensel and
Ziemba 1995; Santa-Clara and Valkanov 2003). Regarding the volatility of stock
markets returns, it has been found that under Democrats average volatility is
significantly higher (Freeman, Hays and Stix 2000, Herron 2000) and significantly
lower (Santa-Clara and Valkanov 2003; Leblang and Mukherjee 2005). Similarly,
divided government is welcomed on Wall Street by some (Chari et al. 1997, Tierney
2006), it has no substantive impact for others (Snowberg, Wolfers and Zitzewitz 2007),
while it significantly raises volatility for others (Mukherjee and Leblang 2007).
The reasons for such divergent findings lie, in the first place, on the intrinsic
difficulties for identifying the causal mechanisms that connect who sits in the Oval
Office or in Congress with millions of individual decisions to invest in the stock market.
In the second place, finance and political science literature use different empirical
specifications and hardly cross-reference each other. The aim of this paper is to bridge
the gap between these two literatures, taking advantage of their relative strengths:
finance literature’s complete empirical specifications and political science’ theoretical
insights.
Since the 1980s, finance literature has been challenging the traditional view that
markets prefer republicans (Allvine and O’Neill 1980, Huang 1985, Ederer and Ederer
2006). There is a growing consensus in what Santa-Clara and Valkanov (2003:1841)
define as the “presidential puzzle”: stock market returns are higher under Democratic
than Republican administrations and these differences are explained neither by
3
business-cycle variables nor by variations in the risk premiums assigned to each party.1
Two main characteristics of finance scholars’ analyses allow them to derive this
conclusion. They constitute the empirical underpinnings of this paper.
First, if one wants to analyze how some exogenous factors (e.g. party of the
president) affect individuals’ propensity to take the risk of investing in the stock market,
the relevant dependent variable must capture how attractive stocks are in comparison to
completely safe investments. Therefore, finance scholars like Santa-Clara and Valkanov
(2003) or Ederer and Ederer (2006) do not explore the effect of presidency over the
stock market return, but over the excess market return -the difference between returns
on stocks (e.g. the value-weighted CRSP index) and a risk-free return (e.g. three-month
Treasury bill rate). The excess return is often referred in the literature as the “equity
premium”.
Second, following standard analyses of finance market behavior, these authors
control for business-cycle variables previously found as relevant to forecast stock
market –such as the dividend-price ratio, the term spread between two bonds with
different maturity, the relative interest rate and the inflation rate.2 Consequently, they
can test if the party of the President is simply proxying for variations in the business
cycle. They show that this is not the case, finding important party differences. For the
period 1927-1998, Santa-Clara and Valkanov (2003) prove that, even when controlling
for business-cycle variables, the stock market returned about 11 percent more a year
under Democratic presidents and only 2 percent more under Republicans. Including
these standard economic variables, finance researchers eliminate many possible
alternative mechanisms through which presidential partisanship could affect the stock
market (e.g. Democrats lead to higher growth or to higher interest rates). They thus
clarify the empirical landscape showing that partisan differences in stock market
behavior do not depend on differences in macro-economic policies between Democrats
and Republicans, but must be attributed to the market being systematically positively
surprised by other Democratic policies.
The main weakness of finance approaches is that their empirical sophistication is
not preceded by theoretical models and we do not know which these other policies are
1 This is also the prevailing view among economists writing in the popular press. See, for instance, Hal Varian’s “Which party in the White House means good times for stock investors?” (The New York Times 10/20/2003). 2 For a review of the classic arguments within finance literature on the need to include these control variables, see Fama (1991) and Ederer and Ederer (2006).

4
and why politicians choose them.3 Santa-Clara and Valkanov (2003:1870) conjecture
that presidency may affect the stock market through its fiscal and regulatory policies,
but do not develop the argument further. Likewise, finance literature narrows its
attention exclusively to which party occupies the Presidency, neglecting other
potentially relevant political factors –e.g. who controls the Congress. Quite the opposite,
from political science several theoretical explanations -using more complex political
factors- have been drawn. They constitute the theoretical underpinnings of this paper.
In one of the most comprehensive contributions, Leblang and Mukherjee (2005)
build up a game theory model showing the micro-foundations that, according to them,
connect political events and market behavior. They predict that rational expectations of
higher inflation under Democratic administrations will lower the volume of trade in the
stock market and that will ultimately lead to a decrease in the mean and volatility of
stock prices.4 Their results support this hypothesis, showing that during the tenure of
right-wing governments (in Britain and the US) both stock market mean returns and
volatility are higher. These results thus sharply contradict finance literature’s main
finding. Leblang and Mukherjee include some macro-economic variables, such as
inflation or interest rates, and, unlike finance literature studies, they also control for
other political variables, such as the existence of divided government.
Nevertheless, unlike finance literature, they do not control for all the four
standard business-cycle variables and this could be bias their striking findings.
Variables related to the business cycle –which, at the same time, may be, although not
necessarily must be, related to political factors- could be driving the results.
Particularly, Leblang and Mukherjee do not include any proxy for dividend yield, which
has been identified by the finance literature as the most powerful forecast for stock
returns (Fama and French 1988 and Fama 1991).5 More importantly, also contrary to
finance literature, they examine the impact of political variables over stock market
returns instead of excess returns. Increases or decreases in market returns do not tell us
much about individuals’ higher or lower propensity to make risky investments under
certain political circumstances if we do not control for variations in available risk-free
3 Thus, it could be argued that we are left with lack of theoretical substance not so different from the work of Leinweber (1997) who, after exhausting multiple databases, found that historically the single best predictor of stock market behavior was butter production in Bangladesh. 4 Another remarkable studies along similar lines are Mukherjee and Lebland 2007 and Bernhard and Leblang (2006). 5 They use dividend yield but as a dependent variable to analyze the impact of partisanship over it; but, again in this analysis they do not control for other macro-economic variables.
5
options. Put simply, without a benchmark, we cannot asses if the stock market performs
better or worse.
Very related to these empirical flaws, there is an inherent problem in the
theoretical explanations of stock market behavior which rely on partisan macro-
economic policy differences. Following the literature specialized on partisan economic
effects, no clear predictions over the global macro-economic impact of political parties
can be inferred. On the one hand, it is plausible to assume that, under Democratic
presidencies, investors rationally expect “higher interest rates and that future economic
activity, in general, will slow down” (Leblang and Mukherjee 2007:140). On the other
hand, it is also plausible to assume almost exactly the opposite –that is, that under
Democrats economic growth accelerates.6 Therefore, in a single analysis Leblang and
Mukherjee are actually attempting to test not one but two hypotheses at the same time.
First, that Democratic presidents produce “poor economic activity and higher inflation”
(2007:140) -a challenging hypothesis that, so say the least, it is difficult to confirm even
by those scholars who address it directly. And, second, that macro-economic
performance affects stock market behavior. Although the two hypotheses deserve
scientific attention, they should be analyzed separately. Even in a well-specified
theoretical model as the one Leblang and Mukherjee develop, there are too many
intermediate steps (e.g. expectations of higher interest rates at low-medium term and, as
a result, anticipation of lower growth at medium-long term) between the President and
investors’ behavior. Leblang and Mukherjee thus face a joint-hypothesis problem
similar to Fama’s (1991) observation about tests of the market efficiency hypothesis in
stock market behavior. Any assessment of the effects of partisan politics on the stock
market through macro-economic policies must be jointly tested with a model of partisan
macro-economics.
We admit that partisan differences in economic policies may have a say in
explaining partisan variation in stock market performance, but, given the lack of
consensus on how partisanship affects macro-economy, we are not in conditions to
identify how. Thus, similar to finance literature, in the empirical part we include the
most standard proxies for the business cycle and focus our attention on the partisan
6 As Snowberg, Wolfers and Zitzewitz (2007:1) argue, empirical evidence on partisan effects on macro-economy is mixed due to the difficulty of generalizing from a small number of Presidential election cycles. Alesina at al. (1997) find faster economic growth under Democratic administrations, but we cannot reject that they could simply be taking advantage of a better inflation management by previous Republican presidencies.
6
variation of the stock market that does not seem to obey to macro-economic variables.
Also like finance scholars, we use the excess return as the dependent variable.
The remainder of the paper is organized as follows. Section 2 develops a
theoretical model based on investors’ reactions to two policy dimensions: redistribution
and stock market regulation. The main predictions of the models are that shareholders,
who are assumed to overvalue predictability, prefer policies enacted by Democrats –the
more leftist a President is, the better-, and under conditions of divided government and
ideological polarization in Congress. Section 3 tests the hypotheses analyzing monthly
changes in US stock market performance from the 1870s until today. It complements
them with flesh-and-bone narratives -from public policy and economic history scholars-
designed to show the micro-foundations of the theory. Section 4 concludes and connects
the results of this paper with what recent comparative regulatory policy literature
defines as the “striking political paradox of finance capitalism”: the support of center-
left parties to the cause of shareholders (Cioffi and Höpner 2006:1).
2. Theoretical model
The model developed in this section shares its main assumptions with traditional
accounts on the relationship between politics and the stock market. Following Siegel
(2002), we presuppose that most corporate executives and stock traders are Republicans
and, while many Democratic policies may be perceived in principle as unfavorable to
stock markets (e.g. income redistribution or tax treatment of capital gains), Republican
fiscal and redistributive policies are seen as more positive. Nevertheless, unlike these
traditional accounts, we do not easily derive from these assumptions that “it is well
known that stock market prefers Republicans to Democrats” (2002:221). We contend
that a full description of the interplays between politics and stock market must take into
account not only redistributive concerns, but also an under-theorized mechanism in the
finance and political science literatures: regulatory policy.
Since Stigler’s (1964) advocacy for the development of testable hypotheses on
regulatory policies, a substantial literature has arisen on the economics of particular
stock market regulations. Nevertheless, many problems emerge in what is known as
event-study methodology –i.e. when we want to test the impact of an individual
regulatory policy on stock market performance. The noisy, lengthy regulatory process
tends to give rise to, among others, endogeneity issues, confounding events, selection
7
concerns and imprecision of data (Mulherin 2007:428).7 Furthermore, we always lack a
control sample or counterfactual: what would have happened in the stock market if that
particular regulation had not been passed?
These problems have come up in the studies on the regulations of the Securities
Exchange Commission (SEC) in the 1930s.8 Since these policies came after the 1929
crash, it is difficult to scientifically deal with variables such as risk and return before
and after such an endogenous event (Mulherin 2007:427).9 That is also the case of the
2002 Sarbanes-Oxley Act, the most comprehensive reform of corporate governance
since the 1930s. The Act reacted to a sequence of corporate financial scandals,
including Enron in November 2001, Tyco International in January 2002 and the
collapse of World.Com in June 2002. Although it represents an unprecedented
intervention of federal law into the internal structure and affairs of corporations (Cioffi
and Höpner 2006:24), trying to estimate its effect on the stock market is “an extremely
difficult task” (Mulherin 2007:429). The lengthy evolution of the Act through Congress
over a period of several months, preceded as well by many other months of intense
discussions in the media, makes it complicated to establish when the market absorbed
the news about the passage of the Act.10
The absence of neat effects of particular regulations does not mean that markets
are insensitive to regulatory policy.11 Academic research has found a strong and robust
impact of corporate governance structures over equity prices. Firms with a corporate
structure protecting shareholders rights have, among other characteristics, higher value,
higher profits, higher sales growth, and lower capital expenditures (Gompers et al.
7 Another important problem when analyzing regulatory policy –and which is often neglected- is that of the unintended consequences. According to Mulherin (2007:423), regulation of stock market could be subject to problems of unintended consequences similar to those found by Peltzman’s (1975) analysis of automobile safety regulations. While the mandatory provision of seatbelts effectively reduced fatalities to drivers, it had the offsetting effect of increasing pedestrian deaths as a result of faster driving. 8 The Securities Act of 1933 and the Securities Exchange Act of 1934. The latter created the SEC. 9 As a result, while some scholars -such as the Nobel laureate Stiglitz (2002)- find support for the hypothesis that the SEC is in the public interest (i.e. benefiting investors confidence), others –like the also Nobel laureate Stigler (1964)- are more skeptical and suggest rather a special interest impetus for SEC regulation (i.e. benefiting mostly insiders). 10 Unlike the SEC regulation, the problem of counterfactuals can be surmounted in the case of the Sarbanes-Oxley Act, by studying its effects on cross-listed, non-US American Depositary Receipts that were also subject to the act and using as control samples matched firms (Litvak 2007). 11As the SEC itself concludes in relation the regulation of fund governance, “finding no relation in the data does not confirm that no economically significant relation exists between fund governance and performance” (quoted in Mulherin 2007:431).
8
2003).12 Therefore, policies regulating corporate structures should have a notable impact
on markets.13 The scientific problem is how to determine it.
In order to solve the problems of endogeneity and lack of counterfactuals
inherent to the analysis of particular regulations, we propose an alternative theoretical
approach aimed at capturing investors’ expectations of regulatory policy under different
political circumstances. Our model presents several advantages.
In the first place, it follows Stigler’s (1964:120) recommendation of generating
testable propositions on regulation that are “simplicity in itself” through deriving
investors’ expectations directly from political changes. Secondly, we analyze the impact
of political variables through a long span of time, from the late 19th century till
nowadays. This allows us to have several control samples (e.g. several partisan
alternations in power) and to take into account endogeneities produced by, for instance,
stock crashes.14 In addition, a long-horizon approach is the most appropriate way to
avoid the most pervasive difficulty of event-study methodology: how to identify a
single date for an event such as regulation which is preceded by political and media
discussions, a lengthy legislative negotiation and, furthermore, it can be followed by
judicial uncertainty (Gompers et al. 2003:2). Thirdly, we do not look at particular
regulatory policies, or at investors’ expectations about particular regulatory policies, but
at investors’ general expectations about market regulations under different political
conditions.
The model developed here aims at answering how politicians actions affect
shareholders’ wellbeing (and therefore, the prices of stocks). Similar to political
economy models we address the question by formalizing the behavior of constituencies
and politicians as a result of their ideology and economic interest. These models have
been lengthily applied to explain fiscal and monetary policy,15 but, with possibly the
sole exception of Pagano and Volpin (2005), they have not been used to study company
law or stock market policies. Here, we simultaneously follow standard political
economy theories, modeling fiscal-redistributive policy, and Pagano and Volpin’s
approach, modeling stock market regulations.
12 For a summary of previous studies showing similar results, see Shleifer and Vishny (1997). 13As Gompers et al. (2003:35) infer from their empirical analysis, “if an 11.4 percentage point difference in firm value were even partially ‘caused’ by each additional [pro-shareholders] governance provision, then the long-run benefits of eliminating multiple provisions would be enormous”. 14 We thus follow Officer (1973), who argues that SEC regulations in the 1930s are so endogenous that can only be analyzed with a long-term perspective –for him, from 1897 to 1969. 15 For a summary of these models, see Drazen (2000).

9
This sketch of a theoretical model aims to explain why we observe: i) that
democratic presidents are associated with higher returns for investors in the stock
market; and ii) that situations of divided government, in which there are greater
ideological differences between the president and congress are also associated with
higher returns for investors.
Government’s policies might influence the stock market in many ways. We will
focus only on two: it can, by changing corporate governance rules, alter the balance of
power between managers and investors over how to share the benefits (and costs)
generated by the firm. It can, also, by regulating labor market conditions, establish
taxation rules, (dis)incentives for unionization, etc…that affect the “share of the pie”
that goes to employers (investors and management) and employees.
There are three economic actors -workers, shareholders and managers- with
different Euclidean preferences16 over these two dimensions of conflict: policies that
affect the distribution of firms’ surplus between capital-owners and labor (or, for sake of
simplicity, “redistributive” policies), and policies that affect the distribution of non-
workers gains between managers and shareholders (or “regulatory” policies). We
normalize the weight of the first (redistributive) dimension to 1, so that the parameter δ
measures the relative weight of the second (regulatory) dimension (δ<1 if the first
dimension is more important, δ>1 if the second dimension matters more).
We normalize the length of each dimension to the interval 0,1 where 0
represents the policy most preferred by shareholders in the two dimensions, and 1
represents the policy most preferred by workers in the first (redistributive) dimension,
and by managers in the second (regulatory) dimension.
Managers’ ideal policy position on the first dimension is the same as
shareholders’, while workers, in the second dimension are completely indifferent along
the 0,1 line (i.e. they do not have an intrinsic preference over how managers and
shareholders should split their share of the pie).
There are two parties, (D)emocrat and (R)epublican. Each party’s policy
position is a weighted average of the preferences of its voters. We assume that all
workers are represented by the democratic party, while all managers are represented by
the republican party. Therefore, party positions are exclusively given by these two
16 We assume that all groups’ preferences are euclidean, i.e. policy deviations from the ideal policy cause equal losses in utility in the two dimensions, with the exception of workers, who only care about the first dimension (see below).

10
groups’ preferences (workers for democrats, managers for republicans and the share of
shareholders in each party).17
The composition of the electorate (and, as a result, the party’s final platforms) is
unknown prior to the elections. It is known, however, that workers are always a
majority within the Democratic party. As a result, the proportion of shareholders in the
democratic coalition sD is given by a uniform probability distribution (0,1/2) while the
share of shareholders in the republican party sR is given by a uniform probability
distribution (0,1), because, within the party, the proportion of shareholders can be either
smaller or larger than the proportion of managers.
sD ~ unif (0,1/2)
sR ~ unif (0,1)
Under a democratic coalition of workers and shareholders, policy in the first
dimension is given by the preference of workers minus the relative weight of
shareholders in the party (1-sD), policy in the second dimension is given by the
shareholders’ preference (0), since workers are completely indifferent over this
dimension.
Under a republican coalition of managers and shareholders, policy in the
redistributive dimension is simply 0 (both groups have the same ideal point, 0, in this
dimension of conflict), whereas the party policy in the regulatory dimension is given by
a weighted average of the two sectors’ preferences, which is simply 1-sR.
17 We rely on a large literature to characterize parties in this way. On the one hand, as mentioned above, we follow the traditional assumption that right-wing parties have been ideologically and strategically allied with employers –i.e. managers and shareholders- and in opposition to the working class, represented by left-wing parties. In terms of both policy orientation and electoral support, the Republican party has traditionally maintained closer ties to employers than do the Democrats (Cioffi and Höpner 2006:29). On the other hand, following recent literature on market regulation, there are several reasons to consider that Democrats also represent, at least partially, shareholders’ preferences. First, the gap between managers’ and shareholders’ interests seems to be widening. Managers are increasingly interested in resisting hostile –and highly lucrative for shareholders- takeovers, and managers awarding themselves with rises in executive compensations –such as “golden parachutes” severance payments- at the expense of owners’ interests (Cioffi and Höpner 2006:23). Secondly, mass shareholding has made the defense of shareholders’ interests a key element of all Democratic attempts to attract middle class voters (Cioffi and Höpner 2006:26). Furthermore, the preferences of both groups tend to increasingly converge regarding regulatory policy. Workers and shareholders are gradually forming in many OECD economies what Gourevitch and Shinn (2005) call “transparency coalitions”. Employees and unions are agreeing with the demands of investors in favor of the protection of shareholders rights for two reasons. First, pro-shareholders regulations help employees overcome informational asymmetries vis-à-vis managers. Second, employees are, through pension funds, ever more becoming shareholders themselves. Actually, some of the most activist investors in the US have been union pension funds, since they have both ideological reasons -as representatives of the working class- and strategic one -as shareowners (Cioffi and Höpner 2006:23). Closely tied to the AFL-CIO, they have been core contributors of the Democratic Party.

11
Given the distributions of sD and sR, the expected equilibrium policies under the
Democratic party is (1/4,0); and under the Republican party, (0,1/2). With Euclidean
preferences, this translates into a preference of shareholders for policies under
republicans whenever δ<2.
Shareholders, however, are not only exclusively concerned about the expected
policy position, but also about the uncertainty around the expected equilibrium policy.
In particular, shareholders dislike policy deviations from the expected equilibrium
policy in both dimensions, so that we can finally write their utility function as follows:
US=-(µ(P1)2-γ1(ϕ (P1))
- δ(µ(P2)
2-γ2(ϕ (P2))
where µ(Pn) refers to expected policy in the n dimension, γn measures the weight of the
expected policy volatility of the n dimension in the shareholders’ expected utility,18 and
ϕ to the average absolute deviation with respect to the expected value µ.19
Again, drawing on the uniform distributions of sD and sR, the expected policy
deviation is 1/8 in the redistributive dimension of conflict under democrats, and 1/4 in
the regulatory dimension under republicans.20 Once we know both the expected policy
and the expected policy deviation, we can easily derive under what conditions do
shareholders prefer democrats, and when republicans:
Democrats will provide a higher utility to shareholders whenever the following
inequality holds
2γ1 +9 < 4(δ+γ2)
In words, democrats are preferred the greater the weight of the second dimension
with respect to the first (δ), and the greater the relative sensitivity to volatility in the
second dimension with respect to the first (γ2/γ1), for different volatility/distance
sensitivity ratios (γ1). Figure 1 shows the shareholders’ indifference curves between
18 Therefore, when γn =1 the expected deviations from expected policies in the n-dimension are equally disliked than expected deviation from the ideal policy in the first dimension.
19 We use the average absolute deviation, which is simply
1
nxi − µX
i=1
n
∑, instead of the more
commonly used standard deviation, which in a uniform distribution with range (a,b) is given by
(b − a)2
12 . These two measures of dispersion are of course highly correlated, but we use the latter as the average absolute deviation grasps better what we are interested in, besides simplifying the algebra. No substantive difference would have being obtained had we used the standard deviation instead. 20 Obviously, there is no expected policy deviation in the second or regulatory dimension under democrats, nor in the first or redistributive one under republicans –the expected and realized policy is always 0 in both cases.
12
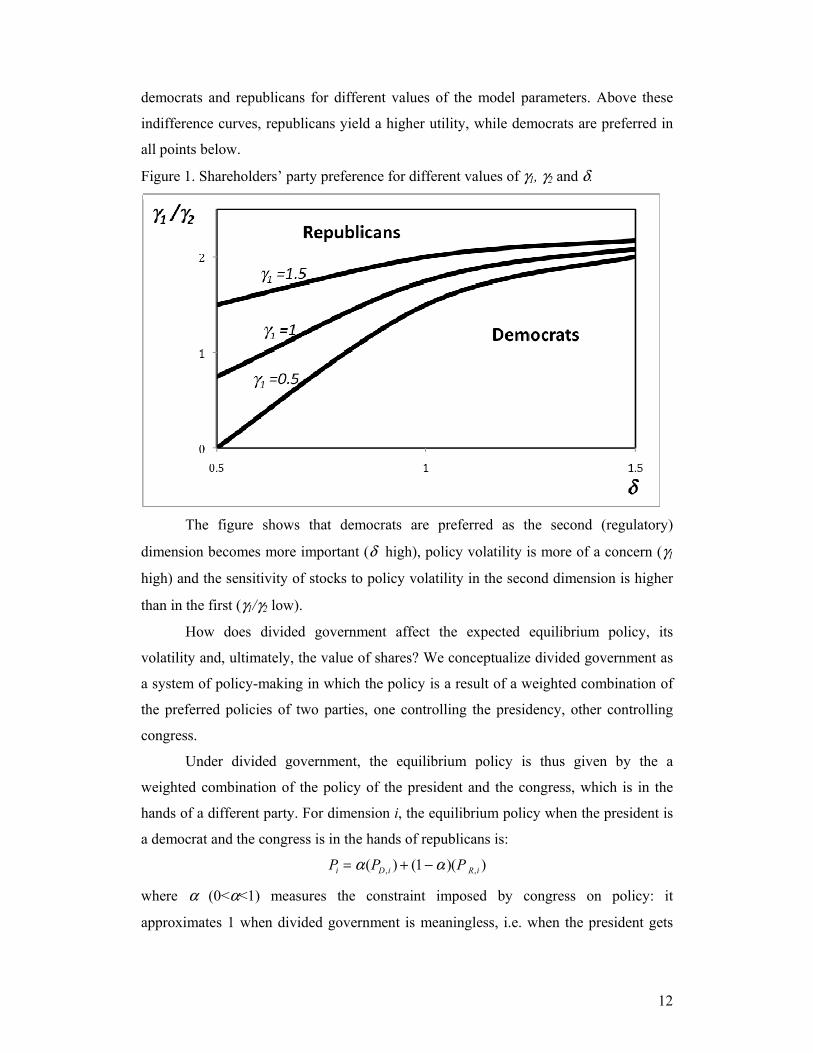
democrats and republicans for different values of the model parameters. Above these
indifference curves, republicans yield a higher utility, while democrats are preferred in
all points below.
Figure 1. Shareholders’ party preference for different values of γ1, γ2 and δ.
The figure shows that democrats are preferred as the second (regulatory)
dimension becomes more important (δ high), policy volatility is more of a concern (γ1
high) and the sensitivity of stocks to policy volatility in the second dimension is higher
than in the first (γ1/γ2 low).
How does divided government affect the expected equilibrium policy, its
volatility and, ultimately, the value of shares? We conceptualize divided government as
a system of policy-making in which the policy is a result of a weighted combination of
the preferred policies of two parties, one controlling the presidency, other controlling
congress.
Under divided government, the equilibrium policy is thus given by the a
weighted combination of the policy of the president and the congress, which is in the
hands of a different party. For dimension i, the equilibrium policy when the president is
a democrat and the congress is in the hands of republicans is:
Pi = α(PD,i ) + (1− α )(P R,i )
where α (0<α<1) measures the constraint imposed by congress on policy: it
approximates 1 when divided government is meaningless, i.e. when the president gets

13
its preferred policy implemented, and it approximates 0 when congress is the only actor
deciding over policy.
We can now see how divided government affects the equilibrium policy under a
democratic and under a republican presidency:
US ,D = α[−µ(PD,1)2 − γ 1(ϕ(PD,1))] + (1− α )[δ (−µ(PR,2 )
2 − γ 2 (ϕ(PR,2 ))]
US ,R = α[−µ(PR,2 )2 − γ 2 (ϕ(PR,2 ))]+ (1− α )[δ (−µ(PD,1)
2 − γ 1(ϕ(PD,1))]
In words, the utility loss for shareholders under a democratic (republican)
president equals the expected policy deviation of democrats (republicans) in the first
(second) dimension, weighted by the power of the president (α), plus the expected
policy of deviation of republicans (democrats) in the second (first) dimension, weighted
by the power of congress (1-α).
To illustrate the results, we simulate what the utility for shareholders is under
different values of the model parameter under divided government: α=.6. We compare
the utilities under divided and divided government for different sensitivities to
volatilities in the second dimension (γ2=1 and γ2=1.5), for different values of δ (x-axis),
both under democratic (figure 2a) and republican (figure 2b) presidents, showing clearly
that for reasonable values of the model parameters, divided government is welfare-
enhancing for shareholders.
Figures 2a and 2b.

14
The intuition for the salutary effects of divided government is straightforward: as
divided government induces policy choices that are less extreme than before,21 divided
government is preferred to extreme policies in one dimension.
In sum, both democratic governments (under certain value parameters), and
divided government are associated with better expected environments for shareholders,
suggesting some possible channels through which political phenomena can extert
effects on stock market behavior. The next section tests with stock market data whether
it is indeed the case that these two political features have been systematically associated,
as expected, with periods of better stock market performance.
3. Empirical Analysis
This section tests the theoretical hypotheses of the model with data on stock market
performance from 1872 to 2003. Before starting the test, we must though answer the
following question: when did stock market investors start to take into account the policy
dimensions of the model? On the one hand, it would be naïve to assume that investors’
expectations have remained the same since 1872 when the first regulations of the stock
market were not enacted until the 1930s. On the other, as the literature has pointed out,
although much of the motivation for the SEC regulations in the early 1930s came from
the perceived weaknesses leading up to the 1929 crash, calls for federally mandated
disclosure to reduce fraud and tame insider trading were made earlier (Mulherin
2007:425). Thus it is plausible to assume that the stock market started to expect/fear
21 Quadratic preferences over the policy space imply that, for instance, the policy vector (0.5, 0.5) is always preferred to (1,0) or (0,1).
15
public regulations long before the creation of the SEC, but it is difficult to establish a
particular date.
In the aftermath of the 1907 bank panic which would trigger the creation of the
Federal Reserve (1913), popular press and some scholars started to raise their concerns
about the consequences for general welfare of a non-publicly regulated stock market
(Emery 1908).22 Nevertheless, the first systematic political debates on stock market
regulation would probably be around 1913, according to both literature and
contemporary accounts. That was the year of the “Money Trust Investigation” by the
US Senate Pujo Committee, considered as the first relevant intervention of political
power into the stock market -that had been so far an entirely private business
(Untermyer 1915:27). The Pujo Committee gave visibility and politicized the increasing
conflict of interests between, on the one hand, small investors and, on the other, finance
tycoons and managers, who were accused of abusing the confidence of the former.23
Therefore, it is likely to assume that investors, similar to some finance experts testifying
before the Committee, began to forecast future political interventions in the stock
market:
“I am convinced that the time will come, and before long, after regulation has been
enforced, when those who are now bitterly assailing the champions of this legislation in the vain hope of thereby diverting the issue will find that it has marked the dawn of a new era of usefulness and prosperity for them, and that the Exchange will feel grateful to those who have pointed the way.”24
The political struggles between different economic actors became evident in the
years immediately before and after the Pujo Committee. Several pamphlets by public
opinion leaders, books by professionals and articles by academics were published in the
1910s and seen at the time as “the result of the renewed agitation in recent years against
speculative markets and the widespread demand for their control or abolition by
legislative action” (Emery 1913:917).25 Chief among them would be Untermyer’s
Speculation on the Stock Exchanges and Public Regulation of the Exchanges in 1915, a
22 Some authors already out the context surrounding the passage of the pro-consumers The Pure Food and Drugs Act of 1906 as the time when “the speculator-investor, like other consumers, became conscious of the abuses of the market place that only the producers had complained of previously” (Cowing 1958:17). 23“Many of the vast illegitimate fortunes that have debauched our citizenship are attributable directly to that cause. For many years the pretended market prices of securities of our greatest corporations have been ‘rigged’ and manipulated at the will of a handful of gamblers and operators, and the people of the country have been literally robbed of hundreds of millions of dollars through such transactions (Untermyer 1915:42).” 24 Testimony of Samuel Untermyer before the US Senate Committee (quoted in Untermyer 1915:68). 25 E.g. John H. Piper’s (1915) The Technology of Stock Market Manipulation, W.C. Van Antwerp’s (1913) The Stock Market From Within or Thomas Gibson’s (1913) The Elements of Speculation.
16
detailed description of how “small honest investors” were victims of the abuses
committed by “members of pools ‘insiders’” (Untermyer 1915:46-49).26 Based on these
accounts, we choose the date of the Pujo Committee (1913) as the initial year to start
testing our hypotheses. Since 1913 onwards we can plausibly assume that it was
common knowledge among investors that regulation would take place.27
Dependent Variable
As argued above, our dependent variable is the excess return or “equity premium”: the
difference between stock market returns and a risk-free rate. We use monthly stock
market return and Treasury Bill data from Global Finance Data for the period 1872 to
2003. Like finance literature approaches, we also use the log excess return for our
analysis. The log excess return is constructed using the S&P 500 Composite Total
Return Index and the USA Total Return Commercial/Treasury-Bill Index. The S&P 500
is back-calculated to 1872 by the Cowles Foundation using the Commercial and
Financial Chronicle. The US bill returns series uses commercial bills from 1872-1918
and treasury bills thereafter.
Economic Variables
Similar to mainstream financial studies, we use four main economic control variables:
the log dividend-price ratio (lDYt), the term spread (TSPt) between two bonds with
different maturity, the relative interest rate (RRt) and the monthly inflation rate
26For example, as Umtermyer (1915:29) denounced, a share of stock that cost $11 was charged with the same compulsory commission as one that cost $200. As Untermyer constantly recalls, what explains fraud and corruption within the New York Stock Exchange was not the absence of regulations, but the fact that regulations and restrictions were imposed by its own members. “Like every industry and profession it contains black sheep within its fold, but unlike others its regulations and practices have heretofore held out to them and to the gamblers whose tools they are temptations, inducements, and immunities of which they have freely availed themselves (…) “My criticism is of a financial system that not only permits but which it is claimed by its authors and those who are executing its self-made law renders it necessary for a handful of private citizens to seize and exercise such vast powers because there is no constituted authority to protect the public or with the right to restrain, direct, or review their action. Herein lies the anomaly of our situation –unlike anything of this kind in the civilized world (…) Why should the determination of such vital public policies be left in private and interested hands?” (Untermyer 1915:26-35). So, the question was not between absence of regulation and public regulation, but between private regulation (by a closed 1,100-strong group of investors) and public regulation. As a matter of fact, the NYSE was extremely regulated during the 1910s, including the prohibition to its members, under the pain of expulsion, from buying or selling securities without the express approval of a special committee and then only under certain restrictions as to the price, terms and other conditions (Umtermyer 1915:33) 27 As Cowing (1958:19) remarks, “the exchanges were afraid that regulation would follow in the wake of the revelations in the Pujo Report”.

17
(INFMt). We can thus test the hypothesis if the political variables are simply a proxy for
these business-cycle variables. Akin to Ederer and Ederer (2006), and contrary to Santa-
Clara and Valkanov, (2003) we do not include a default spread between yields of
differently rated bonds, because such data is not available for the pre-1927 period. Also
similar to Ederer and Ederer (2006), due to data scarcity for the first decades of the
sample, we use proxies for the 10-year treasury note and the 3-month treasury bill used
by Santa-Clara and Valkanov to construct the term spread series. As the US
Government 90-day T-Bills series is only available back to 1920, we use the 3-month
Commercial Paper before that date. All control variables are demeaned.
Historical Variables
Like many previous studies, we control for major historical events found as significant
to explain stock market returns. We include the following dummy variables: WorldWar
I (WWIt; 1 between 1914:8-1918:10, zero otherwise), the Great Depression (GDt;
1929:10-1932:7), World War II (WWIIt; 1939:9-1945:8), the 1973 Oil Crisis (OILCt;
1973:10-1973:11), and January –given the standard finding that stocks tend to rise in
that month.
Political Variables
Following the theoretical model, we introduce three political variables. Ideology of the
President comes from Poole and Rosenthal dataset. We mostly use a continuous
ideological variable instead of the standard in the literature presidential dichotomy.
Firstly, this allows us to keep valuable information which is otherwise lost with a
dummy variable. Secondly, the driving force in our theoretical model –as well as
probably in many other previous explanations- is not so much the party label of the
candidate, but his particular position within a certain ideological or policy scale. Due to
the lack of reliable data on the ideology of some presidents for the pre-1944 period, we
also incorporate the dummy Democrat (President) in some of the models.
Unified Government and Polarize are our proxies for the degree of separation of
powers and heterogeneity of political preferences. Unified Government is a dummy with
value 1 when the party of the President controls both legislative chambers and 0
otherwise. Polarize comes from the Poole and Rosenthal database based on roll-call
voting data, and it is a measure of the distance between the median democrat and the
median republican in the Congress in each year.

18
Analysis of the 1872-1913 period
Table 1 shows the results of two models which analyze the impact of political factors in
the pre-Pujo Committee period. In other words, when one can plausibly assume that the
regulatory policy was a minor concern for stock investors and only one of the two
dimensions of the theory (redistributive policy) was relevant. Or, what is the same,
when we are in the left side of Figure 1. The prediction would thus be straightforward
here: stock markets will perform better under Republicans.
Similar to finance literature, instead of time series with lagged dependent
variables, we run Ordinary Least Squares (OLS) regressions of the log excess returns
and use Heteroskedasticity and Autocorrelation Consistent Standard Errors (HACSE).
They allow us to correct better for problems of heteroskedasticity and serial correlations
than standard time series. One can see in Model 1 of table 1 that effectively the ideology
of the president exerts a significant and positive effect on excess returns: the more
Republican (or right-wing) a president is, the better for the stock market. Due to the
existence of numerous missing values for the ideologies of some presidents during this
period (Poole and Rosenthal themselves recommend not to use them), we double check
the results with the dummy variable Democrat President in model 2. Again, it goes in
the right direction –excess return is lower under Democrats-, but this time the result is
not statistically significant.
Regarding the control variables, they follow the direction of the standard
predictions in the theory, but –in some cases probably because of the low number of
observations- they do not stand as significant. The exception would be the dummy
January, the impact of which is significant, confirming the traditional assumption that
stocks tend to rise in that month.

19
Table 1.Political and Economic Determinants of US Stock Market Performance 1872-1913
Model 1
Model 2
Inflation 0.060 (0.146)
0.103 (0.092)
Dividend-price ratio (log) 0.021 (0.018)
-0.006 (0.009)
Term spread two bonds 0.004* (0.002)
0.001 (0.001)
Interest rate 0.801 (3.828)
0.443 (1.667)
January 0.018** (0.008)
0.014*** (0.005)
Ideology President 0.292*** (0.011)
Party President (1= Dem)
-0.004 (0.005)
Polarization 0.131 (0.073)
0.002 (0.345)
Unified Government 0.016 (0.220)
-0.006 (0.010)
Constant -0.0138 (0.064)
-0.015 (0.029)
N 180
492
***1% significance ** 5% significance, *10% significance. Standard errors in brackets
These results are in line with qualitative evidence from economic and political
historians of the period. To begin with, according to literature accounts, the regulation
of the stock market seemed to lack political salience prior to the 1910s. The major
politically divisive issue that one may assume as affecting investors was fiscal policy –
and, very particularly the lengthy process of the passage of the income tax, which lasted
for more than two decades. When the Democrats won the congressional election of
1890 and the presidential election of 1892, the income tax was put on the top of the
political agenda. In the post-Civil War period Democrats, together with the Populist
Party, were strongly identified with agricultural, low-income states; and attempted to
introduce an income tax which would be mostly paid in the more Republican higher-
income industrial North (Baack and Ray 1985:609).

20
After the passage of the Income Tax in 1894, the political debates surrounding it,
if any, gained impetus.28 A few months later the Supreme Court ruled that the income
tax was unconstitutional because it was a “direct” tax. This judicial decision made the
income tax a major political issue in the presidential campaign of 1896 and, again, party
positions were transmitted very clearly to the electorate and to the stock market. While
the Democrats under the Populist candidate Bryan included the tax in their party
platform, Republican President McKinley plainly rejected it. Debate continued for the
years to come with representatives split along party lines: Democrats (and Populists)
supporting the different income-tax proposals and Republicans opposing them (Baack
and Ray 1985:610).29 Finally, federal budget constrains due to a series of new spending
initiatives, particularly military, and an increasingly demanding veterans’ pension
system, would lead to the passage of the income-tax Sixteenth Amendment in 1913. The
constitutional amendment deactivated, at least temporally, the partisan fiscal debate -
giving a certain sense of predictability to redistribution policies.30 Similarly, Democrats
proposed many other radical reforms during the long leadership of Populist Bryan31
which can easily be seen as hostile to investors’ interests.32
Analysis of the 1913-2003 period
We move now to test the implications of the theory for the period in which we can
assume that both dimensions of the theory have been at play. Table 2 shows three
different models for this period. Model 3 analyzes the excess stock returns for the entire
1913-2003 period. Economic variables follow the predicted sign and, this time,
dividend-price ratio, inflation and interest rate appear as significant. Both WWI and the
Oil Crisis affect negatively excess returns. More interestingly, political factors seem to
28 From the voting congressional records of the 1894 Income Tax we can easily derive which party would be preferred by stock investors: 196 Democrats (plus 8 Populists) voted in favor and 122 Republicans (plus 17 Democrats and 1 Populist) against. 29 Taking advantage of the need to finance the Spanish-American War, Democrats proposed another income tax in 1898, which again was defeated by Republicans. The issue played an important role as well in the 1910 campaign, with (Southern) Democrats attempting to attach an income-tax amendment to the tariff bill (Firor Scott 1963:60). 30 Some authors argue that, once federal government secured the funding mechanism through the income-tax amendment, political debates started to shift from Whom to tax –a primary concern for stock investors- to To Whom benefit with federal spending. The US would thus “entered the modern age of special-interest politics” (Baack and Ray 1985:610). 31 He was nominated Democratic presidential candidate in three elections -1896, 1900 and 1908. 32 For example, some Democrats talked of government ownership of railroads in the 1905 congressional debates on railway regulation –an initiative fiercely opposed by the “Republican Old Guard” (Firor Scott 1963:55). Despite his electoral defeats, Bryan –nicknamed “The Great Commoner”- retained control of the Democratic Party for a long period, fostering a radical agenda which conformed the meaning of the generic term “populist” as we know it today.

21
have a significant impact: excess stock market returns increase the more leftist the
President, the higher the ideological polarization, and under divided government.
Table 2.Political and Economic Determinants of US Stock Market Performance 1913-2003
Model 3 1913-2003
Model 4 1932-2003
Model 5 1932-2003
Inflation -0.484* (0.272)
-1.005*** (0.351)
-1.027*** (0.343)
Dividend-price ratio (log) 0.019*** (0.005)
0.028*** (0.007)
0.024*** (0.007)
Term spread two bonds 0.001 (0.001)
-0.001 (0.002)
-0.001 (0.002)
Interest rate -7.019*** (2.694)
-7.706*** (2.870)
-7.141** (2.852)
World War I -0.026** (0.012)
Great Depression -0.008 (0.009)
-0.007 (0.010)
World War II -0.004 (0.007)
-0.005 (0.008)
-.0005 (0.007)
1973 Oil Crisis -0.059* (0.034)
-0.059* (0.035)
-.0064* (0.034)
January 0.007 (0.005)
0.005 (0.006)
0.005 (0.006)
Ideology President -0.015*** (0.004)
-0.016*** (0.005)
Party President (1= Dem)
.0133*** (0.005)
Polarization 0.029* (0.016)
0.067** (0.027)
0.048* (0.027)
Unified Government -0.028** (0.011)
-0.029** ( 0.012)
-0.025** (0.017)
Constant -0.009 (0.010)
-0.027* (0.016)
-0.024 (0.016)
N 934
826 850
***1% significance ** 5% significance, *10% significance. Standard errors in brackets
Model 4 reproduces the analysis, but this time for the period in which stock
market regulation officially starts in the aftermath of the Great Depression with the
enactment of the 1933 and 1934 Acts. In other words, we look more specifically at the
period in which both policy dimensions of the theory may definitely be assumed as

22
important for investors. The results are almost identical, with the only noticeable
difference that the coefficients of the political factors become slightly more important
and more significant. Thus, political factors do not seem to increasingly matter less, but
more. Finally, model 5 double checks the results using the standard in the literature
dummy presidential variable. Again, results do not change: excess returns are larger
under Democratic presidencies.33
Similar to the analysis of the pre-1913 period, the results of these models,
although contradicting some findings in political science on stock market performance,
coincide with accounts from historians and scholars on regulatory policy. In the first
place, as it is well known, New Deal Democrats created modern securities regulation in
the 1930s. As Mulherin 2007:425) reminds, although it is difficult to asses the real
impact of these regulations on stock performance, this does not mean that they were not
welcomed by investors after the 1929 crash.34
More recently, we can also see in regulation literature several illustrations of the
workings of the theory. Regulation policies enacted by Democrats have been
predictably aligned with shareholders interests. One clear example would be the record
of Arthur Levitt -appointed by President Clinton as chairman of the SEC from 1993 to
2001, and who was widely known as champion of the individual investor. Under his
rule, the SEC initiated a series of reforms to protect shareholders by improving
managerial accountability and financial transparency (Cioffi 2006:21).35 Chief among
those reforms would be the 2000 Regulation Fair Disclosure, which mandated that all
33 It could be argued that higher excess returns under certain conditions are simply a compensation for the higher risk investors incur when holding them. The positive effects of Republican presidents up to 1913, of Democrats from 1913 on, and of divided government and polarization on stock market returns could be compensations for the higher volatility of returns under those conditions. Maybe what happens in those circumstances is that investors perceive higher policy inconsistency or uncertainty, what leads to higher market volatility, and, in accordance, they demand for a higher return. In order to control for this possibility, we have tested for differences in the volatility of stock market returns using exponential generalized autoregressive conditional heteroskedasticity (EGARCH) models. Again, in choosing EGARCH as a robustness test for our results we follow recent finance studies (e.g. Ederer and Ederer 2006) and depart from political science ones who tend to use GARCH models (e.g. Mukherjee and Leblang 2007). The results of EGARCH tests rule out the possibility that higher excess returns are a compensation for higher risk: volatility is not significantly higher under Democrats, divided government or polarization. 34 Scholars also agree that, historically the Democratic Party has been less in favor of disrupting or unpredictable reforms than its European counterparts -probably as a result of the relative lack of class-based politics in the US (Cioffi and Höpner 2005:26). 35 That frequently meant direct and hostile confrontation with managers’ vested interests: “They [top executives] had a fortress mentality (…) They chose to make war rather than try to work with the commission. (…) They spent a fortune of money to fight us legally and legislatively.” (Interview in The
New York Times, December 21, 2000.

23
publicly traded companies must disclose information to all investors at the same time,
prohibiting selective disclosures which disadvantaged individual investors.
On the contrary, Republican regulatory policies have been systematically less
predictable. Republicans sometimes seem to favor shareholders and other times
managers. During the 1990s, Republicans, on the one hand, supported most SEC
reforms to improve the mechanisms of transparency and managerial accountability. As
Levitt remarked, despite Republicans had run the committees with oversight
responsibility for the SEC during most of his tenure, “we did these things [pro-
shareholders reforms]” and “we were not rolled back once”.36 This particular example
thus illustrates both Republicans’ alignment with shareholders interests as well as also
the positive effects of divided government on investors’ interests.
On the other hand, voting records in two important regulatory changes during
the 1990s reveal a more pro-management stance of congressional Republicans. In the
first place, Republicans, following a proposal included within Newt Gingrich’s
Contract With America, passed the Private Securities Litigation Reform Act of 1995,
over a veto by President Clinton.37 This Act heightened the pleading requirements for
securities fraud suits, weakening one of the most important enforcement mechanisms at
the disposal of shareholders to hold managers accountable. Similarly, Republicans in
Congress supported the Securities Litigation Uniform Standards Act of 1998, designed
in theory to reduce “frivolous” litigation by making it harder to suit for securities fraud.
This Act was widely perceived as strengthening the position of corporate managers at
the expense of shareholders (Cioffi and Höpner 2006:23).
Furthermore, when resigning after the Republican Presidential takeover in 2000,
Levitt expressed concern about the possibility that some of his pro-shareholders actions
would be rolled back during the new Bush administration. He stated that a SEC with 4
out of 5 board members appointed by a Republican President would lack zeal to push
accountants to resist corporate managers’ pressures to make companies look better.38 He
36 Interview in The New York Times, December 21, 2000. 37 Every Republican in the House voted in favor of the legislation, and only four Republicans in the Senate (e.g. John McCain) voted against it. Four of the five sponsors of the Act in the House and Senate were also Republican. 38 “If you don't have an activist chief accountant (…) the competitive juices of corporate America are such that they will stay close to the line, and some of them will go over the line. It requires continual attention.” (Interview in The New York Times, December 21, 2000).

24
also admitted that the new Republican administration would be strongly tempted by
corporate managers to repeal the 2000 Regulation Fair Disclosure.39
The lengthy legislative procedure that led to the approval of the 2002 Sarbanes-
Oxley Act also clearly shows, first, the difficulties of Republicans to simultaneously
take into account both shareholders’ and managers interests. The Act was sponsored by
a Democrat representative (Paul Sarbanes) and a Republican one (Michael G. Oxley),
and was overwhelmingly approved in both chambers.40 Nevertheless, the Act was the
result of an intense political struggle. While democrats acted cohesively asking for a
pro-shareholders reform, a cleavage within the congressional Republican files emerged
between moderate members who followed a pro-shareholders agenda, and those who
opposed any regulation to preserve their alliance with corporate managers. It was
precisely the possibility of an important fracture within the Republican Party unity what
led President Bush and conservative Republicans in Congress to end their resistance and
gave their support to the Sarbanes-Oxley Act. Secondly, literature also emphasizes the
important role played by divided government in the Act, since it was the Democrats’
control of the Senate prior to the 2002 elections what ultimately allowed to pass it
(Cioffi and Höpner 2006:25).
Another empirical result of our study that finds support on the regulatory
literature is that, contrary to the popular view that nowadays politics matters less for
economic outputs, political factors seem to be more important for the stock market
performance. Our finding of increasing significant coefficients for the three political
variables over the last century is linked with remarks in the regulatory policy literature
that the conflict between shareholders and managers is becoming both more relevant
and more politically visible. Shareholders’ and manager’s interests have been
progressively more coming apart -especially since the late 1970s, given the scarcity of
hostile takeovers before. It was the rise of the junk bond market in the 1980s what
triggered the expansion hostile-takeover offers and, in response, corporate managers
demanded regulations restricting shareholders rights such as takeover defenses or limits
to shareholders’ ability to meet or act (Gompers et al. 2003:1). Consequently, managers
39 “We have heard from corporate executives who lament being unable to do certain things because of fair disclosure (…) they never should have been doing those things anyway” (Interview in The New York
Times, December 21, 2000). 40 In the House by a vote of 423-3 and in the Senate by 99-0. President Bush not only did not veto it, but, when signing it into law, he stated that it was “the most far-reaching reform of American business practices since the time of Franklin D. Roosevelt” (The New York Times July 31, 2002).

25
and shareholders have been fighting more legal and legislative battles for the last three
decades (Adams and Matheson 2001).
4. Conclusions
This paper makes several contributions to the literature. As we have seen, there are two
opposing findings in previous studies: for most finance scholars stock market performs
better under Democrats while political scientists tend to argue that Republicans are
better. Deriving testable propositions from a theory that shows the micro-foundations
linking politics and the stock market and using a well-specified empirical model with
control variables from both literatures, we are able to reconcile these contradictory
results. When the most relevant policy issue at stake for investors was redistribution –
i.e. from the late 19th century to the 1910s-, stock market preferred the Republicans.
From the 1910s onwards though, when shareholders have been exposed to both
redistributive and regulatory policies, the stock market has performed better under
Democrats. Not only this, but since we use a continuous ideological variable, this result
could be written as follows: the more leftist a President is, the better for the stock
market.
Similarly, data shows us an increasing impact of two traditionally neglected
political factors: divided government and ideological polarization. Unlike some
preceding political science predictions that divided government could lead to stock
market downturn (Bernhard and Leblang 2006:1), we show divided government as
having a positive effect on stock market performance. As well, ideological polarization,
in the light of the results presented here and against the prevailing view about the
negative economic consequences of polarization, exerts a positive impact on the stock
market.
Also quite opposite to both finance and political science approaches, this paper
is grounded on qualitative findings from public policy and economic history literatures.
They have helped us, first, identify our theoretical mechanisms and, second, take the
relevant decisions on the empirical design. In general, similar to public policy literature,
this paper has shown that politics matters –and it seems that increasingly more- for the
stock market. Regulations are not the consequence of economic forces, but of political
calculus. The ones who have taken the lead in recent pro-shareholders regulations in
OECD countries have not been so much unions (not so directly interested), shareholders
(poorly organized) or other interest groups, but parties who have seen an opportunity in

26
exploiting the conflict within the ranks of business between managers and shareholders
(Cioffi and Höpner 2006:33).
Inferences of these results outside the US cannot be made easily though. The US
is a paradigmatic example of “liberal market economy” –with market-driven financial
system, liquid markets, diffuse share ownership that separates corporate ownership from
control, among other features. Thus the American form of shareholders-managers
conflict is difficult to find in other economies with the same impetus (Fligstein 2001).
Nevertheless, as long as there has been an increase in both the diffusion of share
ownership as well as its extension to middle and working classes in many countries,
scholars in comparative regulatory policy have already started to detect policy coalitions
along the lines of the ones pointed out here for the US. Center-left parties in countries
like Germany, France and Italy have been increasingly overcoming their traditional
opposition to shareholders’ requests, becoming the main driving force behind the latest
pro-shareholders regulatory reforms. At the same time, long-lasting established
alliances with corporate managers have constrained right-wing parties in those countries
for clearly endorsing pro-shareholders regulations (Cioffi and Höpner 2006).
Many outcomes of this new alliance between shareholders’ interests and center-
left parties –like the French 2001 “New Economic Regulations” Act, the 1998 “Dragui
reforms” in Italy,41 or the German Corporate Governance Commission in 2000- are
probably too recent to have significantly affected investors’ behavior to the same extent
as in the US -where the origins of this coalition can be traced back many decades ago.
But it is likely to expect similar results for other OECD countries in analyses focused on
the latest years.
The normative implications of this paper, if any, run against Leblang and
Mukherjee’s remark that “right-wing parties arguably have a greater ability and
willingness for priming the economy in ways that has a positive impact on stock
returns” (2005:800). They claim -“perhaps provocatively” (2005:783)- that Republicans
are likely to have better electoral prospects in the future.” Although sharing their
assumptions on Democrats’ commitment to redistribution and Republicans’ generally
closer position to the preferences of the stock market, this paper shows that they are not
enough to explain the impact of political factors over investors’ calculations. The
predictability of policy preferences may play an even more important role than the
41 Mario Dragui, a former vice-chairman of Goldman Sachs in London, was the main pro-shareholder economic reformer within the 1996-1998 left-wing government of Massimo D’Alema.

27
starting party policy preferences. In the light of the results of this paper, our predictions
on future electoral fortunes would thus be more in line with those comparative
regulatory policy studies pointing out the rising constraints faced by center-right parties
in OECD countries to address mainstream business concerns (Cioffi and Höpner 2006).
Instead of responding to widespread public concerns about corporate scandals, center-
right parties are increasingly perceived as protective of traditional features of
managerialism. Changing economic conditions during the last decades have sharpen the
conflict of policy interests between shareholders and managers and that seriously
diminishes the capacity of center-right parties to simultaneously appeal to both
constituencies.
On the contrary, center-left parties seem to have been able to take advantage of
the unpredictability of center-right’s policies. Furthermore, center-left’s alliance with
shareholders does not seem to be increasingly weakening, but, quite the opposite,
increasingly reinforcing center-left’s traditional coalition with employees. Nowadays,
more employees own shares and, with the crisis in public old age pension systems in
several OECD countries, there are reasons to expect further increases in shareholdings
by employees as an alternative form of saving. Therefore, the general rise in
shareholding among the electorate, the increasing role of regulatory policy to solve the
deepening cleavage between shareholders and managers, and the growing convergence
of left parties and shareholders’ interests should lead us to predict, in contrast to
Leblang and Mukherjee (2005), better future electoral prospects for center-left than for
center-right parties.
References
Adams, E. S. and J. H. Matheson. 2001. “A Statutory Model for Corporate Constituency Concerns,” Emory Law Journal, p. 1085 (Fall). Alesina, A., Roubini, N. and Cohen, G. (1997) Political Cycles and the Macroeconomy, MIT Press, Cambridge, Massachusetts. Allvine, F. C., and D. E. O’Neill. 1980. ‘‘Stock Market Returns and the Presidential Election Cycle.’’ Financial Analysts Journal 36(5):49–56. Baack, B.D. and E. J. Ray. 1985. “Special Interests and the Adoption of the Income Tax in the United States”, The Journal of Economic History, Vol. 45, No. 3, 607-625. Sep. Bernhard, W. and D. Leblang, 2006, Democratic Processes and Financial Markets: Pricing
Politics, Cambridge University Press, Cambridge, U.K.

28
Campbell, S. D. and Li, C., 2004. “Alternative Estimates of the Presidential Premium” Working paper 2004-69, Federal Reserve Board, Washington, D.C. Cioffi, John W. (2006): “Building Finance Capitalism: The Regulatory Politics of Corporate Governance Reform in the United States and Germany,” in Jonah Levy, ed., The State After
Statism: New State Activities in the Age of Globalization and Liberalization. Cambridge, MA: Harvard University Press Cioffi, J. and M. Höpner. 2006. “Party Politics in Corporate Governance Reform” Politics &
Society, Vol. 34, No. 4, 463-502. Chari, V. V., Larry E. Jones, and R. Marimon. 1997. “The Economics of Split-Ticket Voting in Representative Democracy.” The American Economic Review 87: 957–976. Cowing, C.B. 1958. “The Discussion of Speculative Competence in America, 1906-1934” American Quarterly, Vol. 10, No. 1, 17-33. Spring, 1958. Drazen, A., 2000. Political economy in macroeconomics. Princeton: Princeton University Press. Ederer, M. and F. Ederer. 2006. “Political Cycles and the Stock Market: Presidential and Prime Minister Puzzles” Emery, H. C. 1908. “Ten Years Regulation of the Stock Exchange in Germany”. Yale Review
17 (May):5–23. Emery, H.C. 1913. Untitled. The American Economic Review, Vol. 3, No. 4, pp. 917-921. Fama, E.F. 1991. “Efficient Capital Markets: II”, Journal of Finance 46, 1575-1617. Fama, E.F. and French, K.R. 1988. “Dividend Yields and Expected Stock Returns,” Journal of
Financial Economics 22, 3-25. Freeman, J., J. C. Hays, and H. Stix, 2000, “Democracy and markets: the case of exchange rates.” American Journal of Political Science 44, 449–468. Gompers, P.A., J. L. Ishii, and A. Metrick. 2003. "Corporate Governance and Equity Prices." Quarterly Journal of Economics. February, 107-155. Gourevitch, Peter; Shinn, James (2005): Political Power and Corporate Control: The New
Global Politics of Corporate Governance. Princeton, NJ: Princeton University Press. Herron, M., 2000, “Estimating the economic impact of political party competition in the 1992 British election.” American Journal of Political Science 44, 326–337. Huang, R.1985. “Common Stock Returns and Presidential Elections, Financial Analysts
Journal 41, 58-61. Leblang, D. and B. Mukherjee. 2005, “Government partisanship, elections and the stock market: examining American and British stock returns, 1930–2000.” American Journal of Political
Science 49, 781–803. Leinweber, David J., 1997, “Stupid data mining tricks: Over-fitting the S&P 500” ,Working paper, First Quadrant.
29
Litvak, K., 2007. “Sarbanes-Oxley and the cross-listing premium” Michigan Law Review, 105: 1857-1898. Mukherjee, B. and Leblang, D. 2007. “Partisan Politics, Interest Rates and the Stock Market: Evidence from American and British Returns in the Twentieth Century” . Economics & Politics, Vol. 19, No. 2, pp. 135-167. Nelson, D.B. (1991) “Conditional Heteroskedasticity in Asset Returns: A new Approach”, Econometrica 59, 347-370. Officer, R.R., 1973. 2The variability of the market factor of the New York Stock Exchange”. Journal of Business 46, 434–453. Pagano, M. and P. Volpin. 2005 “The Political Economy of Corporate Governance”, American
Economic Review vol. 95(4), pp. 1005-1030. Peltzman, S., 1975. “The effects of automobile safety regulation”. Journal of Political Economy 83, 677–726. Roe, Mark J. 2003. Political Determinants of Corporate Governance. Political Context,
Corporate Impact, Oxford: Oxford University Press. Santa-Clara, P. and Valkanov, R., 2003. “The Presidential Puzzle: Political Cycles and the Stock Market”, Journal of Finance 58, 1841-1872. Shleifer, A., and R. Vishny. 1997. “A Survey of Corporate Governance,” Journal of Finance, LII, 737-783. Siegel, J. J., 2002, Stocks for the Long Run: The Definitive Guide to Financial Market Returns
and Long-Term Investment Strategies, McGraw Hill, New York. Snowberg, E., J. Wolfers, and E. Zitzewitz. 2007. “Partisan Impacts on the Economy: Evidence from Prediction Markets and Close Elections.” The Quarterly Journal of Economics 122: 807–830. Stigler, G.J., 1964. 2Public regulation of the securities markets2. Journal of Business 37, 117–142. Stiglitz, J.E., 2002. “Information and change in the paradigm in economics”. American
Economic Review 92, 460–501. Tierney, John. “Bring on the Seinfeld Congress”. The New York Times, November 14, 2006. Untermyer, Samuel. 1915. “Speculation on the Stock Exchanges, and Public Regulation of the Exchanges.” American Economic Review 5: 24-68.