Particle beam mass spectrometry of submicron particles charged to saturation in an electron beam
12
Pergamon J. Aerosol Sci., Vol. 26, No. 5, pp. 145-756, 1995 Copyright 0 1995 Elsevier Science Ltd Printed in Great Britain. All tights reserved @X-8502/95 $9.50 + 0.00 0021-8502(95)00009-7 PARTICLE BEAM MASS SPECTROMETRY OF SUBMICRON PARTICLES CHARGED TO SATURATION IN AN ELECTRON BEAM Paul J. Ziemann, Peng Liu, Nagaraja P. Rao, David B. Kittelson and Peter H. McMurry Particle Technology Laboratory, Department of Mechanical Engineering, University of Minnesota, Minneapolis, MN 55455, U.S.A. (First received 4 November 1994; and in final form 9 January 1995) Abstract-A particle beam mass spectrometer has been developed for measuring the size distribu- tion of submicron (in this study -0.02-0.3 pm) particles in low-pressure environments. Particles are sampled into a differentially pumped system and focused into a narrow, low-divergence beam using aerodynamic lenses, charged to saturation in an electron beam, and then deflected electrostatically into a Faraday cup for measurement of the particle current. Measurements of particle current as a function of deflection voltage are combined with measured relationships between particle velocity and diameter, charge and diameter, and mass and diameter, to determine the particle size distribu- tion. Results of measurements on KC1 particles are in good agreement with size distributions obtained by differential mobility analysis. The maximum diameter resolution @,/AD,) is about 10, a complete size distribution can be measured in about 2-3 min, and the detection limit is about 10 particles cm - 3 when sampling from a pressure of 270 Pa. INTRODUCTION The manufacture of semiconductor devices involves a variety of processes occurring over a wide range of operating pressures (from atmospheric to ultra-high vacuum). During processing, particles can be produced by flaking from the walls of the equipment, or by homogeneous nucleation resulting from pump down or from reactions involving gas phase species that produce nonvolatile products. These particles can deposit on the surfaces of semiconductor devices, leading to defects which reduce product yield. It is projected (Semiconductor Research Corporation, 1991) that by the year 2001 particles down to 0.015 pm, and perhaps as small as 0.005 pm, will be critical to the yields of 1 Gbit DRAMS. Semiconductor manufacturers will need to be able to detect aerosol particles down to this size at subatmospheric pressures, but there are currently no instruments that can meet these requirements. Available techniques for sizing and detecting aerosol particles are often limited to operation near atmospheric pressure (e.g. mobility analyzers, condensation nucleus counters), or cannot be used to detect low concentrations of ultrafine particles (e.g. light scattering). In an effort to alleviate this problem, we have recently developed a particle beam mass spectrometer that can be used to size and detect ultrafine particles sampled from low-pressure environments. The instrument could be used as a particle detector in process control, and as a tool for investigating particle formation in semiconductor equipment or other low-pressure systems. Such a device could be coupled to a laser-ionization time-of- flight mass spectrometer, which can be used to determine the chemical composition of single aerosol particles (McKeown et al., 1991) but provides limited particle size information. In our instrument, particles are focused into a narrow beam using a series of aerodynamic lenses that we have recently developed (Liu et al., 1995a, b), and are then transported into a low-pressure chamber where they are charged by electron impact and deflected electro- statically into a Faraday cup detector for current measurement. Particle size is determined by combining measured relationships between particle velocity and diameter, charge and diameter, and mass and diameter, to obtain a relationship between particle diameter and kinetic energy-to-charge ratio. The latter quantity can easily be measured using conven- 745
Transcript of Particle beam mass spectrometry of submicron particles charged to saturation in an electron beam

Pergamon J. Aerosol Sci., Vol. 26, No. 5, pp. 145-756, 1995 Copyright 0 1995 Elsevier Science Ltd
Printed in Great Britain. All tights reserved @X-8502/95 $9.50 + 0.00
0021-8502(95)00009-7
PARTICLE BEAM MASS SPECTROMETRY OF SUBMICRON PARTICLES CHARGED TO SATURATION
IN AN ELECTRON BEAM
Paul J. Ziemann, Peng Liu, Nagaraja P. Rao, David B. Kittelson and Peter H. McMurry
Particle Technology Laboratory, Department of Mechanical Engineering, University of Minnesota, Minneapolis, MN 55455, U.S.A.
(First received 4 November 1994; and in final form 9 January 1995)
Abstract-A particle beam mass spectrometer has been developed for measuring the size distribu- tion of submicron (in this study -0.02-0.3 pm) particles in low-pressure environments. Particles are sampled into a differentially pumped system and focused into a narrow, low-divergence beam using aerodynamic lenses, charged to saturation in an electron beam, and then deflected electrostatically into a Faraday cup for measurement of the particle current. Measurements of particle current as a function of deflection voltage are combined with measured relationships between particle velocity and diameter, charge and diameter, and mass and diameter, to determine the particle size distribu- tion. Results of measurements on KC1 particles are in good agreement with size distributions obtained by differential mobility analysis. The maximum diameter resolution @,/AD,) is about 10, a complete size distribution can be measured in about 2-3 min, and the detection limit is about 10 particles cm - 3 when sampling from a pressure of 270 Pa.
INTRODUCTION
The manufacture of semiconductor devices involves a variety of processes occurring over a wide range of operating pressures (from atmospheric to ultra-high vacuum). During processing, particles can be produced by flaking from the walls of the equipment, or by homogeneous nucleation resulting from pump down or from reactions involving gas phase species that produce nonvolatile products. These particles can deposit on the surfaces of semiconductor devices, leading to defects which reduce product yield. It is projected (Semiconductor Research Corporation, 1991) that by the year 2001 particles down to 0.015 pm, and perhaps as small as 0.005 pm, will be critical to the yields of 1 Gbit DRAMS. Semiconductor manufacturers will need to be able to detect aerosol particles down to this size at subatmospheric pressures, but there are currently no instruments that can meet these requirements. Available techniques for sizing and detecting aerosol particles are often limited to operation near atmospheric pressure (e.g. mobility analyzers, condensation nucleus counters), or cannot be used to detect low concentrations of ultrafine particles (e.g. light scattering). In an effort to alleviate this problem, we have recently developed a particle beam mass spectrometer that can be used to size and detect ultrafine particles sampled from low-pressure environments. The instrument could be used as a particle detector in process control, and as a tool for investigating particle formation in semiconductor equipment or other low-pressure systems. Such a device could be coupled to a laser-ionization time-of- flight mass spectrometer, which can be used to determine the chemical composition of single aerosol particles (McKeown et al., 1991) but provides limited particle size information.
In our instrument, particles are focused into a narrow beam using a series of aerodynamic lenses that we have recently developed (Liu et al., 1995a, b), and are then transported into a low-pressure chamber where they are charged by electron impact and deflected electro- statically into a Faraday cup detector for current measurement. Particle size is determined by combining measured relationships between particle velocity and diameter, charge and diameter, and mass and diameter, to obtain a relationship between particle diameter and kinetic energy-to-charge ratio. The latter quantity can easily be measured using conven-
745
746 P. J. Ziemann et al.
tional electrostatic energy analysis, and therefore the particle size distribution of an aerosol can be determined by scanning the energy analyzer.
This technique differs from traditional forms of mass spectrometry, in which velocities are usually measured (e.g. from magnetic or time-of-flight measurements) at the same time as the energies. For example, the mass distributions of nanometer-size carbon particles formed and charged (one or two charges) in a flame have recently been measured using a combina- tion of pulsed and static electric deflection (Roth and Hospital, 1994). Another difference involves our treatment of particle charge, which appears in the equations describing particle motion in an electric or magnetic field. When atoms, molecules, or clusters smaller than a few nanometers are ionized by any of the standard techniques (e.g. chemical ionization, electron impact, or laser ionization) they usually become singly charged. On the other hand, the charge acquired by larger particles will usually increase with particle size. This behavior can greatly complicate the mass analysis of these species. One can choose to operate under ionization conditions such that the maximum particle charge will be one, as has been done in a study on clusters up to about 10 nm in diameter (Henkes and Mikosh, 1974) and also for submicron particles (Seapan et al., 1982). However, this technique can significantly decrease instrument sensitivity when measurements are made over a large range of particle sizes. Our approach is to impact particles with high currents of electrons that have high enough energies to cause secondary electron emission. The result is that particles acquire high positive charges, which increases the signal per particle. More importantly, particles become saturated with charge under these conditions, the amount of charge being linearly proportional to the particle diameter (Ziemann et al., 1995a). This simple relationship can then be used in the data analysis.
In this report we describe the operation of the instrument and the techniques used for calibration, data analysis, and measurements of particle size distributions. The results of measurements made using the particle beam mass spectrometer are compared with size distributions obtained by differential mobility analysis, a standard technique for atmo- spheric pressure measurements.
EXPERIMENTAL APPARATUS AND TECHNIQUE
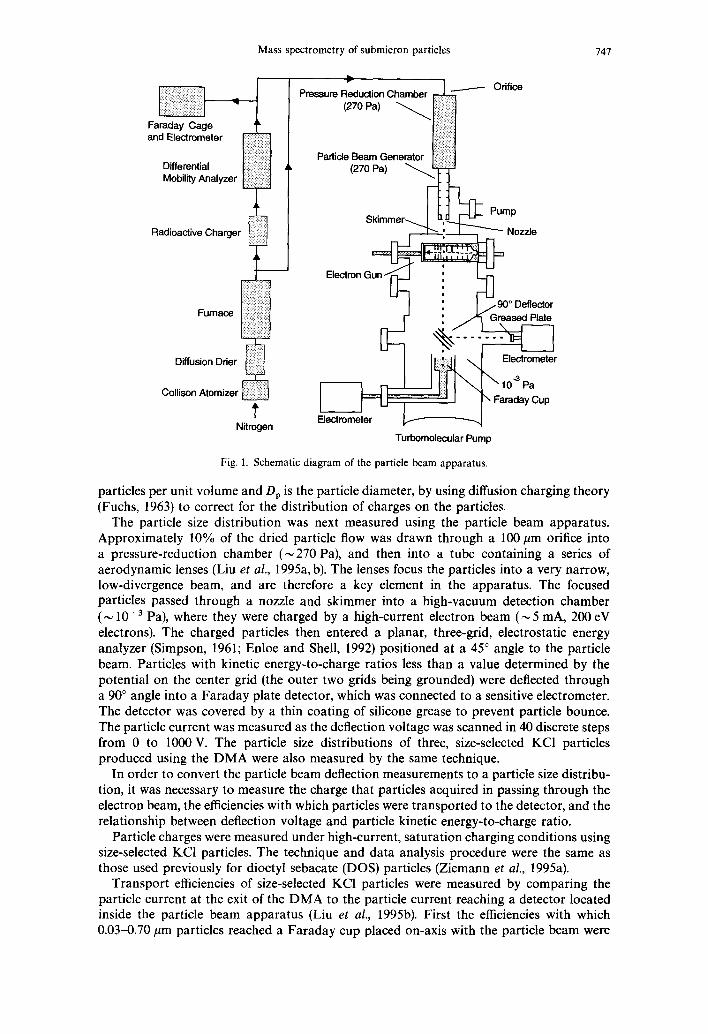
The apparatus used in these experiments is shown in Fig. 1. It has been described in detail elsewhere (Ziemann et al., 1995a). The only significant modification made for this work was that a pair of parallel plates used to electrostatically deflect the particles was replaced (although in a different location) by a set of grids (95% transmission nickel mesh) that provide 90” electrostatic deflection. This change allowed the particle detector to be moved into a side-arm off the main chamber, thereby reducing background noise and lowering the particle detection limit.
Potassium chloride particles were generated for size distribution measurements by nebulizing an aqueous salt solution using a Collison atomizer with nitrogen carrier gas. The solution drops were dried by passing them through a pair of diffusion driers containing silica gel and anhydrous calcium sulfate, respectively, and then through a tube furnace operated at 300 “C.
The particle size distribution was first measured using a differential mobility analyzer (DMA) (Liu and Pui, 1974) which separates particles according to their electrical mobility and only allows those within a narrow mobility window to pass. The measured mobility can be expressed as a mobility diameter that, for spherical particles, is equal to the geometric diameter. In what follows we will use the term particle diameter rather than mobility diameter.
Before entering the DMA, dried particles were charged to near-Boltzmann equilibrium (Liu and Pui, 1975) in a bipolar charger containing a strip of radioactive *iOPo. The particle current transmitted by the DMA was then measured using a Faraday cage and electro- meter, while the center-rod voltage of the DMA was scanned in 30 discrete steps. The particle current, measured as a function of the deflection voltage, was inverted (Hagen and Alofs, 1983) to obtain the size distribution function dN/dlog D,, where N is the number of
Mass spectrometry of submicron particles 141
Pressure Reduction Chamber
Faraday Cage and Electrometer
Differential Mobility Analyzer
Radioactive Charger
AL
t Nitrogen
(270 Pa)
Partide Beam Generator (270 Pa)
Electrometer
Turbomolecular Pump
Fig. 1. Schematic diagram of the particle beam apparatus.
particles per unit volume and D, is the particle diameter, by using diffusion charging theory (Fuchs, 1963) to correct for the distribution of charges on the particles.
The particle size distribution was next measured using the particle beam apparatus. Approximately 10% of the dried particle flow was drawn through a 100 pm orifice into a pressure-reduction chamber (-270 Pa), and then into a tube containing a series of aerodynamic lenses (Liu et al., 1995a, b). The lenses focus the particles into a very narrow, low-divergence beam, and are therefore a key element in the apparatus. The focused particles passed through a nozzle and skimmer into a high-vacuum detection chamber (- 10e3 Pa), where they were charged by a high-current electron beam (- 5 mA, 200 eV electrons). The charged particles then entered a planar, three-grid, electrostatic energy analyzer (Simpson, 1961; Enloe and Shell, 1992) positioned at a 45” angle to the particle beam. Particles with kinetic energy-to-charge ratios less than a value determined by the potential on the center grid (the outer two grids being grounded) were deflected through a 90” angle into a Faraday plate detector, which was connected to a sensitive electrometer. The detector was covered by a thin coating of silicone grease to prevent particle bounce. The particle current was measured as the deflection voltage was scanned in 40 discrete steps from 0 to 1000 V. The particle size distributions of three, size-selected KC1 particles produced using the DMA were also measured by the same technique.
In order to convert the particle beam deflection measurements to a particle size distribu- tion, it was necessary to measure the charge that particles acquired in passing through the electron beam, the efficiencies with which particles were transported to the detector, and the relationship between deflection voltage and particle kinetic energy-to-charge ratio.
Particle charges were measured under high-current, saturation charging conditions using size-selected KC1 particles. The technique and data analysis procedure were the same as those used previously for dioctyl sebacate (DOS) particles (Ziemann et al., 1995a).
Transport efficiencies of size-selected KC1 particles were measured by comparing the particle current at the exit of the DMA to the particle current reaching a detector located inside the particle beam apparatus (Liu et al., 1995b). First the efficiencies with which 0.03-0.70 pm particles reached a Faraday cup placed on-axis with the particle beam were
748 P. J. Ziemann et al.
measured, while the electron gun was turned off and the energy analyzer voltage set to zero. Next the efficiencies were measured for particles deflected by 90” into the off-axis Faraday detector. The deflection measurements were made using particles smaller than about 0.05 ,um, since larger particles were not deflected by voltages up to 5000 V. Finally, the transport efficiencies of a few larger particles were measured by deflecting particles under saturation charging conditions. The higher charges made it possible to deflect these particles with smaller voltages. In this case the efficiencies were calculated by first dividing the deflected particle current by the known saturation charge (determined from the size-dependent charging measurements), before comparing with the DMA particle current.
The 90” energy analyzer was calibrated by measuring the voltages required to deflect particles having known kinetic energy-to-charge ratios. Deflection curves were measured for 0.0435 pm DOS and KC1 particles (primarily singly charged) with the electron gun turned off, and for each particle the voltage at the inflection point was determined. The kinetic energy of DOS particles was calculated using the velocity-diameter relationship measured previously (Ziemann et al., 1995a) for these particles using a parallel-plate deflector whose behavior can be calculated from geometric properties. The kinetic energy of KC1 particles was calculated using the same equations, but with corrections for particle density and shape that are described below. The average kinetic energy-to-voltage ratio for the two particles was 1.49 Ifr 0.1 eV/V. It is easy to show using electrostatics and Newton’s laws that the value for a perfect 90” deflector is 2. Our smaller value is due to field penetration through the mesh used to establish the grid potentials, which weakens the deflection fields (Enloe and Shell, 1992).
DATA ANALYSIS
The quantity measured using our energy-analysis technique is the integrated particle beam current IPB(I/), determined as a function of deflection voltage V. In electrostatic energy analysis the deflection voltage is proportional to the particle’s kinetic energy-to- charge ratio, so that
V = mu2/2Aze, (1)
where m, u, and z are the particle mass, velocity, and charge (in elementary units), respectively, A is proportionality constant that depends on the configuration of the energy analyzer (the value is obtained from the deflector calibration), and e is the magnitude of the electron charge. In order to express the particle beam current as a function of particle diameter, it is necessary to know the relationship between particle mass and diameter m(D,), velocity and diameter u(D,), and charge and diameter z(D,). These equations can then be substituted into equation (1) to obtain V(D,), which can in turn be substituted into Z,,(V) to obtain Z&J. The particle size distribution function (number per unit volume per diameter interval) dN(D,) /dD, is obtained by dividing dZPB(Dp) /dD, by the size-dependent particle charges ez(D,) and transport efficiencies E(D,), and the volumetric flow rate of gas into the particle beam apparatus F. This yields
dN(D,)ldD, = (dl,,(D,)ldD,)/(ez(D,)E(D,)F),
which can be rearranged to obtain
(2)
dN(D,)ldlog D, = 2.3D,(dl,,(D,)ldD,)/(ez(D,)E(D,)F). (3)
The results presented here were analyzed by importing the raw data into a spread-sheet and then using curve-fitting and differentiation routines to perform the necessary data manip- ulations.
RESULTS AND DISCUSSION
Instrument calibration
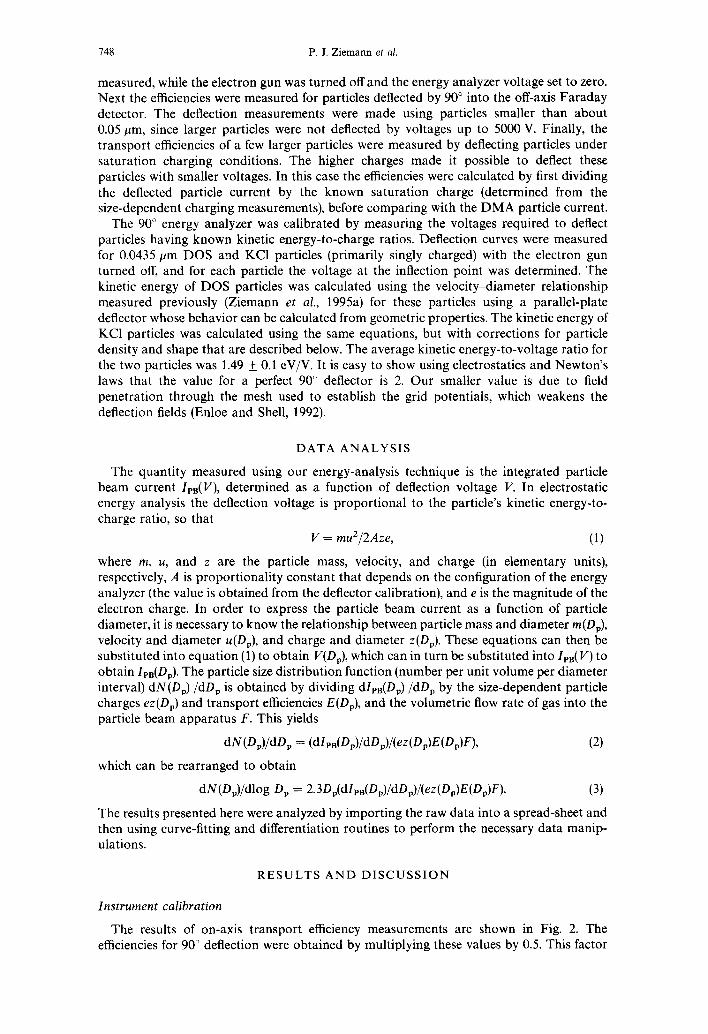
The results of on-axis transport efficiency measurements are shown in Fig. 2. The efficiencies for 90” deflection were obtained by multiplying these values by 0.5. This factor
Mass spectrometry of submicron particles 149
00 O 6 0.8 ,” 0
5 00 0
.-
$ 0.6 Lu
,”
E 3 0.4
S c
0.2 i
0 0 0 0 0
I
0.0 u-2 0.0 0.1 0.2 0.3 0.4 0.5 0.6 0.7 0.6
Particle Diameter (pm)
Fig. 2. Transport efficiencies of size-selected KC1 particles measured at the Faraday cup detector located on axis with the particle beam.
was determined from the measurements made on small or charge-saturated particles, all of which exhibited losses of approximately 50% upon deflection. The losses are probably due to divergence of the particle beam to widths larger than the diameter of the off-axis Faraday detector. Shortening the energy analyzer-to-detector distance reduced deflection losses, but also increased the noise so that the detection limit was above that attained at the longer distance (40 cm). The efficiencies shown in Fig. 2 are up to 20% lower than values obtained previously (Liu et al., 1995b) for DOS particles of the same size. The lower efficiencies result from broadening of the KC1 particle beam due to nonspherical particle shapes, and the smaller opening (6 mm) on the Faraday cup housing.
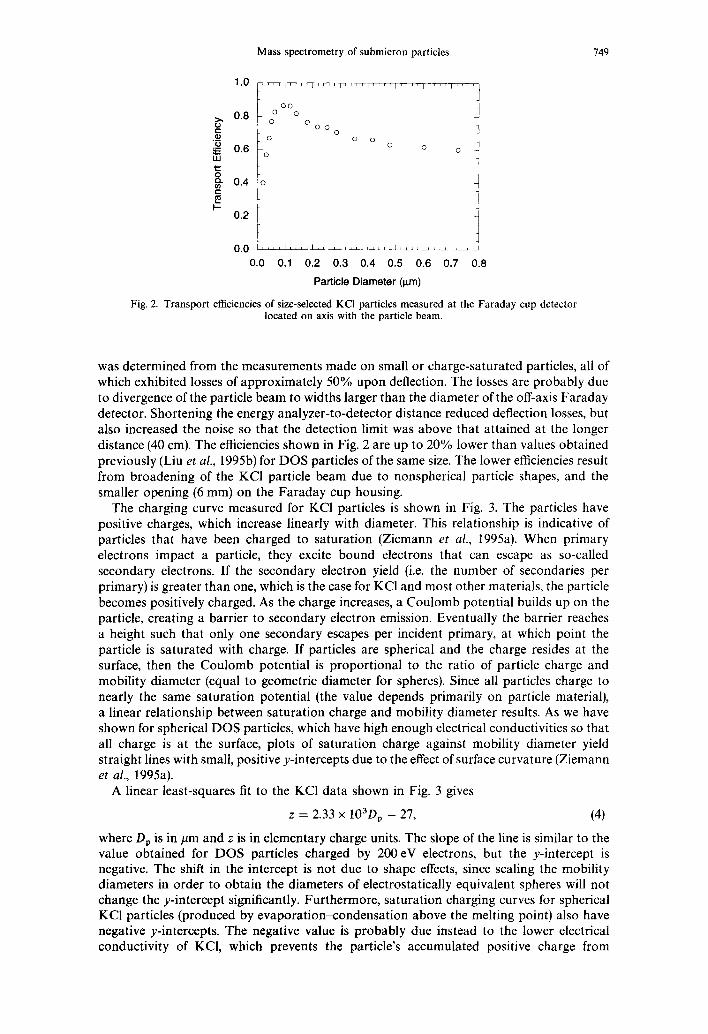
The charging curve measured for KC1 particles is shown in Fig. 3. The particles have positive charges, which increase linearly with diameter. This relationship is indicative of particles that have been charged to saturation (Ziemann et al., 1995a). When primary electrons impact a particle, they excite bound electrons that can escape as so-called secondary electrons. If the secondary electron yield (i.e. the number of secondaries per primary) is greater than one, which is the case for KC1 and most other materials, the particle becomes positively charged. As the charge increases, a Coulomb potential builds up on the particle, creating a barrier to secondary electron emission. Eventually the barrier reaches a height such that only one secondary escapes per incident primary, at which point the particle is saturated with charge. If particles are spherical and the charge resides at the surface, then the Coulomb potential is proportional to the ratio of particle charge and mobility diameter (equal to geometric diameter for spheres). Since all particles charge to nearly the same saturation potential (the value depends primarily on particle material), a linear relationship between saturation charge and mobility diameter results. As we have shown for spherical DOS particles, which have high enough electrical conductivities so that all charge is at the surface, plots of saturation charge against mobility diameter yield straight lines with small, positive y-intercepts due to the effect of surface curvature (Ziemann et al., 1995a).
A linear least-squares fit to the KC1 data shown in Fig. 3 gives
z = 2.33 x 10³D, - 27, (4)
where D, is in pm and z is in elementary charge units. The slope of the line is similar to the value obtained for DOS particles charged by 200 eV electrons, but the y-intercept is negative. The shift in the intercept is not due to shape effects, since scaling the mobility diameters in order to obtain the diameters of electrostatically equivalent spheres will not change the y-intercept significantly. Furthermore, saturation charging curves for spherical KC1 particles (produced by evaporationcondensation above the melting point) also have negative y-intercepts. The negative value is probably due instead to the lower electrical conductivity of KCl, which prevents the particle’s accumulated positive charge from
7.50 P. J. Ziemann et al
‘-vp_1-~r--rT-_rT17~7~
i
j
i
_ i
j
Electron Energy = 200 eV _: Electron Current - 5 mA
I -, 1 L-I L LL / LLL _i_.L __I
0.00 0.05 0.10 0.15 0.20 0.25 0.30
Particle Diameter (pm)
Fig. 3. Saturation charges measured for size-selected KC1 particles.
migrating to the surface. As a result, the charge remains distributed in a layer below the surface, increasing the Coulomb potential, and thereby decreasing the amount of charge the particle must have to reach the saturation potential. From the results of measurements made on bulk materials (Young, 1956,1957), we estimate that the depth of penetration of 200 eV electrons in KC1 is approximately 7 nm. If the positive charge is distributed in this layer, the particle will behave electrostatically as if its diameter has been reduced by a similar amount. The result should be a positive x-intercept (equivalent to a negative y-intercept) on the order of a few nanometers. The value from equation (4) is ‘V 12 nm. This effect will be discussed in detail in a future publication on electron impact charging of insulator particles.
The relationship between particle velocity and diameter was obtained using the results of measurements made previously on size-selected DOS particles (Ziemann et al., 1995a). It was shown then that for particles with diameters in the range 0.040.24 pm, the relationship between particle velocity u (m s- ‘) and diameter D, (pm) can be fit to the power law
U = a(pD,))b, (5)
where a = 88.6 m s-i , b = 0.304, and p = 0.915 g cme3 (the density of DOS). This equation is valid for the particle beam lens configuration and source pressure used in those experi- ments, which were also used here. The equation can be applied to our presumably cubic (based on the shapes of atomized NaCl particles (Lodge and Tufts, 1957; Matijevic et ul., 1963)) KC1 particles by using the density of KC1 and replacing D, with a quantity appropriate for a cubic particle. It can be shown using theory on aerosol dynamics and the particle shape corrections presented by Dahneke (1973ac) that in the free-molecule regime (the condition in our nozzle) a spherical particle with diameter S, has the same aerodynamic properties as a cube with side length S,. The appropriate velocity expression for KC1 particles is therefore obtained from equation (5) by replacing D, with KD,, yielding
U = a(pKDJb, (6)
where K is a shape factor equal to the ratio of the side length of a cubic particle to its mobility diameter D,. Note that this definition is not the same as that used to define the dynamic shape factor (Hinds, 1982). One can similarly show that K is between 0.724 and 0.746, which are the values for cubic particles in the free-molecular and continuum flow regimes, respectively. We assume an average value of 0.735 since the DMA operates in the transition regime. The equation relating mass and diameter for KC1 particles is then
m = pSz = p(KDJ3. (7)
Substituting equations (4), (6) and (7) (with equation (7) multiplied by lo-i5 so that the mass will be in kilograms when p is in gcmF3 and D, in pm), and a = 88.6 ms-‘, b = 0.304,
Mass spectrometry of submicron particles 751
p = 1.987gcmm3, K = 0.735, and A = 1.49 into equation (1) yields
F’= 1.03 x 1070,2.39/(2.33 x 1030, - 27), (8)
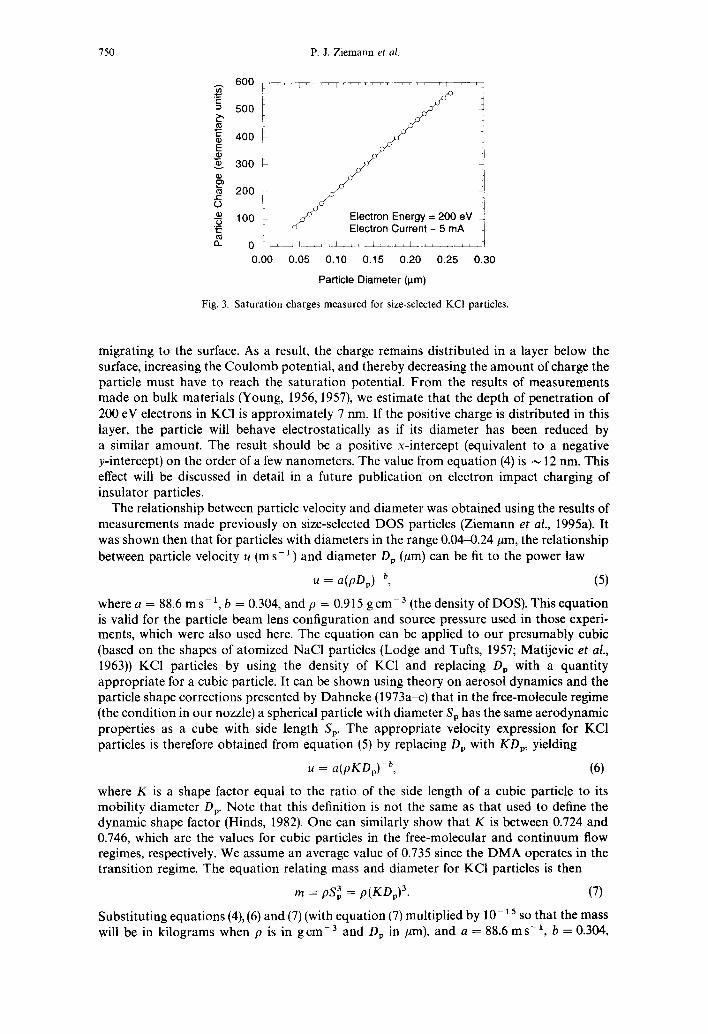
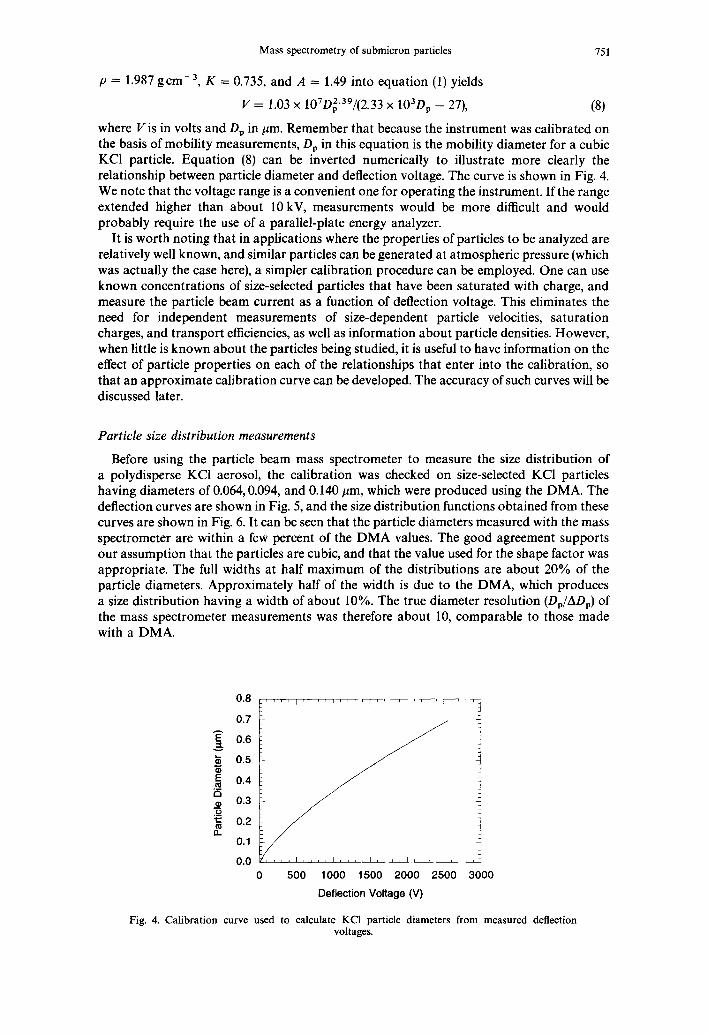
where V is in volts and D, in pm. Remember that because the instrument was calibrated on the basis of mobility measurements, D, in this equation is the mobility diameter for a cubic KC1 particle. Equation (8) can be inverted numerically to illustrate more clearly the relationship between particle diameter and deflection voltage. The curve is shown in Fig. 4. We note that the voltage range is a convenient one for operating the instrument. If the range extended higher than about 10 kV, measurements would be more difficult and would probably require the use of a parallel-plate energy analyzer.
It is worth noting that in applications where the properties of particles to be analyzed are relatively well known, and similar particles can be generated at atmospheric pressure (which was actually the case here), a simpler calibration procedure can be employed. One can use known concentrations of size-selected particles that have been saturated with charge, and measure the particle beam current as a function of deflection voltage. This eliminates the need for independent measurements of size-dependent particle velocities, saturation charges, and transport efficiencies, as well as information about particle densities. However, when little is known about the particles being studied, it is useful to have information on the effect of particle properties on each of the relationships that enter into the calibration, so that an approximate calibration curve can be developed. The accuracy of such curves will be discussed later.
Particle size distribution measurements
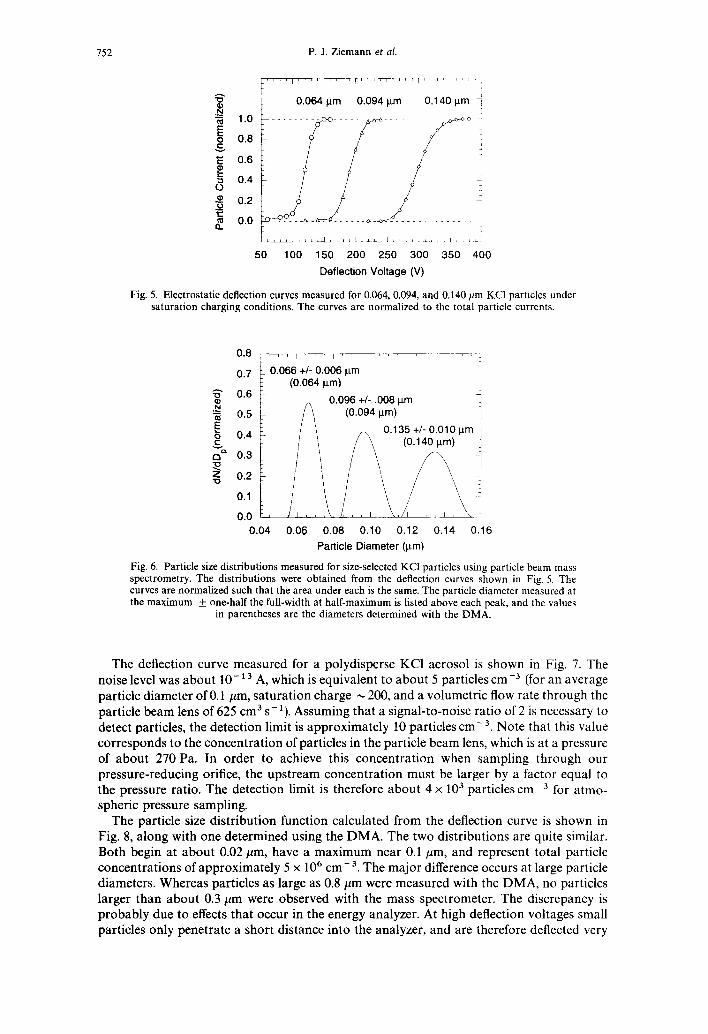
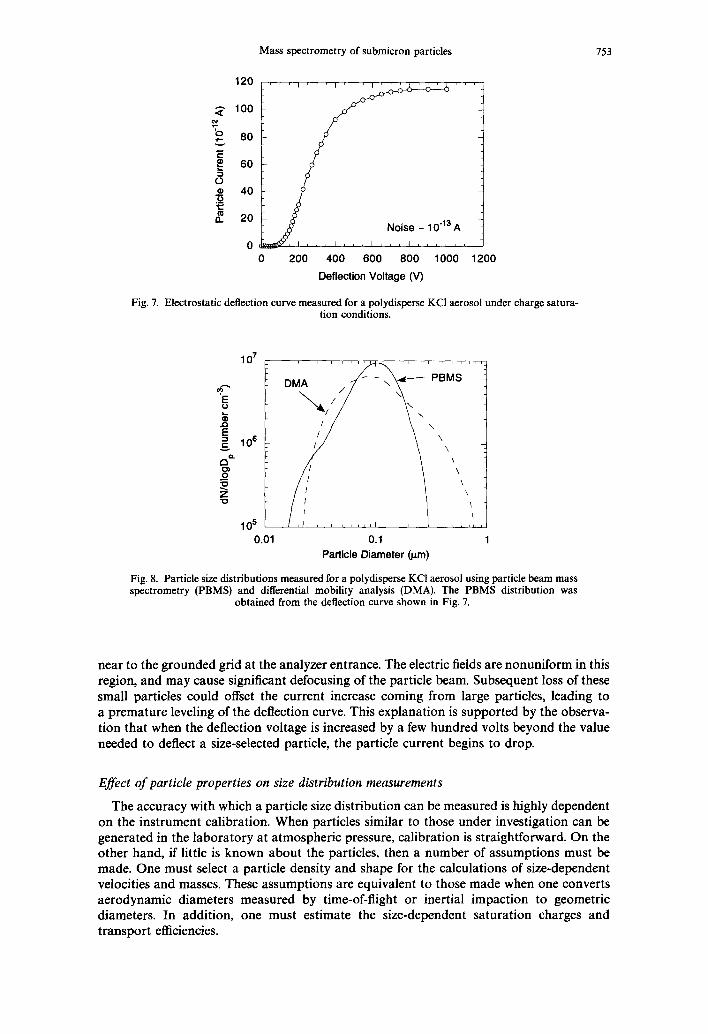
Before using the particle beam mass spectrometer to measure the size distribution of a polydisperse KC1 aerosol, the calibration was checked on size-selected KC1 particles having diameters of 0.064,0.094, and 0.140 ,um, which were produced using the DMA. The deflection curves are shown in Fig. 5, and the size distribution functions obtained from these curves are shown in Fig. 6. It can be seen that the particle diameters measured with the mass spectrometer are within a few percent of the DMA values. The good agreement supports our assumption that the particles are cubic, and that the value used for the shape factor was appropriate. The full widths at half maximum of the distributions are about 20% of the particle diameters. Approximately half of the width is due to the DMA, which produces a size distribution having a width of about 10%. The true diameter resolution @,/AD,) of the mass spectrometer measurements was therefore about 10, comparable to those made with a DMA.
0.7
$ 0.6
5 0.5
E” .s 0.4
: 0.3 P 5 0.2 a
0.1
500 1000 1500 2000 2500 3000
Deflection Voltage (V)
Fig. 4. Calibration curve used to calculate KC1 particle diameters from measured deflection voltages.
752 P. J. Ziemann et al
8
$ ‘- : 1.0
b 0.8 5 g 0.6
5 0.4 0 +j 0.2 ‘E a” 0.0
I-. .~ U. L ~1
50 100 150 200 250 300 350 400
Deflection Voltage (V)
Fig. 5. Electrostatic deflection curves measured for 0.064, 0.094, and 0.140 pm KC1 particles under saturation charging conditions. The curves are normalized to the total particle currents.
0.8 r--7-T--7T-, - i-m-..; o,7 I 0.066 +I- 0.006 pm ~_
(0.064 pm) g 0.6 L 2
0.096 +/- .008 km 0.5
0.04 0.06 0.08 0.10 0.12 0.14 0.16
Particle Diameter (pm)
Fig. 6. Particle size distributions measured for size-selected KC1 particles using particle beam mass spectrometry. The distributions were obtained from the deflection curves shown in Fig. 5. The curves are normalized such that the area under each is the same. The particle diameter measured at the maximum + one-half the full-width at half-maximum is listed above each peak, and the values
in parentheses are the diameters determined with the DMA.
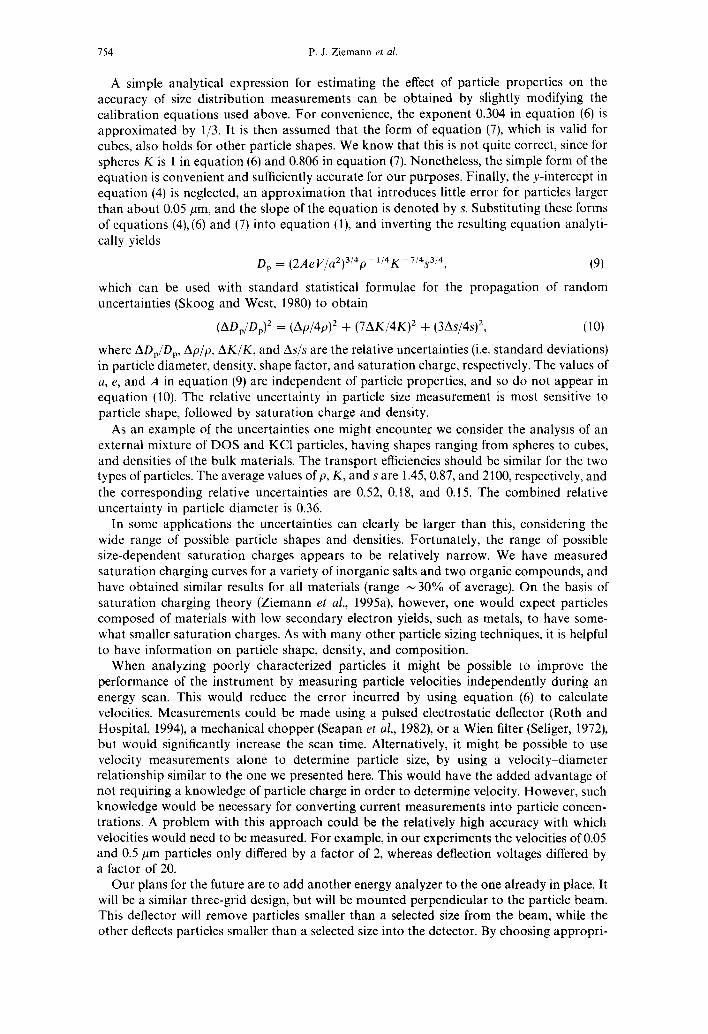
The deflection curve measured for a polydisperse KC1 aerosol is shown in Fig. 7. The noise level was about lo- ’ 3 A, which is equivalent to about 5 particles cmp3 (for an average particle diameter of 0.1 pm, saturation charge N 200, and a volumetric flow rate through the particle beam lens of 625 cm3 s- ‘). Assuming that a signal-to-noise ratio of 2 is necessary to detect particles, the detection limit is approximately 10 particles cme3. Note that this value corresponds to the concentration of particles in the particle beam lens, which is at a pressure of about 270 Pa. In order to achieve this concentration when sampling through our pressure-reducing orifice, the upstream concentration must be larger by a factor equal to the pressure ratio. The detection limit is therefore about 4 x lo3 particles cm-3 for atmo-
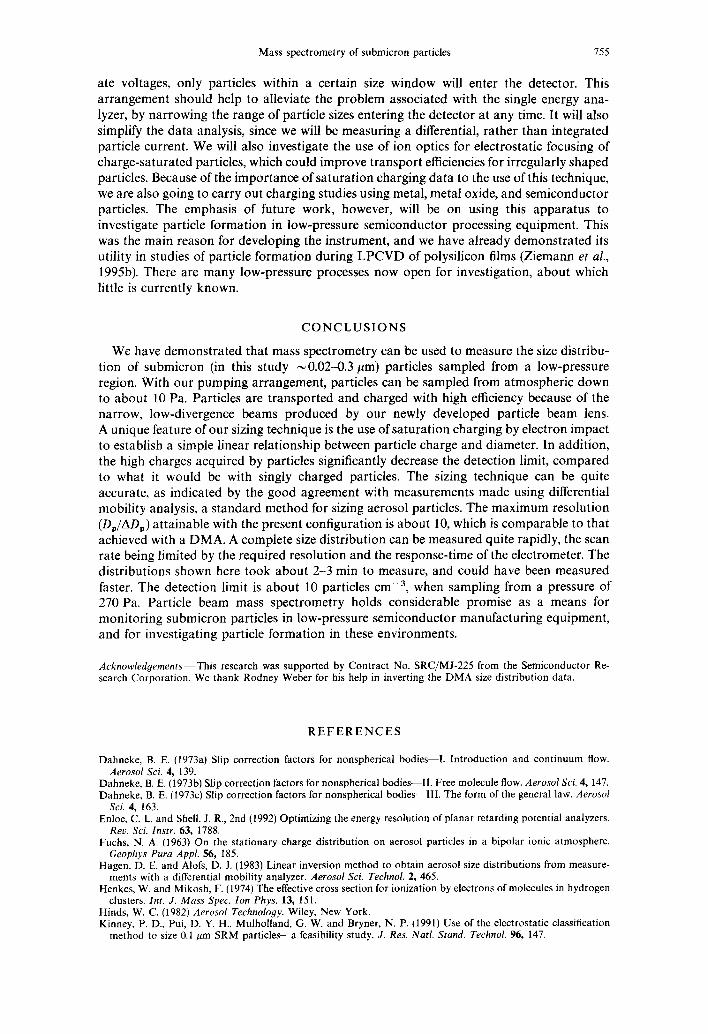
spheric pressure sampling. The particle size distribution function calculated from the deflection curve is shown in
Fig. 8, along with one determined using the DMA. The two distributions are quite similar. Both begin at about 0.02 pm, have a maximum near 0.1 pm, and represent total particle concentrations of approximately 5 x lo6 cm- 3. The major difference occurs at large particle diameters. Whereas particles as large as 0.8 pm were measured with the DMA, no particles larger than about 0.3 pm were observed with the mass spectrometer. The discrepancy is probably due to effects that occur in the energy analyzer. At high deflection voltages small particles only penetrate a short distance into the analyzer, and are therefore deflected very
Mass spectrometry of submicron particles 753
2 100
? 0 5 80
E p!
3
80
Q) H
40
5 a 20
0 0 200 400 800 800 1000 1200
Deflection Voltage (V)
Fig. 7. Electrostatic deflection curve measured for a polydisperse KC1 aerosol under charge satura- tion conditions.
0.01 0.1
Particle Diameter (pm)
1
Fig. 8. Particle size distributions measured for a polydisperse KC1 aerosol using particle beam mass spectrometry (PBMS) and differential mobility analysis (DMA). The PBMS distribution was
obtained from the deflection curve shown in Fig. 7.
near to the grounded grid at the analyzer entrance. The electric fields are nonuniform in this region, and may cause significant defocusing of the particle beam. Subsequent loss of these small particles could offset the current increase coming from large particles, leading to a premature leveling of the deflection curve. This explanation is supported by the observa- tion that when the deflection voltage is increased by a few hundred volts beyond the value needed to deflect a size-selected particle, the particle current begins to drop.
Eflect of particle properties on size distribution measurements
The accuracy with which a particle size distribution can be measured is highly dependent on the instrument calibration. When particles similar to those under investigation can be generated in the laboratory at atmospheric pressure, calibration is straightforward. On the other hand, if little is known about the particles, then a number of assumptions must be made. One must select a particle density and shape for the calculations of size-dependent velocities and masses. These assumptions are equivalent to those made when one converts aerodynamic diameters measured by time-of-flight or inertial impaction to geometric diameters. In addition, one must estimate the size-dependent saturation charges and transport efficiencies.
754 P. J. Ziemann et al
A simple analytical expression for estimating the effect of particle properties on the accuracy of size distribution measurements can be obtained by slightly modifying the calibration equations used above. For convenience, the exponent 0.304 in equation (6) is approximated by l/3. It is then assumed that the form of equation (7), which is valid for cubes, also holds for other particle shapes. We know that this is not quite correct, since for spheres K is 1 in equation (6) and 0.806 in equation (7). Nonetheless, the simple form of the equation is convenient and sufficiently accurate for our purposes. Finally, the y-intercept in equation (4) is neglected, an approximation that introduces little error for particles larger than about 0.05 pm, and the slope of the equation is denoted by s. Substituting these forms of equations (4),(6) and (7) into equation (1) and inverting the resulting equation analyti- cally yields
D, = (2~~ ~/~2)314~ - 1/4~ - 714~314, (9)
which can be used with standard statistical formulae for the propagation of random uncertainties (Skoog and West, 1980) to obtain
(AD,/DJ2 = (Ap/4~)~ + (7AK/4K)2 + (~As/~s)~, (10)
where AD,/D,, ApIp, AK/K, and As/s are the relative uncertainties (i.e. standard deviations) in particle diameter, density, shape factor, and saturation charge, respectively. The values of a, e, and A in equation (9) are independent of particle properties, and so do not appear in equation (10). The relative uncertainty in particle size measurement is most sensitive to particle shape, followed by saturation charge and density.
As an example of the uncertainties one might encounter we consider the analysis of an external mixture of DOS and KC1 particles, having shapes ranging from spheres to cubes, and densities of the bulk materials. The transport efficiencies should be similar for the two types of particles. The average values of p, K, and s are 1.45,0.87, and 2100, respectively, and the corresponding relative uncertainties are 0.52, 0.18, and 0.15. The combined relative uncertainty in particle diameter is 0.36.
In some applications the uncertainties can clearly be larger than this, considering the wide range of possible particle shapes and densities. Fortunately, the range of possible size-dependent saturation charges appears to be relatively narrow. We have measured saturation charging curves for a variety of inorganic salts and two organic compounds, and have obtained similar results for all materials (range -30% of average). On the basis of saturation charging theory (Ziemann et al., 1995a), however, one would expect particles composed of materials with low secondary electron yields, such as metals, to have some- what smaller saturation charges. As with many other particle sizing techniques, it is helpful to have information on particle shape, density, and composition.
When analyzing poorly characterized particles it might be possible to improve the performance of the instrument by measuring particle velocities independently during an energy scan. This would reduce the error incurred by using equation (6) to calculate velocities. Measurements could be made using a pulsed electrostatic deflector (Roth and Hospital, 1994), a mechanical chopper (Seapan et al., 1982) or a Wien filter (Seliger, 1972), but would significantly increase the scan time. Alternatively, it might be possible to use velocity measurements alone to determine particle size, by using a velocityydiameter relationship similar to the one we presented here. This would have the added advantage of not requiring a knowledge of particle charge in order to determine velocity. However, such knowledge would be necessary for converting current measurements into particle concen- trations. A problem with this approach could be the relatively high accuracy with which velocities would need to be measured. For example, in our experiments the velocities of 0.05 and 0.5 pm particles only differed by a factor of 2, whereas deflection voltages differed by a factor of 20.
Our plans for the future are to add another energy analyzer to the one already in place. It will be a similar three-grid design, but will be mounted perpendicular to the particle beam. This deflector will remove particles smaller than a selected size from the beam, while the other deflects particles smaller than a selected size into the detector. By choosing appropri-
Mass spectrometry of submicron particles 755
ate voltages, only particles within a certain size window will enter the detector. This arrangement should help to alleviate the problem associated with the single energy ana- lyzer, by narrowing the range of particle sizes entering the detector at any time. It will also simplify the data analysis, since we will be measuring a differential, rather than integrated particle current. We will also investigate the use of ion optics for electrostatic focusing of charge-saturated particles, which could improve transport efficiencies for irregularly shaped particles. Because of the importance of saturation charging data to the use of this technique, we are also going to carry out charging studies using metal, metal oxide, and semiconductor particles. The emphasis of future work, however, will be on using this apparatus to investigate particle formation in low-pressure semiconductor processing equipment. This was the main reason for developing the instrument, and we have already demonstrated its utility in studies of particle formation during LPCVD of polysilicon films (Ziemann et al., 199513). There are many low-pressure processes now open for investigation, about which little is currently known.
CONCLUSIONS
We have demonstrated that mass spectrometry can be used to measure the size distribu- tion of submicron (in this study - 0.0220.3 pm) particles sampled from a low-pressure region. With our pumping arrangement, particles can be sampled from atmospheric down to about 10 Pa. Particles are transported and charged with high efficiency because of the narrow, low-divergence beams produced by our newly developed particle beam lens. A unique feature of our sizing technique is the use of saturation charging by electron impact to establish a simple linear relationship between particle charge and diameter. In addition, the high charges acquired by particles significantly decrease the detection limit, compared to what it would be with singly charged particles. The sizing technique can be quite accurate, as indicated by the good agreement with measurements made using differential mobility analysis, a standard method for sizing aerosol particles. The maximum resolution (D,/AD,) attainable with the present configuration is about 10, which is comparable to that achieved with a DMA. A complete size distribution can be measured quite rapidly, the scan rate being limited by the required resolution and the response-time of the electrometer. The distributions shown here took about 2-3 min to measure, and could have been measured faster. The detection limit is about 10 particles cme3, when sampling from a pressure of 270 Pa. Particle beam mass spectrometry holds considerable promise as a means for monitoring submicron particles in low-pressure semiconductor manufacturing equipment, and for investigating particle formation in these environments.
Acknow\edgemenrs-This research was supported by Contract No. SRC/MJ-225 from the Semiconductor Re- search Corporation. We thank Rodney Weber for his help in inverting the DMA size distribution data.
REFERENCES
Dahneke. B. E. f1973a) Slio correction factors for nonsnherical bodies-I. Introduction and continuum flow. Aerosol Sci. 4,‘139. ’ L
Dahneke, B. E. (1973b) Slip correction factors for nonspherical bodies-Il. Free molecule flow. Aerosol Sci. 4, 147. Dahneke. B. E. (1973~) Slit, correction factors for nonspherical bodies-III. The form of the general law. Aerosol
.X.4,163. . Enloe, C. L. and Shell, J. R., 2nd (1992) Optimizing the energy resolution of planar retarding potential analyzers.
Reu. Sci. Instr. 63, 1788. Fuchs, N. A. (1963) On the stationary charge distribution on aerosol particles in a bipolar ionic atmosphere.
Geophys Pura Appl. 56, 185. Hagen, D. E. and Alofs, D. J. (1983) Linear inversion method to obtain aerosol size distributions from measure-
ments with a differential mobility analyzer. Aerosol Sci. Technol. 2, 465. Henkes, W. and Mikosh, F. (1974) The effective cross section for ionization by electrons of molecules in hydrogen
clusters. In?. J. Mass Spec. Ion Phys. 13, 1.51. Hinds, W. C. (1982) Aerosol Technology. Wiley, New York. Kinney, P. D., Pui, D. Y. H., Mulholland, G. W. and Bryner, N. P. (1991) Use of the electrostatic classification
method to size 0.1 pm SRM particles-a feasibility study. J. Rex Natl. Stand. Technol. 96, 147.
756 P. J. Ziemann et al.
Liu, B. Y. H. and Pui, D. Y. H. (1974) A submicron aerosol standard and the primary absolute calibration of the condensation nuclei counter. J. Colloid Interface Sci. 47, 155.
Liu, B. Y. H. and Pui, D. Y. H. (1975) Equilibrium bipolar charge distribution of aerosols. J. Colfoid Znterface Sci. 49, 305.
Liu, P., Ziemann, P. J., Kittelson, D. B. and McMurry, P. H. (1995a) Generating particle beams of controlled dimensions and divergence: I. Theory of particle motion in aerodynamic lenses and nozzle expansions. Aerosol Sci. Technol. (in press).
Liu, P., Ziemann, P. J., Kittelson, D. B. and McMurry, P. H. (1995b) Generating particle beams of controlled dimensions and divergence: II. Experimental evaluation of particle motion in aerodynamic lenses and nozzle expansions. Aerosol Sci. Technol. (in press).
Lodge, J. P. and Tufts, B. J. (1995) An electron microscope study of sodium chloride particles as used in aerosol generation. J. Colloid Sci. 10, 256.
Matijevic, E., Espenscheid, W. F. and Kerker, M. (1963) Aerosols consisting of spherical particles of sodium chloride. J. Colloid Sci. 18, 91.
McKeown, P. J., Johnston, M. V. and Murphy, D. M. (1991) On-line single-particle analysis by laser desorption mass spectrometry. Analyt. Chem. 63, 2069.
Roth, P. &d Hospiial, A. (1994) Design and test of a particle mass spectrometer (PMS). .I. Aerosol Sci. 25, 61. Seapan, M.. Selman, D.. Seale, F.. Siebcrs, G. and Wissler. E. H. (1982) Aerosol characterization usine molecular
&am techniques...!. bollois Interface Sci. 87, 154. . ’ Semiconductor Research Corporation Newsletter (1991) 9, 1. Seliger, R. L. (1972) E x B mass-separator design. J. appl. Phys. 43, 2352. Simpson, J. A. (1961) Design of retarding field energy analyzers. Rev. Sci. Instr. 32, 1283. Skoog, D. A. and West, D. M. (1980) Principles of Instrumental Analysis. Saunders College, Philadelphia. Young, J. R. (1956) Penetration of electrons and ions in aluminium. .I. appl. Phys. 27, 1. Young, J. R. (1957) Dissipation of energy by 2.5-10 keV electrons in Al,O,. J. appl. Phys. 28, 524. Ziemann, P. J., Liu, P., Kittelson, D. B. and McMurry, P. H. (1995a) Electron impact charging properties of
size-selected, submicrometer organic particles. _I. phys. Chem. (in press). Ziemann, P. J., Liu, P., Nijhawan, S., Campbell, S. A., Kittelson, D. B. and McMurry, P. H. (1995b) Particle beam
mass spectrometry of submicron particles formed during LPCVD of polysilicon films. Proc. 41st Annual Meeting of the Institute of Enoironmental Sciences, Anaheim, CA, April 3(rMay 5, 1995 (in press).