PART II - Wisconsin Department of Administration
228
21 GENERAL INFORMATION PART II GENERAL INFORMATION ABOUT THE STATE OF WISCONSIN Part II of the 2018 Annual Report provides general information about the State of Wisconsin (State). It describes the following: • Revenues • Expenditures • Accounting and Financial Reporting • Budgeting Process and Fiscal Controls • Budgetary Results of 2017-18 Fiscal Year • State Budget (including State Budget for 2017-19 Biennium) • General Fund Information • State Government Organization • State Obligations • Employee Pension Funds and Other Post-Employment Benefits • Statistical Information APPENDIX A to this Part II of the 2018 Annual Report includes the audited general purpose external financial statements for the fiscal year ending June 30, 2018 and the independent auditor’s report provided by the State Auditor. Requests for additional information about the State may be directed as follows: Contact: Capital Finance Office Attn: Capital Finance Director Phone: (608) 267-0374 Mail: State of Wisconsin Department of Administration 101 East Wilson Street, FLR 10 P.O. Box 7864 Madison, WI 53707-7864 E-mail: [email protected] Web site: doa.wi.gov/capitalfinance As a result of the State general election held on November 6, 2018, the Honorable Tony Evers is the Governor-Elect and his term begins on January 7, 2019. Mr. Evers defeated incumbent Governor Scott Walker in this State-wide election. In addition, the Honorable Josh Kaul is the Attorney General-Elect and his term also begins on January 7, 2019. Mr. Kaul defeated incumbent Attorney General Brad Schimel in the same State-wide election. The State independently provides monthly reports on general fund financial information. These reports are not required by any of the State’s undertakings provided to permit compliance with Rule 15c2-12 adopted by the Securities and Exchange Commission under the Securities Exchange Act of 1934. These reports are available on the State’s Capital Finance Office web site that is listed above and are filed as additional voluntary information with the Municipal Securities Rulemaking Board (MSRB) through its Electronic Municipal Market Access (EMMA) system. These reports are not incorporated by reference into this Part II of the 2018 Annual Report. This Part II of the 2018 Annual Report presents financial information about the State in various formats. Some financial information is presented on a budgetary basis or an agency-recorded basis, while other
-
Upload
khangminh22 -
Category
Documents
-
view
1 -
download
0
Transcript of PART II - Wisconsin Department of Administration

21 GENERAL INFORMATION
PART II
GENERAL INFORMATION ABOUT THE STATE OF WISCONSIN
Part II of the 2018 Annual Report provides general information about the State of Wisconsin (State). It
describes the following:
• Revenues
• Expenditures
• Accounting and Financial Reporting
• Budgeting Process and Fiscal Controls
• Budgetary Results of 2017-18 Fiscal Year
• State Budget (including State Budget for 2017-19 Biennium)
• General Fund Information
• State Government Organization
• State Obligations
• Employee Pension Funds and Other Post-Employment Benefits
• Statistical Information
APPENDIX A to this Part II of the 2018 Annual Report includes the audited general purpose external
financial statements for the fiscal year ending June 30, 2018 and the independent auditor’s report
provided by the State Auditor.
Requests for additional information about the State may be directed as follows:
Contact: Capital Finance Office
Attn: Capital Finance Director
Phone: (608) 267-0374
Mail: State of Wisconsin Department of Administration
101 East Wilson Street, FLR 10
P.O. Box 7864
Madison, WI 53707-7864
E-mail: [email protected] Web site: doa.wi.gov/capitalfinance
As a result of the State general election held on November 6, 2018, the Honorable Tony Evers is the
Governor-Elect and his term begins on January 7, 2019. Mr. Evers defeated incumbent Governor Scott
Walker in this State-wide election. In addition, the Honorable Josh Kaul is the Attorney General-Elect
and his term also begins on January 7, 2019. Mr. Kaul defeated incumbent Attorney General Brad
Schimel in the same State-wide election.
The State independently provides monthly reports on general fund financial information. These reports
are not required by any of the State’s undertakings provided to permit compliance with Rule 15c2-12
adopted by the Securities and Exchange Commission under the Securities Exchange Act of 1934. These
reports are available on the State’s Capital Finance Office web site that is listed above and are filed as
additional voluntary information with the Municipal Securities Rulemaking Board (MSRB) through its
Electronic Municipal Market Access (EMMA) system. These reports are not incorporated by reference
into this Part II of the 2018 Annual Report.
This Part II of the 2018 Annual Report presents financial information about the State in various formats.
Some financial information is presented on a budgetary basis or an agency-recorded basis, while other

22 GENERAL INFORMATION
information is presented on a cash basis. Some financial information relates to the General Fund only,
while other information relates to other funds. The reader should be aware of these different formats
when reviewing the financial information presented in the 2018 Annual Report.
The 2018 Annual Report includes information and defined terms for different types of securities issued
by the State. The context or meaning of a term used in one part of the 2018 Annual Report may differ
from that of the same term used in another part, and the total amount shown in a table may vary from the
related sum due to rounding. No information or resource referred to in the 2018 Annual Report is part of
the report unless expressly incorporated by reference.
Certain statements in this Part II of the 2018 Annual Report may be forward-looking statements that are
based on expectations, estimates, projections, or assumptions. Any forward-looking statements are made
as of the date of the 2018 Annual Report, and the State undertakes no obligation to update such
statements to reflect subsequent events or circumstances. Actual results could differ materially from the
anticipated results.
REVENUES
Revenue Structure
The State raises revenues from diverse sources:
• Various taxes levied by the State
• Federal Government payments
• Various kinds of fees, licenses, permits, and service charges paid by users of specific services,
privileges, or facilities
• Investment income
• Gifts, donations, and contributions
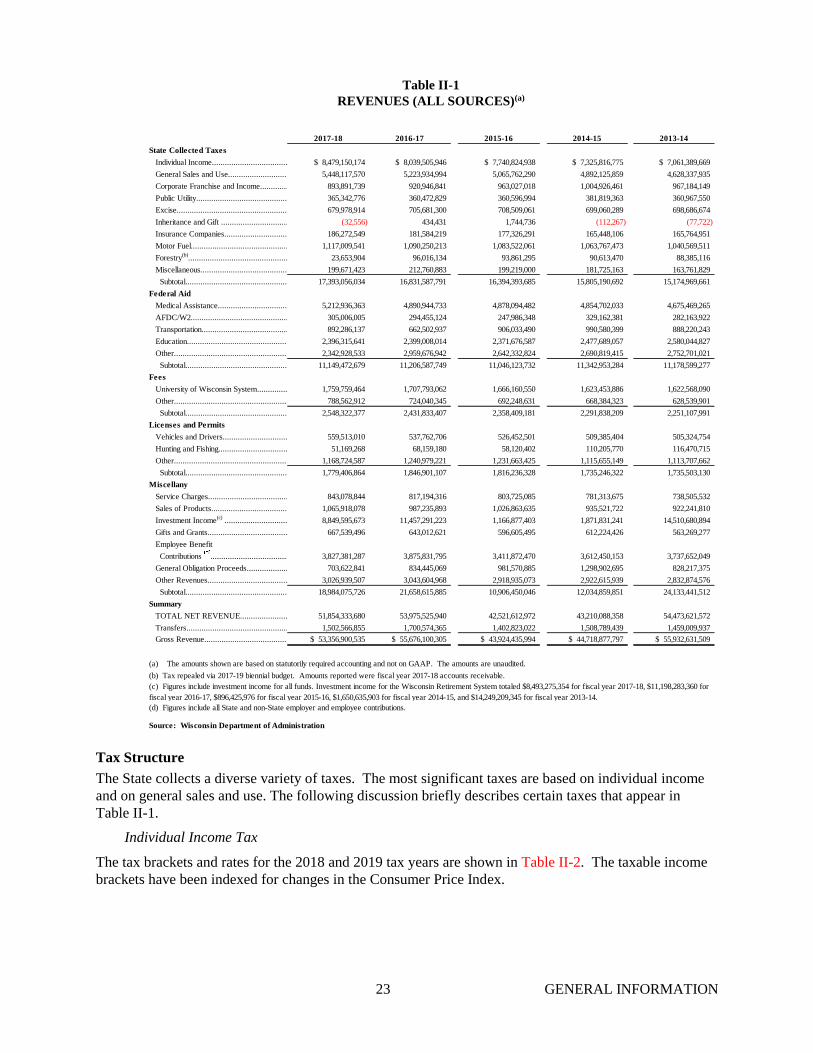
Table II-1 identifies the specific sources of revenue (all funds) and the amounts raised from each source
for each of the last five fiscal years. Future receipts may differ from historical data.
23 GENERAL INFORMATION
Table II-1
REVENUES (ALL SOURCES)(a)
2017-18 2016-17 2015-16 2014-15 2013-14
State Collected Taxes
Individual Income.................................... $ 8,479,150,174 $ 8,039,505,946 $ 7,740,824,938 $ 7,325,816,775 $ 7,061,389,669
General Sales and Use................................. 5,448,117,570 5,223,934,994 5,065,762,290 4,892,125,859 4,628,337,935
Corporate Franchise and Income............... 893,891,739 920,946,841 963,027,018 1,004,926,461 967,184,149
Public Utility................................................ 365,342,776 360,472,829 360,596,994 381,819,363 360,967,550
Excise................................................................... 679,978,914 705,681,300 708,509,061 699,060,289 698,686,674
Inheritance and Gift ............................................. (32,556) 434,431 1,744,736 (112,267) (77,722)
Insurance Companies...................................... 186,272,549 181,584,219 177,326,291 165,448,106 165,764,951
Motor Fuel......................................................... 1,117,009,541 1,090,250,213 1,083,522,061 1,063,767,473 1,040,569,511
Forestry(b)
................................................................. 23,653,904 96,016,134 93,861,295 90,613,470 88,385,116
Miscellaneous.................................................... 199,671,423 212,760,883 199,219,000 181,725,163 163,761,829
Subtotal...............................................................17,393,056,034 16,831,587,791 16,394,393,685 15,805,190,692 15,174,969,661
Federal Aid
Medical Assistance.............................................. 5,212,936,363 4,890,944,733 4,878,094,482 4,854,702,033 4,675,469,265
AFDC/W2....................................................................305,006,005 294,455,124 247,986,348 329,162,381 282,163,922
Transportation....................................................... 892,286,137 662,502,937 906,033,490 990,580,399 888,220,243
Education................................................................2,396,315,641 2,399,008,014 2,371,676,587 2,477,689,057 2,580,044,827
Other.................................................................... 2,342,928,533 2,959,676,942 2,642,332,824 2,690,819,415 2,752,701,021
Subtotal....................................................................11,149,472,679 11,206,587,749 11,046,123,732 11,342,953,284 11,178,599,277
Fees
University of Wisconsin System..................... 1,759,759,464 1,707,793,062 1,666,160,550 1,623,453,886 1,622,568,090
Other............................................................ 788,562,912 724,040,345 692,248,631 668,384,323 628,539,901
Subtotal........................................................... 2,548,322,377 2,431,833,407 2,358,409,181 2,291,838,209 2,251,107,991
Licenses and Permits
Vehicles and Drivers........................................... 559,513,010 537,762,706 526,452,501 509,385,404 505,324,754
Hunting and Fishing......................................... 51,169,268 68,159,180 58,120,402 110,205,770 116,470,715
Other................................................................. 1,168,724,587 1,240,979,221 1,231,663,425 1,115,655,149 1,113,707,662
Subtotal...............................................................1,779,406,864 1,846,901,107 1,816,236,328 1,735,246,322 1,735,503,130
Miscellany
Service Charges................................................. 843,078,844 817,194,316 803,725,085 781,313,675 738,505,532
Sales of Products............................................... 1,065,918,078 987,235,893 1,026,863,635 935,521,722 922,241,810
Investment Income(c) ..............................................8,849,595,673 11,457,291,223 1,166,877,403 1,871,831,241 14,510,680,894
Gifts and Grants....................................................... 667,539,496 643,012,621 596,605,495 612,224,426 563,269,277
Employee Benefit
Contributions ................................................ 3,827,381,287 3,875,831,795 3,411,872,470 3,612,450,153 3,737,652,049
General Obligation Proceeds......................... 703,622,841 834,445,069 981,570,885 1,298,902,695 828,217,375
Other Revenues.................................................. 3,026,939,507 3,043,604,968 2,918,935,073 2,922,615,939 2,832,874,576
Subtotal........................................................ 18,984,075,726 21,658,615,885 10,906,450,046 12,034,859,851 24,133,441,512
Summary
TOTAL NET REVENUE............................... 51,854,333,680 53,975,525,940 42,521,612,972 43,210,088,358 54,473,621,572
Transfers........................................................ 1,502,566,855 1,700,574,365 1,402,823,022 1,508,789,439 1,459,009,937
Gross Revenue..................................................$ 53,356,900,535 $ 55,676,100,305 $ 43,924,435,994 $ 44,718,877,797 $ 55,932,631,509
(a) The amounts shown are based on statutorily required accounting and not on GAAP. The amounts are unaudited.
(b) Tax repealed via 2017-19 biennial budget. Amounts reported were fiscal year 2017-18 accounts receivable.
Source: Wisconsin Department of Administration
(d) Figures include all State and non-State employer and employee contributions.
(c) Figures include investment income for all funds. Investment income for the Wisconsin Retirement System totaled $8,493,275,354 for fiscal year 2017-18, $11,198,283,360 for
fiscal year 2016-17, $896,425,976 for fiscal year 2015-16, $1,650,635,903 for fiscal year 2014-15, and $14,249,209,345 for fiscal year 2013-14.
Tax Structure
The State collects a diverse variety of taxes. The most significant taxes are based on individual income
and on general sales and use. The following discussion briefly describes certain taxes that appear in
Table II-1.
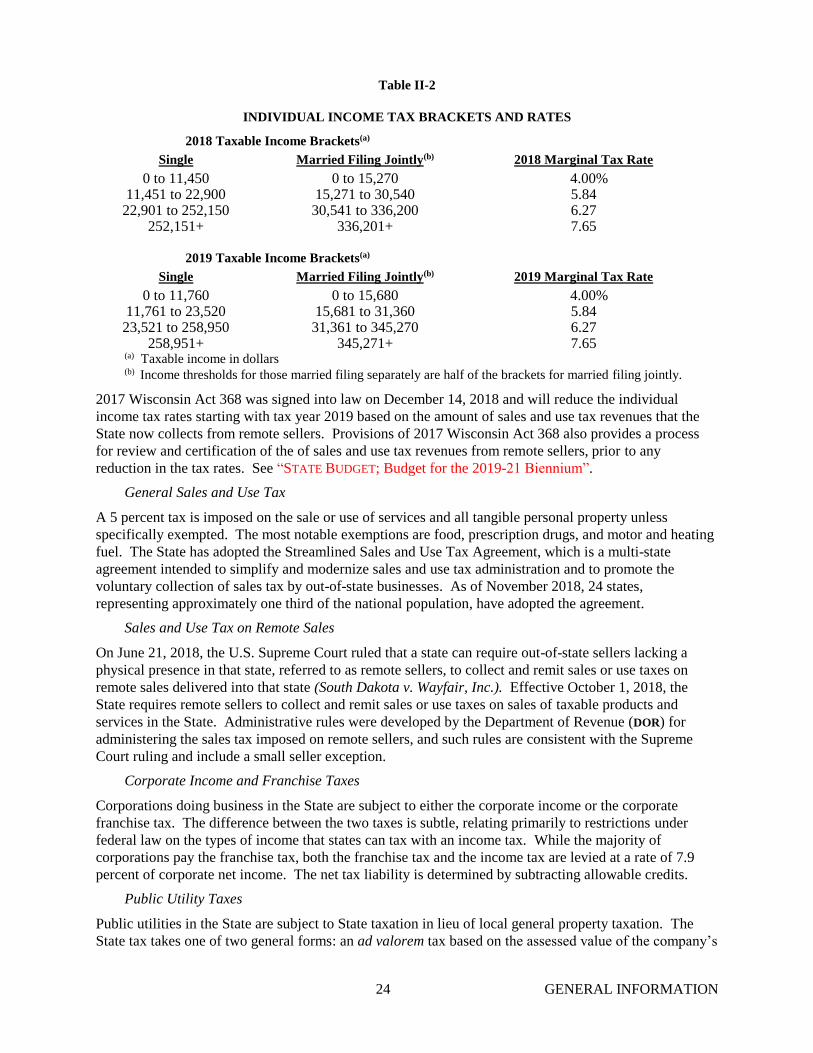
Individual Income Tax
The tax brackets and rates for the 2018 and 2019 tax years are shown in Table II-2. The taxable income
brackets have been indexed for changes in the Consumer Price Index.
(dl
24 GENERAL INFORMATION
Table II-2
INDIVIDUAL INCOME TAX BRACKETS AND RATES
2018 Taxable Income Brackets(a)
Single Married Filing Jointly(b) 2018 Marginal Tax Rate
0 to 11,450 0 to 15,270 4.00% 11,451 to 22,900 15,271 to 30,540 5.84 22,901 to 252,150 30,541 to 336,200 6.27
252,151+ 336,201+ 7.65
2019 Taxable Income Brackets(a)
Single Married Filing Jointly(b) 2019 Marginal Tax Rate
0 to 11,760 0 to 15,680 4.00% 11,761 to 23,520 15,681 to 31,360 5.84 23,521 to 258,950 31,361 to 345,270 6.27
258,951+ 345,271+ 7.65 (a) Taxable income in dollars(b) Income thresholds for those married filing separately are half of the brackets for married filing jointly.
2017 Wisconsin Act 368 was signed into law on December 14, 2018 and will reduce the individual
income tax rates starting with tax year 2019 based on the amount of sales and use tax revenues that the
State now collects from remote sellers. Provisions of 2017 Wisconsin Act 368 also provides a process
for review and certification of the of sales and use tax revenues from remote sellers, prior to any
reduction in the tax rates. See “STATE BUDGET; Budget for the 2019-21 Biennium”.
General Sales and Use Tax
A 5 percent tax is imposed on the sale or use of services and all tangible personal property unless
specifically exempted. The most notable exemptions are food, prescription drugs, and motor and heating
fuel. The State has adopted the Streamlined Sales and Use Tax Agreement, which is a multi-state
agreement intended to simplify and modernize sales and use tax administration and to promote the
voluntary collection of sales tax by out-of-state businesses. As of November 2018, 24 states,
representing approximately one third of the national population, have adopted the agreement.
Sales and Use Tax on Remote Sales
On June 21, 2018, the U.S. Supreme Court ruled that a state can require out-of-state sellers lacking a
physical presence in that state, referred to as remote sellers, to collect and remit sales or use taxes on
remote sales delivered into that state (South Dakota v. Wayfair, Inc.). Effective October 1, 2018, the
State requires remote sellers to collect and remit sales or use taxes on sales of taxable products and
services in the State. Administrative rules were developed by the Department of Revenue (DOR) for
administering the sales tax imposed on remote sellers, and such rules are consistent with the Supreme
Court ruling and include a small seller exception.
Corporate Income and Franchise Taxes
Corporations doing business in the State are subject to either the corporate income or the corporate
franchise tax. The difference between the two taxes is subtle, relating primarily to restrictions under
federal law on the types of income that states can tax with an income tax. While the majority of
corporations pay the franchise tax, both the franchise tax and the income tax are levied at a rate of 7.9
percent of corporate net income. The net tax liability is determined by subtracting allowable credits.
Public Utility Taxes
Public utilities in the State are subject to State taxation in lieu of local general property taxation. The
State tax takes one of two general forms: an ad valorem tax based on the assessed value of the company’s

25 GENERAL INFORMATION
property within the State, or a tax or license fee based on the gross revenues or receipts of the company
generated in the State.
Companies subject to the ad valorem tax include air carrier companies, conservation and regulation
companies, municipal electric associations, pipeline companies, railroad companies, and telephone
companies. A tax assessment is calculated by determining the full market value of the company’s taxable
property and multiplying that value by a tax rate. In general, the tax assessment equals the statewide
average net property tax rate multiplied by the value of the taxable property. For telephone companies,
however, the property values are determined within each local taxing jurisdiction. The value within each
taxing jurisdiction is multiplied by the net tax rate applied in that jurisdiction. This procedure causes the
value of intangible property to be excluded from the calculated amount.
Companies subject to the tax or license fee based on gross revenues or receipts include car line
companies, electric cooperatives, and municipal and private light, heat, and power companies. Car line
companies (which are companies engaged in the business of furnishing or leasing car line equipment to a
railroad) are taxed on all receipts allocated to the State at a tax rate equal to the average statewide net
property tax rate. For electric cooperatives, certain revenues are excluded, and deductions may be
allowed. The taxable gross revenues are taxed at a flat rate of 3.19 percent, except that the tax rate on
wholesale sales of electricity is reduced to 1.59 percent. For light, heat, and power companies, certain
revenues are excluded, and deductions may be allowed. Taxable gross revenues from the sale of gas
services are subject to tax at the rate of 0.97 percent, and wholesale sales of electricity are taxed at the
rate of 1.59 percent. The tax rate on all other revenues is 3.19 percent.
Excise Taxes on Tobacco and Alcohol
Cigarettes are taxed at the rate of $2.52 cents per pack of 20, moist snuff is taxed at the rate of 100
percent of the manufacturer’s list price, and other tobacco products are taxed at the rate of 71 percent of
the manufacturer’s list price, while the tax on cigars is the lesser of 71 percent of the manufacturer’s list
price or $0.50 per cigar. The cigarette and tobacco products taxes are collected from distributors and
subjobbers.
Wine is taxed at $0.25 or $0.45 per gallon (or $0.066 or $0.119 per liter), depending on its alcohol
content. Liquor is taxed at $3.25 per gallon (or $0.859 per liter). The wine and liquor tax is collected
from wholesalers. Beer is taxed at the rate of $2 per barrel, and the tax is paid monthly by brewers.
Estate, Inheritance, and Gift Taxes
For deaths occurring after September 30, 2002 and before January 1, 2008, the State imposed an estate
tax in an amount equal to the credit allowed for state inheritance or estate taxes under federal law in
effect on December 31, 2000. For deaths occurring on or after January 1, 2008, State estate taxes were
based on the federal credit computed under federal law in effect on the date of death, which, based on
federal law in effect since January 1, 2008, resulted in the current elimination of State estate taxes for
deaths occurring on or after January 1, 2008.
Congress has taken action to extend certain tax laws and to reinstate a modified federal estate tax to
allow for a deduction for state estate taxes. Under current State law, this action resulted in the continued
elimination of State estate taxes for deaths occurring on or after January 1, 2008. 2013 Wisconsin Act 20
eliminated the State’s estate tax for deaths occurring after December 31, 2012. Prior statutes would take
effect again if federal law is modified to provide a credit for state estate taxes.
Insurance Company Premium Tax
Wisconsin-based life insurance companies pay a tax of 2 percent of the premiums received less a credit
equal to 50 percent of personal property taxes. Small companies may choose to pay 2.5 percent of all
income except premiums less the personal property tax credit. Nondomestic life insurance companies pay
the 2 percent rate with no personal property tax credit.

26 GENERAL INFORMATION
Domestic and nondomestic property and casualty insurance companies are taxed 2 percent on allocated
fire insurance premiums received. The 2 percent tax levied on fire insurance premiums is redistributed to
local governments as a “fire department dues” tax. Nondomestic casualty insurance companies are taxed
an additional 2.375 percent on allocated fire insurance premiums received, 2 percent on all forms of
casualty premiums, and 0.5 percent on ocean marine coverages.
Domestic mortgage guaranty insurance companies pay a tax of 2 percent of premiums received.
Nondomestic companies are also subject to retaliation and reciprocation. If a nondomestic company’s
state of domicile assesses a Wisconsin domestic company, in aggregate, a greater amount than these
rates, then the State retaliates. If a nondomestic company’s state of domicile assesses a Wisconsin
domestic company, in aggregate, a lesser amount than these rates, then the State reciprocates, subject to
minimums of the 2 percent “fire department dues,” 0.375 percent for ocean marine and allocated fire
insurance premiums, 0 percent for all forms of casualty premiums, and 2 percent for life premiums.
Motor Vehicle Fuel Tax
Motor vehicle fuel is taxed at the rate of 30.9 cents per gallon. The tax is collected from the wholesaler
but is specifically passed through to the user. The revenues are deposited in the Transportation Fund,
where they are used primarily for highway purposes.
Forestry Tax
The forestry tax was the only State tax upon general property. It was a levy on all taxable property in the
State. The tax rate for the 2016-17 fiscal year was $0.1697 per $1,000 in property value. The tax was
collected by municipal treasurers and remitted to the State during property tax settlements. After its
receipt in the General Fund, it was transferred to the segregated Conservation Fund. The 2017-19
biennial budget (2017 Wisconsin Act 59) repealed this tax beginning with the 2017-18 fiscal year and
replaced it with a general fund transfer to the Conservation Fund equal to what would have been raised
under the prior law tax.
Miscellaneous Taxes
The State collects other miscellaneous taxes and fees, the largest of which is the real estate transfer fee.
This fee is assessed at the time of a sale or transfer of real estate (subject to certain exceptions) and at the
rate of $0.30 per $100 value.
Tax Credits
Complementing the State’s tax structure are tax credits designed to relieve certain taxes. These credits
are reflected as expenditures for budgeting purposes. A brief description of the principal tax credits
follows.
Manufacturing and Agriculture Tax Credit
The manufacturing and agriculture tax credit provides tax relief to manufacturers and farmers. For
individual income tax filers, the credit is equal to 7.5 percent of a claimant’s qualified production
activities income (QPAI) derived from property assessed as manufacturing or agricultural property in the
State. For corporate tax filers, the credit is 7.5 percent of the claimant’s QPAI, apportioned income, or
income taxable under combined reporting provisions. The credit was originally set at a 1.875 percent
rate in tax year 2013 and phased in to its current 7.5 percent rate beginning with tax year 2016. The
credit is nonrefundable, but unused credit amounts may be carried forward and used in future years.
According to recent estimates by the Department of Revenue, the credit reduces annual State income tax
revenues by approximately $320 million annually.
Homestead Tax Credit
Property tax relief is provided to low-income homeowners and renters through a homestead tax credit.
The maximum household income limit is $24,680. The maximum amount of aidable property taxes is
$1,460, and the amount of farm acreage on which the property tax is based is 120 acres. For renters, the

27 GENERAL INFORMATION
portion of rent allocated as property tax is 25 percent, or 20 percent if heat is included in rent. In the
2017-18 fiscal year, low-income homeowners and renters received nearly $84 million in homestead tax
credit relief.
Earned Income Tax Credit
The earned income tax credit provides financial assistance to lower-income workers. The tax credit
supplements the wages and self-employment income of such families. It offsets the impact of the social
security tax and increases the incentive to work. As of November 2018, the State was one of 29 states
and the District of Columbia that offered an earned income tax credit. Twenty-four of those programs,
including the State’s, offered a refundable earned income tax credit.
The State’s earned income tax credit is calculated as a percentage of the federal tax credit, which varies
by income and family size. The State’s tax credit varies the percentage of the federal tax credit by the
number of children: 4 percent of the federal tax credit for one child, 11 percent for two, and 34 percent
for three or more. The maximum State tax credit in tax year 2018 is $138 for one child, $629 for two
children, and $2,187 for three or more children. In the 2017-18 fiscal year, low-income wage earners
received $97 million in earned income tax credits.
Farmland Preservation Tax Credit
The farmland preservation program provides property tax relief to farmland owners and encourages local
governments to develop farmland preservation policies. The tax credit reduces income tax liability or is
rebated if the credit exceeds income tax due. The credit is based on the number of qualifying acres, as
well as certain other factors. Expenditures under the program were approximately $17 million in fiscal
year 2017-18.
School Levy Tax Credit
The school levy tax credit is distributed based on each municipality’s share of statewide levies for school
purposes and is provided to all classes of property taxpayers (residential, commercial, industrial, and
others). For property taxes levied in December 2017, $940 million of school levy tax credits was
distributed statewide. The first dollar credit, which offsets the school district property taxes paid on the
first $6,800 on an improved parcel, provided an additional $149 million of property tax relief for
property taxes levied in December 2017. These tax credits offset approximately 9.9 percent of all levies
or 22.0 percent when measured against school levies only. The tax credits are paid to counties or
municipalities to reduce the amount due from all property taxpayers.
Lottery Property Tax Credit.
The net proceeds of the state lottery are reserved for property tax relief. The lottery property tax credit is
paid to counties or municipalities to reduce the amount due from local taxpayers. The lottery property
tax credit is paid only for property taxes on primary residences. For the 2017-18 tax year, the total
lottery property tax credit was approximately $172 million.
School Property Tax Credit
The school property tax credit is a nonrefundable credit to reduce individual income net tax liability, and
is equal to 12 percent of the first $2,500 in property taxes, or rent relating to allocable property taxes, for
a maximum credit of $300. In the 2017-18 fiscal year, the school property tax credit totaled
approximately $423 million.
Electronics and Information Technology Zone Tax Credit.
The statute that authorized creation of an electronics and information technology zone in southeast
Wisconsin also provides for refundable tax credits for a business or businesses located in the zone. In
November 2017, the State entered into a contract with a firm to provide up to $2.85 billion in tax credits
to that firm to support the development of a manufacturing campus in Racine County. The amount of
28 GENERAL INFORMATION
refundable tax credits to be provided to this firm depends on verified levels of capital investment and job
creation. Payments under this tax credit will likely not begin until the 2019-20 fiscal year.
Tax Collection Procedure (Delinquencies)
If a taxpayer does not file a valid return when required, DOR may estimate the amount of tax due and
send the taxpayer an assessment of the amount owing. The taxpayer has 60 days to appeal the amount
owed, and absent an appeal, the account is considered delinquent on the due date. A delinquency also
occurs when a taxpayer fails to properly pay taxes on a filed return or under-computes the tax due. The
taxpayer is billed for the shortfall, and in the case where taxes are not properly paid, there is no appeal
process. An assessment can also result from office or field audits. A taxpayer has 60 days to appeal an
audit adjustment.
DOR uses a computer system to record payment and collection information for income, franchise, sales,
and use taxes. Revenue agents around the State can access the case records for delinquent accounts.
Collection of a delinquent account begins with a notice of overdue tax, which is sent to the taxpayer. This
notice informs the taxpayer that failure to pay may result in a warrant being filed in the county of
residence and that other involuntary collection actions may be taken. The account is assigned to a
revenue agent, who may contact the taxpayer to attempt to solicit payment in full or to set up an
installment payment plan. Records of all collection contacts and actions are maintained in the statewide
computer system.
If voluntary payments cannot be arranged, the revenue agent may proceed to a variety of involuntary
collection actions, such as attachment of wages, levy, or garnishment of assets. Depending on the
circumstances of the account, DOR may move directly to an involuntary collection action after the notice
of overdue tax is sent. If the amount owed is greater than $5,000, the account will be posted on a DOR
web site that identifies delinquent taxpayers. If the delinquent taxpayer has a refund coming from any tax
program administered by DOR, the refund is applied to the delinquent balance. Federal tax refunds are
also applied to the delinquent balance.
Other actions that may be recommended to resolve a delinquent account include:
• Revocation of a business seller’s permit
• Withholding a business’s liquor license
• Denial of a State-issued occupational license
• Referral to a private collection agency
If the revenue agent cannot collect the delinquent taxes, and it is unknown whether the taxpayer has any
assets that may be garnished, then a supplemental hearing may be called before the court commissioner
in the taxpayer’s county of residence, in order to determine the taxpayer’s ability to pay. If assets are
discovered, DOR may request appointment of a receiver to sell the assets. If the taxpayer is without any
assets, the proceedings may be stayed and the account periodically reviewed until either the taxpayer has
assets to pay or a determination is made to write off the account.
An analysis of the overall delinquency rate for the income, franchise, gift, and sales and use taxes is
shown in Table II-30 under “STATISTICAL INFORMATION”.
EXPENDITURES
General
State expenditures are categorized under eight functional categories and the general obligation bond
program. They are subcategorized by three distinct types of expenditures. The eight functional
categories, which are listed in Table II-3, are described later in this Part II of the 2018 Annual Report.
See “STATE GOVERNMENT ORGANIZATION; Description of Services Provided by State Government”.
The three types of expenditures are described below.
29 GENERAL INFORMATION
• State Operations. Direct payments by State agencies to carry out State programs for expenses
such as salaries, supplies, services, debt service, and permanent property, including the
University of Wisconsin System.
• Aids to Individuals and Organizations. Payments from a State fund made directly to, or on behalf
of, an individual or private organization (for example, Medicaid, parent choice and charter
school programs, or student financial assistance).
• Local Assistance. Payments from a State fund to, or on behalf of, local units of government and
school districts, including payments associated with State programs administered by local
governments and school districts (for example, elementary and secondary school aids, shared
revenues, and school levy and first dollar tax credits).
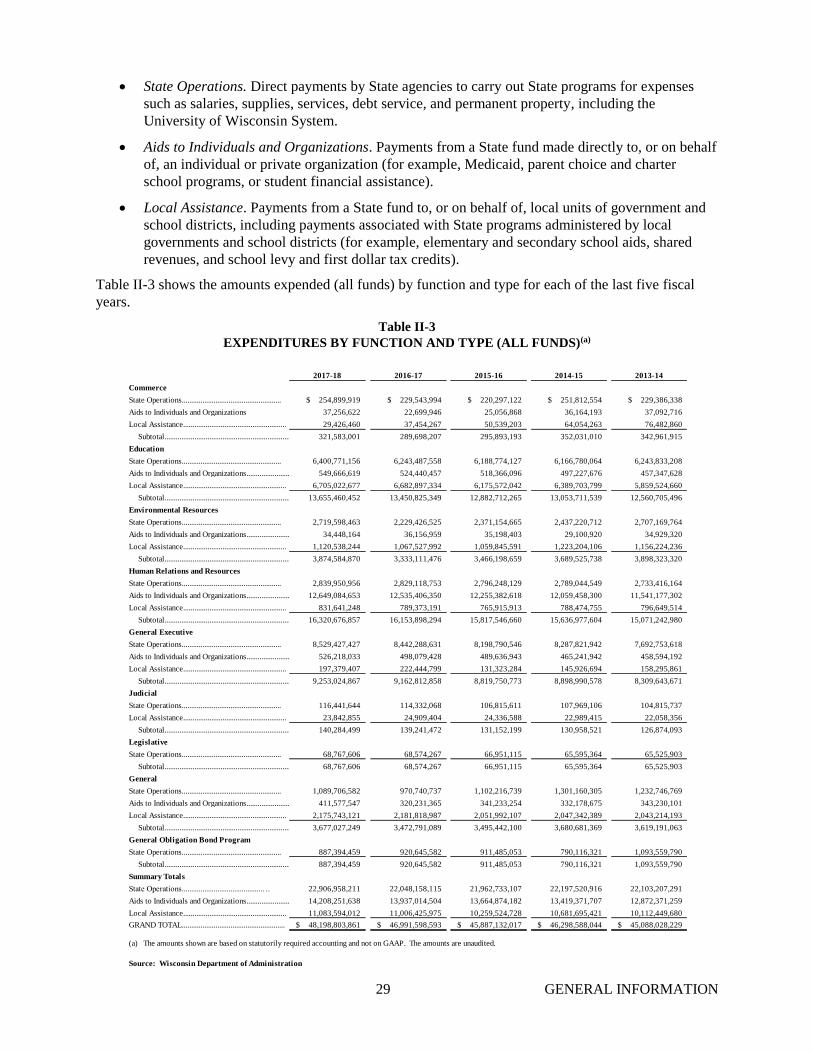
Table II-3 shows the amounts expended (all funds) by function and type for each of the last five fiscal
years.
Table II-3
EXPENDITURES BY FUNCTION AND TYPE (ALL FUNDS)(a)
2017-18 2016-17 2015-16 2014-15 2013-14
Commerce
State Operations..................................................... $ 254,899,919 $ 229,543,994 $ 220,297,122 $ 251,812,554 $ 229,386,338
Aids to Individuals and Organizations 37,256,622 22,699,946 25,056,868 36,164,193 37,092,716
Local Assistance....................................................... 29,426,460 37,454,267 50,539,203 64,054,263 76,482,860
Subtotal...................................................................... 321,583,001 289,698,207 295,893,193 352,031,010 342,961,915
Education
State Operations..................................................... 6,400,771,156 6,243,487,558 6,188,774,127 6,166,780,064 6,243,833,208
Aids to Individuals and Organizations........................ 549,666,619 524,440,457 518,366,096 497,227,676 457,347,628
Local Assistance....................................................... 6,705,022,677 6,682,897,334 6,175,572,042 6,389,703,799 5,859,524,660
Subtotal...................................................................... 13,655,460,452 13,450,825,349 12,882,712,265 13,053,711,539 12,560,705,496
Environmental Resources
State Operations..................................................... 2,719,598,463 2,229,426,525 2,371,154,665 2,437,220,712 2,707,169,764
Aids to Individuals and Organizations........................ 34,448,164 36,156,959 35,198,403 29,100,920 34,929,320
Local Assistance....................................................... 1,120,538,244 1,067,527,992 1,059,845,591 1,223,204,106 1,156,224,236
Subtotal...................................................................... 3,874,584,870 3,333,111,476 3,466,198,659 3,689,525,738 3,898,323,320
Human Relations and Resources
State Operations..................................................... 2,839,950,956 2,829,118,753 2,796,248,129 2,789,044,549 2,733,416,164
Aids to Individuals and Organizations........................ 12,649,084,653 12,535,406,350 12,255,382,618 12,059,458,300 11,541,177,302
Local Assistance....................................................... 831,641,248 789,373,191 765,915,913 788,474,755 796,649,514
Subtotal...................................................................... 16,320,676,857 16,153,898,294 15,817,546,660 15,636,977,604 15,071,242,980
General Executive
State Operations..................................................... 8,529,427,427 8,442,288,631 8,198,790,546 8,287,821,942 7,692,753,618
Aids to Individuals and Organizations........................ 526,218,033 498,079,428 489,636,943 465,241,942 458,594,192
Local Assistance....................................................... 197,379,407 222,444,799 131,323,284 145,926,694 158,295,861
Subtotal...................................................................... 9,253,024,867 9,162,812,858 8,819,750,773 8,898,990,578 8,309,643,671
Judicial
State Operations..................................................... 116,441,644 114,332,068 106,815,611 107,969,106 104,815,737
Local Assistance....................................................... 23,842,855 24,909,404 24,336,588 22,989,415 22,058,356
Subtotal...................................................................... 140,284,499 139,241,472 131,152,199 130,958,521 126,874,093
Legislative
State Operations..................................................... 68,767,606 68,574,267 66,951,115 65,595,364 65,525,903
Subtotal...................................................................... 68,767,606 68,574,267 66,951,115 65,595,364 65,525,903
General
State Operations..................................................... 1,089,706,582 970,740,737 1,102,216,739 1,301,160,305 1,232,746,769
Aids to Individuals and Organizations........................ 411,577,547 320,231,365 341,233,254 332,178,675 343,230,101
Local Assistance....................................................... 2,175,743,121 2,181,818,987 2,051,992,107 2,047,342,389 2,043,214,193
Subtotal...................................................................... 3,677,027,249 3,472,791,089 3,495,442,100 3,680,681,369 3,619,191,063
General Obligation Bond Program
State Operations..................................................... 887,394,459 920,645,582 911,485,053 790,116,321 1,093,559,790
Subtotal...................................................................... 887,394,459 920,645,582 911,485,053 790,116,321 1,093,559,790
Summary Totals
State Operations...........................................… 22,906,958,211 22,048,158,115 21,962,733,107 22,197,520,916 22,103,207,291
Aids to Individuals and Organizations........................ 14,208,251,638 13,937,014,504 13,664,874,182 13,419,371,707 12,872,371,259
Local Assistance....................................................... 11,083,594,012 11,006,425,975 10,259,524,728 10,681,695,421 10,112,449,680
GRAND TOTAL....................................................... $ 48,198,803,861 $ 46,991,598,593 $ 45,887,132,017 $ 46,298,588,044 $ 45,088,028,229
(a) The amounts shown are based on statutorily required accounting and not on GAAP. The amounts are unaudited.
Source: Wisconsin Department of Administration
30 GENERAL INFORMATION
General Fund Expenditures
In the 2017-18 fiscal year, approximately 51% of all general-fund taxes collected by the State were
returned to local units of government. The remaining funds were used for aids to individuals and
organizations (26%) and State operations and programs (23%), which included the University of
Wisconsin System. For the 2017-19 biennium, these percentages were expected to be approximately
51% returned to local units of government, 25% for aids to individuals and organizations, and 24% for
State operations and programs, which includes the University of Wisconsin System.
ACCOUNTING AND FINANCIAL REPORTING
Statutory Basis
The State accounts for, reports, and budgets its operations as set forth in the Wisconsin Statutes. The
Annual Fiscal Report (which is unaudited) must be published each year on or before October 15th.
Except as noted in the following paragraph, under statutory accounting, receipts are recorded only at the
time money or checks are deposited in the State Treasury, and disbursements are recorded only at the
time a check is drawn. As a result, actions and circumstances, including discretionary decisions by
certain governmental officials, can affect the timing of payments and deposits and therefore the amounts
reported in a fiscal year.
For budgeting and Wisconsin Constitutional compliance purposes, the State’s records are maintained in
conformity with statutory requirements. The more important legal provisions are:
• In all cases the date of the contract or order determines the fiscal year in which it is charged
unless it is determined that the purpose of the contract or order is to prevent lapsing of
appropriations or to otherwise circumvent budgeting intent.
• The current year records must remain open until July 31st to permit departments to certify
for payment of bills applicable to the year ended June 30th and to deposit revenues
applicable to such year, with the following exceptions: (1) amounts withheld for income
taxes prior to July 1st and (2) taxes imposed on sales prior to July 1st are deemed to be
accrued tax receipts as of the close of the fiscal year, provided such revenue is deposited on
or before August 15th.
• On July 31st all outstanding encumbrances entered for the previous year must be transferred
to the new fiscal year, and an equivalent prior year appropriation balance must also be
forwarded to the new fiscal year.
• Revenues and expenditures are reported on a net basis. Overcollections refunded are
deducted from revenues and current year overpayments made are deducted from
expenditures.
• General Fund investments are carried at the lower of cost or par with discounts, premiums,
and earnings recorded on an accrual basis.
• Encumbrances are treated as expenditures in the year of initiation.
Generally Accepted Accounting Principles
The State also accounts for and reports on its operations using generally accepted accounting principles
(GAAP). For the fiscal year ended June 30, 2018 the State has prepared a Comprehensive Annual
Financial Report (CAFR) in accordance with GAAP. The General Purpose External Financial Statements
section of the CAFR for the fiscal year ended June 30, 2018 has been audited and is included as APPENDIX
A to this Part II of the 2018 Annual Report.
Financial statements prepared in accordance with GAAP differ from those prepared in accordance with the
Wisconsin Statutes. A notable difference pertains to the General Fund balance. Using the CAFR and
audited general purpose external financial statements for the fiscal year ended June 30, 2018, as an
example, the undesignated, unreserved balance for the fiscal year ended June 30, 2018, was $589 million
on a budgetary basis. However, under GAAP, the total fund balance of the General Fund for the fiscal

31 GENERAL INFORMATION
year ended June 30, 2018 was a deficit of $1.254 billion. The difference results primarily because GAAP
recognizes accrued liabilities that are not taken into account under the statutory basis. The single largest
accrued liability for the fiscal year ended June 30, 2018 was $884 million and related to the State’s
individual income tax accruals.
Enterprise Resource Planning System
Effective October 1, 2015, the State implemented a statewide initiative to consolidate information
technology systems with an integrated software system that included applications for finance,
procurement, budget, and reporting. Effective December 14, 2015, applications of this new enterprise
resource planning system were implemented for human resources and payroll. The State Department of
Transportation commenced use of this system on July 1, 2016.
BUDGETING PROCESS AND FISCAL CONTROLS
Appropriations are made through the enactment of the State budget. Most of the budget process derives
from statutory laws or custom and practice, and thus the process is subject to change.
The State budget is the legislative document that sets the amount of authorized State expenditures for the
two fiscal years in a biennium and the corresponding amount of revenues (primarily taxes) projected to
be available to pay those expenditures. A biennium begins on July 1st of each odd-numbered year and
ends on June 30th of the subsequent odd-numbered year. The requirement for a State budget is linked
directly to the Wisconsin Constitution, which provides that “No money shall be paid out of the treasury
except in pursuance of an appropriation by law.” The Wisconsin Constitution requires a balanced
budget. It also requires that, if final budgetary expenses of any fiscal year exceed available revenues,
then the Legislature must take actions to pay the deficiency in the succeeding fiscal year.
Budget Requests from Agencies
The formal budget process begins when the State Budget Office in the State of Wisconsin Department of
Administration (DOA or Department of Administration) issues instructions to State agencies for
submission of their budget requests for the next biennium. Larger agencies actually begin their internal
processes for development of their budget requests several months prior to the issuance of these
instructions.
Pursuant to the Wisconsin Statutes, agency budget requests are to be submitted no later than September
15th of each even-numbered year. Agencies are also required to submit copies of their budget requests to
the Legislative Fiscal Bureau (LFB) at the same time that copies are delivered to the State Budget Office.
Executive Budget
Pursuant to the Wisconsin Statutes, the Secretary of Administration is required to provide to the
Governor or Governor-Elect and to each member of the next Legislature, by November 20th of each even-
numbered year, a compilation of the total amount of each agency’s biennial budget request. The
Wisconsin Statutes also require that DOR compile and provide, by November 20th of each even-numbered
year, information on the actual and estimated revenues for the current and forthcoming biennium. These
revenue estimates are used by the Governor as the basis for budget recommendations about General Fund
biennial budget spending. The State Budget Director (who is an appointee of the Secretary of
Administration) is involved in the review of agency requests and the development of the Governor’s
budget recommendations for appropriations. In addition to proposing a biennial budget, the Governor’s
budget recommendations also include any statutory language changes needed to accomplish the policy
initiatives and program or appropriation changes that are part of the Governor’s recommendations. A
draft bill is prepared by the Legislative Reference Bureau incorporating the Governor’s fiscal and
statutory recommendations.
The Governor is required to deliver the biennial budget message and executive budget bill or bills to the
Legislature on or before the last Tuesday in January of the odd-numbered year. However, upon request
of the Governor, a later submission date may be allowed by the Legislature upon passage of a joint

32 GENERAL INFORMATION
resolution. It is common for the Governor to request a later submission date; a later submission date was
requested, and allowed, for each of the last ten executive budget bills.
The Wisconsin Statues provide that immediately after delivery of the Governor’s budget message, the
executive budget bill or bills must be introduced by the Legislature’s Joint Committee on Finance (JCF),
without change, into one of the two houses of the Legislature. Upon introduction, the bill or bills must
be referred to that committee for review. Because of both the complexity of the budget and its
significance, committee review of the budget bill is the most extensive and involved review given to any
bill in a legislative session.
Legislative Consideration
LFB usually provides initial overview briefings on the budget for the JCF. The committee holds public
hearings on the proposed budget, including both hearings at which agencies present informational
briefings and hearings to allow public comment. Other legislative committees may hold meetings, at the
discretion of the committee chairperson, to inform committee members of particular aspects of the
budget that may affect the substantive interests of the committee.
Upon conclusion of the public hearings, the JCF commences executive sessions of the Governor’s
recommended budget. The committee invariably adopts a budget that contains numerous changes to the
Governor’s recommendations. The form of the committee’s budget is usually a substitute amendment to
the Governor’s budget bill rather than being a separately identified new bill.
The two houses of the Legislature rarely pass identical versions of the budget in their first consideration.
There are alternative methods available for achieving resolution of the differences between the two
houses on bills. A common method is for one house to seek a committee of conference on the bill
wherein a specified number of members from each house are delegated to meet as a bargaining
committee with the goal of producing a report reconciling the differences. Another method that has been
used from time to time has been to successively pass, between the houses, narrowing amendments
dealing only with the points of difference between the respective budgets as initially recommended by
the two houses.
While the Wisconsin Statutes require that summary information be compiled by DOR on the actual and
estimated revenues for the current and forthcoming biennia and that this summary information be
available on November 20th of each even-numbered year, LFB may use its discretion to provide updated
revenue estimates at any time for the current and forthcoming biennia.
Governor’s Partial Veto Power
The Wisconsin Constitution grants the Governor the power of partial veto for any appropriation bill.
This means that rather than having to approve or reject the budget bill in its entirety, the Governor may
selectively delete portions of the budget bill. Both language and dollar amounts in a budget bill may be
eliminated by the Governor’s veto, and dollar amounts may be reduced. The Wisconsin Constitution
prohibits the Governor from using the partial veto to create a new sentence by combining parts of two or
more sentences.
The budget bill (less any items deleted or reduced by the Governor’s partial veto) then becomes the
State’s fiscal policy document for the next two years. Just as it may do with a Governor’s veto of a bill
in its entirety, the Legislature may, by a two-thirds vote by each house, override a partial veto and enact
the vetoed portion into law. This action may be taken before or after the budget becomes effective.
Continuing Authority
The failure of the Legislature to adopt a new budget before the commencement of a biennium does not
result in a lack of spending authority. Under Wisconsin law an existing appropriation continues in effect
until it is amended or repealed. Thus, in the event that a budget is not in effect at the start of a fiscal
year, the prior year’s budget serves as the budget until such time as a new budget is enacted. Once a

33 GENERAL INFORMATION
newly enacted budget becomes effective, the continuing authority is superseded by the newly enacted
appropriations.
The continuing authority of existing appropriations until a new budget is adopted helps to protect against
the effect of a delay in the adoption of a budget. The 2017-19 biennial budget of the State was enacted on
September 21, 2017, which was 82 days after the start of the biennium. Of the ten prior biennial budgets,
the 2013-15, 2011-13 and 2009-11 biennial budgets were each enacted prior to the start of their
respective biennia; however the 2015-17 biennial budget and each of the six biennial budgets prior to the
2009-11 were enacted after the start of their respective biennia, with the latest date after the start of a
biennium being October 27, 1999 (for the 1999-2001 biennium), which was nearly four months after the
start of the 1999-2000 fiscal year (the first fiscal year of that biennium).
General Fund Tax Increase
Wisconsin Statutes require that neither house of the Legislature may pass a bill that increases certain
General Fund taxes (income, state sales, or franchise taxes) unless the bill is approved by two-thirds of
those members present and voting. There is an exception if the Legislature passes a joint resolution
requiring a statewide advisory referendum on the question of whether the Legislature should authorize
the tax increase, and a majority of voters voting at the referendum approve the tax increase.
Fiscal Controls
No money shall be paid out of the State Treasury except as appropriated by law. The Wisconsin Statutes
require that the Secretary of Administration and the State Treasurer must approve all payments. The
Secretary of Administration is also responsible for audit of expenditures prior to disbursement. The
Legislative Audit Bureau has post-expenditure audit responsibility.
The Department of Administration maintains separate accounts for all appropriations, showing the
amounts appropriated, the amounts allotted, the amounts encumbered, the amounts expended, and certain
other data necessary for the financial management and control of all State accounts. The Department of
Administration also maintains the general ledgers of the General Fund and all other funds of the State.
State law prohibits the enactment of legislation that would cause the estimated General Fund balance to
be less than a specified amount or percentage of the general purpose revenue appropriations for that
fiscal year. The specified amount for the 2016-17 fiscal year was $65 million. State law currently
requires that beginning with the 2017-18 fiscal year, the statutorily-required reserve will be an amount
equal to the lesser of the prior fiscal year’s required balance plus $5 million, or 2 percent of the general
purpose revenue appropriations for that fiscal year. The specified amount, or percentage of general
purpose revenue appropriations, is included in Wisconsin Statutes, and can be changed (and has
previously been changed) by legislative action.
The budget can move out of balance if estimated revenues are less than anticipated in the budget or if
expenditures for open-ended appropriations are greater than anticipated. The Wisconsin Statutes provide
that, following the enactment of the budget, if the Secretary of Administration determines that budgeted
expenditures will exceed revenues by more than one-half of one percent of general purpose revenues
(consisting of general taxes, miscellaneous receipts, and revenues collected by State agencies which lose
their identity and are available for appropriation by the Legislature), then no approval of expenditure
estimates can occur. Further, the Secretary of Administration must notify the Governor and the
Legislature, and the Governor must submit a bill correcting the imbalance. If the Legislature is not in
session, then the Governor must call a special session to take up the matter.
The Secretary of Administration also has statutory power to order reductions in the appropriations of
State agencies. The Secretary of Administration may also temporarily reallocate free balances of certain
funds to other funds that have insufficient balances and, further, may prorate or defer certain payments in
the event current or projected balances are insufficient to meet current obligations. See “GENERAL FUND
INFORMATION; General Fund Cash Flow.” The Department of Administration may also request, upon
34 GENERAL INFORMATION
making certain determinations and receiving approval of the JCF, the issuance of operating notes by the
State of Wisconsin Building Commission (Commission).
Budget Stabilization Fund
Statutory provisions require, for each fiscal year, the transfer of 50 percent of general purpose revenues
received over the original budget estimate to the State’s Budget Stabilization Fund (which is a “rainy day
fund”), provided that the statutory required General Fund balance for that fiscal year is maintained. As
of June 30, 2018, the balance in the Budget Stabilization Fund was approximately $322 million.
The transfers to the Budget Stabilization Fund, which only occur when general purpose revenues exceed
the original budget estimates, are required to continue until the balance in the Budget Stabilization Fund
is at least equal to 5 percent of the estimated expenditures from the General Fund, which would be
approximately $831 million based on estimated General Fund expenditures for the 2017-18 fiscal year.
2017 Wisconsin Act 368 was signed into law on December 14, 2018 and includes a provisions that would
exclude for the 2018-19 fiscal year certain revenues from the determination of any transfer to the Budget
Stabilization Fund. These excluded revenues would be the additional revenues received in that fiscal
year attributable to an increase in sales and use tax revenues resulting from the collection of such taxes
on remote sellers. The statutory provisions requiring transfers from the General Fund to the Budget
Stabilization Fund were suspended for the 2013-14 and 2014-15 fiscal years.
BUDGETARY RESULTS OF 2017-18 FISCAL YEAR
Pursuant to Wisconsin Statutes, the Annual Fiscal Report (budgetary basis) for the fiscal year ending
June 30, 2018 was published October 15, 2018.
The Annual Fiscal Report provides that the State ended the 2017-18 fiscal year on a statutory and
unaudited basis with an undesignated balance of $589 million. This amount is $34 million more than the
projected gross ending balance for the fiscal year included in the budget for the 2017-19 biennium (2017
Wisconsin Act 59), $64 million less than the projected gross ending balance included in the LFB report
dated January 17, 2018 (January 2018 LFB Report), and $41 million more than the projected gross
ending balance that was included in the summary provided in the LFB paper dated June 14, 2018 (June
2018 LFB Paper). The State did not issue any operating notes during the 2017-18 fiscal year.
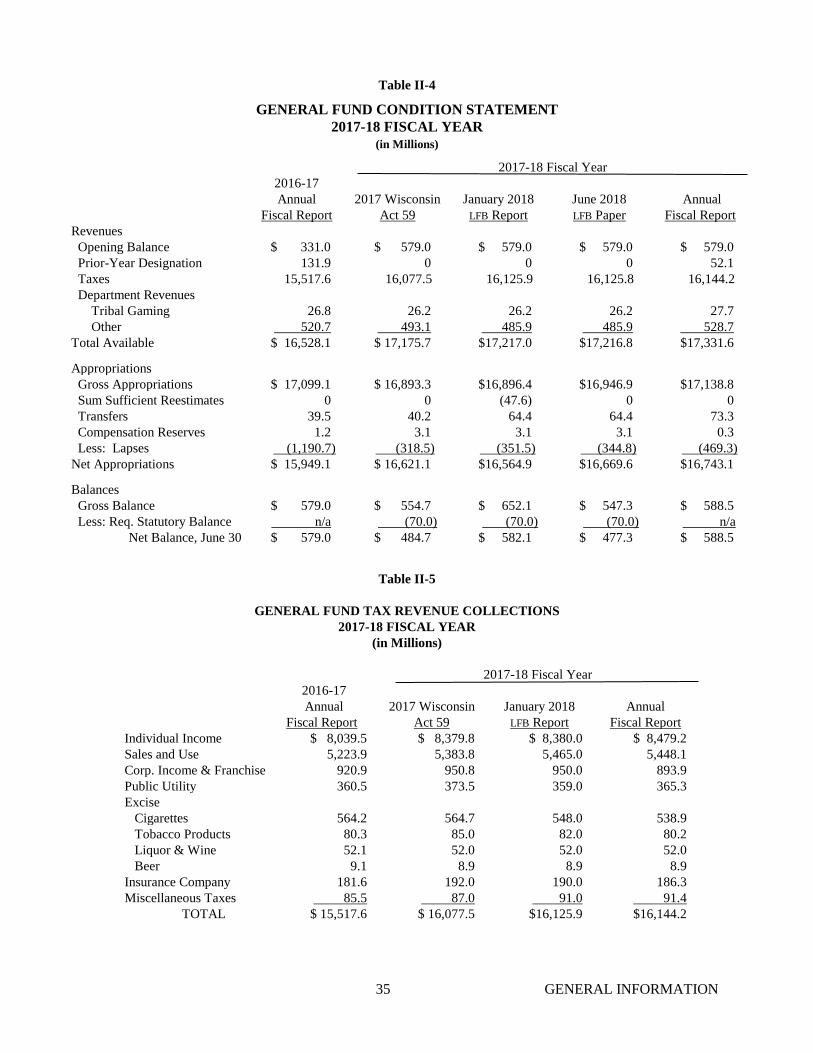
Table II-4 shows the General Fund condition statement for the 2017-18 fiscal year. The table also
includes, for comparison, the General Fund condition statement for the 2016-17 fiscal year, the estimated
General Fund condition statement included in 2017 Wisconsin Act 59, the estimated General Fund
condition statement included in the January 2018 LFB Report, and the estimated General Fund condition
statement included in the June 2018 LFB Paper.
The Annual Fiscal Report (budgetary basis) also provides final General Fund tax collections for the
2017-18 fiscal year. These General Fund tax revenue collections, on a budgetary basis, were $16.144
billion, compared to $15.518 billion for the 2016-17 fiscal year; this is an increase of approximately $627
million (or 4.0%).
Table II-5 provides a summary of the final General Fund tax revenues for the 2017-18 fiscal year. Table
II-5 also includes, for comparison, the actual General Fund tax collections for the 2016-17 fiscal year, the
projected General Fund tax collections as included in 2017 Wisconsin Act 59 and the General Fund tax
collections as projected in the January 2018 LFB Report.
35 GENERAL INFORMATION
Table II-4
GENERAL FUND CONDITION STATEMENT
2017-18 FISCAL YEAR
(in Millions)
2017-18 Fiscal Year
2016-17
Annual
Fiscal Report
2017 Wisconsin
Act 59
January 2018
LFB Report
June 2018
LFB Paper
Annual
Fiscal Report
Revenues
Opening Balance $ 331.0 $ 579.0 $ 579.0 $ 579.0 $ 579.0
Prior-Year Designation 131.9 0 0 0 52.1
Taxes 15,517.6 16,077.5 16,125.9 16,125.8 16,144.2
Department Revenues
Tribal Gaming 26.8 26.2 26.2 26.2 27.7
Other 520.7 493.1 485.9 485.9 528.7
Total Available $ 16,528.1 $ 17,175.7 $17,217.0 $17,216.8 $17,331.6
Appropriations
Gross Appropriations $ 17,099.1 $ 16,893.3 $16,896.4 $16,946.9 $17,138.8
Sum Sufficient Reestimates 0 0 (47.6) 0 0
Transfers 39.5 40.2 64.4 64.4 73.3
Compensation Reserves 1.2 3.1 3.1 3.1 0.3
Less: Lapses (1,190.7) (318.5) (351.5) (344.8) (469.3)
Net Appropriations $ 15,949.1 $ 16,621.1 $16,564.9 $16,669.6 $16,743.1
Balances
Gross Balance $ 579.0 $ 554.7 $ 652.1 $ 547.3 $ 588.5
Less: Req. Statutory Balance n/a (70.0) (70.0) (70.0) n/a
Net Balance, June 30 $ 579.0 $ 484.7 $ 582.1 $ 477.3 $ 588.5
Table II-5
GENERAL FUND TAX REVENUE COLLECTIONS
2017-18 FISCAL YEAR
(in Millions)
2017-18 Fiscal Year
2016-17
Annual
Fiscal Report
2017 Wisconsin
Act 59
January 2018
LFB Report
Annual
Fiscal Report
Individual Income $ 8,039.5 $ 8,379.8 $ 8,380.0 $ 8,479.2
Sales and Use 5,223.9 5,383.8 5,465.0 5,448.1
Corp. Income & Franchise 920.9 950.8 950.0 893.9
Public Utility 360.5 373.5 359.0 365.3
Excise
Cigarettes 564.2 564.7 548.0 538.9
Tobacco Products 80.3 85.0 82.0 80.2
Liquor & Wine 52.1 52.0 52.0 52.0
Beer 9.1 8.9 8.9 8.9
Insurance Company 181.6 192.0 190.0 186.3
Miscellaneous Taxes 85.5 87.0 91.0 91.4
TOTAL $ 15,517.6 $ 16,077.5 $16,125.9 $16,144.2

36 GENERAL INFORMATION
The Annual Fiscal Report for the 2017-18 fiscal year is not part of the 2018 Annual Report but has been
filed with, and may be obtained from, the MSRB through its EMMA system or at the following address:
State of Wisconsin Capital Finance Office
Department of Administration
101 East Wilson Street, FLR 10
P.O. Box 7864
Madison, WI 53707-7864
(608) 267-0374
doa.wi.gov/capitalfinance
STATE BUDGET
Budget for 2017-19 Biennium
The budget act for the 2017-19 biennium, 2017 Wisconsin Act 59, was enacted on September 21, 2017
with some vetoes. Detailed information and summary tables and charts concerning the enacted budget
for the 2017-19 biennium may be obtained from the following web site (neither the following web site or
the summaries available at such web site are incorporated by reference into this Part II of the 2018
Annual Report):
legis.wisconsin.gov/lfb
Information pertaining to 2017 Wisconsin Act 59 has also been filed with the MSRB on their EMMA
system.
Budget for 2018-19 Fiscal Year
Fiscal year 2018-19 is the second year of the 2017-19 biennial budget. Table II-6 shows the estimated
General Fund condition statement for the 2018-19 fiscal year, as provided by DOA on November 20,
2018 (November 2018 DOA Report). Table II-6 also includes, for comparison purposes, the actual
General Fund condition statement for the 2017-18 fiscal year, the projected General Fund condition
statement from the 2017-19 biennial budget, the General Fund condition statement as projected in the
January 2018 LFB Report and the General Fund condition statement as projected in the June 2018 LFB
Paper.
Revenue Projections for the 2018-19 Fiscal Year
The November 2018 DOA Report includes estimated General Fund tax revenues for the 2018-19 fiscal
year of $16.816 billion. This estimated amount is $672 million (4.2%) more than the fiscal year 2017-18
actual revenues, and $137 million more than the projections in the January 2018 LFB Report. The
estimates are summarized by tax source in Table II-7, which also includes, for comparison, the actual
General Fund tax collections for the 2017-18 fiscal year, projected General Fund tax collections from
2017 Wisconsin Act 59, and projections provided in the January 2018 LFB Report.
Sales and Use Tax on Remote Sales
The estimates in the November 2018 DOA Report assume additional sales and use tax revenues from
remote sellers collected as the result of the June 2018 U.S. Supreme Court ruling (South Dakota v.
Wayfair, Inc.). The DOR estimate for the 2018-19 fiscal year of these collections based on Wayfair is $45
million. 2017 Wisconsin Act 368 was signed into law on December 14, 2018 and replaces existing
procedures and determinations for possible reduction in individual income tax rates, and directly offsets
increases in tax collections resulting from Wayfair with individual income tax reductions starting in the
tax year 2019; however, there is no expected impact on the General Fund revenue collections for the
2018-19 fiscal year.

37 GENERAL INFORMATION
Table II-6
ESTIMATED GENERAL FUND CONDITION STATEMENT
2018-19 FISCAL YEAR
(in Millions)
2018-19 Fiscal Year
2017-18 Annual
Fiscal Report
2017
Wisconsin
Act 59
January 2018
LFB Report
June 2018
LFB Paper
November 2018
DOA Report
Revenues
Opening Balance $ 579.0 $ 554.7 $ 652.1 $ 547.3 $ 588.5
Prior-Year Designation 52.1
Taxes 16,144.2 16,650.9 16,678.8 16,631.8 16,816.0
Department Revenues
Tribal Gaming 27.7 26.1 26.1 26.1 26.2
Other 528.7 443.2 452.0 451.9 456.2
Total Available $17,331.6 $17,674.8 $17,809.0 $17,656.9 $17,886.9
Appropriations
Gross Appropriations $17,138.8 $17,700.3 $17,700.4 $17,829.8 $17,706.8
Sum Sufficient Reestimate (5.3)
Transfers 73.3 41.6 55.6 41.6 124.2
Compensation Reserves 0.3 52.1 52.1 52.1 52.1
Prelim. Debt Service Reestimate ($16.8)
Less: Lapses (469.3) (441.8) (453.9) (448.2) (601.7)
Net Appropriations $16,743.1 $17,352.1 $17,348.8 $17,475.3 $17,264.3
Balances
Gross Balance $ 588.5 $ 332.7 $ 460.2 $ 181.7 $ 622.6
Less: Req. Statutory Balance n/a (75.0) (75.0) (75.0) (75.0)
Net Balance, June 30 $ 588.5 $ 247.7 $ 385.2 $ 106.7 $ 547.6
Table II-7
ESTIMATED GENERAL FUND TAX REVENUE COLLECTIONS
2018-19 FISCAL YEAR
(in Millions)
2018-19 Fiscal Year
2017-18 Annual
Fiscal Report
2017
Wisconsin
Act 59
January 2018
LFB Report
November 2018
DOA Report
Individual Income $ 8,479.2 $ 8,720.0 $ 8,720.0 $ 8,817.8
Sales and Use 5,448.1 5,593.1 5,650.0 5,704.2
Corp. Income & Franchise 893.9 962.4 960.0 973.6
Public Utility 365.3 378.2 363.0 356.4
Excise
Cigarettes 538.9 560.4 547.0 531.8
Tobacco Products 80.2 88.0 85.0 82.6
Liquor & Wine 52.0 53.0 53.0 54.3
Beer 8.9 8.8 8.8 8.9
Insurance Company 186.3 197.0 195.0 191.0
Miscellaneous Taxes 91.4 90.0 97.0 95.4
TOTAL $16,144.2 $16,650.9 $16,678.8 $16,816.0
38 GENERAL INFORMATION
Budget for the 2019-21 Biennium
Pursuant to the Wisconsin Statutes, the November 2018 DOA Report summarizes the amount of each
agency’s 2019-21 biennial budget request and includes estimated General Fund revenues, as compiled by
DOR for the forthcoming biennium. The Governor will use these revenue estimates and agency requests
to propose a balanced biennial budget, which must be submitted to the Legislature on or before January
31, 2019; however, a later submission date may be allowed by the Legislature if requested by the
Governor, and such a submittal extension is expected for the 2019-21 biennial budget.
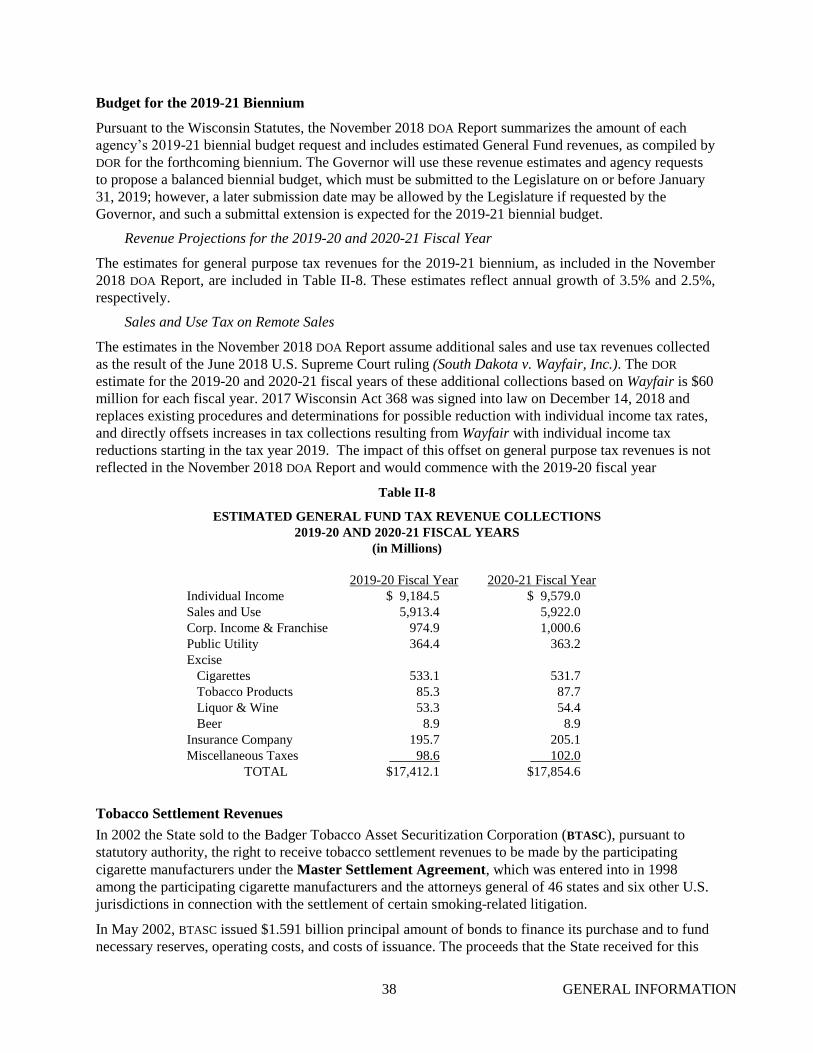
Revenue Projections for the 2019-20 and 2020-21 Fiscal Year
The estimates for general purpose tax revenues for the 2019-21 biennium, as included in the November
2018 DOA Report, are included in Table II-8. These estimates reflect annual growth of 3.5% and 2.5%,
respectively.
Sales and Use Tax on Remote Sales
The estimates in the November 2018 DOA Report assume additional sales and use tax revenues collected
as the result of the June 2018 U.S. Supreme Court ruling (South Dakota v. Wayfair, Inc.). The DOR
estimate for the 2019-20 and 2020-21 fiscal years of these additional collections based on Wayfair is $60
million for each fiscal year. 2017 Wisconsin Act 368 was signed into law on December 14, 2018 and
replaces existing procedures and determinations for possible reduction with individual income tax rates,
and directly offsets increases in tax collections resulting from Wayfair with individual income tax
reductions starting in the tax year 2019. The impact of this offset on general purpose tax revenues is not
reflected in the November 2018 DOA Report and would commence with the 2019-20 fiscal year
Table II-8
ESTIMATED GENERAL FUND TAX REVENUE COLLECTIONS
2019-20 AND 2020-21 FISCAL YEARS
(in Millions)
2019-20 Fiscal Year 2020-21 Fiscal Year
Individual Income $ 9,184.5 $ 9,579.0
Sales and Use 5,913.4 5,922.0
Corp. Income & Franchise 974.9 1,000.6
Public Utility 364.4 363.2
Excise
Cigarettes 533.1 531.7
Tobacco Products 85.3 87.7
Liquor & Wine 53.3 54.4
Beer 8.9 8.9
Insurance Company 195.7 205.1
Miscellaneous Taxes 98.6 102.0
TOTAL $17,412.1 $17,854.6
Tobacco Settlement Revenues
In 2002 the State sold to the Badger Tobacco Asset Securitization Corporation (BTASC), pursuant to
statutory authority, the right to receive tobacco settlement revenues to be made by the participating
cigarette manufacturers under the Master Settlement Agreement, which was entered into in 1998
among the participating cigarette manufacturers and the attorneys general of 46 states and six other U.S.
jurisdictions in connection with the settlement of certain smoking-related litigation.
In May 2002, BTASC issued $1.591 billion principal amount of bonds to finance its purchase and to fund
necessary reserves, operating costs, and costs of issuance. The proceeds that the State received for this
39 GENERAL INFORMATION
sale were expended. The bonds issued by BTASC were payable from the tobacco settlement revenues that
the State had sold and assigned to BTASC.
In April 2009, the State, acting by and through the Department of Administration, issued $1.529 billion
principal amount of general fund annual appropriation bonds to purchase from BTASC the State’s right to
the tobacco settlement revenues pursuant to the Master Settlement Agreement. All obligations previously
issued by BTASC have been redeemed, and the State resumed its right to receive tobacco settlement
revenues under the Master Settlement Agreement as a result of the State’s purchase.
Potential Effect of Litigation
The following is a description of various legal proceedings, claims, and tax refunds that may have a
budgetary effect on the State.
Notice of Transferee Liability
In September 2008, the Internal Revenue Service made a claim against the State of Wisconsin Investment
Board (SWIB) by issuing a notice of transferee liability. This claim seeks taxes, penalties, and interest
relating to the sale of Shockley Communications Corporation (SCC) stock in 2001. The Internal Revenue
Service asserts that the shareholders’ sale of SCC stock should have been characterized as a sale of assets
by SCC, on which SCC should have paid income taxes. The Internal Revenue Service asserts that the
former SCC shareholders, including SWIB, would be liable for those taxes, plus penalties and interest.
The SWIB liability, as a putative transferee of SCC assets, was estimated to be between $17 million and
$52 million. SWIB has accrued a loss of $17 million which represents the estimated minimum amount of
the possible liability to which SWIB believes it may be exposed.
Enforcement Provisions of Master Settlement Agreement
The State and 7 other states that signed the Master Settlement Agreement are in litigation with the major
tobacco manufacturers regarding the post-2003 diligence of the states in their enforcement of
certification and escrow payment laws designed to monitor and regulate the sale of cigarettes by tobacco
manufacturers that did not sign the Master Settlement Agreement.
An arbitration proceeding regarding the dispute for calendar year 2004 has begun. Wisconsin received
notice from the tobacco manufacturers in June 2017 that they will contest the State’s diligence.
Wisconsin’s hearing is currently scheduled to take place in January 2019. Therefore, pending resolution
of the dispute, the State will not receive approximately $15 million of Master Settlement Agreement
funds that have been withheld by tobacco manufacturers.
Other
The State, its officers, and its employees are defendants in numerous other lawsuits. It is the opinion of
the Attorney General that such pending litigation will not be finally determined so as to result
individually or in the aggregate in a final judgment against the State which would materially impair its
financial position. Potential liability for such pending litigation does not constitute a significant
impairment of the State’s financial position, or its ability to pay debt service.
Employment Relations
This summary discusses employment relations within the executive branch under the authority of the
Department of Administration. Since July 2015, the University of Wisconsin-Madison, and the remainder
of the University of Wisconsin (UW) System combined, are independent civil service systems, with their
own statutorily-defined collective bargaining units and collective bargaining authority. Therefore, neither
entity is included in the following summary.
The executive branch had approximately 24,504 full-time-equivalent (FTE) classified and unclassified
employees in 18 statutorily-designated bargaining units as of the end of 2017-18 fiscal year. An
additional 2,395 classified supervisors in two bargaining units may by statute also be considered for
representation, but these supervisory units have never applied for representation. During the 2017-18
fiscal year, two of these 18 bargaining units, covering 443 FTE employees, were represented by a union,

40 GENERAL INFORMATION
statutorily limited to the ability to negotiate base wages only. One additional bargaining unit, covering
381 FTE employees, was represented by a union to negotiate wages, benefits, and working conditions.
Thus, at the end of the 2017-18 fiscal year, a total of 824 FTE employees were represented for some
degree of collective bargaining.
For all except one bargaining unit, representation rights are strictly limited to negotiation of base wage
increases for a single fiscal year contract, and a recertification election must be held each year. The one
exception is the public safety bargaining unit (State Patrol troopers and inspectors), which may negotiate
wage rates, pay schedules, fringe benefits, hours of work, and conditions of employment for fiscal
biennium contracts, and represent employees for grievances. Unlike the other unions, the public safety
union is not subject to annual recertification.
Each collective bargaining agreement requires ratification by the members of the respective labor union,
approval by the legislative Joint Committee on Employment Relations, passage by both houses of the
Legislature, and signature of the Governor.
At the close of fiscal year 2017-18, there were only two collective bargaining agreements in force. The
first was for public safety (State Patrol) and the second was for building trades.
Most classified and unclassified employees are also covered under the State compensation plan. The
compensation plan, in conjunction with statutes, administrative rules, and policies, provides wages,
hours, paid leave, and conditions of employment for all civil service employees, except as negotiable by
unions. Fringe benefits including retirement and health and life insurance are determined legislatively or
through the Group Insurance and Employee Trust Fund Boards. The public safety union is the only union
that can negotiate with regard to certain aspects of these fringe benefits.
The budget provides for salary and fringe benefits in an amount that is expected to be sufficient to meet
all contractual obligations.
State Budget Assumptions
Tax revenue projections for the 2017-19 biennial budget were based on January 2017 estimates from LFB.
Current tax revenue projections for the 2018-19 fiscal year are based on November 2018 estimates from
DOR. See “STATE BUDGET”. The estimates are based on the State tax structure and on assumptions
about basic economic factors and their historical relationships to State tax receipts. Revenue sources
other than taxes are estimated in the preparation of the budget. The all-funds budget establishes estimates
of these nontax revenues and presumes that an equal amount of expenditures will be made. For that
purpose, any variation from the expected level of revenue is assumed to result in a corresponding
increase or decrease in expenditures.
State disbursements for the budget are based on assumptions relating to economic and demographic
factors, desired levels of services, and the success of expenditure control mechanisms applied by the
Secretary of Administration pursuant to statutory authority in controlling disbursements for State
operations. Factors that may affect the level of disbursements in the budgets and make the projected
levels difficult to maintain include uncertainties relating to the economies of the nation and the State.
Economic Assumptions
DOR prepares forecasts of income and employment for the State. These forecasts focus on industry
employment, housing trends, and income components for the State.
41 GENERAL INFORMATION
The tax revenue estimates from DOR included in the November 2018 DOA Report reflect certain
projections presented in a national economic forecast by IHS Markit (IHS), which provides national
economic forecasts, database support, and consulting services. Table II-9 contains excerpts from IHS’
November 2018 national economic forecast, and Table II-10 contains a summary of information from
DOR’s Wisconsin Econometric Model (Model).
Wisconsin Econometric Model
The Model is a forecasting tool used for assessing the future of the State’s economy, measured primarily
by income and employment. The Model provides DOR with information about how the State’s economy
responds to changes in the national economic conditions and plays a critical role in the revenue
estimating process. The Model was first designed in 1976 by a predecessor of IHS (Data Resources Inc.).
DOR has periodically redesigned the Model to improve its performance and to correspond to changes in
national modeling concepts in the IHS macro model of the U.S. economy and to incorporate new data
definitions as embodied in the national and regional income accounts.
The Model provides forecasts of the major components of Wisconsin income and employment. Income
measures correspond to the measures of State personal income provided by the U.S. Department of
Commerce, Bureau of Economic Analysis. Employment measures correspond to the North American
Industry Classification System (NAICS) as provided by the U.S. Department of Labor, Bureau of Labor
Statistics through its Current Employment Statistics program and Quarterly Census of Employment and
Wages program. The Model is a structural model that employs accounting identities and theoretical
constructs for predictions on each economic variable. It is driven by a set of variables that are exogenous
or determined outside the Model. The national forecast data are used in the Model to generate forecasts
of State employment, income, tax revenue, and other economic indicators.
The Model is similar to many economic models in that the economy is described by a set of mathematical
equations. There are equations for employment, wages, property income, proprietary income, transfer
payments, housing permits, and taxes, among others. The Model currently consists of 183 equations, 99
of which are econometric regressions.
The equations of the Model are a mixture of definitional equations and stochastic equations. Definitional
equations are used to formulate accounting relationships (for example, total employment is the sum of
employment for each industry). Stochastic equations are used to specify probability or statistical
relationships in which the relationship between any two economic measures cannot be defined exactly.
Stochastic equations within the Model are determined using regression techniques. Both types of
equations rely on an extensive historical database that contains both national and State measures.
Forecasts of economic variables at the national level are required to solve the Model’s equations.
National forecast data include measures of employment, personal income, industry output, factor costs,
tax levels and rates, interest rates, inflation, etc. Currently, the Model uses forecasts provided by IHS for
these national variables.
Other data come from both federal and State agencies. These data are principally measures of State
personal income, employment, population, wages, milk prices, housing permits, new vehicle sales, and
State tax rates and collections. After the data are compiled into the Model, the system of equations is
simultaneously solved for income, employment, and other economic variables.
DOR maintains the Model through a process of keeping the Model’s database up to date and re-examining
the Model’s equations when historical data are revised. The Model is calibrated to be temporally
consistent with current data estimates by re-estimating the system of equations on a regular basis.
Updating and revising the Model is necessary to keep the Model’s forecasts as reliable as possible. It is
believed that if the Model can account for previous changes in income and employment, then it should be
able to accurately forecast current levels of income and employment barring any large, unforeseen
changes in the structure of the economy.
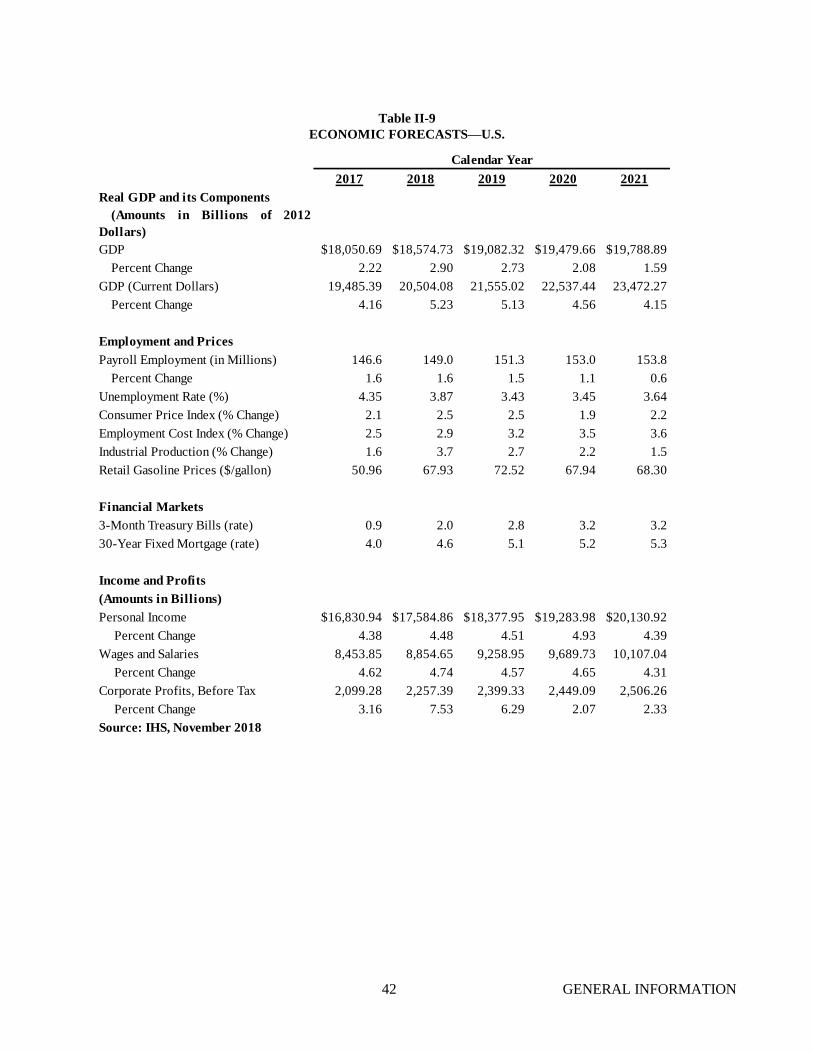
42 GENERAL INFORMATION
Table II-9
ECONOMIC FORECASTS—U.S.
2017 2018 2019 2020 2021
Real GDP and its Components
(Amounts in Billions of 2012
Dollars)
GDP $18,050.69 $18,574.73 $19,082.32 $19,479.66 $19,788.89
Percent Change 2.22 2.90 2.73 2.08 1.59
GDP (Current Dollars) 19,485.39 20,504.08 21,555.02 22,537.44 23,472.27
Percent Change 4.16 5.23 5.13 4.56 4.15
Employment and Prices
Payroll Employment (in Millions) 146.6 149.0 151.3 153.0 153.8
Percent Change 1.6 1.6 1.5 1.1 0.6
Unemployment Rate (%) 4.35 3.87 3.43 3.45 3.64
Consumer Price Index (% Change) 2.1 2.5 2.5 1.9 2.2
Employment Cost Index (% Change) 2.5 2.9 3.2 3.5 3.6
Industrial Production (% Change) 1.6 3.7 2.7 2.2 1.5
Retail Gasoline Prices ($/gallon) 50.96 67.93 72.52 67.94 68.30
Financial Markets
3-Month Treasury Bills (rate) 0.9 2.0 2.8 3.2 3.2
30-Year Fixed Mortgage (rate) 4.0 4.6 5.1 5.2 5.3
Income and Profits
(Amounts in Billions)
Personal Income $16,830.94 $17,584.86 $18,377.95 $19,283.98 $20,130.92
Percent Change 4.38 4.48 4.51 4.93 4.39
Wages and Salaries 8,453.85 8,854.65 9,258.95 9,689.73 10,107.04
Percent Change 4.62 4.74 4.57 4.65 4.31
Corporate Profits, Before Tax 2,099.28 2,257.39 2,399.33 2,449.09 2,506.26
Percent Change 3.16 7.53 6.29 2.07 2.33
Source: IHS, November 2018
Calendar Year
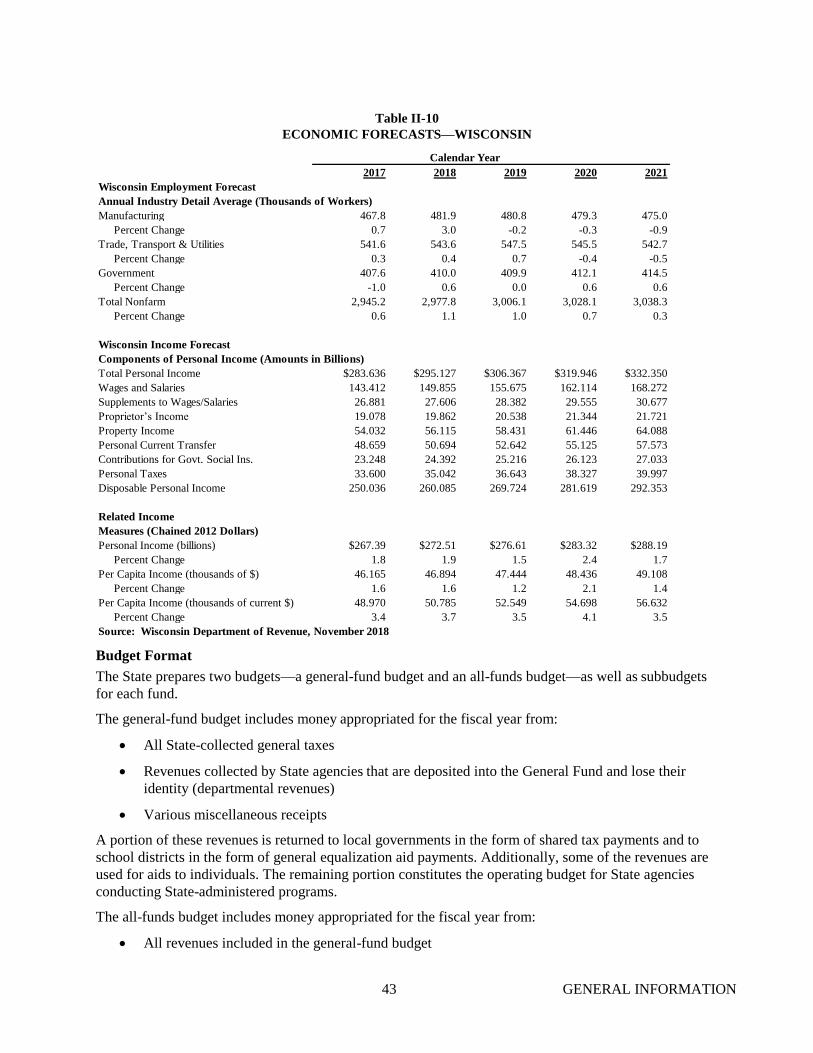
43 GENERAL INFORMATION
Table II-10
ECONOMIC FORECASTS—WISCONSIN
2017 2018 2019 2020 2021
Wisconsin Employment Forecast
Annual Industry Detail Average (Thousands of Workers)
Manufacturing 467.8 481.9 480.8 479.3 475.0
Percent Change 0.7 3.0 -0.2 -0.3 -0.9
Trade, Transport & Utilities 541.6 543.6 547.5 545.5 542.7
Percent Change 0.3 0.4 0.7 -0.4 -0.5
Government 407.6 410.0 409.9 412.1 414.5
Percent Change -1.0 0.6 0.0 0.6 0.6
Total Nonfarm 2,945.2 2,977.8 3,006.1 3,028.1 3,038.3
Percent Change 0.6 1.1 1.0 0.7 0.3
Wisconsin Income Forecast
Components of Personal Income (Amounts in Billions)
Total Personal Income $283.636 $295.127 $306.367 $319.946 $332.350
Wages and Salaries 143.412 149.855 155.675 162.114 168.272
Supplements to Wages/Salaries 26.881 27.606 28.382 29.555 30.677
Proprietor’s Income 19.078 19.862 20.538 21.344 21.721
Property Income 54.032 56.115 58.431 61.446 64.088
Personal Current Transfer 48.659 50.694 52.642 55.125 57.573
Contributions for Govt. Social Ins. 23.248 24.392 25.216 26.123 27.033
Personal Taxes 33.600 35.042 36.643 38.327 39.997
Disposable Personal Income 250.036 260.085 269.724 281.619 292.353
Personal Income (billions) $267.39 $272.51 $276.61 $283.32 $288.19
Percent Change 1.8 1.9 1.5 2.4 1.7
Per Capita Income (thousands of $) 46.165 46.894 47.444 48.436 49.108
Percent Change 1.6 1.6 1.2 2.1 1.4
Per Capita Income (thousands of current $) 48.970 50.785 52.549 54.698 56.632
Percent Change 3.4 3.7 3.5 4.1 3.5
Calendar Year
Related Income
Measures (Chained 2012 Dollars)
Source: Wisconsin Department of Revenue, November 2018
Budget Format
The State prepares two budgets—a general-fund budget and an all-funds budget—as well as subbudgets
for each fund.
The general-fund budget includes money appropriated for the fiscal year from:
• All State-collected general taxes
• Revenues collected by State agencies that are deposited into the General Fund and lose their
identity (departmental revenues)
• Various miscellaneous receipts
A portion of these revenues is returned to local governments in the form of shared tax payments and to
school districts in the form of general equalization aid payments. Additionally, some of the revenues are
used for aids to individuals. The remaining portion constitutes the operating budget for State agencies
conducting State-administered programs.
The all-funds budget includes money appropriated for the fiscal year from:
• All revenues included in the general-fund budget
44 GENERAL INFORMATION
• Revenues collected by State agencies that are paid into a specific fund (such as the
Transportation Fund or the Conservation Fund)
• Federal funds that are estimated to be received and either paid into a specific fund (such as the
Transportation Fund or the Conservation Fund) for a specified program or purpose, or credited to
an appropriation to finance a specific program or agency
• Investment earnings or losses
• Revenues resulting from the contracting of public debt
The all-funds budget assumes that certain categories of revenues are expended in like amounts. These
categories include federal funds, revenues paid into specific funds (other than the General Fund) for a
specified program or purpose or which are credited to an appropriation to finance a specific program or
agency, and proceeds of general obligation debt. In any given fiscal year, there may be a balance at year-
end in the funds, specific program, or agency. Because it includes only estimates of federal funds to be
received and expended, the all-funds budget may vary during the course of the fiscal year.
Impact of Federal Programs
The State does not typically receive substantial amounts of federal aid. Any reduction in federal aid
would have a more immediate effect on individuals, local governments, and other service providers than
on the State directly. Any reduction would, however, increase the likelihood of the State being asked to
increase its support of the affected parties, which could not happen without the Legislature’s approval.
Budget Sequestration Cuts
The United States Congress has mandated across-the-board cuts to the federal budget, starting with the
federal fiscal year that started October 1, 2012. The 2018 Bipartisan Budget Act set new spending caps
on discretionary programs for Federal Fiscal Years 2018 and 2019. Due to this known cap, the State
does not expect to see any significant decrease in federal funds during the 2018-19 fiscal year.
Supplemental Appropriations
Even after the budget is adopted, the State may increase appropriations or reduce taxes. However, it has
been the State’s practice that supplemental appropriations adopted by the Legislature will be within
revenue projections for that fiscal period or balanced by reductions in other appropriations.
No legislation directly or indirectly affecting general purpose revenue may be enacted if it would cause
the estimated General Fund balance at the end of the fiscal year to be less than the required statutory
reserve.
GENERAL FUND INFORMATION
General Fund Cash Flow
Many of the budgetary tables presented thus far in this Part II of the 2018 Annual Report have reported
information on a budgetary basis. The following tables present information primarily on a cash basis.
Table II-11 is presented over two pages and includes the detailed actual cash flow for the 2017-18 fiscal
year and the detailed actual cash flow through October 31, 2018 and projected cash flow from November
1, 2018 through June 30, 2019 for the 2018-19 fiscal year. Table II-12 provides a five-year history of
general cash flows. Table II-13 is presented over two pages and provides, for the 2017-18 fiscal year and
for the 2018-19 fiscal year-to-date, receipts and disbursements on a cash basis along with a comparison to
estimates for the same period and actual receipts and disbursements for the same period of the previous
fiscal year. Table II-14 presents a monthly summary of the General Fund from fiscal year 2016-17
through fiscal year 2018-19 and also provides actual expenditures and revenues from July 1, 2018
through October 31, 2018 and projected expenditures and revenues from November 1, 2018 through June
30, 2019.

45 GENERAL INFORMATION
No operating notes were issued for the 2016-17 or 2017-18 fiscal years, and none have been, or expected
to be, issued for the current fiscal year.
Tables II-11, II-12, II-13 and II-14 should be read in conjunction with other information concerning the
State budget set forth elsewhere in this Part II of the 2018 Annual Report, including “BUDGETING
PROCESS AND FISCAL CONTROLS”, “STATE BUDGET”, and “STATE OBLIGATIONS; Operating Notes”. As
noted above, there have been and will continue to be differences in the amounts shown for the cash-flow
basis and the budgetary basis presentations. For example, the cash-flow basis presentations in the
following tables include all tax receipts as revenues and tax refunds as disbursements, while the
budgetary basis presentations in Tables II-4 and II-6 include tax revenues that are net of tax refunds.
The results, projections, or estimates for the 2018-19 fiscal year in the following tables reflect the
enacted budget for the 2017-19 biennium (2017 Wisconsin Act 59) and the estimated General Fund tax
revenues included in the January 2018 LFB Report and the June 2018 LFB Paper. These tables to not
include the November 2018 DOA Report.
Unforeseen events or variations from underlying assumptions may cause a decrease in receipts or an
increase in disbursements from those projected for a given month and thus may adversely affect the
projection of cash flow for the time shown. Additionally, the timing of transactions from month to month
may vary from the forecast.
The State has experienced and expects to continue to experience certain periods when the General Fund
is in a negative cash position. The Wisconsin Statutes provide certain administrative remedies to deal
with these periods. The Secretary of Administration may temporarily reallocate cash in other funds to the
General Fund in an amount up to 9% of the general-purpose revenue appropriations then in effect
(approximately $1.592 billion in the 2018-19 fiscal year). In addition, the Secretary of Administration
can temporarily reallocate an additional amount of up to 3% of the general-purpose revenue
appropriations then in effect (approximately $531 million in the 2018-19 fiscal year) for a period of up to
30 days. In aggregate, the limit on the amount available from temporary reallocations for the 2018-19
fiscal year is approximately $2.123 billion.
If the amount available for temporary reallocation to the General Fund is insufficient, then the Secretary
of Administration may set priorities for payments from the General Fund as well as prorate and defer
certain payments. The Wisconsin Statutes provide that all payments shall be in accordance with the
following order of preference:
• All direct and indirect payments of principal and interest on State general obligation debt have
first priority and may not be prorated or reduced.
• All direct and indirect payments of principal and interest on operating notes have second priority
and may not be prorated or reduced.
• All State employee payrolls have third priority and may be prorated or reduced.
• All other payments shall be paid in a priority determined by the Secretary of Administration and
may be prorated or reduced. The Secretary of Administration has covenanted to give high
priority to payments due under the Master Lease Program, debt service due on the General Fund
Annual Appropriation Bonds, and appropriations to the Wisconsin Center District in the
approximate amount of $8 million to assist in the development and construction of a new arena
in Milwaukee, Wisconsin, pursuant to contracts entered into in connection with the issuance of
the related obligations.
Table II-15 presents the actual cash balances available for temporary reallocation from July 31, 2016
through October 31, 2018 and the projected balances for November 30, 2018 through June 30, 2019. The
available cash balances are presented in two different tables; one table does not include balances in the
Local Government Investment Pool (LGIP), while the second table does include such balances. Though
46 GENERAL INFORMATION
the LGIP is available for temporary reallocation, funds in the LGIP are deposited and withdrawn by local
units of government and thus are outside the control of the State.
Tables II-16 and II-17 are each presented over two pages and include recorded revenues deposited into
the General Fund and recorded expenditures made from the General Fund, as recorded by State agencies,
for the 2017-18 fiscal year final as compared to the prior fiscal year, and July 1, 2018 to October 31,
2018 as compared to the period of July 1, 2017 to October 31, 2017. These tables present information
that is based on the revenues and expenditures that are recorded in, or processed through, the State’s
central accounting system and across all State agencies. There may be differences between the tax
revenues shown in Table II-16 and those reported by the Department of Revenue from time to time in its
monthly general purpose revenue collections report; the Department of Revenue report only includes
general purpose revenues or taxes that are actually collected by the Department of Revenue while certain
revenues are collected by other State agencies.
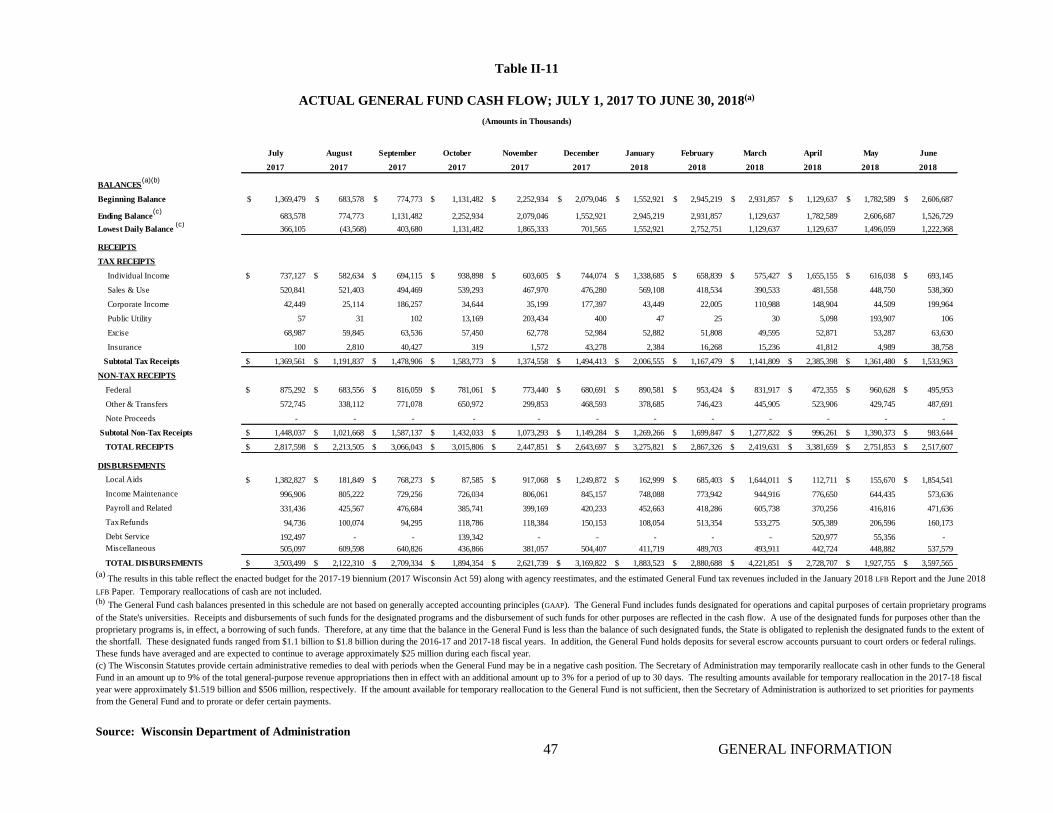
47 GENERAL INFORMATION
Table II-11
ACTUAL GENERAL FUND CASH FLOW; JULY 1, 2017 TO JUNE 30, 2018(a)
(Amounts in Thousands)
July August September October November December January February March April May June
2017 2017 2017 2017 2017 2017 2018 2018 2018 2018 2018 2018
BALANCES(a)(b)
Beginning Balance 1,369,479$ 683,578$ 774,773$ 1,131,482$ 2,252,934$ 2,079,046$ 1,552,921$ 2,945,219$ 2,931,857$ 1,129,637$ 1,782,589$ 2,606,687$
Ending Balance(c)
683,578 774,773 1,131,482 2,252,934 2,079,046 1,552,921 2,945,219 2,931,857 1,129,637 1,782,589 2,606,687 1,526,729
Lowest Daily Balance (c)
366,105 (43,568) 403,680 1,131,482 1,865,333 701,565 1,552,921 2,752,751 1,129,637 1,129,637 1,496,059 1,222,368
RECEIPTS
TAX RECEIPTS
Individual Income 737,127$ 582,634$ 694,115$ 938,898$ 603,605$ 744,074$ 1,338,685$ 658,839$ 575,427$ 1,655,155$ 616,038$ 693,145$
Sales & Use 520,841 521,403 494,469 539,293 467,970 476,280 569,108 418,534 390,533 481,558 448,750 538,360
Corporate Income 42,449 25,114 186,257 34,644 35,199 177,397 43,449 22,005 110,988 148,904 44,509 199,964
Public Utility 57 31 102 13,169 203,434 400 47 25 30 5,098 193,907 106
Excise 68,987 59,845 63,536 57,450 62,778 52,984 52,882 51,808 49,595 52,871 53,287 63,630
Insurance 100 2,810 40,427 319 1,572 43,278 2,384 16,268 15,236 41,812 4,989 38,758
Subtotal Tax Receipts 1,369,561$ 1,191,837$ 1,478,906$ 1,583,773$ 1,374,558$ 1,494,413$ 2,006,555$ 1,167,479$ 1,141,809$ 2,385,398$ 1,361,480$ 1,533,963$
NON-TAX RECEIPTS
Federal 875,292$ 683,556$ 816,059$ 781,061$ 773,440$ 680,691$ 890,581$ 953,424$ 831,917$ 472,355$ 960,628$ 495,953$
Other & Transfers 572,745 338,112 771,078 650,972 299,853 468,593 378,685 746,423 445,905 523,906 429,745 487,691
Note Proceeds - - - - - - - - - - - -
Subtotal Non-Tax Receipts 1,448,037$ 1,021,668$ 1,587,137$ 1,432,033$ 1,073,293$ 1,149,284$ 1,269,266$ 1,699,847$ 1,277,822$ 996,261$ 1,390,373$ 983,644$
TOTAL RECEIPTS 2,817,598$ 2,213,505$ 3,066,043$ 3,015,806$ 2,447,851$ 2,643,697$ 3,275,821$ 2,867,326$ 2,419,631$ 3,381,659$ 2,751,853$ 2,517,607$
DISBURSEMENTS
Local Aids 1,382,827$ 181,849$ 768,273$ 87,585$ 917,068$ 1,249,872$ 162,999$ 685,403$ 1,644,011$ 112,711$ 155,670$ 1,854,541$
Income Maintenance 996,906 805,222 729,256 726,034 806,061 845,157 748,088 773,942 944,916 776,650 644,435 573,636
Payroll and Related 331,436 425,567 476,684 385,741 399,169 420,233 452,663 418,286 605,738 370,256 416,816 471,636
Tax Refunds 94,736 100,074 94,295 118,786 118,384 150,153 108,054 513,354 533,275 505,389 206,596 160,173
Debt Service 192,497 - - 139,342 - - - - - 520,977 55,356 -
Miscellaneous 505,097 609,598 640,826 436,866 381,057 504,407 411,719 489,703 493,911 442,724 448,882 537,579
TOTAL DISBURSEMENTS 3,503,499$ 2,122,310$ 2,709,334$ 1,894,354$ 2,621,739$ 3,169,822$ 1,883,523$ 2,880,688$ 4,221,851$ 2,728,707$ 1,927,755$ 3,597,565$
(a) The results in this table reflect the enacted budget for the 2017-19 biennium (2017 Wisconsin Act 59) along with agency reestimates, and the estimated General Fund tax revenues included in the January 2018 LFB Report and the June 2018
LFB Paper. Temporary reallocations of cash are not included. (b) The General Fund cash balances presented in this schedule are not based on generally accepted accounting principles (GAAP). The General Fund includes funds designated for operations and capital purposes of certain proprietary programs
of the State's universities. Receipts and disbursements of such funds for the designated programs and the disbursement of such funds for other purposes are reflected in the cash flow. A use of the designated funds for purposes other than the
proprietary programs is, in effect, a borrowing of such funds. Therefore, at any time that the balance in the General Fund is less than the balance of such designated funds, the State is obligated to replenish the designated funds to the extent of
the shortfall. These designated funds ranged from $1.1 billion to $1.8 billion during the 2016-17 and 2017-18 fiscal years. In addition, the General Fund holds deposits for several escrow accounts pursuant to court orders or federal rulings.
These funds have averaged and are expected to continue to average approximately $25 million during each fiscal year.
(c) The Wisconsin Statutes provide certain administrative remedies to deal with periods when the General Fund may be in a negative cash position. The Secretary of Administration may temporarily reallocate cash in other funds to the General
Fund in an amount up to 9% of the total general-purpose revenue appropriations then in effect with an additional amount up to 3% for a period of up to 30 days. The resulting amounts available for temporary reallocation in the 2017-18 fiscal
year were approximately $1.519 billion and $506 million, respectively. If the amount available for temporary reallocation to the General Fund is not sufficient, then the Secretary of Administration is authorized to set priorities for payments
from the General Fund and to prorate or defer certain payments.
Source: Wisconsin Department of Administration
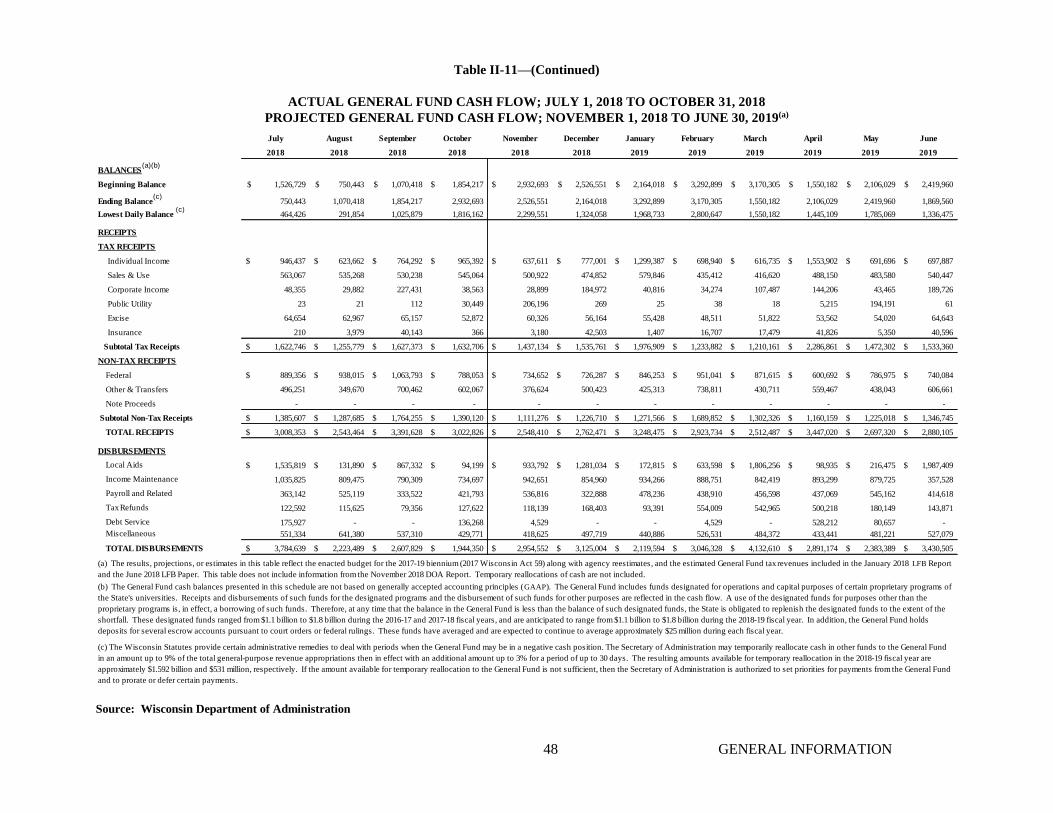
48 GENERAL INFORMATION
Table II-11—(Continued)
ACTUAL GENERAL FUND CASH FLOW; JULY 1, 2018 TO OCTOBER 31, 2018
PROJECTED GENERAL FUND CASH FLOW; NOVEMBER 1, 2018 TO JUNE 30, 2019(a)
July August September October November December January February March April May June
2018 2018 2018 2018 2018 2018 2019 2019 2019 2019 2019 2019
BALANCES(a)(b)
Beginning Balance 1,526,729$ 750,443$ 1,070,418$ 1,854,217$ 2,932,693$ 2,526,551$ 2,164,018$ 3,292,899$ 3,170,305$ 1,550,182$ 2,106,029$ 2,419,960$
Ending Balance(c)
750,443 1,070,418 1,854,217 2,932,693 2,526,551 2,164,018 3,292,899 3,170,305 1,550,182 2,106,029 2,419,960 1,869,560
Lowest Daily Balance (c)
464,426 291,854 1,025,879 1,816,162 2,299,551 1,324,058 1,968,733 2,800,647 1,550,182 1,445,109 1,785,069 1,336,475
RECEIPTS
TAX RECEIPTS
Individual Income 946,437$ 623,662$ 764,292$ 965,392$ 637,611$ 777,001$ 1,299,387$ 698,940$ 616,735$ 1,553,902$ 691,696$ 697,887$
Sales & Use 563,067 535,268 530,238 545,064 500,922 474,852 579,846 435,412 416,620 488,150 483,580 540,447
Corporate Income 48,355 29,882 227,431 38,563 28,899 184,972 40,816 34,274 107,487 144,206 43,465 189,726
Public Utility 23 21 112 30,449 206,196 269 25 38 18 5,215 194,191 61
Excise 64,654 62,967 65,157 52,872 60,326 56,164 55,428 48,511 51,822 53,562 54,020 64,643
Insurance 210 3,979 40,143 366 3,180 42,503 1,407 16,707 17,479 41,826 5,350 40,596
Subtotal Tax Receipts 1,622,746$ 1,255,779$ 1,627,373$ 1,632,706$ 1,437,134$ 1,535,761$ 1,976,909$ 1,233,882$ 1,210,161$ 2,286,861$ 1,472,302$ 1,533,360$
NON-TAX RECEIPTS
Federal 889,356$ 938,015$ 1,063,793$ 788,053$ 734,652$ 726,287$ 846,253$ 951,041$ 871,615$ 600,692$ 786,975$ 740,084$
Other & Transfers 496,251 349,670 700,462 602,067 376,624 500,423 425,313 738,811 430,711 559,467 438,043 606,661
Note Proceeds - - - - - - - - - - - -
Subtotal Non-Tax Receipts 1,385,607$ 1,287,685$ 1,764,255$ 1,390,120$ 1,111,276$ 1,226,710$ 1,271,566$ 1,689,852$ 1,302,326$ 1,160,159$ 1,225,018$ 1,346,745$
TOTAL RECEIPTS 3,008,353$ 2,543,464$ 3,391,628$ 3,022,826$ 2,548,410$ 2,762,471$ 3,248,475$ 2,923,734$ 2,512,487$ 3,447,020$ 2,697,320$ 2,880,105$
DISBURSEMENTS
Local Aids 1,535,819$ 131,890$ 867,332$ 94,199$ 933,792$ 1,281,034$ 172,815$ 633,598$ 1,806,256$ 98,935$ 216,475$ 1,987,409$
Income Maintenance 1,035,825 809,475 790,309 734,697 942,651 854,960 934,266 888,751 842,419 893,299 879,725 357,528
Payroll and Related 363,142 525,119 333,522 421,793 536,816 322,888 478,236 438,910 456,598 437,069 545,162 414,618
Tax Refunds 122,592 115,625 79,356 127,622 118,139 168,403 93,391 554,009 542,965 500,218 180,149 143,871
Debt Service 175,927 - - 136,268 4,529 - - 4,529 - 528,212 80,657 -
Miscellaneous 551,334 641,380 537,310 429,771 418,625 497,719 440,886 526,531 484,372 433,441 481,221 527,079
TOTAL DISBURSEMENTS 3,784,639$ 2,223,489$ 2,607,829$ 1,944,350$ 2,954,552$ 3,125,004$ 2,119,594$ 3,046,328$ 4,132,610$ 2,891,174$ 2,383,389$ 3,430,505$
(b) The General Fund cash balances presented in this schedule are not based on generally accepted accounting principles (GAAP). The General Fund includes funds designated for operations and capital purposes of certain proprietary programs of
the State's universities. Receipts and disbursements of such funds for the designated programs and the disbursement of such funds for other purposes are reflected in the cash flow. A use of the designated funds for purposes other than the
proprietary programs is, in effect, a borrowing of such funds. Therefore, at any time that the balance in the General Fund is less than the balance of such designated funds, the State is obligated to replenish the designated funds to the extent of the
shortfall. These designated funds ranged from $1.1 billion to $1.8 billion during the 2016-17 and 2017-18 fiscal years, and are anticipated to range from $1.1 billion to $1.8 billion during the 2018-19 fiscal year. In addition, the General Fund holds
deposits for several escrow accounts pursuant to court orders or federal rulings. These funds have averaged and are expected to continue to average approximately $25 million during each fiscal year.
(c) The Wisconsin Statutes provide certain administrative remedies to deal with periods when the General Fund may be in a negative cash position. The Secretary of Administration may temporarily reallocate cash in other funds to the General Fund
in an amount up to 9% of the total general-purpose revenue appropriations then in effect with an additional amount up to 3% for a period of up to 30 days. The resulting amounts available for temporary reallocation in the 2018-19 fiscal year are
approximately $1.592 billion and $531 million, respectively. If the amount available for temporary reallocation to the General Fund is not sufficient, then the Secretary of Administration is authorized to set priorities for payments from the General Fund
and to prorate or defer certain payments.
(a) The results, projections, or estimates in this table reflect the enacted budget for the 2017-19 biennium (2017 Wisconsin Act 59) along with agency reestimates, and the estimated General Fund tax revenues included in the January 2018 LFB Report
and the June 2018 LFB Paper. This table does not include information from the November 2018 DOA Report. Temporary reallocations of cash are not included.
Source: Wisconsin Department of Administration
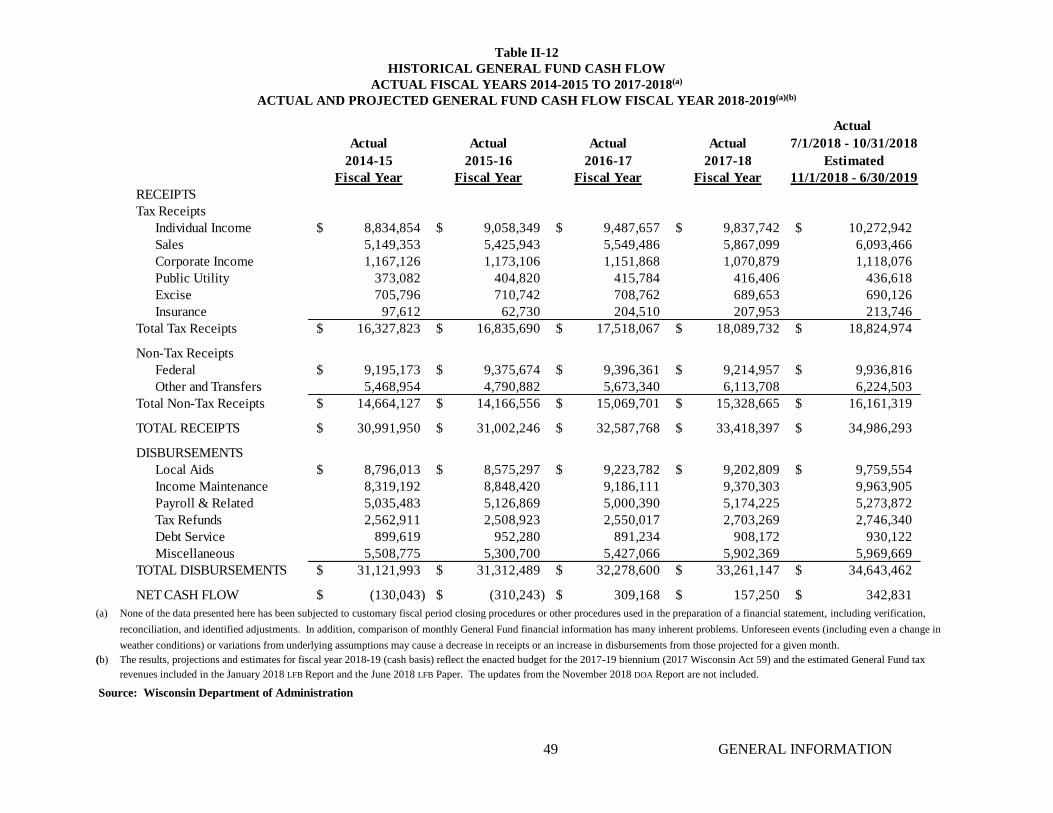
49 GENERAL INFORMATION
Table II-12
HISTORICAL GENERAL FUND CASH FLOW
ACTUAL FISCAL YEARS 2014-2015 TO 2017-2018(a)
ACTUAL AND PROJECTED GENERAL FUND CASH FLOW FISCAL YEAR 2018-2019(a)(b)
Actual
Actual Actual Actual Actual 7/1/2018 - 10/31/2018
2014-15 2015-16 2016-17 2017-18 Estimated
Fiscal Year Fiscal Year Fiscal Year Fiscal Year 11/1/2018 - 6/30/2019
RECEIPTS
Tax Receipts
Individual Income 8,834,854$ 9,058,349$ 9,487,657$ 9,837,742$ 10,272,942$
Sales 5,149,353 5,425,943 5,549,486 5,867,099 6,093,466
Corporate Income 1,167,126 1,173,106 1,151,868 1,070,879 1,118,076
Public Utility 373,082 404,820 415,784 416,406 436,618
Excise 705,796 710,742 708,762 689,653 690,126
Insurance 97,612 62,730 204,510 207,953 213,746
Total Tax Receipts 16,327,823$ 16,835,690$ 17,518,067$ 18,089,732$ 18,824,974$
Non-Tax Receipts
Federal 9,195,173$ 9,375,674$ 9,396,361$ 9,214,957$ 9,936,816$
Other and Transfers 5,468,954 4,790,882 5,673,340 6,113,708 6,224,503
Total Non-Tax Receipts 14,664,127$ 14,166,556$ 15,069,701$ 15,328,665$ 16,161,319$
TOTAL RECEIPTS 30,991,950$ 31,002,246$ 32,587,768$ 33,418,397$ 34,986,293$
DISBURSEMENTS
Local Aids 8,796,013$ 8,575,297$ 9,223,782$ 9,202,809$ 9,759,554$
Income Maintenance 8,319,192 8,848,420 9,186,111 9,370,303 9,963,905
Payroll & Related 5,035,483 5,126,869 5,000,390 5,174,225 5,273,872
Tax Refunds 2,562,911 2,508,923 2,550,017 2,703,269 2,746,340
Debt Service 899,619 952,280 891,234 908,172 930,122
Miscellaneous 5,508,775 5,300,700 5,427,066 5,902,369 5,969,669
TOTAL DISBURSEMENTS 31,121,993$ 31,312,489$ 32,278,600$ 33,261,147$ 34,643,462$
NET CASH FLOW (130,043)$ (310,243)$ 309,168$ 157,250$ 342,831$
(a) None of the data presented here has been subjected to customary fiscal period closing procedures or other procedures used in the preparation of a financial statement, including verification,
reconciliation, and identified adjustments. In addition, comparison of monthly General Fund financial information has many inherent problems. Unforeseen events (including even a change in
weather conditions) or variations from underlying assumptions may cause a decrease in receipts or an increase in disbursements from those projected for a given month.
(b) The results, projections and estimates for fiscal year 2018-19 (cash basis) reflect the enacted budget for the 2017-19 biennium (2017 Wisconsin Act 59) and the estimated General Fund tax
revenues included in the January 2018 LFB Report and the June 2018 LFB Paper. The updates from the November 2018 DOA Report are not included.
Source: Wisconsin Department of Administration

50 GENERAL INFORMATION
Table II-13
GENERAL FUND CASH RECEIPTS AND DISBURSEMENTS COMPARED TO ESTIMATES AND
PREVIOUS FISCAL YEAR(a)
(Cash Basis)
2016-17 Fiscal Year through June 30, 2017
Actual Actual(b)
Estimate(b)
Variance
Adjusted
Variance(c)
Difference
FY17 Actual to
FY18 Actual
RECEIPTS
Tax Receipts
Individual Income 9,487,657$ 9,837,742$ 9,703,549$ 134,193$ 134,193$ 350,085$
Sales 5,549,486 5,867,099 5,746,524 120,575 120,575 317,613
Corporate Income 1,151,868 1,070,879 1,203,062 (132,183) (132,183) (80,989)
Public Utility 415,784 416,406 424,737 (8,331) (8,331) 622
Excise 708,762 689,653 704,773 (15,120) (15,120) (19,109)
Insurance 204,510 207,953 208,978 (1,025) (1,025) 3,443
Total Tax Receipts 17,518,067$ 18,089,732$ 17,991,623$ 98,109$ 98,109$ 571,665$
Non-Tax Receipts
Federal 9,396,361$ 9,214,957$ 9,303,880$ (88,923)$ (88,923)$ (181,404)$
Other and Transfers 5,673,340 6,113,708 6,168,307 (54,599) (54,599) 440,368
Total Non-Tax Receipts 15,069,701$ 15,328,665$ 15,472,187$ (143,522)$ (143,522)$ 258,964$
TOTAL RECEIPTS 32,587,768$ 33,418,397$ 33,463,810$ (45,413)$ (45,413)$ 830,629$
DISBURSEMENTS
Local Aids 9,223,782$ 9,202,809$ 9,262,453$ 59,644$ 59,644$ (20,973)$
Income Maintenance 9,186,111 9,370,303 9,718,451 348,148 348,148 184,192
Payroll & Related 5,000,390 5,174,225 5,176,959 2,734 2,734 173,835
Tax Refunds 2,550,017 2,703,269 2,627,696 (75,573) (75,573) 153,252
Debt Service 891,234 908,172 1,034,140 125,968 125,968 16,938
Miscellaneous 5,427,066 5,902,369 5,646,393 (255,976) (255,976) 475,303
TOTAL DISBURSEMENTS 32,278,600$ 33,261,147$ 33,466,092$ 204,945$ 204,945$ 982,547$
2017-18 FISCAL YEAR VARIANCE YEAR-TO-DATE 159,532$ 159,532$
2017-18 Fiscal Year through June 30, 2018
(a) None of the data presented here has been subjected to customary fiscal period closing procedures or other procedures used in the
preparation of a financial statement, including verification, reconciliation, and identified adjustments. In addition, comparison of
monthly General Fund financial information has many inherent problems. Unforeseen events (including even a change in weather
conditions) or variations from underlying assumptions may cause a decrease in receipts or an increase in disbursements from
those projected for a given month.(b) The results in this table for the 2017-18 fiscal year reflect the budget bill for the 2017-19 biennium (2017 Wisconsin Act 59) and
the estimated General Fund tax revenues included in the January 2018 LFB Report and the June 2018 LFB Paper.(c) Changes are sometimes made after the beginning of the fiscal year to the projected revenues and disbursements. Depending on
when these changes occur, there are situations in which prior estimates cannot be changed, which may result in large variances.
This column includes adjustments to the variances, if any, to more accurately reflect the variance between the estimated and
actual amounts.
Source: Wisconsin Department of Administration

51 GENERAL INFORMATION
Table II-13—(Continued)
GENERAL FUND CASH RECEIPTS AND DISBURSEMENTS YEAR-TO-DATE
COMPARED TO ESTIMATES AND PREVIOUS FISCAL YEAR(a)
(Cash Basis)
As of October 31, 2018
2017-18 Fiscal Year through October 31, 2017
Actual Actual Estimate(b)
Variance
Adjusted
Variance(c)
Difference
FY18 Actual to
FY19 Actual
RECEIPTS
Tax Receipts
Individual Income 2,952,774$ 3,299,783$ 3,187,825$ 111,958$ 111,958$ 347,009$
Sales 2,076,006 2,173,637 2,131,082 42,555 42,555 97,631
Corporate Income 288,464 344,231 308,306 35,925 35,925 55,767
Public Utility 13,359 30,605 15,033 15,572 15,572 17,246
Excise 249,818 245,650 248,072 (2,422) (2,422) (4,168)
Insurance 43,656 44,698 44,377 321 321 1,042
Total Tax Receipts 5,624,077$ 6,138,604$ 5,934,695$ 203,909$ 203,909$ 514,527$
Non-Tax Receipts
Federal 3,155,968$ 3,679,217$ 3,300,199$ 379,018$ 379,018$ 523,249$
Other and Transfers 2,332,907 2,148,450 2,388,508 (240,058) (240,058) (184,457)
Total Non-Tax Receipts 5,488,875$ 5,827,667$ 5,688,707$ 138,960$ 138,960$ 338,792$
TOTAL RECEIPTS 11,112,952$ 11,966,271$ 11,623,402$ 342,869$ 342,869$ 853,319$
DISBURSEMENTS
Local Aids 2,420,534$ 2,629,240$ 2,664,484$ 35,244$ 35,244$ 208,706$
Income Maintenance 3,257,418 3,370,306 3,779,990 409,684 409,684 112,888
Payroll & Related 1,619,428 1,643,576 1,594,795 (48,781) (48,781) 24,148
Tax Refunds 407,891 445,195 413,974 (31,221) (31,221) 37,304
Debt Service 331,839 312,195 343,063 30,868 30,868 (19,644)
Miscellaneous 2,192,387 2,159,795 2,191,992 32,197 32,197 (32,592)
TOTAL DISBURSEMENTS 10,229,497$ 10,560,307$ 10,988,298$ 427,991$ 427,991$ 330,810$
2018-19 FISCAL YEAR VARIANCE YEAR-TO-DATE 770,860$ 770,860$
2018-19 Fiscal Year through October 31, 2018
(a) None of the data presented here has been subjected to customary fiscal period closing procedures or other procedures used in the
preparation of a financial statement, including verification, reconciliation, and identified adjustments. In addition, comparison of
monthly General Fund financial information has many inherent problems. Unforeseen events (including even a change in weather
conditions) or variations from underlying assumptions may cause a decrease in receipts or an increase in disbursements from
those projected for a given month.(b) The results, projections, and estimates in this table for the 2018-19 fiscal year reflect the budget bill for the 2017-19 biennium
(2017 Wisconsin Act 59) and the estimated General Fund tax revenues included in the January 2018 LFB Report and the June
2018 LFB Paper. The updates from the November 2018 DOA Report are not included.(c) Changes are sometimes made after the beginning of the fiscal year to the projected revenues and disbursements. Depending on
when these changes occur, there are situations in which prior estimates cannot be changed, which may result in large variances.
This column includes adjustments to the variances, if any, to more accurately reflect the variance between the estimated and
actual amounts.
Source: Wisconsin Department of Administration

52 GENERAL INFORMATION
Table II-14
GENERAL FUND MONTHLY CASH POSITION(a)
July 1, 2016 through October 31, 2018 ⎯ Actual(b)
November 1, 2018 through June 30, 2019 ⎯ Estimated(b)
(Amounts in Thousands)
Starting Date Starting Balance Receipts(c)
Disbursements(c)
2016 July.................……………………….1,060,311$ (d) 2,365,368$ 3,571,989$
August...................…………………….(146,310) (d) 2,845,854 1,880,719
September.........…………………………..818,825 3,071,017 2,764,312
October.................……………………………1,125,530 2,530,074 1,751,982
November....................……………………..1,903,622 2,421,948 2,592,643
December.....................………………………..1,732,927 2,589,461 3,045,467
2017 January....................……………………….1,276,921 2,942,209 1,808,524
February.............………………………….2,410,606 2,721,016 2,857,261
March..................…………………………..2,274,361 2,688,376 3,934,216
April........................………………………1,028,521 2,832,722 2,591,412
May..........................………………………….1,269,831 2,581,512 2,004,233
June..........................…………………….1,847,110 2,998,211 3,475,842
July.................……………………….1,369,479 2,817,598 3,503,499
August...................…………………….683,578 (d) 2,213,505 2,122,310
September.........…………………………..774,773 3,066,043 2,709,334
October.................……………………………1,131,482 3,015,806 1,894,354
November....................……………………..2,252,934 2,447,851 2,621,739
December.....................………………………..2,079,046 2,643,697 3,169,822
2018 January....................……………………….1,552,921 3,275,821 1,883,523
February.............………………………….2,945,219 2,867,326 2,880,688
March..................…………………………..2,931,857 2,419,631 4,221,851
April........................………………………1,129,637 3,381,659 2,728,707
May..........................………………………….1,782,589 2,751,853 1,927,755
June..........................…………………….2,606,687 2,517,607 3,597,565
July.................……………………….1,526,729 3,008,353 3,784,639
August...................…………………….750,443 2,543,464 2,223,489
September.........…………………………..1,070,418 3,391,628 2,607,829
October.................……………………………1,854,217 3,022,826 1,944,350
November....................……………………..2,932,693 2,548,410 2,954,552
December.....................………………………..2,526,551 2,762,471 3,125,004
2019 January....................……………………….2,164,018 3,248,475 2,119,594
February.............………………………….3,292,899 2,923,734 3,046,328
March..................…………………………..3,170,305 2,512,487 4,132,610
April........................………………………1,550,182 3,447,020 2,891,174
May..........................………………………….2,106,029 2,697,320 2,383,389
June..........................…………………….2,419,960 2,880,105 3,430,505 (a) The General Fund balances presented in this table are not based on generally accepted accounting principles (GAAP).(b) The results for the 2017-18 fiscal year and results and the projections and estimates for the 2018-19 fiscal year reflect the
enacted budget for the 2017-19 biennium (2017 Wisconsin Act 59) and the estimated General Fund tax revenues included in the January 2018 LFB Report and the June 2018 LFB Paper. The updates from the November 2018 DOA
Report are not included. (c) Operating notes were not issued for the 2016-17 or 2017-18 fiscal years. It is not anticipated that operating notes will
be issued for the 2018-19 fiscal year.(d) At some period during this month, the General Fund was in a negative cash position. The Wisconsin Statutes provide
certain administrative remedies for periods when the General Fund is in a negative cash position. The Secretary of Administration may temporarily reallocate cash in other funds to the General Fund up to 9% of the total general purpose revenue appropriations then in effect (approximately $1.519 billion in the 2017-18 fiscal year and approximately $1.592 billion in the 2018-19 fiscal year) and may also temporarily reallocate an additional amount of up to 3% of total general purpose revenue appropriations in effect (approximately $506 million in the 2017-18 fiscal year and $531 million in the 2018-19 fiscal year) for a period of up to 30 days. If the amount available for temporary reallocation to the General Fund is insufficient, then the Secretary of Administration is authorized to set priorities for payments from the General Fund and to prorate and defer certain payments.
Source: Wisconsin Department of Administration

53 GENERAL INFORMATION
Table II-15
CASH BALANCES IN FUNDS AVAILABLE FOR TEMPORARY REALLOCATION(a)(b)
July 31, 2016 to October 31, 2018 — Actual(c)
November 30, 2018 to June 30, 2019 — Estimated(c)
(Amounts in Millions)
The following two tables show, the monthly cash balances available for temporary reallocation. The first table does not include
balances in the LGIP, and the second table does include such balances. Though the LGIP is available for temporary reallocation,
funds in the LGIP are deposited and withdrawn by local units of government and thus are outside the control of the State. The
monthly average daily balances in the LGIP for the past five years have ranged from a low of $2.19 billion during November 2014
to a high of $3.98 billion in August 2018. The Secretary of Administration may not exercise the authority to make temporary
reallocation if doing so would jeopardize the cash flow of any fund or account from which the temporary reallocation would be
made.
Available Balances; Does Not Include Balances in the LGIP
Month (Last Day) 2016 2017 2018 2019
January $1,442 $1,548 $1,548
February 1,305 1,620 1,620
March 1,356 1,633 1,633
April 1,302 1,681 1,681
May 1,361 1,403 1,403
June 1,289 1,507
1,383df;ajdsf
io;ajsdfijsaio
j
1,507
1,383df;ajds
fio;ajsdfijsai
oj
July 1,597 1,388 1,383
August 1,481 1,464 1,429
September 1,622 1,624 1,524
October 1,420 1,531 1,304
November 1,390 1,444 1,444
December 1,683 1,592 1,592
Available Balances; Includes Balances in the LGIP
Month (Last Day) 2016 2017 2018 2019
January $5,115 $5,205 $5,205
February 5,050 5,457 5,457
March 5,289 5,699 5,699
April 4,901 5,462 5,462
May 4,600 4,906 4,906
June 4,461 5,028 5,028
July 5,803 5,461 5,781
August 4,750 4,762 5,058
September 4,663 4,865 4,670
October 4,292 4,624 4,103
November 4,120 4,256 4,256
December 4,902 4,761 4,761
(a) None of the data presented here has been subjected to customary fiscal period closing procedures or other procedures used in the preparation of a financial
statement, including verification, reconciliation, and identified adjustments. In addition, comparison of monthly General Fund financial information has many
inherent problems. Unforeseen events (including even a change in weather conditions) or variations from underlying assumptions may cause a decrease in
receipts or an increase in disbursements from those projected for a given month.
(b) The amounts shown reflect a reduction in the aggregate cash balances available to the extent any fund had a negative balance and temporary reallocations were
made from such fund.
(c) The results for the 2017-18 fiscal years reflect the enacted budget reflect 2017 Wisconsin Act 59 and the January 2018 LFB Report. The results and projections
for the 2018-19 fiscal year reflect 2017 Wisconsin Act 59 and the January 2018 LFB Report, but do not reflect the June 2018 LFB Paper and November 2018 DOA
Report.
Source: Wisconsin Department of Administration
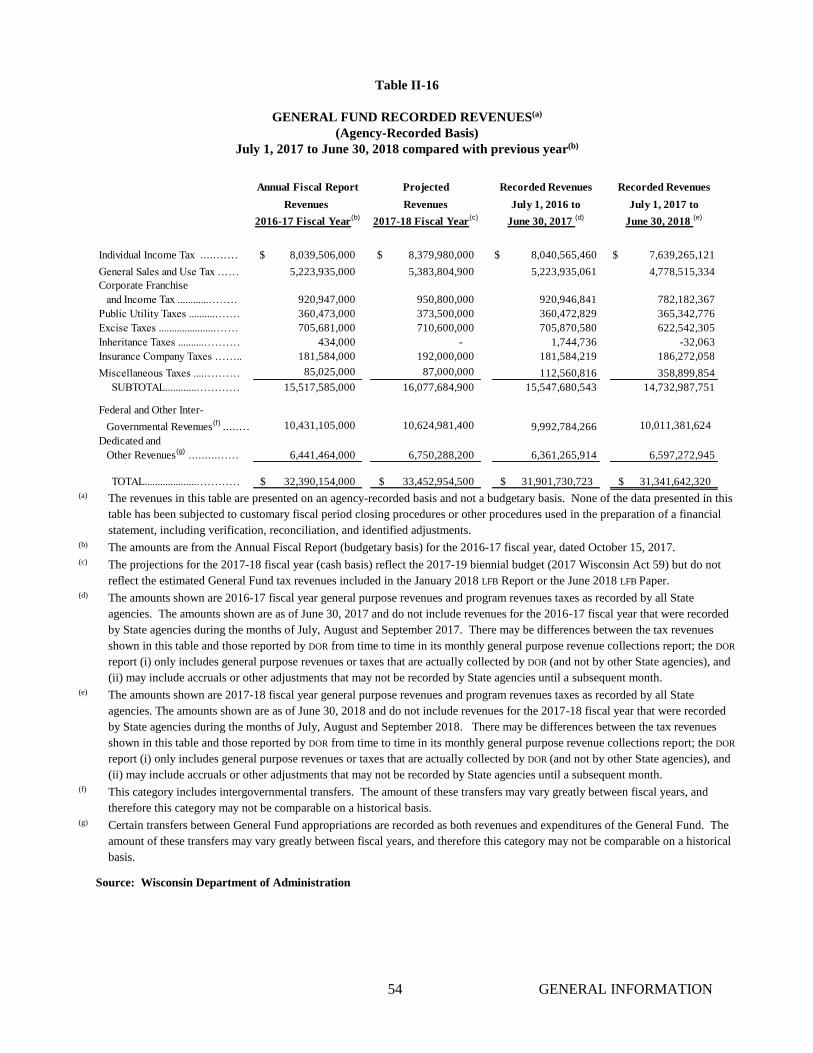
54 GENERAL INFORMATION
Table II-16
GENERAL FUND RECORDED REVENUES(a)
(Agency-Recorded Basis)
July 1, 2017 to June 30, 2018 compared with previous year(b)
Annual Fiscal Report Projected Recorded Revenues Recorded Revenues
Revenues Revenues July 1, 2016 to July 1, 2017 to
2016-17 Fiscal Year(b)
2017-18 Fiscal Year(c)
June 30, 2017 (d)
June 30, 2018 (e)
Individual Income Tax .....……… 8,039,506,000$ 8,379,980,000$ 8,040,565,460$ 7,639,265,121$
General Sales and Use Tax …….. 5,223,935,000 5,383,804,900 5,223,935,061 4,778,515,334
Corporate Franchise
and Income Tax ............……….. 920,947,000 950,800,000 920,946,841 782,182,367
Public Utility Taxes ..........………. 360,473,000 373,500,000 360,472,829 365,342,776
Excise Taxes .....................……….. 705,681,000 710,600,000 705,870,580 622,542,305
Inheritance Taxes ..........…………. 434,000 - 1,744,736 -32,063
Insurance Company Taxes …….. 181,584,000 192,000,000 181,584,219 186,272,058
Miscellaneous Taxes ....………… 85,025,000 87,000,000 112,560,816 358,899,854
SUBTOTAL............…………… 15,517,585,000 16,077,684,900 15,547,680,543 14,732,987,751
Federal and Other Inter-
Governmental Revenues(f)
.....… 10,431,105,000 10,624,981,400 9,992,784,266 10,011,381,624
Dedicated and
Other Revenues(g)
..........……… 6,441,464,000 6,750,288,200 6,361,265,914 6,597,272,945
TOTAL....................……………………32,390,154,000$ 33,452,954,500$ 31,901,730,723$ 31,341,642,320$
(a) The revenues in this table are presented on an agency-recorded basis and not a budgetary basis. None of the data presented in this
table has been subjected to customary fiscal period closing procedures or other procedures used in the preparation of a financial
statement, including verification, reconciliation, and identified adjustments.(b) The amounts are from the Annual Fiscal Report (budgetary basis) for the 2016-17 fiscal year, dated October 15, 2017.(c) The projections for the 2017-18 fiscal year (cash basis) reflect the 2017-19 biennial budget (2017 Wisconsin Act 59) but do not
reflect the estimated General Fund tax revenues included in the January 2018 LFB Report or the June 2018 LFB Paper.(d) The amounts shown are 2016-17 fiscal year general purpose revenues and program revenues taxes as recorded by all State
agencies. The amounts shown are as of June 30, 2017 and do not include revenues for the 2016-17 fiscal year that were recorded
by State agencies during the months of July, August and September 2017. There may be differences between the tax revenues
shown in this table and those reported by DOR from time to time in its monthly general purpose revenue collections report; the DOR
report (i) only includes general purpose revenues or taxes that are actually collected by DOR (and not by other State agencies), and
(ii) may include accruals or other adjustments that may not be recorded by State agencies until a subsequent month.(e) The amounts shown are 2017-18 fiscal year general purpose revenues and program revenues taxes as recorded by all State
agencies. The amounts shown are as of June 30, 2018 and do not include revenues for the 2017-18 fiscal year that were recorded
by State agencies during the months of July, August and September 2018. There may be differences between the tax revenues
shown in this table and those reported by DOR from time to time in its monthly general purpose revenue collections report; the DOR
report (i) only includes general purpose revenues or taxes that are actually collected by DOR (and not by other State agencies), and
(ii) may include accruals or other adjustments that may not be recorded by State agencies until a subsequent month.(f) This category includes intergovernmental transfers. The amount of these transfers may vary greatly between fiscal years, and
therefore this category may not be comparable on a historical basis.(g) Certain transfers between General Fund appropriations are recorded as both revenues and expenditures of the General Fund. The
amount of these transfers may vary greatly between fiscal years, and therefore this category may not be comparable on a historical
basis.
Source: Wisconsin Department of Administration

55 GENERAL INFORMATION
Table II-16—(Continued)
GENERAL FUND RECORDED REVENUES(a)
(Agency-Recorded Basis)
July 1, 2018 to October 31, 2018 compared with previous year(b)
Annual Fiscal Report Projected Recorded Revenues Recorded Revenues
Revenues Revenues July 1, 2017 to July 1, 2018 to
2017-18 Fiscal Year(b)
2018-19 Fiscal Year(c)
October 31, 2017 (d)
October 31, 2018 (e)
Individual Income Tax .....……… 8,479,150,000$ 8,719,966,000$ 2,367,641,328$ 2,509,261,967$
General Sales and Use Tax …….. 5,448,118,000 5,593,136,900 1,395,237,652 1,467,948,511
Corporate Franchise
and Income Tax ............……….. 893,892,000 961,795,000 193,804,842 266,454,190
Public Utility Taxes ..........………. 365,343,000 378,200,000 9,920,120 30,714,732
Excise Taxes .....................……….. 679,979,000 710,200,000 184,696,911 185,740,284
Inheritance Taxes ..........…………. (33,000) - -4,526 1,554
Insurance Company Taxes …….. 186,273,000 197,000,000 43,655,157 44,388,273
Miscellaneous Taxes ....………… 91,445,000 90,000,000 66,296,480 70,904,202
SUBTOTAL............…………… 16,144,167,000 16,650,297,900 4,261,247,965 4,575,413,713
Federal and Other Inter-
Governmental Revenues(f)
.....… 10,121,722,000 11,001,150,100 3,348,919,907 3,570,363,373
Dedicated and
Other Revenues(g)
..........……… 6,584,552,000 7,122,266,500 2,298,701,309 2,426,431,877
TOTAL....................……………………32,850,441,000$ 34,773,714,500$ 9,908,869,181$ 10,572,208,964$
(a) The revenues in this table are presented on an agency-recorded basis and not a budgetary basis. None of the data presented in this
table has been subjected to customary fiscal period closing procedures or other procedures used in the preparation of a financial
statement, including verification, reconciliation, and identified adjustments.(b) The amounts are from the restated Annual Fiscal Report (budgetary basis) for the 2017-18 fiscal year, dated October 15, 2018(c) The estimates in this table for the 2018-19 fiscal year (cash basis) reflect the enacted budget for the 2017-19 biennial budget (2017
Wisconsin Act 59) but do not include estimated General Fund tax revenues included in the January 2018 LFB Report, the June 2018
LFB Paper, or the November 2018 DOA Report.(d) The amounts shown are 2017-18 fiscal year general purpose revenues and program revenues taxes as recorded by all State
agencies. There may be differences between the tax revenues shown in this table and those reported by DOR from time to time in its
monthly general purpose revenue collections report; the DOR report (i) only includes general purpose revenues or taxes that are
actually collected by DOR (and not by other State agencies), and (ii) may include accruals or other adjustments that may not be
recorded by State agencies until a subsequent month.(e) The amounts shown are 2018-19 fiscal year general purpose revenues and program revenues taxes as recorded by all State
agencies. There may be differences between the tax revenues shown in this table and those reported by DOR from time to time in its
monthly general purpose revenue collections report; the DOR report (i) only includes general purpose revenues or taxes that are
actually collected by DOR (and not by other State agencies), and (ii) may include accruals or other adjustments that may not be
recorded by State agencies until a subsequent month.(f) This category includes intergovernmental transfers. The amount of these transfers may vary greatly between fiscal years, and
therefore this category may not be comparable on a historical basis.(g) Certain transfers between General Fund appropriations are recorded as both revenues and expenditures of the General Fund. The
amount of these transfers may vary greatly between fiscal years, and therefore this category may not be comparable on a historical
basis.
Source: Wisconsin Department of Administration

56 GENERAL INFORMATION
Table II-17
GENERAL FUND RECORDED EXPENDITURES BY FUNCTION(a)
(Agency-Recorded Basis)
July 1, 2017 to June 30, 2018 compared with previous year(b)
Recorded Recorded
Annual Fiscal Report Expenditures Expenditures
Expenditures Appropriations July 1, 2016 to July 1, 2017 to
2016-17 Fiscal Year(b)
2017-18 Fiscal Year(c)
June 30, 2017 (d)
June 30, 2018 (e)
Commerce...............................………………. 209,017,000$ 200,578,100$ 315,564,675$ 190,985,133$
Education................................……………….. 13,368,786,000 13,706,059,200 13,393,301,710 13,565,818,294
Environmental Resources.......…………………. 320,463,000 339,979,600 321,530,203 321,655,350
Human Relations & Resources ……………………14,343,401,000 14,341,728,400 14,382,568,082 14,683,789,502
General Executive..................………………….. 1,075,321,000 1,146,065,800 1,090,842,210 1,052,080,868
Judicial....................................………………….. 139,027,000 144,250,300 139,030,432 139,022,323
Legislative...............................………………………. 68,575,000 76,520,900 68,575,061 68,581,318
General Appropriations..........…………………….. 2,367,075,000 2,560,816,600 2,417,589,191 2,552,205,862
TOTAL.......…………………………………..31,891,665,000$ 32,515,998,900$ 32,129,001,565$ 32,574,138,650$
(a) The expenditures in this table are presented on an agency-recorded basis and not a budgetary basis. None of the data presented
in this table has been subjected to customary fiscal period closing procedures or other procedures used in the preparation of a
financial statement, including verification, reconciliation, and identified adjustments.(b) The amounts are from the Annual Fiscal Report (budgetary basis) for the 2016-17 fiscal year, dated October 15, 2017.(c) The estimates and projections for the 2017-18 fiscal year (cash basis) reflect the 2017-19 biennial budget (2017 Wisconsin Act 59),
but do not include revisions provided in the January 2018 LFB Report or the June 2018 LFB Paper.(d) The amounts shown are 2016-17 fiscal year expenditures as recorded by all State agencies. The amounts shown are as of June 30,
2017 and do not include expenditures for the 2016-17 fiscal year that were recorded by State agencies during the months of July,
August and September 2017.(e) The amounts shown are 2017-18 fiscal year expenditures as recorded by all State agencies. The amounts shown are as of June 30,
2018 and do not include expenditures for the 2017-18 fiscal year that were recorded by State agencies during the months of July,
August and September 2018.
Source: Wisconsin Department of Administration
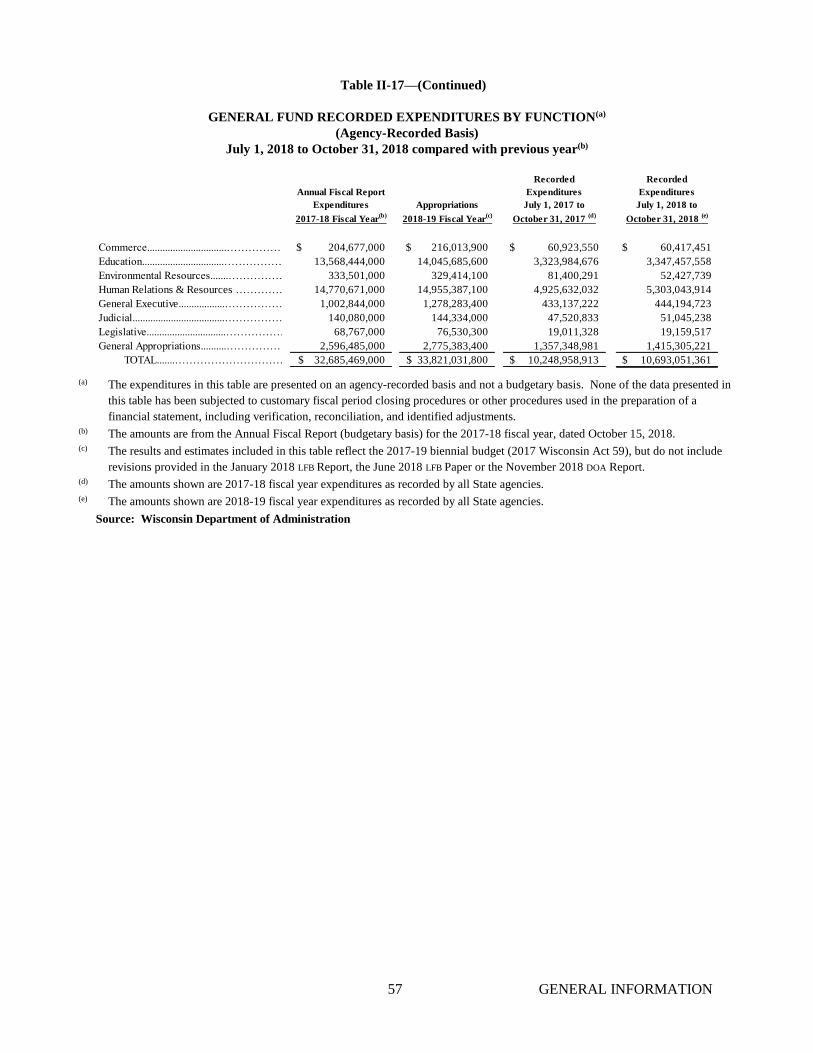
57 GENERAL INFORMATION
Table II-17—(Continued)
GENERAL FUND RECORDED EXPENDITURES BY FUNCTION(a)
(Agency-Recorded Basis)
July 1, 2018 to October 31, 2018 compared with previous year(b)
Recorded Recorded
Annual Fiscal Report Expenditures Expenditures
Expenditures Appropriations July 1, 2017 to July 1, 2018 to
2017-18 Fiscal Year(b)
2018-19 Fiscal Year(c)
October 31, 2017 (d)
October 31, 2018 (e)
Commerce...............................………………. 204,677,000$ 216,013,900$ 60,923,550$ 60,417,451$
Education................................……………….. 13,568,444,000 14,045,685,600 3,323,984,676 3,347,457,558
Environmental Resources.......…………………. 333,501,000 329,414,100 81,400,291 52,427,739
Human Relations & Resources ……………………14,770,671,000 14,955,387,100 4,925,632,032 5,303,043,914
General Executive..................………………….. 1,002,844,000 1,278,283,400 433,137,222 444,194,723
Judicial....................................………………….. 140,080,000 144,334,000 47,520,833 51,045,238
Legislative...............................………………………. 68,767,000 76,530,300 19,011,328 19,159,517
General Appropriations..........…………………….. 2,596,485,000 2,775,383,400 1,357,348,981 1,415,305,221
TOTAL.......…………………………………..32,685,469,000$ 33,821,031,800$ 10,248,958,913$ 10,693,051,361$
(a) The expenditures in this table are presented on an agency-recorded basis and not a budgetary basis. None of the data presented in
this table has been subjected to customary fiscal period closing procedures or other procedures used in the preparation of a
financial statement, including verification, reconciliation, and identified adjustments.(b) The amounts are from the Annual Fiscal Report (budgetary basis) for the 2017-18 fiscal year, dated October 15, 2018.(c) The results and estimates included in this table reflect the 2017-19 biennial budget (2017 Wisconsin Act 59), but do not include
revisions provided in the January 2018 LFB Report, the June 2018 LFB Paper or the November 2018 DOA Report.(d) The amounts shown are 2017-18 fiscal year expenditures as recorded by all State agencies.(e) The amounts shown are 2018-19 fiscal year expenditures as recorded by all State agencies.
Source: Wisconsin Department of Administration
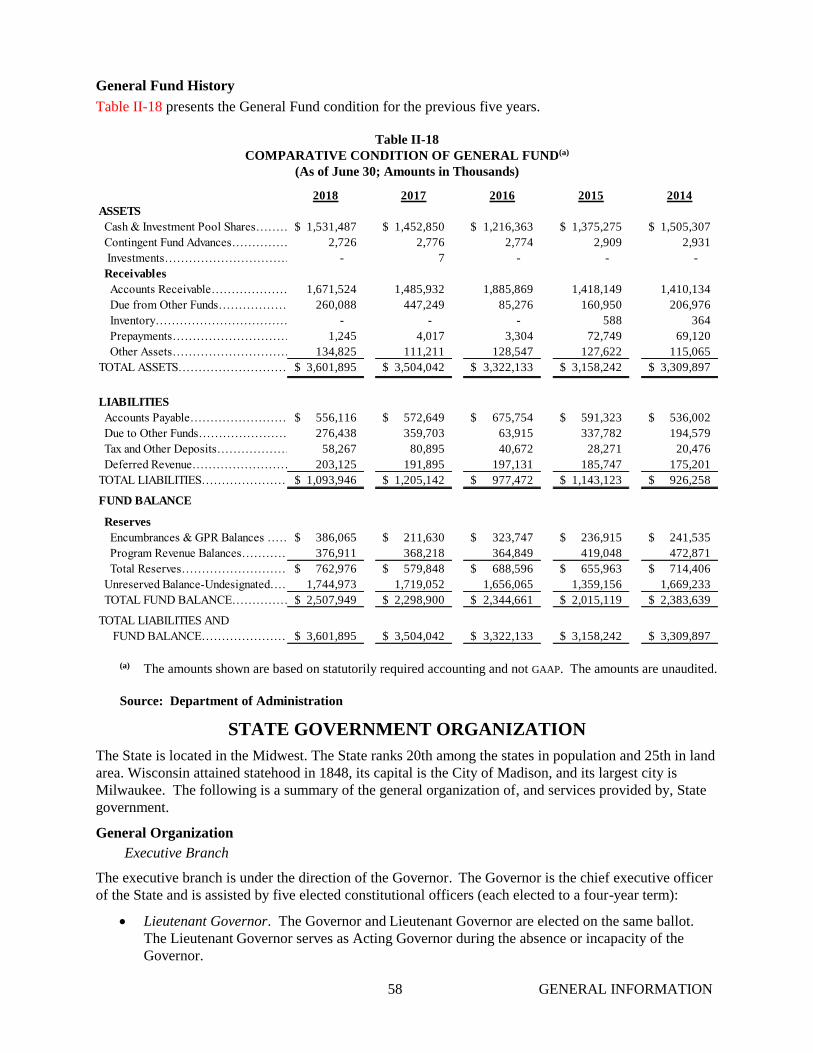
58 GENERAL INFORMATION
General Fund History
Table II-18 presents the General Fund condition for the previous five years.
Table II-18
COMPARATIVE CONDITION OF GENERAL FUND(a)
(As of June 30; Amounts in Thousands)
2018 2017 2016 2015 2014
ASSETS
Cash & Investment Pool Shares………………….1,531,487$ 1,452,850$ 1,216,363$ 1,375,275$ 1,505,307$
Contingent Fund Advances…………………………………..2,726 2,776 2,774 2,909 2,931
Investments………………………………….. - 7 - - -
Receivables
Accounts Receivable…………………………………………1,671,524 1,485,932 1,885,869 1,418,149 1,410,134
Due from Other Funds…………………………260,088 447,249 85,276 160,950 206,976
Inventory………………………………… - - - 588 364
Prepayments……………………………………1,245 4,017 3,304 72,749 69,120
Other Assets……………………………………134,825 111,211 128,547 127,622 115,065
TOTAL ASSETS………………………………….3,601,895$ 3,504,042$ 3,322,133$ 3,158,242$ 3,309,897$
LIABILITIES
Accounts Payable……………………………………556,116$ 572,649$ 675,754$ 591,323$ 536,002$
Due to Other Funds…………………………………………….276,438 359,703 63,915 337,782 194,579
Tax and Other Deposits………………………………58,267 80,895 40,672 28,271 20,476
Deferred Revenue………………………………….203,125 191,895 197,131 185,747 175,201
TOTAL LIABILITIES…………………………………1,093,946$ 1,205,142$ 977,472$ 1,143,123$ 926,258$
FUND BALANCE
Reserves
Encumbrances & GPR Balances ………………………………..386,065$ 211,630$ 323,747$ 236,915$ 241,535$
Program Revenue Balances………………………….376,911 368,218 364,849 419,048 472,871
Total Reserves………………………………………762,976$ 579,848$ 688,596$ 655,963$ 714,406$
Unreserved Balance-Undesignated…………………………….1,744,973 1,719,052 1,656,065 1,359,156 1,669,233
TOTAL FUND BALANCE…………………………….2,507,949$ 2,298,900$ 2,344,661$ 2,015,119$ 2,383,639$
TOTAL LIABILITIES AND
FUND BALANCE………………………………………..3,601,895$ 3,504,042$ 3,322,133$ 3,158,242$ 3,309,897$
(a) The amounts shown are based on statutorily required accounting and not GAAP. The amounts are unaudited.
Source: Department of Administration
STATE GOVERNMENT ORGANIZATION
The State is located in the Midwest. The State ranks 20th among the states in population and 25th in land
area. Wisconsin attained statehood in 1848, its capital is the City of Madison, and its largest city is
Milwaukee. The following is a summary of the general organization of, and services provided by, State
government.
General Organization
Executive Branch
The executive branch is under the direction of the Governor. The Governor is the chief executive officer
of the State and is assisted by five elected constitutional officers (each elected to a four-year term):
• Lieutenant Governor. The Governor and Lieutenant Governor are elected on the same ballot.
The Lieutenant Governor serves as Acting Governor during the absence or incapacity of the
Governor.
59 GENERAL INFORMATION
• Attorney General. The Attorney General heads the State of Wisconsin Department of Justice,
which provides all State agencies with legal advice and counsel.
• State Treasurer. The State Treasurer participates in the promotion of the State’s unclaimed
property program administered by the Department of Revenue, and signs certain checks and
other financial instruments.
• Secretary of State. The Secretary of State keeps a record of the official acts of the Legislature
and executive agencies.
• Superintendent of Public Instruction. The Superintendent of Public Instruction heads the State of
Wisconsin Department of Public Instruction, which supervises the operations of and establishes
standards for schools throughout the State. Governor-elect Evers is expected to appoint a new
Superintendent after his inauguration on January 7, 2019.
The executive branch consists of 17 departments (including two headed by other constitutional officers),
11 independent agencies, and numerous other authorities.
Legislative Branch
The legislative branch consists of the Legislature and its subordinate service agencies. The Legislature is
bicameral, composed of the Senate and the Assembly. The 33 members of the Senate serve staggered
four-year terms, and the 99 members of the Assembly serve identical two-year terms. Both the Senate
and the Assembly operate on a committee system. The Legislature’s biennial session begins in odd-
numbered years on the first Monday in January (or January 3rd if the first Monday is January 1st or
January 2nd). By a joint resolution, the biennial session is divided into floor periods interspersed with
committee work periods. In odd-numbered years, the Joint Committee on Legislative Organization
develops a schedule for the two-year period. The Legislature also meets in special session when so called
by the Governor and in extraordinary session when a majority from each branch signs a petition; at these
times the Legislature may transact only that business for which the special or extraordinary session is
called.
Judicial Branch
The judicial branch consists of:
• Supreme Court. The Supreme Court is composed of seven justices who are elected statewide for
staggered ten-year terms.
• Court of Appeals. The Court of Appeals is composed of 16 judges who are elected district-wide
for staggered six-year terms, generally sitting in three-judge panels.
• Circuit Courts. There are 69 Circuit Courts (the State’s trial courts). Each has one or more
branches and judges who are locally elected for six-year terms, and all are administered from ten
judicial districts.
The State pays all costs of the Supreme Court and Court of Appeals and certain costs of the Circuit
Courts.
Description of Services Provided by State Government
The State provides a wide range of services to its residents and to its local government units. These
services are organized for both budgetary and financial reporting of the General Fund into eight
functional groupings. Each State agency is categorized into one or more of these functions. There are
some agency activities that fit into more than one function. Listed below is a description of each
function, an identification of those State agencies and boards within each function, and a brief summary
of the responsibilities of each State agency.
60 GENERAL INFORMATION
Commerce
The State’s involvement in the commerce function is in the regulation of conduct of commercial
transactions. The objective is to protect the public as consumers of agricultural and manufactured goods
and services and as participants in financial transactions. The State also actively promotes economic
development by working with companies seeking to expand or move to the State and broadening markets
for State goods and services. These objectives are met in several ways:
• Inspection of raw products and conditions under which they are grown or obtained, including
conducting research in areas such as animal or plant diseases, grading of products, and
establishing standards for contents of processed foods.
• Licensing of members of various trades and professions whose activities affect the health of
individuals, such as doctors and nurses, or whose actions are considered important for public
safety, such as architects and engineers.
• Maintaining an orderly market in which to conduct business and specifying methods of fair
competition by:
❑ regulating the rates that public utilities may charge for their services
❑ setting standards for the operation of banks, savings and loan companies, and credit
unions to protect depositors
❑ regulating the sale of securities and insurance offered for sale in the State
❑ approving or disapproving the establishment or discontinuance of transportation
routes
Several State agencies participate in the field of commerce:
• Department of Agriculture, Trade and Consumer Protection provides consumer protection and
regulates the conditions of the growth and processing of food and fair trade practices in general.
• Department of Safety and Professional Services supervises a variety of examining boards in
various trades and professions and promotes industrial development.
• Department of Financial Institutions regulates securities transactions and supervises State-
chartered banks, credit unions, and savings and loans. The department also administers the
State’s Section 529 College Savings Plans. Further information about these Section 529 College
Savings Plans can be found at www.edvest.com or www.tomorrowsscholar.com or from
[email protected]. These sites and materials are not incorporated into, nor are they a part of, the
2018 Annual Report.
• Public Service Commission regulates the rates and services offered by railroad companies and
heat, light, power, and water companies. The commission also awards grants for expansion of
broadband services to underserved areas of the State.
• Department of Tourism promotes the State’s many attributes to visitors.
The Wisconsin Economic Development Corporation was created in 2011 to develop and implement
economic and business development programs in the State. Prior to 2011, the Wisconsin Department of
Commerce provided economic development services. The Wisconsin Economic Development
Corporation is a public body corporate and politic with a 14-member board of directors, whose chief
executive officer is appointed by the Governor, and receives appropriations from the State to fund its
activities. 2017 Wisconsin Act 369 was signed into law on December 14, 2018 and increases the
membership of the board of directors to 18 members, with the additional four members being legislative
appointments. 2017 Wisconsin Act 369 also specifies that the board of directors would appoint the chief
executive officer, but that provision would not apply after September 1, 2019.

61 GENERAL INFORMATION
Education
The State views its responsibilities in education to encompass all levels, and nearly all types, of
education and related activities. As a result the State provides significant financial support to primary and
secondary schools, and technical colleges operated at the local level, assists private higher educational
institutions, and operates the University of Wisconsin System.
• Primary and Secondary Schools. There were 422 school districts in the State for the 2017-18
school year, which administer the elementary and secondary schools within those districts. There
were approximately 855,329 students attending public elementary and secondary schools in the
2017-18 school year. Elementary and secondary schools are operated by district boards, with
supervision of the system provided by the Department of Public Instruction.
• Technical Colleges. The State is divided into 16 technical college districts. In the 2017-18
academic year, 314,835 full- and part-time students were enrolled in the technical college
system. The technical colleges are operated by district boards, with supervision of the system
provided by the Technical College System Board.
• University of Wisconsin System. The University of Wisconsin (UW) System consists of its
doctoral campus in Madison (the largest campus in the State), its doctoral campus in Milwaukee,
11 other four-year degree-granting institutions, 13 two-year colleges, and the UW Extension. The
system is joining the two-year colleges with seven of the system’s doctoral and four-year
institutions, and placing the UW Extension under the administrative purview of UW-Madison.
This restructuring is expected to be completed in 2020. The UW System’s total enrollment in
2017-18 was 174,516 students.
Other agencies and boards concerned with the education function of the State include the Educational
Communications Board (which operates the State public radio network, the State public television
network, and the State educational television network), the State Historical Society, and the Higher
Educational Aids Board (which manages and oversees of the State’s student financial aid system for
residents attending institutions of higher education).
Environmental Resources and Transportation
Two major State agencies, the Department of Transportation and the Department of Natural Resources,
are concerned with the development of transportation resources, and the protection of the land, forests,
water, air, wildlife, and minerals of the State while promoting a healthy, sustainable environment.
The State works with municipal and industrial operations discharging wastewater to surface or
groundwater to retain the purity of State lakes and streams and ensure quality groundwater for families,
businesses, customers, and the community. The State also sets standards of air quality at a level that will
provide adequate protection to public health and welfare, and prevent detrimental effects on property and
our environment. Parks and forests have been established and are maintained both to preserve unusual
phenomena of nature and to provide the public with recreational and educational opportunities. Private
forest owners are given incentives to observe scientific conservation practices so that new growth may
replace cut timber. Hunting and fishing limits are set, and hunters and anglers licensed, to preserve the
fish and wildlife from extinctive practices. Farming methods that preserve the quality and stability of the
soil are encouraged.
Governmental activities for preserving and protecting the State’s natural resources are largely the
province of the Department of Natural Resources, but the Department of Agriculture, Trade and
Consumer Protection is also actively involved.
The State has an elaborate system of highways. It consists of interstate highways financed from Federal
and State funds and of State highways, county trunk highways, town roads, city and village streets, and
park and forest roads. Closely connected with the highway building functions of the State government
and the aid granted to local units for streets and highways are the objects for which these roads are

62 GENERAL INFORMATION
built—the motor vehicle and its occupants. While the State is concerned with the building and
maintenance of an adequate number of roads of certain standards to meet the traffic demands, it is also
concerned with the safety and convenience of the people who are using those roads. Over 6.5 million
vehicles are currently registered.
The Department of Transportation also gives various forms of driver examination tests when driver
licenses are issued or renewed to ensure drivers know the laws, are physically fit to drive, and have the
required driving skills. Road building and motor vehicle regulation are also responsibilities of the
Department of Transportation, which also has charge of the State’s aeronautical activities, the
administration of funds to assist mass transit, railroad preservation, and intermodal transportation
planning.
Human Relations and Resources
Various State agencies have responsibilities to maximize human growth and development, including
health, living standards, safety, and working relationships with each other.
Public health covers the prevention and detection of disease, health education programs, assistance in
hospital construction, maintenance of institutions for the care and treatment of the mentally handicapped,
the setting of standards of cleanliness of public facilities and safety in construction, and the maintenance
of public health records.
Improving living standards for needy, aged, handicapped, and minors in need of assistance is also a goal
of the State. Such health and welfare activities are primarily the work of the Department of Health
Services, including the State’s BadgerCare Plus Program, which provides health insurance coverage for
all children under the age of 19 (regardless of income) and low-income adults, and a prescription drug
program for the elderly. With respect to the Patient Protection and Affordable Care Act, the State has
notified the U.S. Department of Health and Human Services that the State will not build a state-based
health insurance exchange and will defer to the Federal Government’s insurance exchange.
The Board of Aging and Long-Term Care makes recommendations on programs to benefit the aged and
those individuals needing long term care services. The Department of Veterans Affairs operates
additional assistance programs for military service veterans.
As a worker, the individual comes in contact with the State in many ways, mostly through the
Department of Workforce Development:
• Minimum wages and maximum hours are set by law.
• State worker’s compensation provides financial assistance if a worker is injured on the job.
• Unemployment compensation is provided to the worker if the worker’s job is lost.
• Employment services are provided by the State (in partnership with the Federal Government) to
help a worker find a job or to acquire the skills necessary for employment.
• Investigation of discrimination occurs if a worker suspects employment discrimination based on
race, age, gender, creed, or handicap.
The State mediates or arbitrates labor disputes between workers and their employers, which is the task of
the Employment Relations Commission. The State’s agent in protecting and assisting the worker is the
Department of Workforce Development, which is also currently responsible for the State’s employment
and training services.
The Department of Children and Families focuses exclusively on helping and protecting children and
families within the State. It administers more than 30 services, including child welfare and the
Wisconsin Works (W-2) program, which provides employment preparation services, case management,
and cash assistance to eligible families.

63 GENERAL INFORMATION
To promote the general welfare of citizens and insure peaceable relations among them, the State seeks to
protect citizens from lawless elements in society by maintaining those conditions of stability and order
necessary for a well-functioning society. Law enforcement is largely a local matter, but the Department
of Corrections is responsible for the safe custody and supervision of offenders using the best, most
effective correctional policies and procedures, as well as keeping citizens protected, helping offenders
succeed in the community and making every effort to reduce costs to taxpayers. The Department of
Justice furnishes legal services to State agencies and provides technical assistance to local law
enforcement agencies. The Office of the State Public Defender makes determinations of indigence and
provides legal representation for specified defendants who are unable to afford a private attorney.
The State also provides an armed military force to protect the populace in times of State or national
emergencies, natural or man-made, and to supplement the federal armed forces in time of war. These
activities come under the jurisdiction of the Department of Military Affairs.
General Executive
The administrative or staff functions that support the direct services provided to Wisconsin residents and
local governments are included in this functional group. Although each operating agency may conduct
some staff functions, some agencies perform staff functions almost exclusively.
• Department of Administration duties include budgeting, information technology, data processing,
personnel management, accounting, payroll, financial reporting, processing the receipt and
disbursement of monies received or expended by the State, engineering, and facilities
management and planning.
• Elections Commission administers and enforces Wisconsin election law, working with municipal
clerks to carry out open, fair, and transparent elections.
• Ethics Commission administers and enforces the campaign finance, ethics, and lobbying law.
• Department of Revenue collects the taxes imposed by Wisconsin Statutes, distributes that part of
the revenue that is to be returned to the local units of government, calculates the equalized value
of the property that has been assessed by local government, operates and distributes the proceeds
of the State lottery and serves as custodian of unclaimed property.
• Office of the State Treasurer participates in the promotion of the State’s unclaimed property
program administered by the Department of Revenue, and signs certain checks and other
financial instruments.
• Department of Employee Trust Funds manages the State’s public employee retirement system
and health and other group insurance contracts.
• Office of the Secretary of State keeps and authenticates various State records.
• State of Wisconsin Investment Board invests the assets of the Wisconsin Retirement System and
various State funds, including the State Investment Fund.
Legislative
The legislative function provides for the operation of the Legislature, its committees, and service
agencies.
General Appropriations
The function of general appropriations is assigned those appropriations that do not fit easily into any of
the other functions. Most general appropriations are for payments to local governments of taxes collected
by the State but shared with local governments and for other payments intended to relieve local taxes.
64 GENERAL INFORMATION
The major portion of this reporting area relating to State operations is the funding of any planned
adjustments to employee compensation, which is budgeted centrally but transferred to, and ultimately
paid by, each agency.
STATE OF WISCONSIN BUILDING COMMISSION
The Commission supervises all matters relating to the State’s issuance of general obligations, revenue
obligations, and operating notes. In addition, the Commission also oversees the planning, improvement,
major maintenance, and renovation of State facilities.
Limitations in the Wisconsin Constitution severely restricted the issuance of direct State debt until 1969,
when the Wisconsin Constitution was amended to authorize the State to borrow money. Chapter 18 of the
Wisconsin Statutes delegates powers to the Commission and establishes the procedures for the issuance
of debt.
The Commission is composed of eight members. The Governor serves as the chairperson. Each house of
the Legislature appoints three members. One citizen member is appointed by the Governor and serves at
the Governor’s pleasure. State law provides for the two major political parties to be represented in the
membership from each house, and one member appointed from each house must be a member of the
Legislative State Supported Program Study and Advisory Committee. The members act without liability
except for misconduct.
The Administrator of the Division of Facilities Development and Management serves as Secretary to the
Commission with the concurrence of the Secretary of Administration. Nonvoting advisory members of
the Commission include the Secretary of Administration, and the ranking architect in the DOA Division of
Facilities Development and Management. Employees of the DOA Division of Executive Budget and
Finance, including the Capital Finance Director, serve as staff responsible for managing the State’s
various borrowing programs.
The Commission’s office is located at the Administration Building, 7th Floor, 101 East Wilson Street, its
mailing address is P.O. Box 7866, Madison, Wisconsin 53707-7866, and its telephone number is (608)
266-1855.
STATE OBLIGATIONS
General Obligations
The State, acting through the Commission, may issue general obligation bonds and notes or enter into
loans that are secured by the State’s full faith, credit, and taxing power. There is irrevocably
appropriated, as a first charge upon all revenues of the State, a sum sufficient for the timely payment of
State general obligations. As of December 15, 2018, the State had $7.752 billion of outstanding general
obligations.
The State has never defaulted in the punctual payment of principal or interest on any general obligation
indebtedness and has never attempted to prevent or delay such required payments. The State has
reserved no right to reduce or modify any terms with respect to security or source of payment of general
obligation bonds or notes. See Part III of the 2018 Annual Report for additional information on general
obligations.
Operating Notes
The Commission may issue operating notes to fund operating expenses upon the request of the
Department of Administration if it determines that a deficiency will occur in the funds of the State that
will not permit the State to pay its operating expenses in a timely manner. The Governor and the JCF must
also approve the request for issuance.
Operating notes may be issued in an amount not exceeding 10% of budgeted appropriations of general
purpose and program revenues in the year in which operating notes are issued, and must be repaid no
later than the last day of the fiscal year in which they are issued. Operating notes are not general

65 GENERAL INFORMATION
obligations of the State and are not on parity with State general obligations. The General Fund may be
pledged for the repayment of operating notes, and money of the General Fund may be impounded for
future payment of principal and interest; however, any such repayment or impoundment must adhere to
statutory requirements related to payment of the amounts due the Bond Security and Redemption Fund
securing the repayment of State general obligation bonds. All payments and impoundments securing the
operating notes are also subject to appropriation. Owners of the operating notes have a right to file suit
against the State in accordance with procedures established in the Wisconsin Statutes.
As of December 15, 2018, the State had not issued, and does not intend to issue, operating notes in fiscal
year 2018-19.
Master Lease Program
The State, acting by and through the Department of Administration, has entered into a master lease for
the purpose of acquiring property (and in limited situations, prepaid service contracts) for State agencies
through installment payments. The State’s obligation to make lease payments is subject to annual
appropriation by the Legislature. The full faith and credit of the State are not pledged to the lease
payments; the State is not obligated to levy or pledge any tax to pay the lease payments. The State’s
obligation to make the lease payments does not constitute debt for purposes of the Wisconsin
constitutional debt limit, and there is no limit to the amount of such obligations that the State can incur.
Although an effort is made to use the master lease program for all property acquired by the State through
nonappropriation leases, it is possible that State agencies may separately incur such obligations through
other lease arrangements. Certificates of participation have been issued that evidence a proportionate
interest in certain lease payments to be made by the State. As of December 15, 2018, the outstanding
principal amount of the State’s obligations under the master lease program was approximately $101
million. See Part IV of the 2018 Annual Report for additional information on master lease certificates of
participation.
State Revenue Obligations
Subchapter II of Chapter 18 of the Wisconsin Statutes authorizes the State, acting through the
Commission, to issue revenue obligations. Revenue obligations may be in one of the following forms:
• Enterprise obligations. Secured by a pledge of revenues or property derived solely from the
operation of a program funded by the issuance of the revenue obligations.
• Special fund obligations. Secured by a pledge of revenues or property derived from any program
or any pledge of revenues.
Any such program to be undertaken or obligations to be issued must be specifically authorized by the
Legislature. The resulting obligations are not general obligations of the State.
Revenues pledged to the repayment of revenue obligations are deposited with a trustee for the
obligations. These revenues are pledged to the owners of revenue obligations, who have a security
interest on all such revenues until payment of the obligations has been made or provided for. Three such
programs have been authorized and are currently outstanding:
• Transportation revenue bond program. This program finances a portion of the costs of the State
highways and related transportation facilities. The obligations are secured by motor vehicle
registration fees and other registration-related fees. The Commission has issued 36 series of
bonds (which include refunding bond issues) and three series of commercial paper notes for this
program, which were outstanding in the aggregate amount of $1.768 billion as of December 15,
2018. See Part V of the 2018 Annual Report for additional information on transportation revenue
obligations.
• Clean water fund program. This program makes loans to municipalities in the State for the
construction or improvement of their water pollution control facilities. The Commission has
authorized two revenue bond programs for the funding the clean water fund program; clean
66 GENERAL INFORMATION
water revenue bonds and environmental improvement fund revenue bonds. Starting in 1991, the
Commission issued 28 series of clean water revenue bonds (including refunding bond issues). In
2015, the Commission established the environmental improvement fund revenue bond program;
therefore, no further issuance of clean water revenue bonds is expected. As of December 15,
2018, the outstanding principal amount of the State’s clean water revenue bonds was $40 million.
See Part VI of the 2018 Annual Report for additional information on clean water revenue bonds.
The Commission has issued four series of environmental improvement fund revenue bonds: of
which two series refunded clean water revenue bonds. As of December 15, 2018, the
outstanding principal amount of the State’s environmental improvement fund revenue bonds was
$330 million. See Part VII of the 2018 Annual Report for additional information on
environmental improvement fund revenue bonds.
• Petroleum inspection fee revenue obligations program. This program funds environmental
remediation claims submitted under the Petroleum Environmental Cleanup Fund Award
Program. Obligations issued for this program are secured by petroleum inspection fees. The
Commission has issued six series of bonds (including refunding bond issues) and two series of
extendible municipal commercial paper for this program, of which only bonds were outstanding
in the aggregate amount of $27 million as of December 15, 2018. See Part VIII of the 2018
Annual Report for additional information on petroleum inspection fee revenue obligations.
General Fund Annual Appropriation Bonds
The State has issued general fund annual appropriation bonds (1) to pay the State’s unfunded accrued
prior service (pension) liability and the State’s unfunded accrued liability for sick leave conversion and
(2) to finance the purchase of tobacco settlement revenues that the State previously sold to BTASC. The
general fund annual appropriation bonds are not a debt of the State, and the State’s obligation to make
debt service payments is subject to annual appropriation by the Legislature. The full faith and credit of
the State are not pledged, and the State is not obligated to levy or pledge any tax, to make the debt
service payments.
The State has issued seven series of general fund annual appropriation bonds (including refunding bond
issues) to pay the State’s unfunded accrued prior service (pension) liability, determined as of January 1,
2003, and the State’s unfunded accrued liability for sick leave conversion, determined as of October 1,
2003. See “STATE OBLIGATIONS; Prior Service Pension Liabilities and Other Post-Employment
Benefits”. The general fund annual appropriation bonds issued for this purpose were outstanding in the
aggregate amount of $1.499 billion as of December 15, 2018. With respect to the outstanding general
fund annual appropriation bonds that are in the form of taxable floating rate notes, the State has hedged
nearly all its variable-rate exposure by entering into interest rate exchange agreements (commonly called
swap agreements).
The State has issued five series of general fund annual appropriation bonds (including refunding bond
issues) to finance the purchase of tobacco settlement revenues that the State previously sold to BTASC.
See “STATE BUDGET; Tobacco Settlement Revenues”. The general fund annual appropriation bonds
issued for this purpose were outstanding in the aggregate amount of $1.529 billion as of December 15,
2018. In October 2018, the State entered into a forward delivery bond purchase agreement for a
refunding bond issue that is expected to close in January 2019.
See Part IX of the 2018 Annual Report for additional information on all general fund annual
appropriation bonds.
Independent Authorities
State law creates and grants to three independent special purpose authorities the power to issue bonds
and notes. None of these entities is a department or agency of the State, and none can issue bonds or
notes that are legal obligations of the State.

67 GENERAL INFORMATION
Wisconsin Housing and Economic Development Authority
The Wisconsin Housing and Economic Development Authority (WHEDA) acts as a funding vehicle for
the development of housing for low- and moderate-income families and economic development projects.
WHEDA is also authorized to administer the State’s agricultural production loan guaranty program.
WHEDA may issue bonds and notes, which are to be general obligations of WHEDA (except for bonds for
the housing rehabilitation loan program) unless WHEDA chooses to limit the obligation. The State is
expressly not liable on WHEDA obligations. Repayment may be secured by capital reserve funds, which
may be created for each bond issue in an amount that is appropriate for the type of projects being funded.
Invasion of this reserve triggers a moral obligation pledge on the part of the State and prevents further
WHEDA borrowing until the reserve is replenished. In the event a capital reserve fund is not established
for a particular bond issue, the moral obligation pledge would not be applicable. As of June 30, 2018,
WHEDA had borrowing authority of approximately $600 million for programs secured by the capital
reserve fund, excluding debt issued to refund other debt, the current outstanding balance for programs
secured by the capital reserve fund was approximately $344 million, and in aggregate, WHEDA had
$1.532 billion in outstanding notes and bonds. WHEDA has borrowing authority for several specific
programs:
• Programs secured by capital reserve fund. Borrowing authority of $600 million, excluding debt
issued to refund other debt, of which $344 million of borrowing authority was available on
October 31, 2018. A housing revenue bond issue of approximately $148 million is expected to
close in December 2018.
• Housing rehabilitation programs. Borrowing authority of $100 million, of which $100 million
of borrowing authority was available on November 30, 2018.
• Single-family home ownership mortgage loan program. WHEDA had issued $8.612 billion in such
bonds as of November 30, 2018. In the one-year period ending November 30, 2018, two single-
family issues totalling approximately $240 million were sold.
• Residential facilities for the elderly and chronically disabled. Borrowing authority of $99
million, and as of November 30, 2018, no bond issues remained outstanding.
• Economic development and agriculture loans. Current borrowing authority of $169 million.
From current and previous borrowing authority, as of November 30, 2018, WHEDA had sold 143
series of bonds for economic development and agriculture totaling $125 million, which are not
general obligations of WHEDA, and 58 series of bonds, totaling $93 million, which are general
obligations of WHEDA.
WHEDA is directed by a twelve-member board comprising the Secretary of Administration, the chief
executive officer of the Wisconsin Economic Development Corporation, two representatives to the
Assembly and two State Senators who are appointed in the same manner as the members of standing
committees in their respective houses and equally represent the two major political parties, and six public
members serving staggered terms, nominated by the Governor and confirmed by the Senate. Financial
reports may be obtained from the Wisconsin Housing and Economic Development Authority, P.O. Box
1728, Madison, WI 53701. The telephone number is (608) 266-7884, the e-mail address is
[email protected], and the web site address is www.wheda.com.
Wisconsin Health and Educational Facilities Authority
The Wisconsin Health and Educational Facilities Authority (WHEFA) provides revenue bond financing
for any Wisconsin 501(c)(3) nonprofit organizations. It may finance any qualifying capital project and
may refinance any qualifying outstanding indebtedness. As of June 30, 2018, WHEFA had outstanding 237
issues totaling approximately $9.640 billion. All bonds are limited obligations of WHEFA, payable only
from revenues specified in the documents pertaining to each bond financing and are not State debt. There
is no capital reserve fund or authorization for a moral obligation pledge. An annual program and financial
68 GENERAL INFORMATION
report to the Legislature and the Governor is required. The State Auditor is empowered to investigate
WHEFA’s financial affairs and prescribe methods of accounting. The governance of WHEFA is by a seven-
member, staggered-term board nominated by the Governor and confirmed by the Senate. The Governor
annually appoints the chairperson. Financial reports may be obtained from Wisconsin Health and
Educational Facilities Authority, 18000 West Sarah Lane, Suite 300, Brookfield, WI 53045-5841. The
telephone number is (262) 792-0466, the e-mail address is [email protected], and the web site address is
www.whefa.com.
University of Wisconsin Hospitals and Clinics Authority
The University of Wisconsin Hospitals and Clinics Authority (UWHCA) operates hospitals in Wisconsin,
including the University of Wisconsin Hospital, American Family Children’s Hospital, and The
American Center Hospital, and hospitals in Illinois, including the Swedish American Hospital and the
Swedish American Medical Center. UWHCA also operates a number of clinics in Wisconsin and Illinois.
It provides instruction for medical and other health related professions, students, and sponsors. It also
supports medical research and assists health care programs and personnel throughout the State. As of
June 30, 2018, UWHCA had outstanding long-term debt totaling approximately $587 million.
UWHCA may issue bonds and notes payable solely from the funds pledged in the bond resolution or any
trust indenture or mortgage or deed of trust that secures the obligations. The State is not liable for the
payment of principal or interest on the debt, nor is it liable for the performance of any pledge, mortgage,
obligation, or agreement entered into by UWHCA.
UWHCA is directed by a sixteen-member board. Composition and selection of members are specified by
Chapter 233 and Section 15.96 of the Wisconsin Statutes. The sixteen voting members consist of six
persons appointed by the Governor for staggered five-year terms with the approval of the State Senate,
two members either filled by or appointed by each co-chairperson of JCF, three members of the Board of
Regents appointed by the President of the Board of Regents, the Chancellor of UW-Madison, Dean of the
UW School of Medicine and Public Health (UWSMPH), a Chair of a department of the UWSMPH appointed
by the Chancellor of UW-Madison, a Faculty member of a UW-Madison health professional school other
than the UWSMPH appointed by the Chancellor of UW-Madison, and the Secretary of DOA or his/her
designee. Financial reports can be obtained from the University of Wisconsin Hospitals and Clinics
Authority, Room H4/893, 600 Highland Avenue, Madison, WI 53792-8360. The telephone number is
(608) 265-7131.
Local Districts
The Legislature has authorized the creation of the following types of local districts, which may be
created by one or more local units of government:
• Local exposition district. This type of district is authorized to issue bonds for costs related to an
exposition center and to issue up to $203 million of obligations for costs related to sports and
entertainment arena facilities. To date, one such district has been created (the Wisconsin Center
District). For bonds issued related to an exposition center, if the Secretary of Administration
determines that certain conditions are met, the State may have a moral obligation to appropriate
moneys to make up deficiencies in the district’s debt service reserve fund that secure up to $200
million principal amount of bonds in the event that project revenues and tax revenues received by
the district are inadequate to pay debt service on the bonds. Obligations issued for costs related
to a sports and entertainment arena facilities are not subject to a moral obligation of the State.
• Local professional baseball park district. The territory of this type of district consists of each
county with a population of more than 600,000 and all contiguous counties. A district is
authorized to issue bonds for costs related to a baseball park. If the Secretary of Administration
determines that certain conditions are met, the State may have a moral obligation to appropriate
moneys to make up deficiencies in the district’s reserve funds that secure up to $160 million
principal amount of bonds in the event the project revenues and tax revenues received by the

69 GENERAL INFORMATION
district are inadequate to pay debt service. To date, one such district has been created (the
Southeast Wisconsin Professional Baseball Park District).
• Local professional football park district. The territory of this type of district consists of any
county with a population of more than 150,000 that includes the principal site of a stadium that is
the home of a professional football team. A district is authorized to issue revenue bonds for
costs related to a football park. If the Secretary of Administration determines that certain
conditions are met, the State may have a moral obligation to appropriate moneys to make up
deficiencies in the district’s reserve funds that secure up to $160 million principal amount of
bonds in the event the project revenues and tax revenues received by the district are inadequate
to pay debt service. To date, one such district has been created (the Green Bay-Brown County
Professional Football Stadium District).
Moral Obligations
In certain situations where the State does not have a legal obligation to make a payment, the Legislature
has recognized a moral obligation to make an appropriation for the payment and has expressed its
expectation and aspiration that, if ever called upon to do so, it would. The following items describe these
situations and the amount of outstanding obligations that are subject to the State’s moral obligation:
• Payments to reserve funds securing certain obligations of WHEDA. As of June 30, 2018 there
were thirteen issues outstanding in the aggregate amount of $439 million that carry a moral
obligation of the State.
Name of WHEDA Issue Maturity Date Principal Issued Outstanding Balance
Housing Revenue Bonds 1998 Series A, B & C 11/1/2018 $ 39,895,000 $ 50,000 2003 Series A-E 5/1/2044 41,975,000 8,265,000 2005 Series A-F 11/1/2045 179,535,000 86,565,000 2006 Series A-D 5/1/2047 28,580,000 15,920,000 2007 Series A-G 11/1/2042 42,570,000 14,785,000 2008 Series A-G 11/1/2033 56,155,000 14,475,000 2009 Series A 5/1/2042 14,045,000 8,675,000 2010 Series A-B 11/1/2043 42,775,000 19,600,000 2012 Series A-B 5/1/2055 53,540,000 51,280,000 2013 Series A-C 5/1/2045 21,270,000 9,390,000
2015 Series A-C 5/1/2052 73,170,000 60,225,000
2016 Series A-C 5/1/2054 39,775,000 39,535,000
2017 Series A-C 11/1/2055 110,585,000 110,585,000
Total $439,350,000 • Payments of debt service on petroleum inspection fee revenue obligations. In its legislation
authorizing the issuance of the petroleum inspection fee revenue obligations, the Legislature,
recognizing a moral obligation to do so, expressed its expectation that, if the Legislature were to
reduce the rate of the petroleum inspection fee (which has happened) and if the petroleum
inspection fee were insufficient to pay debt service on the petroleum inspection fee revenue
obligations when due (which has not happened), then the Legislature would make an
appropriation from the general fund sufficient to pay such debt service. The petroleum inspection
fee revenue obligations are currently outstanding in the principal amount of $27 million.
• Payments to reserve funds securing certain obligations of different types of local districts,
subject to the Secretary of Administration’s determination that certain conditions have been met.
Currently there is one issue from a local exposition district (the Wisconsin Center District) that is
outstanding in the amount of $102 million that carries a moral obligation of the State. Two
other local districts (the Southeast Wisconsin Professional Baseball Park District and the Green
Bay-Brown County Professional Football Stadium District) each have authority to issue $160
70 GENERAL INFORMATION
million of revenue obligations that, subject to the Secretary of Administration’s determination
that certain conditions have been met, could carry a moral obligation of the State. Both districts
have issued revenue obligations, but those obligations do not carry the moral obligation of the
State.
• Payments for debt service on certain obligations issued by a local governmental unit in an
electronics and information technology manufacturing zone, subject to the Secretary of
Administration’s designation and determination that certain conditions have been met. This
moral obligation will be for up to 40 percent of a local governmental unit’s aggregate municipal
obligations issued to finance costs related to development occurring in, or for the benefit of, the
electronics and information technology manufacturing zone. Currently there is one bond issue
(by the Village of Mount Pleasant) that is outstanding in the amount of $120 million that carries
the moral obligation of the State. In addition, the Secretary of Administration has entered into an
agreement that allows this moral obligation to be designated, provided the required conditions
are met, for another issuance of obligations expected in calendar year 2019 in the principal
amount of approximately $24 million.
• Payments to reserve funds securing obligations issued by certain redevelopment authorities,
subject to the Secretary of Administration’s determination that certain conditions have been met.
Currently there is one issue by a redevelopment authority (the Redevelopment Authority of the
City of Milwaukee) for the Milwaukee Public Schools Neighborhood Schools Initiative that are
outstanding in the total amount of $29 million that carries a moral obligation of the State.
• Payments required to be made by municipalities on loans from the Clean Water Fund Program,
if so designated by the State. Currently no Clean Water Fund Program loan carries a moral
obligation of the State.
Employee Pension Funds
The State is part of the Wisconsin Retirement System (WRS), which is a hybrid pension plan with
separate individual accounts maintained for all participants. Market-related risks are generally mitigated
via (1) regular changes in active employee contributions based on actuarial costs and (2) adjustment of
benefits based on investment performance. A further description of the WRS and identification of the
State’s obligation follows; this is supplemented with additional statistical material in Tables II-19
through II-24.
The State’s pension obligations are defined by formulas that establish monthly retirement benefits as a
function of annual compensation and years of service. The State’s current contributions to meet these
pension obligations are established by a yearly actuarial determination of the value of the retirement
benefits that have accrued to State employees and will have to be paid out in the future. The actuarial
method used to determine the size of the contributions is known as “Frozen Initial Liability” for prior
service liability and “Entry Age Normal” for current contributions. Actuarial assumptions that have been
adopted in application of this method are shown in Tables II-25, II-26, and II-27.
The Department of Employee Trust Funds (ETF) administers the pension programs of both the State and
local governments, and the State of Wisconsin Investment Board is responsible for investment of all the
funds. Although the State provides pension and investment management staff for its own and local
government employees, the State has no financial obligation for payment of any local government
contribution.
WRS covers eligible employees of the State. The total retirement contribution consists of a member
(employee) contribution and an employer contribution, and an employer cannot fund any of the
member’s required contribution. As of June 2018, employee and employer contributions for calendar
year 2019 were set at the following rates:
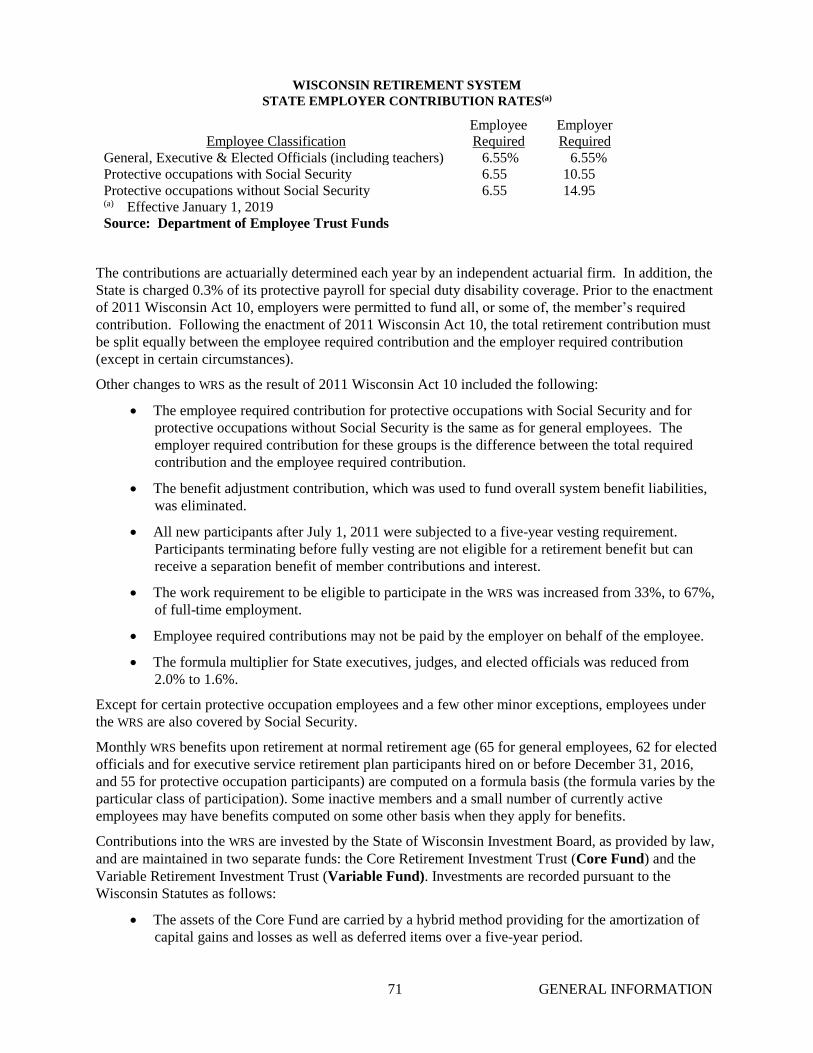
71 GENERAL INFORMATION
WISCONSIN RETIREMENT SYSTEM
STATE EMPLOYER CONTRIBUTION RATES(a)
Employee Classification
Employee
Required
Employer
Required
General, Executive & Elected Officials (including teachers) 6.55% 6.55%
Protective occupations with Social Security 6.55 10.55
Protective occupations without Social Security 6.55 14.95 (a) Effective January 1, 2019
Source: Department of Employee Trust Funds
The contributions are actuarially determined each year by an independent actuarial firm. In addition, the
State is charged 0.3% of its protective payroll for special duty disability coverage. Prior to the enactment
of 2011 Wisconsin Act 10, employers were permitted to fund all, or some of, the member’s required
contribution. Following the enactment of 2011 Wisconsin Act 10, the total retirement contribution must
be split equally between the employee required contribution and the employer required contribution
(except in certain circumstances).
Other changes to WRS as the result of 2011 Wisconsin Act 10 included the following:
• The employee required contribution for protective occupations with Social Security and for
protective occupations without Social Security is the same as for general employees. The
employer required contribution for these groups is the difference between the total required
contribution and the employee required contribution.
• The benefit adjustment contribution, which was used to fund overall system benefit liabilities,
was eliminated.
• All new participants after July 1, 2011 were subjected to a five-year vesting requirement.
Participants terminating before fully vesting are not eligible for a retirement benefit but can
receive a separation benefit of member contributions and interest.
• The work requirement to be eligible to participate in the WRS was increased from 33%, to 67%,
of full-time employment.
• Employee required contributions may not be paid by the employer on behalf of the employee.
• The formula multiplier for State executives, judges, and elected officials was reduced from
2.0% to 1.6%.
Except for certain protective occupation employees and a few other minor exceptions, employees under
the WRS are also covered by Social Security.
Monthly WRS benefits upon retirement at normal retirement age (65 for general employees, 62 for elected
officials and for executive service retirement plan participants hired on or before December 31, 2016,
and 55 for protective occupation participants) are computed on a formula basis (the formula varies by the
particular class of participation). Some inactive members and a small number of currently active
employees may have benefits computed on some other basis when they apply for benefits.
Contributions into the WRS are invested by the State of Wisconsin Investment Board, as provided by law,
and are maintained in two separate funds: the Core Retirement Investment Trust (Core Fund) and the
Variable Retirement Investment Trust (Variable Fund). Investments are recorded pursuant to the
Wisconsin Statutes as follows:
• The assets of the Core Fund are carried by a hybrid method providing for the amortization of
capital gains and losses as well as deferred items over a five-year period.
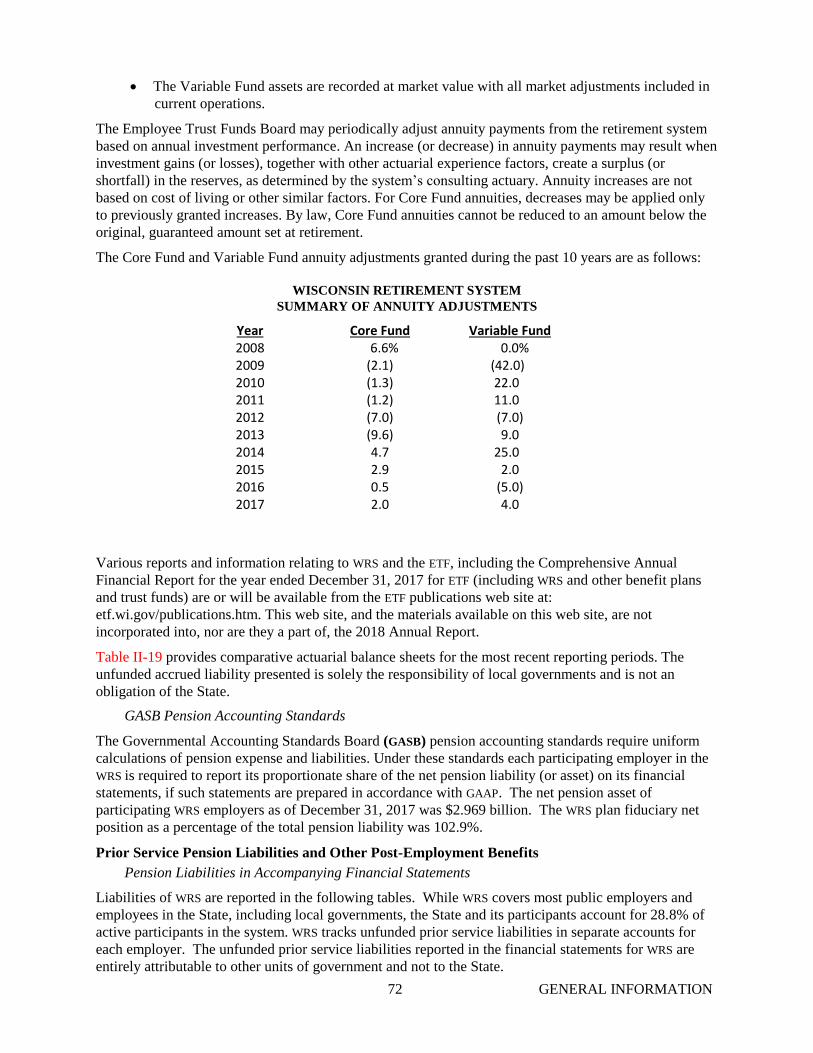
72 GENERAL INFORMATION
• The Variable Fund assets are recorded at market value with all market adjustments included in
current operations.
The Employee Trust Funds Board may periodically adjust annuity payments from the retirement system
based on annual investment performance. An increase (or decrease) in annuity payments may result when
investment gains (or losses), together with other actuarial experience factors, create a surplus (or
shortfall) in the reserves, as determined by the system’s consulting actuary. Annuity increases are not
based on cost of living or other similar factors. For Core Fund annuities, decreases may be applied only
to previously granted increases. By law, Core Fund annuities cannot be reduced to an amount below the
original, guaranteed amount set at retirement.
The Core Fund and Variable Fund annuity adjustments granted during the past 10 years are as follows:
WISCONSIN RETIREMENT SYSTEM
SUMMARY OF ANNUITY ADJUSTMENTS
Year Core Fund Variable Fund 2008 6.6% 0.0% 2009 (2.1) (42.0) 2010 (1.3) 22.0 2011 (1.2) 11.0 2012 (7.0) (7.0) 2013 (9.6) 9.0 2014 4.7 25.0 2015 2.9 2.0 2016 0.5 (5.0) 2017 2.0 4.0
Various reports and information relating to WRS and the ETF, including the Comprehensive Annual
Financial Report for the year ended December 31, 2017 for ETF (including WRS and other benefit plans
and trust funds) are or will be available from the ETF publications web site at:
etf.wi.gov/publications.htm. This web site, and the materials available on this web site, are not
incorporated into, nor are they a part of, the 2018 Annual Report.
Table II-19 provides comparative actuarial balance sheets for the most recent reporting periods. The
unfunded accrued liability presented is solely the responsibility of local governments and is not an
obligation of the State.
GASB Pension Accounting Standards
The Governmental Accounting Standards Board (GASB) pension accounting standards require uniform
calculations of pension expense and liabilities. Under these standards each participating employer in the
WRS is required to report its proportionate share of the net pension liability (or asset) on its financial
statements, if such statements are prepared in accordance with GAAP. The net pension asset of
participating WRS employers as of December 31, 2017 was $2.969 billion. The WRS plan fiduciary net
position as a percentage of the total pension liability was 102.9%.
Prior Service Pension Liabilities and Other Post-Employment Benefits
Pension Liabilities in Accompanying Financial Statements
Liabilities of WRS are reported in the following tables. While WRS covers most public employers and
employees in the State, including local governments, the State and its participants account for 28.8% of
active participants in the system. WRS tracks unfunded prior service liabilities in separate accounts for
each employer. The unfunded prior service liabilities reported in the financial statements for WRS are
entirely attributable to other units of government and not to the State.
73 GENERAL INFORMATION
Pension liabilities are calculated using the “Entry Age Normal with Frozen Initial Liability” actuarial
cost method. Under this method, actuarial gains and losses are treated as future costs in the normal cost
calculation and do not affect the past service liability. Investment losses, such as those experienced in
2008, do not create an unfunded liability but do place upward pressure on future contribution rates.
Pension and Sick Leave Conversion Benefits
Prior to 2004, the State recognized for accounting and disclosure purposes an unfunded prior service
liability for the State’s account within WRS. The State also recognized for accounting and disclosure
purposes an unfunded prior service liability for sick leave conversion, which permits employees, at
retirement, to use the value of unused sick leave to pay for health insurance premiums. Proceeds from
the State’s issuance of General Fund Annual Appropriation Bonds in 2003 fully funded both of these
prior service liabilities, and the State currently has no prior service liabilities associated with these
benefits.
Retiree Life Insurance OPEB
The State provides post-retirement life insurance coverage to retired plan participants over the age of 65
at no cost to the employee. Similar to pension, GASB standards now require uniform calculations of Other
Post-Employment Benefits (OPEB) expense and liabilities. Under these standards, employers are required
to report a total or net OPEB liability on their financial statements, if such statements are prepared in
accordance with GAAP. As of December 31, 2017, the net OPEB liability for the State Retiree Life
Insurance plan was $493 million. The plan fiduciary net position as a percentage of the total pension
liability was 41.6%.
Implied Subsidy of Retiree Health Insurance
The State Retiree Health Insurance program provides post-employment health insurance coverage to all
eligible retired employees of the State of Wisconsin. Through the program, the State offers certain
retirees who are not yet eligible for Medicare benefits the option to continue participating in the State’s
Group Health Insurance program and to pay for coverage at the premium rate set for active State
employees. Although the State does not directly pay any portion of the premium for retirees who choose
to participate in the program, the State does pay higher premiums for its active employees than it
otherwise would if retirees were excluded. Therefore, the State implicitly subsidizes the premiums paid
by participating retirees by offering these individuals access to health insurance coverage at a lower rate
than they might otherwise pay based upon their age. This subsidy, in turn, creates an OPEB liability,
which the State must recognize and report under GASB standards. The State’s net OPEB liability for
Retiree Health Insurance as of June 30, 2018 was $642 million.
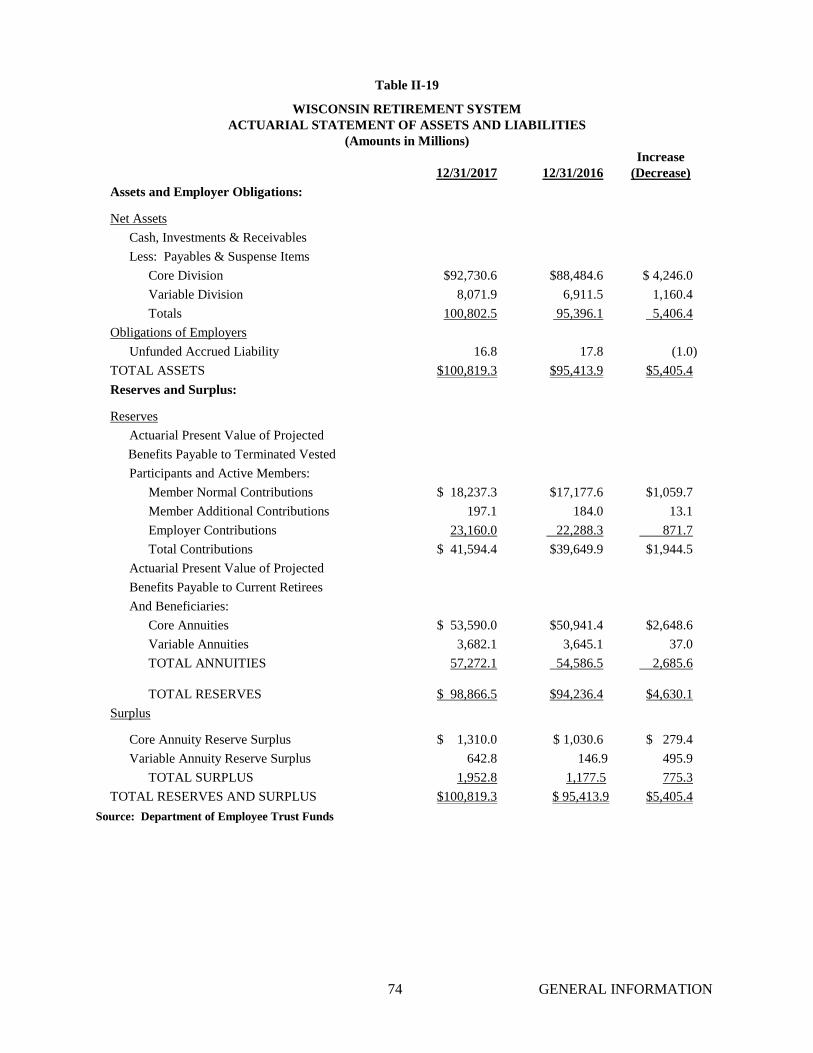
74 GENERAL INFORMATION
Table II-19
WISCONSIN RETIREMENT SYSTEM
ACTUARIAL STATEMENT OF ASSETS AND LIABILITIES
(Amounts in Millions)
12/31/2017 12/31/2016
Increase
(Decrease)
Assets and Employer Obligations:
Net Assets
Cash, Investments & Receivables
Less: Payables & Suspense Items
Core Division $92,730.6 $88,484.6 $ 4,246.0
Variable Division 8,071.9 6,911.5 1,160.4
Totals 100,802.5 95,396.1 5,406.4
Obligations of Employers
Unfunded Accrued Liability 16.8 17.8 (1.0)
TOTAL ASSETS $100,819.3 $95,413.9 $5,405.4
Reserves and Surplus:
Reserves
Actuarial Present Value of Projected
Benefits Payable to Terminated Vested
Participants and Active Members:
Member Normal Contributions $ 18,237.3 $17,177.6 $1,059.7
Member Additional Contributions 197.1 184.0 13.1
Employer Contributions 23,160.0 22,288.3 871.7
Total Contributions $ 41,594.4 $39,649.9 $1,944.5
Actuarial Present Value of Projected
Benefits Payable to Current Retirees
And Beneficiaries:
Core Annuities $ 53,590.0 $50,941.4 $2,648.6
Variable Annuities 3,682.1 3,645.1 37.0
TOTAL ANNUITIES 57,272.1 54,586.5 2,685.6
TOTAL RESERVES $ 98,866.5 $94,236.4 $4,630.1
Surplus
Core Annuity Reserve Surplus $ 1,310.0 $ 1,030.6 $ 279.4
Variable Annuity Reserve Surplus 642.8 146.9 495.9
TOTAL SURPLUS 1,952.8 1,177.5 775.3
TOTAL RESERVES AND SURPLUS $100,819.3 $ 95,413.9 $5,405.4
Source: Department of Employee Trust Funds

75 GENERAL INFORMATION
Notes to Wisconsin Retirement System
All eligible State of Wisconsin employees participate in
the Wisconsin Retirement System (System or WRS), a
cost-sharing multiple-employer public employee
retirement system (PERS). The payroll for State
employees covered by the system for the year ended
December 31, 2017 was $4.46 billion, which includes
various public authorities in the State.
Effective June 29, 2011, all permanent employees
expected to work over 1,200 hours a year (880 hours a
year for teachers) are eligible to participate in the
System. General category and Executive/Elected
employees are required by statute to contribute one-half
of the actuarially determined contribution (6.7% of their
salary) for calendar year 2018. Employers may not make
these contributions to the plan on behalf of the
employees. Protective occupation employees are
required to contribute the same percentage of their
salaries as General category employees. Employers are
required to contribute the remaining amounts necessary
to pay the projected cost of future benefits. The total
required contribution for the year ended December 31,
2017 was $624 million, which consisted of $322 million
or 7.2% of payroll from the employer and $302 million
or 6.8% of payroll from employees.
Employees who retire at or after age 65 (55 for
protective occupation employees) are entitled to receive
a WRS retirement benefit. The benefit is calculated as
1.6% (2.0% for Executives, Elected Officials, and
Protective Occupations with social security and 2.5%
for protective occupations without social security) of
final average earnings for each year of creditable service
after December 31, 1999. Service earned before January
1, 2000 accrues benefits at a rate of 1.765% (2.165% for
Executives, Elected Officials, and Protective
Occupations with social security and 2.665% for
protective occupations without social security). The
benefit multiplier for Executives and Elected Officials is
reduced to 1.6% for service earned after June 29, 2011.
Final Average Earnings is the average of the employee’s
three highest years’ earnings. Employees may retire at
age 55 (50 for protective occupation employees) and
receive reduced benefits. For employees joining the
system after June 29, 2011, five years of service are
required to be eligible for a retirement benefit.
Employees terminating covered employment before
becoming eligible for a retirement benefit may withdraw
their contributions and forfeit all rights to any
subsequent benefit. The System also provides death and
disability benefits for employees. Eligibility for and the
amount of all benefits are determined under Chapter 40
of the Wisconsin Statutes.
The System utilizes the “Entry Age Normal with Frozen
Initial Liability” actuarial method in establishing
employer contribution rates. Under this method, the
Unfunded Accrued Actuarial Liability is affected only
by the monthly amortization payments, compound
interest, the added liability created by new employer
units, and any added liabilities caused by changes in
benefit provisions. All actuarial gains or losses arising
from the difference between actual and assumed
experience are reflected in the determination of the
normal cost. The unfunded accrued actuarial liability is
being amortized over a 40-year period beginning
January 1, 1990. However, periodically, the Employee
Trust Funds Board has reviewed and, when appropriate,
adjusted the actuarial assumptions used to determine this
liability. Changes in the assumptions affect the
unfunded accrued actuarial liability, and the resulting
actuarial gains or losses are credited or charged to
employer’s unfunded liability accounts. The State of
Wisconsin, as of December 31, 2017, had no unfunded
liability. The total system unfunded liability of $17
million, as of December 31, 2017, is attributable to local
governments.
Ten-year historical trend information showing the
System’s progress in accumulating sufficient assets to
pay benefits when due is presented in the System’s
December 31, 2017 Comprehensive Annual Financial
Report.
The preceding provides a comparative actuarial balance
sheet for the most recent reporting periods.

76 GENERAL INFOMRATION
Table II-20
WISCONSIN RETIREMENT SYSTEM
FUNDING RATIO
(Amounts in Thousands)
Year
A
Actuarial
Value of
Assets
B
Unfunded
Actuarial
Liability
C
Reserve
Requirement
(A+B)
D
Funding
Ratio
(AC)
2008 $77,159,400 $252,600 $77,412,000 99.7% 2009 78,911,300 193,300 79,104,600 99.8 2010 80,626,900 131,900 80,758,800 99.8 2011 78,940,000 99,300 79,039,300 99.9 2012 78,613,000 69,700 78,682,700 99.9 2013 85,276,100 52,600 85,328,700 99.9 2014 89,360,400 31,700 89,392,100 100.0 2015 91,502,400 24,100 91,526,500 100.0 2016 95,396,200 17,800 95,414,000 100.0 2017 100,802,500 16,800 100,819,300 100.0
Source: Department of Employee Trust Funds
Table II-21
WISCONSIN RETIREMENT SYSTEM
COVERED EMPLOYEES
Year
Active
State
Active
Local Retired
2008 72,165 193,556 144,033 2009 72,415 194,878 150,671 2010 72,740 193,889 155,775 2011 70,391 186,863 167,453 2012 72,269 184,564 173,655 2013 73,091 183,697 180,056 2014 73,893 183,362 185,605 2015 73,036 183,041 191,795 2016 73,514 183,771 197,647 2017 74,085 183,328 203,300
Source: Department of Employee Trust Funds
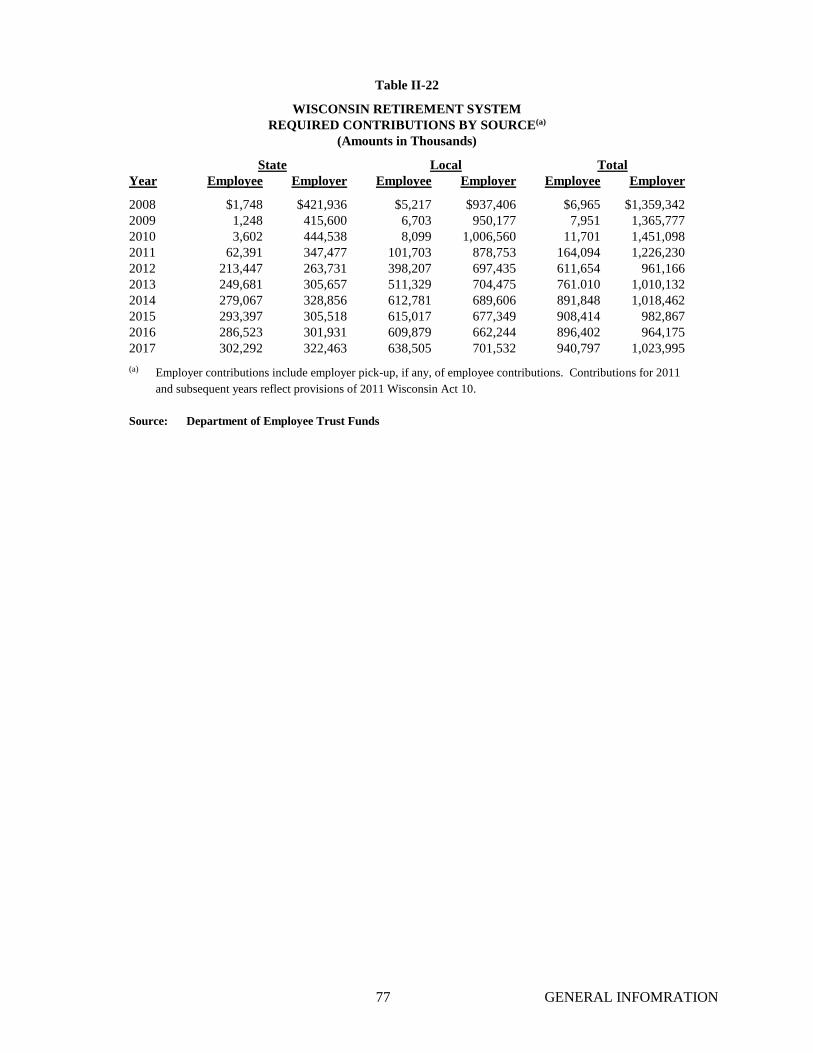
77 GENERAL INFOMRATION
Table II-22
WISCONSIN RETIREMENT SYSTEM
REQUIRED CONTRIBUTIONS BY SOURCE(a)
(Amounts in Thousands)
State Local Total
Year Employee Employer Employee Employer Employee Employer
2008 $1,748 $421,936 $5,217 $937,406 $6,965 $1,359,342
2009 1,248 415,600 6,703 950,177 7,951 1,365,777
2010 3,602 444,538 8,099 1,006,560 11,701 1,451,098
2011 62,391 347,477 101,703 878,753 164,094 1,226,230
2012 213,447 263,731 398,207 697,435 611,654 961,166
2013 249,681 305,657 511,329 704,475 761.010 1,010,132
2014 279,067 328,856 612,781 689,606 891,848 1,018,462
2015 293,397 305,518 615,017 677,349 908,414 982,867
2016 286,523 301,931 609,879 662,244 896,402 964,175
2017 302,292 322,463 638,505 701,532 940,797 1,023,995
(a) Employer contributions include employer pick-up, if any, of employee contributions. Contributions for 2011
and subsequent years reflect provisions of 2011 Wisconsin Act 10.
Source: Department of Employee Trust Funds

78 GENERAL INFOMRATION
Table II-23
WISCONSIN RETIREMENT SYSTEM
REVENUES BY TYPE(a)
(Amounts in Thousands)
Year
Employee
Contributions(b)
Employer
Contributions(c)
Investment
Income Other Income Total Revenues
(a) Employee required contributions made in accordance with statutory requirements. Employer required
contributions were made in accordance with actuarially-determined contribution requirements.
(b) Employee contributions include all employee required, employee additional and benefit adjustment
contributions, including those paid by the employer on behalf of the employee.
(c) Employer contributions include all employer required contributions, including contributions for unfunded actuarial accruedliability.
Source: Department of Employee Trust Funds
Table II-24
WISCONSIN RETIREMENT SYSTEM
BENEFIT EXPENDITURES BY TYPE
(Amounts in Thousands)
Year Separations Death Annuities Supplemental(a) Misc. Total
2008 $27,375 $28,802 $3,793,740 $1,160 $17,970 $3,869,047
2009 24,800 29,124 3,758,389 912 36,543 3,843,300
2010 26,415 29,124 3,846,305 743 17,603 3,920,190
2011 28,006 33,129 4,103,321 601 18,620 4,183,677
2012 26,563 24,800 4,182,881 470 21,542 4,256,256
2013 33,271 37,972 4,186,386 342 22,858 4,280,829
2014 34,401 33,480 4,411,169 265 119,371 4,598,686
2015 37,642 31,746 4,748,334 210 66,005 4,883,937
2016 39,276 30,366 4,921,126 158 91,697 5,082,623
2017 38,358 31,302 5,179,965 112 26,133 5,275,870 (a) Supplemental benefits were granted to certain employees by the Legislature in 1974. These benefits are paid
out of the State General Fund.
Source: Department of Employee Trust Funds
2008 $736,149 $683,520 $(22,744,110) $1,618 $(21,322,822)
2009 736,689 705,997 13,024,986 1,117 14,468,790
2010 787,460 750,702 8,317,435 990 9,856,588
2011 797,856 789,244 664,151 849 2,252,100
2012 757,151 799,350 9,858,710 678 11,415,889
2013 871,260 914,698 11,343,231 532 13,129,721
2014 906,499 1,023,197 4,888,240 642 6,818,578
2015 937,225 977,734 (674,988) 248 1,240,219
2016 921,864 963,122 7,271,531 341 9,156,858
2017 965,453 1,017,559 14,868,726 5,558 16,857,296
2007 $705,804 $655,128 $6,495,914 $1,823 $7,858,669
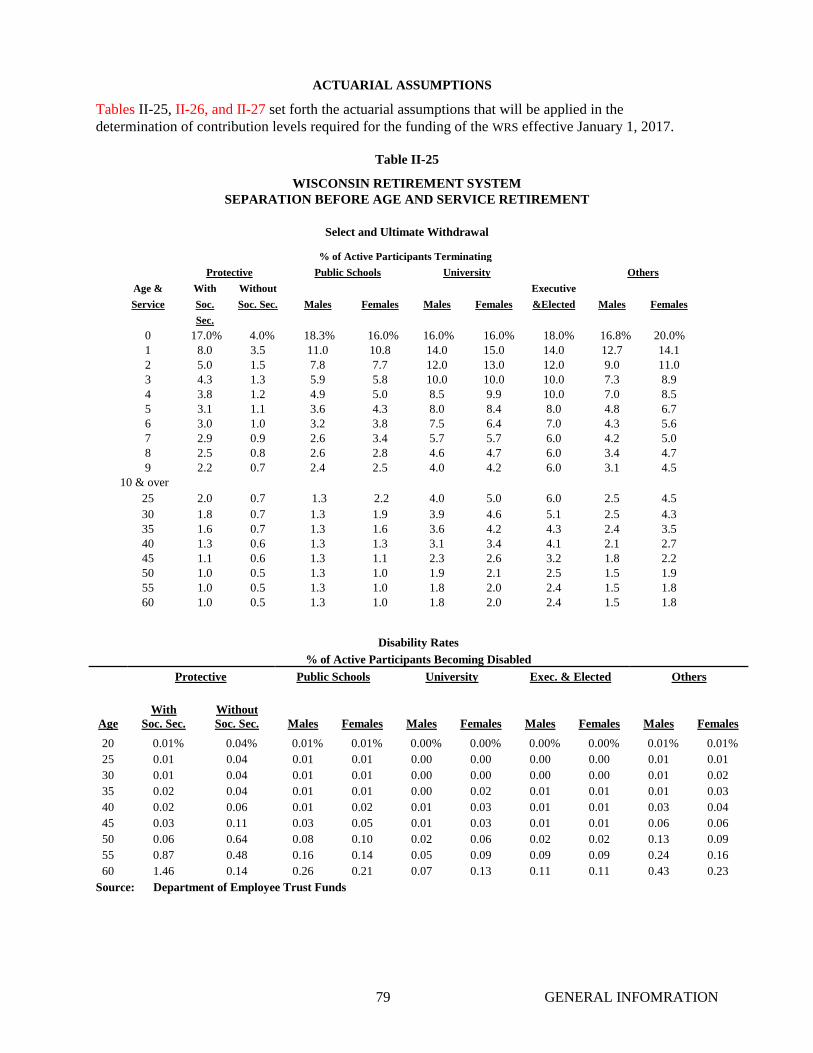
79 GENERAL INFOMRATION
ACTUARIAL ASSUMPTIONS
Tables II-25, II-26, and II-27 set forth the actuarial assumptions that will be applied in the
determination of contribution levels required for the funding of the WRS effective January 1, 2017.
Table II-25
WISCONSIN RETIREMENT SYSTEM
SEPARATION BEFORE AGE AND SERVICE RETIREMENT
Select and Ultimate Withdrawal
% of Active Participants Terminating
Protective Public Schools University Others
Age &
Service
With
Soc.
Sec.
Without
Soc. Sec. Males Females Males Females
Executive
&Elected Males Females
0 17.0% 4.0% 18.3% 16.0% 16.0% 16.0% 18.0% 16.8% 20.0%
1 8.0 3.5 11.0 10.8 14.0 15.0 14.0 12.7 14.1
2 5.0 1.5 7.8 7.7 12.0 13.0 12.0 9.0 11.0
3 4.3 1.3 5.9 5.8 10.0 10.0 10.0 7.3 8.9
4 3.8 1.2 4.9 5.0 8.5 9.9 10.0 7.0 8.5
5 3.1 1.1 3.6 4.3 8.0 8.4 8.0 4.8 6.7
6 3.0 1.0 3.2 3.8 7.5 6.4 7.0 4.3 5.6
7 2.9 0.9 2.6 3.4 5.7 5.7 6.0 4.2 5.0
8 2.5 0.8 2.6 2.8 4.6 4.7 6.0 3.4 4.7
9 2.2 0.7 2.4 2.5 4.0 4.2 6.0 3.1 4.5
10 & over
25 2.0 0.7 1.3 2.2 4.0 5.0 6.0 2.5 4.5
30 1.8 0.7 1.3 1.9 3.9 4.6 5.1 2.5 4.3
35 1.6 0.7 1.3 1.6 3.6 4.2 4.3 2.4 3.5
40 1.3 0.6 1.3 1.3 3.1 3.4 4.1 2.1 2.7
45 1.1 0.6 1.3 1.1 2.3 2.6 3.2 1.8 2.2
50 1.0 0.5 1.3 1.0 1.9 2.1 2.5 1.5 1.9
55 1.0 0.5 1.3 1.0 1.8 2.0 2.4 1.5 1.8
60 1.0 0.5 1.3 1.0 1.8 2.0 2.4 1.5 1.8
Disability Rates
% of Active Participants Becoming Disabled
Protective Public Schools University Exec. & Elected Others
Age
With
Soc. Sec.
Without
Soc. Sec. Males Females Males Females Males Females Males Females
20 0.01% 0.04% 0.01% 0.01% 0.00% 0.00% 0.00% 0.00% 0.01% 0.01%
25 0.01 0.04 0.01 0.01 0.00 0.00 0.00 0.00 0.01 0.01
30 0.01 0.04 0.01 0.01 0.00 0.00 0.00 0.00 0.01 0.02
35 0.02 0.04 0.01 0.01 0.00 0.02 0.01 0.01 0.01 0.03
40 0.02 0.06 0.01 0.02 0.01 0.03 0.01 0.01 0.03 0.04
45 0.03 0.11 0.03 0.05 0.01 0.03 0.01 0.01 0.06 0.06
50 0.06 0.64 0.08 0.10 0.02 0.06 0.02 0.02 0.13 0.09
55 0.87 0.48 0.16 0.14 0.05 0.09 0.09 0.09 0.24 0.16
60 1.46 0.14 0.26 0.21 0.07 0.13 0.11 0.11 0.43 0.23
Source: Department of Employee Trust Funds
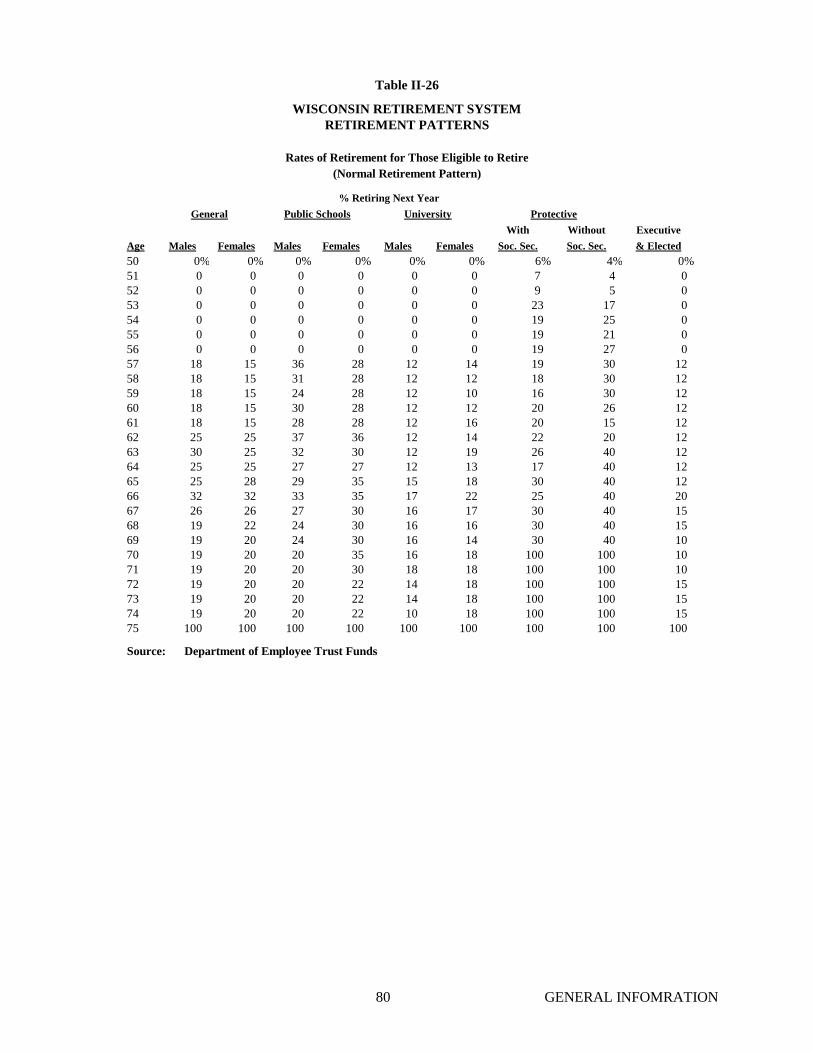
80 GENERAL INFOMRATION
Table II-26
WISCONSIN RETIREMENT SYSTEM
RETIREMENT PATTERNS
Rates of Retirement for Those Eligible to Retire
(Normal Retirement Pattern)
% Retiring Next Year
General Public Schools University Protective
Age Males Females Males Females Males Females
With
Soc. Sec.
Without
Soc. Sec.
Executive
& Elected
50 0% 0% 0% 0% 0% 0% 6% 4% 0%
51 0 0 0 0 0 0 7 4 0
52 0 0 0 0 0 0 9 5 0
53 0 0 0 0 0 0 23 17 0
54 0 0 0 0 0 0 19 25 0
55 0 0 0 0 0 0 19 21 0
56 0 0 0 0 0 0 19 27 0
57 18 15 36 28 12 14 19 30 12
58 18 15 31 28 12 12 18 30 12
59 18 15 24 28 12 10 16 30 12
60 18 15 30 28 12 12 20 26 12
61 18 15 28 28 12 16 20 15 12
62 25 25 37 36 12 14 22 20 12
63 30 25 32 30 12 19 26 40 12
64 25 25 27 27 12 13 17 40 12
65 25 28 29 35 15 18 30 40 12
66 32 32 33 35 17 22 25 40 20
67 26 26 27 30 16 17 30 40 15
68 19 22 24 30 16 16 30 40 15
69 19 20 24 30 16 14 30 40 10
70 19 20 20 35 16 18 100 100 10
71 19 20 20 30 18 18 100 100 10
72 19 20 20 22 14 18 100 100 15
73 19 20 20 22 14 18 100 100 15
74 19 20 20 22 10 18 100 100 15
75 100 100 100 100 100 100 100 100 100
Source: Department of Employee Trust Funds
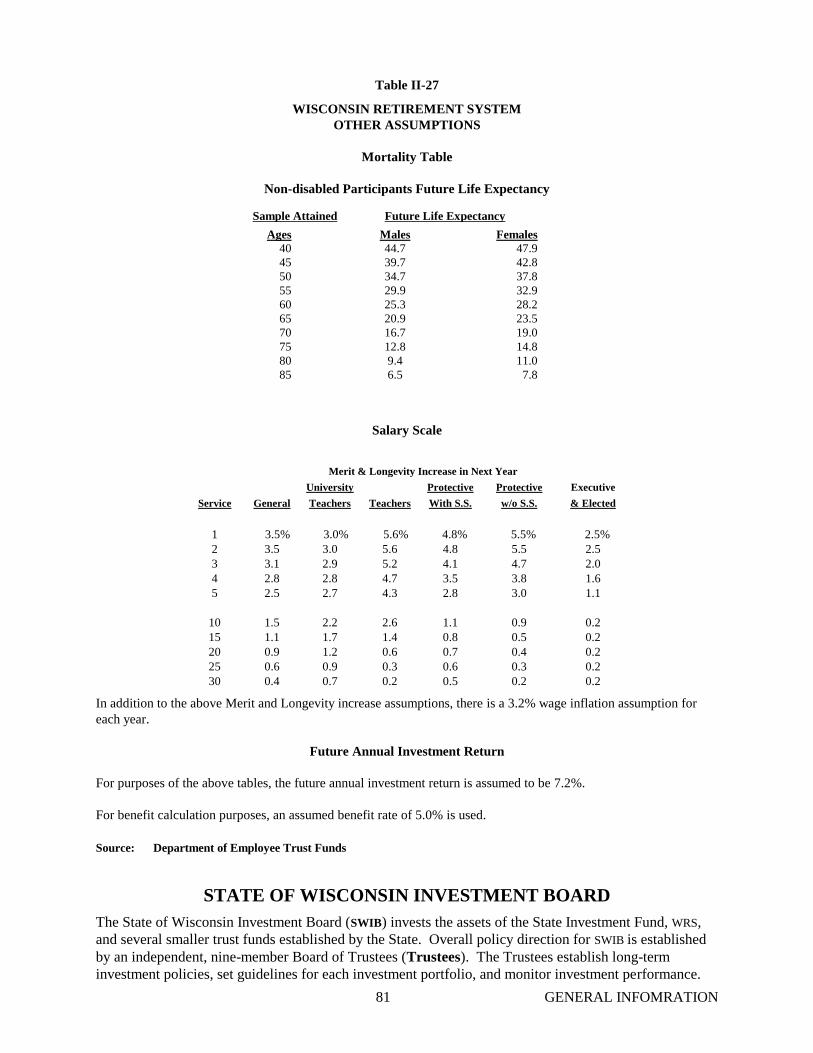
81 GENERAL INFOMRATION
Table II-27
WISCONSIN RETIREMENT SYSTEM
OTHER ASSUMPTIONS
Mortality Table
Non-disabled Participants Future Life Expectancy
Sample Attained Future Life Expectancy
Ages Males Females
40 44.7 47.9
45 39.7 42.8
50 34.7 37.8
55 29.9 32.9
60 25.3 28.2
65 20.9 23.5
70 16.7 19.0
75 12.8 14.8
80 9.4 11.0
85 6.5 7.8
Salary Scale
Merit & Longevity Increase in Next Year
Service General
University
Teachers Teachers
Protective
With S.S.
Protective
w/o S.S.
Executive
& Elected
1 3.5% 3.0% 5.6% 4.8% 5.5% 2.5%
2 3.5 3.0 5.6 4.8 5.5 2.5
3 3.1 2.9 5.2 4.1 4.7 2.0
4 2.8 2.8 4.7 3.5 3.8 1.6
5 2.5 2.7 4.3 2.8 3.0 1.1
10 1.5 2.2 2.6 1.1 0.9 0.2
15 1.1 1.7 1.4 0.8 0.5 0.2
20 0.9 1.2 0.6 0.7 0.4 0.2
25 0.6 0.9 0.3 0.6 0.3 0.2
30 0.4 0.7 0.2 0.5 0.2 0.2
In addition to the above Merit and Longevity increase assumptions, there is a 3.2% wage inflation assumption for
each year.
Future Annual Investment Return
For purposes of the above tables, the future annual investment return is assumed to be 7.2%.
For benefit calculation purposes, an assumed benefit rate of 5.0% is used.
Source: Department of Employee Trust Funds
STATE OF WISCONSIN INVESTMENT BOARD
The State of Wisconsin Investment Board (SWIB) invests the assets of the State Investment Fund, WRS,
and several smaller trust funds established by the State. Overall policy direction for SWIB is established
by an independent, nine-member Board of Trustees (Trustees). The Trustees establish long-term
investment policies, set guidelines for each investment portfolio, and monitor investment performance.

82 GENERAL INFOMRATION
The nine members of the Board of Trustees include:
• The Secretary of Administration or a designee.
• Two participants in the WRS. One of these is a teacher who is appointed by the Teacher
Retirement Board. The other represents non-teacher participants and is appointed by the
Wisconsin Retirement Board.
• Six public members, who are appointed by the Governor. Of these public members, four are
required to have at least ten years of investment experience, and one is required to be an
individual with a minimum of ten years of financial experience who holds a nonelected finance
position with a local government that participates in the Local Government Investment Pool.
All appointed members serve six-year terms. During calendar year 2018, the Trustees met nine times.
The Trustees appoint SWIB’s Executive Director/Chief Investment Officer. The Executive Director/Chief
Investment Officer is responsible for oversight of staff activities and developing and recommending
policies for adoption by the Trustees. The portfolio managers and analysts are all responsible for daily
investment decisions in their markets.
Pursuant to Wisconsin Statutes, the State Investment Fund consists of cash balances of the General Fund,
State agencies and departments, and WRS reserves. In addition, the State Investment Fund also includes
investment deposits from elective participants consisting of over 1,000 municipalities and other public
entities, which are accounted for in the LGIP, which is a subset of the State Investment Fund.
The objectives of the State Investment Fund are to provide (in order of priority):
• Safety of principal
• Liquidity
• Competitive rate of return
This fund includes the cash balances from retirement trust funds. This fund also acts as the State’s cash
management fund and provides the State’s General Fund with liquidity for operating expenses. The State
Investment Fund is strategically managed similar to a money market fund, but has the ability to have a
longer average maturity than a registered money market fund. Because of the role played by the State
Investment Fund, the cash balances available for investment vary daily as cash is accumulated or
withdrawn from the funds.
With regard to investments of the State Investment Fund, the Wisconsin Statutes establish parameters,
and the Trustees establish and monitor policies covering:
• Types of assets and the amount that can be acquired
• Delegation of powers to purchase and sell and specific guidelines for various types of
investments
• Emergency powers in the event the Trustees are unable to meet
• Guidelines that prohibit the use of derivatives, financial futures, and related options
The policies seek to achieve safety of principal and liquidity by attention to quality standards, maturity,
and marketability. The policies seek to enhance return through portfolio management that considers,
among other things, anticipated changes in interest rates and the yield curve.
As a public agency, SWIB is not registered under the Investment Company Act of 1940, the Investment
Advisers Act of 1940, or the Commodity Exchange Act. However, a description of risk factors,
guidelines, and investment objectives concerning the LGIP and the State Investment Fund may be
obtained from the State of Wisconsin Investment Board, P.O. Box 7842, Madison, WI 53707-7842. The
telephone number is (608) 266-2381, the e-mail address is [email protected], and the web site

83 GENERAL INFOMRATION
address is www.swib.state.wi.us. Neither the preceding web site nor the summaries available at such web
site are incorporated by reference into this Part II of the 2018 Annual Report.
Table II-28 presents unaudited financial and statistical information for the State Investment Fund. A copy
of SWIB’s annual report or information on the LGIP and the State Investment Fund may be obtained from
SWIB, but are not part of the 2018 Annual Report.
Table II-28
STATE INVESTMENT FUND
(As of October 31, 2018)
HOLDINGS DETAIL REPORT
AVERAGE MATURITY FOR THE LAST SIX MONTHS
Reporting
Date
Average
Maturity (Days)
Reporting
Date
Average
Maturity (Days)
10/31/2018 28 7/31/2018 28 9/30/2018 25 6/30/2018 20 8/31/2018 30 5/31/2018 26
SUMMARY OF INVESTMENT FUND PARTICIPANTS
(As of October 31, 2018)
Source:Wisconsin Investment Board
Amortized Cost
Percent of Portfolio
at Amortized Cost
U.S. Governments & Agencies $ 6,083,029,000 58.56% U.S. Repurchase Agreements 3,163,227,000 30.45 Certificates of Deposit & Bankers Acceptance 284,602,000 2.74 Commercial Paper and Corporate Notes 857,025,000 8.25
$10,387,883,000 100.00%
Participants Par Amount ($000) Percent of Portfolio
Mandatory Participants
State of Wisconsin and Agencies $ 5,420,376 52.74% State of Wisconsin Investment Board 1,763,692 17.16
Elective Participants Local Government Investment Pool 3,092,809 30.10 TOTAL $10,276,877 100.00%
The difference between the total of participant's unit shares ($10,276,877,000) and the total of the
investments ($10,387,883,000) is the result of check float (checks written and posted at DOA that
have not yet cleared the bank) and a timing delay in posting bank receipts at DOA which have
already been invested by SWIB.

84 GENERAL INFOMRATION
STATISTICAL INFORMATION
This section presents information pertaining to the State’s economic condition, including property value,
population, income, and employment.
Table II-29
STATE ASSESSMENT
(EQUALIZED VALUE)
OF TAXABLE PROPERTY
Calendar Year
Value of
Taxable
Property
Rate of
Increase
(Decrease)
2009 $511,911,983,100 (0.5)% 2010 495,904,192,300 (3.1) 2011 486,864,232,800 (1.8) 2012 471,092,529,200 (3.2) 2013 467,502,564,000 (0.8) 2014 479,023,957,200 2.5 2015 490,602,544,050 2.4 2016 505,124,328,250 3.0 2017 525,984,545,850 4.1 2018 549,532,691,500 4.5
Source: Department of Revenue

85 GENERAL INFOMRATION
Table II-30
DELINQUENCY RATE:
INCOME, FRANCHISE, GIFT, SALES, AND USE TAXES
Fiscal Year
Total Revenues
Expected
(Amounts in Thousands)
Delinquent Balance(a)
(Amounts in Thousands)
Delinquent Balance as a
Percent of Total
Revenues Expected
2009 $10,957,071 $1,128,139 10.30%
2010 10,898,706 993,075 9.14
2011 11,662,010 914,671 7.84
2012 12,236,987 968,484 7.91
2013 12,832,365 971,303 7.57
2014 12,656,911 975,512 7.71
2015 13,222,872 928,244 7.02
.
2016 13,762,689 950,356 6.90
2017 14,184,390 1,019,961 7.19
2018 14,820,792 1,037,558 7.00
(a) The collectible delinquent balance is generally less than shown. The collectible delinquent balance is determined by
decreasing the delinquent balance by various factors to address amounts owed by taxpayers in bankruptcy, amounts
owed by deceased taxpayers, amounts owed by defunct corporations, and amounts owed by accounts assigned to
field revenue agents.
Source: Department of Revenue

86 GENERAL INFOMRATION
Table II-31
POPULATION TRENDS
% Change Population Per Sq. Mile
Year Wisconsin Total
(In Thousands)
Rank Wisconsin U.S. Wisconsin U.S.
1910 2,334 13 12.8 21.0 42.2 26.0
1920 2,632 13 12.8 15.0 47.6 29.9
1930 2,939 13 11.7 16.2 53.7 34.7
1940 3,138 13 6.8 7.3 57.3 37.2
1950 3,435 14 9.5 14.5 62.8 42.6
1960 3,952 15 15.1 18.5 72.6 50.6
1970 4,418 16 11.8 13.3 81.1 57.5
1980 4,706 16 6.5 11.4 86.5 64.0
1990 4,892 16 4.0 9.8 90.1 70.3
2000 5,364 18 9.6 13.2 98.8 79.6
2010 5,690 20 0.6 0.4 105.0 87.4
2011 5,706 20 0.3 0.7 105.4 88.2
2012 5,721 20 0.3 0.8 105.6 88.9
2013 5,737 20 0.3 0.7 105.9 89.5
2014 5,751 20 0.2 0.8 106.2 90.2
2015 5,760 20 0.2 0.8 106.4 90.9
2016 5,773 20 0.2 0.7 106.6 91.6
2017 5,795 20 0.4 0.7 107.0 92.2
Source: U.S. Census Bureau Population and Housing Units Estimates and land area statistics from U.S. Census Bureau
State and County Quick Facts

87 GENERAL INFOMRATION
Table II-32
POPULATION CHARACTERISTICS
Wisconsin U.S.
% Urban (2010) 70.2% 80.7%
% Rural (2010) 29.8 19.3
% Foreign-born (2017) 5.0 13.7
Dependency Ratio (a) 62.8 61.8 (a) Dependency Ratio = (Population under 18) + (Population aged 65+)
(Population aged 18-64)
YEARS OF SCHOOL COMPLETED
(as % of population age 25 and over)
Wisconsin U.S.
Grade School - 8 years 97.4% 94.9%
High School/equivalent 92.4 88.0
Bachelor’s Degree 30.4 32.0
Source: All U.S. Census Bureau web site, American FactFinder
Urban/Rural: 2010 Census Summary File 1 Table P2
Foreign-Born: 2017 American Community Survey 1-Year Estimates Table S0501
Dependency Ratio: 2017 American Community Survey 1-Year Estimates Table S0101
Educational Attainment: 2017American Community Survey 1-Year Estimates Table
S1501

88 GENERAL INFOMRATION
Table II-33
POPULATION BY AGE GROUP
(2017)
Age Group Wisconsin U.S.
Under 5 5.8% 6.1%
5-14 12.5 12.7
15-44 38.1 39.8
45-59 20.5 19.7
60 and over 23.2 21.8
Total 100.0 100.0
Note: Totals may not equal 100% due to rounding
Source: 2017 American Community Survey 1-Year Estimates
Table S0101
Table II-34
ESTIMATED PERSONAL INCOME(a)
Year
Amount Total
($ in Millions)
Per Capita
Wisconsin
Per Capita
U.S.
Percentage
Wisconsin to
U.S.
2008 $219,283 $38,873 $41,082 94.9%
2009 215,499 38,012 39,376 96.5
2010 219,628 38,597 40,277 95.8
2011 232,664 40,749 42,461 96.0
2012 243,576 42,537 44,282 96.1
2013 245,382 42,728 44,493 96.0
2014 255,075 44,296 46,494 95.3
2015 265,094 45,960 48,451 94.9
2016 270,226 46,762 49,246 95.0
2017 283,636 48,941 51,640 94.8
(a) All dollar estimates are in current dollars (not adjusted for inflation).
Source: Table SAINC1 Personal Income Summary: Personal Income, Population, Per Capita Personal
Income, Bureau of Economic Analysis, U.S. Department of Commerce

89 GENERAL INFOMRATION
Table II-35
MEDIAN HOUSEHOLDS INCOME FOR FOUR-PERSON FAMILY(b)
Year(a) Wisconsin U.S. Percentage
WI to U.S.
2008 $80,530 $75,782 106.3%
2009 76,188 73,714 103.4
2010 76,117 72,767 140.6
2011 79,648 74,563 106.8
2012 80,198 76,049 105.5
2013 82,350 77,953 105.6
2014 85,859 80,545 106.6
2015 88,133 82,508 106.8
2016 93,500 86,877 107.6
2017 96,972 90,748 106.9
(a) Annual values are not adjusted for inflation.
(b) The values provided are based on the estimated “Median Income for Four-Person Family”. Data included in
prior continuing disclosure annual reports may have included a mix of family households and non-family
households.
Source: American Community Survey 1-Year Estimates Table B19019. The 2017 data is from the 2017 1-
year estimates, the 2016 data is from the 2016 1-year estimates, and so forth.
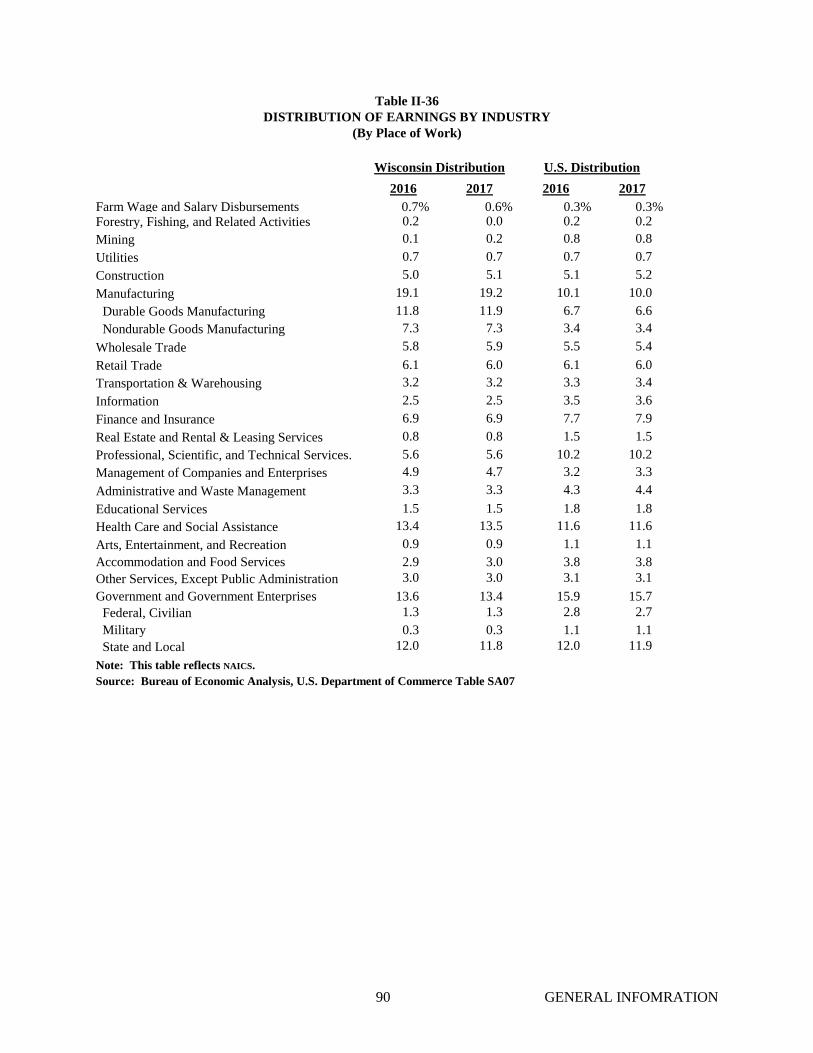
90 GENERAL INFOMRATION
Table II-36
DISTRIBUTION OF EARNINGS BY INDUSTRY
(By Place of Work)
Wisconsin Distribution U.S. Distribution
2016 2017 2016 2017
Farm Wage and Salary Disbursements 0.7% 0.6% 0.3% 0.3% Forestry, Fishing, and Related Activities 0.2 0.0
0
0.2 0.2
Mining 0.1 0.2 0.8 0.8
Utilities 0.7 0.7 0.7 0.7
Construction 5.0 5.1 5.1 5.2
Manufacturing 19.1 19.2 10.1 10.0
Durable Goods Manufacturing 11.8 11.9 6.7 6.6
Nondurable Goods Manufacturing 7.3 7.3 3.4 3.4
Wholesale Trade 5.8 5.9 5.5 5.4
Retail Trade 6.1 6.0 6.1 6.0
Transportation & Warehousing 3.2 3.2 3.3 3.4
Information 2.5 2.5 3.5 3.6
Finance and Insurance 6.9 6.9 7.7 7.9
Real Estate and Rental & Leasing Services 0.8 0.8 1.5 1.5
Professional, Scientific, and Technical Services . 5.6 5.6 10.2 10.2
Management of Companies and Enterprises 4.9 4.7 3.2 3.3
Administrative and Waste Management 3.3 3.3 4.3 4.4
Educational Services 1.5 1.5 1.8 1.8
Health Care and Social Assistance 13.4 13.5 11.6 11.6
Arts, Entertainment, and Recreation 0.9 0.9 1.1 1.1
Accommodation and Food Services 2.9 3.0 3.8 3.8
Other Services, Except Public Administration 3.0 3.0 3.1 3.1
Government and Government Enterprises 13.6 13.4 15.9 15.7
Federal, Civilian 1.3 1.3 2.8 2.7
Military 0.3 0.3 1.1 1.1
State and Local 12.0 11.8 12.0 11.9
Note: This table reflects NAICS.
Source: Bureau of Economic Analysis, U.S. Department of Commerce Table SA07
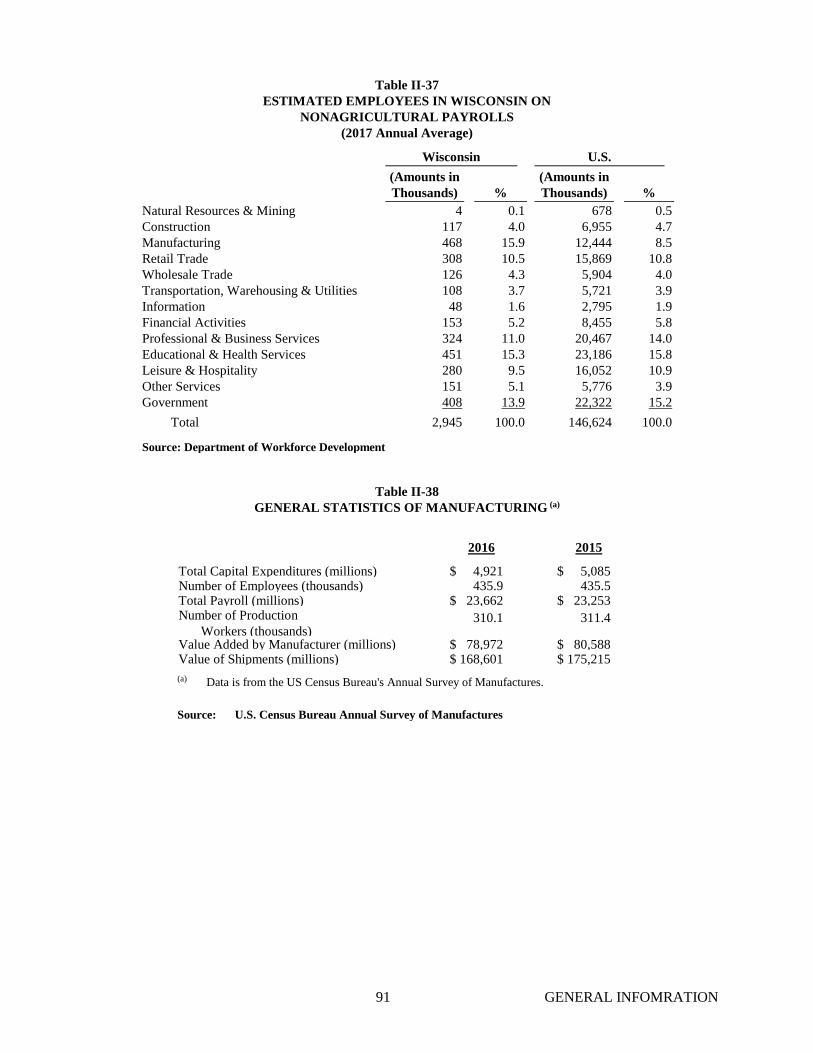
91 GENERAL INFOMRATION
Table II-37
ESTIMATED EMPLOYEES IN WISCONSIN ON
NONAGRICULTURAL PAYROLLS
(2017 Annual Average)
Wisconsin U.S.
(Amounts in
Thousands) %
(Amounts in
Thousands) %
Natural Resources & Mining 4 0.1 678 0.5
Construction 117 4.0 6,955 4.7
Manufacturing 468 15.9 12,444 8.5
Retail Trade 308 10.5 15,869 10.8
Wholesale Trade 126 4.3 5,904 4.0
Transportation, Warehousing & Utilities 108 3.7 5,721 3.9
Information 48 1.6 2,795 1.9
Financial Activities 153 5.2 8,455 5.8
Professional & Business Services 324 11.0 20,467 14.0
Educational & Health Services 451 15.3 23,186 15.8
Leisure & Hospitality 280 9.5 16,052 10.9
Other Services 151 5.1 5,776 3.9
Government 408 13.9 22,322 15.2
Total 2,945 100.0 146,624 100.0
Source: Department of Workforce Development
Table II-38
GENERAL STATISTICS OF MANUFACTURING (a)
2016 2015
Total Capital Expenditures (millions) $ 4,921 $ 5,085 Number of Employees (thousands) 435.9 435.5 Total Payroll (millions) $ 23,662 $ 23,253 Number of Production
Workers (thousands) 310.1 311.4
Value Added by Manufacturer (millions) $ 78,972 $ 80,588 Value of Shipments (millions) $ 168,601 $ 175,215
(a) Data is from the US Census Bureau's Annual Survey of Manufactures.
Source: U.S. Census Bureau Annual Survey of Manufactures
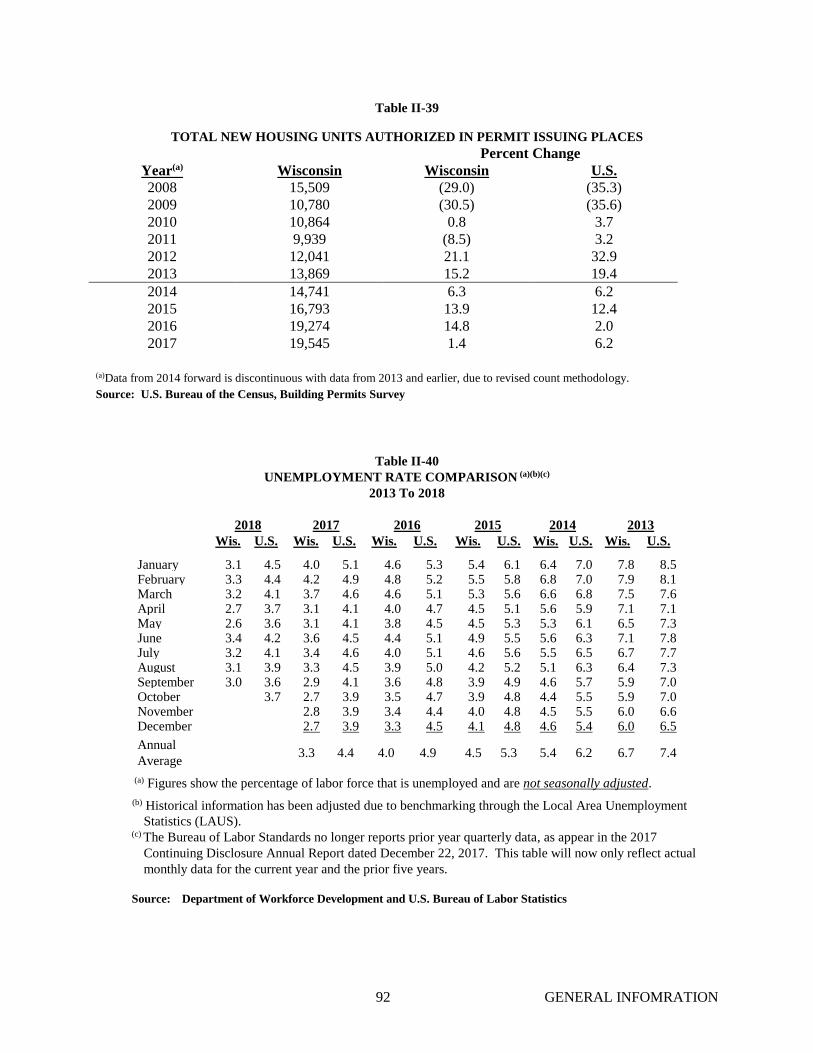
92 GENERAL INFOMRATION
Table II-39
TOTAL NEW HOUSING UNITS AUTHORIZED IN PERMIT ISSUING PLACES
Percent Change
Year(a) Wisconsin Wisconsin U.S.
2008 15,509 (29.0) (35.3)
2009 10,780 (30.5) (35.6)
2010 10,864 0.8 3.7
2011 9,939 (8.5) 3.2
2012 12,041 21.1 32.9
2013 13,869 15.2 19.4
2014 14,741 6.3 6.2
2015 16,793 13.9 12.4
2016 19,274 14.8 2.0
2017 19,545 1.4 6.2
(a)Data from 2014 forward is discontinuous with data from 2013 and earlier, due to revised count methodology.
Source: U.S. Bureau of the Census, Building Permits Survey
Table II-40
UNEMPLOYMENT RATE COMPARISON (a)(b)(c)
2013 To 2018
2018 2017 2016 2015 2014 2013
Wis. U.S. Wis. U.S. Wis. U.S. Wis. U.S. Wis. U.S. Wis. U.S.
January 3.1 4.5 4.0 5.1 4.6 5.3 5.4 6.1 6.4 7.0 7.8 8.5 February 3.3 4.4 4.2 4.9 4.8 5.2 5.5 5.8 6.8 7.0 7.9 8.1 March 3.2 4.1 3.7 4.6 4.6
4
5.1 5.3 5.6 6.6 6.8 7.5 7.6 April 2.7 3.7 3.1 4.1 4.0 4.7 4.5 5.1 5.6 5.9 7.1 7.1 May 2.6 3.6 3.1 4.1 3.8 4.5 4.5 5.3 5.3 6.1 6.5 7.3 June 3.4 4.2 3.6 4.5 4.4 5.1 4.9 5.5 5.6 6.3 7.1 7.8 July 3.2 4.1 3.4 4.6 4.0 5.1 4.6 5.6 5.5 6.5 6.7 7.7 August 3.1 3.9 3.3 4.5 3.9 5.0 4.2 5.2 5.1 6.3 6.4 7.3 September 3.0 3.6 2.9 4.1 3.6 4.8 3.9 4.9 4.6 5.7 5.9 7.0 October 3.7 2.7 3.9 3.5 4.7 3.9 4.8 4.4 5.5 5.9 7.0 November 2.8 3.9 3.4 4.4 4.0 4.8
4.8
4.5 5.5 6.0 6.6 December 2.7 3.9 3.3 4.5 4.1 4.8 4.6 5.4 6.0 6.5
Annual
Average 3.3 4.4 4.0 4.9 4.5 5.3 5.4 6.2 6.7 7.4
(a) Figures show the percentage of labor force that is unemployed and are not seasonally adjusted.
(b) Historical information has been adjusted due to benchmarking through the Local Area Unemployment
Statistics (LAUS).(c) The Bureau of Labor Standards no longer reports prior year quarterly data, as appear in the 2017
Continuing Disclosure Annual Report dated December 22, 2017. This table will now only reflect actual
monthly data for the current year and the prior five years.
Source: Department of Workforce Development and U.S. Bureau of Labor Statistics

93 GENERAL INFORMATION
APPENDIX A
GENERAL PURPOSE EXTERNAL FINANCIAL STATEMENTS
The following material is a reprint of the “General Purpose External Financial Statements” section of the
audited CAFR for the fiscal year ended June 30, 2018. Any web sites listed in the General Purpose
External Financial Statements are not incorporated by reference into this Part II of the 2018 Annual
Report.
The entire CAFR is available from the State Controller’s Office, Department of Administration, P.O. Box
7864, Madison, WI 53707-7864. The entire CAFR has also been filed with the MSRB through its EMMA
system and is available on the Capital Finance website:
doa.wi.gov/capitalfinance
{This page number is the last sequential page number of the 2018 Annual Report to be used in this Part II of the 2018 Annual
Report. The following uses page numbers from the General Purpose External Financial Statements. The sequential page
numbers for the 2018 Annual Report continue in Part III.}

STATE OF
WISCONSIN
General Purpose External Financial Statements
For the fiscal year ended June 30, 2018
Scott Walker, Governor
Department of Administration
Ellen Nowak, Secretary Jeffery C. Anderson, State Controller
Prepared by the State Controller’s Office
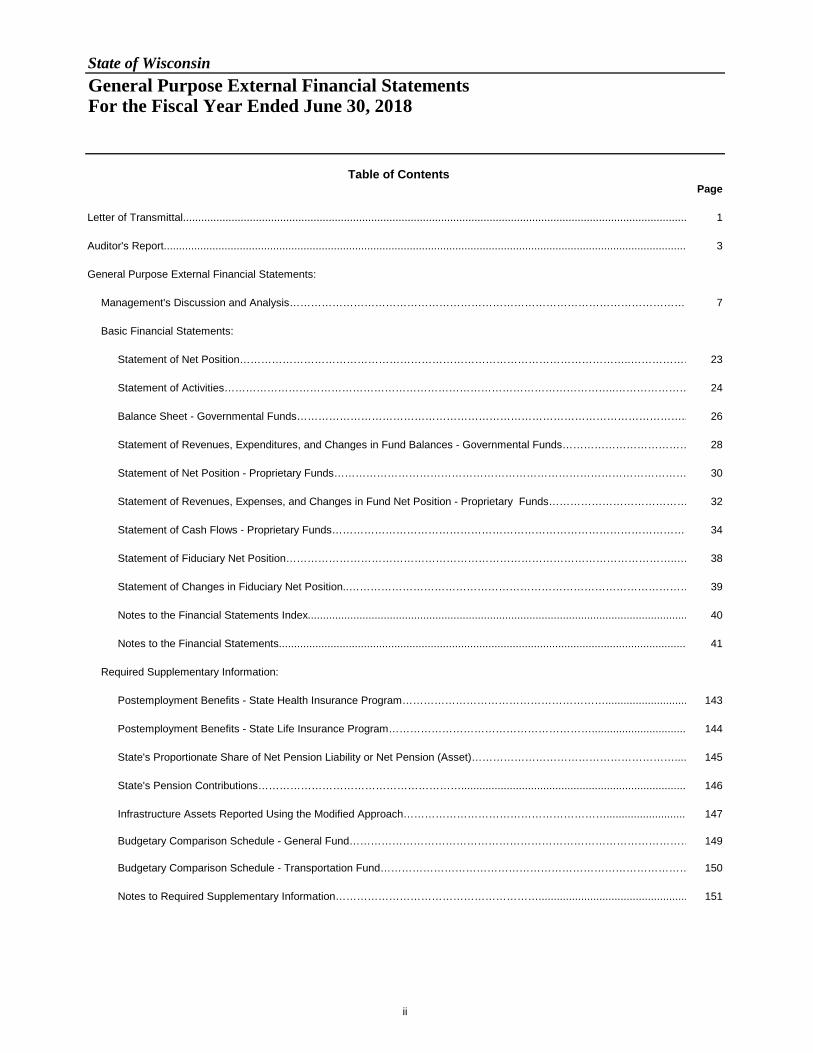
State of WisconsinGeneral Purpose External Financial StatementsFor the Fiscal Year Ended June 30, 2018
Table of ContentsPage
Letter of Transmittal...................................................................................................................................................................... 1
Auditor's Report............................................................................................................................................................................. 3
General Purpose External Financial Statements:
Management's Discussion and Analysis…………………………………………………………………………………………………… 7
Basic Financial Statements:
Statement of Net Position………………………………………………………………………………………………..……………… 23
Statement of Activities………………………………………………………………………………………………..………………… 24
Balance Sheet - Governmental Funds……………………………………………………………………………………………….. 26
Statement of Revenues, Expenditures, and Changes in Fund Balances - Governmental Funds……………………………… 28
Statement of Net Position - Proprietary Funds……………………………………………………………………………………… 30
Statement of Revenues, Expenses, and Changes in Fund Net Position - Proprietary Funds………………………………… 32
Statement of Cash Flows - Proprietary Funds………………………………………………………………………………………… 34
Statement of Fiduciary Net Position………………………………………………………………………………………………..… 38
Statement of Changes in Fiduciary Net Position..…………………………………………………………………………………… 39
Notes to the Financial Statements Index............................................................................................................................. 40
Notes to the Financial Statements....................................................................................................................................... 41
Required Supplementary Information:
Postemployment Benefits - State Health Insurance Program…………………………………………………........................... 143
Postemployment Benefits - State Life Insurance Program…………………………………………………............................... 144
State's Proportionate Share of Net Pension Liability or Net Pension (Asset)………………………………………………….... 145
State's Pension Contributions………………………………………………….......................................................................... 146
Infrastructure Assets Reported Using the Modified Approach…………………………………………………........................... 147
Budgetary Comparison Schedule - General Fund…………………………………………………………………………………… 149
Budgetary Comparison Schedule - Transportation Fund…………………………………………………………………………… 150
Notes to Required Supplementary Information…………………………………………………................................................. 151
ii

STATE OF WISCONSIN
DEPARTMENT OF ADMINISTRATION Scott Walker, Governor Ellen Nowak, Secretary
Waylon Hurlburt, Division Administrator
Executive Budget and Finance, State Controller’s Office, PO Box 7932, Madison, WI 53707‐7932 Phone: (608) 266‐1694 | DOA.WI.GOV
WISCONSIN IS OPEN FOR BUSINESS
1
December 20, 2018 The Honorable Scott Walker The Honorable Members of the Legislature Citizens of the State of Wisconsin We are pleased to submit the General Purpose External Financial Statements of the State of Wisconsin for the fiscal year ended June 30, 2018. They are part of the audited Comprehensive Annual Financial Report and present financial information in conformity with generally accepted accounting principles. The General Purpose External Financial Statements include management’s discussion and analysis (MD&A), the basic financial statements, and required supplementary information (RSI).
MD&A presents a discussion and analysis of the State’s financial performance during the fiscal year.
The basic financial statements include an overview of the government as a whole (excluding the
State’s fiduciary activities) as well as detailed information on all governmental, proprietary, and fiduciary fund activity. Notes, which are considered part of the basic financial statements, provide additional information and should be used in conjunction with the financial statements.
RSI includes information on post-employment health insurance benefits, the State’s proportionate
share of the net pension liability, the State’s pension contribution, infrastructure and the budgetary comparison schedule with accompanying notes.
The General Purpose External Financial Statements, as well as the Comprehensive Annual Financial Report, are on file at the office of the State Controller and will benefit users requiring summary information about our State's finances. The Comprehensive Annual Financial Report is available on the Department of Administration’s website. Sincerely,
Ellen Nowak Jeffery C. Anderson, CPA Secretary State Controller
IA\ DEPARTMENT OF
ADMINISTRATION
'97

2
3
Independent Auditor’s Report on the Financial Statements and Other Reporting Required by Government Auditing Standards
Honorable Members of the Legislature The Honorable Scott Walker, Governor
Report on the Financial Statements
We have audited the accompanying financial statements and the related notes of the governmental activities, the business-type activities, the aggregate discretely presented component units, each major fund, and the aggregate remaining fund information of the State of Wisconsin, which collectively make up the State’s basic financial statements, as of and for the year ended June 30, 2018, as listed in the table of contents. Management’s Responsibility for the Financial Statements
Management of the State of Wisconsin is responsible for the preparation and fair presentation of these financial statements in accordance with accounting principles generally accepted in the United States of America. This includes the design, implementation, and maintenance of internal control relevant to the preparation and fair presentation of financial statements that are free from material misstatement, whether due to fraud or error. Auditor’s Responsibility
Our responsibility is to express opinions on these financial statements based on our audit. We did not audit the financial statements for the University of Wisconsin (UW) System Fund or, the Environmental Improvement Fund, both of which are major funds and represent 69 percent of the assets and 70 percent of the liabilities of the business-type activities. We also did not audit the College Savings Program Trust Fund, which represents 4 percent of the assets of the aggregate remaining fund information. Those financial statements were audited by other auditors whose reports have been furnished to us, and our opinions, insofar as they relate to the amounts included for these funds, are based solely on the reports of the other auditors. In addition, we did not audit the financial statements of the discretely presented component units. Our opinion on the aggregate discretely presented component units is based solely upon audit reports, prepared by other auditors and furnished to us, for the Wisconsin Housing and Economic Development Authority, the UW Hospitals and Clinics Authority, and the UW Foundation. We conducted our audit in accordance with auditing standards generally accepted in the United States of America and the standards applicable to financial audits contained in Government Auditing Standards, which is issued by the Comptroller General of the United States. Those standards require that we plan and perform the audit to obtain reasonable assurance about whether the financial statements are free from material misstatement. The financial statements for the following were audited by other auditors in accordance with these standards: the UW System Fund, the Environmental Improvement Fund, the College Savings Program Trust Fund, the Wisconsin Housing and Economic Development Authority, and the UW Hospitals and Clinics Authority. The financial statements of the UW Foundation were
sTATE oF wiscoNsIN I Legislative Audit Bureau 22 East Mifflin St., Sui te 500 • Madison, WI 53703 • (608) 266-2818 • Hot line: 1-877-FRAUD-17 • www.legis.wisconsin.gov/ lab
joe Chrisman State Auditor

4
audited by other auditors in accordance with auditing standards generally accepted in the United States of America, but not in accordance with Government Auditing Standards. An audit involves performing procedures to obtain audit evidence about the amounts and disclosures in the financial statements. The procedures selected depend on the auditor’s judgment, including the assessment of the risks of material misstatement of the financial statements, whether due to fraud or error. In making those risk assessments, the auditor considers internal control relevant to the entity’s preparation and fair presentation of the financial statements in order to design audit procedures that are appropriate in the circumstances, but not for the purpose of expressing an opinion on the effectiveness of the entity’s internal control. Accordingly, we express no such opinion. An audit also includes evaluating the appropriateness of the accounting policies used and the reasonableness of significant accounting estimates made by management, as well as evaluating the overall presentation of the financial statements. We believe that the audit evidence we have obtained is sufficient and appropriate to provide a basis for our opinions on these financial statements. Opinions
In our opinion, based on our audit and the reports of other auditors, the financial statements referred to in the first paragraph present fairly, in all material respects, the financial position of the governmental activities, the business-type activities, the aggregate discretely presented component units, each major fund, and the aggregate remaining fund information of the State of Wisconsin as of June 30, 2018, and the respective changes in its financial position and, where applicable, cash flows for the year then ended in accordance with accounting principles generally accepted in the United States of America. Emphases of Matter
As discussed in Note 1D, the State implemented Governmental Accounting Standards Board (GASB) Statement Number 74, Accounting and Financial Reporting for Postemployment Benefit Plans Other Than Pension Plans, and Statement Number 75, Accounting and Financial Reporting for Postemployment Benefits Other than Pensions. These statements changed presentation and disclosure requirements for employers that offer other postemployment benefits. As described in Notes 1E and 7, UW System changed its method of accounting for library holdings. Library holdings are now reported as depreciable capital assets. As discussed in Note 5B, the financial statements include investments that do not have readily ascertainable market prices and are valued based on a variety of third-party pricing methods. However, because of the inherent uncertainty of valuation, those estimated values may differ from the values that would have been used had a ready market for the investments existed. As discussed in Note 5B to the financial statements, as of June 30, 2018, the State Investment Fund held $1.6 billion in a repurchase agreement with the Wisconsin Retirement System. The State Investment Fund and the Wisconsin Retirement System are both administered by the State of Wisconsin Investment Board. Certain account balances cannot be measured precisely but must be estimated, particularly actuarially accrued liabilities and infrastructure assets reported in the financial statements and notes. Notes 14, 17, 18, and 20 include a discussion of estimates used by funds that accrue

5
liabilities based upon actuarial information, including assumptions used in their calculation, and other sources. Note 1E includes information related to the estimated historical cost of infrastructure assets constructed prior to July 1, 2000. Because estimates are based upon information available when the financial statements are prepared, actual values may differ from the estimated amounts. These differences cannot be quantified.
Our opinions are not modified with respect to these matters.
Other Matters
Required Supplementary Information—Accounting principles generally accepted in the United States of America require that the Management’s Discussion and Analysis, and the following items in the required supplementary information section, as listed in the table of contents—Postemployment Benefits–State Health Insurance Program, Postemployment Benefits–State Life Insurance Program, State’s Proportionate Share of Net Pension Liability or Net Pension (Asset), State’s Pension Contributions, Infrastructure Assets Reported Using the Modified Approach, Budgetary Comparison Schedule–General Fund, Budgetary Comparison Schedule–Transportation Fund, and Notes to Required Supplementary Information—be presented to supplement the basic financial statements. Such information, although not a part of the basic financial statements, is required by GASB, which considers it to be essential for placing the basic financial statements in an appropriate operational, economic, or historical context. In accordance with auditing standards generally accepted in the United States of America, we have applied certain limited procedures to the required supplementary information that included inquiries of management about the methods of preparing the information. We further compared the information for consistency with management’s responses to our inquiries, the basic financial statements, and other knowledge we obtained during our audit of the basic financial statements. We do not express an opinion or provide any assurance on the information because the limited procedures do not provide us with sufficient evidence to express an opinion or provide any assurance.
Other Reporting Required by Government Auditing Standards
In accordance with Government Auditing Standards, we have also issued a report dated December 20, 2018, on our consideration of the State’s internal control over financial reporting; our tests of its compliance with certain provisions of laws, regulations, contracts, and grant agreements; and other matters. The purpose of that report is solely to describe the scope of our testing of internal control over financial reporting and compliance and the results of that testing, and not to provide an opinion on the effectiveness of the State’s internal control over financial reporting or on compliance. That report is an integral part of an audit performed in accordance with Government Auditing Standards and should be used when considering the State’s internal control over financial reporting and compliance.
LEGISLATIVE AUDIT BUREAU
Joe ChrismanState Auditor
December 20, 2018

6

State of Wisconsin Management Discussion and Analysis
For the Fiscal Year Ended June 30, 2018
7
MANAGEMENT’S DISCUSSION AND ANALYSIS The Management's Discussion and Analysis of the State of Wisconsin’s Comprehensive Annual Financial Report (CAFR)
presents a discussion and analysis of the State’s financial performance during the fiscal year that ended June 30, 2018. It
should be read in conjunction with the transmittal letter located at the front of this CAFR, and the State’s financial statements,
including the note disclosures which are an integral part of the statements, that follow this part of the CAFR.
FINANCIAL HIGHLIGHTS -- PRIMARY GOVERNMENT
Government-wide (Tables 2 and 3 on Pages 10 and 11) • Net Position. The assets plus deferred outflows of resources of the State of Wisconsin exceeded its liabilities plus deferred
inflows of resources at the close of Fiscal Year 2018 by $24.9 billion (reported as "net position"). Of this amount, $(8.2) billion
was reported as "unrestricted net position". A positive balance in unrestricted net position would represent the amount
available to be used to meet a government's ongoing obligations to citizens and creditors.
• Changes in Net Position. The State's total net position increased by $1.7 billion in Fiscal Year 2018. Net position of
governmental activities increased by $1.1 billion or 8.2 percent, while net position of the business-type activities showed an
increase of $658.0 million or 6.4 percent.
• Excess of Revenues over (under) Expenses -- Governmental Activities. During Fiscal Year 2018, the State’s total revenues
for governmental activities of $30.1 billion were $2.1 billion more than total expenses (excluding transfers) for governmental
activities of $28.0 billion. Of these expenses, $12.2 billion were covered by program revenues. General revenues, generated
primarily from various taxes, totaled $17.8 billion.
Fund • Governmental Funds -- Fund Balances. As of the close of Fiscal Year 2018, the State's governmental funds reported
combined ending fund balances of $1.3 billion, an increase of $927.4 million in comparison with the prior year. Of this total
amount, $(2.1) billion represents the unassigned fund balances.
• General Fund -- Fund Balance. At the end of the current fiscal year, total fund balance was $(1.3) billion, a change of
$372.4 million from a deficit of $(1.6) billion reported in the prior year. The unassigned fund deficit for the General Fund was
$(1.8) billion, or 7.6 percent of total General Fund expenditures.
Additional information regarding individual funds begins on Page 15.
Long-term Debt • The State's total long-term debt obligations (bonds and notes payable) increased by $257.8 million during the current fiscal
year which represents the net difference between new issuances, payments and refundings of outstanding debt. Increases
in debt resulted from new borrowings in excess of repayments of existing debt, and the continued reporting of crossover
refunded debt. The state issued crossover refunding bonds during Fiscal Year 2018 to refund $530.4 million in certain
general obligation and transportation revenue bonds. The outstanding refunded bonds will continue to be reported as a
liability and resources provided by the refunding are held in escrow and reported as assets until the crossover dates. At the
crossover dates those assets will be sufficient to redeem the $530.4 million of refunded bonds. During the year issuances
of new general obligations exceeded repayments and refundings of debt by $352.6 million. Revenue bonds outstanding
decreased by $24.9 million. Annual appropriation bonds totaling $69.9 million were repaid. Additional detail regarding these
activities begins on Page 20.
OVERVIEW OF THE FINANCIAL STATEMENTS
The Financial Section of this CAFR consists of four parts: (1) management's discussion and analysis (this section), (2) basic financial statements, (3) additional required supplementary information, and (4) optional other supplementary information. Parts (2), (3), and (4) are briefly described on the following pages:
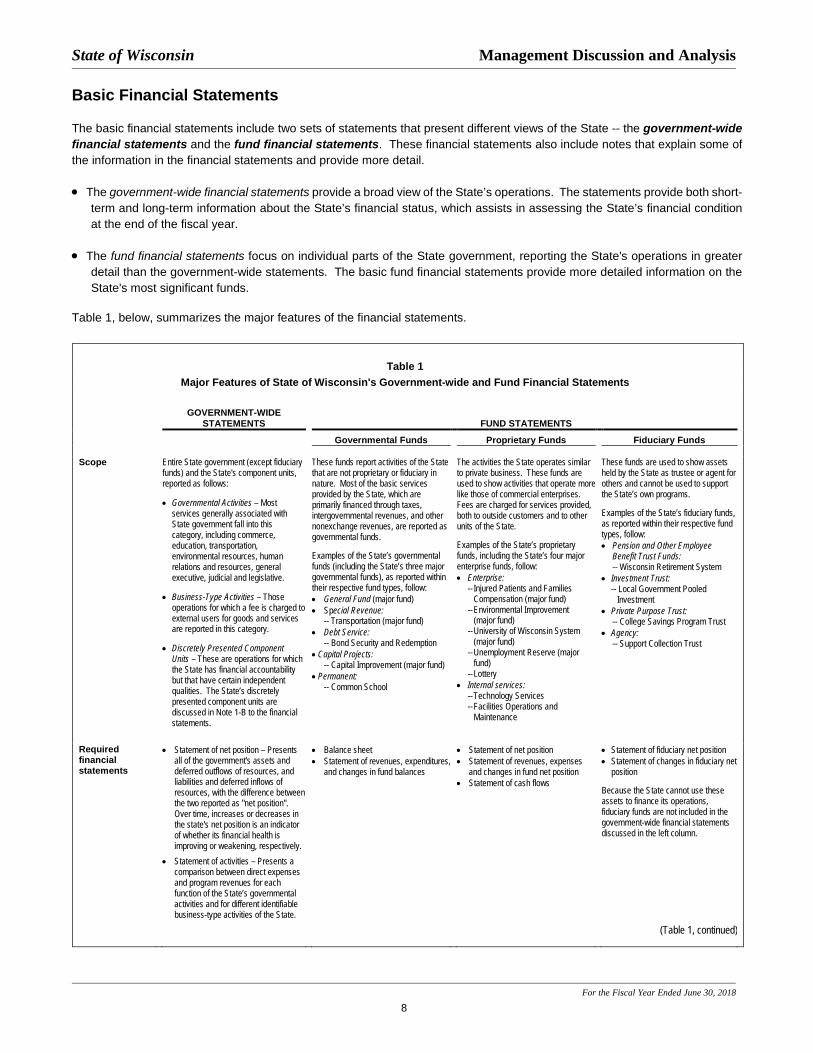
State of Wisconsin Management Discussion and Analysis
For the Fiscal Year Ended June 30, 2018
8
Basic Financial Statements
The basic financial statements include two sets of statements that present different views of the State -- the government-wide financial statements and the fund financial statements. These financial statements also include notes that explain some of
the information in the financial statements and provide more detail.
• The government-wide financial statements provide a broad view of the State’s operations. The statements provide both short-
term and long-term information about the State’s financial status, which assists in assessing the State’s financial condition
at the end of the fiscal year.
• The fund financial statements focus on individual parts of the State government, reporting the State's operations in greater
detail than the government-wide statements. The basic fund financial statements provide more detailed information on the
State's most significant funds.
Table 1, below, summarizes the major features of the financial statements.
Table 1 Major Features of State of Wisconsin's Government-wide and Fund Financial Statements
GOVERNMENT-WIDE STATEMENTS
FUND STATEMENTS
Governmental Funds Proprietary Funds Fiduciary Funds Scope Entire State government (except fiduciary
funds) and the State's component units, reported as follows: • Governmental Activities – Most
services generally associated with State government fall into this category, including commerce, education, transportation, environmental resources, human relations and resources, general executive, judicial and legislative.
• Business-Type Activities – Those
operations for which a fee is charged to external users for goods and services are reported in this category.
• Discretely Presented Component
Units – These are operations for which the State has financial accountability but that have certain independent qualities. The State’s discretely presented component units are discussed in Note 1-B to the financial statements.
These funds report activities of the State that are not proprietary or fiduciary in nature. Most of the basic services provided by the State, which are primarily financed through taxes, intergovernmental revenues, and other nonexchange revenues, are reported as governmental funds. Examples of the State’s governmental funds (including the State’s three major governmental funds), as reported within their respective fund types, follow: • General Fund (major fund) • Special Revenue: -- Transportation (major fund) • Debt Service: -- Bond Security and Redemption • Capital Projects: -- Capital Improvement (major fund) • Permanent: -- Common School
The activities the State operates similar to private business. These funds are used to show activities that operate more like those of commercial enterprises. Fees are charged for services provided, both to outside customers and to other units of the State. Examples of the State’s proprietary funds, including the State’s four major enterprise funds, follow: • Enterprise:
-- Injured Patients and Families Compensation (major fund)
-- Environmental Improvement (major fund)
-- University of Wisconsin System (major fund)
-- Unemployment Reserve (major fund)
-- Lottery • Internal services:
-- Technology Services -- Facilities Operations and
Maintenance
These funds are used to show assets held by the State as trustee or agent for others and cannot be used to support the State’s own programs. Examples of the State’s fiduciary funds, as reported within their respective fund types, follow: • Pension and Other Employee
Benefit Trust Funds: -- Wisconsin Retirement System
• Investment Trust: -- Local Government Pooled
Investment • Private Purpose Trust:
-- College Savings Program Trust • Agency:
-- Support Collection Trust
Required financial statements
• Statement of net position – Presents all of the government's assets and deferred outflows of resources, and liabilities and deferred inflows of resources, with the difference between the two reported as "net position". Over time, increases or decreases in the state's net position is an indicator of whether its financial health is improving or weakening, respectively.
• Statement of activities – Presents a comparison between direct expenses and program revenues for each function of the State’s governmental activities and for different identifiable business-type activities of the State.
• Balance sheet • Statement of revenues, expenditures,
and changes in fund balances
• Statement of net position • Statement of revenues, expenses
and changes in fund net position • Statement of cash flows
• Statement of fiduciary net position • Statement of changes in fiduciary net
position Because the State cannot use these assets to finance its operations, fiduciary funds are not included in the government-wide financial statements discussed in the left column.
(Table 1, continued)
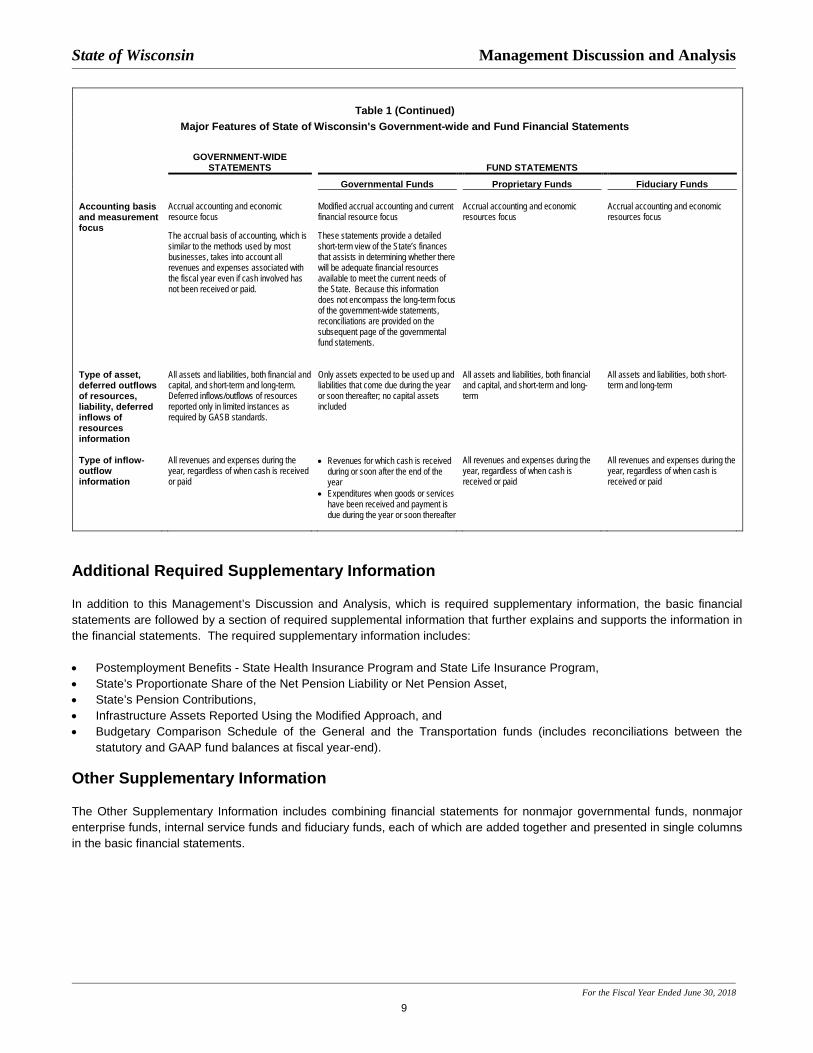
State of Wisconsin Management Discussion and Analysis
For the Fiscal Year Ended June 30, 2018
9
Table 1 (Continued) Major Features of State of Wisconsin's Government-wide and Fund Financial Statements
GOVERNMENT-WIDE STATEMENTS
FUND STATEMENTS
Governmental Funds Proprietary Funds Fiduciary Funds Accounting basis and measurement focus
Accrual accounting and economic resource focus The accrual basis of accounting, which is similar to the methods used by most businesses, takes into account all revenues and expenses associated with the fiscal year even if cash involved has not been received or paid.
Modified accrual accounting and current financial resource focus These statements provide a detailed short-term view of the State’s finances that assists in determining whether there will be adequate financial resources available to meet the current needs of the State. Because this information does not encompass the long-term focus of the government-wide statements, reconciliations are provided on the subsequent page of the governmental fund statements.
Accrual accounting and economic resources focus
Accrual accounting and economic resources focus
Type of asset, deferred outflows of resources, liability, deferred inflows of resources information
All assets and liabilities, both financial and capital, and short-term and long-term. Deferred inflows/outflows of resources reported only in limited instances as required by GASB standards.
Only assets expected to be used up and liabilities that come due during the year or soon thereafter; no capital assets included
All assets and liabilities, both financial and capital, and short-term and long-term
All assets and liabilities, both short-term and long-term
Type of inflow-outflow information
All revenues and expenses during the year, regardless of when cash is received or paid
• Revenues for which cash is received during or soon after the end of the year
• Expenditures when goods or services have been received and payment is due during the year or soon thereafter
All revenues and expenses during the year, regardless of when cash is received or paid
All revenues and expenses during the year, regardless of when cash is received or paid
Additional Required Supplementary Information In addition to this Management’s Discussion and Analysis, which is required supplementary information, the basic financial
statements are followed by a section of required supplemental information that further explains and supports the information in
the financial statements. The required supplementary information includes:
• Postemployment Benefits - State Health Insurance Program and State Life Insurance Program,
• State’s Proportionate Share of the Net Pension Liability or Net Pension Asset,
• State’s Pension Contributions,
• Infrastructure Assets Reported Using the Modified Approach, and
• Budgetary Comparison Schedule of the General and the Transportation funds (includes reconciliations between the
statutory and GAAP fund balances at fiscal year-end).
Other Supplementary Information
The Other Supplementary Information includes combining financial statements for nonmajor governmental funds, nonmajor
enterprise funds, internal service funds and fiduciary funds, each of which are added together and presented in single columns
in the basic financial statements.
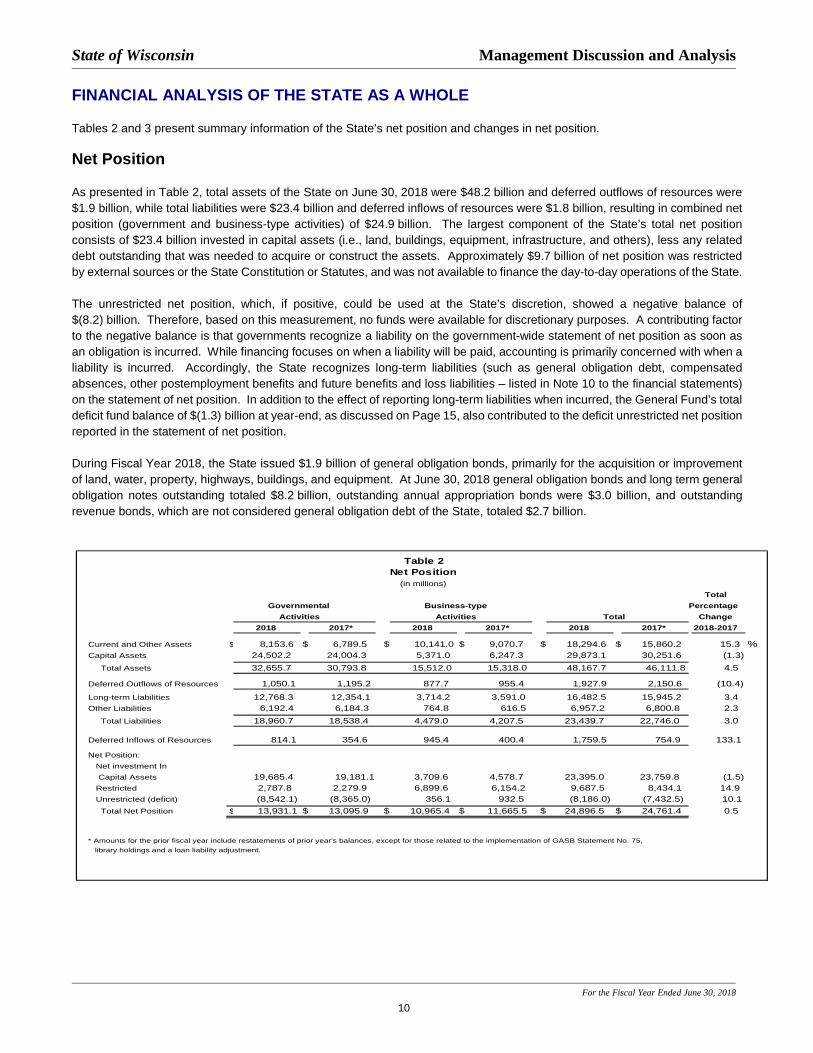
State of Wisconsin Management Discussion and Analysis
For the Fiscal Year Ended June 30, 2018
10
FINANCIAL ANALYSIS OF THE STATE AS A WHOLE
Tables 2 and 3 present summary information of the State’s net position and changes in net position.
Net Position
As presented in Table 2, total assets of the State on June 30, 2018 were $48.2 billion and deferred outflows of resources were
$1.9 billion, while total liabilities were $23.4 billion and deferred inflows of resources were $1.8 billion, resulting in combined net
position (government and business-type activities) of $24.9 billion. The largest component of the State’s total net position
consists of $23.4 billion invested in capital assets (i.e., land, buildings, equipment, infrastructure, and others), less any related
debt outstanding that was needed to acquire or construct the assets. Approximately $9.7 billion of net position was restricted
by external sources or the State Constitution or Statutes, and was not available to finance the day-to-day operations of the State.
The unrestricted net position, which, if positive, could be used at the State’s discretion, showed a negative balance of
$(8.2) billion. Therefore, based on this measurement, no funds were available for discretionary purposes. A contributing factor
to the negative balance is that governments recognize a liability on the government-wide statement of net position as soon as
an obligation is incurred. While financing focuses on when a liability will be paid, accounting is primarily concerned with when a
liability is incurred. Accordingly, the State recognizes long-term liabilities (such as general obligation debt, compensated
absences, other postemployment benefits and future benefits and loss liabilities – listed in Note 10 to the financial statements)
on the statement of net position. In addition to the effect of reporting long-term liabilities when incurred, the General Fund’s total
deficit fund balance of $(1.3) billion at year-end, as discussed on Page 15, also contributed to the deficit unrestricted net position
reported in the statement of net position.
During Fiscal Year 2018, the State issued $1.9 billion of general obligation bonds, primarily for the acquisition or improvement
of land, water, property, highways, buildings, and equipment. At June 30, 2018 general obligation bonds and long term general
obligation notes outstanding totaled $8.2 billion, outstanding annual appropriation bonds were $3.0 billion, and outstanding
revenue bonds, which are not considered general obligation debt of the State, totaled $2.7 billion.
Table 2Net Position
(in millions)
TotalGovernmental Business-type Percentage
Activities Activities Total Change2018 2017* 2018 2017* 2018 2017* 2018-2017
Current and Other Assets $ 8,153.6 $ 6,789.5 $ 10,141.0 $ 9,070.7 $ 18,294.6 $ 15,860.2 15.3 %
Capital Assets 24,502.2 24,004.3 5,371.0 6,247.3 29,873.1 30,251.6 (1.3)
Total Assets 32,655.7 30,793.8 15,512.0 15,318.0 48,167.7 46,111.8 4.5
Deferred Outflows of Resources 1,050.1 1,195.2 877.7 955.4 1,927.9 2,150.6 (10.4)
Long-term Liabilities 12,768.3 12,354.1 3,714.2 3,591.0 16,482.5 15,945.2 3.4
Other Liabilities 6,192.4 6,184.3 764.8 616.5 6,957.2 6,800.8 2.3
Total Liabilities 18,960.7 18,538.4 4,479.0 4,207.5 23,439.7 22,746.0 3.0
Deferred Inflows of Resources 814.1 354.6 945.4 400.4 1,759.5 754.9 133.1
Net Position:
Net investment In
Capital Assets 19,685.4 19,181.1 3,709.6 4,578.7 23,395.0 23,759.8 (1.5)
Restricted 2,787.8 2,279.9 6,899.6 6,154.2 9,687.5 8,434.1 14.9
Unrestricted (deficit) (8,542.1) (8,365.0) 356.1 932.5 (8,186.0) (7,432.5) 10.1
Total Net Position $ 13,931.1 $ 13,095.9 $ 10,965.4 $ 11,665.5 $ 24,896.5 $ 24,761.4 0.5
* Amounts for the prior fiscal year include restatements of prior year's balances, except for those related to the implementation of GASB Statement No. 75,
library holdings and a loan liability adjustment.

State of Wisconsin Management Discussion and Analysis
For the Fiscal Year Ended June 30, 2018
11
Changes in Net Position
The revenues and expenses information, as shown in Table 3, was derived from the government-wide statement of activities
and reflects how the State’s net position changed during the fiscal year. The State earned program revenues of $19.8 billion
and general revenues of $17.9 billion for total revenues of $37.7 billion during Fiscal Year 2018. Expenses for the State during
Fiscal Year 2018 were $36.0 billion. As a result of the excess of revenues over expenses, the total net position of the State
increased $1.7 billion, net of contributions and transfers.
Table 3Changes in Net Position
(in millions)
T o talGo vernmental B usiness-type T o tal P rimary P ercentage
A ct iv it ies A ct ivit ies Go vernment C hange2018 2017* 2018 2017* 2018 2017* 2018-2017
Program Revenues:
Charges for Services $ 2,400.5 $ 2,375.5 $ 6,693.7 $ 6,778.8 $ 9,094.2 $ 9,154.3 (0.7) %
Operating Grants and Contributions 9,087.5 8,737.8 812.5 610.1 9,900.0 9,347.8 5.9
Capital Grants and Contributions 760.6 601.1 45.2 22.6 805.8 623.7 29.2
General Revenues:
Income Taxes 9,450.7 8,928.2 - - 9,450.7 8,928.2 5.9
Sales and Excise Taxes 6,046.5 5,931.2 - - 6,046.5 5,931.2 1.9
Public Utility Taxes 361.7 357.8 - - 361.7 357.8 1.1
M otor Fuel Taxes 1,121.8 1,101.7 - - 1,121.8 1,101.7 1.8
Other Taxes 404.7 516.1 - - 404.7 516.1 (21.6)
Other General Revenues 444.6 415.5 22.1 8.8 466.8 424.4 10.0
Total Revenues 30,078.5 28,965.0 7,573.5 7,420.3 37,652.1 36,385.3 3.5
Program Expenses:
Commerce 266.2 248.9 - - 266.2 248.9 7.0
Education 7,442.1 7,237.5 - - 7,442.1 7,237.5 2.8
Transportation 2,379.9 2,139.4 - - 2,379.9 2,139.4 11.2
Environmental Resources 473.3 458.1 - - 473.3 458.1 3.3
Human Relations and Resources 13,599.5 13,396.2 - - 13,599.5 13,396.2 1.5
General Executive 626.3 675.5 - - 626.3 675.5 (7.3)
Judicial 143.1 142.6 - - 143.1 142.6 0.3
Legislative 69.3 70.3 - - 69.3 70.3 (1.5)
Tax Relief and Other General Expenditures 1,612.8 1,428.6 - - 1,612.8 1,428.6 12.9
Intergovernmental - Shared Revenue 972.1 967.0 - - 972.1 967.0 0.5
Interest on Long-term Debt 440.1 450.1 - - 440.1 450.1 (2.2)
Injured Patients and Families Compensation - - 23.7 (56.9) 23.7 (56.9) (141.7)
Environmental Improvement - - 43.1 74.1 43.1 74.1 (41.8)
University o f Wisconsin System - - 4,973.2 5,005.3 4,973.2 5,005.3 (0.6)
Unemployment Reserve - - 411.7 471.3 411.7 471.3 (12.7)
Lottery - - 661.3 616.6 661.3 616.6 7.3
Health Insurance - - 1,287.4 1,290.5 1,287.4 1,290.5 (0.2)
Care and Treatment Facilities - - 391.7 395.7 391.7 395.7 (1.0)
Other Business-type - - 135.2 169.6 135.2 169.6 (20.3)
Total Expenses 28,024.8 27,214.2 7,927.3 7,966.2 35,952.1 35,180.4 2.2
Excess (deficiency) before Contributions,
Special Items and Transfers 2,053.8 1,750.8 (353.8) (545.9) 1,700.0 1,204.9
Contributions to Term and Permanent Endowments - - 1.1 2.0 1.1 2.0
Contributions to Permanent Fund Principal 12.3 12.6 - - 12.3 12.6
Special Item - (Surrender)/Cancellation of GO Bonds - 148.9 - (169.4) - (20.5)
Transfers (1,010.6) (905.1) 1,010.6 905.1 - -
Increase (decrease) in Net Position 1,055.4 1,007.1 658.0 191.8 1,713.4 1,198.9
Net Position - Beginning (Prior Year Ending) 13,095.9 12,088.9 11,665.5 11,473.6 24,761.4 23,562.5
Change in Accounting Principle (16.5) (1,110.9) (1,127.4)
Effect of Implementation o f GASB Statement No. 75 (203.8) - (247.1) - (450.9) -
Net Position - Beginning (Restated) 12,875.7 12,088.9 10,307.4 11,473.6 23,183.1 23,562.5
Net Position - Ending $ 13,931.1 $ 13,095.9 $ 10,965.4 $ 11,665.5 $ 24,896.5 $ 24,761.4 0.5
* Amounts for the prior f iscal year include restatements of prior year's balances, except for those related to the implementat ion of GASB Statement No. 75,
library holdings and a loan liability adjustment.

State of Wisconsin Management Discussion and Analysis
For the Fiscal Year Ended June 30, 2018
12
Governmental Activities The net position of governmental activities increased $1.1 billion in Fiscal Year 2018. Revenues for the governmental activities
(including contributions to permanent fund principal) totaled $30.1 billion, while expenses and net transfers totaled $29.0 billion
in Fiscal Year 2018.
General and program revenues of governmental activities increased $1.1 billion during this fiscal year. Tax revenues increased
$550.2 million primarily due to enhanced income and sales and excise taxes of $522.4 million and $115.3 million, respectively,
while other taxes decreased $111.5 million from the prior year. Operating grants increased by $349.8 million, while capital
grants also increased by $159.5 million. In addition, other general revenues and charges for goods and services increased
$29.1 million and $25.0 million, respectively.
The State’s governmental activities program expenses increased $810.5 million to $28.0 billion during Fiscal Year 2018. Human
relations and resources expenses increased by $203.3 million (1.5 percent) to a total of $13.6 billion. Education expenses
increased by $204.6 million (2.8 percent) to $7.4 billion due in part to increase in per pupil aid. Transportation expenses
increased $240.5 million (11.2 percent) to $2.4 billion as the result of increased operating costs to maintain and preserve
infrastructure. A one-time Child Sales Tax Rebate caused tax relief and other general expenses to increase $184.2 million (12.9
percent) to $1.6 billion. Commerce and environmental resource expenses increased $17.3 million and $15.2 million,
respectively. Conversely, general executive expenses decreased $49.1 million, while interest on long-term debt also decreased
$10.1 million.
As shown in Table 4, below, approximately 57.8 percent of revenues from all sources earned came from taxes (sales and excise,
income, public utility, motor fuel, and other taxes). Operating grants and contributions represent amounts received from other
governments/entities – primarily the federal government. Operating grants and contributions for non-capital purposes provided
30.2 percent of total revenues. Capital grants and contributions provided 2.5 percent, charges for services contributed
8.0 percent, while various other revenues provided 1.5 percent of the remaining governmental activity revenue sources.
Charges for Serv ices8.0%
Operating Grants and Contributions
30.2%
Capital Grants and Contributions
2.5%Income Tax es31.4%
Sales and Ex cise Taxes20.1%
Public Utility Taxes1.2%
Motor Fuel Tax es3.8%
Other Tax es1.3%
Other General Rev enues1.5%
Other10.3%
Table 4Governmental Activities - 2018 Revenues

State of Wisconsin Management Discussion and Analysis
For the Fiscal Year Ended June 30, 2018
13
As shown in Table 5, below, expenses for human relations and resources programs make up the largest portion – 46.8 percent
– of total governmental expenses and transfers. Included in this cost function are programs such as Medical Assistance and
Temporary Assistance for Needy Families as well as costs for state correctional facilities and services.
Educational expenses, which include various school aids but exclude expenses of the University of Wisconsin System, make up
25.6 percent of total expenses. Tax relief and other general expenses and the municipal and county shared revenue program
represent 9.0 percent of the total, while transportation expenses represent 8.2 percent. Net transfers to business-type activities,
which include a general purpose revenue subsidy to the University of Wisconsin System, make up 3.5 percent of the total
expenses and transfers. Remaining functional expenses totaled 5.4 percent while interest on long-term debt totaled 1.5 percent.
Human Relations and Resources46.8%
Education (excludes University of Wisconsin System)
25.6%
Tax Relief and Other General Expenses
5.6%Intergovernmental
(Shared Revenues)3.4%
Transfers3.5%
Transportation8.2%
Environmental Resources1.6%
Interest on Long-term Debt1.5%
General Executive2.2%
Commerce0.9%
Judicial0.5%Legislative
0.2%
Other13.8%
Table 5 Governmental Activities - 2018 Expenses

State of Wisconsin Management Discussion and Analysis
For the Fiscal Year Ended June 30, 2018
14
Business-Type Activities
Net position of the State’s business-type activities increased $658.0 million in Fiscal Year 2018.
Revenues of business-type activities totaled $7.6 billion for Fiscal Year 2018, an increase of $153.3 million from the prior year.
Program revenues consisted of $6.7 billion of charges for services, $812.5 million of operating grants and contributions, and
$45.2 million of capital grants and contributions. General revenues, contributions to endowments and permanent fund principal
and net transfers totaled $22.1 million, $1.1 million, and $1.0 billion, respectively.
The total expenses for business-type activities were $7.9 billion, a decrease of $38.8 million from the prior fiscal year. The
largest decrease in program expenses, $59.7 million, related to decreased expenses for the Unemployment Reserve. Expenses
for the University of Wisconsin System, Environmental Improvement and other business type program expenses also decreased
$32.1 million, $31.0 million and $34.4 million, respectively. Offsetting those decreases were increases in Injured Patients and
Family Compensation and Lottery funds of $80.7 million and $44.7 million, respectively.
Table 6, below, compares the program revenues and program expenses of the various State business-type activities. This table
does not include the transfer in (subsidy) from the General Fund to the University of Wisconsin System or other business-type
activities.
$0
$500
$1,000
$1,500
$2,000
$2,500
$3,000
$3,500
$4,000
$4,500
$5,000
$5,500
Injured Patientsand Families
Compensation
EnvironmentalImprovement
University ofWisconsin System
UnemploymentReserve
Lottery Health Insurance Care andTreatment
Other Business-type
Totals (in millions)
Table 6Fiscal Year 2018
Business-Type ActivitiesComparison of Program Revenues to Program Expenses
Program Re venue s
(e xclu des g eneral
re venue s)
Program Expenses
[]
State of Wisconsin Management Discussion and Analysis
For the Fiscal Year Ended June 30, 2018
15
FINANCIAL ANALYSIS OF THE STATE'S INDIVIDUAL FUNDS
Governmental Funds
At the end of Fiscal Year 2018, the State's governmental funds reported a combined fund balance of $1.3 billion. Funds with
significant changes in fund balance are discussed below:
General Fund
The General Fund is the chief operating fund of the State. At June 30, 2018, the State's General Fund reported a total fund
deficit of $(1.3) billion. The net change in fund balance during Fiscal Year 2018 was $372.4 million, in contrast to $96.7 million
in Fiscal Year 2017. Major revenue, expenditure and other sources/uses contributing to the change in fund balance are as
follows:
Revenues
Revenues of the General Fund totaled $26.4 billion in Fiscal Year 2018, an increase of $960.7 million (3.8 percent) from
the prior year. Factors contributing to this change included the following:
• Revenues from taxes increased $634.7 million. The increases relate to income and sales taxes, which increased
$526.3 million and $116.4 million, respectively, from Fiscal Year 2017. Sales tax revenue increases were driven by
increased consumer expenditures for taxable goods, while the increase in income taxes was the result of growth in
personal income.
• Intergovernmental revenues (i.e. federal assistance) increased $317.9 million to $8.7 billion in Fiscal Year 2018.
Human relations and resources programs (e.g. Medicaid) reported increased revenues of $331.8 million. Because
costs are split between federal and State sources, revenues associated with Medicaid related programs increase as
costs increase.
Expenditures
2017 Wisconsin Act 59 established spending authority for the State of Wisconsin for Fiscal Year 2018. Expenditures of
the General Fund totaled $24.3 billion in Fiscal Year 2018, an increase of $602.7 million from Fiscal Year 2017. Factors
contributing to the change include the following:
• Human relations and resources expenditures increased by $261.5 million to $13.4 billion, primarily the result of
increased medical assistance costs. These costs comprise 55.2 percent of General Fund expenditures.
• Education expenditures increased $203.6 million to $7.4 billion, due in part to an increase in per pupil aid in Fiscal
Year 2018. These costs comprise 30.2 percent of General Fund expenditures.
• Tax relief and other general expenditures increased by $181.3 million to a total of $1.6 billion primarily the result of a
one-time Child Sales Tax Rebate in Fiscal Year 2018.
Other Financing Sources and Uses
Other financing sources/uses totaled a net $(1.7) billion in Fiscal Year 2018, an $84.0 million increase from Fiscal
Year 2017. The components of this included the following:
• Transfers out of the General Fund totaled $1.8 billion, an increase of $43.4 million from the prior year.
• The GPR supplement comprises a large portion of the transfers out and is provided to various enterprise funds.
The supplement totaled $909.4 million, an increase of $38.7 million from the prior year. The University of
Wisconsin System, which receives the majority of the GPR supplement, had $838.8 million in GPR expenses in
Fiscal Year 2018, an increase of $30.6 million.
State of Wisconsin Management Discussion and Analysis
For the Fiscal Year Ended June 30, 2018
16
• Transfers out for debt service payments to the Bond Security and Redemption Fund totaled $466.9 million in
Fiscal Year 2018 compared to $514.8 million in Fiscal Year 2017.
• Transfers out to nonmajor enterprise funds, the Capital Improvement Fund and Transportation Fund were
$101.2 million, $83.4 million and $43.4 million, respectively.
• Transfers in to the General Fund decreased $42.0 million (from $99.6 million in Fiscal Year 2017 to $57.6 million in
Fiscal Year 2018). Non-major enterprise funds transferred $22.4 million while non-major governmental funds and the
University of Wisconsin System transferred $19.0 million and $13.3 million, respectively.
Note 9D provides additional information on transfers in and out of the General Fund.
As of June 30, 2018, the General Fund reported an unassigned fund balance deficit of $(1.8) billion, a reduction of the deficit
of $310.9 million from the prior year. A deficit unassigned fund balance represents the excess of the liabilities of the General
Fund over its assets and nonspendable, restricted, and committed fund balance accounts.
General Fund Budgetary Highlights
Differences between the original budget and the final amended budget were significant and included a $3.7 billion increase in
appropriations. Contributing to the variance is the fact that several of the State’s programs and various transfers (see the
items denoted with *, below) are not included in the original budget. In addition, numerous adjustments to spending
estimates were needed as the year progressed because of changing circumstances (spending needs can change
dramatically over a one-year period). The largest variances occurred in the following appropriations (in millions):
Program Variance
Food Stamps, Electronic Benefit Transfer* $ 1,200.0
Federal Aid Medical Assistance 544.1
UW System, General Program Operations (part of Statutory General Fund) 197.8
Federal Aid Local Assistance 145.1
Child Sales Tax Rebate* 122.1
Actual charges to appropriations (expenditures) were $3.6 billion below the final budgeted estimates. Large positive
expenditure variances were reported in the Medical Assistance Federal Aid ($637.2 million) and the Food Stamps Benefits
($368.0 million) appropriations.
During the past fiscal year, the budgetary-based fund balance increased $212.4 million for the statutory General Fund, in part,
because of increased general purpose revenues for taxes. Net transfers from other funds totaled $47.4 million in Fiscal Year
2018 compared to $20.0 million in the prior fiscal year.

State of Wisconsin Management Discussion and Analysis
For the Fiscal Year Ended June 30, 2018
17
Transportation Fund
In Fiscal Year 2018, the Transportation Fund’s fund balance increased $73.5 million (12.6 percent) from $582.4 million to
$655.9 million. The state constitution restricts use of state resources deposited into the Fund for transportation purposes. As
such, $637.7 million or 97.2 percent of fund balance is reported as restricted for Fiscal Year 2018. Remaining fund balance is
reported as nonspendable and correlates to prepaid and inventory assets.
Primary revenue sources of the fund include motor fuel taxes, intergovernmental, and license and permit revenue sources, as
well as interfund transfers in. Additional federal and local funding in Fiscal Year 2018 caused revenues of the fund to increase
$248.4 million (10.3 percent) to a total of $2.7 billion. Use of external sources of funding for projects, rather than state resources
such as taxes and licenses, contributes to revenue fluctuations between years.
An increase in transportation functional expenditures of $240.4 million, offset by a reduction in capital outlay expenditures of
$205.6 million, resulted in total expenditures increasing by $34.8 million to $2.5 billion. The change in the types of expenditures
reported in the fund was the result of a higher proportion of maintenance and preservation projects versus capitalizable projects.
In addition to the expenditures reported in the Transportation Fund, long term debt-funded transportation expenditures of
$163.7 million and $72.2 million were reported in the Capital Improvement Fund and Transportation Revenue Bonds Fund,
respectively. In the current year, transportation-related expenditures decreased $170.6 million in the Capital Improvement
Fund, while also decreasing $8.4 million in the Transportation Revenue Bonds Fund.
Transfers in increased slightly from $67.1 million to $73.7 million in Fiscal Year 2018. An on-going transfer equal to
0.25 percent of general fund taxes as published in the general fund condition statement is made annually with that amount
being $40.2 million in Fiscal Year 2018. In addition, $30.3 million was transferred from the Petroleum Inspection special
revenue fund. Transfers out increased $13.8 million to $173.6 million. Transfers out to the Bond Security and Redemption
Fund for debt service were $136.3 million, while transfers out to the Conservation Fund were $20.0 million in Fiscal Year 2018.
Capital Improvement Fund
Fund balance of the Capital Improvement Fund increased by $23.3 million from $(261.5) million to $(238.2) million. Assets of
the Fund, which are comprised of cash and receivables, decreased $69.4 million to $126.7 million. Short-term notes payable
and amounts owed to the Transportation Fund for reimbursement of transportation-related projects comprise most Fund
liabilities. Liabilities totaled $364.9 million, a decrease of $92.7 million from the prior year.
Two issues of long-term debt totaling $324.3 million were made during the year, a decrease of $293.0 million from the prior
fiscal year. During the year, debt and premium proceeds funded $147.4 million of capital outlay expenditures, a decrease of
$156.5 million and the result of less transportation related projects funded by the Capital Improvement Fund. Capital outlay
expenditures reflect capital assets, such as buildings and highways, which were either in progress or completed during the
fiscal year and will be used on a long-term basis. Debt proceeds also funded $117.9 million of maintenance and repair
expenditures on state owned assets that are reported as functional expenditures. Transportation related functional costs were
$57.0 million, a decrease of $25.8 million, and comprised 48.3 percent of functional expenditures. Environmental resource
related expenditures were $26.3 million and 22.3 percent of functional expenditures.
Transfers in to the Capital Improvement Fund for debt service payments on outstanding notes payable decreased $9.4 million
to $95.4 million. Transfers Out of the Capital Improvement Fund, which are also funded from debt proceeds, increased
$49.0 million to $170.2 million, because more debt was distributed to proprietary funds.
Proprietary Funds
Proprietary funds provide the same type of information found in the government-wide financial statements but in more detail.
Significant changes to balances of major proprietary funds from Fiscal Year 2017 to Fiscal Year 2018 include the following:
Environmental Improvement
Fund net position of the Environmental Improvement Fund increased $75.9 million to $2.0 billion. Total assets of the Fund
decreased by $17.9 million, while total liabilities decreased $95.9 million. Assets decreased to $2.3 billion as the result of a
State of Wisconsin Management Discussion and Analysis
For the Fiscal Year Ended June 30, 2018
18
$42.1 million reduction in loans to local governments and a cash increase of $27.5 million. Conversely, liabilities decreased to
$271.1 million due to a $97.1 million reduction in revenue bonds payable.
Operating income of the Fund increased by $39.2 million to $30.1 million in Fiscal Year 2018. Operating revenues, which
consists primarily of investment and interest income of $48.5 million, remained steady in Fiscal Year 2018. Operating expenses
decreased $40.5 million in Fiscal Year 2018, the result of a $40.9 million reduction in interest expense. The defeasance of
$583.0 million of clean water revenue bonds in the prior year reduced the amount of interest expense for Fiscal Year 2018.
Injured Patients and Families Compensation
Net position of the Injured Patients and Families Compensation Fund increased by $10.0 million, from $999.4 million to
$1.0 billion at June 30, 2018. Total assets of the Fund, which increased $18.1 million to $1.4 billion, are primarily comprised of
investments. Fund liabilities, which increased by $8.0 million to $382.1 million, are comprised primarily of actuarially-determined
future benefits and loss liabilities of $366.5 million, an increase of $9.4 million from the prior year.
Operating revenue of the Fund consisted of assessment income which decreased $4.3 million (27.5 percent) to $11.5 million.
The reduced revenue was the result of a 30.0 percent decrease in assessment rates and changes in the number of participating
providers. Non-operating revenue consists solely of investment and interest income of $22.4 million in Fiscal Year 2018.
Fund operating expenses consist primarily of benefit expenses. Benefit expenses, which are determined by an actuary, were
$22.4 million for Fiscal Year 2018 compared to negative $58.2 million the prior year. Fiscal Year 2018 benefit payments totaled
$12.9 million, compared to $9.1 million the prior year.
Unemployment Reserve
Net position of the Unemployment Reserve Fund increased by $250.4 million during Fiscal Year 2018 from $1.5 billion at
June 30, 2017 to $1.8 billion at June 30, 2018. Benefit expenses decreased from $465.8 million in Fiscal Year 2017 to
$407.3 million in Fiscal Year 2018, a decrease of $58.5 million (12.6 percent). The decrease in benefits is the result of the
average unemployment rate falling from 3.6 percent during Fiscal Year 2017 to 3.0 percent during Fiscal Year 2018.
Total operating revenues decreased by $115.7 million from $744.6 million in Fiscal Year 2017 to $628.9 million in Fiscal
Year 2018. Employer contributions decreased from $706.9 million in Fiscal Year 2017 to $597.1 million in Fiscal Year 2018, a
decrease of $109.8 million (15.5 percent). The average tax rate on taxable wages decreased from 2.06% during Calendar
Year 2017 to an estimated 1.72% in Calendar Year 2018.
University of Wisconsin System
Fund net position increased $198.4 million to $5.4 billion. Assets, which consist primarily of capital assets and cash, increased
$709.9 million to $8.4 billion. A restricted net pension asset of $399.1 million was reported in Fiscal Year 2018 compared to a
net pension liability of $(112.7 million) in the prior year. Liabilities, which consist mostly of bonds payable and OPEB, decreased
by $42.8 million to $2.9 billion. Deferred outflows of resources decreased $81.8 million to $750.5 million, while deferred inflows
of resources increased $489.7 million to $849.6 million. The changes in deferred outflows and inflows were primarily related to
changes in pension related amounts.
Operating revenues decreased $90.4 million or 2.5 percent to $3.6 billion. Student tuition, and federal grants and contracts of
$1.3 billion and $748.2 million, respectively, comprise 56.7 percent of operating revenues. Increases of $21.1 million,
$15.9 million and $58.8 million were reported for tuition and fees, sales and services of auxiliary enterprises and other income,
respectively. Conversely, revenues decreased by $161.3 million (17.7 percent) and $9.2 million (3.6 percent), for federal grants
and contracts and local and private grants and contracts, respectively. The federal grants and contracts account previously
included federal Pell grants. Beginning in Fiscal Year 2018, however, Pell grants of $162.7 million are reported as nonoperating
revenue. Sales and services of educational activities revenues also declined by $16.1 million or 4.8 percent. Operating expenses
decreased $3.8 million or 0.1 percent. Personal services expense declined by $66.7 million (2.0 percent) while other expenses
declined by $12.6 million. These were offset by an increase in supplies and services, scholarship and fellowship, and
depreciation expenses of $31.4 million, $12.4 million, and $31.5 million, respectively. Nonoperating investment and interest
income declined $11.2 million while gifts and donations declined $8.1 million. Offsetting those declines was an increase in other
revenues caused by reporting Pell grants as non-operating revenue beginning in Fiscal Year 2018.
Transfers in to the University of Wisconsin System totaled $1.0 billion in Fiscal Year 2018. The general purpose revenue
supplement received from the State’s General Fund was $838.8 million an increase of $30.6 million. The Capital Improvement
Fund also transferred $142.4 million of bond and note proceeds to the University of Wisconsin System an increase of
State of Wisconsin Management Discussion and Analysis
For the Fiscal Year Ended June 30, 2018
19
$39.0 million from the prior year. Bond proceeds transferred in are a function of on-going capital projects funded with those
bonds.
GOVERNMENT-WIDE CAPITAL ASSET AND DEBT ADMINISTRATION
Capital Assets
At the close of Fiscal Year 2018, the State reported $29.9 billion invested in capital assets, net of accumulated depreciation of
$7.8 billion. This represents an increase of $599.0 million, or 2.0 percent, from Fiscal Year 2017. Depreciation charges totaled
$156.4 million and $339.9 million for governmental and business-type activities, respectively, in Fiscal Year 2018. The details
of these assets are presented in Table 7, below. Additional information about the State’s capital assets is presented in Note 7
to the financial statements.
Table 7 Capital Assets, Net of Depreciation, as of June 30
(in millions)
Governmental Business-Type TotalActivities Activities Primary Government
2018 2017* 2018 2017* 2018 2017*
Land and Land Improvements $ 2,925 $ 2,893 $ 172 $ 171 $ 3,097 $ 3,065
Buildings and Improvements 1,612 1,387 4,216 4,387 5,828 5,774
Library Holdings 59 59 155 159 214 218
Machinery and Equipment 369 333 311 307 680 640
Infrastructure 16,955 15,843 - - 16,955 15,843
Construction and Software in Progress 2,582 3,473 516 262 3,098 3,735
Totals $ 24,502 $ 23,988 $ 5,371 $ 5,286 $ 29,873 $ 29,274
*Amounts for the prior fiscal year have been restated
The major capital asset additions completed or acquired during Fiscal Year 2018 included the:
• USH 12: Lake Delton – Sauk City $182.7 million
• Hill Farms Building A and B Replacement $158.2 million
• Preservation Storage Building $34.9 million
• Wisconsin Housing and Economic Development Authority Building Purchase $29.1 million
• Capitol Heat and Power Plant Facility Renovation and Upgrade $21.1 million
• Wisconsin Resource Center Female Treatment Center $16.0 million
• UW Milwaukee Children Center Renovation $10.4 million
In addition to these completed projects, construction and software in progress as of June 30, 2018 for governmental and
business-type activities totaled $2.6 billion and $516.2 million, respectively. A list of those projects is provided in Note 7. The
State’s continuing or proposed major capital projects for Fiscal Year 2018 and future years include:
• I-94 North South Freeway Project (Completion in 2021) $1.6 billion
• Zoo Interchange (Completion in 2023) $1.5 billion
• I39/90: USH 12 to Illinois (Completion 2020) $1.2 billion
• US 10 / State Highway 441 (Completion in 2019) $390.1 million
• St. Croix Bridge Crossing (Completion in 2019) $304.5 million
• USH18/151 Verona Road (Completion in 2019) $269.8 million
• USH 53 La Crosse Corridor (Completion TBD) $162.8 million
• STH 23 / State Highway 67 / US 41 (Completion in 2021) $153.1 million
• STH 15 / STH 76 New London (Completion in 2023) $143.8 million
• STH 50 / I94 43rd Avenue (Completion 2023) $104.5 million

State of Wisconsin Management Discussion and Analysis
For the Fiscal Year Ended June 30, 2018
20
Debt Administration
The State of Wisconsin Building Commission, an agency of the State, is empowered by law to consider, act upon, authorize,
issue and sell all debt obligations of the State. The total general obligation debt outstanding for the State as of June 30, 2018
was $8.2 billion, as shown in Table 8. During Fiscal Year 2018, $1.9 billion of general obligation bonds were issued to provide
for the acquisition or improvement of land, water, property, highways, buildings, equipment, or facilities for public purposes or
to refund outstanding bonds. Of the bonds issued in the current year, $647.2 million was to be used for University of Wisconsin
System academic and self-amortizing facilities; $472.0 million for transportation projects, $154.9 million for environmental
programs, and $79.2 million for correctional and mental health facilities. The remaining proceeds from new bonds issued were
used for various other projects.
In Fiscal Year 2004, the State issued $1.8 billion of annual appropriation bonds to pay the State’s unfunded accrued prior
service (pension) liability and its unfunded accrued liability for sick leave conversion credits. In Fiscal Year 2009, the State
issued $1.5 billion of annual appropriation bonds to purchase the future right, title, and interest in the Tobacco Settlement
Revenues (TSRs) from Badger Tobacco Asset Securitization Corporation (BTASC). As of June 30, 2018, $3.0 billion of these
bonds were outstanding.
Chapter 18 of the Wisconsin Statutes authorizes the State to issue revenue obligations. These obligations, which are not
general obligation debt of the State, are secured by a pledge of revenues or property derived from the operations of a program
funded by the issuance of the obligations. Revenue bonds of the primary government totaled $2.7 billion outstanding at
June 30, 2018, as shown in Table 8. These bonds included $2.3 billion of Transportation Revenue Bonds, $56.1 million of
Petroleum Inspection Revenue Bonds, and $265.0 million of Environmental Improvement Revenue Bonds.
Table 8
Outstanding Debt as of June 30, 2018 and 2017 (in millions)
Governmental Business-Type
Activities Activities Total 2018 2017 2018 2017 2018 2017
General obligations:
Bonds and long-term notes $6,478.1 $6,190.4 $1,685.4 $1,620.5 $8,163.5 $7,810.8
Annual appropriation bonds 3,044.0 3,113.9 -- -- 3,044.0 3,113.9
Revenue bonds 2,386.8 2,314.7 265.0 362.0 2,651.8 2,676.7
Totals $11,908.9 $11,618.9 $1,950.4 $1,982.5 $13,859.2 $13,601.4
Article VIII of the Wisconsin Constitution and Wis. Stat. Sec. 18.05 limit the amount of general obligation bond debt the State
can contract in total and in any calendar year. In total, debt cannot exceed five percent of the value of all taxable property in
the State. The amount of debt contracted in any calendar year is limited to the lesser of three-quarters of one percent of the
aggregate value of taxable property or five percent of the aggregate value of taxable property less net indebtedness
at January 1.
At June 30, 2018, State of Wisconsin general obligation fixed rate bonds had a rating of AA+ from Fitch Ratings, AA+ from Kroll
Bond Rating Agency, Aa1 from Moody's Investors Services, and AA from Standard and Poor's Rating Services. General
obligation variable notes had a rating of F1+ from Fitch Investors Services, L.P, P-1 from Moody’s, and A-1+ from Standard
and Poor’s Corporation.
Detailed information about the State’s long-term debt activity is presented in Note 11 to the financial statements.

State of Wisconsin Management Discussion and Analysis
For the Fiscal Year Ended June 30, 2018
21
INFRASTRUCTURE -- MODIFIED APPROACH The State reports infrastructure (i.e., roads, bridges, and buildings considered an ancillary part of roads) as capital assets.
Infrastructure assets exclude right-of-way costs. The State has elected to report its infrastructure assets (11,200 centerline miles
of roads and 5,200 bridges with a combined value of $17.0 billion) using the modified approach. Under this method, infrastructure
assets are not required to be depreciated if the State manages its eligible infrastructure assets using an asset management
system designed to maintain and preserve these assets at a condition level established and disclosed by the State.
All infrastructure assets constructed prior to July 1, 2000 have been recorded at estimated historical cost. Historical cost was
determined by calculating current costs of a similar asset and deflating that cost, using the Federal Highway Administration’s
composite index for federal-aid highway construction, to the estimated average construction date. All infrastructure assets
constructed after July 1, 2000 have been recorded at historical cost.
In order to adequately serve the traveling public and support the State economy, it is the State’s policy to ensure at least
85 percent of the state-owned roads and bridges are in good or fair condition. As of June 30, 2018, 92.6 percent of the roads
and 97.0 percent of bridges were in good or fair condition, consistent with State policies. This compares to 92.6 percent of the
roads and 96.9 percent of bridges as of June 30, 2017.
For the fiscal year ended June 30, 2018, actual maintenance and preservation costs for the State’s road network were
$616.7 million, or $131.3 million less than the estimated amount. On the same date, actual maintenance and preservation costs
for the State’s bridge network were $89.9 million, or $2.2 million less than the estimated amount. In developing estimated costs
at the beginning of the fiscal year, it is difficult to predict the types of projects that will actually incur costs during the year. In
addition, the State of Wisconsin, Department of Transportation’s multi-year contracting process, allowing encumbrances to carry
forward, makes a comparison of actual to estimate amounts difficult since expenditures for the current year may have been
budgeted and committed to a project in prior years.
ECONOMIC FACTORS
During calendar year 2017, the Wisconsin economy continued its strong expansion.
Wisconsin employment continued to grow throughout 2017. According to the federal Bureau of Labor Statistics, total nonfarm
employment in Wisconsin increased 1.4 percent in 2015, 1.2 percent in 2016 and 0.6 percent during 2017. This performance
generally followed national employment trends. Nationally, employment grew 2.1 percent in 2015, 1.8 percent in 2016 and
1.6 percent in 2017. Wisconsin employment growth is somewhat constrained due to a lower unemployment rate and a slower
overall population growth than the nation as a whole.
More recently, Wisconsin's growth in employment has slightly accelerated along with national employment growth. Between
September 2017 and September 2018, Wisconsin employment has increased 1.4 percent. Nationally, employment is up
1.7 percent over the same period, in line with 2017 employment growth. In addition, Wisconsin's seasonally adjusted
unemployment rate in September 2018 was 3.0 percent, well below the 3.7 percent national unemployment rate.
Reflecting the continuing expansion, Wisconsin's state nominal gross domestic product increased 3.1 percent in 2017, tracking
national growth of 4.1 percent. Wisconsin's 2017 growth followed growth rates of 4.3 percent and 3.4 percent in 2015 and 2016,
respectively. These figures compare with the 50-state total gross domestic product increases of 4.0 percent in 2015 and
2.8 percent in 2016. Since 2007, Wisconsin's gross domestic product increased by a similar magnitude as the country as a
whole with 33.0 percent cumulative growth versus 33.9 percent nationally.
Steady growth in output has spurred gains in personal income. Wisconsin personal income grew 4.1 percent, 2.1 percent and
3.6 percent in 2015, 2016 and 2017, respectively. Nationally, personal income grew 4.9 percent, 2.6 percent and 4.4 percent in
the same years. On a per capita basis, Wisconsin's income performance is similar to the nation's. Per capita income in
Wisconsin increased by 4.0 percent, 1.8 percent and 3.2 percent in 2015, 2016 and 2017, respectively. This compares to growth
of 4.1 percent, 1.8 percent and 3.6 percent in the same years nationally. Relative to the national average, Wisconsin per capita
income has remained in approximately the same range for the past three years at 95.2 percent, 95.2 percent and 94.8 percent
of the national average in 2015, 2016 and 2017, respectively.
State of Wisconsin Management Discussion and Analysis
For the Fiscal Year Ended June 30, 2018
22
Wisconsin's statewide total property value increased again in 2018 for the fifth straight year following five years of declines from
2009 through 2013. The recovery in values has been broad-based, reflecting improvements in all major sectors. In 2018, total
property values increased 4.5 percent, with residential property value growing at 5.1 percent. In addition, commercial real estate
values grew 6.8 percent and manufacturing values grew 4.5 percent. Manufacturing values have now increased for seven
consecutive years.
CONTACTING THE STATE'S FINANCIAL MANAGEMENT
This financial report is designed to provide Wisconsin's citizens, taxpayers, customers, investors and creditors with a general
overview of the State's finances and to demonstrate the State's accountability for the money it receives. Questions about this
report or requests for additional financial information should be addressed to: State of Wisconsin, State Controller's Office, 101
E. Wilson Street, 5th Floor, Madison, WI 53707 or by email to: [email protected].
Some state agencies, such as the State of Wisconsin Investment Board, Department of Employee Trust Funds and the University
of Wisconsin, issue stand-alone audited financial statements. The information contained in those statements may vary from this
document due to scope and application of generally accepted accounting principles. Questions about how to obtain the
separately issued financial statements should be directed to individual agencies or to the State Controller’s Office.
The State’s component units issue their own separate audited financial statements. These statements may be obtained by
directly contacting the component unit through their administrative offices identified in Note 1-B.
* * * *
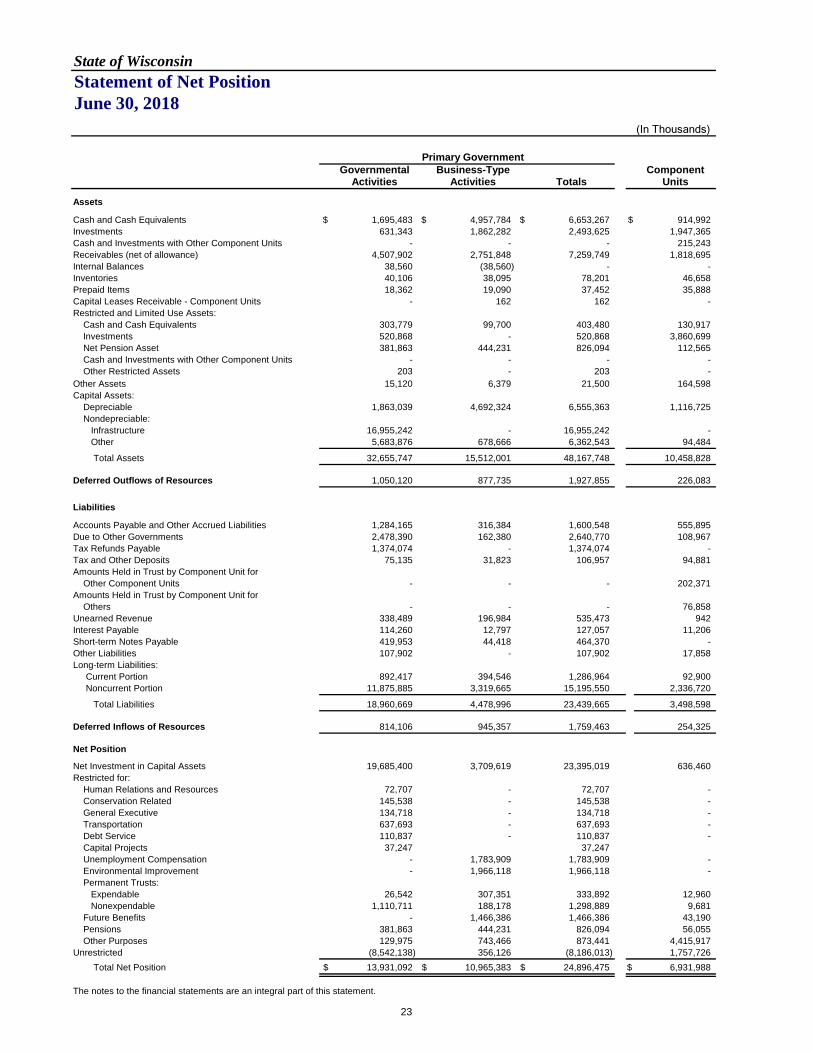
State of WisconsinStatement of Net PositionJune 30, 2018
(In Thousands)
Primary GovernmentGovernmental Business-Type Component
Activities Activities Totals Units
Assets
Cash and Cash Equivalents $ 1,695,483 $ 4,957,784 $ 6,653,267 $ 914,992
Investments 631,343 1,862,282 2,493,625 1,947,365
Cash and Investments with Other Component Units - - - 215,243
Receivables (net of allowance) 4,507,902 2,751,848 7,259,749 1,818,695
Internal Balances 38,560 (38,560) - -
Inventories 40,106 38,095 78,201 46,658
Prepaid Items 18,362 19,090 37,452 35,888
Capital Leases Receivable - Component Units - 162 162 -
Restricted and Limited Use Assets:
Cash and Cash Equivalents 303,779 99,700 403,480 130,917
Investments 520,868 - 520,868 3,860,699
Net Pension Asset 381,863 444,231 826,094 112,565
Cash and Investments with Other Component Units - - - -
Other Restricted Assets 203 - 203 -
Other Assets 15,120 6,379 21,500 164,598
Capital Assets:
Depreciable 1,863,039 4,692,324 6,555,363 1,116,725
Nondepreciable:
Infrastructure 16,955,242 - 16,955,242 -
Other 5,683,876 678,666 6,362,543 94,484
Total Assets 32,655,747 15,512,001 48,167,748 10,458,828
Deferred Outflows of Resources 1,050,120 877,735 1,927,855 226,083
Liabilities
Accounts Payable and Other Accrued Liabilities 1,284,165 316,384 1,600,548 555,895
Due to Other Governments 2,478,390 162,380 2,640,770 108,967
Tax Refunds Payable 1,374,074 - 1,374,074 -
Tax and Other Deposits 75,135 31,823 106,957 94,881
Amounts Held in Trust by Component Unit for
Other Component Units - - - 202,371
Amounts Held in Trust by Component Unit for
Others - - - 76,858
Unearned Revenue 338,489 196,984 535,473 942
Interest Payable 114,260 12,797 127,057 11,206
Short-term Notes Payable 419,953 44,418 464,370 -
Other Liabilities 107,902 - 107,902 17,858
Long-term Liabilities:
Current Portion 892,417 394,546 1,286,964 92,900
Noncurrent Portion 11,875,885 3,319,665 15,195,550 2,336,720
Total Liabilities 18,960,669 4,478,996 23,439,665 3,498,598
Deferred Inflows of Resources 814,106 945,357 1,759,463 254,325
Net Position
Net Investment in Capital Assets 19,685,400 3,709,619 23,395,019 636,460
Restricted for:
Human Relations and Resources 72,707 - 72,707 -
Conservation Related 145,538 - 145,538 -
General Executive 134,718 - 134,718 -
Transportation 637,693 - 637,693 -
Debt Service 110,837 - 110,837 -
Capital Projects 37,247 37,247
Unemployment Compensation - 1,783,909 1,783,909 -
Environmental Improvement - 1,966,118 1,966,118 -
Permanent Trusts:
Expendable 26,542 307,351 333,892 12,960
Nonexpendable 1,110,711 188,178 1,298,889 9,681
Future Benefits - 1,466,386 1,466,386 43,190
Pensions 381,863 444,231 826,094 56,055
Other Purposes 129,975 743,466 873,441 4,415,917
Unrestricted (8,542,138) 356,126 (8,186,013) 1,757,726
Total Net Position $ 13,931,092 $ 10,965,383 $ 24,896,475 $ 6,931,988
The notes to the financial statements are an integral part of this statement.
23

State of WisconsinStatement of Activities For the Fiscal Year Ended June 30, 2018
(In Thousands)
Operating Grants, Capital Grants,Contributions Contributions
Charges for and Restricted and RestrictedFunctions/Programs Expenses Services Interest Interest
Primary Government: Governmental Activities:
Commerce $ 266,247 $ 276,882 $ 16,678 $ - Education 7,442,098 13,097 933,637 - Transportation 2,379,940 794,358 191,652 749,356 Environmental Resources 473,257 242,907 89,888 180 Human Relations and Resources 13,599,471 686,802 7,606,341 11,076 General Executive 626,327 280,739 177,796 - Judicial 143,115 50,457 686 - Legislative 69,280 1,768 - - Tax Relief and Other General Expenses 1,612,835 - 70,862 - Intergovernmental - Shared Revenue 972,110 53,462 - - Interest on Debt 440,077 - - -
Total Governmental Activities 28,024,757 2,400,473 9,087,540 760,612
Business-type Activities:Injured Patients and Families Compensation 23,723 11,424 22,383 - Environmental Improvement 43,119 48,578 60,511 - University of Wisconsin System 4,973,217 3,625,793 556,901 45,144 Unemployment Reserve 411,682 625,859 36,266 - Lottery 661,297 667,541 (144) - Health Insurance 1,287,380 1,332,776 28,952 - Care and Treatment Facilities 391,698 305,424 393 50 Other Business-type 135,190 76,335 107,197 -
Total Business-type Activities 7,927,307 6,693,730 812,458 45,194
Total Primary Government $ 35,952,064 $ 9,094,203 $ 9,899,999 $ 805,806
Component Units: Housing and Economic Development Authority $ 284,833 $ 106,179 $ 184,675 $ - Health Care Liability Insurance Plan (1,205) 2,001 1,300 - University Hospitals and Clinics Authority 3,090,751 3,213,518 - 1,930 University of Wisconsin Foundation 343,104 267,470 313,184 - Wisconsin Economic Development Corp 44,722 150 60,325 -
Total Component Units $ 3,762,205 $ 3,589,318 $ 559,485 $ 1,930
General Revenues:Dedicated for General Purposes: Income Taxes Sales and Excise Taxes Public Utility Taxes Other TaxesMotor Fuel/Other Taxes Dedicated for TransportationOther Dedicated TaxesInterest and Investment EarningsMiscellaneous
Contributions to Term and Permanent Endowments
Contributions to Permanent Fund Principal Transfers
Total General Revenues, Contributions, and Transfers
Change in Net Position
Net Position - Beginning
Net Position - Ending
The notes to the financial statements are an integral part of this statement.
Program Revenues
24

Governmental Business-Type ComponentActivities Activities Total Units
$ 27,313 $ 27,313 (6,495,364) (6,495,364)
(644,575) (644,575) (140,281) (140,281)
(5,295,252) (5,295,252) (167,791) (167,791) (91,972) (91,972) (67,511) (67,511)
(1,541,972) (1,541,972) (918,648) (918,648) (440,077) (440,077)
(15,776,132) (15,776,132)
$ 10,085 10,085 65,970 65,970
(745,379) (745,379) 250,442 250,442
6,100 6,100 74,347 74,347
(85,831) (85,831) 48,342 48,342
- (375,925) (375,925)
(15,776,132) (375,925) (16,152,056)
$ 6,021 4,506
124,697 237,550 15,753
388,527
9,450,658 - 9,450,658 - 6,046,474 - 6,046,474 -
361,696 - 361,696 - 300,111 - 300,111 -
1,121,780 - 1,121,780 - 104,563 - 104,563 - 35,699 22,147 57,847 63,042
408,919 - 408,919 13,629 - 1,145 1,145 -
12,281 - 12,281 - (1,010,615) 1,010,615 - -
16,831,565 1,033,908 17,865,473 76,671
1,055,434 657,983 1,713,417 465,197
12,875,658 10,307,399 23,183,058 6,466,791
$ 13,931,092 $ 10,965,383 $ 24,896,475 $ 6,931,988
Primary Government
Net (Expense) Revenue and Changes in Net Position
25

State of WisconsinBalance Sheet - Governmental Funds June 30, 2018
(In Thousands)
Capital Nonmajor TotalGeneral Transportation Improvement Governmental Governmental
Assets and Deferred Outflows of ResourcesAssets:Cash and Cash Equivalents $ 593,025 $ 488,197 $ 121,298 $ 444,679 $ 1,647,198 Investments 594 - - 630,749 631,343 Receivables (net of allowance): Taxes 1,551,220 104,506 - 268 1,655,994 Loans to Local Governments - - - 490,881 490,881 Other Loans Receivable 5,454 16,967 - - 22,421 Other Receivables 715,979 4,308 - 71,825 792,112 Due from Other Funds 134,065 76,897 5,426 37,748 254,137 Interfund Receivables 74,732 - - - 74,732 Due from Other Governments 1,158,176 274,043 - 37,399 1,469,619 Inventories 15,115 17,246 - 2,725 35,086 Prepaid Items 3,473 942 - 9,522 13,937 Restricted and Limited Use Assets: Cash and Cash Equivalents - - - 299,943 299,943 Investments - - - 520,868 520,868 Other Restricted Assets - - 203 203 Other Assets 14,658 - - 462 15,120
Total Assets 4,266,492 983,106 126,723 2,547,273 7,923,594
Deferred Outflows of Resources - 142 - - 142
Total Assets and Deferred Outflows of Resources $ 4,266,492 $ 983,248 $ 126,723 $ 2,547,273 $ 7,923,737
Liabilities, Deferred Inflows of Resources, and Fund BalancesLiabilities: Accounts Payable and Other Accrued Liabilities $ 1,049,421 $ 161,860 $ 4,912 $ 25,048 $ 1,241,241 Due to Other Funds 103,295 34,319 10,520 41,455 189,589 Due to Component Units 205 - - 16,631 16,836 Interfund Payables - - - 2,171 2,171 Due to Other Governments 2,354,076 119,656 772 3,886 2,478,390 Tax Refunds Payable 1,371,275 2,611 - 188 1,374,074 Tax and Other Deposits 58,274 - - 16,861 75,135 Unearned Revenue 312,878 8,543 - 4,984 326,405 Interest Payable - - - 53,855 53,855 Advances from Other Funds 759 - - 6,352 7,112 Short-term Notes Payable - - 348,715 58,808 407,523 Revenue Bonds and Notes Payable - - - 131,170 131,170
Total Liabilities 5,250,184 326,988 364,919 361,408 6,303,500
Deferred Inflows of Resources 269,834 379 - 8,212 278,425
Fund Balances: Nonspendable 18,576 18,188 - 1,121,781 1,158,545 Restricted 257,577 637,693 - 833,523 1,728,793 Committed 320,054 - - 228,193 548,247 Unassigned (1,849,733) - (238,196) (5,844) (2,093,773)
Total Fund Balances (1,253,527) 655,881 (238,196) 2,177,653 1,341,812
Total Liabilities, Deferred Inflows of Resources, and Fund Balances $ 4,266,492 $ 983,248 $ 126,723 $ 2,547,273 $ 7,923,737
(Continued)
26

State of WisconsinBalance Sheet - Governmental Funds June 30, 2018
(Continued)
TotalGovernmental
Reconciliation to the Statement of Net Position:
Total Fund Balances - Governmental Funds (from previous page) $ 1,341,812
Capital assets used in governmental activities are not financial
resources and, therefore, are not reported in the funds:
Infrastructure 16,955,242
Other Capital Assets 8,685,219
Accumulated Depreciation (1,680,164)
23,960,297
Other long-term assets and deferred outflows and inflows
of resources that are not available to pay for current period
expenditures and, therefore, are not recognized in the funds. 507,900
Deferred outflows of resources used to accumulate decreases
in fair values of hedging derivatives that are not reported in
the governmental funds. 107,902
Derivative instruments (interest rate swaps) that also are not
reported in the governmental funds. (107,902)
0
Some of the State's revenues will be collected after year-end
but are not available soon enough to pay for the current period's
expenditures and, therefore, are not recognized in the funds. 278,425
Internal service funds are used by management to charge the
costs of certain activities, such as telecommunications and
insurance, to individual funds. The assets and liabilities of the
internal service funds are included in governmental activities
in the Statement of Net Position. 16,838
Long-term liabilities, including bonds payable, are not due and
payable in the current period and, therefore, are not reported in
the fund statements. These liabilities, however, are included in
the Statement of Net Position.
Revenue Bonds Payable (2,255,665)
Appropriation Bonds Payable (3,043,979)
General Obligation Bonds and Notes Payable (6,105,940)
Accrued Interest on Bonds (60,405)
Capital Leases (67,625)
Compensated Absences (152,011)
Pollution Remediation (5,725)
Claims and Judgments (479)
Other Postemployment Benefits Liability (482,351)
(12,174,180)
Net Position of Governmental Activities as reported on the Statement of Net Position (See page 23) $ 13,931,092
The notes to the financial statements are an integral part of this statement.
27
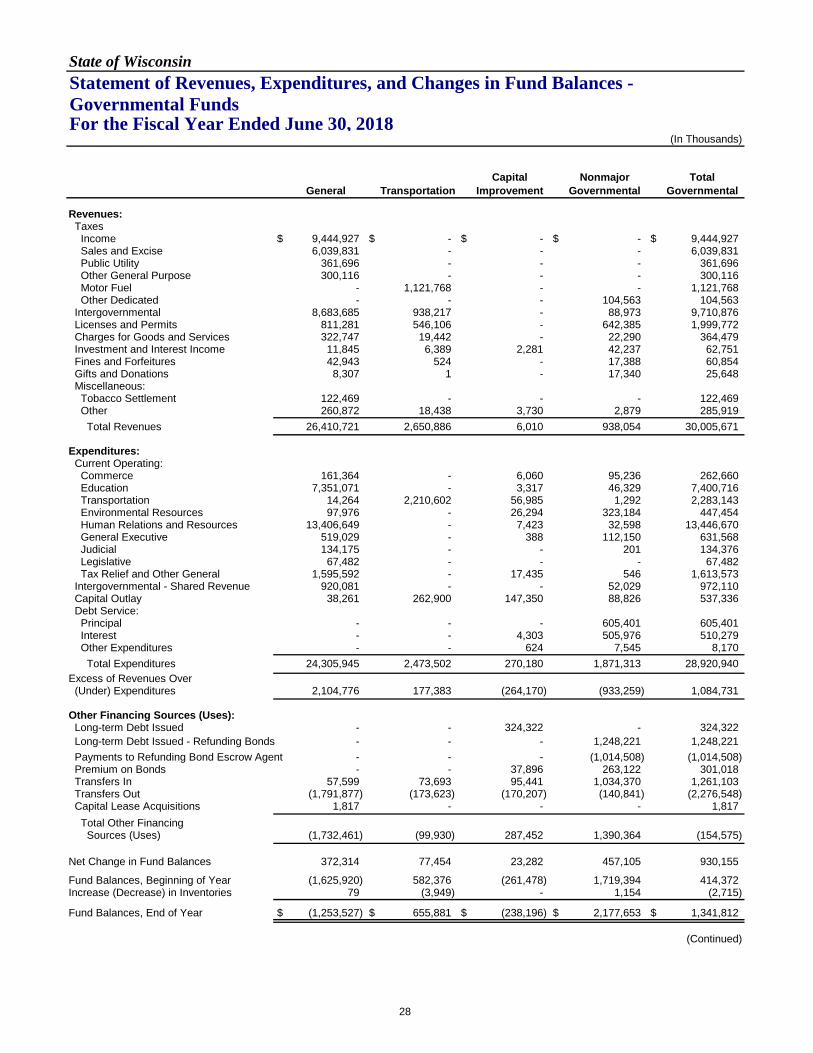
State of WisconsinStatement of Revenues, Expenditures, and Changes in Fund Balances - Governmental Funds For the Fiscal Year Ended June 30, 2018
(In Thousands)
Capital Nonmajor TotalGeneral Transportation Improvement Governmental Governmental
Revenues: Taxes Income $ 9,444,927 $ - $ - $ - $ 9,444,927 Sales and Excise 6,039,831 - - - 6,039,831 Public Utility 361,696 - - - 361,696 Other General Purpose 300,116 - - - 300,116 Motor Fuel - 1,121,768 - - 1,121,768 Other Dedicated - - - 104,563 104,563 Intergovernmental 8,683,685 938,217 - 88,973 9,710,876 Licenses and Permits 811,281 546,106 - 642,385 1,999,772 Charges for Goods and Services 322,747 19,442 - 22,290 364,479 Investment and Interest Income 11,845 6,389 2,281 42,237 62,751 Fines and Forfeitures 42,943 524 - 17,388 60,854 Gifts and Donations 8,307 1 - 17,340 25,648 Miscellaneous: Tobacco Settlement 122,469 - - - 122,469 Other 260,872 18,438 3,730 2,879 285,919
Total Revenues 26,410,721 2,650,886 6,010 938,054 30,005,671
Expenditures: Current Operating: Commerce 161,364 - 6,060 95,236 262,660 Education 7,351,071 - 3,317 46,329 7,400,716 Transportation 14,264 2,210,602 56,985 1,292 2,283,143 Environmental Resources 97,976 - 26,294 323,184 447,454 Human Relations and Resources 13,406,649 - 7,423 32,598 13,446,670 General Executive 519,029 - 388 112,150 631,568 Judicial 134,175 - - 201 134,376 Legislative 67,482 - - - 67,482 Tax Relief and Other General 1,595,592 - 17,435 546 1,613,573 Intergovernmental - Shared Revenue 920,081 - - 52,029 972,110 Capital Outlay 38,261 262,900 147,350 88,826 537,336 Debt Service: Principal - - - 605,401 605,401 Interest - - 4,303 505,976 510,279 Other Expenditures - - 624 7,545 8,170
Total Expenditures 24,305,945 2,473,502 270,180 1,871,313 28,920,940
Excess of Revenues Over (Under) Expenditures 2,104,776 177,383 (264,170) (933,259) 1,084,731
Other Financing Sources (Uses): Long-term Debt Issued - - 324,322 - 324,322
Long-term Debt Issued - Refunding Bonds - - - 1,248,221 1,248,221
Payments to Refunding Bond Escrow Agent - - - (1,014,508) (1,014,508) Premium on Bonds - - 37,896 263,122 301,018 Transfers In 57,599 73,693 95,441 1,034,370 1,261,103 Transfers Out (1,791,877) (173,623) (170,207) (140,841) (2,276,548) Capital Lease Acquisitions 1,817 - - - 1,817
Total Other Financing Sources (Uses) (1,732,461) (99,930) 287,452 1,390,364 (154,575)
Net Change in Fund Balances 372,314 77,454 23,282 457,105 930,155
Fund Balances, Beginning of Year (1,625,920) 582,376 (261,478) 1,719,394 414,372 Increase (Decrease) in Inventories 79 (3,949) - 1,154 (2,715)
Fund Balances, End of Year $ (1,253,527) $ 655,881 $ (238,196) $ 2,177,653 $ 1,341,812
(Continued)
28

State of WisconsinStatement of Revenues, Expenditures, and Changes in Fund Balances - Governmental Funds For the Fiscal Year Ended June 30, 2018
(Continued)
TotalGovernmental
Reconciliation to the Statement of Activities:Net Change in Fund Balances (from previous page) $ 930,155
Inventories, which are recorded under the purchases method for governmentalfund reporting, are reported under the consumption approach on the Statement ofActivities. As a result of this change, the Increase (Decrease) in Reserve forInventories on the fund statement has been reclassified as functional expenseson the government-wide statement. (2,715)
Governmental funds report the acquisition or construction of capital assets asexpenditures, while governmental activities report depreciation expense toallocate the cost of these assets over their estimated useful life. Donated assets are set up at acquisition value with a corresponding amount of revenue recognized.In the current period, these amounts are:
Capital Outlay/Functional Expenditures 534,600 Depreciation Expense (114,434)
Grants and Contributions (Donated Assets) 180 420,346
Transfers of capital assets between governmental and business-type activitiesresults in the movement of those assets on the Statement of Net Assets andcorresponding recognition of the related transfer in/out on the Statement of Activities. 972
In the Statement of Activities, only the gain/(loss) on the sale/disposal of capitalassets is reported, while in the governmental funds, any proceeds from the saleincreases financial resources. Thus, the change in net position differs from thechange in fund balance by the cost of the capital assets sold/disposed. (76,814)
Revenues in the Statement of Activities that do not provide current financialresources are not reported as revenues in the funds. 15,307
Bond proceeds provide current financial resources to governmental funds, but issuingdebt increases long-term liabilities in the Statement of Net Position. Repayment ofbond principal is reported as an expenditure in the governmental funds, but therepayment reduces long-term liabilities in the Statement of Net Position.
Bonds Issued (1,572,543) Payments to Refunding Bond Escrow Agent 1,014,508 Repayment of Bond Principal 605,401 Bond Premium (301,018) Prepaid Bond Insurance Costs (Amortization) (16)
(253,668)
Some expenses reported in the Statement of Activities do not require the use ofcurrent financial resources and, therefore, are not reported as expenditures ingovernmental funds.
Net Decrease (increase) in Accrued Interest 93,621 Decrease (increase) in Capital Leases 5,413 Decrease (increase) in Compensated Absences (3,434) Decrease (increase) in Pollution Remediation Liabilities 2,257 Decrease (increase) in Claims and Judgments 77 Change in net pension assets, net pension liabilities, and pension-related deferred outflows and inflows of resources (49,502) Decrease (increase) in Postemployment Benefit Liabilities (35,856)
12,575
Internal service funds are used by management to charge the costs of certainactivities, such as insurance and telecommunications to individual funds. The netrevenue (expense) of the internal service funds is reported with governmental activities. 9,276
Changes in Net Position of Governmental Activities as reported on the Statement of Activities (See page 25) $ 1,055,434
The notes to the financial statements are an integral part of this statement.
29
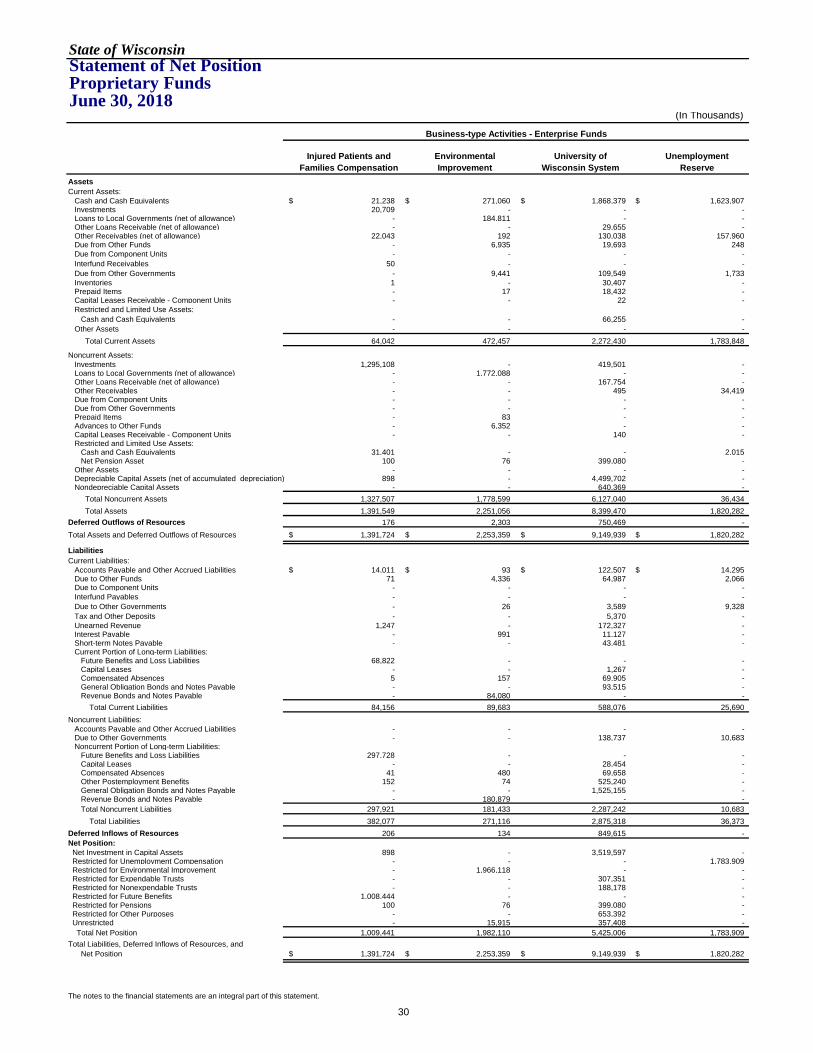
State of WisconsinStatement of Net PositionProprietary Funds June 30, 2018
(In Thousands)
Injured Patients and Environmental University of Unemployment
Families Compensation Improvement Wisconsin System ReserveAssetsCurrent Assets:
Cash and Cash Equivalents $ 21,238 $ 271,060 $ 1,868,379 $ 1,623,907 Investments 20,709 - - - Loans to Local Governments (net of allowance) - 184,811 - - Other Loans Receivable (net of allowance) - - 29,655 - Other Receivables (net of allowance) 22,043 192 130,038 157,960 Due from Other Funds - 6,935 19,693 248
Due from Component Units - - - -
Interfund Receivables 50 - - -
Due from Other Governments - 9,441 109,549 1,733
Inventories 1 - 30,407 - Prepaid Items - 17 18,432 - Capital Leases Receivable - Component Units - - 22 -
Restricted and Limited Use Assets:
Cash and Cash Equivalents - - 66,255 -
Other Assets - - - -
Total Current Assets 64,042 472,457 2,272,430 1,783,848
Noncurrent Assets:
Investments 1,295,108 - 419,501 - Loans to Local Governments (net of allowance) - 1,772,088 - - Other Loans Receivable (net of allowance) - - 167,754 - Other Receivables - - 495 34,419 Due from Component Units - - - - Due from Other Governments - - - - Prepaid Items - 83 - - Advances to Other Funds - 6,352 - - Capital Leases Receivable - Component Units - - 140 - Restricted and Limited Use Assets: Cash and Cash Equivalents 31,401 - - 2,015 Net Pension Asset 100 76 399,080 - Other Assets - - - - Depreciable Capital Assets (net of accumulated depreciation) 898 - 4,499,702 - Nondepreciable Capital Assets - - 640,369 -
Total Noncurrent Assets 1,327,507 1,778,599 6,127,040 36,434
Total Assets 1,391,549 2,251,056 8,399,470 1,820,282
Deferred Outflows of Resources 176 2,303 750,469 -
Total Assets and Deferred Outflows of Resources $ 1,391,724 $ 2,253,359 $ 9,149,939 $ 1,820,282
Liabilities Current Liabilities:
Accounts Payable and Other Accrued Liabilities $ 14,011 $ 93 $ 122,507 $ 14,295 Due to Other Funds 71 4,336 64,987 2,066 Due to Component Units - - - -
Interfund Payables - - - -
Due to Other Governments - 26 3,589 9,328
Tax and Other Deposits - - 5,370 -
Unearned Revenue 1,247 - 172,327 - Interest Payable - 991 11,127 - Short-term Notes Payable - - 43,481 - Current Portion of Long-term Liabilities: Future Benefits and Loss Liabilities 68,822 - - - Capital Leases - - 1,267 - Compensated Absences 5 157 69,905 - General Obligation Bonds and Notes Payable - - 93,515 - Revenue Bonds and Notes Payable - 84,080 - -
Total Current Liabilities 84,156 89,683 588,076 25,690
Noncurrent Liabilities:
Accounts Payable and Other Accrued Liabilities - - - - Due to Other Governments - - 138,737 10,683 Noncurrent Portion of Long-term Liabilities: Future Benefits and Loss Liabilities 297,728 - - - Capital Leases - - 28,454 - Compensated Absences 41 480 69,658 - Other Postemployment Benefits 152 74 525,240 - General Obligation Bonds and Notes Payable - - 1,525,155 - Revenue Bonds and Notes Payable - 180,879 - -
Total Noncurrent Liabilities 297,921 181,433 2,287,242 10,683
Total Liabilities 382,077 271,116 2,875,318 36,373
Deferred Inflows of Resources 206 134 849,615 -
Net Position: Net Investment in Capital Assets 898 - 3,519,597 - Restricted for Unemployment Compensation - - - 1,783,909 Restricted for Environmental Improvement - 1,966,118 - - Restricted for Expendable Trusts - - 307,351 - Restricted for Nonexpendable Trusts - - 188,178 - Restricted for Future Benefits 1,008,444 - - - Restricted for Pensions 100 76 399,080 - Restricted for Other Purposes - - 653,392 - Unrestricted - 15,915 357,408 -
Total Net Position 1,009,441 1,982,110 5,425,006 1,783,909
Total Liabilities, Deferred Inflows of Resources, and
Net Position $ 1,391,724 $ 2,253,359 $ 9,149,939 $ 1,820,282
The notes to the financial statements are an integral part of this statement.
Business-type Activities - Enterprise Funds
30

Nonmajor Governmental Activities -Enterprise Totals Internal Service Funds
$ 1,173,199 $ 4,957,784 $ 48,285 4,520 25,229 -
253 185,064 - 1,798 31,453 -
81,379 391,612 3,413 20,416 47,292 16,788
- - 585
54 104 -
8,105 128,828 524
7,687 38,095 5,019 558 19,007 4
- 22 -
29 66,284 3,837
556 556 -
1,298,554 5,891,330 78,454
122,443 1,837,053 - 1,628 1,773,717 -
24,362 192,116 - - 34,915 - - - - - - - - 83 494
759 7,112 - - 140 -
- 33,416 - 44,976 444,231 7,329
5,824 5,824 - 191,724 4,692,324 513,965
38,298 678,666 27,895
430,013 9,699,594 549,684
1,728,567 15,590,924 628,139
124,787 877,735 16,771
$ 1,853,354 $ 16,468,659 $ 644,909
$ 100,376 $ 251,282 $ 10,935 35,079 106,539 2,244
434 434 -
25,266 25,266 47,346
17 12,961 -
26,453 31,823 -
23,410 196,984 12,084 678 12,797 2,658 936 44,418 12,430
66,998 135,820 42,165 141 1,408 8,623
5,296 75,363 1,251 4,360 97,875 16,455
- 84,080 -
289,444 1,077,048 156,190
13,238 13,238 - - 149,420 -
553,223 850,950 68,171 1,423 29,877 18,080 7,748 77,926 3,038
67,046 592,512 9,916 62,367 1,587,521 355,658
- 180,879 -
705,044 3,482,322 454,864
994,487 4,559,371 611,054
95,402 945,357 15,565
189,125 3,709,619 134,020 - 1,783,909 - - 1,966,118 - - 307,351 - - 188,178 -
457,941 1,466,386 - 44,976 444,231 7,329 90,073 743,466 -
(18,649) 354,674 (123,059)
763,465 10,963,931 18,290
$ 1,853,354 $ 16,468,659 $ 644,909
Total Net Position Reported Above $ 10,963,931 Adjustment to Reflect the Consolidation of Internal
Service Activities Related to Enterprise Funds 1,451 Net Position of Business-type Activities $ 10,965,383
Business-type Activities - Enterprise Funds
31

State of WisconsinStatement of Revenues, Expenses, and Changes in Fund Net Position - Proprietary Funds For the Fiscal Year Ended June 30, 2018
(In Thousands)
Injured Patients and Environmental University of UnemploymentFamilies Compensation Improvement Wisconsin System Reserve
Operating Revenues: Charges for Goods and Services $ 11,424 $ - $ - $ -
Participant and Employer Contributions - - - 597,072
Tuition and Fees - - 1,279,301 -
Federal Grants and Contracts - - 748,228 -
Local and Private Grants and Contracts - - 248,736 -
Sales and Services of Educational Activities - - 319,510 -
Sales and Services of Auxiliary Enterprises - - 445,365 -
Sales and Services to UW Hospital Authority - - 69,725 -
Investment and Interest Income - 48,533 - -
Interest Income Used as Security for Revenue Bonds - - - -
Miscellaneous:
Federal Aid for Unemployment Insurance Program - - - 3,065
Reimbursing Financing Revenue - - - 27,384
Other - 46 467,880 1,403
Total Operating Revenues 11,424 48,578 3,578,745 628,924
Operating Expenses: Personal Services 579 5,650 3,190,142 -
Supplies and Services 187 3,268 1,237,603 -
Lottery Prize Awards - - - -
Scholarships and Fellowships - - 157,604 -
Depreciation 524 - 323,984 -
Benefit Expense 22,433 - - 407,270
Interest Expense - 9,543 - -
Other Expenses - - 12,343 4,413
Total Operating Expenses 23,723 18,461 4,921,676 411,682
Operating Income (Loss) (12,299) 30,117 (1,342,931) 217,241
Nonoperating Revenues (Expenses): Operating Grants - 56,650 162,691 -
Investment and Interest Income 22,383 3,914 45,053 33,201
Gain (Loss) on Disposal of Capital Assets - - (2,055) -
Interest Expense - - (50,557) -
Gifts and Donations - - 370,022 -
Miscellaneous Revenues - - 47,047 -
Other Expenses:
Property Tax Credits - - - -
Grants Disbursed - (24,658) - -
Federal Settlement - - - -
Other - - - -
Total Nonoperating Revenues (Expenses) 22,383 35,907 572,201 33,201
Income (Loss) Before Contributions and
Transfers 10,085 66,024 (770,730) 250,442
Capital Contributions - - 45,144 -
Additions to Endowments - - 1,145 -
Transfers In - 17,880 1,004,117 -
Transfers Out (14) (8,011) (81,283) (9)
Change in Net Position 10,071 75,893 198,394 250,433
Total Net Position, Beginning of Year 999,371 1,906,217 5,226,612 1,533,476
Total Net Position, End of Year $ 1,009,441 $ 1,982,110 $ 5,425,006 $ 1,783,909
The notes to the financial statements are an integral part of this statement.
Business-type Activities - Enterprise Funds
32

Nonmajor Governmental Activities - Enterprise Totals Internal Service Funds
$ 1,002,813 $ 1,014,237 $ 280,341
1,365,755 1,962,827 -
- 1,279,301 -
- 748,228 -
- 248,736 -
- 319,510 -
- 445,365 -
- 69,725 -
1,892 50,425 -
- - -
- 3,065 -
- 27,384 -
5,910 475,238 3,979
2,376,370 6,644,042 284,320
317,510 3,513,882 47,337
206,721 1,447,779 145,565
404,447 404,447 -
- 157,604 -
15,406 339,914 41,963
1,332,535 1,762,237 33,745
1,731 11,273 -
20,948 37,704 35
2,299,297 7,674,840 268,645
77,073 (1,030,798) 15,674
1,270 220,611 174
135,704 240,255 317
(157) (2,212) (1,250)
(1,388) (51,945) (7,695)
624 370,646 -
5,734 52,781 1,377
(173,515) (173,515) -
(1,687) (26,345) -
- - (105)
(21) (21) (2,034)
(33,438) 630,255 (9,215)
43,636 (400,544) 6,459
50 45,194 -
- 1,145 -
124,663 1,146,660 7,949
(46,728) (136,044) (3,560)
121,620 656,411 10,848
641,845 10,307,520 7,442
$ 763,465 $ 10,963,931 $ 18,290
Change in Net Position Reported Above $ 656,411
Activities Related to Enterprise Funds 1,572
Change in Net Position of Business-Type Activities $ 657,983
Business-type Activities - Enterprise Funds
33

State of WisconsinStatement of Cash Flows - Proprietary Funds For the Fiscal Year Ended June 30, 2018
(In Thousands)
Injured Patients and Environmental University of UnemploymentFamilies Compensation Improvement Wisconsin System Reserve
Cash Flows from Operating Activities: Cash Receipts from Customers $ 11,300 $ - $ - $ 628,326 Cash Payments to Suppliers for Goods and Services (281) (3,630) (1,242,974) - Cash Payments to Employees for Services (827) (4,117) (3,135,657) - Tuition and Fees - - 1,278,250 - Grants and Contracts - - 969,088 - Cash Payments for Lottery Prizes - - - - Cash Payments for Loans Originated - (148,226) (38,867) - Collection of Loans - 190,356 34,860 - Interest Income - 48,976 - - Cash Payments for Benefits (12,964) - - (426,547) Sales and Services of Educational Activities - - 331,980 - Sales and Services of Auxiliary Enterprises - - 449,794 - Sales and Services to UW Hospital Authority - - 67,963 - Scholarships and Fellowships - - (157,604) - Other Operating Revenues - 46 445,151 53,535 Other Operating Expenses - - - (4,490) Other Sources of Cash - - - - Other Uses of Cash - - - -
Net Cash Provided (Used) by Operating Activities (2,772) 83,404 (998,016) 250,824
Cash Flows from Noncapital Financing Activities: Operating Grants Receipts - 66,342 162,691 - Grants for Loans to Governments - - - - Grants Disbursed - (24,658) - - Proceeds from Issuance of Debt - - - - Repayment of Bonds and Notes - (90,550) - - Escrow Deposit - - - - Interest Payments - (13,276) - - Property Tax Credit Payments - - - - Noncapital Gifts - - 371,156 - Interfund Loans Received - - - - Interfund Loans Repaid - - - -
Repayment of Interfund Borrowings - - - - Transfers In - 11,047 1,081,000 - Transfers Out (14) (8,011) (96,578) - Student Direct Lending Receipts - - 660,691 - Student Direct Lending Disbursements - - (662,240) - Other Cash Inflows from Noncapital Financing Activities - - 46,005 - Other Cash Outflows from Noncapital Financing Activities - (82) (23,526) -
Net Cash Provided (Used) by Noncapital Financing Activities (14) (59,188) 1,539,199 -
Cash Flows from Capital and Related Financing Activities: Proceeds from Issuance of Debt - - 283,954 - Capital Contributions - - 142,360 - Repayment of Bonds and Notes - - (346,218) -
Interest Payments - - (134,558) -
Transfers In - - - -
Capital Lease Obligations - - - - Proceeds from Sale of Capital Assets - - - - Payments for Purchase of Capital Assets (447) - (366,419) - Other Cash Inflows from Capital Financing Activities - - 59,992 - Other Cash Outflows from Capital Financing Activities - - - -
Net Cash Provided (Used) by Capital and Related
Financing Activities (447) - (360,889) -
Cash Flows from Investing Activities: Proceeds from Sale and Maturities of Investment Securities 211,809 - 606,555 - Purchase of Investment Securities (253,321) - (574,779) - Cash Payments for Loans Originated - - - - Collection of Loans - - - - Investment and Interest Receipts 33,993 3,260 56,477 33,201
Net Cash Provided (Used) by Investing Activities (7,519) 3,260 88,253 33,201
Net Increase (Decrease) in Cash and Cash Equivalents (10,752) 27,475 268,547 284,025 Cash and Cash Equivalents, Beginning of Year 63,391 243,586 1,666,087 1,341,898
Cash and Cash Equivalents, End of Year $ 52,639 $ 271,060 $ 1,934,634 $ 1,625,922
Business-type Activities - Enterprise Funds
34

Nonmajor Governmental Activities - Enterprise Totals Internal Service Funds
$ 2,396,627 $ 3,036,253 $ 294,754 (176,068) (1,422,953) (146,348) (315,337) (3,455,939) (41,320)
- 1,278,250 - - 969,088 -
(408,254) (408,254) - - (187,093) -
7,467 232,683 - 1,850 50,826 -
(1,362,453) (1,801,964) (36,329) - 331,980 - - 449,794 - - 67,963 - - (157,604) -
15,128 513,859 3,945 (59,403) (63,893) (1) 53,939 53,939 1,253
(29) (29) (1,450)
153,466 (513,095) 74,505
1,305 230,338 - - - -
(2,901) (27,559) - - - -
(5,836) (96,386) - - - -
(1,776) (15,052) (18) (170,200) (170,200) -
- 371,156 - 1,520 1,520 981
(1,655) (1,655) (5,157)
(27) (27) - 116,238 1,208,284 5,811 (43,031) (147,634) (9,197)
- 660,691 - - (662,240) -
1,004 47,009 28 227 (23,381) -
(105,133) 1,374,864 (7,552)
3,162 287,116 174,078 50 142,410 -
(7,399) (353,617) (29,452)
(1,417) (135,975) (9,666)
6,406 6,406 -
(32) (32) (13,544) 68 68 13,786
(19,686) (386,553) (204,596) 3,289 63,280 26,549
(43) (43) (1,956)
(15,602) (376,939) (44,802)
32,695 851,059 - (24,556) (852,655) -
- - - - - -
140,315 267,246 308
148,454 265,650 308 181,184 750,479 22,459 992,044 4,307,005 29,663
$ 1,173,228 $ 5,057,484 $ 52,121
(Continued)
Business-type Activities - Enterprise Funds
35

State of Wisconsin Statement of Cash Flows - Proprietary Funds For the Fiscal Year Ended June 30, 2018
(Continued)
Injured Patients and Environmental University of UnemploymentFamilies Compensation Improvement Wisconsin System Reserve
Reconciliation of Operating Income (Loss) to Net Cash Provided (Used) by Operations: Operating Income (Loss) $ (12,299) $ 30,117 $ (1,342,931) $ 217,241
Adjustment to Reconcile Operating Income (Loss) to Net Cash Provided (Used) by Operating Activities: Depreciation 524 - 323,984 - Provision for Uncollectible Accounts - - - (4,357) Operating Income (Investment Income) Classified as Investing Activity - - - - Operating Expense (Interest Expense) Classified as Noncapital Financing Activity - 8,780 - - Miscellaneous Nonoperating Income (Expense) - - - - Changes in Assets, Deferred Outflows, Liabilities, and Deferred Inflows: Decrease (Increase) in Receivables - 42,610 13,949 43,805 Decrease (Increase) in Due from Other Funds - (1,311) 4,025 57 Decrease (Increase) in Due from Component Units - - - - Decrease (Increase) in Due from Other Governments - - (38,248) 262 Decrease (Increase) in Inventories - - 12,175 - Decrease (Increase) in Prepaid Items - 17 14,359 - Decrease (Increase) in Net Pension Assets (100) (76) (399,080) - Decrease (Increase) in Other Assets - - - - Decrease (Increase) in Deferred Outflows of Resources 15 (21) 82,972 - Increase (Decrease) in Accounts Payable and Other Accrued Liabilities (125) (31) (35,978) (2,008) Increase (Decrease) in Due to Other Funds 18 3,132 - 127 Increase (Decrease) in Due to Component Units - - - - Increase (Decrease) in Due to Other Governments - 25 (11,208) (4,303) Increase (Decrease) in Tax and Other Deposits - - - - Increase (Decrease) in Unearned Revenue (424) - 1,749 - Increase (Decrease) in Interest Payable - - - - Increase (Decrease) in Compensated Absences - 67 1,516 - Increase (Decrease) in Net Pension Liability (26) (11) (112,699) - Increase (Decrease) in Postemployment Benefits 88 17 (2,593) - Increase (Decrease) in Future Benefits and Loss Liability 9,437 - - - Increase (Decrease) in Deferred Inflows of Resources 120 89 489,991 -
Total Adjustments 9,527 53,287 344,915 33,582
Net Cash Provided (Used) by Operating Activities $ (2,772) $ 83,404 $ (998,016) $ 250,824
Noncash Investing, Capital and Financing Activities:
Assets Acquired through Capital Leases $ - $ - $ 608 $ -
Special Item: Surrender of General Obligation Bonds
Held as Investments - - - -
Net Change in Unrealized Gains and Losses 9,707 - 2,220 - Other - - 3,530 -
The notes to the financial statements are an integral part of this statement.
Business-type Activities - Enterprise Funds
36
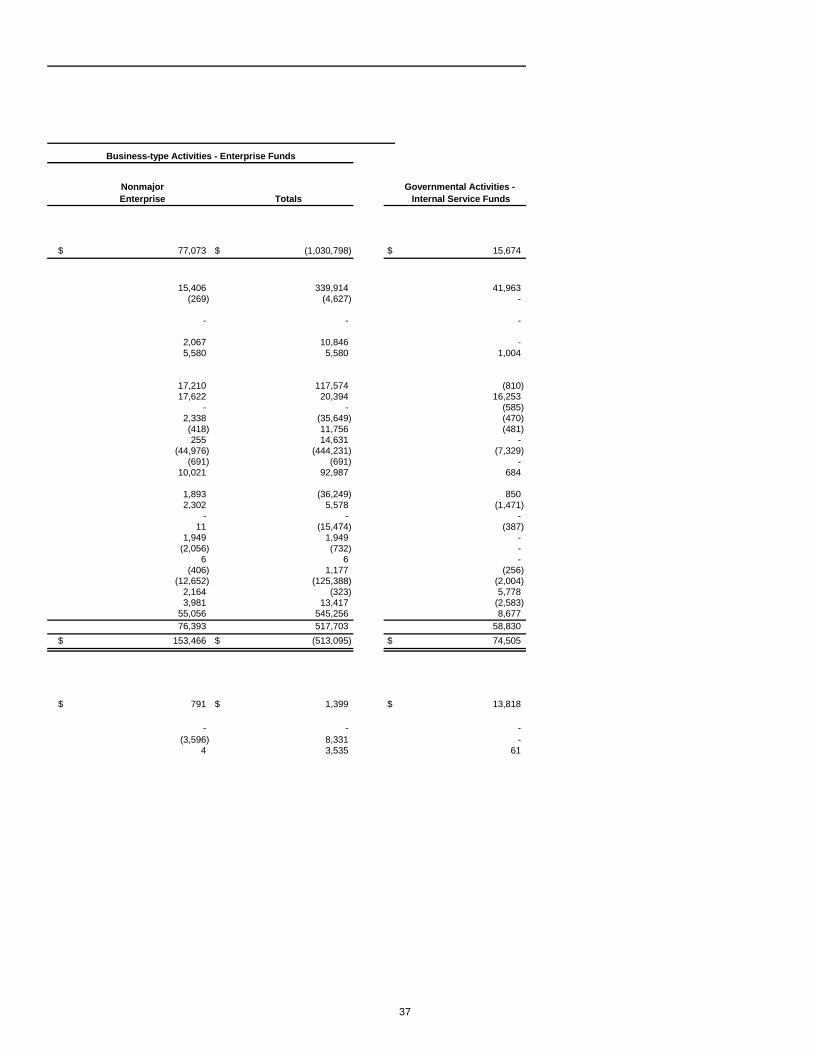
Nonmajor Governmental Activities - Enterprise Totals Internal Service Funds
$ 77,073 $ (1,030,798) $ 15,674
15,406 339,914 41,963 (269) (4,627) -
- - -
2,067 10,846 - 5,580 5,580 1,004
17,210 117,574 (810) 17,622 20,394 16,253
- - (585) 2,338 (35,649) (470) (418) 11,756 (481) 255 14,631 -
(44,976) (444,231) (7,329) (691) (691) -
10,021 92,987 684
1,893 (36,249) 850 2,302 5,578 (1,471)
- - - 11 (15,474) (387)
1,949 1,949 - (2,056) (732) -
6 6 - (406) 1,177 (256)
(12,652) (125,388) (2,004) 2,164 (323) 5,778 3,981 13,417 (2,583)
55,056 545,256 8,677
76,393 517,703 58,830
$ 153,466 $ (513,095) $ 74,505
$ 791 $ 1,399 $ 13,818
- - -
(3,596) 8,331 - 4 3,535 61
Business-type Activities - Enterprise Funds
37

State of WisconsinStatement of Fiduciary Net PositionJune 30, 2018
(In Thousands)
Pensionand Other Private-Employee Investment Purpose
Benefit Trust Trust Trust AgencyAssets
Cash and Cash Equivalents $ 2,312,162 $ 3,719,427 $ 78,010 $ 42,804
Securities Lending Collateral 1,576,662 - - -
Prepaid Items 42,087 - - -
Receivables (net of allowance):
Prior Service Contributions Receivable 17,199 - - -
Benefits Overpayment Receivable 2,664 - - -
Due from Other Funds 60,612 - 18,357 2,900
Due from Component Units 6,233 - - -
Interfund Receivables 290,222 - - -
Due from Other Governments 128,286 - 7,427 1,081
Due from Employers - - - -
Interest and Dividends Receivable 314,112 - - -
Investment Sales Receivable 1,279,158 - - -
Other Receivables 3,431 69 39,041 2,168
Total Receivables 2,101,916 69 64,825 6,149
Investments:
Fixed Income 30,709,368 - - -
Stocks 63,241,061 - - -
Options (3,830) - - -
Financial Futures Contracts and Swaps 51,251 - - -
Limited Partnerships 12,212,410 - - -
Preferred Securities 241,674 - - -
Convertible Securities 196 - - -
Real Estate 1,368,583 - - -
Investments of Private Purpose Trust Funds - - 5,059,125 -
Investments of Agency Funds - - - 57
Multi-asset Investments 4,701,121 - - -
Investment Contract 596,204 - - -
Foreign Currency Contracts (1,131) - - -
To Be Announced Securities 95,489 - - -
Total Investments 113,212,394 - 5,059,125 57
Capital Assets 33,895 - - -
Other Assets - - 20 342,594
Total Assets 119,279,115 3,719,496 5,201,980 $ 391,603
Deferred Outflows of Resources - - 34
LiabilitiesAccounts Payable and Other Accrued Liabilities 61,918 - 31,062 $ 23,859
Reverse Repurchase Agreements 6,114,256 - - -
Securities Lending Collateral Liability 1,576,662 - - -
Annuities Payable 360,589 - - -
Advance Contributions - - - -
Due to Other Funds 73,503 117 11,328 1,597
Interfund Payables 290,275 - - -
Tax and Other Deposits - - - 366,147
Future Benefits and Loss Liabilities - - 4,940 -
Short Sales of Securities 2,722,194 - - -
Investment Payable 467,189 - - -
Unearned Revenue 43 - 18,355 -
Compensated Absences Payable 2,558,709 - - -
Net Pension Liability - - - -
Other Postemployment Benefits - - 18 -
Total Liabilities 14,225,339 117 65,702 $ 391,603
Deferred Inflows of Resources - - 36
Net PositionHeld in Trust for Pension Benefits,
Pool Participants and Other Purposes $ 105,053,776 $ 3,719,379 $ 5,136,275
The notes to the financial statements are an integral part of this statement.
38

State of WisconsinStatement of Changes in Fiduciary Net PositionFor the Year Ended June 30, 2018
(In Thousands)
Pensionand Other Private-Employee Investment Purpose
Benefit Trust Trust Trust
AdditionsContributions:
Employer Contributions $ 1,078,916 $ - $ -
Employee Contributions 1,002,902 - -
Other - - -
Total Contributions 2,081,818 - -
Deposits - 10,300,723 534,095
Premiums - - 242,651
Federal Subsidy - - 20,339
Investment Income:
Net Appreciation (Depreciation) in
Fair Value of Investments 13,831,016 - -
Interest 569,459 - -
Dividends 1,243,516 - -
Securities Lending Income 37,868 - -
Other 213,128 - -
Investment Income of Investment,
Private Purpose, and Other
Employee Benefit Trust Funds 385,506 75,470 346,996
Less:
Investment Expense (487,384) (509) (8,261)
Securities Lending Rebates and Fees (8,220) - -
Investment Income Distributed to
Other Funds (530,657) - -
Net Investment Income 15,254,233 74,961 338,735
Interest on Prior Service Receivable 1,130 - -
Miscellaneous Income 5,724 - 5,192
Total Additions 17,342,905 10,375,685 1,141,012
DeductionsRetirement Benefits and Refunds:
Retirement, Disability, and Beneficiary 5,211,267 - -
Separations 38,358 - -
Total Retirement Benefits and Refunds 5,249,625 - -
Distributions 36,240 10,012,417 405,504
Other Benefit Expense 286,673 - 257,949
Administrative Expense 29,935 160 15,286
Miscellaneous Expense - - -
Transfers Out - - 5
Total Deductions 5,602,473 10,012,577 678,744
Net Increase (Decrease) 11,740,432 363,107 462,268
Net Position - Beginning of Year 93,313,344 3,356,271 4,674,006
Net Position - End of Year $ 105,053,776 $ 3,719,379 $ 5,136,275
The notes to the financial statements are an integral part of this statement.
39

State of WisconsinNotes To The Financial Statements
PageSummary of Significant Accounting Policies
Note 1. Summary of Significant Accounting Policies………………………………………………………………………… 41
Explanation of Certain Differences Between Governmental Fund Statements and Government-Wide Statements
Note 2. Detailed Reconciliation of the Government-wide and Fund Statements………………………………………… 53
Stewardship and Compliance Note 3. Budgetary Control……………………………………………………………………………………………………… 57
Note 4. Deficit Fund Balance/Fund Net Position, Restricted Net Position, Budget Stabilization Arrangement,
Minimum Fund Balance Policy, and Fund Balance of Governmental Funds…………………………………… 57
Detailed Disclosures Regarding Assets and RevenuesNote 5. Deposits and Investments……………………………………………………………………………………………… 59
Note 6. Receivables and Net Revenues……………………………………………………………………………………… 82
Note 7. Capital Assets…………………………………………………………………………………………………………… 83
Note 8. Endowments…………………………………………………………………………………………………………… 87
Note 9. Interfund Receivables, Payables and Transfers…………………………………………………………………… 88
Detailed Disclosures Regarding Liabilities and Expenses/ExpendituresNote 10. Changes in Long-term Liabilities……………………………………………………………………………………… 91
Note 11. Bonds, Notes and Other Debt Obligations…………………………………………………………………………… 93
Note 12. Lease Commitments and Installment Purchases…………………………………………………………………… 106
Note 13. Pollution Remediation Obligations…………………………………………………………………………………… 108
Note 14. Retirement Plan………………………………………………………………………………………………………… 109
Note 15. Milwaukee Retirement System………………………………………………………………………………………… 112
Note 16. Other Postemployment Benefit (OPEB) Programs…………………………………………………………….…… 113
Note 17. Other Postemployment Benefit Plans…………………………………………………………….………………… 115
Note 18. Public Entity Risk Pools Administered by the Department of Employee Trust Funds………………………… 122
Note 19. Self-Insurance…………………………………………………………………………………………………………… 124
Note 20. Insurance Funds………………………………………………………………………………………………………… 125
Other Note DisclosuresNote 21. Deferred Outflows of Resources and Deferred Inflows of Resources…………………………………………… 129
Note 22. Segment Information and Condensed Financial Data……………………………………………………………… 131
Note 23. Component Units - Condensed Financial Information................................................................................... 132
Note 24. Restatements of Beginning Fund Balances/Net Positions and Other Changes………………………………… 133
Note 25. Litigation, Contingencies and Commitments………………………………………………………………………… 135
Note 26. Tax Abatements ……………………………………………………………….……………………………………… 137
Note 27. Subsequent Events ……………………………………………………………….…………………………………… 140
Index
40
State of Wisconsin
Notes To The Financial Statements
For the Fiscal Year Ended June 30, 2018
41
NOTE 1. SUMMARY OF SIGNIFICANT ACCOUNTING POLICIES
A. Basis of Presentation
The accompanying basic financial statements have been prepared
in conformity with generally accepted accounting principles
(GAAP) for governments as prescribed by the Governmental
Accounting Standards Board (GASB).
B. Financial Reporting Entity
For GAAP purposes, the State of Wisconsin includes all funds,
elected offices, departments and agencies of the State, as well as
boards, commissions, authorities and universities. The State has
also considered all potential "component units" for which it is
financially accountable, and other affiliated organizations for which
the nature and significance of their relationship, including their
ongoing financial support, with the State are such that exclusion
would cause the State's financial statements to be misleading or
incomplete.
The decision to include a potential component unit in the State’s
reporting entity is based on the criteria set forth in GASB Statement
No. 14, The Financial Reporting Entity, GASB Statement No. 39, Determining Whether Certain Organizations Are Component Units, an amendment of GASB Statement No. 14, and GASB Statement
No. 61, The Financial Reporting Entity: Omnibus, an amendment of GASB Statements No. 14 and No. 34. GASB Statement No. 14
criteria include the ability to appoint a voting majority of an
organization's governing body and (1) the ability of the State to
impose its will on that organization or (2) the potential for the
organization to provide specific financial benefits to, or impose
specific financial burdens on, the State. GASB Statement No. 39
provisions relate to separately legal, tax-exempt organizations and
include: (1) the economic resources received or held are entirely or
almost entirely for the direct benefit of the State, (2) the State is
entitled to, or has the ability to otherwise access, a majority of the
economic resources received or held by the separate organization,
and (3) the economic resources received or held by an individual
organization that the State is entitled to, or has the ability to
otherwise access, are significant to the State. GASB Statement
No. 61 modifies certain requirements for inclusion in the financial
reporting entity, especially in regards to the fiscal dependency
criterion where a financial benefit or burden relationship is now
required. It also amends the “blending” criteria for component units
and clarifies the reporting of equity interests in legally separate
organizations.
Based upon the application of the criteria contained in GASB
Statement No. 14, as amended by GASB Statement No. 39, the
Wisconsin Public Broadcasting Foundation, Inc. is reported as a
blended component unit; and the Wisconsin Housing and
Economic Development Authority, the Wisconsin Health Care
Liability Insurance Plan, the University of Wisconsin Hospital and
Clinics Authority, the Wisconsin Economic Development
Corporation and the University of Wisconsin Foundation, are
presented as discrete component units, as discussed below.
Complete financial statements of the individual component units
that issue separate statements can be obtained from their
respective administrative offices:
Wisconsin Public Broadcasting Foundation Inc.
Wisconsin Educational Communications Board
3319 West Beltline Highway
Madison, WI 53713
http://www.ecb.org
Wisconsin Housing and Economic Development Authority
201 West Washington Avenue, Suite 700
Madison, WI 53703
http://www.wheda.com
Wisconsin Health Care Liability Insurance Plan
Office of the Commissioner of Insurance
125 South Webster Street
Madison, WI 53703
http://oci.wi.gov
University of Wisconsin Hospital and Clinics Authority
301 South Westfield Road
Madison, WI 53717
http://www.uwhealth.org
Wisconsin Economic Development Corporation
201 West Washington Avenue
Madison, Wisconsin 53703
http://inwisconsin.com
University of Wisconsin Foundation
1848 University Avenue
Madison, WI 53726-4090
https://www.supportuw.org
State of Wisconsin Notes to The Financial Statements
For the Fiscal Year Ended June 30, 2018
42
Blended Component Unit
Blended component units are entities that are legally separate from
the State, but are so intertwined with the State that they are, in
substance, the same as the State. The blended component unit
serves or benefits the primary government. They are reported as
part of the State and blended into the appropriate funds.
Wisconsin Public Broadcasting Foundation, Inc. – The Wisconsin
Public Broadcasting Foundation, Inc. (Foundation), created in 1983
by the Wisconsin Legislature, is a private, non-stock, nonprofit
Wisconsin Corporation, wholly owned by the Wisconsin
Educational Communications Board (ECB), a unit of the State. The
Foundation solicits funds in the name of, and with the approval of,
the ECB. The Foundation's funds are managed by a five-member
board of trustees consisting of the executive director of the ECB
and four members of the ECB board. The Foundation is reported
as a special revenue fund.
Discretely Presented Component Units
Discretely presented component units are entities which are legally
separate from the State, but are financially accountable to the
State, whose relationship with the State is such that exclusion
would cause the State's financial statements to be misleading or
incomplete. The Wisconsin Housing and Economic Development
Authority, the Wisconsin Health Care Liability Insurance Plan, the
University of Wisconsin Hospital and Clinics Authority, the
Wisconsin Economic Development Corporation and the University
of Wisconsin Foundation are reported in a separate column and in
separate rows in the government-wide statements to emphasize
that they are legally separate.
Wisconsin Housing and Economic Development Authority – The
Wisconsin Housing and Economic Development Authority
(Authority) was established by the Wisconsin Legislature in 1972
to help meet the housing needs of Wisconsin's low and moderate
income citizens. The State has significantly expanded the scope
of services of the Authority by adding programs that include
financing for farmers and for economic development projects.
While the Authority receives no State tax dollars for its bond-
supported programs and the State is not liable on bonds the
Authority issues, the State has the ability to impose its will on the
Authority through legislation. The State appoints the Authority's
Board. The Authority reports on a June 30 fiscal year-end.
Wisconsin Health Care Liability Insurance Plan – The Wisconsin
Health Care Liability Insurance Plan (Plan) was established by rule
of the Commissioner of Insurance of the State of Wisconsin to
provide health care liability insurance and liability coverage
normally incidental to health care liability insurance to eligible
health care providers in the State. Eight out of 13 members of the
Board of Directors are appointed by the Governor, and the State
has the ability to impose its will upon the Plan. The Plan reports
on a fiscal year ended December 31.
University of Wisconsin Hospital and Clinics Authority – The
University of Wisconsin Hospital and Clinics Authority (Hospital) is
a not-for-profit academic medical center. The Hospital operates an
acute-care hospital with 566 beds, numerous specialty clinics, and
six intensive care units with a total of 83 beds, and it provides
comprehensive health care to patients, education programs,
research and community service. Prior to June 1996, the Hospital
was a unit of the University of Wisconsin-Madison. In June 1996,
in accordance with legislation enacted by the State Legislature, the
Hospital was restructured as a Public Authority, a public body
corporate and politic created by State statutes. The State appoints
a majority of the Hospital’s Board of Directors and a financial
benefit/burden relationship exists between the Hospital and the
State. The Hospital reports on a June 30 fiscal year-end.
The legislation that created the Hospital Authority also provided,
among other things, for the Board of Regents of the University of
Wisconsin System to execute various agreements with the
Hospital. These agreements include an Affiliation Agreement, a
Lease Agreement, a Conveyance Agreement and a Contractual
Services Agreement and Operating and Service Agreement.
The Affiliation Agreement requires the Hospital to continue to
support the educational, research and clinical activities of the
University of Wisconsin-Madison, which are administered by the
Hospital. Under the terms of a Lease Agreement, the Hospital
leases facilities which were occupied by the Hospital as of
June 29, 1996. Under a Conveyance Agreement, certain assets
and liabilities related to the Hospital were identified and transferred
to the Hospital effective July 1, 1996. Subject to the Contractual
Services Agreement and Operating and Service Agreement
between the Board of Regents and the Hospital, the two parties
have entered into contracts for the continuation of services in
support of programs and operations.
Wisconsin Economic Development Corporation – The Wisconsin
Economic Development Corporation (WEDC) is a legally separate
body corporate and politic. The WEDC’s primary purpose is
economic development activities in the State. The State appoints
a majority of the WEDC’s Board, has the ability to impose its will on
the WEDC, and a financial benefit/burden relationship exists. The
WEDC reports on a fiscal year ended June 30.
University of Wisconsin Foundation – The University of Wisconsin
Foundation (the Foundation) is a legally separate, tax-exempt
component unit of the State. The Foundation acts primarily as a
fund-raising organization to supplement the resources that are
available mostly to the University of Wisconsin-Madison (UW-
Madison) as well as several other units of the University of
Wisconsin System in support of its programs. These include
scientific, literary, athletic and educational program purposes. The
University of Wisconsin System is reported as an enterprise fund
State of Wisconsin Notes to The Financial Statements
For the Fiscal Year Ended June 30, 2018
43
of the State. Although the State does not control the timing or
amount of receipts from the Foundation, the majority of resources,
or income thereon, that the Foundation holds and invests, are
restricted to the activities of the UW-Madison by the donors.
Because these restricted resources held by the Foundation can
only be used by, or for the benefit of, the UW-Madison and several
other units of the University of Wisconsin System, the Foundation
is considered a component unit of the State. The Foundation
reports on a fiscal year ended June 30.
Related Organizations
These related organizations are excluded from the reporting entity
because the State's accountability does not extend beyond
appointing a voting majority of the organization's board members.
Financial statements are available from the respective
organizations.
Wisconsin Health and Educational Facilities Authority – a public
body politic and corporate that provides financing for capital
expenditures and refinancing of indebtedness for Wisconsin health
care and educational institutions.
Bradley Center Sports and Entertainment Corporation – a public
body politic and corporate that operates the Bradley Center.
Fox River Navigational System Authority – created under Chapter
237 as a public body corporate and politic to oversee the Fox River
navigational system after the federal government (the U.S. Army
Corps of Engineers) transferred the system to the State.
C. Government-wide and Fund Financial
Statements
The government-wide financial statements consist of the statement
of net position and the statement of activities.
These statements report information on all activities, except for
fiduciary activities, of the primary government and its component
units. The statement of net position and the statement of activities
distinguish between the governmental and business-type activities
of the State. Governmental activities are generally financed
through taxes, intergovernmental revenues and other
nonexchange revenues. Business-type activities are generally
financed in whole or in part by fees charged to external parties for
goods and services. The focus of the government-wide statements
is the primary government. A separate column on the statement of
net position and the statement of activities reports activities for all
discretely presented component units.
The fund financial statements provide detailed information on all
governmental, proprietary and fiduciary funds. Separate columns
are presented for all major governmental and enterprise funds.
Nonmajor governmental and enterprise funds are aggregated and
presented as a single column on the respective governmental or
proprietary statements. Internal service funds are exempt from the
major fund reporting requirements and are aggregated and
ultimately reported as a single column on the proprietary
statements. Fiduciary funds are also exempt from major fund
reporting and are aggregated by fund type and ultimately reported
as single columns on the fiduciary statements.
D. Measurement Focus, Basis of Accounting,
and Financial Statement Presentation
The government-wide statement of net position and statement of
activities, as well as the proprietary and fiduciary fund statements,
are reported using the economic resources measurement focus
and the accrual basis of accounting. With this measurement focus,
all assets, deferred outflows of resources, liabilities, and deferred
inflows of resources associated with the operation of these funds
are included on the statement of net position. Under the accrual
basis, revenues are recorded when earned and expenses are
recorded when the related liability is incurred.
In the University of Wisconsin System's enterprise fund, revenues
and expenses of an academic term that spans two fiscal years are
recognized in two years based on a proration of summer session
days.
In reporting the financial activity of its enterprise funds and
business-type activities, the State applies all applicable GASB
pronouncements.
Most of the funds included in the State’s Comprehensive Annual
Financial Report are presented on a fiscal year ended June 30.
However, because funds of the Department of Employee Trust
Funds (DETF) are administered on a calendar year basis, they are
presented on a fiscal year ended December 31. This may result in
GASB standards being implemented in different fiscal years for the
DETF GAAP funds. Funds reported as of December 31 include:
Wisconsin Retirement System, Accumulated Sick Leave, Duty
Disability, Reimbursed Employee Expense, Local Retiree Life
Insurance, Retiree Life Insurance, Milwaukee Retirement System,
Retiree Health Insurance, Local Retiree Health Insurance, Income
Continuation Insurance, Health Insurance, and Life Insurance.
As a result of the differences in timing, transactions between funds
with different fiscal year ends may result in inconsistencies in
amounts reported as due to/due from other funds or as interfund
transfers. Similar differences may occur in amounts reported as
due to/from component units.
The University of Wisconsin Foundation and Wisconsin Health
Care Liability Insurance Plan are reported as component units.
The Foundation financial statements are prepared using
accounting standards promulgated by the Financial Accounting
Standards Board as they apply to not-for-profit corporations. The
Plan financial statements are prepared using prescribed statutory
accounting practices included in the National Association of

State of Wisconsin Notes to The Financial Statements
For the Fiscal Year Ended June 30, 2018 44
Insurance Commissioner’s Accounting Practices and Procedures
Manual. Statutory accounting practices vary somewhat from
United States GAAP but are expected to be immaterial.
Governmental fund financial statements are accounted for using
the current financial resources measurement focus. With this
measurement focus, only current assets and current liabilities
generally are included on the balance sheet. Operating statements
of these funds present increases (i.e., revenues and other financing
sources) and decreases (i.e., expenditures and other financing
uses) in net available financial resources.
Governmental funds are reported on the modified accrual basis of
accounting. This basis of accounting recognizes revenues
generally when they become measurable and available to pay
current reporting period liabilities. For this purpose, the State
considers tax revenues to be available if they are collected within
60 days of the end of the current fiscal year end. Other revenues
are considered to be available if received within one year after the
fiscal year end except for tobacco settlement revenues for which
just one-half of revenues expected to be received within one year
are recognized. Material revenue sources susceptible to accrual
include individual and corporate income taxes, sales taxes, public
utility taxes, motor fuel taxes and federal revenues.
Expenditures and related liabilities are recognized when
obligations are incurred as a result of the receipt of goods and
services. However, expenditures related to debt service,
compensated absences, and claims and judgments, are recorded
only when payment is due.
The State reports the following major funds:
Major Governmental Funds
• General Fund – the primary operating fund of the State,
accounts for all financial transactions except those required to
be accounted for in another fund.
• Transportation Fund – a special revenue fund, accounts for the
proceeds from motor fuel taxes, vehicle registrations, licensing
fees, and federal and local governments which are used to
supply and support safe, efficient and effective transportation in
Wisconsin.
• Capital Improvement Fund - a capital projects fund, accounts for
the proceeds received from general obligation bonds and notes,
and associated interest earnings. Resources of the fund are
used for the acquisition or construction of major capital facilities
and for repair and maintenance projects.
Major Enterprise Funds
• Injured Patients and Families Compensation Fund – accounts
for the program to provide excess medical malpractice insurance
for Wisconsin health care providers. The revenues to finance
this insurance are primarily derived from assessments charged
to health care providers.
• Environmental Improvement Fund – accounts for financial
resources generated and used for clean water projects. Federal
capitalization grants, interest earnings, revenue bond proceeds,
and general obligation bond proceeds are its primary funding
sources.
• University of Wisconsin System Fund – accounts for the 13
universities, 13 two-year colleges, the University of Wisconsin
Extension and System Administration.
• Unemployment Reserve Fund – accounts for unemployment
contributions made by employers, federal program receipts,
benefit payment recoveries and unemployment benefits paid to
laid off workers in the State.
In addition, the State reports the following fund types:
Governmental Funds
• Special Revenue Funds – account for and report the proceeds
of specific revenue sources that are restricted or committed to
expenditure for specified purposes other than debt service or
capital projects. Examples include the Conservation Fund and
the Petroleum Inspection Fund.
• Debt Service Funds – account for and report financial resources
that are restricted, committed, or assigned to expenditure for
principal and interest. Financial resources that are being
accumulated for future principal and interest are also reported in
debt service funds.
• Capital Projects Funds – account for and report financial
resources that are restricted, committed or assigned to
expenditure for capital outlays, including the acquisition or
construction of capital facilities and other capital assets (other
than those financed by proprietary funds or that will be held in
trust for individuals, private organizations, or other
governments).
• Permanent Funds – account for and report resources that are
restricted to the extent that only earnings, and not principal, may
be used for purposes that support the State’s programs – that is,
for the benefit of the State or its citizenry.
State of Wisconsin Notes to The Financial Statements
For the Fiscal Year Ended June 30, 2018
45
Proprietary Funds
• Enterprise Funds – account for the activities for which fees are
charged to external users for goods or services. Examples
include the Lottery Fund and the Veterans Trust Fund.
• Internal Service Funds – account for the operations of State
agencies which provide goods or services to other State units or
other governments on a cost-reimbursement basis. These
services include technology, fleet management, financial,
facilities management, and risk management. Additional goods
and services are provided by the inmate work experience
program, Badger State Industries.
Fiduciary Funds
• Pension and Other Employee Benefit Trust Funds – used to
account for resources that are required to be held in trust for
members and beneficiaries for public employee retirement or
other benefit plans e.g. Wisconsin Retirement System.
• Investment Trust Funds – account for assets invested on a
commingled basis by the State on behalf of other governmental
entities e.g. local government pooled investments.
• Private-purpose Trust Funds – account for all other trust
arrangements which benefit individuals, private organizations, or
other governments e.g. the state-sponsored college savings
program.
• Agency Funds – account for those assets for which the State
acts solely in a custodial capacity e.g. the collection and
disbursement of court-ordered child support payments.
Amounts reported as program revenues on the government-wide
statement of activities include (a) charges for services – amounts
received from customers or applicants who purchase, use or
directly benefit from the goods, services or privileges provided by
the State; including interest earnings from various loan funds/
component units, (b) program-specific operating grants,
contributions, and restricted interest, and (c) program-specific
capital grants, contributions, and restricted interest. General
revenues consist of taxes and all other revenues that do not meet
the definition of program revenues. Special items, if any, are
significant transactions or events within the control of management
that are either unusual in nature or infrequent in occurrence.
As a general rule, the effect of interfund activity has been
eliminated from the government-wide financial statements. This
includes all internal service fund activity, as well as other internal
allocations. Exceptions to this general rule are certain charges
between various functions of the government, whose elimination
would distort the direct costs and program revenues reported for
the various functions concerned.
The revenues and expenses shown on the proprietary fund
statements are identified as either operating or nonoperating.
Operating revenues and expenses generally result from providing
goods and services in connection with a proprietary fund’s primary
mission. The State’s enterprise funds are involved in many diverse
fields including patient care, insurance programs, loan programs,
the University of Wisconsin System, employee benefit plans, and
the lottery. The internal service funds provide services and goods
to other State agencies and departments.
A significant portion of operating revenues for the proprietary funds
is recorded under charges for goods and services. In the case of
the State’s loan program enterprise funds, investment and interest
income is an important component of operating revenue.
Operating revenues of the University of Wisconsin include tuition
and fees, certain grants and contracts resulting from exchange
transactions, and sales and services of educational activities and
auxiliary enterprises. In regards to the employee benefit plans, the
primary operating revenue source is participant and employer
contributions. Operating expenses for the proprietary funds include
the costs of sales and services, benefit expenses, administration
expenses and depreciation on capital assets. All revenues and
expenses not related to a fund’s primary purpose are reported as
nonoperating.
When both restricted and unrestricted resources are available for
use, it is the State’s policy to use restricted resources first, then
unrestricted resources as they are needed.
GASB Standards Implemented During the Fiscal Year
Effective for Fiscal Year 2018, the State implemented
Governmental Accounting Standards Board (GASB) Statement
No. 75, Accounting and Financial Reporting for Postemployment Benefits Other Than Pensions. This statement establishes
standards of accounting and financial reporting for defined benefit
other postemployment benefits (OPEB) and defined contribution
OPEB that are provided to the employees of state and local
governmental employers.
The State also implemented GASB Statement No. 74, Financial Reporting for Postemployment Benefit Plans Other than Pension Plans. This statement establishes reporting standards for other
postemployment benefits included in the general purpose external
financial reports of state and local governmental OPEB plans.
State of Wisconsin Notes to The Financial Statements
For the Fiscal Year Ended June 30, 2018
46
E. Assets, Deferred Outflows of Resources, Liabilities, Deferred Inflows of Resources, and Net Position/Fund Balances
1. Cash and Cash Equivalents
Cash balances of most funds are deposited with the Department of
Administration (DOA) where the available balances beyond
immediate needs are pooled in the State Investment Fund for
short-term investment purposes. Balances pooled are restricted to
legally stipulated investments valued consistent with GASB
Statement No. 72, Fair Value Measurement and Application. Cash
balances not controlled by DOA may be invested where permitted
by statute.
Cash and cash equivalents, reported on the balance sheet and
statement of cash flows, include bank accounts, petty cash, cash
in transit, short-term investments with an original maturity of three
months or less such as certificates of deposit, money market
certificates, repurchase agreements and individual funds' shares in
the State Investment Fund.
GASB Statement No. 40, Deposit and Investment Risk Disclosures, requires disclosure of risks associated with deposit
and investment balances and the policies applied to mitigate such
risks. Specific disclosures are included in Note 5, Deposits and
Investments.
2. Investments The State may invest in direct obligations of the United States and
Canada, securities guaranteed by the United States, certificates of
deposit issued by banks in the United States and solvent financial
institutions in the State, commercial paper and nonsecured
corporate notes and bonds, bankers acceptances, participation
agreements, privately placed bonds and mortgages, common and
preferred stock and other securities approved by applicable
sections of the Wisconsin Statutes, bond resolutions, and various
trust indentures (see Note 5 to the financial statements).
Investments of the primary government are reported at fair value
consistent with the provisions of GASB Statement No. 72, Fair Value Measurement and Application. Typically, fair value
information is determined using quoted market prices. However,
when quoted market prices are not available for certain securities,
fair values are estimated through techniques such as discounted
future cash flows, matrix pricing and multi-tiers.
In some instances, securities are reported at cost. Certain non-
public or closely held stocks are carried at cost since no
independent quotation is available to price these securities.
Further, certain investment agreements are reported on a cost
basis because the State cannot readily determine whether these
agreements meet the definition of interest-earning investment
contracts as defined by GASB Statement No. 31. However, the
impact on the financial statements is immaterial.
Under Wisconsin Statutes, the investment earnings of certain
Permanent Funds are assigned to other funds. The following table
shows the funds earning the investment income and the ultimate
recipients of that income:
Fund Generating
Investment Income
Fund Receiving
Investment Income
Agricultural College University of Wisconsin System
Normal School General Fund and University of Wisconsin System
University University of Wisconsin System
Benevolent General Fund
3. Mortgage and Other Loans
Mortgage loans of the Veterans Mortgage Loan Repayment Fund
and the Veterans Trust Fund programs, business-type activities,
are stated at the outstanding loan balance less an allowance for
doubtful accounts.
4. Forestation State Tax
2017 Wis. Act 59 (the Budget Act) ended the forestry mill tax, the
only property tax that had been levied by the State. The proceeds
of the tax had been paid to the Conservation Fund. The tax ended
effective with the January 1, 2017 property tax assessments
(property taxes levied in 2017 for payment in 2018).
5. Interfund Assets/Liabilities
During the course of operations, numerous transactions occur
between individual funds for goods provided or services rendered.
The balance sheet or statement of net position for proprietary and
fiduciary funds classifies these receivables and payables as "Due
from Other Funds" or "Due to Other Funds." Short-term interfund
loans are classified as "Interfund Receivables" or "Interfund
Payables." Long-term interfund loans are classified as "Advances
to Other Funds" and "Advances from Other Funds".
Balances that exist between the primary government and
component units are classified as “Due to/from Primary
Government” and, correspondingly, “Due to/from Component
Units”.
Amounts reported in the funds as interfund assets/liabilities are
eliminated in the governmental and business-type columns of the
Statement of Net Position, except for the net residual amount due
between governmental and business-type activities which is shown
as internal balances.
State of Wisconsin Notes to The Financial Statements
For the Fiscal Year Ended June 30, 2018
47
6. Inventories and Prepaid Items
Inventories of governmental and proprietary funds are valued at
cost, which approximates market, using the first-in/first-out, last
in/first out, or weighted-average method. The costs of
governmental fund-type inventories are recorded as expenditures
when purchased rather than when consumed.
Inventories of the University of Wisconsin System held by central
stores are valued at average cost, fuels are valued at market, and
other inventories held by individual institutional cost centers are
valued using a variety of cost flow assumptions that, for each type
of inventory, are consistently applied from year to year.
Prepaid items reflect payments for costs applicable to future
accounting periods.
The fund balances of governmental funds are reported as
nonspendable for inventories and prepaid items, except in cases
where prepaid items are offset by unearned revenues, to indicate
that these accounts do not represent expendable available
financial resources.
7. Capital Assets
Capital assets, which include property, plant, equipment,
intangibles, land and infrastructure assets (roads, bridges, and
buildings considered an ancillary part of roads), are reported in the
applicable governmental or business-type activities columns in the
government-wide financial statements. Assets of the primary
government, other than infrastructure and land purchased for the
construction of infrastructure assets, are capitalized when they
have a unit cost of $5,000 or more (except for a collection of library
resources that must have a cumulative value equal to or greater
than $5.0 million and software purchased by the University of
Wisconsin System) and a useful life of more than one year. In
addition, internally generated intangible assets are capitalized only
if costs are equal to or are greater than $1.0 million.
Purchased or constructed capital assets are valued at cost or
estimated historical cost if actual historical cost is not practicably
determinable. Donated capital assets are recorded at their
acquisition value at the time received.
The State has elected to report infrastructure assets (roads,
bridges and buildings considered an ancillary part of roads) using
the modified approach. Under this method infrastructure assets
are not required to be depreciated if the State manages its eligible
infrastructure assets using an asset management system designed
to maintain and preserve its infrastructure assets at a condition
level established and disclosed by the State. All infrastructure
assets constructed prior to July 1, 2000 have been recorded at
estimated historical cost which was determined by calculating the
current cost of a similar asset and deflating that cost using the
Federal Highway Administration’s composite index for federal aid
highway construction to the estimated average construction date.
All infrastructure assets constructed after July 1, 2000 have been
recorded at historical cost. The costs of maintenance and
preservation that do not add to the asset’s capacity or efficiency
are not capitalized. Interest incurred during construction is not
capitalized.
Exhaustible capital assets of the primary government generally are
depreciated on the straight-line method over the asset’s useful life.
Select buildings of the University of Wisconsin System are
depreciated using the componentized method over the estimated
useful life of the related assets. Depreciation expense is recorded
in the government-wide financial statements, as well as in the
proprietary fund statements. There is no depreciation recorded for
land, construction in process, and infrastructure. In addition,
depreciation is not recorded for certain other capital assets
including the State Capitol, Executive Residence and associated
furnishings, and the Historical Society library collection. Generally,
estimated useful lives are as follows:
Buildings and improvements 6 - 40 years
Equipment, machinery and furnishings 3 - 15 years
Library Holdings 15 years
Collections of works of art, historical treasures, and similar assets,
which are on public display, used in furtherance of historical
education, or involved in advancement of artistic or historical
research, are not capitalized unless these collections were already
capitalized at June 30, 1999. Collections range from memorabilia
on display in the Wisconsin Veterans Museum, the Wisconsin
Historical Society Museum and other museums to buildings such
as the Villa Louis Mansion and the Fur Trade Museum located at
the Villa Louis historical site. In addition, works of art or historical
treasures on display in the various State office buildings, as well as
statues on display outside the State Capitol, also are not
capitalized.
In Fiscal Year 2018, the University of Wisconsin System elected to
change the accounting method for library holdings. Library holdings
will be treated as a composite asset and depreciated over a 15-
year average life. In prior years, those assets were not depreciated.
The new accounting method, which was applied prospectively, is
common with other peer university systems. The University of
Wisconsin System financial statements for Fiscal Year 2018
include a prior period adjustment of $961.0 million for accumulated
depreciation.
8. Restricted and Limited Use Assets
Assets that are required to be held and/or used as specified in
Wisconsin statutes, bond indentures, bond resolutions, trustee
agreements, board resolutions, and donor specifications have
been reported as Restricted and Limited Use Assets.

State of Wisconsin Notes to The Financial Statements
For the Fiscal Year Ended June 30, 2018
48
9. Local Assistance Aids
Municipal and County Shared Revenue Program
Through the Municipal and County Shared Revenue Program, the
State distributes general revenues collected from general State tax
sources to municipal and county governments to be used for
providing local government services. State statutes require that
payment to local governments be made during July and November.
At June 30, 2018, the State was liable to various local governments
for unpaid shared revenue aid. To measure the amount of the
program allocable to the State's fiscal year, the amount is prorated
over portions of recipient local governments’ calendar fiscal years
that are within the State's fiscal year. The result is that a liability of
$441.7 million representing one-half of the total appropriated
amount is reported at June 30, 2018 as Due to Other
Governments.
State Property Tax Credit Program
At June 30, 2018, the State was liable to various taxing jurisdictions
for the school levy, the first dollar, and the lottery property tax
credits paid through the State Property Tax Credit Program.
The school levy tax credit provides property tax relief in the form of
State credits on individual property tax bills.
The first dollar tax credit was first established for property taxes
levied in 2008, and payable in 2009. This credit is allowed on every
taxable real estate parcel containing an improvement in the state.
Under the lottery property tax credit, owners of property used as a
primary residence receive a tax credit equal to the school property
tax on a portion of the dwelling’s value.
State statutes require that payment to local taxing jurisdictions for
the school levy and first dollar tax credits be made during July.
Although the state property tax credit is calculated on the property
tax levy for school purposes, the State's July payment is paid to an
administering municipality who treats the payment the same as
other tax collections and distributes the collections to the various
tax levying jurisdictions (e.g., cities, towns, and school districts).
The portion of the liability payable to school districts for the school
levy and first dollar tax credits represents the amount of the July
payment earned over the school districts' previous fiscal year
ended June 30. Since the entire school districts' portion of the July
payment occurs within the State's fiscal year, 100 percent of the
July payment relating to the school taxing jurisdictions' levy is
reported as a liability at June 30, 2018.
The portion of the liability payable to general government for the
school levy and first dollar tax credits represents the amount of the
July payment prorated over the portion of the local governments'
calendar year which is within the State's fiscal year. The result is
that 50 percent of the July payment based on the general
government taxing jurisdictions' levy is reported as a liability at
June 30, 2018.
The aggregated State Property Tax Credit Program liability of
$811.0 million is reported in the General Fund as Due to Other
Governments. Of that amount, $700.0 million relates to the school
levy tax credit and $111.0 million relates to the first dollar tax credit.
The lottery property tax credit is accounted for in the Lottery Fund,
an enterprise fund that records revenues and expenses on the
accrual basis. The State pays municipal treasurers for lottery
credits who distribute the moneys to the various taxing jurisdictions.
For credits reducing the calendar year 2018 property tax bills, the
State made this payment in March 2018. A portion of the State’s
March payment distributed to the general government taxing
jurisdictions applies to their fiscal year that ends on December 31.
Therefore, part of the March distribution represents an expense of
the State in Fiscal Year 2018, while the remaining portion
represents advanced payments. The resulting deferred outflow of
resources reported within the Lottery Fund totals $43.5 million at
June 30, 2018.
State Aid for Exempt Computers
The Aid for Exempt Computers compensates local governments
for tax base lost due to the property tax exemption for computers,
software and related equipment. Aid payments are calculated
using a procedure that results in an aid amount equal to the amount
of taxes that would be paid if the property were taxable. Payments
to local governments are made on the fourth Monday in July.
At June 30, 2018, the State was liable to various local governments
and other taxing jurisdictions for unpaid exempt computer aid
payments of $65.7 million.
State Aid for Exempt Personal Property
2017 Wis. Act 59 (the Budget Act) exempted machinery, tools, and
patterns, not including such items considered manufacturing
property under current law, from the property tax effective with
property assessed as of January 1, 2018 (the 2018(19) property
tax levy). The Act also created a state aid program administered
by DOR to make payments to each local taxing jurisdiction,
including tax increment districts, that imposed property taxes on
those items that were not manufacturing property in 2017(18).
Upon certification by DOR, payments will be made to local taxing
jurisdictions on or before the first Monday in May. Under the Act,
the first aid payment is scheduled to be made in May 2019.
10. Long-term Debt Obligations
In the government-wide financial statements, and proprietary fund
types in the fund financial statements, long-term debt is reported
as a liability net of the applicable bond premium or discount. Bond
premiums and discounts are deferred and amortized using the

State of Wisconsin Notes to The Financial Statements
For the Fiscal Year Ended June 30, 2018
49
effective interest rate method on a prospective basis beginning in
Fiscal Year 2004, except for the annual appropriation bonds that
are amortized ratably over the life of the obligations to which they
relate.
In the fund financial statements, governmental fund types
recognize flows for bond premiums and discounts, as well as
issuance costs, during the current period. The face amount of the
debt issued is reported as other financing sources. Premiums and
discounts are reported as other financing sources and other
financing uses, respectively. Issuance costs are reported as other
debt service expenditures for governmental fund types, and non-
operating expenses for proprietary fund types.
On the government-wide financial statements, bond premiums and
discounts related to the Transportation Revenue Bonds and the
Petroleum Inspection Fee Obligation Revenue Bonds (which
finance programs in a capital projects fund and a special revenue
fund, respectively) are amortized ratably over the life of the
obligations to which they relate. Results from the use of this
method do not vary materially from those that would be obtained
by use of the effective interest rate method.
11. Compensated Absences
Consistent with the compensated absences reporting standards of
GASB Statement No. 16, Accounting for Compensated Absences, an accrual for certain salary-related payments associated with
annual leave and an accrual for a certain portion of sick leave is
included in the compensated absences liability at year end.
Annual Leave
Full-time employees' annual leave days are credited on January 1
of each calendar year in general at a minimum of 15 or 13 days per
year, depending on Fair Labor Standards Act (FLSA) status. There
is no requirement to use annual leave. However, unused leave is
lost unless approval to carry over the unused portion is obtained
from the employing agency. In general, each full-time employee is
eligible for four and one-half personal holidays each calendar year,
provided the employee is in pay status for at least one day in the
year. If a holiday occurs on a Saturday, employees receive leave
time proportional to their working status to use at their discretion.
The State's compensated absence liability at June 30 consists of
accumulated unpaid annual leave, personal holiday hours, and
Saturday/legal hours earned and vested during January through
June. The liability is reported in the government-wide, proprietary
fund types and fiduciary funds.
Sick Leave
Full-time employees earn sick leave at a rate of five hours per pay
period. Unused sick leave is accumulated from year to year without
limit until termination or retirement. Accumulated sick leave is not
paid. However, at employee retirement the accumulated sick leave
may be converted to pay for the retiree's health insurance
premiums. The State accumulates resources to pay for the
expected health insurance premiums of retired employees. The
portion of the health insurance obligation funded through the sick
leave conversion and accumulated resources are presented in the
Accumulated Sick Leave Fund, a pension and other employee
benefit trust fund.
12. Unearned Revenue
In both the government-wide and fund financial statements
unearned revenue represents amounts for which asset recognition
criteria have been met, but not revenue recognition criteria.
Unearned revenue arises when resources are received by the
State before it has a legal claim to them, such as when grant
moneys are received prior to the incurrence of qualifying
expenditures. In subsequent periods, when revenue recognition
criteria are met, or when the State has a legal claim to the
resources, the liability for unearned revenue is removed and
revenue is recognized.
Unearned revenue of the University of Wisconsin System consists
of payments received but not earned at June 30, 2018, primarily for
summer session tuition, tuition and room deposits for the next fall
term, advance ticket sales for upcoming intercollegiate athletic
events, and amounts received from grant and contract sponsors
that have not yet been earned under the terms of the agreement.
13. Self-Insurance
Consistent with the requirements of GASB Statement No. 10,
Accounting and Financial Reporting for Risk Financing and Related Insurance Issues, the State’s risk management activities are
reported in an internal service fund, and the claims liabilities
associated with that fund are reported therein.
The State's policy is generally not to purchase commercial
insurance for the risk of losses to which it is exposed. Instead,
State management believes it is more economical to manage its
own risks internally. The Risk Management Fund, an internal
service fund, is used to pay for losses incurred by any State agency
and for administrative costs incurred to manage a state-wide risk
management program. These losses include damage to property
owned by the agencies, personal injury or property damage
liabilities incurred by a State officer, agent or employee, and
worker's compensation costs for State employees. A limited
amount of insurance is purchased to limit the exposure to
catastrophic losses. Annually, a charge is allocated to each
agency for its proportionate share of the estimated cost attributable
to the program per Wis. Stat. Sec. 16.865(8).

State of Wisconsin Notes to The Financial Statements
For the Fiscal Year Ended June 30, 2018
50
14. Deferred Outflows of Resources and Deferred Inflows of Resources
Deferred outflows of resources are a consumption of net position
by the government that is applicable to a future reporting period.
Deferred inflows of resources are an acquisition of net position by
the government that is applicable to a future reporting period. The
events associated with the outflows and inflows of resources have
already occurred. Under GASB standards, however, the
recognition of those outflows and inflows as expenses or
expenditures and revenues are deferred until the future periods to
which the outflows and inflows are applicable. GASB standards
identify circumstances under which deferred outflows of resources
and deferred inflows of resources must be reported. The reporting
of deferred inflows and outflows are only allowable under those
circumstances.
As applicable, the State reports deferred outflows of resources or
deferred inflows of resources in the Statement of Net Position for
governmental activities and business-type activities and for
proprietary and fiduciary fund types as follows:
A decrease or increase in the fair value of derivative instruments
classified as effective hedges is presented as a deferred outflow or
deferred inflow of resources, respectively, with an off-setting
liability or asset, as applicable.
Gains on refunded debt (i.e. the reacquisition price is less than the
net carrying amount of the old debt) are reported as deferred
inflows, while losses on refunded debt (i.e. the reacquisition price
is greater than the net carrying amount of the old debt) are reported
as deferred outflows. Both are amortized to interest expense over
the remaining life of the old bonds or the life of the new bonds,
whichever is shorter.
Differences between expected and actual experience with regard
to economic and demographic factors in the measurement of the
pension and OPEB liabilities for the State’s proportionate share are
reported as deferred inflows or deferred outflows of resources.
They are amortized using a systematic and rational method over a
closed period equal to the average of the expected remaining
service lives of all active and inactive employees provided with
pensions or OPEBs through the applicable plans.
Changes of assumptions about future economic or demographic
factors, or of other inputs in the measurement of the pension or
OPEB liabilities for the State’s proportionate share, are reported as
deferred inflows or deferred outflows of resources. They are
amortized using a systematic and rational method over a closed
period equal to the average of the expected remaining service lives
of all active and inactive employees provided with pensions or
OPEBs through the applicable plans.
Differences between projected and actual earnings on the State’s
proportionate share of pension or OPEB plan investments, if any,
are reported as deferred inflows or deferred outflows of resources
and amortized using a systematic and rational method over a
closed five-year period.
Changes in the State’s proportionate share of the pension or OPEB
liabilities since the prior measurement date, and differences
between actual and proportionate share of contributions are
reported as deferred inflows or deferred outflows of resources.
They are amortized using a systematic and rational method over a
closed period equal to the average expected remaining service
lives of all active and inactive employees provided with pensions or
OPEBs through the applicable plans.
Contributions to the pension or OPEB plans from the State
subsequent to the measurement date of the pension or OPEB
liabilities and before the end of the State’s fiscal year end are
reported as deferred outflows of resources.
State resources transmitted to an entity before time requirements
are met, but after all other eligibility requirements have been met,
are reported as a deferred outflow of resources.
Federal or other entities’ resources transmitted to the State before
time requirements are met, but after all other eligibility
requirements have been met, are reported as deferred inflows of
resources.
Further, governmental fund types may report deferred inflows of
resources for unavailable revenue, such as derived nonexchange
revenue transactions (e.g. sales tax, income tax, assessments on
earnings and consumption, etc.). These inflows are not deferred in
the government-wide financial statements; rather, they are
recognized as revenue.
State of Wisconsin Notes to The Financial Statements
For the Fiscal Year Ended June 30, 2018
51
15. Fund Balance Classification and Restricted Net Position
Fund Balance Classification
In the fund financial statements, governmental funds report fund
balance classifications that comprise a hierarchy based primarily
on the extent to which the state is bound to honor constraints on
the specific purposes for which amounts in those funds can be
spent. Fund balance is reported as restricted when constraints
placed on the use of the resources are either externally imposed
by creditors, grantors, contributors, or laws or regulations of other
governments; or, imposed by law through constitutional provisions
or enabling legislation.
Amounts that may be used only for specific purposes, pursuant to
constraints imposed by passage of a bill by both houses of the
legislature that is signed into law by the governor, are reported as
committed fund balance. Those committed amounts cannot be
used for any other purpose unless a bill passes both houses of the
legislature and is signed by the governor to remove or change the
specified use. Passage of a bill by both houses of the legislature
and signing of the bill by the governor is the highest level action
that results in committed fund balance.
Amounts that are constrained by the state’s intent to be used for
specific purposes, but are neither restricted nor committed, are
classified as assigned fund balances. Intent is expressed by state
officials to whom the state has delegated the authority to assign
amounts to be used for specific purposes. Unassigned fund
balance represents fund balance that has not been assigned to
other funds and that has not been restricted, committed, or
assigned to specific purposes within the general fund.
Nonspendable fund balances include amounts that cannot be
spent because they are either not in spendable form or are legally
or contractually required to be maintained intact.
When both restricted and unrestricted resources are available for
use it is the State’s policy to use restricted resources first, and then
unrestricted as they are needed. The state has not established a
policy for use of unrestricted fund balance. Under the provisions of
GASB Statement No. 54, Fund Balance Reporting and Governmental Fund Type Definitions, if a government does not
establish a policy for its use of unrestricted fund balance amounts,
committed amounts would be reduced first, followed by assigned
amounts, and then unassigned amounts.
Restricted Net Position
Restricted Net Position, presented in the government-wide and
proprietary funds statement of net position are reported when
constraints placed on use are either (1) externally imposed by
creditors (such as through debt covenants), grantors, contributors,
or laws or regulations of other governments, or (2) imposed by law
through constitutional provisions or enabling legislation. Enabling
legislation authorizes the government to assess, levy, charge, or
otherwise mandate payment of resources (from external resource
providers) and includes a legally enforceable requirement that
those resources be used only for the specific purposes stipulated
in the legislation. Unrestricted net position may be used at the
State’s discretion but may have limitations on use based on State
statutes.

State of Wisconsin Notes to The Financial Statements
For the Fiscal Year Ended June 30, 2018
52
This page left intentionally blank.
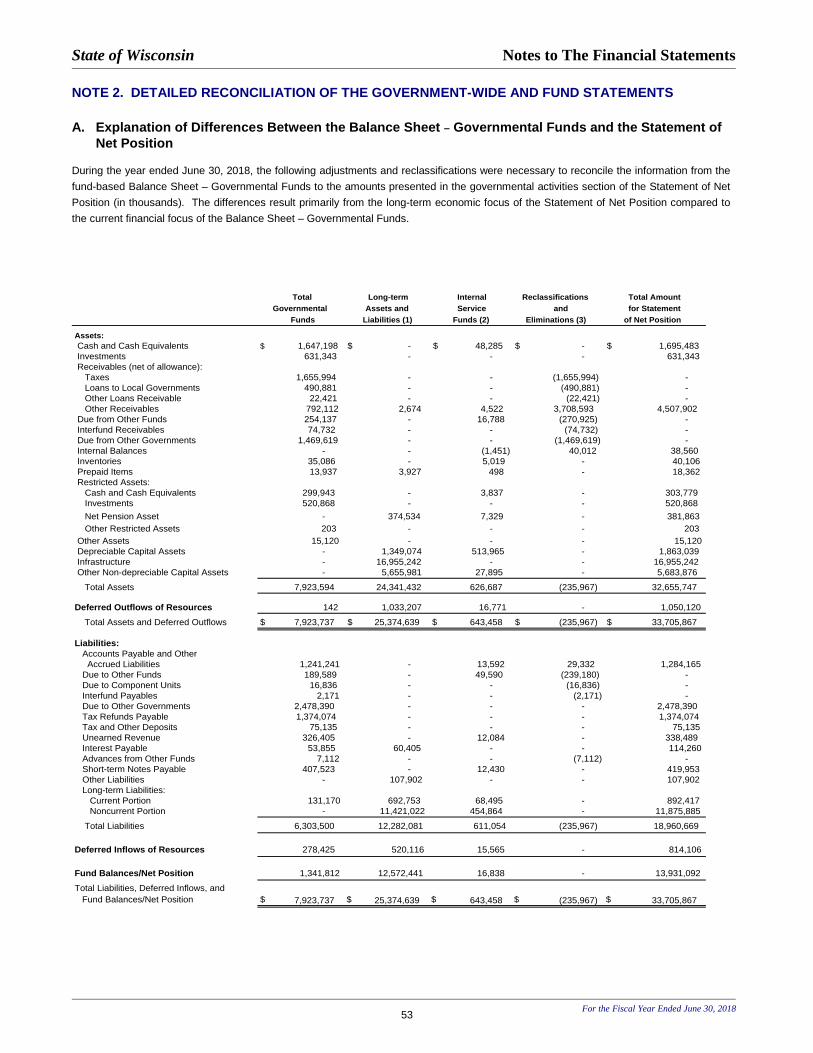
State of Wisconsin Notes to The Financial Statements
For the Fiscal Year Ended June 30, 2018
53
NOTE 2. DETAILED RECONCILIATION OF THE GOVERNMENT-WIDE AND FUND STATEMENTS A. Explanation of Differences Between the Balance Sheet – Governmental Funds and the Statement of
Net Position During the year ended June 30, 2018, the following adjustments and reclassifications were necessary to reconcile the information from the
fund-based Balance Sheet – Governmental Funds to the amounts presented in the governmental activities section of the Statement of Net
Position (in thousands). The differences result primarily from the long-term economic focus of the Statement of Net Position compared to
the current financial focus of the Balance Sheet – Governmental Funds.
Total Long-term Internal Reclassifications Total AmountGovernmental Assets and Service and for Statement
Funds Liabilities (1) Funds (2) Eliminations (3) of Net Position
Assets: Cash and Cash Equivalents $ 1,647,198 $ - $ 48,285 $ - $ 1,695,483
Investments 631,343 - - - 631,343
Receivables (net of allowance):
Taxes 1,655,994 - - (1,655,994) -
Loans to Local Governments 490,881 - - (490,881) -
Other Loans Receivable 22,421 - - (22,421) -
Other Receivables 792,112 2,674 4,522 3,708,593 4,507,902
Due from Other Funds 254,137 - 16,788 (270,925) -
Interfund Receivables 74,732 - - (74,732) -
Due from Other Governments 1,469,619 - - (1,469,619) -
Internal Balances - - (1,451) 40,012 38,560
Inventories 35,086 - 5,019 - 40,106
Prepaid Items 13,937 3,927 498 - 18,362
Restricted Assets:
Cash and Cash Equivalents 299,943 - 3,837 - 303,779
Investments 520,868 - - - 520,868
Net Pension Asset - 374,534 7,329 - 381,863
Other Restricted Assets 203 - - - 203 g
Other Assets 15,120 - - - 15,120
Depreciable Capital Assets - 1,349,074 513,965 - 1,863,039
Infrastructure - 16,955,242 - - 16,955,242
Other Non-depreciable Capital Assets - 5,655,981 27,895 - 5,683,876
Total Assets 7,923,594 24,341,432 626,687 (235,967) 32,655,747
Deferred Outflows of Resources 142 1,033,207 16,771 - 1,050,120
Total Assets and Deferred Outflows $ 7,923,737 $ 25,374,639 $ 643,458 $ (235,967) $ 33,705,867
Liabilities: Accounts Payable and Other
Accrued Liabilities 1,241,241 - 13,592 29,332 1,284,165
Due to Other Funds 189,589 - 49,590 (239,180) -
Due to Component Units 16,836 - - (16,836) -
Interfund Payables 2,171 - - (2,171) -
Due to Other Governments 2,478,390 - - - 2,478,390
Tax Refunds Payable 1,374,074 - - - 1,374,074
Tax and Other Deposits 75,135 - - - 75,135
Unearned Revenue 326,405 - 12,084 - 338,489
Interest Payable 53,855 60,405 - - 114,260
Advances from Other Funds 7,112 - - (7,112) -
Short-term Notes Payable 407,523 - 12,430 - 419,953
Other Liabilities - 107,902 - - 107,902
Long-term Liabilities:
Current Portion 131,170 692,753 68,495 - 892,417
Noncurrent Portion - 11,421,022 454,864 - 11,875,885
Total Liabilities 6,303,500 12,282,081 611,054 (235,967) 18,960,669
Deferred Inflows of Resources 278,425 520,116 15,565 - 814,106
Fund Balances/Net Position 1,341,812 12,572,441 16,838 - 13,931,092
Total Liabilities, Deferred Inflows, and
Fund Balances/Net Position $ 7,923,737 $ 25,374,639 $ 643,458 $ (235,967) $ 33,705,867
State of Wisconsin Notes to The Financial Statements
For the Fiscal Year Ended June 30, 2018
54
(1) Long-term asset and liability differences arise because governmental funds focus only on short-term financing (that is, resources
that will be available to pay for current period expenditures). In contrast, the Statement of Net Position has a long-term economic
focus and reports on all capital and financial resources.
(2) The adjustment for internal service funds reflects the reclassification of these funds for the government-wide statement. The assets
and liabilities of these funds are reported as proprietary activities on the fund statements, but are included as governmental activities
on the Statement of Net Position.
(3) Various reclassifications are necessary due to the differing level of detail needed on each of the statements. Eliminations are done
on the Statement of Net Position to minimize the grossing-up effect on assets and liabilities within the governmental and business-
type activities columns of the primary government. The net residual amounts due between governmental and business-type
activities are shown as internal balances.
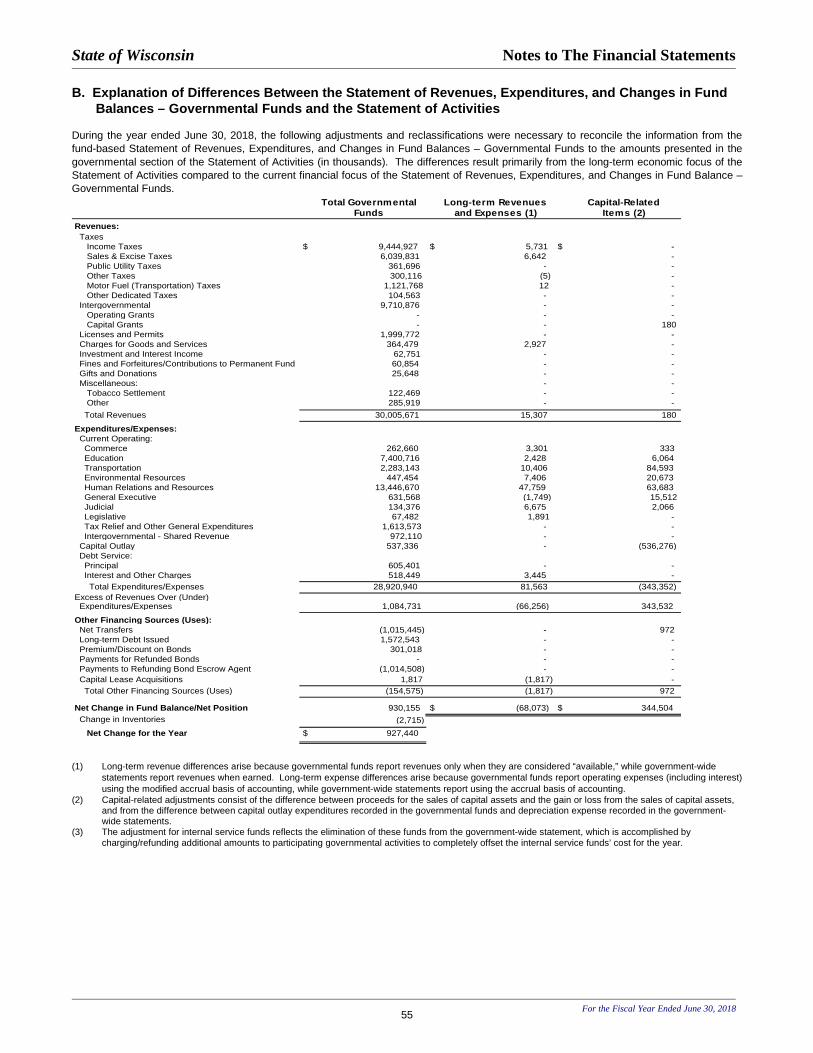
State of Wisconsin Notes to The Financial Statements
For the Fiscal Year Ended June 30, 2018
55
B. Explanation of Differences Between the Statement of Revenues, Expenditures, and Changes in Fund Balances – Governmental Funds and the Statement of Activities
During the year ended June 30, 2018, the following adjustments and reclassifications were necessary to reconcile the information from the
fund-based Statement of Revenues, Expenditures, and Changes in Fund Balances – Governmental Funds to the amounts presented in the
governmental section of the Statement of Activities (in thousands). The differences result primarily from the long-term economic focus of the
Statement of Activities compared to the current financial focus of the Statement of Revenues, Expenditures, and Changes in Fund Balance –
Governmental Funds.
Total Governmental Long-term Revenues Capital-RelatedFunds and Expenses (1) Items (2)
Revenues: Taxes
Income Taxes $ 9,444,927 $ 5,731 $ -
Sales & Excise Taxes 6,039,831 6,642 -
Public Utility Taxes 361,696 - -
Other Taxes 300,116 (5) -
Motor Fuel (Transportation) Taxes 1,121,768 12 -
Other Dedicated Taxes 104,563 - -
Intergovernmental 9,710,876 - -
Operating Grants - - -
Capital Grants - - 180
Licenses and Permits 1,999,772 - -
Charges for Goods and Services 364,479 2,927 -
Investment and Interest Income 62,751 - -
Fines and Forfeitures/Contributions to Permanent Fund 60,854 - -
Gifts and Donations 25,648 - -
Miscellaneous: - -
Tobacco Settlement 122,469 - -
Other 285,919 - -
Total Revenues 30,005,671 15,307 180
Expenditures/Expenses: Current Operating:
Commerce 262,660 3,301 333
Education 7,400,716 2,428 6,064
Transportation 2,283,143 10,406 84,593
Environmental Resources 447,454 7,406 20,673
Human Relations and Resources 13,446,670 47,759 63,683
General Executive 631,568 (1,749) 15,512
Judicial 134,376 6,675 2,066
Legislative 67,482 1,891 -
Tax Relief and Other General Expenditures 1,613,573 - -
Intergovernmental - Shared Revenue 972,110 - -
Capital Outlay 537,336 - (536,276)
Debt Service:
Principal 605,401 - -
Interest and Other Charges 518,449 3,445 -
Total Expenditures/Expenses 28,920,940 81,563 (343,352)
Excess of Revenues Over (Under) Expenditures/Expenses 1,084,731 (66,256) 343,532
Other Financing Sources (Uses): Net Transfers (1,015,445) - 972
Long-term Debt Issued 1,572,543 - -
Premium/Discount on Bonds 301,018 - -
Payments for Refunded Bonds - - -
Payments to Refunding Bond Escrow Agent (1,014,508) - -
Capital Lease Acquisitions 1,817 (1,817) - Total Other Financing Sources (Uses) (154,575) (1,817) 972
Net Change in Fund Balance/Net Position 930,155 $ (68,073) $ 344,504
Change in Inventories (2,715)
Net Change for the Year $ 927,440
(1) Long-term revenue differences arise because governmental funds report revenues only when they are considered “available,” while government-wide
statements report revenues when earned. Long-term expense differences arise because governmental funds report operating expenses (including interest)
using the modified accrual basis of accounting, while government-wide statements report using the accrual basis of accounting.
(2) Capital-related adjustments consist of the difference between proceeds for the sales of capital assets and the gain or loss from the sales of capital assets, and from the difference between capital outlay expenditures recorded in the governmental funds and depreciation expense recorded in the government-wide statements.
(3) The adjustment for internal service funds reflects the elimination of these funds from the government-wide statement, which is accomplished by charging/refunding additional amounts to participating governmental activities to completely offset the internal service funds’ cost for the year.
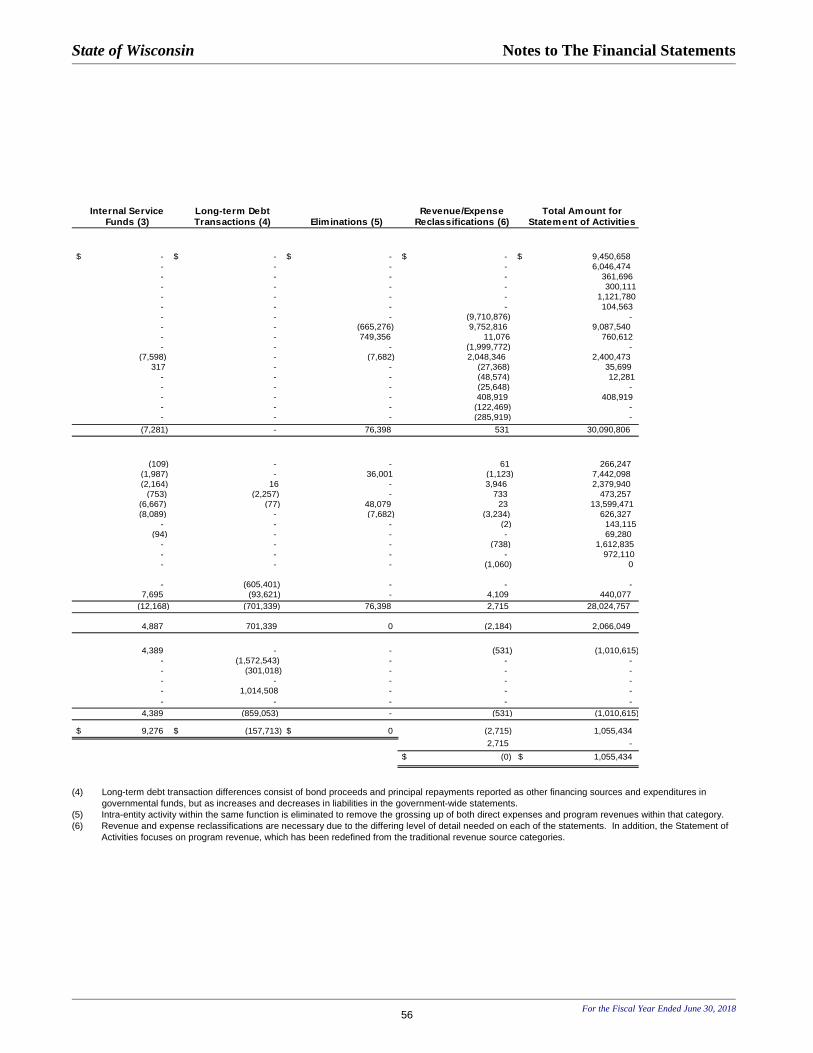
State of Wisconsin Notes to The Financial Statements
For the Fiscal Year Ended June 30, 2018
56
Internal Service Long-term Debt Revenue/Expense Total Amount forFunds (3) Transactions (4) Eliminations (5) Reclassifications (6) Statement of Activities
$ - $ - $ - $ - $ 9,450,658
- - - - 6,046,474
- - - - 361,696
- - - - 300,111
- - - - 1,121,780
- - - - 104,563
- - - (9,710,876) -
- - (665,276) 9,752,816 9,087,540
- - 749,356 11,076 760,612
- - - (1,999,772) -
(7,598) - (7,682) 2,048,346 2,400,473
317 - - (27,368) 35,699
- - - (48,574) 12,281
- - - (25,648) -
- - - 408,919 408,919
- - - (122,469) -
- - - (285,919) -
(7,281) - 76,398 531 30,090,806
(109) - - 61 266,247
(1,987) - 36,001 (1,123) 7,442,098
(2,164) 16 - 3,946 2,379,940
(753) (2,257) - 733 473,257
(6,667) (77) 48,079 23 13,599,471
(8,089) - (7,682) (3,234) 626,327
- - - (2) 143,115
(94) - - - 69,280
- - - (738) 1,612,835
- - - - 972,110
- - - (1,060) 0
- (605,401) - - -
7,695 (93,621) - 4,109 440,077
(12,168) (701,339) 76,398 2,715 28,024,757
4,887 701,339 0 (2,184) 2,066,049
4,389 - - (531) (1,010,615)
- (1,572,543) - - -
- (301,018) - - -
- - - - -
- 1,014,508 - - -
- - - - -
4,389 (859,053) - (531) (1,010,615)
$ 9,276 $ (157,713) $ 0 (2,715) 1,055,434
2,715 -
$ (0) $ 1,055,434
(4) Long-term debt transaction differences consist of bond proceeds and principal repayments reported as other financing sources and expenditures in
governmental funds, but as increases and decreases in liabilities in the government-wide statements.
(5) Intra-entity activity within the same function is eliminated to remove the grossing up of both direct expenses and program revenues within that category.
(6) Revenue and expense reclassifications are necessary due to the differing level of detail needed on each of the statements. In addition, the Statement of
Activities focuses on program revenue, which has been redefined from the traditional revenue source categories.
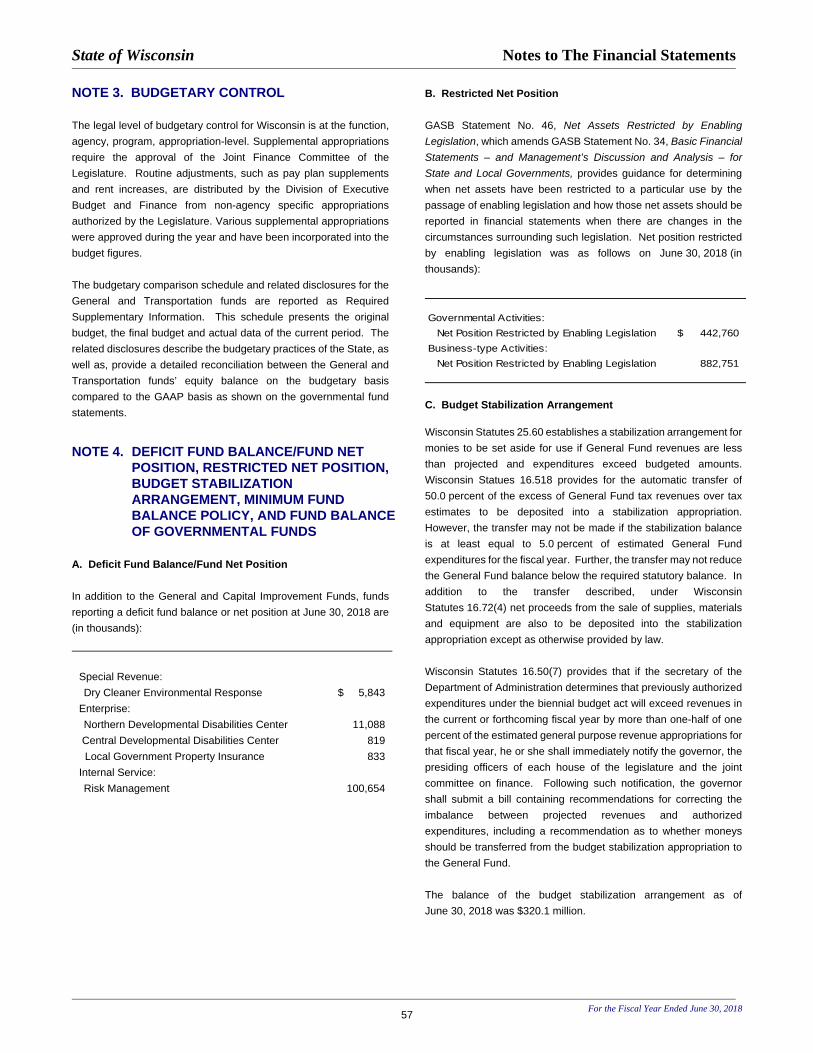
State of Wisconsin Notes to The Financial Statements
For the Fiscal Year Ended June 30, 2018
57
NOTE 3. BUDGETARY CONTROL The legal level of budgetary control for Wisconsin is at the function,
agency, program, appropriation-level. Supplemental appropriations
require the approval of the Joint Finance Committee of the
Legislature. Routine adjustments, such as pay plan supplements
and rent increases, are distributed by the Division of Executive
Budget and Finance from non-agency specific appropriations
authorized by the Legislature. Various supplemental appropriations
were approved during the year and have been incorporated into the
budget figures.
The budgetary comparison schedule and related disclosures for the
General and Transportation funds are reported as Required
Supplementary Information. This schedule presents the original
budget, the final budget and actual data of the current period. The
related disclosures describe the budgetary practices of the State, as
well as, provide a detailed reconciliation between the General and
Transportation funds’ equity balance on the budgetary basis
compared to the GAAP basis as shown on the governmental fund
statements.
NOTE 4. DEFICIT FUND BALANCE/FUND NET POSITION, RESTRICTED NET POSITION, BUDGET STABILIZATION ARRANGEMENT, MINIMUM FUND BALANCE POLICY, AND FUND BALANCE OF GOVERNMENTAL FUNDS
A. Deficit Fund Balance/Fund Net Position In addition to the General and Capital Improvement Funds, funds
reporting a deficit fund balance or net position at June 30, 2018 are
(in thousands):
Special Revenue:
Dry Cleaner Environmental Response $ 5,843
Enterprise:
Northern Developmental Disabilities Center 11,088
Central Developmental Disabilities Center 819
Local Government Property Insurance 833
Internal Service:
Risk Management 100,654
B. Restricted Net Position GASB Statement No. 46, Net Assets Restricted by Enabling
Legislation, which amends GASB Statement No. 34, Basic Financial
Statements – and Management’s Discussion and Analysis – for
State and Local Governments, provides guidance for determining
when net assets have been restricted to a particular use by the
passage of enabling legislation and how those net assets should be
reported in financial statements when there are changes in the
circumstances surrounding such legislation. Net position restricted
by enabling legislation was as follows on June 30, 2018 (in
thousands):
Governmental Activities:
Net Position Restricted by Enabling Legislation 442,760$
Business-type Activities:
Net Position Restricted by Enabling Legislation 882,751
C. Budget Stabilization Arrangement
Wisconsin Statutes 25.60 establishes a stabilization arrangement for
monies to be set aside for use if General Fund revenues are less
than projected and expenditures exceed budgeted amounts.
Wisconsin Statues 16.518 provides for the automatic transfer of
50.0 percent of the excess of General Fund tax revenues over tax
estimates to be deposited into a stabilization appropriation.
However, the transfer may not be made if the stabilization balance
is at least equal to 5.0 percent of estimated General Fund
expenditures for the fiscal year. Further, the transfer may not reduce
the General Fund balance below the required statutory balance. In
addition to the transfer described, under Wisconsin
Statutes 16.72(4) net proceeds from the sale of supplies, materials
and equipment are also to be deposited into the stabilization
appropriation except as otherwise provided by law.
Wisconsin Statutes 16.50(7) provides that if the secretary of the
Department of Administration determines that previously authorized
expenditures under the biennial budget act will exceed revenues in
the current or forthcoming fiscal year by more than one-half of one
percent of the estimated general purpose revenue appropriations for
that fiscal year, he or she shall immediately notify the governor, the
presiding officers of each house of the legislature and the joint
committee on finance. Following such notification, the governor
shall submit a bill containing recommendations for correcting the
imbalance between projected revenues and authorized
expenditures, including a recommendation as to whether moneys
should be transferred from the budget stabilization appropriation to
the General Fund.
The balance of the budget stabilization arrangement as of
June 30, 2018 was $320.1 million.

State of Wisconsin Notes to The Financial Statements
For the Fiscal Year Ended June 30, 2018
58
D. Minimum Fund Balance Wisconsin Statutes 20.003(4) establishes a minimum General Fund
balance. Under the statutes, no bill directly or indirectly affecting
general purpose revenues as defined in Wisconsin
Statues 20.001(2)(a) may be enacted by the legislature if the bill
would cause the estimated General Fund balance on June 30 of any
fiscal year to be an amount equal to or less than the amount
specified for that fiscal year. The minimum required balance for the
fiscal year ending June 30, 2018 was $70.0 million.
E. Fund Balance for Governmental Funds Governmental funds reported the following categories of fund
balance as of June 30, 2018 (in thousands):
Ca pita l Nonma jor Tota lGe ne ra l Tra nsporta tion Improve me nt Gove rnme nta l Gove rnme nta l
Nonspe nda ble for: Inventory, Prepaid and Long- term
Receivables 18,576 18,188 - 12,247 49,011
Legal or Contractual Purposes - - - 1,109,534 1,109,534
(Permanent Fund Principal)
Re stric te d for: Commerce 34,448 - - 33 34,480
Education 9,741 - - 54,839 64,581
Transportation - 637,693 - - 637,693
Environmental Resources 5,511 - - 145,538 151,049
Human Relations and
Resources 72,707 - - 37,010 109,717
General Executive 134,718 - - 11,506 146,223
Judic ial 44 - - - 44
Tax Relief and Other General
Expenditures 408 - - - 408
Intergovernmental - Shared Revenue - - - 4,154 4,154
Debt Service - - - 543,197 543,197
Capital Projects - - - 37,247 37,247
Committe d to: Commerce - - - 63,402 63,402
Education - - - 477 477
Environmental Resources - - - 92,984 92,984
Human Relations and
Resources - - - 22,121 22,121
General Executive - - - 20,327 20,327
Judic ial - - - 97 97
Tax Relief and Other General
Expenditures 320,054 - - - 320,054
Capital Projects - - - 28,785 28,785
Una ssigne d (1,849,733) - (238,196) (5,844) (2,093,773)
Tota l Fund Ba la nc e (1,253,527) 655,881 (238,196) 2,177,653 1,341,812

State of Wisconsin Notes to The Financial Statements
For the Fiscal Year Ended June 30, 2018
59
NOTE 5. DEPOSITS AND INVESTMENTS
The State maintains a short-term investment "pool", the State
Investment Fund, for the State, its agencies and departments,
and certain other public institutions which elect to participate. The
investment "pool" is managed by the State of Wisconsin
Investment Board (the Board) which is further authorized to carry
out investment activities for certain enterprise, trust and agency
funds. A small number of State agencies also carry out
investment activities separate from the Board.
The State of Wisconsin Investment Board also issues separate
financial reports for the investments they manage, including the
State Investment Fund, and the Wisconsin Retirement System.
Copies of the separately issued financial reports may be obtained
at www.swib.state.wi.us or by writing to:
State of Wisconsin Investment Board
P.O. Box 7842
Madison, WI 53707-7842
A. Deposits
Deposits include cash and cash equivalents on deposit in banks
or other financial institutions, and nonnegotiable certificates of
deposit. The majority of the State's deposits are under the control
of the Department of Administration. The Department of
Administration maintains multiple accounts with an agreement
with the bank that allows an overdraft in one account if the
overdraft is offset by balances in other accounts.
Custodial credit risk is the risk that in the event of a bank failure,
the government's deposits may not be returned to it. The State's
policy regarding custodial credit risk is detailed in Chapter 34 of
the State Statutes. In brief, any federal or state bank, credit union
or savings bank may be designated a public depository. A surety
bond may be required. The State's insured deposits are covered
by the Federal Deposit Insurance Corporation (FDIC) and an
appropriation for losses on public deposits. In the event of loss,
the division of banking makes payments up to $400,000 per
depositor for the excess of the payments made by the Federal
Deposit Insurance Corporation or the Wisconsin Credit Union
Savings Insurance Corporation. Payments are made, until the
funds available in the appropriation are exhausted, in the order in
which satisfactory proofs of loss are received by the State's
Department of Financial Institutions.
1. Primary Government
As of June 30, 2018, $158.6 million of the primary government's
bank balance of $135.0 million was exposed to custodial credit
risk as follows (in millions):
Uninsured and uncollateralized $ 135.0
Foreign currency risk is the risk that changes in exchange rates
will adversely affect the fair value of a deposit. Deposits in foreign
currency at June 30, 2018 are immaterial. The primary
government does not have a formal policy specifically related to
foreign currency risk.
The State’s Unemployment Reserve Fund had $1.6 billion on
deposit with the U.S. Treasury. This amount is presented as
Cash and Cash Equivalents and is not included in the carrying
amount of deposits nor is it categorized according to risk because
it is neither a deposit with a financial institution nor an investment.
Certificates of Deposit are carried at cost as they are considered
nonparticipating interest-earning investment contracts. Because
they are valued at cost, they are not included in the fair value
hierarchy established by GASB Statement 72, Fair Value
Measurement and Application.
2. Wisconsin Retirement System (WRS) As of December 31, 2017, WRS cash deposits totaled
$1,900.1 million. Of the total deposits, $1,512.1 million was
collateralized by the securities borrowed. Depository insurance
covered another $24.9 million of the total. Additionally, a portion
of the total deposits were uninsured and uncollateralized. These
represented balances held in foreign currencies in the custodian’s
nominee name, cash posted as collateral for derivatives
transactions and cash collateral posted in excess of the market
value of securities borrowed for short sales. The sum of
uninsured and uncollateralized deposits amounted to
$363.1 million at December 31, 2017. In addition to cash
deposits, the WRS also held $57.8 million in certificates of
deposit, all of which were covered by depository insurance.
3. State Investment Fund As of June 30, 2018, the SIF held Certificates of Deposit (CDs)
with a value of $42.5 million invested pursuant to the Wisconsin
Certificate of Deposit Program, all of which is insured through
FDIC insurance. Investment guidelines provide that to be
accepted into this program, banks must accept deposits in
Wisconsin and meet credit-screening criteria designed to assure
the safety of the deposits.

State of Wisconsin Notes to The Financial Statements
For the Fiscal Year Ended June 30, 2018
60
B. Investments
1. Primary Government
Wisconsin Statutes, program policy provisions, appropriate
governing boards, and general resolutions contained in revenue
bond indenture documents define the types of securities
authorized as appropriate investments and the conditions for
making investment transactions.
Investments of the State are managed by various portfolios. For
disclosure purposes, the following investment portfolios are
discussed separately:
Primary government, excluding the Wisconsin Retirement
System and the State Investment Fund. The primary
government portfolios include Various Funds managed by the
State of Wisconsin Investment Board consisting of the
following:
-- The University of Wisconsin System (UWS)
-- Local Government Property Insurance Fund (LGPIF)
-- State Life Insurance Fund (SLF)
-- Injured Patients and Families Compensation Fund (IPFCF)
-- Historical Society Fund
-- Tuition Trust Fund
Wisconsin Retirement System (WRS)
State Investment Fund (SIF) -- functions as the State's cash
management fund by "pooling" the idle cash balances of all
State funds and other public institutions. Investments of the
SIF are discussed in section B2 of this note disclosure.
Primary Government (excluding the Wisconsin Retirement
System (WRS), and the State Investment Fund (SIF))
For the primary government, except for the Various Funds
discussed later, permitted investments include: direct general
obligations of the United States of America and obligations
(including obligations of any federal agency or corporation) for
which the payment of the principal and interest are unconditionally
guaranteed by the full faith and credit of the United States; bonds
or other obligations of any state or the United States of America
or of any agency, instrumentality or local governmental unit of any
such state including the State of Wisconsin; bonds, debentures,
participation certificates, notes or similar evidences of
indebtedness of any of the Federal Financing Bank, Federal
Home Loan Bank System, Federal Farm Credit Bank, Federal
National Mortgage Association, Federal Home Loan Mortgage
Corporation, Resolution Funding Corporation, Government
National Mortgage Association, Student Loan Marketing
Association or Tennessee Valley Authority; public housing bonds
issued by public agencies or municipalities; commercial paper;
interest-bearing time deposits, certificates of deposit or other
similar banking arrangements; shares of a diversified open-end
management investment company; repurchase agreements;
common and preferred stock; bankers acceptances; corporate
commercial paper; bonds issued by a local district created under
Wisconsin Act 229; and investment agreements with a bank, bank
holding company, insurance company or other financial institution.
The State of Wisconsin Investment Board (SWIB or the Board)
has control of the investment and collection of principal, interest,
and dividends of all monies invested of the University of
Wisconsin System (UWS), Local Government Property Insurance
Fund (LGPIF), the State Life Insurance Fund (SLF), the Injured
Patients and Families Compensation Fund (IPFCF), the Historical
Society Trust Fund, and the Tuition Trust Fund, which are
collectively known as the “Various Funds”.
The UWS Board of Regents authorize and govern the UWS
investment policies and guidelines. The UWS Board of Regents
has delegated investment management authority to SWIB and is
responsible for monitoring its delegation of this investment
management authority. SWIB determines and sets UWS asset
allocation targets which are reviewed quarterly.
Wisconsin Statutes allow investments of the LGPIF in direct
obligations of the United States and Canada, securities
guaranteed by the United States, unsecured notes of financial
and industrial issuers, Yankee/Euro dollar issues, and certificates
of deposit issued by banks in the United States, including solvent
financial institutions in Wisconsin.
Permitted classes of investments of the SLF and the IPFCF
include bonds of government units or of corporations, loans
secured by mortgages, preferred or common stocks, real property
and other investments not specifically prohibited by statute.
Funds available for the Historical Society Trust Fund are
managed with an investment objective of maintaining a diversified
portfolio of high quality publicly issued equities and fixed income
obligations providing long-term growth in capital and income
generation.
The Board is directed to invest moneys held in the Tuition Trust
Fund in investments with maturities and liquidity that are
appropriate for the needs of the fund as reported by the State
Department of Administration.
The UWS also issues separate financial reports. Copies of these
separately issued financial reports may be obtained at
www.wisconsin.edu or by writing to:
Office of Financial Administration
780 Regent Street, Suite 255
Madison, WI 53715
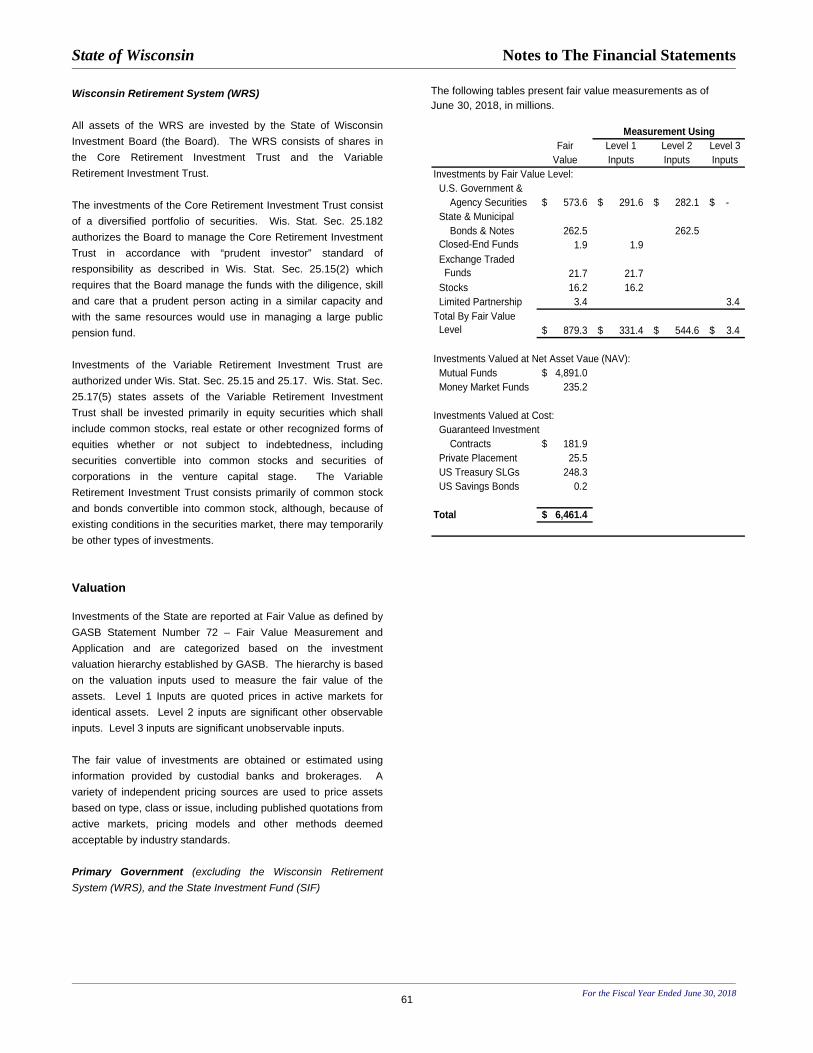
State of Wisconsin Notes to The Financial Statements
For the Fiscal Year Ended June 30, 2018
61
Wisconsin Retirement System (WRS)
All assets of the WRS are invested by the State of Wisconsin
Investment Board (the Board). The WRS consists of shares in
the Core Retirement Investment Trust and the Variable
Retirement Investment Trust.
The investments of the Core Retirement Investment Trust consist
of a diversified portfolio of securities. Wis. Stat. Sec. 25.182
authorizes the Board to manage the Core Retirement Investment
Trust in accordance with “prudent investor” standard of
responsibility as described in Wis. Stat. Sec. 25.15(2) which
requires that the Board manage the funds with the diligence, skill
and care that a prudent person acting in a similar capacity and
with the same resources would use in managing a large public
pension fund.
Investments of the Variable Retirement Investment Trust are
authorized under Wis. Stat. Sec. 25.15 and 25.17. Wis. Stat. Sec.
25.17(5) states assets of the Variable Retirement Investment
Trust shall be invested primarily in equity securities which shall
include common stocks, real estate or other recognized forms of
equities whether or not subject to indebtedness, including
securities convertible into common stocks and securities of
corporations in the venture capital stage. The Variable
Retirement Investment Trust consists primarily of common stock
and bonds convertible into common stock, although, because of
existing conditions in the securities market, there may temporarily
be other types of investments.
Valuation Investments of the State are reported at Fair Value as defined by
GASB Statement Number 72 – Fair Value Measurement and
Application and are categorized based on the investment
valuation hierarchy established by GASB. The hierarchy is based
on the valuation inputs used to measure the fair value of the
assets. Level 1 Inputs are quoted prices in active markets for
identical assets. Level 2 inputs are significant other observable
inputs. Level 3 inputs are significant unobservable inputs.
The fair value of investments are obtained or estimated using
information provided by custodial banks and brokerages. A
variety of independent pricing sources are used to price assets
based on type, class or issue, including published quotations from
active markets, pricing models and other methods deemed
acceptable by industry standards.
Primary Government (excluding the Wisconsin Retirement
System (WRS), and the State Investment Fund (SIF)
The following tables present fair value measurements as of
June 30, 2018, in millions.
Fair Level 1 Level 2 Level 3
Value Inputs Inputs Inputs
Investments by Fair Value Level:
U.S. Government &
Agency Securities 573.6$ 291.6$ 282.1$ -$
State & Municipal
Bonds & Notes 262.5 262.5
Closed-End Funds 1.9 1.9
Exchange Traded
Funds 21.7 21.7
Stocks 16.2 16.2
Limited Partnership 3.4 3.4
Total By Fair Value
Level 879.3$ 331.4$ 544.6$ 3.4$
Investments Valued at Net Asset Vaue (NAV):
Mutual Funds 4,891.0$
Money Market Funds 235.2
Investments Valued at Cost:
Guaranteed Investment
Contracts 181.9$
Private Placement 25.5
US Treasury SLGs 248.3
US Savings Bonds 0.2
Total 6,461.4$
Measurement Using
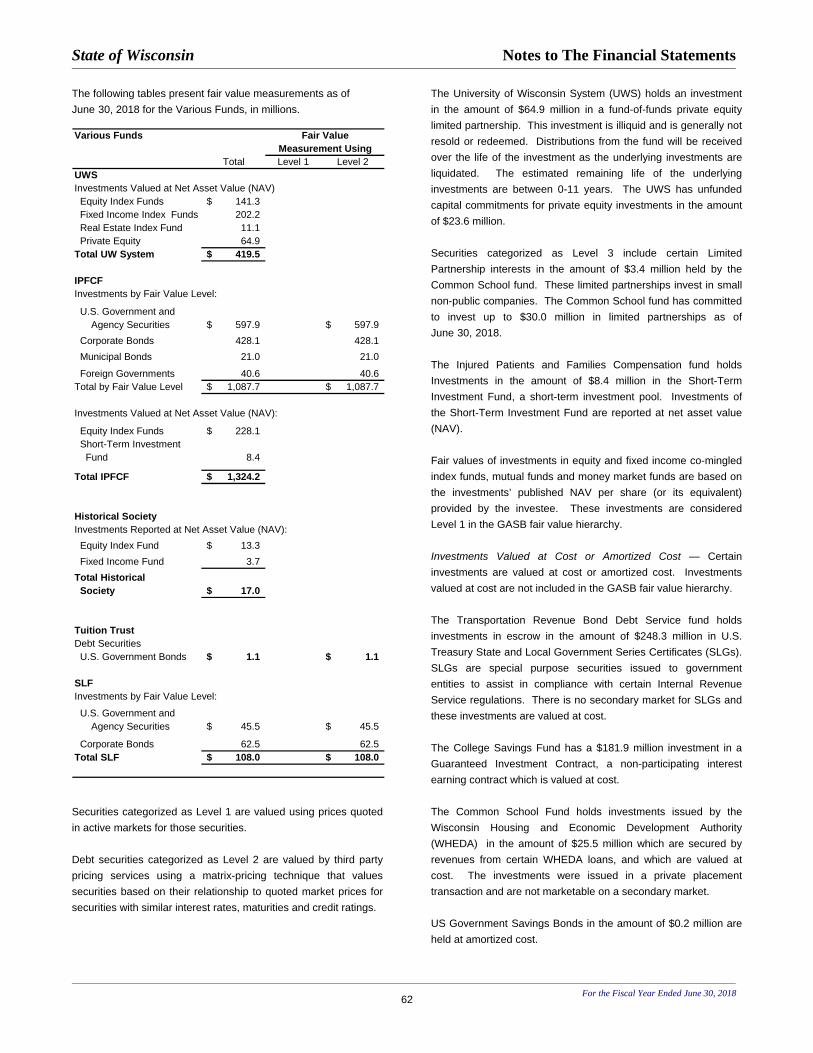
State of Wisconsin Notes to The Financial Statements
For the Fiscal Year Ended June 30, 2018
62
The following tables present fair value measurements as of
June 30, 2018 for the Various Funds, in millions.
Various Funds
Total Level 1 Level 2
UWSInvestments Valued at Net Asset Value (NAV)
Equity Index Funds 141.3$
Fixed Income Index Funds 202.2
Real Estate Index Fund 11.1
Private Equity 64.9
Total UW System 419.5$
IPFCFInvestments by Fair Value Level:
U.S. Government and
Agency Securities 597.9$ 597.9$
Corporate Bonds 428.1 428.1
Municipal Bonds 21.0 21.0
Foreign Governments 40.6 40.6
Total by Fair Value Level 1,087.7$ 1,087.7$
Investments Valued at Net Asset Value (NAV):
Equity Index Funds 228.1$
Short-Term Investment
Fund 8.4
Total IPFCF 1,324.2$
Historical SocietyInvestments Reported at Net Asset Value (NAV):
Equity Index Fund 13.3$
Fixed Income Fund 3.7
Total Historical Society 17.0$
Tuition TrustDebt Securities
U.S. Government Bonds 1.1$ 1.1$
SLFInvestments by Fair Value Level:
U.S. Government and
Agency Securities 45.5$ 45.5$
Corporate Bonds 62.5 62.5
Total SLF 108.0$ 108.0$
Measurement UsingFair Value
Securities categorized as Level 1 are valued using prices quoted
in active markets for those securities.
Debt securities categorized as Level 2 are valued by third party
pricing services using a matrix-pricing technique that values
securities based on their relationship to quoted market prices for
securities with similar interest rates, maturities and credit ratings.
The University of Wisconsin System (UWS) holds an investment
in the amount of $64.9 million in a fund-of-funds private equity
limited partnership. This investment is illiquid and is generally not
resold or redeemed. Distributions from the fund will be received
over the life of the investment as the underlying investments are
liquidated. The estimated remaining life of the underlying
investments are between 0-11 years. The UWS has unfunded
capital commitments for private equity investments in the amount
of $23.6 million.
Securities categorized as Level 3 include certain Limited
Partnership interests in the amount of $3.4 million held by the
Common School fund. These limited partnerships invest in small
non-public companies. The Common School fund has committed
to invest up to $30.0 million in limited partnerships as of
June 30, 2018.
The Injured Patients and Families Compensation fund holds
Investments in the amount of $8.4 million in the Short-Term
Investment Fund, a short-term investment pool. Investments of
the Short-Term Investment Fund are reported at net asset value
(NAV).
Fair values of investments in equity and fixed income co-mingled
index funds, mutual funds and money market funds are based on
the investments’ published NAV per share (or its equivalent)
provided by the investee. These investments are considered
Level 1 in the GASB fair value hierarchy.
Investments Valued at Cost or Amortized Cost — Certain
investments are valued at cost or amortized cost. Investments
valued at cost are not included in the GASB fair value hierarchy.
The Transportation Revenue Bond Debt Service fund holds
investments in escrow in the amount of $248.3 million in U.S.
Treasury State and Local Government Series Certificates (SLGs).
SLGs are special purpose securities issued to government
entities to assist in compliance with certain Internal Revenue
Service regulations. There is no secondary market for SLGs and
these investments are valued at cost.
The College Savings Fund has a $181.9 million investment in a
Guaranteed Investment Contract, a non-participating interest
earning contract which is valued at cost.
The Common School Fund holds investments issued by the
Wisconsin Housing and Economic Development Authority
(WHEDA) in the amount of $25.5 million which are secured by
revenues from certain WHEDA loans, and which are valued at
cost. The investments were issued in a private placement
transaction and are not marketable on a secondary market.
US Government Savings Bonds in the amount of $0.2 million are
held at amortized cost.

State of Wisconsin Notes to The Financial Statements
For the Fiscal Year Ended June 30, 2018
63
Wisconsin Retirement System (WRS)
The following schedules presents fair value measurements at December 31, 2017 (fair values in millions):
WRS
Fair Level 1 Level 2 Level 3
Value Inputs Inputs Inputs
Investments by Fair Value Level:
Cash Equivalents
Certificates of Deposit 41.4$ -$ 4.4$ 37.0$
Commercial Paper 397.9 - - 397.9
U.S. Treasury Securities 104.9 104.9 - -
Total Cash Equivalents 544.1 104.9 4.4 434.8
Equities
Domestic 36,137.1 36,000.8 - 136.3
International 20,264.3 20,263.0 - 1.3
Total Equities 56,401.4 56,263.8 - 137.6
Fixed Income
Asset Backed Securities 71.8 - 54.5 17.3
Corporates & Private Placements 4,726.5 - 4,621.7 104.8
Foreign Government / Agency Bonds 2,511.5 - 2,506.4 5.0
Municipal Bonds 122.4 - 122.4 -
U.S. Government Agencies 215.9 - 215.9 -
U.S. Treasury Inflation Protected Securities 12,780.8 - 12,780.8 -
U.S. Treasury Securities 3,595.7 115.7 3,480.1 -
Total Fixed Income 24,024.6 115.7 23,781.8 127.1
Real Estate 1,368.6 1,368.6
Preferred Securities
Domestic 97.7 - 43.8 53.9
International 144.0 131.1 12.9 -
Total Preferred Securities 241.7 131.1 56.7 53.9
Convertibles 0.2 0.2
Derivatives
Foreign Exchange Contracts (1.1) - (1.1)
Futures 47.1 47.1 -
Options (3.8) (3.8) -
Swaps 4.2 - 4.2
To Be Announced Securities 95.5 - 95.5
Total Derivatives 141.8 43.2 98.5
Equity Short Sales (2,722.2) (2,662.1) (60.1)
Total 80,000.1$ 53,996.6$ 23,881.3$ 2,122.2$
Measurement UsingFair Value
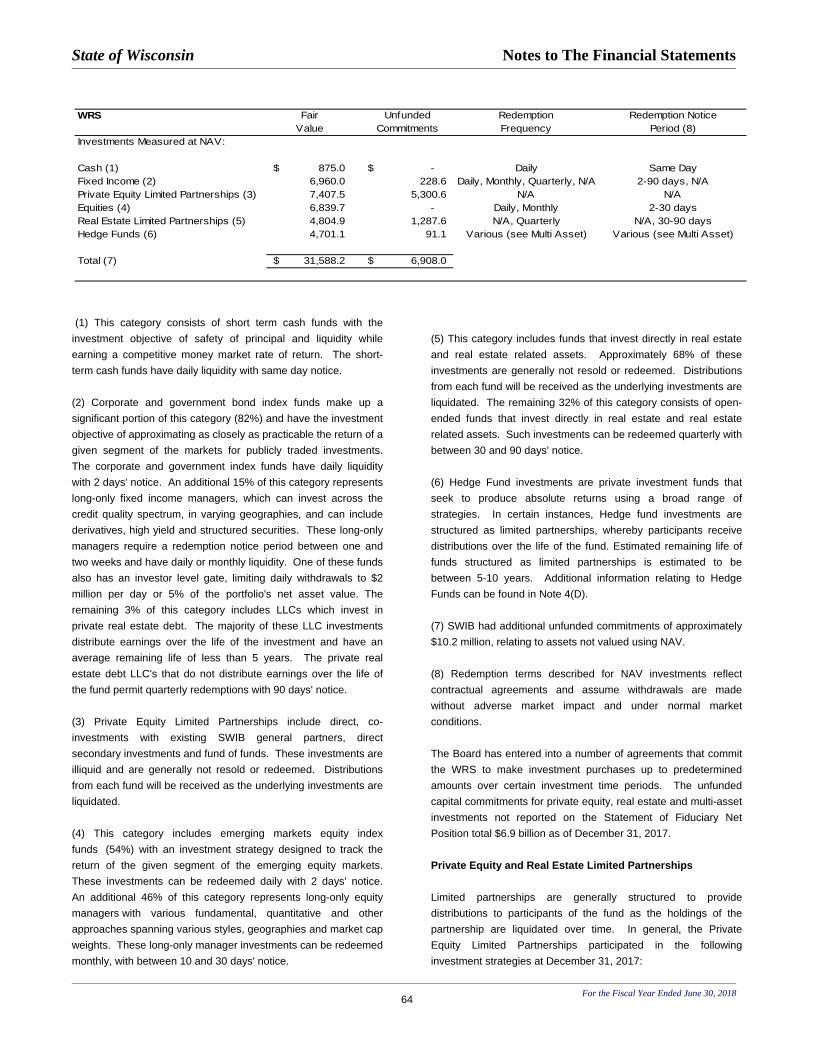
State of Wisconsin Notes to The Financial Statements
For the Fiscal Year Ended June 30, 2018
64
(1) This category consists of short term cash funds with the
investment objective of safety of principal and liquidity while
earning a competitive money market rate of return. The short-
term cash funds have daily liquidity with same day notice.
(2) Corporate and government bond index funds make up a
significant portion of this category (82%) and have the investment
objective of approximating as closely as practicable the return of a
given segment of the markets for publicly traded investments.
The corporate and government index funds have daily liquidity
with 2 days' notice. An additional 15% of this category represents
long-only fixed income managers, which can invest across the
credit quality spectrum, in varying geographies, and can include
derivatives, high yield and structured securities. These long-only
managers require a redemption notice period between one and
two weeks and have daily or monthly liquidity. One of these funds
also has an investor level gate, limiting daily withdrawals to $2
million per day or 5% of the portfolio's net asset value. The
remaining 3% of this category includes LLCs which invest in
private real estate debt. The majority of these LLC investments
distribute earnings over the life of the investment and have an
average remaining life of less than 5 years. The private real
estate debt LLC's that do not distribute earnings over the life of
the fund permit quarterly redemptions with 90 days' notice.
(3) Private Equity Limited Partnerships include direct, co-
investments with existing SWIB general partners, direct
secondary investments and fund of funds. These investments are
illiquid and are generally not resold or redeemed. Distributions
from each fund will be received as the underlying investments are
liquidated.
(4) This category includes emerging markets equity index
funds (54%) with an investment strategy designed to track the
return of the given segment of the emerging equity markets.
These investments can be redeemed daily with 2 days' notice.
An additional 46% of this category represents long-only equity
managers with various fundamental, quantitative and other
approaches spanning various styles, geographies and market cap
weights. These long-only manager investments can be redeemed
monthly, with between 10 and 30 days' notice.
(5) This category includes funds that invest directly in real estate
and real estate related assets. Approximately 68% of these
investments are generally not resold or redeemed. Distributions
from each fund will be received as the underlying investments are
liquidated. The remaining 32% of this category consists of open-
ended funds that invest directly in real estate and real estate
related assets. Such investments can be redeemed quarterly with
between 30 and 90 days' notice.
(6) Hedge Fund investments are private investment funds that
seek to produce absolute returns using a broad range of
strategies. In certain instances, Hedge fund investments are
structured as limited partnerships, whereby participants receive
distributions over the life of the fund. Estimated remaining life of
funds structured as limited partnerships is estimated to be
between 5-10 years. Additional information relating to Hedge
Funds can be found in Note 4(D).
(7) SWIB had additional unfunded commitments of approximately
$10.2 million, relating to assets not valued using NAV.
(8) Redemption terms described for NAV investments reflect
contractual agreements and assume withdrawals are made
without adverse market impact and under normal market
conditions.
The Board has entered into a number of agreements that commit
the WRS to make investment purchases up to predetermined
amounts over certain investment time periods. The unfunded
capital commitments for private equity, real estate and multi-asset
investments not reported on the Statement of Fiduciary Net
Position total $6.9 billion as of December 31, 2017.
Private Equity and Real Estate Limited Partnerships
Limited partnerships are generally structured to provide
distributions to participants of the fund as the holdings of the
partnership are liquidated over time. In general, the Private
Equity Limited Partnerships participated in the following
investment strategies at December 31, 2017:
WRS Fair Unfunded Redemption Redemption Notice
Value Commitments Frequency Period (8)
Investments Measured at NAV:
Cash (1) 875.0$ -$ Daily Same Day
Fixed Income (2) 6,960.0 228.6 Daily, Monthly, Quarterly, N/A 2-90 days, N/A
Private Equity Limited Partnerships (3) 7,407.5 5,300.6 N/A N/A
Equities (4) 6,839.7 - Daily, Monthly 2-30 days
Real Estate Limited Partnerships (5) 4,804.9 1,287.6 N/A, Quarterly N/A, 30-90 days
Hedge Funds (6) 4,701.1 91.1 Various (see Multi Asset) Various (see Multi Asset)
Total (7) 31,588.2$ 6,908.0$
State of Wisconsin Notes to The Financial Statements
For the Fiscal Year Ended June 30, 2018
65
Buyout – This strategy acquires shares of a private company to
gain a controlling interest.
Mezzanine – Provides mezzanine debt to finance leveraged
buyouts, recapitalizations, and corporate acquisitions.
Special Situations – This strategy can invest in public and private
companies undergoing financial distress, a turnaround in
business operations, or which are believed to be undervalued
because of a discrete extraordinary event.
Venture Capital – This strategy invests in companies with
potential for significant growth (generally small to early stage
emerging firms).
The Real Estate Limited Partnerships generally consisted of the
following investment strategies at December 31, 2017:
Core – Core investments are expected to deliver a significant
percentage of their return from income and should demonstrate
lower volatility than Opportunistic and Value investments due to
lower leverage, higher occupancy, and asset location.
Value – Value investments typically have significant near-term
leasing, repositioning, and/or renovation risk. This strategy is
expected to have modest initial operating revenues with potential
for substantial income growth and will likely encounter greater
volatility than Core strategies, but lower volatility than
Opportunistic strategies.
Opportunistic – Opportunistic investments usually have significant
development, lease-up, financial restructuring, and/or liquidity risk
with little or no initial operating income. This strategy typically
uses the highest leverage, is expected to achieve most of its
return from future capital gains, and is likely to encounter greater
volatility than Core and Value strategies.
Hedge Funds
Hedge Fund investments are private investment funds that seek
to produce absolute returns using a broad range of strategies.
When redeeming Hedge Fund investments, the agreements
governing the investment vehicle oftentimes require advanced
notice and may restrict the timing of withdrawals. Hedge Fund
agreements can also include “lock-up” periods, which restrict
investors from redeeming their investment during a specified time
frame. The lock-up period helps portfolio managers avoid liquidity
problems. Lock-ups can be “hard,” where redemptions are not
permitted for a specified time period, or “soft,” where redemptions
are permitted provided the investor pays a penalty. In certain
instances, a fund may have both hard and soft lock-up restrictions
in place. In addition, hedge fund managers can also institute a
“rolling” lock-up. A fund with a rolling lock-up period requires
investors to commit to an initial lock-up period, and, if the investor
does not submit a redemption notice within a set time prior to
expiration of the lock-up, the lock-up is reset.
The Retirement Funds participated in the following Hedge Fund
strategies at December 31, 2017:
Equity Long-Short – This strategy invests both long and short in
publicly-traded stocks. These managers vary in their use of short
selling and leverage.
Event-Driven– The funds in this strategy seek to gain an
advantage from pricing inefficiencies that may occur before or
after a corporate action or related event, such as a merger,
spinoff, earnings call, bankruptcy, or restructuring.
Global Macro – The funds in this category invest their holdings in
indexes, commodities, interest rate instruments, and currencies
as a result of relative value or directional forecasts from a
systematic or discretionary approach.
Market Neutral/Arbitrage – This strategy uses a range of fixed
income, convertible instruments, and/or statistical arbitrage
strategies that seek to hedge market-related risks to earn
consistent returns.
Multistrategy – The funds in this category employ a wide range of
strategies and instruments in managing assets.
Credit Risk Credit risk is the risk that an issuer or other counterparty to an
investment will not fulfill its obligations.
Primary Government (excluding the Wisconsin Retirement
System (WRS), and the State Investment Fund (SIF)
The primary government, except for the Various Funds discussed
later, follows Wisconsin Statutes, program policy provisions,
appropriate governing boards, and general resolutions contained
in revenue bond indenture documents limits investments in public
housing bonds issued by public agencies or municipalities, the
State of Wisconsin, interest-bearing time deposits, certificates of
deposit or other similar banking arrangement, shares of a
diversified open-end management investment company
repurchase agreements and investment agreements to a rating
no lower than the rating assigned to the bonds. Investments in all
other permitted debt securities are required to bear the highest
rating available from each nationally recognized rating agency. In
addition, credit risk of certain funds such as the Retiree Life
Insurance Fund is minimized by monitoring portfolio diversification
by asset class, creditor and industry and by complying with
investment limitations governed by insurance laws and
regulations.
State of Wisconsin Notes to The Financial Statements
For the Fiscal Year Ended June 30, 2018
66
Regarding the Various Funds, investment guidelines require that
the bond portfolios shall maintain an average quality rating of A-
or better at time of purchase, using the lower of split ratings at the
time of purchase.
Investment credit quality ratings as of June 30, 2018, from
Standard and Poor’s, Moody’s Investors Service, and Fitch
Ratings are presented below using the Standard and Poor’s rating
scale (in millions):
Primary Government (excluding the Various Funds, WRS and SIF)
Credit Quality Ratings Fair Value AAA $ 189.0
AA 537.6
A 22.0
Not Rated 1,914.7
Total $ 2,663.2
The following schedule displays the credit ratings at June 30, 2018, for the Various Funds (fair values in millions):
Various Funds
UW System IPFCF Historical Society Tuition Trust SLF
AAA $ - $ 27.4 $ - $ 1.1 $ 1.1
AA 631.5 50.5
A 121.8 30.8
BBB 275.0 23.9
BB 31.9 1.7
Short-term Investment Fund (Not Rated) 8.4
Bond Fund (Not Rated) 141.3 3.7
Totals $ 141.3 $ 1.096.1 $ 3.7 $ 1.1 $ 108.0
Wisconsin Retirement System (WRS)
With the exception of derivative instrument credit risk, there are
no fund-wide or system-wide investment guidelines related to
credit risk exposures for investments of the WRS. Fixed income
credit risk investment guidelines outline the minimum ratings
required at the time of purchase by individual portfolios, or groups
of portfolios, based on the portfolios’ investment objectives. In
addition, some fixed income portfolios are required to carry a
minimum weighted average rating at all times.
The following schedule displays the lowest credit rating assigned
by nationally recognized statistical rating organizations on debt
securities held as of December 31, 2017 (in millions).
WRS Rating Fair Value
F1/A-1 $ 0.1
AAA/Aaa 259.9
AA/Aa 17,397.5
A 1,872.7
P-2/A-2 328.6
BBB/Baa 2,090.0
BB/Ba 925.5
B 824.4
CCC/Caa or below 310.5
Commingled Fixed Income Funds 7,633.1
Not Rated 790.4
Total $ 32,433.3
Reverse Repurchase Agreements
Wisconsin Retirement System (WRS)
SWIB held $6.1 billion in reverse repurchase agreements at
December 31, 2017. Investment guidelines permit certain

State of Wisconsin Notes to The Financial Statements
For the Fiscal Year Ended June 30, 2018
67
portfolios to enter into reverse repurchase agreements, which are
a sale of securities with a simultaneous agreement to repurchase
the securities in the future at the same price plus a stated rate of
interest. The market value of the securities underlying reverse
repurchase agreements exceeds the cash received, providing the
counterparty a margin against a decline in market value of the
securities. If the counterparty defaults on their obligations to sell
these securities back to SWIB or provide cash of equal value,
SWIB could suffer an economic loss equal to the difference
between the market value of the underlying securities plus
accrued interest and the agreement obligation, including accrued
interest. This credit exposure at December 31, 2017 was
$87.8 million.
SWIB enters into reverse repurchase agreements with various
counterparties and such transactions are governed by Master
Repurchase Agreements (MRA). MRAs are negotiated contracts
and contain terms in which SWIB seeks to minimize counterparty
credit risk. SWIB also controls credit exposures by limiting trades
with any one counterparty to stipulated amounts. The
counterparty credit exposure is monitored daily and managed
through the transfer of margin, in the form of cash or securities,
between SWIB and the counterparty.
The cash proceeds from reverse repurchase agreements are
reinvested by the Board. The maturities of the purchases made
with the proceeds of reverse repurchase agreements are not
necessarily matched to the maturities of the agreements. The
agreed-upon yields earned by the counterparty were
between 1.18 percent and 1.82 percent. Portfolio guidelines
require agreements to mature between one and 90 days.
Custodial Credit Risk
Custodial credit risk is the risk that, in the event of a failure of the
counterparty, the State will not be able to recover the value of the
investment or collateral securities that are in the possession of an
outside party.
Primary Government (excluding the Wisconsin Retirement
System (WRS), and the State Investment Fund (SIF))
The primary government, including the Various Funds, does not
have an investment policy specifically for custodial credit risk. As
of June 30, 2018, the primary government did not have any direct
investment securities exposed to custodial credit risk.
Wisconsin Retirement System (WRS)
The WRS’s custodial credit risk policy addresses the primary risks
associated with safekeeping and custody. It requires that
custodial institutions be selected through a competitive bid
process and that the institution be designated a ‘Systemically
Important Financial Institution’ by the U.S. Federal Reserve. The
policy also requires that the WRS be reflected as beneficial owner
on all securities entrusted to the custodian and that the WRS
have access to safekeeping and custody accounts. The
custodian is also required to be insured for errors and omissions
and must provide the WRS with an annual report on internal
controls. The WRS’s current custodial bank was selected in
accordance with these guidelines and meets all requirements
stipulated in the custodial credit risk policy.
As of December 31, 2017, the WRS held 2 repurchase
agreements totaling $14.2 million. All of these repurchase
agreements were tri-party agreements held in short-term cash
management portfolios managed by SWIB’s custodian. The
underlying securities for these repurchase agreements were held
by the tri-party agent, not in SWIB’s name.
Concentration of Credit Risk
Concentration of credit risk is the risk of loss attributed to the
magnitude of a government’s investment in a single issuer.
Primary Government (excluding the Wisconsin Retirement
System (WRS), and the State Investment Fund (SIF))
Although the primary government, except for the Various Funds
discussed later, does not have a formal policy on limiting the
exposure to concentrations of credit risk, it is the primary
government’s policy to comply with the provisions contained
within the general resolutions of revenue bond indentures and
other program policy investment criteria.
Debt securities issued by the State of Wisconsin represent the
largest concentration of investments in a single issuer. In total
$138.9 million of the reported investments of the non-major
governmental funds were issued by the State of Wisconsin which
represents 12.1 percent of total investments.
The Various Funds’ investment guidelines limit concentrations of
credit risk by establishing maximum issuer and/or sector exposure
limits. Generally, the guidelines require that no single issuer may
exceed 5 percent of the fund investments, with the exception of
U.S. Government and its Agencies, whose exposure is unlimited.
The LGPIF further limits AAA-rated U.S. mortgage-backed, AAA-
rated asset-backed and individual corporate issuers to 3 percent
of the market value of the fund investments. No investments from
these issuers were owned at fiscal year-end.
Excluding investments issued or explicitly guaranteed by the U.S.
government and pooled investments, as of June 30, 2018, none
of the Various Funds had more than 5 percent of their total
investments in a single issuer.

State of Wisconsin Notes to The Financial Statements
For the Fiscal Year Ended June 30, 2018
68
Wisconsin Retirement System (WRS)
For investments of the WRS, concentration of credit risk is limited
by establishing investment guidelines for individual portfolios or
groups of portfolios that generally restrict issuer concentrations in
any one company or Rule 144A securities to less than 5 percent
of the portfolio’s market value.
The WRS did not hold any investments with a single issuer,
exclusive of investments issued or explicitly guaranteed by the
U.S. government, representing 5% or more of the value of the
total WRS investments’ value at December 31, 2017.
Interest Rate Risk
Interest rate risk is the risk that changes in interest rates of debt
investments will adversely affect the fair value of an investment.
Primary Government (excluding the Wisconsin Retirement
System (WRS), and the State Investment Fund (SIF))
Although the primary government, except for the Various Funds
discussed later, does not have a formal policy on limiting the
exposure to changes in interest rates, it is the primary
government’s policy to comply with the provisions contained
within the general resolutions of revenue bond indentures and
other program policy investment criteria. For example, the Lottery
Fund acquires investments with maturity dates that significantly
coincide with scheduled payment dates of prize annuities.
Investments are held to maturity unless an annuitant requests
premature termination of an annuity, then any loss or gain due to
market fluctuations are passed through to the redeeming
annuitant. Therefore, the Lottery Fund has minimal interest rate
risk exposure. Further, as a means of limiting its exposure to
interest rate risks, certain funds are required to limit at least half of
the fund’s investment portfolio to maturities of less than one year.
In addition, interest rate risk of certain other funds such as the
Retiree Life Insurance Fund is minimized by maintaining a
diversified portfolio of investments and monitoring cash flow
patterns in order to approximately match the expected maturity of
liabilities.
The following table provides information about the interest rate
risks associated with the primary government’s investments,
except those of the Various Funds. The investments include
certain short-term cash equivalents, and various long-term items.
At June 30, 2018, the primary government’s investments were
(in millions):
Primary Government (excluding the Various Funds, WRS, SIF, and investments in an external investment pool)
Investment Maturities Less Than 1 to 5 6 to 10 More Than Fair
Investment Type 1 Year Years years 10 Years Value U.S. Government and U.S. agency holdings $ 287.2 $ 257.0 $ 3.8 $ 274.0 $ 822.0
State and municipal bonds and notes 4.0 4.5 67.8 186.2 262.5
Money market funds 235.2 -- -- -- 235.2
Mutual funds – open ended 0.1 638.4 1,181.9 -- 1,820.4
Private Placement 0.4 1.8 3.0 20.3 25.5
Guaranteed Investment Contracts -- 181.9 -- -- 181.9
Total $ 527.0 $ 1,083.6 $ 1,256.5 $ 480.6 $ 3,347.7
The Various Funds, which are managed by the Board, use the
duration method to identify and manage interest rate risk. Three
of the Various Funds have investment guidelines relating to
interest rate risk. The LGPIF guidelines require that a bond’s
maturity must not exceed ten years. The SLF guidelines require
the Weighted Average Maturity (WAM) of the portfolio, including
cash, to be a minimum of ten years. The IPFCF guidelines
require that effective duration of the bond portfolio shall remain
within 15% of the assigned benchmark’s duration.

State of Wisconsin Notes to The Financial Statements
For the Fiscal Year Ended June 30, 2018
69
As of June 30, 2018, the Various Funds had interest rate risk
statistics as detailed below (in millions):
Various Funds Duration or WAM (in years) for Fixed Income Securities
Investment Type UW System IPFCF Historical Society Tuition Trust SLF Fair
Value Duration
Fair
Value Duration Fair
Value Duration Fair
Value Duration Fair
Value WAM
Govt/Agency $ - $ 597.9 5.33 $ - $ 1.1 0.41 $ 45.5 14.24
Corporate Bonds 428.1 7.22 62.5 15.5
Municipal Bonds 21.0 11.92
Foreign Bonds
(Govt/Agency) 40.6 4.49
Bond Fund 141.3 7.01 3.7 6.35
Short-Term
Investment Fund 8.4 0.13
Total $141.3 $1,096.1 $ 3.7 $ 1.1 $108.0
External Investment Pools
The Injured Patients and Families Compensation Fund, has
investments totaling $8.4 million at June 30th, 2017 in the Short-
Term Investment Fund, a pooled short-term investment fund.
This balance is reported as cash and cash equivalents on the
Statement of Net Position.
Investments for the Retiree Life Fund and Local Retiree Life Fund
are held with the insurance carrier. Interest is calculated and
credited to the Retiree Life Insurance Funds based on the rate of
return for a segment of the insurance carrier’s general fund,
specifically 10 Year A- Bonds (as a proxy and not tied to any
specific investments). The funds invested during the year earn
interest based on that year’s rate of return for 10 Year A- Bonds.
The overall aggregate interest rate is calculated using a tiered
approach based on the year the funds were invested and the rate
of return for that year. Investment interest is credited based on the
aggregate rate of return and assets are not adjusted to fair market
value. Furthermore, the insurance carrier guarantees the principal
amounts of the reserves, including all interest previously credited
thereto.
Wisconsin Retirement System (WRS)
Generally, analysis of long or intermediate term portfolios’ interest
rate risk is performed using various duration calculations.
Modified duration, which is stated in years, is the measure of price
sensitivity of a fixed income security to an interest rate change of
100 basis points. The calculation is based on the weighted
average of the present values for all cash flows. Some pooled
investments are analyzed using an option adjusted duration
calculation which is similar to the modified duration method.
Option adjusted duration incorporates the duration shortening
effect of any embedded call provisions in the securities.
Short term portfolios’ interest rate risk is analyzed using the
weighted average maturity to next reset. Weighted average
maturity is the maturity of each position in a portfolio weighted by
the dollar value of the position to compute an average maturity for
the portfolio as a whole. This measure indicates a portfolio’s
sensitivity to interest rate changes: a longer weighted average
maturity implies greater volatility in response to interest rate
changes.
SWIB's investment guidelines related to interest rate risk vary by
portfolio. Some fixed income portfolios are required to be
managed within a range of a targeted duration, while others are
required to maintain a weighted average maturity at or below a
specified number of days or years.

State of Wisconsin Notes to The Financial Statements
For the Fiscal Year Ended June 30, 2018
70
Aggregated interest rate risk exposure as of December 31, 2017,
stated in terms of modified duration (for long term instruments)
and weighted average maturity (for repurchase agreements and
short term pooled investments), is presented below (in millions):
WRS
Investment Type* Fair Value
Modified Duration (Years)
Asset Backed Securities $ 71.8 4.1
Corporate Bonds & Private
Placements 4,985.2 6.3
Foreign Government / Agency
Bonds 2,511.5 8.0
Municipal Bonds 122.4 10.3
U.S. Government Agencies 215.9 4.2
U.S. Treasury Inflation
Protected Securities 12,780.8 7.6
U.S. Treasury Securities 3,700.6 5.0
Commingled Funds:
Domestic Fixed Income 5,699.4 7.9
Emerging Market Fixed
Income 1,058.7 6.1
Subtotal $ 31,146.3
Investment Type Fair Value
Weighted Average
Maturity (days)
Commercial Paper $ 397.9 15
Repurchase Agreements 14.2 2
Commingled Funds:
Short Term Cash
Management 875.0 62
Subtotal 1,287.0
Total $ 32,433.3
*Excludes Derivatives which are separately disclosed
Foreign Currency Risk
Foreign currency risk is the risk that changes in exchange rates
will adversely impact the fair value of an investment.
Primary Government (excluding the Wisconsin Retirement
System (WRS), and the State Investment Fund (SIF))
The primary government, except for the Various Funds discussed
later, does not have a formal policy to limit foreign currency risk,
however, certain funds such as the Environmental Improvement
Fund are not permitted to invest in foreign currency based on
provisions contained in its bond indenture general resolution.
However, foreign currency risk of the Retiree Life Insurance Fund
is minimized by utilizing short-duration spot forward contracts to
minimize the adverse impact of foreign currency exchange rate
risks inherent in the elapsed time between trade processing and
trade settlement. At June 30, 2018, the primary government,
excluding the Various Funds, did not own any issues
denominated in a foreign currency.
The Various Funds’ investment guidelines do not specifically
address foreign currency risk with the exception that the SLF only
allows investments in U.S. dollar denominated instruments. As of
June 30, 2018, the Various Funds did not directly own any issues
denominated in a foreign currency.
State of Wisconsin Notes to The Financial Statements
For the Fiscal Year Ended June 30, 2018
71
Wisconsin Retirement System (WRS)
The WRS held foreign currency denominated cash and securities directly in designated actively managed portfolios and indirectly through its
investment in certain commingled invest funds. As of December 31, 2017, the WRS had the following currency exposure (all assets stated in
millions of United States Dollars):
Currency Exposures by Investment Type
Currency Cas
h & C
ash
Equivalen
ts
Sto
cks
Fixed
Inco
me
Lim
ited
Partn
ersh
ips
Pre
ferred
Secur
ities
Shor
t Sales
Fut
ures
& O
ptions
Tot
al
Argentina Peso -$ -$ 0.3$ -$ -$ -$ -$ 0.3$
Australia Dollar 11.1 1,173.7 34.9 - - (28.8) - 1,191.0
Brazil Real 0.8 45.5 - - 16.9 - - 63.2
Canada Dollar 13.2 1,691.3 32.2 - - (44.5) (0.1) 1,692.2
Chile Peso - 2.4 - - - - - 2.4
Colombia Peso - 0.5 - - - - - 0.5
Czech Republic Koruna - 0.3 - - - - - 0.3
Denmark Krone 0.8 347.4 12.5 - - (12.8) - 347.9
Euro Currency Unit 36.9 5,754.5 958.0 851.6 114.1 (154.0) (2.5) 7,558.7
Hong Kong Dollar 6.0 850.9 - - - - - 856.8
Hungary Forint - 0.5 - - - - - 0.5
India Rupee 0.2 87.3 - - - - - 87.4
Indonesia Rupiah 0.6 25.2 0.1 - - - - 25.9
Israel Shekel 0.6 37.7 - - - (0.7) - 37.6
Japan Yen 84.2 4,319.2 477.4 - - (174.1) 0.6 4,707.4
Malaysia Ringgit 1.0 31.6 8.2 - - - - 40.8
Mexico Peso 0.9 4.1 23.6 - - - - 28.5
New Zealand Dollar 0.5 33.7 2.6 - - - - 36.8
Norw ay Krone 1.0 123.9 5.4 - - (5.4) - 124.9
Philippines Peso - 1.2 - - - - - 1.2
Poland Zloty 1.4 32.7 17.5 - - - - 51.6
Singapore Dollar 2.1 243.9 6.9 - - (14.6) - 238.4
South African Rand 1.0 56.3 20.0 - - - - 77.4
South Korea Won 0.2 217.3 - - - - - 217.5
Sw eden Krona 5.1 447.2 8.5 6.9 - (26.2) - 441.5
Sw itzerland Franc 2.9 1,382.7 - - - (12.4) - 1,373.2
Taiw an New Dollar - 93.9 - - - - - 93.9
Thailand Baht 0.2 71.1 - - - - - 71.3
Turkey Lira 0.3 69.0 - - - - - 69.3
United Kingdom Pound 29.9 3,122.7 162.0 150.7 - (57.4) 1.0 3,408.9
Total 201.0$ 20,267.8$ 1,770.2$ 1,009.2$ 131.0$ (530.9)$ (1.0)$ 22,847.3$
State of Wisconsin Notes to The Financial Statements
For the Fiscal Year Ended June 30, 2018
72
Securities Lending Transactions
Wisconsin Retirement System (WRS)
Securities Lending Transactions – State statutes and Board
policies permit the use of investments of the WRS to enter into
securities lending transactions. These transactions involve the
lending of securities to broker-dealers and other entities in
exchange for collateral, in the form of cash or securities, with the
simultaneous agreement to return the collateral for identical
securities in the future. The securities custodian is an agent in
lending the domestic and international securities. When
securities are delivered to a borrower as part of a securities
lending agreement, the borrower is required to place collateral
equal to 102 percent of the loaned securities' fair value, including
interest accrued, as of the delivery date with the lending agent. In
the event that securities are loaned against collateral
denominated in a different currency, the borrower is required to
place collateral totaling 105 percent of the loaned securities’ fair
value, including interest accrued, as of the delivery date with the
lending agent. Collateral is marked to market daily and adjusted
as needed to maintain the required minimum level. On
December 31, 2016, the fair value of the securities on loan to
counterparties was approximately $10.8 billion.
Cash collateral is reinvested by the lending agent in two separate
pools, a U.S. dollar cash collateral pool and a pool denominated
in Euros, in accordance with contractual investment guidelines,
which are designed to minimize the risk of principal loss and
provide a modest rate of return. Investment guidelines limit credit
and liquidity risk by restricting new investments to overnight
repurchase agreements collateralized with high quality U.S.
government, U.S. government agencies, and sovereign debt
securities. The earnings generated from the collateral
investments, plus or minus the rebates received from or paid to
the dealers and less fees paid to agents, results in the net
earnings from lending activities, which are then split on a
percentage basis with the lending agent.
At December 31, 2017, minimal credit risk exposure to borrowers
existed because loans are collateralized in excess of 100%. The
contract with the lending agent requires it to indemnify the WRS if
the borrowers fail to return the loaned securities and the collateral
is inadequate to replace the securities lent. Losses resulting from
violations of investment guidelines are also indemnified.
The majority of security loans are open-ended and can be
terminated on demand. The risk that SWIB would be unable to
return collateral to securities borrowers upon termination of the
loan is mitigated by the highly liquid nature of investments held in
the collateral reinvestment pools. The average maturities of the
loans and the average maturity of the assets held in collateral
reinvestment pools were similar at December 31, 2017.
Securities lending is allowed in certain commingled fund
investments. All earnings of these funds are reported in the
Statement of Changes in Fiduciary Net Position.
Derivative Instruments
Wisconsin Retirement System (WRS)
Derivatives may be used to implement investment strategies for
the Core and Variable Funds. All derivative instruments are
subjected to risk analysis and monitoring processes at the
portfolio, asset class and fund levels. Investment guidelines
define allowable derivative activity for each portfolio and are
based on the investment objectives which have been approved by
the Board. Where derivatives are permitted, guidelines stipulate
allowable instruments and the manner and degree to which they
are to be used.
Gains and losses for all derivative instruments are reported in the
Statement of Changes in Fiduciary Net Position.
SWIB seeks to mitigate counterparty credit risk through
counterparty credit evaluations and approvals, counterparty credit
limits, and exposure monitoring techniques. Additionally, policies
have been established which seek to implement master netting
arrangements with counterparties that permit the closeout and
netting of transactions with the same counterparty. Agreements
may also require daily collateral postings to further mitigate credit
risk.
As of December 31, 2017, there were 12 counterparties making
up the WRS’s exposure to counterparty credit risk for uncleared
OTC derivative contracts. The exposure of the WRS to
counterparty credit risk relating to these was as follows (in millions
of United States Dollars):
OTC Derivatives Subject to Counterparty Credit Risk
Counterparty Credit
Rating
FX Receivables: AA $ 0.7
A 2,002.5
BBB 479.6
To Be Announced
Securities A 0.2
Warrants Not Rated 3.9
Total 2,486.9
Less Collateral and MNA Offsets 2,482.8
Total OTC Counterparty Credit Risk $ 4.2
State of Wisconsin Notes to The Financial Statements
For the Fiscal Year Ended June 30, 2018
73
Foreign Currency Spot and Forward Contracts — Foreign
Currency Spot and Forward contracts are OTC agreements
between two counterparties to exchange designated currencies at
a specific time in the future. No cash is exchanged when a
foreign exchange spot or forward contract is initiated. Amounts
due are paid or received on the contracted settle date.
Currency exposure management is permitted through the use of
currency derivative instruments. Direct hedging of currency
exposure back to the U. S. dollar is permitted when consistent
with the strategy of the portfolio. Cross-currency exposure
management to transfer out of an exposed currency and into a
benchmark currency is permitted. In some portfolios, currencies
of non-benchmark countries may be held through the use of
forward contracts, provided that the notional value of any single
non-benchmark currency does not exceed 5 percent of the market
value of the portfolio. Discretionary currency overlay strategies at
the total fund and asset class level may be employed when
currency market conditions suggest such strategies are
warranted.
The net receivable or payable for spot and forward contracts is
included in Foreign Currency Contracts on the Statement of
Fiduciary Net Position. Losses may arise from future changes in
the value of the underlying currency, or if the counterparties do
not perform under the terms of the contract. Spot and forward
contracts are valued daily with the changes in fair value included
in the Net Appreciation (Depreciation) in Fair Value of
Investments on the Statement of Changes in Fiduciary Net
Position.
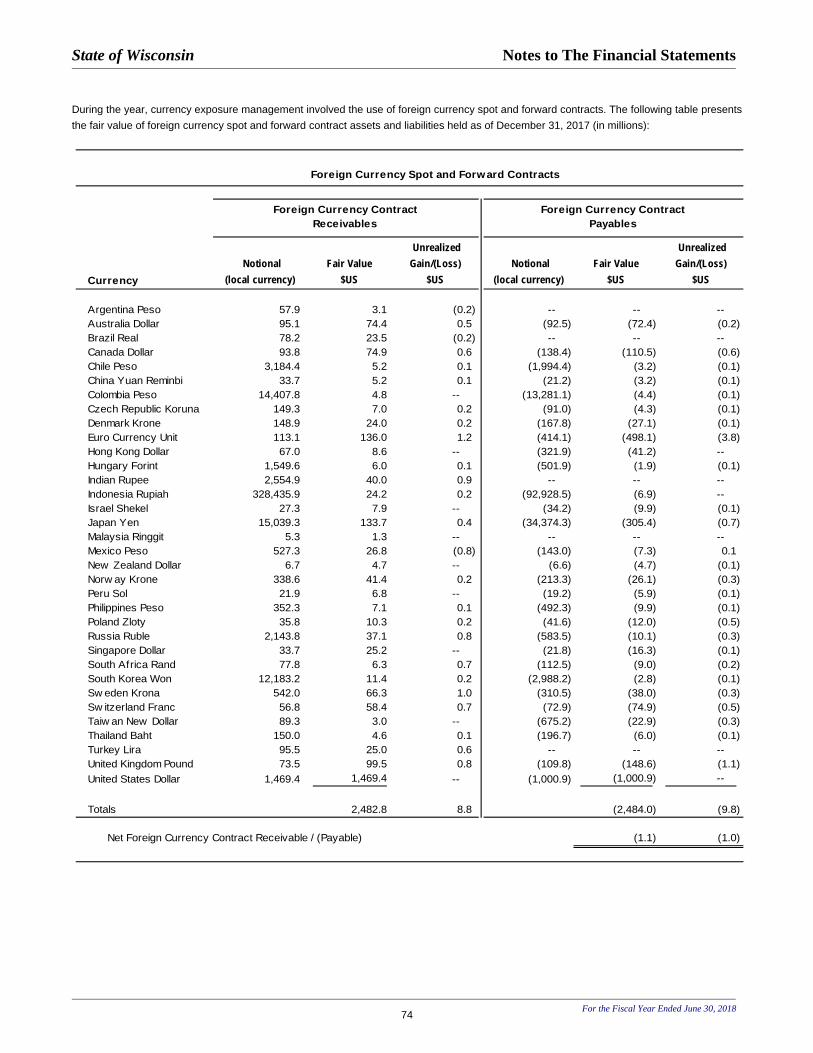
State of Wisconsin Notes to The Financial Statements
For the Fiscal Year Ended June 30, 2018
74
During the year, currency exposure management involved the use of foreign currency spot and forward contracts. The following table presents
the fair value of foreign currency spot and forward contract assets and liabilities held as of December 31, 2017 (in millions):
Foreign Currency Spot and Forward Contracts
Currency Notional
(local currency) Fair Value
$US
Unrealized Gain/(Loss)
$US Notional
(local currency) Fair Value
$US
Unrealized Gain/(Loss)
$US
Argentina Peso 57.9 3.1 (0.2) -- -- --
Australia Dollar 95.1 74.4 0.5 (92.5) (72.4) (0.2)
Brazil Real 78.2 23.5 (0.2) -- -- --
Canada Dollar 93.8 74.9 0.6 (138.4) (110.5) (0.6)
Chile Peso 3,184.4 5.2 0.1 (1,994.4) (3.2) (0.1)
China Yuan Reminbi 33.7 5.2 0.1 (21.2) (3.2) (0.1)
Colombia Peso 14,407.8 4.8 -- (13,281.1) (4.4) (0.1)
Czech Republic Koruna 149.3 7.0 0.2 (91.0) (4.3) (0.1)
Denmark Krone 148.9 24.0 0.2 (167.8) (27.1) (0.1)
Euro Currency Unit 113.1 136.0 1.2 (414.1) (498.1) (3.8)
Hong Kong Dollar 67.0 8.6 -- (321.9) (41.2) --
Hungary Forint 1,549.6 6.0 0.1 (501.9) (1.9) (0.1)
Indian Rupee 2,554.9 40.0 0.9 -- -- --
Indonesia Rupiah 328,435.9 24.2 0.2 (92,928.5) (6.9) --
Israel Shekel 27.3 7.9 -- (34.2) (9.9) (0.1)
Japan Yen 15,039.3 133.7 0.4 (34,374.3) (305.4) (0.7)
Malaysia Ringgit 5.3 1.3 -- -- -- --
Mexico Peso 527.3 26.8 (0.8) (143.0) (7.3) 0.1
New Zealand Dollar 6.7 4.7 -- (6.6) (4.7) (0.1)
Norw ay Krone 338.6 41.4 0.2 (213.3) (26.1) (0.3)
Peru Sol 21.9 6.8 -- (19.2) (5.9) (0.1)
Philippines Peso 352.3 7.1 0.1 (492.3) (9.9) (0.1)
Poland Zloty 35.8 10.3 0.2 (41.6) (12.0) (0.5)
Russia Ruble 2,143.8 37.1 0.8 (583.5) (10.1) (0.3)
Singapore Dollar 33.7 25.2 -- (21.8) (16.3) (0.1)
South Africa Rand 77.8 6.3 0.7 (112.5) (9.0) (0.2)
South Korea Won 12,183.2 11.4 0.2 (2,988.2) (2.8) (0.1)
Sw eden Krona 542.0 66.3 1.0 (310.5) (38.0) (0.3)
Sw itzerland Franc 56.8 58.4 0.7 (72.9) (74.9) (0.5)
Taiw an New Dollar 89.3 3.0 -- (675.2) (22.9) (0.3)
Thailand Baht 150.0 4.6 0.1 (196.7) (6.0) (0.1)
Turkey Lira 95.5 25.0 0.6 -- -- --
United Kingdom Pound 73.5 99.5 0.8 (109.8) (148.6) (1.1)
United States Dollar 1,469.4 1,469.4 -- (1,000.9) (1,000.9) --
Totals 2,482.8 8.8 (2,484.0) (9.8)
(1.1) (1.0)
Foreign Currency ContractReceivables
Foreign Currency ContractPayables
Net Foreign Currency Contract Receivable / (Payable)
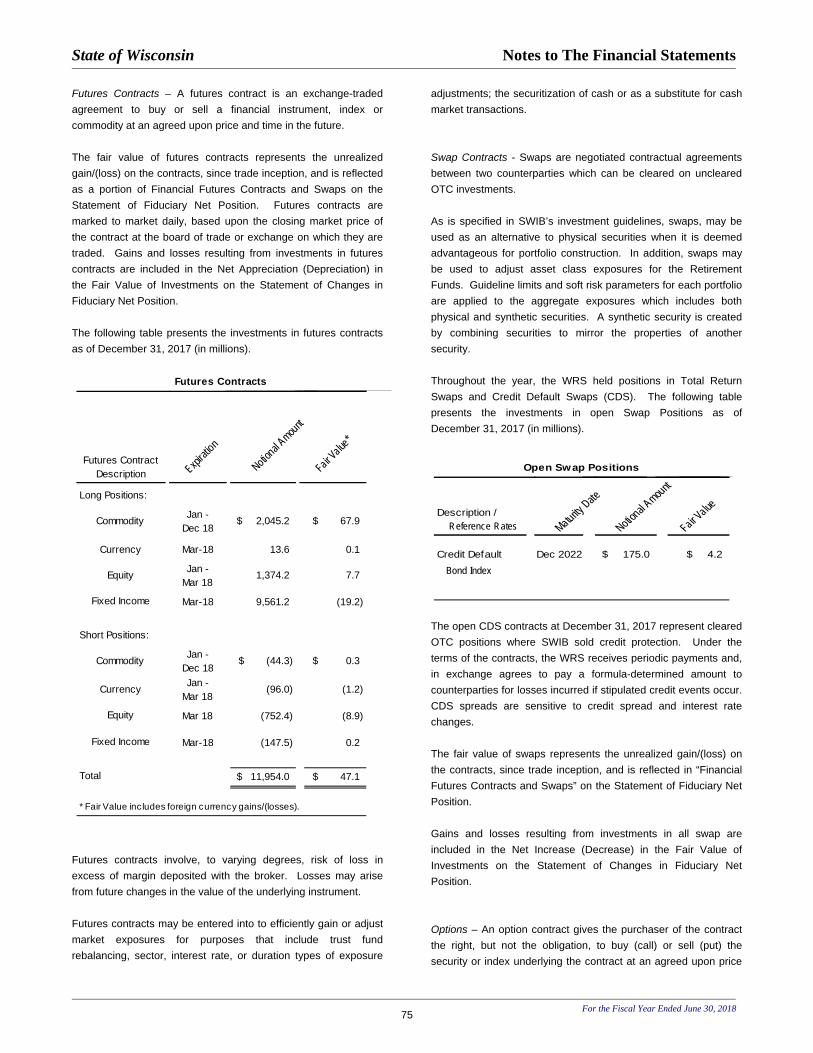
State of Wisconsin Notes to The Financial Statements
For the Fiscal Year Ended June 30, 2018
75
Futures Contracts – A futures contract is an exchange-traded
agreement to buy or sell a financial instrument, index or
commodity at an agreed upon price and time in the future.
The fair value of futures contracts represents the unrealized
gain/(loss) on the contracts, since trade inception, and is reflected
as a portion of Financial Futures Contracts and Swaps on the
Statement of Fiduciary Net Position. Futures contracts are
marked to market daily, based upon the closing market price of
the contract at the board of trade or exchange on which they are
traded. Gains and losses resulting from investments in futures
contracts are included in the Net Appreciation (Depreciation) in
the Fair Value of Investments on the Statement of Changes in
Fiduciary Net Position.
The following table presents the investments in futures contracts
as of December 31, 2017 (in millions).
Futures contracts involve, to varying degrees, risk of loss in
excess of margin deposited with the broker. Losses may arise
from future changes in the value of the underlying instrument.
Futures contracts may be entered into to efficiently gain or adjust
market exposures for purposes that include trust fund
rebalancing, sector, interest rate, or duration types of exposure
adjustments; the securitization of cash or as a substitute for cash
market transactions.
Swap Contracts - Swaps are negotiated contractual agreements
between two counterparties which can be cleared on uncleared
OTC investments.
As is specified in SWIB’s investment guidelines, swaps, may be
used as an alternative to physical securities when it is deemed
advantageous for portfolio construction. In addition, swaps may
be used to adjust asset class exposures for the Retirement
Funds. Guideline limits and soft risk parameters for each portfolio
are applied to the aggregate exposures which includes both
physical and synthetic securities. A synthetic security is created
by combining securities to mirror the properties of another
security.
Throughout the year, the WRS held positions in Total Return
Swaps and Credit Default Swaps (CDS). The following table
presents the investments in open Swap Positions as of
December 31, 2017 (in millions).
The open CDS contracts at December 31, 2017 represent cleared
OTC positions where SWIB sold credit protection. Under the
terms of the contracts, the WRS receives periodic payments and,
in exchange agrees to pay a formula-determined amount to
counterparties for losses incurred if stipulated credit events occur.
CDS spreads are sensitive to credit spread and interest rate
changes.
The fair value of swaps represents the unrealized gain/(loss) on
the contracts, since trade inception, and is reflected in “Financial
Futures Contracts and Swaps” on the Statement of Fiduciary Net
Position.
Gains and losses resulting from investments in all swap are
included in the Net Increase (Decrease) in the Fair Value of
Investments on the Statement of Changes in Fiduciary Net
Position.
Options – An option contract gives the purchaser of the contract
the right, but not the obligation, to buy (call) or sell (put) the
security or index underlying the contract at an agreed upon price
Futures Contracts
Expi
ration
Notion
al Amount
Fair V
alue*
Futures Contract
Description
Long Positions:
Jan -
Dec 182,045.2$ 67.9$
Mar-18 13.6 0.1
Jan -
Mar 181,374.2 7.7
Mar-18 9,561.2 (19.2)
Short Positions:
Jan -
Dec 18(44.3)$ 0.3$
Jan -
Mar 18(96.0) (1.2)
Mar 18 (752.4) (8.9)
Mar-18 (147.5) 0.2
11,954.0$ 47.1$
* Fair Value includes foreign currency gains/(losses).
Commodity
Equity
Fixed Income
Commodity
Fixed Income
Total
Currency
Currency
Equity
Open Swap Positions
Maturity Date
Notional A
mount
Fair ValueDescription /
Reference Rates
Credit Default Dec 2022 175.0$ 4.2$
Bond Index

State of Wisconsin Notes to The Financial Statements
For the Fiscal Year Ended June 30, 2018
76
on or before the expiration of the option contract. The seller of
the contract is subject to market risk, while the purchaser is
subject to credit risk and market risk, to the extent of the premium
paid to enter into the contract.
Rebalancing policies and portfolio investment guidelines permit
the use of exchange-traded and over-the-counter options.
Options may be used to improve market exposure efficiency,
enhance expected returns, or provide market exposure hedges.
Exchange rules require that the seller of exchange-traded call
option contracts cover these positions either by collateral deposits
in the form of cash or securities or by pledging, in escrow, the
actual securities that would be transferred to the option purchaser
in the event the option contract were exercised.
The fair value of option contracts is based upon the closing
market price of the contract and is reflected as Options on the
Statement of Fiduciary Net Position. Gains and losses as a result
of investments in option contracts are included in the Net
Appreciation (Depreciation) in the Fair Value of Investments on
the Statement of Changes in Fiduciary Net Position.
The table below presents the fair value of option contracts as of
December 31, 2017 (in millions):
To Be Announced Securities — In 2017, the WRS began trading
to be announced mortgage-backed (TBA) securities. These
commitments are uncleared OTC forward contracts consisting of
mortgage-backed securities (MBS) issued by Government
National Mortgage Association, a government entity, and by
government-sponsored enterprises such as, the Federal National
Mortgage Association or the Federal Home Loan Mortgage Corp.
The term TBA is derived from the fact that the actual MBS that will
be delivered to fulfill a TBA trade is not designated at the time the
trade is made. Instead, the specific pool of mortgages making up
the MBS is announced 48 hours prior to the established trade
settlement date. Eligibility rules and standards for MBS pools
deliverable into TBA contracts ensure that delivered MBS pools
are fungible. Payment for TBA securities is not made until the
settlement date.
Certain portfolio investment guidelines allow for both long and
short TBA positions. To mitigate counterparty credit risk,
guidelines establish minimum credit ratings and require master
netting agreements which include provisions for collateral
exchanges.
TBAs, much like their underlying MBS securities, may be highly
sensitive to interest rate changes. This is because the MBS pool
on which these forward contracts are based can be subject to
early payment in a period of declining interest rates. The price of
TBAs can fluctuate as the marketplace predicts changes in timing,
or possible reductions in expected cash flows, associated with a
change in interest rates.
Security
Description
Contract
Type Position
Exchange-
Traded vs. OTC Expiration Notional
Fair
Value
Unrealized
Gain (Loss)
Currency Call Short Exchange Jan 18 (0.2)$ -$ -$
Equity Call Long Exchange Mar 18 - Apr 18 2.7 0.1 (0.2)
Call Short Exchange Jan 18 - Mar 18 (71.9) (2.6) (1.2)
Call Short OTC Jan 18 (3.9) - -
Put Long Exchange Jan 18 - Sep 18 16.8 0.3 (0.2)
Put Short Exchange Jan 18 - Sep 18 (146.6) (1.4) 0.4
Put Short OTC Jan 18 (6.4) (0.2) -
Volatility Call Long Exchange Feb 18 0.8 0.1 -
Call Short Exchange Feb 18 (0.8) - -
Put Short Exchange Feb 18 (0.8) - -
Option Contracts
Total Option Contracts (210.3)$ (3.8)$ (1.2)$
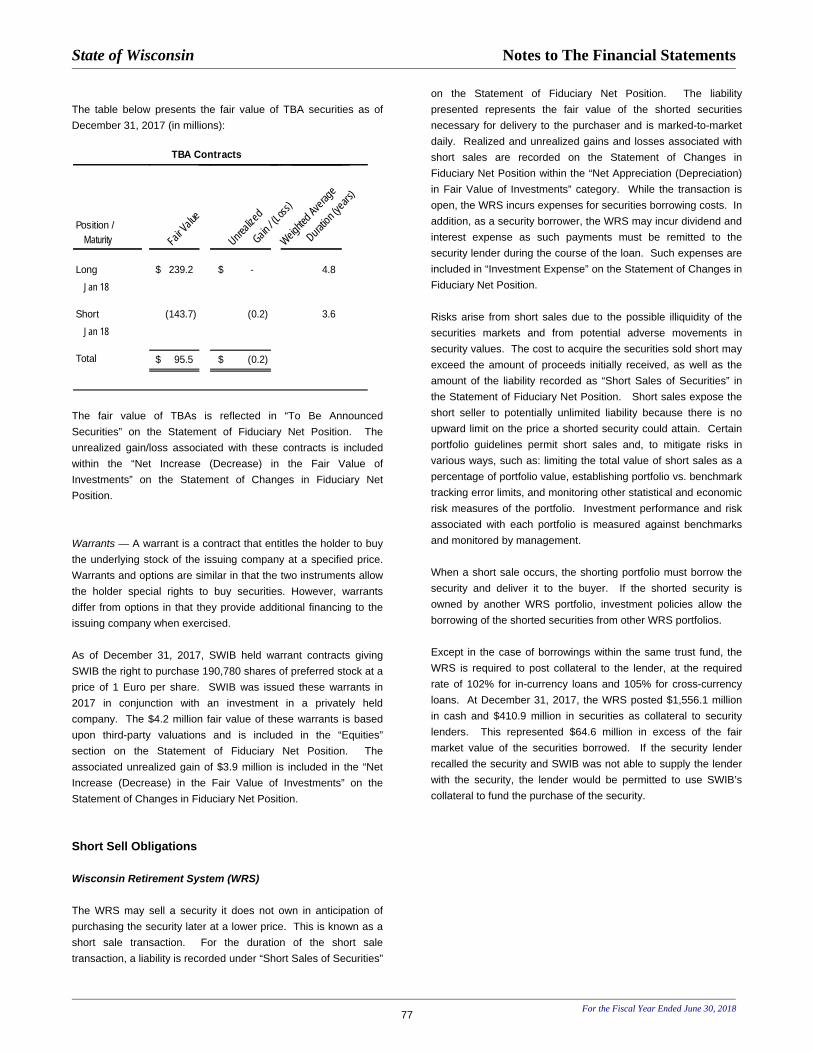
State of Wisconsin Notes to The Financial Statements
For the Fiscal Year Ended June 30, 2018
77
The table below presents the fair value of TBA securities as of
December 31, 2017 (in millions):
The fair value of TBAs is reflected in “To Be Announced
Securities” on the Statement of Fiduciary Net Position. The
unrealized gain/loss associated with these contracts is included
within the “Net Increase (Decrease) in the Fair Value of
Investments” on the Statement of Changes in Fiduciary Net
Position.
Warrants — A warrant is a contract that entitles the holder to buy
the underlying stock of the issuing company at a specified price.
Warrants and options are similar in that the two instruments allow
the holder special rights to buy securities. However, warrants
differ from options in that they provide additional financing to the
issuing company when exercised.
As of December 31, 2017, SWIB held warrant contracts giving
SWIB the right to purchase 190,780 shares of preferred stock at a
price of 1 Euro per share. SWIB was issued these warrants in
2017 in conjunction with an investment in a privately held
company. The $4.2 million fair value of these warrants is based
upon third-party valuations and is included in the “Equities”
section on the Statement of Fiduciary Net Position. The
associated unrealized gain of $3.9 million is included in the “Net
Increase (Decrease) in the Fair Value of Investments” on the
Statement of Changes in Fiduciary Net Position.
Short Sell Obligations Wisconsin Retirement System (WRS)
The WRS may sell a security it does not own in anticipation of
purchasing the security later at a lower price. This is known as a
short sale transaction. For the duration of the short sale
transaction, a liability is recorded under “Short Sales of Securities”
on the Statement of Fiduciary Net Position. The liability
presented represents the fair value of the shorted securities
necessary for delivery to the purchaser and is marked-to-market
daily. Realized and unrealized gains and losses associated with
short sales are recorded on the Statement of Changes in
Fiduciary Net Position within the “Net Appreciation (Depreciation)
in Fair Value of Investments” category. While the transaction is
open, the WRS incurs expenses for securities borrowing costs. In
addition, as a security borrower, the WRS may incur dividend and
interest expense as such payments must be remitted to the
security lender during the course of the loan. Such expenses are
included in “Investment Expense” on the Statement of Changes in
Fiduciary Net Position.
Risks arise from short sales due to the possible illiquidity of the
securities markets and from potential adverse movements in
security values. The cost to acquire the securities sold short may
exceed the amount of proceeds initially received, as well as the
amount of the liability recorded as “Short Sales of Securities” in
the Statement of Fiduciary Net Position. Short sales expose the
short seller to potentially unlimited liability because there is no
upward limit on the price a shorted security could attain. Certain
portfolio guidelines permit short sales and, to mitigate risks in
various ways, such as: limiting the total value of short sales as a
percentage of portfolio value, establishing portfolio vs. benchmark
tracking error limits, and monitoring other statistical and economic
risk measures of the portfolio. Investment performance and risk
associated with each portfolio is measured against benchmarks
and monitored by management.
When a short sale occurs, the shorting portfolio must borrow the
security and deliver it to the buyer. If the shorted security is
owned by another WRS portfolio, investment policies allow the
borrowing of the shorted securities from other WRS portfolios.
Except in the case of borrowings within the same trust fund, the
WRS is required to post collateral to the lender, at the required
rate of 102% for in-currency loans and 105% for cross-currency
loans. At December 31, 2017, the WRS posted $1,556.1 million
in cash and $410.9 million in securities as collateral to security
lenders. This represented $64.6 million in excess of the fair
market value of the securities borrowed. If the security lender
recalled the security and SWIB was not able to supply the lender
with the security, the lender would be permitted to use SWIB’s
collateral to fund the purchase of the security.
TBA Contracts
Fair Va
lue
Unrealize
d
Gain / (L
oss)
Weighte
d Average
Duration (y
ears)
Position /
Maturity
Long 239.2$ -$ 4.8
Jan 18
Short (143.7) (0.2) 3.6
Jan 18
95.5$ (0.2)$ Total
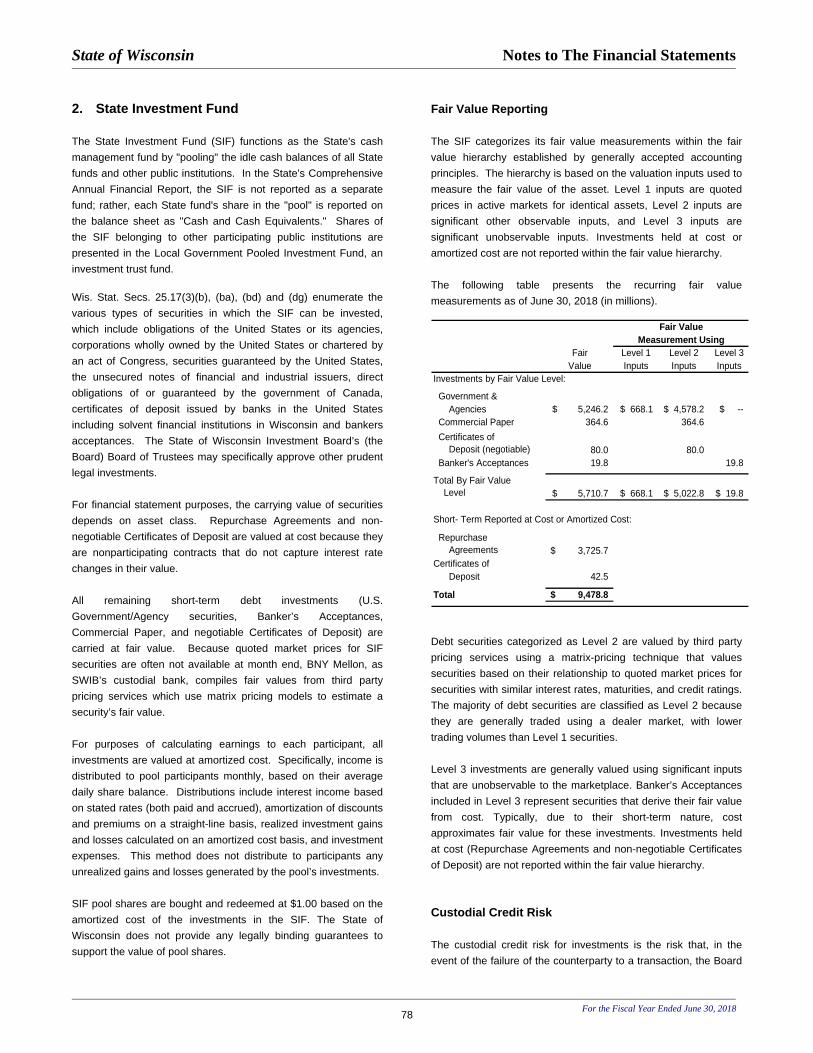
State of Wisconsin Notes to The Financial Statements
For the Fiscal Year Ended June 30, 2018
78
2. State Investment Fund
The State Investment Fund (SIF) functions as the State's cash
management fund by "pooling" the idle cash balances of all State
funds and other public institutions. In the State's Comprehensive
Annual Financial Report, the SIF is not reported as a separate
fund; rather, each State fund's share in the "pool" is reported on
the balance sheet as "Cash and Cash Equivalents." Shares of
the SIF belonging to other participating public institutions are
presented in the Local Government Pooled Investment Fund, an
investment trust fund.
Wis. Stat. Secs. 25.17(3)(b), (ba), (bd) and (dg) enumerate the
various types of securities in which the SIF can be invested,
which include obligations of the United States or its agencies,
corporations wholly owned by the United States or chartered by
an act of Congress, securities guaranteed by the United States,
the unsecured notes of financial and industrial issuers, direct
obligations of or guaranteed by the government of Canada,
certificates of deposit issued by banks in the United States
including solvent financial institutions in Wisconsin and bankers
acceptances. The State of Wisconsin Investment Board’s (the
Board) Board of Trustees may specifically approve other prudent
legal investments.
For financial statement purposes, the carrying value of securities
depends on asset class. Repurchase Agreements and non-
negotiable Certificates of Deposit are valued at cost because they
are nonparticipating contracts that do not capture interest rate
changes in their value.
All remaining short-term debt investments (U.S.
Government/Agency securities, Banker’s Acceptances,
Commercial Paper, and negotiable Certificates of Deposit) are
carried at fair value. Because quoted market prices for SIF
securities are often not available at month end, BNY Mellon, as
SWIB’s custodial bank, compiles fair values from third party
pricing services which use matrix pricing models to estimate a
security’s fair value.
For purposes of calculating earnings to each participant, all
investments are valued at amortized cost. Specifically, income is
distributed to pool participants monthly, based on their average
daily share balance. Distributions include interest income based
on stated rates (both paid and accrued), amortization of discounts
and premiums on a straight-line basis, realized investment gains
and losses calculated on an amortized cost basis, and investment
expenses. This method does not distribute to participants any
unrealized gains and losses generated by the pool’s investments.
SIF pool shares are bought and redeemed at $1.00 based on the
amortized cost of the investments in the SIF. The State of
Wisconsin does not provide any legally binding guarantees to
support the value of pool shares.
Fair Value Reporting
The SIF categorizes its fair value measurements within the fair
value hierarchy established by generally accepted accounting
principles. The hierarchy is based on the valuation inputs used to
measure the fair value of the asset. Level 1 inputs are quoted
prices in active markets for identical assets, Level 2 inputs are
significant other observable inputs, and Level 3 inputs are
significant unobservable inputs. Investments held at cost or
amortized cost are not reported within the fair value hierarchy.
The following table presents the recurring fair value
measurements as of June 30, 2018 (in millions).
Fair Level 1 Level 2 Level 3
Value Inputs Inputs Inputs
Investments by Fair Value Level:
Government &
Agencies 5,246.2$ 668.1$ 4,578.2$ $ --
Commercial Paper 364.6 364.6
Certificates of
Deposit (negotiable) 80.0 80.0
Banker's Acceptances 19.8 19.8
Total By Fair Value
Level 5,710.7$ 668.1$ 5,022.8$ 19.8$
Short- Term Reported at Cost or Amortized Cost:
Repurchase
Agreements 3,725.7$
Certificates of
Deposit 42.5
Total 9,478.8$
Measurement UsingFair Value
Debt securities categorized as Level 2 are valued by third party
pricing services using a matrix-pricing technique that values
securities based on their relationship to quoted market prices for
securities with similar interest rates, maturities, and credit ratings.
The majority of debt securities are classified as Level 2 because
they are generally traded using a dealer market, with lower
trading volumes than Level 1 securities.
Level 3 investments are generally valued using significant inputs
that are unobservable to the marketplace. Banker’s Acceptances
included in Level 3 represent securities that derive their fair value
from cost. Typically, due to their short-term nature, cost
approximates fair value for these investments. Investments held
at cost (Repurchase Agreements and non-negotiable Certificates
of Deposit) are not reported within the fair value hierarchy.
Custodial Credit Risk
The custodial credit risk for investments is the risk that, in the
event of the failure of the counterparty to a transaction, the Board

State of Wisconsin Notes to The Financial Statements
For the Fiscal Year Ended June 30, 2018
79
will not be able to recover the value of investments or collateral
securities that are in the possession of an outside party.
Investments are exposed to custodial credit risk if the securities
are uninsured and unregistered and are either held by the
counterparty or by the counterparty’s trust department or agent
but not in the name of the Board. The SIF held six repurchase
agreements totaling $3.7 billion as of June 30, 2018. Five of the
repurchase agreements totaling $2.1 billion, were tri-party
agreements. The underlying securities (collateral) for these
repurchase agreements were held by the tri-party’s agent, not in
SWIB’s name. The remaining repurchase agreement, totaling 1.6
billion, was a related-party, bilateral agreement with the WRS.
The underlying securities for this repurchase agreement were
held by SWIB’s custodian, in SWIB’s name.
The related party repurchase transaction with the WRS was an
overnight agreement collateralized with U.S. Treasury securities.
The WRS is also a participant in the SIF, with an investment
totaling 2.0 billion at June 30, 2018.
The SIF’s custodial credit risk policy addresses the primary risks
associated with safekeeping and custody. It requires that
custodial institutions be selected through a competitive bid
process and that the institution be designated a ‘Systemically
Important Financial Institution’ by the U.S. Federal Reserve. The
policy also requires that the SIF be reflected as beneficial owner
on all securities entrusted to the custodian and that the SIF have
access to safekeeping and custody accounts. The custodian is
also required to be insured for errors and omissions and must
provide the SIF with an annual report on internal controls. The
SIF’s current custodial bank was selected in accordance with
these guidelines and meets all requirements stipulated in the
custodial credit risk policy.
Concentration of Credit Risk
Concentration of credit risk is the risk of loss attributed to the
magnitude of an organization’s investment in a single issuer. The
SIF’s investment guidelines limit concentrations of credit risk by
establishing maximum issuer and/or issue exposure limits based
on credit rating. These guidelines do not place a limit on
maximum exposure for any U.S. Treasury or Agency discount
notes. As of June 30, 2018, the SIF has more than five percent of
its investments in FNMA (15.6 percent), FHLB (17.6 percent),
FHLMC (11.1 percent), U.S. Treasury (11.0 percent) and
Repurchase Agreement collateral (39.3 percent) consisting of
various securities issued by these same U.S. Agencies. Since
the Repurchase Agreements generally mature each day, new
collateral, consisting of a different blend of U.S. Treasury and
Agency securities, is assigned each night.
Credit Quality Risk Credit risk is the risk that an issuer or other counterparty to an
investment will not fulfill its obligations. The Board established
investment guidelines with maximum exposure limits by security
type based on the minimum credit ratings as issued by Nationally
Recognized Statistical Rating Organizations (NRSROs).
The following table presents these credit ratings and aggregate
exposures by investment type as of June 30, 2018 (in millions):
Fair Investment Type Ratings Value
Repurchase Agreements (Collateral):
U.S. Government Debt & Agencies AA 3,725.7
U.S. Treasury:
Short-Term (Bills) A-1+ 867.7
Long Term (Note) AA 179.3
Government Sponsored Entity
U.S. Agency:
Federal Home Loan Bank (FHLB) A-1+ 1,673.8
Federal Home Loan Mortgage
Corporation (FHLMC) A-1+ 1,024.7
Federal Home Loan Mortgage
Corporation (FHLMC) AA 25.0
Federal National Mortgage
Association (FNMA) A-1+ 1,475.6
Certificates of Deposit:
Negotiable A-1+ 55.0
Negotiable A-1 25.0
Non-Negotiable (Wisc. CD program) NR 42.5
Banker’s Acceptances A-1+ 19.8
Commercial Paper A-1+ 310.7
Commercial Paper A-1 53.9
Total Investments $ 9,478.8
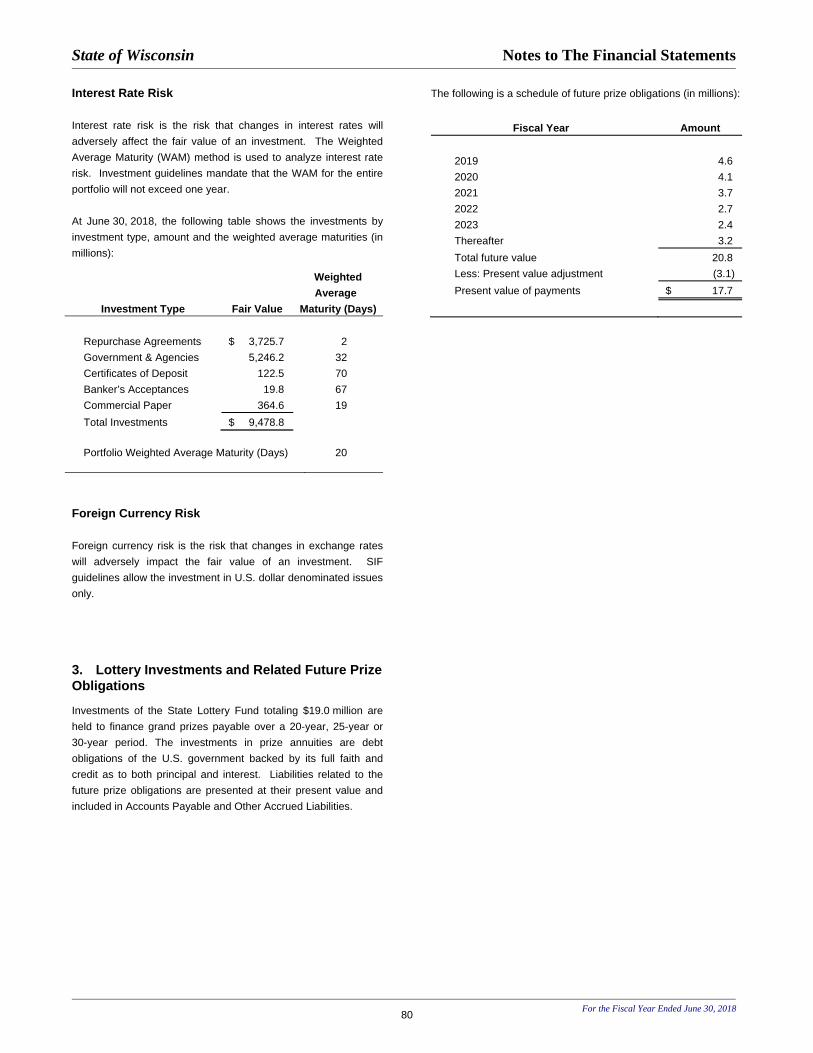
State of Wisconsin Notes to The Financial Statements
For the Fiscal Year Ended June 30, 2018
80
Interest Rate Risk
Interest rate risk is the risk that changes in interest rates will
adversely affect the fair value of an investment. The Weighted
Average Maturity (WAM) method is used to analyze interest rate
risk. Investment guidelines mandate that the WAM for the entire
portfolio will not exceed one year.
At June 30, 2018, the following table shows the investments by
investment type, amount and the weighted average maturities (in
millions):
Weighted Average
Investment Type Fair Value Maturity (Days)
Repurchase Agreements $ 3,725.7 2
Government & Agencies 5,246.2 32
Certificates of Deposit 122.5 70
Banker’s Acceptances 19.8 67
Commercial Paper 364.6 19
Total Investments $ 9,478.8
Portfolio Weighted Average Maturity (Days) 20
Foreign Currency Risk
Foreign currency risk is the risk that changes in exchange rates
will adversely impact the fair value of an investment. SIF
guidelines allow the investment in U.S. dollar denominated issues
only.
3. Lottery Investments and Related Future Prize Obligations
Investments of the State Lottery Fund totaling $19.0 million are
held to finance grand prizes payable over a 20-year, 25-year or
30-year period. The investments in prize annuities are debt
obligations of the U.S. government backed by its full faith and
credit as to both principal and interest. Liabilities related to the
future prize obligations are presented at their present value and
included in Accounts Payable and Other Accrued Liabilities.
The following is a schedule of future prize obligations (in millions):
Fiscal Year Amount
2019 4.6
2020 4.1
2021 3.7
2022 2.7
2023 2.4
Thereafter 3.2
Total future value 20.8
Less: Present value adjustment (3.1)
Present value of payments $ 17.7
State of Wisconsin Notes to The Financial Statements
For the Fiscal Year Ended June 30, 2018
81
his page le irienlionally blank.

State of Wisconsin Notes to The Financial Statements
For the Fiscal Year Ended June 30, 2018
82
NOTE 6. RECEIVABLES AND NET REVENUES A. Receivables
Receivables at June 30, 2018 were as follows (in thousands):
Lo ans t o D ue Fro m D ue F ro m
Lo cal St udent V et erans M o rt g ag e Ot her Ot her Ot her C ompo nent To t al
T axes Government s Lo ans Loans Loans Lo ans R eceivab les Go vernment s U nit s R eceivab lesGo vernment al A ct ivit ies:General $ 1,551,220 $ - $ - $ - $ - $ 5,454 $ 715,979 $ 1,158,176 $ - $ 3,430,829
Transportat ion 104,506 - - - - 16,967 4,308 274,043 - 399,824
Capital Improvement - - - - - - - - - -
Nonmajor Governmental 268 490,881 - - - - 71,825 37,399 - 600,374
Total Governmental: 1,655,994 490,881 - - - 22,421 792,112 1,469,619 - 4,431,027
Government-wide
Adjustments:
Internal Service Funds - - - - - - 3,413 524 585 4,522
Accrual Adjustments - - - - - - 2,674 - - 2,674
Fiduciary Receivables - - - - - - 69,679 - - 69,679
To t al – Government al A ct ivit ies $ 1,655,994 $ 490,881 $ - $ - $ - $ 22,421 $ 867,878 $ 1,470,142 $ 585 $ 4,507,902
Related revenue not
recognized in the funds
because it is not available $ 223,188 $ - $ - $ - $ - $ - $ 21,399 $ - $ - $ 244,587
B usiness- t ype A ct ivit ies:Current:
Injured Pat ients and
Families Compensat ion $ - $ - $ - $ - $ - $ - $ 22,043 $ - $ - $ 22,043
Environmental
Improvement - 184,811 - - - - 192 9,441 - 194,444
University of
Wisconsin System - - 29,655 - - - 130,038 109,549 22 269,264
Unemployment
Reserve - - - - - - 157,960 1,733 - 159,693
Nonmajor Enterprise - 253 - 149 1,649 - 81,379 8,105 - 91,535
Total Current: - 185,064 29,655 149 1,649 - 391,612 128,828 22 736,979
Noncurrent:
Environmental
Improvement - 1,772,088 - - - - - - - 1,772,088
University of
Wisconsin System - - 167,754 - - - 495 - 140 168,388
Unemployment
Reserve - - - - - - 34,419 - - 34,419
Nonmajor Enterprise - 1,628 - 361 20,962 3,039 - - - 25,990
Total Noncurrent - 1,773,717 167,754 361 20,962 3,039 34,915 - 140 2,000,886
Government-wide
Adjustments:
Fiduciary Receivables - - - - - - 14,144 - - 14,144
To t al – B usiness- t yp e A ct ivit ies $ - $ 1,958,781 $ 197,408 $ 510 $ 22,611 $ 3,039 $ 440,670 $ 128,828 $ 162 $ 2,752,009
Ot her Lo ans R eceivab le
B. Net Revenues
Certain revenues of the University of Wisconsin System are reported net of scholarship allowances. For Fiscal Year 2018, these scholarship
allowances totaled as follows (in thousands):
Student Tuition and Fees $ 231,391
Sales and Services of Auxiliary Enterprises 39,909
Total $ 271,300
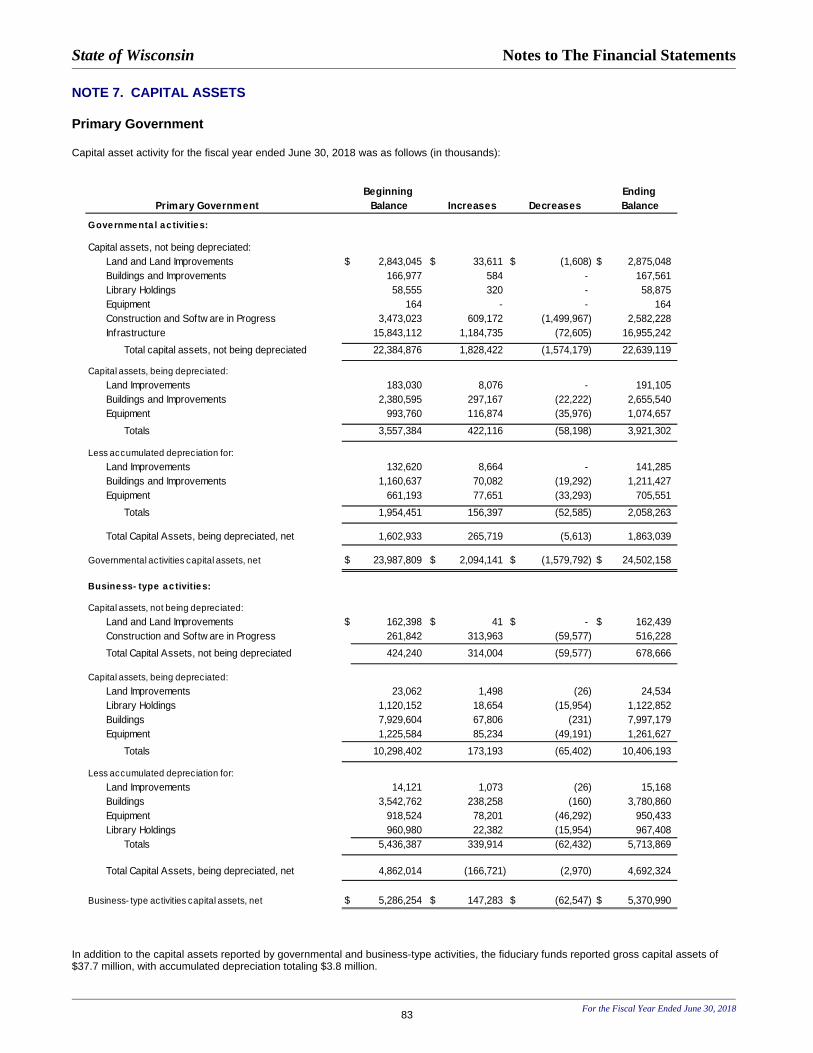
State of Wisconsin Notes to The Financial Statements
For the Fiscal Year Ended June 30, 2018
83
NOTE 7. CAPITAL ASSETS Primary Government Capital asset activity for the fiscal year ended June 30, 2018 was as follows (in thousands):
In addition to the capital assets reported by governmental and business-type activities, the fiduciary funds reported gross capital assets of $37.7 million, with accumulated depreciation totaling $3.8 million.
Beginning Ending Primary Government Balance Increases Decreases Balance
Gove rnme nta l a c tivitie s:
Capital assets, not being depreciated:
Land and Land Improvements $ 2,843,045 $ 33,611 $ (1,608) $ 2,875,048
Buildings and Improvements 166,977 584 - 167,561
Library Holdings 58,555 320 - 58,875
Equipment 164 - - 164
Construction and Softw are in Progress 3,473,023 609,172 (1,499,967) 2,582,228
Infrastructure 15,843,112 1,184,735 (72,605) 16,955,242
Total capital assets, not being depreciated 22,384,876 1,828,422 (1,574,179) 22,639,119
Capital assets, being depreciated:
Land Improvements 183,030 8,076 - 191,105
Buildings and Improvements 2,380,595 297,167 (22,222) 2,655,540
Equipment 993,760 116,874 (35,976) 1,074,657
Totals 3,557,384 422,116 (58,198) 3,921,302
Less accumulated depreciation for:
Land Improvements 132,620 8,664 - 141,285
Buildings and Improvements 1,160,637 70,082 (19,292) 1,211,427
Equipment 661,193 77,651 (33,293) 705,551
Totals 1,954,451 156,397 (52,585) 2,058,263
Total Capital Assets, being depreciated, net 1,602,933 265,719 (5,613) 1,863,039
Governmental activities capital assets, net $ 23,987,809 $ 2,094,141 $ (1,579,792) $ 24,502,158
Busine ss- type ac tivitie s:
Capital assets, not being depreciated:
Land and Land Improvements $ 162,398 $ 41 $ - $ 162,439
Construction and Softw are in Progress 261,842 313,963 (59,577) 516,228
Total Capital Assets, not being depreciated 424,240 314,004 (59,577) 678,666
Capital assets, being depreciated:
Land Improvements 23,062 1,498 (26) 24,534
Library Holdings 1,120,152 18,654 (15,954) 1,122,852
Buildings 7,929,604 67,806 (231) 7,997,179
Equipment 1,225,584 85,234 (49,191) 1,261,627
Totals 10,298,402 173,193 (65,402) 10,406,193
Less accumulated depreciation for:
Land Improvements 14,121 1,073 (26) 15,168
Buildings 3,542,762 238,258 (160) 3,780,860
Equipment 918,524 78,201 (46,292) 950,433
Library Holdings 960,980 22,382 (15,954) 967,408
Totals 5,436,387 339,914 (62,432) 5,713,869
Total Capital Assets, being depreciated, net 4,862,014 (166,721) (2,970) 4,692,324
Business- type activities capital assets, net $ 5,286,254 $ 147,283 $ (62,547) $ 5,370,990

State of Wisconsin Notes to The Financial Statements
For the Fiscal Year Ended June 30, 2018
84
Depreciation Expense Depreciation expense was charged to the primary government as follows (in thousands):
Commerce $ 315 University of Wisconsin System $ 323,984
Education 5,310 Lottery 29
Transportation 12,147 Veterans Mortgage Loan Repayment 5
Environmental Resources 16,364 Injured Patients and Families Compensation 524
Human Relations and Resources 63,290 Environmental Improvement -
General Executive 14,942 Other Business-Type 15,371
Judicial 2,066 Total depreciation expense -
Internal Service Funds 41,963 business-type activities $ 339,914
Total depreciation expense -
governmental activities $ 156,397
Governmental Activities Business-type Activities
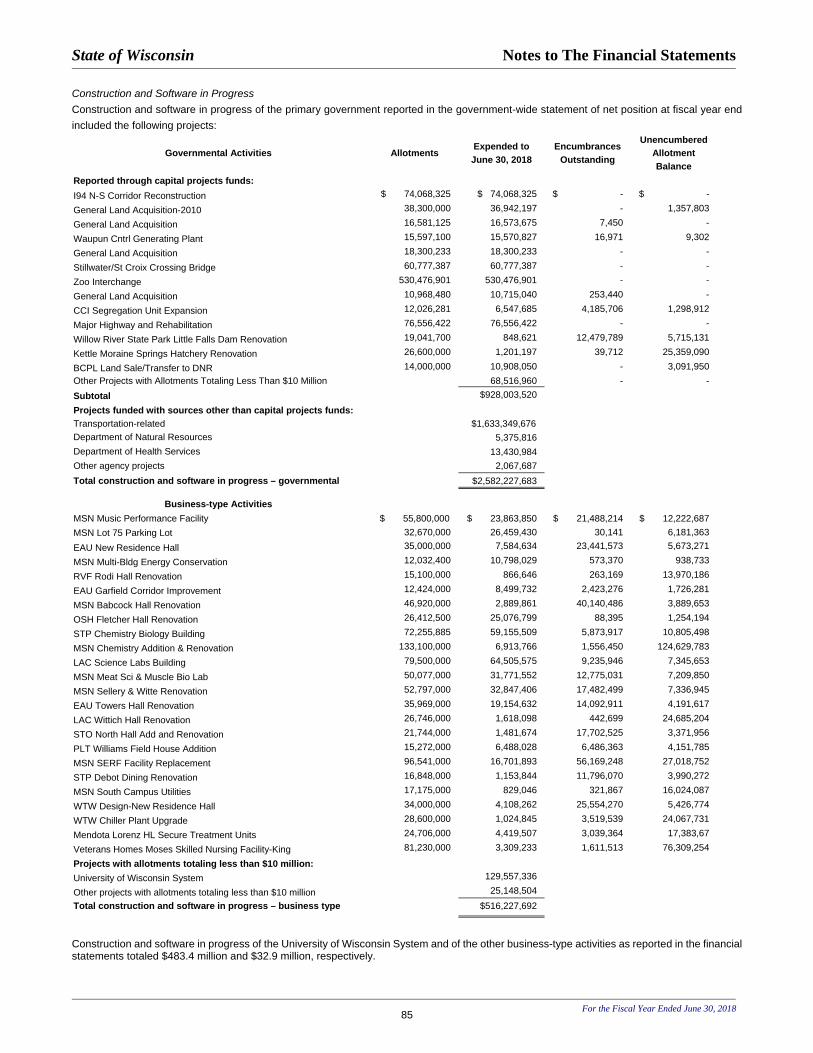
State of Wisconsin Notes to The Financial Statements
For the Fiscal Year Ended June 30, 2018
85
Construction and Software in Progress
Construction and software in progress of the primary government reported in the government-wide statement of net position at fiscal year end
included the following projects:
Construction and software in progress of the University of Wisconsin System and of the other business-type activities as reported in the financial statements totaled $483.4 million and $32.9 million, respectively.
Governmental Activities Allotments Expended to June 30, 2018
Encumbrances Outstanding
Unencumbered Allotment Balance
Reported through capital projects funds:
I94 N-S Corridor Reconstruction $ 74,068,325 $ 74,068,325 $ - $ -
General Land Acquisition-2010 38,300,000 36,942,197 - 1,357,803
General Land Acquisition 16,581,125 16,573,675 7,450 -
Waupun Cntrl Generating Plant 15,597,100 15,570,827 16,971 9,302
General Land Acquisition 18,300,233 18,300,233 - -
Stillwater/St Croix Crossing Bridge 60,777,387 60,777,387 - -
Zoo Interchange 530,476,901 530,476,901 - -
General Land Acquisition 10,968,480 10,715,040 253,440 -
CCI Segregation Unit Expansion 12,026,281 6,547,685 4,185,706 1,298,912
Major Highway and Rehabilitation 76,556,422 76,556,422 - -
Willow River State Park Little Falls Dam Renovation 19,041,700 848,621 12,479,789 5,715,131
Kettle Moraine Springs Hatchery Renovation 26,600,000 1,201,197 39,712 25,359,090
BCPL Land Sale/Transfer to DNR 14,000,000 10,908,050 - 3,091,950
Other Projects with Allotments Totaling Less Than $10 Million 68,516,960 - -
Subtotal $928,003,520
Projects funded with sources other than capital projects funds:
Transportation-related $1,633,349,676
Department of Natural Resources 5,375,816
Department of Health Services 13,430,984
Other agency projects 2,067,687
Total construction and software in progress – governmental $2,582,227,683
Business-type Activities
MSN Music Performance Facility $ 55,800,000 $ 23,863,850 $ 21,488,214 $ 12,222,687
MSN Lot 75 Parking Lot 32,670,000 26,459,430 30,141 6,181,363
EAU New Residence Hall 35,000,000 7,584,634 23,441,573 5,673,271
MSN Multi-Bldg Energy Conservation 12,032,400 10,798,029 573,370 938,733
RVF Rodi Hall Renovation 15,100,000 866,646 263,169 13,970,186
EAU Garfield Corridor Improvement 12,424,000 8,499,732 2,423,276 1,726,281
MSN Babcock Hall Renovation 46,920,000 2,889,861 40,140,486 3,889,653
OSH Fletcher Hall Renovation 26,412,500 25,076,799 88,395 1,254,194
STP Chemistry Biology Building 72,255,885 59,155,509 5,873,917 10,805,498
MSN Chemistry Addition & Renovation 133,100,000 6,913,766 1,556,450 124,629,783
LAC Science Labs Building 79,500,000 64,505,575 9,235,946 7,345,653
MSN Meat Sci & Muscle Bio Lab 50,077,000 31,771,552 12,775,031 7,209,850
MSN Sellery & Witte Renovation 52,797,000 32,847,406 17,482,499 7,336,945
EAU Towers Hall Renovation 35,969,000 19,154,632 14,092,911 4,191,617
LAC Wittich Hall Renovation 26,746,000 1,618,098 442,699 24,685,204
STO North Hall Add and Renovation 21,744,000 1,481,674 17,702,525 3,371,956
PLT Williams Field House Addition 15,272,000 6,488,028 6,486,363 4,151,785
MSN SERF Facility Replacement 96,541,000 16,701,893 56,169,248 27,018,752
STP Debot Dining Renovation 16,848,000 1,153,844 11,796,070 3,990,272
MSN South Campus Utilities 17,175,000 829,046 321,867 16,024,087
WTW Design-New Residence Hall 34,000,000 4,108,262 25,554,270 5,426,774
WTW Chiller Plant Upgrade 28,600,000 1,024,845 3,519,539 24,067,731
Mendota Lorenz HL Secure Treatment Units 24,706,000 4,419,507 3,039,364 17,383,67
Veterans Homes Moses Skilled Nursing Facility-King 81,230,000 3,309,233 1,611,513 76,309,254
Projects with allotments totaling less than $10 million:
University of Wisconsin System 129,557,336
Other projects with allotments totaling less than $10 million 25,148,504
Total construction and software in progress – business type $516,227,692

State of Wisconsin Notes to The Financial Statements
For the Fiscal Year Ended June 30, 2018
86
Beginning in Fiscal Year 2018, DOT capital projects are reported
as completed infrastructure when the project is 100 percent
complete. Prior to Fiscal Year 2018, DOT capital projects were
reported as completed infrastructure when the project was
estimated to be 80 percent complete. Construction in progress and
infrastructure are both reported as non-depreciable capital assets.
As a result, the impact on CAFR reporting is limited to the timing of
when assets move from the Nondepreciable Other account to the
Nondepreciable Infrastructure account in the Statement of Net
Position.
Beginning in Fiscal Year 2018, University of Wisconsin System
library holdings are reported as depreciable capital assets with
applicable depreciation expense reflected in the financial
statements. A prior period adjustment was made to reflect the
reduction in beginning equity for the University of Wisconsin
System fund related to the change.

State of Wisconsin Notes to The Financial Statements
For the Fiscal Year Ended June 30, 2018
87
NOTE 8. ENDOWMENTS Primary Government University of Wisconsin System Through March 2018, the University of Wisconsin System
invested its trust funds, principally gifts and bequests designated
as endowments or quasi-endowments, in two of its own
investment pools: the Long Term Fund and the Intermediate Term
Fund. Effective April 1, 2018, the University of Wisconsin System
transferred its investment management responsibilities to the
State of Wisconsin Investment Board (SWIB). As a result of this
transfer, the Intermediate Term Fund was eliminated as a
separate investment pool. Benefiting University of Wisconsin
System entities receive quarterly distributions from the Long Term
Fund, principally endowed assets, based on an annual spending
rate applied to a 12-quarter moving average market value of the
fund. The annual spending rate is currently 4.0 percent.
Distributions that occurred in 2018 from the Intermediate Term
Fund, principally quasi-endowments and unspent income
distributions, consisted of interest earnings distributed quarterly.
Spending rate and interest distributions from both of these funds
are transferred to the State Investment Fund, pending near-term
expenditures. At June 30, 2018, net appreciation of $141.9 million
was available to meet spending rate distributions, of which $16.7
million was actually authorized for expenditure.
For University of Wisconsin System-controlled, donor-restricted
endowments, the Uniform Prudent Management of Institutional
Funds Act as adopted, permits the Board of Regents of the
University of Wisconsin System to appropriate for current
spending, an amount of realized and unrealized endowment
appreciation as they determine to be prudent. Realized and
unrealized appreciation in excess of that amount appropriated for
current spending is retained by the endowments.
University of Wisconsin System investment policies and
guidelines are governed and authorized by the Board of Regents.
The approved asset allocation for the new SWIB-managed Long
Term Fund has a target to public markets of the following: 57.0
percent public equities, 20.0 percent fixed income, and 23.0
percent inflation sensitive securities. Private markets are not
included in the target asset allocation. The legacy private markets
investments will self-liquidate as distributions are made from
existing funds with no new commitments intended.
The fair value of Endowments as of June 30, 2018 was $419.6
million including an unrealized gain of $2.6 million when fair
values as of June 30, 2018 are compared to asset acquisition
costs.
The calculation of realized gains and losses is independent of a
calculation of the net change in the fair value of investments since
realized gains and losses are based on the difference between
the selling price and the acquisition cost of the asset. Therefore,
when assets are reported at fair value much of the realized gain
or loss may have already been included in prior years as part of
the overall change in the fair value of investments.
At June 30, 2018, the book value and fair value of principal funds
under control of the University of Wisconsin System was
(in millions):
Original Contributions and Distributed Net Gains $ 279.6
Realized Gains – Undistributed 137.4
Book Value 417.0
Unrealized Net Gains/Losses - Undistributed 2.6
Fair Value $ 419.6
On June 30, 2018, the portfolio at market, for the Long Term
Fund, contained 40.7 percent in global equities, 16.9 percent in
Treasury Inflation Protection Securities (TIPS), 16.7 percent in
investment grade government/credit, 5.2 percent in hedged non-
U.S. equities, 2.7 percent in real estate investment trusts, 2.3
percent in emerging markets equities, and 15.5 percent in private
markets. The total return on the Long Term Fund including
capital appreciation was 8.10 percent for the year. The total
return on the Intermediate find, including capital appreciation, was
1.2% for the nine months ending March 31, 2018, when the fund
was liquidated. As of April 2018, all funds are externally
managed, compared to 89.8% in fiscal year 2017.
For fiscal year 2017, $488.2 million of endowment investments
were reported. A large portion of the decline in the total value of
investments is due to the elimination and liquidation of the of the
former Intermediate Term Fund as of March 31, 2018. The
proceeds from the liquidation of these investments ($86.2 million)
were transferred to the SIF, holdings of which are not classified as
investments in the above table.

State of Wisconsin Notes to The Financial Statements
For the Fiscal Year Ended June 30, 2018
88
NOTE 9. INTERFUND RECEIVABLES, PAYABLES, AND TRANSFERS
Interfund balances as of or for the year ended June 30, 2018 consists of the following (in thousands):
A. Due from/to Other Funds: Due from Other Funds and the Due to Other Funds represent short-term interfund accounts receivable and payable. The balances in these
accounts at June 30, 2018 were as follows (in thousands):
Due to Other Funds:
Injured Environ-
Nonmajor Patients mental University of Unemploy-
Trans- Capital Govern- and Families Improve- Wisconsin ment Nonmajor Internal
General portation Improvement mental Compensation ment System Reserve Enterprise Service Fiduciary
Due from Other Funds:
General $ - $ 15,989 $ 2 $ 3,082 $ 69 $ 3,003 $ 37,804 $ 2,065 $ 1,573 $ 1,048 $ 69,431 $ 134,065
Transportation 41,164 - 3,620 31,995 - - - - - 119 - 76,897
Capital
Improvement - - - - - - - - 4,619 806 - 5,426
Nonmajor
Governmental 20,495 11,862 - 2,090 - 1,281 - 1 2,019 - - 37,748
Environmental
Improvement 37 - 6,834 64 - - - - - - - 6,935
University of
Wisconsin
System 16,465 799 65 2,265 - 48 - - 1 50 1 19,693
Unemployment
Reserve 248 - - - - - - - - - - 248
Nonmajor
Enterprise 5,105 - - - - - - - 1,221 - 12,816 19,142
Internal
Service 9,621 4,378 - 1,111 - - 1,120 - 286 25 248 16,788
Fiduciary 10,160 1,291 - 849 2 4 26,063 - 24,510 195 6,328 69,402
Total $ 103,295 $ 34,319 $ 10,520 $ 41,455 $ 71 $ 4,336 $ 64,987 $ 2,066 $ 34,228 $ 2,244 $ 88,823 $ 386,344
Total
The balances in the Due from Other Funds and Due to Other Funds accounts typically result from the time lag between the dates that
(1) interfund goods and services were provided and when the payments occurred, and
(2) interfund transfers were accrued and when the liquidations occurred.
Most of the State’s funds are presented on a fiscal year ended June 30. However, some funds are presented on a fiscal year ended
December 31. As a result, inconsistencies may occur in amounts reported as interfund receivables or payables between funds with different
fiscal year ends.

State of Wisconsin Notes to The Financial Statements
For the Fiscal Year Ended June 30, 2018
89
B. Interfund Receivables/Payables
Interfund Receivables/Payables represent short-term loans from
one fund to another to cover cash overdrafts. Interfund
receivables/payables at June 30, 2018 were as follows
(in thousands):
Interfund Receivable:
General
Injured
Patients
and Families
Compensation
Nonmajor
Enterprise
Fiduciary
Total
Interfund Payables:
Nonmajor
Governmental
$ 2,121
$ 50
$ -
$ -
$ 2,171
Nonmajor
Enterprise
25,266
25,266
Internal Service 47,346 - 47,346
Fiduciary - - 54 290,222 290,276
Total $74,732 $ 50 $ 54 $290,222 $365,058
C. Advances to/from Other Funds Advances to/from Other Funds represent long-term loans to one
fund from another fund. Advances at June 30, 2018 were as
follows (in thousands):
Advances from Other Funds (liability):
Nonmajor
General Governmental Total
Advances to Other Funds (asset)
Environmental
Improvement
$ -
$ 6,352
$ 6,352
Nonmajor
Enterprise
759
-
759
Total $ 759 $ 6,352 $ 7,111

State of Wisconsin Notes to The Financial Statements
For the Fiscal Year Ended June 30, 2018
90
D. Interfund Transfers Interfund Transfers in and out that occurred during Fiscal Year 2018 were as follows (in thousands):
Transfers In:
Gener
al
Transp
ortatio
n
Cap
ital
Impro
vem
ent
Non
majo
r
Gove
rnm
ental
Environm
enta
l
Impro
vem
ent
Uni
vers
ity o
f
Wis
cons
in
Syste
m
Non
majo
r
Enterp
rise
Inte
rnal
Serv
ice
Total
Transfers Out:
General -$ 43,435$ 83,411$ 700,037$ -$ 859,091$ 101,198$ 4,706$ 1,791,877$
Transportation 1,761 - 8,198 163,665 - - - - 173,623
Capital
Improvement - - - - 17,880 142,360 8,684 1,283 170,207
Nonmajor
Governmental 19,044 30,259 3,489 84,093 - 2,646 46 1,263 140,841
Injured Patients
and Families
Compensation - - - 14 - - - - 14
Environmental
Improvement - - - 8,011 - - - - 8,011
University of
Wisconsin
System 13,266 - 302 67,715 - - - - 81,283
Unemployment
Reserve 9 - - - - - - - 9
Nonmajor
Enterprise 23,390 - 7 8,597 - - 14,734 - 46,728
Internal Service 1,096 - 34 1,713 - 20 - 697 3,560
Fiduciary 5 - - 526 - - - - 531
Total 58,571$ 73,693$ 95,441$ 1,034,370$ 17,880$ 1,004,117$ 124,663$ 7,949$ 2,416,683$
Transfers are typically used to move: (1) revenues from the fund
that statute or budget requires to collect them to the fund that
statute or budget requires to expend them, (2) receipts restricted
to debt service from the funds collecting the receipts to the debt
service fund as debt service payments become due, (3)
unrestricted revenues collected in one fund to finance various
programs accounted for in other funds in accordance with statute
or budgetary authorizations, and (4) accumulated surpluses from
other funds to the General Fund when authorized by statute.
Most of the State’s funds are presented on a fiscal year ended June
30. However, some funds are presented on a fiscal year ended
December 31. As a result, inconsistencies may occur in amounts
reported as interfund transfers between funds with different fiscal
year ends. In addition, the transfer of capital assets between
governmental and enterprise funds will result in an inconsistency.
Nonroutine and Other Transfers Transfers considered non-routine or inconsistent with the fund
making the transfer included the following (in thousands):
Transfer out from the General Fund:
Funds Reporting the Transfer In Amount Transportation $ 42,965
Environmental 7,990
Local Government Property Insurance 5,200
Transfers in to the General Fund:
Funds Reporting the Transfer Out Amount University of Wisconsin System $ 3,809
Local Government Property Insurance 13,136
Transfers out from the Petroleum Inspection Fund:
Fund Reporting the Transfer In Amount
Transportation
$ 24,000

State of Wisconsin Notes to The Financial Statements
For the Fiscal Year Ended June 30, 2018
91
NOTE 10. CHANGES IN LONG-TERM LIABILITIES During the year ended June 30, 2018, the following changes occurred in long-term liabilities (in thousands): Primary Government
AmountsBalance Balance Due Within
Governmental Activities July 1, 2017 Additions Reductions June 30, 2018 One Year
Bonds and Long Term Notes Payable:
General Obligation Bonds & Notes for:
Governmental Funds $ 5,486,525 $ 1,203,948 $ 1,132,043 $ 5,558,430 $ 538,914
Internal Service Funds 184,758 172,877 25,325 332,311 16,455
Annual Appropriation Bonds 3,096,995 - 69,060 3,027,935 43,505
Revenue Bonds 2,075,650 368,595 323,705 2,120,540 180,212
775,014 327,949 233,311 869,652 -
Total Bonds and Long Term
Notes Payable 11,618,942 2,073,369 1,783,443 11,908,868 779,086
Other Liabilities:
Future Benefits and Loss Liability 112,920 40,976 43,559 110,336 42,165
Capital Leases 97,708 15,635 19,015 94,328 16,478
Compensated Absences 153,122 55,185 52,007 156,300 54,464
Net Pension Liability 107,399 - 107,399 - -
Other Postemployment Benefits 474,509 40,656 22,898 492,267 -
Claims, Judgments and Commitments 556 - 77 479 -
Pollution Remediation Obligations 7,982 - 2,257 5,725 225
Total Governmental Activities
Long-term Liabilities $ 12,573,138 $ 2,225,821 $ 2,030,656 $ 12,768,303 $ 892,417
Issuance Premiums and (Discounts)
Repayment of the general obligation bonds and notes is made from
the Bond Security and Redemption Fund. The amount presented
in this fund represents the liability to be paid from resources
accumulated to provide debt service payments in
Fiscal Year 2018. Repayment of the revenue bonds principal and
interest is made from the appropriate debt service fund with
payments secured by registration and inspection fees collected by
the appropriate program. Most of the compensated absences,
pension and other postemployment benefits liabilities are attributed
to the General, Transportation and Conservation funds. Long-term
liabilities for claims, judgments and commitments are generally
liquidated with resources of the governmental activities.

State of Wisconsin Notes to The Financial Statements
For the Fiscal Year Ended June 30, 2018
92
AmountsBalance Balance Due Within
Business-type Activities July 1, 2017 Additions Reductions June 30, 2018 One Year
Bonds Payable:
General Obligation Bonds $ 1,502,852 $ 259,150 $ 210,497 $ 1,551,505 $ 97,875
Revenue Bonds 328,435 - 90,550 237,885 84,080
151,195 49,819 40,048 160,966 -
Total Bonds Payable 1,982,482 308,968 341,095 1,950,355 181,955
Other Liabilities:
Future Benefits and Loss Liability 853,832 288,459 155,520 986,770 135,820
Capital Leases 31,061 932 708 31,285 1,408
Compensated Absences 152,111 74,089 72,910 153,290 75,363
Net Pension Liability 125,388 - 125,388 - -
Other Postemployment Benefits 592,753 37,103 37,344 592,512 -
Total Business-type Activities
Long-term Liabilities $ 3,737,626 $ 709,550 $ 732,965 $ 3,714,211 $ 394,546
Issuance Premiums and (Discounts)

State of Wisconsin Notes to The Financial Statements
For the Fiscal Year Ended June 30, 2018
93
NOTE 11. BONDS, NOTES AND OTHER DEBT OBLIGATIONS
The following schedule summarizes outstanding bonds and long-
term notes payable at June 30, 2018 (in millions):
Primary Government Governmental Activities:
General Obligation Bonds and Notes $ 6,478.1
Annual Appropriation Bonds 3,044.0
Revenue Bonds:
Transportation 2,330.8
Petroleum Inspection 56.1
Total Governmental Activities 11,908.9 Business-type Activities:
General Obligation Bonds and Notes:
University of Wisconsin System 1,618.7
Other Business-type 66.7
Revenue Bonds:
Environmental Improvement 265.0
Total Business-type Activities 1,950.4
Total Primary Government $ 13,859.2
A. General Obligation Bonds The State of Wisconsin Building Commission, an agency of the
State, is empowered by law to consider, act upon, authorize, issue
and sell all debt obligations of the State. To date, the Commission
has authorized and issued general obligation bonds and notes
primarily to provide funds for the acquisition or improvement of
land, water, property, highways, buildings, equipment or facilities
for public purposes. Occasionally, general obligation bonds are
also issued for the purpose of providing funds for veterans housing
loans and to refund general obligation bonds. All general obligation
bonds and notes authorized and issued by the State are secured
by a pledge of the full faith, credit and taxing power of the State of
Wisconsin and are customarily repaid over a period of twenty to
thirty years.
Article VIII of the Wisconsin Constitution and Wis. Stat.
Section 18.05 set limits on the amount of debt that the State can
contract in total and in any calendar year. In total, debt outstanding
cannot exceed five percent of the value of all taxable property in
the State. Annual debt issued cannot exceed the lesser of three-
quarters of one percent or five percent of the value of all taxable
property in the State less net indebtedness at January 1.
At June 30, 2018, $4.0 billion of general obligation bonds were
legislatively authorized but unissued.
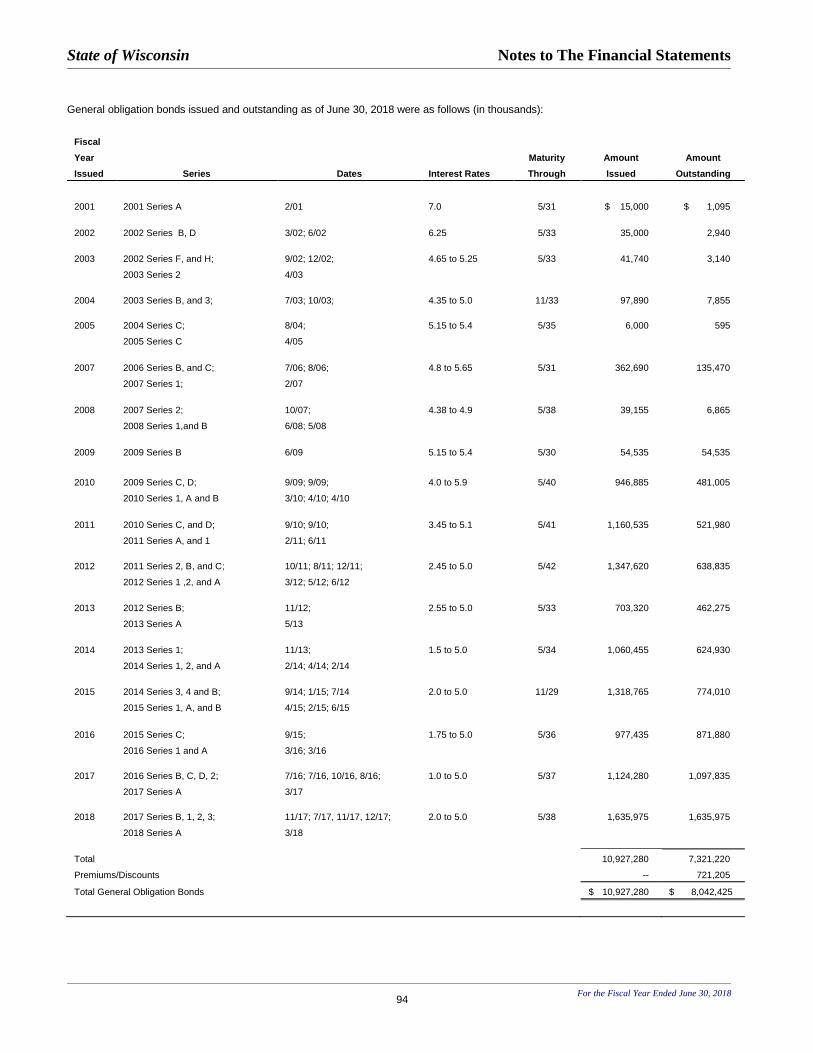
State of Wisconsin Notes to The Financial Statements
For the Fiscal Year Ended June 30, 2018
94
General obligation bonds issued and outstanding as of June 30, 2018 were as follows (in thousands):
Fiscal
Year Maturity Amount Amount Issued Series Dates Interest Rates Through Issued Outstanding
2001 2001 Series A 2/01 7.0 5/31 $ 15,000 $ 1,095
2002 2002 Series B, D 3/02; 6/02 6.25 5/33 35,000 2,940
2003 2002 Series F, and H; 9/02; 12/02; 4.65 to 5.25 5/33 41,740 3,140
2003 Series 2 4/03
2004 2003 Series B, and 3; 7/03; 10/03; 4.35 to 5.0 11/33 97,890 7,855
2005 2004 Series C; 8/04; 5.15 to 5.4 5/35 6,000 595
2005 Series C 4/05
2007 2006 Series B, and C; 7/06; 8/06; 4.8 to 5.65 5/31 362,690 135,470
2007 Series 1; 2/07
2008 2007 Series 2; 10/07; 4.38 to 4.9 5/38 39,155 6,865
2008 Series 1,and B 6/08; 5/08
2009 2009 Series B 6/09 5.15 to 5.4 5/30 54,535 54,535
2010 2009 Series C, D;
2010 Series 1, A and B
9/09; 9/09;
3/10; 4/10; 4/10
4.0 to 5.9 5/40 946,885 481,005
2011 2010 Series C, and D;
2011 Series A, and 1
9/10; 9/10;
2/11; 6/11
3.45 to 5.1 5/41 1,160,535 521,980
2012 2011 Series 2, B, and C;
2012 Series 1 ,2, and A
10/11; 8/11; 12/11;
3/12; 5/12; 6/12
2.45 to 5.0 5/42 1,347,620 638,835
2013 2012 Series B;
2013 Series A
11/12;
5/13
2.55 to 5.0 5/33 703,320 462,275
2014 2013 Series 1;
2014 Series 1, 2, and A
11/13;
2/14; 4/14; 2/14
1.5 to 5.0 5/34 1,060,455 624,930
2015 2014 Series 3, 4 and B; 9/14; 1/15; 7/14 2.0 to 5.0 11/29 1,318,765 774,010
2015 Series 1, A, and B 4/15; 2/15; 6/15
2016 2015 Series C; 9/15; 1.75 to 5.0 5/36 977,435 871,880
2016 Series 1 and A 3/16; 3/16
2017 2016 Series B, C, D, 2; 7/16; 7/16, 10/16, 8/16; 1.0 to 5.0 5/37 1,124,280 1,097,835
2017 Series A 3/17
2018 2017 Series B, 1, 2, 3; 11/17; 7/17, 11/17, 12/17; 2.0 to 5.0 5/38 1,635,975 1,635,975
2018 Series A 3/18
Total 10,927,280 7,321,220
Premiums/Discounts -- 721,205
Total General Obligation Bonds $ 10,927,280 $ 8,042,425

State of Wisconsin Notes to The Financial Statements
For the Fiscal Year Ended June 30, 2018
95
As of June 30, 2018, general obligation bond debt service requirements for principal and interest for governmental activities and business -type
activities are as follows (in thousands):
Fiscal Year Governmental Activities Business-Type Activities Ended June 30 Principal Interest Principal Interest
2019 $ 416,438 $ 267,626 $ 69,357 $ 70,277
2020 427,327 247,908 73,263 66,568
2021 418,101 233,174 73,059 65,109
2022 415,270 211,254 77,260 61,316
2023 439,375 190,574 88,835 57,514
2024-2028 1,859,549 670,969 528,301 216,269
2029-2033 1,248,658 289,909 443,852 100,429
2034-2038 561,412 69,506 137,198 28,036
2039-2042 -- -- 43,965 4,379
Total 5,786,130 2,180,920 1,535,090 669,898
Premiums/Discounts 587,313 133,892
Total $ 6,373,443 $ 2,180,920 $ 1,668,982 $ 669,898
Qualified Build America Bonds
The State has issued four series of general obligation bonds, in the
aggregate amount of $769.2 million, that are “qualified Build
America Bonds” pursuant to Section 54AA of the Internal Revenue
Code of 1986, as amended (Code). Based on the credit allowed
for “qualified Build America Bonds”, the State has elected to
receive from the United States Treasury on each payment date a
direct payment in the amount of 35 percent of the interest payable
by the State with respect to such date, and the credit will not be
allowed to the taxpayers holding the bonds.
With respect to the direct payments the State expects to receive,
since such payments are not program Income and not pledged to
the payment on the Bonds, there is no direct impact on the Bonds
with these direct payments being subject to the mandated across-
the-board cuts to the Federal budget for the federal fiscal year that
started October 1, 2017 and ends September 30, 2018. The
impact of these cuts for the current federal fiscal year is a 6.6%
reduction in the direct payment amount that the State expected to
receive.
• The interest rates on the 2009 Series B bonds, in the amount
of $54.5 million, range from 5.15 percent to 5.40 percent
payable semiannually on May 1 and November 1 beginning
with the first interest payment date of November 1, 2009.
These bonds are callable at par on May 1, 2019 or any date
thereafter. The bonds mature beginning May 1, 2023 through
2030.
• The interest rates on the 2009 Series D bonds, in the amount
of $225.8 million, range from 4.9 percent to 5.9 percent
payable semiannually on May 1 and November 1 beginning
with the first interest payment date of May 1, 2010. These
bonds are callable at par on May 1, 2020 or any date
thereafter. The bonds mature beginning May 1, 2023 through
2040.
• The interest rates on the 2010 Series B bonds, in the amount
of $179.1 million, range from 4.3 percent to 5.65 percent
payable semiannually on May 1 and November 1 beginning
with the first interest payment date of November 1, 2010.
These bonds are callable at par on May 1, 2020 or any date
thereafter. The bonds mature beginning May 1, 2020 through
2030.
• The interest rates on the 2010 Series D bonds, in the amount
of $309.7 million, range from 3.45 percent to 5.1 percent
payable semiannually on May 1 and November 1 beginning
with the first interest payment date of May 1, 2011. These
bonds are callable at par on May 1, 2021 or any date
thereafter. The bonds mature beginning May 1, 2020 through
2041.
In November 2017, the State issued General Obligation Refunding
Bonds (2017 Series 2), which included a crossover refunding of
certain outstanding general obligation bonds that are “qualified
Build America Bonds”. A portion of the proceeds of the bonds were
deposited in escrow to provide for future interest payments on the
2017 Series 2 bonds until the crossover dates (May 1, 2019 and
May 1, 2020), at which time the escrow resources to retire
$46.5 million of 2009 Series B bonds, $128.2 million of 2009 Series
D Bonds, and $119.1 million of 2010 Series B Bonds. Until the
respective crossover dates, the refunded bonds are not considered
defeased, and both the 2017 Series 2 Bonds and refunded bonds
are reported as liabilities of the State.
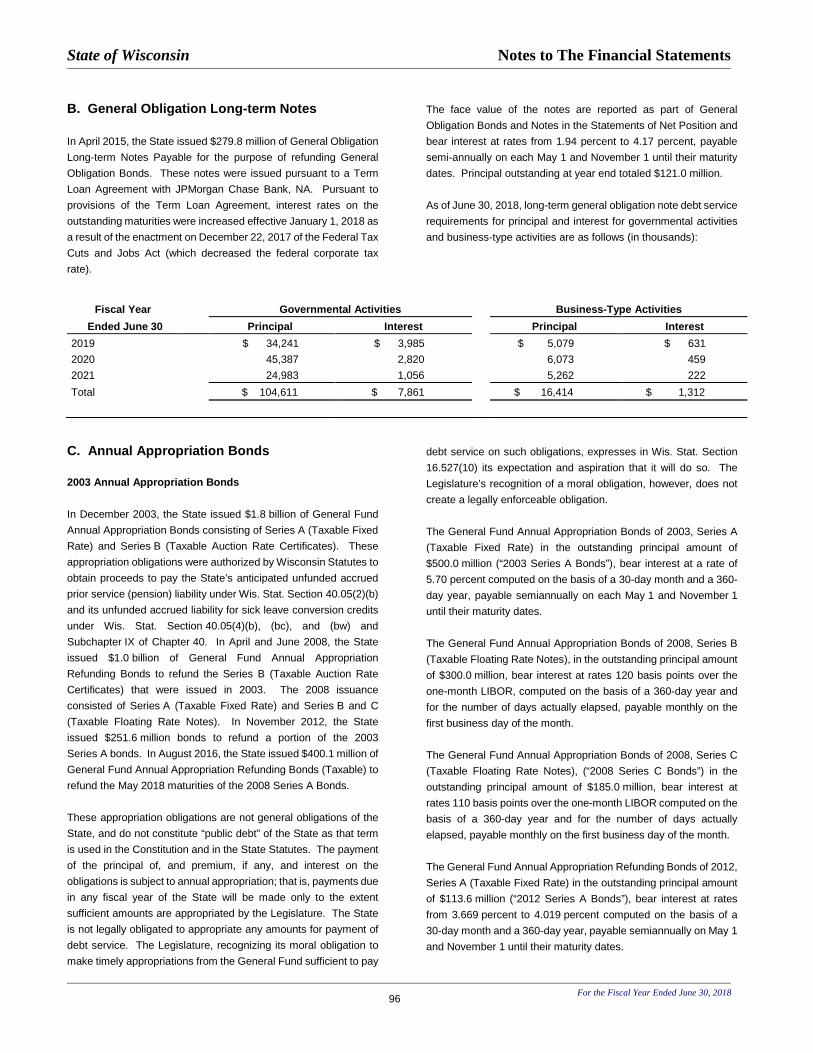
State of Wisconsin Notes to The Financial Statements
For the Fiscal Year Ended June 30, 2018
96
B. General Obligation Long-term Notes
In April 2015, the State issued $279.8 million of General Obligation
Long-term Notes Payable for the purpose of refunding General
Obligation Bonds. These notes were issued pursuant to a Term
Loan Agreement with JPMorgan Chase Bank, NA. Pursuant to
provisions of the Term Loan Agreement, interest rates on the
outstanding maturities were increased effective January 1, 2018 as
a result of the enactment on December 22, 2017 of the Federal Tax
Cuts and Jobs Act (which decreased the federal corporate tax
rate).
The face value of the notes are reported as part of General
Obligation Bonds and Notes in the Statements of Net Position and
bear interest at rates from 1.94 percent to 4.17 percent, payable
semi-annually on each May 1 and November 1 until their maturity
dates. Principal outstanding at year end totaled $121.0 million.
As of June 30, 2018, long-term general obligation note debt service
requirements for principal and interest for governmental activities
and business-type activities are as follows (in thousands):
Fiscal Year Governmental Activities Business-Type Activities Ended June 30 Principal Interest Principal Interest
2019 $ 34,241 $ 3,985 $ 5,079 $ 631
2020 45,387 2,820 6,073 459
2021 24,983 1,056 5,262 222
Total $ 104,611 $ 7,861 $ 16,414 $ 1,312
C. Annual Appropriation Bonds 2003 Annual Appropriation Bonds
In December 2003, the State issued $1.8 billion of General Fund
Annual Appropriation Bonds consisting of Series A (Taxable Fixed
Rate) and Series B (Taxable Auction Rate Certificates). These
appropriation obligations were authorized by Wisconsin Statutes to
obtain proceeds to pay the State’s anticipated unfunded accrued
prior service (pension) liability under Wis. Stat. Section 40.05(2)(b)
and its unfunded accrued liability for sick leave conversion credits
under Wis. Stat. Section 40.05(4)(b), (bc), and (bw) and
Subchapter IX of Chapter 40. In April and June 2008, the State
issued $1.0 billion of General Fund Annual Appropriation
Refunding Bonds to refund the Series B (Taxable Auction Rate
Certificates) that were issued in 2003. The 2008 issuance
consisted of Series A (Taxable Fixed Rate) and Series B and C
(Taxable Floating Rate Notes). In November 2012, the State
issued $251.6 million bonds to refund a portion of the 2003
Series A bonds. In August 2016, the State issued $400.1 million of
General Fund Annual Appropriation Refunding Bonds (Taxable) to
refund the May 2018 maturities of the 2008 Series A Bonds.
These appropriation obligations are not general obligations of the
State, and do not constitute “public debt” of the State as that term
is used in the Constitution and in the State Statutes. The payment
of the principal of, and premium, if any, and interest on the
obligations is subject to annual appropriation; that is, payments due
in any fiscal year of the State will be made only to the extent
sufficient amounts are appropriated by the Legislature. The State
is not legally obligated to appropriate any amounts for payment of
debt service. The Legislature, recognizing its moral obligation to
make timely appropriations from the General Fund sufficient to pay
debt service on such obligations, expresses in Wis. Stat. Section
16.527(10) its expectation and aspiration that it will do so. The
Legislature’s recognition of a moral obligation, however, does not
create a legally enforceable obligation.
The General Fund Annual Appropriation Bonds of 2003, Series A
(Taxable Fixed Rate) in the outstanding principal amount of
$500.0 million (“2003 Series A Bonds”), bear interest at a rate of
5.70 percent computed on the basis of a 30-day month and a 360-
day year, payable semiannually on each May 1 and November 1
until their maturity dates.
The General Fund Annual Appropriation Bonds of 2008, Series B
(Taxable Floating Rate Notes), in the outstanding principal amount
of $300.0 million, bear interest at rates 120 basis points over the
one-month LIBOR, computed on the basis of a 360-day year and
for the number of days actually elapsed, payable monthly on the
first business day of the month.
The General Fund Annual Appropriation Bonds of 2008, Series C
(Taxable Floating Rate Notes), (“2008 Series C Bonds”) in the
outstanding principal amount of $185.0 million, bear interest at
rates 110 basis points over the one-month LIBOR computed on the
basis of a 360-day year and for the number of days actually
elapsed, payable monthly on the first business day of the month.
The General Fund Annual Appropriation Refunding Bonds of 2012,
Series A (Taxable Fixed Rate) in the outstanding principal amount
of $113.6 million (“2012 Series A Bonds”), bear interest at rates
from 3.669 percent to 4.019 percent computed on the basis of a
30-day month and a 360-day year, payable semiannually on May 1
and November 1 until their maturity dates.
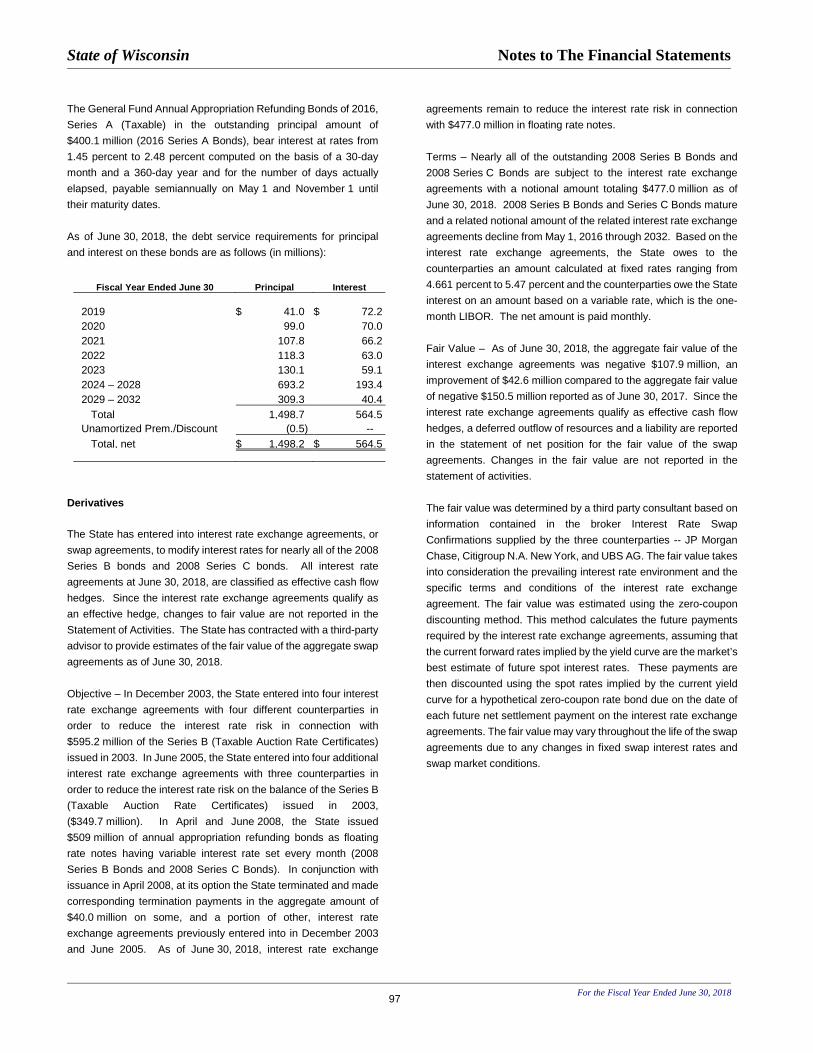
State of Wisconsin Notes to The Financial Statements
For the Fiscal Year Ended June 30, 2018
97
The General Fund Annual Appropriation Refunding Bonds of 2016,
Series A (Taxable) in the outstanding principal amount of
$400.1 million (2016 Series A Bonds), bear interest at rates from
1.45 percent to 2.48 percent computed on the basis of a 30-day
month and a 360-day year and for the number of days actually
elapsed, payable semiannually on May 1 and November 1 until
their maturity dates.
As of June 30, 2018, the debt service requirements for principal
and interest on these bonds are as follows (in millions):
Fiscal Year Ended June 30 Principal Interest
2019 $ 41.0 $ 72.2
2020 99.0 70.0
2021 107.8 66.2
2022 118.3 63.0
2023 130.1 59.1
2024 – 2028 693.2 193.4
2029 – 2032 309.3 40.4
Total 1,498.7 564.5
Unamortized Prem./Discount
(0.5) --
Total, net $ 1,498.2 $ 564.5
Derivatives The State has entered into interest rate exchange agreements, or
swap agreements, to modify interest rates for nearly all of the 2008
Series B bonds and 2008 Series C bonds. All interest rate
agreements at June 30, 2018, are classified as effective cash flow
hedges. Since the interest rate exchange agreements qualify as
an effective hedge, changes to fair value are not reported in the
Statement of Activities. The State has contracted with a third-party
advisor to provide estimates of the fair value of the aggregate swap
agreements as of June 30, 2018.
Objective – In December 2003, the State entered into four interest
rate exchange agreements with four different counterparties in
order to reduce the interest rate risk in connection with
$595.2 million of the Series B (Taxable Auction Rate Certificates)
issued in 2003. In June 2005, the State entered into four additional
interest rate exchange agreements with three counterparties in
order to reduce the interest rate risk on the balance of the Series B
(Taxable Auction Rate Certificates) issued in 2003,
($349.7 million). In April and June 2008, the State issued
$509 million of annual appropriation refunding bonds as floating
rate notes having variable interest rate set every month (2008
Series B Bonds and 2008 Series C Bonds). In conjunction with
issuance in April 2008, at its option the State terminated and made
corresponding termination payments in the aggregate amount of
$40.0 million on some, and a portion of other, interest rate
exchange agreements previously entered into in December 2003
and June 2005. As of June 30, 2018, interest rate exchange
agreements remain to reduce the interest rate risk in connection
with $477.0 million in floating rate notes.
Terms – Nearly all of the outstanding 2008 Series B Bonds and
2008 Series C Bonds are subject to the interest rate exchange
agreements with a notional amount totaling $477.0 million as of
June 30, 2018. 2008 Series B Bonds and Series C Bonds mature
and a related notional amount of the related interest rate exchange
agreements decline from May 1, 2016 through 2032. Based on the
interest rate exchange agreements, the State owes to the
counterparties an amount calculated at fixed rates ranging from
4.661 percent to 5.47 percent and the counterparties owe the State
interest on an amount based on a variable rate, which is the one-
month LIBOR. The net amount is paid monthly.
Fair Value – As of June 30, 2018, the aggregate fair value of the
interest exchange agreements was negative $107.9 million, an
improvement of $42.6 million compared to the aggregate fair value
of negative $150.5 million reported as of June 30, 2017. Since the
interest rate exchange agreements qualify as effective cash flow
hedges, a deferred outflow of resources and a liability are reported
in the statement of net position for the fair value of the swap
agreements. Changes in the fair value are not reported in the
statement of activities.
The fair value was determined by a third party consultant based on
information contained in the broker Interest Rate Swap
Confirmations supplied by the three counterparties -- JP Morgan
Chase, Citigroup N.A. New York, and UBS AG. The fair value takes
into consideration the prevailing interest rate environment and the
specific terms and conditions of the interest rate exchange
agreement. The fair value was estimated using the zero-coupon
discounting method. This method calculates the future payments
required by the interest rate exchange agreements, assuming that
the current forward rates implied by the yield curve are the market’s
best estimate of future spot interest rates. These payments are
then discounted using the spot rates implied by the current yield
curve for a hypothetical zero-coupon rate bond due on the date of
each future net settlement payment on the interest rate exchange
agreements. The fair value may vary throughout the life of the swap
agreements due to any changes in fixed swap interest rates and
swap market conditions.

State of Wisconsin Notes to The Financial Statements
For the Fiscal Year Ended June 30, 2018
98
Associated Debt – Using rates as of June 30, 2018, debt service
requirements are presented for the 2008 Series B Bonds and 2008
Series C Bonds that are subject to the interest rate exchange
agreements and the net swap payments assuming that interest
rates remain the same for their term. As rates vary, interest
payments on the floating rate notes and net swap payments will
vary. (in millions)
Fiscal Year Interest Ended Rate
June 30 Principal Interest Swaps, Net Totals
2019 $ 1.1 $ 15.7 $ 15.6 $ 32.4
2020 1.1 15.7 15.5 32.3
2021 8.5 15.6 15.4
39.6
2022 10.1 15.3 15.2
40.7
2023 10.1 15.0 15.0
40.1
2024 – 2028 211.1 64.3 64.7 340.0
2029 – 2032 235.0 17.1 17.3 269.4
$ 477.0 $ 158.8 $ 158.7 $ 794.5
Interest Rate Risk – Currently, the State does not have interest rate
risk because it is paying a fixed-rate of interest on the interest rate
exchange agreements. However, if for some unforeseen reason
any of the swap agreements are terminated prior to maturity; the
State will have interest rate risk associated with the outstanding
2008 Series B Bonds and 2008 Series C Bonds until their maturity.
Credit Risk – As of June 30, 2018, the State was exposed to only
a minimal amount of credit risk, as the fair values of all of the four
interest rate exchange agreements were negative. Should rates
change, the State could have increased exposure in the future.
The State has entered into four interest rate agreements with three
different counterparties. The lowest rating assigned to these
counterparties is, as of June 30, 2018, A1 by Moody’s, A+ by
Standard & Poor’s, and A+ by Fitch Ratings. Under the interest
rate exchange agreements and to mitigate the potential for credit
risk, if any of the counterparties’ credit quality falls below A2 by
Moody’s Investors Service or A- by either Standard & Poor’s or
Fitch Ratings, the fair value of the interest rate exchange
agreement for that respective counterparty will be fully
collateralized by that counterparty. In addition, an event of
termination occurs if any of the counterparties’ credit quality falls
below Baa2 by Moody’s Investors service or BBB by either
Standard & Poor’s or Fitch Ratings.
Basis Risk – The interest rate exchange agreements expose the
State to basis risk (i.e., a shortfall or surplus between the variable
interest rate received on the interest rate exchange agreements
and the interest rate paid on the floating rate notes), however this
risk is fixed at the spreads for the respective series.
Termination Risk – The interest rate exchange agreements may be
terminated by the State, upon two business days’ written notice,
designating to the counterparty the termination date. In addition,
the State or the counterparties may terminate the interest rate
exchange agreements if the other party fails to perform under the
terms of the interest rate exchange agreements or if other various
events occur. As of June 30, 2018, there have not been any such
events. If any interest rate exchange agreement is terminated, the
State would be unhedged and exposed to additional interest rate
risk on the 2008 Series B Bonds and the 2008 Series C Bonds. In
addition, if the interest rate exchange agreement has a negative
fair value at the time of termination, the State would incur a loss
and would be required to make a settlement payment to the related
counterparty. Actual termination payments, if required to be made,
can be made, at the State's discretion, from the Stabilization Fund,
or delayed until funds are available in the Subordinated Payment
Obligations Fund or until the next biennium when appropriations
can be made in the biennial budget for the termination payments.
Market-Access Risk and Rollover Risk – The State’s swap
agreements are for the term (maturity) of the 2008 Series B Bonds
and the 2008 Series C Bonds and, therefore, there is no market-
access risk or rollover risk.
Foreign Currency Risk – The State’s swap agreements are not
subject to foreign currency risk. 2009 Annual Appropriation Bonds
In April 2009, the State issued $1.5 billion of General Fund Annual
Appropriation Bonds. These appropriation obligations were
authorized by Wisconsin Statutes for the purpose of purchasing the
tobacco settlement revenues that had been sold by the Secretary
of Administration to the Badger Tobacco Asset Securitization
Corporation pursuant to Wis. Stat. Section 16.63. In August 2016,
January 2017, and May 2017, the State issued an aggregate $1.1
billion of General Fund Annual Appropriation Refunding Bonds
(Taxable and Tax Exempt) to refund a portion of the appropriation
obligations issued in 2009.
The 2009 General Fund Annual Appropriation Bonds bear interest
rates from 4.60 percent to 6.25 percent computed on the basis of
a 30-day month and a 360-day year, payable semiannually on each
May 1 and November 1, until their maturity dates.
The 2016 Series B (Taxable) General Fund Annual Appropriation
Bonds bear interest rates from 1.45 percent to 3.29 percent
computed on the basis of a 30-day month and a 360-day year,
payable semiannually on each May 1 and November 1, until their
maturity dates.
The 2017 Series A Taxable General Fund Annual Appropriation
Bonds bear interest rates from 1.87 percent to 3.95 percent
computed on the basis of a 30-day month and a 360-day year,

State of Wisconsin Notes to The Financial Statements
For the Fiscal Year Ended June 30, 2018
99
payable semiannually on each May 1 and November 1, until their
maturity dates.
The 2017 Series B General Fund Annual Appropriation Bonds bear
interest rates from 4.00 percent to 5.00 percent computed on the
basis of a 30-day month and a 360-day year, payable semiannually
on each May 1 and November 1, until their maturity dates.
The 2017 Series C (Taxable) General Fund Annual Appropriation
Bonds bear interest rates from 1.52 percent to 3.15 percent
computed on the basis of a 30-day month and a 360-day year,
payable semiannually on each May 1 and November 1, until their
maturity dates.
These appropriation obligations are not general obligations of the
State, and do not constitute “public debt” of the State as that term
is used in the Constitution and in the State Statutes. The payment
of the principal of, and premium, if any, and interest on the
obligations is subject to annual appropriation; that is, payments due
in any fiscal year of the State will be made only to the extent
sufficient amounts are appropriated by the Legislature. The State
is not legally obligated to appropriate any amounts for payment of
debt service. The Legislature, recognizing its moral obligation to
make timely appropriations from the General Fund sufficient to pay
debt service on such obligations, expresses in Wis. Stat. Section
16.527(10) its expectation and aspiration that it will do so. The
Legislature’s recognition of a moral obligation, however, does not
create a legally enforceable obligation.
As of June 30, 2018, the debt service requirements for principal
and interest on these bonds are as follows (in millions):
Fiscal Year Ended June 30 Principal Interest
2019 $ 2.5 $ 62.2
2020 36.9 62.2
2021 40.3 60.6
2022 40.9 58.8
2023 44.6 57.0
2024 – 2028 663.3 235.1
2029 – 2033 139.2 122.2
2034 – 2037 561.6 53.3
Total 1,529.2 711.5
Unamortized Premium/Discount 16.6
Total, net $ 1,545.8 $ 711.5
D. Revenue Bonds Chapter 18, Wisconsin Statutes, authorizes the State to issue
revenue obligations secured by a pledge of revenues or property
derived from the operation of a program funded by the issuance
of these obligations. The resulting bond obligations are not general
obligations of the State.
Transportation Revenue Bonds
Transportation Revenue Bonds are issued to finance part of the
costs of certain transportation facilities and major highway projects.
Chapter 18, Subchapter II of the Wisconsin Statutes as amended,
Wis. Stat. Sec. 84.59 and a general bond resolution and series
resolutions authorize the issuance of these bonds.
The Department of Transportation is authorized to issue a total of
$4.1 billion of revenue bonds. Presently, there are fourteen issues
of Transportation Revenue Bonds outstanding totaling $2.1 billion.
Debt service payments are secured by driver and vehicle
registration fees and the program resolution provides for a reserve
fund, which if funded, will be used in the event that a deficiency
exists in the redemption fund.
The Transportation Revenue Bonds issued and outstanding as of
June 30, 2018 were as follows (in thousands):
Issue Issue Date
Interest Rates
Maturity Through Issued Outstanding
2017 2 12/17 5.0 7/32 $ 368,595 $ 368,595
2017 1 5/17 5.0 7/37 284,520 284,520
2015 A 12/15 3.0 to 5.0 7/36 225,000 222,520
2015 1 4/15 5.0 7/29 207,240 166,430
2014 2 12/14 5.0 7/27 94,130 94,130
2014 1 4/14 4.5 to 5.0 7/34 339,745 79,065
2013 1 3/13 4.0 to 5.0 7/33 259,680 169,515
2012 2 6/12 4.0 to 5.0 7/24 116,400 105,065
2012 1 4/12 3.5 to 5.0 7/32 343,725 150,435
2010 B 12/10 4.7 to 6.0 7/31 123,925 123,925
2010 A 12/10 5.0 7/21 76,075 8,935
2009 B 10/09 4.44 to 5.84 7/30 147,130 127,245
2007 1 3/07 5.0 7/22 206,900 136,455
2005 A 3/05 5.0 7/21 235,585 28,575
3,028,650 2,065,410
Unamortized Premium / Discount -- 265,354
Total $ 3,028,650 $ 2,330,764
Petroleum Inspection Fee Revenue Bonds
Petroleum Inspection Fee (PIF) Revenue Bonds are issued to
finance claims made under the Petroleum Environmental Cleanup
Fund Award (PECFA) Program for reimbursement of cleanup costs
to soil and groundwater contamination. The program reimburses
owners for 75 percent to 99 percent of cleanup costs associated
with soil and groundwater contamination. As of June 30, 2018, PIF
Bonds outstanding are $55.1 million. Debt service payments are
secured by petroleum inspection fees.
State of Wisconsin Notes to The Financial Statements
For the Fiscal Year Ended June 30, 2018
100
The PIF revenue bonds issued and outstanding as of
June 30, 2018 were as follows (in thousands):
Issue Issue Date
Interest Rate
Maturity Through Issued Outstanding
2016-1 10/16 4.0 to 5.0 7/19 $ 62,445 $ 55,130
Unamortized Premium / Discount 941
Total $ 56,071
Environmental Improvement Fund Revenue Bonds
The Environmental Improvement Fund (the Fund) provides loans
and grants to local municipalities to finance wastewater treatment
planning and construction. The Fund is authorized to issue Clean
Water Revenue Bonds and Environmental Improvement Fund
Revenue Bonds up to an amount of $2.5 billion in total.
Environmental Improvement Fund revenue bonds are payable only
from revenues derived from 1) pledged loan amounts, 2) amounts
in the Loan Fund, Reserve Fund (if any), and 3) all other pledged
receipts.
The Environmental Improvement Fund has pledged future loan
revenues, net of specified operating expenses, to repay
outstanding revenue bonds. Proceeds from the bonds provided
financing for loans to municipalities to construct or improve water
and wastewater projects.
At June 30, 2018, there were two issues of Environmental
Improvement Fund Revenue Bonds outstanding totaling
$237.9 million.
Bonds issued and outstanding for the Environmental Improvement
Fund as of June 30, 2018 were as follows (in thousands):
Issue IssueDate
Interest Rates
MaturityThrough Issued Outstanding
2017-A 6/17 3.0 to 5.0 6/35 218,705 202,415
2015-A 12/15 3.0 to 5.0 6/30 43,380 35,470
262,085 237,885
Unamortized Premium / Discount -- 27,074
Total $ 262,085 $ 264,959
As of June 30, 2018, revenue bond debt service requirements for principal and interest for governmental activities and business-type activities
are as follows (in thousands):
Governmental Activities Business-Type Activities Transportation Petroleum Inspection Fee Environmental Improvement
Fiscal Year Revenue Bonds Revenue Bonds Fund Revenue Bonds Ended June 30 Principal Interest Principal Interest Principal Interest
2019 $ 103,235 $ 90,204 $ 27,935 $ 1,647 $ 84,080 $ 11,894
2020 227,150 87,124 27,195 544 9,375 7,690
2021 246,730 86,309 -- -- 8,790 7,222
2022 133,820 82,334 -- -- 9,230 6,782
2023 133,385 75,024 -- -- 9,690 6,320
2024-2028 562,620 271,342 50,365 24,300
2029-2033 468,455 109,895 66,355 12,834
2034-2038 190,015 16,649 -- --
2039 -- --
Total 2,065,410 818,881 55,130 2,191 237,885 77,042
Unamortized Premium / Discount 265,354 -- 941 -- 27,074 --
Total $ 2,330,764 $ 818,881 $ 56,071 $ 2,191 $ 264,959 $ 77,042
Qualified Build America Bonds
The State has issued three series of revenue bonds, in the
aggregate amount of $320.8 million, that are “qualified Build
America Bonds” pursuant to Section 54AA of the Internal Revenue
Code of 1986, as amended (Code). Based on the credit allowed for
“qualified Build America Bonds”, the State has elected to receive
from the United States Treasury on each payment date a direct
payment in the amount of 35 percent of the interest payable by the
State with respect to such date, and the credit will not be allowed to
the taxpayers holding the bonds.
With respect to the direct payments the State expects to receive,
since such payments are not Program Income and not pledged to
State of Wisconsin Notes to The Financial Statements
For the Fiscal Year Ended June 30, 2018
101
the payment on the Bonds, there is no direct impact on the Bonds
with these direct payments being subject to the mandated across-
the-board cuts to the Federal budget for the federal fiscal year that
started October 1, 2017 and ends September 30, 2018. The impact
of these cuts for the current federal fiscal year is a 6.6% reduction
in the direct payment amount that the State expected to receive.
The interest rates on the 2009 Series B (taxable) Transportation
Revenue Bonds in the amount of $127.2 million range from
4.44 percent to 5.84 percent payable semiannually on January 1
and July 1 beginning with the first interest payment date of
July 1, 2010. These bonds are callable at par on July 1, 2019 or
any date thereafter. The bonds mature beginning July 1, 2015
through 2030.
The interest rates on the 2010 Series B (taxable) Transportation
Revenue Bonds in the amount of $123.9 million range from
4.7 percent to 6.0 percent payable semiannually on January 1 and
July 1 beginning with the first interest payment date of July 1, 2011.
These bonds are callable at par on July 1, 2020 or any date
thereafter. The bonds mature beginning July 1, 2022 through 2031.
In December 2017, the State issued Transportation Revenue
Refunding Bonds (2017 Series 2), which included a crossover
refunding of certain outstanding transportation revenue bonds that
are “qualified Build America Bonds”. A portion of the proceeds of
the bonds were deposited in an escrow to provide for future interest
payments on the 2017 Series 2 bonds until the crossover dates
(July 1, 2019 and July 1, 2020), at which time the escrow has
resources to retire $112.6 million of 2009 Series B bonds and
$123.9 million of 2010 Series B bonds. Until the respective
crossover dates, the refunded bonds are not considered to be
defeased, and both the 2017 Series 2 bonds and refunded bonds
are reported as liabilities of the State.
E. Refundings, Exchanges and Early Extinguishments
Refunding Provisions of GASB Statement No. 23
The State implemented the provisions of GASB Statement No. 23.
Accounting and Financial Reporting for Refunding of Debt Reported by Proprietary Activities beginning with Fiscal Year 1996. This
Statement requires proprietary activities to adopt certain accounting
and reporting changes for both current refunding and advance
refunding resulting in defeasance of debt. GASB Statement No. 23
permits, but does not require, retroactive application of its
provisions. The State has chosen not to apply the provisions
retroactively to previously issued financial statements.
Current Fiscal Year Refundings/General Obligation Bonds
In July 2017, the State issued $345.3 million of general obligation
refunding bonds (2017 Series 1), the proceeds of $422.4 million
were deposited in an escrow account to provide for future debt
service payments and redemption of $374.9 million of various
general obligation bonds outstanding at the time of the refunding.
As a result of the advance refunding, the $374.9 million of various
general obligation bonds for which future debt service payments
and redemption are paid from the escrow account are considered
defeased and the associated liability removed from the financial
statements. The refunding resulted in a decrease in total debt
service payments by $34.9 million and an economic gain of
$25.0 million.
In December 2017, the State issued $382.7 million of General
Obligation Refunding Bonds (2017 Series 2), which was a
combination advance refunding and crossover refunding. The
proceeds of 462.6 million were deposited in an escrow account to
provide for (i) future debt service and redemption of $135.7 million
of various general obligation bonds outstanding at the time of the
refunding, resulting in the $135.7 million of various general
obligation bonds being considered defeased and the associated
liability removed from the financial statements, and (ii) future
interest payments on the 2017 Series 2 bonds until the crossover
dates (May 1, 2019 and May 1, 2020), at which time the escrow has
resources to retire $293.9 million of various general obligation
bonds that are NOT considered to be defeased until the respective
crossover refunding date, with both the 2017 Series 2 bonds and
crossover refunded bonds reported as liabilities of the State until
such date. The refunding resulted in a decrease in total debt
service payments by $32.1 million and an economic gain of
$27.9 million.
In December 2017, the State issued $347.0 million of general
obligation refunding bonds (2017 Series 3), the proceeds of
$416.7 million were deposited in an escrow account to provide for
future debt service payments and redemption of $365.9 million of
various general obligation bonds outstanding at the time of the
refunding. As a result of the advance refunding, the $365.9 million
of various general obligation bonds for which future debt service
payments and redemption are paid from the escrow account are
considered defeased and the associated liability removed from the
financial statements. The refunding resulted in a decrease in total
debt service payments by $31.7 million and an economic gain of
$21.6 million.
Prior Year Refundings/General Obligation Bonds
Government Accounting Standards Board Statement No. 7
Advance Refundings Resulting in Defeasance of Debt, provides
that refunded debt and assets placed in escrow for the payment of
related debt service be excluded from the financial statements. At

State of Wisconsin Notes to The Financial Statements
For the Fiscal Year Ended June 30, 2018
102
June 30, 2018, $1,571.4 million of general obligation bond principal
has been defeased.
Current Fiscal Year Refundings/Revenue Bonds
In December 2017, the State issued $368.6 million of
Transportation Revenue Refunding Bonds (2017 Series 2), which
was a combination advance refunding and crossover refunding.
The proceeds of $439.6 million were deposited in an escrow
account to provide for (i) future debt service payments and
redemption of $169.5 million of various transportation revenue
bonds outstanding at the time of the refunding, resulting in the
$169.5 million of various transportation revenue bonds being
considered defeased and the associated liability removed from the
financial statements, and (ii) future interest payments on the 2017
Series 2 bonds until the crossover dates (July 1, 2019 and July 1,
2020), at which time the escrow has resources to retire
$236.5 million of various transportation revenue bonds that are
NOT considered to be defeased until the respective crossover
refunding date, with both the 2017 Series 2 bonds and crossover
refunded bonds reported as liabilities of the State until such date..
The refunding resulted in a decrease in total debt service payments
by $22.5 million and an economic gain of $21.3 million.
Prior Year Refundings/Revenue Bonds For financial reporting purposes, the following primary government
revenue bonds have been defeased, and therefore, removed as a
liability from the balance sheet:
• Environmental Improvement Fund revenue bonds – At
June 30, 2018, revenue bonds outstanding of $646.7 million
have been defeased.
• Transportation Revenue Bonds – At June 30, 2018, revenue
bonds outstanding of $561.9 million have been defeased.
F. Short-term Financing
The State of Wisconsin Building Commission, an agency of the
State, is empowered by law to consider, authorize, issue, and sell
debt obligations of the State. To date, the Commission has
authorized the issuance of notes. When this short-term debt does
not meet long-term financing criteria, it is classified among fund
liabilities.
General Obligation Commercial Paper Notes
The State has authorized General Obligation Commercial Paper
Notes for the acquisition, construction, development, extension,
enlargement, or improvement of land, waters, property, highway,
buildings, equipment or facilities. Periodically, additional
commercial paper notes are issued to pay for maturing commercial
paper notes.
The State intends to make annual May 1 payments on the
outstanding commercial paper notes that reflect principal
amortization of the notes. The State also intends to make regular
payments to the issuing and paying agent that will be used to pay
interest due on maturing notes. On June 30, 2018, the amount of
commercial paper notes outstanding was $181.9 million which had
interest rates ranging from 1.12 percent to 1.66 percent and
maturities ranging from July 2, 2018 to September 6, 2018.
Short-term debt activity for the year ended June 30, 2018 for
general obligation commercial paper notes was as follows (in
millions):
Balance Balance
July 1, 2017 Additions Reductions June 30, 2018
$ 218.7 $ -- $ 36.8 $ 181.9
General Obligation Extendible Municipal Commercial Paper
The State has authorized General Obligation extendible municipal
commercial paper for the acquisition, construction, development,
extension, enlargement, or improvement of land, waters, property,
highway, buildings, equipment or facilities. Periodically, additional
extendible municipal commercial papers are issued to pay for
maturing extendible municipal commercial paper. The State
intends to make annual May 1 payments on the outstanding
commercial paper notes that reflect principal amortization of the
paper. The State also intends to make regular payments to the
issuing and paying agent that will be used to pay the interest due
on the maturing notes. At June 30, 2018, the amount of extendible
municipal commercial paper outstanding was $223.7 million which
had interest rates ranging from 1.38 percent to 1.72 percent and
maturities from July 9, 2018, to August 6, 2018.
Short-term debt activity for the year ended June 30, 2018 for
general obligation extendible municipal commercial paper was as
follows (in millions):
Balance Balance
July 1, 2017 Additions Reductions June 30, 2018
$ 288.2 $ -- $ 64.5 $ 223.7
State of Wisconsin Notes to The Financial Statements
For the Fiscal Year Ended June 30, 2018
103
Transportation Revenue Commercial Paper Notes
The State authorized transportation revenue commercial paper
notes to pay the costs of major highway projects and certain State
transportation facilities. Periodically, additional commercial paper
notes are issued to pay for maturing commercial paper notes. The
State intends to make annual July 1 payments on the commercial
paper notes that reflect principal amortization of the notes. The
State also intends to make regular deposits to the issuing and
paying agent that will be used to pay interest due on maturing notes.
At June 30, 2018, the amount of transportation revenue commercial
paper notes outstanding was $58.8 million which carries interest
rates ranging from 1.33 percent to 1.70 percent and maturities
ranging from August 2, 2018 to September 6, 2018.
Short-term debt activity for the year ended June 30, 2018 for the
transportation revenue commercial paper notes was as follows (in
millions):
Balance Balance
July 1, 2017 Additions Reductions June 30, 2018
$ 88.7 $ -- $ 29.9 $ 58.8
G. Certificates of Participation
The State established a facility in 1992 that provides lease
purchase financing for property and certain service items acquired
by state agencies. This facility is the Third Amended and Restated
Master Lease between the State acting by and through the
Department of Administration and U.S. Bank National Association.
Lease purchase obligations under the Master Lease are not general
obligations of the State, but are payable from appropriations of
State agencies participating in the Master Lease Program, subject
to annual appropriation. The interest component of each
lease/purchase payment is subject to a separate determination.
Pursuant to the terms and conditions of this agreement, the trustee
for the facility issues parity Master Lease certificates of participation
that evidence proportionate interest of the owners thereof in lease
payments. A common pool of collateral ratably secures all Master
Lease certificates. Title in the property and service items
purchased under the facility remains with the State and the State
grants to the Trustee, for the benefit of all Master Lease certificate
holders, a first security interest in the leased items.
The outstanding balance as of June 30, 2018 was as follows:
Average Life Balance Due (Weighted Term)
$109.6 million 2.91 Years
At June 30, 2018, the following parity Master Lease certificates were outstanding:
• Master Lease Certificates of Participation of 2013, Series A
(Revolving Credit Agreement – Taxable) in the amount of
$30.1 million. This Master Lease certificate evidences the
State's obligation to repay advances under a Revolving Credit
Agreement, dated September 1, 2013, as amended between
U.S. Bank National Association (as trustee), the State of
Wisconsin, acting by and through its Department of
Administration, as lessee, and PNC Bank National
Association. The scheduled termination date under the
Revolving Credit Agreement, as amended, is
September 1, 2018. This Master Lease certificate shall bear
interest at the rates and mature on the dates provided for in
the Revolving Credit Agreement. The balance of this Master
Lease certificate may include some accrued interest that will
be payable at the next semi-annual interest payment date.
• Master Lease Certificates of Participation of 2014, Series A, in
the amount of $17.2 million. This series of Master Lease
certificates has interest rates ranging from 2.75 percent to 5.0
percent and matures semi-annually through March 1, 2023.
• Master Lease Certificates of Participation of 2014, Series B in
the amount of $19.4 million. This series of Master Lease
certificates has interest rates ranging from 1.65 to 5.00 percent
and matures semi-annually through March 1, 2023.
• Master Lease Certificates of Participation of 2015, Series A in
the amount of $24.3 million. This series of Master Lease
certificates has interest rates ranging from 3.0 to 5.0 percent
and matures semi-annually through March 1, 2023.
• Master Lease Certificates of Participation of 2016, Series A in
the amount of $18.6 million. This series of Master Lease
certificates has interest rates ranging from 3.0 to 5.0 percent
and matures semi-annually through March 1, 2023.
The Third Amended and Restated Master Lease 1992-1 provides
that certain lease schedules to the facility can be terminated if the
State deposits with the Trustee an amount that is equal to the
outstanding amount of the lease schedule, or in amounts that are
sufficient to purchase investments that mature on dates and in
amounts to make the lease payments when due. At June 30, 2018,
State of Wisconsin Notes to The Financial Statements
For the Fiscal Year Ended June 30, 2018
104
the State has not deposited with the Trustee amounts, that when
invested, will terminate lease schedules.
H. Arbitrage Rebate
The Tax Reform Act of 1986 requires that governmental entities
issuing tax-exempt debt subsequent to August 1986, calculate and
rebate arbitrage earnings to the federal government. Specifically,
the excess of the aggregated amount earned on investments
purchased with bond proceeds over the amount that would have
been earned if the proceeds were invested at a rate equal to the
bond yield, is to be rebated to the federal government. As of
June 30, 2018, a liability for arbitrage rebate did not exist.
I. Moral Obligation Debt
Through legislation enacted in 1999, the State authorized the
creation of local districts. These districts (Wisconsin Center District,
Southeast Wisconsin Professional Baseball Park District, and the
Green Bay/Brown County Professional Football Stadium District)
are authorized to issue bonds for their respective purpose, and if
the State determines that certain conditions are satisfied, the State
may have a moral obligation to appropriate moneys to make up
deficiencies in the districts' special debt service reserve funds. To
date, the Wisconsin Center District has the authority to issue up to
$200.0 million in bonds and has issued one series with an
outstanding balance of $108.3 million that is subject to the moral
obligation. The two other local districts each have authority to issue
$160.0 million of revenue obligations that, subject to the Secretary
of Administration’s determination that certain conditions have been
met, could carry a moral obligation of the State. All the districts
have issued revenue obligations that do not carry the moral
obligation of the State.
Through legislation enacted in 1999, the State authorized the
issuance of up to $170.0 million principal amount of bonds to
finance the development or redevelopment of sites and facilities to
be used for public schools. If certain conditions are satisfied, and if
a special debt service reserve fund is created for the bonds, the
State will provide a moral obligation pledge, which would restore
the special debt reserve fund established for the bonds to an
amount not to exceed the maximum annual debt service on the
bonds. One bond issue with an outstanding balance of
$29.1 million has been issued that have a special debt service
reserve fund secured by the State’s moral obligation.
Through legislation enacted in 2017, subject to the Secretary of
Administration’s designation and determination of certain
conditions being met, the State may provide a moral obligation
pledge for up to 40% of a local governmental unit’s aggregate
municipal obligations issued to finance costs related to
development occurring in, or for the benefit of, the electronics and
information technology manufacturing zone. In October 2018, the
Secretary of Administration designated the State’s moral obligation
pledge on $120.0 million of Village of Mount Pleasant Tax
Increment Revenue Bonds.
J. Credit Agreements The State has entered into a credit agreement that provides the
State a line of credit for liquidity support for up to $275.0 million of
general obligation commercial paper notes. As of June 30, 2018,
$275.0 million was unused and available. The line of credit expires
in March 2019, but is subject to termination and renewal as
provided for in the credit agreement. The cost of this line of credit
is 0.225 percent per year.
The State has entered into a credit agreement to provide the State
a line of credit for liquidity support for its transportation revenue
commercial paper program. The amount of the line of credit is
$63.0 million. As of June 30, 2018, $63.0 million was unused and
available. This line of credit expires in April 2019, but is subject to
termination and renewal as provided for in the credit agreement.
The cost of this line of credit is 0.35 percent per year.
State of Wisconsin Notes to The Financial Statements
For the Fiscal Year Ended June 30, 2018
105
This page left intentionally blank.

State of Wisconsin Notes to The Financial Statements
For the Fiscal Year Ended June 30, 2018
106
NOTE 12. LEASE COMMITMENTS AND INSTALLMENT PURCHASES
The State leases office buildings, space, and equipment under a
variety of agreements that vary in lease term, many of which are
subject to appropriation from the State Legislature to continue the
lease commitment. If such funding, i.e., through legislative
appropriation, is judged to be assured, and the likelihood of
cancellation through exercise of the fiscal funding clause is remote,
leases are considered non-cancelable and reported as either a
capital lease or an operating lease.
A. Capital Leases
Primary Government
Capital lease commitments in the government-wide and proprietary
funds statements are reported as liabilities at lease inception. The
related assets along with the depreciation are also reported at that
time. Lease payments are reported as a reduction of the liability.
For capital leases in governmental funds, “Other Financing
Sources - Capital Lease Acquisitions" and expenditures are
recorded at lease inception. Lease payments are recorded as
expenditures.
The following is an analysis of the gross minimum lease payments
along with the present value of the minimum lease payments as of
June 30, 2018 for capital leases (in thousands):
Assets acquired through capital leases are valued at the lower of
fair market value or the present value of minimum lease payments
at the inception of the lease. The following is an analysis of capital
assets recorded under capital leases as of June 30, 2018 (in
thousands):
Fisc a l Ye a r Princ ipa l Inte re st
2019 $ 16,478 $ 4,358
2020 13,431 3,612
2021 12,704 2,966
2022 10,596 2,393
2023 40,408 1,942
2024-2028 711 52
2029-2033 - -
2034-2038 - -
2039-2043 - -
2044-2048 - -
Total minimum
future payments 94,328 -
Total minimum
interest payments $ - 15,323
Gove rnmenta l Ac tivitie s
Fisc a l Ye a r Princ ipa l Inte rest
2019 $ 1,147 $ 2,162
2020 1,021 2,125
2021 881 2,078
2022 733 2,025
2023 706 1,973
2024-2028 4,179 9,067
2029-2033 4,872 7,492
2034-2038 6,985 5,379
2039-2043 10,766 2,356
2044-2048 - -
Total minimum
future payments 31,289 -
Total minimum
interest payments $ - 34,656
Busine ss- type Ac tivitie s
Gove rnme nta l Busine ss- typeAc tivitie s Ac tivitie s
Land and Land
Improvements $ - $ -
Buildings and
Improvements - 29,287
Machinery and
Improvements 176,377 3,029
Construction in
Progress
Less: Accumulated
Depreciation (55,749) (5,143)
Carrying Amount $ 120,628 $ 27,172

State of Wisconsin Notes to The Financial Statements
For the Fiscal Year Ended June 30, 2018
107
B. Operating Leases Operating leases, those leases not recorded as capital leases, are
not recorded in the statement of net position. These leases contain
various renewal options, the effect of which are reflected in the
minimum lease payments only if it is considered that the option will
be exercised. Certain other operating leases contain escalation
clauses and contingent rentals which are not included in the
calculation of the future minimum lease payments. Operating lease
expenditures/expenses are recognized as incurred or paid over the
lease term.
Governmental and business-type activities rental expenses under
operating leases for Fiscal Year 2018 were $92.9 million. Of this
amount, $92.8 million relates to minimum rental payments
stipulated in lease agreements, and $49.1 thousand pertains to
contingent rental payments.
The following is an analysis of the future minimum rental payments
due under operating leases (in thousands):
C. Installment Purchases
The State has entered into installment purchase agreements. The
following is an analysis of the gross minimum installment
payments, along with the present value of the minimum installment
payments, as of June 30, 2018 for installment purchases (in
thousands):
Gove rnme nta l Busine ss- typeFisc a l Ye a r Ac tivitie s Ac tivitie s
2019 $ 40,702 $ 25,213
2020 29,014 24,687
2021 22,895 21,635
2022 10,942 15,630
2023 7,445 14,318
2024 - 2028 11,400 63,037
2029 - 2033 1,077 54,932
2034 - 2038 848 39,150
2039 - 2043 733 24,721
2044- 2048 521 14,820
2049 - 2053 240 -
2054 - 2058 228 -
Thereafter 76 -
Minimum lease
payments $ 126,120 $ 298,144
Fisc a l Ye a r Princ ipa l Inte re st
2019 $ 401 6
2020 401 5
2021 401 3
2022 - -
2023 - -
Total minimum future
installment payments $ 1,203 -
Total interest payments $ - 13
Busine ss- type Ac tivitie s

State of Wisconsin Notes to The Financial Statements
For the Fiscal Year Ended June 30, 2018
108
NOTE 13. POLLUTION REMEDIATION OBLIGATIONS
Governmental Accounting Standards Board (GASB)
Statement No. 49, Accounting and Financial Reporting for Pollution
Remediation Obligations, establishes accounting and financial
reporting standards for pollution remediation obligations. These
are obligations to address the current or potential detrimental
effects of existing pollution by participating in pollution remediation
activities such as site assessments and cleanups. The scope of
the standard excludes pollution prevention or control obligations
with respect to current operations, and future pollution remediation
obligations that are required upon retirement of an asset, such as
landfill closure and post closure care and nuclear power plant
decommissioning.
Measurement of Obligations
GASB Statement No. 49 requires the State to calculate pollution
remediation obligations using the expected cash flow technique.
These estimates are subject to change over time. Costs may vary
due to price fluctuations, changes in technology, changes in
potential responsible parties, results of environmental studies,
changes to statutes or regulations and other factors. Recoveries
from other responsible parties may reduce the State’s obligation.
In accordance with the standard, if the State cannot reasonably
estimate a pollution remediation obligation, it does not report a
liability. Under specific circumstances capital assets may be
created when pollution remediation is performed. The State has
adopted a minimum reporting threshold of $1.0 million. Therefore,
only remediation sites with outlays estimated to meet or exceed
that amount are reported in the financial statements.
During the fiscal year, the State recognized $(2.1) million of
additional estimated liabilities for pollution remediation. The State
expended $0.2 million to clean up sites. Therefore, the beginning
liability of $8.0 million decreased to $5.7 million. There were no
recoveries received from other responsible parties during the fiscal
year and none are expected for the identified obligations.
Identified Remediation Obligations
Pollution remediation liabilities are updated annually and are based
on engineering studies and the judgment of agency officials. The
following table shows liabilities included in the Statement of Net
Position as of June 30, 2018 (in millions):
Nature and Source of Pollution
Estimated Liability
Estimated Recovery
Contract agreement with EPA
to clean up Superfund site for
former wood treatment facility
$0.2
Voluntary commencement by
the State to clean up heavy
metal contamination of canal
near former industrial site
5.5 --
Total estimated obligations $5.7 --
In addition to the liability reported in the table above, the State
expects to incur estimated costs of $27,000 per year indefinitely to
pump and treat contamination at a former chrome plating facility.
The State also expects to incur estimated costs of $70,000 per year
indefinitely to operate and maintain a closed landfill. Both are
Superfund sites and estimated total remediation costs for them
cannot be reasonably determined. Therefore, a liability has not
been reported in the Statement of Net Position for either site.
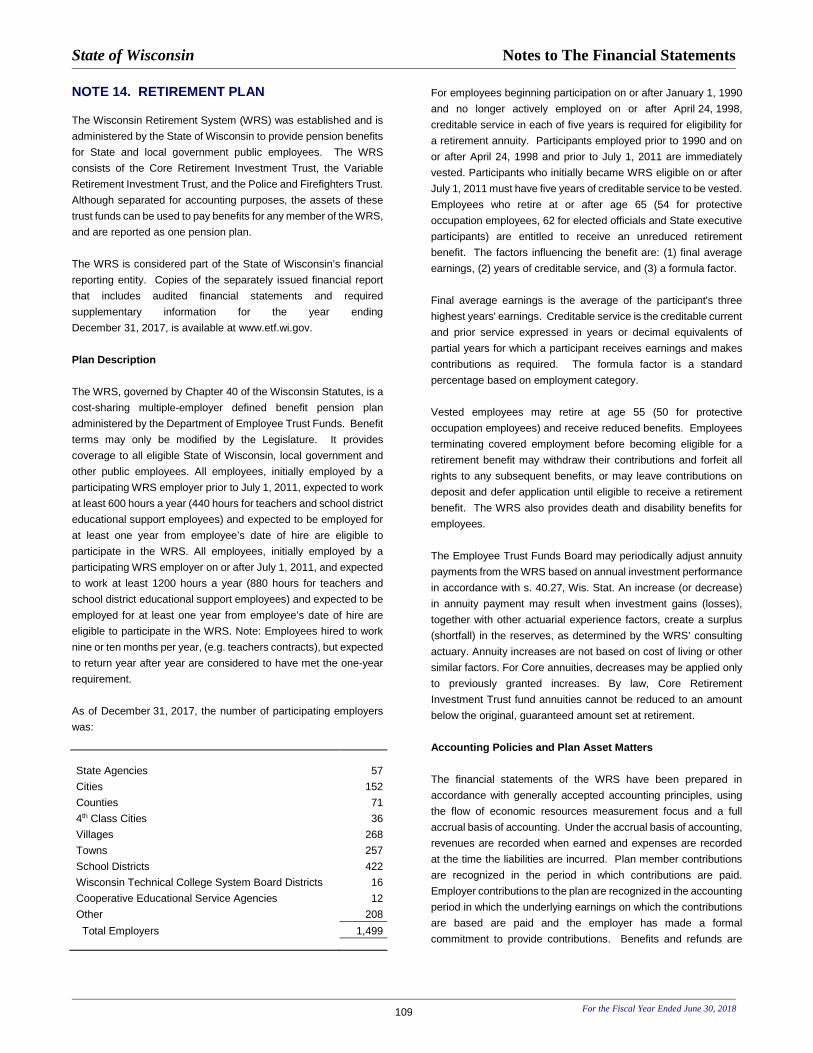
State of Wisconsin Notes to The Financial Statements
For the Fiscal Year Ended June 30, 2018 109
NOTE 14. RETIREMENT PLAN
The Wisconsin Retirement System (WRS) was established and is
administered by the State of Wisconsin to provide pension benefits
for State and local government public employees. The WRS
consists of the Core Retirement Investment Trust, the Variable
Retirement Investment Trust, and the Police and Firefighters Trust.
Although separated for accounting purposes, the assets of these
trust funds can be used to pay benefits for any member of the WRS,
and are reported as one pension plan.
The WRS is considered part of the State of Wisconsin’s financial
reporting entity. Copies of the separately issued financial report
that includes audited financial statements and required
supplementary information for the year ending
December 31, 2017, is available at www.etf.wi.gov.
Plan Description
The WRS, governed by Chapter 40 of the Wisconsin Statutes, is a
cost-sharing multiple-employer defined benefit pension plan
administered by the Department of Employee Trust Funds. Benefit
terms may only be modified by the Legislature. It provides
coverage to all eligible State of Wisconsin, local government and
other public employees. All employees, initially employed by a
participating WRS employer prior to July 1, 2011, expected to work
at least 600 hours a year (440 hours for teachers and school district
educational support employees) and expected to be employed for
at least one year from employee’s date of hire are eligible to
participate in the WRS. All employees, initially employed by a
participating WRS employer on or after July 1, 2011, and expected
to work at least 1200 hours a year (880 hours for teachers and
school district educational support employees) and expected to be
employed for at least one year from employee’s date of hire are
eligible to participate in the WRS. Note: Employees hired to work
nine or ten months per year, (e.g. teachers contracts), but expected
to return year after year are considered to have met the one-year
requirement.
As of December 31, 2017, the number of participating employers
was:
State Agencies 57
Cities 152
Counties 71
4th Class Cities 36
Villages 268
Towns 257
School Districts 422
Wisconsin Technical College System Board Districts 16
Cooperative Educational Service Agencies 12
Other 208
Total Employers 1,499
For employees beginning participation on or after January 1, 1990
and no longer actively employed on or after April 24, 1998,
creditable service in each of five years is required for eligibility for
a retirement annuity. Participants employed prior to 1990 and on
or after April 24, 1998 and prior to July 1, 2011 are immediately
vested. Participants who initially became WRS eligible on or after
July 1, 2011 must have five years of creditable service to be vested.
Employees who retire at or after age 65 (54 for protective
occupation employees, 62 for elected officials and State executive
participants) are entitled to receive an unreduced retirement
benefit. The factors influencing the benefit are: (1) final average
earnings, (2) years of creditable service, and (3) a formula factor.
Final average earnings is the average of the participant's three
highest years' earnings. Creditable service is the creditable current
and prior service expressed in years or decimal equivalents of
partial years for which a participant receives earnings and makes
contributions as required. The formula factor is a standard
percentage based on employment category.
Vested employees may retire at age 55 (50 for protective
occupation employees) and receive reduced benefits. Employees
terminating covered employment before becoming eligible for a
retirement benefit may withdraw their contributions and forfeit all
rights to any subsequent benefits, or may leave contributions on
deposit and defer application until eligible to receive a retirement
benefit. The WRS also provides death and disability benefits for
employees.
The Employee Trust Funds Board may periodically adjust annuity
payments from the WRS based on annual investment performance
in accordance with s. 40.27, Wis. Stat. An increase (or decrease)
in annuity payment may result when investment gains (losses),
together with other actuarial experience factors, create a surplus
(shortfall) in the reserves, as determined by the WRS’ consulting
actuary. Annuity increases are not based on cost of living or other
similar factors. For Core annuities, decreases may be applied only
to previously granted increases. By law, Core Retirement
Investment Trust fund annuities cannot be reduced to an amount
below the original, guaranteed amount set at retirement.
Accounting Policies and Plan Asset Matters
The financial statements of the WRS have been prepared in
accordance with generally accepted accounting principles, using
the flow of economic resources measurement focus and a full
accrual basis of accounting. Under the accrual basis of accounting,
revenues are recorded when earned and expenses are recorded
at the time the liabilities are incurred. Plan member contributions
are recognized in the period in which contributions are paid.
Employer contributions to the plan are recognized in the accounting
period in which the underlying earnings on which the contributions
are based are paid and the employer has made a formal
commitment to provide contributions. Benefits and refunds are
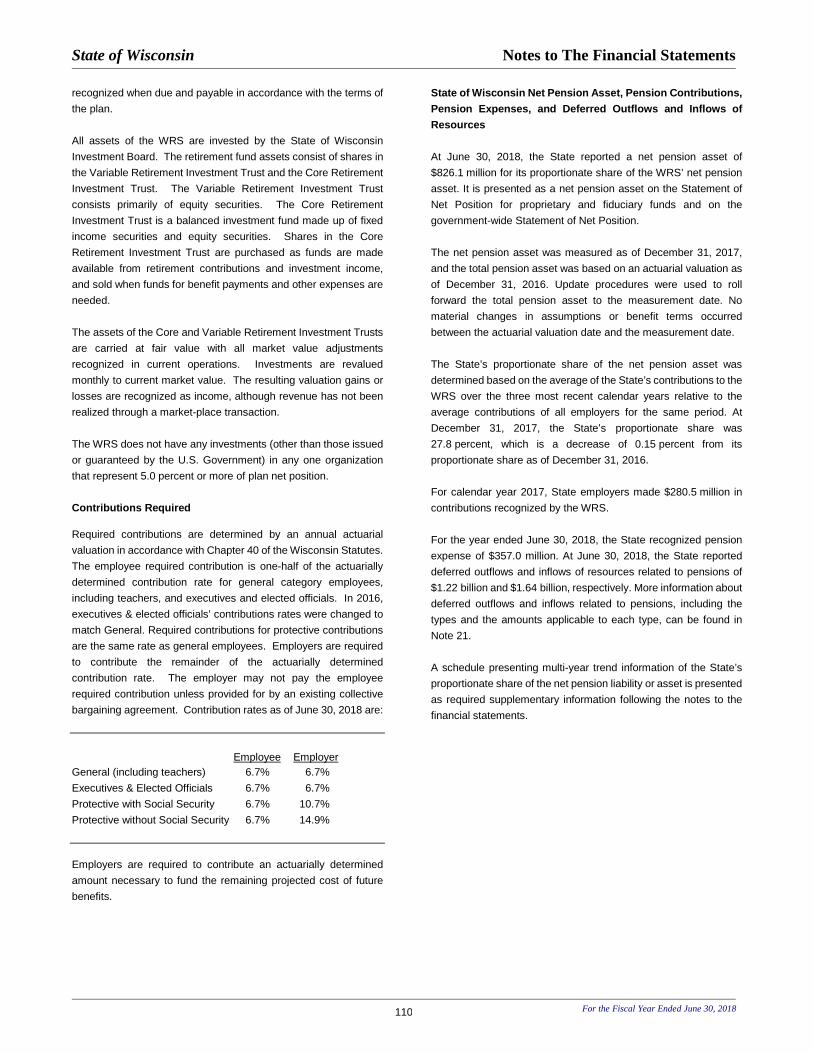
State of Wisconsin Notes to The Financial Statements
For the Fiscal Year Ended June 30, 2018 110
recognized when due and payable in accordance with the terms of
the plan.
All assets of the WRS are invested by the State of Wisconsin
Investment Board. The retirement fund assets consist of shares in
the Variable Retirement Investment Trust and the Core Retirement
Investment Trust. The Variable Retirement Investment Trust
consists primarily of equity securities. The Core Retirement
Investment Trust is a balanced investment fund made up of fixed
income securities and equity securities. Shares in the Core
Retirement Investment Trust are purchased as funds are made
available from retirement contributions and investment income,
and sold when funds for benefit payments and other expenses are
needed.
The assets of the Core and Variable Retirement Investment Trusts
are carried at fair value with all market value adjustments
recognized in current operations. Investments are revalued
monthly to current market value. The resulting valuation gains or
losses are recognized as income, although revenue has not been
realized through a market-place transaction.
The WRS does not have any investments (other than those issued
or guaranteed by the U.S. Government) in any one organization
that represent 5.0 percent or more of plan net position.
Contributions Required
Required contributions are determined by an annual actuarial
valuation in accordance with Chapter 40 of the Wisconsin Statutes.
The employee required contribution is one-half of the actuarially
determined contribution rate for general category employees,
including teachers, and executives and elected officials. In 2016,
executives & elected officials’ contributions rates were changed to
match General. Required contributions for protective contributions
are the same rate as general employees. Employers are required
to contribute the remainder of the actuarially determined
contribution rate. The employer may not pay the employee
required contribution unless provided for by an existing collective
bargaining agreement. Contribution rates as of June 30, 2018 are:
Employee Employer
General (including teachers) 6.7% 6.7%
Executives & Elected Officials 6.7% 6.7%
Protective with Social Security 6.7% 10.7%
Protective without Social Security 6.7% 14.9%
Employers are required to contribute an actuarially determined
amount necessary to fund the remaining projected cost of future
benefits.
State of Wisconsin Net Pension Asset, Pension Contributions, Pension Expenses, and Deferred Outflows and Inflows of Resources At June 30, 2018, the State reported a net pension asset of
$826.1 million for its proportionate share of the WRS’ net pension
asset. It is presented as a net pension asset on the Statement of
Net Position for proprietary and fiduciary funds and on the
government-wide Statement of Net Position.
The net pension asset was measured as of December 31, 2017,
and the total pension asset was based on an actuarial valuation as
of December 31, 2016. Update procedures were used to roll
forward the total pension asset to the measurement date. No
material changes in assumptions or benefit terms occurred
between the actuarial valuation date and the measurement date.
The State’s proportionate share of the net pension asset was
determined based on the average of the State’s contributions to the
WRS over the three most recent calendar years relative to the
average contributions of all employers for the same period. At
December 31, 2017, the State’s proportionate share was
27.8 percent, which is a decrease of 0.15 percent from its
proportionate share as of December 31, 2016.
For calendar year 2017, State employers made $280.5 million in
contributions recognized by the WRS.
For the year ended June 30, 2018, the State recognized pension
expense of $357.0 million. At June 30, 2018, the State reported
deferred outflows and inflows of resources related to pensions of
$1.22 billion and $1.64 billion, respectively. More information about
deferred outflows and inflows related to pensions, including the
types and the amounts applicable to each type, can be found in
Note 21.
A schedule presenting multi-year trend information of the State’s
proportionate share of the net pension liability or asset is presented
as required supplementary information following the notes to the
financial statements.
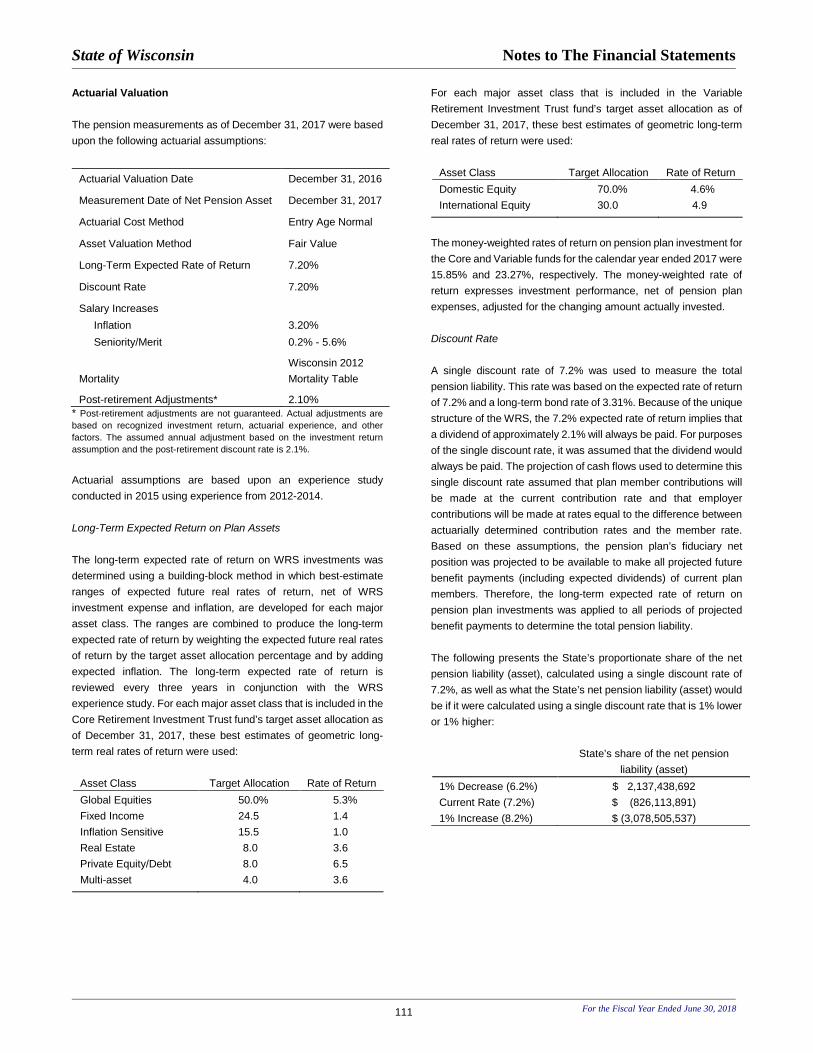
State of Wisconsin Notes to The Financial Statements
For the Fiscal Year Ended June 30, 2018 111
Actuarial Valuation
The pension measurements as of December 31, 2017 were based
upon the following actuarial assumptions:
* Post-retirement adjustments are not guaranteed. Actual adjustments are
based on recognized investment return, actuarial experience, and other
factors. The assumed annual adjustment based on the investment return
assumption and the post-retirement discount rate is 2.1%.
Actuarial assumptions are based upon an experience study
conducted in 2015 using experience from 2012-2014.
Long-Term Expected Return on Plan Assets
The long-term expected rate of return on WRS investments was
determined using a building-block method in which best-estimate
ranges of expected future real rates of return, net of WRS
investment expense and inflation, are developed for each major
asset class. The ranges are combined to produce the long-term
expected rate of return by weighting the expected future real rates
of return by the target asset allocation percentage and by adding
expected inflation. The long-term expected rate of return is
reviewed every three years in conjunction with the WRS
experience study. For each major asset class that is included in the
Core Retirement Investment Trust fund’s target asset allocation as
of December 31, 2017, these best estimates of geometric long-
term real rates of return were used:
Asset Class Target Allocation Rate of Return
Global Equities 50.0% 5.3%
Fixed Income 24.5 1.4
Inflation Sensitive 15.5 1.0
Real Estate 8.0 3.6
Private Equity/Debt 8.0 6.5
Multi-asset 4.0 3.6
For each major asset class that is included in the Variable
Retirement Investment Trust fund’s target asset allocation as of
December 31, 2017, these best estimates of geometric long-term
real rates of return were used:
Asset Class Target Allocation Rate of Return
Domestic Equity 70.0% 4.6%
International Equity 30.0 4.9
The money-weighted rates of return on pension plan investment for
the Core and Variable funds for the calendar year ended 2017 were
15.85% and 23.27%, respectively. The money-weighted rate of
return expresses investment performance, net of pension plan
expenses, adjusted for the changing amount actually invested.
Discount Rate
A single discount rate of 7.2% was used to measure the total
pension liability. This rate was based on the expected rate of return
of 7.2% and a long-term bond rate of 3.31%. Because of the unique
structure of the WRS, the 7.2% expected rate of return implies that
a dividend of approximately 2.1% will always be paid. For purposes
of the single discount rate, it was assumed that the dividend would
always be paid. The projection of cash flows used to determine this
single discount rate assumed that plan member contributions will
be made at the current contribution rate and that employer
contributions will be made at rates equal to the difference between
actuarially determined contribution rates and the member rate.
Based on these assumptions, the pension plan’s fiduciary net
position was projected to be available to make all projected future
benefit payments (including expected dividends) of current plan
members. Therefore, the long-term expected rate of return on
pension plan investments was applied to all periods of projected
benefit payments to determine the total pension liability.
The following presents the State’s proportionate share of the net
pension liability (asset), calculated using a single discount rate of
7.2%, as well as what the State’s net pension liability (asset) would
be if it were calculated using a single discount rate that is 1% lower
or 1% higher:
State’s share of the net pension
liability (asset)
1% Decrease (6.2%) $ 2,137,438,692
Current Rate (7.2%) $ (826,113,891)
1% Increase (8.2%) $ (3,078,505,537)
Actuarial Valuation Date December 31, 2016
Measurement Date of Net Pension Asset December 31, 2017
Actuarial Cost Method Entry Age Normal
Asset Valuation Method Fair Value
Long-Term Expected Rate of Return 7.20%
Discount Rate 7.20%
Salary Increases
Inflation 3.20%
Seniority/Merit 0.2% - 5.6%
Mortality
Wisconsin 2012
Mortality Table
Post-retirement Adjustments* 2.10%

State of Wisconsin Notes to The Financial Statements
For the Fiscal Year Ended June 30, 2018 112
NOTE 15. MILWAUKEE RETIREMENT SYSTEM The Milwaukee Retirement System (MRS) is reported as an
Investment Trust Fund. MRS participants provide assets to the
State of Wisconsin, Department of Employee Trust Funds (DETF)
for investing in its Core Retirement Investment Trust Fund (Core
Fund) and the Variable Retirement Investment Trust Fund
(Variable Fund) of the Wisconsin Retirement System. Participation
of the MRS in the Core Fund and Variable Fund is described in the
DETF Administrative Code, Chapter 10.12. The State of Wisconsin
Investment Board (SWIB) manages the Core Fund and Variable
Fund with oversight by a Board of Trustees as authorized in Wis.
Stat. 25.14 and 25.17. SWIB is not registered with the Securities
and Exchange Commission as an investment company.
The investments of the Core Fund and Variable Fund consist of a
highly diversified portfolio of securities. Wis. Stat. 25.17(3)(a)
allows investments in loans, securities and any other investments
as authorized by Wis. Stat. 620.22. Permitted classes of
investments include bonds of governmental units or of private
corporations, loans secured by mortgages, preferred or common
stock, real property and other investments not specifically
prohibited by statute.
Investments are revalued monthly to fair value, with unrealized
gains and losses reflected in income.
Monthly, the DETF distributes a pro-rata share of the total Core
Fund and Variable Fund earnings less administrative expenses to
the MRS accounts. The MRS accounts are adjusted to fair value
and gains/losses are recorded directly in the accounts per DETF
Administrative Code, Chapter 10.12(2). Neither State statute, a
legal provision nor a legally binding guarantee exists to support the
value of shares.
Copies of the separately issued financial report that includes
audited financial statements along with the accompanying footnote
disclosures and supplementary information for the Core Fund and
the Variable Fund is available at www.swib.state.wi.us or may be
obtained upon request from:
State of Wisconsin Investment Board
P.O. Box 7842
Madison, Wisconsin 53707-7842

State of Wisconsin Notes to The Financial Statements
_______________________________________________________________________________________________________________________________________________
For the Fiscal Year Ended June 30, 2018 113
NOTE 16. OTHER POSTEMPLOYMENT BENEFIT (OPEB) PROGRAMS
Governmental Accounting Standards Board (GASB) Statement
No. 75, Accounting and Financial Reporting for Postemployment Benefits Other Than Pensions establishes standards for
recognizing and measuring liabilities, deferred outflows of
resources, deferred inflows of resources, and
expense/expenditures in financial reports of state and local
governmental employers. GASB statement 74, Financial Reporting for Postemployment Benefit Plans Other than Pension Plans,
establishes reporting standards for other postemployment benefits
included in the general purpose external financial reports of state
and local governmental OPEB plans.
Under Chapter 40 of Wisconsin Statutes, the Department of
Employee Trust Funds (ETF) and Group Insurance Board (GIB)
have statutory authority for program administration and oversight
of post-employment benefits. ETF administers postemployment
benefit plans other than pension plans for the Retiree Health
Insurance and Retiree Life Insurance plans (for retired state
employees). ETF also administers the Local Retiree Health
Insurance and the Local Retiree Life Insurance plans (for retired
local government employees). The plans are reported as fiduciary
funds in the State’s CAFR.
ETF’s separately issued financial statements contain further
information. ETF’s report may be obtained at www.etf.wi.gov and
on request from:
The Department of Employee Trust Funds
4822 Madison Yards Way
Madison, Wisconsin 53705-9100
Basis of Accounting
The OPEB plans are reported in accordance with GASB standards
and accounted for using the flow of economic resources
measurement focus and the accrual basis of accounting. The
OPEB liability, deferred outflows of resources and deferred inflows
of resources, OPEB expense, and fiduciary net position, if any,
have been determined on the same basis. Benefit payments
(including refunds of employee contributions) are recognized when
due and payable in accordance with the benefit terms.
Investments, if any, are reported at fair value.
Retiree Health Insurance Funds
The Retiree Health Insurance plans offer group health insurance to
retired State of Wisconsin and local government employees.
Retirees pay the full premium amount. The State Retiree Health
Insurance Fund includes the State, the University of Wisconsin,
and other component units of the State. The Local Government
Retiree Health Insurance Fund includes 354 local government
employers. The plans are not administered through a trust. The
Retiree Health Insurance Funds contain certain non-OPEB
components relating to post-Medicare pharmacy and health
insurance benefits. ETF and the GIB have statutory authority for
program administration and oversight under Wisconsin Statutes
Chapters 15.165 (2) and 40.03 (6).
State of Wisconsin and local government employees participating
in the State Health Insurance Plan or the Wisconsin Public
Employers Insurance Plan (local government plans) are eligible to
continue their health insurance coverage after leaving covered
employment. Membership as of December 31, 2017, included
26,692 former state employees or their beneficiaries and 1,987
former local government employees and beneficiaries.
Employees may choose between self-insured health plans and
alternate health plans with specific provider networks (i.e., HMOs).
The HMOs follow GIB guidelines for eligibility and program
requirements. All HMOs offer a prescribed benefit package called
Uniform Benefits and participate in a yearly competitive premium
rate bid process. The Standard Plan and State Maintenance Plan
are self-insured by the GIB and administered by WPS Health
Insurance. Self-insured coverage for health insurance was
discontinued as of December 31, 2017. The Standard Plan is a
preferred provider plan. The pharmacy benefit is self-insured by the
GIB and administered by Navitus Health Solutions.
Effective January 1, 2012, prescription drug coverage for Medicare
eligible retirees enrolled in the State group health insurance
program is provided by a self-funded Medicare Part D Employer
Group Waiver Plan (EGWP). A Medicare “Wrap” product is also
included to provide full coverage to members, as required by
uniform benefits, when they reach the Medicare coverage gap, also
known as the “donut hole."
Retiree Life Insurance Funds
The State Retiree Life Insurance Fund includes the State, the
University of Wisconsin, and other component units of the State,
and is considered a single-employer defined benefit OPEB plan.
The Local Government Retiree Life Insurance Fund included 738
local government employers as of December 31, 2017 and is
considered a cost-sharing multiple-employer defined benefit OPEB
plan. The plans are administered through a trust.
The plans provide post-employment life insurance coverage to all
eligible employees of participating employers. The plans are
established by Wisconsin Statutes Chapter 40.70. ETF contracts
with Securian Financial Group, Inc (Securian) as a third party
administrator for the Retiree Life Insurance plans. Benefit terms
may be modified by the GIB, subject to state and federal legislative
constraints.

State of Wisconsin Notes to The Financial Statements
_______________________________________________________________________________________________________________________________________________
For the Fiscal Year Ended June 30, 2018 114
Generally, members may enroll during a 30-day enrollment period
after their date of hire. Members may also enroll after the initial 30-
day enrollment period with evidence of insurability. Members under
evidence of insurability enrollment must enroll in group life
insurance coverage before age 55 to be eligible for Basic or
Supplemental coverage.
Contributions The GIB approves contribution rates annually, based on
recommendations from the insurance carrier. Recommended rates
are based on an annual valuation, taking into consideration an
estimate of the present value of future benefits and the present
value of future contributions. A portion of employer contributions
made during a member’s working lifetime funds a post-retirement
benefit.
Employers are required to pay the following contributions for active
members to provide them with basic coverage after age 65. There
are no employer contributions for pre-65 annuitant coverage. All
contributions are actuarially determined.
State Local
50 percent post
retirement coverage
28 percent of the
employee premium
40 percent of the
employee premium
25 percent post
retirement coverage N/A
20 percent of
employee premium
Employee contributions are based upon nine age bands through
age 69 and an additional eight age bands for those age 70 and
over. Participating employees must pay monthly contribution rates
per $1,000 of coverage until the age of 65 (age 70 if active). The
employee contribution rates in effect for the year ended December
31, 2017 are as listed below:
Attained Age
State Basic
State Supple-mental
Local Basic
Local Supple-mental
Under 30 $0.04 $0.04 $0.05 $0.05
30-34 0.04 0.04 0.06 0.06
35-39 0.04 0.04 0.07 0.07
40-44 0.06 0.06 0.08 0.08
45-49 0.10 0.10 0.12 0.12
50-54 0.16 0.16 0.22 0.22
55-59 0.22 0.22 0.39 0.39
60-64 0.30 0.30 0.49 0.49
65-69 0.39 0.39 0.57 0.57
At retirement, the member must have active group life insurance
coverage and satisfy one of the following:
Wisconsin Retirement System (WRS) coverage prior to
January 1, 1989, or
At least one month of group life insurance coverage in each
of five calendar years after 1989 and one of the following:
Eligible for an immediate WRS benefit, or
At least 20 years from their WRS creditable service as of
January 1, 1990, plus their years of group life insurance
coverage after 1989, or
At least 20 years on the payroll of their last employer.
In addition, terminating members and retirees must continue to pay
the employee premiums until age 65 (age 70 if active).
Benefits and Membership
After retirement, basic coverage is continued for life in amounts for
the insurance in force before retirement:
Age State Local Before age 65 100% 100%
While age 65 75% 75%
While age 66 50% 50%
After age 66 50%
50%/25%
Employer Election
After retirement, supplemental and additional coverage may be
continued until age 65 at 100 percent of the amount of the
insurance in force before retirement at the employee’s expense,
and spouse and dependent coverage is terminated.
Membership as of December 31, 2017, included:
State Local Total Active* 51,438 75,719 127,157
Inactive Pre-Age 65
Annuitants 7,032 10,195 17,227
Inactive Post-Age 64
Annuitants 24,973 33,644 58,617
Totals 83,443 119,558 203,001
* Active membership includes disabled

State of Wisconsin Notes to The Financial Statements
_______________________________________________________________________________________________________________________________________________
For the Fiscal Year Ended June 30, 2018 115
NOTE 17. OTHER POSTEMPLOYMENT BENEFIT PLANS A. State Retiree Health Insurance OPEB
The State Retiree Health Insurance program provides
postemployment health insurance coverage to all eligible retired
employees of the State, the University of Wisconsin, University of
Wisconsin Hospital and Clinics Authority, Wisconsin Housing and
Economic Development Authority and Wisconsin Economic
Development Corporation. The employers do not directly pay any
portion of the premium for participating retirees. However, because
retirees pay the same premium rate set for active employees, an
implicit rate subsidy exists for employers. This implicit rate subsidy
is reported as an OPEB liability. At age 65, when eligible, retirees
are required to enroll in Medicare. No assets have accumulated
because there is no trust.
Retiree Health Insurance Plan Description
GASB standards classify the State Retiree Health Insurance
program as a single employer defined benefit OPEB plan with
multiple participating employers. Medical, prescription drug and
dental benefits are provided to eligible retirees.
Retirees pay the full premium until age 65 directly to the plan either
through “out-of-pocket” or from unused accumulated sick leave
conversion credits. The value of the sick leave benefit is defined
as compensated absences and reported under the provisions of
GASB Statement No. 16, Accounting for Compensated Absences.
Contribution requirements are established and may be amended
by the GIB. Premiums for non-Medicare retirees are based on an
effective rate structure for the health care service provider selected.
Monthly rates range from $543 to $1,400 for single coverage and
$1,331 to $3,495 for family coverage.
As of January 1, 2017 (most recent actuarial valuation date),
membership consisted of:
Member Type Number Retired members or beneficiaries
receiving OPEB benefits
5,996
Vested terminated members not
yet receiving OPEB benefits
1,537
Active members 61,952
Total 69,485
Inclusion of OPEB Information for Component Units
GASB standards require the presentation of OPEB related
amounts and information in the State’s financial statements for both
the State of Wisconsin (the primary government) and the
component units. The component units are responsible for their
share of the OPEB liabilities. Reported amounts related to the
OPEB liability, OPEB expense and related deferred inflows and
outflows for the OPEB plans may vary by an immaterial amount
from the final amounts due to the timing of available information.
Total Retiree Health OPEB Liability The actuarial valuation was based on the plan of retiree benefits
and was made for purposes of fulfilling GASB accounting standards
which require recognition of the employer cost of postemployment
benefits over an employee’s career. The total cost of providing
postemployment benefits is projected, considering relevant
assumptions, then discounted to determine the total OPEB liability.
To determine the total OPEB liability for the program, the actuary
performed an actuarial valuation as of January 1, 2017 and adjusted
for changes such as interest earned, contributions paid, and
benefits paid through June 30, 2017. Based on this, the actuary
determined the OPEB liability totaled $719.3 million.
The total OPEB liability was allocated to participating employers
based on their proportionate share of health insurance premiums
contributed for active employees. Amounts by participating
employers as of a June 30, 2018 reporting date, are indicated in the
table below (in millions):
Participating Employer OPEB Liability
Primary Government
State of Wisconsin $ 326.0
University of Wisconsin System 315.7
Component Units
UW Hospital and Clinics Authority 75.3
WI Housing & Economic Development Authority 1.4
WI Economic Development Corp. 0.9
Total OPEB Liability $719.3
Changes in the Total OPEB Liability
Changes to the total OPEB plan liability during the fiscal year
include the following (in millions):
Amount Total OPEB Liability June 30, 2016 $ 775.4
Changes for the Year
Service cost 72.1
Interest 23.6
Difference between expected & actual experience (4.1)
Changes of assumptions (109.3)
Benefit payments* (38.4)
Net Change in Total OPEB Liability (56.0)
Total OPEB Liability June 30, 2017 $719.3
* Employer benefit payments of $38.4 million were actuarially determined
and pertain to the implicit rate subsidy.

State of Wisconsin Notes to The Financial Statements
_______________________________________________________________________________________________________________________________________________
For the Fiscal Year Ended June 30, 2018 116
Actuarial Methods and Assumptions
Projections of benefits for financial reporting purposes are based on
the substantive plan (the plan as understood by the employer and
plan members) and include the types of benefits provided at the time
of each valuation and the historical pattern of sharing of benefit
costs between the employer and plan members to that point. The
actuarial methods and assumptions used include techniques that
are designed to reduce short-term volatility in actuarial accrued
liabilities and the actuarial value of assets, consistent with the long-
term perspective of the calculations.
The total OPEB liability in the January 1, 2017 actuarial valuation
was determined using the following actuarial assumptions and
other inputs, applied to all periods included in the measurement
unless otherwise specified:
Actuarial Valuation Date January 1, 2017
Measurement Date of Total
OPEB Liability
June 30, 2017
Actuarial cost method Entry age level percent of pay
Asset Valuation Method N/A
Inflation 3.2%
Salary increases Vary by service and employee class,
including inflation
Discount Rate Discount rate was changed to 3.58% for
the June 30, 2017 measurement from
2.85% for the June 30, 2016
measurement. The 2015 valuation used
a discount rate of 3.56%
Health care cost trend rates
(calendar year basis from
January 1, 2017)
Medical 2.33% for one year then 5.25% graded
to 4.5% over three years
Prescription drug -4.9% for one year then 8.5% graded to
4.5% over seven years
Dental 3.5% for one year then 4.0%
Administrative costs 4.8% for one year then 3.0%
Benefit Changes None
Participation Rate Decreased from 95% to 85%
Assumed Claims Costs were changed to reflect the
expected claims in effect for 2017
Disability Rates Rates for General and Executive and
Elected employees were changed to
match the pension valuation as of
December 31, 2014
Withdrawal Rate Withdrawal rate for General female
employees with 0 years of service was
changed to match the pension valuation
as of December 31, 2014
Trend Rates Trend rates were re-established to
adjust to the claims experience for
2018. Both medical and prescription
coverages were assumed to have an
ultimate trend of 4.50%
Benefit End Date Benefits end when participants turn 65
years old
Actuarial assumptions are based on the Wisconsin Retirement
System experience study conducted in 2015 using experience from
2012 to 2014. Valuation assumption changes decreased the liability
by $109.3 million due to raising the discount rate to 3.58 percent
from 2.85 percent based on the Bond Buyer, 20-year, general
obligation municipal bond index rate closest to the measurement
date (but not beyond). In addition, the assumed participation rate
was lowered from 95 percent to 85 percent to account for actual
historic participation rates.
Sensitivity of the Total OPEB Liability to Changes in the Discount Rate
The following presents each employer’s proportionate share of the
total liability and what it would be if it were calculated using a
discount rate that is 1-percentage-point lower or higher than the
current discount rate (in millions):
1% Decrease in Discount
Rate (2.58%)
Current Discount
Rate (3.58%)
1% Increase in Discount
Rate (4.58%)
Primary Government
State of Wisconsin $348.7 $326.0 $304.4
University of WI System 337.6 315.7 294.7
Component Units
UW Hospital and Clinics 80.5 75.3 70.3
WI Housing & Economic
Development Authority 1.5 1.4 1.3
WI Economic
Development Corp. 1.0 0.9 0.9
Total OPEB Liability $769.3 $719.3 $671.6
Sensitivity of the Total OPEB Liability to Changes in the Healthcare Cost Trend Rates
The following presents each employer’s proportionate share of the
total liability and what it would be if it were calculated using a
healthcare trend rate that is 1-percentage-point lower or higher than
the current healthcare trend rate (in millions):
1% Decrease in
Healthcare Trend Rate
Current Healthcare Trend Rate
1% Increase in
Healthcare Trend Rate
Primary Government State of Wisconsin $288.4 $326.0 $370.8
University of WI System 279.3 315.7 359.0
Component Units UW Hospital and Clinics 66.6 75.3 85.6
WI Housing & Economic
Development Authority 1.2 1.4 1.6
WI Economic
Development Corp. 0.8 0.9 1.1
Total OPEB Liability $636.3 $719.3 $818.1
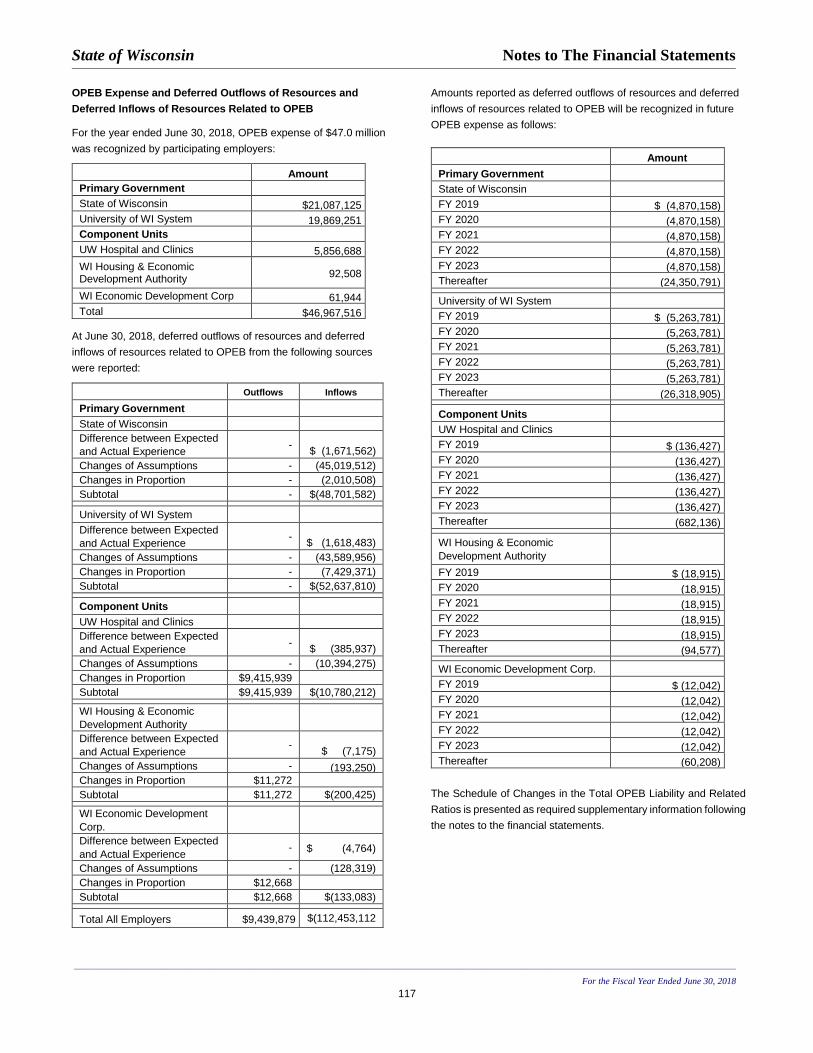
State of Wisconsin Notes to The Financial Statements
_______________________________________________________________________________________________________________________________________________
For the Fiscal Year Ended June 30, 2018 117
OPEB Expense and Deferred Outflows of Resources and Deferred Inflows of Resources Related to OPEB
For the year ended June 30, 2018, OPEB expense of $47.0 million
was recognized by participating employers:
Amount Primary Government
State of Wisconsin $21,087,125
University of WI System 19,869,251
Component Units
UW Hospital and Clinics 5,856,688
WI Housing & Economic Development Authority
92,508
WI Economic Development Corp 61,944
Total $46,967,516
At June 30, 2018, deferred outflows of resources and deferred
inflows of resources related to OPEB from the following sources
were reported:
Outflows Inflows
Primary Government
State of Wisconsin Difference between Expected
and Actual Experience -
$ (1,671,562)
Changes of Assumptions - (45,019,512)
Changes in Proportion - (2,010,508)
Subtotal - $(48,701,582)
University of WI System
Difference between Expected
and Actual Experience -
$ (1,618,483)
Changes of Assumptions - (43,589,956)
Changes in Proportion - (7,429,371)
Subtotal - $(52,637,810)
Component Units
UW Hospital and Clinics Difference between Expected
and Actual Experience -
$ (385,937)
Changes of Assumptions - (10,394,275)
Changes in Proportion $9,415,939 Subtotal $9,415,939 $(10,780,212)
WI Housing & Economic
Development Authority
Difference between Expected
and Actual Experience -
$ (7,175)
Changes of Assumptions - (193,250)
Changes in Proportion $11,272
Subtotal $11,272 $(200,425)
WI Economic Development
Corp.
Difference between Expected
and Actual Experience - $ (4,764)
Changes of Assumptions - (128,319)
Changes in Proportion $12,668 Subtotal $12,668 $(133,083)
Total All Employers $9,439,879 $(112,453,112
Amounts reported as deferred outflows of resources and deferred
inflows of resources related to OPEB will be recognized in future
OPEB expense as follows:
Amount Primary Government State of Wisconsin
FY 2019 $ (4,870,158)
FY 2020 (4,870,158)
FY 2021 (4,870,158)
FY 2022 (4,870,158)
FY 2023 (4,870,158)
Thereafter (24,350,791)
University of WI System
FY 2019 $ (5,263,781)
FY 2020 (5,263,781)
FY 2021 (5,263,781)
FY 2022 (5,263,781)
FY 2023 (5,263,781)
Thereafter (26,318,905)
Component Units UW Hospital and Clinics
FY 2019 $ (136,427)
FY 2020 (136,427)
FY 2021 (136,427)
FY 2022 (136,427)
FY 2023 (136,427)
Thereafter (682,136)
WI Housing & Economic
Development Authority
FY 2019 $ (18,915)
FY 2020 (18,915)
FY 2021 (18,915)
FY 2022 (18,915)
FY 2023 (18,915)
Thereafter (94,577)
WI Economic Development Corp.
FY 2019 $ (12,042)
FY 2020 (12,042)
FY 2021 (12,042)
FY 2022 (12,042)
FY 2023 (12,042)
Thereafter (60,208)
The Schedule of Changes in the Total OPEB Liability and Related
Ratios is presented as required supplementary information following
the notes to the financial statements.

State of Wisconsin Notes to The Financial Statements
_______________________________________________________________________________________________________________________________________________
For the Fiscal Year Ended June 30, 2018 118
B. State Retiree Life Insurance OPEB
The State Retiree Life Insurance program provides postemployment
health insurance coverage to all eligible retired employees of the
State, the University of Wisconsin, University of Wisconsin Hospital
and Clinics Authority, Wisconsin Housing and Economic
Development Authority and Wisconsin Economic Development
Corporation. Each employer’s proportionate share of the net OPEB
liability and collective OPEB expense, deferred inflows and outflows
is based on the employer’s contribution for the most recent calendar
year compared to the total contributions of all employers.
Inclusion of OPEB Information for Component Units
GASB standards require the presentation of OPEB related
amounts and information in the State’s financial statements for both
the State of Wisconsin (the primary government) and the
component units. The component units are responsible for their
share of the OPEB liabilities. Reported amounts related to the
OPEB liability, OPEB expense and related deferred inflows and
outflows for the OPEB plans may vary by an immaterial amount
from the final amounts due to the timing of available information.
OPEB Liabilities, OPEB Expense, and Deferred Outflows of Resources and Deferred Inflows of Resources Related to OPEB
At June 30, 2018, the State, including the University of Wisconsin
System, reported a liability of $447.9 million for its proportionate
share of the net OPEB liability. The net OPEB liability was
measured as of December 31, 2017 and the total OPEB liability
used to calculate the net OPEB liability was determined by an
actuarial valuation as January 1, 2017 rolled forward to
December 31, 2017. The State’s proportion of the net OPEB
liability was based on the State’s share of contributions to the
OPEB plan relative to the contributions of all participating
employers. At December 31, 2017, the State’s proportion was
90.8 percent which was a decrease of 0.4 percent from its
proportion of 91.2 percent measured as of December 31, 2016.
Net OPEB liability amounts, by participating employers as of a
June 30, 2018 reporting date, are indicated in the table below
(in millions):
Participating Employer
Net OPEB
Liability Primary Government
State of Wisconsin $ 238.4
University of Wisconsin System 209.6
Component Units
UW Hospital and Clinics Authority 43.7
WI Housing & Economic Development
Authority
1.3
Wisconsin Economic Development Corporation 0.5
Total Net OPEB Liability $493.5
For the year ended June 30, 2018, OPEB expense of $47.5 million
was recognized by participating employers:
Amount Primary Government State of Wisconsin $23,772,096
University of WI System 19,135,391
Component Units UW Hospital and Clinics 4,443,657
WI Housing & Economic Development Authority 130,048
WI Economic Development Corp 57,350
Total $47,538,544
For the year ended June 30, 2018, contributions of $1.4 million
were recognized by the plan from participating employers:
Amount Primary Government State of Wisconsin $687,380
University of WI System 565,951
Component Units
UW Hospital and Clinics 118,171
WI Housing & Economic Development Authority 3,545
WI Economic Development Corp 1,437
Total $1,376,484 Changes in the Net OPEB Liability
Changes to the total OPEB plan liability during the fiscal year
include the following (in millions):
Amount Total OPEB Liability December 31, 2016 $762.6
Changes for the Year
Service cost 26.2
Interest 30.7
Difference between expected & actual experience (5.3)
Changes of assumptions 49.0
Benefit payments (17.7)
Net Change in Total OPEB Liability 82.9
Total OPEB Liability December 31, 2017 $845.5
Plan Fiduciary Net Position December 31, 2016 $357.4
Changes for the Year
Contributions from employers 1.4
Net investment income 11.6
Administrative expense (.7)
Benefit payments (17.7)
Net change in Plan Fiduciary Net Position (5.4)
Plan Fiduciary Net Position December 31, 2017 $352.0
Collective Net OPEB Liability December 31, 2016 $405.1
Net change in Collective Net OPEB Liability 88.4
Collective Net OPEB Liability December 31, 2017
$493.5

State of Wisconsin Notes to The Financial Statements
_______________________________________________________________________________________________________________________________________________
For the Fiscal Year Ended June 30, 2018 119
At June 30, 2018, deferred outflows of resources and deferred
inflows of resources related to OPEB from the following sources
were reported:
Outflows Inflows
Primary Government
State of Wisconsin
Difference between Expected
and Actual Experience -
$2,181,173
Changes of Assumptions $20,300,117
Change in Proportion Share 4,875,029
Net Difference Between
Projected and Actual Earnings
on OPEB Plan Investments
2,288,588
Subtotal $27,463,734 $2,181,173
University of WI System
Difference between Expected
and Actual Experience -
$1,917,278
Changes of Assumptions $17,844,053
Change in Proportion Share - 6,313,448
Net Difference Between
Projected and Actual Earnings
on OPEB Plan Investments
2,011,697
Subtotal $19,855,750 $8,230,726
Component Units
UW Hospital and Clinics
Difference between Expected
and Actual Experience -
$400,328
Changes of Assumptions $3,725,842
Change in Proportion Share 1,379,813
Net Difference Between
Projected and Actual Earnings
on OPEB Plan Investments
420,043
Subtotal $5,525,698 $400,328
WI Housing & Economic
Development Authority
Difference between Expected
and Actual Experience -
$12,009
Changes of Assumptions $111,764
Change in Proportion Share 21,836
Net Difference Between
Projected and Actual Earnings
on OPEB Plan Investments
12,600
Subtotal $146,200 $12,009
WI Economic Development
Corp.
Difference between Expected
and Actual Experience -
$4,867
Changes of Assumptions $45,301
Change in Proportion Share 36,771
Net Difference Between
Projected and Actual Earnings
on OPEB Plan Investments
5,107
Subtotal $87,179 $4,867
Total All Employers $53,078,561 $10,829,103
Amounts reported as deferred outflows of resources and deferred
inflows of resources related to OPEB will be recognized in future
OPEB expense as follows:
Amount Primary Government State of Wisconsin FY 2019 $4,309,920 FY 2020 4,309,920
FY 2021 4,309,920 FY 2022 4,309,920 FY 2023 3,751,729 Thereafter 3,826,761 University of WI System FY 2019 $2,072,492
FY 2020 2,072,492
FY 2021 2,072,492
FY 2022 2,072,492
FY 2023 1,581,835
Thereafter 1,613,474
Component Units UW Hospital and Clinics FY 2019 $996,502
FY 2020 996,502
FY 2021 996,502
FY 2022 996,502
FY 2023 865,158
Thereafter 882,463
WI Housing & Economic Development
Authority FY 2019 $22,919
FY 2020 22,919
FY 2021 22,919
FY 2022 22,919
FY 2023 19,845
Thereafter 20,244
WI Economic Development Corp. FY 2019 $13,810
FY 2020 13,810
FY 2021 13,810
FY 2022 13,810
FY 2023 12,565
Thereafter 12,815
Total All Employers $42,249,458
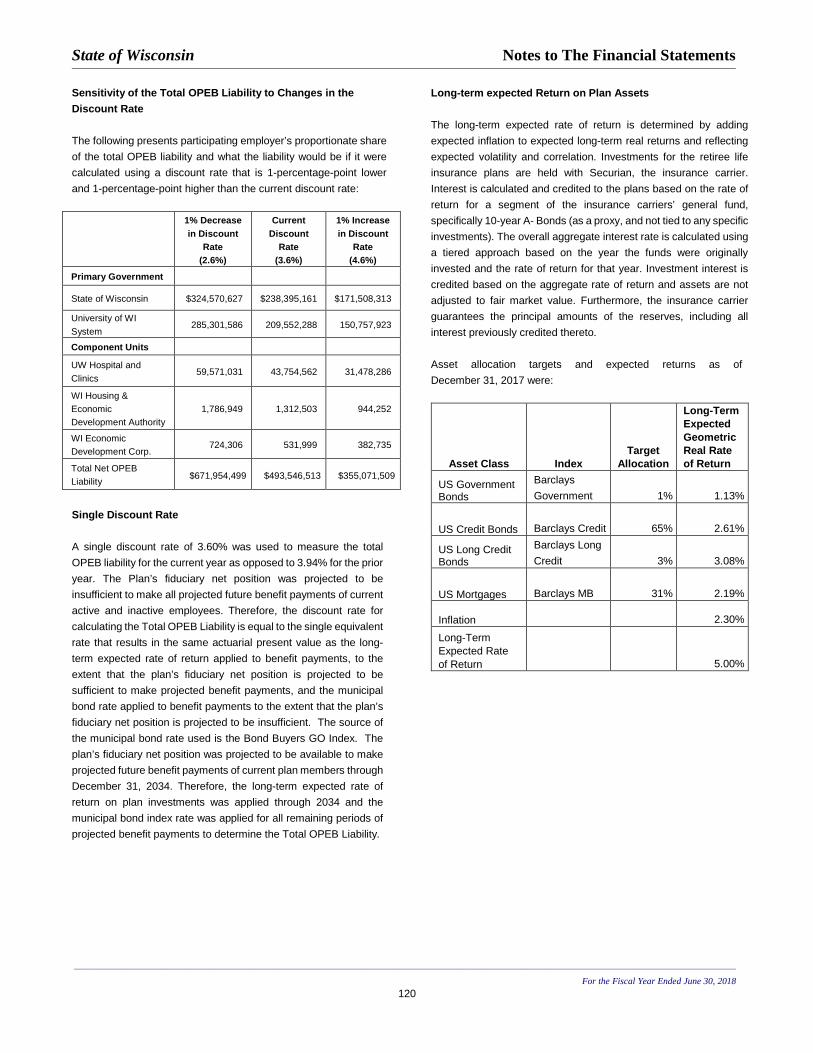
State of Wisconsin Notes to The Financial Statements
_______________________________________________________________________________________________________________________________________________
For the Fiscal Year Ended June 30, 2018 120
Sensitivity of the Total OPEB Liability to Changes in the Discount Rate The following presents participating employer’s proportionate share
of the total OPEB liability and what the liability would be if it were
calculated using a discount rate that is 1-percentage-point lower
and 1-percentage-point higher than the current discount rate:
1% Decrease in Discount
Rate (2.6%)
Current Discount
Rate (3.6%)
1% Increase in Discount
Rate (4.6%)
Primary Government
State of Wisconsin $324,570,627 $238,395,161 $171,508,313
University of WI
System 285,301,586 209,552,288 150,757,923
Component Units
UW Hospital and
Clinics 59,571,031 43,754,562 31,478,286
WI Housing &
Economic
Development Authority
1,786,949 1,312,503 944,252
WI Economic
Development Corp. 724,306 531,999 382,735
Total Net OPEB
Liability $671,954,499 $493,546,513 $355,071,509
Single Discount Rate
A single discount rate of 3.60% was used to measure the total
OPEB liability for the current year as opposed to 3.94% for the prior
year. The Plan’s fiduciary net position was projected to be
insufficient to make all projected future benefit payments of current
active and inactive employees. Therefore, the discount rate for
calculating the Total OPEB Liability is equal to the single equivalent
rate that results in the same actuarial present value as the long-
term expected rate of return applied to benefit payments, to the
extent that the plan’s fiduciary net position is projected to be
sufficient to make projected benefit payments, and the municipal
bond rate applied to benefit payments to the extent that the plan’s
fiduciary net position is projected to be insufficient. The source of
the municipal bond rate used is the Bond Buyers GO Index. The
plan’s fiduciary net position was projected to be available to make
projected future benefit payments of current plan members through
December 31, 2034. Therefore, the long-term expected rate of
return on plan investments was applied through 2034 and the
municipal bond index rate was applied for all remaining periods of
projected benefit payments to determine the Total OPEB Liability.
Long-term expected Return on Plan Assets
The long-term expected rate of return is determined by adding
expected inflation to expected long-term real returns and reflecting
expected volatility and correlation. Investments for the retiree life
insurance plans are held with Securian, the insurance carrier.
Interest is calculated and credited to the plans based on the rate of
return for a segment of the insurance carriers’ general fund,
specifically 10-year A- Bonds (as a proxy, and not tied to any specific
investments). The overall aggregate interest rate is calculated using
a tiered approach based on the year the funds were originally
invested and the rate of return for that year. Investment interest is
credited based on the aggregate rate of return and assets are not
adjusted to fair market value. Furthermore, the insurance carrier
guarantees the principal amounts of the reserves, including all
interest previously credited thereto.
Asset allocation targets and expected returns as of
December 31, 2017 were:
Asset Class Index Target
Allocation
Long-Term Expected Geometric Real Rate of Return
US Government Bonds
Barclays
Government 1% 1.13%
US Credit Bonds Barclays Credit 65% 2.61%
US Long Credit Bonds
Barclays Long
Credit 3% 3.08%
US Mortgages Barclays MB 31% 2.19%
Inflation 2.30%
Long-Term
Expected Rate
of Return 5.00%

State of Wisconsin Notes to The Financial Statements
_______________________________________________________________________________________________________________________________________________
For the Fiscal Year Ended June 30, 2018 121
Actuarial assumptions
Actuarial assumptions are based on the Wisconsin Retirement
System experience study conducted in 2015 using experience from
2012 to 2014. The projections of cash flows used to determine the
single discount rate assumed that employer contributions will be
made according to the current employer contributions schedule
and that contributions are made by plan members retiring prior to
age 65. The total OPEB liability in the January 1, 2017, actuarial
valuation was determined using the following actuarial
assumptions, applied to all periods included in the measurement:
Actuarial Valuation Date: January 1, 2017
Measurement Date of Net OPEB
Liability:
December 31, 2017
Actuarial Cost Method: Entry Age Normal
20 Year Tax-Exempt Municipal
Bond Yield:
3.44%
Long-Term Expected Rated of
Return:
5.00%
Discount Rate: 3.60%
Salary Increases
Inflation:
Seniority/Merit:
3.20%
0.2% - 5.6%
Mortality: WI 2012 Mortality Table
OPEB plan fiduciary net position. Detailed information about the
OPEB plan’s fiduciary net position is available in separately issued
financial statements from ETF. The report can be obtained at
www.etf.wi.gov and on request from:
The Department of Employee Trust Funds
4822 Madison Yards Way
Madison, Wisconsin 53705-9100
State of Wisconsin Notes to The Financial Statements
For the Fiscal Year Ended June 30, 2018
122
NOTE 18. PUBLIC ENTITY RISK POOLS ADMINISTERED BY THE DEPARTMENT OF EMPLOYEE TRUST FUNDS
The Department of Employee Trust Funds operates four public
entity risk pools: group health insurance, group income continuation
insurance, duty disability insurance, and life insurance. ETF’s
separately issued financial statements, which contain historical
trend, revenue, and claims development information, are available
at www.etf.wi.gov and on request from:
Wisconsin Department of Employee Trust Funds
PO Box 7931
Madison, WI 53707-7931
1-877-533-5020
The information provided in this note applies to the period ending
December 31, 2017.
A. Description of Funds
The Health Insurance Fund offers group health insurance for
current employees of the State government and of participating
local public employers. All public employers in the State are eligible
to participate. Approximately 354 local employers plus the State
currently participate. The State and local government portions of
the fund are accounted for separately and have separate
contribution rates, benefits, and actuarial valuations. The fund
includes both a self-insured, fee-for-service plan as well as various
prepaid plans, primarily Health Maintenance Organizations
(HMO's) and a self-insured plan that provides for pharmacy benefits
of covered members.
The Income Continuation Insurance Fund offers disability wage
continuation insurance for current employees of the State
government and of participating local public employers. All public
employers in the State are eligible to participate. Approximately
219 local employers plus the State currently participate. The State
and local government portions of the fund are accounted for
separately and have separate contribution rates, benefits, and
actuarial valuations. The plan is self-insured.
The Duty Disability Fund offers special disability insurance for State
of Wisconsin and local WRS participants in protective occupations.
Participation in the program is mandatory for all WRS employers
with protective occupation employees. The State of Wisconsin and
494 local employers currently participate. The plan is self-insured,
and the risk is shared between the State of Wisconsin and local
government employers in the plan. Contributions are actuarially
determined and are employer paid. Contributions are based on a
graduated, experience-rated formula.
B. Accounting Policies for Risk Pools
Basis of Accounting - All Public Entity Risk Pools are accounted for
in enterprise funds using the full accrual basis of accounting and
the flow of economic resources measurement focus.
Valuation of Investments - Assets of the Health Insurance Fund
Income Continuation Insurance and Duty Disability Insurance funds
are invested in the Core Retirement Investment Trust. Investments
are valued at fair value.
Unpaid Claims Liabilities - Claims liabilities are based on estimates
of the ultimate cost of claims that have been reported but not
settled, and of claims that have been incurred but not reported. The
estimate includes the effects of inflation and other societal and
economic factors. Adjustments to claims liabilities are charged or
credited to expense in the periods in which they are made. Unpaid
claims liability is presented at face value and is not discounted for
health insurance. It is discounted using an interest rate of
7.2 percent for income continuation and duty disability insurance.
The liabilities for income continuation, duty disability, and health
insurance were determined by actuarial methods.
Administrative Expenses - All maintenance expenses are expensed
in the period in which they are incurred. Acquisition costs are
immaterial and are treated as maintenance expenses.
Reinsurance - Health insurance plans provided by HMO's and
health insurance for local government annuitants are fully insured
by outside insurers. All remaining risk is self-insured with no
reinsurance coverage.
Risk Transfer - Participating employers are not subject to
supplemental assessments in the event of deficiencies. If the
assets of the fund were exhausted, participating employers would
not be responsible for the fund's liabilities.
Premium Setting - Premiums are established by the GIB (Health
Insurance and ICI) and ETF Board for Duty Disability in consultation
with actuaries.

State of Wisconsin Notes to The Financial Statements
For the Fiscal Year Ended June 30, 2018
123
C. Unpaid Claims Liabilities
As discussed in Section B of this Note, each fund establishes a
liability for both reported and unreported insured events, which is
an estimate of future payments of losses. The following represents
changes in those aggregate liabilities for the nonreinsured portion
of each fund during Calendar Year 2017 (in millions):
2017 2016 2017 2016 2017 2016 2017 2016 2017 2016
Unpaid claims and claimadjustment expenses atbeginning of the calendaryear $ 93.5 $ 87.1 $ 453.4 $ 418.9 $ 2.0 $ 1.9 $ (15.0) $ (19.5) $ 1.9 $ 0.0
Incurred claims and claimadjustment expenses:Provision for insured events of
the current calendar year 17.7 20.7 19.2 11.9 16.0 15.1 164.5 156.0 44.4 44.1
Changes in provision for insured
events of prior calendar years1.1 6.8 27.2 57.0 (0.2) (0.6) (4.9) 14.4 (0.1) 0.0
Total incurred claims and claim
adjustment expenses 18.8 27.5 46.4 68.9 15.8 14.5 159.6 170.4 44.3 44.1
Payments:Claims and claim adjustment
expenses attributable to insured
events of the current calendar
year 4.6 5.6 0.0 0.1 14.2 13.1 183.3 171.0 43.4 42.2
Claims and claim adjustment
expenses attributable to insured
events of prior calendar years15.0 15.6 35.0 34.3 1.8 1.3 (19.9) (5.1) 1.8 0.0
Total payments 19.6 21.2 35.0 34.4 16.0 14.4 163.4 165.9 45.2 42.2
Total unpaid claims and claim adjustment expenses at end of the calendar year $ 92.7 $ 93.4 $ 464.8 $ 453.4 $ 1.8 $ 2.0 $ (18.8) * $ (15.0) * $ 1.0 $ 1.9
* Total unpaid claims at the end of 2017 is the net of $4.4 million in unpaid claims and $23.2 million in rebates due from pharmaceutical companies; unpaid claims at the
end of 2016 is the net of $4.5 million in unpaid claims and $19.5 million in rebates due from pharmaceutical companies.
** Prior to 2017, the Duty Disability fund w as reported as a f iduciary fund rather than a proprietary (i.e. risk pool) fund. The beginning year value noted above w as the
result of a prior period adjustment to restate the Duty Disability fund as a risk pool.
Income Continuation Insurance
Duty Disability Insurance **
Health Insurance Pharmacy Benefits Dental
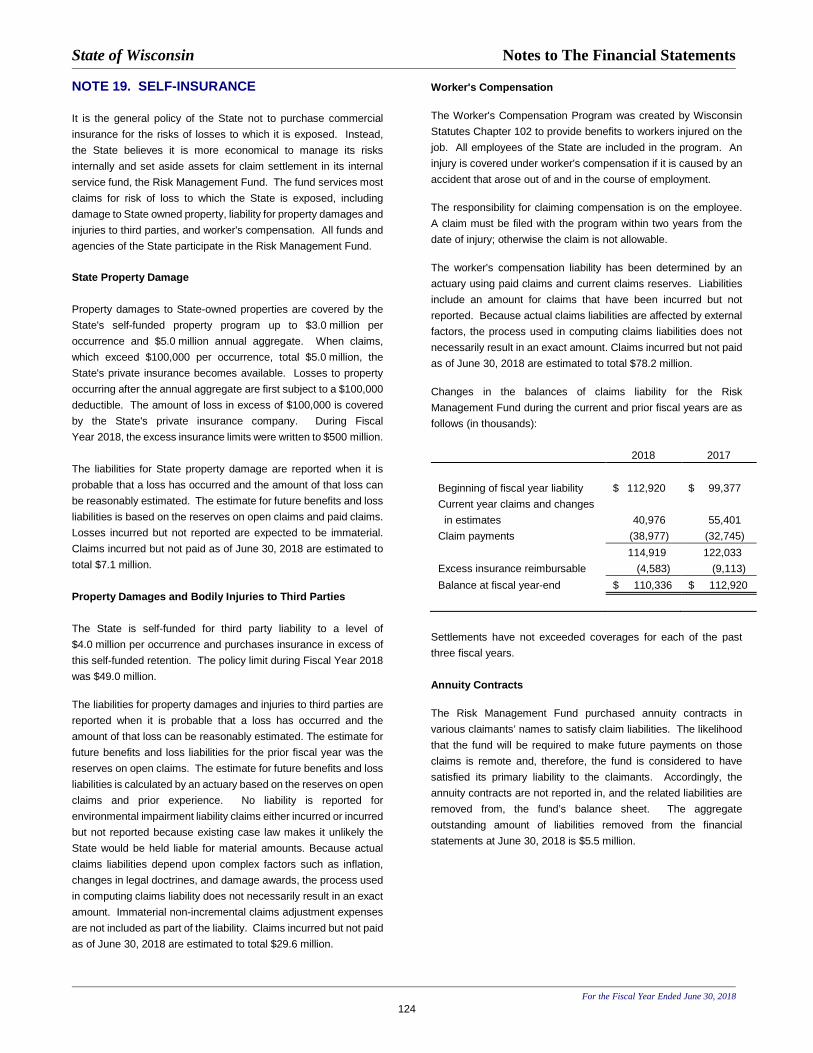
State of Wisconsin Notes to The Financial Statements
For the Fiscal Year Ended June 30, 2018
124
NOTE 19. SELF-INSURANCE It is the general policy of the State not to purchase commercial
insurance for the risks of losses to which it is exposed. Instead,
the State believes it is more economical to manage its risks
internally and set aside assets for claim settlement in its internal
service fund, the Risk Management Fund. The fund services most
claims for risk of loss to which the State is exposed, including
damage to State owned property, liability for property damages and
injuries to third parties, and worker's compensation. All funds and
agencies of the State participate in the Risk Management Fund.
State Property Damage
Property damages to State-owned properties are covered by the
State's self-funded property program up to $3.0 million per
occurrence and $5.0 million annual aggregate. When claims,
which exceed $100,000 per occurrence, total $5.0 million, the
State's private insurance becomes available. Losses to property
occurring after the annual aggregate are first subject to a $100,000
deductible. The amount of loss in excess of $100,000 is covered
by the State's private insurance company. During Fiscal
Year 2018, the excess insurance limits were written to $500 million.
The liabilities for State property damage are reported when it is
probable that a loss has occurred and the amount of that loss can
be reasonably estimated. The estimate for future benefits and loss
liabilities is based on the reserves on open claims and paid claims.
Losses incurred but not reported are expected to be immaterial.
Claims incurred but not paid as of June 30, 2018 are estimated to
total $7.1 million.
Property Damages and Bodily Injuries to Third Parties The State is self-funded for third party liability to a level of
$4.0 million per occurrence and purchases insurance in excess of
this self-funded retention. The policy limit during Fiscal Year 2018
was $49.0 million.
The liabilities for property damages and injuries to third parties are
reported when it is probable that a loss has occurred and the
amount of that loss can be reasonably estimated. The estimate for
future benefits and loss liabilities for the prior fiscal year was the
reserves on open claims. The estimate for future benefits and loss
liabilities is calculated by an actuary based on the reserves on open
claims and prior experience. No liability is reported for
environmental impairment liability claims either incurred or incurred
but not reported because existing case law makes it unlikely the
State would be held liable for material amounts. Because actual
claims liabilities depend upon complex factors such as inflation,
changes in legal doctrines, and damage awards, the process used
in computing claims liability does not necessarily result in an exact
amount. Immaterial non-incremental claims adjustment expenses
are not included as part of the liability. Claims incurred but not paid
as of June 30, 2018 are estimated to total $29.6 million.
Worker's Compensation
The Worker's Compensation Program was created by Wisconsin
Statutes Chapter 102 to provide benefits to workers injured on the
job. All employees of the State are included in the program. An
injury is covered under worker's compensation if it is caused by an
accident that arose out of and in the course of employment.
The responsibility for claiming compensation is on the employee.
A claim must be filed with the program within two years from the
date of injury; otherwise the claim is not allowable.
The worker's compensation liability has been determined by an
actuary using paid claims and current claims reserves. Liabilities
include an amount for claims that have been incurred but not
reported. Because actual claims liabilities are affected by external
factors, the process used in computing claims liabilities does not
necessarily result in an exact amount. Claims incurred but not paid
as of June 30, 2018 are estimated to total $78.2 million.
Changes in the balances of claims liability for the Risk
Management Fund during the current and prior fiscal years are as
follows (in thousands):
2018 2017
Beginning of fiscal year liability $ 112,920 $ 99,377
Current year claims and changes
in estimates 40,976 55,401
Claim payments (38,977) (32,745)
114,919 122,033
Excess insurance reimbursable (4,583) (9,113)
Balance at fiscal year-end $ 110,336 $ 112,920
Settlements have not exceeded coverages for each of the past
three fiscal years.
Annuity Contracts
The Risk Management Fund purchased annuity contracts in
various claimants’ names to satisfy claim liabilities. The likelihood
that the fund will be required to make future payments on those
claims is remote and, therefore, the fund is considered to have
satisfied its primary liability to the claimants. Accordingly, the
annuity contracts are not reported in, and the related liabilities are
removed from, the fund’s balance sheet. The aggregate
outstanding amount of liabilities removed from the financial
statements at June 30, 2018 is $5.5 million.

State of Wisconsin Notes to The Financial Statements
For the Fiscal Year Ended June 30, 2018
125
NOTE 20. INSURANCE FUNDS A. Local Government Property Insurance Fund
The purpose of the Local Government Property Insurance Fund is
to provide property insurance coverage to tax-supported local
government units such as counties, towns, villages, cities, school
districts and library boards. Property insured includes government
buildings, schools, libraries and motor vehicles. Coverage is
available on an optional basis. As of June 30, 2018, the Local
Government Property Insurance Fund insured 30 local
governmental units. The total amount of insurance in force as of
June 30, 2018 was $.2 billion.
The dissolution of the fund was included in 2017 Wis. Act 59, the
State’s biennial budget act, enacted in September 2017. The fund
will continue to provide coverage through December 31, 2018.
Valuation of Cash Equivalents and Investments - All investments
of the Local Government Property Insurance Fund are managed
by the State of Wisconsin Investment Board, as discussed in Note
5-B to the financial statements. At June 30, 2018, the fund had
$1.29 million shares in the State Investment Fund which are
considered cash equivalents.
Premium - Unearned premium reported as unearned revenue
represents the daily pro rata portion of premium written which is
applicable to the unexpired terms of the insurance policies in force.
Policies are generally written for annual terms.
Unpaid Loss Liabilities - The Local Government Property Insurance
Fund establishes the unpaid loss liability titled future benefits and
loss liabilities on the financial statements based on estimates of the
ultimate cost of losses (including future loss adjustment expenses)
that have been reported but not settled, and of losses that have
been incurred but not reported. Estimated amounts of excess-of-
loss insurance recoverable on unpaid losses are deducted from the
liability for unpaid losses. Loss liabilities are recomputed
periodically to produce current estimates that reflect recent
settlements, loss frequency, and other economic factors.
Adjustments to future benefits and loss liabilities are charged or
credited to expense in the periods in which they are made.
Policy Acquisition Costs - Since the Local Government Property
Insurance Fund has no marketing staff and incurs no sales
commissions, acquisition costs are minimal and charged to
operations as incurred.
Excess-of-Loss Insurance Coverage - The Local Government
Property Insurance Fund purchases excess-of-loss insurance
coverage, the operation of which is analogous to “reinsurance,” to
reduce its exposure to large losses on all types of insured events.
Excess-of-loss insurance permits recovery of a portion of losses
from the excess-of-loss insurers, although it does not discharge the
primary liability of the fund as direct insurer of the risks reinsured.
The fund does not report excess-of-loss insured risks as liabilities
unless it is probable that those risks will not be covered by excess-
of-loss insurers. As of June 30, 2018, the fund had a $0.5 million
combined single limit retention for each occurrence. Only loss
occurrences over $10.0 thousand are included in the recoverable
calculation. Premiums ceded to excess-of-loss insurers, which is
netted against premium revenue (charges for goods and services
in the financial statements), amounted to $261.0 thousand during
the fiscal year. Excess-of-loss and adjusting expense recoveries
earned would typically reduce claims paid (benefit expense on the
financial statements). During the fiscal year the losses recovered
through excess-of-loss insurance was $(2.6) million.

State of Wisconsin Notes to The Financial Statements
For the Fiscal Year Ended June 30, 2018
126
Unpaid Loss Liabilities
As discussed above, the Local Government Property Insurance
Fund establishes a liability for both reported and unreported
insured events, which includes estimates of both future payments
of losses and related loss expenses. The following represents
changes in those aggregate liabilities for the fund during the past
two fiscal years (in thousands):
2018 2017
Unpaid loss liabilities
at beginning of the year $7,184 $12,037
Less: Excess-of-loss insurance
recoverable
4,532
5,699
Net unpaid loss liabilities at beginning
of year 2,652 6,338
Incurred losses and loss
expenses:
Provision for insured events of the
current year 3,059 2,215
Increase (decrease) in provision for
insured events of prior years (276) 1,723
Total incurred losses and loss
expenses 2,783 3,938
Payments:
Losses and loss
expenses attributable to insured
events of the current year 2,064 574
Losses and loss
expenses attributable to insured
events prior years 2,701 7,050
Total payments 4,765 7,624
Net unpaid loss liabilities
at end of year 670 2,652
Plus: Excess-of-loss liabilities
recoverable
4,828
4,532
Total unpaid loss liabilities
at end of year $5,498 $7,184
Trend Information Historical trend information showing revenue and claims
development information is presented in the Office of the
Commissioner of Insurance June 30, 2018 financial statements.
Copies of these statements may be requested from:
Office of the Commissioner of Insurance
125 South Webster Street
Madison, Wisconsin 53703
B. State Life Insurance Fund
The State Life Insurance Fund was created under Chapter 607,
Wisconsin Statutes, to offer life insurance to residents of Wisconsin
in a manner similar to private insurers. This fund functions much
like a mutual life insurance company and is subject to the same
regulatory requirements as any life insurance company licensed to
operate in Wisconsin.
Premiums are reported as earned when due. Benefits and
expenses are associated with earned premiums so as to result in
recognition of profits over the life of the contracts. This association
is accomplished by means of the provision for liabilities for future
benefits and the amortization of acquisition costs.
The State Life Insurance Fund does not pay commissions nor does
it incur agent expenses.

State of Wisconsin Notes to The Financial Statements
For the Fiscal Year Ended June 30, 2018
127
Future benefits and loss liabilities have been computed by the net
level premium method based upon estimated future investment
yield and mortality. The composition of liabilities and the more
material assumptions pertinent thereto are presented below
(in thousands):
Ordinary Life Amount of Issue Insurance Policy Year in Force Liability
1913-1966 $ 6,333 5,086
1967-1976 24,556 15,540
1977-1985 61,986 25,339
1986-1994 44,529 10,210
1995-2012 43,383 8,143
2013+ 5,511 434
$ 186,298 $ 64,752
Bases of Assumptions
Issue Interest Year Rate Mortality 1913-1966 3.0% American Experience, ANB*
1967-1976 3.0 1958 CSO, ALB, Unisex
1977-1985 4.0 1958 CSO, ALB, Female Setback
3 years
1986-1994 5.0 1980 CSO, ALB, Aggregate
1995-2008 4.0 1980 CSO, ALB, Aggregate
2009-2012 4.0 2001 CSO, ALB, Aggregate
2013+ 3.5 2001 CSO, ALB, Aggregate
* Age Next Birthday
All of the State Life Insurance Fund's life insurance in force is
participating. This Fund is required by statute to maintain surplus
at a level between 7 percent and 10 percent of statutory admitted
assets as far as practicably possible. All excess surplus is to be
returned to the policyholders in the form of policyholder dividends.
Policyholder dividends are declared each year in order to achieve
the required level of surplus.
The statutory assets at December 31, 2017 were $111.9 million
and statutory capital and surplus was $7.9 million. Fund equity at
June 30, 2018 was $19.5 million.
C. Injured Patients and Families Compensation Fund
The Injured Patients and Families Compensation Fund was
created in 1975 for the purpose of providing excess medical
malpractice coverage for claims exceeding the legal primary
insurance limits prescribed in Wis. Stat. Section 655.23(4), or the
maximum liability limit for which the health care provider is insured,
whichever limit is greater. Management of the Fund is vested with
a 13-member Board of Governors, which is chaired by the
Commissioner of Insurance. Most health care providers
permanently practicing or operating in the State of Wisconsin are
required to pay Injured Patients and Families Compensation Fund
assessment fees. Risk of loss is retained by the Fund.
The Future Benefits and Loss Liability account includes individual
case estimates for reported losses and estimates for incurred but
not reported losses based upon the projected ultimate losses
recommended by a consulting actuary. The liability for incurred but
not reported losses as of June 30, 2018, is determined by
deducting individual case estimates of the liability for reported
losses and net losses paid from inception of the Fund, and adding
a risk margin to the projected ultimate loss liabilities, as follows (in
thousands):
Projected ultimate loss liability $ 1,108,669
Less: Net loss paid from inception (874,412)
Less: Liability for reported losses (16,995)
Risk Margin 58,564
Liability for incurred but not reported losses $ 275,826
The Future Benefits and Loss Liability account also includes an
estimate of the loss adjustment expense (LAE). Using the data
available through September 30 of the fiscal year, the actuary
estimated the liability for LAE as 34 percent of the estimated unpaid
losses as of June 30, 2018. The percentage used in the financial
statements was different, since the actuary’s estimate was
adjusted to reflect actual LAE payments. Specifically, the loss
adjustment expenses paid from the inception of the Fund through
June 30, 2018, are deducted from the projected ultimate LAE to
determine the liability for LAE as June 30, 2018 as follows (in
thousands):
Projected ultimate LAE liability $ 155,691
Less: LAE paid from inception (103,001)
Risk Margin 13,173
Liability for LAE $ 65,863
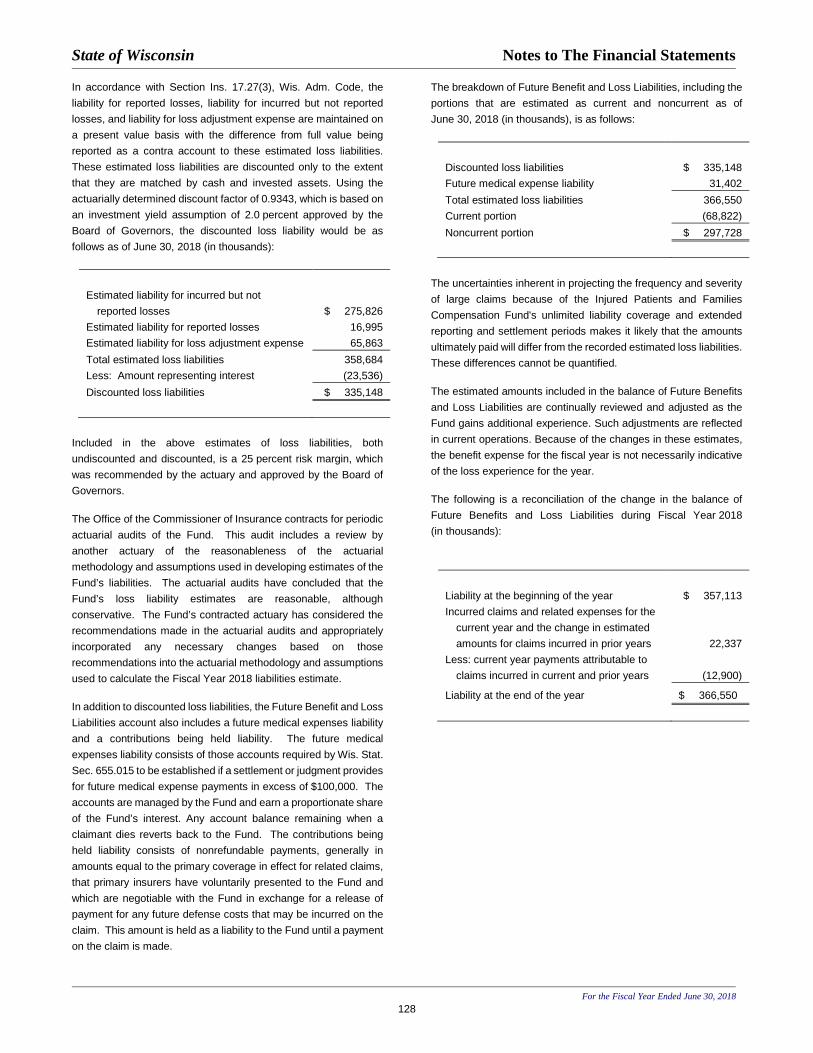
State of Wisconsin Notes to The Financial Statements
For the Fiscal Year Ended June 30, 2018
128
In accordance with Section Ins. 17.27(3), Wis. Adm. Code, the
liability for reported losses, liability for incurred but not reported
losses, and liability for loss adjustment expense are maintained on
a present value basis with the difference from full value being
reported as a contra account to these estimated loss liabilities.
These estimated loss liabilities are discounted only to the extent
that they are matched by cash and invested assets. Using the
actuarially determined discount factor of 0.9343, which is based on
an investment yield assumption of 2.0 percent approved by the
Board of Governors, the discounted loss liability would be as
follows as of June 30, 2018 (in thousands):
Estimated liability for incurred but not
reported losses $ 275,826
Estimated liability for reported losses 16,995
Estimated liability for loss adjustment expense 65,863
Total estimated loss liabilities 358,684
Less: Amount representing interest (23,536)
Discounted loss liabilities $ 335,148
Included in the above estimates of loss liabilities, both
undiscounted and discounted, is a 25 percent risk margin, which
was recommended by the actuary and approved by the Board of
Governors.
The Office of the Commissioner of Insurance contracts for periodic
actuarial audits of the Fund. This audit includes a review by
another actuary of the reasonableness of the actuarial
methodology and assumptions used in developing estimates of the
Fund’s liabilities. The actuarial audits have concluded that the
Fund’s loss liability estimates are reasonable, although
conservative. The Fund’s contracted actuary has considered the
recommendations made in the actuarial audits and appropriately
incorporated any necessary changes based on those
recommendations into the actuarial methodology and assumptions
used to calculate the Fiscal Year 2018 liabilities estimate.
In addition to discounted loss liabilities, the Future Benefit and Loss
Liabilities account also includes a future medical expenses liability
and a contributions being held liability. The future medical
expenses liability consists of those accounts required by Wis. Stat.
Sec. 655.015 to be established if a settlement or judgment provides
for future medical expense payments in excess of $100,000. The
accounts are managed by the Fund and earn a proportionate share
of the Fund’s interest. Any account balance remaining when a
claimant dies reverts back to the Fund. The contributions being
held liability consists of nonrefundable payments, generally in
amounts equal to the primary coverage in effect for related claims,
that primary insurers have voluntarily presented to the Fund and
which are negotiable with the Fund in exchange for a release of
payment for any future defense costs that may be incurred on the
claim. This amount is held as a liability to the Fund until a payment
on the claim is made.
The breakdown of Future Benefit and Loss Liabilities, including the
portions that are estimated as current and noncurrent as of
June 30, 2018 (in thousands), is as follows:
Discounted loss liabilities $ 335,148
Future medical expense liability 31,402
Total estimated loss liabilities 366,550
Current portion (68,822)
Noncurrent portion $ 297,728
The uncertainties inherent in projecting the frequency and severity
of large claims because of the Injured Patients and Families
Compensation Fund's unlimited liability coverage and extended
reporting and settlement periods makes it likely that the amounts
ultimately paid will differ from the recorded estimated loss liabilities.
These differences cannot be quantified.
The estimated amounts included in the balance of Future Benefits
and Loss Liabilities are continually reviewed and adjusted as the
Fund gains additional experience. Such adjustments are reflected
in current operations. Because of the changes in these estimates,
the benefit expense for the fiscal year is not necessarily indicative
of the loss experience for the year.
The following is a reconciliation of the change in the balance of
Future Benefits and Loss Liabilities during Fiscal Year 2018
(in thousands):
Liability at the beginning of the year $ 357,113
Incurred claims and related expenses for the
current year and the change in estimated
amounts for claims incurred in prior years
22,337
Less: current year payments attributable to
claims incurred in current and prior years
(12,900)
Liability at the end of the year $ 366,550

State of Wisconsin Notes to The Financial Statements
For the Fiscal Year Ended June 30, 2018 129
NOTE 21. DEFERRED OUTFLOWS OF RESOURCES AND DEFERRED INFLOWS OF RESOURCES Deferred outflows and resources and deferred inflows of resources at June 30, 2018 were as follows (in thousands):
General TransportationCapital
ImprovementNonmajor
Governmental Internal ServiceFull Accrual Adjustments
Total Governmental
ActivitiesDeferred Outflows of ResourcesAccumulated Decreases in the Fair Value of Hedging Derivatives $ - $ - $ - $ - $ - $ 107,902 $ 107,902 Debt Refunding - - - - 3,739 257,549 261,288 Advances by the State - 142 - - - - 142 Differences Between Expected and Actual Pension Experience - - - - 9,264 476,284 485,549
Changes of Pension Assumption - - - - 1,446 74,004 75,450 Changes in Proportion and Differences Between Actual and Proportionate Share of Contributions - - - - 154 8,263 8,417 Pension Contributions Subsequent to the Measurement Date - - - - 1,265 69,061 70,326 Other (includes Life and Health OPEBs) - - - - 903 40,144 41,047
Total Deferred Outflows of Resources $ - $ 142 $ - $ - $ 16,771 $ 1,033,207 1,050,120
General TransportationCapital
ImprovementNonmajor
Governmental Internal ServiceFull Accrual Adjustments
Total Governmental
ActivitiesDeferred Inflows of ResourcesDebt Refunding $ - $ - $ - $ - $ 331 $ 11,715 $ 12,046 Unavailable Revenue 269,834 379 - 8,212 - (278,425) - Differences Between Expected and
Actual Pension Experience - - - - 4,349 222,601 226,949
Actual Earnings on Pension Investments - - - - 10,074 514,762 524,835 Changes in Proportion and Differences Between Actual and Proportionate Share of Contributions - - - - 112 5,783 5,895 Other (includes Life and Health OPEBs) - - - - 701 43,680 44,380
Total Deferred Inflows of Resources $ 269,834 $ 379 $ - $ 8,212 $ 15,565 $ 520,116 $ 814,106
Injured Patients and Family
CompensationEnvironmental Improvement
University of Wisconsin
SystemUnemployment
ReserveNonmajor Enterprise
Total Business-Type Activities
Deferred Outflows of ResourcesDebt Refunding $ - $ 2,175 $ 50,910 $ - $ 931 $ 54,016 Advances by the State - - - - 43,466 43,466 Differences Between Expected and Actual Pension Experience 126 97 507,041 - 56,761 564,025
Changes of Pension Assumption 19 7 78,850 - 8,895 87,772 Net Difference Between Projected and Actual Earnings on Pension Investments - - 25 - - 25 Changes in Proportion and Differences Between Actual and Proportionate Share of Contributions 2 2 - - 910 914 Pension Contributions Subsequent to the Measurement Date 15 16 74,807 - 8,260 83,098 Other (includes Life and Health OPEBs) 14 6 38,836 - 5,563 44,419
Total Deferred Outflows of Resources $ 176 $ 2,303 $ 750,469 $ - $ 124,787 $ 877,735
Injured Patients and Family
CompensationEnvironmental Improvement
University of Wisconsin
SystemUnemployment
ReserveNonmajor Enterprise
Total Business-Type Activities
Deferred Inflows of ResourcesDebt Refunding $ - $ - $ 576 $ - $ 59 $ 635 Differences Between Expected and
Actual Pension Experience 56 22 237,177 - 26,757 264,012
Actual Earnings on Pension Investments 137 104 548,498 - 61,815 610,554 Changes in Proportion and Differences Between Actual and Proportionate Share of Contributions 2 1 4,967 - 657 5,626 Other (includes Life and Health OPEBs) 12 6 58,398 - 6,114 64,530
Total Deferred Inflows of Resources $ 206 $ 134 $ 849,615 $ - $ 95,402 $ 945,357
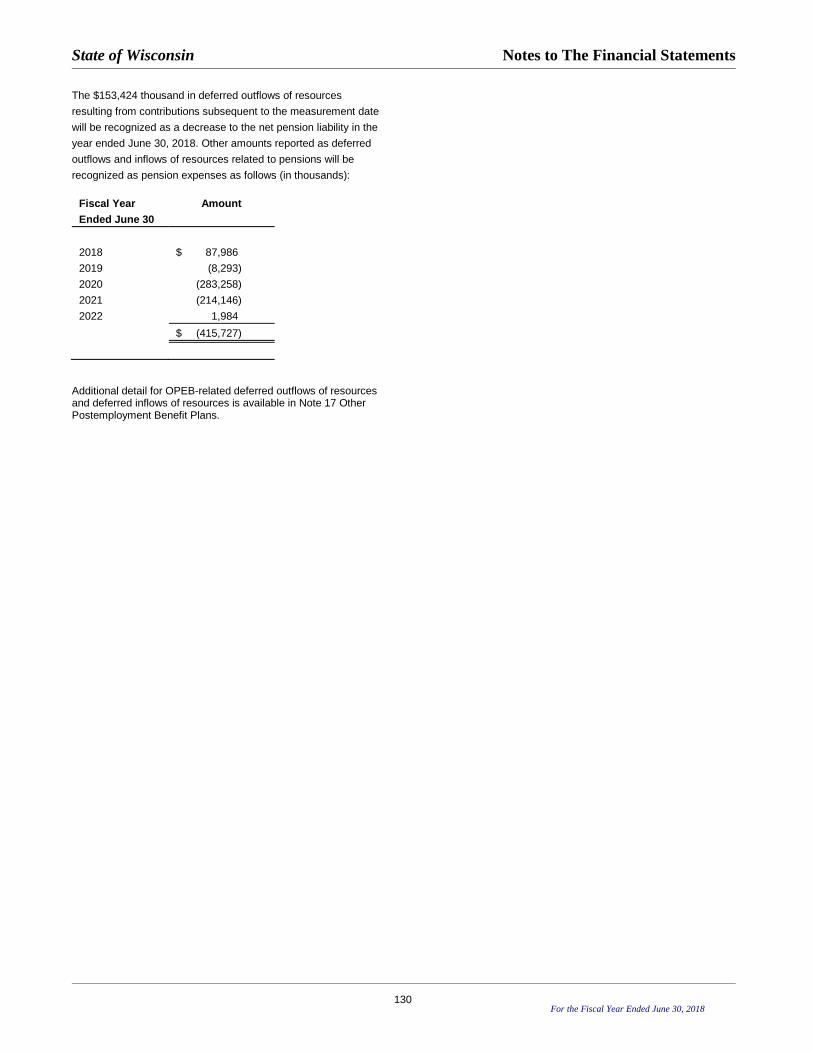
State of Wisconsin Notes to The Financial Statements
For the Fiscal Year Ended June 30, 2018 130
The $153,424 thousand in deferred outflows of resources
resulting from contributions subsequent to the measurement date
will be recognized as a decrease to the net pension liability in the
year ended June 30, 2018. Other amounts reported as deferred
outflows and inflows of resources related to pensions will be
recognized as pension expenses as follows (in thousands):
Fiscal Year Ended June 30
Amount
2018 $ 87,986
2019 (8,293)
2020 (283,258)
2021 (214,146)
2022 1,984
$ (415,727)
Additional detail for OPEB-related deferred outflows of resources and deferred inflows of resources is available in Note 17 Other Postemployment Benefit Plans.
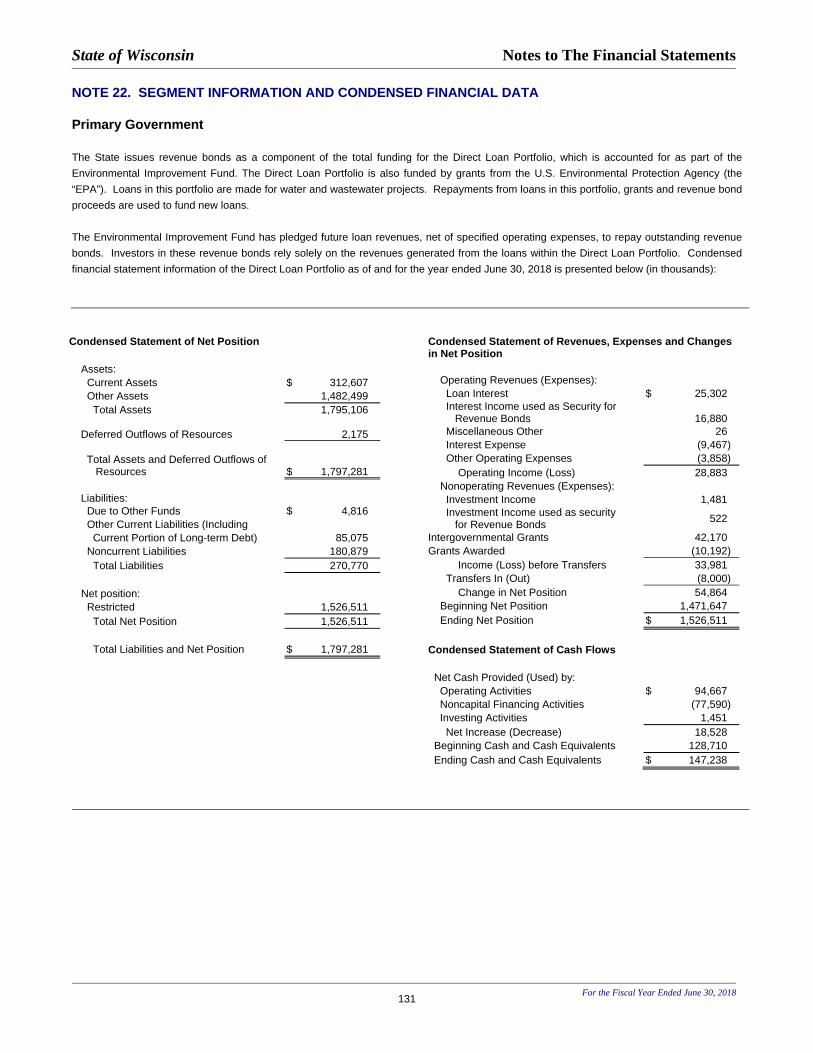
State of Wisconsin Notes to The Financial Statements
For the Fiscal Year Ended June 30, 2018
131
NOTE 22. SEGMENT INFORMATION AND CONDENSED FINANCIAL DATA
Primary Government
The State issues revenue bonds as a component of the total funding for the Direct Loan Portfolio, which is accounted for as part of the
Environmental Improvement Fund. The Direct Loan Portfolio is also funded by grants from the U.S. Environmental Protection Agency (the
“EPA”). Loans in this portfolio are made for water and wastewater projects. Repayments from loans in this portfolio, grants and revenue bond
proceeds are used to fund new loans.
The Environmental Improvement Fund has pledged future loan revenues, net of specified operating expenses, to repay outstanding revenue
bonds. Investors in these revenue bonds rely solely on the revenues generated from the loans within the Direct Loan Portfolio. Condensed
financial statement information of the Direct Loan Portfolio as of and for the year ended June 30, 2018 is presented below (in thousands):
Condensed Statement of Net Position
Assets:
Current Assets $ 312,607
Other Assets 1,482,499
Total Assets 1,795,106 Deferred Outflows of Resources 2,175
Total Assets and Deferred Outflows of Resources $ 1,797,281
Liabilities:
Due to Other Funds $ 4,816
Other Current Liabilities (Including
Current Portion of Long-term Debt) 85,075
Noncurrent Liabilities 180,879
Total Liabilities 270,770
Net position:
Restricted 1,526,511
Total Net Position 1,526,511
Total Liabilities and Net Position $ 1,797,281
Condensed Statement of Revenues, Expenses and Changes in Net Position
Operating Revenues (Expenses):
Loan Interest $ 25,302
Interest Income used as Security for Revenue Bonds
16,880
Miscellaneous Other 26
Interest Expense (9,467)
Other Operating Expenses (3,858)
Operating Income (Loss) 28,883
Nonoperating Revenues (Expenses):
Investment Income 1,481
Investment Income used as security for Revenue Bonds
522
Intergovernmental Grants 42,170
Grants Awarded (10,192)
Income (Loss) before Transfers 33,981
Transfers In (Out) (8,000)
Change in Net Position 54,864
Beginning Net Position 1,471,647
Ending Net Position $ 1,526,511
Condensed Statement of Cash Flows
Net Cash Provided (Used) by:
Operating Activities $ 94,667
Noncapital Financing Activities (77,590)
Investing Activities 1,451
Net Increase (Decrease) 18,528
Beginning Cash and Cash Equivalents 128,710
Ending Cash and Cash Equivalents $ 147,238
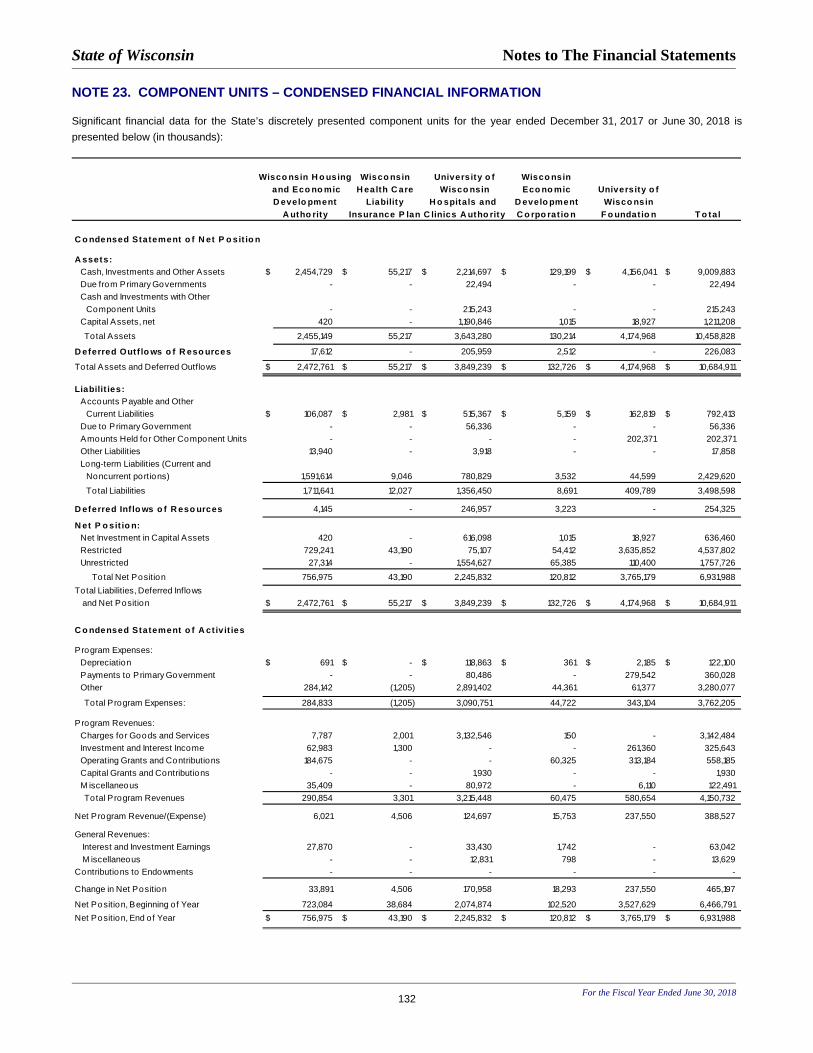
State of Wisconsin Notes to The Financial Statements
For the Fiscal Year Ended June 30, 2018
132
NOTE 23. COMPONENT UNITS – CONDENSED FINANCIAL INFORMATION
Significant financial data for the State’s discretely presented component units for the year ended December 31, 2017 or June 30, 2018 is
presented below (in thousands):
Wisco nsin H o using Wisco nsin University o f Wisco nsin and Eco no mic H ealth C are Wisco nsin Eco no mic University o fD evelo pment Liability H o spitals and D evelo pment Wisco nsin
A utho rity Insurance P lan C linics A utho rity C o rpo rat io n F o undat io n T o tal
C o ndensed Statement o f N et P o sit io n
A ssets: Cash, Investments and Other Assets $ 2,454,729 $ 55,217 $ 2,214,697 $ 129,199 $ 4,156,041 $ 9,009,883
Due from Primary Governments - - 22,494 - - 22,494
Cash and Investments with Other
Component Units - - 215,243 - - 215,243
Capital Assets, net 420 - 1,190,846 1,015 18,927 1,211,208
Total Assets 2,455,149 55,217 3,643,280 130,214 4,174,968 10,458,828
D eferred Outf lo ws o f R eso urces 17,612 - 205,959 2,512 - 226,083
Total Assets and Deferred Outflows $ 2,472,761 $ 55,217 $ 3,849,239 $ 132,726 $ 4,174,968 $ 10,684,911
Liabilit ies: Accounts Payable and Other
Current Liabilities $ 106,087 $ 2,981 $ 515,367 $ 5,159 $ 162,819 $ 792,413
Due to Primary Government - - 56,336 - - 56,336
Amounts Held for Other Component Units - - - - 202,371 202,371
Other Liabilities 13,940 - 3,918 - - 17,858
Long-term Liabilities (Current and
Noncurrent portions) 1,591,614 9,046 780,829 3,532 44,599 2,429,620
Total Liabilities 1,711,641 12,027 1,356,450 8,691 409,789 3,498,598
D eferred Inf lo ws o f R eso urces 4,145 - 246,957 3,223 - 254,325
N et P o sit io n: Net Investment in Capital Assets 420 - 616,098 1,015 18,927 636,460
Restricted 729,241 43,190 75,107 54,412 3,635,852 4,537,802
Unrestricted 27,314 - 1,554,627 65,385 110,400 1,757,726
To tal Net Position 756,975 43,190 2,245,832 120,812 3,765,179 6,931,988
Total Liabilities, Deferred Inflows
and Net Position $ 2,472,761 $ 55,217 $ 3,849,239 $ 132,726 $ 4,174,968 $ 10,684,911
C o ndensed Statement o f A ct ivit ies
Program Expenses:
Depreciation $ 691 $ - $ 118,863 $ 361 $ 2,185 $ 122,100
Payments to Primary Government - - 80,486 - 279,542 360,028
Other 284,142 (1,205) 2,891,402 44,361 61,377 3,280,077
Total Program Expenses: 284,833 (1,205) 3,090,751 44,722 343,104 3,762,205
Program Revenues:
Charges for Goods and Services 7,787 2,001 3,132,546 150 - 3,142,484
Investment and Interest Income 62,983 1,300 - - 261,360 325,643
Operating Grants and Contributions 184,675 - - 60,325 313,184 558,185
Capital Grants and Contributions - - 1,930 - - 1,930
M iscellaneous 35,409 - 80,972 - 6,110 122,491
Total Program Revenues 290,854 3,301 3,215,448 60,475 580,654 4,150,732
Net Program Revenue/(Expense) 6,021 4,506 124,697 15,753 237,550 388,527
General Revenues:
Interest and Investment Earnings 27,870 - 33,430 1,742 - 63,042
M iscellaneous - - 12,831 798 - 13,629
Contributions to Endowments - - - - - -
Change in Net Position 33,891 4,506 170,958 18,293 237,550 465,197
Net Position, Beginning of Year 723,084 38,684 2,074,874 102,520 3,527,629 6,466,791
Net Position, End of Year $ 756,975 $ 43,190 $ 2,245,832 $ 120,812 $ 3,765,179 $ 6,931,988
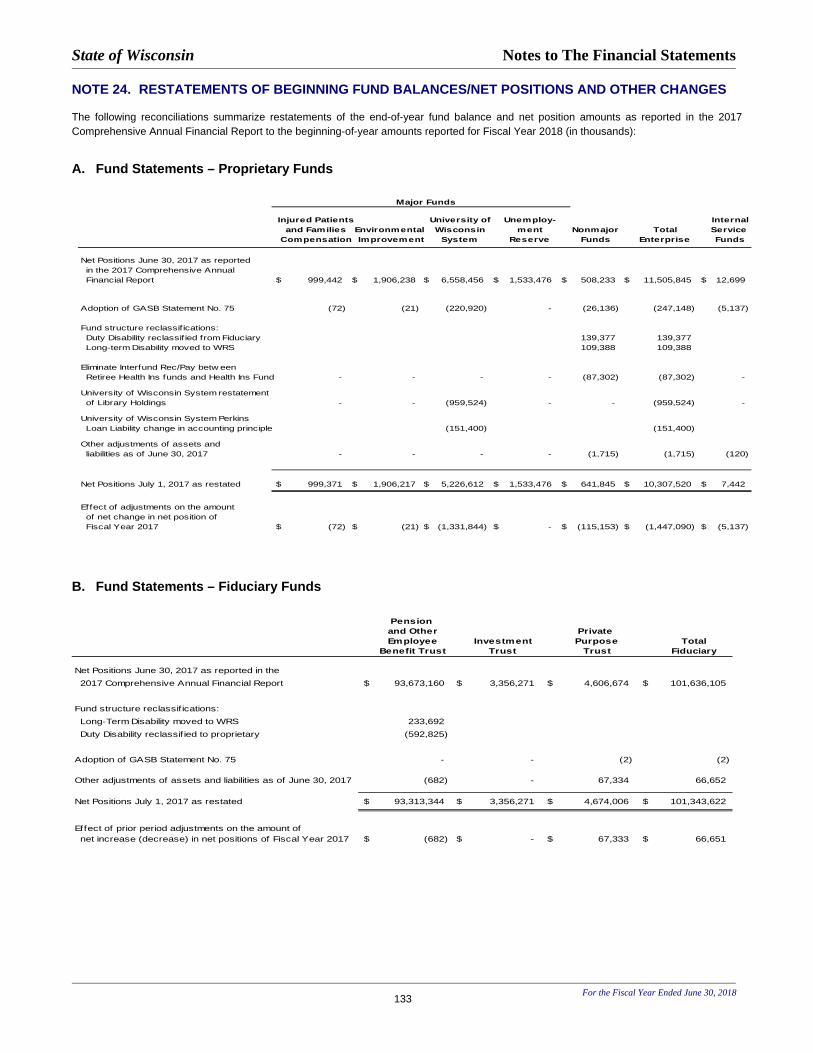
State of Wisconsin Notes to The Financial Statements
For the Fiscal Year Ended June 30, 2018
133
NOTE 24. RESTATEMENTS OF BEGINNING FUND BALANCES/NET POSITIONS AND OTHER CHANGES
The following reconciliations summarize restatements of the end-of-year fund balance and net position amounts as reported in the 2017
Comprehensive Annual Financial Report to the beginning-of-year amounts reported for Fiscal Year 2018 (in thousands):
A. Fund Statements – Proprietary Funds
Major Funds
Injured Patients University of Unemploy- Internaland Families Environmental Wisconsin ment Nonmajor Total Service
Compensation Improvement System Reserve Funds Enterprise Funds
Net Positions June 30, 2017 as reported
in the 2017 Comprehensive Annual
Financial Report $ 999,442 $ 1,906,238 $ 6,558,456 $ 1,533,476 $ 508,233 $ 11,505,845 $ 12,699
Adoption of GASB Statement No. 75 (72) (21) (220,920) - (26,136) (247,148) (5,137)
Fund structure reclassif ications:
Duty Disability reclassif ied from Fiduciary 139,377 139,377
Long-term Disability moved to WRS 109,388 109,388
Eliminate Interfund Rec/Pay betw een
Retiree Health Ins funds and Health Ins Fund - - - - (87,302) (87,302) -
University of Wisconsin System restatement
of Library Holdings - - (959,524) - - (959,524) -
University of Wisconsin System Perkins
Loan Liability change in accounting principle (151,400) (151,400)
Other adjustments of assets and
liabilities as of June 30, 2017 - - - - (1,715) (1,715) (120)
Net Positions July 1, 2017 as restated $ 999,371 $ 1,906,217 $ 5,226,612 $ 1,533,476 $ 641,845 $ 10,307,520 $ 7,442
Effect of adjustments on the amount
of net change in net position of
Fiscal Year 2017 $ (72) $ (21) $ (1,331,844) $ - $ (115,153) $ (1,447,090) $ (5,137)
B. Fund Statements – Fiduciary Funds
Pension and Other Private Employee Investment Purpose Total
Benefit Trust Trust Trust Fiduciary
Net Positions June 30, 2017 as reported in the
2017 Comprehensive Annual Financial Report $ 93,673,160 $ 3,356,271 $ 4,606,674 $ 101,636,105
Fund structure reclassif ications:
Long-Term Disability moved to WRS 233,692
Duty Disability reclassif ied to proprietary (592,825)
Adoption of GASB Statement No. 75 - - (2) (2)
Other adjustments of assets and liabilities as of June 30, 2017 (682) - 67,334 66,652
Net Positions July 1, 2017 as restated $ 93,313,344 $ 3,356,271 $ 4,674,006 $ 101,343,622
Effect of prior period adjustments on the amount of
net increase (decrease) in net positions of Fiscal Year 2017 $ (682) $ - $ 67,333 $ 66,651

State of Wisconsin Notes to The Financial Statements
For the Fiscal Year Ended June 30, 2018
134
2BC. Government-wide Statements
Primary GovernmentGovernmental Business-type
Activities Activities Totals
Net Positions June 30, 2017 as reported in the
2017 Comprehensive Annual Financial Report $ 13,099,538 $ 11,505,724 $ 24,605,262
Capital projects corrections (1,003) (1,003)
Capital asset correction (16,505) (16,505)
Transportation capital asset corrections (2,477) - (2,477)
Adoption of GASB Statement No. 75 (198,638) (247,148) (445,786)
Fund structure reclassif ications 248,765 248,765
Eliminate Interfund Rec/Pay betw een
Retiree Health Ins funds and Health Ins Fund (87,302) (87,302)
University of Wisconsin System restatement
of Library Holdings (959,524) (959,524)
University of Wisconsin System Perkins
Loan Liability change in accounting principle - (151,400) (151,400)
Other adjustments of assets and liabilities as of June 30, 2017 (5,257) (1,716) (6,973)
Net Positions July 1, 2017 as restated $ 12,875,658 $ 10,307,399 $ 23,183,058
Effect of adjustments on the amount of net increase
(decrease) in net positions of Fiscal Year 2017 $ (223,759) $ (1,447,090) $ (1,670,849)
State of Wisconsin Notes to The Financial Statements
For the Fiscal Year Ended June 30, 2018
135
NOTE 25. LITIGATION, CONTINGENCIES AND COMMITMENTS A. Litigation and Contingencies
The State is a participant in various legal proceedings pertaining to
matters incidental to the performance of routine governmental
operations.
The State accrues liabilities related to legal proceedings, if a loss
is probable and reasonably estimable. Such losses, totaling
$17.2 million on June 30, 2018 reported in the governmental
activities, are discussed below:
The Work Injury Supplemental Benefit Fund, administered by the
Department of Workforce Development, provides compensatory
payments to survivors of fatally injured employees or disabled
employees with work-related injuries. The liability for annuities to
be paid totaled $0.6 million at June 30, 2018.
In September 2008, the Internal Revenue Service (IRS) provided
the State of Wisconsin Investment Board (SWIB) a Notice of
Transferee Liability. This claim seeks taxes, penalties and interest
relating to the sale of Shockley Communications Corporation
(SCC) stock in 2001.
The IRS asserts that the shareholders’ sale of SCC stock in 2001
should have been characterized as a sale of assets by SCC, on
which SCC should have paid income taxes. SWIB filed a petition
in the United States Tax Court contesting the proposed IRS
assessment for the taxes, plus penalties and interest. In 2015, the
Tax Court found that the principal shareholders of SCC were liable
as putative transferees for the tax, penalties and interest owed by
SCC related to its sale. In October 2017 the 11th Circuit Court of
Appeals upheld the 2015 opinion.
Although SWIB plans to continue to aggressively contest the IRS’
assertions, the estimated minimum possible loss of $16.6 million
has been accrued. The potential liability is estimated to be
between $16.6 million and $53.8 million.
Other Claims, Judgments, and Contingencies
The State is also named as a party in other legal proceedings
where the ultimate disposition and consequence are not presently
determinable. The potential loss amount relating to an unfavorable
outcome for certain of these proceedings could not be reasonably
determined at this time. However, the ultimate dispositions and
consequences of any single legal proceeding or all legal
proceedings collectively should not have a material adverse effect
on the State's financial position.
Volkswagen Group of America and certain related entities admitted
to violating the federal Clean Air Act from 2009 through 2016.
Volkswagen partially settled its civil liability for these Clean Air Act
violations by entering into judicial consent decrees. These judicial
settlements require Volkswagen to pay more than $2.9 billion into
an Environmental Mitigation Trust Fund administered by
Wilmington Trust, N.A. The State of Wisconsin is a designated
beneficiary and will receive $67.1 million over ten years.
2017 Wisconsin Act 59, appropriated $42 million of Wisconsin's
share of the Volkswagen trust funds for replacement of eligible
state fleet vehicles and establishment of a transit capital assistance
grant program. The Department of Administration created a
competitive statewide grant program to award trust funds to eligible
applicants for the replacement of public transit vehicles.
Expenditures funded from the trust are first expected in FY 2019.
The University of Wisconsin Hospital and Clinics Authority
(UWHCA) makes annual payments to the Department of
Administration (DOA) for pension and sick leave conversion
amounts for certain former state employees. UWHCA claims that
DOA has charged too much and, since 2016, it has stop making
payments. UWHCA claims it is entitled to a substantial refund. DOA
asserts that UWHCA still must make annual payments through
2032. The parties will be mediating the dispute in December 2018.
In August 2018, the Department of Health Services (DHS) received
notification from the U.S. Department of Health and Human
Services (DHHS) recommending a $27.6 million disallowance
related to the Medicaid program. DHHS concluded DHS did not
refund the full federal share of Medicaid-related settlements and
judgements from October 2008 through September 2016. In
September 2018, DHS asserted in a letter to DHHS the amount to
be refunded is $6.1 million.

State of Wisconsin Notes to The Financial Statements
For the Fiscal Year Ended June 30, 2018
136
B. Commitments
Primary Government
As of June 30, 2018, encumbrances of the General Fund totaled
$524.4 million, encumbrances of the Transportation Fund totaled
$1.6 billion, and encumbrances of other non-major governmental
funds totaled $192.8 million. Obligations at June 30, 2018
representing multi-year, long-term commitments included
(in thousands):
Transportation Fund $ 277,729
Capital Improvement Fund – WisDOT Harbors,
Rails and Highway Programs
15,900
Transportation Revenue Bonds Capital
Projects Fund 22,138
General Fund – Housing Programs 23,715
The Environmental Improvement Fund (the Fund) was established
to administer the Clean Water Fund Loan Program. Loans are
made to local units of government for wastewater treatment
projects for terms of up to 20 years. These loans are made at a
number of prescribed interest rates based on environmental
priority. The loans contractually are revenue obligations or general
obligations of the local governmental unit. Additionally, various
statutory provisions exist which provide further security for
payment. The Fund has made financial assistance commitments
of $166.7 million as of June 30, 2018. These loan commitments
are expected to be met through proceeds from issuance of revenue
obligations and additional federal grants.
The Injured Patients and Families Compensation Fund may be
required to purchase an annuity as a result of a claim settlement.
Under specific annuity arrangements, the Fund may have ultimate
responsibility for annuity payments if the annuity company defaults
on annuity payments. The total estimated replacement value of the
Fund’s annuities as of June 30, 2018 was $32.8 million. The
replacement value calculation includes only annuities where the
Fund remains the owner. Annuities with qualified assignments are
no longer included. The Fund reserves the right to pursue
collection from State guarantee funds.
State Public Deposit Guarantee - As required by Wis. Stat.
Sec. 34.08, the State is to make payments to public depositors for
proofs of loss (e.g., loss resulting from a bank failure) up to
$400 thousand per depositor above the amount of federal
insurance. This statutory requirement guarantees that the State
will make payments in favor of the public depositor that has
submitted a proof of loss. Payments would be made in the order
in which satisfactory proofs of loss are received by the State's
Department of Financial Institutions, until the designated
appropriation is exhausted. At June 30, 2018, the appropriation
available totaled $63.9 million. Losses become fixed as of the date
of the loss. A public depositor experiencing a loss must assign its
interest in the deposit, to the extent of the amount paid, to the
Department of Financial Institutions. Any recovery made by the
Department of Financial Institutions under the assignment is to be
repaid to the appropriation. The possibility of a material loss
resulting from payments to and recovery from public depositors is
remote.
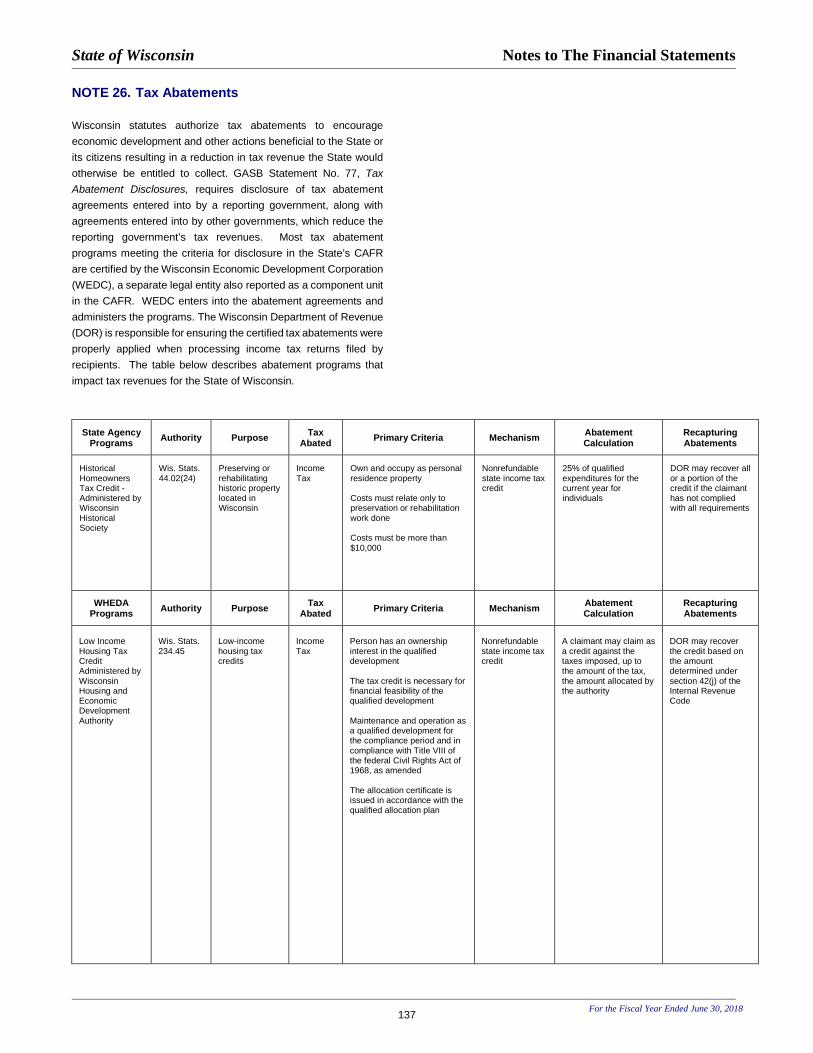
State of Wisconsin Notes to The Financial Statements
For the Fiscal Year Ended June 30, 2018
137
NOTE 26. Tax Abatements Wisconsin statutes authorize tax abatements to encourage
economic development and other actions beneficial to the State or
its citizens resulting in a reduction in tax revenue the State would
otherwise be entitled to collect. GASB Statement No. 77, Tax Abatement Disclosures, requires disclosure of tax abatement
agreements entered into by a reporting government, along with
agreements entered into by other governments, which reduce the
reporting government’s tax revenues. Most tax abatement
programs meeting the criteria for disclosure in the State’s CAFR
are certified by the Wisconsin Economic Development Corporation
(WEDC), a separate legal entity also reported as a component unit
in the CAFR. WEDC enters into the abatement agreements and
administers the programs. The Wisconsin Department of Revenue
(DOR) is responsible for ensuring the certified tax abatements were
properly applied when processing income tax returns filed by
recipients. The table below describes abatement programs that
impact tax revenues for the State of Wisconsin.
State Agency Programs Authority Purpose Tax
Abated Primary Criteria Mechanism Abatement Calculation
Recapturing Abatements
Historical Homeowners Tax Credit -Administered by Wisconsin Historical Society
Wis. Stats. 44.02(24)
Preserving or rehabilitating historic property located in Wisconsin
Income Tax
Own and occupy as personal residence property Costs must relate only to preservation or rehabilitation work done Costs must be more than $10,000
Nonrefundable state income tax credit
25% of qualified expenditures for the current year for individuals
DOR may recover all or a portion of the credit if the claimant has not complied with all requirements
WHEDA Programs Authority Purpose Tax
Abated Primary Criteria Mechanism Abatement Calculation
Recapturing Abatements
Low Income Housing Tax Credit Administered by Wisconsin Housing and Economic Development Authority
Wis. Stats. 234.45
Low-income housing tax credits
Income Tax
Person has an ownership interest in the qualified development The tax credit is necessary for financial feasibility of the qualified development Maintenance and operation as a qualified development for the compliance period and in compliance with Title VIII of the federal Civil Rights Act of 1968, as amended The allocation certificate is issued in accordance with the qualified allocation plan
Nonrefundable state income tax credit
A claimant may claim as a credit against the taxes imposed, up to the amount of the tax, the amount allocated by the authority
DOR may recover the credit based on the amount determined under section 42(j) of the Internal Revenue Code
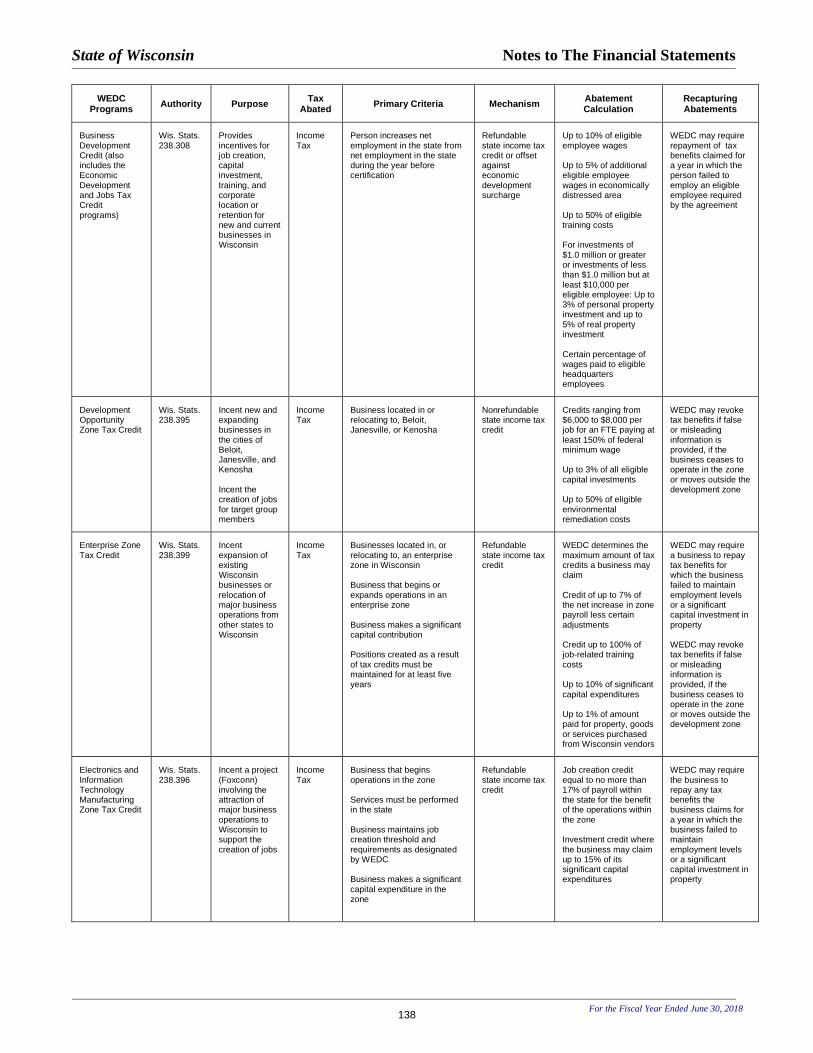
State of Wisconsin Notes to The Financial Statements
For the Fiscal Year Ended June 30, 2018
138
WEDC Programs Authority Purpose Tax
Abated Primary Criteria Mechanism Abatement Calculation
Recapturing Abatements
Business Development Credit (also includes the Economic Development and Jobs Tax Credit programs)
Wis. Stats. 238.308
Provides incentives for job creation, capital investment, training, and corporate location or retention for new and current businesses in Wisconsin
Income Tax
Person increases net employment in the state from net employment in the state during the year before certification
Refundable state income tax credit or offset against economic development surcharge
Up to 10% of eligible employee wages Up to 5% of additional eligible employee wages in economically distressed area Up to 50% of eligible training costs For investments of $1.0 million or greater or investments of less than $1.0 million but at least $10,000 per eligible employee: Up to 3% of personal property investment and up to 5% of real property investment Certain percentage of wages paid to eligible headquarters employees
WEDC may require repayment of tax benefits claimed for a year in which the person failed to employ an eligible employee required by the agreement
Development Opportunity Zone Tax Credit
Wis. Stats. 238.395
Incent new and expanding businesses in the cities of Beloit, Janesville, and Kenosha Incent the creation of jobs for target group members
Income Tax
Business located in or relocating to, Beloit, Janesville, or Kenosha
Nonrefundable state income tax credit
Credits ranging from $6,000 to $8,000 per job for an FTE paying at least 150% of federal minimum wage Up to 3% of all eligible capital investments Up to 50% of eligible environmental remediation costs
WEDC may revoke tax benefits if false or misleading information is provided, if the business ceases to operate in the zone or moves outside the development zone
Enterprise Zone Tax Credit
Wis. Stats. 238.399
Incent expansion of existing Wisconsin businesses or relocation of major business operations from other states to Wisconsin
Income Tax
Businesses located in, or relocating to, an enterprise zone in Wisconsin Business that begins or expands operations in an enterprise zone Business makes a significant capital contribution Positions created as a result of tax credits must be maintained for at least five years
Refundable state income tax credit
WEDC determines the maximum amount of tax credits a business may claim Credit of up to 7% of the net increase in zone payroll less certain adjustments Credit up to 100% of job-related training costs Up to 10% of significant capital expenditures Up to 1% of amount paid for property, goods or services purchased from Wisconsin vendors
WEDC may require a business to repay tax benefits for which the business failed to maintain employment levels or a significant capital investment in property WEDC may revoke tax benefits if false or misleading information is provided, if the business ceases to operate in the zone or moves outside the development zone
Electronics and Information Technology Manufacturing Zone Tax Credit
Wis. Stats. 238.396
Incent a project (Foxconn) involving the attraction of major business operations to Wisconsin to support the creation of jobs
Income Tax
Business that begins operations in the zone Services must be performed in the state Business maintains job creation threshold and requirements as designated by WEDC Business makes a significant capital expenditure in the zone
Refundable state income tax credit
Job creation credit equal to no more than 17% of payroll within the state for the benefit of the operations within the zone Investment credit where the business may claim up to 15% of its significant capital expenditures
WEDC may require the business to repay any tax benefits the business claims for a year in which the business failed to maintain employment levels or a significant capital investment in property
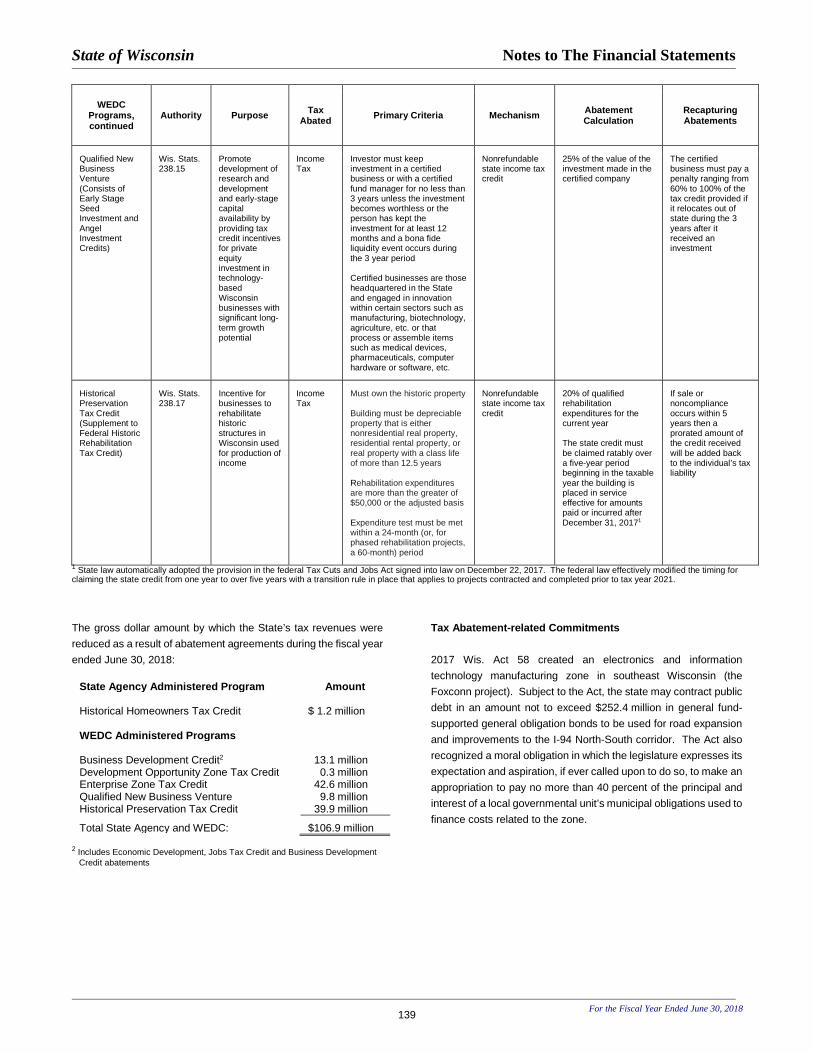
State of Wisconsin Notes to The Financial Statements
For the Fiscal Year Ended June 30, 2018
139
WEDC Programs, continued
Authority Purpose Tax Abated Primary Criteria Mechanism Abatement
Calculation Recapturing Abatements
Qualified New Business Venture (Consists of Early Stage Seed Investment and Angel Investment Credits)
Wis. Stats. 238.15
Promote development of research and development and early-stage capital availability by providing tax credit incentives for private equity investment in technology-based Wisconsin businesses with significant long-term growth potential
Income Tax
Investor must keep investment in a certified business or with a certified fund manager for no less than 3 years unless the investment becomes worthless or the person has kept the investment for at least 12 months and a bona fide liquidity event occurs during the 3 year period Certified businesses are those headquartered in the State and engaged in innovation within certain sectors such as manufacturing, biotechnology, agriculture, etc. or that process or assemble items such as medical devices, pharmaceuticals, computer hardware or software, etc.
Nonrefundable state income tax credit
25% of the value of the investment made in the certified company
The certified business must pay a penalty ranging from 60% to 100% of the tax credit provided if it relocates out of state during the 3 years after it received an investment
Historical Preservation Tax Credit (Supplement to Federal Historic Rehabilitation Tax Credit)
Wis. Stats. 238.17
Incentive for businesses to rehabilitate historic structures in Wisconsin used for production of income
Income Tax
Must own the historic property Building must be depreciable property that is either nonresidential real property, residential rental property, or real property with a class life of more than 12.5 years Rehabilitation expenditures are more than the greater of $50,000 or the adjusted basis Expenditure test must be met within a 24-month (or, for phased rehabilitation projects, a 60-month) period
Nonrefundable state income tax credit
20% of qualified rehabilitation expenditures for the current year The state credit must be claimed ratably over a five-year period beginning in the taxable year the building is placed in service effective for amounts paid or incurred after December 31, 20171
If sale or noncompliance occurs within 5 years then a prorated amount of the credit received will be added back to the individual’s tax liability
1 State law automatically adopted the provision in the federal Tax Cuts and Jobs Act signed into law on December 22, 2017. The federal law effectively modified the timing for claiming the state credit from one year to over five years with a transition rule in place that applies to projects contracted and completed prior to tax year 2021.
The gross dollar amount by which the State’s tax revenues were
reduced as a result of abatement agreements during the fiscal year
ended June 30, 2018:
2 Includes Economic Development, Jobs Tax Credit and Business Development
Credit abatements
Tax Abatement-related Commitments
2017 Wis. Act 58 created an electronics and information
technology manufacturing zone in southeast Wisconsin (the
Foxconn project). Subject to the Act, the state may contract public
debt in an amount not to exceed $252.4 million in general fund-
supported general obligation bonds to be used for road expansion
and improvements to the I-94 North-South corridor. The Act also
recognized a moral obligation in which the legislature expresses its
expectation and aspiration, if ever called upon to do so, to make an
appropriation to pay no more than 40 percent of the principal and
interest of a local governmental unit’s municipal obligations used to
finance costs related to the zone.
State Agency Administered Program Amount Historical Homeowners Tax Credit
$ 1.2 million
WEDC Administered Programs Business Development Credit2
13.1 million
Development Opportunity Zone Tax Credit 0.3 million Enterprise Zone Tax Credit 42.6 million Qualified New Business Venture 9.8 million Historical Preservation Tax Credit 39.9 million
Total State Agency and WEDC: $106.9 million

State of Wisconsin Notes to The Financial Statements
For the Fiscal Year Ended June 30, 2018
140
NOTE 27. SUBSEQUENT EVENTS Primary Government
Long-term Debt
General Obligation Bonds – In October 2018, the State issued
$259.0 million of 2018 Series B general obligation bonds to be used
for the acquisition, construction, development, extension,
enlargement or improvement of land, water, property, highways,
buildings, equipment or facilities for public purposes. The interest
rates associated with these bonds were set at 5.0 percent payable
semiannually beginning May 1, 2019. The bonds mature annually
beginning May 1, 2020 through May 1, 2039.
General Fund Annual Appropriation Bonds – In October 2018, the
State entered into a forward delivery bond purchase agreement for
the issuance of general fund annual appropriation refunding bonds.
Subject to that agreement, the State expects to issue $360.0 million
of Series A general fund annual appropriation refunding bonds in
January 2019 to be used for the current refunding on May 1, 2019
of general fund annual appropriation bonds previously issued.
When issued, the interest rates are expected to be 5.0 percent
payable semiannually beginning May 1, 2019 and maturing May 1,
2021 through 2029.
Environmental Improvement Revenue Bonds – In August 2018, the
State issued $92.1 million of 2018 Series A environmental
improvement fund revenue bonds to make pledged loans for the
program. The interest rate associated with these bonds was set at
5.0 percent payable semiannually beginning December 1, 2018.
The bonds mature annually beginning June 1, 2020 through June
1, 2026.
Certificates of Participation
In August 2018, the State issued $26.6 million of 2018 Series A
master lease certificates of participation to fund Lease Schedules
previously financed through a revolving credit facility, and financing
an additional Lease Schedule. The interest rate associated with
these bonds were set at 3.0 to 5.0 percent payable semiannually
beginning March 1, 2019. The bonds mature semiannually
beginning March 1, 2019 through March 1, 2023.
Moral Obligation Debt
In October 2018, the Secretary of Administration designated the
State’s moral obligation pledge on $120.0 million of Village of
Mount Pleasant Tax Increment Revenue Bonds. This pledge does
not exceed the amount provided for in law for a local governmental
unit’s aggregate municipal obligations issued to finance costs
related to development occurring in, or for the benefit of, the
electronics and information technology manufacturing zone.
Injured Patients and Families Compensation Fund
Under Wis. Stats. 655.015, the Injured Patients and Families
Compensation Fund is charged with: “crediting each claimant's
account with a proportionate share of any interest earned by the
fund, based on that account’s proportionate share of the fund”.
Previously, the interest rate credited to claimants’ accounts had
been based on the interest earnings of the State Investment Fund.
In December 2018, the Board of Governors voted to change the
interest credited to the claimants’ accounts to reflect the interest on
the fixed income investment portfolio, or the State Investment
Fund, whichever is greater, and to apply this change retroactively.
The actual amount of earnings to be credited is unknown, but the
initial estimated amount is approximately $12.0 million.

State of Wisconsin Notes to The Financial Statements
For the Fiscal Year Ended June 30, 2018
141
This page left intentionally blank.

Required Supplementary Information
142

State of Wisconsin Required Supplementary Information
For the Fiscal Year Ended June 30, 2018
143
Postemployment Benefits - State Health Insurance Program Schedule of Changes to the Total OPEB Liability and Related Ratios (in millions)
As of the Measurement Date June 30
2017 Total OPEB Liability
Service cost 72.1
Interest 23.6
Difference between expected & actual experience (4.1)
Changes of assumptions (109.3)
Benefit payments (38.4)
Net Change in Total OPEB Liability (56.0) Total OPEB Liability – Beginning $775.4 Total OPEB Liability – Ending $719.3 Covered-employee payroll $3,690.7
Total OPEB liability as a percentage of covered
19.49%
This schedule will be built prospectively until it contains ten years of data.
Notes to RSI The State Health Insurance OPEB plan does not have assets in trust or equivalent arrangements and is funded on a pay-as-you-go basis. Potential factors that may significantly affect trends in amounts reported include changes to the discount rate, health care trend rates, and participation rate assumptions. Employer benefit payments were actuarially determined and pertain to the implicit rate subsidy.
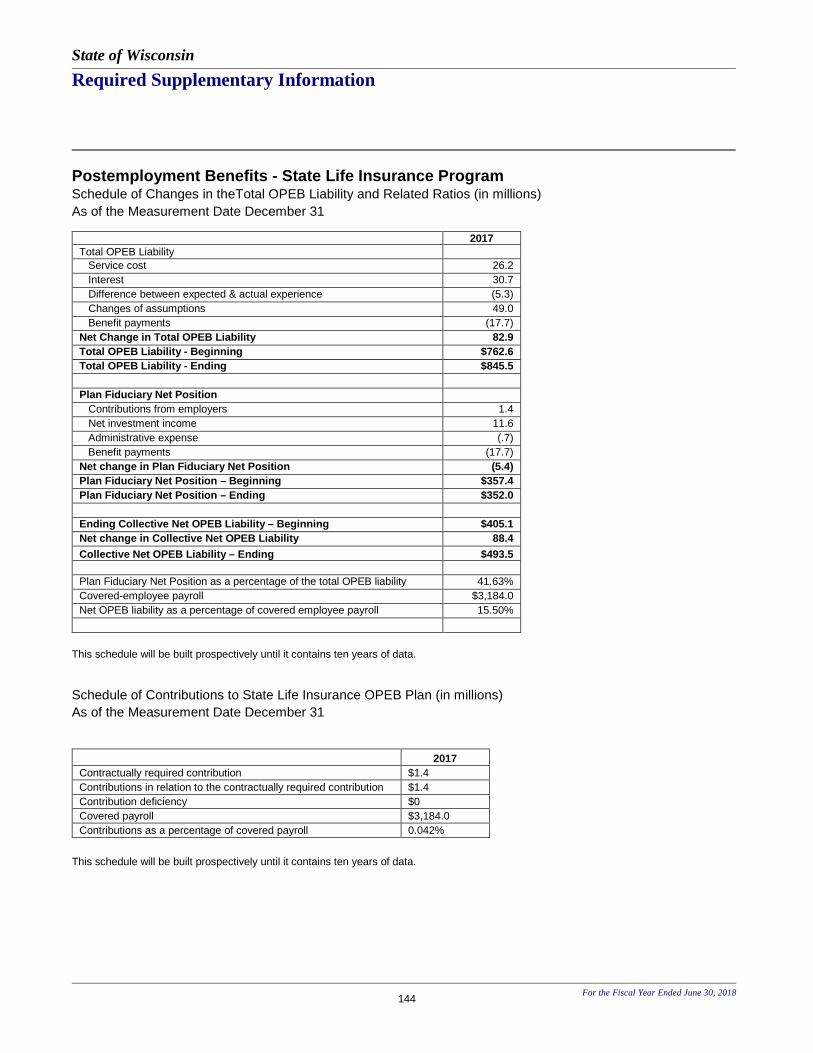
State of Wisconsin Required Supplementary Information
For the Fiscal Year Ended June 30, 2018
144
Postemployment Benefits - State Life Insurance Program Schedule of Changes in theTotal OPEB Liability and Related Ratios (in millions)
As of the Measurement Date December 31
2017 Total OPEB Liability Service cost 26.2 Interest 30.7 Difference between expected & actual experience (5.3) Changes of assumptions 49.0 Benefit payments (17.7) Net Change in Total OPEB Liability 82.9 Total OPEB Liability - Beginning $762.6 Total OPEB Liability - Ending $845.5 Plan Fiduciary Net Position Contributions from employers 1.4 Net investment income 11.6 Administrative expense (.7) Benefit payments (17.7) Net change in Plan Fiduciary Net Position (5.4) Plan Fiduciary Net Position – Beginning $357.4 Plan Fiduciary Net Position – Ending $352.0 Ending Collective Net OPEB Liability – Beginning $405.1 Net change in Collective Net OPEB Liability 88.4 Collective Net OPEB Liability – Ending $493.5 Plan Fiduciary Net Position as a percentage of the total OPEB liability 41.63%
Covered-employee payroll $3,184.0
Net OPEB liability as a percentage of covered employee payroll 15.50%
This schedule will be built prospectively until it contains ten years of data.
Schedule of Contributions to State Life Insurance OPEB Plan (in millions)
As of the Measurement Date December 31
This schedule will be built prospectively until it contains ten years of data.
2017 Contractually required contribution $1.4
Contributions in relation to the contractually required contribution $1.4
Contribution deficiency $0
Covered payroll $3,184.0
Contributions as a percentage of covered payroll 0.042%

State of Wisconsin Required Supplementary Information
For the Fiscal Year Ended June 30, 2018
145
State’s Proportionate Share of the Net Pension Liability or Net Pension (Asset)
The State’s proportionate share of the net pension liability (NPL) or net pension (asset) (NPA) of the Wisconsin Retirement System is provided
below:
State’s State’s State’s Share WRS’ Net Position Proportion Proportionate State’s of the NPL/(NPA) as a Percentage of the Share of Covered as a Percentage of of the Total
Fiscal NPL/(NPA) the NPL/(NPA) Payroll Covered Payroll Pension Liability Year* (a) (b) (c) (b / c) (d)
2018 (27.8%) $ (826,113,891) $3,867,555,186 (21.4%) 102.9%
2017 28.0% $ 232,791,419 $3,806,871,835 6.1% 99.1%
2016 28.1% $ 455,475,378 $3,790,475,424 12.0% 98.2%
2015 (28.0%) $ (686,873,469) $3,735,598,305 (18.4%) 102.7%
* The amounts presented were measured as of the calendar year-end or for the calendar year ended that occurred within the fiscal year listed.
GASB standards require the presentation of 10 years of information. Because fiscal year 2015 was the first year for reporting this information, a
full 10-year schedule will not be available until fiscal year 2024.

State of Wisconsin Required Supplementary Information
For the Fiscal Year Ended June 30, 2018
146
State’s Pension Contributions
The State’s pension contributions to the Wisconsin Retirement System are provided below:
State’s State’s Contributions Actuarially State’s Contribution State’s Made as a Determined Contributions Excess/ Covered Percentage of
Fiscal Contributions Made (Deficiency) Payroll Covered Payroll Year* (a) (b) (b - a) (c) (b / c)
2018 $280,500,929 $280,500,929 $ - $3,867,555,186 7.3%
2017 $263,970,133 $263,970,133 $ - $3,806,871,835 6.9%
2016 $270,985,300 $270,985,300 $ - $3,790,475,424 7.2%
2015 $275,968,183 $275,968,183 $ - $3,735,598,305 7.4%
* The amounts presented were measured for the calendar year ended that occurred within the fiscal year listed.
GASB standards require the presentation of 10 years of information. Because fiscal year 2015 was the first year for reporting this information, a
full 10-year schedule will not be available until fiscal year 2024.

State of Wisconsin Required Supplementary Information
For the Fiscal Year Ended June 30, 2018
147
Infrastructure Assets Reported Using the Modified Approach
The State has adopted the modified approach for reporting
infrastructure assets. Under the modified approach, infrastructure
assets are not depreciated as long as the State can demonstrate
that these assets are properly managed and are being preserved
at or above an established condition level. Instead of depreciation,
the costs to maintain and preserve infrastructure assets are
expensed, while additions and improvements are capitalized. The
State owns approximately 11,200 centerline miles of road and
5,200 bridges.
Road Network
Condition assessments are completed on a two-year cycle with the
most current results reported for each State road. The State
completes the assessment of the Eastern half of the State in one
year and the Western half of the State in the next. Numerous
measures are used to assess the condition of the State’s road
network. The State has adopted the International Roughness
Index (IRI), as defined by the Federal Highway Administration, as
one of its condition measures. IRI is a direct measure of road
roughness, with an IRI of 2.69 mm/m (170 inches/mile) or greater
being defined as a “poor” ride. Roads with a “poor” IRI assessment
may cause negative impacts for the traveling public by decreasing
driver comfort and potentially increasing the damage to vehicles
and goods. It is the State’s policy to ensure no more than
15 percent of its roads receive a “poor” IRI assessment.
Recent condition assessment results are as follows:
Year Miles Percent Variance
Ended of Rated Established Favorable/
June 30 Road “Poor” Percent (Unfavorable)
2018 11,200 7.4 15.0 7.6
2017 11,200 7.4 15.0 7.6
2016 11,200 8.9 15.0 6.1
2015 11,200 7.3 15.0 7.7
2014 11,200 8.3 15.0 6.7
2013 11,200 6.2 15.0 8.8
2012 11,200 7.0* 15.0 8.0
2011 11,200 12.0** 15.0 3.0
2010 11,200 9.3** 15.0 5.7
2009 11,200 6.9 15.0 8.1
* The 2012 decrease in the percentage of roads rated poor is due
to inclusion of new construction in the scope of the condition
assessment. Without such inclusion, the percentage of poor roads
would have been equivalent to the 2011 level. New construction
was included because efficiencies were gained from a new van
used to capture condition assessment data, resulting in new
construction being included in the assessment closer to the
completion date. In prior years, new construction was generally
not included in condition assessments until the following year.
** The 2011 and 2010 increase in the percentage of roads rated
poor compared to previous years is partially attributable to the new
equipment used in assessing the IRI. For 2011, all of the miles
were tested using the new equipment. For 2010, approximately
half of the miles were tested using the new equipment. DOT
officials believe the current data collection methods provide a more
accurate view of existing ride quality because of improvements in
equipment and methodology.
Each year the State estimates the costs to maintain and preserve
the road network at, or above, the established condition level.
Actual maintenance/preservation costs compare to estimates as
follows:
Variance Year Estimated Actual (In millions)
Ended Costs Costs Favorable/ June 30 (In millions) (In millions) (Unfavorable)
2018 $748.0 $616.7 $ 131.3
2017 $770.3 $629.3 $ 141.0
2016 $617.6 $564.7 $ 52.9
2015 $603.4 $643.3 $ (39.9)
2014 $619.4 $605.9 $ 13.5
2013 580.9 561.8 19.1
2012 611.0 585.3 25.7
2011 606.7 705.7 (99.0)
2010 660.7 669.1 (8.4)
2009 647.7 624.4 23.3
Estimated costs are developed at the beginning of the fiscal year
based on projects planned for the current and future years. The
types of projects ultimately contracted and incurring costs during
the year are often very different. In addition, the State of
Wisconsin, Department of Transportation’s multi-year contracting
process, allowing encumbrances to carry forward, makes a
comparison of actual to estimated amounts difficult since
expenditures for the current year may have been budgeted and
committed to a project in prior years.

State of Wisconsin Required Supplementary Information
For the Fiscal Year Ended June 30, 2018
148
Bridge Network
Condition assessments are completed on a two-year cycle, with
more frequent inspections completed if warranted. The most
current assessment results are reported for each State bridge,
making the overall assessment a blend of measures completed in
the current fiscal year and those completed in the prior year.
The structural condition rating is a broad measure of the condition
of a bridge. Each bridge is rated using three National Bridge
Inventory (NBI) condition codes and two NBI appraisal ratings. The
three NBI condition codes are Deck Condition, Superstructure
Condition, and Substructure Condition. The two NBI appraisal
ratings are Structural Evaluation and Waterway Adequacy. The
NBI uses a 10-point scale for condition codes and appraisal ratings.
A bridge is considered “structurally deficient” if any condition code
is 4 or less, or if either appraisal code is 2 or less.
“Structurally deficient” bridges cause negative impacts for the
public by increasing the likelihood that heavy loads will need to be
rerouted to less efficient routes, thus increasing logistic costs for State businesses. It is the State’s policy to ensure no more than
15 percent of its bridges are “structurally deficient”.
Recent condition assessment results are as follows:
Year Number Percent Variance Ended of Structurally Established Favorable/
June 30 Bridges Deficient Percent (Unfavorable) 2018 5,200 3.0 15.0 12.0
2017 5,200 3.1 15.0 11.9
2016 5,200 3.1 15.0 11.9
2015 5,200 3.2 15.0 11.8
2014 5,100 3.3 15.0 11.7
2013 5,100 3.1 15.0 11.9
2012 5,100 3.3 15.0 11.7
2011 5,100 3.6 15.0 11.4
2010 5,000 4.1 15.0 10.9
2009 5,000 3.8 15.0 11.2
Each year, the State estimates the costs to maintain and preserve
the bridge network at, or above, the established condition level.
Actual maintenance/preservation costs compare to estimates as
follows:
Variance Year Estimated Actual (In millions)
Ended Costs Costs Favorable/ June 30 (In millions) (In millions) (Unfavorable)
2018 $92.1 $89.9 $2.2
2017 $56.9 $59.3 $(2.4)
2016 $78.6 $128.3 $(49.7)
2015 57.1 164.4 (107.3)
2014 261.2 131.0 130.2
2013 123.2 115.3 7.9
2012 101.9 61.1 40.8
2011 42.4 64.2 (21.8)
2010 91.7 93.0 (1.3)
2009 55.9 56.9 (1.0)
Estimated costs are developed at the beginning of the fiscal year
based on projects planned for the current and future years. The
types of projects ultimately contracted and incurring costs during
the year are often very different. The State of Wisconsin,
Department of Transportation’s multi-year contracting process,
allowing encumbrances to carry forward, makes a comparison of
actual to estimated amounts difficult since expenditures for the
current year may have been budgeted and committed to a project
in prior years. Estimated and actual costs for 2014 have been
restated from amounts reported in prior years due to an error in
classification of costs on a capital project as
maintenance/preservation costs.
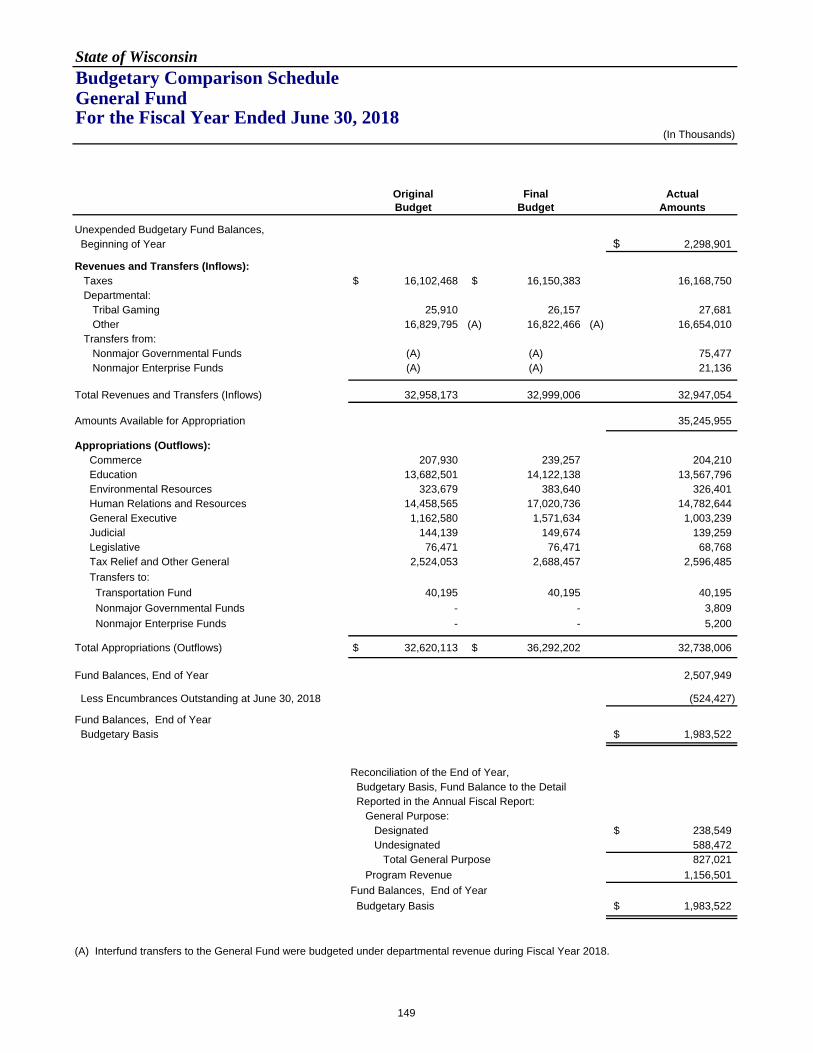
State of WisconsinBudgetary Comparison Schedule General Fund For the Fiscal Year Ended June 30, 2018
(In Thousands)
Original Final ActualBudget Budget Amounts
Unexpended Budgetary Fund Balances,
Beginning of Year $ 2,298,901
Revenues and Transfers (Inflows): Taxes $ 16,102,468 $ 16,150,383 16,168,750
Departmental:
Tribal Gaming 25,910 26,157 27,681
Other 16,829,795 (A) 16,822,466 (A) 16,654,010
Transfers from:
Nonmajor Governmental Funds (A) (A) 75,477
Nonmajor Enterprise Funds (A) (A) 21,136
Total Revenues and Transfers (Inflows) 32,958,173 32,999,006 32,947,054
Amounts Available for Appropriation 35,245,955
Appropriations (Outflows): Commerce 207,930 239,257 204,210
Education 13,682,501 14,122,138 13,567,796
Environmental Resources 323,679 383,640 326,401
Human Relations and Resources 14,458,565 17,020,736 14,782,644
General Executive 1,162,580 1,571,634 1,003,239
Judicial 144,139 149,674 139,259
Legislative 76,471 76,471 68,768
Tax Relief and Other General 2,524,053 2,688,457 2,596,485
Transfers to:
Transportation Fund 40,195 40,195 40,195
Nonmajor Governmental Funds - - 3,809
Nonmajor Enterprise Funds - - 5,200
Total Appropriations (Outflows) $ 32,620,113 $ 36,292,202 32,738,006
Fund Balances, End of Year 2,507,949
Less Encumbrances Outstanding at June 30, 2018 (524,427)
Fund Balances, End of Year
Budgetary Basis $ 1,983,522
Reconciliation of the End of Year,
Budgetary Basis, Fund Balance to the Detail
Reported in the Annual Fiscal Report:
General Purpose:
Designated $ 238,549
Undesignated 588,472
Total General Purpose 827,021
Program Revenue 1,156,501
Fund Balances, End of Year
Budgetary Basis $ 1,983,522
(A) Interfund transfers to the General Fund were budgeted under departmental revenue during Fiscal Year 2018.
149

State of WisconsinBudgetary Comparison Schedule Transportation Fund For the Fiscal Year Ended June 30, 2018
(In Thousands)
Original Final ActualBudget Budget Amounts
Unexpended Budgetary Fund Balances,
Beginning of Year $ 490,789
Revenues (Inflows): Taxes $ 1,123,220 $ 1,123,220 1,123,220
Departmental 1,603,325 1,603,325 1,603,325
Transfers from:
General Fund 40,195 40,195 40,195
Nonmajor Governmental Funds 24,000 24,000 24,000
Total Revenues (Inflows) 2,790,740 2,790,740 2,790,740
Amounts Available for Appropriation 3,281,529
Appropriations and Transfers (Outflows): Environmental Resources 2,940,162 5,395,446 2,762,063
General Executive 2,001 2,001 1,696
Tax Relief and Other General 22,394 22,442 21,774
Total Appropriations and Transfers (Outflows) $ 2,964,557 $ 5,419,889 2,785,533
Fund Balances, End of Year 495,996
Less Encumbrances Outstanding at June 30, 2018 (1,706,452)
Fund Balances, End of Year
Budgetary Basis $ (1,210,456)
150

State of Wisconsin Notes To Required Supplementary Information
For the Fiscal Year Ended June 30, 2018
151
NOTE 1. BUDGETARY INFORMATION A. Budgetary – GAAP Reporting Reconciliation
The accompanying Budgetary Comparison Schedule compares the legally adopted budget (more fully described in RSI Note 1-B) with actual
data on a budgetary basis. Because accounting principles applied for purposes of developing data on the budgetary basis differ significantly
from those used to present financial statements in conformity with generally accepted accounting principles (GAAP), a reconciliation of basis
and perspective differences as of June 30, 2018 is presented below (in thousands):
General Fund
Transportation Fund
Fund balance June 30, 2018 (budgetary basis – budgetary fund structure):
General Purpose Revenue – fund balance per budgetary basis Annual Fiscal Report
Undesignated fund balance $ 588,472
Designated fund balance 238,549
Total General Purpose Revenue fund balance 827,021
Program Revenue – fund balance per budgetary basis Annual Fiscal Report 1,156,501
Fund balance June 30, 2018 (budgetary basis – budgetary fund structure)
as reported on the budgetary comparison schedule 1,983,522 $(1,210,456)
Reclassifications:
To eliminate encumbrances reported as expenditures under budgetary reporting (basis difference) 524,427 1,706,452
To include activities of funds such as the Medical Assistance Trust, Hospital Assessment, Critical
Hospital Assessment, Budget Stabilization, and Permanent Endowment Funds (reported as special
revenue funds under budgetary reporting) as part of the General Fund (perspective difference) 429,320 --
To remove activities reported in another GAAP fund type (perspective differences): Enterprise funds (except for the University of Wisconsin System) (32,151) --
University of Wisconsin System (1,306,911) --
Internal Service funds (6,005) --
Fiduciary funds (4,066) --
Transportation Revenue Bonds capital project fund -- 1,422 Fund balance June 30, 2018 (GAAP fund structure – budgetary basis, excluding encumbrances
treated as expenditures at year end) 1,588,136 497,417
Adjustments (basis differences):
To accrue receivables and establish payables for individual income taxes (net) (884,330) --
To defer revenues for gross receipts public utility taxes (277,475) --
To adjust revenues and expenditures for tax-related items and other tax credit/aid programs (net) (472,705) (7,310)
To adjust expenditures for the municipal and county shared revenue program (507,375) --
To adjust expenditures for State property tax credit program (810,964) --
To accrue unpaid Medicaid payments to providers (net of receivable from federal government) (263,343) --
To adjust revenues and expenditures for certain major Health Services, and Children and
Families human services payments to local governments (137,828) --
To accrue receivable for Medicaid drug rebates (net of payable to federal government) 203,918 --
To adjust expenditures/revenues for other Health Services, Workforce Development,
Children and Families, and Corrections accruals and deferrals (62,520) --
To recognize the tobacco settlement revenue receivable 75,761 --
To accrue State educational aids payments deferred until the subsequent year (75,000) --
To accrue receivables from the federal government for the Children’s Health Insurance Program 275,390
To adjust expenditures and revenues for State Energy Program and other revolving loan programs 5,453 --
To adjust revenues and expenditures for other items (net) 89,354 165,774
Fund balance June 30, 2018 (GAAP fund structure – GAAP basis) as reported on the
governmental fund statements $(1,253,527) $655,881
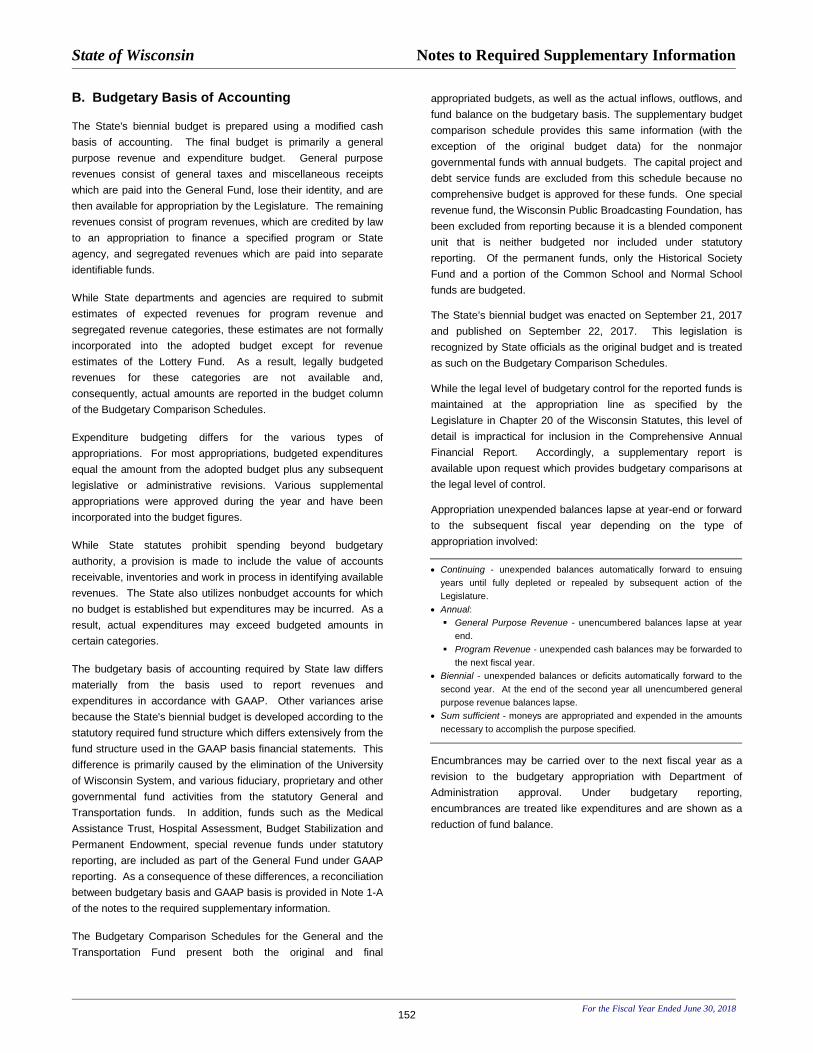
State of Wisconsin Notes to Required Supplementary Information
For the Fiscal Year Ended June 30, 2018
152
B. Budgetary Basis of Accounting
The State's biennial budget is prepared using a modified cash
basis of accounting. The final budget is primarily a general
purpose revenue and expenditure budget. General purpose
revenues consist of general taxes and miscellaneous receipts
which are paid into the General Fund, lose their identity, and are
then available for appropriation by the Legislature. The remaining
revenues consist of program revenues, which are credited by law
to an appropriation to finance a specified program or State
agency, and segregated revenues which are paid into separate
identifiable funds.
While State departments and agencies are required to submit
estimates of expected revenues for program revenue and
segregated revenue categories, these estimates are not formally
incorporated into the adopted budget except for revenue
estimates of the Lottery Fund. As a result, legally budgeted
revenues for these categories are not available and,
consequently, actual amounts are reported in the budget column
of the Budgetary Comparison Schedules.
Expenditure budgeting differs for the various types of
appropriations. For most appropriations, budgeted expenditures
equal the amount from the adopted budget plus any subsequent
legislative or administrative revisions. Various supplemental
appropriations were approved during the year and have been
incorporated into the budget figures.
While State statutes prohibit spending beyond budgetary
authority, a provision is made to include the value of accounts
receivable, inventories and work in process in identifying available
revenues. The State also utilizes nonbudget accounts for which
no budget is established but expenditures may be incurred. As a
result, actual expenditures may exceed budgeted amounts in
certain categories.
The budgetary basis of accounting required by State law differs
materially from the basis used to report revenues and
expenditures in accordance with GAAP. Other variances arise
because the State's biennial budget is developed according to the
statutory required fund structure which differs extensively from the
fund structure used in the GAAP basis financial statements. This
difference is primarily caused by the elimination of the University
of Wisconsin System, and various fiduciary, proprietary and other
governmental fund activities from the statutory General and
Transportation funds. In addition, funds such as the Medical
Assistance Trust, Hospital Assessment, Budget Stabilization and
Permanent Endowment, special revenue funds under statutory
reporting, are included as part of the General Fund under GAAP
reporting. As a consequence of these differences, a reconciliation
between budgetary basis and GAAP basis is provided in Note 1-A
of the notes to the required supplementary information.
The Budgetary Comparison Schedules for the General and the
Transportation Fund present both the original and final
appropriated budgets, as well as the actual inflows, outflows, and
fund balance on the budgetary basis. The supplementary budget
comparison schedule provides this same information (with the
exception of the original budget data) for the nonmajor
governmental funds with annual budgets. The capital project and
debt service funds are excluded from this schedule because no
comprehensive budget is approved for these funds. One special
revenue fund, the Wisconsin Public Broadcasting Foundation, has
been excluded from reporting because it is a blended component
unit that is neither budgeted nor included under statutory
reporting. Of the permanent funds, only the Historical Society
Fund and a portion of the Common School and Normal School
funds are budgeted.
The State’s biennial budget was enacted on September 21, 2017
and published on September 22, 2017. This legislation is
recognized by State officials as the original budget and is treated
as such on the Budgetary Comparison Schedules.
While the legal level of budgetary control for the reported funds is
maintained at the appropriation line as specified by the
Legislature in Chapter 20 of the Wisconsin Statutes, this level of
detail is impractical for inclusion in the Comprehensive Annual
Financial Report. Accordingly, a supplementary report is
available upon request which provides budgetary comparisons at
the legal level of control.
Appropriation unexpended balances lapse at year-end or forward
to the subsequent fiscal year depending on the type of
appropriation involved:
• Continuing - unexpended balances automatically forward to ensuing
years until fully depleted or repealed by subsequent action of the
Legislature.
• Annual: General Purpose Revenue - unencumbered balances lapse at year
end.
Program Revenue - unexpended cash balances may be forwarded to
the next fiscal year.
• Biennial - unexpended balances or deficits automatically forward to the
second year. At the end of the second year all unencumbered general
purpose revenue balances lapse.
• Sum sufficient - moneys are appropriated and expended in the amounts
necessary to accomplish the purpose specified.
Encumbrances may be carried over to the next fiscal year as a
revision to the budgetary appropriation with Department of
Administration approval. Under budgetary reporting,
encumbrances are treated like expenditures and are shown as a
reduction of fund balance.