Department of Revenue Administration - New Hampshire ...
195
oc:rvo z.vrii x'oz.yun-j State of New Hampshire Department of Revenue Administration Undsey M. Stepp 109 Pleasant Street PO Box 457, Concortl, NH 03302-0457 Telephone 603-230-5005 www.revenue.nh.gov caroltynn J. Lear Commisslonar Asaiatant Commiasioner September 23, 2020 His Excellency, Governor Christopher T. Sununu And Honorable Council Dear Governor Sununu and Honorable Councilors, It is my pleasure to present the Department of Revenue Administration's (DRA) 2020 annual report, as required by RSA 20:7, to you and the citizens of New Hampshire. This report is intended to provide readers with current insight into the activities of the operational units within the DRA, as well as data regarding the taxes we collect and the municipal finance and assessing laws that we administer. The DRA faced and conquered numerous challenges, some planned and some unplanned, during State Fiscal Year (FY) 2020. The planned challenges included implementing the first of three phases of DRA's new Revenue Information Management System (RIMS), Including a new on-line portal called Granite Tax Connect (GTC). The first phase Included more than 9,000 taxpayers of the Meals and Rentals, Medicaid Enhancement Tax, and Nursing Facility Quality Assessment. The second phase will be going live in October 2020 and will Include DRA's largest tax types with the Business Profit Tax, Business Enterprise Tax, Interest and Dividends Tax, and Communication Services Tax. Additional information on RIMS and GTC can be found in the body of this report. The unplanned challenges were primarily due to the COVID-19 pandemic. The majority of DRA employees transitioned to working remotely while still meeting the DRA's mission of fairly and efficiently administering the tax laws of New Hampshire, collecting the proper amount of taxes due, and providing support to municipal units of government. In addition, the DRA assisted taxpayers and businesses with the extension of Business Tax and Interest and Dividends Tax due dates from April 15"* to June as well as with the administration of various COVID-19 relief programs, most notably the Main Street Relief Fund (MSRF). While the COVID-19 pandemic presented the DRA with many challenges, I am extremely proud of the work of DRA employees to face and conquer the various unforeseen events. Thankyoufortaking the time to review this annual report. If you have any questions, or if you require any additional information, please do not hesitate to contact me directly. Sincerely, Xr. Undsey M. Stepp Commissioner TDO Access: Relay NH 1-600-735-2964 Indlvktuab who nood auxUlary aids for effective communication In programs and servloes of the D^rtment of Revenue Administration are Invited to make their needs and preferences known to the Department.
-
Upload
khangminh22 -
Category
Documents
-
view
0 -
download
0
Transcript of Department of Revenue Administration - New Hampshire ...
oc:rvo z.vrii x'oz.yun-j
State of New HampshireDepartment of Revenue Administration
Undsey M. Stepp
109 Pleasant Street
PO Box 457, Concortl, NH 03302-0457Telephone 603-230-5005www.revenue.nh.gov caroltynn J. Lear
Commisslonar Asaiatant Commiasioner
September 23, 2020
His Excellency,
Governor Christopher T. Sununu
And Honorable Council
Dear Governor Sununu and Honorable Councilors,
It is my pleasure to present the Department of Revenue Administration's (DRA) 2020 annual report, asrequired by RSA 20:7, to you and the citizens of New Hampshire. This report is intended to provide readerswith current insight into the activities of the operational units within the DRA, as well as data regarding thetaxes we collect and the municipal finance and assessing laws that we administer.
The DRA faced and conquered numerous challenges, some planned and some unplanned, during State FiscalYear (FY) 2020. The planned challenges included implementing the first of three phases of DRA's new RevenueInformation Management System (RIMS), Including a new on-line portal called Granite Tax Connect (GTC). Thefirst phase Included more than 9,000 taxpayers of the Meals and Rentals, Medicaid Enhancement Tax, andNursing Facility Quality Assessment. The second phase will be going live in October 2020 and will IncludeDRA's largest tax types with the Business Profit Tax, Business Enterprise Tax, Interest and Dividends Tax, andCommunication Services Tax. Additional information on RIMS and GTC can be found in the body of this report.
The unplanned challenges were primarily due to the COVID-19 pandemic. The majority of DRA employeestransitioned to working remotely while still meeting the DRA's mission of fairly and efficiently administeringthe tax laws of New Hampshire, collecting the proper amount of taxes due, and providing support to municipalunits of government. In addition, the DRA assisted taxpayers and businesses with the extension of BusinessTax and Interest and Dividends Tax due dates from April 15"* to June as well as with the administration ofvarious COVID-19 relief programs, most notably the Main Street Relief Fund (MSRF). While the COVID-19pandemic presented the DRA with many challenges, I am extremely proud of the work of DRA employees toface and conquer the various unforeseen events.
Thankyoufortaking the time to review this annual report. If you have any questions, or if you require anyadditional information, please do not hesitate to contact me directly.
Sincerely,
Xr.
Undsey M. Stepp
Commissioner
TDO Access: Relay NH 1-600-735-2964Indlvktuab who nood auxUlary aids for effective communication In programs and servloes of the
D^rtment of Revenue Administration are Invited to make their needs and preferences known to the Department.
The Department
of
Revenue
Administration
m ai a
£ 31 K
m
IBsae
33
2?-'' ►r'* -
.-• rs;— .'re
109 Pleasant Street, Concord, NH 03301
2020 Annual Reportmm
Inside This FY 2020 Annual Report
Mission Statement 001
Organizational Chart 002
Division Primary Function 003
Summary of Taxes Administered 005
Legislative Session In Review FY 2020/2021 State Budget 013
2020 Legislative Session In Review 019
DRA Highlights FY 2020 021
Office of Revenue Counsel 022
Hearings Bureau 027
Taxpayer Services 029
Forms Calendar 030
Collections Division 031
Municipal and Property Division 033
Audit Division 036
Technology Developments 037
Revenue Information Management System (RIMS) 038
Transparency Reports and Statistics 039
Legislative History 055
2019 Property Tax Tables per RSA 21-J:3, XII 093
New Hampshire Property Tax Summary 130
2019 Equalization Survey Including Utility and Railroad 135
2019 Equalization Survey Not Including Utility and Railroad 152
2019 Base Valuation for Debt Limits 178
2019 Comparison of Full Value Tax Rates 185
State of New HampshireDepartment of Revenue Administration
109 Pleasant Street
PO Box 457, Concord, NH 03302-0457Telephone 603-230-5005www.revenue.nh.gov
Caroltynn J. LearUndsey M. SteppCommissioner Assistant Commissioner
September 23, 2020
His Excellency,Governor Christopher T. Sununu
And Honorable Council
Dear Governor Sununu and Honorable Councilors,
It is my pleasure to present the Department of Revenue Administration's (DRA) 2020 annual report, asrequired by RSA 20:7, to you and the citizens of New Hampshire. This report is intended to provide readerswith current Insight into the activities of the operational units within the DRA, as well as data regarding the
taxes we collect and the municipal finance and assessing laws that we administer.
The DRA faced and conquered numerous challenges, some planned and some unplanned, during State FiscalYear (FY) 2020. The planned challenges included implementing the first of three phases of DRA's new RevenueInformation Management System (RIMS), including a new on-line portal called Granite Tax Connect (GTC). Thefirst phase included more than 9,000 taxpayers of the Meals and Rentals, Medicald Enhancement Tax, andNursing Facility Quality Assessment. The second phase will be going live in October 2020 and will includeDRA's largest tax types with the Business Profit Tax, Business Enterprise Tax, Interest and Dividends Tax, andCommunication Services Tax. Additional information on RIMS and GTC can be found in the body of this report.
The unplanned challenges were primarily due to the COVID-19 pandemic. The majority of DRA employeestransitloned to working remotely while still meeting the DRA's mission of fairly and efficiently administeringthe tax laws of New Hampshire, collecting the proper amount of taxes due, and providing support to municipalunits of government. In addition, the DRA assisted taxpayers and businesses with the extension of BusinessTax and Interest and Dividends Tax due dates from April 15"' to June IS"*, as well as with the administration ofvarious COVID-19 relief programs, most notably the Main Street Relief Fund (MSRF). While the COVID-19pandemic presented the DRA with many challenges, I am extremely proud of the work of DRA employees toface and conquer the various unforeseen events.
Thank you fortaking the time to review this annual report. If you have any questions, or if you require anyadditional Information, please do not hesitate to contact me directly.
Sincerely,
Undsey M. Stepp
Commissioner
TDD Access: Relay NH 1-800-735-2964Individuals who need auxiliary aids for effecilve communication In programs and services of the
Deparlmenl of Revenue Administration are Invited to make their needs and preferences known to the Department.
gfeVENU/?C
iu </)
;qo;
oskO
cquitvOr
Our Mission
The mission of the Department of Revenue Administration is to fairly and efficiently
administer the tax laws of the State of New Hampshire, collecting the proper amount
of taxes due, incurring the least cost to the taxpayers, in a manner that merits the
highest degree of public confidence in our integrity. Further, we will provide prompt
and constructive assistance to the municipal units of government in matters of
budget, finance, and the appraisal of real estate.
This report is submitted to
Governor Christopher T. Sununu
And
Members of the Executive Council
District 1 - Michael j. Cryans
District 2 - Andru Volinsky
District 3 - Russell E. Prescott
District 4 - Theodore L. Gatsas
District 5 - Debora B. Pignatelli
■SB
1www.revenue.nh.gov 2020 Annual Report Of the Department Of Revenue Administration

Department of Revenue Administration
COMMISSIONER
■-•Lindsey M/Stepp
.. —Cr
ASSISTANT COMMISSIONERCarollynn J. Lear -
j .i '" Business Office'.l i:
['I, Projert Management«•""Revenue Information' Management.Systems
j ' .Tax Policy andI Legislative Analysis:
- Legal ynit' ;-
-
I -I ̂
:• Hearings Unit
Internal Audit
... .[
Hurrian Resources '
www.revenue.nh.gov
Tobacco .&'.Multi Entity
' Multi-State
I -■ b iaovery;
j - Hearii^s Managernent:?|
1■ ADMiNlSTRATIpN UNIT
'Carollynn J..LeaV,. <- Zl Positibns-
. .. . . -1.. _. r
AUDIT division',1 ■ FrederickJ. CocHb'rothj" C-' *48 Positions ■ * ; -V k.
■ 1
. COLLECTIONS . .J •• Ora M-Leiyiere
:• 12 Positions
f ;:MLiNiaPAL& PROPERTY . I1 .James P..Gefry^-j' 29Positions ■
(. . ■fAXPAYERSERViCEs/- ;|';;i ̂ Oebra'A. Bourbeau. r. -vI' • 51 Positions.
{ ■ -r ^ ,j Collections Gro_up^.."J
j- Equaliiatibn^.- \i ■
. Utility -...".r:
Timber & Gravel."'
'Appraisal
2020 Annual Report Of the Department Of Revenue Administration
'Mail/Deposit/Return.■: -wPfoicessir^"'."
- Taxpayer Account :ts.1 " Reconcilfation.-v',
Analytics' - '
Forms
Call Center;^
Division Primary Functions
Administration UnitI
The Administration unit performs administrative functions necessary to support Department of
Revenue Administration (DRA) operations including accounting, purchasing, administrative
hearings, tax policy and legislative analysis, fleet and facility maintenance, human resources,
legal services, and project management.
Audit Division
The Audit Division conducts audits of tax returns of individuals, partnerships, estates, trusts,
corporations, and documents filed with DRA to ensure compliance with New Hampshire tax
laws and rules.
Collections Division
The Collections Division initiates collection activities in pursuit of delinquent tax returns and
outstanding payments for all taxes administered by DRA. Issues wholesale tobacco tax licenses,
meals and rentals tax licenses, and sells tobacco tax stamps.
Municipal and Property Division
The Municipal and Property Division (M&P) establishes and approves municipal, school, county
and village district tax rates. Provides technical assistance, relative to taxation and finance, to
the political subdivisions of the state; and prescribes a uniform chart of accounts for all
municipalities, schools, counties,'and village districts. Assists and educates municipalities with
the methods of appraisal and assessment of real property. Provides revaluation monitoring
statewide to municipalities and conducts once in five-year assessment reviews. M&P equalizes
the local assessed valuation of each municipality to bring such valuations to the full and true
market value of the property. Advises and assists municipalities and taxpayers in timely
collection of the excavation tax. Advises and assists municipalities and taxpayers in full and
true appraisals and timely collection of timber yield tax. M&P appraises public utility, railroad
property for equalization and state utility property tax, as well as local tax purposes. The
Division assists local municipalities with the administration of the Current Use law RSA 79-A.
Department of Information Technology
The embedded Department of Information Technology personnel designs, develops, and
maintains computerized systems to support the administration of taxes and to automate labor
intensive functions.
www.revenue.nh.gov 2020 Annual Report Of the Department Of Revenue Administration

Taxpayer Services Division
The Taxpayer Services Division processes taxpayer documents in an accurate and efficient
manner. Provides general taxpayer assistance to the public for all taxes administered by the
Department and maintains taxpayer accounts.
Employee of the Year
kmm ' « ■ -^11 -
1 .«r
mk4m
mi.W Mm.7.
T.
Ms. Leroy has worked for the Department of Revenue
Administration in the Audit Division for over 12 years and
tackles some of the Division's toughest audits. Violeta's
analysis and work product are thorough and demonstrate a
sophisticated understanding of very complicated
issues. Violeta's work Is always of the highest quality and
she is recognized by everyone in the Audit Division as a
valuable resource. Co-workers regularly seek her advice and
help on difficult issues. Despite the overwhelming amount
of work that everyone has to do, Violeta's willingness to
assist others is unequaled.
Recently DRA was asked to support two other New Hampshire agencies with a very challenging
and sensitive project, naturally, we sought Violeta's assistance! This project, which included
imbedding herself at another agency, placed demands that far exceeded her job duties as a
state tax auditor.
Violeta is a natural leader and inspires others to follow in her footsteps. Violeta consistently
displays a positive attitude which includes being energetic and motivated and taking pride in
work by improving and learning new job skills. The Employee Code of Respect at DRA reads
"\A/e will cultivate respect and teamwork among fellow co-workers by encouraging each other
to live up to our full potential through honesty, understanding, dignity, tolerance and
accountability". Violeta has the propensity to always look on the bright side and focuses on
solutions to problems. Violeta unfailingly treats everyone with respect, is always cheerful,
upbeat and positive. Violeta is a great asset to the Department of Revenue Administration and
is completely deserving of this recognition.
www.revenue.nh.gov 2020 Annual Report Of the Department Of Revenue Administration
SUMMARY OF TAXES ADMINISTERED BY THE
DEPARTMENT OF REVENUE ADMINISTRATION
FY 2020
This is only a brief summary of certain New Hampshire taxes administered by the Department of
Revenue Administration. This summary is not intended to be relied upon as a full and complete
text. Please refer to the applicable forms, instructions, rules and to the laws cited below to
determine how this information applies to specific persons or situations.
BUSINESS PROFITS TAX - RSA CHAPTER 77-A
The Business Profits Tax (BPT) has historically been one of the largest sources of general fund
revenue. Enacted In 1970 as a replacement for the municipal property tax on stock-in-trade,
farm livestock, poultry, fuel pumps, mills and machinery, the initial rate was established at 6%.
The rate steadily increased to a high of 9.56% in Fiscal Year (FV) 1983. The rate then decreased
to 7% beginning FY 1995, then increased to 8% for tax years ending on or after July 1,1999. The
rate of 8.5% was effective for all returns and taxes due on account of taxable periods ending on
or after July 1, 2001. For taxable periods ending on or after December 31, 2016, the BPT rate
was reduced to 8.2%. For taxable periods ending on or after December 31, 2018, the BPT rate
was reduced to 7.9%, because, in accordance with Chapter 274:23, Laws of 2015, the amount
of combined unrestricted general and education trust fund revenue collected for the blenniumending June 30, 2017 was more than $4.64 billion. For taxable periods ending on or after
December 31, 2019, the BPT rate is reduced to 7.7%. For taxable periods ending on or after
December 31, 2021, the BPT rate will depend on the combined amount of general and education
trust fund revenue collected for the fiscal year ending June 30, 2020, excluding $68,100,000
appropriated to the education trust fund (the "combined revenue"). If the.combined revenue is 6%
or more below the official revenue estimates, the BPT rate will be 7.9%. If the combined revenue Is
6% or more above the official revenue estimates, the BPT rate will be 7.5%. Otherwise, the BPT rate
will continue to be 7.7%. The BPT is assessed on income from conducting business activity within
the state. For multi-state businesses, income Is apportioned using a weighted sales factor of
two and the standard payroll and property factors. Organizations operating a unitary business
must use combined reporting in filing their NH return. Four annual estimate payments are
required on liabilities greater than $200, paid at 25% each. BPT return due dates are consistentwith federal return due dates based on the taxpayer's entity type. Business organizations with
$50,000 or less of gross business income from all their activities are not required to file areturn. Business organizations, however, that realize a gain or loss on the sale or exchange of aninterest in the business organization shall file a return for the taxable period, regardless of
whether or not the business organization's gross business income is in excess of $50,000 duringthe taxable period.
www.revenue.nh.gov 2020 Annual Reporl Of the Department Of Revenue Administration
BUSINESS ENTERPRISE TAX - RSA CHAPTER 77-EI
In 1993, a 0.25% tax was enacted on taxable enterprise value tax base, which is the sum of all
compensation paid or accrued, interest paid or accrued, and dividends paid after specialadjustments and apportionment. Chapter 17, Laws of 1999 increased the rate from 0.25% to0.5%. The rate was increased to 0.75% in 2001. For taxable periods ending on or after December31,2016, the Business Enterprise Tax (BET) rate was reduced to 0.72%. For taxable periods endingon or after December 31, 2018, the BET rate was reduced to .675%, because, in accordance withChapter 274:24, Laws of 2015, the amount of combined unrestricted general and education trustfund revenue collected for the biennlum ending June 30, 2017 was more than $4.64 billion. Fortaxable periods ending on or after December 31, 2019, the BET rate is reduced to 0:60%. Fortaxable periods ending on or after December 31, 2021, the BET rate depends on the combinedamount of general and education trust fund revenue collected for the fiscal year ending June 30,2020, excluding $68,100,000 appropriated to the education trust fund (the "combined revenue"). Ifthe combined revenue is 6% or more below the official revenue estimates, the' BET rate will be
0.675%. If the combined revenue is 6% or more above the official revenue estimates, the BET ratewill be 0.50%. Otherwise, the BET rate will continue to be 0.60%. In 2001, the filing thresholdincreased to $150,000 (from $100,000) of gross business receipts or $75,000 (from $50,000) ofthe enterprise value tax base. In 2013, the filing thresholds increased to $200,000 of gross'business receipts or $100,000 of the enterprise value tax base. Beginning with taxable periodsending on or after December 31, 2015, the Commissioner is required to biennially adjust thesefiling threshold amounts using the Consumer Price Index, Northeast Region. Four annual estimatepayments are required on liabilities greater than $260 for taxable periods ending on or afterDecember 31, 2013; paid at 25% each on the 15th day of the 4th, 6th, 9th and 12th months ofthe taxable year. The BET return is due at the same time the BPT return is due. The BET may beused as a credit against the BPT under RSA 77-A:5. Any unused portion of the credit may becarried forward and allowed against the BPT for 5 taxable periods from the taxable period inwhich the BET was paid for credits from taxable periods ending before December 31, 2014, andfor 10 taxable periods from the taxable period in which the BET was paid for credits from taxableperiods ending on or after December 31, 2014.
COMMUNICATIONS SERVICES TAX - RSA CHAPTER 82-A
First enacted In 1990 at 5.5%, this tax was assessed upon two-way communications services.Chapter 158, Laws of 2001, increased the permanent portion of the tax to 4.5% and continued
the surtax of 2.5%, resulting in an overall tax rate of 7% for the period beginning July 1, 2001 andending June 30, 2003. A permanent rate of 7% was passed effective July 1, 2003. Retailers mustregister with the Department and are required to collect and remit the tax. Communications
Services Tax returns must be filed by the retailer on the 15th day of the month for the precedingcalendar month unless the average monthly liability Is less than $100. Any retailer who canreasonably estimate its average monthly liability to be In excess of $10,000 is required to makean estimated payment equal to 90% of the actual tax collected. This payment is due on or beforethe 15th day of the month during which the liability is incurred.
www,revenue.nh.gov 2020 Annual Report Of the Department Of Revenue Administration
EDUCATION PROPERTY TAX - RSA 76:3
Under Chapter 17, Laws of 1999, the Education Property Tax was established. The tax is assessedand collected by municipalities to be retained for use by their local school districts. The rate wasoriginally $6.60 per thousand of equalized valuation without utilities. The tax appears on thesame bill with the other property taxes administered at the local level. The effective date of thistax was April 1,1999. The sunset provision of the Education Property Tax was repealed, makingthe tax a permanent revenue source dedicated to funding education. As of April 1,2005, the rate
was $3.33 per $1,000. Beginning July 1, 2005, and every fiscal year thereafter, the Commissioner
is required to set the education tax rate at a level sufficient to generate revenue of $363,000,000.
INTEREST & DIVIDENDS TAX - RSA CHAPTER 77
The Interest & Dividends (l&D) Tax, which was first enacted in 1923, applied a tax based on the
"average rate of property taxation" upon the income and dividend income received by NewHampshire residents from sources other than New Hampshire and Vermont banks. The tax waschanged significantly in FY 1995 to eliminate the exemption on income from New Hampshire andVermont banks. In conjunction with this change, the personal exemption increased from $1,200to $2,400. The exemption for joint filers increased from $2,400 to $4,800. Estimated l&D Taxpayments are due on tax liabilities greater than $500 on the 4'^ 6'^ 9^^ and 12^*^ months of thetax year, unless the taxpayer is a calendar year taxpayer in which case the final payment is dueon January 15^^ following the tax year. The l&D Tax return is due on the 15*^ day of the 4'^ monthfollowing the tax year. Additional exemptions are available for residents who are 65 years of ageor older, who are blind, or who are disabled, unable to work, and have not yet reached their 65th
birthday. The current tax rate of 5% has remained the same since FY 1977. For taxable periodsending on or after December 31, 2013, trusts are no longer taxable under the l&D Tax. Instead,interest and dividend income received by the grantors or beneficiaries of trusts, to the extent
that they are inhabitants or residents of New Hampshire, is subject to taxation.
LOCAL PROPERTY TAX - RSA CHAPTER 76
Property taxes, based upon local assessed valuations, are administered and collected by theindividual cities and towns. The majority of property taxes collected are based on the market
value of the property at Its highest and best use. Some property taxes, however, are based onthe market value of a property's actual use, such as:
• Current use assessments under RSA Chapter 79-A for certain farm land, forest land, and
unproductive land. The program is for properties dedicated to remaining as open space.A Land Use Change Tax of 10% of the market value of the property is charged upon theoccurrence of a disqualifying event (usually a development, use or sale of a portion of aproperty). Typically ten acres or more of dedicated land is required. Application to localofficials on or before April 15^^ is required.
www.revenue.nh.gov 2020 Annual Report Of the Department Of Revenue Administration
• Taxes on the value of standing timber assessed under RSA Chapter 79. These areassessed by local officials, at a rate of 10% of the value of the standing timber. The
annual filing of an Intent to cut and the subsequent report of timber cut are required.
• Taxes on the value of gravel and excavated materials assessed under RSA Chapter 72-B.
These are assessed at a rate of $.02 per cubic yard of earth excavated.
Local Property Tax Exemptions, Credits and Deferrals
Elderly Exemption - RSA 72:39-a
Effective July 23, 1996, RSA 72:39-a replaced the Standard, Expanded, Adjusted and Optional
Adjusted Elderly Exemptions. The statute sets the minimum exemption, which the cities and
towns may modify as follows:
• Different dollar amounts for qualified residents ages 65-75, 75-80, and 80 or older;
• Net Income limitations, including social security or pension payments; and
• Net asset limitations.
Blind Exemption - RSA 72:37
The exemption for the legally blind must be adopted by the municipality. The exemption Is a
minimum $15,000 reduction of the assessed value of residential real estate (as defined In RSA
72:29, 11} and could be higher If modified by the municipality.I
Deferral for the Elderly or Disabled - RSA 72:38-a
Property taxes are deferred and accrue Interest at the rate of 5% per annum for qualifying
taxpayers. The deferred property tax may not exceed more than 85% of the equity value of the
residence. If granted by the assessing officials, the deferral Is available to any resident propertyowner who is 65 years or older or eligible under the federal Social Security Act for benefits for
the disabled, has owned the home for at least 5 years (or one year If eligible under the federal
Social Security Act), and Is currently residing there.
Veterans' Tax Credits and Disabled Exemption
Qualified residents are entitled to the following tax credits In the following amounts, which are
to be deducted from their tax bills:
• RSA 72:28 - The standard veterans' tax credit In the amount of $50 unless, alternatively,
the municipality adopts the optional veterans' tax credit which Is an amount from $51 upto $750;
• RSA 72:28-b - The all veterans' property tax credit If adopted by the municipality. In the
amount of the standard or optional veterans' tax credit in effect In the municipality;
www.revenue.nh.gov 2020 Annual Report Of the Department Of Revenue Administration
• RSA 72:28-c - The combat service tax credit if adopted by the municipality, in an amount
from $50 up to $500;
• RSA 72:29-3 - The standard surviving spouse tax credit in the amount of $700 unless,
alternatively, the municipality adopts the optional surviving spouse tax credit which is an
amount from $701 up to $2,000; and
• RSA 72:35 - The standard service-connected total disability tax credit in the amount of
$700 unless, alternatively, the municipality adopts the optional service-connected totaldisability tax credit which is an amount from $701 up to $4,000.
Certain Disabled Veterans' Exemption under RSA 72:36-a: A resident discharged under
conditions other than dishonorable or honorably separated from military service, who is 100%
totally and permanently disabled from service connection, who is a double amputee, paraplegic,
or has blindness of both eyes with visual acuity of 5/200 or less as the result of service connection,
and who owns a specially adapted home acquired with the assistance of the United StatesDepartment of Veterans Affairs is exempt from all taxation on that home.
I
Tax Exemption for Improvements to Assist Persons with Disabilities - RSA 72:37-a
This exemption is limited to any increase in the assessed value of residential real estate owing to
improvements made by the resident owner for the purpose of assisting a person with a disability
who also resides on the residential real estate.
Tax Exemptions for Wind-Powered, Solar, and Woodheating Energy Systems
RSAs 72:66, 72:62, 72:70
These exemptions are optional to the cities and towns, and must be voted upon locally.
Tax Exemption for the Disabled - RSA 72:37-b
This exemption is available to persons eligible under the federal Social Security Act for benefits
to the disabled. It is applicable only on the applicant's principal place of abode. The exemption isoptional and must be voted on by the municipality, which also determines the amount of the
exemption and the income/asset limitations.
MEALS & ROOMS (RENTALS) TAX - RSA CHAPTER 78-A
The Meals and Rooms (Rentals) (M&R) Tax was enacted in 1967 at a rate of 5%. The tax is
assessed upon patrons of hotels, restaurants, and motor vehicle rental establishments on certain
rentals of rooms and motor vehicles, and upon meals costing $.36 or more, but collected andremitted to the State by operators. Chapter 144, Laws of 2009, increased the rate from 8% to the
current rate of 9%. An M&R Tax operator's license is required. The M&R Tax is required to be
remitted to the State on the 15th day of the month following the collection of tax, accompaniedby the M&R Tax return. An M&R Tax operator is required to maintain books and records showing
www.revenue.nh.gov 2020 Annual Report Of the Department Of Revenue Administration
the amount of tax collected and to remit the tax monthly to the State, less a 3% commission if
the return and payment are filed both timely and electronically.
MEDICAID ENHANCEMENT TAX - RSA CHAPTER 84-A
The Medicaid Enhancement Tax (MET) was enacted in 1991 at a rate of 8% of gross patientservices revenue of every hospital. In 1993, the rate was changed to be established by legislation
each biennium upon the gross patient services revenue of every hospital for the hospital's fiscalyear ending during the first full calendar year preceding the taxable period. If the Legislature
failed to set the rate of tax on or before April 1, preceding the first^fiscal year of'the biennium,
the tax rate was to be zero for that biennium. In no event was the rate of the tax to be greater
than 6 percent for any biennium. In 1998, the law was amended to require the Legislature to set
the tax rate on or before May 1. In 2003, the tax rate was changed to 6% of gross patient servicesrevenue. In 2004, the 6% tax on gross patient services revenue was changed to a 6% tax upon the
"net" patient services revenue of every hospital. In 2007, the tax rate was reduced to 5.5% of netpatient services revenue. For taxable periods ending June 30, 2014 and prior, hospitals were
required to pay 100%of the taxdueforthe taxable period no later than the 15^^ day of the fourthmonth of the taxable period and were .required to file a tax return with the Department on or
before the 10^*^ day of the month following the expiration of the taxable period. For taxableperiods beginning July 1, 2014 and after, special hospitals for rehabilitation are no longer
included in the definition of "hospital" and hospitals are required to file a return on or before the15'^ day of April in the taxable period. In addition, every hospital shall on or before January 15 inthe taxable period make a nonbinding estimate of its projected tax payment. The tax rate
decreased to 5.45% for the taxable period ending June 30, 2016, and to 5.4% for the taxable
period ending June 30, 2017, and for every taxable period thereafter.
REAL ESTATE TRANSFER TAX - RSA CHAPTER 78-B
The Real Estate TransferTax (RETT) was first enacted in 1967. Chapter 17, Laws of 1999, increased
the permanent tax rate assessed on the sale, granting, and transfer of real estate and any interest
in real estate to $.75 per $100, or fractional part thereof, of the price or consideration. This rate
is assessed on both the buyer and seller for a combined tax rate of $1.50 per $100. Where theprice or consideration is $4,000 or less, there is a minimum tax of $20 assessed on both the buyerand seller. The tax is paid at the Registry of Deeds office in the county where the property islocated. A Declaration of Consideration (Form CD-57) must be filed with the Department by both
the purchaser and seller no later than 30 days from the recording of the deed at the Registry ofDeeds or transfer of real estate, whichever is later.
RAILROAD TAX - RSA CHAPTER 82
Every railroad, railway, express, and every parlor, sleeping or dining car company, or other
company not a railroad company owning any cars operated for profit on any railroad in this state
shall pay an annual Railroad Tax. The Railroad Tax is-assessed on the market value of the property
and estate in this state of any such company as of April 1 of each year. The tax is imposed at the
www.revenue.nh.gov 2020 Annual Report Of the Department Of Revenue Administration 10
average rate of taxation at that time upon other property throughout the State. Railroad"property" applies to both railroad companies (an enterprise, corporation, partnership, etc.) andprivate rail cars operated for profit on any railroad in the State.
TOBACCO TAX - RSA CHAPTER 78
The Tobacco Tax is a direct tax upon the consumer at retail. However, it is pre-collected and paid
by the wholesaler. It is presumed the Tobacco Tax has been pre-collected and paid by thewholesaler by the affixing of a Tobacco Tax stamp on the tobacco product. The Tobacco Tax was
first enacted in 1939. Originally the tax was based upon the value at the usual selling price of alltobacco products. In 1975, the tax was changed to a flat rate of $0.12 per package of 20cigarettes. At that time, there was no tax on other tobacco products. Over the next 34 years thetax was increased from $0.12 to.$1.78 per package. In 2011, the Tobacco Tax rate was decreased
from $1.78 to $1.68 for each package containing 20 cigarettes or at a rate proportional to such
rate for packages containing more or less than 20 cigarettes. As of August 1, 2013, the TobaccoTax rate increased from $1.68 back to $1.78 for each package containing 20 cigarettes, perChapter 224:379 through 381, Laws of 2011. In 1991, the Legislature enacted a tax on tobacco
products other than cigarettes (OTP Tax) at the rate "proportional to the cigarette tax, havingsuch ratio to the usual wholesale price of the tobacco product other than cigarettes as the
cigarette tax bears to the usual wholesale price of the cigarettes." In 2003, the OTP Tax waschanged to 19% of the wholesale sales price. The OTP Tax rate was changed again in 2009 to48.59% of the wholesale sales price, and then in 2010 to a rate of 65.03% of the wholesale sales
price. In 2011, the OTP Tax rate was decreased to 48% of the wholesale sales price. As of August1, 2013, the OTP Tax rate increased from 48% back to 65.03% of the wholesale sales price, per
Chapter 224:379 through 381, Laws of 2011. Chapter 346, Laws of 2019 amends the Tobacco Tax
to include electronic cigarettes effective January 1,2020. Electronic cigarettes are treated as OTP but
subject to different tax rates under RSA 78:2, H, one for closed cartridges or containers that are not
intended to be opened (or "closed system" devices), and the other for containers that are intended
to be opened ("open system" devices). For closed system devices, the tax is imposed at a rate of $0.30per milliliter on the volume of the llquid or other substance containing nicotine in the cartridge orcontainer. For open system devices, the tax Is imposed at a rate of 8% of the wholesale sales price of
the container of liquid or other substance containing nicotine. Wholesalers are required to reporttheir tax liability for the collection of the OTP Tax on a monthly basis. The return is due on or
before the 15th day of the month following the end of the reporting period. Wholesalers may filequarterly, but permission to file quarterly must be pre-approved, in writing, by the Department.
UTILITY PROPERTY TAX-RSA CHAPTER 83-F
Utility property is defined, in part, as "all real estate, buildings and structures, machinery,dynamos, apparatus, poles, wires, fixtures of all kinds and descriptions, and pipe lines locatedwithin New Hampshire employed in the generation, production, supply, distribution,transmission, or transportation of electric power or natural gas, crude petroleum and refined
petroleum products or combinations thereof, water, or sewage subject to tax under RSA 72:6,72:7 and 72:8, but not exempt under RSA 72:23," excluding water and air pollution control
www.revenue.nh.gov 2020 Annual Report Of the Department Of Revenue Administration 11
facilities exempt from local property taxation under RSA 72:12-a. In 2011, "utility property" wasamended to also exclude: the electrical generation, production, and supply equipment of an
"eligible customer-generator" as defined In RSA 362-A:l-a, ll-b; property used for the retaildistribution of fuel for personal, non-commercial use, use as a fuel in a motorized vehicle, home
cooking, or heating; and that portion of a manufacturing establishment's generation, production,
supply, distribution, transmission, or transportation of electric "power or natural gas, crudepetroleum and refined petroleum products or combinations thereof, water, or sewage subject totax under RSA 72:6, 72:7, and 72:8, but not exempt under RSA 72:23, that Is expended, used, or
consumed on-site primarily for the operation of the manufacturing establishment and that doesnot otherwise enter the stream of commerce.
The Utility Property Tax rate Is $6.60 per $1,000 of value of utility property. On December 1 ofeach year the Department determines the market value of utility property as of the previous April1. The tax is due annually on or before January 15^^. Every utility or property owner required topay Utility Property Tax must file a declaration of its estimated Utility Property Tax for thesubsequent taxable period, accompanied by payment of 1/4 of the estimated tax due, on or
before April 15 of each year. Additional quarterly estimated payments of the Utility Property Taxare due on June 15'^ September 1S^^ and December IS'''.
www.revenue.nh.gov 2020 Annual Report Of the Department Of Revenue Administration 12
New Hampshire
Legislative Session in Review - FY 2020/2021
State Budget
This Legislative Review is published as a convenient reference guide of relevant statutory
changes made during the 2019 Legislative Session in the FY 2020-2021 state budget by the New
Hampshire General Court. Due to last year's continuing resolution, the FY 2020/2021 statebudget was not adopted as of the date of the last DRA Annual Report. Therefore, the statutory
changes made in the FY2020/2021 state budget are being presented here. This review is
intended to provide a summary or synopsis of enacted legislation. It is not intended to be reliedupon as a full and complete text or as a substitute for the actual state law. Please refer to the
applicable statute and rules to determine how this information applies to specific persons orsituations.
BUSINESS TAX
Tax Rates
HB 4 (Chapter 346, Sections 200-202) amends RSA 77-A:2 and RSA 77-E:2 to establish the rates
of the Business Profits Tax (BPT) and Business Enterprise Tax (BET). For taxable periods ending
on or after December 31, 2019, the rates remain unchanged, namely, 7.7% for BPT, and 0.6% forBET. The rate reductions formerly established by Laws of 2017, 156:215-217, however, were
repealed and instead replaced with varying rate levels contingent on the amount of revenue
collected for the fiscal year ending June 30, 2020.
For all taxable periods ending on or after December 31, 2021, the BPT and BET rates depend on
the combined amount of general and education trust fund revenue collected for the fiscal yearending June 30, 2020, excluding $68,100,000 appropriated to the education trust fund (the"combined revenue"). If the combined revenue is 6% or more below the official revenue
estimates, the BPT and BET rates will be 7.9% and 0.675%. If the combined revenue is 6% or
more above the official revenue estimates, the BPT and BET rates will be 7.5% and 0.50%.
Otherwise, the BPT and BET rates will continue to be 7.7% and 0.60%.
Statutes Amended: RSA 77-A:2 and RSA 77-E:2
Effective Date: July 1, 2019
www.revenue.nh.gov 2020 Annual Report Of the Department Of Revenue Administration 13
Internal Revenue Code applicable to BPT
HB 4 (Chapter 346, Sections 203-206, 251) amends RSA 77-A:l, XX to generally conform the BPTto the United States Internal Revenue Code (IRC) of 1986 in effect on December 31,2018, subjectto the adjustments provided in RSA 77-A:3-b, for taxable periods beginning on or after January1, 2020. The starting point for calculating taxable business profits is federal taxable incomebefore net operating loss and special deductions as determined under the provisions of the IRCas it existed at a specific point in time, subject to the adjustments provided in RSA 77-A:3-b.Currently, for taxable periods beginning on January 1, 2018 through December 31, 2019, theapplicable version is the IRC of 1986 in effect on December 31, 2016. For all taxable periodsbeginning on or after January 1, 2020, the applicable version will be the IRC of 1986 in effect on
December 31, 2018. This will incorporate the federal Tax Cut and Jobs Act changes into the BPT,including global intangible low-taxed income (GILTI), except that New Hampshire will continue todecouple from the section 168(k) bonus depreciation provision and the section 179 immediateexpensing deduction.
GILTI is a new category of foreign earnings included in federal taxable income but subject to aspecial deduction under IRC section 250(a). Since the starting point for calculating taxablebusiness profits does not include special deductions, chapter 346, section 204 inserts new RSA77-A:4, XIX to permit an adjustment so that the BPT also conforms to the federal GILTI deduction.
GILTI is a deemed income inclusion taxed federally at the time it is earned and not again if suchearnings are ever repatriated to the United States as foreign dividends. Foreign dividends,however, are taxed under the BPT. Therefore, to avoid do'uble taxation, chapter 346, section 203amends RSA 77-A:3, 11(b)(5) to provide an adjustment for repatriated foreign earnings alsosubject to BPT as GILTI.
Statute Added: RSA 77-A:4. XIX
Statutes Amended: RSA 77-A:l, XX and RSA 77-A:3,11(b)(5)Statute Repealed: RSA 77'A:3-b, II
Effective Date: July 1, 2019, for taxable periods beginning on or after January 1, 2020
Apportionment
Market-Based Sourcing
HB 4 (Chapter 346, Sections 424-425, 430) amends RSA 77-A;3, 1(c) and RSA 77-E:4, 1(c)(3) toadopt the market-based sourcing method of apportioning sales of services and intangibles forpurposes of the BPT and BET. The change is effective January 1, 2021, for taxable periods endingon or after December 31, 2021. The BPT currently utilizes a three factor apportionment formula'based on payroll, property, and a double-weighted sales factor. Each of these three factorsconsist of a numerator which reflects the payroll, property, ar>d sales within New Hampshire, anda denominator which reflects the payroll, property, and sales everywhere. Each numerator is
www.revenue.nh.gov 2020 Annual Report Of the Department Of Revenue Administration 14
divided by the respective denominator. The three factors are summed and "divided by four toarrive at the New/ Hampshire apportionment percentage. The sales factor consists of two broad
categories: (1) sales of tangible personal property (e.g., merchandise) and (2) everything else(intangible property and services). For BET purposes, the sales factor Is one-third of the
apportionment formula for the portion of the enterprise value tax base from dividends.
Market-based sourcing Impacts the second category of sales only: sales that are not tangible
personal property, particularly sales of services. Under current law, sales of services are
apportioned to the state where the Income-producing activity is performed. If the income-
producing activity Is performed In more than one state, the sales are assigned entirely to the
state where a greater proportion of the Income-producing activity Is performed than in any otherstate, based on "costs of performance." The cost-of-performance method Is an "all or nothing"
approach, because it assigns all the sales of services to the state that has a plurality of the costs
of performance. Thus, a state with 5% of the costs (whether New Hampshire or another state)gets 100% of the sales If each of the other states account for less than 5% of the costs.
Market-based sourcing will replace the cost-of-performance method and assign sales of services
to a state based on the location of the market where the service is delivered (or where the
customer "receives" the service). Market-based sourcing abandons the all-or-nothing approach.
Instead, if New Hampshire has 4% of the market for sales of services then it gets 4% of the sales,regardless of where the plurality of the costs of performance occurs.
Statutes Amended: RSA 77-A:3,1(c) and RSA 77-E:A, l(c}(3}
Effective Date: January 1, 2021, for taxable periods ending on or after December 31, 2021
Single Sales Factor Apportionment
HB 4 (Chapter 346, Sections 426-429) amends RSA 77-A:3, l-lll and related provisions to change
the BPT apportionment formula from a three-factor formula that Includes payroll, property, and
double-weighted sales to a single sales factor apportionment formula. The change Is effectiveJanuary 1, 2022 for taxable periods ending on or after December 31, 2022, unless rescinded by
majority vote of the Legislative Committee on Apportionment described below in November
2020. For example, under the current three factor apportionment formula based on payroll,
property, and a double-weighted sales factor, if a taxpayer has half of its property and half of its
employees In New Hampshire but makes no sales .within the state, then one-quarter of the
taxpayer's Income Is subject to BPT ((50% + 50% + (0%*2))/4 = 25%). In contrast, a single sales
factor apportionment formula is based on sales only. The share of a taxpayer's Income subject
to BPT is based solely on the percentage of the taxpayer's sales occurring In New Hampshire.
Thus, under single sales factor apportionment, the taxpayer described above will pay no BPT
because 0% of Its sales are made to New Hampshire customers. However, a taxpayer with 10%
of its sales made to New Hampshire customers will have 10% of Its income subject to BPT, evenif the taxpayer has no property and/or payroll in this state.
Statute Added: RSA 77-A:l, XVIII-a
www.revenue.nh.gov 2020 Annual Report Of the Department Of Revenue Administration 15
Statutes Amended: RSA 77-A:3, Nil; RSA 77-A:5, Xlll(b)(l); and RSA 77'E:13,1 and II
Effective Date: January 1, 2022, for taxable periods ending on or after December 31, 2022,
unless rescinded by majority vote of the Legislative Committee on Apportionment
Legislative Committee on Apportionment
HB 4 (Chapter 346, Sections 431-433) enacts RSA 77-A:23-a to establish a legislative committee
to study apportionment under the BPT, including by monitoring the laws and legislation of other
states concerning market-based sourcing and related issues. The committee is also authorized
to rescind the enactment of the single sales factor apportionment formula described above by
majority vote in November 2020. The committee will be repealed effective December 1, 2020.
Statute Added: RSA 77-A:23-a
Effective Date: July 1, 2019
Coos County Job Creation Tax Credit
HB 4 (Chapter 346, Section 199) amends RSA 77-E:3-c, II to extend the Coos county job creation
tax credit awarded by the Department of Business and Economic Affairs to any tax period ending
on or before December 31, 2027.
Statute Amended: RSA 77'E:3-c, II
Effective Date: July 1, 2019
COMMUNICATIONS SERVICES TAX
HB 4 (Chapter 346, Sections 252-258) clarifies the applicability of the Communications Services
Tax (GST), RSA 82-A, to voice over Internet protocol (VoIP) and prepaid wireless
telecommunications services, effective January 1, 2020. Under new RSA 82-A:4-d, VoIP services
will be subject to GST if they are used by a person whose residential or primary business street
address (or "place of primary use") is in this state. In addition, under new RSA 82-A:4-e, prepaid
wireless telecommunications services will be subject to the GST if the purchase occurs in person
in this state, or, alternatively, if the consumer gives a New Hampshire delivery or billing address
at the time of the sale or has a New Hampshire telephone number, consistent with the sourcing
rules for the e911 surcharge on prepaid commercial mobile radio service.
The GST is paid by the consumer but collected and remitted by the retailer/seller. Every
retailer/seller of VoIP and/or prepaid wireless telecommunications services must register with
the DRA, collect and remit the GST, and file monthly returns. If a retailer/seller is registered forpurposes of the e911 surcharge with the New Hampshire Department of Safety, Bureau of
Emergency Gommunications, it must also register with the DRA for collection and payment of the
GST.
www.revenue.nh.gov 2020 Annual Report Of the Department Of Revenue Administration 16
Statutes Added: RSA 82-A:2, XXVU-XXX; RSA 82-A:4-d; RSA 82-A:4-e
Statutes Amended: RSA 82-A:l; RSA 82-A:2, III; RSA 82'A:2. X; RSA 82-A:4
Effective Date: January 1, 2020, for taxable periods ending after December 31, 2019
ICF QUALITY ASSESSMENT
HB 4 (Chapter 346, Section 358,1) repeals the ICF quality assessment under RSA 84-D.
Statute Repealed: RSA 84-D
Effective Date: July 1, 2019
TOBACCO TAX
HB 4 (Chapter 346, Sections 92-94) amends "tobacco products" as defined in RSA 78:1, XIII to
include electronic cigarettes (or "e-cigarettes," among other names), and separately defines"electronic cigarette" in new RSA 78:1, lll-a, effective January 1, 2020. The result is to impose
the Tobacco Tax on e-cigarettes, particularly on the liquids or other substances containing
nicotine that are intended to be used with or in such devices. E-cigarettes will be treated as
tobacco products other than cigarettes (or "other tobacco products") but subject to different tax
rates under RSA 78:2, II, one for closed cartridges or containers that are not intended to be
opened (or "closed system" devices), and the other for containers that are intended to be opened
("open system" devices). For closed system devices, the tax is imposed at a rate of $0.30 permilliliter on the volume of the liquid or other substance containing nicotine In the cartridge or
container. For open system devices, the tax is imposed at a rate of 8% of the wholesale sales
price of the container of liquid or other substance containing nicotine. The tax must be pre-
collected and paid along with the filing of monthly returns by every wholesaler that ships or
transports e-cigarettes to retailers in this state. Also, every manufacturer, wholesaler, retailer,
and sampler in the business of selling or distributing e-cigarettes in this state must register with
the New Hampshire Secretary of.State, obtain a license issued by the DRA or the New Hampshire
Liquor Commission under RSA 178, as applicable, and otherwise comply with the Tobacco Tax
law.
Statute Added: RSA 78:1, lll-a
Statutes Amended: RSA 78:1, XIH and RSA 78:2, II
Effective Date: January 1, 2020
ADMINISTRATIVE
SB 242 (Chapter 280) addresses concerns relating to the issues raised in the United States
Supreme Court's decision in South Dakota v. Wayfair, Inc. In the wake of Wayfair, it is possible
that states, or localities within those states, with sales and use taxes, will require New
Hampshire businesses that do not have a physical presence but remotely sell goods in those
states or localities to collect and remit their sales and use taxes. This bill requires a state or
www.revenue.nh.gov 2020 Annual Report Of the Department Of Revenue Administration 17
locality that seeks to determine or impose a sales or use tax liability or collection obligation on a
New Hampshire business to first provide written notice to the New Hampshire Department of
Justice (DOJ) at least 45 days be/ore taking any action; encourages New Hampshire businessesto notify the DOJ whenever a state or locality requests information for use in determining a
sales or use tax liability or collection obligation; requires the DOJ to develop a system providingfor voluntary information sharing and collaboration with New Hampshire businesses, Including
by transmitting periodic bulletins in collaboration with the DRA; and establishes a commissionto monitor actions concerning the imposition of collection obligations on New Hampshire
businesses. The members of the commission include the commissioner of the DRA, or
designee.
Statute Added: RSA 78-E
Effective Date: July 19, 2019
MISCELLANEOUS
SB 29 (Chapter 138) establishes a commission to study acts of violence by the public against
New Hampshire state employees and to recommend processes and policies to reduce future
incidents of violence in the workplace. The members of the commission include the
commissioner of the DRA, or designee.
(
Statute Added: RSA 273:28-a
Effective Date: June 25, 2019
SB 98 (Chapter 230, Sections S-10) establishes a committee to study the effects of past New
Hampshire trust code legislation. The committee's duties include Investigating whether past
New Hampshire trust legislation is having Its desired effect; and whether there is a state
revenue opportunity to be generated from the assets which reside within New Hampshire
chartered trust companies to offset the cost of administration by the state of New Hampshire.
Statute Amended: N/A
Effective Date: July 12, 2019
www.revenue.nh.gov 2020 Annual Report Of the Department Of Revenue Administration 16
New Hampshire FY 2020
Legislative Session in Review
This Legislative Review is published as a convenient reference guide of relevant statutory
changes made during the 2020 Legislative Session by the New Hampshire General Court. This
review is intended to provide a summary or synopsis of enacted legislation.' It is not intended to
be relied upon as a full and complete text or as d substitute for the actual state law. Please refer
to the applicable statute and rules to determine how this information applies to specific persons
or situations.
BUSINESS TAX
HB 1558 (Chapter 38, Sections 3-7) clarifies the timing and procedure for the Commissioner of
Business and Economic Affairs to certify applications for Economic Revitalization Zone Tax
Credits. Extends the prospective repeal of the Economic Revitalization Zone Tax Credit program
from July 1, 2020 to January 1, 2028.
Statute Amended: RSA 162-N
Effective Date: June 30, 2020 {Sections 6 and 7), July 1, 2020 (Sections 3-S)
MUNICIPAL AND PROPERTY
HB 130 (Chapter 1) clarifies the applicability of the Veterans' Property Tax Exemption to those
veterans who are 100 percent permanently and totally disabled pursuant to federal regulations
governing total and permanent disability ratings.
Statute Amended: RSA 72:36-a
Effective Date: April 1, 2020
HB 1111 (Chapter 28) provides for the establishment of communications districts (under newChapter RSA S3-G) for the purpose of contracting and bonding the creation or maintenance of
communications infrastructure and for contracting with service providers and grants
communications districts to issue broadband infrastructure bonds.
Statutes Amended: RSA 33:3-g, RSA 33-B:l, RSA 38:38
Statutes Added: RSA 53-G
Effective Date: July 22, 2020 (Sections 4-8}, September 20, 2020 (Sections 1-3)
HB 1129 (Chapter 8, Sections 2-3) temporarily modifies municipal spending authority due to the
COVID-19 state of emergency to permit towns and districts with a June 30 fiscal year end to make
www.revenue.nh.gov 2020 Annual Report Of the Department Of Revenue Administration 19
expenditures between July 1 and the date a budget is adopted which are reasonable in light of
prior year's appropriations and expenditures during the same time period. Permits towns, village
districts, and school districts that are unable to hold in-person annual meetings In 2020 or 2021
due to COVID-19 to conduct such meetings virtually and sets forth procedures for holding such
virtual annual meetings.
Statute Amended: N/A
Effective Date: July 10, 2020
HB 1182 (Chapter 33, Section 6) modifies the timeline and procedure for the New Hampshire
Department of Transportation to provide municipal assessing officials a copy of any lease or other
agreement, the terms of which provide for the use or occupation by others of real or personal
property owned by the state.
Statute Amended: RSA 72:23
Effective Date: January 1, 2021
HB 1558 (Chapter 38, Sections 19-22 and 25) modifies the vote required to authorize the issuance
of certain municipal bonds or notes from 2/3 to 3/5. Increases the amount of the year-end
unassigned fund balance a school district may retain from 2.5% to 5% of the current fiscal year's
net assessment under RSA 198:5, expands the purposes for which such funds may be retained, and
modifies the approvals necessary.
Statutes Amended: RSA 33:8, RSA 374-B, RSA 198:4-b
Effective Date: September 27, 2020
SB 558 (Chapter 7) extends the reporting date of the Commission to Study School Funding fromSeptember 1, 2020 to January 10, 2021.
Statute Amended: RSA 198-E:2-e
Effective Date: May 10, 2020
MISCELLANEOUS
HB 1245 (Chapter 37, Section 100) creates a legislative commission to study the Identification of
unregistered animal feed products being sold remotely In New Hampshire. The members of the
commission include the commissioner of the DRA, or deslgnee.
www.revenue.nh.gov 2020 Annual Report Of the Department Of Revenue Administration 20

EBOosnitoHssfliQebsgehIsSsguegq
fltoaQSEEKISa
gStibgnnaEDOniiil[msnEB -
DRA HIGHLIGHTS FY 2020
DRA Revenue Information Management System. During the last fiscal
year, the DRA has worked hard to ensure that the replacement of the
DRA's existing tax administration system with a new Revenue
Information Management System (RIMS) Is a success. In October 2019
the DRA launched the first of three phases of the new RIMS system for/
more than 9,000 taxpayers of the Meals & Rentals Tax, Medicaid
Enhancement Tax, and Nursing Facility Quality Assessment. One of the most exciting aspects of
the RIMS project Is the new online user portal. Granite Tax Connect (GTC). GTC allows
taxpayers, operators and practitioners to complete tasks online, such as file taxes electronically,
schedule automated online payments, view correspondence from NHDRA, check on the status
of returns, payments, web requests, and more. Phase two of the RIMS project will be available
on October S, 2020 and will provide these exciting online tools and features to Business Profits
Tax, Business Enterprise Tax, Interest & Dividends Tax, and Communication Services Tax
taxpayers. Learn more about the project on page 38.
COVID-19 Relief Programs. Some of the most rewarding work the DRA has done over the last
year relates to our administration of the Main Street Relief Fund (MSRF) for New Hampshire
businesses. Through the MSRF grant program, the DRA was able to distribute approximately
$340 million to over 5,000 New Hampshire businesses to assist them during the COVID-19
pandemic. During the course of the DRA's administration of the MSRF, the DRA Call Center
answered 3,156 calls related to MSRF.
Tax Season at DRA. Normally, tax filing season, or "rush" as it is called at DRA, occurs in April of
each year. This year, the COVID-19 pandemic resulted in an extension of the normal April filing
due date to June 15, 2020. Therefore, the DRA saw a modified busy period, with a substantial
Increase in return filings during the normal filing period around April 15 and a second busy
period around June 15. As we typically do, DRA staff took an "all hands on deck" approach in
order to ensure that documents and revenue were quickly processed and deposited. In April of
this year, the DRA processed 60,752 documents totaling almost $191 million. In June of this
year, the DRA processed 51,049 documents totaling almost $195 million.
The New Hampshire Department of Revenue Administration's staff will always be ready to take
your important phone call. To request forms, please email: [email protected]., or call the
Forms Line at (603) 230-5001. For any other questions, please contact Taxpayer Services at
(603) 230-5920.
www.revenue.nh.gov 2020 Annual Report Of the Department Of Revenue Administration 21
I
7—
RevenueGburisel
^ - ■ -'Vi"
V?' \t'' C.'^' : ■ -ri' •
The Legal Bureau
The Office of Revenue Counsel (the Legal Bureau).provides legal advice andrepresentation to the Department, Including rendering advice and legal opinions to
Department personnel; managing bankruptcy cases; drafting and coordinating theadoption of administrative rules; responding to RIght-to-Know requests; representing the
Department before the Board of Tax and Land Appeals and the Department's Hearings
Bureau; and providing assistance and advice to the Commissioner's Office, the Municipal
and Property Division (M&P Division), and In connection with audits and other stages of
the enforcement and administration of tax laws. In addition, the Legal Bureau
coordinates and assists with the Department of Justice's representation of the
Department before state and federal court and acts as co-counsel In certain cases. -
During FY2020, the Legal Bureau represented the Department in administrative tribunals
concerning tax assessments and license actions, challenges to state taxing statutes, and
complex collection matters, and managed bankruptcy cases in which the Department Is a
creditor. Revenue Counsel also represented and advised the M&P Division in a number of
matters Involving DRA certified assessors, assessment issues, municipal budget problems,
and timber and gravel tax questions. In addition, the Legal Bureau represented the M&P
Division In numerous utility property tax appeals. Often, the cases managed by the Office
of Revenue Counsel have the potential for a substantial fiscal impact or significant
precedential value. Below Is a description of some noteworthy cases.
Noteworthy Cases from FY202Q
In re City of Berlin: Board of Tax and Land ADoeals
Revenue Counsel'
RO B0V457 ,Concord, NH 03302-0457
A taxpayer complained to the BTLA that members of the City of Berlin Board of Assessors
granted their own abatement applications without third party review In circumstances
that appeared to yield a less than fair result. The BTLA ordered an Investigatory
proceeding and the Legal Bureau intervened. On the eve of a hearing, the BTLA
suspended proceedings due to the COVID-19 State of Emergency. This case is ongoing.
In re City of Nashua, Board of Tax and Land AoDeals
This case arose from a citizen's complaint to the BTLA regarding the legality and
proportionality of the City of Nashua's assessments." The BTLA ordered an Investigatoryproceeding and directed the Department to provide the BTLA with Information regarding
the City's assessing practices. The Department and the City submitted a joint motion to
revalue the City's properties that resulted In a BTLA order requiring the City to complete afull measure and list of property In the City, which had not been completed since 1991.
www.revenue.nh.gov 2020 Annual Report Of the Department Of Revenue Administration 22
In re Town of Perry. Board of Tax and Land ADpeols
This case arose from the Director of M&P Division's determination that since'^the Town of
Derry did not determine values anew on all properties in the Town since 2014, Derry
must complete a reappraisal in 2019 and set values anew for all properties in Derry in
accordance with law. Derry disputed this determination. The Department and Towndecided to remedy its dispute in a way that was equitable and fair to the taxpayers of
Derry and the State of New Hampshire by filing a joint motion asking the Board to
approve a revaluation plan of all property in the Town during year 2020. The BTLA
granted the Joint motion and ordered Derry to fulfill its obligations under RSA 75:8-a.
In re Town of Hanover. Board of Tax ond Land Appeals
This case arose from a citizen petition complaining of assessment irregularities andseeking an order requiring Hanover to complete a revaluation ,of all property in the town.
The Department and the Town filed a joint motion asking the board to approve arevaluation plan, which included a full measure and list of all properties in the town, to be
performed by DRA certified personnel with oversight by the Town Assessor. The BTLAgranted the joint motion. Certain property owners In Hanover attempted to intervene
and have the BTLA reconsider the order to which the Department objected. The Board
denied the motions and the Town is in the process of performing its revaluation.
Declaratory Ruling - Smith ond Newco LLC
This declaratory ruling concerned whether the Petitioner Smith's proposed transfer of
three parcels of real estate, owned by the Petitioner personally, to an entity structure
owned by the Smith Revocable Trust, In which Petitioner is the sole grantor and trustee,
is exempt from the Real Estate Transfer Tax (RETT). In response, the Department foundthat the proposed transfers were exempt from RETT under RSA 78-B:2, XXII.
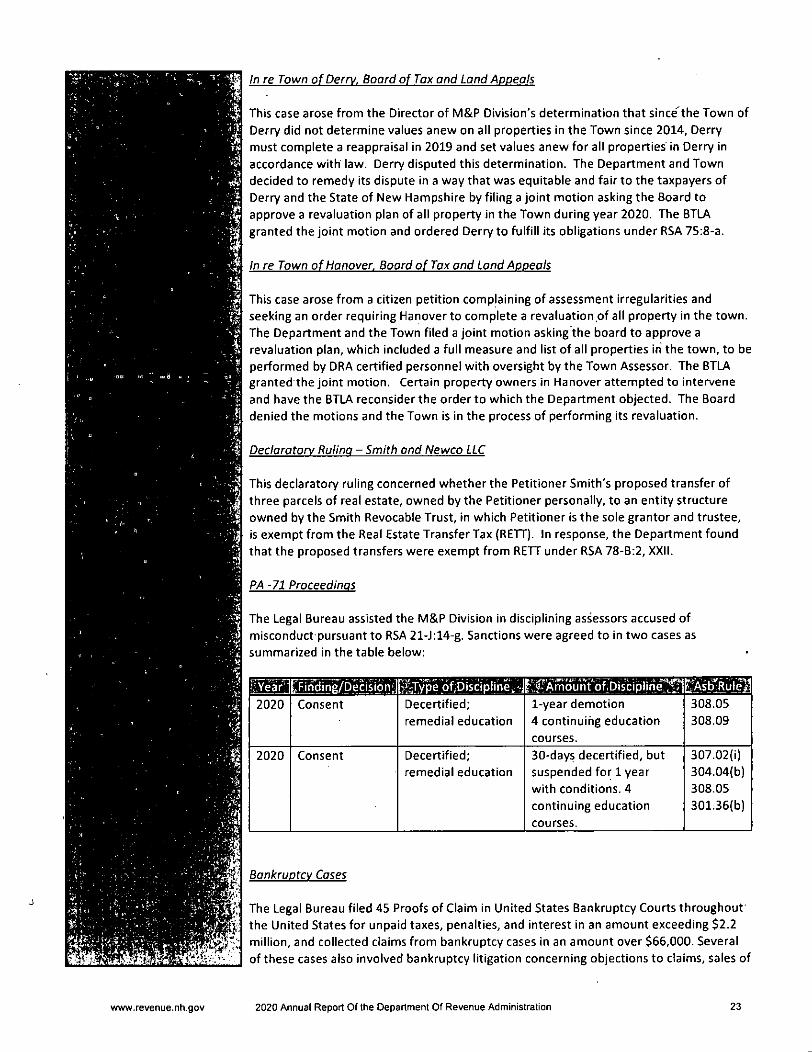
PA -71 Proceedings
The Legal Bureau assisted the M8iP Division in disciplining assessors accused ofmisconduct pursuant to RSA 21-J:14-g. Sanctions were agreed to in two cases as
summarized in the table below:
f.\Ye'ar'' ^r^^ing/Decisidn:^type pibiscipllnei- ^l^^-'^AmoUtitVf.Discipline^2020 Consent Decertified; 1-year demotion 1 308.05
remedial education 4 continuing education 308.09
courses.
2020 Consent Decertified;
remedial education
30-days decertified, but ,suspended for 1 year
with conditions. 4
continuing education
courses.
307.02(i)
304.04(b)
308.05
301.36(b)
Bankruptcy Cases
The Legal Bureau filed 45 Proofs of Claim in United States Bankruptcy Courts throughoutthe United States for unpaid taxes, penalties, and interest in an amount exceeding $2.2million, and collected claims from bankruptcy cases in an amount over $66,000. Several
of these cases also involved bankruptcy litigation concerning objections to claims, sales of
www.revenue.nh.gov 2020 Annual Report Of the Department Of Revenue Administration 23
property, and debtor reorganization plans which the Legal Bureau litigated in conjunction
with DOJ.
Utility Property Tax AoDeals
The complexity of utility property tax appeals is a laborious process requiring significanttime and Investment. The Legal Bureau handled 15 utility property tax appeals duringUtility Property Tax Year 2019 (April 1, 2019 - March 31, 2020). In these contested
matters, the Legal Bureau worked with the Department's utility property appraisers to
achieve favorable results for the Department. While some appeals settled, others are
under advisement with Department's Hearing Officer.
Right to Know Requests
The Legal Bureau responded to 128 requests for government records pursuant to RSA 91-
A:4 over the course of the past year.
ADoeais from Final Orders. Board of Tax and Land Appeals
The Legal Bureau litigated five appeals to BTLA from M&R license renewal denials, and
appeals of assessments,, which all resulted in favorable rulings for the Department.
AoDeals from Final Orders. Superior Court
The Legal Bureau coordinated with DOJ on two appeals to Superior Court.
Phillip Hughes v. Department of Reyenue Administration.
Due to the failure of the M&R operator to file M&R tax returns and pay M&R taxes, the
Department denied the Operator's M&R license renewal, and the Hearings Bureau
upheld the renewal denial. The Operator filed an appeal to Rockingham County Superior
Court. Through DOJ, the Legal Bureau timely filed a Motion to Dismiss the appeal, which
was granted.
Holland & Ferryman y. Department of Reyenue Administration.
The Legal Bureau assisted the Audit Division in coordination with DOJ in settling an
appeal of an audit assessment, whjch resulted in the voluntary dismissal of the appeal to
the Superior Court.
Criminal Inyestiaations and Prosecutions
With the assistance of DOJ, the Legal Bureau conducted extensive investigations into
criminal violations of New Hampshire tax laws.
In State of New Hampshire v. Darvi Rosenberg, DOJ conducted a 4-day jury trial in the
Merrimack County Superior Court. Rosenberg was the CPA tax preparer for Thomas
Katsiantonis who had previously pleaded guilty and served a sentence for tax fraud and
other crimes. Rosenberg was charged.with assisting Katsiantonis and providing false
documents to the Department. Unfortunately, the jury deadlocked and a mistrial was
declared by the court. The question of retrying Mr. Rosenberg remains under
consideration.
4;:,w'-
www.revenue.nh.gov 2020 Annual Report Of the Department Of Revenue Administration 24

Collection Matters
The Legal Bureau provided representation and counsel to the Department in negotiating
and documenting favorable settlements to collect significant sums owed by a number of
taxpayers.
Administrative Rule Making During.FY 2018
jgmpn Rule # short Title
.t.' .. I.. - ' '
Effertive —:
Date ̂
f^jExpifatibn;^
12823 - Rev 2300 - Medicaid Enhancement Tax 7/4/2019 7/4/2029
12832
Rev 806.04(c); Rev 807.04(a)(2); Rev
809.03(b); Rev 809.06; Rev 809.07 - Indicia 'ofRETT Paid
7/25/2019 7/25/2029
12833
Rev 3002.07(b)(1); Rev 3003.02(a); Rev -
3004.02(b){2j; Rev 3004.06 - Indicia of L-CHIP Paid
7/25/2019 7/25/2029
12834Rev 500 - Excavation Tax and Taxation of
Excavation Area7/25/2019 7/25/2029
■ 12854
Rev 3402.01(e) and (f); Rev 3402.03(a) and
(b) intfo. and (b)(2) and (3) - Notice of
Intent to Cut Wood or Timber
8/21/2019 8/21/2029
12881Rev 3200 (various) - Education Tax Credit
Program Update9/27/2019 9/27/2029
12883
Rev 306.07, Rev 904.05, Rev 2406.06 - Use
of Education Tax Credit Against Tax
Liability
9/27/2019 9/27/2029
12905
Rev 204.02(a); Rev 204.03 - Agency Action
on Petitions for Redetermination or
Reconsideration
10/23/2019Do not
expire
12906
Rev 303.03(a) intro; (a)(2), & (e),
304.09(f)(2)c. &d., 2402.01(a) intro. &
(a)(7) - Business Tax Technical Corrections
10/23/2019 , 10/23/2029
12907
Rev 700, 2300, 2500, 2700, 2900 various
sections and paragraphs - First Rollout of
Revenue Information Management System
(RIMS)
10/23/2019 10/23/2029
12923Rev 1200 - Low and Moderate Income
Homeowners Property Tax Relief11/26/2019 11/26/2029
12925
Rev 401.05; Rev 402.02; Rev 405; Rev
418.01(a) and (c) - Tax Credit for Combat
Service
11/26/2019 11/26/2029
12979
Rev 307.11(a), (c) - Business Profits Tax
Corrections Regarding Federal Refund
Subject to Joint Committee on Taxation
Review
1/23/2020 1/23/2030
13002
Rev 1601.15, 1601.20, 1601.20, 1601.21, j
1601.22, 1601.24 & 1605-
Communications Services
3/17/2020 3/17/3030
13040Rev 304.12 - Global Intangible Low -
Taxed Income4/22/2020 4/22/2030
13049 Rev 1000 - Tobacco Tax 6/4/2020 6/4/2030
www.revenue.nh.gov 2020 Annual Report Of the Department Of Revenue Administration 25
. -.'V
■"••j'-v,.-, --.■' : V
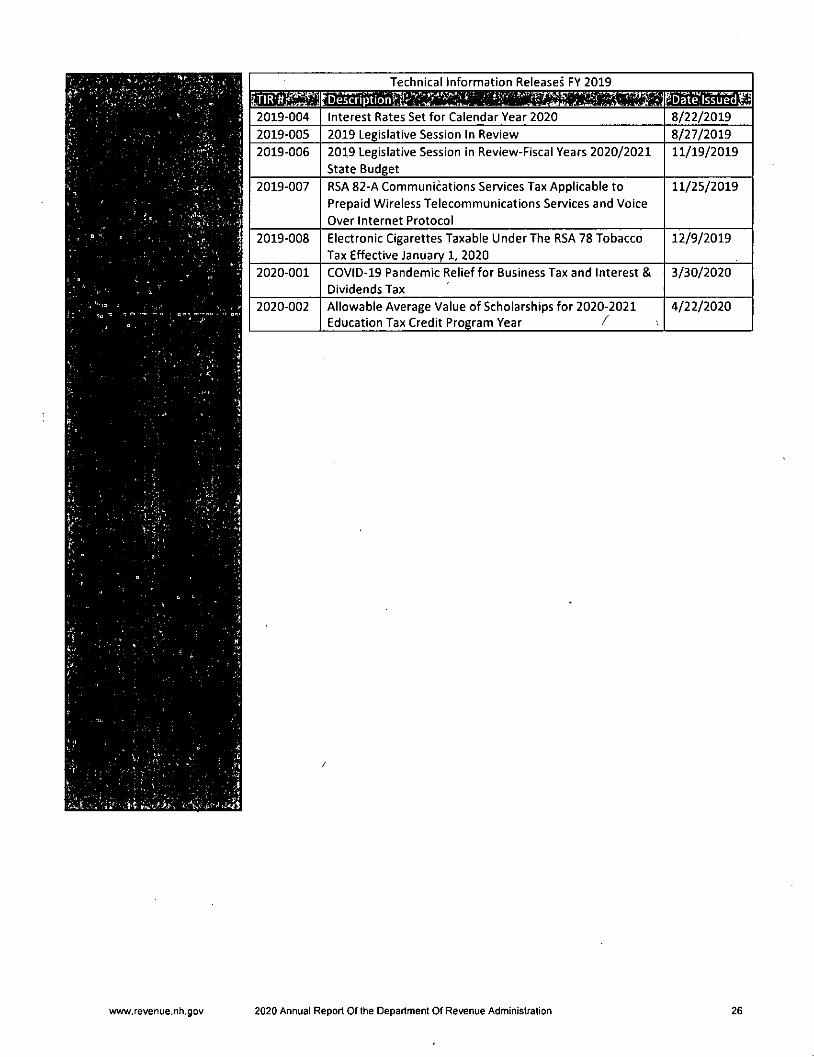
Technical Information Releases FY 2019
mmm2019-004 Interest Rates Set for Calendar Year 2020 8/22/20192019-005 2019 Legislative Session In Review 8/27/20192019-006 2019 Legislative Session in Review-Fiscal Years 2020/2021
State Budget11/19/2019
2019-007 RSA 82-A Communications Services Tax Applicable toPrepaid Wireless Telecommunications Services and VoiceOver Internet Protocol
11/25/2019
2019-008 Electronic Cigarettes Taxable Under The RSA 78 TobaccoTax Effective January 1, 2020
12/9/2019
2020-001 COVID-19 Pandemic Relief for Business Tax and Interest 8iDividends Tax
3/30/2020
2020-002 Allowable Average Value of Scholarships for 2020-2021Education Tax Credit Program Year >
4/22/2020
-'-A
''si'- riil'JA.-P-'-i'
www.revenue.nh,gov 2020 Annual Report Of the Department Of Revenue Administration 26
T'WWW-
. ','W • t .... V- --■
'•' '1-'i '■ '
SevgN(tf
equity
Hearing Officera , - > * . . ' •
Dehise DanierjL
,.(• . !.
... ;
Hearings Bureau ,;PP Box 1467 .;Concord, NH 03302-1467
603.230.5002 ^ .-603.230.5948fax^ .
v."
'.J-1 .
- -'T'i
■" J 5.:
r :■ (
. i: •-' /; ' Heatrings Bureau.
• t.. = i - ̂ qi. ;.
Hearings Bureau
During FY 2020, the Hearings Bureau continued to strive to provide better service tothe taxpayer given our available resources. We have continued to reviewadministrative tasks and work flow to ensure that our processes are as lean andefficient as possible to maximize our productivity.
In FY 2020, with respect to taxpayer petitions, the time to produce a final order afterthe close of the record averaged 133.86 days. Although our goal for FY 2020 fortaxpayer petitions was to produce final orders within an average of 90 days after theclose of the record, there were several older, very complex cases that were issuedduring this period. With respect to cases involving license denials, suspensions andrevocations, bonds, and tobacco seizures, the time to produce a final order after theclose of the record averaged 9.45 days. Our goal for cases involving license denials,suspensions and revocations, bonds, and tobacco seizures was to produce finalorders within an average of 14 days after the close of the record. The total numberof final orders issued in FY 2020 decreased by 18.92% from the number issued in FY2019, as there were several months in which no hearings were held due to theCOVID-19 pandemic. In cases in which a final order was not issued within thetimeframe we had set as a goal for FY 2020, the cause of the delays generallyinclude, but are not limited to, the following: that the order involved complex legalissues which needed additional time to research and write orders, that the HearingBureau's full hearing schedule reduced the time available to research and writeorders, that delays resulted from the unavailability of necessary personnel due tothe COVID-19 pandemic, that time was spent developing a telephonic hearingsprocess due to the COVID-19 pandemic, including drafting the necessary forms,and/or that legislative changes necessitated a revision of Hearings Bureaudocuments. The number of docketed appeals filed in FY 2020 decreased by 39.68%from the number filed in FY 2019, which we suspect is the result of the new RevenueInformation Management System.
During FY 2020, the Hearings Bureau has trained the Paralegal II to preside oversimple licensing and tobacco seizures as a designated Hearing Officer. This strategywas implemented to allow the Hearing Officer to dedicate more time to draftingfinal orders on complex cases in order to decrease the amount of time it takes toissue these orders. We have also continued to make progress in implementing theuse of technology in order to increase efficiency. We have implemented anelectronic indexing and filing system for older paper case files in order to quicklyaccess older information prior to implementation of our electronic casemanagement systems, and continue to catalog those cases as time permits. As the
www.revenue.nh.gov 2020 Annual Report Of the Department Of Revenue Administration 27
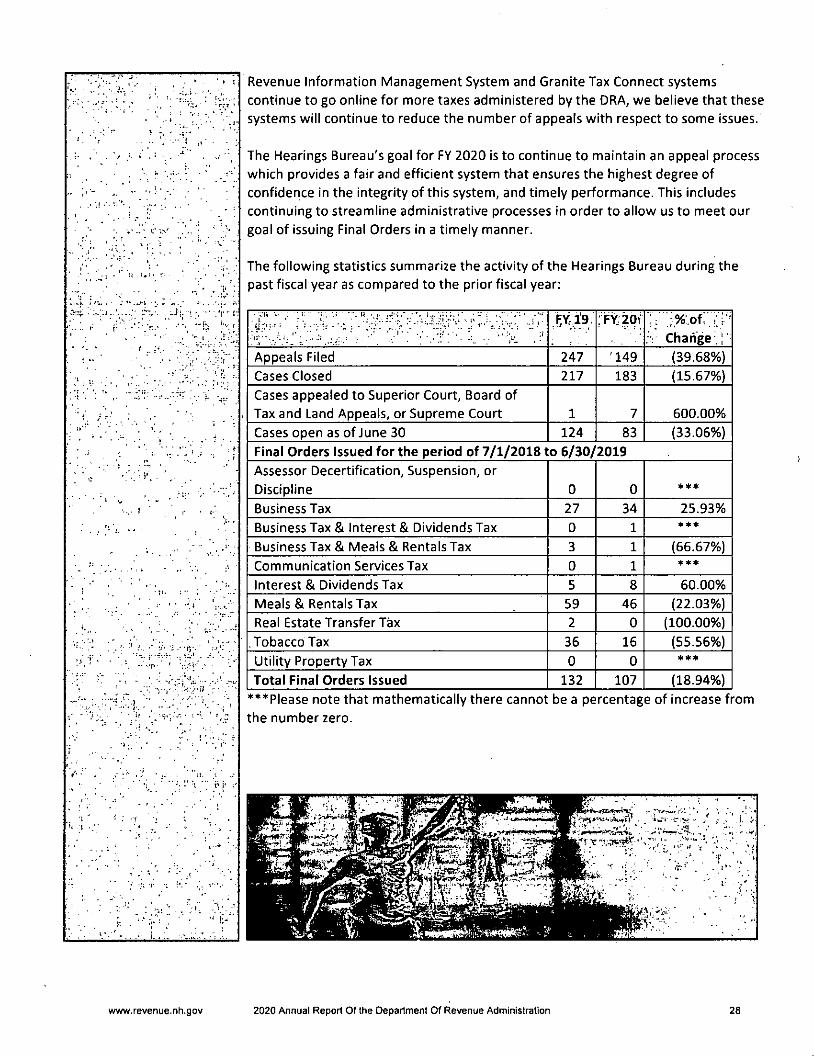
: ''■■■
-•J'lj ■ •• • I
'•IX r
•I5-. '
• .
». I . "
•• • i> 1
, 1"
" 1-
I. . .. v....
Revenue Information Management System and Granite Tax Connect systemscontinue to go online for more taxes administered by the DRA, vje believe that thesesystems will continue to reduce the number of appeals with respect to some issues.
The Hearings Bureau's goal for FV 2020 is to continue to maintain an appeal processwhich provides a fair and efficient system that ensures the highest degree ofconfidence in the integrity of this system, and timely performance. This includescontinuing to streamline administrative processes In order to allow us to meet ourgoal of issuing Final Orders in a timely manner.
The following statistics summarize the activity of the Hearings Bureau during thepast fiscal year as compared to the prior fiscal year:
;fY:20t
Change ;Appeals Filed 247 '149 (39.68%)Cases Closed 217 183 (15.67%)Cases appealed to Superior Court, Board ofTax and Land Appeals, or Supreme Court 1 7 600.00%
Cases open as of June 30 124 83 (33.06%)Final Orders Issued for the period of 7/1/2018 to 6/30/2019Assessor Decertification, Suspension, orDiscipline 0 0 ***
Business Tax 27 34 25.93%
Business Tax & Interest & Dividends Tax 0 1 ***
Business Tax & Meals & Rentals Tax 3 1 (66.67%)Communication Services Tax 0 1
Interest & Dividends Tax 5 8 60.00%
Meals & Rentals Tax 59 46 (22.03%)Real Estate Transfer Tax 2 0 (100.00%)
.Tobacco Tax 36 16 (55.56%)Utility Property Tax 0 0 «**
Total Final Orders Issued 132 107 (18.94%)***Please note that mathematically there cannot be a percentage of increase fromthe number zero.
.v.: :•' ' •' .... :.-<t•x
5^
i3) - _
Ma
www.revenue.nh.gov 2020 Annual Report Of the Department Of Revenue Administration 28
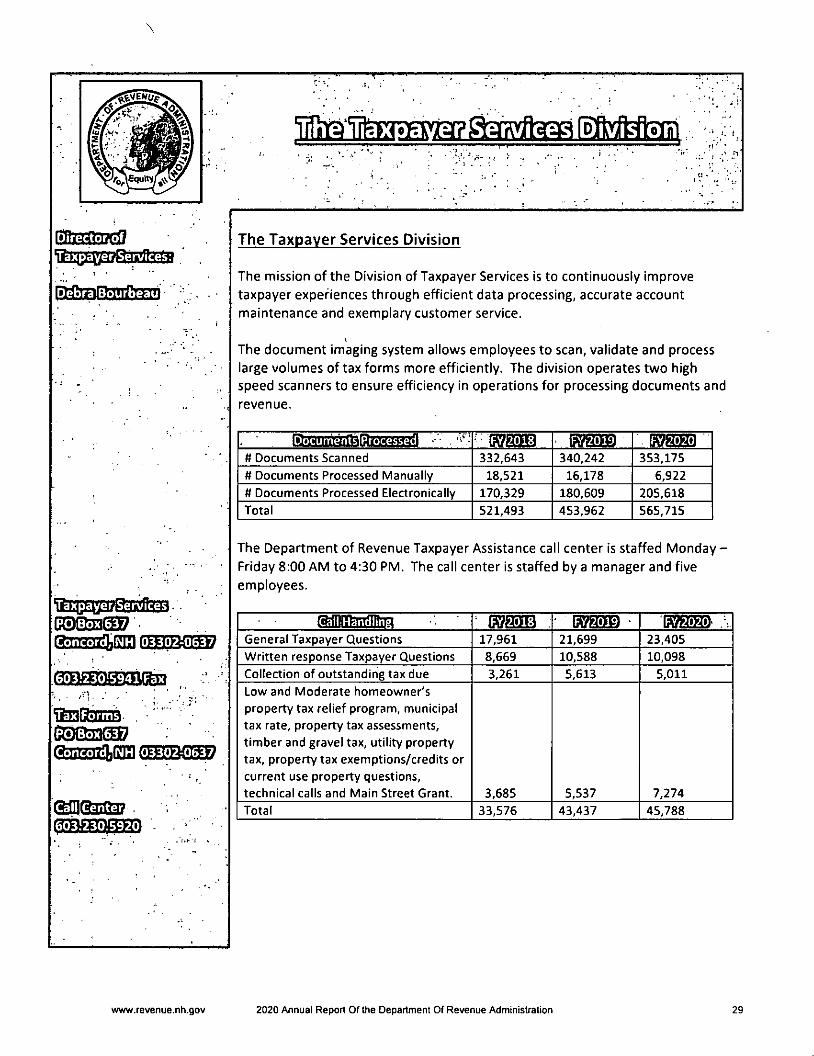
equity
—T-.1,
(•2J33S?G1?■iEq^EBOPSajctea
EatoEEndSaaD
■O^qjEQapaaEflsBsC00snS0 ' _ . ,0aiB3ti)O3Il QBIIBGSS
GEBffiQSKBlin
"EEnSsDCiB ,
ffTiK^ggl
@51031237 .
•n
i . ^
} .
The Taxpayer Services Division
The mission of the Division of Taxpayer Services is to continuously improvetaxpayer experiences through efficient data processing, accurate accountmaintenance and exemplary customer service.
The document imaging system allows employees to scan, validate and processlarge volumes of tax forms more efficiently. The division operates two highspeed scanners to ensure efficiency in operations for processing documents andrevenue.
■ wsm fxfsm R?a5B0tf Documents Scanned 332,643 340,242 353,175tt Documents Processed Manually 18,521 16,178 i 6,922tf Documents Processed Electronically 170,329 i 180,609 205,618Total 521,493 453,962 565,715
The Department of Revenue Taxpayer Assistance call center Is staffed MondayFriday 8:00 AM to 4:30 PM. The call center is staffed by a manager and fiveemployees.
11 [h an^ li nslH^^^^H 07830 078503- ' .General Taxpayer Questions 17,961 21,699 23,405Written response Taxpayer Questions 8,669 10,588 10,098Collection of outstanding tax due 3,261 5,613 5,011Low and Moderate homeowner's
property tax relief program, municipaltax rate, property tax assessments,timber and gravel tax, utility propertytax, property tax exemptions/credits orcurrent use property questions,technical calls and Main Street Grant. 3,685 5,537 7,274Total 33,576 43,437 45,788
www.revenue.nh.90v 2020 Annual Report Of the Department Of Revenue Administration 29
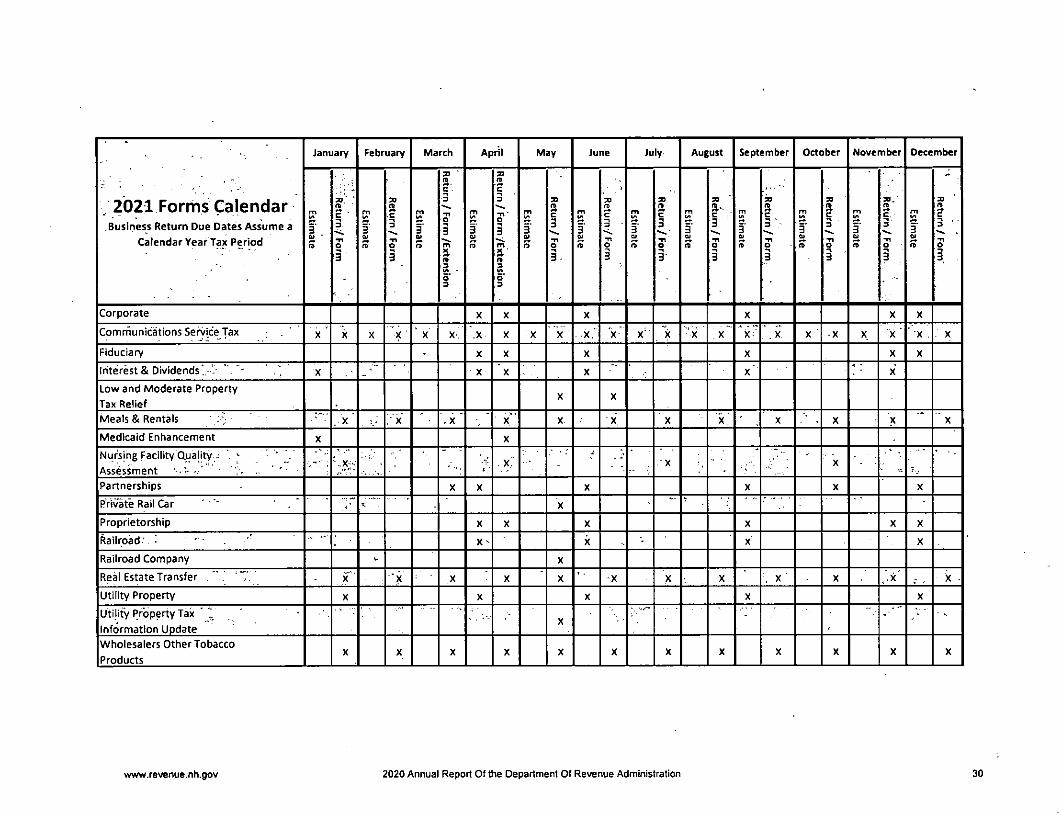
; 2021 Forms CalendarBusiness Return Due Dates Assume a
Calendar Year Tax Period
January February March April May June July August September October November December
Estimate, nruteR/Form Estimate
nruteR /Fomr Estimate nruteR /Fo mr/Extension Estetami
nruteR / mroF/Extension - Estetami nruteR /Form Estetami
.Return/Form Estetami nruteR /Form Estimate
nruteR /Form Estetami.mroF/nruteR-.- Estimate
nruteR /Form Estimate. Return/Form Estetami
nruteR /Form"
Corporate X X X X X X
Conrirfiunlcatlons Service Tax X ' X X X " X X- • X X X X X X X ■ X ■'x X X- . X X ' -X X X ' ' "X . . X
Fiduciary • X X X X X X
Interest & Dividends ' -- ' - X X X X x'« •
X
Low and Moderate PropertyTax Relief
X X
Meals & Rentals ' V• r
X :'x . X - ' X X X X X X X X X
Medicaid Enhancement X X
Nursing Facility Quality : ' ^Assessment ■ .. ' -
.
j' . , x .'J
. X X
Partnerships X X X X X X
Private Rail Car ' ' -- . X --
Proprietorship X X X X X X
Railroad' i ' ■ - X • X X
Railroad Company X
Real Estate Transfer " . ' ' X 'x X X X -X X X \ X X ,.x - X
Utility Property X X X X X
Utility Property Tax ' ^ 'Information Update
-
X,
Wholesalers Other Tobacco
ProductsX X X X X X X X X X X X
wvAv.revenue.nh.gov 2020 Annual Report Of the Department Of Revenue Administration 30
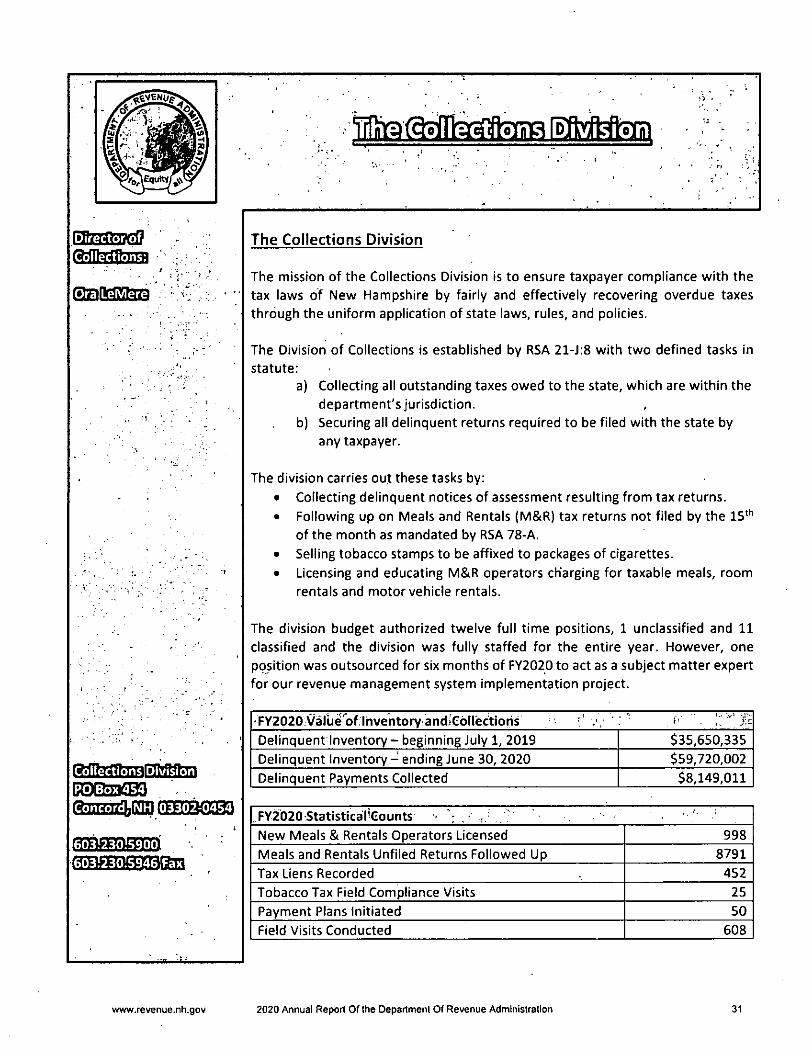
5&VEN554^
CQUtW
EBZ33S?(sO
(500233®! __@insii(na GEEEBG®)
05BEEElffl^EEBSQEEEBBq
to fDMsftoim
The Collections Division
The mission of the Collections Division is to ensure taxpayer compliance with the
tax laws of New Hampshire by fairly and effectively recovering overdue taxes
through the uniform application of state laws, rules, and policies.
The Division of Collections is established by RSA 21-J:8 with two defined tasks in
statute:
a) Collecting all outstanding taxes owed to the state, which are within the
department's jurisdiction.
b) Securing all delinquent returns required to be filed with the state by
any taxpayer.
The division carries out these tasks by:
• Collecting delinquent notices of assessment resulting from tax returns.
• Following up on Meals and Rentals (M&R) tax returns not filed by the 15^^of the month as mandated by RSA 78-A.
• Selling tobacco stamps to be affixed to packages of cigarettes.
• Licensing and educating M&R operators charging for taxable meals, room
rentals and motor vehicle rentals.
The division budget authorized twelve full time positions, 1 unclassified and 11classified and the division was fully staffed for the entire year. However, one
position was outsourced for six months of FY2020 to act as a subject matter expert
for our revenue management system implementation project.
•FY2020:Varue'ofTnventorY andiCollectioiis • '• , >'■ jir:Delinquent Inventory - beginning July 1, 2019 $35,650,335Delinquent Inventory - ending June 30, 2020 $59,720,002Delinquent Payments Collected $8,149,011
..FY2020:Statistical'Counts - .New Meals & Rentals Operators Licensed 998
Meals and Rentals Unfiled Returns Followed Up 8791
Tax Liens Recorded 452
Tobacco Tax Field Compliance Visits 25
Payment Plans Initiated 50
Field Visits Conducted 608
www.revenue.nh.gov 2020 Annual Report Of the Department Of Revenue Administration 31
gsfllSi^nBEB!^daEEoSBa
lEm 61853(3503ConcordI
OSSSEB^BBSESEBBq
The Collections Division underwent many changes in FY2020, including a system
upgrade that rolled out in October 2019 and a complete shift In business operations
due to the novel Coronavirus pandemic in March 2020. While these adjustments
were challenging and demanded our entire focus for most of the fiscal year, the
team worked tirelessly to overcome them.
The first phase of the implementation of the Revenue Information ManagementSystem (RIMS) Involved many processes that directly affected the Collections
Division, including Meals and Rentals license registration, payment plans and other
resolution remedies, lien placement and release, field visit coordination, and
administrative hearing collaboration. These adjustments to the processes and
procedures of the Collection Division were extensive; however, they will ultimately
provide tremendous efficiencies to the users and more importantly, the taxpayers
of New Hampshire.
The pandemic also affected the Collection Division as the majority of staff quickly
transitioned to telework in an effort to reduce the risk of transmission, which
involved restructuring many areas of communication with internal and external
customers. During this time, the Division was also unable to conduct some of the
more personal support offered throughout the year, such as outreach seminars and
field visits.
Toward the end of the fiscal year, the Collection Division also played a pivotal role
in the administration of the Main Street Relief Fund grant, addressing, reviewing,
and responding to the appeals of applicants who were denied relief or had
discrepancies in the information submitted on their applications.
In summary, FY2020 has provided some trials for the Collection Division, but
provided an opportunity to rise to the occasion and reevaluate processes and
approaches in order to make significant changes that will benefit the division,
department, and taxpayers alike.
www.revenue.nh.gov 2020 Annual Report Of the Department Of Revenue Administration 32
CQUtt^f
^Sj^S33QS3'
flSSEnlMEBzSElTGBProperty
lIBnzl^isflEnflGteijZsE®EBz^q- :
Sn^imSlEBGXH?
Ejtn^jEflQnEEnJ^-
GSESSSSSSIU^
Qxmb .QiBSQEEHDQBEEBBEBBd
em KlflEt eiofiKt;
The mission of the Municipal and Property Division is to assure fairness, equity and
proportionality in the assessment and collection of property taxes and the administration
of municipal finances in the state by establishing tax rates, providing technical assistance
and education to municipal officials, monitoring revaluations, reviewing assessment
practices, equalizing local assessed valuation, appraising public utility and railroad
property and administering timber and gravel taxation.
The Division consists of two bureaus. Municipal and Property.
The Municipal Bureau establishes and approves municipal, school, county, state
education and village district tax rates. It provides technical assistance on taxation and
finance to the approximately 564 political subdivisions of the state, and the generalsupervision of municipal tax collectors. Other services include;
• Prescribing a uniform chart of accounts for all municipalities.
• Establishing a standard technical assistance manual for municipalities' use.
• Reviewing trustee reports of municipal trust funds in conjunction with the
Department of Justice Charitable Trust Unit.
• Conducting workshops and seminars for municipal officials, including selectmen,
budget committees, trustees of trust funds, tax collectors, and school officials.
The Property Appraisal Bureau oversees the assessment review process and monitors
revaluations and revaluation contracts, as well as the following specialized services:
• The Equalization Group determines the total equalized value of all taxable
property within the state on an annual basis. This allows shared tax burdens, such
as the state education tax and county property taxes, to be apportioned at a
single standard, market value. The equalization process includes compiling
assessment data, conducting ratio studies and preparing statistical reports.
• Utility Appraisers value all utility and railroad properties in order to determine
the correct assessment of RSA 82 Railroad Taxes and RSA 83-F Utility Property
Taxes.
• Provides administrative, technical and enforcement support to all municipalities
in their assessment and collection of the RSA 79 Timber Tax and the RSA 72-B
Excavation Tax.
• Provides direct education oh property assessments to municipal officials and
assessors, as well as taxation and finance professionals.
• Provides support to two administratively attached boards, the Assessing
Standards Board (ASB) and the Current Use Board (CUB).
www.revenue.nh.gov 2020 Annual Report Of the Department Of Revenue Administration 33
ADMINISTRATIVELY ATTACHED BOARDS
ASSESSING STANDARDS BOARD (ASB)
ASB(S)dra.nh.gov
Chairman - Betsey Patten Vice-Chairman - Robert Gagne
CURRENT USE BOARD (CUB)
Chairman - Charles Souther
Accomplishments of FY 2020 Municipal and Property Division
The Division had some significant accomplishments in their efforts to improve its services
to municipalities and municipal officials and to improve its transparency. Some of these
efforts are completed while others are ongoing. During FY 2020, the Division
accomplished the following:
• In FY 2020, the last 4 months of the year was dominated by the COVID-19 State of
Emergency. Protocols were put in place to ensure Municipal and Property
employees remained as safe as possible during the State of Emergency and
worked with numerous parties to develop emergency orders and other
procedures that allowed M&P to continue to perform all of their mandated tasks.
• Fully staffed the Property Bureau with S new employees.
• Presented educational courses prepared by the International Association of
Assessing Officials which provided greater opportunity for professional assessors.
• Improved timely filing of municipal finance reports and continued timeliness of
tax rate setting via MTRSP. It was the fifth consecutive year of setting over 60% of
tax rates by October 31st.
• Audited and appraised $6.SB in utility property, railroad property and railcar
company assets resulting in billing $43-t-M in utility/railroad property taxes.Additional special projects included attending continuing education classes on
utility valuation issues; holding public forums on the valuation of regulated public
utilities, low-income housing tax credits (LIHTC) and telecotnmunications poles
and conduits costs; researching and publishing LIHTC capitalization rates,
telecommunications poles and conduit replacement costs, and current use land
values; assisting other State agencies with special appraisal projects within our
area of expertise; and worked with Axiomatic to analyze the feasibility ofdeveloping a new utility valuation software system.
• The Timber Group participated in a NHMA webinar and provided numerous other
educational opportunities for municipal officials in New Hampshire.
www.revenue.nh.gov 2020 Annual Report Of the Department Of Revenue Administration 34

The following are brief descriptions of the efforts that are being undertaken in FY
2021:
Continue to ensure that the repercussions of C0\/ID-19 do not significantly
impact the stated goals of the Municipal and Property Division.
The Municipal and Property Bureaus will develop on-line classes to replace the
current classroom offerings.
The Timber Group will work on developing a method to obtain a chain of custody
for timber harvested in the State of New Hampshire.
The Municipal Bureau will work with municipalities to ensure that laws regulating
municipal finance are being followed.
Continue to monitor and review assessing practices throughout the state to
ensure the assessment of property and collection of property taxes is equitable,
efficient, and transparent and performed in an ethical manner.
Continue working with Axiomatic towards developing, testing and implementing
a web-based utility valuation system to administer the Department's duties
under RSA 83-F. This system will provlde a more standardized and efficient
computer assisted appraisal model and database.
MUNICIPAL AND PROPERTY DIVISION
Summary of Education Provided to Municipal and Assessing Officials
■ !Tltle.'of,Rresentatlon3/fOrgarii2ation.j. (Number of presentations)!
Participants. ' ' i; j
Appropriations (6) ^ Town Officials
Budget Drafting (6) Town Officials
Current.Use Mini-Course (1) . '>■ Assessing./Town Officials •Equalization (7) Assessing / Town OfficialsExcavation (2) - u ■ . . . Assessing'/Town Officials! ' ••MS-1/lV Filing (4) Assessing / Town OfficialsState Statutes Part 1 , ■ ■ .Assessing / Town'Officials. '!State Statutes Update Assessing / Town OfficialsTax Collector Workshops (3) J Town Clerks/Tax CollectorsTax Rate Setting (6) Town Officials
Trustee'ofTriJSt Funds Workshop ' . Trustess of Trust Funds
Association of School Business Officials (ASBO) School Officials
www.revenije.nh.gov 2020 Annual Report Of the Department Of Revenue Administration 35
■SevEwtg
Th elAti d i tiD i vis i o nJo
\v£qu]t>f
S5f
DirectorcofAuditFrederick JfGoolbroth, Jr.
e ', : ' ' S-< ' -iy .«
r'•SflS •», *'• ^ vt . ./Assistant Director of Audit:'
«- * ' •'■ • r-'.;?John W.■^Frasler / "m ̂ ^ V1
::v|p
iRep'ortingvTax Fraud ̂ 'S?polBoxa338i.^i', - JdaConcdrdf NH 03302-1388 ^kTax'Fraud[Hotline -r603:230i5030l^r,'^3.230j5949jFax '[email protected];goy
■w- t 'h*> 'fAudit Division " ; <iPoTBoxiiaa . - > ^»^ConcordriNM ̂ 03302-1388
%03:'230!5030\f . , ,
DiscoveryjBureau
CMc^d/lNHl03302i0488
The mission of the Audit Division is to promote taxpayer compliance with NewHampshire's tax laws through: fair, impartial, and efficient selection and reviewof taxpayers' returns; taxpayer education; and discovery of non-filers. The AuditDivision is committed to team work, professional development, and highstandards of professionalism. Members of the audit staff conduct both deskaudits and field audits. The type of audit depends on the nature and scope ofthe audit and the proficiency of the auditor.
The global COVID-19 pandemic had an impact on the Division's operations infiscal year 2020. Nonetheless, DRA auditors completed the review of 819taxpayers' returns. Of that number, 523 taxpayers' returns were auditedresulting in assessments totaling $24,180,481 in tax, penalties, and interest aswell as reductions to refund requests, net operating loss deductions andbusiness enterprise tax credit carry-forwards totaling $1,973,264. Of all thereturns reviewed, the Division ultimately did not pursue full formal audits of310, because no material issues were identified.
In addition to the work described above, the Discovery/Nexus Bureauresearches federal and state filings, as well as online resources, to discovernon-filers who may have a duty to file and pay New Hampshire business taxes,meals and rooms taxes, or interest and dividends taxes. As a result of tiieirefforts in fiscal year 2020, an additional $3,391,513 in tax, penalties, andinterest was collected despite the pandemic, of which $18,800 came in throughthe voluntary disclosure program.
The Tobacco Unit conducted 66 compliance checks resulting in seizures ofI contraband tobacco products at 7 separate locations. Four audits of New
Hampshire licensed tobacco wholesalers were completed. The Unit alsocontinued to conduct joint tobacco/liquor investigations with the state LiquorCommission. The Unit worked to revise the tobacco tax rules to align with therecently modernized statute (RSA 78). With the expansion of the tobacco tax toinclude electronic cigarettes, the Unit helped oversee the additional licensing of57 manufacturers and 69 wholesalers. The Unit also continued to work directlywith the New Hampshire Department of Justice to ensure diligent enforcementof the Master Settlement Agreement by tobacco manufacturers andwholesalers.
Av
www.revenue.nh.gov 2020 Annual Report Of the Department Of Revenue Administration 36
SfeVENUp
£qulW
Technology.
Manager,
'Agency^SoftwarelDivision
Th^.Departmentjof,
Revenue'Administration
3SD3J3SES3
SyC5iB3DGZfll0Concord}
DiafoH oiroi:^
The ORA, with the support of the Department of Information Technology (DolT),
uses technology to provide an efficient and streamlined end-to-end tax process,
which benefits the NH taxpayer, by providing modernized operations and
accurate information.
During FY 2020 the embedded DolT development team began the efforts to retire
the 30 year old Legacy Tax Information Management System (TIMS). All Meals and
Rental Tax, Nursing Facility Quality Assessment, and Medicaid Enhancement Tax
functionality is now inquiry only. The development team also worked to process
all affiliated tax forms through the Document Imaging and Electronic Remittance
application in order to flow seamlessly in to the new Revenue Information
Management System (RIMS). This Document Imaging and Electronic Remittance
initiative processes paper documents, utilizing barcodes and Optical Character
Recognition (OCR), to reduce the need for manual data entry. Payments collected
are remitted to the State's financial institution by an Image Cash Letter (ICL) which
in turn provides the State with same day credit of the funds.
Ongoing efforts continue to maintain the highest level of security and comply with
IRS standards. DolT has introduced changes to improve security on individual
devices as well as the entire infrastructure.
In addition to the major projects above, DolT worked diligently to get employees
out of the building when the 2019 novel Coronavirus hit. DolT was busy insuring
that employees had remote access, the proper hardware and collaborative
software needed to perform their job functions. Two-thirds of the Department as
well as the entire vendor team left the office to shelter in place for an extended
period. During the early stages of the pandemic, the IRS updated tax-filing
deadlines and the DRA implemented a plan for pandemic relief to the taxpayers ofNH. The embedded DolT developers made the appropriate changes to the legacysystem in order to meet the aggressive deadlines.
www.revenue.nh.gov 2020 Annual Report Of the Department Of Revenue Administration 37
'•.-- ■ - '. '->" •••; • ^ - ' ■■•- : • ■-■ ; ,
R(ev#ue Inf)yianagement iSystem (RIIVI5)
\6qultf/
1-t. •
■<^DRA Proiecti Director
Lisa Crowleyif-
i, I -0 - " 4h
Subiect Matter
Exoerts
Donald Dibble
Nicole tiltonBrian Quigley '
Meghan JohnsonAngela Camire\ Sp\fo Millios
NHORAKi :vi:nu I-: \ n i-or m a h onMANAGKWKN'r SYSTliM
HRANTTRTAX CONTJECT
I v:y7:(:()7.^/ir?u
RIMS Goes Live
As fiscal year 2020 comes to a close, the Department of Revenue Administration(DRA), like many across the globe, have experienced an unprecedented^time in itshistory. Facing a global pandemic forced us to move the majority of our staff toremote work locations. Given the importance of DRA's contributions to overall statefunding, as well as the fact that DRA is In the middle of the second phase of a majorsystem upgrade scheduled to go live on October 5, 2020, many of these changes wereinitially met with trepidation. However, DRA has remained steadfast, keeping ouragency goals and taxpayer needs at the forefront of our minds.
On October 28, 2019, DRA successfully Implemented the first phase of its RevenueInformation Management System (RIMS), and its external facing web portal GraniteTax Connect (GIG) for our Meals & Rentals Tax, Medicaid Enhancement Tax, andNursing Facility Quality Assessment taxpayers. Since this date, DRA has processedmore than 59,000 returns through the system, more than 45,000 of those filed viaGTC, we processed over $515 million in payments, collected over $2.8 million in ageddebt, issued more than 69,000 taxpayer letters, and instituted numerous internalprocessing efficiencies. The improvements introduced in this initial phase, bothinternally and externally, have made for a much more user-friendly experience for all,and we look forward to increasing these benefits with phase 2 of the project.
The second phase of the RIMS Project will go live on October 5, 2020 for our NHBusiness Profits, Business Enterprise, Interest and Dividends, and CommunicationServices Taxpayers. Given the complexity and volume of these tax types, our projectteam didn't waste any time jumping into the definition and development phases ofthe project. In spite of the more than 30 DRA and FAST project staff membersworking remotely, we're proud to say that this has merely been a bump in the roadfor our team. On October 5, 2020, NH taxpayers of phase 2 tax types can expect newand exciting changes in the way they manage their accounts and interact with DRA ingeneral. These changes include online account access through GTC, the ability to linkmultiple tax accounts under one GTC login, grant GTC login permissions to taxpreparers, file returns, make payments, receive DRA correspondence via their GTCaccount, and file many DRA forms online, including the NH Power of Attorney,Certificate Requests, and CST Registrations, just to name a few.
Fiscal year 2020 may have had its challenges, but DRA remains focused on the future!
www.revenue.nh.gov 2020 Annual Report Of the Department Of Revenue Administration 38
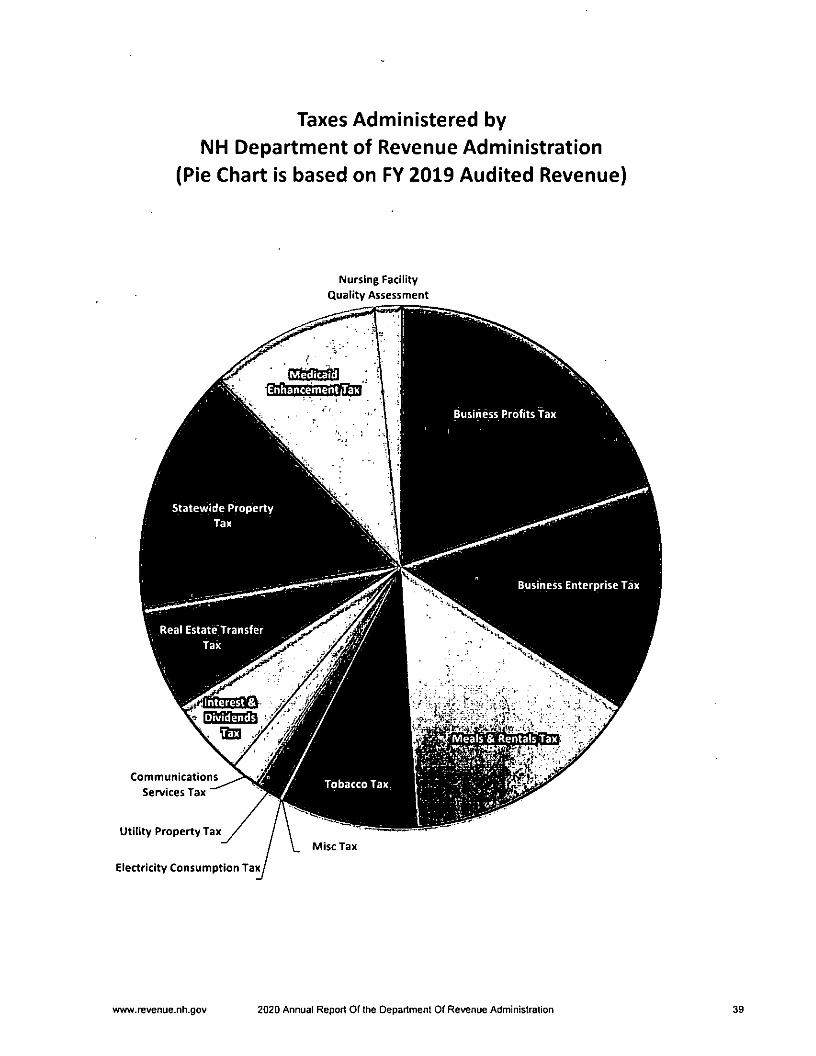
Taxes Administered by
NH Department of Revenue Administration
(Pie Chart is based on FY 2019 Audited Revenue)
Nursing Facility
Quality Assessment
Medicaid
Business Profits Tax
\ ■ :
Business Enterprise Tax
7/.
f ' V :>-x
T/r rj/".*
. 7/ t*» EBSEBIEQ»x •
Tobacco Tax
Misc Tax
Communications
Services Tax
Utility Property Tax
Electricity Consumption Tax
www.revenue.nh.gov 2020 Annual Report Of the Department Of Revenue Administration 39

Business Tax Revenue by Entity Type 10-Year TrendTax Liability Reported
sgsc
800
700
F600
500
400
300
200
100
TY2009 TY2010 TY2011 TY2012 TY2013 TY2014 TY2015 TY2016 TY2017 TY2018
Corporation □ Partnership □ Proprietorship □ Fiduciary n Non-Profits
Entity Type TY2009 .TY2010 TY20i r TY2012 - TV2013 TY2014 TY2015 TY2016 TY2017 TY2018
Corporation $415.3 $391.9 $400.6 $421.6 $445.2 $452.7 $519.4 $482.2 $529.4 $584.7 '• Partnership . $4T3 • " Tsf.r "■^04^7 $58.3; ""$^9^4"^ _~$73.6;_ 7/ $76.77 ~$i26.6f!
Proprietorship $23.1 $25.9 $26.1 $27.3 $27.0 ^ $27.7" $29.2 $30.7 $32.2 $30.41 Fic^ciary, '1 $272 $2.4 ■
...
Non-Profits $2.2 $1.8 $1.3 $1.3 $1.2 $1.3 $1.7 $1.6 SI.5 $1.3
TOTAL $490.2 _$474.p___$480.0__$ 5.10.8 _$535.1__$550.2„_$6_26.3___$59_4.6__$664.5__$745.3_
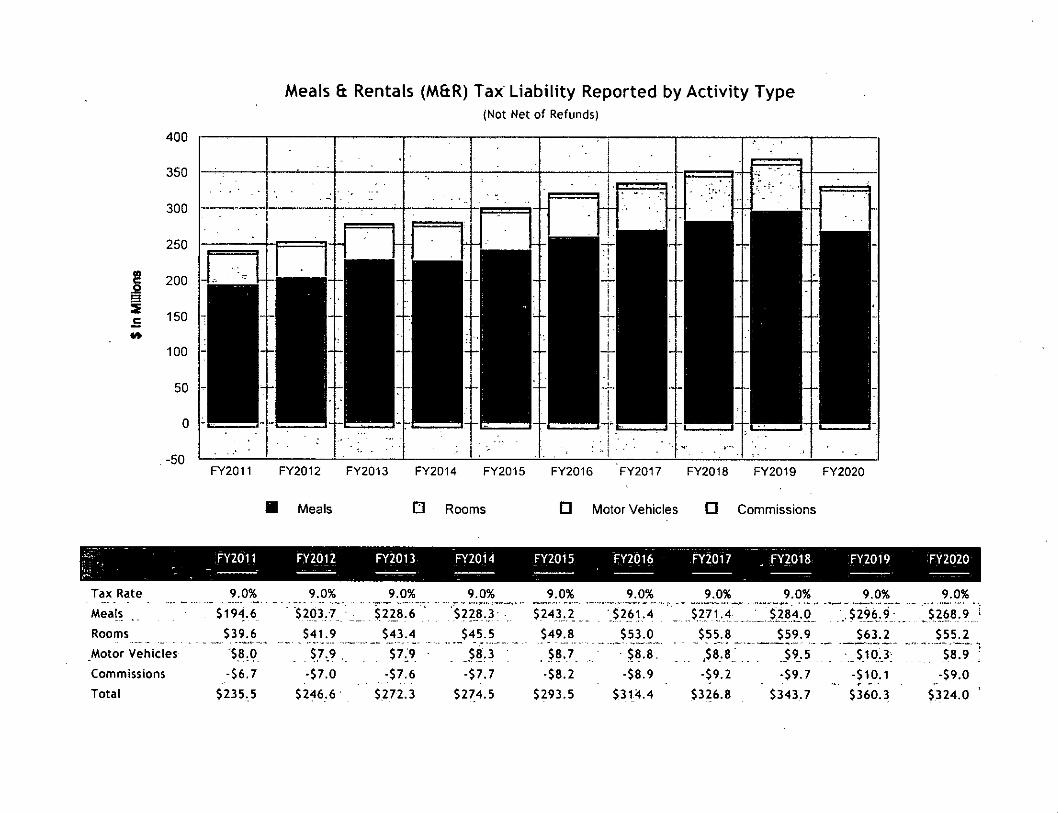
sg'"Sc
400
Meals & Rentals (M&R) Tax Liability Reported by Activity Type(Not Net of Refunds)
350
300
250
200
150
100
50
FY2011 FY2012 FY2013 FY2D14 FY2015 FY2016 FY2017 FY2018 FY2019 FY2020
Meals □ Rooms D Motor Vehicles O Commissions
FY2011 Fvioiz" FY2013 FY2014 FY2015 FY2016 FY2017 . FY2018 :FY2019 :FY2020
Tax Rate 9.0% 9.0% 9.0% 9.0% _9.0% 9.0% 9.0% 9.0% 9.0% 9.0%
Meals $194.6 " $203,7 $228.6 ' $228.3 $243,2 '-$261.4 ' _ $271,4 $i84.0 ■.,$296^.f; $268,9Rooms $39.6 $41.9 $43.4 $45.5 $49.8 $53.0^ $55.8^ $59.9 $63.2 155_^2_Motor Vehicles $8,0 $7.9 $7^9 ■ ,$8.3 . $8.7, $8.8. ,$8.8 -$9-5 ' $10.3; $8.9
Commissions -$6.7 -$7.0 :$7.6 -$7.7 $8.2 -$8.9 ■$9.2 -$9.7 -$10.1 -$9.0Total $235,5 $246.6 $272.3 $274.5 $293.5 $314.4 $326.8 $343.7 $360.3 $324.0

SURROUNDINGISTATE'SiTOBAGeOjTAXSTAMPSSALES'ANALYSISiS
imffT
.easEi?SALES
(IN MILLIONS) ONE STAMP PGR PACKAGE
\m}h} — "BBnr
SALES
eaasa?
F.Y2015
SQEEP.
Maine, ■■ t6%. "'\60.7.' .2%: "64:9 v 4% 62:3-
Massachusetts 147.1 -7% 157.8 -5% 165.3 -5%: 174 0% 174.7
New.Hampshire i : 106A- • .•112 ':-A% '■ 116-.5 ; -4%| . l-21-.8j ' . 3% . 118.8
Vermont 19.7 -4% 20.5 ■10% 22.7 -3% ! 23.4 -8% 25.3
Source: The Tax Burden on Tobacco
TOBACCO TAX REVENUE
TOBACCO'STAMPS■mmmoipmmm• FY2020 - • $'l96,310;930t:' ii$4'6;3i-i,842* , • :• V= -'S-212v622,772^-FY2019 $ 186,054,789 ■$ 13,663,625 $ 199,718,414
TFY2dl8 • ■;$;203!441-,366i ;•; $ i3,028;i99n;:: ■ f;:^ ;$'216,469,565 'FY2017 $ 203,945,525 $ 12,222,220 $ 216,167,746FY2016 " $ 219,217,341 10,39^;227l:;:- ' .$ 229;614,568
OTP VERSUS TOBACCO STAMP TAX REVENUE
TOBACCO'STAMPSr SBFY2020 V ■ -• 92% . CO - /;100%FY2019 93% 7% 100%
'FY2018 : 94% . . ' ; ; 100%
FY2017 94% 6% 100%
Fy2016i ' ^ . 95% ; - .. ' , ..5% ' ;■ 100% '
YEAR-OVER-YEAR DIFFERENCE
TOBACCOjSTAMPS SB, RY2020 : 5.5% ' , ; . .19:4% ■- , ; -6.1%- ■
FY2019 -8.5% 4.9% 8.4%
'FY2018f \ ■, ' -0:2% \ ■6:6%;' .■ V- ■ ■ ' -0.1%FY2017 -7.0% 17.6% 6.2%
FY2016 . ;■ ; : ^3:4%' :3;9% ' "-3:3%;: ■ ■•Figure includes E-Cigarette Tax implemented 1/1/2020.
j ■ . : "(EJEBuSnESS "
.FY2020. ^ '■ '^7^-'66*'FY2019 219 34
'F.Y2018: V. '" 'V.' .; .173. -V .. . 17'';- ■FY2017 177 21
"FY2016 ;.7;iv T;i3i;^ ■ \•Numbers were reduced due to COVID-19 impact.
The Audit Tobacco Group and members of the Collections Division are responsible for conducting'tobaccocompliance checks at NH retail locations as part of the diligent enforcement provision of the Master SettlementAgreement (MSA). These checks are to ensure that NH retailers are purchasing tobacco products on which the NHtobacco tax has been paid and to identify product in the state from Non-Participating Manufacturers as outlined inthe MSA. When tobacco products are found without the tax paid, it is considered contraband and subject toseizure.
www.revenue.nh.gov 2020 Annual Report Of the Department Of Revenue Administration 42
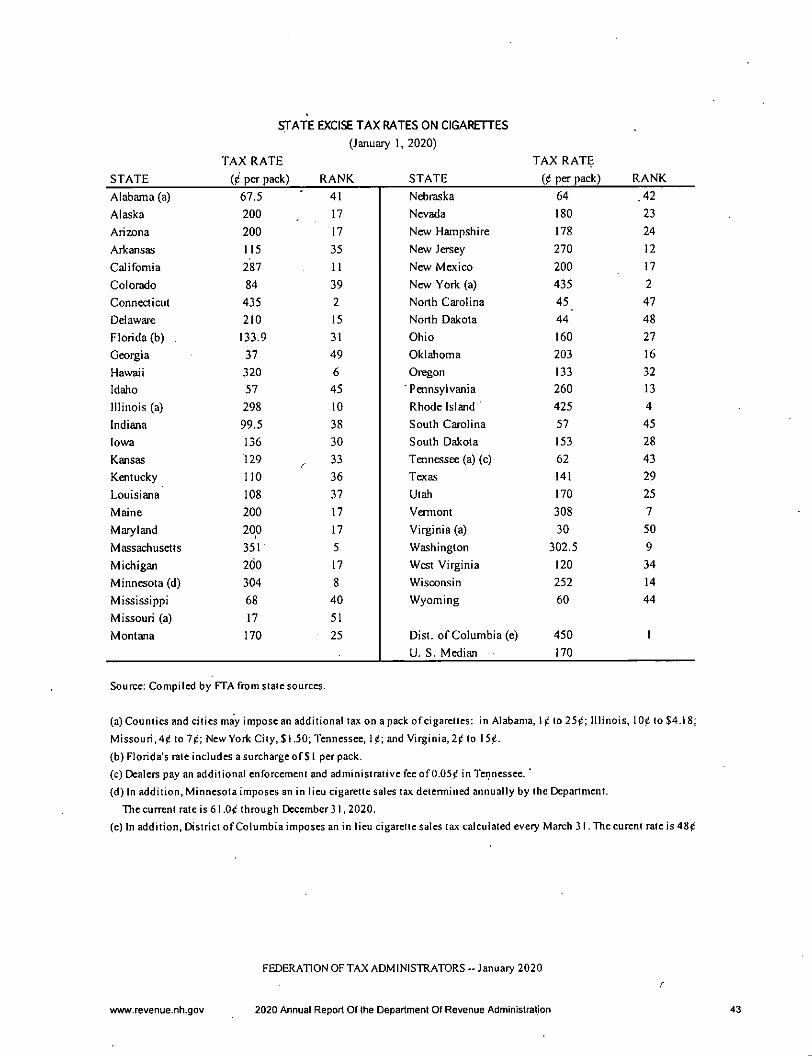
STATE
STATE EXCISE TAX RATES ON CIGARETTES
(January 1, 2020)
TAX RATE
(0 per pack) RANK STATE
TAX RATE
(0 per pack) RANK
Alabama (a) 67.5 41 Nebraska 64 .42
Alaska 200 17 Nevada 180 23
Arizona 200 17 New Hampshire 178 24
Arkansas 115 35 New Jersey 270 12
California 287 11 New Mexico 200 17
Colorado 84 39 New York (a) 435 2
Connecticut 435 2 North Carolina 45 _ 47
Delaware 210 15 North Dakota 44 48
Florida (b) 133.9 31 Ohio 160 27
Georgia 37 49 Oklahoma 203 16
Hawaii 320 6 Oregon 133 32
Idaho 57 45 ■ Pennsylvania 260 13
Illinois (a) 298 10 Rhode Island 425 4
Indiana 99.5 38 South Carolina 57 45
Iowa 136 30 South Dakota 153 28
Kansas 129 33 Tennessee (a) (c) 62 43
Kentucky 110 36 Texas 141 29
Louisiana 108 37 Utah 170 25
Maine 200 17 Vermont 308 7
Maryland 200/
17 Virginia (a) 30 50
Massachusetts 351 5 Washington 302.5 9
Michigan 200 17 West Virginia 120 34
Minnesota (d) 304 8 Wisconsin 252 14
Mississippi 68 40 Wyoming 60 44
Missouri (a) 17 51
Montana 170 25 Dist. of Columbia (e) 450 1
U. S. Median 170
Source: Compiled by FTA from slate sources.
(a) Counties and cities may impose an additional tax on a pack of cigarettes: in Alabama, 1 ̂ to 25^; Illinois, 100 to S4.18;
Missouri, 40 to 70; New York City, $1.50; Tennessee, 10; and Virginia, 20 to 150.
(b) Florida's rate includes a surcharge of SI per pack.
(c) Dealers pay an additional enforcement and administrative fee of 0.050 in Tennessee."
(d) In addition, Minnesota imposes an in lieu cigarette sales tax determined annually by the Department.
The current rateis6I.O0 through December31,2020.
(e) In addition. District of Columbia imposes an in lieu cigarette sales tax calculated every March 31. Thecurcnt rate is 480
FEDERATION OFTAX ADMINISTRATORS - January 2020
www.revenue.nh.gov 2020 Annual Report Of the Department Of Revenue Administration 43
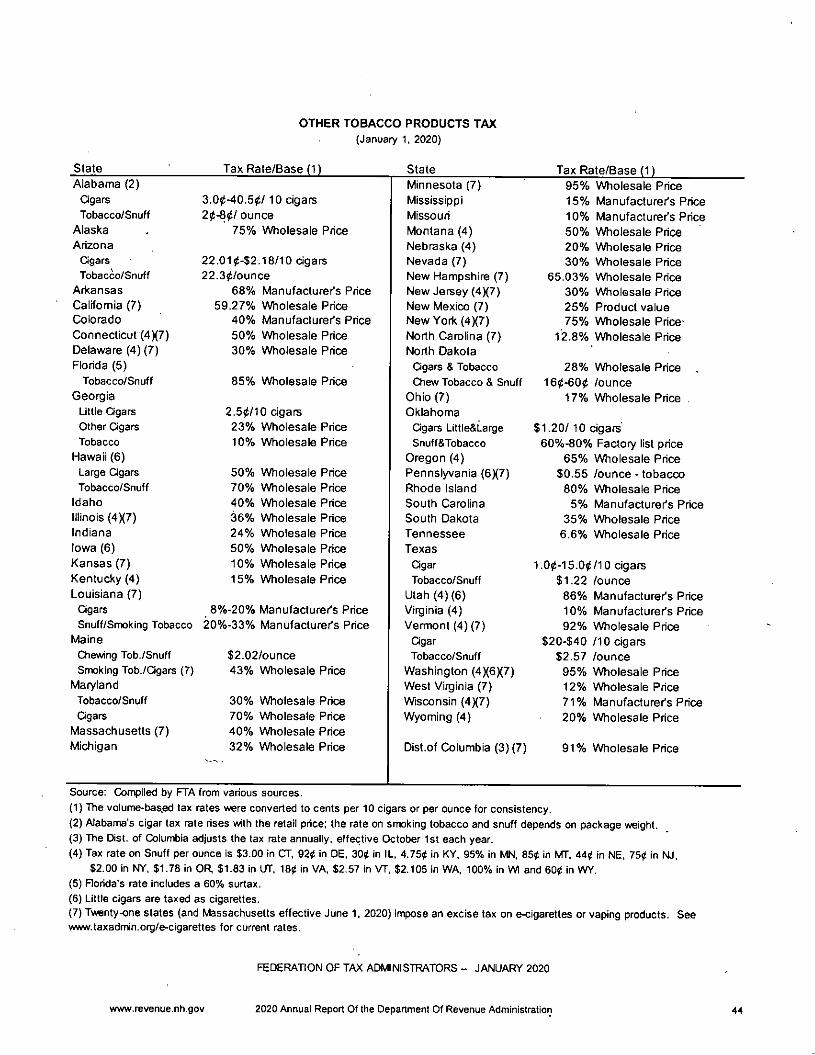
OTHER TOBACCO PRODUCTS TAX
(January 1, 2020)
State Tax Rate/Base (1) State
Alabama (2) Minnesota (7) 95% Wholesale Price
Ogars 3.00-40.50/ 10 cigars Mississippi 15% Manufacturer's Price
Tobacco/Snuff 20-80/ ounce Missouri 10% Manufacturer's Price
Alaska 75% Wholesale Price Montana (4) 50% Wholesale Price
Arizona Nebraska (4) 20% Wholesale Price
Cigars 22.010-$2.18/10 cigars Nevada (7) 30% Wholesale Price
Tobacco/Snuff 22.30/ounce New Hampshire (7) 65.03% Wholesale Price
Arkansas 68% Manufacturer's Price New Jersey (4X7) 30% Wholesale Price
Caiifomia (7) 59.27% Wholesale Price New Mexico (7) 25% Product value
Colorado 40% Manufacturer's Price New Yotk (4X7) 75% Wholesale Price-
Connecticut (4X7) 50% Wholesale Price North Carolina (7) 12.8% Wholesale Price
Delaware (4) (7) 30% Wholesale Price North Dakota
Florida (5) Qgars & Tobacco 28% Wholesale Price .
Tobacco/Snuff 85% Wholesale Price Qiew Tobacco & Snuff 160-600 /ounceGeorgia Ohio (7) 17% Wholesale Price
Little Qgars 2.50/10 cigars Oklahoma
Other Cigars 23% Wholesale Price Qgars Littie&Large $1.20/10 cigarsTobacco 10% Wholesale Price Snuff&Tobacco 60%-80% Factory list price
Hawaii (6) Oregon (4) 65% Wholesale Price
Large Cigars 50% Wholesale Price Pennslyvania (6X7) $0.55 /ounce - tobacco
Tobacco/Snuff 70% Wholesale Price Rhode Island 80% Wholesale Price
Idaho 40% Wholesale Price South Carolina 5% Manufacturer's Price
Illinois (4X7) 36% Wholesale Price South Dakota 35% Wholesale Price
Indiana 24% Wholesale Price Tennessee 6.6% Wholesale Price
Iowa (6) 50% Wholesale Price Texas
Kansas (7) 10% Wholesale Price Qgar 1.00-15.00/10 cigarsKentucky (4) 15% Wholesale Price Tobacco/Snuff $1.22 /ounce
Louisiana (7) Utah (4) (6) 86% Manufacturer's Price
Qgars 8%-20% Manufacturer's Price Virginia (4) 10% Manufacturer's Price
Snuff/Smoking Tobacco 20%-33% Manufacturer's Price Vermont (4) (7) 92% Wholesale Price
Maine Qgar $20-$40 /10 cigarsChewing Tob./Snuff $2.02/ounce Tobacco/Snuff $2.57 /ounce
Sax)king Tob./Ogars (7) 43% Wholesale Price Washington (4X6X7) 95% Wholesale Price
Maryland West Virginia (7) 12% Wholesale Price
Tobacco/Snuff 30% Wholesale Price Wisconsin (4X7) 71% Manufacturer's Price
Qgars 70% Wholesale Price Wyoming (4) 20% Wholesale Price
Massachusetts (7) 40% Wholesale Price
Michigan 32% Wholesale Price Dist.of Columbia (3) (7) 91% Wholesale Price
Source: Compiled by FTA from various sources.
(1) The volume-bas.ed tax rates were converted to cents per 10 cigars or per ounce for consistency.
(2) Alabama's cigar lax rate rises with the retail price; the rate on smoking tobacco and snuff depends on package weight.(3) The Dist. of Columbia adjusts the tax rate annually, effective October 1st each year.(4) Tax rate on Snuff per ounce is $3.00 in CT. 920 in DE, 300 in IL. 4.750 in KY, 95% in MN. 850 in MT, 440 in NE, 750 in NJ,
$2.00 in NY. $1.78 in OR. $1.83 in UT. 180 in VA. $2.57 in VT, $2,105 in WA, 100% in Wl and 600 in WY.(5) Rorida's rate includes a 60% surtax.
(6) Little cigars are taxed as cigarettes.(7) Twenty-one states (and Massachusetts effective June 1, 2020) impose an excise tax on e-cigarettes or vaping products. Seewww.taxadmin.org/e-cigarettes for current rates.
FEDERATION OF TAX ADMINISTRATORS - JANUARY 2020
www.revenue.nh.gov 2020 Annual Report Of the Department Of Revenue Administration 44
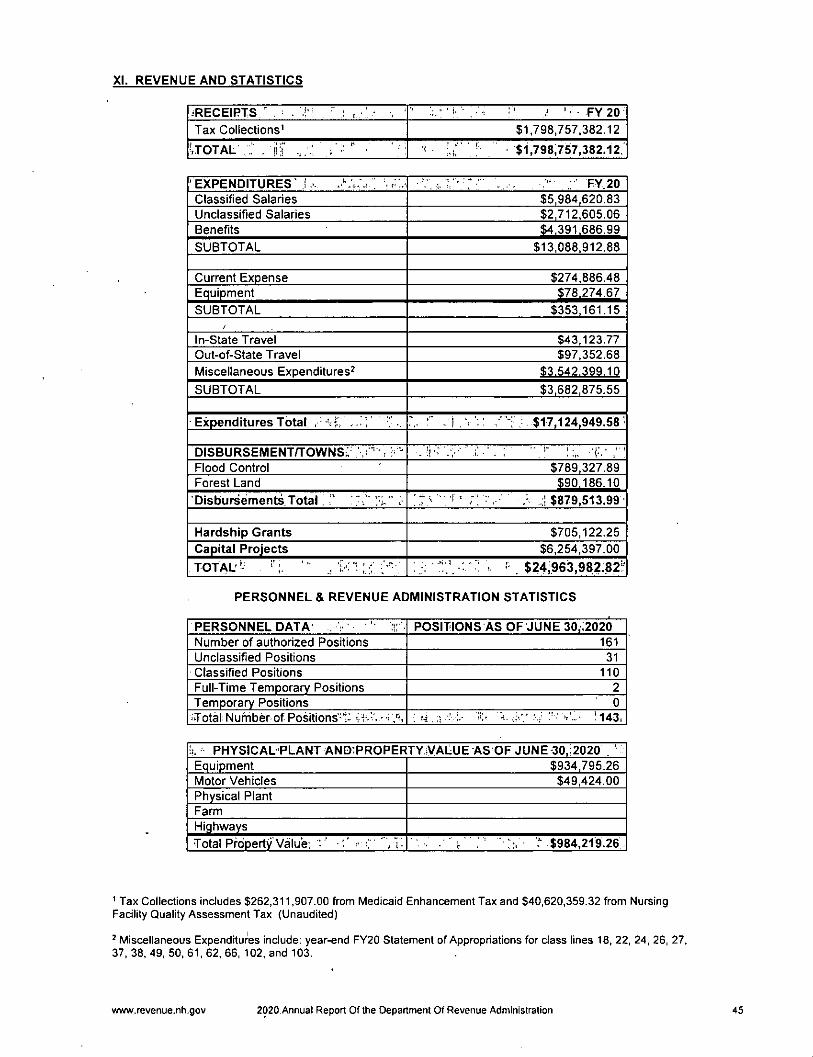
XI. REVENUE AND STATISTICS
.RECEIPTS ' . ! ■ " : , 'i. • FY20•
Tax Collections' $1,798,757.382.12
-.TOTAL" . 'n ■< • f : $1,798,757,382.12.
EXPENDITURES f .-. FY.20.Classified Salaries $5,984,620.83Unclassified Salaries $2,712,605.06Benefits $4,391,686.99
SUBTOTAL $13,088,912.88
Current Expense $274,886.48Equipment $78,274.67
SUBTOTAL $353,161.15
In-State Travel $43,123.77Out-of-State Travel $97,352.68Miscellaneous Expenditures^ $3,542,399.10
SUBTOTAL $3,682,875.55
Expenditures Total , - ! , 7; : "7 ; $17,124,949.58-
disbursement/towns: . '.V' ' 1 'i-. 'Flood Control $789,327.89Forest Land $90,186.10
DIsbursementiTotal , S i i $879,513.99
Hardship Grants $705,122.25Capital Projects $6,254,397.00TOTAL yV: : ,i- X'. ■ ' ■ . $24,963,982:82^
personnel & REVENUE ADMINISTRATION STATISTICS
PERSONNEL DATA . ' POSITIONS AS OF JUNE 30,;2020Number of authorized Positions 161Unclassified Positions 31Classified Positions 110Full-Time Temporary Positions 2Temporary Positions 0-Total Number of Positions-'i- -i 7n 7.-"7 '143.
b. PHYSICAL PLANT ANDiPROPERTY VALUE AS OF JUNE 30. 2020Equipment $934,795.26Motor Vehicles $49,424.00Physical PlantFarmHiqhwaysTotal Property Value; • ' '' !• C , T- . . ." ^ $984,219.26
' Tax Collections includes $262,311,907.00 from Medicaid Enhancement Tax and $40,620,359.32 from NursingFacility Quality Assessment Tax (Unaudited)
^ Miscellaneous Expenditures include: year-end FY20 Statement of Appropriations for class lines 18, 22, 24, 26, 27,37, 38, 49. 50. 61. 62. 66, 102, and 103.
www.revenue.nh.gov 2020 Annual Report Of the Department Of Revenue Administration 45
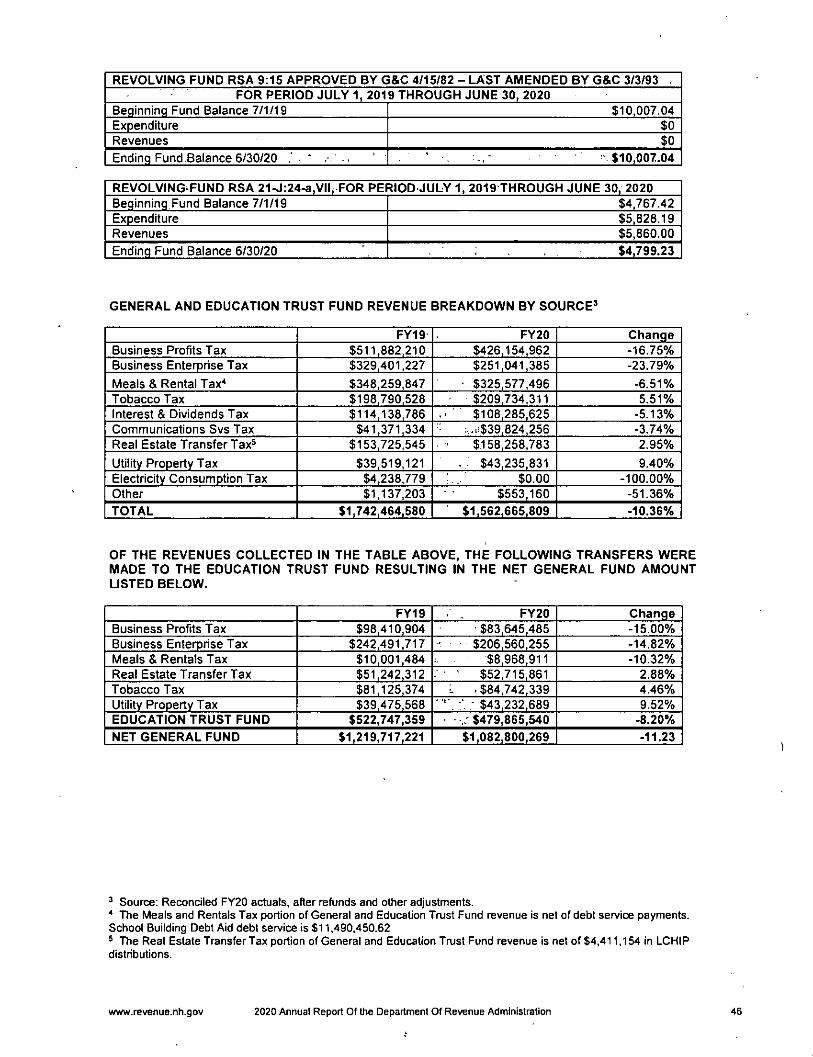
REVOLVING FUND RSA 9:15 APPROVED BY G&C 4/15/82 - LAST AMENDED BY G&C 3/3/93 .
FOR PERIOD JULY 1, 2019 THROUGH JUNE 30, 2020
Beginning Fund Balance 7/1/19 $10,007.04
Expenditure $0
Revenues $0
Ending Fund.Balance 6/30/20 .' • * ' . $10,007.04
REVOLVING'FUND RSA 21^:24^,VII. FOR PERIOD JULY 1. 2019 THROUGH JUNE 30. 2020
Beginning Fund Balance 7/1/19 $4,767.42
Expenditure $5,828.19
Revenues $5,860.00
Ending Fund Balance 6/30/20 $4,799.23
GENERAL AND EDUCATION TRUST FUND REVENUE BREAKDOWN BY SOURCE^
FY19 FY20 Change
Business Profits Tax $511,882,210 $426,154,962 -16.75%
Business Enterprise Tax $329,401,227 $251,041,385 -23.79%
Meals & Rental Tax^ $348,259,847 ■ $325,577,496 -6.51%
Tobacco Tax $198,790,528 • $209,734,311 5.51%
Interest & Dividends Tax $114,138,786 $108,285,625 •5.13%
Communications Svs Tax $41,371,334 :...ii$39,824,256 -3.74%
Real Estate Transfer Tax^ $153,725,545 $158,258,783 2.95%
Utility Property Tax $39,519,121 - . $43,235,831 9.40%
Electricity Consumption Tax $4,238,779 $0.00 -100.00%
Other $1,137,203 $553,160 -51.36%
TOTAL $1,742,464,580 $1,562,665,809 -10.36%
OF THE REVENUES COLLECTED IN THE TABLE ABOVE, THE FOLLOWING TRANSFERS WEREMADE TO THE EDUCATION TRUST FUND RESULTING IN THE NET GENERAL FUND AMOUNT
LISTED BELOW.
FY19 FY20 Change
Business Profits Tax $98,410,904 $83,645,485 -15.00%
Business Enterprise Tax $242,491,717 $206,560,255 -14.82%
Meals & Rentals Tax $10,001,484 $8,968,911 -10.32%
Real Estate Transfer Tax $51,242,312 ' $52,715,861 2.88%
Tobacco Tax $81,125,374 L ̂ $84,742,339 4.46%
Utility Property Tax $39,475,568 " ; $43,232,689 9.52%
EDUCATION TRUST FUND $522,747,359 . $479,865,540 -8.20%
NET GENERAL FUND $1,219,717,221 $1,082,800,269 -11.23
^ Source: Reconciled FY20 actuals, after refunds and other adjustments.* The Meals and Rentals Tax portion of General and Education Trust Fund revenue is net of debt service payments.School Building Debt Aid debt service is $11,490,450.62® The Real Estate Transfer Tax portion of General and Education Trust Fund revenue is net of $4,411,154 in LCHIPdistributions.
www.revenue.nh.gov 2020 Annual Report Of the Department Of Revenue Administration 46
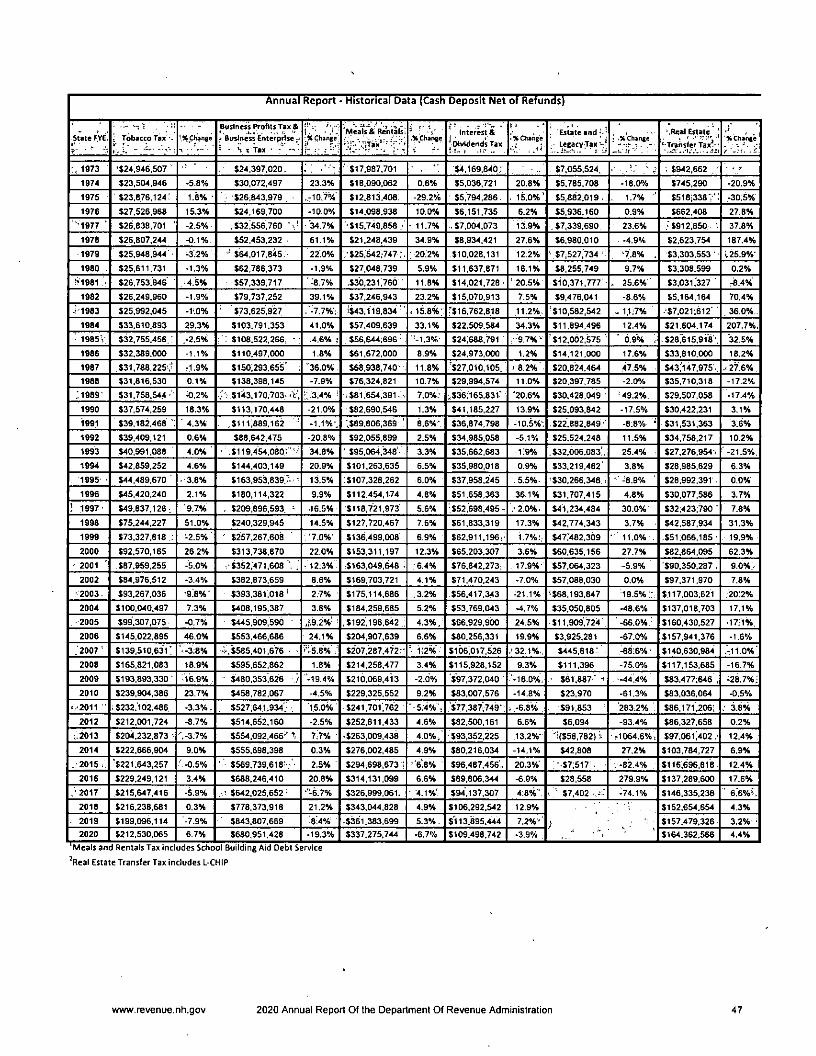
Annual Report • Historical Data (Cash Deposit Net of Refunds)
State fVe!: Tobacco Tax'■ >.pi:ange-A ■ ■ —
Business Profits Tax &
I Business Enterp^e;-» - S s Tax •
i - . i 'Change
'Meals & Rentals:
:;;jl>;'r"fax'••'' : -'t* :.KChange
i r •
Interest &
^ Dividends Taxi 1.. . .!!• .. .
r 1
IKChange
i '.' •Estate and f- '
; Legacy Tax-1 .XChange
—u :i .
'.fteal Eflal^'•Transfer Tax'-'
XChange
\ 1973 •$24,946,507 ' $24,397,020- •' $17,987,701 $4,169,840: $7,055,524. -- -/ . $942,662 . -
1974 $23,504,946 -5.8% $30,072,497 23.3% $18,090,062 0.6% $5,036,721 20.8% $5,785,708 -18.0% $745,290 •20,9%
1975 $23,876,124: 1.6% • ; $26,843,979 . .,-10.7% $12,613,406 -29.2% $5,794,286 . 15.0%' $5,882,019 1.7% ; $518-338",'. •30.5%
1976 $27,526,968 15.3% $24,169,700 -10,0% $14,098,938 10.0% $6,151,735 6.2% $5,936,160 0.9% $662,408 27.8%
•1977 " $26,638,701 -2.5% ,$32;556,760 " - 34.7% '•$15,749,858 - 11.7% ..$7,004,073 '13.9% -. $7,339,690 23.6% .•$912,850 '. 37.8%
1978 $26,807,244 -0.1%. $52,453,232 61.1% $21,248,439 34.9% $8,934,421 27.6% $6,980,010 -4.9% $2,623,754 187.4%
1979 $25,948,944- -3.2% $64,017,845.- 22.0% ..•$25,542,-747 20.2% $10,028,131 12.2% - $7,527,734 •• •7.8% . $3,303,553 v25.9%-
1980 . $25,611,731 -1.3% $62,786,373 -1.9% $27,048,739 5.9% $11,637,871 16.1% $8,255,749 9.7% $3,308,599 0.2%
>1981 $26,753,946 ^4.5% $57,339,717 '-:8.7% .$30,231,766 11.8% $14,021,728- ' 20.5% $10,371,777 - . 25.6% $3,031,327 ' ,-8.4%
1982 $26,249,960 -1.9% $79,737,252 39.1% $37,246,943 23.2% $15,070,913 7.5% $9,476,041 -8.6% $5,164,164 70,4%
1983 $25,992,045 •1-0% $73,625,927 .'-7,7%V i$43,H9,834" ■ 15.8%- '$16,762,818 11.2%. ■$10,582,542 - 1,1 ;7% -■$7.021;612' ' 36.0%..
1984 $33,610,893 29.3% $103,791,353 41.0% $57,409,639 33.1% $22,509,584 34.3% $11,694,496 12.4% $21,604,174 207.7%.
1985 V $32,755,466,' .-2.5% : $108,522,266, - .4.6% '$56,644,696- '--1.3%- $24:686.791 -9.7%- $12,002,575 0.9% , .$28,"615.9i'8'. 32.5%
1986 S32.389.000 -1.1% $110,497,000 1.8% $61,672,000 8.9% $24,973,000 1.2% $14,121,000 17,6% $33,810,000 18.2%
1987 $31,788,225;' r1.9% $150,293,655 36.0% $68,938,740- 11.8% $27,010,105 j 8.2% $20,824,464 ,47.5% $43;i47,975.. .■ 27.6%
1988 $31,816,530 0.1% $138,398,145 -7.9% $76,324,821 10.7% $29,994,574 11.0% $20,397,785 -2.0% $35,710,318 -17.2%
:i989' $31,758,544 - ^.2% >r.$l43.l70,-703- '"t-' i; 3.4% i <.-$81.654:391 7.0%: $36:165,831" '20.6% $30,428,049 •49.2%. $29,507,058 •17.4%
1990 $37,574,259 18.3% $113,170,448 -21.0% $82,690,546 1.3% $41,185,227 13.9% $25,093,842 •17.5% $30,422,231 3.1%
1991 $39,182,468 " 4,3% .$111',889,162 -1.1%-, ;$e9.eo6,369 ! 8.6%-. $36,874,798 -10.5%-. $22,882,849- -8:8% ■ $31,531,363 3:6%
1992 $39,409,121 0.6% $88,642,475 -20.8% $92,055,899 2.5% $34,985,058 -5.1% $25,524,248 11.5% $34,758,217 10.2%
1993 $40,991,088 4.0% • .$119,454,080V'--' 34.8% ' $95,064,348 - 3.3% $35,662,683 -1:9% $32,006,083!. 25.4% $27,276,954i -21.5%.
1994 $42,859,252 4.6% $144,403,149 20.9% $101,263,635 6.5% $35,980,018 0.9% $33,219,462 3.8% $28,985,629 6.3%
1995 ■ $44,489,670 ' • 3.8% $163,953,839,.':-- 13.5% :S107.328.262 6.0% $37,958,245 -5.5%. $30,266,346 ; •' -8.9% $28,992,391 . 00%
1996 $45,420,240 2.1% $180,114,322 9.9% $112,454,174 4.8% $51,658,363 36.1% $31,707,415 4.8% $30,077,586 3.7%
; 1997- $49,837,126: '9.7% . $209,896,593 ' -16.5% $118:721,973 5.6% '$52,698,495 v .'2.0%. $41,234,484 30.0% $32,423:790 ' 7.8%
1998 $75,244,227 51.0% $240,329,945 14.5% $127,720,467 7.6% $61,833,319 17.3% $42,774,343 3.7% . $42,587,934 31.3%
1999 $73,327,818 : -2.5% - $257,267,608 . '7.0%' $136,499,008 6.9% $62,911.196- 1.7%;; $47r482,3d9 ■ 11.0% . .$51,066,185 ■ 19.9%
2000 $92,570,165 26.2% $313,738,870 22.0% $153,311,197 12.3% $65,203,307 3.6% $60,635,156 27.7% $82,864,095 62.3%
- 2001 $87,959,255 -5.0% $352,471,608 , • 12;3% $163,049,648 : 6.4% $76,842,273: 17.9%- $57,064,323 -5.9% $90,350,287 . 9.0%.
2002 $84,976,512 -3.4% $382,873,659 8.6% $169,703,721 4.1% $71,470,243 -7.0% $57,088,030 0.0% $97,371,970 7,8%
-2003. $93,267,036 -9;8%' $393,381,016' 2.7% ,$175,114,686 .3.2% $56,417,343 -21.1% •$68,193,847 19.5%:: $117,003,621 20:2%
2004 $100,040,497 7.3% $408,195,387 3.8% $184,259,685 5.2% $53,769,043 -4,7% $35,050,805 -48.6% $137,018,703 17,1%
• 2005 $99,307,075 -0.7% $445,909,590 ' .,',9.2%- ■ .$192,196,642 . 4.3%. $66,929,900 24.5% $11,909,724 -66.0%;- $160,430,527 •17:1%,
2006 $145,022,695 46.0% $553,466,686 24.1% $204,907,639 6.6% $80,256,331 19.9% $3,925,281 -67.0% $157,941,376 -1.6%
.2007 $139,510,631" -3:8% -;s$585,401,676 - ■"r5.8% .' $207,287,472;- i;2% $106;017,526 32.1%., $445,818: -88:6% • $140,630,984 .-11.0%
2008 $165,821,083 18.9% $595,652,862 1.8% $214,258,477 3.4% $115,928,152 9.3% $111,396 -75.0% $117,153,685 -16.7%
2009 $193,893,330 ' 16.9% $480,353,626 -19.4% $210,069,413 -2.0% $97,372,040 '-15.0%, • $61,887-' -I . --44.4% $83,477:646 , -28.7%;2010 $239,904,386 23.7% $458,782,067 -4.5% $229,325,552 9.2% $83,007,576 -14.8% $23,970 -61.3% $83,036,064 -0,5%
■■2011 ■ ;$232.'102,486 -3.3%. $527,641;934.- , 15.0% $241,701,762 '-5.4%'. '$77,387-,749': . -6.8% $91,853 283.2% $86,171,206; 3.8%
2012 $212,001,724 -8.7% $514,652,160 ■2.5% $252,811,433 4.6% $82,500,161 6.6% $6,094 -93.4% $86,327,658 0.2%
,.2013 $204,232,873 • ^-3.7% $554,092,466-' T 7.7% • $263,009,438 4.0%, $93,352,225 13.2%" ';{$58,782) '!• •-1064,6%: $97.06i;402 . 12.4%
2014 $222,666,904 9.0% $555,698,398 0.3% $276,002,485 4.9% $80,216,034 -14.1% $42,808 27.2% $103,784,727 6.9%
. 2015 . $221,643,257 •'.•0.5% • • $569,739,618'-- - 2.5% $294,698,673 ; •'6!8% • $96,487.456., 20.3%' : --$7,517. ;-82.4% $116,696,818 12.4%
2016 $229,249,121 3.4% $688,246,410 20.8% $314,131,099 6.6% $89,806,344 -6.9% $28,558 279.9% $137,289,600 17.6%
2017 $215,647,416 -5.9% $642,025,652- •"-^7% $326,999,061. - 4.1%' $94,137,307 4:8%T ' $7,402 -74.1% $146,335,236 ■ 6.6%''.2018 $216,236,681 0.3% $778,373,918 21.2% $343,044,828 4.9% $106,292,542 12.9% $152,654,654 4.3%
2019 $199,096,114 -7.9% $843,807,669 8;4% • $361,383,699 5.3%. $113,895,444 7.2%-' $157,479,326 3.2% •
2020 $212,530,065 6.7% $660,951,428 •19,3% $337,275,744 -6.7% $109,498,742 -3.9% $164,362,566 4.4%
I Service
Real Estate Transfer Tax Includes L-CHIP
www.revenue.nh.gov 2020 Annual Report Of the Department Of Revenue Administration 47
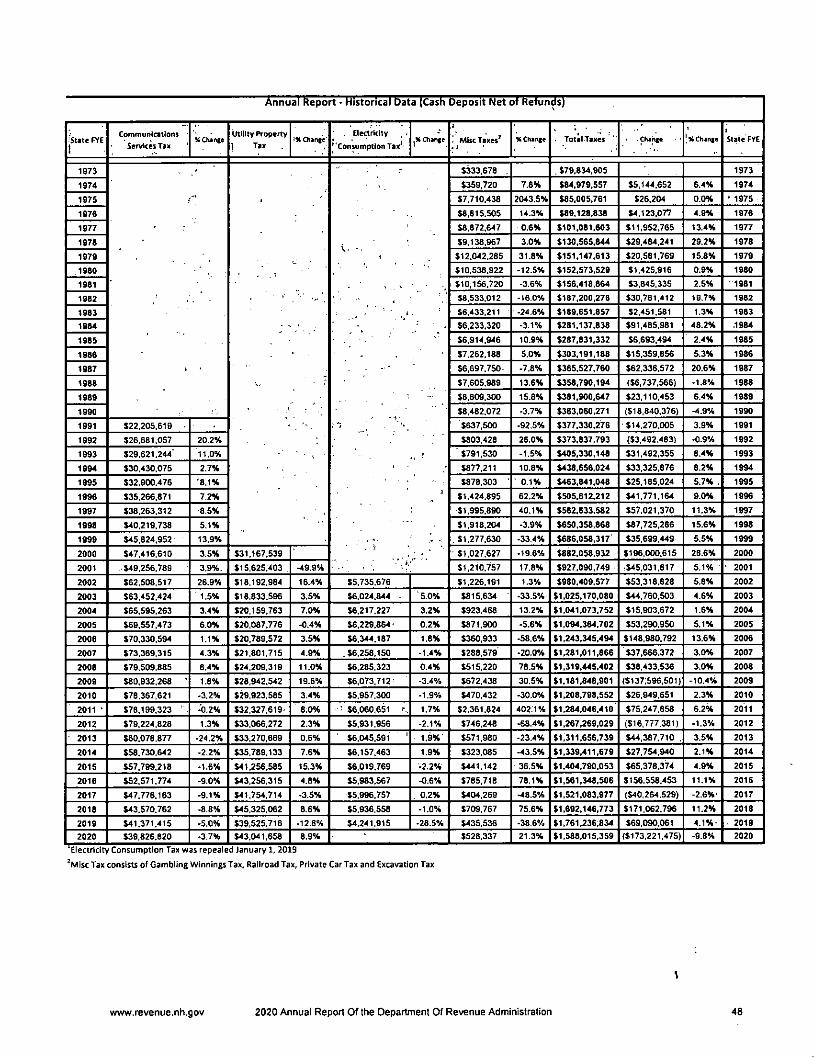
Annual t^eport • Historical Data (Cash Deposit Net of Refunds)
'State FYEj
Communications
ServicKTax 'KChange
Utility Property
j Tax1% Change'
. Electricity
'Consumption Tax'-jKChange
1
, Misc Taxes'.'J
KChange TotalTaxes . Change - ' Change Slate'FYE
1973
f"
, 5
V- • .1
1
$333,678 . . $79,834,905 1973
1974 $359,720 7.8% $84,979,557 $5,144,652 6.4% 1974
1975 $7,710,438 2043.5% $85,005,761 $26,204 0.0% ' 1975
1976 $8,815,505 14.3% $89,128,838 $4,123,077 4.9% 1976
1977 $8,872,647 0.6% $101,081,603 $11,952,765 13.4% 1977
1976 S9.138.967 3.0% $130,565,844 $29,484,241 29.2% 1978
1979 $12,042,285 31.8% $151,147,613 $20,581,769 15.8% 1979
1960 $10,536,922 -12.5% $152,573,529 $1,425,916 0.9% 1980
1961 $10,156,720 -3.6% $156,418,864 $3,845,335 2.5% 1981
1962 $8,533,012 -16,0% $187,200,276 $30,781,412 19.7% 1982
1983 $6,433,211 -24.6% $189,651,857 $2,451,581 1.3% 1983
1984 $6,233,320 -3.1% $281,137,838 $91,485,981 48.2% ,1984
1965 $6,914,946 10.9% $287,831,332 $6,693,494 2.4% 1985
1986 S7.262.168 5.0% $303,191,188 $15,359,856 5.3% 1986
1987 $6,697,750 -7.8% $365,527,760 $62,336,572 20.6% 1987
1966 $7,605,989 13.6% $358,790,194 ($6,737,566) •1.8% 1988
1989 $8,809,300 15.8% $381,900,647 $23,110,453 6.4% 1989
1990 $8,462,072 -3.7% $363,060,271 ($18,840,376) -4.9% 1990
1991 $22,205,619 ' $637,500 -92.5% $377,330,276 $14,270,005 3.9% 1991
1992 $26,681,057 20,2% $803,428 26.0% $373,837,793 ($3,492,483) -0.9% 1992
1993 $29,621,244" 11,0% $791,530 •1.5% $405,330,148 $31,492,355 6.4% 1993
1994 $30,430,075 2.7% $877,211 10.8% $438,656,024 $33,325,876 6.2% 1994
1995 $32,900,476 '8.1% $878,303 • ■ 0.1% $463,841,048 $25,185,024 5.7% . 1995
1996 $35,266,871 7.2% $1,424,895 62.2% $505,612,212 $41,771,164 9.0% 1996
1997 $38,263,312 8.5% $1,995,890 40.1% $562,633,582 $57,021,370 11.3% 1997
1998 $40,219,738 5,1% $1,918,204 -3.9% $650,358,868 $87,725,286 15.6% 1998
1999 $45,824,952 13.9% , $1,277,630 -33.4% $686,058,317 $35,699,449 5.5% 1999
2000 $47,416,610 3.5% $31,167,539 $1,027,627 -19.6% $882,058,932 $196,000,615 26.6% 2000
2001 $49,256,789 3.9%. $15,625,403 -49.9% $1,210,757 17.8% $927,090,749 $45,031,817 5.1% ' 2001
2002 $62,508,517 26.9% $18,192,964 16.4% $5,735,676 $1,226,191 1.3% $980,409,577 $53,318,826 5.6% 2002
2003 $63,452,424 1.5% $16,833,596 3.5% $6,024,844 ' 5.0% $815,634 -33.5% $1,025,170,080 $44,760,503 4.6% 2003
2004 $65,595,263 3.4% $20,159,763 7.0% $6,217,227 3.2% $923,468 13.2% $1,041,073,752 $15,903,672 1.6% 2004
2005 $69,557,473 6.0% $20,087,776 -0.4% $6,229,864- 0.2% $871,900 -5.6% $1,094,364,702 $53,290,950 5.1% 2005
2006 $70,330,594 1.1% $20,789,572 3.5% $6,344,187 1.8% $360,933 -58.6% $1,243,345,494 $148,980,792 13.6% 2006
2007 $73,369,315 4.3% $21,801,715 4.9% : $6,258,150 -1.4% $288,579 -20.0% $1,281,011,666 $37,666,372 3.0% 2007
2006 $79,509,885 6.4% $24,209,319 11.0% $6,285,323 0.4% $515,220 78.5% $1,319,445,402 $38,433,536 3.0% 2006
2009 $80,932,268 ' 1.8% $28,942,542 19.6% $6,073,712 -3.4% $672,438 30.5% $1,181,848,901 ($137:596,501) -10.4% 2009
2010 $78,367,621 -3,2% $29,923,565 3.4% SS.957.300 -1.9% $470,432 -30.0% $1,208,798,552 $26,949,651 2.3% 2010
2011 • $78,199,323 ^ -0.2% $32,327,619- 8.0% : $6,060,651 ' . 1.7% $2,361,824 402.1% $1,284,046,410 $75,247,856 6.2% 2011
2012 $79,224,828 1.3% $33,066,272 2.3% $5,931,956 -2.1% $746,248 -68.4% $1,267,269,029 ($16,777,381) -1.3% 2012
2013 $60,078,877 -24.2% $33,270,669 0.6% $6,045,591 ' 1.9% $571,980 -23.4% $1,311,656,739 $44,387,710 . 3.5% 2013
2014 $58,730,642 -2.2% $35,789,133 7.6% $6,157,463 1.9% $323,085 -43.5% $1,339,411,679 $27,754,940 2.1% 2014
2015 $57,799,218 •1,6% $41,256,585 15.3% $6,019,769 -2.2% $441,142 36.5% $1,404,790,053 $65,378,374 4.9% 2015
2016 $52,571,774 -9,0% $43,256,315 4.8% $5,983,567 •0.6% $785,718 78,1% $1,561,348,506 $156,558,453 11.1% 2016
2017 $47,776,163 -9.1% $41,754,714 -3.5% $5,996,757 . 0.2% $404,269 -48.5% $1,521,083,977 ($40,264,529) -2.6%' 2017
2016 $43,570,762 •8.6% $45,325,062 8.6% $5,936,558 -1.0% $709,767 75.6% $1,692,146,773 $171,062,796 11.2% 2018
2019 $41,371,415 -5.0% $39,525,716 -12.8% $4,241,915 -28.5% $435,536 -38.6% $1,761,236,834 $69,090,061 4.1%- 2019
2020 $39,826,820 -3.7% $43,041,658 6.9% . $528,337 21.3% $1,588,015,359 ($173,221,475) -9.8% 2020
Electricity Consumption Tax was repealed January 1, 2019
'mIsc Tax consists of Gambling Winnings Tax, Railroad Tax, Private Car Tax and Excavation Tax
www.revenue.nh.gov 2020 Annual Report Of the Department Of Revenue Administration 48

Summary of 2017 Business TaxesApproximately 170,000 Businesses have registered with the NH Secretary of State (SoS) andare in "Good Standing" or have an "Active" status.^ ̂
o 72,979 Business Entities filed business tax returns■ . 28,895 Business Entities filing business tax returns paid no ($0) BET or BPT
o 44,084 Business Entities filed business tax returns with payments totaling $619.Im, ofwhich
■ 1,374 (3.1%) of those paid 72.9% of BET/BPT ($451 .Im out of $6i9.1m)• 1,068 (77.7%) are corporations paying a total of $396.0m• 258 (18.8%) are partnerships paying a total of $49.3m• 48 (23.5%) are proprietors and fiduciaries paying a total of $5.9m
■ The remaining 42,710 (96.9%) paid 27.1% of BET/BPT ($168.Om out of$619.1m)
• Of the 42,710 Business Entities that filed and paid 27.1% of BPT/BET:o 9,742 (22.8%) paid under $500 = $2.0m (1.2%)o 7,437 (17.4%) paid $500 - $1,000 = $5.6m (3.3%)o 21,142 (49.5%) paid $1,000 - $10,000 = $69.4m (41.3%)o 4,389 (10.3%) paid $10,000 - $50,000 = $91.0m (54.2%)
' Entities BET - BPT - ' Combined ' % ,
Corporations $183,578,567 $315,010,595 $498,589,162 80.5%
Partnerships $23,747,930 $61,955,151 $85,703,081 13.8%
Proprietors $15,552,662 $15,905,192 $31,457,854 5.1%
Fiduciaries $76,223 $3,274,207 $3,350,430 0.5%
Total $222,955,382 $396,145,145 $619,100,527 100.0%
If there are 170,000 business entities operating in the state of NH then 125,916 or 74% of thempay no business taxes (neither BET nor BPT)When BET and BPT are segregated:
o 591 (1.6 %) are paying 50.5% of BET■ 541 (95.4%) are corporations paying a total of $ 107.6m■ 50 (8.5%) are partnerships, proprietors and fiduciaries paying a total of $5.1 m
o 891 (1.2%) are paying 80.9% of BPT■ 650 (73.0%) are corporations paying a total of $274.9m■ 198 (22.2%) are partnerships paying a total of $40.8m■ 43 (4.8%) are proprietors and fiduciaries paying a total of $4.9m
' Per returns received as of August 28, 2019.■ Information is provided by NH SoS as of August 29, 2019.^ Businesses that want to preserve a trade name have to register a trade name with the NH SoS. A corporation, LLC orlimited partnership must also register with the NH SoS. Being registered with the NH SoS does not necessarily meanthat the business is engaging in business activity in NH or that they meet the BET or BPT filing threshold.Proprietorships and rental businesses do not register unless they want to protect the name of the business.
www.revenue.nh.gov 2020 Annual Report Of the Department Of Revenue Administration 49
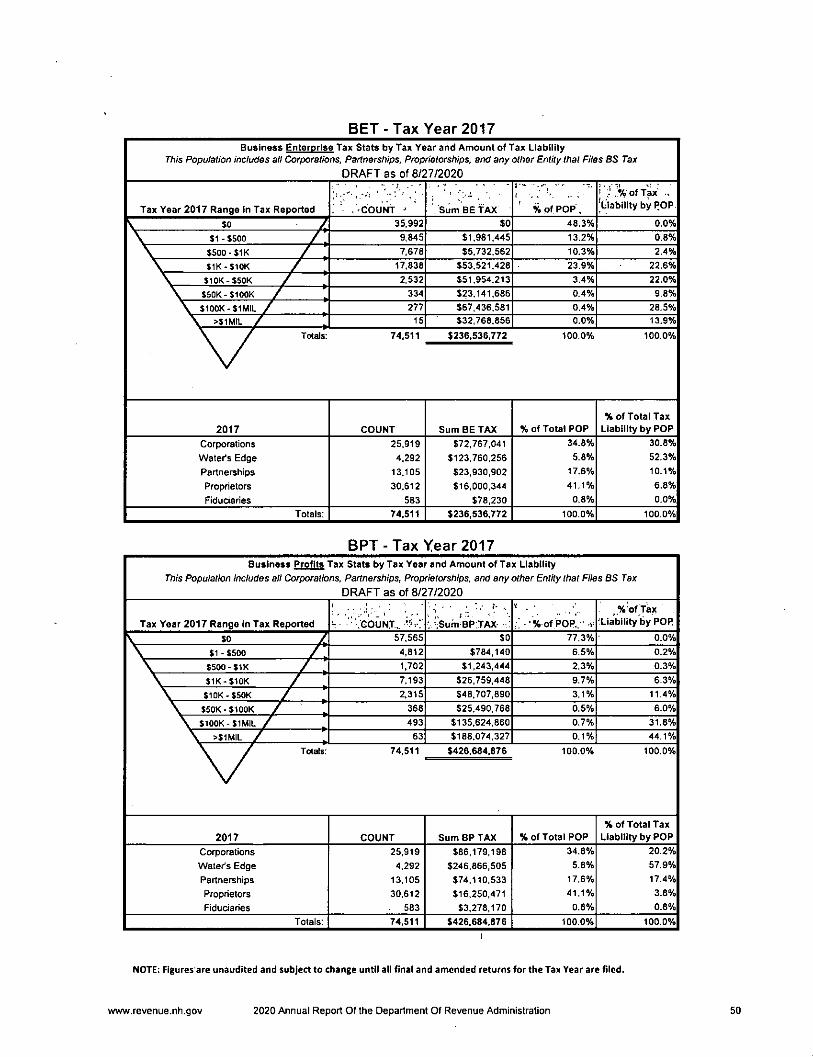
BET-Tax Year 2017
Business Enterprise Tax Stats by Tax Year arid Amount of Tax LiabilityThis Population includes all Corporations, Partnerships, Proprietorships, and any other Entity that Files BS Tax
DRAFT as of 8/27/2020-■ -T,
.,%'of Tax ..
Tax Year 2017 Range in Tax Reported . 'COUNT ' . Sum BE TAX % of POP', Liability by POP
SO 35.992 SO 48.3% 0.0%
\ $1 - $500 / 1 9.845 $1,981,445 13,2% 0.8%
\ $500-$1K / j 7.678 $5,732,562 10.3% 2.4%
\ $1K-$10K / 17.838 $53,521,428 23.9% 22.6%
\ $10K-$50K / 2,532 $51,954,213 3.4% 22.0%
\ $50K.$100K / 334 $23,141,686 0.4% 9.8%
\ SIOOK-SIMIL / 277 $67,436,581 0,4% 28.5%
\ >$1MtL / J 15 $32,768,856 0.0% 13.9%
\ / Totals: 74,511 $236,536,772 100.0% 100.0%
% of Total Tax2017 COUNT Sum BE TAX % of Total POP Liability by POP
Corporations 25.919 $72,767,041 34.8% 30.8%
Water's Edge 4.292 $123,760,256 5.8% 52.3%
Partnerships 13.105 $23,930,902 17.6% 10.1%
Proprietors 30.612 $16,000,344 41.1% 6.8%
Fiduciaries 583 $78,230 0.8% 0.0%
Totals: 74,511 $236,536,772 100.0% 100.0%
BPT-Tax Year 2017Business Profits Tax Stats by Tax Year and Amount of Tax Liability
This Population includes all Corporations, Partnerships, Proprietorships, and any other Entity that Files BS TaxDRAFT as of 8/27/2020
%of Tax
Tax Year 2017 Range in Tax Reported ■: • .cbuNT. '.Sum BP.TAX % -■%ofpop..- 5= 'Liability by POPV $0 57,565 $0 77.3% 0.0%
\ $1 - $500 / j 4,812 $784,140 6.5% 0.2%
\ $500-$1K / 1 1,702 $1,243,444 2.3% 0.3%
\ $1K-$10K / 7.193 $26,759,448 9.7% 6.3%
\ $10K.$50K / 2.315 $48,707,890 3.1% 11.4%
\ $50K-$100K / , 366 $25,490,768 0.5% 6.0%
\ $100K-$1MIL / 1 493 $135,624,860 0.7% 31.8%
\ >$1MIL / i 63 $188,074,327 0.1% 44.1%
\ / Totals: 74,511 $426,684,876 100.0% 100.0%
%of Total Tax2017 COUNT Sum BP TAX %of Total POP Liability by POP
Corporations 25.919 $86,179,198 34.8% 20.2%
Water's Edge 4.292 $246,866,505 5.8% 57.9%
Partnerships 13.105 $74,110,533 17.6% 17.4%
Proprietors 30.612 $16,250,471 41.1% 3.8%
Fiduciaries 583 $3,278,170 0.8% 0.6%
Totals: 74,511 $426,684,876 100.0% 100.0%
NOTE: Figures'are unaudited and subject to change until all final and amended returns for the Tax Year are filed.
www.revenue.nh.gov 2020 Annual Report Of the Department Of Revenue Administration 50
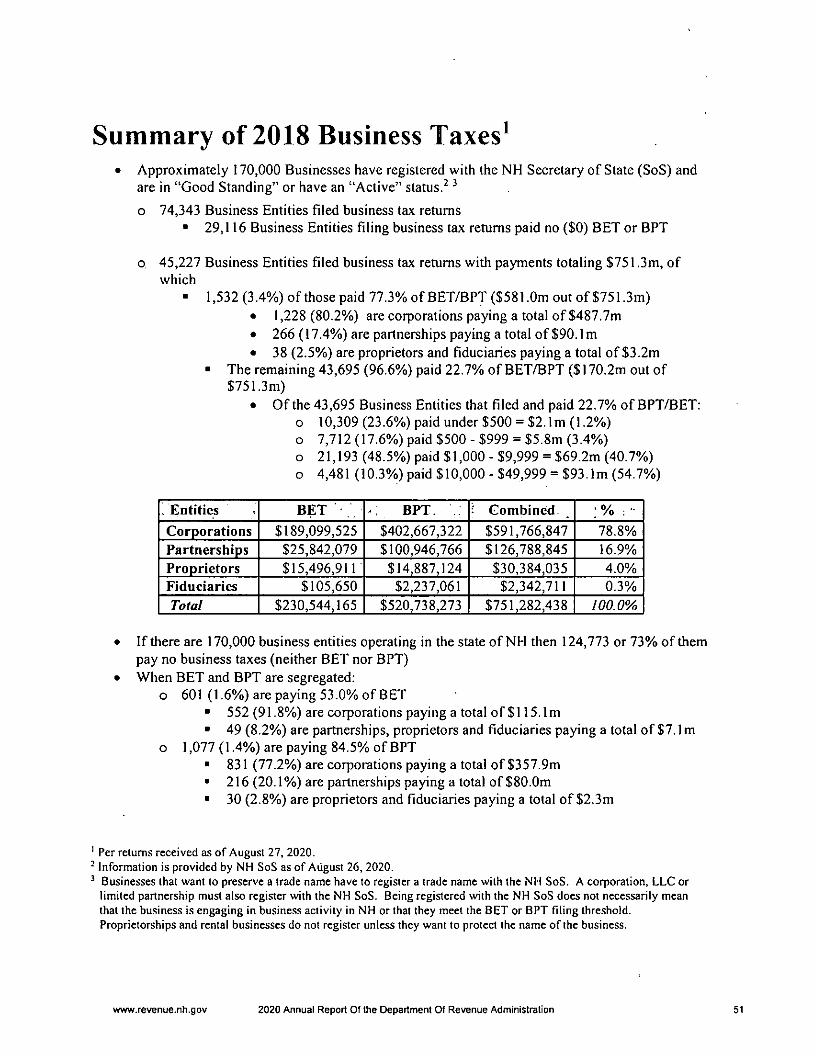
Summary of 2018 Business Taxes^Approximately 170,000 Businesses have registered with the NH Secretary of State (SoS) andare in "Good Standing" or have an "Active" status.^ ̂
o 74,343 Business Entities filed business tax returns
■ 29,116 Business Entities filing business tax returns paid no ($0) BET or BPT
45,227 Business Entities filed business tax returns with payments totaling $751.3m, ofwhich
■ 1,532 (3.4%) ofthose paid 77.3% ofBET/BPT($581.0m out of $751.3m)
• 1,228 (80.2%) are corporations paying a total of $487.7m• 266 (17.4%) are partnerships paying a total of $90.1 m• 38 (2.5%) are proprietors and fiduciaries paying a total of $3.2m
■ The remaining 43,695 (96.6%) paid 22.7% of BET/BPT ($ 170.2m out of$751.3m)
• Of the 43,695 Business Entities that filed and paid 22.7% of BPT/BET:o 10,309 (23.6%) paid under $500 = $2.1m (1.2%)o 7,712 (17.6%) paid $500 - $999 = $5.8m (3.4%)o 21,193 (48.5%) paid $1,000 - $9,999 = $69.2m (40.7%)o 4,481 (10.3%) paid $10,000-$49,999 = $93.Im (54.7%)
. Entities BET BPT Combined : % : ■
Corporations $189,099,525 $402,667,322 $591,766,847 78.8%
Partnerships $25,842,079 $100,946,766 $126,788,845 16.9%
Proprietors $15,496,911 $14,887,124 $30,384,035 4.0%
Fiduciaries $105,650 $2,237,061 $2,342,711 0.3%
Total $230,544,165 $520,738,273 $751,282,438 100.0%
If there are 170,000 business entities operating in the state of NH then 124,773 or 73% of thempay no business taxes (neither BET nor BPT)
When BET and BPT are segregated:o 601 (1.6%) are paying 53.0% of BET
■ 552 (91.8%) are corporations paying a total of $115.1m• 49 (8.2%) are partnerships, proprietors and fiduciaries paying a total of $7.1 m
o 1,077 (1.4%) are paying 84.5% ofBPT■ 831 (77.2%) are corporations paying a total of $357.9m■ 216 (20.1%) are partnerships paying a total of $80.0m■ 30 (2.8%) are proprietors and fiduciaries paying a total of $2.3m
' Per returns received as of August 27, 2020.- Information is provided by NH SoS as of August 26, 2020.^ Businesses that want to preserve a trade name have to register a trade name with the NH SoS. A corporation, LLC orlimited partnership must also register with the NH SoS. Being registered with the NH SoS does not necessarily meanthat the business is engaging in business activity in NH or that they meet the BET or BPT filing threshold.Proprietorships and rental businesses do not register unless they want to protect the name of the business.
www.revenue.nh.gov 2020 Annual Report Of the Department Of Revenue Administration 51
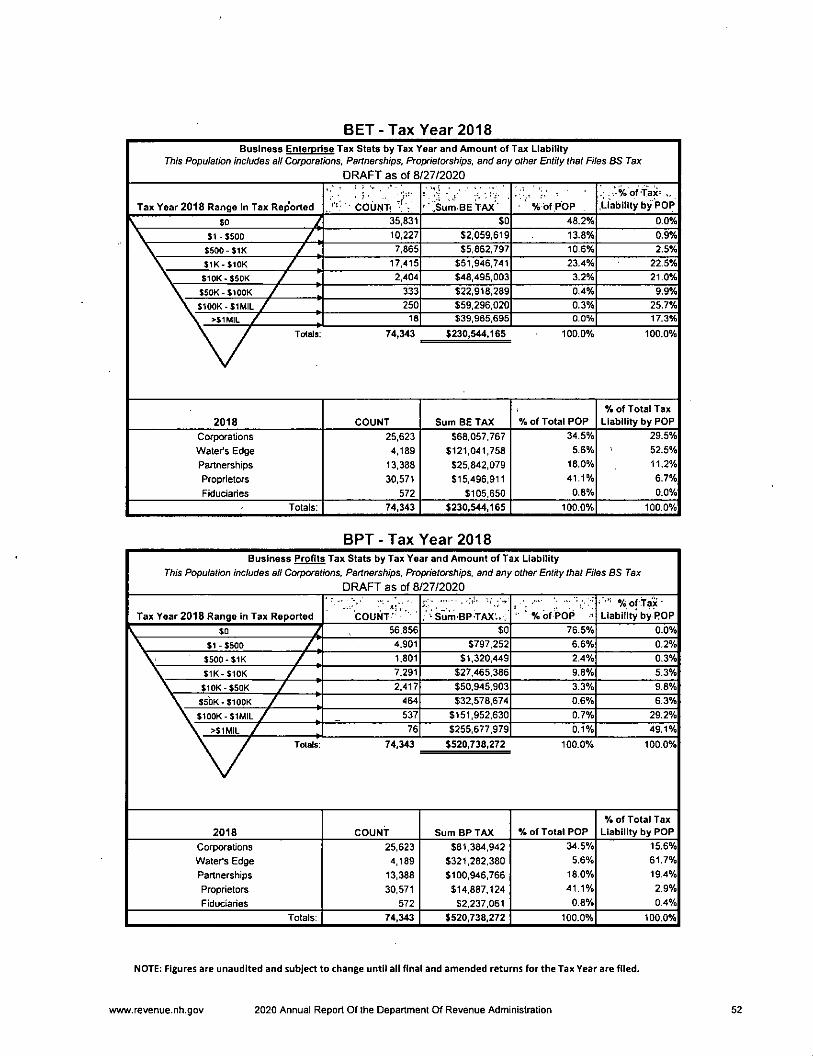
BET-Tax Year 2018
Business Enterprise Tax Stats by Tax Year and Amount of Tax Liability
This Population includes all Corporations, Partnerships, Proprietorships, and any other Entity that Files BS Tax
DRAFT as of 8/27/2020
• . ' '. .'•% of Tax= ,.Tax Year 2018 Range in Tax Reported • COUNT, '\Sum.BETAX' % of POP .Liability by POP
\ io 35,831 $0 48.2% 0.0%
\ $1 $500 / 10.227 $2,059,619 13.8% 0.9%
\ $500-$1K / 7,865 $5,862,797 10.6% 2.5%
\ $1K.$10K / 17,415 $51,946,741 23.4% 22.5%
\ $10K.$50K / 2,404 $48,495,003 3.2% 21.0%
\ $50K-$100K / 1 333 $22,918,289 0.4% 9.9%
\ $100K.$1MIL / 1 250 $59,296,020 0.3% 25.7%
\ >$1MIL / 18 $39,965,695 0,0% 17.3%
\ / Totai 74,343 $230,544,165 100.0% 100.0%
%of Total Tax
2018 COUNT Sum BE TAX % of Totai POP Liability by POP
Coiporations 25,623 $68,057,767 34.5% 29.5%
Water's Edge 4,189 $121,041,758 5.6% ' 52.5%
Partnerships 13,388 $25,842,079 18.0% 11.2%
Proprietors 30,571 $15,496,911 41.1% 6.7%
Fiduciaries 572 $105,650 0.6% 0.0%
Totals: 74,343 $230,544,165 100.0% 100.0%
BPT-Tax Year 2018
Business Profits Tax Stats by Tax Year and Amount of Tax Liability
This Population includes all Corporations, Partnerships, Proprietorships, and any other Entity that Files BS Tax
DRAFT as of 8/27/2020
' •••■' ' "tVj.-, ...... . .:,i. 1 ." % of tax-
Tax Year 2018 Range in Tax Reported COUNT' , ^Sum-BPTAX.. . ' % of POP ^ Liability by POP
y $0 / 56,856 $0 76.5% 0.0%
\ $1 - $500 /' 4,901 $797,252 6.6% 0.2%
V $500-$1K / ^ 1,801 $1,320,449 2.4% 0.3%
\ $1K-$10K / 7,291 $27,465,386 9.8% 5.3%
\ $10K-$50K / 2.417 $50,945,903 3.3% 9.8%
\ $sbK.$100K / 1 464 $32,578,674 0.6% 6.3%
\ $100K-$1MIL / 537 $151,952,630 0.7% 29.2%
\ >$1MiL / ^ 76 $255,677,979 0.1% 49.1%
\ / Totals: 74,343 $520,738,272 100.0% 100.0%
% of Total Tax2018 COUNT Sum BP TAX % of Total POP Liability by POP
Corporations 25,623 $81,384,942 34.5% 15.6%
Water's Edge 4,189 $321,282,380 5.6% 61.7%
Partnerships 13,388 $100,946,766 18.0% 19.4%
Proprietors 30,571 $14,887,124 41.1% 2.9%
Fiduciaries 572 $2,237,061 0.8% 0.4%
Totals: 74,343 $520,738,272 100.0% 100.0%
NOTE: Figures are unaudited and subject to change until aii final and amended returns for the Tax Year are filed.
www.revenue.nh.gov 2020 Annual Report Of the Department Of Revenue Administration 52
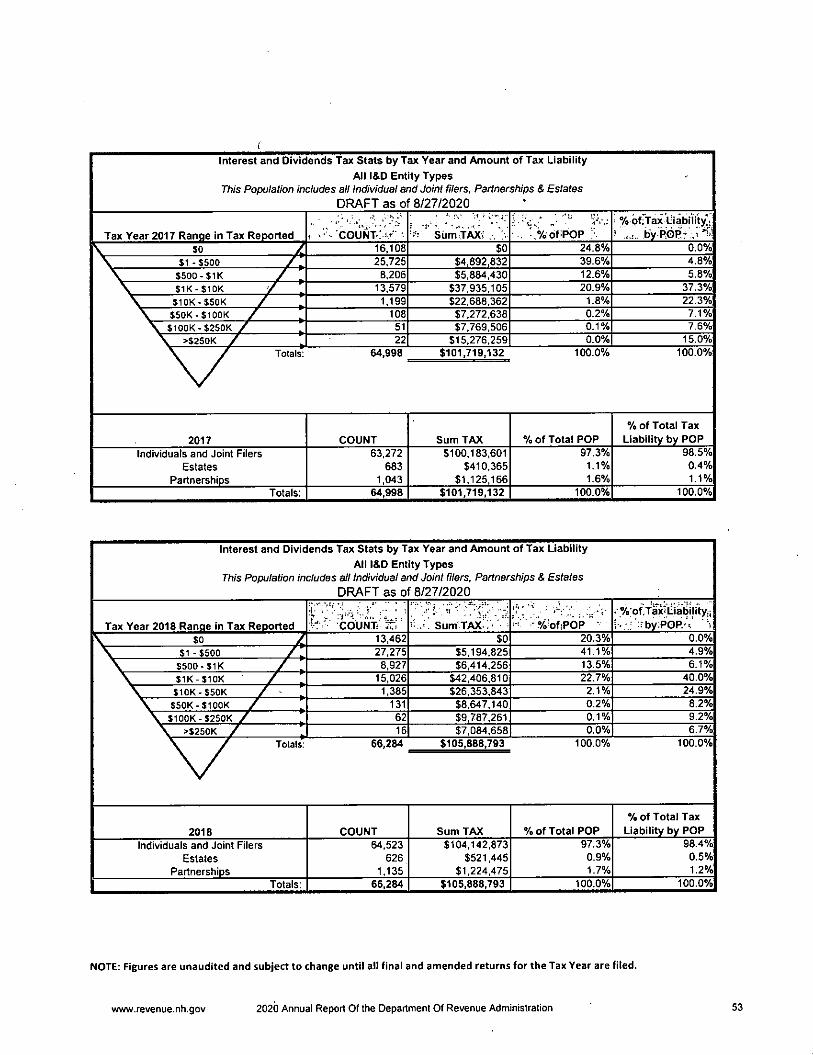
Interest and Dividends Tax Stats by Tax Year and Amount of Tax Liability
All l&D Entity Types
This Population includes all Individual and Joint filers, Partnerships & Estates
DRAFT as of 8/27/2020 »
" • r.'.'.'.i .ij i;;,.
• "-C •• ; 7c of'Tax Liabiilty';Tax Year 2017 Ranae in Tax Reported , "COUNT-: Siim TAXv . . • , -.%-of;pop ' by POP^ .•"\ $0 ^ 16,108 $0 24.8% 0.07c
\ $1-$500 /| 25,725 $4,892,832 39.6% 4.87c
\ $500-$1K / ̂ 8,206 $5,884,430 12.6% 5.87c
\ $1K-$10K '/ j 13,579 $37,935,105 20.9% 37.3%
\ $10K-$50K / j 1,199 $22,688,362 1.8% 22.3%
\ $50K-$100K / 1 108 $7,272,638 0.2% 7.17c
\ $100K-$250K / ^ 51 $7,769,506 0.1% 7.67o
\ >$250K / j 22 $15,276,259 0.0% 15.07c
X Totals: 64,998 $101,719,132 100.0% 100.07c
7c of Total Tax
2017 COUNT Sum TAX 7c of Total POP Liability by POP
Individuals and Joint Filers 63,272 $100,183,601 97.3% 98.57o
Estates 683 $410,365 1.1% 0.47o
Partnerships 1,043 $1,125,166 1.67o 1.17c
Totals: 64,998 $101,719,132 100.0% 100.07c
Interest and Dividends Tax Stats by Tax Year and Amount of Tax Liability
All l&D Entity TypesThis f^pulation includes all Individual and Joint filers, Partnerships & Estates
DRAFT as of 8/27/2020
^ .v::; • % of.Tax'lliabiJityiiTax Year 2018 Ranae in Tax Reported ' COUNT it 2 .= . Sum TAX : -7oofiP6p • i-. - : :rby:POP.'^ i\ $0 ^ 13,462 $0 20.3% 0.0%
\ $1-$500 27,275 $5,194,825 41.1% 4.97c
\ $500-$1K / 1 8,927 $6,414,256 13.5% 6.17c
\ $1K-$10K / 1 15,026 $42,406,810 22.7% 40.07o
\ $10K-$50K / - , 1,385 $26,353,843 2.1% 24.9%
\ $50K-$100K / ^ 131 $8,647,140 0.2% 8.27o
\ $100K-$250K / 1 62 $9,787,261 0.1% 9.27c
\ >$250K / j 16 $7,084,658 0.0% 6.77c
X Totals: 66,284 $105,888,793 100.07o 100.0%
7o of Total Tax
2018 COUNT Sum TAX % of Total POP Liability by POP
Individuals and Joint Filers 64,523 $104,142,873 97.37<. 98.47o
Estates 626 $521,445 0.97o 0.5%
Partnerships 1,135 $1,224,475 1.7% 1.27c
Totals: 66,284 $105,888,793 100.07c 100.07c
NOTE: Figures are unaudited and subject to change until all final and amended returns for the Tax Year are filed.
www.revenue.nh.gov 2020 Annual Report Of the Department Of Revenue Administration 53
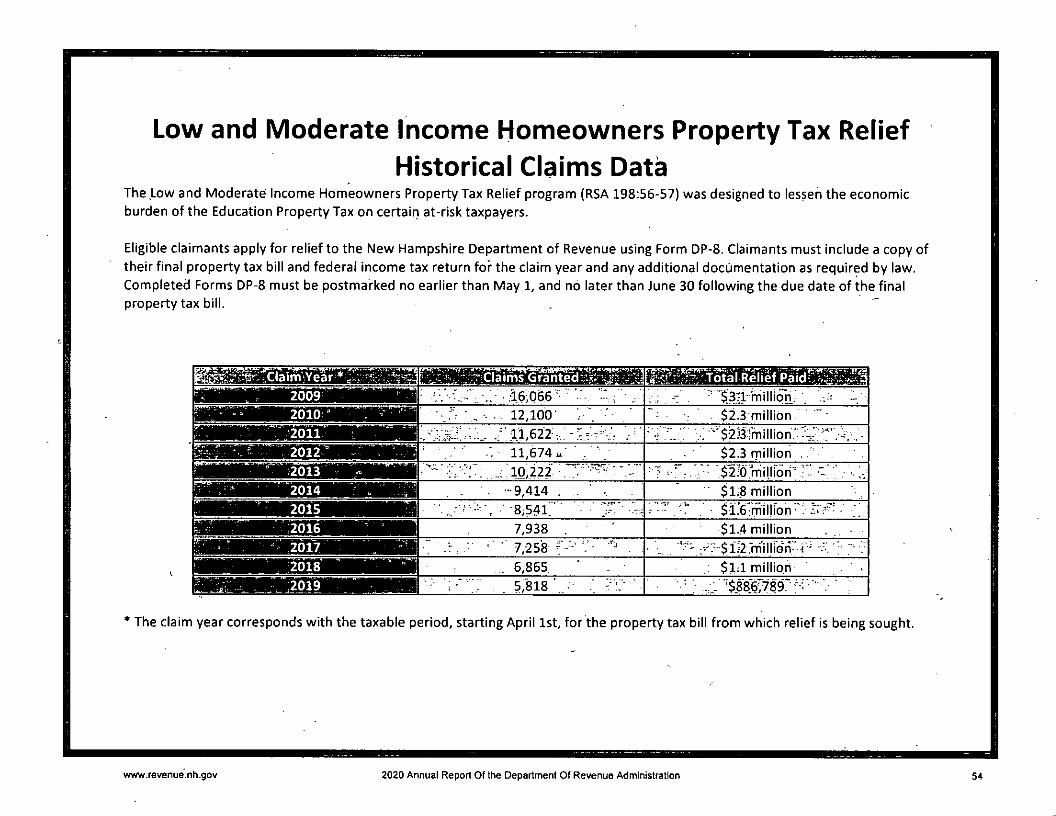
BB
Low and Moderate Income Homeowners Property Tax Relief
Historical Claims DataThe Low and Moderate Income Homeowners Property Tax Relief program (RSA 198:56-57) was designed to lessen the economicburden of the Education Property Tax on certaiti at-risk taxpayers.
Eligible claimants apply for relief to the New Hampshire Department of Revenue using Form DP-8. Claimants must include a copy oftheir final property tax bill and federal income tax return for the claim year and any additional documentation as required by law.Completed Forms DP-8 must be postmarked no earlier than May 1, and no later than June 30 following the due date of the finalproperty tax bill.
xai;a*a«BaoMafeift8>a^YliTn"i >^-^iTfiitiiiri'' ["MTltfr
: 2009 ' ■ '46,066'- ■ / ; •- '$34-million.
V ' 2010 ̂ ■ , - . . 12,100 i . $2.3 million ' "
r-'.' \ 2011 11,622:/ ^ ^ " .'L ■,/ "' $2}3Tmillion.'■ 2012:" , ;/■ 11,674m' ■ $2.3 fTiillion .° 2013 - " ' ' 4'-:4 10,222 ■ : ■/-/■ • ? • .$-2;'0.milli6ri''
•■■9,414 . . .. . 1 $1.8 million^ 2015 V,,/^ -" ■= ■■ ■8;54C - ' 3""' ■-! , - $i.'6;mil|ion ' ^
^ 2016 ■ 7,938 . $1.4 million . , ■2017 '-•' ■" -/: , ■' 7,258 'V- . • •- .•'■-"••$l.2.''m1llidh' r'
r 2018 ^ ; 6,865 ; $1:1 million ' - ' •2019 ■ ■ ^ ;..-V . 5,818 - ■ ; ' ■ ■
* The claim year corresponds with the taxable period, starting April 1st, for the property tax bill from which relief is being sought.
m
www.revenue.nh.gov 2020 Annual Report Of the Department Of Revenue Administration 54
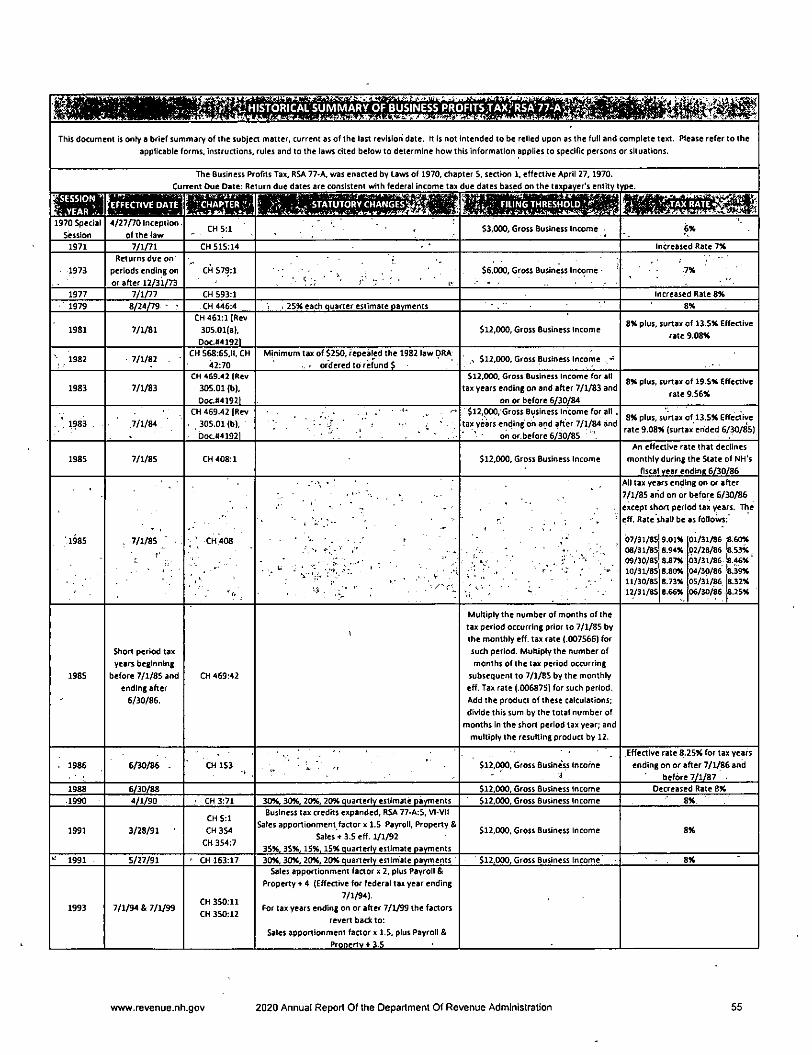
't^^viHISTORICAL SUMMARY OF'bUSINESS PROFITS.T^rRSA'yy-^Aj
This document Is only a brief summary of the subject matter, current as of the last revision date. It is not intended to be relied upon as the full and complete text. Please refer to theapplicable forms, instructions, rules and to the laws cited below to determine how this information applies (0 specific persons or situations.
The Business Profits Tax, RSA 77-A, was enacted by Laws of 1970, chapter S, section 1, effective April 27, 1970.
Current Due Date: Return due dates are consistent with federal Income tax due dates based on the taxpayer's entity type.
1970 Special
Session
4/27/70 Inception
of the lawCH 5:1
FIIIN6 THRESHOLD,'.^"vV-/
$3,000, Gross Business Income 6K
1971 7/1/71 CM 515:14 Increased Rate 7X
1973
Returns due on
periods ending on
or after 12/31/73
CH 579:1 $6,000, Gross Business Income 7*
1977 7/1/77 CH 593:1 Increased Rate 8%
1979 8/24/79 CH 446:4 2SX each quarter estimate payments 8%
1981 7/1/81
CH 461:1 [Rev
30S.01(a),
Doc.1141921
$12,000, Gross Business Income8X plus, surtax of 13.SX Effective
rate 9.08X
1982 7/1/82CH 568:65,11, CH
42:70
Minimum tax of $250. repealed the 1982 law ORA
., • ordered to refund $ ^, $12,000, Gross Business Income . >
1983 7/1/83
CH 469.42 (Rev
305.01 (b),
Doc.fl4192j
$12,000, Gross Business income for all
tax years ending on and after 7/1/83 and
on or before 6/30/84
8X plus, surtax of 19.SX Effective
rate 9.S6X
1983 ,7/1/84
CH 469.42 (Rev
. 305.01 (b),
boc.«f41921
$12,p00,'Gross Business Income for all .tax years ending' on and after 7/1/84 and
on or before 6/30/85 " '
SXplus, surtax of 13.SX Effective
rate 9.08X (surtax ended 6/30/85)
1985 7/1/85 CH 408:1 $12,000, Gross Business Income
An effective rate that declines
monthly during the State of NH's
fiscal year ending 6/30/86
All tax years ending on or after
7/1/85 and on or before 6/30/86
except short period tax years. The
eff. Rate shall be as follows:'
1985 7/1/85 CH408 07/31/85 9.01X 01/31/86 ]8.60X08/31/85 B.94X 02/28/86 8.53X
09/30/85 8.87X 03/31/86 8.46X
10/31/85 B.80X 04/30/86 8.39X
11/30/85 B.73X 05/31/86 8.32X
12/31/85 e.66X 06/30/86 8.25X
1985
Short period tax
years beginning
before 7/1/85 and
ending after
6/30/86.
CH 469:42
Multiply the number of months of the
tax period occurring prior to 7/1/85 by
the monthly eff. tax rate (.007566) for
such period. Multiply the number of
months of the tax period occurring
subsequent to 7/1/85 by the monthly
eff. Tax rate (.006875) for such period.
Add the product of these calculations;
divide this sum by the total number of
months in the short period tax year; and
multiply the resulting product by 12.
. 1986 6/30/86 CH 153 $12,000, Gross Business Income
Effective rate 8.2SX for tax years
ending on or after 7/1/86 and
before 7/1/87 ,
1988 6/30/88 $12,000, Gross Business Income Decreased Rate 8X
.1990 4/1/90 CH 3:71 30X, 30X, 20X, 20X quarterly estimate payments $12,000, Gross Business Income 8X
1991 3/28/91
CH 5:1
CH 354
CH 354:7
Business tax credits expanded, RSA 77-A:5, VI-VII
Sales apponionment factor x 1.5 Payroll, Property &
Sales + 3.5 eff. 1/1/92
35X, 3SX, 15X, 15X quarterly estimate payments
$12,000, Gross Business income 8X
1991 5/27/91 CH 163:17 30X, 30X, 20X, 20X quarterly estimate payments $12,000, Gross Business income 8X
1993 7/1/94 & 7/1/99CH 350:11
CH 350:12
Sales apportionment factor x 2, plus Payroll &
Property * 4 (Effective for federal tax year ending
7/1/94).
For tax years ending on or after 7/1/99 the factors
revert back to:
Sales apportionment factor x 1.5, plus Payroll &
Property 4 3.5 '
www.revenue.nh.gov 2020 Annual Report Of the Department Of Revenue Administration 55
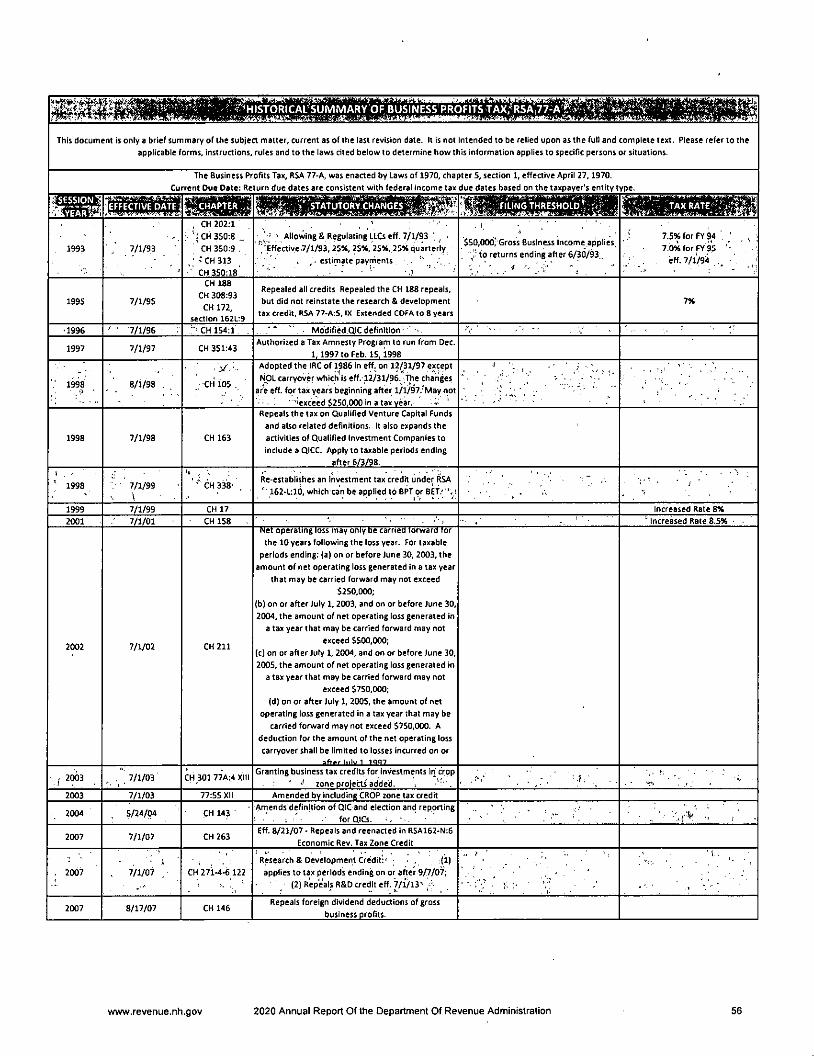
• • . y p. 1 S .1 * V'' Tl' ̂
<'^HiSTORiCAL''SUMMARY OF,BUSINESS^OFITSTAX5R5A77-AW-^ wW:irJ;t' '.-^'
This document is only a brief summary of the subject matter, current as of the last revision date. It Is not Intended to be relied upon as the full and complete text. Please refer to the
applicable forms, Instructions, rules and to the laws cited below to determine how this Information applies to specific persons or situations.
The Business Profits Tax, RSA 77-A. was enacted by Laws of 1970, chapter 5, section 1, effective April 27,1970.
Current Due Date: Return due dates are consistent with federal income tax due dates based on the taxpayer's entity type.
1993 ■ / yi/93
: CH 202:1
; ' 1 CH 350:8 ..CH 350:9 .
'CH313
CH3S0:ia'
/'• '■ Alloying & Regulating LLCs eff. 7/1/93'iiEffcaive 7/1/93, 25*, 25X, 25%, 25* quarterly
■ . estimate payments .
S50,000| Gross Business Income applies,. to returns ending after 6/30/93,,
, J 7.5* for FY 947.0* for FY 95
; • _, eff.7/1/9'4
1995 7/1/9S
CH 188
CH 308:93
CH 172,section 162L:9
Repealed all credits Repealed the CH 188 repeals,but did not reinstate the research & development
tax credit. RSA 77-A:S, IX Extended COFA to 8 years7*
•1996 • • 7/1/96 • "CH 154:1 . '" " • Modified QIC definition •
1997 7/1/97 CH 351:43Authorized a Tax Amnesty Program to run from Dec.
1.1997 to Feb. 15.1998
IMS■i
8/1/98 ,
• ̂
CH 105 .
Adopted the IRC of 1986 in eff. on 12^31/97 exceptNpL carryover which is eff. 12/31/96. . The changes
are eff. for tax years beginning after l/l/97.'May not' "■'exceed 5250.000 In a tax vear. » '
1998 7/1/98 CH 163
Repeals the tax on Qualified Venture Capital Fundsand also related definitions. It also expands theactivities of Qualified Investment Companies toInclude a QICC. Apply to taxable periods ending
after 6/3/98.
'
! 1998 ; • 7/1/99•. \
'"CH 338' . Re-establishes an Investment tax credit under RSA162-L;i6, which'can be applied to 6PT or BET.'"'.!
. T- . •
1999 7/1/99 CH 17 Increased Rate 8*
2001 7/1/01 CH 158 increased Rate 8.5* -
2002 7/1/02 CH 211
Net operating loss may only oe carried torwaro tor
the 10 years following the loss year. For taxableperiods ending: (a) on or before June 30. 2003, the
amount of net operating loss generated in a tax yearthat may be carried forward may not exceed
5250,000;(b) on or after July 1,2003, and on or before June 30,2004, the amount of net operating loss generated in
a tax year that may be carried forward may notexceed 5500,000;
(c) on or after July 1, 2004, and on or before June 30,2005, the amount of net operating loss generated in
a tax year that may be carried forward may notexceed $750,000;
(d) on or after July 1, 2005, the amount of netoperating loss generated in a tax year that may be
carried forward may not exceed $750,000. Adeduction for the amount of the net operating losscarryover shall be limited to losses incurred on or
. f 2003 - , , ̂ 7/1/03 CH 301 77A:4 XIIIGranting business tax credits for investments irt crop
zone proiehs added.2003 7/1/03 77:55 XII Amended by including CROP zone tax credit
2004 5/24/04 CH 143Amends definition of QIC and election and reporting
; forQICs- - •
2007 7/1/07 CH 263Eff. 8/21/07 • Repeals and reenacted in RSA162-N:6
Economic Rev. Tax Zone Credit
, 2007 . 7/1/07 , ■ CH 27i-4-6 122Research & Development Credit":' ; • , (i)applies to tax periods ending on or after 9/7/07;
■ (2) Repeals R&D aedit eff. 7/l/13\---
• 1. .
2007 8/17/07 CH 146Repeals foreign dividend deductions of gross
business profits.
www.revenue.nh.gov 2020 Annual Report Of the Department Of Revenue Administration 56
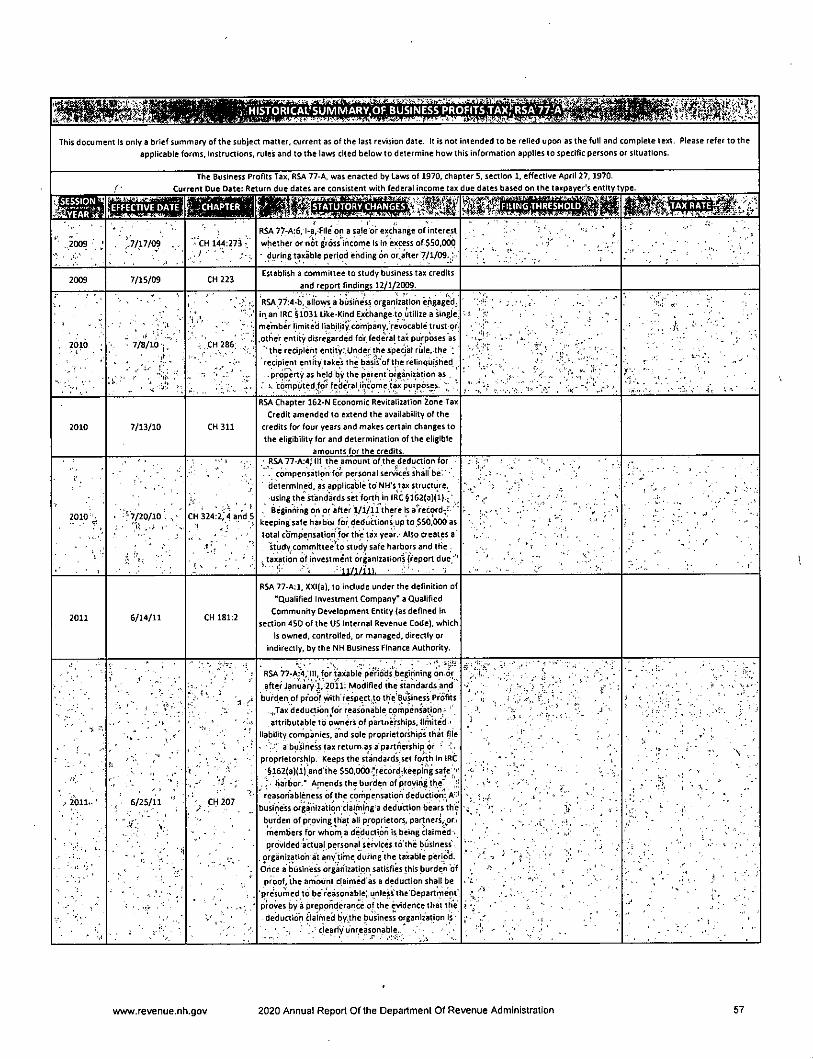
This document is only a brief summary of the subject matter, current as of the last revision date. It is not intended to be relied upon as the full and complete text. Please refer to theapplicable forms. Instructions, rules and to the laws cited below to determine how this information applies to specific persons or situations.
The Business Profits Tax, RSA 77-A, was enacted by Laws of 1970, chapter 5, section 1, effective April 27,1970.
Current Due Date: Return due dates are consistent with federal income tax due dates based on the taxpayer's entity type.
2009 .7/17/09 CH 144:273
RSA 77-A;6, l-a, flle'on a sale or exchange of Interestwhether or not gross Income Is in excess ofSSO.OOO
• during taxable period ending on or^after 7/1/09.,; •
2009 7/15/09 CH 223Establish a committee to study business tax credits
and report findings 12/1/2009.
, 2010 - 7/8/10 CH 286
RSA 77:4-b^ allows a busihe'ss organization engaged ̂in an IRC §1031 Like-Kind Exchange to utilize a single
member limite'd liability company, revocable trust or..other entity disregarded for federal tax purposes as
' the recipient entity;.Under the special riile, the 1recipient entity takes the basis'of the relinquished
. - property as held by the parent organization as .
1. 'cqmputed.for federal mcome,tax purposes. .'
y. .t--
" .'V . ■-
2010 7/13/10 CH311
RSA Chapter 162-N Economic Revltaiization Zone TaxCredit amended to extend the availability of the
credits for four years and makes certain changes tothe eligibility for and determination of the eligible
amounts for the credits.
2010^ -7/20/10''i! .
CH 324:2;4andS
RSA77-A;4jlll the amount of.the deduction for- . compensation.for personal services shall bei' ' .
determined, as applicable to NH's tax structure,using the standards set forth in IRC §162(a)(l).; ' _
., Beginning on or after 1/1/11 there is e'record-,"keeping safe harbor for deduhions up to SS0,000astotal compensation for the tax year.' Also creates a'
studycommlttee^o study safe harbors and thetaxation of investment organizations (report due.' '
""'y '"i. ' ■'■11/1/111. ■
'l'
2011 6/14/11 CH 181:2
RSA 77-A:l, XXI(a), to include under the definition of"Qualified Investment Company" a Qualified
Community Development Entity (as defined insection 450 of the US Internal Revenue Code), which
is owned, controlled, or managed, directly orindirectly, by the NH Business Finance Authority.
2011- 6/25/11 '
•v;: y.
CH 207
RSA 77-A:4,'lll, for taxable pe'riods beginning on.orafter January^ 20il:.Modified the.standards and
burden of proof with respect,to the'Business Profits..,,Tax deduction/or reasonable compensation - 'attributable to owners of partnerships, limite'd
liability companies, and sole proprietorships that file■ a business tax return as a partnership or - 'i.proprietorship. Keeps the standards.set forth In IRC■§162(a)(l) and the 550,000'Vecordrkeepingsafe;-
• harbor." Amends the burden of proving the"reasonableness of the corhpensatioh deduction':. A^'
business organization claiminga deduction tzears theburden of proving that all proprietors, partners,^or.>rnembers for whom, a deduction Is bieirig claimed -,provided actual personal services to the business'..
. organization at anytime during the taxable period.Once a business organization satisfies this burden ofproof, the amount clalrned as a deduction shall be
'pre'sumed to be'reasonable;.unless the Departinent'proves by a preponderance of the evidence that the- deduction clairtied by..the business organization,Is -
■ • clearlyunrcasonable. • ,
i X. • .
www.revenue.nh.gov 2020 Annual Report Of the Department Of Revenue Administration 57
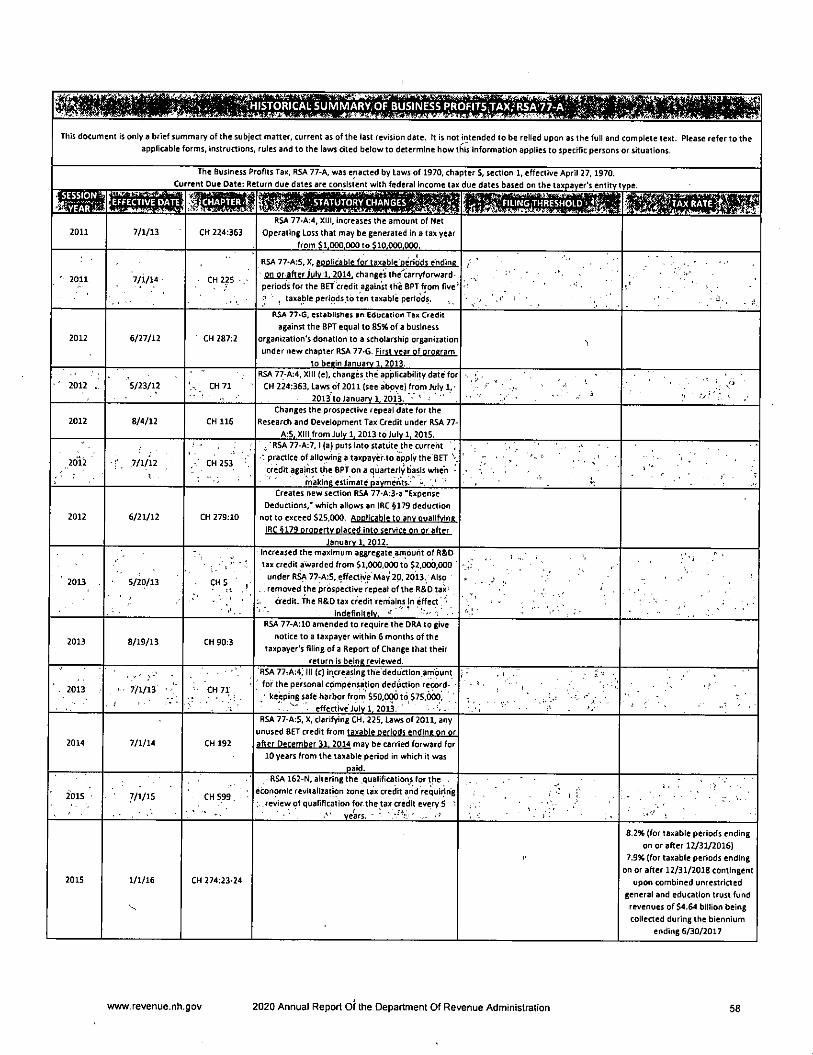
iMMmiThis document Is only a brief summary of the subject matter, current as of the last revision date. It Is not intended to be relied upon as the full and complete text. Please refer to the
applicable forms, Instructions, rules and to the laws cited below to determine how this information applies to specific persons or situations.
Cu
The Business P
rrent Due Date: R(
rofits Tax, R5A 77-A, was enacted by Laws of 1970, cha
turn due dates are consistent with federal Income tax
pter 5, section 1, effective April 27,1970.
due dates based on the taxpayer's entity type.
2011 7/1/13 CH 224:363
RSA 77-A:4, XIII, increases the amount of Net
Operating Loss that may be generated in a tax yearfrom 51.000.000 to SlO.000.000.
'■ 2011 7/1/14 • CH 225 • •
RSA 77-A:5. X. annllrahle for taxable nerihds endine
on or after July 1. 2014. chance's the'carrvforward^periods for the BET credit against the BPT from five':! ' ^ laxableperiods to ten taxable periods.
1 ' • ■
, \l' i ^ '
2012 6/27/12 CH 287:2
RSA 77-G, establishes an Education Tax Creditagainst the BPT equal to SS% of a business
organization's donation to a scholarship organizationunder new chanter RSA 77-(i. First vear nf nrocram
to beeln laniiarv 1. 2013.
' ' 2012 5/23/12 CH71
RSA 77-A:4, XIII (e), changes the applicability date forCH 224:363, Laws of 2011 (see above) from July 1, •
2013 to January 1, 2013.■ . i
I • i
2012 8/4/12 CH 116
Changes the prospective repeal date for theResearch and Development Tax Credit under RSA 77-
A:5. XIII from July 1.2013 to Julv 1. 2015.
2012 ■f. ,7/1/121
CH 253
. RSA 77-A:7,1 (a) puts Into Statute the current .•'. practice of allowing a taxpayer to apply the BET \
credit against the BPT on a quarterly basis whe'n ■making estimate oavmefits.' - '
2012 6/21/12 CH 279:10
Creates new section RSA 77-A:3-a "ExpenseDeductions," which allows an IRC §179 deduction
not to exceed 525.000. Aoollcahle to anv ouallfvlneIRC §179 orooertv olaced into service on or after
January 1. 2012.
■ 2013 • 5/20/13 CH5 ,
' Increased the maximum aggregate arnouht of R8iDtax credit awarded from 51.000,000 to $2,000,000under R^ 77-A:S, effective May 20,2013. Also
. .removed the prospective repeal of the R&D taxcredit. The R&D tax credit remains in effect '■
indefinltftlv. • •
2013 8/19/13 CH 90:3
RSA 77-A:10 amended to require the DRA to givenotice to a taxpayer within 6 months of the
taxpayer's filing of a Report of Change that theirreturn Is being reviewed.
' . 2013 , ' •7/1/13 '. } ' • ' ' • '
CH 71
'RSA77rA:4; III (c) increasing the deduction,amountfor the personal compensation deduction record-• keeping safe harbor from 550,000 to $75,000,
^ effective'Julvl.2013.' ' ' • C.
. /, ■' ,
2014 7/1/14 CH 192
RSA 77-A;5, X, clarifying CH. 225, Laws of 2011, anyunused BFT rredit from taxable nerlnrls ending on or
after December 31. 2014 mav he rarrieri fnrwarri for
10 years from the taxable period In which It wasoaid.
2015 7/1/15 CH 599.
RSA 162-N, altering the qualifications for theeconomic revitalization zone tax credit and requiring
review of qualification for the tax credit every 5 :years. - '
, ̂ i t.
2015 1/1/16 CH 274:23-24
8.2% (for taxable periods endingon or after 12/31/2016)
7.9% (for taxable periods endingon or after 12/31/2018 contingent
upon combined unrestrictedgeneral and education trust fundrevenues of $4.64 billion beingcollected during the biennium
ending 6/30/2017
www.revenue.nh.gov 2020 Annual Report Of the Department Of Revenue Administration 56
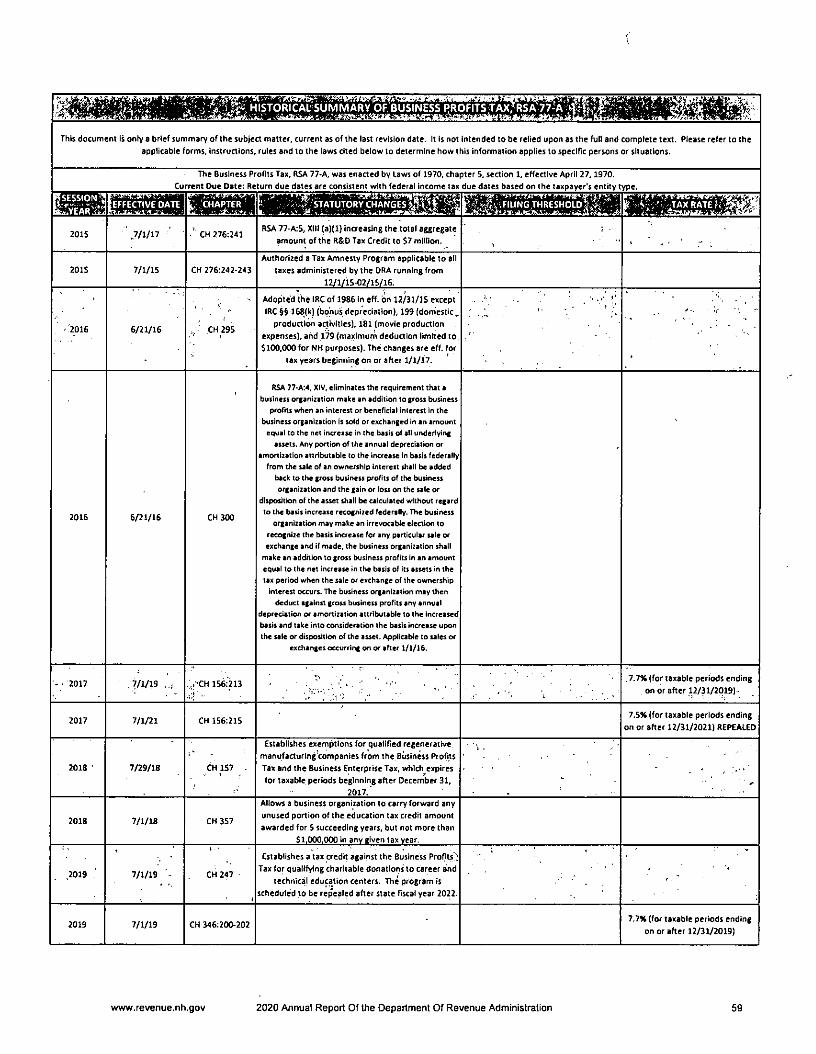
HISTORICALSUMMARY OF,BUSINESS PROFITS TAXrRS^77-A
This document Is only a brief summary of the subject matter, current as of the last revision date. It is not Intended to be relied upon as the full and complete text. Please refer to the
applicable forms, instructions, rules and to the laws cited below to determine how this information applies to specific persons or situations.
2015
The Business Profits Tax, RSA 77-A, was enacted by l.aw$ of 1970, chapter 5, section I, effective April 27.1970.
Current Due Date: Return due dates are consistent with federal income tax due dates based on the taxpayer's entity type.
..7/1/17 CH 276:241RSA 77-A:S, XIII (aKl) increasing the total aggregate
arnount of the R&D Tax Credit to $7 million.
201S 7/1/15 CH 276:242-243
Authorized a Tax Amnesty Program applicable to all
taxes administered by the DRA running from
12/1/1S-02/1S/16.
2016 6/21/16 . CH295
Adopted the IRC of 1986 in eff. on 12/31/15 except
IRC §§ 168(k) (bonus depreciation), 199 (domestic.
produaion activities), 181 (movie production
expenses), and 1^ (maximurh deduction limited to$100,000 for NH purposes). The changes are eff. for
lax years beginning on or after 1/1/17.
2016 6/21/16 CH300
RSA 77-A:4, XiV, eliminates the requirement that a
business organization make an addition to gross business
profits when an interest or beneficial interest In the
business organization Is sold or exchanged In an amount
equal to the net Increase in the basis of all underlying
assets. Any portion of the annual depreciation or
amortization attributable to the increase in basis federally
from the sale of an ownership interest shall be added
back to the gross business profits of the business
organization and the gain or loss on the sale or
disposition of the asset shall be calculated without regard
to the basis increase recognized federally. The business
organization may make an irrevocable election to
recognize the basis increase for any particular sale or
exchange and if made, the business organization shall
make an addition to gross business profits in an amount
equal to the net Increase in the basis of Its assets in the
tax period when the sale or exchange of the ownership
interest occurs. The business organization may then
deduct against gross business profits any annual
depreciation or amonization attributable to the increased
basis and take into consideration the basis increase upon
the sale or disposition of the asset. Applicable to sales or
exchartges occurring on or after 1/1/16,
2017 7/1/19 ,i'CH 156:213.7.7% (for taxable periods ending
on or after 12/31/2019)-
2017 7/1/21 CM 156:2157.5% (for taxable periods ending
on or after 12/31/2021) REPEALED
2018 7/29/18 CH 157
Establishes exemptions for qualified regenerative
manufacturing companies from the Business Profits
Tax and the Business Enterprise Tax, which expires
for taxable periods beginning after December 31,
2017."
2018 7/1/18 CH 357
Allows a business organization to carry forward any
unused portion of the education tax credit amount
awarded for 5 succeeding years, but not more than
Sl.CXW.OOO in any given tax year.
2019 7/1/19 CH 247
Establishes a tax credit against the Business Profits
Tax (or qualifying charitable donaliorts to career and
technical education centers. The program Is
scheduled to be repealed after state fiscal year 2022.
2019 7/1/19 CH 346:200-2027.7% (for taxable periods ending
on or after 12/31/2019)
www.revenue.nh.gov 2020 Annual Report Of the Department Of Revenue Administration 59
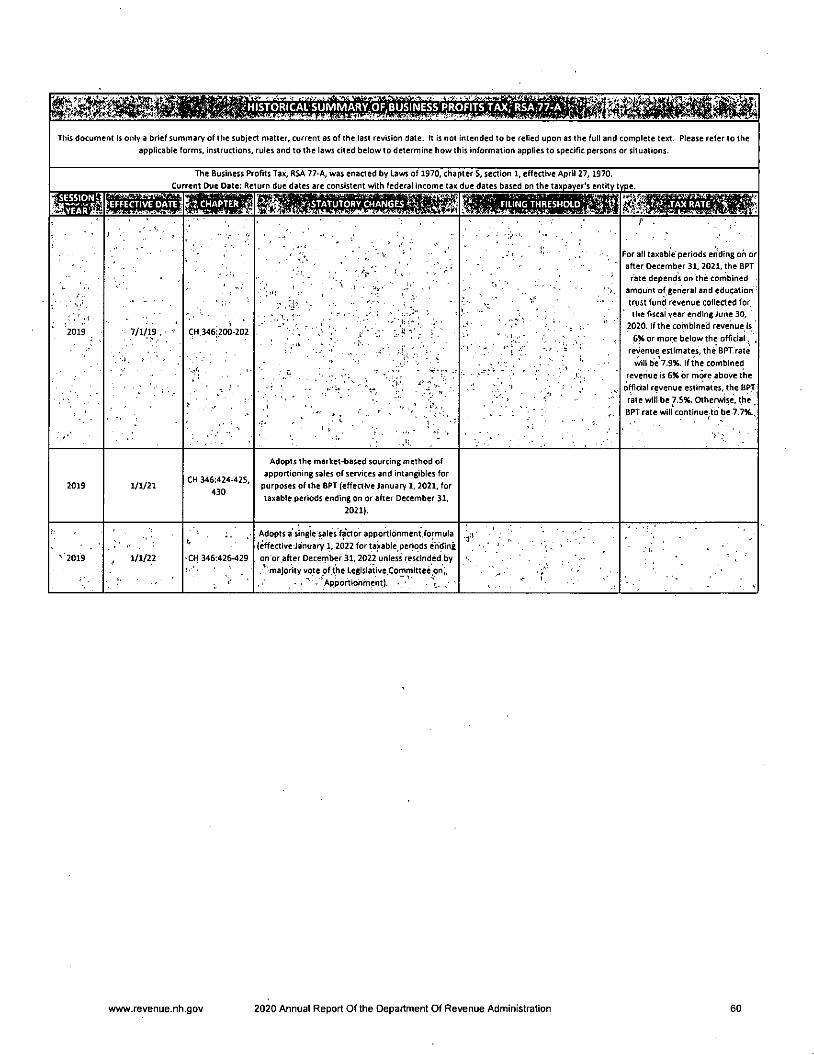
This document is only a brief summary of the subject matter, current as of the last revision date. It Is not intended to be relied upon as the full and complete text. Please refer to the
applicable forms, instructions, rules and to the laws cited below to determine how this information applies to specific persons or situations.
The Business Profits Tax, RSA 77-A, was enacted by Laws of 1970, chapter S, section l, effective April 27,1970.
Current Due Date: Return due dates are consistent with federal income tax due dates based on the taxpayer's entity type.
- j-.. • (
1
:. ■ . 1
2019 7/1/19 . CH 346:200-202
^ -i-v.
, .
'i
; i
for all taxable periods ending on or
after December 31. 2021, the BPT
rate depends on the combined
amount of general and education
trust fund revenue collected for,the fiscal year ending June 30,
2020. If the combined revenue is
6Kor more below the official. ,
revenue estimates, the BPT rate
will be^7.9%. If the combinedrevenue Is 6% or more above the
official revenue estimates, the BPT
rate will be 7.S94. Otherwise, theBPT rate will continue to be 7.7X.,
2019 1/1/21CH 346:424-425,
430
Adopts the market-based sourcing method of
apportioning sales of services and intangibles for
purposes of the BPT (effective January 1, 2021, for
taxable periods ending on or after December 31,
2021).
2019 1/1/22 CH 346;42M29
Adopts a'single sales factor apportionment.formula(effective-January 1,2022 (or taxable,periods ending
on or after Oecerribef 31,2022 unless rescinded by
' majority vote of the Leglslative.Committee on,.• . ' - 'Apportionment). • '
www.revenue.nh.gov 2020 Annual Report Of the Department Of Revenue Administration 60
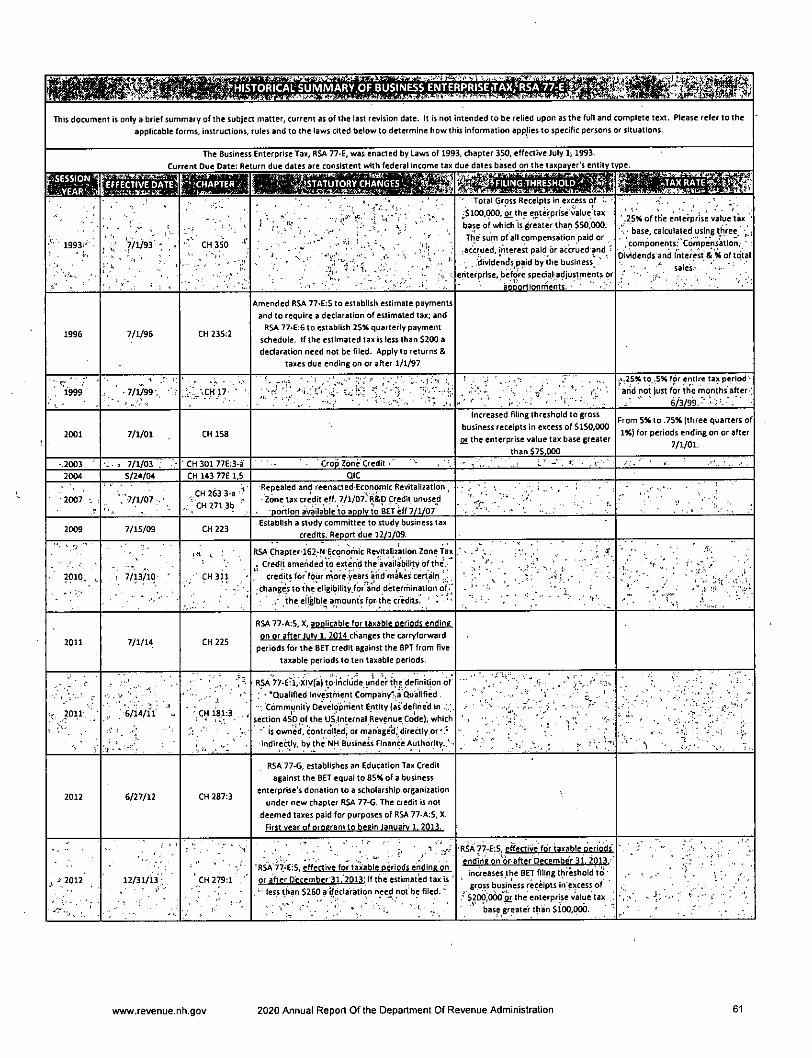
This document is only a brief summary of the subject matter, current as of the last revision date. It Is not intended to be relied upon as the full and complete text. Please refer to theapplicable forms, instructions, rules and to the laws cited below to determine how this information applies to specific persons or situations.
Cu
The Buslnes
rent Due Date: Re
Enterprise Tax, RSA 77-E, was enacted by Laws of 199
urn due dates are consistent with federal Income tax
3, chapter 350, effective July li 1993.
due dates based on the taxpayer's entity tiTpe.
i'' 1993:''• , ,7/1/93' , .
k ' 1
CH 350
/'■ ' v'-V.- ,
' Total Gross Receipts in excess of -:$100,000, sr the enterprise value taxbase of which Is greater than $50,000.The sum of all compensation paid or
^accrued, interest paid or accrued and..dividends paid by the business ^
enterprise, before special adjustments or' annortlonmenis •
.25% of the enterprise value tax '' base, calculated using th/ee. ., components: "Cornpensation, '
Dividends and Interest & % of total', •_ ' sale's.-' ' ' '
1996 7/1/96 CH 235:2
Amended RSA 77-E:5 to establish estimate paymentsand to require a declaration of estimated tax; and
RSA 77-E:6 to establish 25% quarterly paymentschedule. If the estimated tax is less than S200 adeclaration need not be filed. Apply to returns 8i
taxes due ending on or after 1/1/97
■ 1999■\ !•
• 7/1/99 ■ ;,","J,CH17- ' ■ • * 1 '
|V.2S% to,.5% for entire tax period •' arid not just for the months'after^;
6/3/99.'' ■ ••-.-1"" •
2001 7/1/01 CH 158
Increased filing threshold to grossbusiness receipts In excess of $150,000Qf the enterprise value tax base greater
than S7S.000
From 5%to .75% (three quarters of1%) for periods ending on or after
7/1/01.
-2003 ' •:. . 7/1/03 . - -CH 30177E:3-a ' Crop Zone Credit • ' 1 '■ ' ' ■ L' .'i' " '2004 5/24/04 CH 143 77E 1,5 QIC
•2007 ■,"7/1/07 •• . , CH 263 3-a1 CH 2713b •"
Repealed and reenacted Economic Revitalhatlon,- Zone tax credit eff. 7/1/07."R&D Credit unused
• portion available to aoolv to BET eff 7/1/07
2009 7/15/09 CH223Establish a study committee to study business tax
credits. Report due 12/1/09.
2010, ^ . : 7/p/io *in K '
. ?"311
RSA Chapter l62;N Econorhic Revitaliiatlon Zone TaxCredit amended to extend the availability of the' -credits forVoiir more years 'and makes certain
changes to the eligibility.forand deterrhination of.rthe eligible amounts for the credits. ' ^
2011 7/1/14 CH 225
RSA 77-A:S. X. aoolirable for taxable periods ending
on or after liilv 1 7014 fhanees the rarrvforward
periods for the BET credit against the BPT from fivetaxable periods to ten taxable periods.
-r 2011 ' 6/14/iT "-'CH 181:3 -v
RSA77-E:'i, XIV(a) to include under the definition of■ 'Qualified Investment Company'.a Qualified .
•••, Community Developrrient Entity jas defined inseaion 450 of the US Internal Revenue Code), which
■" Is owned, controlled, or managed,' directly or' .•indirebly. by the NH Business finance Authority.,'''
■ ■ " -' V" : V -
K.
2012 6/27/12 CH 287:3
RSA 77-G, establishes an Education Tax Creditagainst the BET equal to 85% of a business
enterprise's donation to a scholarship organizationunder new chapter RSA 77-6. The credit is not
deemed taxes paid for purposes of RSA 77-A;S, X.First vear nf nrneram tn heein ianuarv 1. 2013.
V
, J- 2012 ■ - 12/n/i3; ' CH 279:1 , ■'
- ■ .'-i' '■• ."•■ROt''77-E:S. effective for taxable periods ending onor after Deremher 31."201.3: If the estimated tax is '
. ' less than $260 a declaration need not be filed. ̂
•R5A 77-FrS effective for taxable oerlods'
ending on'drafter December 31. 2013. 'increases the BET filing threshold to' 'gross business receipts in'excess of
• $200;o6p"sjr the enterprise value tax .base greater th'ah $100,000.
.■ ■ '-■;"v , / ■■
www.revenue.nh,gov 2020 Annual Report Of the Department Of Revenue Administration 61
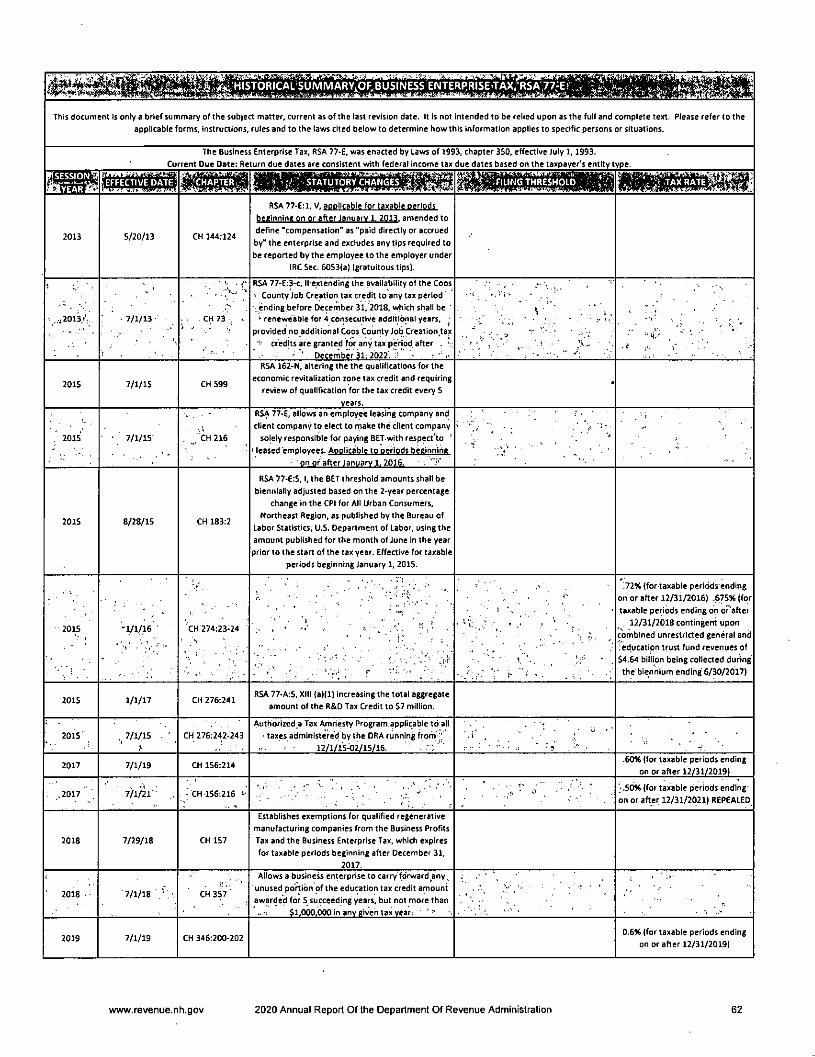
^' *"tiffV^
This document is oniya brief summary of the subject matter, currer>t as of the last revision date. It is not intended to be relied upon as the full and complete text. Please refer to the
applicable forms, instructions, rules and to the laws cited below to determine how this information applies to specific persons or situations.
Cu
The Busines
rent Due Date: Re
Enterprise Tax, RSA 77-E, was enacted by Laws of 199
turn due dates are consistent with federal Income tax
3, chapter 350, effective July 1,1993.
due dates based on the taxpayer's entity type.
mmmmmmm
2013 5/20/13 CH 144:124
RSA 77-E:l. V. aoDilcable for taxable nerlods
heeinnine on or after laniiarv 1 7013 amended to
define 'compensation' as 'paid dlrealy or accrued
by" the enterprise and excludes any tips required to
be reported by the employee to the employer under
IRC Sec. 6053(a) (gratuitous tips).
/
5
. 7/1/13
. -' ■ ■r"V...
. . CH 73 , .
RSA 77-E:3-c, II extending the availability of the Coos' County Job Creation tax credit to any tax period'i.endlng before December 31,2018, which shall be '
* reneweable for 4 consecutive additional years,provided no additional Coos County Job Creation tax" credits are granted for any tax period after . v;
- Decernber31.-2022'.
: r' ' \ .
. tf .. '
201S 7/1/15 CH 599
RSA 162-N, altering the the qualifications for theeconomic reviialization zone tax credit and requiring
review of qualification for the tax credit every 5years.
•
, 2015 ■ 7/1/15■ .1
... CH 216
RSA 77-E, allows art employee leasing company andclient company to elect to make the client company
solely responsible for paying BET with respect to '! leased 'emolovees. Aonlirable to oefiods beeinnitie
on of after January 1.2016.
201S 8/28/15 CH 183:2
RSA 77-£:S, 1, the BET threshold amounts shall bebiennially adjusted based on the 2-year percentage
change in the CPI for All Urban Consumers,Northeast Region, as published by the Bureau of
Labor Statistics, U.S. Department of Labor, using theamount published for the month of June In the yearprior to the start of the tax year. Effective for taxable
periods beginning January 1, 2015.
2015 ■inns CH 274:23-24
" r'\, ^ ^ •
11% (for taxable pericJds endingon or after 12/31/2016) .675* (fortaxable periods ending on oPafter
12/31/2018 contingent uponcombined unrestricted general and.'education trust fund revenues of$4.64 billion being collected duringthe blennium ending 6/30/2017)
2015 1/1/17 CH 276:241RSA 77-A:5, XIII (a)(1) Increasing the total aggregate
amount of the R&D Tax Credit to $7 million.
2015' 7/1/15 . ' ̂i,
CH 276:242-243
Authorized.a Tax Amnesty Program applicable to all' taxes administered by the DRA running frorTi''i;'
' • 12/1/15-D2/15/16. '■a'
2017 7/1/19 CH 156:214.60* (for taxable periods ending
on or after 12/31/2019)
.2017 7/1/21- •' CH 156:216 ^ v■- ■, ' ■ ■ - ' ' ■ ■;.5d* (for taxable periods ending-on or after 12/31/2021) REPEALED
2018 7/29/18 CH 157
Establishes exemptions for qualified regenerativemanufacturing companies from the Business ProfitsTax and the Business Enterprise Tax, which expiresfor taxable periods beginning after December 31,
2017.
2018 • • 7/1/18 CH357
Allows a business enterprise to carry forward any,unused po'ftibn of the education tax credit amountavvarded for 5 succeeding years, but not more than..V 51.000.000 in anve'n/en tax vear;
2019 7/1/19 CH 346:200-2020.6* (for taxable periods ending
on or after 12/31/2019)
www.revenue.nh.gov 2020 Annual Report Of the Department Of Revenue Administration 62
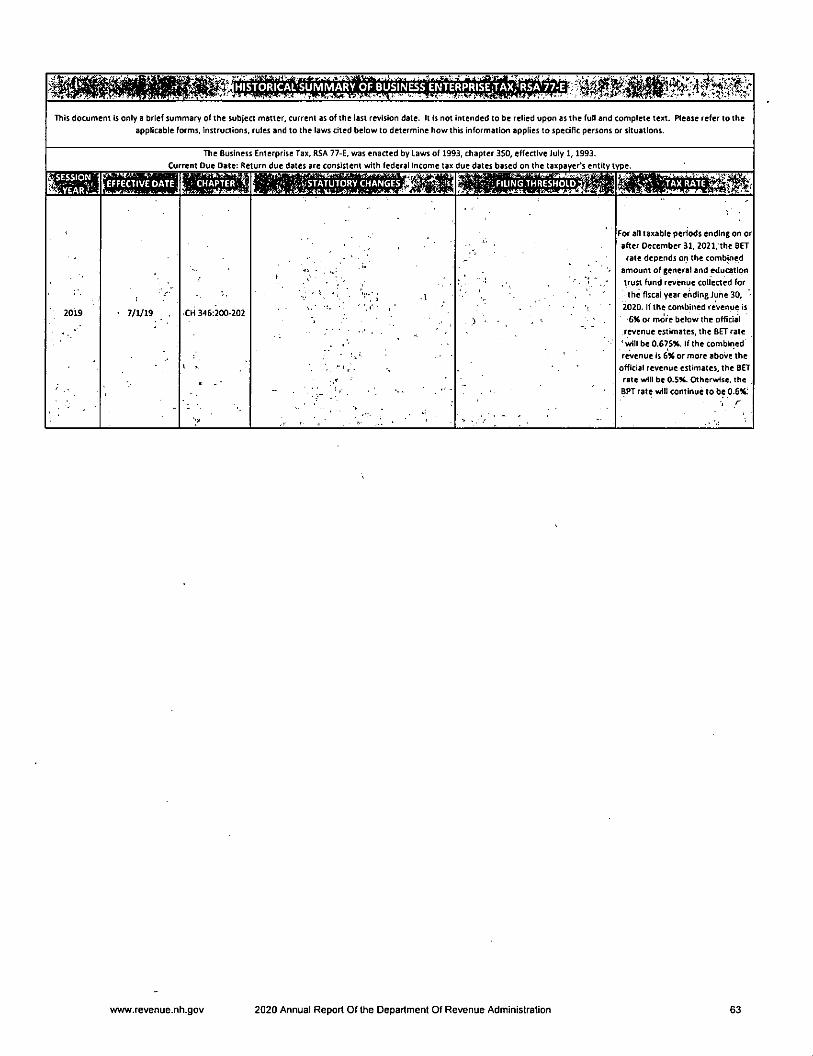
HISTORICAL'SUMMARY OF BUSINESS ENTERPRISE:TAX/RSA77'EV-- <•• <>■'
This document Is only a brief summary of the subject matter, current as of the last revision date, it Is not intended to be relied upon as the full and complete text. Please refer to theapplicable forms, Instructions, rules and to the lawsdted below to determine how this information applies to specific persons or situations.
The Business Enterprise Tax, RSA 77-E, was enacted by Laws of 1993, chapter 3S0, effective iuly 1,1993._Cu^ent_Due_D8te|_Return_due_date$_are_consistent_witMederaN^^
2019 7/1/19 CH 346:200-202
For all taxable periods ending on orafter December 31, 2021, the BETrate depends on the combined
amount of general and educationtrust fund revenue collected forthe fiscal year ending June 30, -
2020. If the combined revenue Is6% or more below the official
revenue estimates, the BET rate' will be 0.675K. If the combined
revenue is 6K or more above the
official revenue estimates, the BETrate will be O.SH. Otherwise, the
BPT rate will continue to be 0.6%:' r
svww.revenue.nh.gov 2020 Annual Report Of the Department Of Revenue Administration 63
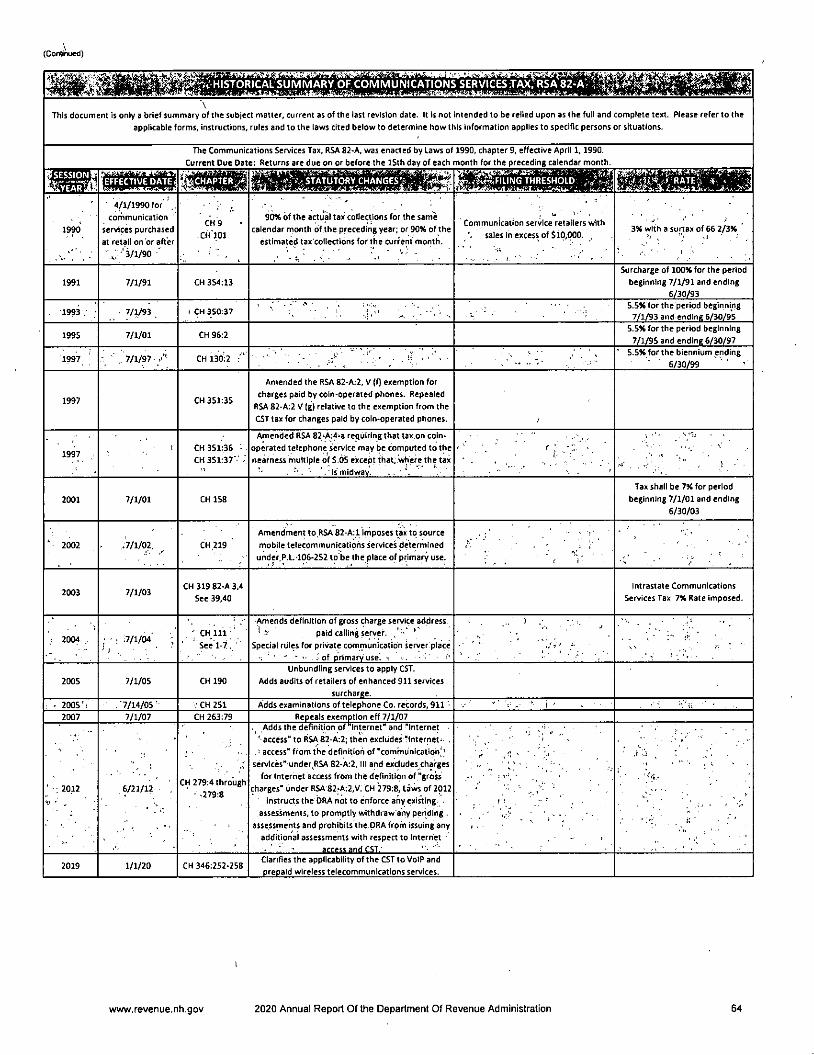
(Continued)
^^^;^-HISTORICAL SUMMARY OF COMMUNICATIONS'SERVICES.TAX,'RSA
\This document is only a brief summary of the subject matter, current as of the last revision date. It is not intended to be relied upon as the full and complete text. Please refer to the
applicable forms, instructions, rules and to the laws cited below to determine how this information applies to speciflc persons or situations.
The Communications Services Tax, RSA 82-A, was enacted by Laws of 1990, chapter 9, effective April 1,1990.
Current Due Date: Returns are due on or before the ISth day of each month for the preceding calendar month.otr ^̂ le' f'fl iiiiT f/W'
I^APTER]^;
1990
4/1/1990 for' ■,cornmunicatlon '
services purchasedat retail on or after
V ' 3/1/90
CH9
-CHlOl
90% of the actual tax collections for the samecalendar month of the preceding year; or 90% of the
estimated tax'collectidns for the current month.
Communication service retailers withsales In excess of Sip,000. . 3% with a surtax of 66 2/3%
'! • , J ' ■ .
' ... . ' ' '
1991 7/1/91 CH 354:13
Surcharge of 100% for the periodbeginning 7/1/91 and ending
6/30/93
- 1993 , ■ • '/1/93 , ! CM 350:37 ^ !' • ' ■ iS.5%for the period beginning7/1/93 and ending 6/30/95
1995 7/1/01 CH 96:25.5% for the period beginning7/1/95 and ending 6/30/97
1997 ' ' ..'7/1/97.;''' CH 130:2 /' ' " /" ■ ■ 5.5% for the blennium ending6/30/99 ' '
1997 CM 351:35
Amended the RSA 82-A:2, V (f) exemption forcharges paid by coin-operated phones. Repealed
RSA 82-A:2 V (g) relative to the exemption from theGST tax for changes paid by coin-operated phones. /
1997 .t CH 351:36 -
CH 351:37"- ."
Amended RSA 82-A:4-3 requiring that tax on coin-operated telephone service may be computed to thenearness multiple of S.OS except that, where the tax
. '. 'ismidway.
. ... . ,
- ;• • •
2001 7/1/01 CH 158
Tax shall be 7% for periodbeginning 7/1/01 and ending
6/30/03
' 2002 • .•V/l/02, (:H 219 'Amendment to.RSA 82-A:l Irnposes tax to sourcemobile telecommunications services determinedunder.P.L. 106-252 to'be the place of primary use. V '■ ' .
2003 7/1/03CH 319 82-A 3.4
See 39,40Intrastate Communications
Services Tax 7% Rate imposed.
. • i
-• 2004 ; : .7/1/04' ;' ■ . ' ' '
-CHlli-' 'Seel-?!
Amends definition of gross ^arge service addresspaid calling server. . ' '
Special rules for private communication server place' ■ - Jof primary use! -• . r-
5-•
2005 7/1/05 CH 190
Unbundling services to apply CST.Adds audits of retailers of enhanced 911 services
surcharge.■ 200S'i . "7/14/05 ' .• CH 251 Adds examinations of telephone Co. records, 911'
2007 7/1/07 CH 263:79 Repeals exemption eff 7/1/07
' •; 2012• , " ' •
6/21/12CH 279:4 through' • -279:8
. Adds the definition of Internet'and "Internet
' access' to RSA 82-A:2; then excludes 'Internet- .access" from the definition of "communication^ '
services' under RSA 82-A:2, III and excludes chargesfor Internet access from the definition of 'gross
charges" under RSA 82-A:2,V, CH 279:8, laws of 2012instructs the DRA not to enforce any existing .
assessments, to promptly withdraw any pending ,assessments and prohibits the pRA from issuing any
additional assessments with respect to Internet- ' - arpessanrffST.'
^ ..
' i; ' . •
2019 1/1/20 CH 346:252-258Clarifies the applicability of the CST to VoIP andprepaid wireless telecommunications services.
www.revenije.nh.gov 2020 Annual Report Of the Department Of Revenue Administration 64
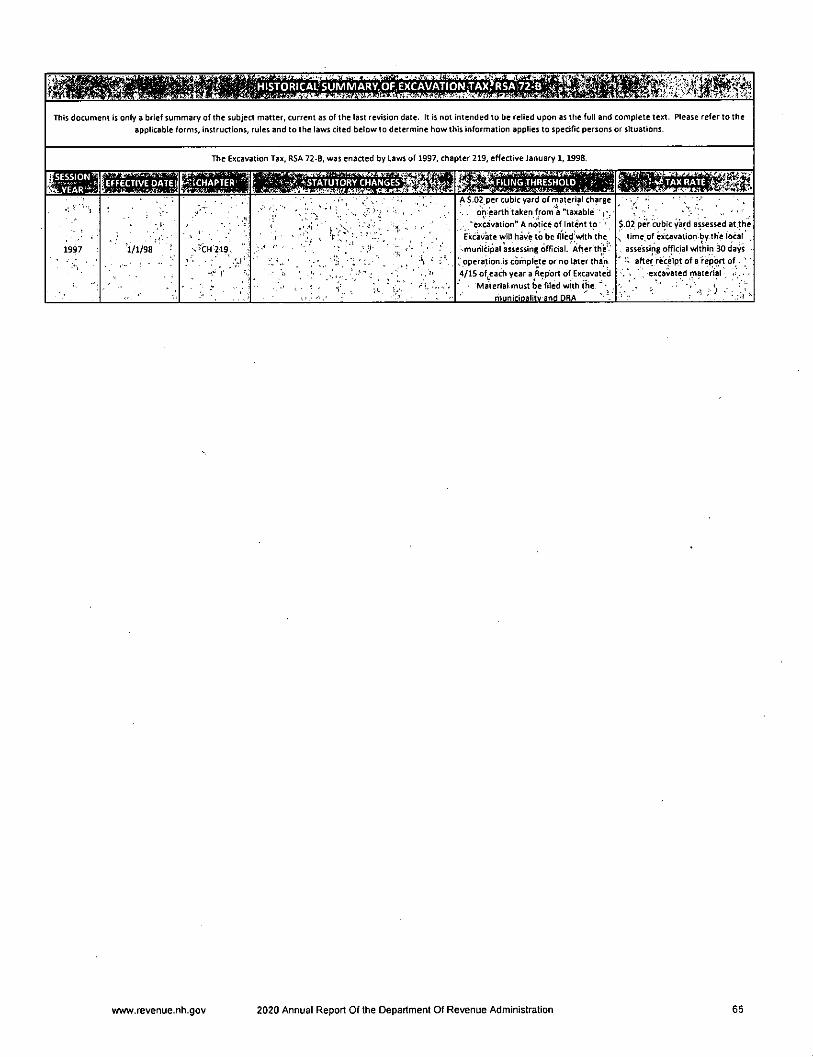
raalMWHYn'■:;;ii>;HlSTORICAL-SUMMARY.OF,EXCAVATIONrTAX
This document is only a brief summary of the subjea matter, current as of the last revision date, it is not intended to be relied upon as the full and complete text. Please refer to theapplicable forms, instructions, rules and to the laws cited below to determine how this information applies to specific persons or situations.
The Excavation Tax, RSA 72-B, was enaCTed by Laws of 1997, chapter 219, effective January 1,1998.
1997 1/1/98 -CH'219.,
■ " i'. s - •'.
■5' • -A, I.-.
A $.02 per cubic yard of material charge, on earth taken from a "taxable '
■ excavation" A notice of Intent to •Excavate will have to be filed with the
'.muhidpal assessing official. After the'.'operation is complete or no later than
4/15 of^each year a Report of ExcavatedMaterial must be filed with the "■
rhunicipalitv and DRA
$.02 per cubic yard assessed at.the^ time.of excavation by th'e local
assessing official within 30 days' after receipt of a report of. y. \ , excavated material < -
• ' •?:) V.
wvAv.revenue.nh.gov 2020 Annual Report Of the Department Of Revenue Administration 65
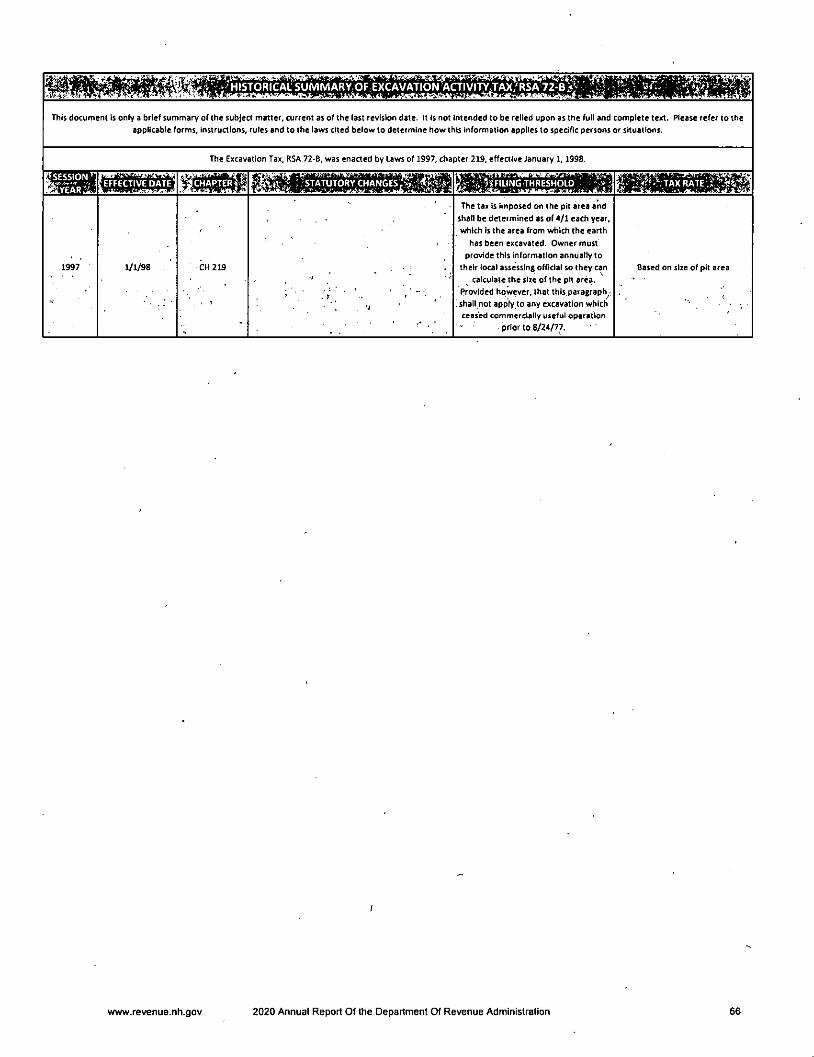
iMHMHMiMMThis document is only 8 brief summary of the subject matter, current as of the last revision date. It is not intended to be relied upon as the full and complete teirt. I^ease refer to the
applicable forms, instructions, rules and to the laws cited below to determine how this information applies to specific persons or situations.
The Excavatlon Tax, RSA 72-B, was enacted by Laws of 1997, chapter 219, effective January 1,1998.
1997 1/1/98 .
/
CH 219
The tax is imposed on the pit area and
shall be determined as of 4/1 each year,
which is the area from which the earth
has been excavated. Owner must
provide this Information annually to
their local assessing official so they can
^ calculate the size of the pit area.Provided however, that this paragraph^
.shall not apply to any excavation which
' ceased commercially useful operation
prior to 8/24/77.
Based on size of pit area
www.revenue.nh.gov 2020 Annual Report Of the Department Of Revenue Administration 66
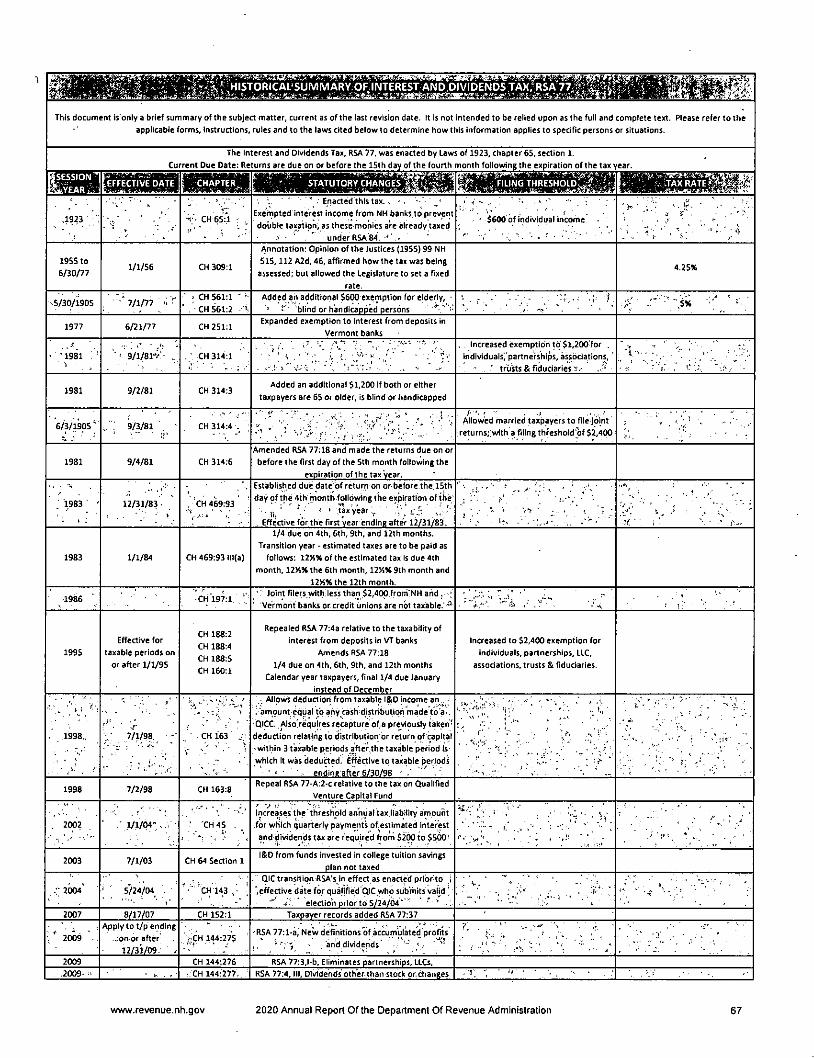
This document Is only a brief summary of the subject matter, current as of the last revision date. It is not intended to be relied upon as the full and complete text. Please refer to the
applicable forms, instructions, rules and to the laws cited below to determine how this information applies to specific persons or situations.
The Interest and Dividends Tax, RSA 77. was enacted by Laws of 1923, chapter 65, section 1.
Current Due Date: Returns are due on or before the ISth day of the fourth month following the expiration of the tax year.
' l ' STATUTORY^CHANQES^I^I'^^.-^-
• 1923
^ . *
CH 65:1 :
Enacted this tax.. •.
Exempted interest income from NK banks to prevent
double taxation, as these monies are already taxed
. under RSA 84. '
' $600 of individual Income
' J, - . .. . i2, ■ .. . '
• 1 . 1;- . • 1 > .
1955 to
6/30/771/1/56 CH 309:1
Annotation: Opinion of the Justices (1955) 99 NH
515,112 A2d, 46, affirmed how the tax was being
assessed; but allowed the Legislature to set a fixed
rate.
4.25X
-5/30/1905 , ''mm ' ; CH 561:1 " •■ CM 561:2
Added an additional 5600 exemption for elderly, -blind or handicapped persons
' S% '' '■ '
1977 6/21/77 CH 251:1Expanded exemption to Interest from deposits in
Vermont banks
■ •1981 :' 1 •
9/l/8rr- . • CH 314:1 ' V ■ ', Increased exemption to $1,200 for .
individuals)'partnefships, associations, 'trusts 8 fiduciaries "r.-
A"'- '- '-' "■
1981 9/2/81 CH 314:3Added an additional $1,200 If both or either
taxpayers are 65 or older, is blind or handicapped
6/3/1905' 9/V81 . CH,314:4 . „ " ■' -■ Allowed married taxpayers to file jointreturns:.with a filing thfeshold'of $2,4()0
; " ^ -■ ■
1981 9/4/81 CH 314:6
Amended RSA 77:18 and made the returns due on or
before the first day of the 5th month following theexpiration of the tax year.
; 1983 '
■ '■ > .
12/31/83 , 'CH 469:93Established due date of return on or-before the.15thday of the 4th month following the expiration of the
•• • i., ' ' V ' ' ■ -Vd; "Effective for the first year endina after 12/31/83. '.tK • " ;
1983 1/1/84 CH 469:93 lll(a)
1/4 due on 4th, 6th, 9th, and 12th months.Transition year - estimated taxes are to be paid as
follows: 12XK of the estimated tax Is due 4th
month, 12)4H the 6th month, 12!4% 9th month and12S%the 12th month.
1986 •CH197:1•. Joint'filers with.less than 52,400 from'NH arid, ;
' Ve'rmorit banks or credit unions are not taxable. *'' ■ ■" - -ft.
1995
Effective for
taxable periods onor after 1/1/95
CH 188:2
CH 188:4
CH 188:5
CH 160:1
Repealed RSA 77:4a relative to the taxability ofinterest from deposits in VT banks
Amends RSA 77:18
1/4 due on 4th, 6th, 9th, and 12th monthsCalendar year taxpayers, final 1/4 due January
Instead of December
Increased to $2,400 exemption forindividuals, partnerships, LLC,
associations, trusts & fiduciaries.
1998,. 7/1/98, . CH 163
V
Allows deduction from taxable l&D income an..; amount equal to any cash dinributipii made t'o'a-.QICC. Also'requlres recapture of a previously taken 'deduction relatltig to distribution or return of capitalwithin 3 taxable periods after.the taxable period iswhich it was deducted. Effective to taxable periods
' > • ' ■ - enrtlne after fi/30/98 '
'' - ■ . ■' !.r. .-i' :
1998 7/2/98 CH 163:8Repeal RSA 77-A:2-c relative to the tax on Qualified
Venture Capital Fund
. 2002 ■ ■ 1/1/04" . •• - .
Increases the threshold annual'tax,liability amountfor which quarterly payments of.estimated interestand dividends tax are required from $2013 to $500'
ii,-.' -• ^ ^'. ■ • '; -
-r"-'..'-,-;'.. ^
2003 7/1/03 CH 64 Section 1l&D from funds Invested in college tuition savings
plan not taxed
2004" ' ' ' 5/24/04 . ■ •'"'CH143/- •. QIC transition RSA's in effect as enahed prior to j.effective date for qualiRed QIC who submits valid [
election prior to 5/24/64"". ' '
.
• -J ■■ '
2007 8/17/07 CH 152:1 Taxpayer records added RSA 77:37
' H- " ■2009
Apply to t/p ending-6n or after
12/31/09. ."jtCH 144:275 ^ •RSA 77:l-a, Newdefihitions of accumulated profits
, , • , "and dividends' ■
7, . ^ ,r. •
2009 CH 144:276 RSA 77:3,l-b. Eliminates partnerships, LLCs,2009- ' vCH 144:277. , RSA 77:4, III. Dividends other than stock or.changes , 'j •
www.revenue.nh.gov 2020 Annual Report Of the Department Of Revenue Administration 67
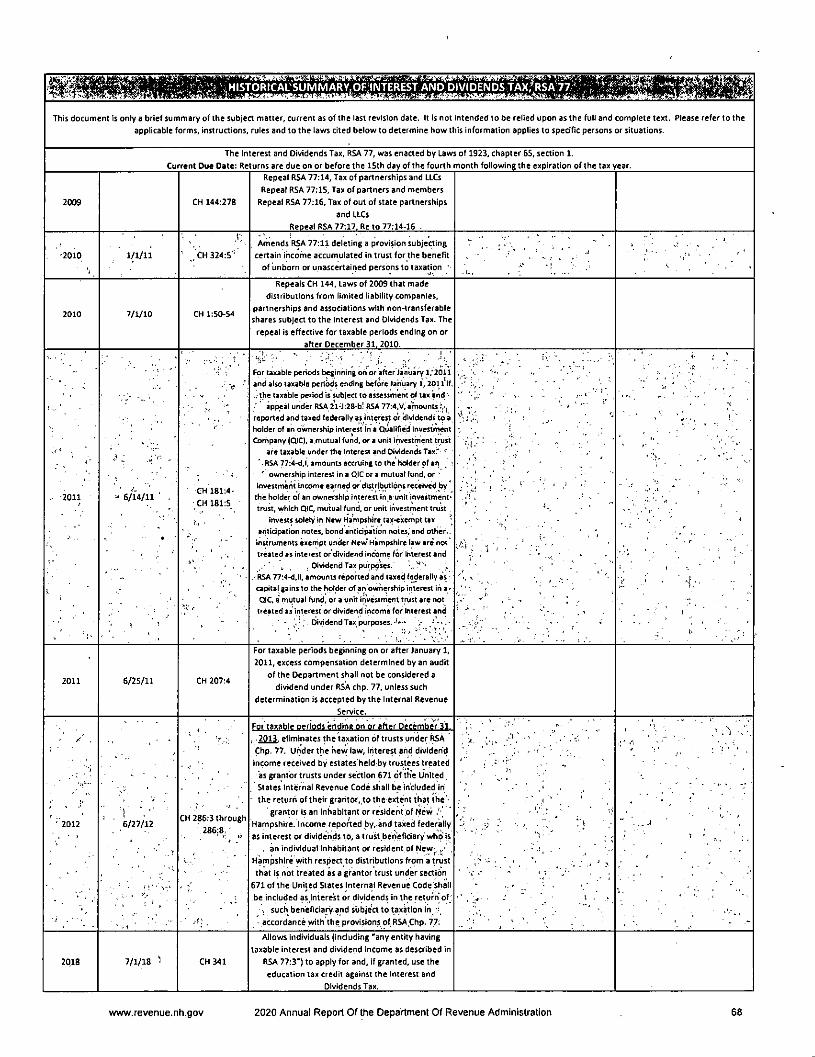
This document Is only a brief summary of the subject matter, current as of the last revision date. It is not intended to be relied upon as the full and complete text. Please refer to the
applicable forms, instructions, rules and to the laws cited below to determine how this Information applies to speciflc persons or situations.
The Interest and Dividends Tax, RSA 77, was enacted by Laws of 1923, chapter 65, section 1.
Current Due Date: Returns are due on or before the 15th day of the fourth month followinB the expiration of the tax year.
2009 CH 144:278
Repeal RSA 77:14, Tax of partnerships and LLCs
Repeal RSA 77:15, Tax of partners and members
Repeal R5A 77:16, Tax of out of state partnerships
and LLCs
Repeal RSA 77:17. Re to 77:14-16 .
-2010 1/1/11 CH 324:S-
Amends RSA 77:11 deleting a provision subjecting
certain Income accumulated in trust for the benefit
of unborn or unascertained persons to taxation '
2010 7/1/10
Repeals CH 144, Laws of 2009 that made
distributions from limited liability companies,
partnerships and associations with non-transferableshares subject to the Interest and Dividends Tax. The
repeal is effective for taxable periods ending on or
after December 31,2010.
2011 6/14/11CH 181
CH 181
For taxable periods beginning on or after January l.'20n
and also taxable periods ending before January 1, 2011 if
;; the taxable period is subject to assessment of tax and '•
appeal under RSA 21-J:28-bl RSA 77:4,V,amounts.'.',
reported and taxed federally as interest or dividends to a
holder of an ownership Interest in a Qualified InvestmentCompany (QIC), a.mutual fund, or a unit Investment trust
are taxable under the Interest and Dividends Taxr
' . RSA 77:4-d,l, amounts accruing to the holder of an
' ' ownership Interest In a QIC or a mutual fund, or '
investment Income earned or distributions received by
the holder of an ownership interest in a unit lnvestment<
trust, which QIC, mutual fund, or unit Investment trust
invests solely in New Ha mpshire tax-exempt tax
ariticipation notes, bond anticipation notes,' and other..
instruments exempt under New' Hampshire law are not
treated as Interest or dividend Income for Interest and
. » , Dividend Tax purposes.
.' RSA 77:4-d.ll, amounts reported and taxed federally ascapital gains to the holder of an ownership interest ifi a-
QIC, a' mutual fund, or a unit invesirhent trust are nottreated as interest or dividend Income for Interest and
- Dividend Tax purposes.-''-
2011 6/25/11 CH 207:4
For taxable periods beginning on or after January 1,
2011, excess compensation determined by an audit
of the Department shall not be considered a
dividend under RSA chp. 77, unless such
determination is accepted by the Internal Revenue
Service.
2012 6/27/12CH 286:3 through
286:8,
For taxable periods ending on or after December 31.
, .2013. eliminates the taxation of trusts under RSAChp. 77. Under the hew law, interest and dividend
Income received by estates held by trustees treated
as grantor trusts under section 671 of the United
States Internal Revenue Code shall be included in
- the return of their grantor, to the extent that the''grantor Is an Inhabitant or resident of New
Hampshire. Income reported by,-and taxed federally
as interest or dividends to, a trust ben'eflciary who is
. an individuallnhabltant or resident of New|.Hampshire with respect to distributions from a trust
that Is not treated as a grantor trust under section
671 of the United States Internal Revenue Code shall
be included asjntere'st or dividends in the return' of;•• such beneficiary and subject to taxation ih_
• accordance with the provisions of,RSA,Chp. 77;
2018 7/1/18 CH341
Allows individuals (Including "any entity having
taxable Interest and dividend income as described in
RSA 77:3") to apply for and, If granted, use the
education tax credit against the Interest and
Dividends Tax.
www.revenue.nh.gov 2020 Annual Report Of the Department Of Revenue Administration 68
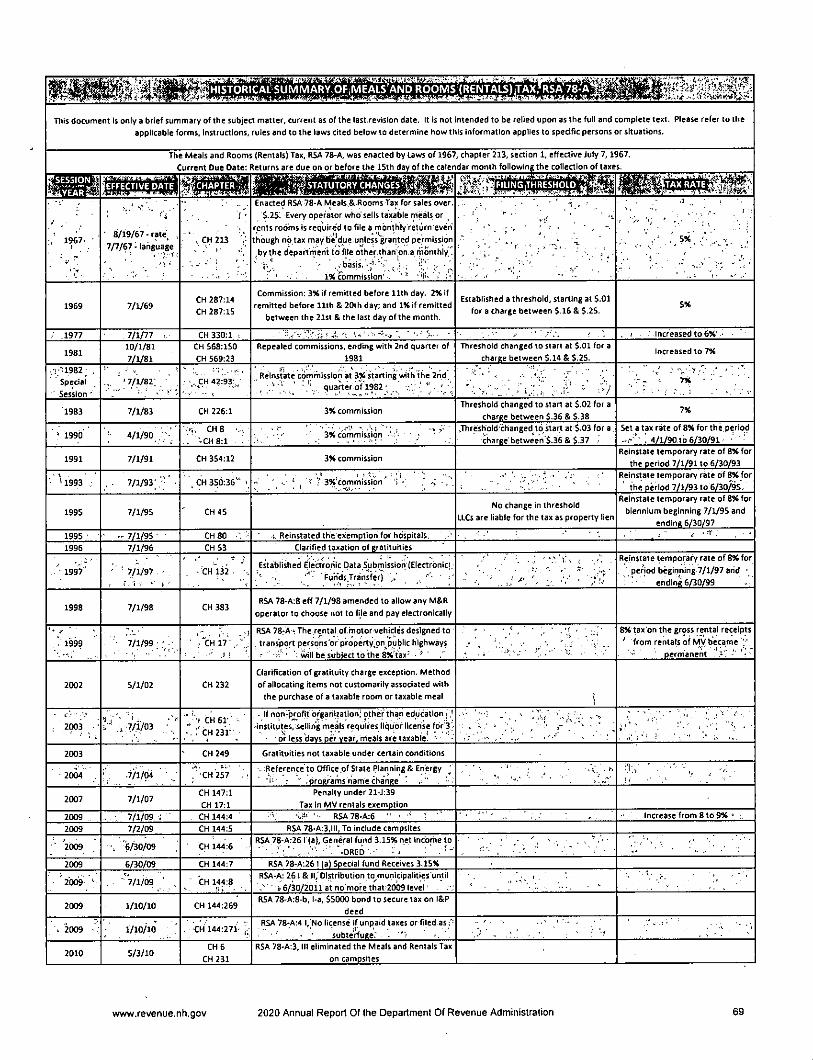
"r-r'i-Wthtj^^llj.'SIORICAlSUfyiMARY.qF-iMEAlSANpROp^
This document is only a brief summary of the subject matter, current as of the last revision date. It is not intended to be relied upon as the full and complete text. Please refer to theapplicable forms, instructions, rules and to the laws cited below to determine how this information applies to specific persons or situations.
The Meals and Room
Current Due Date:
(Rentals) Tax. R5A 78-A, was enacted by laws of 1967
Returns are due on or before the 15th day of the eaten
, chapter 213, section 1, effective July 7,1
dar month following the collection of taxe
67.
s.
^mmm
1967- ■1
V •
H. / n"• '• i
■ 8/19/67 • rate; ,7/7/67 - language
'• -'''
' . CH 213
Enacted RSA 78-A Meals.& Rooms Tax for sales over,
5.25^ Every operator who'sells taxable meals or
rents rooms is required to file a monthly return even'though no,tax may be'due unle^grarited permission,by the department to file other.than'on a rnonihly.
' '■ basis. '•> . • ;; - . . . 1% commission' .
■ • ' T.. ■ ,. • ' . ' ' ' '1.
: t 1 "i
,i . ,
,_5%. V.
1969 7/1/69CH 287:14
CH 287:15
Commission: 3% if remitted before 11th day. 2% Ifremitted before 11th & 20th day; and 1% if remitted
between the 21st 81 the last day of the month.
Established a threshold, starting at 5.01for a charge between $.16 & $.25. 5%
.1977 7/1/77 , CH 330:1 . ■ '-l-'v-I-' '.'i • ^ , 1 . ■ Increased to 6%' •
198110/1/817/1/81
CH 568:150
CH 569:23
Repealed commissions, ending with 2nd quarter of1981
Threshold changed to start at $.01 for acharee between $.14 & $.25.
Increased to 7%
..•!;'U982 ; ,Special
■ Session -
... '7/1/82-. ; CH 42:93'^- Reinstate commission at starting with the 2ndquarter of 1982 ^ ■ / rr-' •„ iV . = 7% ' - '
1983 7/1/83 CH 226:1 3% commissionThreshold changed to start at $.02 for a
charge between $.36 & $.387%
' » 1990' 4/1/90• CH8 •-
. . -CH 8:13*commission • ; '' , .Threshold changed tpstart at $.03 for a
charee between S.36 & $.37Set a tax rate of 8% for the period
; 4/l/90.to 6/30/91' ■'
1991 7/1/91 CM 354:12 3% commissionReinstate temporary rate of 8% for
the period 7/1/91 to 6/30/93
■ ̂1993 .• ■ w";.':' • '.CH350:36'''' , '! t 3%'commission' >*• ' ' ■ - ■" •: Reinstate temporary rate of 8% forthe period 7/1/93 to 6/30^5.
199S 7/1/9S CH45No change In threshold
LLCs are liable for the tax as property lien
Reinstate temporary rate of 8% forblennium beginning 7/1/95 and
ending 6/30/97
1995 • 7/1/95 • • CH80 : Reinstated the exemption for hospitals. , - • :r , . . .
1996 7/1/96 CH 53 Clarified taxation of gratltuities
, ' 1997 ■■ ' 7/1/97 .•" i . • >
'CH132 Estaiblished Ele'ctroriic Data Submission (Electronic:.Funds Transfer)
\ ".' 'ri ; .
- ,. • , •• i_.
Reinstate temporary rate of 8% forperiod beginning 7/1/97 arid '
ending 6/30/99
1998 7/1/98 CH 383RSA 78-A:8 eff 7/1/98 amended to allow any M&R
operator to choose not to file and pay electronically
* * r ^
" 1999 ■ 7/1/99; . ' j "c'h 17 - •„RSA 78rA r The rental of motor vehicles designed to. transport persohs'or property^on public highways
- will be subject to the^'tax- '
8% tax on the gross rental receipts' from rentals of MV became '
- permanent •" '
2002 5/1/02 CH 232
Clarification of gratituity charge exception. Methodof allocating items not customarily associated with
the purchase of a taxable room or taxable meal
; 2003 -"ij ■ ' :.7/1/03 ; "V" CH6r -•
• . CH 23r
. If noni'profit organization; other'than education•institutes, selling meals requires liquor license for 3 >
• or less "davsoervcaf. meals are taxable. • ' '
2003 CH 249 Gratitultles not taxable under certain conditions
2004 ' ''/i/?^ ■ ' ■CH 257 . ' - Reference'to Office of State Planning & Energy J'!-• ■ .oroRramsriamechanEe • .. ^
2007 7/1/07CH 147:1
CH 17:1
Penalty under 21-J:39Tax In MV rentals exemption
2009 . • 7/1/09 ; ' , CH 144:4 ■- RSA78-A:6 " ' " 1 .. . . ' ► . , Increase from 8 to 9% ' .
2009 7/2/09 CH 144:5 RSA 78-A:3.lll. To include campsites
"2009 "6/30/09 CH 144:6RSA 78-A:26 I fa), General fund 3.15% net income to
" ' . "-DRED '.•■ •• < ' . ■-2009 6/30/09 CH 144:7 RSA 78-A:261 (a) Special fund Receives 3.15%
'2009 ^ '7/1/09 ■ „ ■ CH 144:8RSA-A: 261 & 11,'Olstributlon to^municipalities'until
•i'6/30/2011 at no'morethat'20b9 level ' .
2009 1/10/10 CH 144:269RSA 78-A:8-b. l-a. S5000 bond to secure tax on l&P
deed
^ 2009 1/10/10 . 'CH 144:271-RSA 78-A:4 1, No license if unpaid taxes or fijed as
subte'rfuee:' ■ '
2010 5/3/10 1CH6
CH 231
RSA 78-A;3, III eliminated the Meals and Rentals Taxon campsites
www.revenue.nh,gov 2020 Annual Report Of the Department Of Revenue Administration 69
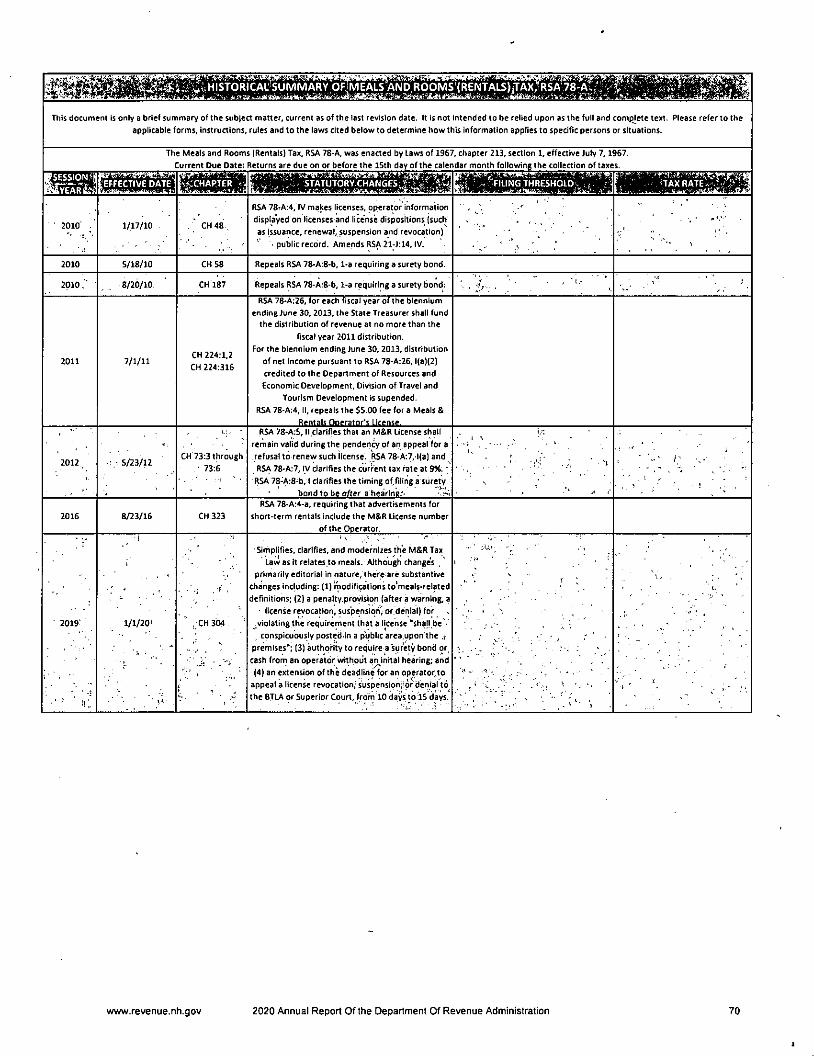
This document Is only a brief summary of the subject matter, current as of the last revision date. It Is not intended to be relied upon as the full and comq[ete text. Please refer to theapplicable forms, instructions, rules and to the laws cited below to determine how this Information applies to specific persons or situations.
The Meals and Rooms (Rentals) Tax, RSA 78-A, was enacted by Laws of 1967, chapter 213, section 1, effective July 7,1967.
Current Due Date: Returns are due on or before the 15th day of the calendar month following the collection of taxes,
2010 1/17/10 CH 48
RSA 78-A:4,'IV makes licenses, operator Information
dlspla'yed on licenses and license dispositions (suchas Issuance, renewal, suspension and revocation)
' ■ public record. Amends RSA 21-J:14, IV.
2010 5/18/10 CK 58 Repeals RSA 78-A:8-b, 1-a requiring a surety bond.
2010. ,8/20/10. CH 187 Repeals RSA 78-A:8-b, l-a requiring a surety bond:
RSA 76-A;26, for each fiscal year of the biennlum
ending June 30, 2013, the State Treasurer shall fund
the distribution of revenue at no more than the
fiscal year 2011 distribution.
For the biennlum ending June 30,2013, distribution
of net income pursuant to RSA 78-A;26,1(a)(2)
credited to the Department of Resources and
Economic Development, Division of Travel and
Tourism Development is supended.
RSA 78-A:4, II, repeals the SS.OO fee for a Meals &
Rentals Operator's License
2011 7/1/11CH 224:1,2
CH 224:316
2012 -• ^ 5/23/12CH 73:3 through
' 73:6
RSA 78-A:S, ll darifies that an M&R license shall
remain valid during the penden^ of an appeal for a
:refus3l to renew such license. RSA 78-A:7,1(a) andRSA 78-A:7, l,V clarifies the current tax rate at 9%.'
RSA 78-A:8-b, I clarifies the timing of.filirig a Surety' bond to be ofter a hearing.'■ -r-i
2016 8/23/16 CH 323
RSA 78-A:4-a. requiring that advertisements forshort-term rentals Include the M&R License number
of the Operator.
2019 1/1/20' CH 304
' Simplifies, clarifies, and modernizes the M&R TaxLaw as it relates to meals. Although change's
primarily editorial in nature, there are substantivechanges including: (1) modifications to'meals-relateddefinitions; (2) a penalty.proyision (after a warning, a
license revocation, suspension^ or.denial) for.violating the requirement that a license "shatl be".'
conspicuously posted>in a public area.upon'thepremises"; (3) authority to require a surety bond or.cash from an operator without an Inltal hearing; and(4) an extension of the deadline for an operator.to
appeal a license revocation; suspension;''or denial tothe BTLA or Superior Court, from 10 days to IS days.
www.revenue.nh.gov 2020 Annual Report Of the Department Of Revenue Administration 70
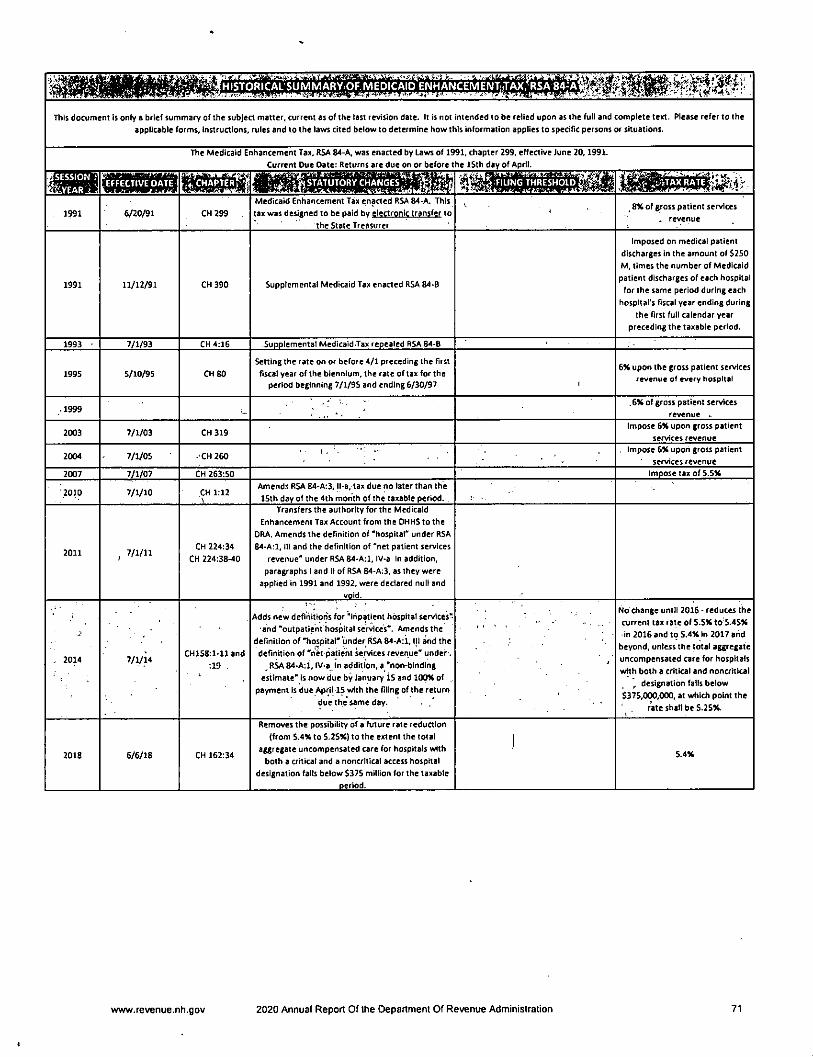
HISTORICAL'SUMMARV OF-MEDICAID ENHANCEMENT,TAX;RSA 84jA
This document is only 8 brief summary of the subject matter, current as of the last revision date. It is not intended to be relied upon as the full and complete text. Please refer to the
applicable forms, instructions, rules and to the laws cited below to determine how this information applies to specific persons or situations.
The Medicaid Enhancement Tax, RSA 84-A was enaaed by Laws of 19
Current Due Date: Returns are due on or before t
91. chapter 299, effective June 20,1991.
he 15th day of April.
.EFFECTIVE DATE
1991 6/20/91 CH 299
Medicaid Enhancement Tax enacted RSA &4-A. This
tax was riesieneri to he nald bv electron if transfer to
the State Treasurer
8% of gross patient services
. revenue
1991 11/12/91 CH 390 Supplemental Medicaid Tax enacted RSA &4-B
Imposed on medical patient
discharges in the amount of 5250M, times the number of Medicaid
patient discharges of each hospital
for the same period during each
hospital's fiscal year ending during
the first full calendar year
preceding the taxable period.
1993 • 7/1/93 CH4:16 Supplemental Medicaid Tax repealed ftSA84-B
1995 5/10/95 CH80
Setting the rate on or before 4/1 preceding the first
fiscal year of the biennium, the rate of tax for the
period beginning 7/1/9S and ending 6/30/97 1
6% upon the gross patient services
revenue of every hospital
.1999.6% of gross patient services
revenue .
2003 7/1/03 CH 319Impose 6% upon gross patient
services revenue
2004 7/1/05 -CM 260. Impose 6% upon gross patient
services revenue
2007 7/1/07 CH 263:50 Impose tax of 5.5%
2010 7/VlO CH 1:12\
Amends RSA &4-A:3, ll-a, tax due no later than the
ISth day of the 4th month of the taxable period.
2011 , 7/1/11CH 224:34
CH 224:38-40
Transfers the authority for the Medicaid
Enhancement Tax Account from the DHHS to the
ORA. Amends the definition of "hospital* under RSA
84-A:l, III and the definition of 'net patient services
revenue" under RSA 84-A:l, iv-a In addition,
paragraphs 1 and 11 of RSA 84-A:3, as they were
applied in 1991 and 1992, were declared null and
void.
. 2014 7/1/14CH 158:1-11 and
:19 .
Adds new definitions for "ihpatient hospital services"
and "outpatient hospital services". Amends the
definition of "hospital' under RSA&4-A:i, III and thedefinition of "net patient services revenue" under-.
, RSA 84-A:l, IV-a In addition, a 'non-binding
estimate* is now due by January iS and 100% ofpayment Is due Ajirit 15 with the filing of the return
due the same (lay.
No change until 2016 - reduces the
current tax rate of 5.5% to 5.45%
in 2016 and to S.4% In 2017 and
beyond, unless the total aggregate
uncompensated care for hospitals
with both a critical and noncritlcal
designation fails below
i5375,000,000, at which point therate shall be S.25%.
2018 6/6/18 CH 162:34
Removes the possibility of a future rate reduction
(from 5.4% to 5.25%) to the extent the total
aggregate uncompensated care for hospitals with
both a critical and a noncritlcal access hospital
designation falls below S37S million for the taxableperiod.
15.4%
www.revenue.nh.gov 2020 Annual Report Of the Department Of Revenue Administration 71
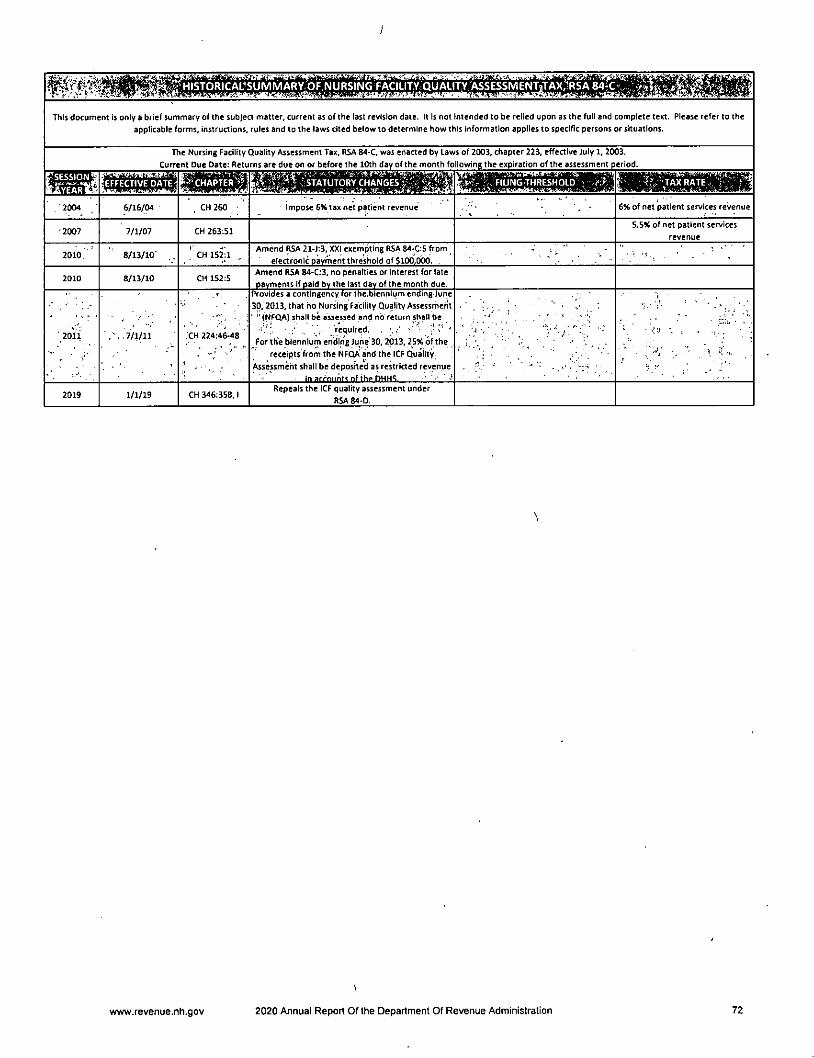
This document is only a brief summary of the subject matter, current as of the last revision date. It Is not intended to be relied upon as the full and complete teirt. Please refer to theapplicable forms, instructions, rules and to the laws cited below to determine how this information applies to specific persons or situations.
Ti
Curr
le Nursing Facility
nt Due Date: Retu
Quality Assessment Tax, RSA 84-C, was enacted by Law
rns are due on or before the 10th day of the month fo
s of 2003, chapter 223, effective July 1, 20
lowing the expiration of the assessment p
03.
eriod.
, 2004 6/16/04 , CH 260 Impose 6% tax net patient revenue
» .. . .
6% of net patient services revenue
•2007 7/1/07 CH 263;S1S.S* of net patient services
revenue
2010, 8/13/10 ' CH152:1Amend WA 21-J;3, XXI exempting RSA 84-C:5 from
electronic oavmentthre'shold of Siod.obo. ,
2010 8/13/10 CH 152:5Amend RSA 84-C;3, no penalties or interest for late
oavments if paid by the last day of the month due.
'2011
^ ' f'
.-. 7/1/11 .'CH 224:46-48
) , ■ '
Provides a contingency for the.biennlum ending June
30,2013, that ho Nursing Facility Quality Assessment' " (NFQA) shall be assessed and no return shall be
.. ' required. •- l'' 'For the biennium ending June' 30,2013,25* of the
receipts from the NFQA and the ICF Quality
Assessment shall be deposited as restricted revenue
in arrniints nf the DHHS
' •
/ ■ ' ■ ,
- ' "• • •
2019 1/1/19 CH 346:358,1Repeals the ICF quality assessment under
RSA 84-D.
\
www.revenue.nh.gov 2020 Annual Report Of the Department Of Revenue Administration 72
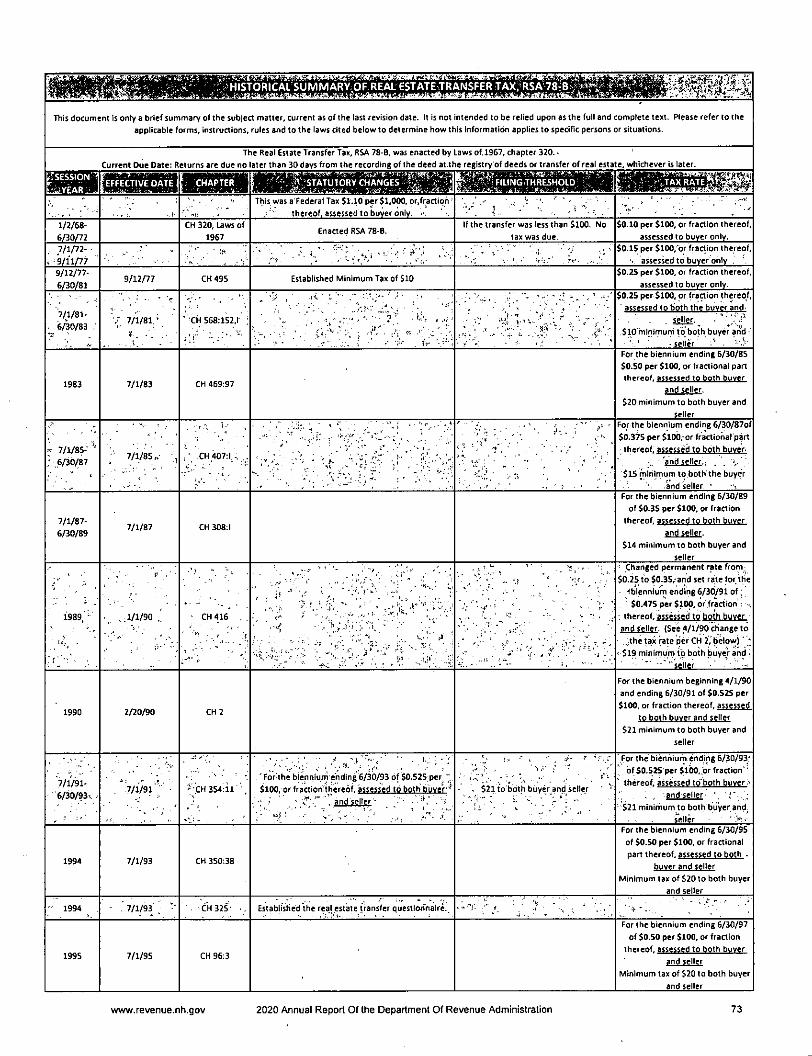
This document is only a brief summary of the subject matter, current as of the last revision date. II is not intended to be relied upon as the full and complete text. Please refer to the
applicable forms, instructions, rules and to the laws cited below to determine how this Information applies to specific persons or situations.
The Real Estate Transfer Tax, RSA 78-B, was enacted by Laws of.l967, chapter 320. - '
Current Due Date; Returns are due no later than 30 days from the recording of the deed at the registry of deeds or transfer of real estate, whichever is later.
This was a Federal Tax $1.10 per $1,000, or,fraction'thereof, assessed to buyer only.
1/2/68-
6/30/72
CH 320, Laws of
1967Enacted RSA 78-B.
If the transfer was less than $100. No
tax was due.
$0.10 per $100, or fraction thereof,assessed to buver only.
. 7/1/72-
.•^9/11/77.' ' - '• t, ■ , • V ■ ■•■V ■
$0.15 per $100, or fraction thereof,. assessed to buyer only .
9/12/77-6/30/81
9/12/77 CH 495 Established Minimum Tax of 510$0.25 per $100, or fraction thereof,
assessed to buver only.
'7(1/81-- 6/30/83 ;
7/1/81. '
-•
1 . . •
"CH 568:152,1 '
.0 , ■ .H-. •. • • . '; •• \
' ... • • "'v- ;
•• , fv
$0.25 per $100, or fradion thereof,• assessed to both the buver and
• ' - . seller. ..$10-minimum to both buyer arid
-seller
1983 7/1/83 CH 469:97
For the blennlum ending 6/30/85$0.50 per $100, or fractional partthereof, assessed to both buver
and seller.
$20 minimum to both buyer andseller
- 7/1/85.-; 6/30/87
;■ 7/1/85•; '
. • -CM 407:1 .c'- ■ ' -
-'i;
■ . ''■■■■■ ' >'■' - .
For the biennium ending 6/30/87of$0,375 per $10b,-or fractional part- thereof, assessed to both buver.
- 'and seller.. '.$15 mlnirnum to both the buyer
and seller •
7/1/87-6/30/89
7/1/87 CH 308:1
For the blennlum ending 6/30/89of $0.35 per $100, or fraction
thereof, assessed to both buver
and seller.
$14 minimum to both buyer andseller
/' . '•
1989,' -
•
: ■
■. ,.1/1/90
. j '
■ CH416
' ' V . 7:v:.
.•i.-f . •i'.-i-.' •. .1 •
. . v; '.^ " 'uV -
,. 7, ■ - . .
• - I-'
Changed permanent rate from;$0.25 to $0.35, and set fate for the
fblenniurn ending 6/30/91 of;$0,475 per $100, of fraction ; -.
: thereof, assessed to both buverand seller. fSee 4/1/90 cbange to.^the tax rate per CH 2, below)' '
' $19 minimum to both buye.r and ■-■ '■• •-■"'seller
1990 2/20/90 CH 2
For the blennlum beginning 4/1/90and ending 6/30/91 of $0,525 per$100, or fraalon thereof, assessed
to both buver and seller
$21 minimum to both buyer andseller
'7/1/91-6/30/?3x^ . , 7/1/91 -
■ ■
-'■CH 354:11
'
' " •
,' For'the biennlum ending 6/30/93 of S0.S25_per.$100. or fraction,thereof, assessed to both buver -
•' ; '"andscller -
- .. . V>- '
. $21 to both buyer and seller '
For the biennium ending 6/30/93'of $0,525 per $100, or fraction"
■ thereof, assessed toboth buver:-•andseller- ■ r. •
' $21 minirifium to both buyer and,. - seiler ' -
1994 7/1/93 CH 350:38
For the biennium ending 6/30/95of $0.50 per $100, or fractionalnartthereof assessed to both .
buver and seller
Minimum tax of $20 to both buyerand seller
• i9M - ' 7/1/93 . -• CH32S'- •. EstabilsKed the reaj estate t/ansfer questionnaire.. • ■•"J- ' ' ■ 'r ■ ■ ^• ■ ' ■ • ■
1995 7/1/95 CH 96:3
For the biennium ending 6/30/97of $0.50 per $100, or fraction
thereof, assessed to both buver
andseller
Minimum tax of 520 to both buyerand seller
www.revenue.nh.gov 2020 Annual Report Of the Department Of Revenue Administration 73
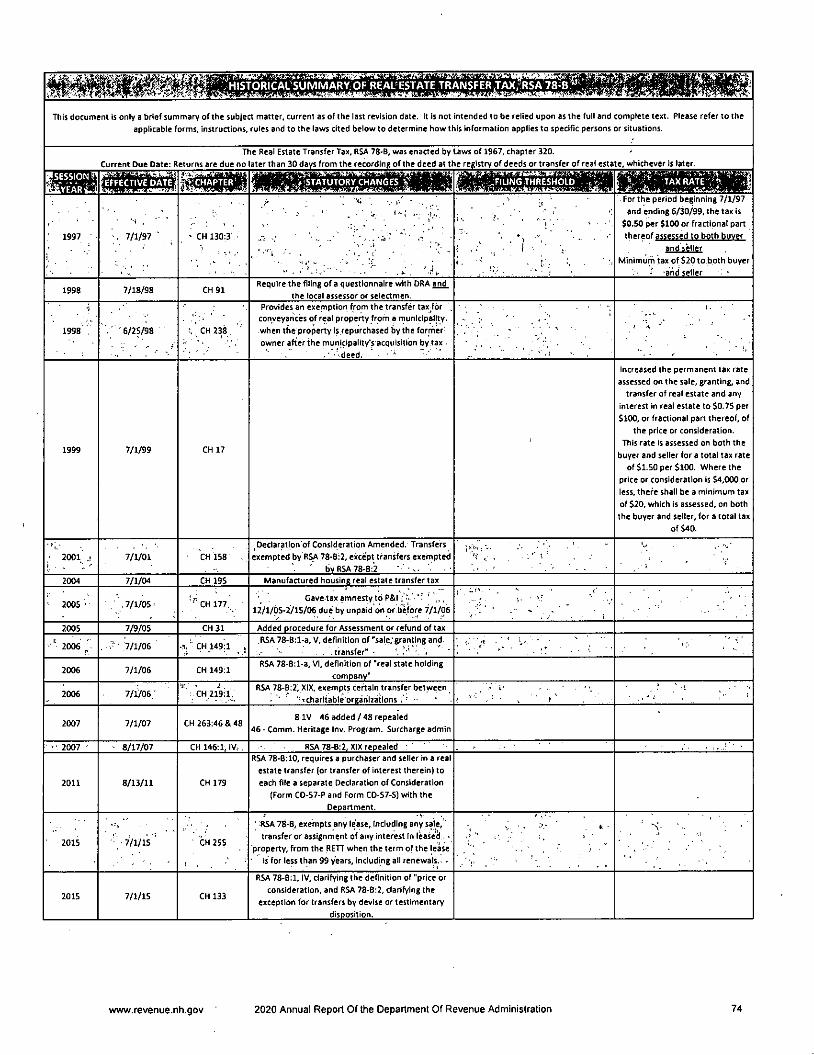
This document is only a t>rief summary of the subject matter, current as of the last revision date, it Is not intended to be relied upon as the full and complete text. Please refer to the
applicable forms, instructions, rules and to the laws cited below to determine how this information applies to specific persons or situations.
Current Due Date: R
T
eturns are due no
ie Real Estate Transfer Tax, RSA 78-0, was enacted by
ater than 30 days from the recordlni; of the deed at t:
Laws of 1967, chapter 320.
e registry of deeds or transfer of real esta e, whichever is later.
SM
1997 : ■ '/I/®' " • CH 130;3'
'K; ;
• ' ■ ' . ■ j-.
' •• . '.,-^1.
'' f \ V . < '
'. ^ • l . \ ■ ''
. For the period beginning 7/1/97
and ending 6/30/99, the tax is
$0.50 per $100 or fractional part
thereof assessed to both buver
andselier
Minimum tax of $20 to both buyer
-shdsHler
1998 7/18/98 CH91Require the filing of a questionnaire with DRA and
the local assessor or selectmen.
1998' . " ' ' 6/25/98 ■ ■ ^! CH 238 , '
Provides an exemption from the transfer tax for ,
conveyances of real property from a rriunlcipallty.
when the property is repurchased by the former
owner after the municipality's acquisition by tax .
•'-deed. : • • *
1 'i ''
1999 7/1/99 CH 17
1
Increased the permanent tax rate
assessed on the sale, granting, and
transfer of real estate and any
Interest in real estate to $0.7S per
$100, or fractional part thereof, of
the price or consideration.
This rate Is assessed on both the
buyer and seller for a total tax rate
of $1.50 per $100. Where the
price or consideration is $4,000 or
less, there shall be a minimum tax
of $20, which is assessed, on both
the buyer and seller, for a total tax
of $40.
; 200l' .?- - "i. '
7/1/01 "cH 158^Declaratlon'of Consideration Amended. Transfersexempted by RSA 78-B;2, except transfers exempted
bv R5A 78-8:2 ' •..
' t ' . , ■ C"2004 7/1/04 CH 195 Manufactured housing real estate transfer tax
• 2005 • . ,7/1/05' ■'"'CH 177. Gave tax amnesty to P&l •'•y ' ,, ,12/1/05-2715/06 due by unpaid on or.before 7/1/06
2005 7/9/05 CH 31 Added procedure for Assessment or refund of tax
2006 J • 7/1/06 •i. 'CH 149:1 . RSA 78-B:l-a, V. definition of 'sale;granting and.. . . transfer' ■ ■.
'i - • ■"
2006 7/1/06 CH 149:1RSA 78-B:l-a, VI, definition of "real stale holding
company"
2006 7/1/06 ■ CH 219:1.RSA 78-B:2, XIX, exempts cerlain transfer between
'•'Charitable organliatlons i ' • - V ' 't ^ • ̂ I , 1 " •
2007 7/1/07 CH 263:46 & 4881V 46added/48repeaied
46 - Comm. Heritage Inv. Program. Surcharge admin
• - • 2007 • • 8/17/07 CH 146:1, IV.. , RSA 78-8:2, XIX repealed ' '
2011 8/13/11 CH 179
RSA 78-6:10, requires a purchaser and seller in a realestate transfer (or transfer of interest therein) toeach file a separate Declaration of Consideration
(Form CD-S7-P and Form CD-S7-S) with theDepartment.
2015 -7/1/15'' • 'CH 255
-r .
' RSA 78-B, exempts any lease. Including any sale, 'transferor assignment of any interest In leased ■
■property, from the RETT when the term of the leaseis for less than 99 years. Including all renewals.. •
"i * •,1 ■' . • ' ; 1 • ■ . ' - ■
2015 7/1/15 CH 133
RSA 78-B:l, IV, clarifying the definition of "price orconsideration, and RSA 78-8:2, clarifying the
exception for transfers by devise or testimentarydisposition.
www.revenue.nh.gov 2020 Annual Report Of the Department Of Revenue Administration 74
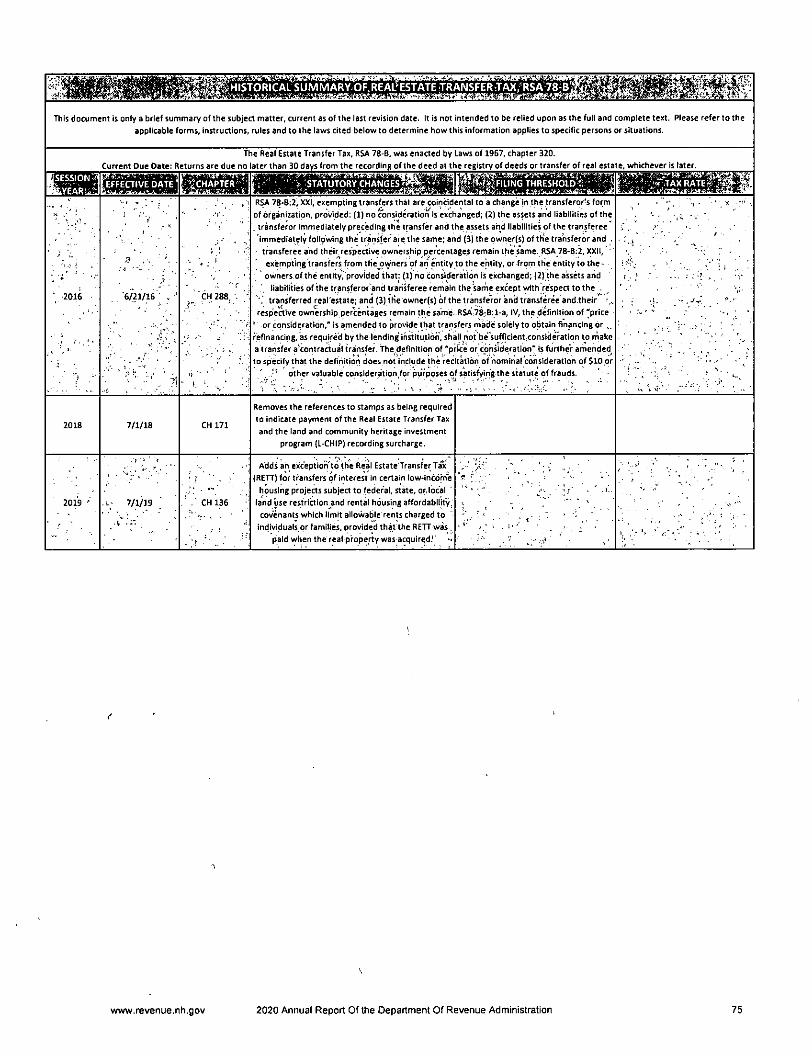
This document is only a brief summary of the subject matter, current as of the last revision date. It is not intended to be relied upon as the full and complete text. Please refer to the
applicable forms, instructions, rules and to the laws cited below to determine how this information applies to specific persons or situations.
The Real Estate Transfer Tax, RSA 78-B, was enacted by
Current Due Date: Returns are due no later than 30 days from the recording of the deed at t
Laws of 1967, chapter 320.
e registry of deeds or transfer of real estate, whichever Is later.
BSESSIONI
IkyEARUtiFFECTIVE date' -/iCHAPTER'v
2016
,y .. ' .
'e/gi/iB , '
1
• ' • " 4
^ CH 288. . -
RSA 78-B:2, XXI, exempting transfers that are coincidental to a change in the transferor's form
of organization, provided: (1) no consideration is exchanged; (2) the assets and liabilities of the
. transferor Immediately preceding the transfer and the assets and liabilities of the transferee
immediately folipviring the transfer are the same; and (3) the owner(s) of the transferor and .transferee and their respective ownership percentages remain the same. RSA 78-B;2, XXII, '
exempting transfers from the owners of art entity to the entity, or from the entity to the •' owners of the entlty.'provlded that: (1) no consideration Is exchanged; (2) the assets and
liabilities of the transferor'and trarisferee remain the sarhe except wrtth'respect to the .
transferred real'estate; and (3) tite ownerfs) of the transferor'and transferee and.theirrespenive ownership percentages remain the same. RSA 78-6; 1-a, IV, the definition of "price
' or consideration,' Is amended to provide that transfers made solely to obtain financing or..
refinancing, as required by the lending institution, shall not be'sufficient consideration to rnakea transfer a'contractual transfer. The definition of "price or consideration"^ is further amendedto specify that the defiriition does not include the recltatiori of nominal consideration of $10 or' other valuable consideration,for purposes of satisfying the statute of frauds.
, . " . • y *1'
' -V
2018 7/1/18 CH 171
Removes the references to stamps as being required
to indicate payment of the Real Estate Transfer Tax
and the land and community heritage investment
program (L-CHIP) recording surcharge.
2019 '
•' ' '
.L- 7/1/19 ■ .' . ■ CH i36 •'
Adds an exc'eption'to the Real Estate Transfer Tax(RETT) for transfers of interest in certain low-income
housing projects subject to federal, state, or.local
land use restriction and rental housing affordabllity,
covenants which limit allowable rents charged toindlvlduals.or families, provided that the RETT was.
paid when the real property was acquired-'
www.revenue.nh.gov 2020 Annual Report Of the Department Of Revenue Administration 75
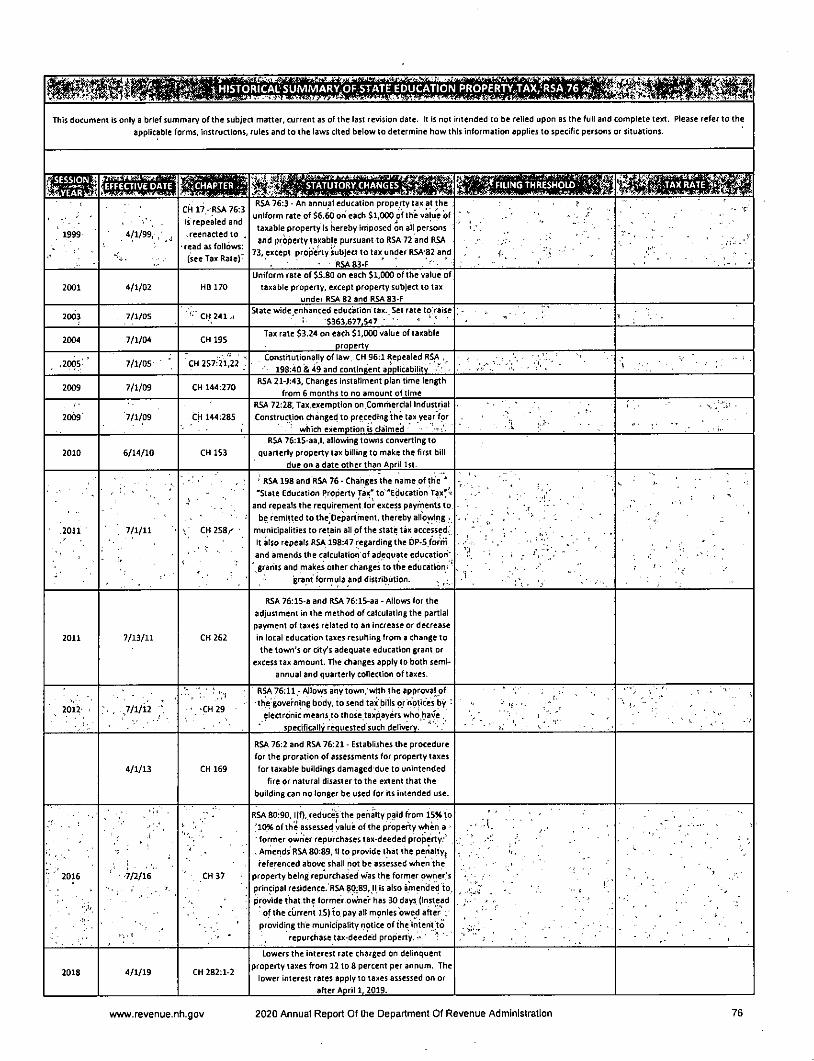
^^Rfl^B^ iHISTORICAL SUMMARY^OF STATE EDUCATION PROPERTYJAX/RSA 76^;:
This document is only a brief summary of the subject matter, current as of the last revision date. It is not Intended to be relied upon as the full and complete text. Please refer to theapplicable forms, instructions, rules and to the laws cited below to determine how this information applies to specific persons or situations.
1999 ■ 4/1/99, ,-^^
CH 17 - RSA 76:3
is repealed and
.reenactedto .
read as follows:
(seclax Rate)"
RSA 76:3 - An annual education property tax at the
uniform rate of 56.60 on each Si,000 of the vajue oftaxable property is hereby trhposed on all persons
and property taxable pursuant to RSA 72 and RSA
73, except property subjea to tax under RSA'82 and
■ . • RSA83-F '
' ' ^
2001 4/1/02 HB170
Uniform rate of $5.80 on each $1,000 of the value of
taxable property, except property subject to tax
under RSA 82 and RSA 83-F
2003 7/1/05 '• CH 241 ..State wnde enhanced education tax. Set rate to;raise
'■ $363,677,547 • ' ' ' '
2004 7/1/04 CH 195Tax rate $3.24 on each $1,000 value of taxable
orooertv
'2995 ' 7/1/05 ; CH 257:21,22 ^ Constitutionally of law CH 96:1 Repealed RSA .198:40 & 49 and contineent applicability - ' .'■f.''" "X' ■ - "
2009 7/1/09 CH 144:270RSA 21-J:43, Changes Installment plan time length
from 6 months to no amount of time
2009 '7/1/09 CH 144:285
RSA 72:28, Tax exemption on.Comrherdal IndustrialConstruction changed to preceding the tax year for
which exemption is claimed - ' ■x V ' .. . ,: ■ / ' ■
2010 6/14/10 CH 153
RSA 76:lS-aa,l, allowing towns converting toquarterly property tax billing to make the first bill
due on a date other than April 1st.
2011
• . i ' V •
, 7/1/11
•! '
■; CH 258/'
1
;
' RSA 198 and R^ 76 • Changes the name of the ''State Education Property Tax' to"Educ8tion Tax"---
and repeals the requirement for excess payments tobe remitted to thc^Department, thereby allowing .
municipalities to retain ail of the state tax accessed^It also repeats RSA 198:47 regarding the DP-S forrriand amends the calculation of adequate education'' grants and makes other changes to the education-'
grant formula and distribution.
, , - - . . . ' '^1'
' -'' V .
2011 7/13/11 CH 262
RSA 76:15-a and RSA 76:15-aa - Allows for theadjustment in the method of calculating the partialpayment of taxes related to an increase or decreasein local education taxes resulting from a change tothe town's or cit/s adequate education grant or
excess tax amount. The changes apply to both semiannual and quarterly collection of taxes.
\ 2012 i' . I - ■
:■ , -.7/1/12 ■"' .Vi
•\-CH29
RSA 76:11 - Allows any town, with the approval of--the'governing body, to send tax bills or notices by
electronic means.to those taxpayers who have .soecificailv reouested'such delivery. ~ '• ' ' 1.' ' . ' '
4/1/13 CH 169
RSA 76:2 and RSA 76:21 - Establishes the procedurefor the proratlon of assessments for property taxesfor taxable buildings damaged due to unintended
fire or natural disaster to the extent that thebuilding can no longer be used for Its intended use.
i; ^ •
V ' 2016
",u
■ r •'•} '
' -7/2/16 , CH37 -
RSA 80:90, i(f), reduces the penalty paid from 15% to;iO% of the assessed value of the propetTy when a -' former owner repurchases tax-deeded property.', Amends RSA 80:89, II to provide that the penalty^referenced above shall not be assessed vtrhen the
property being repurchased was the former owrher'sprincipal residence. RSA 80:89,.11 Is also amended to.provide that the former owne'r has 30 days (instead
of the current 15)to pay all monies owed after ,providing the municipality notice of the intent to
repurchase tax-deeded property. ' *: '■
/•
2018 4/1/19 CH 282:1-2
Lowers the interest rate charged on delinquentproperty taxes from 12 to 8 percent per annum. The
lower Interest rates apply to taxes assessed on orafter Aoril 1.2019.
www.revenue.nh.gov 2020 Annual Report Of the Department Of Revenue Administration 76
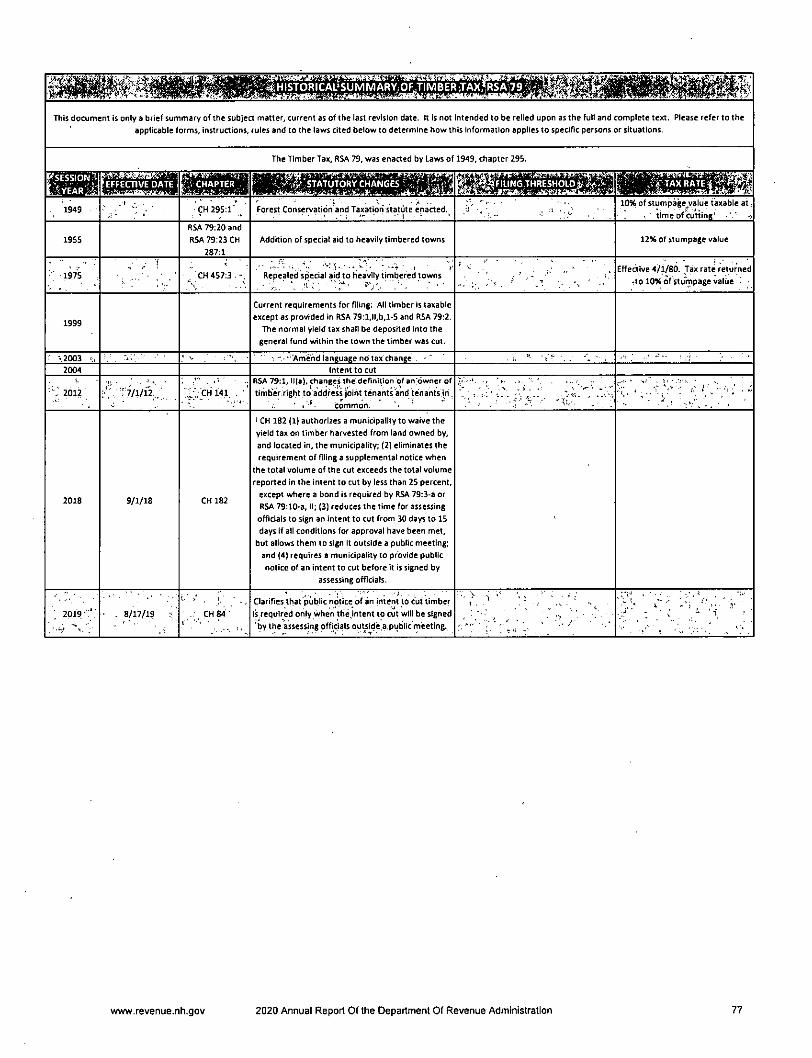
This document is only a brief summary of the subject matter, current as of the last revision date. It is not intended to be relied upon as the full and complete text. Please refer to theapplicable forms, instructions, rules and to the laws cited below to determine how this information applies to specific persons or situations.
The Timber Tax, RSA 79, was enacted by Laws of 1949, chapter 295.
1949 CH 295:1 Forest Conservation and Taxation statute enacted.109i of stumpage value taxable at
■ time of cutting' ■ ■
1955
RSA 79:20 and
RSA 79:23 CH
287=1
Addition of special aid to heavily timbered towns 12Kof stumpage value
-1975 CH 457:3 ■ Repealed special aid to heavily timbered towns. ■ ' ■ if ■ ' ■ -
Effective 4/1/80. Tax rate returned
-to lOK of stumpage valiie
1999
Current requirements for filing: All timber is taxable
except as provided in RSA 79:1,ll,b,1-5 and RSA 79:2.
The normal yield tax shall be deposited into the
general fund vnthin the town the timber was cut.
.2003 •• - - "Amend language no tax change
2004 Intent to cut
2012 7/1/12. CH 141
RSA 79:1, 11(8), changes the dermition of an owner of
tirnber right to address joint tenants and tenants.in.
■ I ' • common. 'X:,-.
2018 9/1/18 CH 182
1 CH 182 (1) authorises a municipality to waive the
yield tax on timber harvested from land owned by,
and located in, the municipality; (2) eliminates the
requirement of filing a supplemental notice when
the total volume of the cut exceeds the total volume
reported In the Intent to cut by less than 25 percent,
except where a bond is required by RSA 79:3-a or
RSA 79:10-a, II; |3] reduces the time for assessing
officials to sign an intent to cut from 30 days to 15
days if all conditions for approval have been met,
but allows them to sign it outside a public meeting;
and (4) requires a municipality to provide public
notice of an intent to cut before it Is signed by
assessing officials.
2019 •: . 8/17/1? CH84
Clarifies that public notice of an intent to cut timber
is required only when the.intent to cut will be signed
'by the assessing officials outslde.a.public meeting.
wwfw.revenue.nh.gov 2020 Annual Report Of the Department Of Revenue Administration 77

This document is only a brief summary of the subject matter, current as of the last revision date, it is not intended to be relied upon as the full and complete text. Please refer to theapplicable forms, instructions, rules and to the laws cited below to determine how this information applies to specific persons or situations.
The Tobacco Tax, RSA 78, was enacted by Laws ot
1939, chapter 167.
1939 •'
i'
RSA 78 CH 167:1For cigarettes, the Department sells tobacco tax
stamps to licensed wholesalers:
ISK, based on the value at usual
selling price of all Tobacco'-.Products'
1965 CH 132
RSA 78:9 establishes a discount rate, based on the
volume of sales, as follows: 2-3/4K sales up to the
First 5500,000; 2-3/8X sales from $501,000 to $1M;
2K sales in excess of $1M. Based on annual sales
from July 1st through June 30th.
Increased to 21X
1967 ' CH 159 Increased to 30K'
1970 CH5 Increased to 34S
1971 7/1/71 CH 475 ■ Increased to 42%
1975 7/1/75 CH 466
Changed the flat rate of $0.12 pernarkaee of 20 cigarettes: no tax on
Other tobacco products.
1983 . ■ ■ • 7/1/83 CH 469:103 ; r;'"'- ■ ■ rv;,, ;Increased to $0.17 per package (to
match the State of Vermont) .
1985 8/25/85 CH 396:1Contingency plan to adjust the tax rate only If
Vermont changed their tax rate.
1986, CH7'5:1 •• •' . . 't '
Rate fixed at $0.17 per package of
20 cigarettes, and SO.21 per
-package of 25 cigarettes.
1989 7/1/89 • CH 336:1
Rate fixed at $0.21 per package of20 cigarettes, and $0.26% per
package of 25 cigarettes, and
proportional to packages of more
or less.
1990 2/20/90 CH5:1 "'v' " ■Increased to $0.25 per package of
20 cigarettes, and $0.31% per .package of 25 cigarettes.
1991 7/1/91 CH 292
Enacted a Smokeless Tobacco Tax, with a rate
"...proportional to the cigarette tax, having such
ratio to the usual wholesale price of the tobacco
product other than cigarettes as the cigarette tax
bears to the usual wholesale price of the cigarettes."
This is a rate that must be periodically calculated by
the Collection Division.
■
1 ,
'■ ■
-1993 - •
1
■ " ■-1/1/94 -
1 • " ■
• ' . * .V ^
CH114 >
; Restructured licensing process so the license willexpire in each even-numbered year (good for two
' • ■ years); with prices as follows: •/ ""ManufacturerSlOO - '''•
Wholesalers S250Sub-jobberSlSO. ■ «
' , ' , ' , ..■'.Retailer'SlO,", . ■Vending Machine SlO / -
Vftndine'Ma'chlneOoeratorS7n
V. ' * J . , • . >
■ ,:V "■ ' . '-l
' . ' • '• ' ' '
. i -
1995 8/18/95 CH 259:2
Enacted a prohibition against the sale or distributionto persons under 18 years of age; anyone not
complying is guilty of a violation with a fine of $100for each offense. Also enacted restrictions on sale of
tobacco products through vending machines.
, 1997 • , '1/1/97 . CH 351:57 . -ii." ,
Increased the tax rate from $0.25toSO.37. ;
1997 1/1/98 CH 338:2Added license fees for tobacco samplers and for
each vending machine location.
- 1997 , 1/1/98 ' CH 338:7• Enacted further restrictions on'sale of tobacco
" products through vending machines.' ', ■■
1999 CH 351:57
Increased the rate of tobacco to
$0.52 per pack of 20 not to includecigars, pipe tobacco and loose
tobacco.
■- 2003 ' 7/1/03 CH is? . Rate $0.52 per pack. 19% tax ontobacco other than cigarettes.
2003 7/1/03 CH319Tax stamps discount removed. Repealed comp for
collecting tax.
www.revenue.nh.gov 2020 Annual Report Of the Department Of Revenue Administration 78
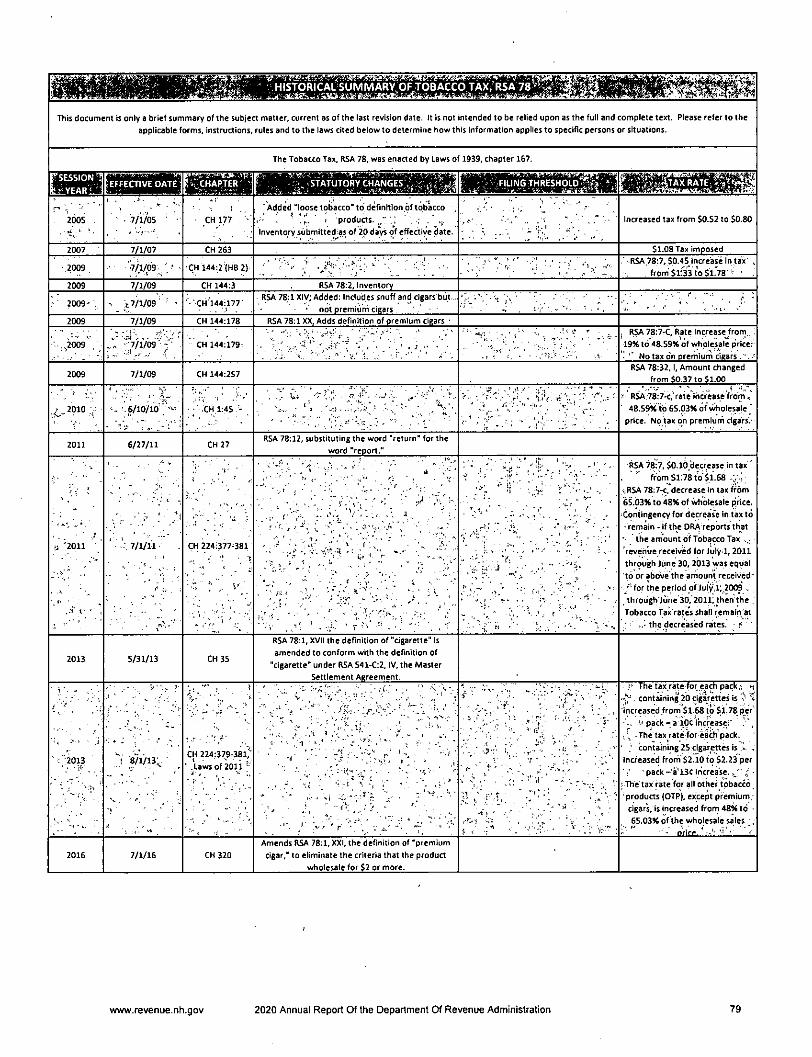
,-v.
This document is only a brief summary of the subject matter, current as of the last revision date. It is not intended to be relied upon as the fuli and complete text. Please refer to the
applicable forms, instructions, rules and to the laws cited below to determine how this information applies to specific persons or situations.
The Tobacco Tax, RSA 78, was enacted by Laws of 1939, chapter 167.
PSESSIOhJl
fe rVEAR'
2005 • - 7/1^5 ■ • CH177
' Added "loose tobacco* to definition of tobacco
•" - ' 'l- ' • 'products.,/: ;;Inventory submitted as of 20 days of effective date.' / / " '1 i".' - '1' - '
increased tax from S0.S2 to S0.80
2007 7/1/07 CH 263 Sl.08 Tax imposed
2009 •CH 144:2 {HB 2} ;r ^ . - RSA.78:7, S0.45,increase in tax ^from'Sl".33lo$i.78 ' •
2009 7/1/09 CH 144:3 RSA 78:2. inventory
■ 2009' , > zVX/09 ' ' ''■'CHi44:177' RSA 78:1 XiV; Added: Includes snuff and cigars but..• not premium cigars
■' ; ■/ ■ , t -
2009 7/1/09 CM 144:178 RSA 78:1XX, Adds definition of premium cigars '
■•..;.2009 ' ■'J/i/bg'"'p'- . CH 144:179-;;; v ■ ■ --- . RW 78:7-C, Rate increase frdrn,. .
19% to 48.S9X of wholesale price: ■" '' No tax on oremium cigars.
2009 7/1/09 CH 144:257RSA 78:32, i, Amount changed
from 50.37 to Sl.OO
/ 2010'.V
'.e/io/io";'"--' • ;':.CH1:4S."-: RW 78:7-c,'rate increase from,
48.S9*'to 65.03* of t^olesale 'price. No tax on premiurn cigars'.'
2011 6/27/11 CH27RSA 78:12, substituting the word "return" for the
word "report."
0 '2011
■_f. -
■ •" .' " /'
• 7/1/11
t
CH 224:377-381
p t'-
. V ' U ' '
' V • • ' * . , . V .
- - .r ^
RSA 78:7, $0.10 decrease in tax '. ■ ' front Si;78tVSl.68^RSA 78:7-c, deaease in taxffbm65.03* to 48* of wholesale price.Contingency for decreas'e In tax to- remain - if the ORA reports that
•' "the amount of Tobacco Tax ...revenue received for July 1,2011through June 30, 2013 vyas equalto or above the amount received-
• "for the period of July,1/2009 ., throiigh jiine 30,2011", then the ,Tobacco Tax rates shall remain at
the decreased rates, -f '
2013 5/31/13 CH 35
RSA 78:1, XVii the definition of "cigarette" isamended to conform with the definition of
"cigarette" under RSA S41.C:2, IV, the MasterSettlement Agreement.
' •"■20X3-i"'-_ ,
;8/i/i3:,-
• . . trt," ■■
CH 224:379-381,^'' .Laws of Mil
••
- •••.- ■ ■' . "■
' '" • • ■ ' " • ' 1
- '" . ' ; ,. ■ ■ j
' , ■ / "■i'': ■ '■
" / ' t' • ^ y
>: The tax rate for each pack- -i. containing 20 cigarettes is, 1
increased.from Sl.68 to Si.78 perpack - a lOcVncreasc;" '.
-The tax rate for ea(^ pack,containing 25 cigarettes is .
Increased frorn S2.10 to S2.23 per■ pack -'a'13C iricrea'se. / -
/The tax rate for ail other tobacco,products (OTP), except premium,-cigars, is increased from 48* to '65.03* of the whojesale sales ;.
- nrire. '
2016 7/1/16 CH 320
Amends RSA 78:1, XXI, the definition of "premiumcigar,* to eliminate the criteria that the product
wholesale for S2 or more.
www.revenue.nh.gov 2020 Annual Report Of the Department Of Revenue Administration 79
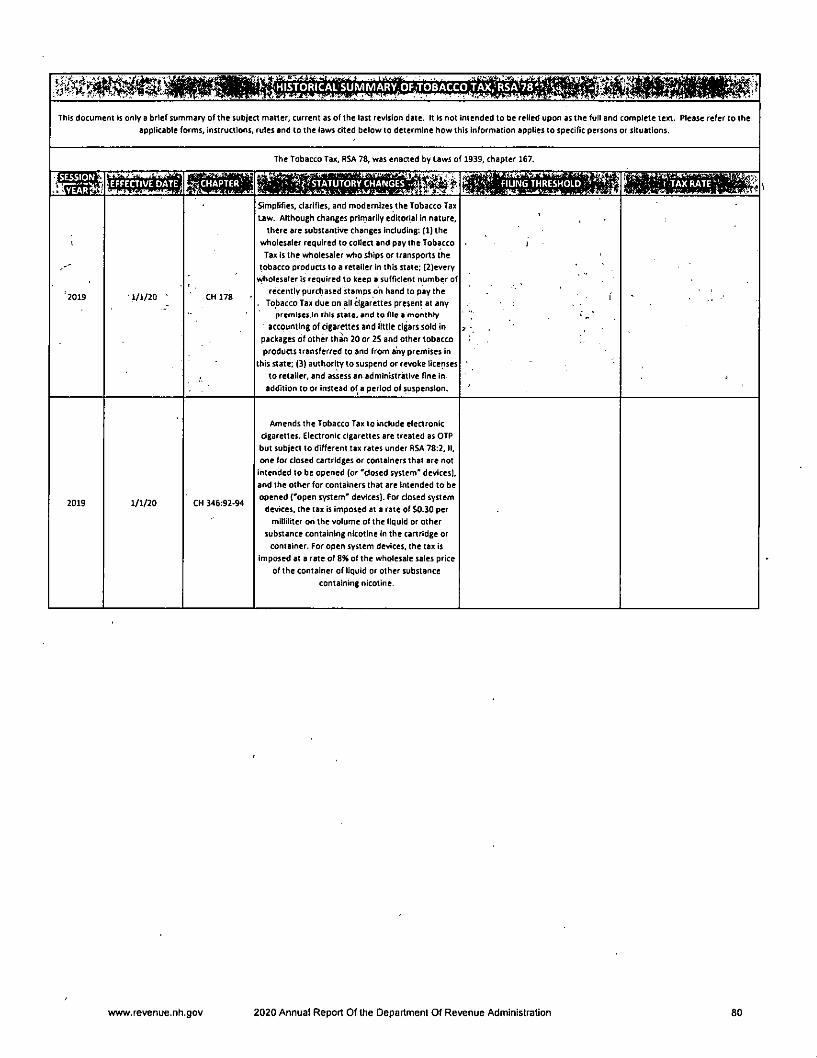
This document is only a brief summary of the subject matter, current as of the last revision date. It Is not intended to be relied upon as the full and complete ten. Please refer to the
applicable forms, instructions, rules and to the laws cited below to determine how this information applies to specific persons or situations.
The Tobacco Tax, RSA 78, was enaaed by Laws of 1939, chapter 167.
2019 • 1/1/20 CH 178
Simplifies, clarifies, and moderniies the Tobacco Tax
Law. Although changes prirriarity editorial in nature,
there are substantive changes including; (1) the
wholesaler required to collect and pay the Tobacco
Tax is the wholesaler who ships or transports the
tobacco products to a retaiier in this state; (2)every
wholesaler is required to keep a sufficient number of
recently purchased stamps on hand to pay the
. Tobacco Tax due on all ̂ garettes present at anypremises In this state, and to file a monthly
accounting of cigarettes and little cigars sold in
packages of other than 20 or 2S and other tobacco
products transferred to and from any premises in
this state; (3) authority to suspend or revoke licenses
to retailer, and assess an administrative fine in
addition to or instead of a period of suspension.
v-:v FlUNG THRESHOLD' V
2019 1/1/20 CH 346:92-94
Amends the Tobacco Tax to include electronic
cigarettes. Electronic cigarettes are treated as OTP
but subject to different tax rates under RSA 78:2. II.
one for closed caaridges or containers that are not
intended to be opened (or 'closed system' devices),
and the other for containers that are Intended to be
opened ('open system' devices), for dosed system
devices, the tax is imposed at a rate of &0.30 per
mllliiiter on the volume of the liquid or other
substance containing nicotine in the cartridge or
container. For open system devices, the tax is
imposed at a rate of 8% of the wholesale sales price
of the container of liquid or other substance
containing nicotine.
www.revenue.nh.gov 2020 Annual Report Of the Department Of Revenue Administration 80

This document is only a brief summary of the subject matter, current as of the last revision date, it is not intended to be relied upon as the fuii and compiete text.
Please refer to the applicable forms, instructions, rules and to the laws cited below to determine how this information applies to specific persons or situations.
The Railroad Tax, RSA 82, was enacted by Laws of 1990, chapter 9, effective March 31,1990.
mm
2005 7/1/05 CH Law 93Changes assessment, collection, and appeals
. - ." ■ i procedures^' ' '
2010 7/1/10 CH 60
Makes various changes to RSA 82 relative to the
definitions and procedures relating to the Railroad
Tax. (Market value versus actual value, evidence of
value, information filing to DRA on or before May 1st
each year, and Failure to File penalty of 1% of the
property tax (no less than $250 or more than $2,500)
for failure to file the information, or obtain an
extension to file.
www.revenue.nh.gov 2020 Annual Report Of the Department Of Revenue Administration 81
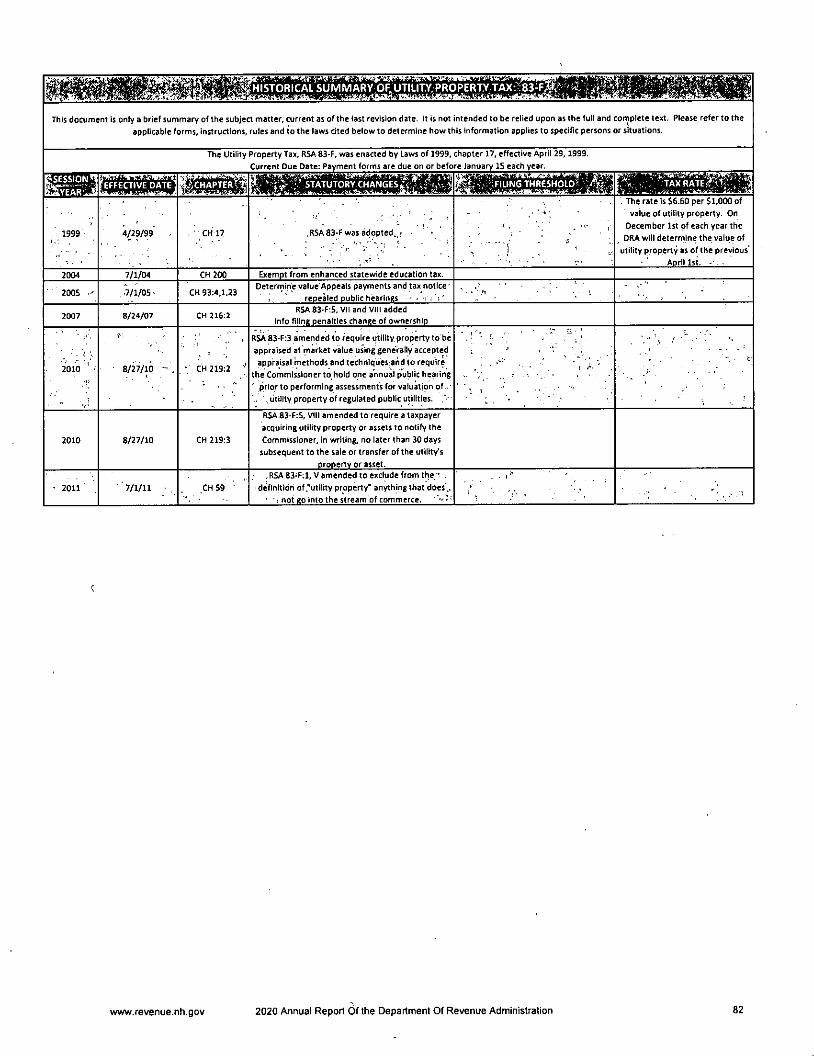
^pMHISTORICAC SUMMARY OF. UmiTY;PROPERTY TAX:?;83-FJ!;.^ ̂
This document is only a brief summary of the subject matter, current as of the last revision date, it is not intended to be reiied upon as the full and complete text. Please refer to theapplicable forms, instructions, rules and to the laws cited below to determine how this information applies to specific persons or situations.
The Utility Property Tax, fiSA 83-F, was enacted by Laws of 1999, chapter 17, effective April 29,1999.Current Due Date: Payment forms are due on or before January IS each year.
}*f^immm.
1999 4/29/99 • CH 17 , RSA 83-F was adopted.,;
. The rate Is $6.60 per $1,000 of
value of utility property. OnDecember 1st of each year the
DRA will deterrnine the value of
utility property as of the previous'Aorll 1st. ■
2004 7/1/04 CH 200 Exempt from enhanced statewide education tax.
2005 . .7/1/05 • CH 93:4,1,23Deterrnine value'Appeals payments and tax notice'
' repealed publichigarings
2007 8/24/07 CH 216:2RSA 83-F:5, Vii and Vlli added
Info flline penalties change of ownership
2010 8/27/10 •' CH 219:2
RSA 83-F:3 amended to require ytility. property to beappraised at market value using generally accepted
appraisal methods and techniques and to require
the Commissioner to hold one annual public hearing
' prior to performing assessment's for valuation of ', utility property of regulated public utilities.
2010 8/27/10 CH 219:3
RSA 83-F:S, VIM amended to require a taxpayer
acquiring utility property or assets to notify the
Commissioner, in writing, no later than 30 days
subsequent to the sale or transfer of the utility's
property or asset.
2011 7/1/11 CH 59
,RSA 83-F:l, V amended to exclude from the;* .
'definition of ."utility property" anything that does'.
' '! not go into the stream of commerce.
wvvw.revenue.nh.gov 2020 Annual Report Of the Department Of Revenue Administration 82
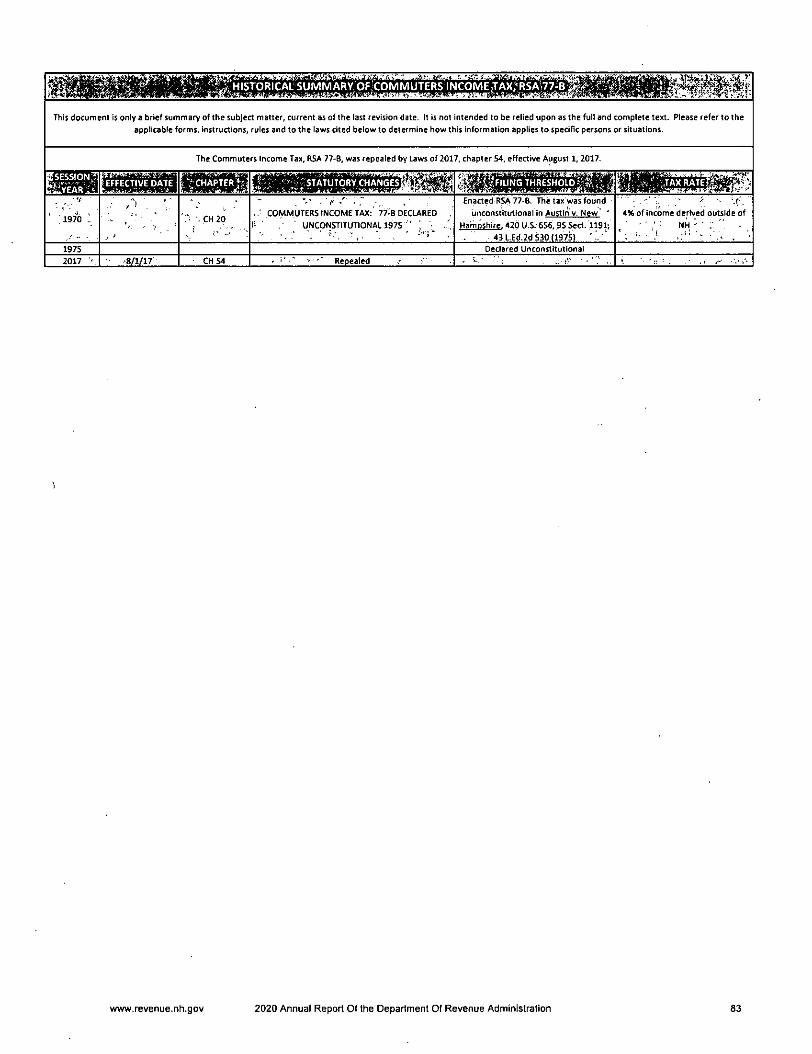
MKMMIThis document is only a brief summary of the subject matter, current as of the last revision date. It Is not intended to be relied upon as the full and complete text. Please refer to the
applicable forms, instructions, rules and to the laws cited below to determine how this information applies to specific persons or situations.
The Commuters Income Tax, RSA 77-B, was repealed by Laws of 2017, chapter 54, effective August 1,2017.
;1970 1. V
J
■ •. CH 20, C0Mh4LITERS INCOME TAX:' 77-B DECLARED1= ' • UNCONSTITUTIONAL 1975 "" J
Enacted R^ 77-B. The tax was found
iinrnnstitixtional In Austin v. New' *
Ha'moshire. 420 U.S.-6.56. 95 .Sect. 1191-.
43Led.2dS30(197S) ' '
'• '■<.4K of income derived outside of
, ' ' ' iV . NH -" : " -
1975 Declared Unconstitutional
2017 • -8/1/17 CH 54 - Repealed ■ ̂ ■ ' , • .. •- ..
www.revenue.nh.gov 2020 Annual Report Of the Department Of Revenue Administration 83
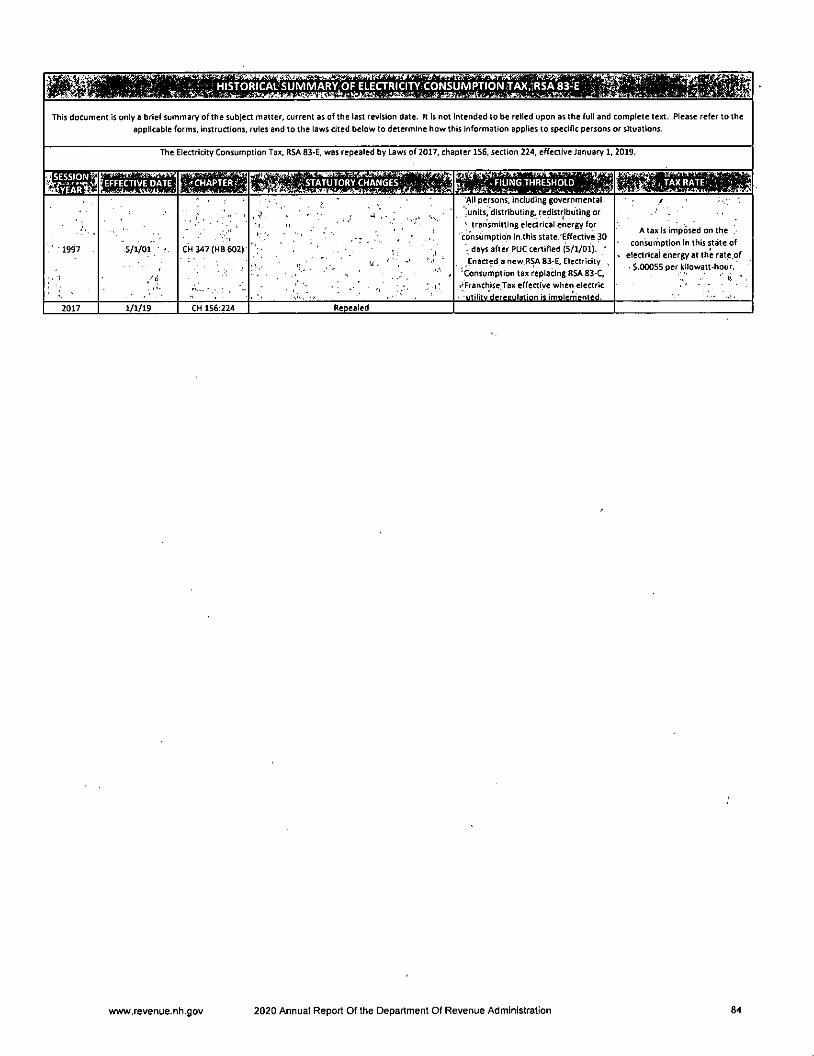
; • : HistORiCAl!suKlARY;OF ELECtRIClfYlcONSUMVfrON T^.iRS^3-r:^^^f^
This document is oniy a brief summary of the subiect matter, current as of the last revision date. It is not intended to be relied upon as the full and complete text. Piease refer to theapplicable forms, instructions, rules and to the laws cited below to determine how this information applies to specific persons or situations.
The Electricity Consum Mion Tax, RSA 83-E, was repealed by Laws of 2017, cha pter 156, section 224, effective January 1,2019.
MM li-<CHAPTER p; ilr.STATUTORY CHANGES • v.; iV :-i''PIUNG threshold , .'-P' 54
' •1997
•, -i
5/1/01 - c'h 347(HB602)
1 • • ' '' . ; . ,v !.>,'1 • ' , ' ,
Ail persons, including governmental.
'units, distributing, redistributing or' transmitting electrical energy for
consumption in.thls state.'Effective 30
- days after PUC certified (5/1/01). '
Enacted a new RSA 83-E, Electricity ,
' Consumption tax replacing RSA 83-C,
('Franchise Tax effective when electric
•utiiitv deregulation is imolemented.
/ ' '
A tax Is imposed on the
consumption In this state of
> electrical energy at the rate.of1S.00055 per kilowatt-hour.
' B " -
2017 1/1/19 CH 156:224 Repealed
www.revenue.nh.gov 2020 Annual Report Of the Department Of Revenue Administration 84
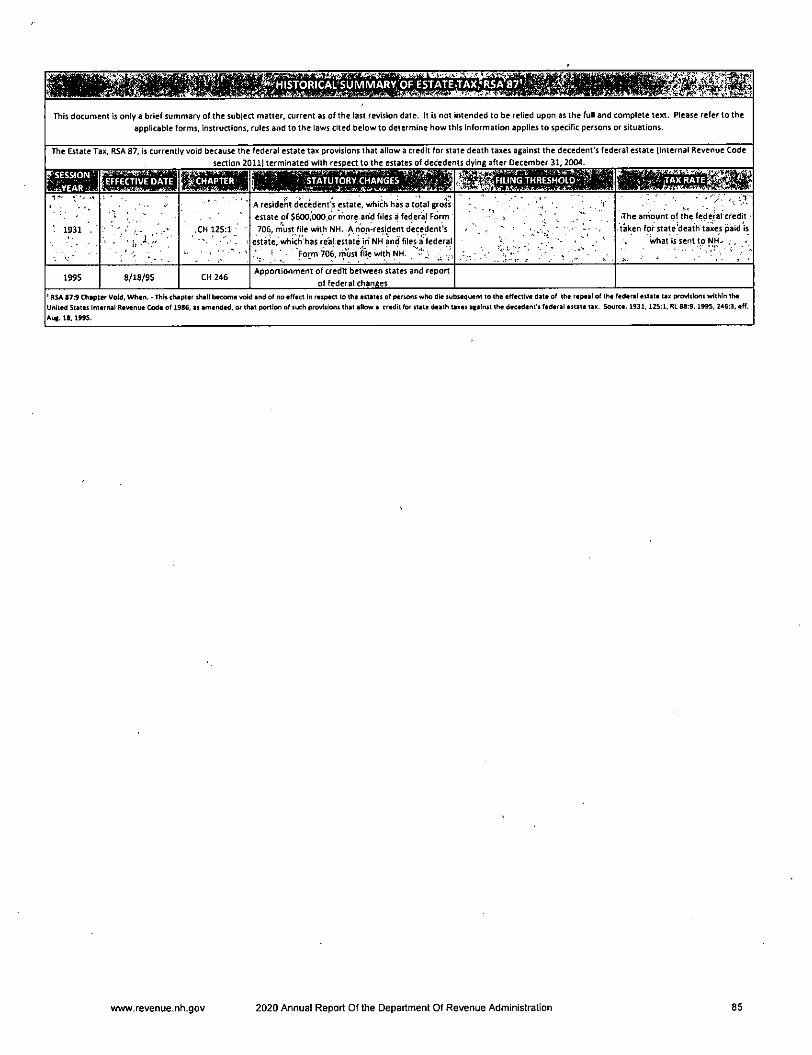
ffwilHl'Inl'
This document is only a brief summary of the subjea matter, current as of the last revision date. It is not intended to be relied upon as the full and complete text. Please refer to theapplicable forms, instructions, rules and to the laws cited below to determine how this Information applies to specific persons or situations.
The Estate Tax, RSA 87, is currently void because the federal estate tax provisions that allow a credit for st
section 2011) terminated with respect to the estates of decede
te death taxes against the decedent's fed
ts dying after December 31,2004.
sral estate (internal Revenue Code
gjjpip1 •*- •• •. .1
; 1931 . ,CH 125:1
•> . d iA resident decedent's estate, which has a total gross
estate of $600,000 or rhore and files a federal Form
706, must file with NH. A non-resident decedent's
estate, which'has real estate in NH and files a'federal
i ' Form 706, nn'ust file with NH. ,
s '• ^-3 ' • ' \ ̂
V . • " '^1 ' • ' <
The arhount of the federal credit -
taken for state death taxes paid is
, what is sent to NH-
1995 8/18/95 CH 246Apportionment of credit between states and report
of federal changes
' RSA 07:9 Chapter Void, When. - Thh chapter shall Itecome vok) and of no effect In respect to the estates of persons who die sutuequent to the effecthre date of the repeal of the federal estate u> provisions within tfteUnited States Internal Revenue Code of 1986. as amended, or that portion of such provlsloru that allow a credit for state death taxes atalnst the decedent's federal estate tax. Source. 1931.12S:1. RL08:9.199S. 246:3. eff.Aug. 16. 199S.
www.revenije.nh.gov 2020 Annual Report Of the Department Of Revenue Administration 85
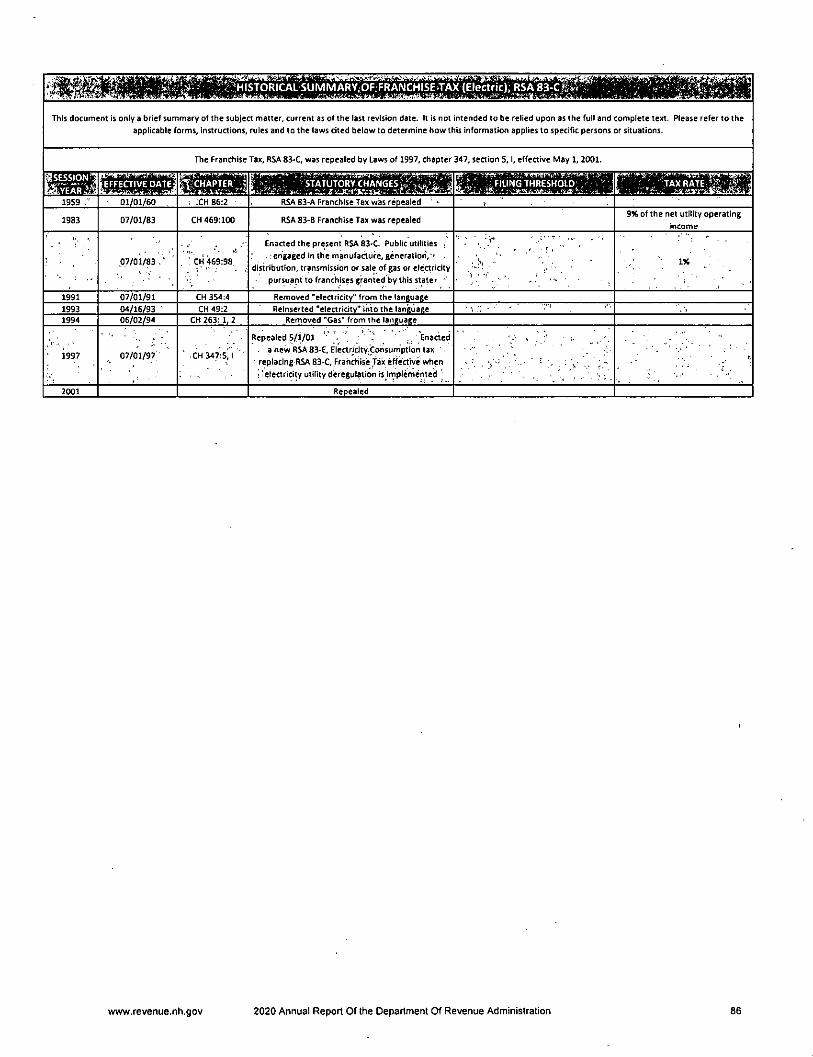
: SUMMARV;OF:FRANCHISETAX (Electnc);:RSA 83:Cfe^^ ' ̂
This document is only a brief summary of the subject matter, current as of the last revision date. It Is not Intended to be relied upon as the full and complete text. Please refer to the
applicable forms, instructions, rules and to the laws cited below to determine how this information applies to specific persons or situations.
The Franchise Tax, RSA 83-C, was repealed by Laws of 1997, chapter 347, section 5, i, effeaive May 1, 2001.
HSESSpNf^I^YEAR^
1959 ; ■ 01/01/60 : ;CH86;2 - RSA 83-A Franchise Tax was repealed ^ V ' .
1983 07/01/83 CH 469:100 RSA 83-B Franchise Tax was repealed9% of the net utility operating
income
"
07/01/83." . ■ CH 469:98
Enacted the present RSA 83-C. Public utilities j
. engaged in the manufacture, generation,-' .
distribution, transmission or sale of gas or elearlcity
.pursuant to franchises granted by this state-- ''
" : ■ 1* ' •
1991 07/01/91 CH 354:4 Removed "electricity" from the language
1993 04/16/93 ~ CH 49:2 Reinserted 'electricity" into the language
1994 06/02/94 CH 263:1,2 Removed "Gas" from the language
1997 07/01/97 ' .CH 347;5j '■
Repealed 5/1/01 , Enacted
■ a new R5A83-E, Electrjcity.Consumption tax '.
' replacing RSA 83-C, Franchise .tax effective .when: "eiectrlcity utility deregulation is implemented ^
■V- ■ ^ - - ' ■
2001 Repealed
www.revenue.nh.gov 2020 Annual Report Of the Department Of Revenue Administration 86
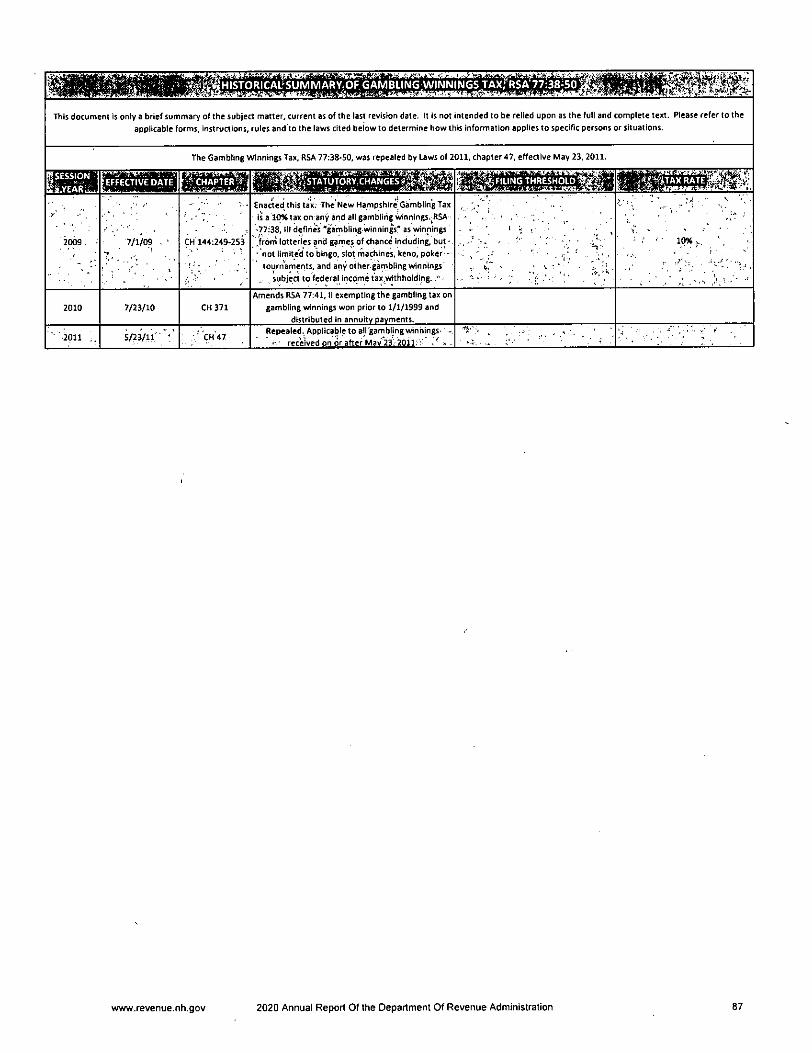
This document is only a brief summary of the subject matter, current as of the last revision date. It is not intended to be relied upon as the full and complete text. Please refer to theapplicable forms, instructions, rules and'to the laws cited below to determine how this information applies to specific persons or situations.
The Gambling Winnings Tax, RSA 77:38-50, was repealed by Laws of 2011, chapter 47, effective May 23, 2011.
SMS"•jir'iMi'ifliTiffirfflfrf
fflSiBiSii
y _
2009 ■ 7/1/09 . •
7, 'CH 144:249-253
Enacted this tax. The New Hampshire Gambling Tax
' is a 10% tax on any and all gambling winnings.^RSA'77:38, III defines 'g'ambling winnings" as winnings'.front lotteries and garnes of chance including, but-- not limite'd to bingo, slot machines, keno, poker -
tournaments, and any other.gambling winnings
subject to federal Income tax.withholdlng. -1 - V; ^
1. "
• 10% ■ .
2010 7/23/10 CH 371
Amends R5A 77:41, II exempting the gambling tax on
gambling winnings won prior to 1/1/1999 and
distributed in annuity oavments.
■' '2011 S/23/ir'",' Repealed. Applicable to alfgambjingynnhingS' -received on or after Mav 23>2011: / >. .
"r ■ - ^ ' i ' ' '
www.revenue.nh.gov 2020 Annual Report Of the Department Of Revenue Administration 87
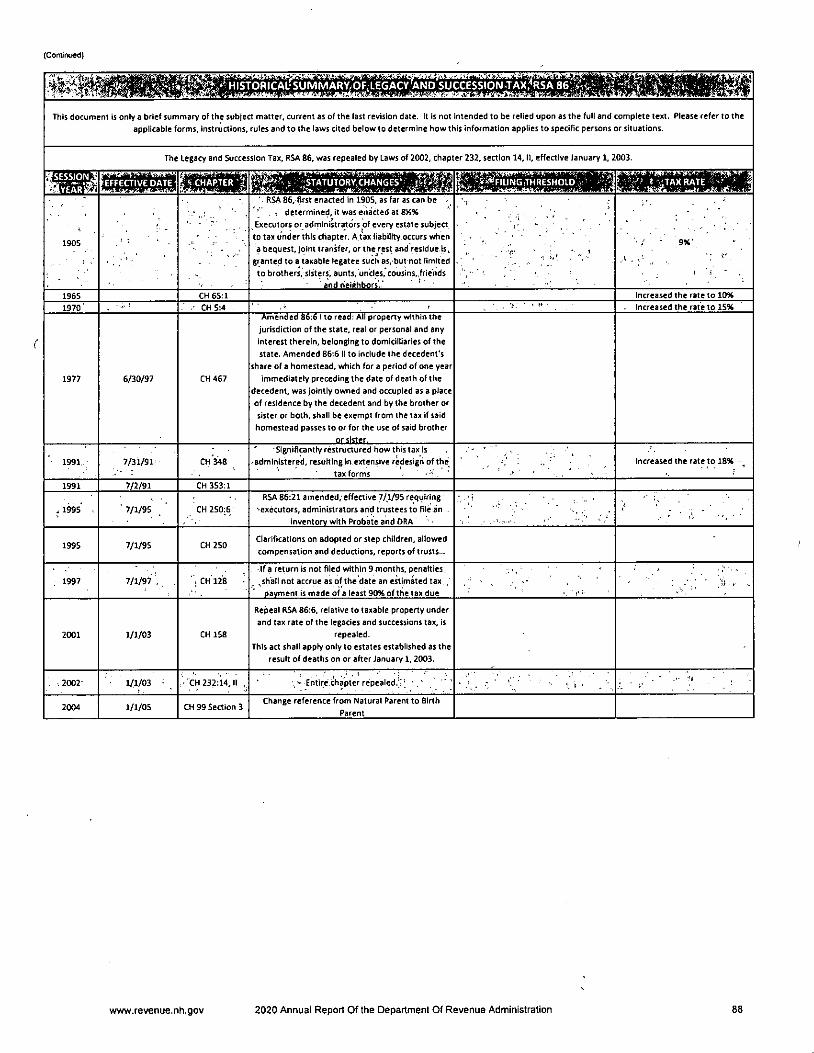
(Contirxied)
w^4»^ HIST0RICAL-SUMMARY>0F,LEGACY'AND SUCCESSIONTAX.^RSA 86vAi^ 3s
This document Is only a brief summary of the subject matter, current as of the last revision date. It is not intended to be relied upon as the full and complete text. Please refer to the
applicable forms, Instructions, rulesand to the laws cited below to determine how this information applies to specific persons or situations.
The Legacy and Succession Tax, RSA 86, was repealed by Laws of 2002, chapter 232, section 14, li, effective January 1, 2003.
ft CHAPTER ■';;Statut6rv,chan
1905
- ' RSA 86, first enacted in 1905, as far as can be -' . • determined. It was enacted at 8H%Executors or adrninlstrators of every estate subjectto tax under this chapter. A tax liability occurs whena bequest, joint transfer, or the rest and residue is,
granted to a taxable legatee such as,'but not limitedto brothers, sisters, aunts, uncles,'cousins,,friends
andhelehbors'.' • ' •
' '-r-' ' '■■ ; • 9%' '
1 ' ! " ,
196S CH 65:1 Increased the rate to 10%
1970 - ... i CHS:4 Increased the rate to 15%
1977 6/30/97 CH 467
Amended 86:61 to read: All property within thejurisdiction of the state, real or personal and anyInterest therein, belonging to domlcllliaries of thestate. Amended 86:6 II to Include the decedent's
share of a homestead, which for a period of one yearImmediately preceding the dale of death of the
decedent, was jointly owned and occupied as a placeof residence by the decedent and by the brother orsister or both, shall be exempt from the tax If saidhomestead passes to or for the use of said brother
or sister.
1991 7/31/91 Ch'348'5ignlficantly restructured how this taxis
■ administered, resulting In.extensive redesign of thetaxforms
Increased the rate to 18% ~
1991 7/2191 CH 353:1
.1995 , ' 7/1/95 CH 250:6R5A 86:21 amended; effective 7/1/95 requiring
' executors, administrators and trustees to file an .Inventory with Probate and ORA
\
1995 7/1/95 CH 250Ciarlficallons on adopted or step children, allowedcompensation and deductions, reports of trusts...
1997 7/1/97 , 1 CH 128 ■If a return is not filed within 9 months, penalties^sh'all not accrue as of the date an estimated tax ,
pavmeni is made of a least 90% of the lax due
2001 1/1/03 CH 158
Repeal RSA 86:6, relative to taxable property underand tax rate of the legacies and successions tax. Is
repealed.This act shall apply only to estates established as the
result of deaths on or after January 1, 2003.
>2002- 1/1/03 - . • CM 232:14, II , Entire chapter repealed."; ' ■ ' ■:/ ■ ■■ '
2004 1/1/05 CH 99 Section 3Change reference from Natural Parent to &lrth
Parent
www.revenue.nh.gov 2020 Annual Report Of the Department Of Revenue Administration 88
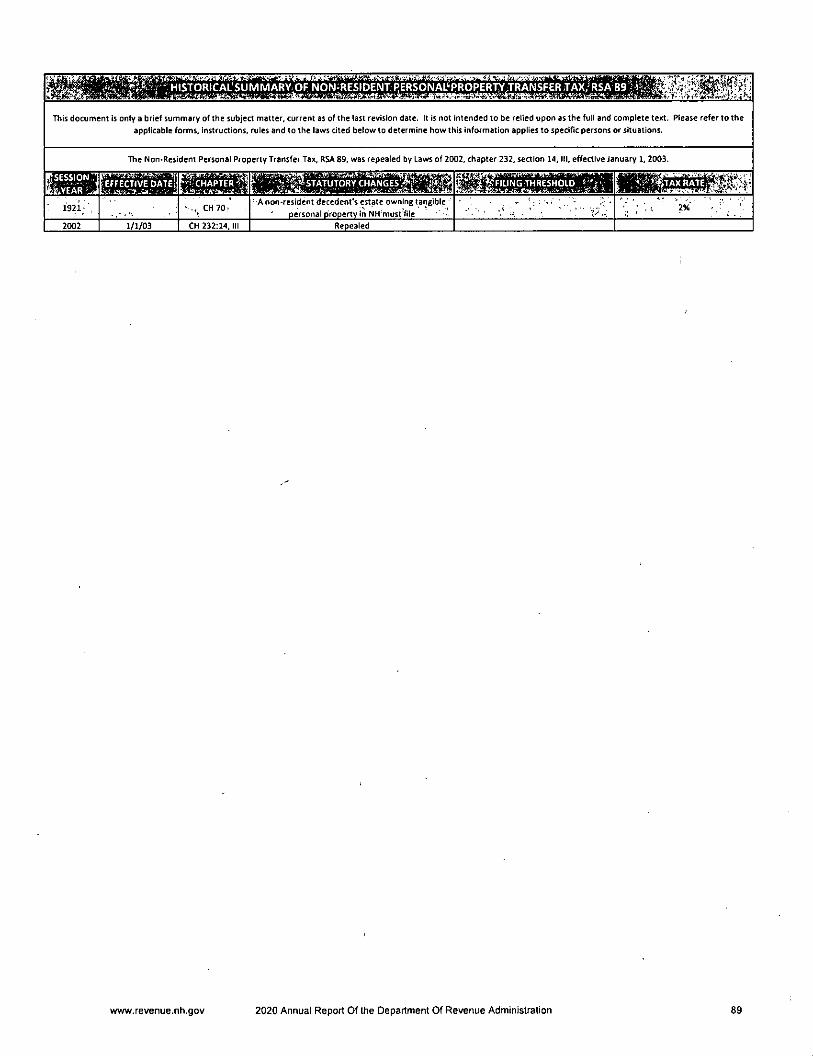
ewsRs MM
This document is only a brief summary of the subject matter, current as of the last revision date. It is not intended to be relied upon as the full and complete text. Please refer to the
applicable forms, instructions, rules and to the laws cited below to determine how this information applies to specific persons or situations.
The Non-Resident Personal Property Transfer Tax, RSA 89, was repealed by Laws of 2002, chapter 232, section 14, III, effective January 1, 2003.
1921 CH 70.A non-resident decedent's estate owning tangible
personal property in NH'must file-■ ; 2*' '
2002 1/1/03 CH 232:14, III Repealed
www.revenue.nh.gov 2020 Annual Report Of Ihe Department Of Revenue Administration 89
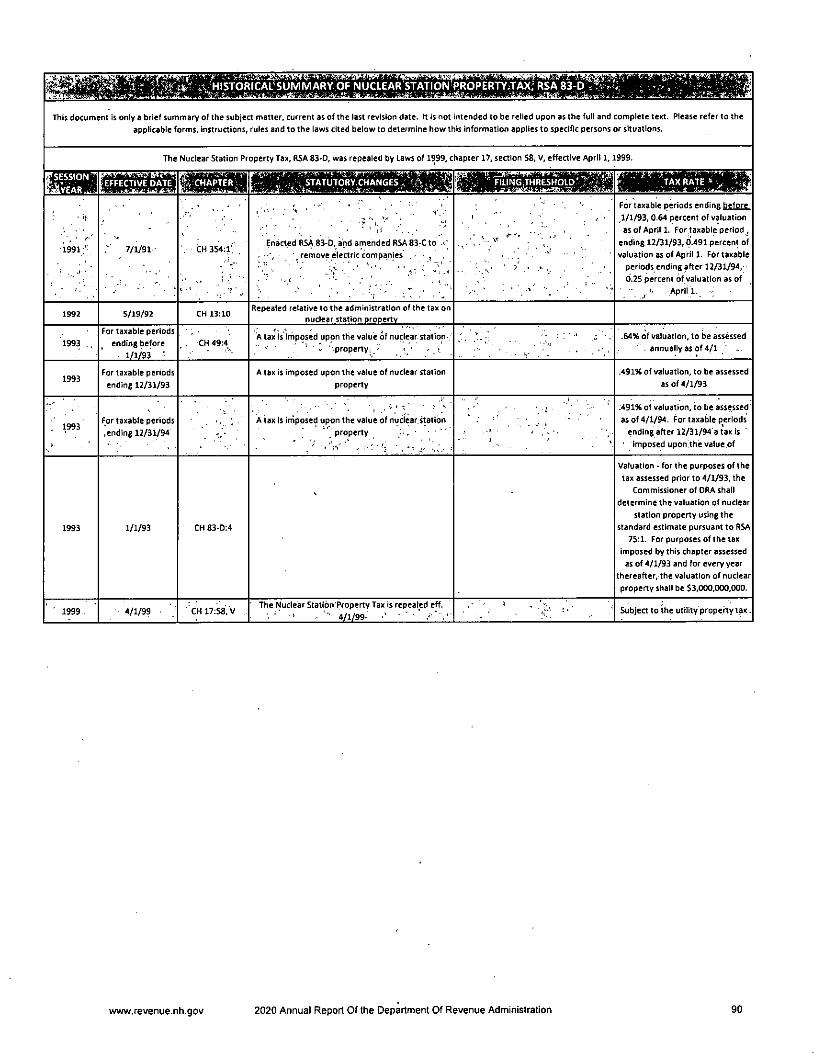
1*.^ IV HISTORICAL^SUMMARY OF NUCLEAR STATION PROPERTY,.TAX; RSA 83-D >
This document is only a brief summary of the subject matter, current as of the last revision date. It is not intended to be relied upon as the full and complete text. Please refer to the
applicable forms, instructions, rules and to the laws cited below to determine how this information applies to specific persons or situations.
The Nuclear Station Property Tax, RSA 83-D, was repealed by Laws of 1999, clapter 17, section 58, V, effeaive April 1, 999.
gum ' FILINGjTHReSHOp'T^^^
' ' '''
'1991;' ,
1 ■ ''
7/1/91' • CH 354;i;'.
■ ■
''' •
-V. ' - " "
Enacted RSA 83-D, and amended RSA83-C to ''
: , • remove electric companies ,
1 '* • , .
V. ■ •
. •; ■ " • r. ■ -
For taxable periods ending before
,1/1/93,0.64 percent of valuationas of April 1. For taxable period ,
ending 12/31/93,0.491 percent ofvaluation as of April 1. For taxable
periods ending after 12/31/94,-
0.25 percent of valuation as of
April 1,
1992 5/19/92 CH 13:10Repealed relative to the administration of the tax on
nuclear station orooertv
1993 ,,'
For Uxabie periods
ending before
• 1/1/93 '
. CH 49:4A tax isirhposed upon the value of nuclear station-
■ V '.property;' • . ■ ' 1. ■
.64% of valuation, to be assessed
. annuallyasof4/l ' -
1993For taxable periods
ending 12/31/93
A tax is imposed upon the value of nuclear station
property
.491% of valuation, to be assessed
as of 4/1/93
; 1993For taxable periods
.ending 12/31/94
'v- •
A tax is irnposed upon the value of nuclear, station
■" property i'. ■. ' s,',. -
.491% of valuation, to be assessedas of 4/1/94. For taxable periods
ending after 12/31/94'a tax Is' imposed upon the value of
1993 1/1/93 CH 83-0:4
••
Valuation • for the purposes of thetax assessed prior to 4/1/93, the
Commissioner of DRA shall
determine the valuation of nuclearstation property using the
standard estimate pursuant to RSA75:1. For purposes of the tax
imposed by this chapter assessedas of 4/1/93 and for every year
thereafter, the valuation of nuclearproperty shall be $3,000,000,000.
' 1999 ■ 4/1/9? • CH 17:58, VThe Nuclear Station Property Tax is repealed eff.
• ■ • > . ' ' 4/1/99-' •' Subject to the utility property tax.
www.revenue.nh.gov 2020 Annual Report Of the Department Of Revenue Administration 90
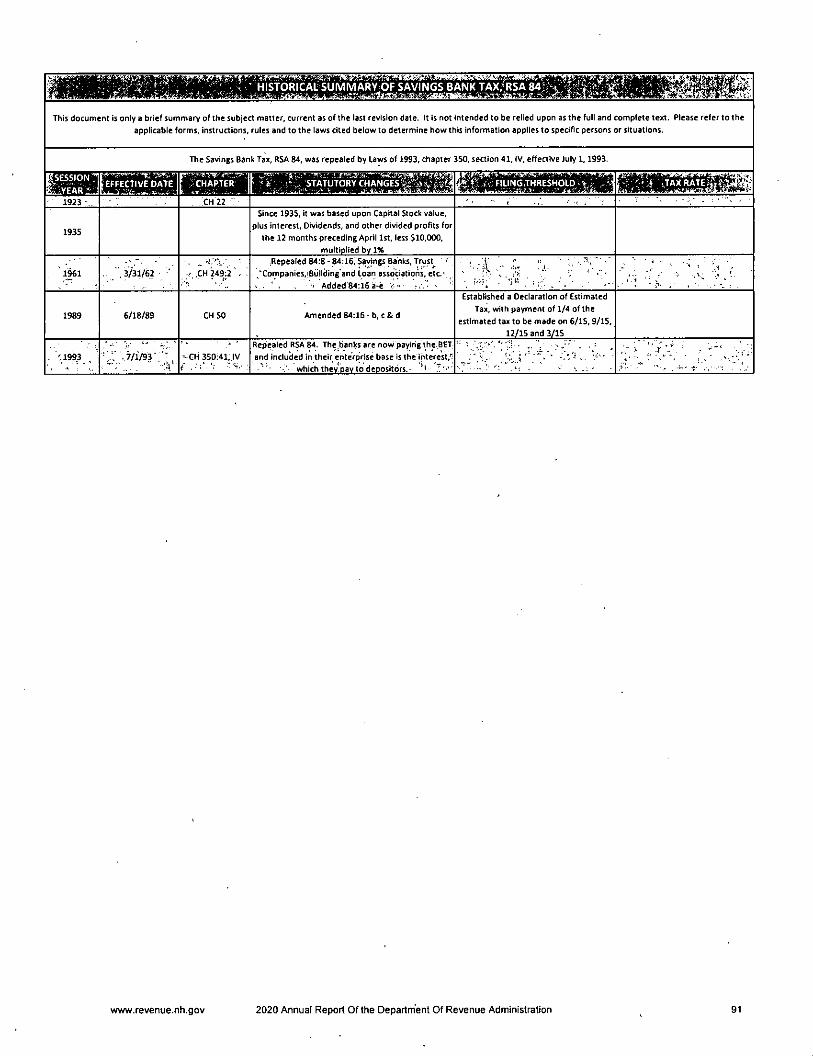
This document Is only a brief summary of the subject matter, current as of the last revision date, it is not intended to be reiied upon as the fuli and complete text. Please refer to the
applicable forms, instructions, rules and to the laws cited below to determine how this information applies to specific persons or situations.
The Savings Bank Tax, ftSA 84, was repealed by Laws of 1993, chapter 3S0, section 41, IV, effective July 1,1993.
1923 - , CH 22 . : ••-. . •
•
1935
Since 1935, it was based upon Capital Stock value,
plus interest. Dividends, and other divided profits for
the 12 months preceding April 1st, less 510,000,multiplied by 1%
1961 . ' ,3/31/62 ■• . .. ■
,CH 249:2 '. ̂.Repealed 84:8 - 84:161 Savings Banks, Trust
,'Companies,iBuliding'and loan associations, etc- . ' . ■' Added 84:16 a-e • . ' J .
1989 6/18/89 CH 50 Amended 84:16 - b, c & d
Established a Declaration of EstimatedTax, with payment of 1/4 of the
estimated tax to be made on 6/15,9/15,12/15 and 3/lS
- '.1993 . i
. . .
. •• I.' -
^GH 350:41, IV'r.- '
Repealed RSA 84. The.banks are now payirig the BETand included in their enterprise base is the interest,"
• which thev pay to depositors.-
:: . • •• :.- ■
www.revenue.nh.gov 2020 Annual Report Of the Department Of Revenue Administration 91
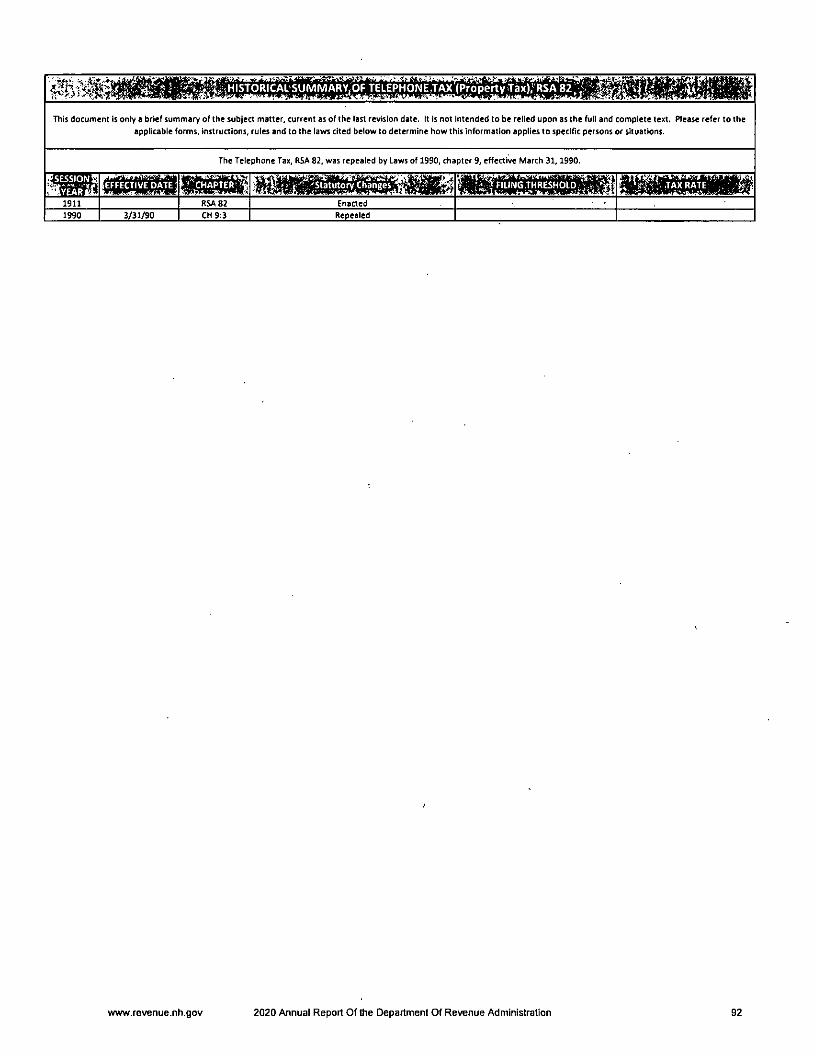
This document is onty 8 brief summary of the subject matter, current as of the last revision date. It Is not Intended to be relied upon as the full and complete text. Please refer to the
applicable forms, instructions, rules and to the laws cited below to determine how this Information applies to specific persons or situations.
The Telephone Tax, RSA 82, was repealed by Laws of 1990, chapter 9, effective March 31,1990.
<p«inM
11911 RSA 82 i Enacted
1990 3/31/90 CH9:3 1 Repealed
www.revenue.nh.gov 2020 Annual Report Of the Department Of Revenue Administration 92
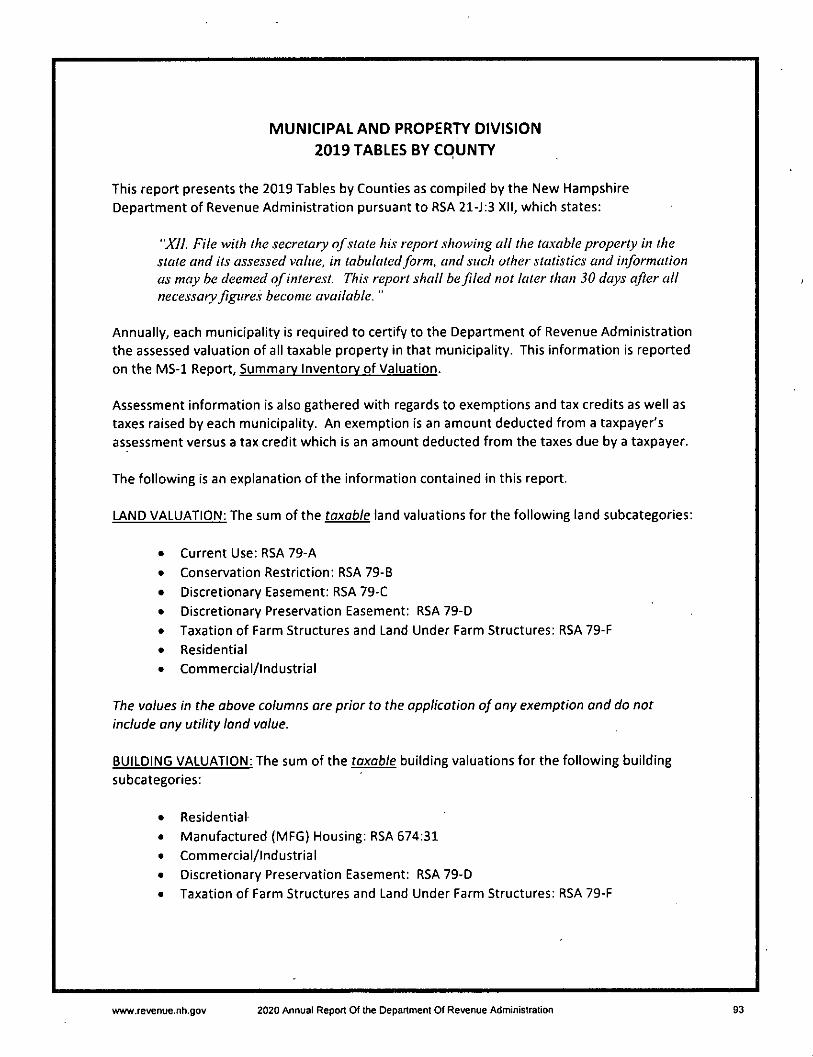
MUNICIPAL AND PROPERTY DIVISION
2019 TABLES BY COUNTY
This report presents the 2019 Tables by Counties as complied by the New HampshireDepartment of Revenue Administration pursuant to RSA 21-J:3 XII, which states:
"A7/. File with the secretary of state his report showing all the taxable property in thestate and its assessed value, in tabulated form, and such other statistics and informationas may be deemed ofinterest. This report shall be filed not later than 30 days after allnecessaryfigures become available."
Annually, each municipality is required to certify to the Department of Revenue Administrationthe assessed valuation of all taxable property in that municipality. This information is reported
on the MS-1 Report, Summarv Inventory of Valuation.
Assessment information is also gathered with regards to exemptions and tax credits as well astaxes raised by each municipality. An exemption Is an amount deducted from a taxpayer's
assessment versus a tax credit which is an amount deducted from the taxes due by a taxpayer.
The following is an explanation of the information contained in this report.
LAND VALUATION: The sum of the taxable land valuations for the following land subcategories:
Current Use: RSA 79-A
Conservation Restriction: RSA 79-B
Discretionary Easement: RSA 79-C
Discretionary Preservation Easement: RSA 79-D
Taxation of Farm Structures and Land Under Farm Structures: RSA 79-F
Residential
Commercial/Industrial
The values in the above columns are prior to the application of any exemption and do not
include any utility land value.
BUILDING VALUATION: The sum of the taxable building valuations for the following building
subcategories:
Residential
Manufactured (MFG) Housing: RSA 674:31
Commercial/Industrial
Discretionary Preservation Easement: RSA 79-D
Taxation of Farm Structures and Land Under Farm Structures: RSA 79-F
www.revenue.nh.gov 2020 Annual Report Of the Department Of Revenue Administration 93
The values in the above columns are prior to the application of any exemptions and do not
include any utility building value.
PUBLIC UTILITIES: The figure represents the sum of all utility values classified as PUBLIC WATER,GAS, ELECTRIC, OIL, PIPELINE or OTHER pursuant to RSA 83-F. OTHER utilities include utilitiesthat the Department of Revenue Administration has not appraised. Some examples of OTHER
utilities include hydro plants, water and certain gas companies.
MATURE WOOD & TIMBER: RSA 79:5
GROSS VALUATION: Gross valuation represents the valuation of all taxable property in each
municipality prior to adjustments for property tax exemptions.
EDUCATIONAL & SPECIAL EXEMPTIONS: The sum of the following exemptions granted:
• RSA 72:36-a, Certain Disabled Veterans
• RSA 72:37-a, Improvements to Assist Persons with Disabilities
• RSA 72:38-b, Improvements to Assist the Deaf
• RSA 72:23, IV, School Dining, Dormitory and Kitchen Exemption
(maximum $150,000 per property)
• RSA 72:12-a, Water & Air Pollution Control Facilities Exemption
MODIFIED ASSESSED VALUATION: Modified assessed valuation represents the sum of the gross
valuation minus the educational and special exemptions. The modified assessed valuation is the
basis for calculating the equalized values for each municipality.
LOCAL OPTIONAL EXEMPTIONS OR EXEMPTIONS WITH OPTIONAL ELEMENTS: Each municipality has
adopted an elderly exemption. The amount of the exemption and the specific criteria (asset andincome limits) to qualify are determined locally within statutory requirements. Each municipalitymay adopt the other exemptions listed below in this section:
RSA 72:37, Blind Exemption
RSA 72:37-b, Disabled Exemption
RSA 72;38-b, Deaf Ex^emptionRSA 72:39-a & b. Elderly Exemption
RSA 72:70, Wood-Heating Energy Systems Exemption
RSA 72:62, Solar Energy Systems Exemption
RSA 72:66, Wind-Powered Energy Systems Exemption
RSA 72:23, IV, Additional School Dining, Dormitory and Kitchen Exemption (amount
> $150,000 per property)
NET LOCAL ASSESSED VALUATION: Net local assessed valuation represents the sum of the
modified assessed valuation minus the value of the blind, elderly and local optional exemptions.
www.revenue.nh.gov 2020 Annual Report Of the Department Of Revenue Administration 94

GROSS PROPERTY TAXES: Gross Property taxes represent the sum of the net tax commitment
plus the veteran's tax credits. The Department of Revenue's Municipal Services Division
establishes the property tax rate using this figure.
LESS VETERANS TAX CREDITS: Veterans' tax credits represent the sum of tax credits granted
pursuant to RSA 72:28; 72:28-b; 72:28-c; 72:29-a; 72:32 and RSA 72:35.
NET TAX COMMITMENT: Net tax commitment represents the sum of gross property taxes
minus the sum of the veteran's tax credits. The amount a municipality must actually raise in
taxes equals the sum of the amount appropriated by the municipal legislative body minus any
revenues.
ACTUAL TAX RATE: The actual tax rate equals the sum of the municipal, county, local and state
school education tax rates. This tax rate does not include village district or precinct tax rates.V,
RESIDENTS TAX: Residents tax represents the sum of monies collected by a municipality for theResidents Tax pursuant to RSA 72:1.
COUNTY SUMMARY: The county summary represents the totals for each of the above listed
columns for all ten counties in the state. The county tax rate listed is the average county tax
rate and is calculated by taking the sum of the tax rates for all municipalities in a county anddividing by the number of municipalities.
EDUCATIONAL & SPECIAL EXEMPTIONS REPORT: This report provides a breakdown of the
educational and special exemptions granted by municipalities. These are not optional.
LOCAL OPTIONAL EXEMPTIONS REPORT: This report provides a breakdown of what each
municipality currently grants. These are optional and must be adopted by the legislative body ofthe municipality.
For further explanation about any information contained in this report, please contact the
Department of Revenue Administration, Municipal & Property Division at (603) 230-5950.
This document may be found on our web site at:
http://www.revenue.nh.gov/mun-prop/propertv/index.htm
www.revenue.nh.gov 2020 Annual Report Of the Department Of Revenue Administration 95
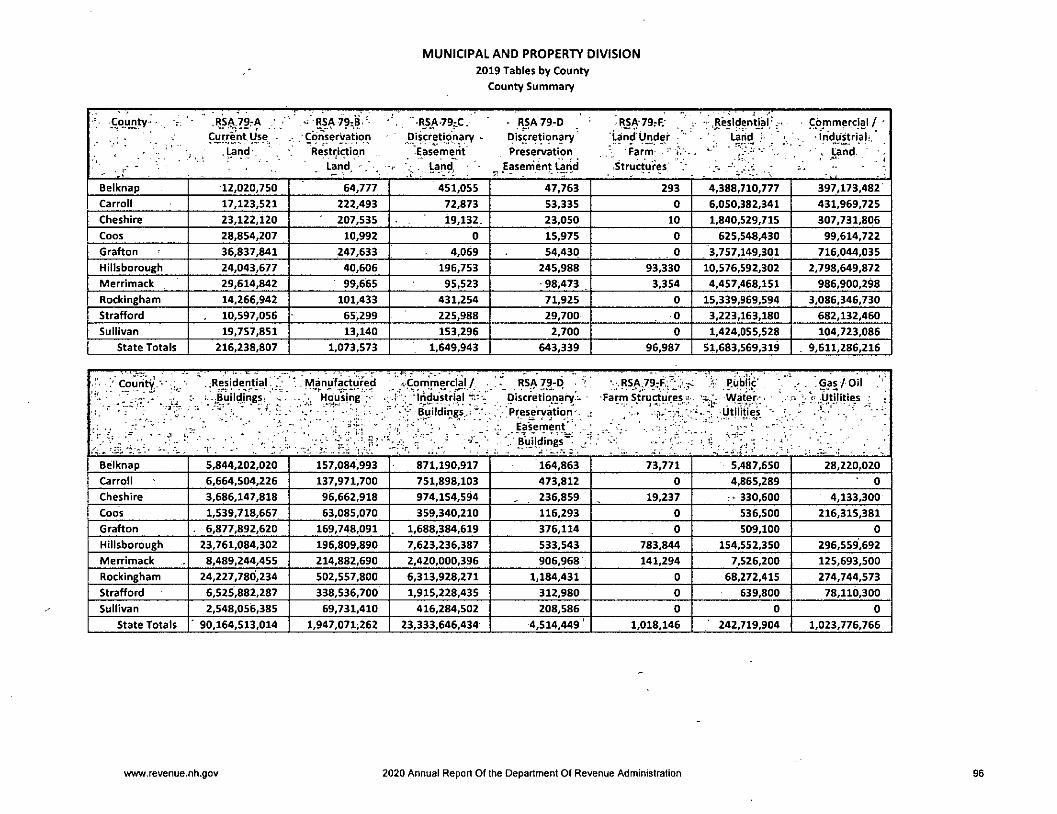
MUNICIPAL AND PROPERTY DIVISION
2019 Tables by County
County Summary
' Cq.ujity • , > ' .Rj5)^79.-A - RSA79.iB.'- - RSA79-D ' • RSA-79.-F; ' : -^Reslden'tja!;.- - Commercial/'- Discretionary Land Ujider Land ; - . industrial:
,Land'. , Restriction Easement Preservation Farm- , tand-
i" • < Land. . i- . Land, • Easerrient Land .Structures . '...-/i . • ■ -
Belknap 12,020.750 64,777 451,055 47,763 293 4,388,710,777 397,173,482
Carroll 17,123,521 222,493 72,873 53,335 0 6,050,382,341 431,969,725
Cheshire 23,122,120 207,535 19,132. 23,050 10 1,840,529,715 307,731,806
Coos 28,854,207 10,992 0 15,975 0 625,548,430 99,614,722
Grafton 36,837,841 247,633 4,069 54,430 0 3,757,149,301 716,044,035
Hillsborough 24,043,677 40,606 196,753 245,988 93,330 10,576,592,302 2,798,649.872
Merrimack 29,614,842 99,665 95,523 98,473 3,354 4,457,468,151 986,900,298
Rockingham 14,266,942 101,433 431,254 71,925 0 15,339,969,594 3,086,346,730
Strafford 10,597,056 65,299 225,988 29,700 0 3,223,163,180 682,132,460
Sullivan 19,757,851 13,140 153,296 2,700 0 1,424,055,528 104,723,086
State Totals 216,238,807 1,073.573 1,649,943 643,339 96,987 51,683,569,319 . 9,611,286,216
County."' ; .^Residential. ^.Manufactured ^.Comme/cial/, RSA79-p'■- - iBuildingS: Housing;- Industrial . Discretionary
' ' 4 ' r ''C. ,' ^ -y Buildings,.: .. Preservationy; ... 'y- ' " ' . f"- -". '. '' .rt' '
I. i:." '^r B'ujidings'-
VP-Ublic Gas/Oil^ • -Farm Strurtures/--- -i.'- VVatW ; - . r. _,Utnitie_s ;
Belknap 5,844,202,020 157,084,993 871.190,917 164,863 73,771 5,487,650 28,220,020Carroll 6,664,504,226 137,971,700 751,898,103 473,812 0 4,865,289 0
Cheshire 3,686,147,818 96,662,918 974,154,594 236,859 19,237 - 330,600 4,133,300Coos 1,539,718,667 63,085,070 359,340,210 116,293 0 536,500 216,315,381Grafton . 6,877,892,620 169,748,091 . 1,688,384,619 376,114 0 509,100 0
Hillsborough 23,761,084,302 196,809,890 7,623,236,387 533,543 783,844 154,552,350 296,559,692Merrimack 8,489,244,455 214,882,690 2,420,000,396 906,968 141,294 7,526,200 125,693,500Rockingham 24,227,780,234 502,557,800 6,313,928,271 1,184,431 0 68,272,415 274,744,573Strafford 6,525,882,287 338,536,700 1,915,228,435 312,980 0 639,800 78,110,300Sullivan 2,548,056,385 69,731,410 416,284,502 208,586 0 0 0
State Totals ' 90,164,513,014 l,947,071i262 23,333,646,434 4,514,449 ' 1,018,146 242,719,904 1,023,776,766
www.revenue.nh.gov 2020 Annual Report Of the Department Of Revenue Administration 96
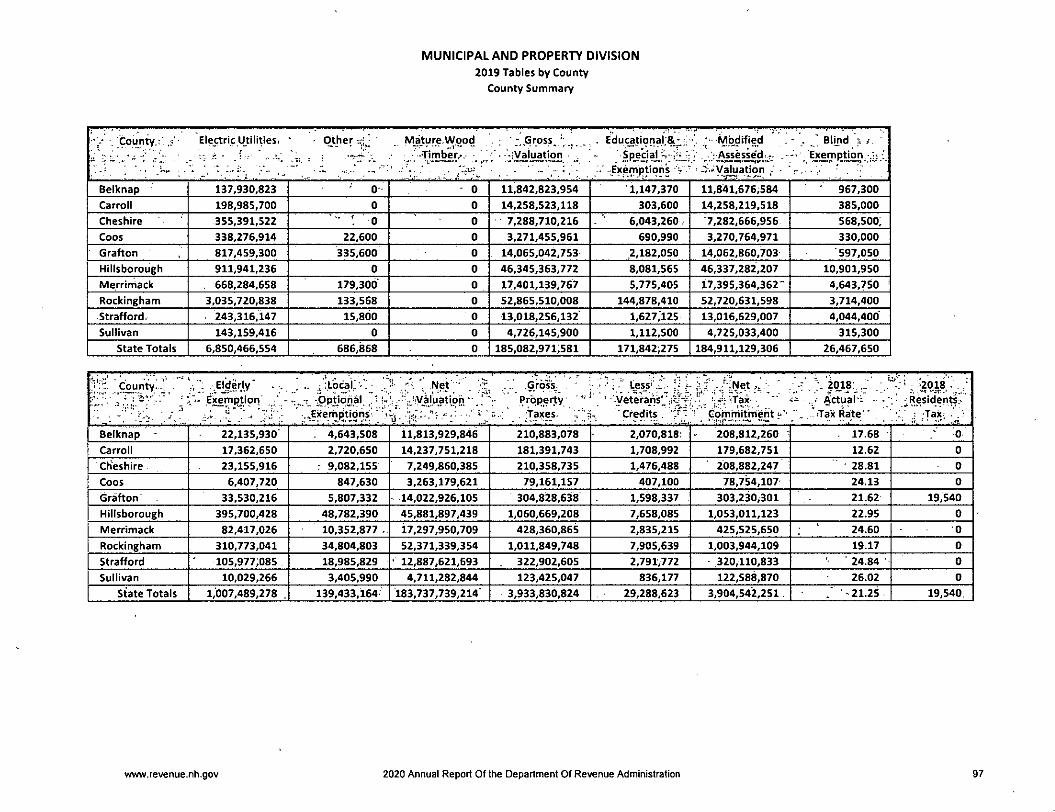
MUNICIPAL AND PROPERTY DIVISION
2019 Tables by County
County Summary
■/ . County.?! Electric Utilitiesi • Other -4^ Mature.W.ood•Tirnber/^.- -
' :_Gross. ^ . Educational:8i:,i!' Special
• Exemptions 'V
-ModifiedAssesse'd---
->■>'Valuation •
- . ' Blind r-Exgrnption -.T: -!
Belknap 137,930,823 0 - 0 11,842,823,954 1,147,370 11,841,676,584 ' 967,300
Carroll 198,985,700 0 0 14,258,523,118 303,600 14,258,219,518 385,000
Cheshire 355,391,522 ■■ : 0 0 7,288,710,216 6,043,260. 7,282,666,956 568,500:Coos 338,276,914 22,600 0 3,271,455,961 690,990 3,270,764,971 330,000Grafton 817,459,300 335,600 0 14,065,042.753 .2,182,050 14,062,860,703 597,050Hillsborough 911,941,236 0 0 46,345,363,772 8,081,565 46,337,282,207 10,901,950Merrirhack . 668,284,658 179,300 0 17,401,139,767 5,775,405 17,395,364,362 4,643,750Rockingham 3,035,720,838 133,568 0 52,865,510,008 144,878,410 52,720,631,598 3,714,400.Strafford. 243,316,147 15,800 0 13,018,256,132 1,627,125 13,016,629,007 4,044,400Sullivan 143,159,416 0 0 4,726,145,900 1,112,500 4,725,033,400 315,300
State Totals 6,850,466,554 686,868 0 185,082,971,581 171,842,275 184,911,129,306 26,467,650-
•Elderly'Ekemptior)' / •, li " I" _
o i iLocaK-OpXidnal .* t-
...Exernptigns ' >
Net'--"',: ::^'!V_i|uatipn
.Grbsi. .Property ' *
r../" .Taxes-
Less''!.- .1/'•yeterans'_';;c:'f
Credits. '7"
j? -!'"- •■'-!Neti;'- ;v'''. '--r: Tax-
Gommi^ent j-"'
^ ••• -:• Actual i -- •
' , Tax Rate ".
: '2018 :,;, ! ^Residente:-
Belknap 22,135,930 : 4,643,508 11,813,929,846 210,883,078 2,070,818? 208,812,260 . 17.68 • .' 0
Carroll 17,362,650 2,720,650 14,237,751,218 181,391,743 1,708,992 179,682,751 12.62 0
Cheshire 23,155,916 ; 9,082,155 7,249,860,385 210,358,735 1,476,488 208,882,247 28.81 0
Coos 6,407.720 847,630 3,263,179,621 79,161,157 407,100 78,754,107 24.13 0
Grafton 33,530,216 5,807,332 14,022,926,105 304,828,638 1,598,337 303,230,301 21.62 19,540
Hillsborough 395,700,428 48,782.390 45.881,897,439 1,060,669,208 7,658,085 1,053,011,123 22.95 0
Merrimack 82,417,026 10,352,877, 17,297,950,709 428,360,865 2,835,215 425,525,650 24.60 0
Rockingham 310,773,041 34,804,803 52,371,339,354 1,011,849,748 7,905,639 1,003,944,109 19.17 0
Strafford 105,977,085 . 18,985,829 - 12,887,621,693 322,902,605 2,791,772 320,110,833 ■ 24.84 • 0
Sullivan 10,029,266 3,405,990 4,711,282,844 123,425.047 836,177 122,588,870 26.02 0
State Totals 1,007,489,278 . 139,433,164 183,737,739,214' 3,933,830,824 29,288,623 3,904,542,251 -21.25 19,540
www.revenue.nh.gov 2020 Annual Report Of the Department Of Revenue Administration 97
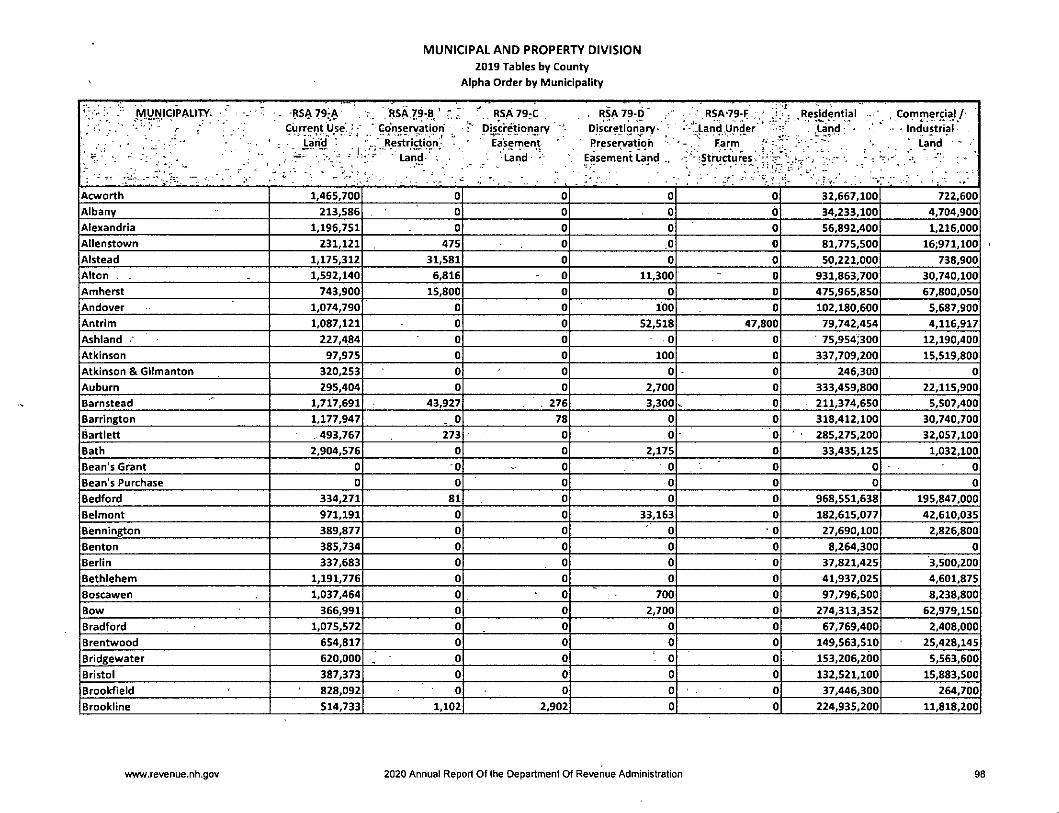
MUNICIPAL AND PROPERTY DIVISION
2019 Tables by County
Alpha Order by Municipality
MUNICrPALITY. •' . V ^ ' .• / , . ' ,
- RSA 79:A
Current Use; ,-
. , RSA 79-B ' :" Co'nservatioh
RSA79:C ,
plscretionary '. RSA79-b"
Discretioriary-
, ■ .RSA*79-f;'-;.' .Residential . "•'•tUndUnder' -•=' .Land: -
, Commercial /■" ■ Industrial
Larid ■ " Restriction'v Easement Preservatioh : Farm r Land • - •'
•' r. . • ■■ 1 " ' Land- Land ■ Easement Land .. •"■-•Structures. " T.-' '.r - . ■
^
.. .
. - • » . V:-V ■ ; 1- ■ ^ 1 . '
Acworth 1,465,700 0 0 0 0 32,667,100 722,600Albany 213,586 . • 0 0 0 0 34,233,100 4,704,900Alexandria 1.196,751 0 0 0 0 56,892,400 1,216,000Atlenstown 231,121 475 0 .0 0 81,775,500 16;971,100Alstead 1,175,312 31,581 0 0 0 50,221,000 738,900Alton . . 1,592,140 6,816 0 11,300 0 931,863,700 30,740,100Amherst 743,900 15,800 0 0 0 475,965,850 67,800,050Andover 1,074,790 0 0 100 0 102,180,600 5,687,900Antrim 1,087,121 0 0 52,518 47,800 79,742,454 4,116,917Ashland 227,484 0 0 0 0 75,954:300 12,190,400Atkinson 97,975 0 0 100 0 337,709.200 15,519,800Atkinson & Gilmanton 320,253 0 0 0 0 246,300 0
Auburn 295,404 0 0 2,700 0 333,459,800 22,115,900Barnstead 1,717,691 43,927 . 276 3,300 0 211,374,650 5,507,400Barrington 1,177,947 . 0 78 0 0 318,412,100 30,740,700Bartiett . 493,767 273 0 0 0 285,275,200 32,057,100Bath 2,904,576 0 0 2,175 0 33,435,125 1,032,100Bean's Gt^ant 0 -0 0 0 0 0 0
Bean's Purchase 0 0 0 0 0 0 0
Bedford 334,271 81 0 0 0 968,551,638 195,847,000Beimont 971,191 0 0 33,163 0 182,615,077 42,610,035Bennington 389,877 0 0 0 ' 0 27,690,100 2,826,800
Benton 385,734 0 0 0 0 8,264,300 0
Berlin 337,683 0 0 0 0 37,821,425 3,500,200Bethlehem 1,191,776 0 0 0 0 41,937,025 4,601,875Boscawen 1,037,464 0 0 700 0 97,796,500 8,238,800Bow 366,991 0 0 2,700 0 274,313,352 62,979,150
Bradford 1,075,572 0 0 0 0 67,769,400 2,408,000Brentwood 654,817 0 0 0 0 149,563,510 25,428,145Bridgewater 620,000 0 0 0 0 153,206,200 5,563,600Bristol 387,373 0 0 0 0 132,521,100 15,883,500
Brookfleld 828,092 0 0 b 0 37,446,300 264,700Brookiine 514,733 1,102 2,902 0 0 224,935,200 11,818,200
www.revenue.nh.gov 2020 Annual Report Of the Department Of Revenue Administration 98
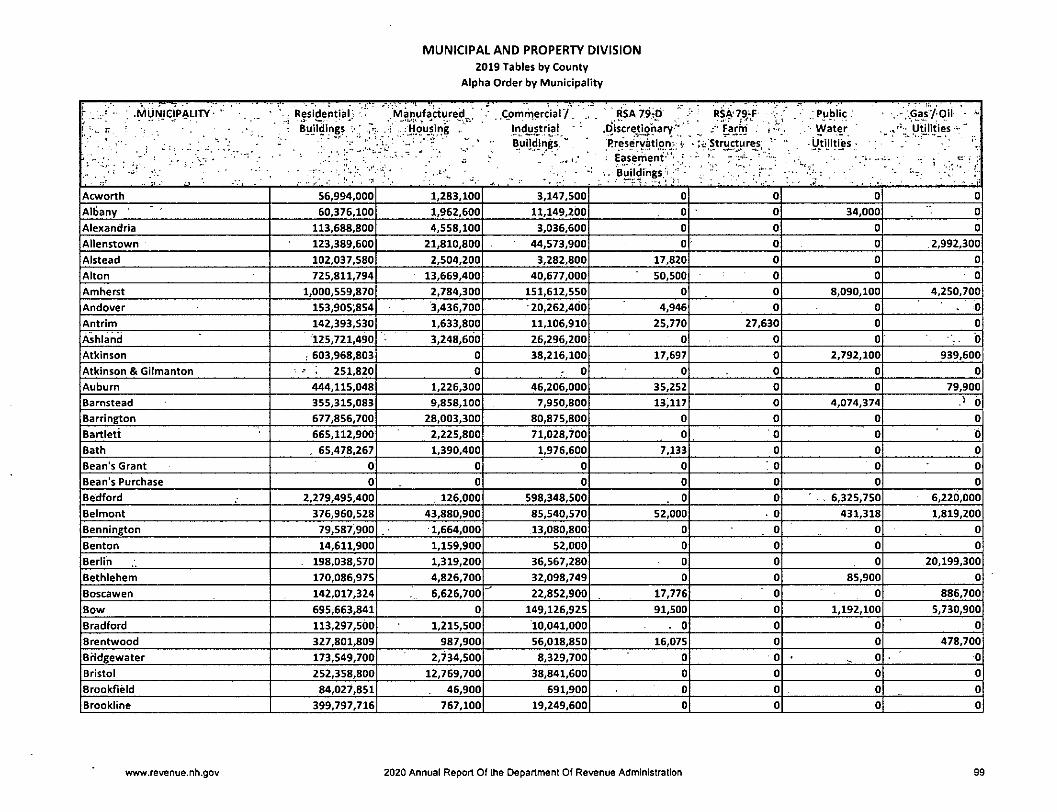
MUNICIPAL AND PROPERTY DIVISION
2019 Tables by County
Alpha Order by Municipality
■ ; .MIJNICl'pALITY - " . .. • ■ ; ResidentjaL ■r • r • Buildings ■ ";• .
-■ .... r--iiL
.Manufactured,^, Commerciar/. .. . RSA79tP T ' PSA'79^-P v.' . . Pubi'9 ' ^; . :Housir)g . Indurtrial .Discretionary-"' Farm . 1-'" . . Water " Ubiities • "
Buildings ~ ' Preservation-i- • ti; Stri^ctures, -Utilitjes- ; "" • Easement'-"- ,; -- •_ .. .
: . BuJJdings.\-" - - f".' -r- ' l'
Acworth 56,994,000 1,283,100 3,147,500 0 0 0 0
Albany 60,376,100 1,962,600 11,149,200 0 0 34,000 0
Alexandria 113,688,800 4,558,100 3,036,600 0 0 0 0
Allenstown 123,389,600 21,810,800 44,573,900 0 0 0 2,992,300
Alstead 102,037,580 2,504,200 3,282,800 17,820 0 0 0
Alton 725,811,794 13,669,400 40,677,000 ■ 50,500 0 0 0
Amherst 1,000,559,870 2,784,300 151,612,550 0 0 8,090,100 4,250,700Andover 153,905;854 3,436,700 20,262,400 4,946 0 0 ^ 0
Antrim 142,393,530 1,633,800 11,106,910 25,770 27,630 0 0
Ashland 125,721,490 3,248,600 26,296,200 0 0 0 .. 0
Atkinson . 603,968,803 0 38,216,100 17,697 0 2,792,100 939,600Atkinson & Gilmanton ; 251,820 0 r 0 0 0 0 0
Auburn 444,115,048 1,226,300 46,206,000 35,252 0 0 79,900Barnstead 355,315,083 9,858,100 7,950,800 13;il7 0 4,074,374 0
Barrington 677,856,700 28,003,300 80,875,800 0 0 0 0
Bartlett 665,112,900 2,225,800 71,028,700 0 0 0 0
Bath . 65,478,267 1,390,400 1,976,600 7,133 0 0 0
Bean's Grant 0 0 0 0 : 0 0 0
Bean's Purchase 0 0 0 0 0 0 0
Bedford 2,279,495,400 126,000 598,348,500 . 0 0 . . 6,325,750 6,220,000
Belmont 376,960,528 43,880,900 85,540,570 52,000 ■ 0 431,318 1,819,200Benningtoh 79,587,900 1,664,000 13,080,800 0 0 0 0
Benton 14,611,900 1,159,900 52,000 0 0 0 0
Berlin 198,038,570 1,319,200 36,567,280 0 0 0 20,199,300
Bethlehem 170,086,975 4,826,700 32,098,749 0 0 85,900 0
Boscawen 142,017,324 6,626,700 22,852,900 17,776 0 0 886,700
Bow 695,663,841 0 149,126,925 91,500 0 1,192,100 5,730,900
Bradford 113,297,500 1,215,500 10,041,000 . 0 0 0 0
Brentwood 327,801,809 987,900 56,018,850 16,075 0 0 478,700
Bridgewater 173,549,700 2,734,500 8,329,700 0 0 0 0
Bristol 252,358,800 12,769,700 38,841,600 0 0 0 0
Brookfleld 84,027,851 46,900 691,900 0 0 0 0
Brookline 399,797,716 767,100 19,249,600 0 0 0 0
www.revenue.nh.gov 2020 Annual Report Of the Department Of Revenue Administration 99
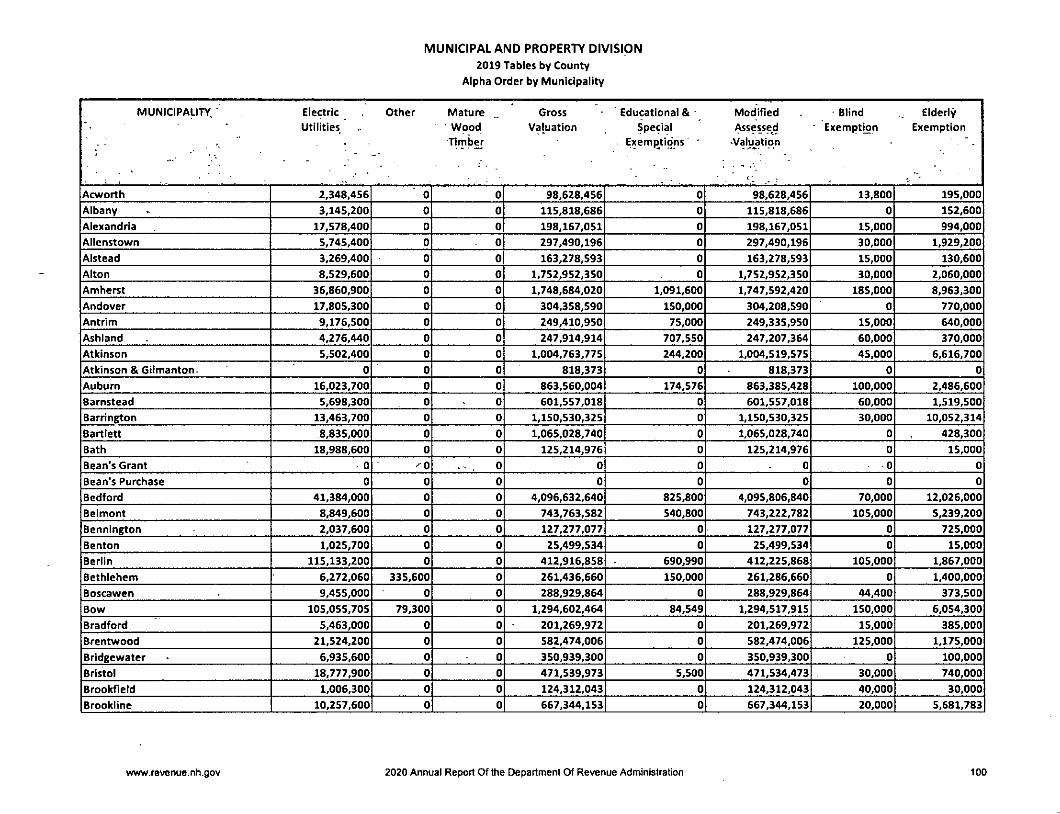
MUNICIPAL AND PROPERTY DIVISION
2019 Tables by County
Alpha Order by Municipality
MUNICIPALITY. ' Electric Other Mature Gross Educationai & Modified ' Blind Elderly
'• Utilities ' Wood Valuation Special Assessed ' Exemption Exemption
•
-•
Tlmb^ . Exemiitiqns •Vaiu^atiqn
Acworth 2,348,456 0 0 98,628,456 0 98,628,456 13,800 195,000
Albany 3,145,200 0 0 115,818,686 0 115,818,686 0 152,600
Alexandria 17,578,400 0 0 198,167,051 0 198,167,051 15,000 994,000
Allenstown 5,745,400 0 0 297,490,196 0 297,490,196 30,000 1,929,200
Alstead 3,269,400 0 0 163,278,593 0 163,278,593 15,000 130,600
Alton 8,529,600 0 0 1,752,952,350 0 1,752,952,350 30,000 2,060,000
Amherst 36,860,900 0 0 1,748,684,020 1,091,600 1,747,592,420 185,000 8,963,300
Andover 17,805,300 0 0 304,358,590 150,000 304,208,590 0 770,000
Antrim 9,176,500 0 0 249,410,950 75,000 249,335,950 15,000 640,000
Ashland 4,276,440 0 0 247,914,914 707,550 247,207,364 60,000 370,000
Atkinson 5,502,400 0 0 1,004,763,775 244,200 1,004,519,575 45,000 6,616,700
Atkinson & Gilmanton- 0 0 0 818,373 0 818,373 0 0
Auburn 16,023,700 0 0 863,560,004 174,576 863,385,428 100,000 2,486,600
Barnstead 5,698,300 0 0 601,557,018 0 601,557,018 60,000 1,519,500
Barrington 13,463,700 0 0 1,150,530,325 0 1,150,530,325 30,000 10,052,314
Bartlett 8,835,000 0 0 1,065,028,740 0 1,065,028,740 0 428,300
Bath 18,988,600 0 0 125,214,976 0 125,214,976 0 15,000
Bean's Grant - 0 ^0 0 0 0 0 0 0
Bean's Purchase 0 0 0 0 0 0 0 0
Bedford 41,384,000 0 0 4,096,632,640 825,800 4,095,806,840 70,000 12,026,000
Belmont 8,849,600 0 0 743,763,582 540,800 743,222,782 105,000 5,239,200
Bennington 2,037,600 0 0 127,277,077 0 127,277,077 0 725,000
Benton 1,025,700 0 0 25,499,534 0 25,499,534 0 15,000
Berlin 115,133,200 0 0 412,916,858 690,990 412,225,868 105,000 1,867,000
Bethlehem 6,272,060 335,600 0 261,436,660 150,000 261,286,660 0 1,400,000
Boscawen 9,455,000 0 0 288,929,864 0 288,929,864 44,400 373,500
Bow 105,055,705 79,300 0 1,294,602,464 84,549 1,294,517,915 150,000 6,054,300
Bradford 5,463,000 0 0 201,269,972 0 201,269,972 15,000 385,000
Brentwood 21,524,200 0 0 582,474,006 0 582,474,006 125,000 1,175,000
Bridgewater 6,935,600 0 0 350,939,300 0 350,939,300 0 100,000
Bristol 18,777,900 0 0 471,539,973 5,500 471,534,473 30,000 740,000
Brookfield 1,006,300 0 0 124,312,043 0 124,312,043 40,000 30,000
Brookline 10,257,600 0 0 667,344,153 0 667,344,153 20,000 5,681,783
VAvw.revenue.nh.gov 2020 Annual Report Of the Department Of Revenue Administration too
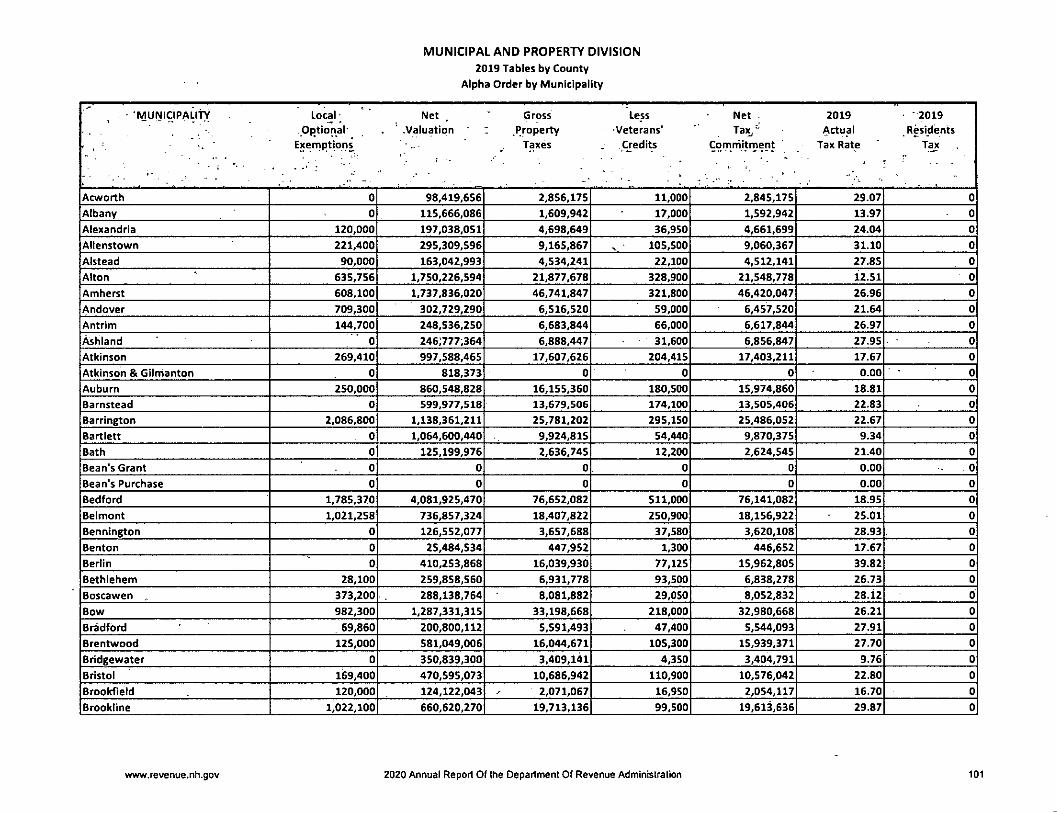
MUNICIPAL AND PROPERTY DIVISION
2019 Tables by County
Alpha Order by Municipality
• MtJNiCIPALiiY Local - Net Gross Less Net 2019 •2019
.Optional' .Valuation : .Property " Veterans' Tax.' Actual Residents
■
Exernptipns Taxes . C.redits Comrriitment ' Tax Rate Tax
Acworth 0 98,419,656 2,856,175 11,000 2,845,175 29.07 0
Albany 0 115,666,086 1,609,942 17,000 1,592,942 13.97 0
Alexandria 120,000 197,038,051 4,698,649 36,950 4,661,699 24.04 0
Allenstown 221,400 295,309,596 9,165,867 105,500 9,060,367 31.10 0
Alstead 90,000 163,042,993 4,534,241 22,100 4,512,141 27.85 0
Alton 635,756 1,750,226,594 21,877,678 328,900 21,548,778 12.51 0
Amherst 608,100 1,737,836,020 46,741,847 321,800 46,420,047 26.96 0
Andover 709,300 302,729,290 6,516,520 59,000 6,457,520 21.64 0
Antrim 144,700 248,536,250 6,683,844 66,000 6,617,844 26.97 0
Ashland 0 246;777;364 6,888,447 31,600 6,856,847 27.95 0
Atkinson 269,410 997,588,465 17,607,626 204,415 17,403,211 17.67 0
Atkinson & Gilnianton 0 818,373 0 0 0 0.00 0
Auburn 250,000 860,548,828 16,155,360 180,500 15,974,860 18.81 0
Barnstead 0 599,977,518 13,679,506 174,100 13,505,406 22.83 0
Barrington 2,086,800 1,138,361,211 25,781,202 295,150 25,486,052 22.67 0
Bartlett 0 1,064,600,440 9,924,815 54,440 9,870,375 9.34 0
Bath 0 125,199,976 2,636,745 12,200 2,624,545 21.40 0
Bean's Grant 0 0 0 0 0 0.00 0
Bean's Purchase 0 0 0 0 0 0.00 0
Bedford 1,785.370 4,081,925,470 76,652,082 511,000 76,141,082 18.95 0
Belmont 1,021,258 736,857,324 18,407,822 250,900 18,156,922 25.01 0
Bennington 0 126,552,077 3,657,688 37,580 3,620,108 28.93 0
Benton 0 25,484,534 447,952 1,300 446,652 17.67 0
Berlin 0 410,253,868 16,039,930 77,125 15,962,805 39.82 0
Bethlehem 28,100 259,858.560 6,931,778 93,500 6,838,278 26.73 0
Boscawen , 373,200 288,138,764 8,081,882 29,050 8,052,832 28.12 0
Bow 982,300 1,287,331,315 33,198,668 218,000 32,980,668 26.21 0
Bradford 69,860 200,800,112 5,591,493 47,400 5,544,093 27.91 0
Brentwood 125,000 581,049,006 16,044,671 105,300 15,939,371 27.70 0
Bridgewater 0 350,839,300 3,409,141 4,350 3,404,791 9.76 0
Bristol 169,400 470,595,073 10,686,942 110,900 10,576,042 22.80 0
Brookfieid 120,000 124,122,043 2,071,067 16,950 2,054,117 16.70 0
Brookline 1,022,100 660,620,270 19,713,136 99,500 19,613,636 29.87 0
www.fevenue.nh.gov 2020 Annual Report Of the Department Of Revenue Administration 101
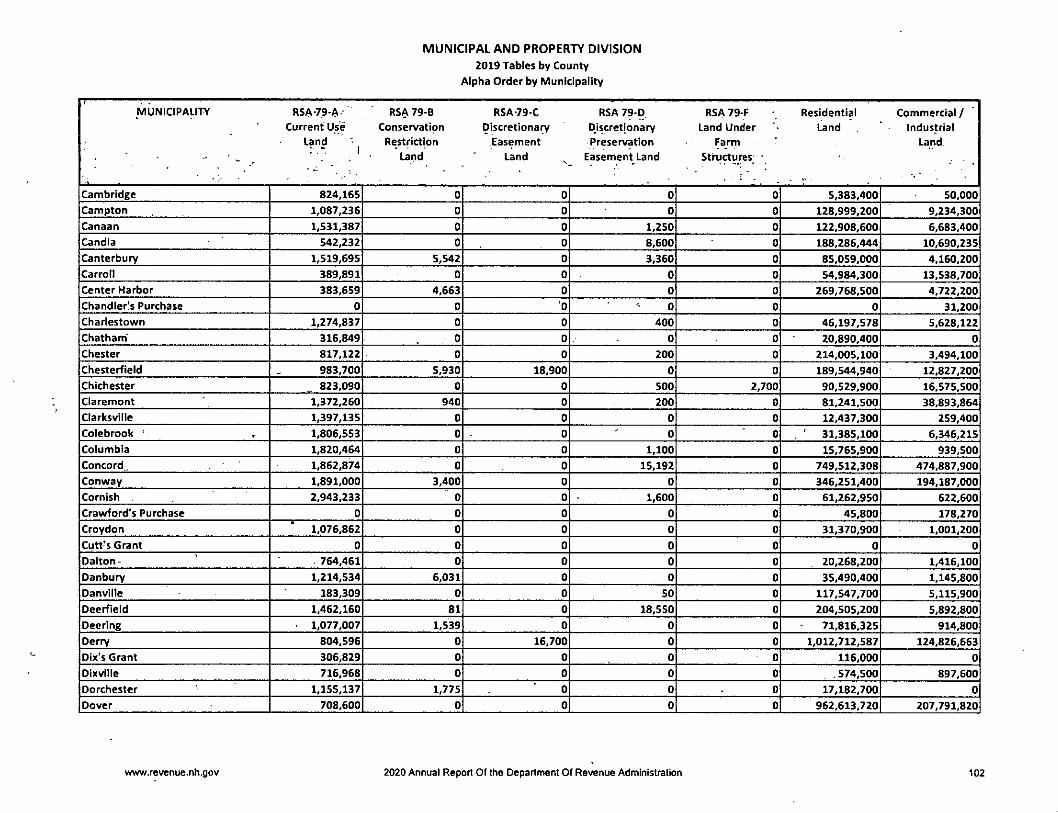
MUNICIPAL AND PROPERTY DIVISION
2019 Tables by County
Alpha Order by Municipality
MUNICIPALITY RSA-79-A RSA 79-B RSA-79-C RSA 79-D RSA 79 F Residential Commercial/Current Use Conservation Discretionary Discretionary Land Under l^nd Industrial
Land ' Restriction Easement Preservation Farm Land
Land Land Easement Land SthJCtures '
Cambridge 824,165 0 0 0 0 5,383,400 50,000
Campton 1,087,236 0 0 0 0 128,999,200 9,234,300
Canaan 1,531,387 0 0 1,250 0 122,908,600 6,683,400
Candia 542,232 0 0 8,600 0 188,286,444 10,690,235
Canterbury 1,519,695 5,542 0 3,360 0 85,059,000 4,160,200
Carroll 389,891 0 0 0 0 54,984,300 13,538,700
Center Harbor 383,659 4,663 0 0 0 269,768,500 4,722,200
Chandler's Purchase 0 0 0 0 0 0 31,200
Charlestown 1,274,837 0 0 400 0 46,197,578 5,628,122
Chatham' 316,849 0 0 0 0 20,890,400 0
Chester 817,122 0 0 200 0 214,005,100 3,494,100
Chesterfield 983,700 5,930 18,900 0 0 189,544.940 12,827,200
Chichester 823,090 0 0 500 2,700 90,529,900 16,575,500
Ciaremont 1,372,260 940 0 200 0 81,241,500 38,893,864
Clarksvilie 1,397,135 0 0 0 0 12,437,300 259,400
Colebrook ' 1,806,553 0 0 0 0 ' 31,385,100 6,346,215
Columbia 1,820,464 0 0 1,100 0 15,765,900 939,500
Concord,. 1,862,874 0 0 15,192 0 749,512,308 474,887,900
Conway 1,891,000 3,400 0 0 0 346,251,400 194,187,000
Cornish 2,943.233 0 0 1,600 0 61,262,950 622,600
Crawford's Purchase 0 0 0 0 0 45,800 178,270
Croydon 1,076,862 0 0 0 0 31,370,900 1,001,200
Cutt's Grant 0 0 0 0 0 0 0
Daiton- - 764,461 0 0 0 0 20,268,200 1,416,100
Danbury 1,214,534 6,031 0 0 0 35,490,400 1,145,800
Danville 183,309 0 0 50 0 117,547,700 5,115,900
Deerfield 1,462,160 81 0 18,550 0 204,505,200 5,892,800
Deering 1,077,007 1,539 0 0 0 71,816,325 914,800
Derry 804,596 0 16,700 0 0 1,012,712,587 124,826,663
Dix's Grant 306,829 0 0 0 0 116,000 0
Dixville 716,968 0 0 0 0 .574,500 897,600
Dorchester 1,155,137 1,775 0 0 0 17,182,700 0
Dover 708,600 0 0 0 0 962,613,720 207,791,820
www.revenue.nh.gov 2020 Annual Report Of the Department Of Revenue Administration 102
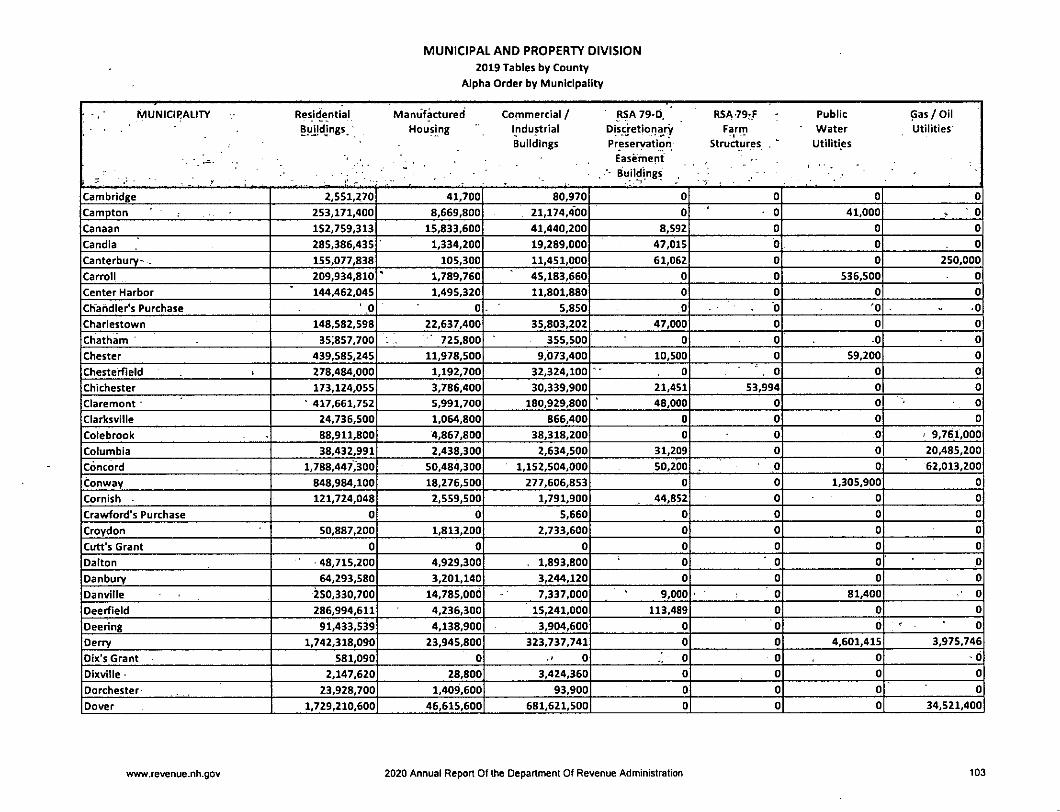
MUNICIPAL AND PROPERTY DIVISION
2019 Tables by County
Alpha Order by Municipality
MUNICIRALITY Residential Manufactured Commercial / ■ RSA 79-D. ' RSA79rF - Public Gas/OH
Buljdjngs, Housing Industrial Dlscjetion^ry Farm Water Utilities
Buildings Preservation Structures . ' Utilities
•. . ■ Easement
Buildings■
'
Cambridge 2,551,270 41,700 80,970 0 0 0 0
Campton ' 253,171,400 8,669,800 21,174,400 0 • 0 41,000 - 0
Canaan 152,759,313 15,833,600 41,440,200 8,592 0 0 0
Candia 285,386,435 1,334,200 19,289,000 47,015 b 0 0
Canterbury-- 155,077,838 105,300 11,451,000 61,062 0 0 250,000
Carroll 209,934,810 1,789,760 45,183,660 0 0 536,500 0
Center Harbor 144,462,045 1,495,320 11,801,880 0 0 0 0
Chandler's Purchase ' 0 0 5,850 0 - b '0 .0
Charlestown 148,582,598 22,637,400 35,803,202 47,000 0 0 0
Chatham 35)857,700 ■ 725,800 355,500 0 0 .0 0
Chester 439,585,245 11,978,500 9,073,400 10,500 0 59,200 0
Chesterfield t 278,484,000 1,192,700 32,324,100 , 0 . 0 0 0
Chichester 173,124,055 3,786,400 30,339,900 21,451 53,994 0 0
Claremont ' • 417,661,752 5,991,700 180,929,800 48,000 0 0 0
Clarksvllle 24,736,500 1,064,800 866,400 0 0 0 0
Colebrook 88,911,800 4,867,800 38,318,200 0 0 0 ' 9,761,000
Columbia 38,432,991 2,438,300 2,634,500 31,209 0 0 20,485,200
Concord 1,788,447,300 50,484,300 1,152,504,000 50,200 0 0 62,013,200
Conway 848,984,100 18,276,500 277,606,853 0 0 1,305,900 0
Cornish ■ 121,724,048 2,559,500 1,791,900 44,852 0 0 0
Crawford's Purchase 0 0 5,660 0 0 0 0
Croydon 50,887,200 1,813,200 2,733,600 0 0 0 0
Cutt's Grant 0 0 0 0 0 0 0
Dalton 48,715,200 4,929,300 . 1,893,800 0 ' 0 0 0
Danbury 64,293,580 3,201,140 3,244,120 0 0 0 0
Danville 250,330,700 14,785,000 7,337,000 9,000 0 81,400 • 0
Oeerfleld 286,994,611 4,236,300 15,241,000 113,489 0 0 0
Peering 91,433,539 4,138,900 3,904,600 0 0 0 ' ' 0
Oerry 1,742,318,090 23,945,800 323,737,741 0 0 4,601,415 3,975,746
Oix's Grant 581,090 0 0 0 0 0 0
Dixvllle - 2,147,620 28,800 3,424,360 0 0 0 0
Dorchester 23,928,700 1,409,600 93,900 0 0 0 0
Dover 1,729,210,600 46,615,600 681,621,500 0 0 0 34,521,400
www.revenue.nh.gov 2020 Annual Report Of the Department Of Revenue Administration 103
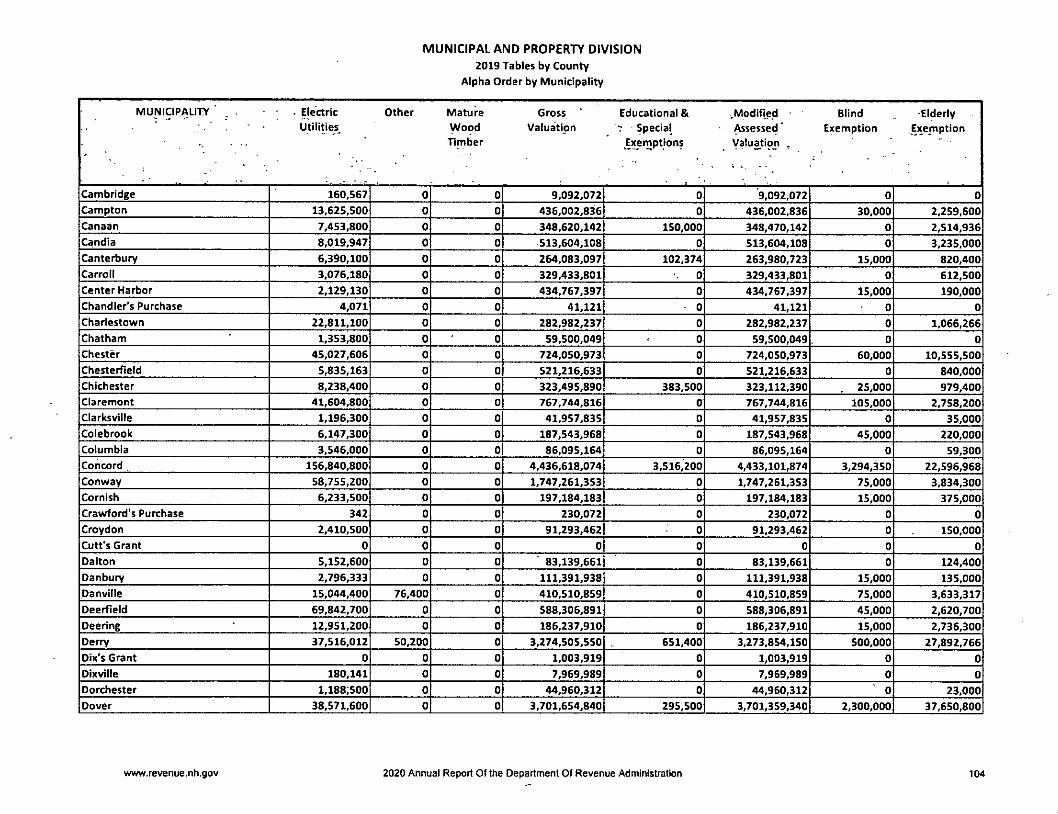
MUNICIPAL AND PROPERTY DIVISION
2019 Tables by County
Alpha Order by Municipality
MUNICIPALITY ' • Electric Other Mature Gross Educational 8i .Modified • Blind -ElderlyUtilities . Wood Valuation Special - Assessed' Exemption Exemption
' ■- ■ ' ■Timber Exemptions Vaiuatipn ,
Cambridge 160,567 0 0 9,092,072 0 9,092,072 0 0
Campton 13,625,500 0 0 436,002,836 0 436,002,836 30,000 2.259,600Canaan 7,453,800 0 0 348,620,142 150,000 348,470,142 0 2,514,936Candia 8,019,947 0 0 513,604,108 0 513,604,108 0 3,235,000Canterbury 6,390,100 0 0 264,083,097 102,374 263,980,723 15,000 820,400Carroll 3,076,180 0 0 329,433,801 0 329,433,801 0 612,500Center Harbor 2,129,130 0 0 434,767,397 0 434,767,397 15,000 190,000Chandler's Purchase 4,071 0 0 41,121 • 0 41,121 0 0
Charlestown 22,811,100 0 0 282,982,237 0 282,982,237 0 1,066,266Chatham 1,353,800 0 0 59,500,049 0 59,500,049 0 0
Chester 45,027,606 0 0 724,050,973 0 724,050,973 60,000 10,555,500Chesterfield 5,835,163 0 0 521,216,633 0 521,216,633 0 840,000Chichester 8,238,400 0 0 323,495,890 383,500 323,112,390 . 25,000 979,400Claremont 41,604,800 0 0 767,744,816 0 767,744,816 105,000 2,758,200Clarksville 1,196,300 0 0 41,957,835 0 41,957,835 0 35,000Colebrook 6,147,300 0 0 187,543,968 0 187,543,968 45,000 220,000Columbia 3,546,000 0 0 86,095,164 0 86,095,164 0 59,300Concord . 156,840,800 0 0 4,436,618,074 3,516,200 4,433,101,874 3,294,350 22,596,968Conway 58,755,200 0 0 1,747,261,353 0 1,747,261,353 75,000 3,834,300Cornish 6,233,500 0 0 197,184,183 0 197.184,183 15,000 375,000Crawford's Purchase 342 0 0 230,072 0 230,072 0 0
Croydon 2,410,500 0 0 91,293,462 0 91.293,462 0 150,000Cutt's Grant 0 0 0 0 0 0 0 0
Dalton 5,152,600 0 0 ' 83,139,661 0 83.139,661 0 124,400Danbury 2,796,333 0 0 111,391,938 0 111,391,938 15,000 135,000Danville 15,044,400 76,400 0 410,510,859 0 410,510,859 75,000 3,633,317Deerfield 69,842,700 0 0 588,306,891 0 588,306,891 45,000 2,620,700Peering 12,951,200 0 0 186,237,910 0 186.237,910 15,000 2,736,300Perry 37,516,012 50,200 0 3,274,505,550 651,400 3,273,854,150 500,000 27,892,766Oix's Grant 0 0 0 1,003.919 0 1,003,919 0 0
Pixville 180,141 0 0 7,969,989 0 7,969,989 0 0
Dorchester 1,188;S00 0 0 44,960,312 0 44,960,312 0 23,000Dover 38,571,600 0 0 3,701,654,840 295,500 3,701,359,340 2,300,000 37,650,800
www.revenue.nh.gov 2020 Annual Report Of the Department Of Revenue Administration 104
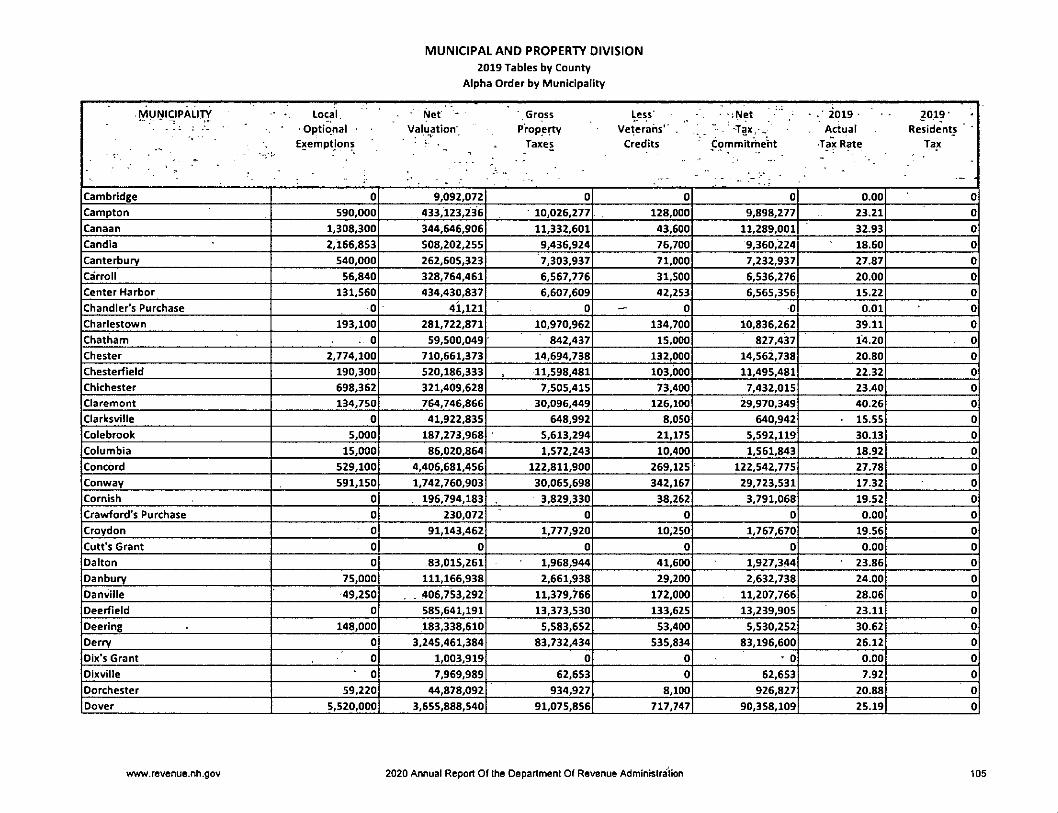
MUNICIPAL AND PROPERTY DIVISION
2019 Tables by County
Alpha Order by Municipality
MUNICIPALITY ■ - Local ■ Net ' Gross Less' • -:Net • 2019 • 2019 •
• Optional - - Valuation' Property Veterans'" _ " . -Tax,-. Actual Residents
Exemptions Taxes Credits Commitrheht Tax Rate Tax
Cambridge 0 9,092,072 0 0 0 0.00 0
Campton 590,000 433,123,236 10,026,277 128,000 9,898,277 23.21 0
Canaan 1,308,300 344,646,906 11,332,601 43,600 11,289,001 32.93 0
Candia 2,166,853 508,202,255 9,436,924 76,700 9,360,224 18.60 0
Canterbury 540,000 262,605,323 7,303,937 71,000 7,232,937 27.87 0
Ca'rroii 56,840 328,764,461 6,567,776 31,500 6,536,276 20.00 0
Center Harbor 131,560 434,430,837 6,607,609 42,253 6,565,356 15.22 0
Chandler's Purchase 0 41,121 0 - 0 0 0.01 0
Chariestown 193,100 281,722,871 10,970,962 134,700 10,836,262 39.11 0
Chatham . 0 59,500,049 842,437 15,000 827,437 14.20 0
Chester 2,774,100 710,661,373 14,694,738 132,000 14,562,738 20.80 0
Chesterfield 190,300 520,186,333 11,598,481 103,000 11,495,481 22.32 0
Chichester 698,362 321,409,628 7,505,415 73,400 7,432,015 23.40 0
Ciaremont 134,750 764,746,866 30,096,449 126,100 29,970,349 40.26 0
Ciarksvilie 0 41,922,835 648,992 8,050 640,942 15.55 0
Colebrook 5,000 187,273,968 5,613,294 21,175 5,592,119 30.13 0
Columbia 15,000 86,020,864 1,572,243 10,400 1,561,843 18.92 0
Concord 529,100 4,406,681,456 122,811,900 269,125 122,542,775 27.78 0
Conway 591,150 1,742,760,903 30,065,698 342,167 29,723,531 17.32 0
Cornish 0 196,794,183 3,829,330 38,262 3,791,068 19.52 0
Crawford's Purchase 0 230,072 0 0 0 0.00 0
Croydon 0 91,143,462 1,777,920 10,250 1,767,670 19.56 0
Cutt's Grant 0 0 0 0 0 0.00 0
Dalton 0 83,015,261 1,968,944 41,600 1,927,344 23.86 0
Danbury 75,000 111,166,938 2,661,938 29,200 2,632,738 24.00 0
Danville 49,250 . . 406,753,292 11,379,766 172,000 11,207,766 28.06 0
Deerfleld 0 585,641,191 13,373,530 133,625 13,239,905 23.11 0
Deering 148,000 183,338,610 5,583,652 53,400 5,530,252 30.62 0
Derry 0 3,245,461,384 83,732,434 535,834 83,196,600 26.12 0
DIx's Grant 0 1,003,919 0 0 ' 0 0.00 0
DIxville ' 0 7,969.989 62,653 0 62,653 7.92 0
Dorchester 59,220 44,878,092 934,927 8,100 926,827 20.88 0
Dover 5,520,000 3,655,888,540 91,075,856 717,747 90,358,109 25.19 0
www.revenue.nh.gov 2020 Annual Report Of the Department Of Revenue Administration 105
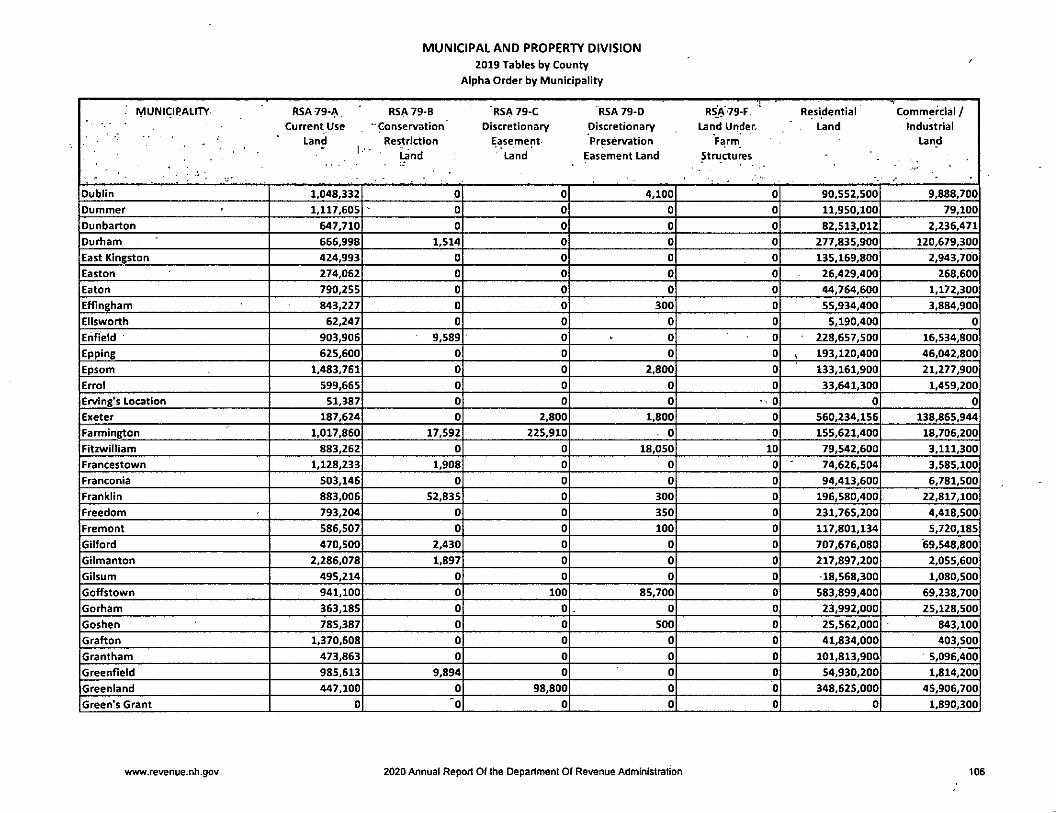
MUNICIPAL AND PROPERTY DIVISION
2019 Tables by County
Alpha Order by Municipality
. MUNICIPALITY- RSA79iA RSA 79-B 'RSA79-C RSA 79-D RSA79-F Residential Commercial /... .
Current Use "Conservation Discretionary Discretionary Land Under. Land Industrial
Land Restriction Easement Preservation Farm Land1
Und Land Easement Land Structures
Dublin 1,048,332 0 0 4,100 0 90,552,500 9,888,700
Dummer 1,117,605 0 0 0 0 11,950,100 79,100
Dunbarton 647,710 0 0 0 0 82,513,012 2,236,471
Durham 666,998 1,514 0 0 0 277,835,900 120,679,300
East Kingston 424,993 0 0 0 0 135,169,800 2,943,700
Easton 274,062 0 0 0 0 26,429,400 268,600
Eaton 790,255 0 0 0 0 44,764,600 1,172,300
Efflngham 843,227 0 0 300 0 55,934,400 3,884,900
Ellsworth 62,247 0 0 0 0 5,190,400 0
Ertfield ' 903,906 9,589 0 0 0 228,657,500 16,534,800
Epping 625,600 0 0 0 0 V 193,120,400 46,042,800
Epsom 1,483,761 0 0 2,800 0 133,161,900 21,277,900
Errol 599,665 0 0 0 0 33,641,300 1,459,200
Erving's Location 51,387 0 0 0 • 0 0 0
Exeter 187,624 0 2,800 1,800 0 560,234,156 138,865,944
Farmington 1,017,860 17,592 225,910 0 0 155,621,400 18,706,200
Fitzwiliiam 883,262 0 0 18,050 10 79,542,600 3,111,300
Francestown 1,128,233 1,908 0 0 0 74,626,504 3,585,100
Franconia 503,146 0 0 0 0 94,413,600 6,781,500
Franklin 883,006 52,835 0 300 0 196,580,400 22,817,100
Freedom 793,204 0 0 350 0 231,765,200 4,418,500
Fremont 586,507 0 0 100 0 117,801,134 5,720,185
Gilford 470,500 2,430 0 0 0 707,676,080 '69,548,800
Gilmanton 2,286,078 1,897 0 0 0 217,897,200 2,055,600
Gilsum 495,214 0 0 0 0 -18,568,300 1,080,500
Goffstown 941,100 0 100 85,700 0 583,899,400 69,238,700
Gorham 363,185 0 0 0 0 23,992,000 25,128,500
Goshen 785,387 0 0 500 0 25,562,000 843,100
Grafton 1,370,608 0 0 0 0 41,834,000 403,500
Grantham 473,863 0 0 0 0 101,813,900 5,096,400
Greenfield 985,613 9,894 0 0 0 54,930,200 1,814,200
Greenland 447,100 0 98,800 0 0 348,625,000 45,906,700
Green's Grant 0 0 0 0 0 0 1,890,300
www.revenue.nh.gov 2020 Annual Report Of the Department Of Revenue Administration 106
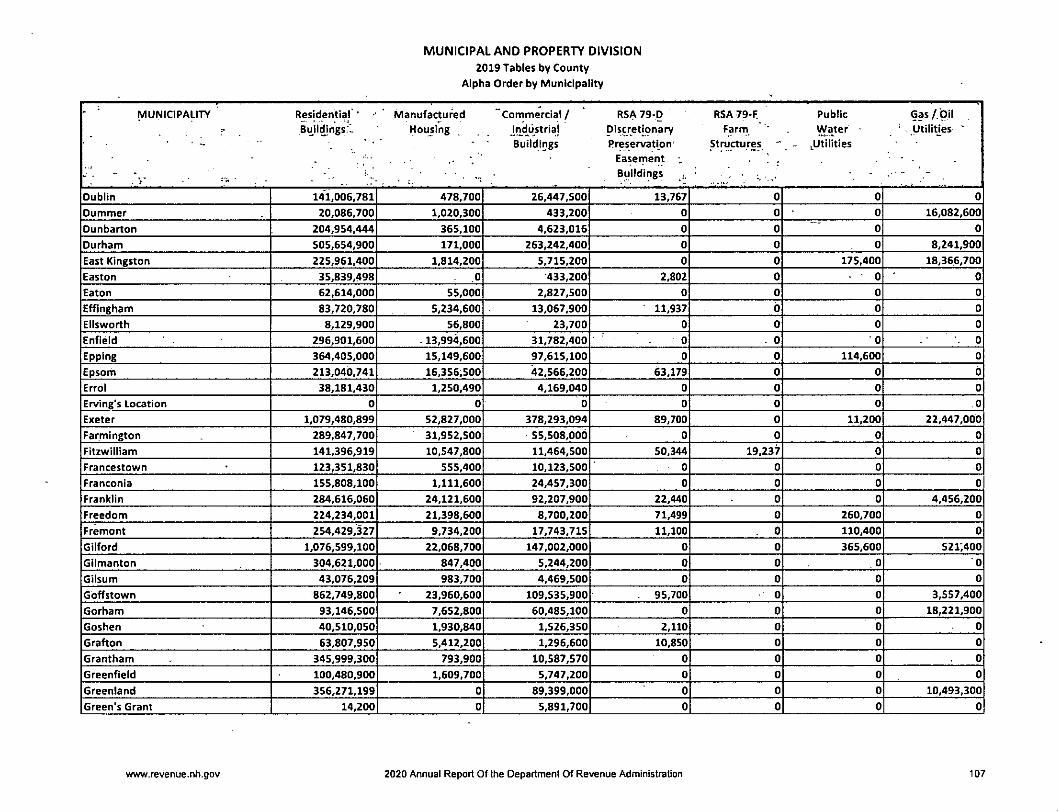
MUNICIPAL AND PROPERTY DIVISION
2019 Tables by County
Alpha Order by Municipality
• ■ MUNiCIPALITY Residentiar' - ' Manufactured "Commercial/ ' RSA 79-D RSA79-F PublicBuii^ngs.l Housing industrial Discretionary " . Utilities '
■ - • " Buildings Preservation Structures "" - ^UtilitiesEasernent •„ . ! , * -
- - Buildings - ,
Dublin 141,006,781 478,700 26,447,500 13,767 0 0 0
Dummer 20,086,700 1,020,300 433,200 0 0 0 16,082,600
Dunbarton 204,954,444 365,100 4,623,016 0 0 0 0
Durham 505,654,900 171,000 263,242,400 0 0 0 8,241,900
East Kingston 225,961,400 1,814,200 5,715,200 0 0 175,400 18,366,700
Easton 35,839,498 0 433,200 2,802 0 0 0
Eaton 62,614,000 55,000 2,827,500 0 0 0 0
Effingham 83,720,780 5,234,600 13,067,900 11,937 b 0 0
Ellsworth 8,129,900 56,800 23,700 0 0 0 0
Enfieid 296,901,600 . 13,994,600 31,782,400 0 . 0 • 0 -. 0
Epping 364,405,000 15,149,600 97,615,100 0 0 114,600 0
Epsom 213,040,741 16,356,500 42,566,200 63,179 0 0 0
Erroi 38,181.430 1,250,490 4,169,040 0 0 0 0
Erving's Location 0 0 0 0 0 0 0
Exeter 1,079,480,899 52,827,000 378,293,094 89,700 0 11,200 22,447,000
Farmington 289,847,700 31,952,500 55,508,000 0 0 0 0
Fitzwiiiiam 141,396,919 10,547,800 11,464,500 50,344 19,237 0 0
Francestown 123,351,830 555,400 10,123,500 0 0 0 0
Franconia 155,808,100 1,111,600 24,457,300 0 0 0 0
Franklin 284,616,060 24,121,600 92,207,900 22,440 0 0 4,456,200
Freedom 224,234,001 21,398,600 8,700,200 71,499 0 260,700 0
Fremont 254,429,327 9,734,200 17,743,715 11,100 0 110,400 0
Gilford 1,076,599,100 22,068,700 147,002,000 0 0 365,600 521,400
Giimanton 304,621,000 847,400 5,244,200 0 0 0 0
Giisum 43,076,209 983,700 4,469,500 0 0 0 0
Goffstown 862,749,800 23,960,600 109,535,900 95,700 0 0 3,557,400
Gorham 93,146,500 7,652,800 60,485,100 0 0 0 18,221,900
Goshen 40,510,050 1,930,840 1,526,350 2,110 0 0 0
Grafton 63,807,950 5,412,200 1,296,600 10,850 0 0 0
Grantham 345,999,300 793,900 10,587,570 0 0 0 0
Greenfield 100,480,900 1,609,700 5,747,200 0 0 0 0
Greenland 356,271,199 0 89,399,000 0 0 0 10,493,300
Green's Grant 14,200 0 5,891,700 0 0 0 0
www.revenue.nh.gov 2020 Annuai Report Of the Department Of Revenue Administration 107
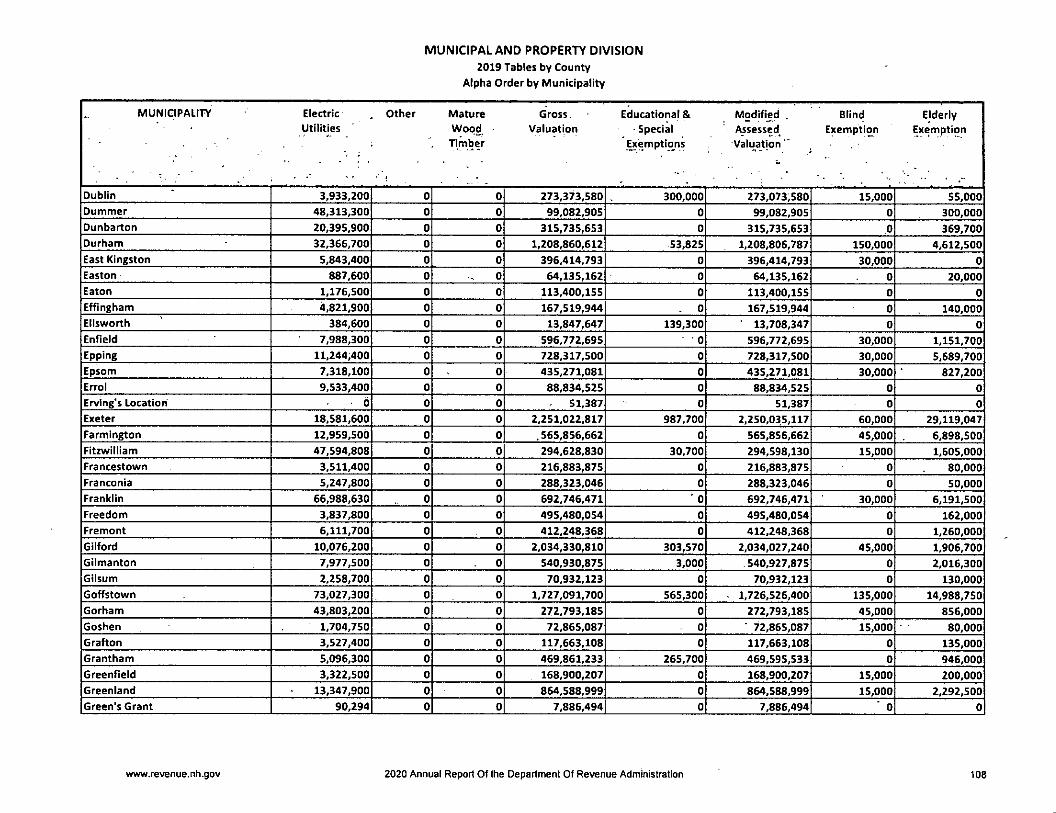
MUNICIPAL AND PROPERTY DIVISION
2019 Tables by County
Alpha Order by Municipality
MUNICIPALITY Electric Other Mature Gross. Educational 8i Modified . Blind ElderlyUtilities Wood Valuation Special Assessed Exemption Exemption
. :
Timber Exiemptions Valuation "
- ,
Dublin 3,933,200 0 0 273,373,580 300,000 273,073,580 15,000 55,000
Dummer 48,313,300 0 0 99,082,905 0 99,082,905 0 300,000
Dunbarton 20,395,900 0 0 315,735,653 0 315,735,653 0 369,700
Durham 32,366,700 0 0 1,208,860,612 53,825 1,208,806,787 150,000 4,612,500
East Kingston 5,843,400 0 0 396,414,793 0 396,414,793 30,000 0
Easton 887,600 0 0 64,135,162 0 64,135,162 0 20,000
Eaton 1,176,500 0 0 113,400,155 0 113,400,155 0 0
Effingham 4,821,900 0 0 167,519,944 0 167,519,944 0 140,000
Ellsworth 384,600 0 0 13,847,647 139,300 13,708,347 0 0
Enfleld 7,988,300 0 0 596,772,695 ■ • 0 596,772,695 30,000 1,151,700
Epping 11,244,400 0 0 728,317,500 0 728,317,500 30,000 5,689,700
Epsom 7,318,100 0 0 435,271,081 0 435,271,081 30,000 827,200
Errol 9,533,400 0 0 88,834,525 0 88,834,525 0 0
Erving's Location • 6 0 0 51,387 0 51,387 0 0
Exeter 18,581,600 0 0 2,251,022,817 987,700 2,250,035,117 60,000 29,119,047
Farmington 12,959,500 0 0 .565,856,662 0 565,856,662 45,000 6,898,500
Fitzwilliam 47,594,808 0 0 294,628,830 30,700 294,598,130 15,000 1,605,000
Francestown 3,511,400 0 0 216,883,875 0 216,883,875 0 80,000
Franconia 5,247,800 0 0 288,323,046 0 288,323,046 0 50,000
Franklin 66,988,630 0 0 692,746,471 ' 0 692,746,471 30,000 6,191,500
Freedom 3,837,800 0 0 495,480,054 0 495,480,054 0 162,000
Fremont 6,111,700 0 0 412,248,368 0 412,248,368 0 1,260,000
Gilford 10,076,200 0 0 2,034,330,810 303,570 2,034,027,240 45,000 1,906,700
Gilmanton 7,977,500 0 0 540,930,875 3,000 540,927,875 0 2,016,300
Gilsum 2,258,700 0 0 70,932,123 0 70,932,123 0 130,000
Goffstown 73,027,300 0 0 1,727,091,700 565,300 - 1,726,526,400 135,000 14,988,750
Gorham 43,803,200 0 0 272,793,185 0 272,793,185 45,000 856,000
Goshen 1,704,750 0 0 72,865,087 0 ■ 72,865,087 15,000 80,000
Grafton 3,527,400 0 0 117,663,108 0 117,663,108 0 135,000
Grantham 5,096,300 0 0 469,861,233 265,700 469,595,533 0 946,000
Greenfield 3,322,500 0 0 168,900,207 0 168,900,207 15,000 200,000
Greenland 13,347,900 0 0 864,588,999 0 864,588,999 15,000 2,292,500
Green's Grant 90,294 0 0 7,886,494 0 7,886,494 ' 0 0
www.revenue.nh.gov 2020 Annual Report Of the Department Of Revenue Administration 108
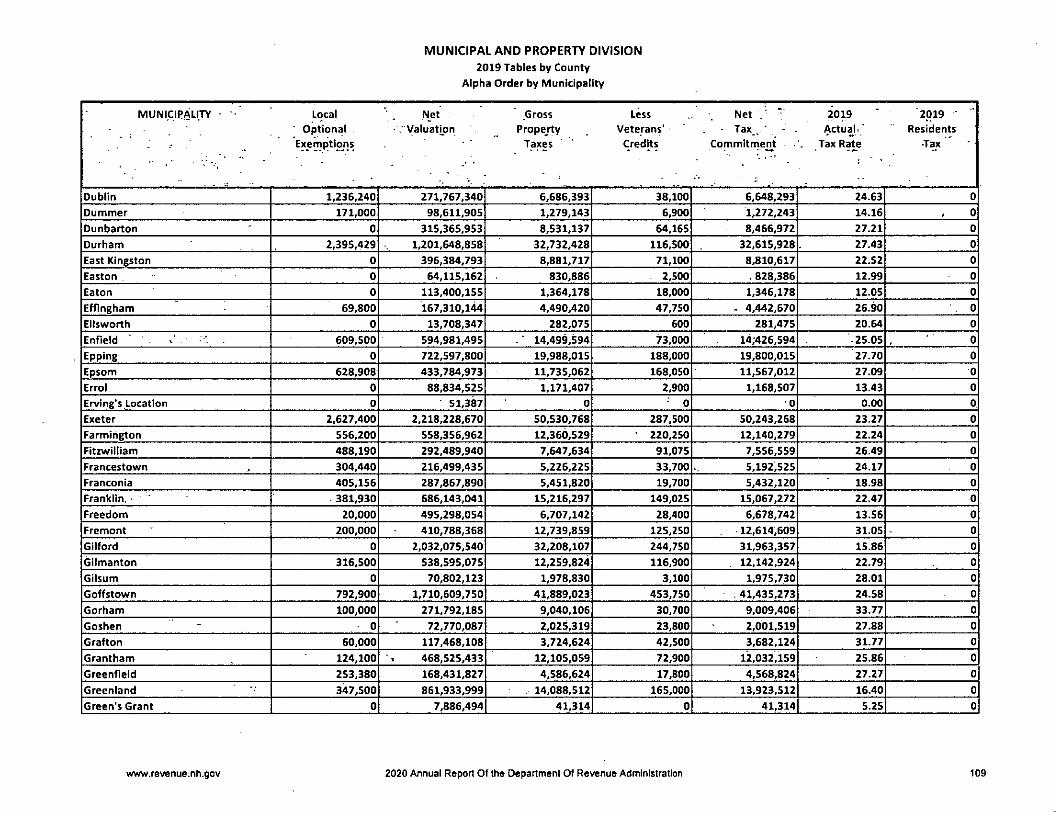
MUNICIPAL AND PROPERTY DIVISION
2019 Tables by County
Alpha Order by Municipality
MUNICIPALITY ■ Local Net Gross Less Net ■' 2019 2019
' Optional -Valuation Propejty Veterans' • Tax^ • Actual ' Residents
- ■■ , ' '■ ■Exemptions
.
Taxes Credits Cornmltrnent Tax Rate •Tax
Dublin 1.236,240 271,767,340 6,686,393 38,100 6,648,293 24.63 0
Dummer 171,000 98,611,905 1,279,143 6,900 1,272,243 14.16 0
Dunbarton 0 315,365,953 8,531,137 64,165 8,466,972 27.21 0
Durham 2,395,429 1,201,648,858 32,732,428 116,500 32,615,928 27.43 0
East Kingston 0 396,384,793 8,881,717 71,100 8,810,617 22.52 0
Easton 0 64,115,162 830,886 . 2,500 . 828,386 12.99 0
Eaton 0 113,400,155 1,364,178 18,000 1,346,178 12.05 0
Effingham 69,800 167,310,144 4,490,420 47,750 - 4,442,670 26.90 . 0
Ellsworth 0 13,708,347 282,075 600 281,475 20.64 0
Enfield " v : . 609,500 594,981,495 -■ 14,499,594 73,000 14;426,594 -25.05 0
Epping 0 722,597,800 19,988,015 188,000 19,800,015 27.70 0
Epsom 628,908 433,784,973 11,735,062 168,050 11,567,012 27.09 0
Errol 0 88,834,525 1,171,407 2,900 1,168,507 13.43 0
Ervlng's Location 0 51,387 0 - 0 •0 0.00 0
Exeter 2,627,400 2,218,228,670 50,530,768 287,500 50,243,268 23.27 0
farmihgton 556,200 558,356,962 12,360,529 • 220,250 12,140,279 22.24 0
Fitzwilliam 488,190 292,489,940 7,647,634 91,075 7,556,559 26.49 0
Francestown 304,440 216,499,435 5,226,225 33,700 5,192,525 24.17 0
Franconia 405,156 287,867,890 5,451,820 19,700 5,432,120 18.98 0
Franklin, " 381,930 686,143,041 15,216,297 149,025 15,067,272 22.47 0
Freedom 20,000 495,298,054 6,707,142 28,400 6,678,742 13.56 0
Fremont 200,000 410,788,368 12,739,859 125,250 12,614,609 31.05 0
Gilford 0 2,032,075,540 32,208,107 244,750 31,963,357 15.86 0
Gilmanton 316,500 538,595,075 12,259,824 116,900 , 12,142,924 22.79 0
Gllsum 0 70,802,123 1,978,830 3,100 1,975,730 28.01 0
Goffstown 792,900 1,710,609,750 41,889,023 453,750 . 41,435,273 24.58 0
Gorham 100,000 271,792.185 9,040,106 30,700 9,009,406 33.77 0
Goshen 0 72,770,087 2,025,319 23,800 2,001,519 27.88 0
Grafton 60,000 117,468,108 3,724,624 42,500 3,682,124 31.77 0
Grantham 124,100 468,525,433 12,105,059 72,900 12,032,159 25.86 0
Greenfield 253,380 168,431,827 4,586,624 17,800 4,568,824 27.27 0
Greenland 347,500 861,933,999 14,088,512 165,000 13,923,512 16.40 0
Green's Grant 0 7,886,494 41,314 0 41,314 5.25 0
www.revenue.nh.gov 2020 Annual Report Of the Department Of Revenue Administration 109
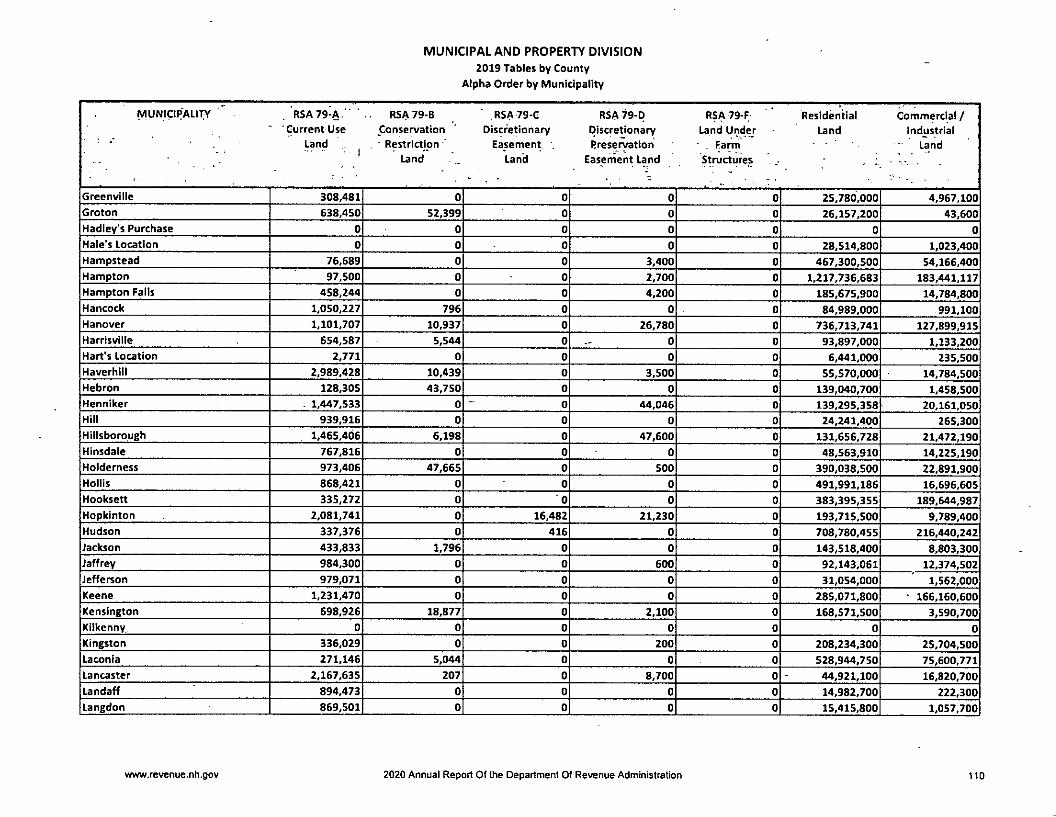
MUNICIPAL AND PROPERTY DIVISION
2019 Tables by County
Alpha Order by Municipality
MUNICIPALITY ^ "RSA79-A.' RSA79-B .RSA79-C RSA 79-D RSA 79-F Residential Commercial /'Current Use Conservation Discretionary Discretionary Land Under Land Industrial
. .
Land • Restriction ' Easement preservation . Farm Land
Land Land Easement Land Structures
Greenville 308,481 0 0 0 0 25,780,000 4,967,100
Groton 638,450 52,399 0 0 0 26,157,200 43,600
Hadley's Purchase 0 0 0 0 0 0 0
Male's Location 0 0 0 0 0 28,514,800 1,023,400
Hampstead 76,689 0 0 3,400 0 467,300,500 54,166,400
Hampton 97,500 0 0 2,700 0 1,217,736,683 183,441,117
Hampton Palis 458,244 0 0 4,200 0 185,675,900 14,784,800
Hancock 1,050,227 796 0 0 0 84,989,000 991,100
Hanover 1,101,707 10,937 0 26,780 0 736,713,741 127,899,915
Harrisville 654,587 5,544 0 0 0 93,897,000 1,133,200
Hart's Location 2,771 0 0 0 0 6,441,000 235,500
Haverhlll 2,989,428 10,439 0 3,500 0 55,570,000 14,784.500
Hebron 128,305 43,750 0 0 0 139,040,700 1,458,500
Henniker . 1,447,533 0 0 44,046 0 139,295,358 20,161,050
Hill 939,916 0 0 0 0 24,241.400 265,300
Hillsbo rough 1,465,406 6,198 0 47,600 0 131,656,728 21,472,190
Hinsdale 767,816 0 0 0 0 48,563,910 14,225,190
Holderness 973,406 47,665 0 500 0 390,038,500 22,891,900
Hollis 868,421 0 0 0 0 491,991,186 16,696,605
Hooksett 335,272 0 0 0 0 383,395,355 189,644,987
Hopkinton 2,081,741 0 16,482 21,230 0 193,715,500 9,789,400
Hudson 337,376 0 416 0 0 708,780,455 216,440,242
Jackson 433,833 1,796 0 0 0 143,518,400 8,803,300
Jaffrey 984,300 0 0 600 0 92,143,061 12,374,502
Jefferson 979,071 0 0 0 0 31,054,000 1,562,000
Keene 1,231,470 0 0 0 0 285,071,800 - 166,160,600
Kensington 698,926 18,877 0 2,100 0 168,571,500 3,590,700
Kilkenny 0 0 0 0 0 0 0
Kingston 336,029 0 0 200 0 208,234,300 25,704,500
Laconia 271,146 5,044 0 0 0 528,944,750 75,600,771
Lancaster 2,167,635 207 0 8,700 0 44,921,100 16,820,700
Landaff 894,473 0 0 0 0 14,982,700 222,300
Langdon 869,501 0 0 0 0 15,415,800 1,057,700
www.revenue.nh.gov 2020 Annual Report Of the Department Of Revenue Administration 110
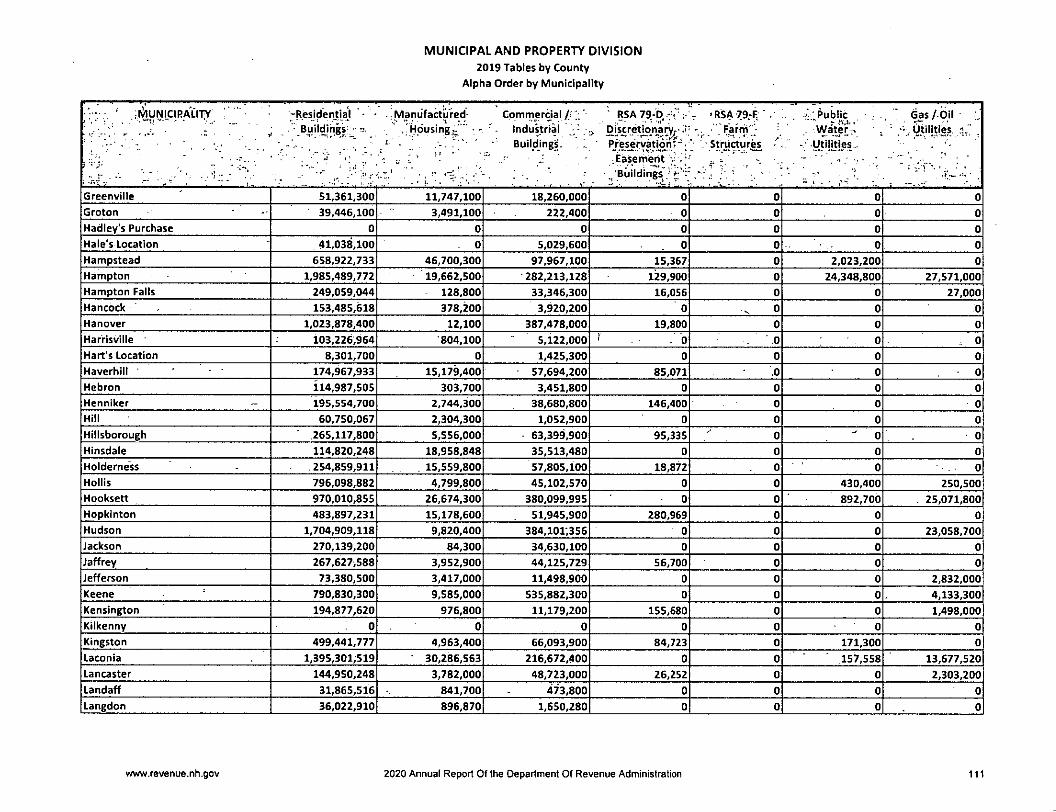
MUNICIPAL AND PROPERTY DIVISION
2019 Tables by County
Alpha Order by Municipality
' il^UNiCIRALITY ' ' -Residential • '. Manufartured- Commercial /: ■ RSA79.-"b..rr;- V •RSA 7.9.-F; ■ . f;;;PubliC Gas/-Oil; ̂ . ' . - Buildings- . Housing^'" • - Industrial j Diicretjonary^-^i "Farrh"- . Wa'ter^ . • Utilities .1.'
. _ . ...., .Buildings. . " Preservatiorif-- -• Structures ■ - -Utilities..
' 1 • ;Easerhent ■ •• \ •
i. 1 ' * . r .• '. • L • .
• ,_'BijildingsH i - ' ■■
Greenville 51,361.300 11,747,100 18,260,000 0 0 0 0
Groton 39,446,100 3,491,100 222,400 0 0 0 0
Hadley's Purchase 0 0 0 0 0 0 0
Male's location 41,038,100 0 5,029,600 0 0 0 0
Hampstead 658,922,733 46,700,300 97,967,100 15,367 0 2,023,200 0
Hampton 1,985,489,772 19,662,500 282,213,128 129,900 0 24,348,800 27,571,000
Hampton Falls 249,059,044 - 128,800 33,346,300 16,056 0 0 27,000
Hancock . 153,485,618 378,200 3,920,200 0 0 0 0
Hanover 1,023,878,400 12,100 387,478,000 19,800 0 0 0
Har'risville 103,226,964 '804,100 5,122,000' - 0 ',0 0 0
Hart's Location 8,301,700 0 1,425,300 0 0 0 0
Haverhill ' 174,967,933 15,179,400 57,694,200 85,071 .0 0 0
Hebron 114,987,505 303,700 3,451,800 0 0 0 0
Henniker — 195,554,700 2,744,300 38,680,800 146,400 0 0 0
Hill 60.750,067 2,304,300 1,052,900 0 0 0 0
Hillsborough 265,117,800 5,556,000 63,399,900 95,335 0 ^ 0 0
Hinsdale 114,820,248 18,958,848 35,513,480 0 0 0 0
Hoiderness 254,859,911 , 15,559,800 57,805,100 18,872 0 0 0
Hollis 796,098,882 4,799,800 45,102,570 0 0 430,400 250,500
Hooksett 970,010,855 26,674,300 380,099,995 - 0 0 892,700 . 25,071,800
Hopkinton 483,897,231 15,178,600 . 51,945,900 280,969 0 0 0
Hudson 1,704,909,118 9,820,400 384,101,356 0 0 0 23,058,700
Jackson 270,139,200 84,300 34,630,100 0 0 0 0
Jaffrey 267,627>588 3,952,900 44,125,729 56,700 0 0 0
Jefferson 73,380,500 3,417,000 11,498,900 0 0 0 2,832,000
Keene 790,830,300 9,585,000 535,882,300 0 0 0 4,133,300
Kensington 194,877,620 976,800 11,179,200 155,680 0 0 1,498,000
Kilkenny 0 0 0 0 0 0 0
Kingston 499,441,777 4,963,400 66,093,900 84,723 0 171,300 0
Laconia 1,395,301,519 30,286,563 216,672,400 0 0 157,558 13,677,520
Lancaster 144,950,248 3,782,000 48,723,000 26,252 0 0 2,303,200
Landaff 31,865,516 841,700 473,800 0 0 0 0
Langdon 36,022,910 896,870 1,650,280 0 0 0 0
www.revenue.nh.gov 2020 Annual Report Of the Department Of Revenue Administration ill

MUNICIPAL AND PROPERTY DIVISION
2019 Tables by County
Alpha Order by Municipality
MUNICIPALITY Electric " Other Mature Gross Educational & Modified - Blind . -. Elderly
Utilities Wood Valuation Special Assessed Exemption Exemption
. -
• Timber. Exemptions Valuatjori-
Greenville 4,166,700 0 0 116,590,681 0 116,590,681 15,000 308,300
Groton 11,843,060 0 0 81,894,309 0 81,894,309 0 290,000
Hadley's Purchase 0 0 0 0 0 0 0 0
Male's Location 222,700 0 0 75,828,600 0 75,828,600 0 0
Hampstead 11,383,200 0 0 1,338,558,889 0 1,338,558,889 300,000 9,186,500
Hampton 52,373,600 0 0 3,793,066,700 0 3,793,066,700 225,000 28,008,600
Hampton Falls 5,408,300 0 0 488,908,644 0 488,908,644 0 3,980,000
Hancock 5,540,700 0 0 250,355,841 . 0 250,355,841 0 377,500
Hanover 13,569,400 0 0 2,290,710,780 160,000 2,290,550,780 60,000 1,060,000
Harrisville 1,826,300 0 0 206,669,695 0 206,669,695 0 60,000
Hart's Location 410,000 0 0 16,816,271 0 16,816,271 0 0
Haverhill 25,050,400 ' 0 0 346,334,871 0 346,334,871 30,000 745,300
Hebron 5,459,800 0 0 264,874,060 0 264,874,060 0 0
Henniker 10,031,700 0 0 408,105,887 150,000 407,955,887 150,000 5,402,577
Hill 3,495,300 0 0 93,049,183 0 93,049,183 0 20,000
Hillsborough 33,329,874 0 0 522,147,031 25,000 522,122,031 45,000 2,171,600
Hinsdale 105,983,350 0 0 338,832,842 0 338,832,842 0 675,100
Holderness 14,868,800 " 0 0 757,064,454 150,000 756,914,454 15,000 17,500
Hollis 15,269,700 0 0 1,371,508,064 753,200 1.370,754,864 0 8,916,300
Hooksett 93,239,300 0 • 0 2,069,364,564 150,000 2,069,214,564 350,000 17,435,100
Hopkinton 30,417,900 0 0 787,344,953 389,282 786,955,671 210,000 5,410,600
Hudson 118,735,504 0 0 3,166,183,567 286,000 3,165,897,567 1,680,000 29,942,500
Jackson 2,497,800 0 0 460,108,729 0 460,108,729 0 115,500
Jaffrey 7,026,400 0 0 428,291,780 0 428,291,780 60,000 983,900
Jefferson 4,532,600 0 0 129,256,071 0 129,256,071 0 487,500
Keene 70,040,400 0 0 1,862,935,170 9,100 1,862,926,070 313,500 3,483,416
Kensington 13,321,033 0 0 394.890,436 0 394,890,436 0 3,055,000
Kilkenny 11,199 0 0 11,199 0 11,199 0 0
Kingston 44,439,100 0 0 849,469,229 383,900 849,085,329 0 2;202,500
Laconia 25,366,893 0 0 2,286,284,164 0 2,286,284,164 520,000 4,411,200
Lancaster 12,317,600 0 0 276,020,642 0 276,020,642 0 338,600
Landaff 1,440,300 0 0 50,720,789 0 50,720,789 0 25,000
Langdon 1,532,810 0 0 57,445,871 0 57,445,871 0 228,500
www.revenue.nh.gov 2020 Annual Report Of the Department Of Revenue Administration 112
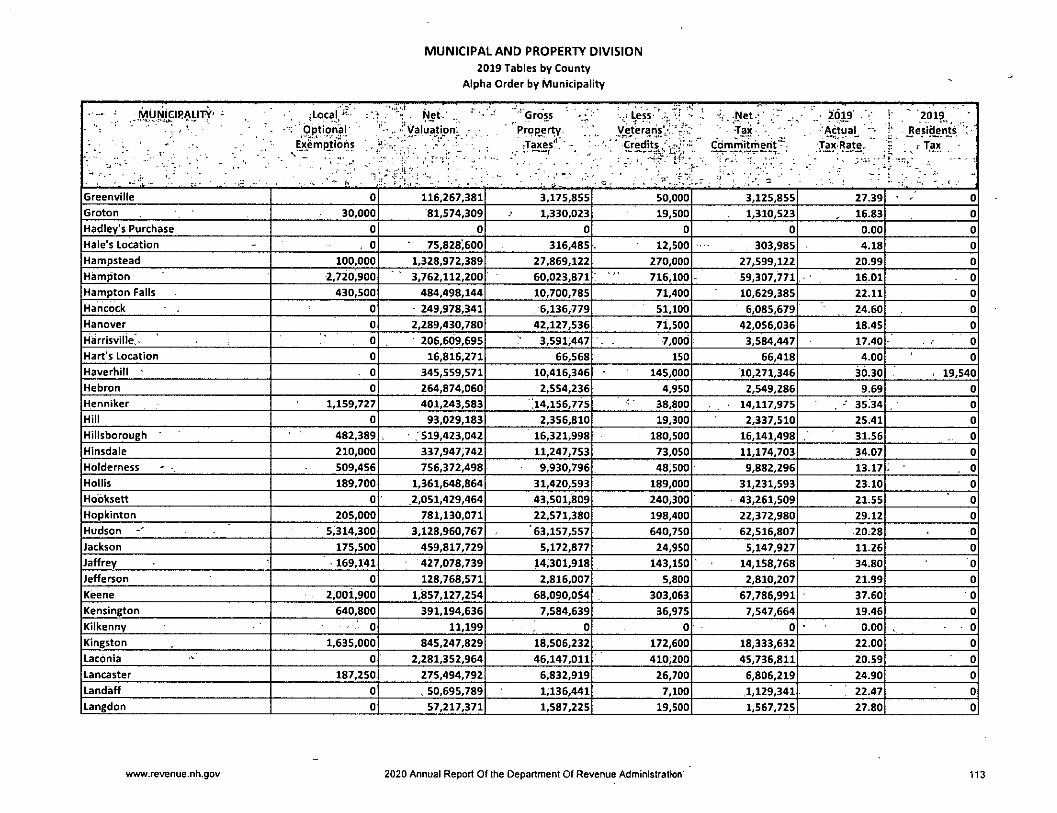
MUNICIPAL AND PROPERTY DIVISION
2019 Tables by County
Alpha Order by Municipality
• ̂ MUNJGIRAUfy* - ;Local/^- r/i . Net- . " '"' Gross' = - ■■ r ''y.aluat'pni ; , Proper^
- . ' '' •- Ejremptlbns '. y- :-,; ". . . Taxes'' •
Less '.;/-; •- : i.-Net.: , 2Q1?' ' 1' 2019^Veterans'.v^Mi T®* . X A_rtua^ " | . Resi^nts "
■! Cgmmitment"". '
Greenville 0 116,267,381 3,175,855 50,000 3,125,855 27.39 • X 0
Groton 30,000 81,574,309 1,330,023 19,500 1,310,523 . 16.83 0
Hadley's Purchase 0 0 0 0 0 0.00 0
Hale's Location : 0 ' 75,828^600 316,485 12,500 303,985 4.18 0
Hampstead 100,000 1,328,972,389 27,869,122 270,000 27,599,122 20.99 0
Hampton 2,720,900 3,762,112,200 60,023,871 716,100 59,307,771 16.01 - 0
Hampton Falls 430,500 484,498,144 10,700,785 71,400 10,629,385 22.11 0
Hancock 0 249,978,341 6,136,779 51,100 6,085,679 24.60 0
Hanover 0 2,289,430,780 42,127,536 71,500 42,056,036 18.45 0
Harrisville.- 0 206,609,695 ^ 3,591,447 7,000 3,584,447 17.40 0
Hart's Location 0 16,816,271 66,568 150 66,418 4.00 0
Haverhill - . 0 345,559,571 10,416,346 145,000 10,271,346 30.30 . 19,540
Hebron 0 264,874,060 2,554,236 4,950 2,549,286 9.69 0
Henniker 1,159,727 401,243,583 !14,156,775 ' 38,800 14,117,975 -■ 35.34 0
Hill 0 93,029,183 2,356,810 19,300 2,337,510 25.41 0
Hillsborough 482,389 ,519,423,042 16,321,998 180,500 16,141,498 31.56 0
Hinsdale 210,000 337,947,742 11,247,753 73,050 11,174,703 34.07 0
Holderness • 509,456 756,372,498 9,930,796 48,500 9,882,296 13.17 . 0
Hollis 189,700 1,361,648,864 31,420,593 189,000 31,231,593 23.10 0
Hobksett 0 .2,051,429,464 43,501,809 240,300 43,261,509 21.55 0
Hopkinton 205,000 781,130,071 22,571,380 198,400 22,372,980 29.12 0
Hudson 5,314,300 3,128,960,767 '63,157,557 640,750 62,516,807 ■20;28 0
Jackson 175,500 459,817,729 5,172,877 24,950 5,147,927 11.26 0
Jeffrey 169,141 427,078,739 14,301,918 143,150 14,158,768 34.80 0
Jefferson 0 128,768,571 2,816,007 5,800 2,810,207 21.99 0
Keene 2,001,900 1,857,127,254 68,090,054 303,063 67,786,991 37.60 0
Kensington 640,800 391,194,636 7,584,639 36,975 7,547,664 19.46 0
Kilkenny ■ 0 11,199 0 0 0 0.00 • - 0
Kingston 1,635,000 845,247,829 18,506,232 172,600 18,333,632 22.00 0
Lacbnia 0 2,281,352,964 46,147,011 410,200 45,736,811 20.59 0
Lancaster 187,250 275,494,792 6,832,919 26,700 6,806,219 24.90 0
Landaff 0 . 50,695,789 1,136,441 7,100 .1,129,341 ; 22.47 0
Langdon 0 57,217,371 1,587,225 19,500 1,567,725 27.80 0
www.revenue.nh.gov 2020 Annual Report Of the Department Of Revenue Administration' 113
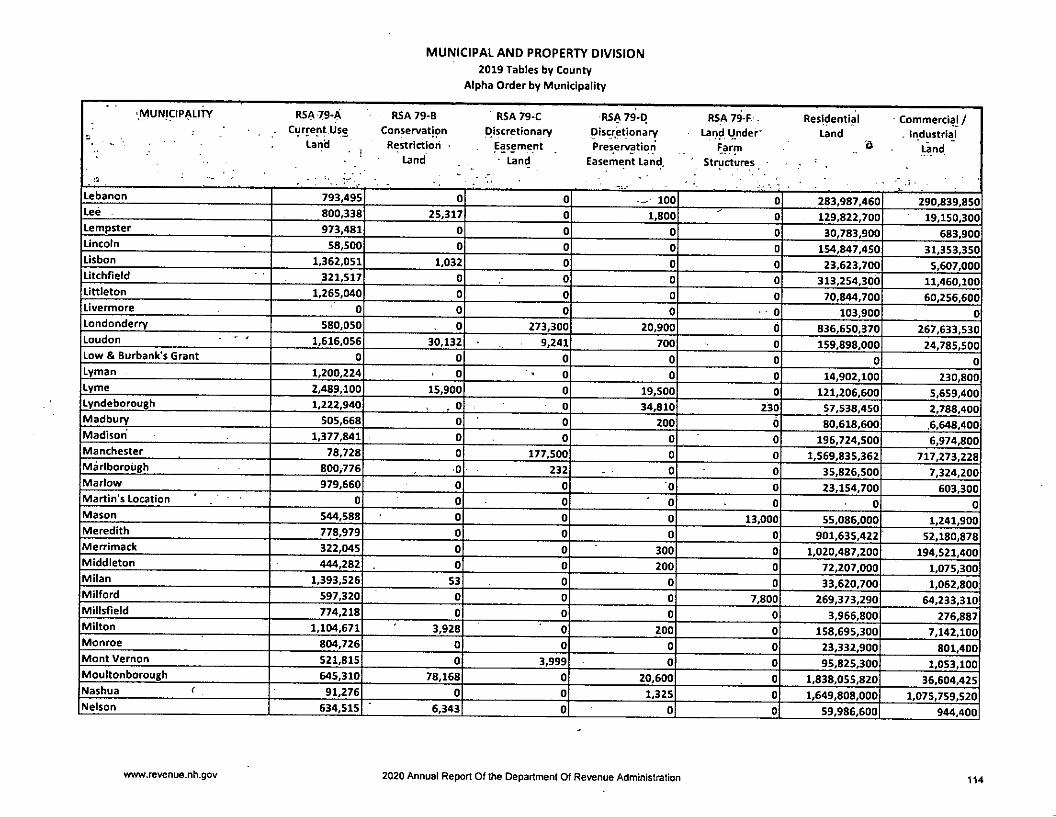
MUNICIPAL AND PROPERTY DIVISION
2019 Tables by County
Alpha Order by Municipality
■MUNICIPALITY
;5 . .
RSA 79-ACurrent Use
Land• i
RSA79-B
Conservation
Restriction >
Land
RSA 79-C
DiscretionaryEasement
' Land
RSi?> 79-0DiscretionaryPreservation
Easement Land.
RSA 79-F :Land tJnder '
Farm
Structures
Residential
Land6
Commercia]/. Industrial
Land
.? •
Lebanon 793,495 0 0 — 100 0 283,987,460| 290,839,850Lee 800,338 25,317 0 1,800 0 129,822,700 19,150,300Lempster 973,481 0 0 0 0 30,783,900 683,900Lincoln 58,500 0 0 0 0 154,847,450 31,353,350Lisbon 1,362,051 1,032 0 0 0 23,623,700 5,607,000Litchfield 321,517 0 0 0 0 313,254,300 11,460,100Littleton 1,265,040 0 0 0 0 70,844,700 60,256,600LIvermore 0 0 0 0 0 103,900 0Londonderry 580,050 0 273,300 20,900 b 836,650,370 267,633,530Loudon 1,616,056 30,132 9,241 700 0 159,898,000 24,785,500Low & Burbank's Grant 0 0 0 0 0 0 0Lyman 1,200,224 0 0 0 0 14,902,100 230,800Lyme 2,489,100 15,900 0 19,500 0 121,206,600 5,659,400Lyndeborough 1,222,940 . 0 0 34,810 230 57,538,450 2,788,400Madbury 505,668 0 0 200 b 80,618,600 .6,648,400Madison 1,377,841 0 0 0 0 196,724,500 6,974,800Manchester 78,728 0 177,500 0 0 1,569,835,362 717,273,228Marlborough 800,776 0 232 0 0 35,826,500 7,324,200Marlow 979,660 0 0 0 0 23,154,700 603,300Martin's Location 0 0 0 0 0 0 0Mason 544,588 0 0 0 13,000 55,086,000 1,241,900Meredith 778,979 0 0 0 0 901,635,422 52,180,878Merrlmack 322,045 0 0 300 0 1,020,487,200 194,521,400MIddleton 444,282 0 0 200 0 72,207,000 1,075,300Milan 1,393,526 53 0 0 0 33,620,700 1,062,800Milford 597,320 0 0 0 7,800 269,373,290 64,233,310Millsfield 774,218 0 0 0 0 3,966,800 276,887Milton 1,104,671 3,928 0 200 0 158,695,300 7,142,100Monroe 804,726 0 0 0 0 23,332,900 801,400Mont Vernon 521,815 0 3,999 0 0 95,825,300 1,053,100Moultonborough 645,310 78,168 0 20,600 0 1,838,055,820 36,604,425Nashua < 91,276 0 0 1,325 0 1,649,808,000 1,075,759,520Nelson 634,515 6,343 0 0 0 59,986,60o| 944,400
www.revenue.nh.gov 2020 Annual Report Of the Department Of Revenue Administration 114
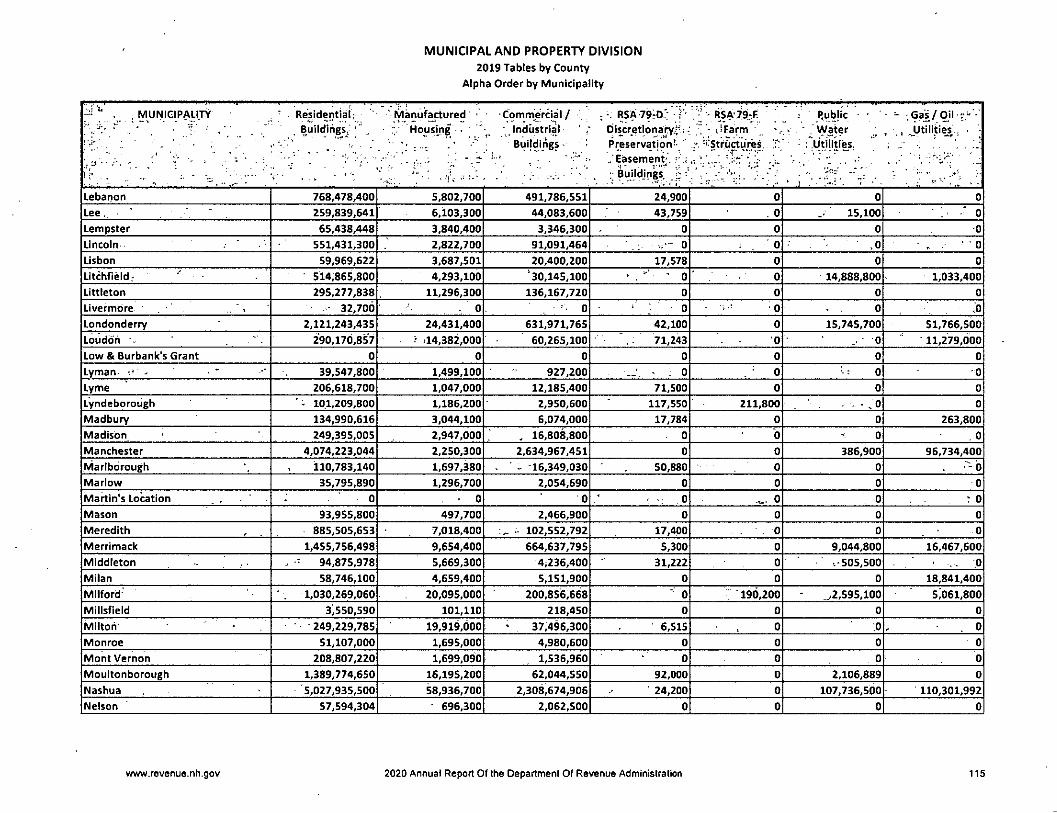
MUNICIPAL AND PROPERTY DIVISION
2019 Tables by County
Alpha Order by Municipality
, MUNICIPALI.TY . Resideiitialr ' Manufactured' ' • Commjerdal / ,, ; •. RSA79:0': V' - Ri5A'79.-F. public • - '.Gas/Oil •
Buildings^ • ", Hous'mg • ' Industrial Dis^cretionafY-;^ - liFarm ' , , Utilities, - •Buildings- Preservation- '.;*, -'-Structurel '.f: : .Utilities.
Easement. =•.; *. ** *
;• Bu|ldings, i . V- ." / . i " V ■ . . ' k .
Lebanon 768,478,400 5,802,700 491,786,551 24,900 0 0 0
Lee, • ' 259,839,641 6,103,300 44,083,600 43,759 . 0 15,100 0
Lempster 65,438,448 3,840,400 3,346,300 0 0 0 •0
Lincoln / ' 551,431,300 2,822,700 91,091,464 - 0 0 >0 , - ■ ' 0
Lisbon 59,969,622 3,687,501 20,400,200 17,578 0 0 0
Litchfield: - 514,865,800 4,293,100 '30,145,100 V ' 0 0 14,888,800 1,033,400
Littleton 295,277,838 11,296,300 136,167,720 0 0 0 0
Livermdre . • . '. 32,700 . 0 0 0 0 0 .0
Londonderry 2,121,243,435 24,431,400 631,971,765 42,100 0 15,745,700 51,766,500
Louddh ■- 290,170,857 ;• >14,382,000 60,265,100 71,243 0 .. 0 ■ 11,279,000Low & Burbank's Grant 0 0 0 0 0 0 0
Lyman . 39,547,800 1,499,100 927,200 • : 0 0 0 -0
Lyme 206,618,700 1,047,000 12,185,400 71,500 0 0 0
Lyndeborough 101,209,800 1,186,200 2,950,600 117,550 211,800 • - • . 0 0
Madbury 134,990,616 3,044,100 6,074,000 17,784 0 0 263,800Madison 249,395,005 2,947,000 . 16,808,800 0 0 0 . 0Manchester 4,074,223,044 2,250,300 2,634,967,451 0 0 386,900 96,734,400Marlbdrough 110,783,140 1,697,380 ' - -16,349,030 50,880 0 0 "6Marlow 35,795.890 1,296,700 2,054,690 0 0 0 0
Martin's Location : ■ 0 - 0 0 : 0 .... 0 0 : 0
Mason 93,955,800 497,700 2,466,900 0 0 0 0
Meredith 885,505,653 7,018,400 - 102,552,792 17,400 . 0 0 0
Merrimack 1,455,756,498 9,654,400 664,637,795 5,300 0 9,044,800 16,467,600Middleton , - 94,875.978 5,669,300 4,236,400 31,222 0 505,500 . -0Milan 58,746,100 4,659,400 5,151,900 0 0 0 18,841,400
Milford 1,030,269,060 20,095,000 200,856,668 " 0 190,200 y2,595,100 5;061,800Millsfield 3,550,590 101,110 218,450 0 0 0 0
Miltoh' 249,229,785 19,919,000 37,496,300 6,515 0 .0 . 0Monroe 51,107,000 1,695,000 4,980,600 0 0 0 0
Mont Vernon 208,807,220 1,699,090 1,536,960 0 0 0 0
Moultonborough 1,389,774,650 16,195,200 62,044,550 92,000 0 2,106,889 0
Nashua 5,027,935,500 58,936,700 2,308,674,906 ' 24,200 0 107,736,500 110,301,992Nelson 57,594,304 696,300 2,062,500 0 0 0 0
www.revenue.nh.gov 2020 Annual Report Of the Department Of Revenue Administration 115
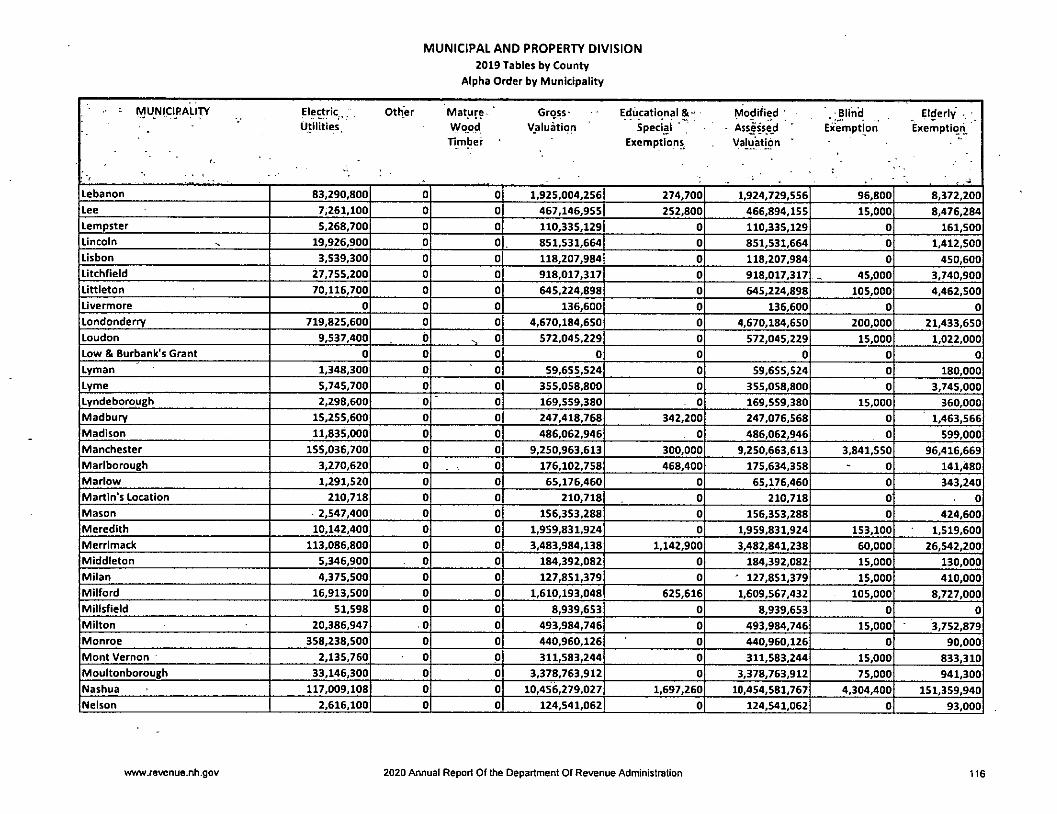
MUNICIPAL AND PROPERTY DIVISION
2019 Tables by County
Alpha Order by Municipality
: MUNICIPALITY Electric. Other Mature -' Gross- Educational Modified ' -Blind Elderly .
.Utilities Wood Valuation 5pecial - Assessed Exemption Exemptiqri^
f.
Timber Exemptions Valuation
Lebanon 83,290,800 0 0 1,925,004,256 274,700 1,924,729,556 96,800 8,372,200
Lee 7,261,100 0 0 467,146,955 252,800 466,894,155 15,000 8,476,284
Lempster 5,268,700 0 0 110,335,129 0 110,335,129 0 161,500
Lincoln 19,926,900 0 0 851,531,664 0 851,531,664 0 1,412,500
Lisbon 3,539,300 0 0 118,207,984 0 118,207,984 0 450,600
Litchfleld 27,755,200 0 0 918,017,317 0 918,017,317 45,000 3,740,900
Littleton 70,116,700 0 0 645,224,898 0 645,224,898 105,000 4,462,500
Livermore 0 0 0 136,600 0 136,600 0 0
Londonderry 719,825,600 0 0 4,670,184,650 0 4,670,184,650 200,000 21,433,650
Loudon 9,537,400 0 ^ 0 572,045,229 0 572,045,229 15,000 1,022,000
Low & Burbank's Grant 0 0 0 0 0 0 0 0
Lyman 1,348,300 0 0 59,655,524 0 59,655,524 0 180,000
Lyme 5,745,700 0 0 355,058,800 0 355,058,800 0 3,745,000
Lyndeborough 2,298,600 0 0 169,559,380 - 0 169,559,380 15,000 360,000
Madbury 15,255,600 0 0 247,418,768 342,200 247,076,568 0 1,463,566
Madison 11,835,000 0 0 486,062,946 0 486,062,946 0 599,000
Manchester 155,036,700 0 0 9,250,963,613 300,000 9,250,663,613 3,841,550 96,416,669
Marlborough 3,270,620 0 0 176,102,758 468,400 175,634,358 0 141,480
Marlow 1,291,520 0 0 65,176,460 0 65,176,460 0 343,240
Martin's Location 210,718 0 0 210,718 0 210,718 0 0
Mason 2,547,400 0 0 156,353,288 0 156,353,288 0 424,600
Meredith 10,142,400 0 0 1,959,831,924 0 . 1,959,831,924 153,100 1,519,600
Merrlmack 113,086,800 0 0 3,483,984,138 1,142,900 3,482,841,238 60,000 26,542,200
Middleton 5,346,900 0 0 184,392,082 0 184,392,082 15,000 130,000
Milan 4,375,500 0 0 127,851,379 0 ' 127,851,379 15,000 410,000
Milford 16,913,500 0 0 1,610,193,048 625,616 1,609,567,432 105,000 8,727,000
Millsfield 51,598 0 0 8,939,653 0 8,939,653 0 0
Milton 20,386,947 0 0 493,984,746 0 493,984,746 15,000 3,752,879
Monroe 358,238,500 0 0 440,960,126 0 440,960,126 0 90,000
MontVernon 2,135,760 0 0 311,583,244 0 311,583,244 15,000 833,310
Moultonborough 33,146,300 0 0 3,378,763,912 0 3,378,763,912 75,000 941,300
Nashua 117,009,108 0 0 10,456,279,027 1,697,260 10,454,581,767 4,304,400 151,359,940
Nelson 2,616,100 0 0 124,541,062 0 124,541,062 0 93,000
www.revenue.nh.gov 2020 Annual Reporl Of the Department Of Revenue Administration 116
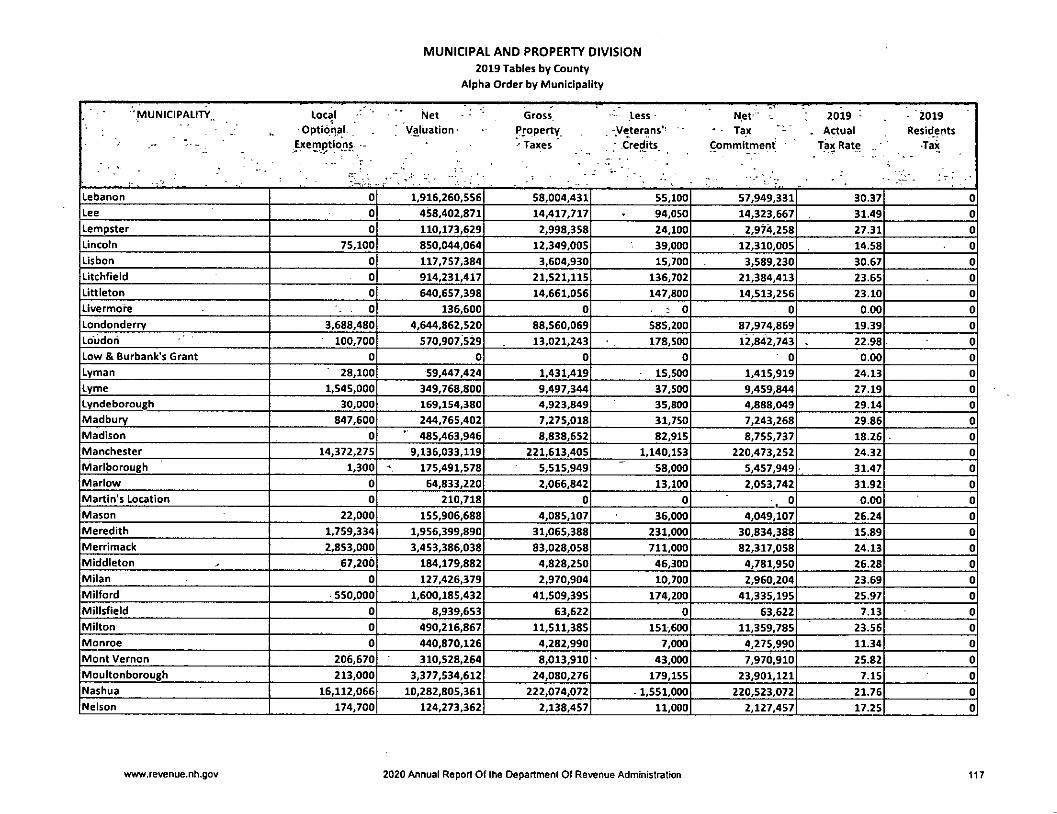
MUNICIPAL AND PROPERTY DIVISION
2019 Tables by County
Alpha Order by Municipality
'MUNICIPALITY,. Local Net Gross, .Less Nef 2019 • . ■ 2019
. ̂ -Optional. " Valuation- Property .-Veterans'' ' ' Tax . Actual Residents' - Exemptions -- • -Taxes . Credits, Commitment • Tax Rate ' Tax
Lebanon 0 1,916,260,556 58,004,431 55,100 57,949,331 30.37 0
Lee 0 458,402,871 14,417,717 94,050 14,323,667 31.49 0
Lempster 0 110,173,629 2,998,358 24,100 2,974,258 27.31 0
Lincoln 75,100 850,044,064 12,349,005 39,000 12,310,005 14.58 0
Lisbon 0 117,757,384 3,604,930 15,700 3,589,230 30.67 0
Litchfield 0 914,231,417 21,521,115 136,702 21,384,413 23.65 0
Littleton 0 640,657,398 14,661,056 147,800 14,513,256 23.10 0
Livermore 0 136,600 0 : - 0 0 0.00 0
Londonderry 3,688,480 4,644,862,520 88,560,069 585,200 87,974,869 19.39 0
Lo'udoh 100,700 570,907,529 13,021,243 178,500 12,842,743 22.98 0
Low & Burbank's Grant 0 0 0 0 0 0.00 0
Lyman 28,100 59,447,424 1,431,419 15,500 1,415,919 24.13 0
Lyme 1,545,000 349,768,800 9,497,344 37,500 9,459,844 27.19 0
Lyndeborough 30,000 169,154,380 4,923,849 35,800 4,888,049 29.14 0
Madbury 847,600 244,765,402 7,275,018 31,750 7,243,268 29.86 0
Madison 0 ' 485,463,946 8,838,652 82,915 8,755,737 18.26 0
Manchester 14,372,275 9,136,033,119 221,613,405 1,140,153 220,473,252 24.32 0
Marlborough 1,300 175,491,578 5,515,949 58,000 5,457,949 31.47 0
Marlow 0 64,833,220 2,066,842 13,100 2,053,742 31.92 0
Martin's Location 0 210,718 0 0 •. 0 0.00 0
Mason 22,000 155,906,688 4,085,107 36,000 4,049,107 26.24 0
Meredith 1,759,334 1,956,399,890 31,065,388 231,000 30,834,388 15.89 0
Merrimack 2,853,000 3,453,386,038 83,028,058 711,000 82,317,058 24.13 0
Middleton 67,200 184,179,882 4,828,250 46,300 4,781,950 26.28 0
Milan 0 127,426,379 2,970,904 10,700 2,960,204 23.69 0
Milford 550,000 1.600,185,432 41,509,395 174,200 41,335,195 25.97 0
Millsfieid 0 8,939,653 63,622 0 63,622 7.13 0
Milton 0 490,216,867 11,511,385 151,600 11,359,785 23.56 0
Monroe 0 440,870,126 4,282,990 7,000 4,275,990 11.34 0
Mont Vernon 206,670 310,528,264 8,013,910 43,000 7,970,910 25.82 0
Moultonborough 213,000 3,377,534,612 24,080,276 179,155 23,901,121 7.15 0
Nashua 16,112,066 10,282,805,361 222,074,072 1,551,000 220,523,072 21.76 0
Nelson 174,700 124,273,362 2,138,457 11,000 2,127,457 17.25 0
www.revenue.nh.gov 2020 Annual Report Of the Department Of Revenue Administration 117
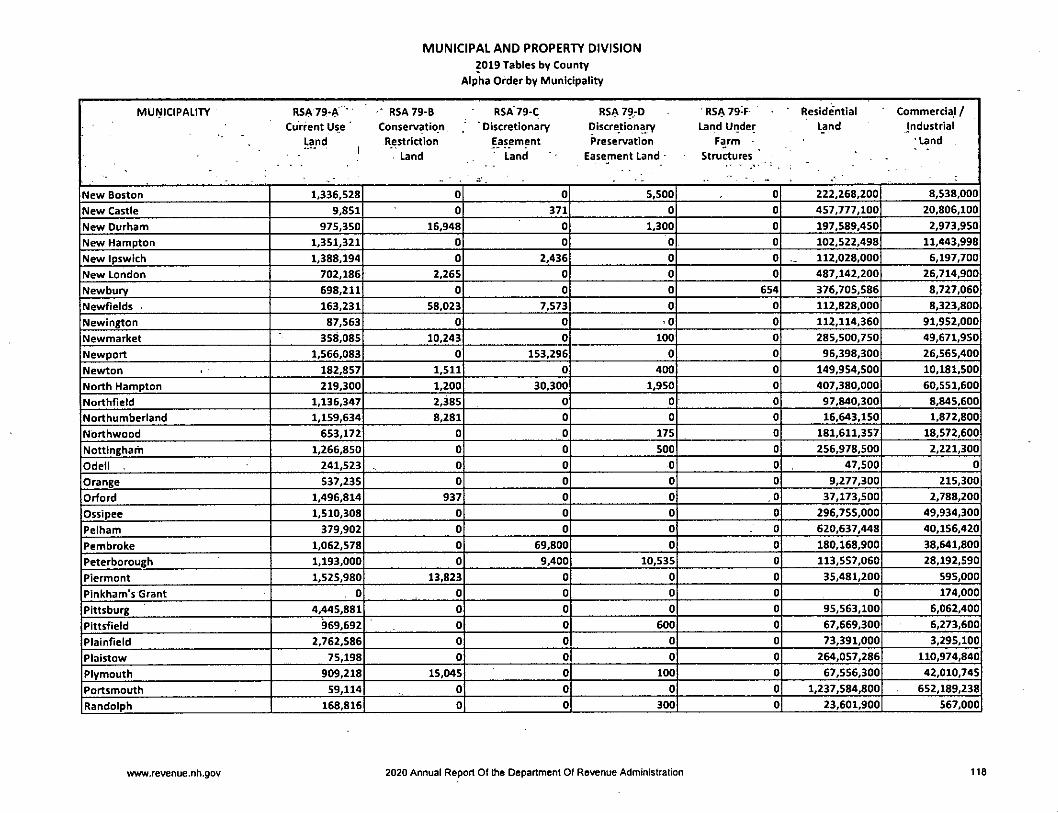
MUNICIPAL AND PROPERTY DIVISION
2019 Tables by County
Alpha Order by Municipality
MUNICIPALITY RSA79-A ■ ■ RSA79-B RSA79-C RSA 79-D R5A 79-F Reside'ntial Commercial f
Current Use ' Conservation 'Discretionary Discretionary Land Under Land Industrial
Land Restriction Easement Preservation Farm ■ • Land
_ ■ > - ;
... 1
. Land Land Easement Land - Structures
New Boston 1,336,528 0 0 5,500 0 222,268,200 8,538,000
New Castle 9,851 0 371 0 0 457,777,100 20,806,100
New Durham 975,350 16,948 0 1,300 0 197,589,450 2,973,950
New Hampton 1,351,321 0 0 0 0 102,522,498 11,443,998
New Ipswich 1,388,194 0 2,436 0 0 112,028,000 6,197,700
New London 702,186 2,265 0r 0 0 487,142,200 26,714,900
Newbury 698,211 0 0 0 654 376,705,586 8,727,060
Newfields . 163,231 58,023 7,573 0 0 112,828,000 8,323,800
Newington 87,563 0 0 0 0 112,114,360 91,952,000
Newmarket 358,085 10,243 0 100 0 285,500,750 49,671,950
Newport 1,566,083 0 153,296 0 0 96,398,300 26,565,400
Newton 182,857 1,511 0 400 0 149,954,500 10,181,500
North Hampton 219,300 1,200 30,300 1,950 0 407,380,000 60,551,600
Northfield 1,136,347 2,385 0 0 0 97,840,300 8,845,600
Northumberland 1,159,634 8,281 0 0 0 16,643,150 1,872,800
Northwood 653,172 0 0 175 0 181,611,357 18,572,600
Nottingham 1,266,850 0 0 500 0 256,978,500 2,221,300
Odell . 241,523 0 0 0 0 47,500 0
Orange 537,235 0 0 0 0 9,277,300 215,300
Orford 1,496,814 937 0 0 .0 37,173,500 2,788,200
Ossipee 1,510,308 0 0 0 0 296,755,000 49,934,300
Pelham 379,902 0 0 0 0 620,637,448 40,156,420
Pembroke 1,062,578 0 69,800 0 0 180,168,900 38,641,800
Peterborough 1,193,000 0 9,400 10,535 0 113,557,060 28,192,590
Piermont 1,525,980 13,823 0 0 0 35,481,200 595,000
Pinkham's Grant . 0 0 0 0 0 0 174,000
Pittsbui^ 4,445,881 0 0 0 0 95,563,100 6,062,400
Pittsfield 969,692 0 0 600 0 67,669,300 6,273,600
Plalnfield 2,762,586 0 0 0 0 73,391,000 3,295,100
Plaistow 75,198 0 0 0 0 264,057,286 110,974,840
Plymouth 909,218 15,045 0 100 0 67,556,300 42,010,745
Portsmouth 59,114 0 0 0 0 1,237,584,800 652,189,238
Randolph 168,816 0 0 300 0 23,601,900 567,000
www.revenue.nh.gov 2020 Annual Report Of the Department Of Revenue Administration 118
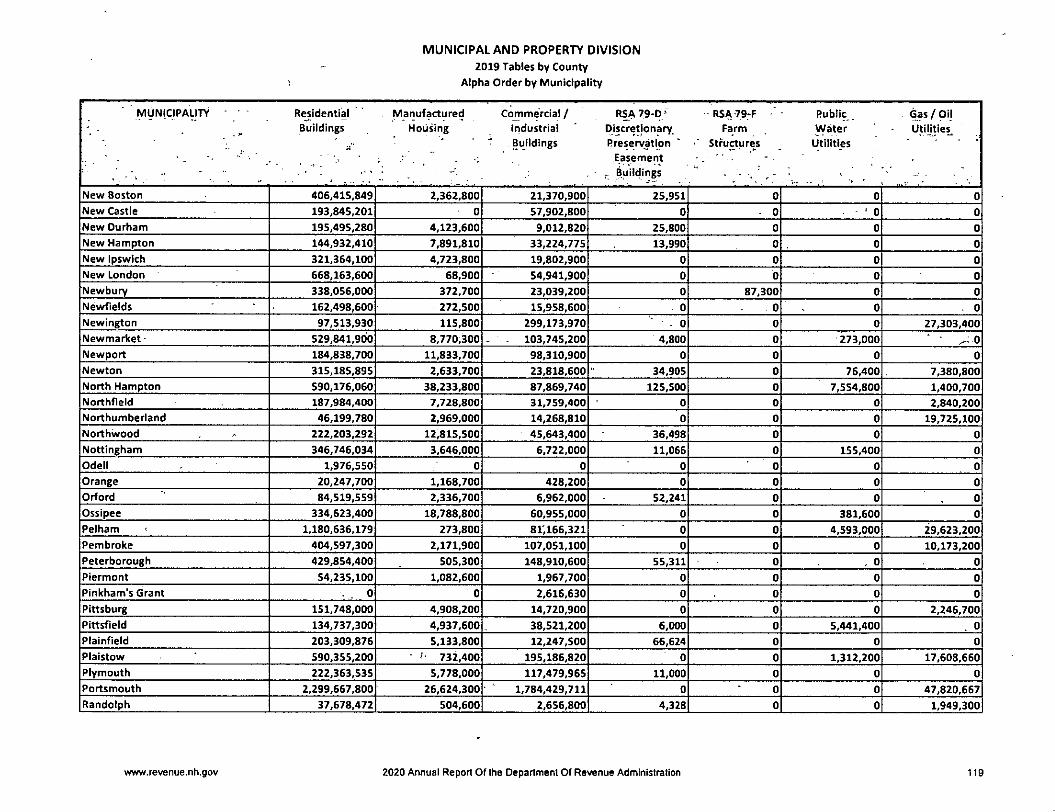
MUNICIPAL AND PROPERTY DIVISION
2019 Tables by County
Alpha Order by Municipality
MUNICIPALITY R«idential . Manufactured Commercial/ RSA79-D' - RSA79-F Public . Gas/OilBuildings Housing Iridustrial Discretionary, Farm Water UtiHtie^
" y'• ' ' ' Buildings Preservation " •" StKictures Utilities . . .■ • " , Easement
_ Buildings
New Boston 406,415.849 2,362,800 21,370,900 25,951 0 0 0
New Castle 193,845,201 0 57,902,800 0 • 0 ' 0 0
New Durham 195,495,280 4,123,600 9,012,820 25,800 0 0 0
New Hampton 144,932,410 7,891,810 33,224,775 13,990 0 0 0
New Ipswich 321,364,100 4,723,800 19,802,900 0 0 0 0
New London 668,163,600 68,900 54,941,900 0 0 0 0
Newbury 338,056,000 372,700 23,039,200 0 87,300 0 0
Newfields 162,498,600 272,500 15,958,600 0 0 0 - 0
Newington 97,513,930 115,800 299,173,970 . 0 0 0 27,303,400
Newmarket - 529,841,900 8,770,300 - . 103,745,200 4,800 0 273,000 ' ̂ 0Newport 184,838,700 11,833,700 98,310,900 0 0 0 0
Newton 315,185,895 2,633,700 23,818,600 34,905 0 76,400 7,380,800
North Hampton 590,176,060 38,233,800 87,869,740 125,500 0 7,554,800 1,400,700
Northfield 187,984,400 7,728,800 31,759,400 0 0 0 2,840,200
Northumberland 46,199,780 2,969,000 14,268,810 0 0 0 19,725,100
Northwood 222,203,292 12,815,500 45,643,400 36,498 0 0 0
Nottingham 346,746,034 3,646,000 6,722,000 11,066 0 155,400 0
Odell 1,976,550 0 0 0 0 0 0
Orange 20,247,700 1,168,700 428,200 0 0 0 0
Orford 84,519,559 2,336,700 6,962,000 52,241 0 0 0
Ossipee 334,623,400 18,788,800 60,955,000 0 0 381,600 0
Pelham 1,180,636,179 273,800 81,166,321 0 0 4,593,000 29,623,200
Pembroke 404,597,300 2,171,900 107,051,100 0 0 0 10,173,200
Peterborough 429,854,400 505,300 148,910,600 55,311 0 , 0 0
Plermont 54,235,100 1,082,600 1,967,700 0 0 0 0
Pinkham's Grant 0 0 2,616,630 0 0 0 0
PIttsburg 151,748,000 4,908,200 14,720,900 0 0 0 2,246,700
Pittsfield 134,737,300 4,937,600 38,521,200 6,000 0 5,441,400 . 0
Plainfleld 203,309,876 5,133,800 12,247,500 66,624 0 0 0
Plaistow 590,355,200 • '■ 732,400 195,186,820 0 0 1,312.200 17,608,660Plymouth 222,363,535 5,778,000 117,479,965 11,000 0 0 0
Portsmouth 2,299,667,800 26,624,300 1,784,429,711 0 0 0 47,820,667Randolph 37,678,472 504,600 2,656,800 4,328 0 0 1,949,300
www.revenue.nh.gov 2020 Annual Report Of the Department Of Revenue Administration 119
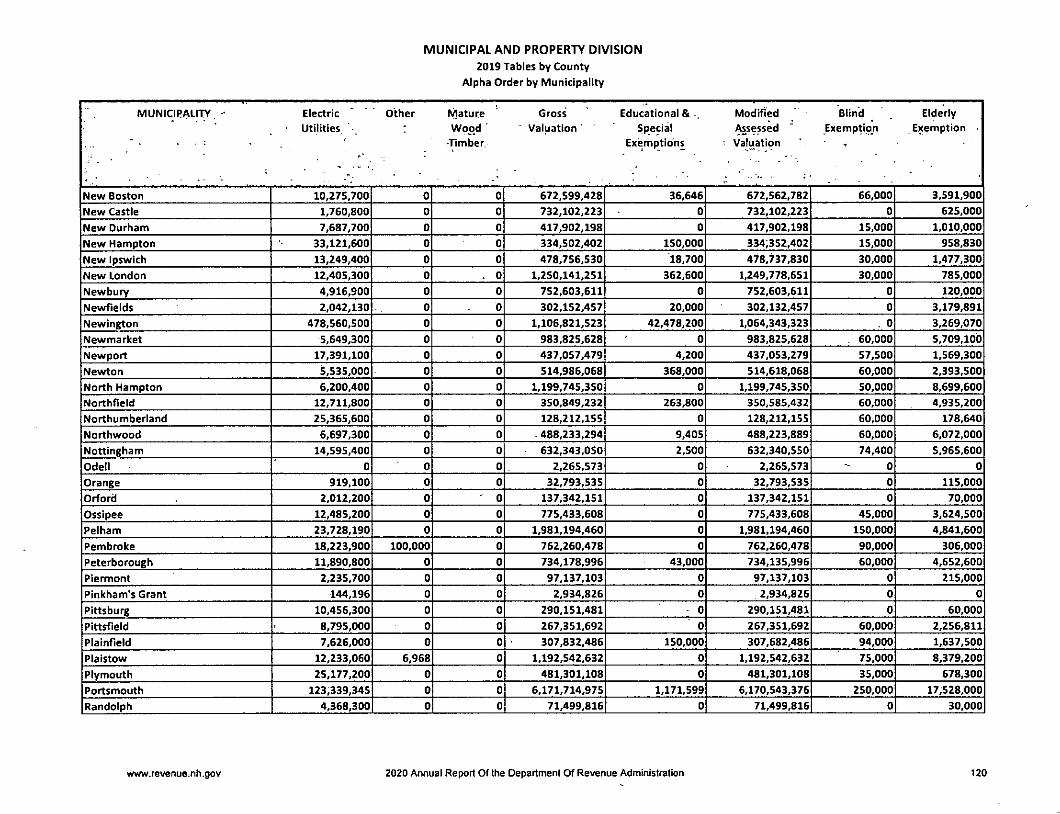
MUNICIPAL AND PROPERTY DIVISION
2019 Tables by County
Alpha Order by Municipality
MUNICIPALITY - Electric ' " Other Mature Gross Educational & , Modified Blind ElderlyUtilities - : Wood' ' Valuation' Special Assessed Exemptmn Exemption '
•Timber, Exemptions ■ Valuation ' ' ,
New Boston 10,275,700 0 0 672,599,428 36,646 672,562,782 66,000 3,591,900
New Castle 1,760,800 0 0 732,102,223 0 732,102,223 0 625,000
New Durham 7,687,700 0 0 417,902,198 0 417,902,198 15,000 1,010,000
New Hampton 33,121,600 0 0 334,502,402 150,000 334;3S2,402 15,000 958,830
New Ipswich 13,249,400 0 0 478,756,530 18,700 478,737,830 30,000 1,477,300
New London 12,405,300 0 . 0 1,250,141,251 362,600 1,249,778,651 30,000 785,000
Newbury 4,916,900 0 0 752,603,611 0 752,603,611 0 120,000
Newfields 2,042,130 0 0 302,152,457 20,000 302,132,457 0 3,179,891
Newington 478,560,500 0 0 1,106,821,523 42,478,200 1,064,343,323 . 0 3,269,070
Newmarket 5,649,300 0 0 983,825,628 0 983,825,628 . 60,000 5,709,100
Newport 17,391,100 0 0 437,057,479 4,200 437,053,279 57,500 1,569,300
Newton 5,535,000 0 0 514,986,068 368,000 514,618,068 60,000 2,393,500
North Hampton 6,200,400 0 0 1,199,745,350 0 1,199,745,350 50,000 8,699,600
Northfleld 12,711,800 0 0 350,849,232 263,800 350,585,432 60,000 4,935,200
Northumberland 25,365,600 0 0 128,212,155 0 128,212,155 60,000 178,640
Northwood 6,697,300 0 0 ■ 488,233,294 9,405 488,223,889 60,000 6,072,000
Nottingham 14,595,400 0 0 632,343,050 2,500 632,340,550 74,400 5,965,600
Odell 0 0 0 2,265,573 0 2,265,573 0 0
Orange 919,100 0 0 32,793,535 0 32,793,535 0 115,000
Orford 2,012,200 0 ' 0 137,342,151 0 137,342,151 0 70,000
Ossipee 12,485,200 0 0 775,433,608 0 775,433,608 45,000 3,624,500
Pelham 23,728,190 0 0 1,981,194,460 0 1,981,194,460 150,000 4,841,600
Pembroke 18,223,900 100,000 0 762,260,478 0 762,260,478 90,000 306,000
Peterborough 11,890,800 0 0 734,178,996 43,000 734,135,996 60,000 4,652,600
Piermont 2,235,700 0 0 97,137,103 0 97,137,103 0 215,000
Pinkham's Grant 144,196 0 0 2,934,826 0 2,934,826 0 0
Pittsburg 10,456,300 0 0 290,151,481 0 290,151,481 0 60,000
Pittsfleld 8,795,000 0 0 267,351,692 0 267,351,692 60,000 2,256,811
Plainfleld 7,626,000 0 0 307,832,486 150,000 307,682,486 94,000 1,637,500
Plaistow 12,233,060 6,968 0 1,192,542,632 0 1,192,542,632 75,000 8,379,200
Plymouth 25,177,200 0 0 481,301,108 0 481,301,108 35,000 678,300
Portsmouth 123,339,345 0 0 6,171,714,975 1,171,599 6,170,543,376 250,000 17,528,000
Randolph 4,368,300 0 0 71,499,816 0 71,499,816 0 30,000
www.revenue.nh.gov 2020 Annual Report Of the Department Of Revenue Administration 120
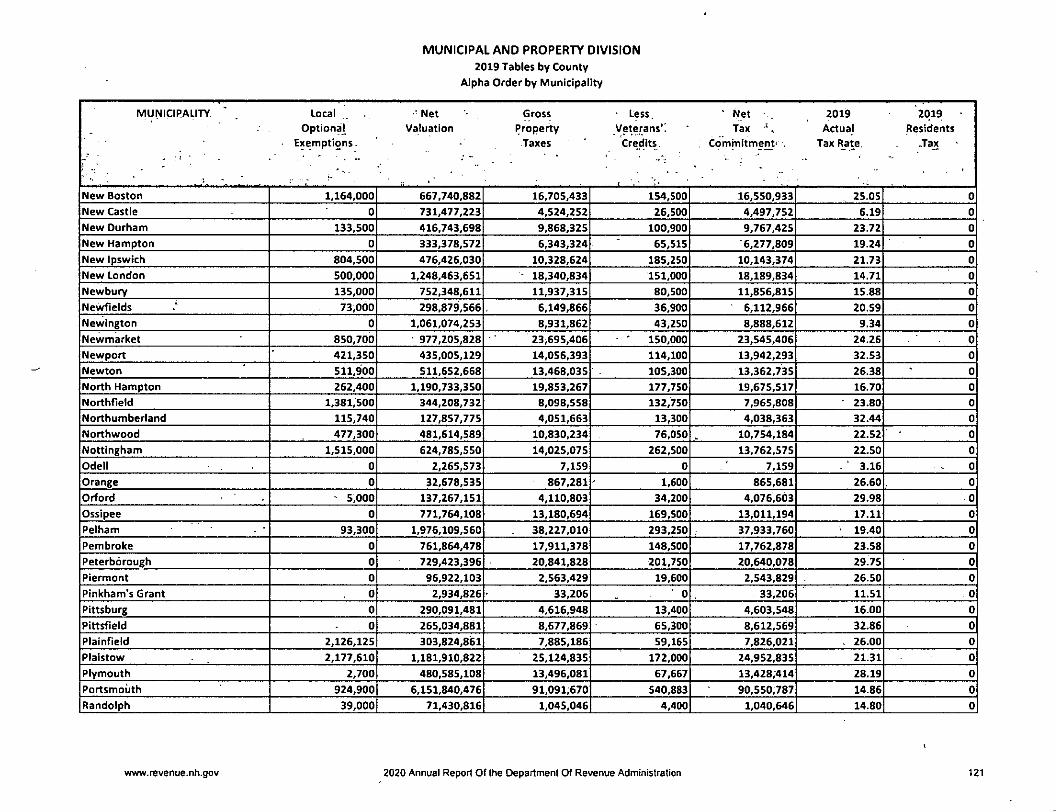
MUNICIPAL AND PROPERTY DIVISION
2019 Tables by County
Alpha Order by Municipality
MUNICIPALITY Local Net Gross • Less. • Net - . 2019 2019 •
Optional Valuation Property Veterans'! Tax '. Actual Residents
r"' :Exemptions. Taxes Credits : Commitment' . Tax Rate. .Tax •
New Boston 1,164,000 667,740,882 16,705,433 154,500 16,550,933 25.05 0
New Castle 0 731,477,223 4,524,252 26,500 4,497,752 6.19 0
New Durham 133,500 416,743,698 9,868,325 100,900 9,767.425 23.72 0
New Hampton 0 333,378,572 6,343,324 65,515 6,277,809 19.24 0
New Ipswich 804,500 476,426,030 10,328,624 185,250 10,143,374 21.73 0
New London 500,000 1,248,463,651 18,340,834 151,000 18,189,834 14.71 0
Newbury 135,000 752,348,611 11,937,315 80,500 11,856,815 15.88 0
Newflelds 73,000 298,879,566 6,149,866 36,900 6,112,966 20.59 0
Newlngton 0 1,061,074,253 8,931,862 43,250 8,888,612 9.34 0
Newmarket 850,700 977,205,828 23,695,406 150,000 23,545,406 24.26 0
Newport 421,350 435,005,129 14,056,393 114,100 13,942,293 32.53 0
Newton 511,900 511,652,668 13,468,035 105,300 13,362,735 26.38 0
North Hampton 262,400 1,190.733.350 19,853,267 177,750 19,675,517 16.70 0
Northfletd 1,381,500 344,208,732 8,098,558 132,750 7,965,808 23.80 0
Northumberland 115,740 127,857,775 4,051,663 13,300 4,038,363 32.44 0
Northwood 477,300 481,614,589 10,830,234 76,050 10,754,184 22.52 0
Nottingham 1,515,000 624,785,550 14,025,075 262,500 13,762,575 22.50 0
Odell 0 2,265,573 7,159 0 7,159 ' 3.16 0
Orange 0 32,678,535 867.281 1,600 865,681 26.60 0
Orford ~ 5,000 137,267,151 4,110,803 34,200 4,076,603 29.98 0
Ossipee 0 771,764,108 13,180,694 169,500 13,011,194 17.11 0
Pelham 93,300 1,976,109,560 38,227,010 293,250 37,933,760 19.40 0
Pembroke 0 761,864,478 17,911,378 148,500 17,762,878 23.58 0
Peterborough 0 729,423,396 20,841,828 201,750 20,640,078 29.75 0
Piermont 0 96,922,103 2,563,429 19,600 2,543,829 26.50 0
Pihkham's Grant 0 2,934,826 33,206 ■ 0 33,206 11.51 0
Pittsburg 0 290,091,481 4,616,948 13,400 4,603,548 16.00 0
Pittsfieid 0 265,034,881 8,677,869 65,300 8,612,569 32.86 0
Plainfield 2,126,125 303,824,861 7,885,186 59,165 7,826,021 . 26.00 0
Plaistow 2,177,610 1,181,910,822 25,124,835 172,000 24,952,835 21.31 0
Plymouth 2,700 480,585,108 13,496,081 67,667 13,428,414 28.19 0
Portsmouth 924,900 6,151,840,476 91,091,670 540,883 90,550,787 14.86 0
Randolph 39,000 71,430,816 1,045,046 4,400 1,040,646 14.80 0
www.revenue.nh.gov 2020 Annual Report Of the Department Of Revenue Administration 121
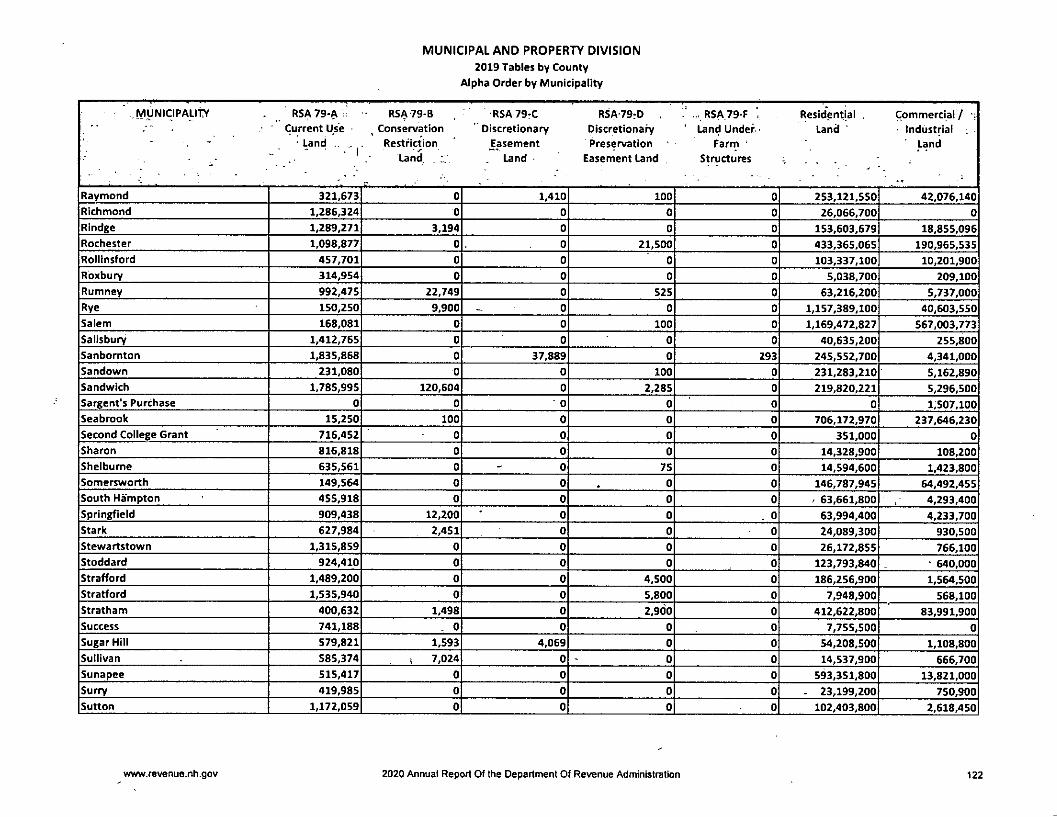
MUNICIPAL AND PROPERTY DIVISION
2019 Tables by County
Alpha Order by Municipality
.MUNICIPALltY RSA79-A • RSA79-B RSA79:C RSA79rD RSA79-F ■ Residential . Commercial / •;Current Use Conservation ' Discretionary Discretional ' Land Under- Land ' ■ Industrial
■ Land Restriction Easement Preservation Farm ' Land
Land . ... Land Easement Land Structures■ ■ ■. •
,
Raymond 321,673 0 1,410 100 0 253,121,550 42,076,140Richmond 1,286,324 0 0 0 0 26,066,700 0
Rindge 1,289,271 3,194 0 0 0 153,603,679 18,855,096Rochester 1,098,877 0 0 21,500 0 433,365,065 190,965,535Roliinsford 457,701 0 0 0 0 103,337,100 10,201,900Rbxbury 314,954 0 0 0 0 5,038,700 209,100Rumney 992,475 22,749 0 525 0 63,216,200 5,737,000Rye 150,250 9,900 0 0 0 1,157,389,100 40,603,550Salem 168,081 0 0 100 0 1,169,472,827 567,003,773Salisbury 1,412,765 0 0 0 0 40,635,200 255,800Sanbomton 1,835,868 0 37,889 0 293 245,552,700 4,341,000Sandown 231.080 0 0 100 0 231,283,210 5,162,890Sandwich 1,785,995 120,604 0 2,285 0 219,820,221 5,296,500Sargent's Purchase 0 0 ■ 0 0 0 0 1,507,100Seabrook 15,250 100 0 0 0 706,172,970 237,646,230Second College Grant 716,452 0 0 0 0 351,000 0
Sharon 816,818 0 0 0 0 14,328,900 108,200Sheiburne 635,561 0 0 75 0 14,594,600 1,423,800Somersworth 149,564 0 0 0 0 146,787,945 64,492,455South Hampton 455,918 0 0 0 0 ' 63,661,800 4,293,400Springfield 909,438 12,200 0 0 . 0 63,994,400 4,233,700Stark 627,984 2,451 0 0 0 24,089,300 930,500Stewartstown 1,315,859 0 0 0 0 26,172,855 766,100Stoddard 924,410 0 0 0 0 123,793,840 - 640,000Strafford 1,489,200 0 0 4,500 0 186,256,900 1,564,500Stratford 1,535,940 0 0 5,800 0 7,948,900 568,100Stratham 400,632 1,498 0 2,900 0 412,622,800 83,991,900Success 741,188 . 0 0 0 0 7,755,500 0
Sugar Hill 579,821 1,593 4,069 0 0 54,208,500 1,108,800Sullivan 585,374 I 7,024 0 0 0 14,537,900 666,700Sunapee 515,417 0 0 0 0 593,351,800 13,821,000Surry 419,985 0 0 0 0 . 23,199,200 750,900Sutton 1,172,059 0 0 0 0 102,403,800 2,618,450
wvAv.revenue.nh.gov 2020 Annual Report Of the Department Of Revenue Administration 122
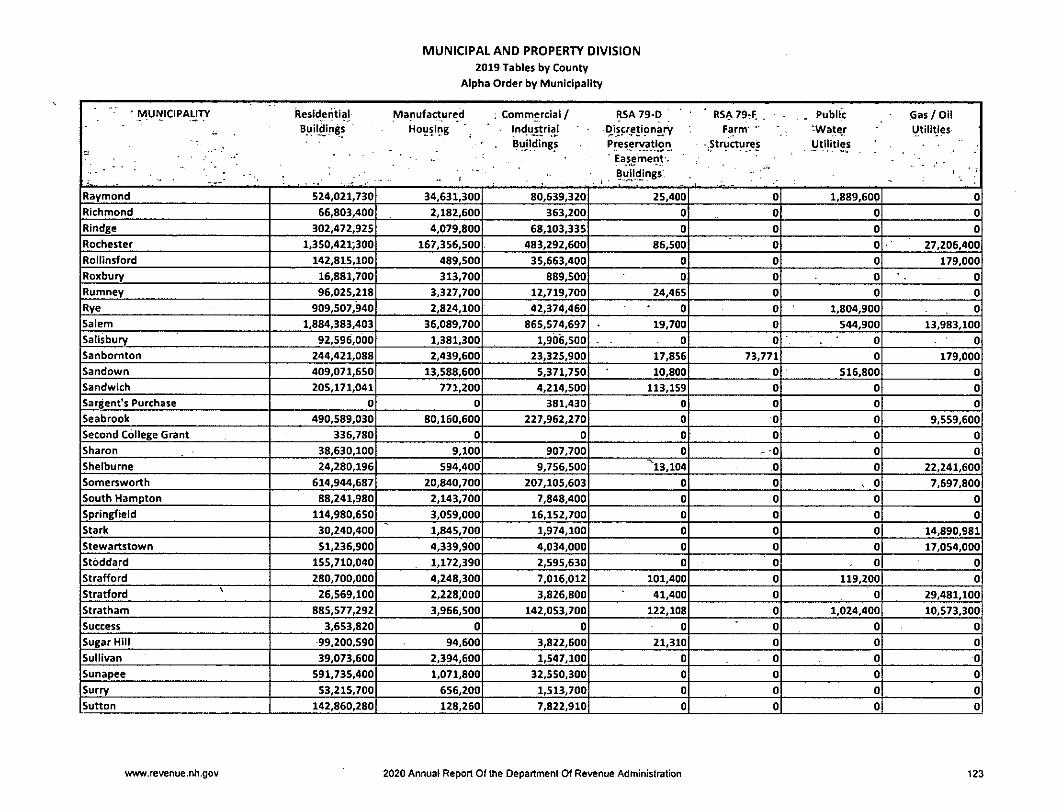
MUNICIPAL AND PROPERTY DIVISION
2019 Tables by County
Alpha Order by Municipality
• MUNICIPALITY Resideritlal- Manufactured , Commercial / R5A79-D R5A 79-F. , . Public Gas/OH■ Byildlngs Housing - Industrial Discretionary Farm •' -Water Utilities
Buildings Preservation • Structures Utilities• " Easement'. .
. . -
Buildings!.. I • . .
t '
Raymond 524,021,730 34,631,300 80,639,320 25,400 0 1,889,600 0
Richmond 66,803,400 2,182,600 363,200 0 0 0 0
RIndge 302,472,925 4,079,800 68,103,335 0 0 0 0
Rochester 1,350,421^300 167,356,500 483,292,600 86,500 0 0 27,206,400
Roltinsford 142,815,100 489,500 35,663,400 0 0 0 179,000
Roxbury 16,881,700 313,700 889,500 0 0 0 0
Rumney 96,025,218 3,327,700 12,719,700 24,465 0 0 0
Rye 909,507,940 2,824,100 42,374,460 0 0 1,804,900 0
Salem 1,884,383,403 36,089,700 865,574,697 19,700 0 544,900 13,983,100
Salisbury 92,596,000 1,381,300 1,906,500 0 0 0 0
Sanbornton 244,421,088 2,439,600 23,325,900 17,856 73,771 0 179,000
Sandown 409,071,650 13,588,600 5,371,750 10,800 0 516,800 0
Sandwich 205,171,041 771,200 4,214,500 113,159 0 0 0
Sargent's Purchase 0 0 381,430 0 0 0 0
Seabrook 490,589,030 80,160,600 227,962,270 0 0 0 9,559,600
Second College Grant 336,780 0 0 0 0 0 0
Sharon 38,630,100 9,100 907,700 0 - 0 0 0
Shelburne 24,280,196 594,400 9,756,500 ^13,104 0 0 22,241,600
Somersworth 614,944,687 20,840,700 207,105,603 0 0 . 0 7,697,800
South Hampton 88,241,980 2,143.700 7,848,400 0 0 0 0
Springfield 114,980,650 3,059,000 16,152,700 0 0 0 0
Stark 30,240,400 1,845,700 1,974,100 0 0 0 14,890,981
Stewartstown 51,236,900 4,339,900 4,034,000 0 0 0 17,054,000
Stoddard 155,710,040 1,172,390 2,595,630 0 0 0 0
Strafford 280,700,000 4,248,300 7,016,012 101,400 0 119,200 0
Stratford ^ 26,569,100 2,228;000 3,826,800 41,400 0 0 29,481,100
Stratham 885,577,292 3,966,500 142,053,700 122,108 0 1,024,400 10,573,300
Success 3,653,820 0 0 0 0 0 0
Sugar Hill 99,200,590 94,600 3,822,600 21,310 0 0 0
Sullivan 39,073,600 2,394,600 1,547,100 0 - 0 0 0
Sunapee 591,735,400 1,071,800 32,550,300 0 0 0 0
Surry 53,215,700 656,200 1,513,700 0 0 0 0
Sutton 142,860,280 128,260 7,822,910 0 0 0 0
www.revenue.nh.gov 2020 Annual Report Of the Department Of Revenue Administration 123
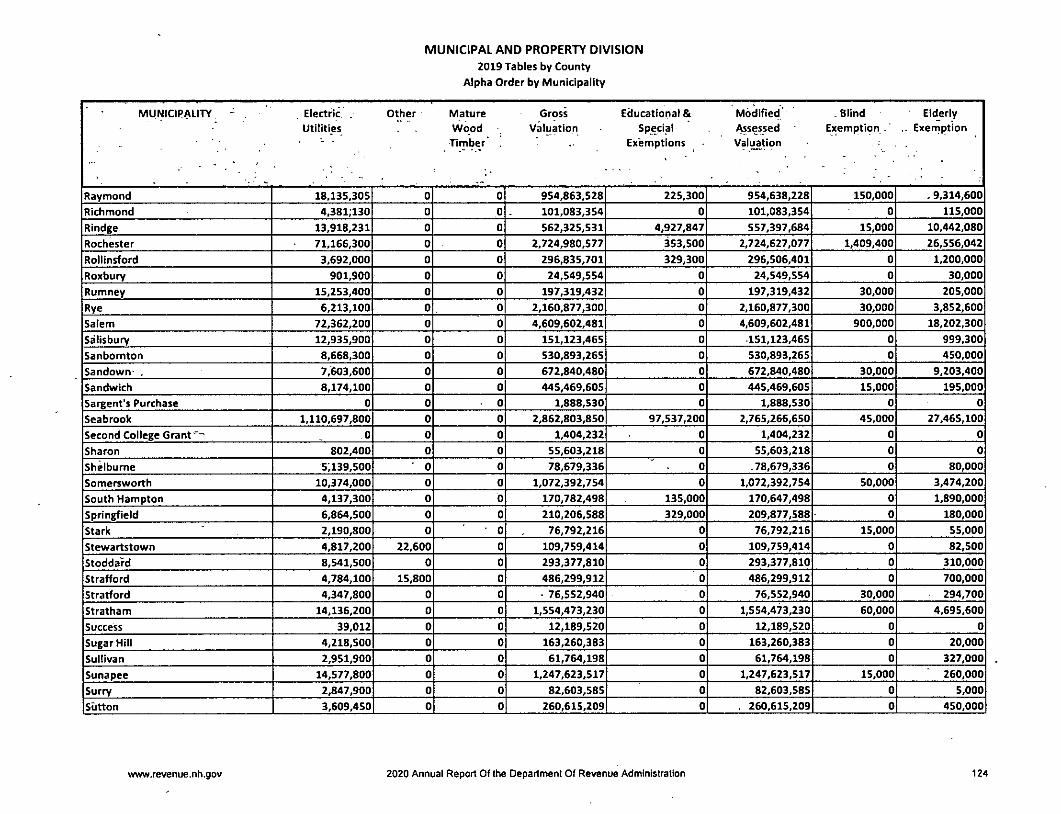
MUNICIPAL AND PROPERTY DIVISION
2019 Tables by County
Alpha Order by Municipality
MUNICIPALITY. .Electric . Other Mature Gross Educational & Modified' .Blind ElderlyUtilities Wood Valuation Special /i^sessed Exemption.' .. Exemption
■ - • Timber Exemptions Valuation
Raymond 18,135,305 0 0 954,863,528 225,300 954,638,228 150,000 . 9,314,600
Richmond 4.381;130 0 0 101,083,354 0 101,083,354 0 115,000
Rindge 13,918,231 0 0 562,325,531 4,927,847 557,397,684 15,000 10,442,080
Rochester 71,166,300 0 0 2,724,980,577 353,500 2,724,627,077 1,409,400 26,556,042
Roliinsford 3,692,000 0 0 296,835,701 329,300 296,506,401 0 1,200,000
Roxbury 901,900 0 0 24,549,554 0 24,549,554 0 30,000
Rumney 15,253,400 0 0 197,319,432 0 197,319,432 30,000 205,000
Rye 6,213,100 0 0 2,160,877,300 0 2,160,877,300 30,000 3,852,600
Salem 72,362,200 0 0 4,609,602,481 0 4,609,602,481 900,000 18,202,300
Salisbury 12,935,900 0 0 151,123,465 0 151,123,465 0 999,300
Sanbornton 8,668,300 0 0 530,893,265 0 530,893,265 0 450,000
SandoMfn- . 7,603,600 0 0 672,840,480 0 672,840,480 30,000 9,203,400
Sandwich 8,174,100 0 0 445,469,605 0 445,469,605 15,000 195,000
Sargent's Purchase 0 0 0 1,888,530 0 1,888,530 0 0
Seabrook 1,110,697,800 0 0 2,862,803,850 97,537,200 2,765,266,650 45,000 27,465,100
Second College Grant 0 0 0 1,404,232 0 1,404,232 0 0
Sharon 802,400 0 0 55,603,218 0 55,603,218 0 0
Shelbume 5;i39,500 0 0 78,679,336 0 .78,679,336 0 80,000
Somersworth 10,374,000 0 0 1,072,392,754 0 1,072,392,754 50,000 3,474,200
South Hampton 4,137,300 0 0 170,782,498 135,000 170,647,498 0 1,890,000
Springfield 6,864,500 0 0 210,206,588 329,000 209,877,588 0 180,000
Stark 2,190,800 0 ■ 0 76,792,216 0 76,792,216 15,000 55,000
Stewartstown 4,817,200 22,600 0 109,759,414 0 109,759,414 0 82,500
Stoddard 8,541,500 0 0 293,377,810 0 293,377,810 0 310,000
Strafford 4,784,100 15,800 0 486,299,912 0 486,299,912 0 700,000
Stratford 4,347,800 0 0 - 76,552,940 0 76,552,940 30,000 294,700
Stratham 14,136,200 0 0 1,554,473,230 0 1,554,473,230 60,000 4,695,600
Success 39,012 0 0 12,189,520 0 12,189,520 0 0
Sugar Hill 4,218,500 0 0 163,260,383 0 163,260,383 0 20,000
Sullivan 2,951,900 0 0 61,764,198 0 61,764,198 0 327,000
Sunapee 14,577,800 0 0 1,247,623,517 0 1,247,623,517 15,000 260,000
Surry 2,847,900 0 0 82,603,585 0 82,603,585 0 5,000
Sutton 3,609,450 0 0 260,615,209 0 . 260,615,209 0 450,000
www.revenue.nh.gov 2020 Annual Report Of (he Departmeni Of Revenue Administration 124
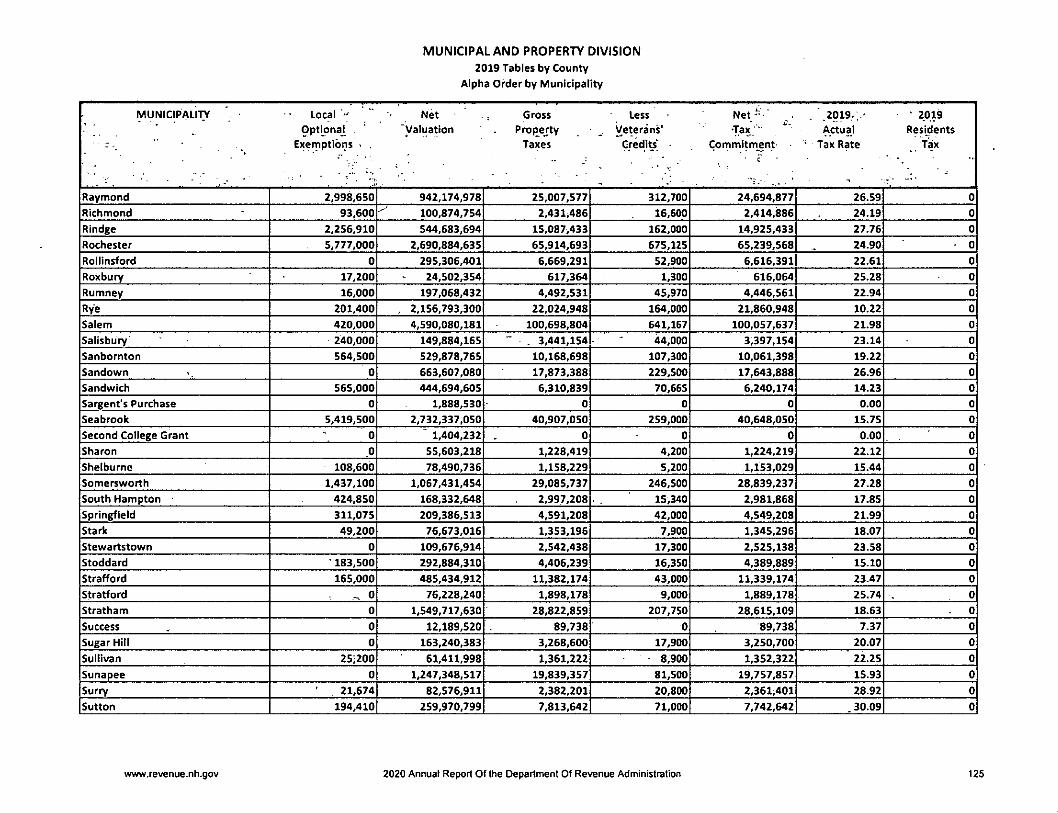
MUNICIPAL AND PROPERTY DIVISION
2019 Tables by County
Alpha Order by Municipality
MUNICIPALITY Local Net - Gross Less Net-- ' 2019.,,' • 2019
Optional . 'Valuation Property Veterans' Tax Actual Residents
Exemptions < Taxes Gredite" CommitmentC
- Tax Rate Tax
Raymond 2,998,650 942,174,978 25,007,577 312,700 24,694,877 26.59 0
Richmond 93,600 100,874,754 2,431,486 16,600 2,414,886 24.19 0
Rindge 2,256,910 544,683,694 15,087,433 162,000 14,925,433 27.76 0
Rochester 5,777,000 2,690,884,635 65,914,693 675,125 65,239,568 24.90 • 0
Rollinsford 0 295,306,401 6,669,291 52,900 6,616,391 22.61 0
Roxbury 17,200 24,502,354 617,364 1,300 616,064 25.28 0
Rumney 16,000 197,068,432 4,492,531 45,970 4,446,561 22.94 0
Rye 201,400 . 2,156,793,300 22,024,948 164,000 21,860,948 10.22 0
Salem 420,000 4,590,080,181 100,698,804 641,167 100,057,637 21.98 0
Salisbury 240,000 149,884,165 . 3.441,154 44,000 3,397,154 23.14 0
Sanbornton 564,500 529,878,765 10,168,698 107,300 10,061,398 19.22 0
Sandown 0 663,607,080 17,873,388 229,500 17,643,888 26.96 0
Sandwich 565,000 444,694,605 6,310,839 70,665 6,240,174 14.23 0
Sargent's Purchase 0 1,888,530 0 0 0 0.00 0
Seabrook 5,419,500 2,732,337,050 40,907,050 259,000 40,648,050 15.75 0
Second College Grant 0 " 1,404,232 0 0 0 0.00 0
Sharon 0 55,603,218 1,228,419 4,200 1,224,219 22.12 0
Shelburne 108,600 78,490,736 1,158,229 5,200 1,153,029 15.44 0
Somersworth 1,437,100 1,067,431,454 29,085,737 246,500 28,839,237 27.28 0
South Hampton 424,850 168,332,648 2,997,208 15,340 2,981,868 17.85 0
Springfield 311,075 209,386,513 4,591,208 42,000 4,549,208 21.99 0
Stark 49,200 76,673,016 1,353,196 7,900 1,345,296 18.07 0
Stewartstown 0 109,676,914 2,542,438 17,300 2,525,138 23.58 0
Stoddard 183,500 292,884,310 4,406,239 16,350 4,389,889 15.10 0
Strafford 165,000 485,434,912 11,382,174 43,000 11,339,174 23.47 0
Stratford - 0 76,228,240 1,898,178 9,000 1,889,178 25.74 0
Stratham 0 1,549,717,630 28,822,859 207,750 28,615,109 18.63 0
Success 0 12,189,520 89,738 0 89,738 7.37 0
Sugar Hill 0 163,240,383 3,268,600 17,900 3,250,700 20.07 0
Sullivan 25)200 61,411,998 1,361,222 8,900 1,352,322 22.25 0
Sunapee 0 1,247,348,517 19,839,357 81,500 19,757,857 15.93 0
Surpy 21,674 82,576,911 2,382,201 20,800 2,361,401 28.92 0
Sutton 194,410 259,970,799 7,813,642 71,000 7,742,642 30.09 0
www.revenue.nh.gov 2020 Annual Report Of the Department Of Revenue Administration 125
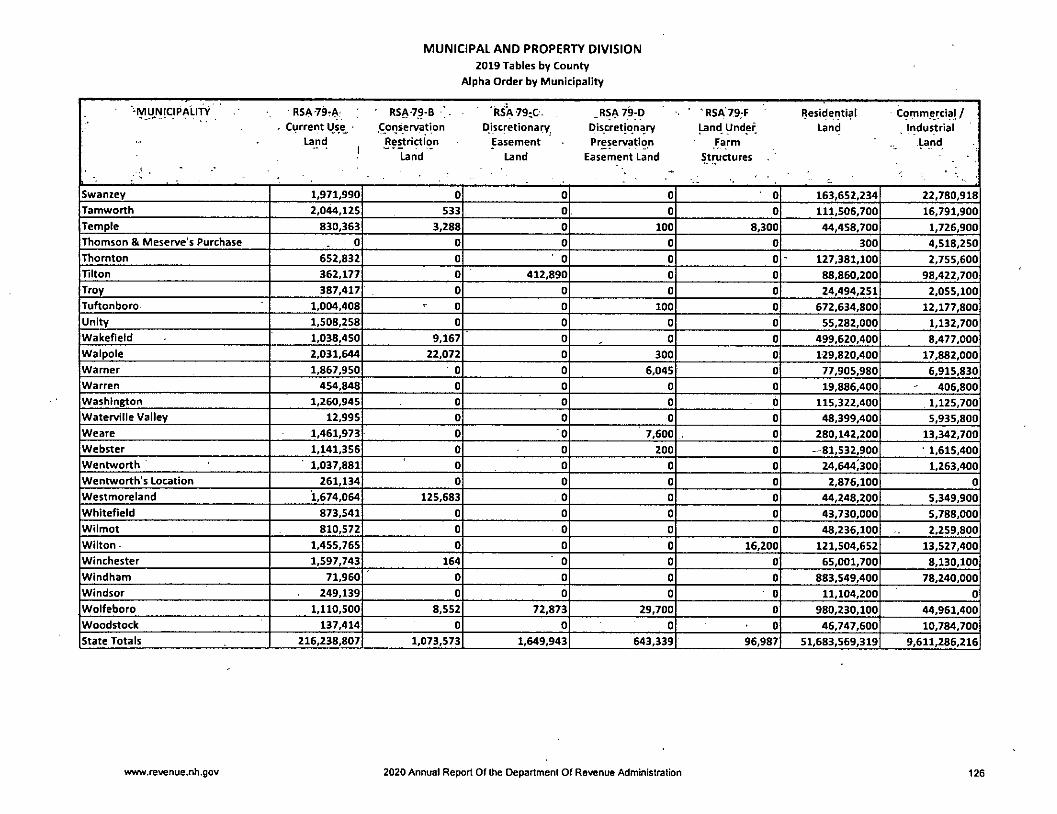
MUNICIPAL AND PROPERTY DIVISION
2019 Tables by County
Alpha Order by Municipality
-MUNICiPAllTY RSA79rA' ' RSA79-B '. ■Rs'a79:C. RSA 79-D ■ 'RSA79-F Residential Commercial /. Current Use Conservation Discretionary, Discretionary Land Under Land Industrial
-Land Restriction Easement Preservation Farm Land
;Land Land Easement Land Structures
Swanzey 1,971,990 0 0 0 0 163,652,234 22,780,918Tamworth 2,044,125 533 0 0 0 111,506,700 16,791,900Temple 830,363 3,288 0 100 8,300 44,458,700 1,726,900Thomson & Meserve's Purchase 0 0 0 0 0 300 4,518,250Thornton 652,832 0 ■ 0 0 0 127,381,100 2,755,600niton 362,177 0 412,890 0 0 88,860,200 98,422,700Troy 387,417 0 0 0 0 24,494,251 2,055,100Tuftonboro 1,004,408 0 0 100 0 672,634,800 12,177,800Unity 1,508,258 0 0 0 0 55,282,000 1,132,700Wakefield 1,038,450 9,167 0 0 0 499,620,400 8,477.000Walpole 2,031,644 22,072 0 300 0 129,820,400 17,882,000Warner 1,867,950 0 0 6,045 0 77,905,980 6,915,830Warren 454,848 0 0 0 0 19,886,400 406,800Washington 1,260,945 0 0 0 0 115,322,400 1,125,700Waterville Valley 12,995 0 0 0 0 48,399,400 5,935,800Weare 1,461,973 0 0 7,600 0 280,142,200 13,342,700Webster 1,141,356 0 0 200 0 -81,532,900 • 1,615,400Wentworth 1,037,881 0 0 0 0 24,644,300 1,263,400Wentworth's Location 261,134 0 0 0 0 2,876,100 0
Westmoreland 1,674,064 125,683 . 0 0 0 44,248,200 5,349,900Whitefield 873,541 0 0 0 0 43,730,000 5,788,000Wilmot 810,572 0 0 0 0 48,236,100 2,259,800Wilton • 1,455,765 0 0 0 16,200 121,504,652 13,527,400Winchester 1,597,743 164 0 0 0 65,001,700 8,130,100Windham 71,960 0 0 0 0 883,549,400 78,240,000Windsor 249,139 0 0 0 0 11,104,200 0
Wolfeboro 1,110,500 8,552 72,873 29,700 0 980,230,100 44,961,400Woodstock 137,414 0 0 0 0 46,747,600 10,784,700State Totals 216,238,807 1,073,573 1,649,943 643,339 96,987 51,683,569,319 9,611,286,216
vvww.revenue.nh.gov 2020 Annual Report Of the Department Of Revenue Administration 126
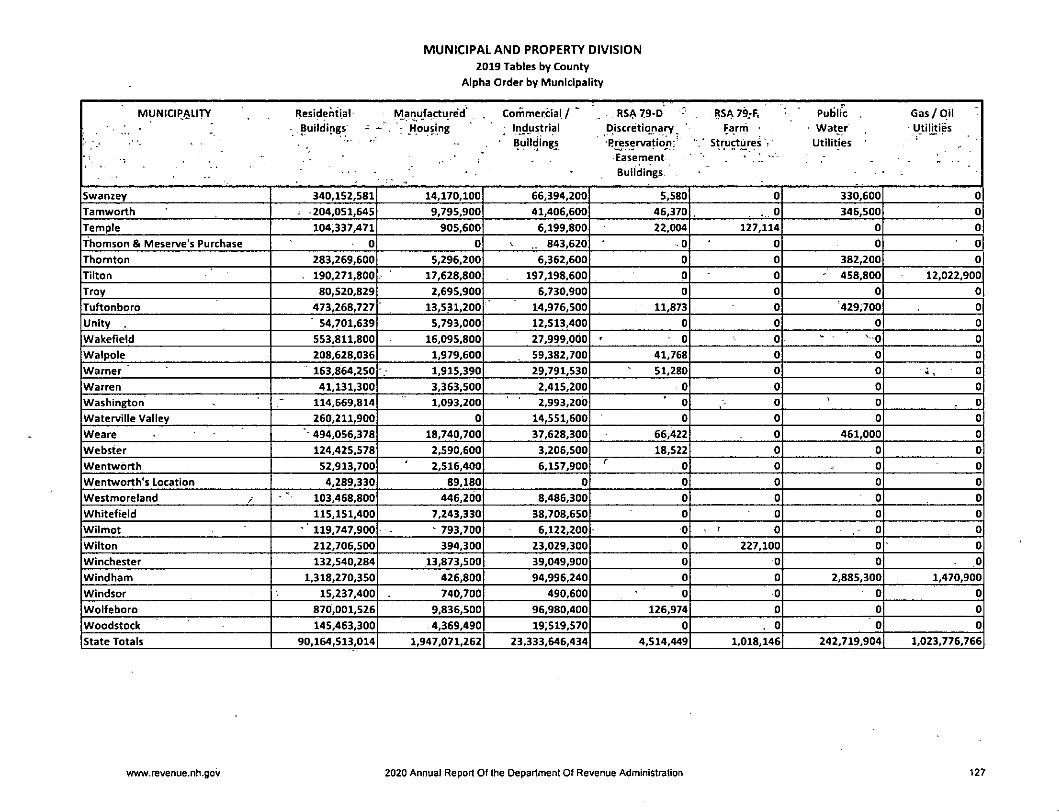
MUNICIPAL AND PROPERTY DIVISION
2019 Tables by County
Alpha Order by Municipality
municipality Residential- Manufactured' Cortimerdal. / " _ ,RSA79-D ^ . RSA79*F. Public Gas/Oil- Buildings ~ - . ; Housing - Industrial Discretionary^ Farrti • • Water -Utilities
' - " " Buildings -Rreservation:" Structures r' Utilities■ r Easement , • L ..
* Buildings
Swanzey 340,152,581 14,170,100 66,394,200 5,580 0 330,600 0
Tamworth . 204,051,645 9,795,900 41,406,600 46,370 . 0 346,500 0
Temple 104,337,471 905,600 6,199,800 22,004 127,114 0 0
Thomson & Meserve's Purchase 0 0 ^ .. 843,620 -0 0 0 0
Thornton 283,269,600 5,296,200 6,362,600 0 0 382,200 0
Tilton 190,271,800 17,628,800 197,198.600 0 0 458,800 12,022,900
Troy 80,520,829 2,695,900 6,730,900 0 0 0 0
Tuftonboro 473,268,727 13,531,200 14,976,500 11,873 0 '429,700 0
Unity ■ 54,701,639 5,793,000 12,513,400 0 0 0 0
Wakefield 553,811,800 16,095,800 27,999,000 0 0 S Q 0
Walpole 208,628,036 1,979,600 59,382,700 41,768 0 0 0
Warner 163,864,250 1,915,390 29,791,530 51,280 0 0 ■i, 0Warren 41,131,300 3,363,500 2,415,200 0 0 0 0
Washington 114,669,814 1,093.200 2,993,200 ' 0 0 0 0
Waterville Valley 260,211,900 0 14,551,600 0 0 0 0
Weare -494,056,378 18,740,700 37,628,300 66,422 0 461,000 0
Webster 124,425,578 2,590,600 3,206,500 18,522 0 0 0
Wentwbrth 52,913,700 2,516,400 6,157,900 0 0 0 0
Wentworth's Location 4,289,330 89,180 0 0 0 0 0
Westmoreland / 103,468,800 446,200 8,486,300 0 0 0 0
Whitefield 115,151,400 7,243,330 38,708,650 0 0 0 0
Wilmot • 119,747,900 ^ 793,700 6,122,200 0 ■ ' 0 0 0
Wilton 212,706,500 394,300 23,029,300 0 227,100 0 0
Winchester 132,540,284 13,873,500 39,049,900 0 0 0 0
Windham 1,318,270,350 426,800 94,996,240 0 0 2,885,300 1,470,900
Windsor 15,237,400 740,700 490,600 0 0 0 0
Wolfeboro 870,001,526 9,836,500 96,980,400 126,974 0 0 0
Woodstock 145,463,300 4,369,490 19;519,570 0 . 0 0 0
State Totals 90,164,513,014 1,947,071,262 23,333,646,434 4,514,449 1,018,146 242,719,904 1,023,776,766
www.revenue.nh.gov 2020 Annual Report Of the Department Of Revenue Administration 127
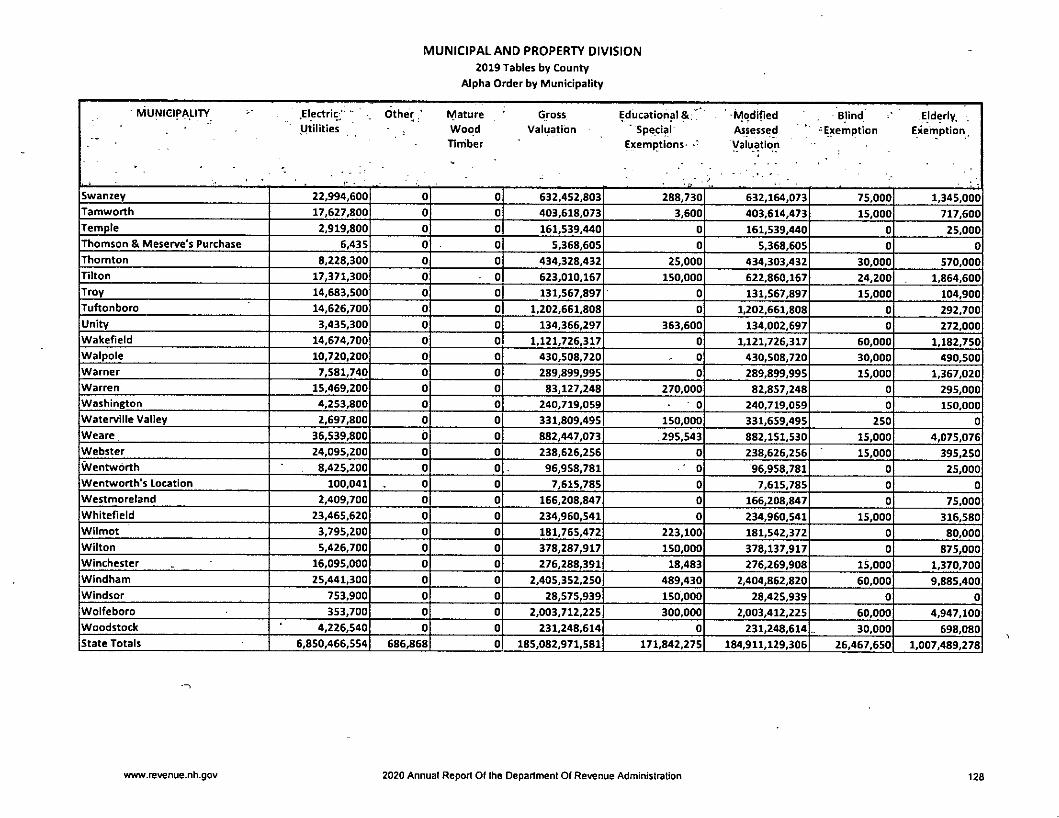
MUNICIPAL AND PROPERTY DIVISION
2019 Tables by County
Alpha Order by Municipality
MUNIGIpALITY .Electric; " Other Mature Gfoss Educational ' ' Modified Blind Elderly..Utilities Wood Valuation ' Special Assessed ' -Exemption Exemption.
Tirhber Exemptions- •" Valuation
Swanzey 22,994,600 0 0 632,452,803 288,730 632,164,073 75,000 1,345,000
Tamworth 17,627,800 0 0 403,618,073 3,600 403,614,473 15,000 717,600
Temple 2,919,800 0 0 161,539,440 0 161,539,440 0 25,000
Thomson & Meserve's Purchase 6,43 S 0 0 5,368,605 0 5,368,605 0 0
Thornton 8,228,300 0 0 434,328,432 25,000 434,303,432 30,000 570,000
Tilton 17,371,300 0 0 623,010,167 150,000 622,860,167 24,200 1,864,600
Troy 14,683,500 0 0 131,567,897 0 131,567,897 15,000 104,900
Tuftonboro 14,626,700 0 0 1,202,661,808 0 1,202,661,808 0 292,700
Unity 3,435,300 0 0 134,366,297 363,600 134,002,697 0 272,000
Wakefield 14,674,700 0 0 1,121,726,317 0 1,121,726,317 60,000 1,182,750
Walpole 10,720,200 0 0 430,508,720 0 430,508,720 30,000 490,500
Warner 7,581,740 0 0 289,899,995 0 289,899,995 15,000 1,367,020
Warren 15,469,200 0 0 83,127,248 270,000 82,857,248 0 295,000
Washington 4,253,800 0 0 240,719,059 0 240,719,059 0 150,000
Waterville Valley 2,697,800 0 0 331,809,495 150,000 331,659,495 250 0
Weare 36,539,800 0 0 882,447,073 295,543 882,151,530 15,000 4,075,076
Webster 24,095,200 0 0 238,626,256 0 238,626,256 15,000 395,250
Wentworth 8,425,200 0 0 96,958,781 ■ 0 96,958,781 0 25,000
Wentworth's Location 100,041 0 0 7,615,785 0 7,615,785 0 0
Westmoreland 2,409,700 0 0 166,208,847 0 166,208,847 0 75,000
Whitefield 23,465,620 0 0 234,960,541 0 234,960,541 15,000 316,580
Wilmot 3,795,200 0 0 181,765,472 223,100 181,542,372 0 80,000
Wilton 5,426,700 0 0 378,287,917 150,000 378,137,917 0 875,000
Winchester 16,095,000 0 0 276,288,391 18,483 276,269,908 15,000 1,370,700
Windham 25,441,300 0 0 2,405,352,250 489,430 2,404,862,820 60,000 9,885,400
Windsor 753,900 0 0 28,575,939 150,000 28,425,939 0 0
Wolfeboro 353,700 0 0 2,003,712,225 300,000 2,003,412,225 60,000 4,947,100
Woodstock 4,226,540 0 0 231,248,614 0 231,248,614 30,000 698,080
State Totals 6,850,466,554 686,868 0 185,082,971,581 171,842,275 184,911,129,306 26,467,650 1,007,489,278
www.revenue.nh.gov 2020 Annual Report Of the Department Of Revenue Administration 128
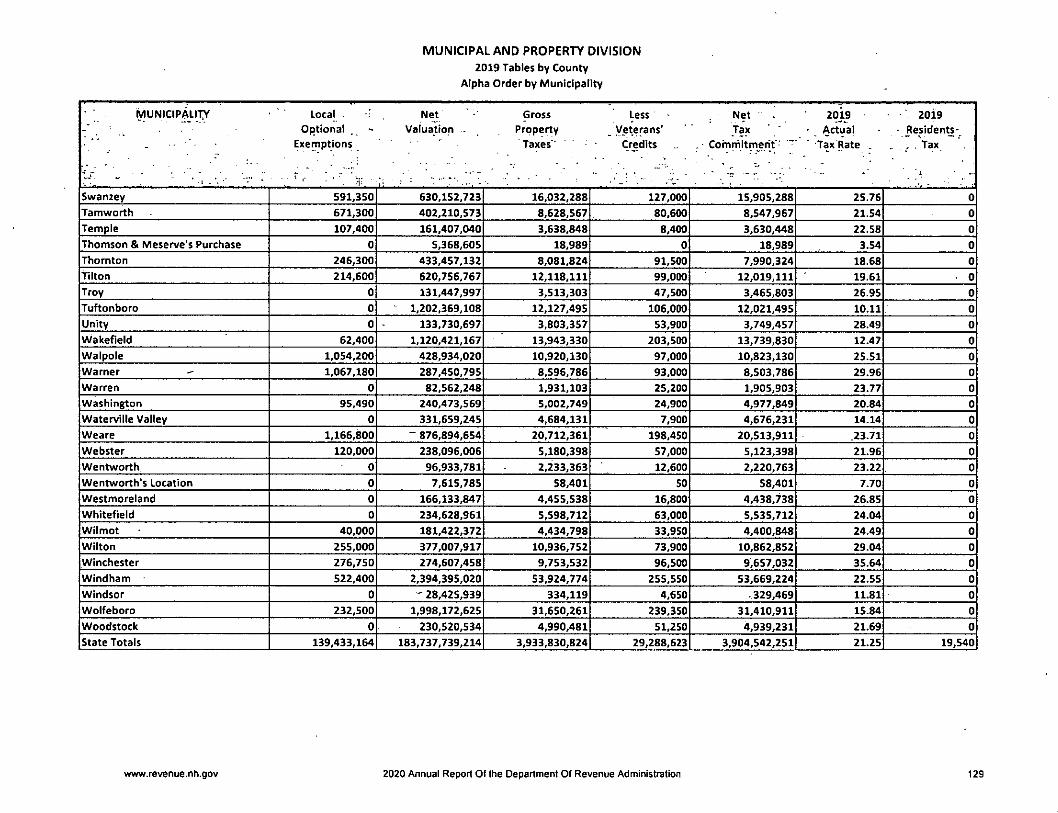
MUNICIPAL AND PROPERTY DIVISION
2019 Tables by County
Alpha Order by Municipality
MUNICIPALITY Local . Net Gross Less Net 2019 • . 20i9
Optional Valuation ■ Property Veterans' Tax - Actual ■ Residents-
Exernptions Taxes" Credits . • ComrhitrTierif •' ■ Tax Rate . , Tax,
Swanzey 591,350 630,152,723 16,032,288 127,000 15,905,288 25.76 0
Tamworth 671,300 402,210,573 8,628,567 80,600 8,547,967 21.54 0
Temple 107,400 161,407,040 3,638,848 8,400 3,630,448 22.58 0
Thomson & Meserve's Purchase 0 5,368,605 18,989 0 18,989 3.54 0
Thornton 246,300 433,457,132 8,081,824 91,500 7,990,324 18.68 0
Tilton 214,600 620,756,767 12,118,111 99,000 12,019,111 19.61 0
Troy 0 131,447,997 3,513,303 47,500 3,465,803 26.95 0
Tuftonboro 0 - 1,202,369,108 12,127,495 106,000 12,021,495 10.11 0
Unity 0 133,730,697 3,803,357 53,900 3,749,457 28.49 0
Wakefield 62,400 1,120,421,167 13,943,330 203,500 13,739,830 12.47 0
Walpole 1.054,200 428,934,020 10,920,130 97,000 10,823,130 25.51 0
Warner -■ 1,067,180 287,450,795 8,596,786 93,000 8,503,786 29.96 0
Warren 0 82,562,248 1,931,103 25,200 1,905,903 23.77 0
Washington 95,490 240,473,569 5,002,749 24,900 4,977,849 20.84 0
Waterville Valley 0 331,659,245 4,684,131 7,900 4,676,231 14.14 0
Weare 1,166,800 " 876,894,654 20,712,361 198,450 20,513,911 .23.71 0
Webster 120,000 238,096,006 5,180,398 57,000 5,123,398 21.96 0
Wentworth 0 96,933,781 2,233,363 12,600 2,220,763 23.22 0
Wentworth's Location 0 7,615,785 58,401 50 58,401 7.70 0
Westmoreland 0 166,133,847 4,455,538 16,800 4,438,738 26.85 0
Whitefield 0 234,628,961 5,598,712 63,000 5,535,712 24.04 0
Wilmot 40,000 181,422,372 4,434,798 33,950 4,400,848 24.49 0
Wilton 255,000 377,007,917 10,936,752 73,900 10,862,852 29.04 0
Winchester 276,750 274,607,458 9,753,532 96,500 9,657,032 35.64 0
Windham 522,400 2,394,395,020 53,924,774 255,550 53,669,224 22.55 0
Windsor 0 - 28,425,939 334,119 4,650 329,469 11.81 0
Wolfeboro 232,500 1,998,172,625 31,650,261 239,350 31,410,911 15.84 0
Woodstock 0 230,520,534 4,990,481 51,250 4,939,231 21.69 0
State Totals 139,433,164 183,737,739,214 3,933,830,824 29,288,623 3,904,542,251 21.25 19,540
www.revenue.nh.gov 2020 Annual Report Of the Department Of Revenue Administration 129
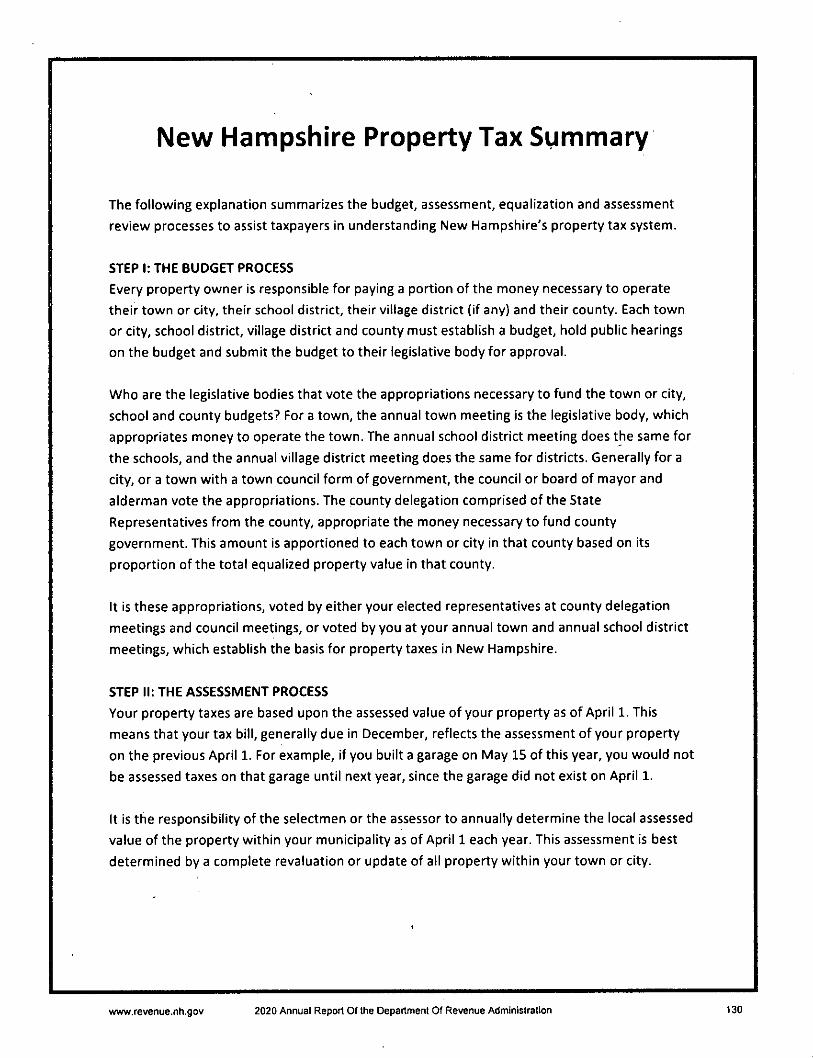
New Hampshire Property Tax Summary
The following explanation summarizes the budget, assessment, equalization and assessment
review processes to assist taxpayers In understanding New Hampshire's property tax system.
STEP I: THE BUDGET PROCESS
Every property owner Is responsible for paying a portion of the money necessary to operate
their town or city, their school district^ their village district (If any) and their county. Each town
or city, school district, village district and county must establish a budget, hold public hearings
on the budget and submit the budget to their legislative body for approval.
Who are the legislative bodies that vote the appropriations necessary to fund the town or city,
school and county budgets? For a town, the annual town meeting is the legislative body, which
appropriates money to operate the town. The annual school district meeting does the same for
the schools, and the annual village district meeting does the same for districts. Generally for a
city, or a town with a town council form of government, the council or board of mayor and
alderman vote the appropriations. The county delegation comprised of the State
Representatives from the county, appropriate the money necessary to fund county
government. This amount Is apportioned to each town or city In that county based on Its
proportion of the total equalized property value In that county.
It Is these appropriations, voted by either your elected representatives at county delegation
meetings and council meetings, or voted by you at your annual town and annual school district
meetings, which establish the basis for property taxes In New Hampshire.
STEP II: THE ASSESSMENT PROCESS
Your property taxes are based upon the assessed value of your property as of April 1. This
means that your tax bill, generally due In December, reflects the assessment of your property
on the previous April 1. For example. If you built a garage on May 15 of this year, you would not
be assessed taxes on that garage until next year, since the garage did not exist on April 1.
It Is the responsibility of the selectmen or the assessor to annually determine the local assessed
value of the property within your municipality as of April 1 each year. This assessment Is best
determined by a complete revaluation or update of all property within your town or city.
www.revenue.nh.gov 2020 Annual Report Of the Department Of Revenue Administration 130
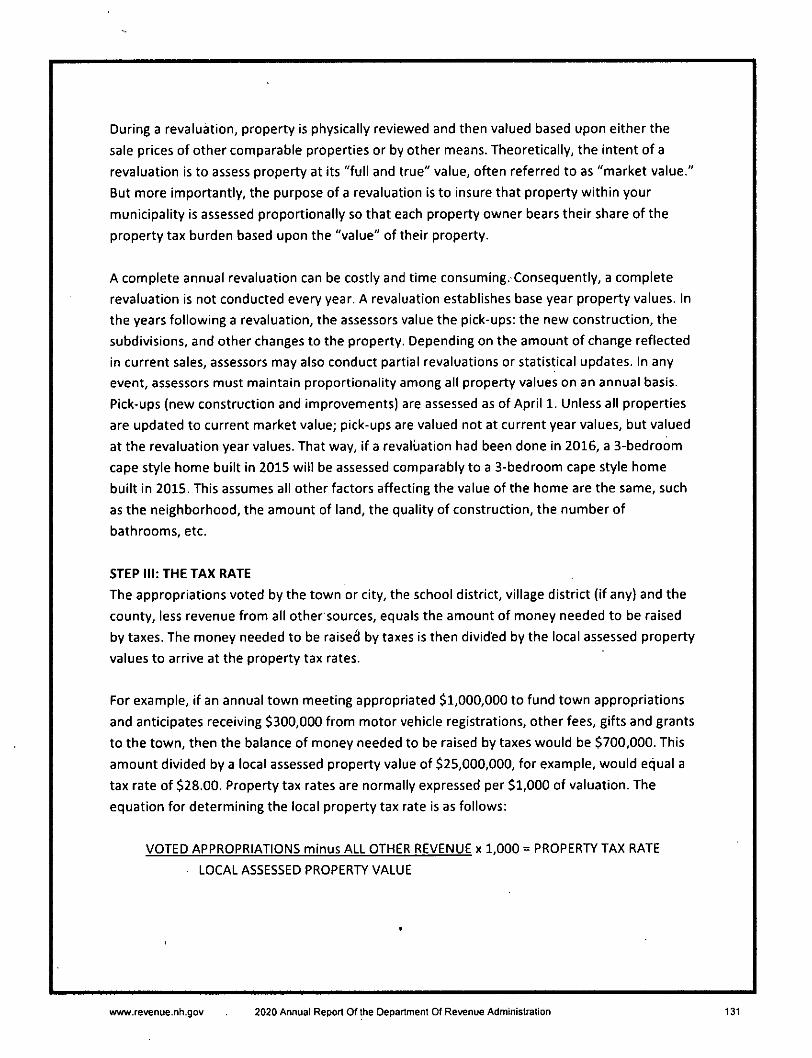
During a revaluation, property is physically reviewed and then valued based upon either the
sale prices of other comparable properties or by other means. Theoretically, the intent of a
revaluation is to assess property at its "full and true" value, often referred to as "market value."
But more importantly, the purpose of a revaluation is to insure that property within your
municipality is assessed proportionally so that each property owner bears their share of the
property tax burden based upon the "value" of their property.
A complete annual revaluation can be costly and time consuming. Consequently, a complete
revaluation is not conducted every year. A revaluation establishes base year property values. In
the years following a revaluation, the assessors value the pick-ups: the new construction, the
subdivisions, and other changes to the property. Depending on the amount of change reflected
in current sales, assessors may also conduct partial revaluations or statistical updates. In any
event, assessors must maintain proportionality among all property values on an annual basis.
Pick-ups (new construction and improvements) are assessed as of April 1. Unless all properties
are updated to current market value; pick-ups are valued not at current year values, but valued
at the revaluation year values. That way, if a revaluation had been done in 2016, a 3-bedroom
cape style home built in 2015 will be assessed comparably to a 3-bedroom cape style home
built in 2015. This assumes all other factors affecting the value of the home are the same, such
as the neighborhood, the amount of land, the quality of construction, the number of
bathrooms, etc.
STEP HI: THE TAX RATE
The appropriations voted by the town or city, the school district, village district (if any) and the
county, less revenue from all other sources, equals the amount of money needed to be raised
by taxes. The money needed to be raised by taxes is then divided by the local assessed property
values to arrive at the property tax rates.
For example, If an annual town meeting appropriated $1,000,000 to fund town appropriations
and anticipates receiving $300,000 from motor vehicle registrations, other fees, gifts and grants
to the town, then the balance of money needed to be raised by taxes would be $700,000. This
amount divided by a local assessed property value of $25,000,000, for example, would equal a
tax rate of $28.00. Property tax rates are normally expressed per $1,000 of valuation. The
equation for determining the local property tax rate is as follows:
VOTED APPROPRIATIONS minus ALL OTHER REVENUE x 1,000 = PROPERTY TAX RATE
LOCAL ASSESSED PROPERTYVALUE
www.revenue.nh.gov 2020 Annual Report Of the Department Of Revenue Administration 131
By law, your property tax bill must show the assessed value of your property, along with the tax
rate for each component of the tax: the town/city, village districts (if any), county, local
education and state education tax rates.
STEP IV: EXEMPTIONS AND TAX CREDITS
An exemption is a reduction in the local assessed value of property, vyhile a credit is a reduction
of the amount of tax due.
Every municipality offers sorne form of an exemption for elderly property owners meeting
certain qualifications, and a tax credit for veterans. In addition, municipalities may adopt and
grant the following exemptions: blind, disabled, deaf, wood-heating energy system, wind-
powered energy system, and solar energy system exemptions. Property tax credits are available
to qualifying veterans or their surviving spouses.
Applications for an exemption or a tax credit must be made to the municipality by April 15th
prior to that year's tax bill. A tax deferral may be granted for elderly or disabled taxpayers
meeting certain criteria on an application submitted to the municipality by March 1^^ prior to .
that year's tax bill.
Education property tax relief is available to low and moderate income homeowners who:
• Oyvn a homestead or an interest in a homestead subject to the education property tax;
• Have resided in the homestead on April 1 of the year for which the claim is made; and
• Had a total "household income" of:
1. $20,000 or less if a single person;
2. $40,000 or less if married or head of a New Hampshire household.
Forms for the low and moderate income homeowner's property tax relief program are available
by May 1" on the Department of Revenue Administration's website at http://revenue.nh.eov/.
The form [DP-8] is a fillable PDF forrn which can be opened, completed, and saved.
Pursuant to RSA 198:57. VI. education property tax relief claims must be filed with the
Department of Revenue Administration between May 1st and June 30th following the due date
of the final tax bill as defined in RSA 76:l-a for state education property taxes. The Department
of Revenue Administration rules for the low and moderate income homeowner's property tax
relief are located at Rev 1200.
www.revenue.nh.gov 2020 Annual Report Of the Department Of Revenue Administration 132
STEP V: THE EQUALIZATION PROCESS
All towns and cities do not conduct revaluations in the same year. Some may be assessing
property close to full value (because they just conducted a revaluation) while other towns and
cities are assessing property at more or less than full value (because their revaluation is not
current). This inconsistency makes it difficult to compare towns and cities to one another since
the local assessed valuations are based upon different revaluation years.
The annual equalization survey conducted by the Department of Revenue Administration
addresses this inconsistency by adjusting each municipality's total local assessed property value
to full value.
The sole purpose for equalizing local assessed property values is to ensure that public taxes and
state revenues shared by towns and cities will be reasonably apportioned. This includes state
education tax, county tax, some cooperative school district taxes and some village districts
taxes. The equalization process involves a detailed study of property sales throughout the state
and compares those sales with the local property assessments. A by-product of the equalization
process is the determination of a ratio.
Generally, the ratio shows the average level at which the town or city assessed property In the
previous year In comparison to full value. Ratios for each municipality are issued by the
department generally by April as a result of the Equalization Process. For more information,
contact the Department at (603) 230-5950 or visit our web site at httoV/revenue.nh.eov/
For example, a ratio of 90% would indicate that the town generally assessed property at
approximately 90% of full value. The ratio does not necessarily apply to any specific property
assessment, but rather indicates the average level of assessment throughout the town or city.
Over a period of several years, as the value of property increases or decreases due to market
fluctuations, the ratio (the comparison of the local assessed value to full value) also fluctuates.
A ratio of 100% indicates that, on the average, the municipality is assessing at full value. A ratio
below 100% indicates average assessments are below full value, and a ratio above 100%
indicates average assessments are above full value.
Neither a high nor a low ratio, in itself, should be cause for alarm. Whether a town or city is
assessing at 110% or 90% of full value is really not significant. What's important is that the
assessments are proportional, so that each property owner bears their share of the property
tax burden based upon the value of their property.
www.revenue.nh.gov 2020 Annual Report Of the Department Of Revenue Administration 133

STEP VI: ASSESSMENT REVIEW
As a result of the Supreme Court's decision in Sirreil v. State of New Hampshire, RSA 75:8-a was
adopted which requires all towns and cities in New Hampshire to reappraise all real estate
within the municipality so that the assessments are at the full and true value at least as often as
every fifth year. The Department of Revenue Administration is mandated by RSA 21:J:ll-a & b
to review and report the degree to which assessments of municipalities achieve compliance
with applicable statutes and rules. The fourth five-year cycle began in 2018. Approximately one-
fourth of the towns and cities will be scheduled for this Assessment Review in 2018, 2019,
2020, 2021 and 2022 respectively. The Assessing Standards Board (ASB) has adopted
recommended standards to be met by towns and cities for their assessment review. The
Department's staff conducts field reviews of the records and assessing practices of all towns
and cities in accordance with the ASB recommended standards and reports their findings to the
municipalities and to the ASB. This report becomes a public document upon Its Issuance./
STEP VII: PROPERTY ASSESSMENT APPEAL PROCESS
There is a two-level appeal process available to any property owner who believes the
assessment of their property is in error. The first level of appeal to request an abatement of
property taxes must be made to the local assessing officials. The request for abatement must
be made in writing by March 1st after the date the tax bills were mailed. If the local assessing
officials neglect or refuse to satisfactorily abate the tax, the second level of appeal is either to
the Board of Tax and Land Appeals or to the Superior Court in the county where the property is
located.
An opinion that property taxes are "too high" is not adequate grounds to justify an abatement.
The "amount of tax" is usually not appealable since the amount of money needed to fund local
government operations is determined by the local legislative bodies through the budget
process. Generally, there must be an error in the assessment of your property in order to
qualify for an abatement.
CONCLUSION
Property taxation In New Hampshire is a process involving all levels of government, from the
voters at town and school district meeting, city councilors, and local assessing officials, to state
legislators and court officials. It is an annual process beginning with the preparation of the
budget and voting of appropriations, continuing with the assessment of property and the
setting of the tax rates, and concluding with the appeal process. Residents and non-residents,
homeowners and landlords, commercial and industrial businesses, all bear the responsibility for
paying their proportional share of property taxes.
www.revenue.nh.gov 2020 Annual Report Of the Department Of Revenue Administration 134
2019 Equalization Survey"Including Utilities and Railroads"
May 1, 2020
This report presents the results of the 2019 Equalization Survey "including utilities and
railroads" conducted by the New Hampshire Department of Revenue Administration pursuant
to RSA 21-J:3 XIII (Revised4/1/99), which states:
"XIII. Equalize annually by May 1 the valuation of the property as assessed In the
several towns, cities, and unincorporated places In the state Including the value
of property exempt pursuant to RSA 72:37, 72:37-b, 72:39-a, 72:62, 72:66 and
72:70 by adding to or deducting from the aggregate valuation of the property In
towns, cities and unincorporated places such sums as will bring such valuations
to the true and market value of the property, and by making such adjustments In
the value of other property from which the towns, cities, and unincorporatedplaces receive taxes or payments in lieu of taxes as may be equitable and Just, so
that any public taxes that may be apportioned among them shall be equal andJust. In carrying out the duty to equalize the valuation of property, the
commissioner shall follow the procedures set forth In RSA 21-J:9-a."
To accomplish this assessment, ratio studies were conducted to determine how the
average level of assessment for all cities and towns compared with the statutory ratio of 100%,so that taxes can be apportioned equitably.
The Department of Revenue Administration (DRA) has completed its process ofcalculating the total equalized valuation of all the municipalities and unincorporated places
throughout the state. The ratios reported for each municipality In this survey were derived bycomparing the sale prices of sales of land, land and buildings and manufactured housing,
covering the period of October 1, 2018, to September 30, 2019, against the actual assessments
applied by the municipalities. Sales information was verified by the grantee whenever possible
by means of Form PA-34, Inventorv of Propertv Transfer. Our goal is to use only arms-length
sales transferred for market value in this analysis. Every effort has been made to exclude non-arms-length transactions including but not limited to: sales involving courts and government
agencies, sales between relatives or corporate affiliates, sales settling an estate, forced sales,
etc.
Every municipality was notified of its 2019 sales assessment ratio. These ratios were
used in conjunction with other DRA adjustments to determine each municipality's total
equalized value for purposes of RSA 21-J:3, XIII.
The following is an explanation of the information contained in this report.
www.revenue.nh.gov 2020 Annual Report Of the Department Of Revenue Administration 135
MODIFIED ASSESSED VALUATION: The modified assessed valuation for each municipality as
reported to the Department of Revenue Administration on the municipality's 2019 MS-1,
Summary Inventorv of Valuation.
GROSS LOCAL ASSESSED VALUATION is the sum of all assessed values in the municipality
minus:
• Certain Disabled Veteran's: RSA 72:36-a
• Improvements to Assist Persons who are Deaf: RSA 72:38-b,V
• Improvements to Assist Persons with Disabilities Exemption: RSA 72:37-a
• School Dining/Dormitory/Kitchen Exemption: RSA 72:23,IV
($150,000 max per exemption)
• Water & Air Pollution Control Exemption: RSA 72:12-a
= MODIFIED ASSESSED VALUATION
minus:
Blind Exemption: RSA 72:37
Disabled Exemption: RSA 72:37-b
Deaf Exemption: RSA 72:38-b
Elderly Exemption: RSA 72:39-a & b
Solar Energy System Exemption: RSA 72:62
Wind Powered Energy System Exemption: RSA 72:66
Wood-Heating Energy System Exemption: RSA 72:70
Additional School DIning/Dormltory/Kitchen Exemption: RSA 72:23,IV(Exemption amount > $150,000)
= NET LOCAL ASSESSED VALUATION is used to compute the municipal, county and local
school tax rates.
TAX INCREMENT FINANCE DISTRICTS (TIPS): RSA 162-K:10,III. - The retained captured
assessed value is added to the modified assessed value and will be equalized for all TIF
districts created after 4/29/99. The original assessed value plus any unretained value is
used to set a municipality's tax rates.
DRA INVENTORY ADJUSTMENT is the sum of the adjustments of the modified local assessed
valuation and is divided into three categories.
Category 1: The total modified local assessed value of land (excluding land in current
use, conservation restriction assessment, discretionary easements and
utilities), buildings and manufactured housing is equalized by the 2019
equalization ratio. This category includes discretionary preservation
easements, taxation of farm structures and land under farm structures.
The difference between the modified local assessed valuation of land,
buildings and manufactured housing and the equalized value equals the
DRA adjustment for land, buildings, and manufactured housing.
www.revenue.nh.gov 2020 Annual Report Of the Department Of Revenue Administration 136
Category 2:. An adjustment for land assessed at current use, conservation restriction
assessment, and discretionary easement values are applied. This
adjustment is calculated by dividing the total net local assessed valuation
for land In these two categories by the 2018 equalization ratio to obtain
the equalized value of current use, conservation restriction assessments,
and discretionary easements. If a municipality has had a full revaluation,
cyclical revaluation or full statistical revaluation as defined by Rev 601.24,
601.16 and 601.25, a ratio of 100.0 is used.
The difference between the local assessed value of the land and the
equalized value equals the DRA adjustment for current use, conservationrestriction assessments, and discretionary easements.
Category 3: The total modified local assessed value of public utilities, as defined byRSA 83-F, is equalized by the 2019 ratio. The value of public utilities is not
added Into the 'Total Equalized Value Not Including Utility Value or
Equalized Railroad Taxes."
EQUALIZED ASSESSED VALUATION: The equalized assessed valuation represents the equalized
value of all "taxable" properties in a municipality and is the sum of the "modified local assessed
valuation" plus the DRA inventory adjustment.
PAYMENT IN LIEU OF TAXES: The equalized value for payments received In lieu of taxes includes
State & Federal Forest Land Reimbursements, Recreation Land Reimbursements, Flood Land
Reimbursements, renewable energy facilities (If applicable) and others.
RAILROAD TAX: The equalized value for monies received from the railroad tax. This figure is not
included in the "Total Equalized Valuation Not Including Utilltv Values and Equalized Railroad
Taxes."
TOTAL EQUALIZED VALUATIONS INCLUDING UTILITY VALUE AND EQUALIZED RAILROAD TAXES:
This figure represents the sum of the equalized assessed valuation, the equalized value ofpayments In lieu of taxes and the equalized value of the railroad tax monies.
The Total Equalized Valuation including the value of utilities and equalized value of railroad
monies reimbursed to municipalities represents the equalized value of all property in amunicipality Including utilities and will be used to:
N
• Apportion county taxes for the 2020 tax year;
' • Calculate state reimbursements, and;• Apportion cooperative school taxes for the 2021 tax year.
LOCAL TAX RATE: The local tax rate, also known as the actual tax rate, is calculated by the
Department of Revenue Administration, Municipal Services Division. The tax rate includes themunicipal, county, local school and state education property tax rates.
www.revenue.nh.gov 2020 Annual Report Of (he Department' Of Revenue Administration 137
EQUALIZATION RATIO: The 2019 equalization ratio as determined by a ratio study conducted by
the Department of Revenue Administration's Equalization staff. '
FULL VALUE TAX RATE: The 2019 gross local property taxes to be raised as reported by theDepartment of Revenue Administration, Municipal & Property Division, divided by the totalequalized valuation including utility values and equalized railroad taxes. This figure representsthe estimated tax rate for a municipality if all the taxable property was assessed at 100% andincludes the equalized value of properties for which a payment in lieu of property taxes Is
rhade.
% PROPORTION TO COUNTY TAX: The percentage of proportion to $1,000 of tax that is to beallocated to each town within the county comparing each municipality's total equalized value to
the total equalized value of the county.
% PROPORTION TO STATE TAX: The percentage of proportion to $1,000 of tax that Is to beallocated to each town within the state by comparing the town's total equalized value to the
total equalized value of the state.
COUNTY & STATE TAX RATE: The sum of the 2019 gross property taxes to'be raised by eachmunicipality in each county and the state divided by the total net local assessed value for eachmunicipality in each county and the state.
STATE & COUNTY RATIOS: The state and county gross assessed values divided by the total
equalized valuation. The state and county ratios are calculated for statistical purposes only andare not applied to any figure as part of the equalization process.
APPEAL OF TOTAL EQUALIZED VALUATION
Municipalities were sent their 2019 Notification of Total Equalized Valuations on April 21, 2020.
Per RSA 71-8:5, II, any municipality aggrieved by the total equalized valuation as determined by
the DRA must appeal to the Board of Tax and Land Appeals in writing within 3D days of thetown's notification of the municipality's total equalized valuation.
The appeal period is not extended due to any communication, either verbal or written,between the DRA and a municipality regarding the total equalized valuation.
www.revenue.nh.gov 2020 Annual Report Of the Department Of Revenue Administration 138
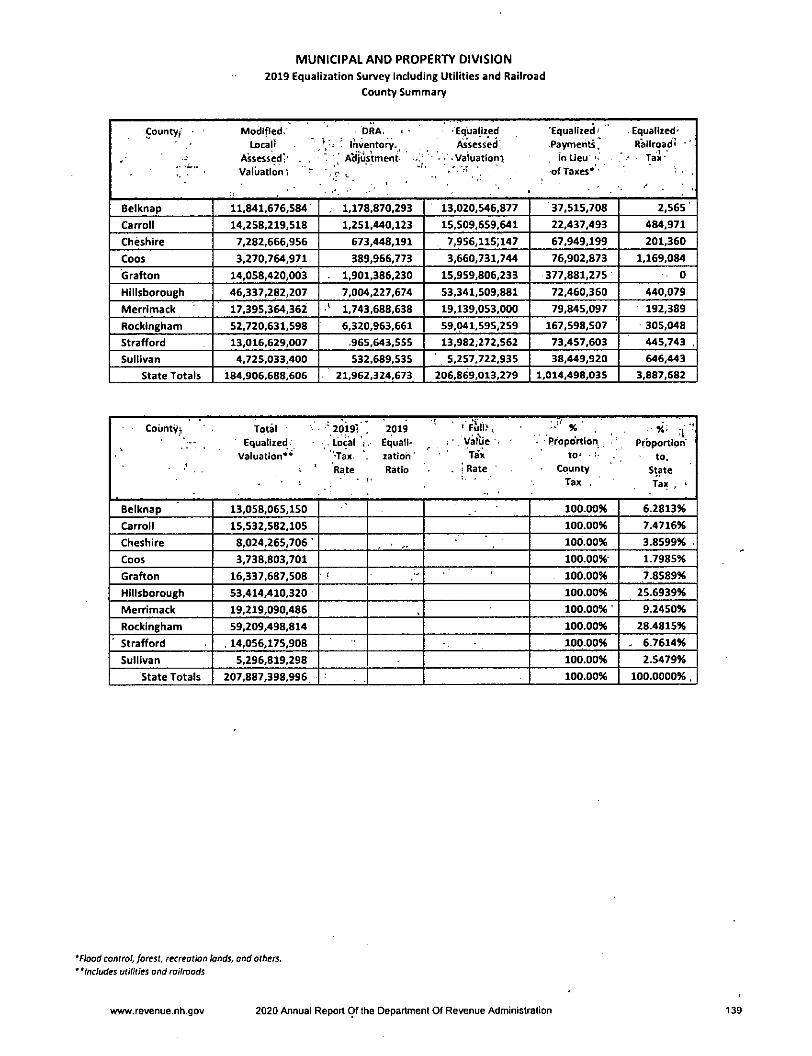
MUNICIPAL AND PROPERTY DIVISION
2019 Equalization Survey Including Utilities and Railroad
County Summary
County/ • ModlBed.
Local'
Assessed;' . .
Valuation; ~
DRA. . •
' Inventory.^[ Adjustment
-Equalized
Assessed;
. • - Vaiuationi
'Equalized'
-Payments.
inUeu
of taxes*'
. Equalized-
Railroad'
Tax'
Belknap 11.841,676,584 . 1,178,870,293 13,020,546,877 37,515,708 2,565
Carroll 14,258,219,518 1,251,440,123 15,509,659,641 22,437,493 484,971
Cheshire 7,282,666,956 673,448,191 7,956,115;147 67,949,199 201,360
Coos 3,270,764,971 389,966,773 3,660,731,744 76,902,873 1,169,084
Grafton 14,058,420,003 . 1,901,386,230 15,959,806,233 377,881,275 0
Hlllsborough 46,337,282,207 7,004,227,674 53,341,509,881 72,460,360 440,079
Merrimack 17,395,364.362 1,743,688,638 19,139,053,000 79,845,097 192,389
Rockingham 52,720,631,598 6,320,963,661 59,041,595,259 167,598,507 305,048
Strafford 13,016,629,007 .965,643,555 13,982,272,562 73,457,603 445,743 .
Sullivan 4,725,033,400 532,689,535 5,257,722,935 38,449,920 646,443
State Totals 184,906,688,606 21,962,324,673 206,869,013,279 1,014,498,035 3,887,682
■ • County^ Total
Equalized.
Valuation**
'20191
- Local i
■Tax "Rate
2019Equalization '
Ratio•
■ ' ' FuH>,; • Value '•
Tax
. ! Rate ■
* ■Pfopdrtion '
tO| •County
Tax ,
:■%: .-r'Prbportlpn"
to.
Statefax . ■
Belknap 13,058,065,150 100.00% 6.2813%
Carroll 15,532,582,105 100.00% 7.4716%
Cheshire 8,024,265,706 • 100.00% 3.8599%
Coos 3,738,803,701 100.00% 1.7985%
Grafton 16,337,687,508 • i . 100.00% 7.8589%
Hlllsborough 53,414,410,320 100.00% 25.6939%
Merrimack 19,219,090,486 . 100.00%' 9.2450%
Rockingham 59,209,498,814 100.00% 28.4815%
Strafford . 14,056,175,908 100.00% . 6.7614%
Sullivan 5,296,819,298 100.00% 2.5479%
State Totals 207,887,398,996 100.00% 100.0000% ,
'Flood control, forest, recreation lands, and others."Includes utilities and railroads
www.revenue.nh.gov 2020 Annual Report Of the Department Of Revenue Administration 139
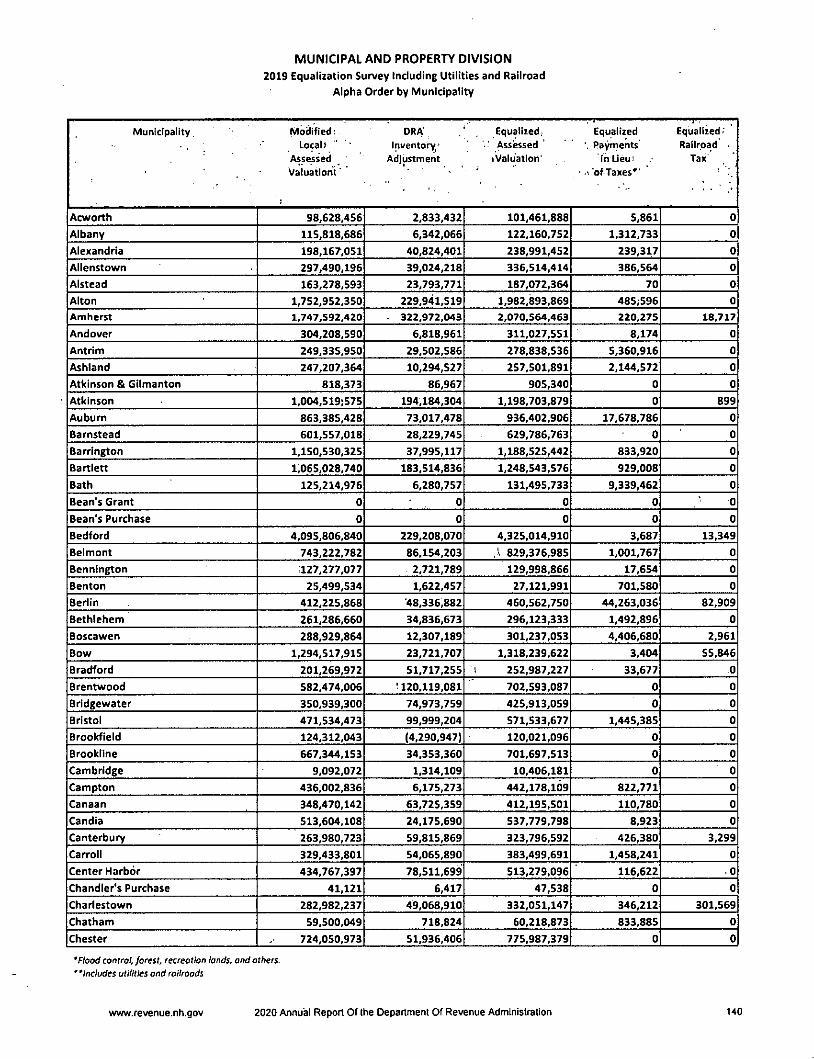
MUNICIPAL AND PROPERTY DIVISION
2019 Equalization Survey Including Utilities and Railroad
Alpha Order by Municipality
Municipality Modified: DRA' Equalized. Equalized Equalized-Localt ' Inventory' -• Assessed ' ' parents Railroad
Assessed Adjustment (Valuation' inUeui Tax
Valuation!' ^ ' • -»'ofTaxes"
Acworth 98,628,456 2,833,432 101,461,888 5,861 0
Albany 115,818,686 6,342,066 122,160,752 1,312,733 0
Alexandria 198,167,051 40,824,401 238,991,452 239,317 0
Allenstown 297,490,196 39,024,218 336,514,414 386,564 0
Alstead 163,278,593 23,793,771 187,072,364 70 0
Alton 1,752,952,350 229,941,519 1,982,893,869 48S;596 0
Amherst 1,747,592,420 ■ 322,972,043 2,070,564,463 220,275 18,717
Andover 304,208,590 6,818,961 311,027,551 8,174 0
Antrim 249,335,950 29,502,586 278,838,536 5,360,916 0
Ashland 247,207,364 10,294,527 257,501,891 2.144,572 0
Atkinson & Gilmanton 818,373 86,967 905,340 0 0
Atkinson 1.004,519:575 194,184,304 1,198,703,879 0 899
Auburn 863,385,428 73,017,478 936,402,906 17,678,786 0
Barnstead 601,557,018 28,229,745 629,786,763 0 0
Barrington 1,150,530,325 37,995,117 1,188,525,442 833,920 0
Bartlett 1,065,028,740 183,514,836 1,248,543,576 929,008 0
Bath 125,214,976 6,280,757 131,495,733 9,339,462 0
Bean's Grant 0 0 0 0 0
Bean's Purchase 0 0 0 0 0
Bedford 4,095,806,840 229,208,070 4,325,014,910 3,687 13,349
Belmont 743,222,782 86,154,203 .1 829,376,985 1,001,767 0
Bennington 127,277,077 2,721,789 129,998,866 17,654 0
Benton 25,499,534 1,622,457 27,121,991 701,580 0
Berlin 412,225,868 '48,336,882 460,562,750 44,263,036 82,909
Bethlehem 261,286,660 34,836,673 296,123,333 1,492,896 0
Boscawen 288,929,864 12,307,189 301,237,053 4,406,680 2,961
Bow 1,294,517,915 23,721,707 1,318,239,622 3,404 55,846
Bradford 201,269,972 51,717,255 252,987,227 33,677 0
Brentwood 582,474,006 1120,119,081 702,593,087 0 0
Bridgewater 350,939,300 74,973,759 425,913,059 0 0
Bristol 471,534,473 99,999,204 571,533,677 1,445,385 0
Brookfield 124,312,043 (4,290,947) 120,021,096 0 0
Brookline 667,344,153 34,353,360 701,697,513 0 0
Cambridge 9,092,072 1,314,109 10,406,181 0 0
Campton 436,002,836 6,175,273 442,178,109 822,771 0
Canaan 348,470.142 63,725,359 412,195,501 110,780 0
Candia 513,604,108 24,175,690 537,779,798 8,923 0
Canterbury 263,980,723 59,815,869 323,796,592 426,380 3,299
Carroll 329,433,801 54,065,890 383,499,691 1,458,241 0
Center Harbor 434,767,397 78,511,699 513,279,096 116,622 .0
Chandler's Purchase 41,121 6,417 47,538 0 0
Charlestown 282,982,237 49,068,910 332,051,147 346,212 301,569
Chatham 59,500,049 718,824 60,218,873 833,885 0
Chester 724,050,973 51,936,406 775,987,379 0 0
'Flood control, forest, recreation lands, and others.
"Includes utilities and railroads
www.revenue.nh.gov 2020 Annual Report Of the Department Of Revenue Administration 140
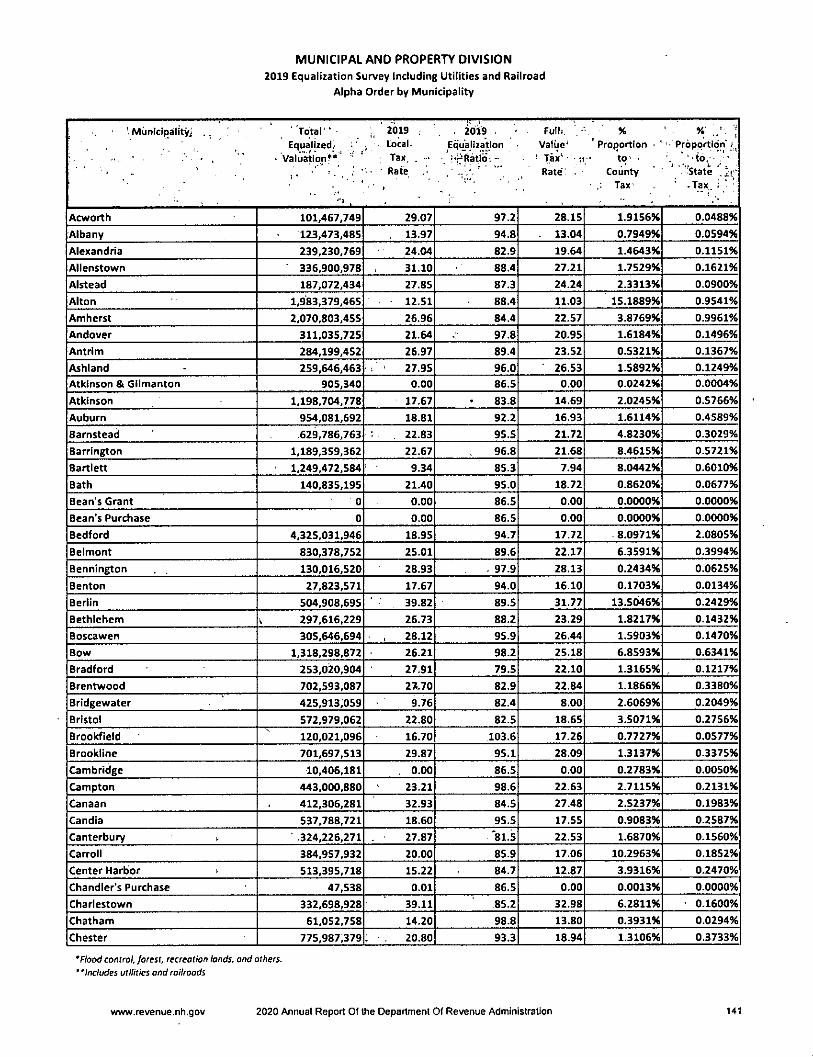
MUNICIPAL AND PROPERTY DIVISION
2019 Equalization Survey Including Utilities and Railroad
Alpha Order by Municipality
'.MunicipalitVi .. ' "Total" 2019 , ' . zois - * Fulh. , % ' %' ]Equalized. •, • local. Equajization • Value' 'Proportion Proportion"
. 7 - Valuation^* " ' Tax. . - i^^Ratib'i- • T?*''' ^9 ' •, . j '' ' ■ . ' Rate " Rate County "'State '.Ir-
Tax' ■ -Tax. i
. '"1 t • ' ■ • 1 ■ " ' . .
Acworth 101,467,749 29.07 97.2 28.15 1.9156% 0.0488%
Albany 123,473,485 , 13.97 94.8 . 13.04 0.7949% 0.0594%
Alexandria 239,230,769 24.04 82.9 19.64 1.4643% 0.1151%
Allenstown 336,900,978 31.10 88.4 27.21 1.7529% 0.1621%
Alstead 187,072,434 27.85 87.3 24.24 2.3313% 0.0900%
Alton 1,983,379,465 - 12.51 88.4 11.03 15.1889% 0.9541%
Amherst 2,070,803,455 26.96 84.4 22.57 3.8769% 0.9961%
Andover 311,035,725 21.64 97.8 20.95 1.6184% 0.1496%
Antrim 284,199,452 26.97 89.4 23.52 0.5321% 0.1367%
Ashland 259,646,463 27.95 96.0 26.53 1.5892% 0.1249%
Atkinson & Gilmanton 905,340 0.00 86.5 0.00 0.0242% 0.0004%
Atkinson 1,198,704,778 17.67 83.8 14.69 2.0245% 0.5766%
Auburn 954,081,692 18.81 92.2 16.93 1.6114% 0.4589%
Barnstead 629,786,763 , 22.83 95.5 21.72 4.8230% 0.3029%
Barrington 1,189,359.362 22.67 96.8 21.68 8.4615% 0.5721%
Bartlett 1,249,472,584 9.34 85.3 7.94 8.0442% 0.6010%
Bath 140,835,195 21.40 95.0 18.72 0.8620% 0.0677%
Bean's Grant 0 0.00 86.5 0.00 0.0000% 0.0000%
Bean's Purchase 0 0.00 86.5 0.00 0.0000% 0.0000%
Bedford 4,325,031,946 18.95 94.7 17.72 8.0971% 2.0805%
Belmont 830,378,752 25.01 89.6 22.17 6.3591% 0.3994%
Bennington 130,016,520 28.93 . 97.9 28.13 0.2434% 0.0625%
Benton 27,823,571 17.67 94.0 16.10 0.1703% 0.0134%
Berlin 504,908,695 39.82 89.5 31.77 13.5046% 0.2429%
Bethlehem V 297,616,229 26.73 88.2 23.29 1.8217% 0.1432%
Boscawen 305,646,694 28.12 95.9 26.44 1.5903% 0.1470%
Bow 1,318,298,872 26.21 98.2 25.18 6.8593% 0.6341%
Bradford 253,020,904 27.91 79.5 22.10 1.3165% 0.1217%
Brentwood 702,593,087 27.70 82.9 22.84 1.1866% 0.3380%
Bridgewater 425,913,059 9.76 82.4 8.00 2.6069% 0.2049%
Bristol 572,979,062 22.80 82.5 18.65 3.5071% 0.2756%
Brookfield 120,021,096 16.70 103.6 17.26 0.7727% 0.0577%
Brookline 701,697,513 29.87 95.1 28.09 1.3137% 0.3375%
Cambridge 10,406,181 0.00 86.5 0.00 0.2783% 0.0050%
Campton 443,000,880 23.21 98.6 22.63 2.7115% 0.2131%
Canaan 412,306,281 32.93 84.5 27.48 2.5237% 0.1983%
Candid 537,788,721 18.60 95.5 17.55 0.9083% 0.2587%
Canterbury k .324,226,271 27.87 81.5 22.53 1.6870% 0.1560%
Carroll 384,957,932 20.00 85.9 17.06 10.2963% 0.1852%
Center Harbor 513,395,718 15.22 84.7 12.87 3.9316% 0.2470%
Chandler's Purchase 47,538 0.01 86.5 0.00 0.0013% 0.0000%
Charlestown 332,698,928 39.11 85.2 32.98 6.2811% - 0.1600%
Chatham 61,052,758 14.20 98.8 13.80 0.3931% 0.0294%
Chester 775,987,379. , 20.80 93.3 18.94 1.3106% 0.3733%
'Flood control, forest, recreation lands, and others.
' 'Includes utilities and railroads
www.revenue.nh.gov 2020 Annual Report Of the Department Of Revenue Administration 141
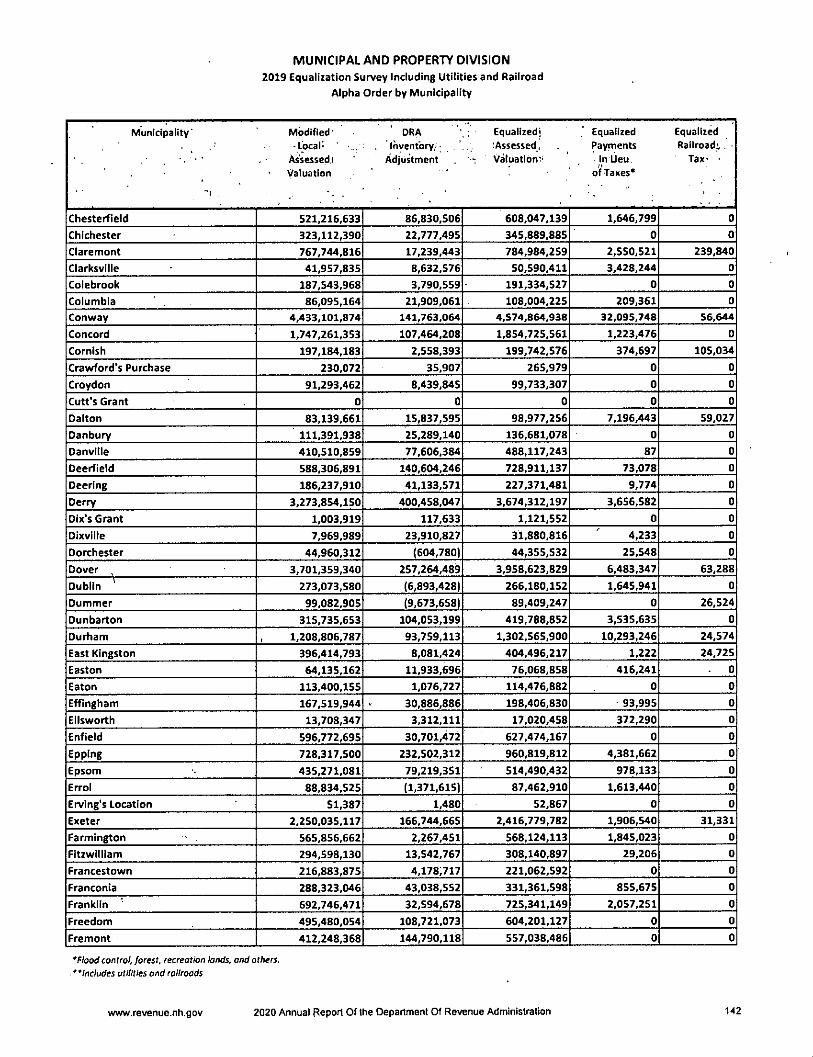
MUNICIPAL AND PROPERTY DIVISION
2019 Equalization Survey Including Utilities and Railroad
Alpha Order by Municipality
Municipality' Modified- ' DRA Equalized! Equalized Equalized-Local- Inventory/- ^Assessed. Payments Railroad;, , -
. . . Assessed! Adjustment ^ Valuation':- in Lieu. Tax* •Valuation ' of Taxes*
Chesterfield 521.216,633 86,830,506 608,047,139 1,646,799 0
Chichester 323,112,390 22,777,495 345,889,885 0 0
Claremont 767,744,816 17,239,443 784,984,259 2,550,521 239,840
Clarksville 41,957,835 8,632,576 50,590,411 3,428,244 0
Colebrook 187,543,968 3,790,559 191,334,527 0 0
Columbia 86,095,164 21,909,061 108,004,225 209,361 0
Conway 4,433,101,874 141,763,064 4,574,864,938 32,095,748 56,644
Concord 1,747,261,353 107,464,208 1,854,725,561 1,223,476 0
Cornish 197,184,183 2,558,393 199,742,576 374,697 105,034
Crawford's Purchase 230,072 35.907 265,979 0 0
Croydon 91,293,462 8,439,845 99,733,307 0 0
Cutt's Grant 0 0 0 0 0
Dalton 83,139,661 15,837,595 98,977,256 7,196,443 59,027
Danbury 111,391,938 25,289,140 136,681,078 0 0
Danville 410,510,859 77,606,384 488,117.243 87 0
Deerfield 588,306,891 140,604,246 728,911,137 73,078 0
Deering 186,237,910 41,133,571 227,371,481 9,774 0
Derry 3,273,854,150 400,458,047 3,674,312,197 3,656,582 0
Dix's Grant 1,003,919 117,633 1,121,552 0 0
DIxville 7,969,989 23,910,827 31,880,816 4,233 0
Dorchester 44,960,312 (604,780) 44,355,532 25,548 0
Dover , 3,701,359,340 257,264,489 3,958,623,829 6,483,347 63,288
Dublin ^ 273,073,580 (6,893,428) 266,180,152 1,645,941 0
Dummer 99,082,905 (9,673,658) 89,409,247 0 26,524
Dunbarton 315,735,653 104,053,199 419,788,852 3,535,635 0
Durham 1,208,806,787 93,759,113 1,302,565,900 10,293,246 24,574
East Kingston 396,414,793 8,081,424 404,496,217 1,222 24,725
Easton 64,135,162 11,933,696 76,068,858 416,241 0
Eaton 113,400,155 1,076,727 114,476,882 0 0
Effingham 167,519,944 30,886,886 198,406,830 93,995 0
Ellsworth 13,708,347 3,312,111 17,020,458 372,290 0
Enfield 596,772,695 30,701,472 627,474,167 0 0
Epping 728,317,500 232,502,312 960,819,812 4,381,662 0
Epsom 435,271,081 79,219,351 514,490,432 978,133 0
Errol 88,834,525 (1,371,615) 87,462,910 1,613,440 0
Erving's Location 51,387 1,480 52,867 0 0
Exeter 2,250,035,117 166,744,665 2,416,779,782 1,906,540 31,331
Farmington 565,856,662 2,267,451 568,124,113 1,845,023 0
Fitzwilliam 294,598,130 13,542,767 308,140,897 29,206 0
Francestown 216,883,875 4,178,717 221,062,592 0 0
Franconia 288,323,046 43,038,552 331,361,598 855,675 0
Franklin 692,746,471 32,594,678 725,341,149 2,057,251 0
Freedom 495,480,054 108,721,073 604,201,127 0 0
Fremont 412,248,368 144,790,118 557,038,486 0 0
*flood control, forest, recreation lands, and others.
* 'Includes utilities and railroads
www.revenue.nh.gov 2020 Annual Peporl Of the Department Of Revenue Administration 142
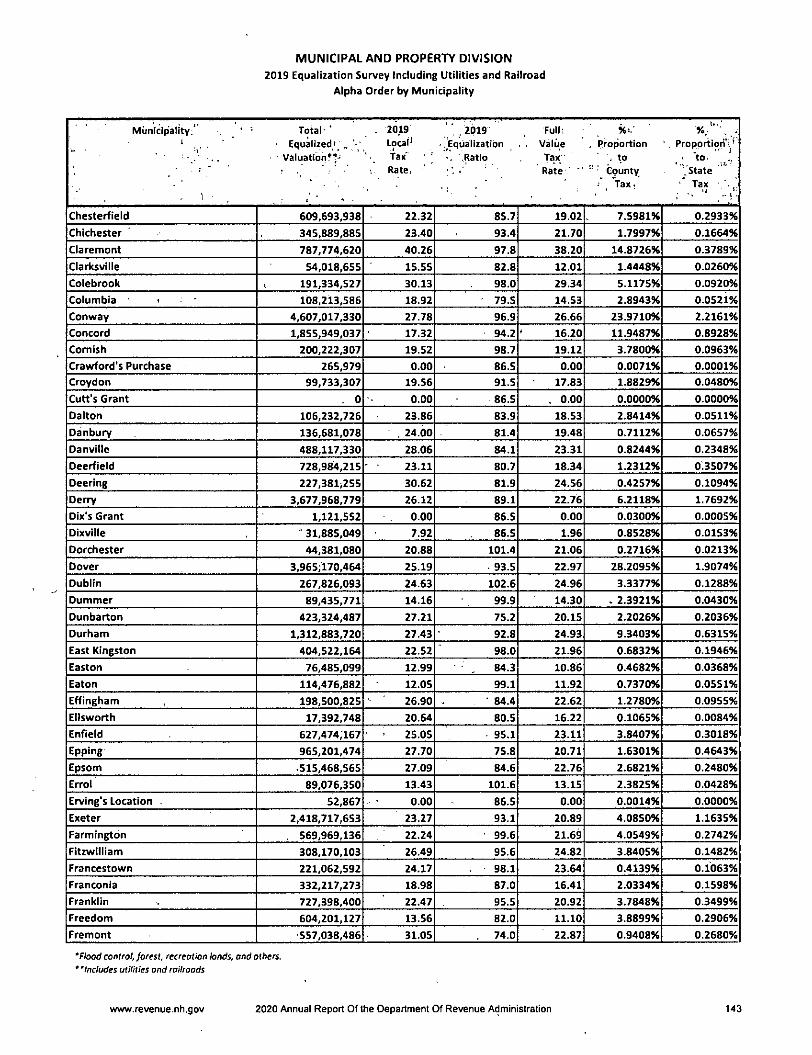
MUNICIPAL AND PROPERTY DIVISION
2019 Equalization Survey Including Utilities and Railroad
Alpha Order by Municipality
Municipality." " ■ Total ' - 2019 '',2019 Full; %«.' X'" ..-' ' • Equalized' Local' -.Equalization . . Value . Proportion Propprtiori\'
.. • Valuatiofi*^- Tax" .Ratio Tax. - to , ' to.■ ' ' r Rate, Rate " ''' County .State
. , . ' ' , ■ , Tax,' ' Tax
Chesterfield 609,693,938 22.32 85.7 19.02 7.5981% 0.2933%
Chlchester 345,889,885 23.40 93.4 21.70 1.7997% 0.1664%
Claremont 787,774,620 40.26 97.8 38.20 14.8726% 0.3789%
Clarksville 54,018,655 15.55 82.8 12.01 1.4448% 0.0260%
Colebrook V 191,334,527 30.13 98.0 29.34 5.1175% 0.0920%
Columbia i ' 108,213,586 18.92 79.5 14.53 2.8943% 0.0521%
Conway 4,607,017,330 27.78 96.9 26.66 23.9710% 2.2161%
Concord 1,855,949,037 17.32 94.2 16.20 11.9487% 0.8928%
Cornish 200,222,307 19.52 98.7 19.12 3.7800% 0.0963%
Crawford's Purchase 265,979 0.00 86.5 0.00 0.0071% 0.0001%
Croydon 99,733,307 19.56 91.5 17.83 1.8829% 0.0480%
Cutt's Grant . 0 0.00 86.5 . 0.00 0.0000% 0.0000%
Dalton 106,232,726 23.86 83.9 18.53 2.8414% 0.0511%
Danbury 136,681,078 , 24.00 81.4 19.48 0.7112% 0.0657%
Danville 488,117,330 28.06 84.1 23.31 0.8244% 0.2348%
Oeerfield 728,984,215 • • 23.11 80.7 18.34 1.2312% 0.3507%
Deering 227,381>255 30.62 81.9 24.56 0.4257% 0.1094%
Derry 3,677,968,779 26.12 89.1 22.76 6.2118% 1.7692%
Dix's Grant 1,121,552 0.00 86.5 0.00 0.0300% 0.0005%
Dixville ' 31,885,049 7.92 86.5 1.96 0.8528% 0.0153%
Dorchester 44,381,080 20.88 101.4 21.06 0.2716% 0.0213%
Dover 3,965;170,464 25.19 93.5 22.97 28.2095% 1.9074%
Dublin 267,826,093 24.63 102.6 24.96 3.3377% 0.1288%
Dummer 89,435,771 14.16 99.9 14.30 . 2.3921% 0.0430%
Dunbarton 423,324,487 27.21 75.2 20.15 2.2026% 0.2036%
Durham 1,312,883,720 27.43 92.8 24.93 9.3403% 0.6315%
East Kingston 404,522,164 22.52 98.0 21.96 0.6832% 0.1946%
Easton 76,485,099 12.99 84.3 10.86 0.4682% 0.0368%
Eaton 114,476,882 12.05 99.1 11.92 0.7370% 0.0551%
Effingham 198,500,825 26.90 ' 84.4 22.62 1.2780% 0.0955%
Ellsworth 17,392,748 20.64 80.5 16.22 0.1065% 0.0084%
Enfield 627,474,167 25.05 95.1 23.11 3.8407% 0.3018%
Epplng 965,201,474 27.70 75.8 20.71 1.6301% 0.4643%
Epsom ■ 515,468,565 27.09 84.6 22.76 2.6821% 0.2480%
Errol 89,076,350 13.43 101.6 13.15 2.3825% 0.0428%
Erving's Location 52,867 0.00 86.5 0.00 0.0014% 0.0000%
Exeter 2,418,717,653 23.27 93.1 20.89 4.0850% 1.1635%
Farmington 569,969,136 22.24 • 99.6 21.69 4.0549% 0.2742%
Fitzwilliam 308,170,103 26.49 95.6 24.82 3.8405% 0.1482%
Francestown 221,062,592 24.17 98.1 23.64 0.4139% 0.1063%
Franconia 332,217,273 18.98 87.0 16.41 2.0334% 0.1598%
Franklin 727,398,400 22.47 95.5 20.92 3.7848% 0.3499%
Freedom 604,201,127 13.56 82.0 11.10 3.8899% 0.2906%
Fremont 557,038,486 31.05 74.0 22.87 0.9408% 0.2680%
'Flood control, forest, recreation londs, and others.
"Includes utilities and railroads
www.revenue.nh.gov 2020 Annual Report Of the Department Of Revenue Administration 143
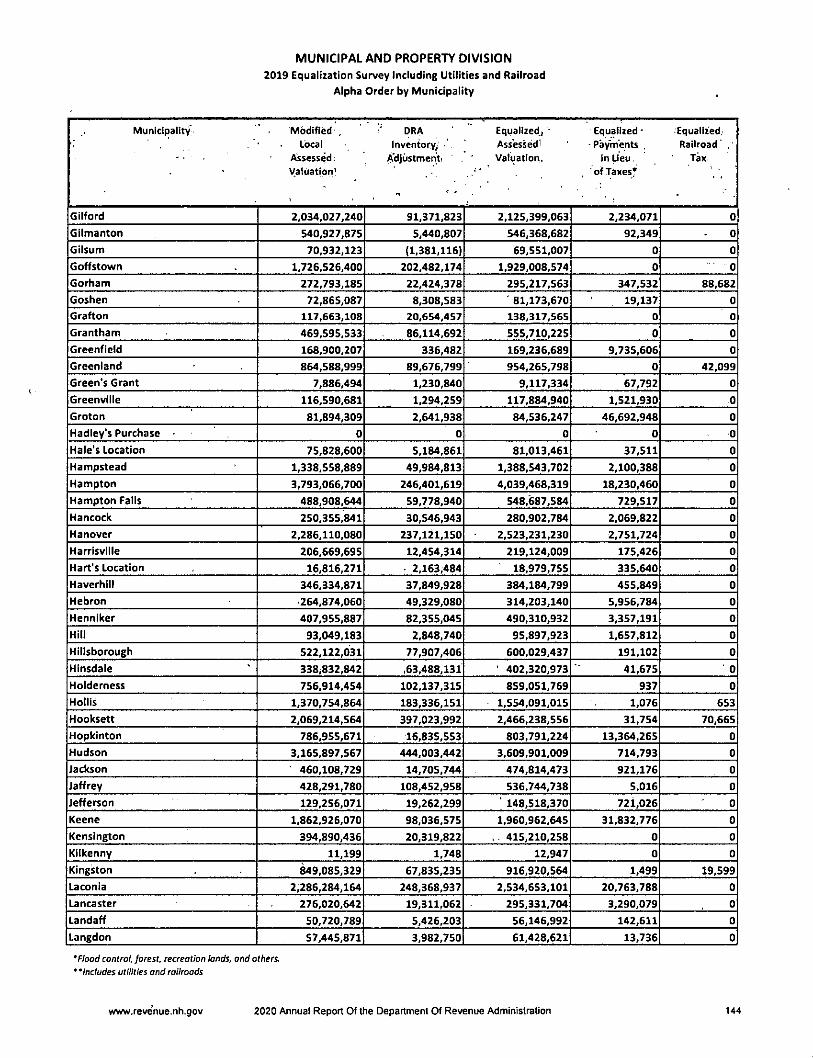
MUNICIPAL AND PROPERTY DIVISION
2019 Equalization Survey Including Utilities and Railroad
Alpha Order by Municipality
Municipality! Modified . <' DRA Equalized^ - Equalized- -Equalized.'Local Inventory^ • Assessed- Payments , Railroad'
- Assessed, A'djiistment . " Valuation. InUeu, TaxValuation^ , of Taxes*
Gilford 2,034,027,240 91,371,823 2,125,399,063 2,234,071 0
Gilmanton 540,927,875 5,440,807 546,368,682 92,349 0
Gilsum 70,932,123 (1,381,116) 69,551,007 0 0
Goffstown 1,726,526,400 202,482,174 1,929,008,574 0 0
Gorham 272,793,185 22,424,378 295,217,563 347,532 88,682
Goshen 72,865,087 8,308,583 81,173,670 19,137 0
Grafton 117,663,108 20,654,457 138,317,565 0 0
Grantham 469,595,533 86,114,692 555,710.225 0 0
Greenfield 168,900,207 336,482 169,236,689 9,735,606 0
Greenland 864,588,999 89,676,799 954,265,798 0 42,099
Green's Grant 7,886,494 1,230,840 9,117,334 67,792 0
Greenville 116,590,681 1,294,259 117,884,940 1,521,930 0
Groton 81,894,309 2,641,938 84,536,247 46,692,948 0
Hadley's Purchase ■ 0 0 0 0 0
Male's Location 75,828,600 5,184,861 81,013,461 37,511 0
Hampstead 1,338,558,889 49,984,813 1,388,543,702 2,100,388 0
Hampton 3,793,066,700 246,401,619 4,039,468,319 18,230,460 0
Hampton Falls 488,908,644 59,778,940 548,687,584 729,517 0
Hancock 250,355,841 30,546,943 280,902,784 2,069.822 0
Hanover 2,286,110.080 237,121,150 2,523,231,230 2,751,724 0
Harrlsville 206,669,695 12,454,314 219,124,009 175.426 0
Hart's Location 16,816,271 2,163,484 18,979,755 335,640 0
Haverhill 346,334,871 37,849,928 384,184,799 455,849 0
Hebron 264,874,060 49,329,080 314,203,140 5,956,784 0
Hennlker 407,955,887 82,355,045 490,310,932 3,357,191 0
Hill 93,049,183 2,848,740 95,897,923 1,657,812 0
Hillsborough 522,122,031 77,907,406 600,029,437 191,102 0
HInsdale 338,832,842 ,63,488,131 402,320,973 41,675 0
Holderness 756,914,454 102,137,315 859,051,769 937 0
Hollls 1,370,754,864 183,336,151 1,554,091,015 1,076 653
Hooksett 2,069,214,564 397,023,992 2,466,238,556 31,754 70,665
Hopkinton 786,955,671 16,835,553 803,791,224 13,364,265 0
Hudson 3,165,897,567 444,003,442 3,609,901,009 714,793 0
Jackson 460,108,729 14,705,744 474,814,473 921,176 0
Jaffrey 428,291,780 108,452,958 536,744,738 5,016 0
Jefferson 129,256,071 19,262,299 ' 148,518,370 721,026 0
Keene 1,862,926,070 98,036,575 1,960,962,645 31,832,776 0
Kensington 394,890,436 20,319,822 , 415,210,258 0 0
Kilkenny 11,199 1,748 12,947 0 0
Kingston 849,085,329 67,835,235 916,920,564 1,499 19,599
Laconia 2,286,284,164 248,368,937 2,534,653,101 20,763,788 0
Lancaster 276,020,642 19,311,062 295,331,704 3,290.079 0
Landaff 50,720,789 5,426,203 56,146,992 142,611 0
Langdon 57,445,871 3,982,750 61,428,621 13,736 0
'Flood control, forest, recreation lands, and others.
' 'Includes utilities and railroads
www.revenue.nh.gov 2020 Annual Report Of the Department Of Revenue Administration 144
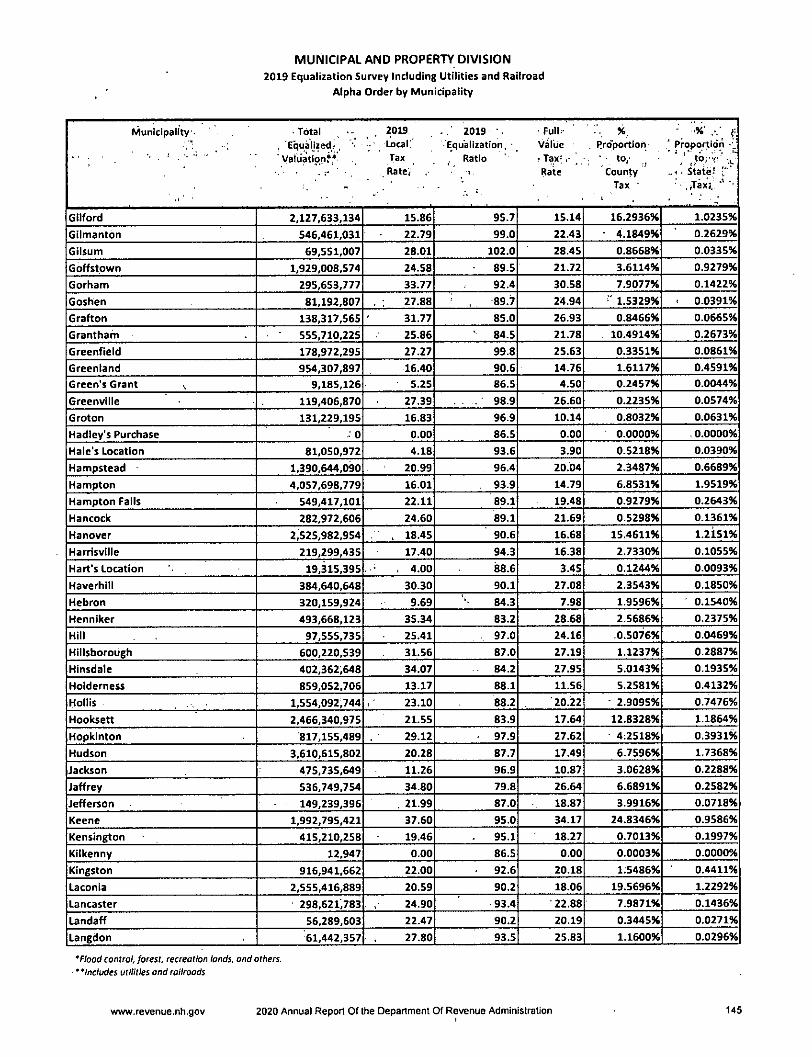
MUNICIPAL AND PROPERTY DIVISION
2019 Equalization Survey Including Utilities and RailroadAlpha Order by Municipaiity
Municipality. ' -Total . . 2019 2019 •. Full.-. Equalizedt , Local! Equalization, - Value . Proportion ' Proportion
" ■ . yaluationf* Tax , Ratio ^Tax- ,- ] -. • - to/ , ' -,i.. , .Ratej • j Rate County > StateJ '
Tax " ' , Jax}. "•
Gilford 2,127,633,134 15.86 95.7 15.14 16.2936% 1.0235%
Gilmanton 546,461,031 22.79 99.0 22.43 - 4.1849% 0.2629%
Gilsum 69,551,007 28.01 102.0 28.45 0.8668% 0.0335%
Goffstown 1,929,008,574 24.58 89.5 21.72 3.6114% 0.9279%
Gorham 295,653,777 33.77 92.4 30.58 7.9077% 0.1422%
Goshen 81,192,807 27.88 89.7 24.94 ' 1.5329% < 0.0391%
Grafton 138,317,565 31.77 85.0 26.93 0.8466% 0.0665%
Grantham 555,710,225 25.86 84.5 21.78 10.4914% 0.2673%
Greenfield 178,972,295 27.27 99.8 25.63 0.3351% 0.0861%
Greenland 954,307,897 16.40 90.6 14.76 1.6117% 0.4591%
Green's Grant v 9,185,126 5.25 86.5 4.50 0.2457% 0.0044%
Greenville 119,406,870 27.39 . . 98.9 26.60 0.2235% 0.0574%
Groton 131,229,195 16.83 96.9 10.14 0.8032% 0.0631%
Hadley's Purchase 0 0.00 86.5 0.00 0.0000% . 0.0000%
Male's Location 81.050,972 4.18 93.6 3.90 0.5218% 0.0390%
Hampstead 1.390,644,090 20.99 96.4 20.04 2.3487% 0.6689%
Hampton 4,057,698,779 16.01 93.9 14.79 6.8531% 1.9519%
Hampton Falls 549,417,101 22.11 89.1 19.48 0.9279% 0.2643%
Hancock 282,972,606 24.60 89.1 21.69 0.5298% 0.1361%
Hanover 2,525,982,954 . 18.45 90.6 16.68 15.4611% 1.2151%
Harrisville 219,299,435 17.40 94.3 16.38 2.7330% 0.1055%
Hart's Location 19,315,395 . 4.00 88.6 3.45 0.1244% 0.0093%
Haverhill 384,640,648 30.30 90.1 27.08 2.3543% 0.1850%
Hebron 320,159,924 9.69 84.3 7.98 1.9596% 0.1540%
Henniker 493,668,123 35.34 83.2 28.68 2.5686% 0.2375%
Hill 97,555,735 25.41 . 97.0 24.16 0.5076% 0.0469%
Hlllsborough 600,220,539 31.56 87.0 27.19 1.1237% 0.2887%
Hinsdale 402,362,648 34.07 84.2 27.95 5.0143% 0.1935%
Holderness 859,052,706 13.17 88.1 11.56 5.2581% 0.4132%
Hollis 1,554,092,744 23.10 88.2 20.22 - 2.9095% 0.7476%
Hooksett 2,466,340,975 21.55 83.9 17.64 12.8328% 1.1864%
Hopkinton 817.155,489 29.12 97.9 27.62 - 4:2518% 0.3931%
Hudson 3,610,615.802 20.28 87.7 17.49 6.7596% 1.7368%
Jackson 475,735,649 11.26 96.9 10.87 3.0628% 0.2288%
Jaffrey 536,749,754 34.80 79.8 26.64 6.6891% 0.2582%
Jefferson 149,239,396 . 21.99 87.0 18.87 3.9916% 0.0718%
Keene 1,992,795,421 37.60 95.0 34.17 24.8346% 0.9586%
Kensington 415,210,258 19.46 95.1 18.27 0.7013% 0.1997%
Kilkenny 12,947 0.00 86.5 0.00 0.0003% 0.0000%
Kingston 916,941,662 22.00 92.6 20.18 1.5486% 0.4411%
Laconia 2,555,416,889 20.59 90.2 18.06 19.5696% 1.2292%
Lancaster 298,621,783 24.90 93.4 22.88 7.9871% 0.1436%
Landaff 56,289,603 22.47 90.2 20.19 0.3445% 0.0271%
Langdon 61,442,357 27.80 93.5 25.83 1.1600% 0.0296%
'Flood control, forest, recreation lands, and others.
* 'Includes utilities and railroads
www.revenue.nh.gov 2020 Annual Report Of the Department Of Revenue Administration 145
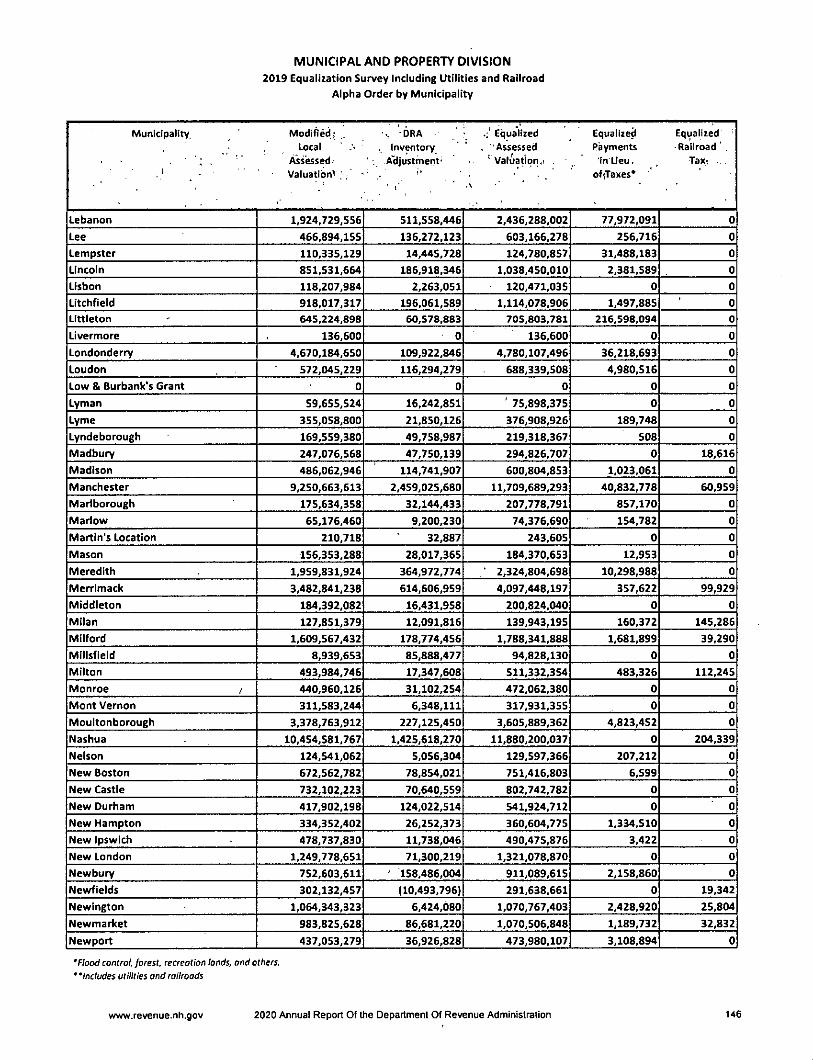
MUNICIPAL AND PROPERTY OIVISION
2019 Equalization Survey including Utilities and Railroad
Alpha Order by Municipality
Municipality. Modifled.- .. ■, DRA Equalized Equalized EqualizedLocal .. Inventory ' . Assessed payments Railroad' .
• . Assessed. ' A'djustment- " Valuation.i in Lieu. , Tax-. , ,Valuation^ ; , ■ ' '* . . ofiTaxes*
• i'' . ■ 'V • ' ■ , •
Lebanon 1,924,729.556 511,558,446 2,436,288,002 77,972,091 0
Lee 466,894.155 136,272,123 603,166,278 256.716 0
Lempster 110,335.129 14,445,728 124,780,857 31,488,183 0
Lincoln 851,531.664 186,918,346 1,038,450,010 2,381,589 0
Lisbon 118,207.984 2,263,051 120,471,035 0 0
Litchfield 918,017.317 196,061,589 1,114,078,906 1,497,885 0
Littleton 645,224.898 60,578,883 705,803,781 216,598,094 0
Livermore 136.600 0 136,600 0 0
Londonderry 4,670,184.650 109,922,846 4,780,107,496 36,218,693 0
Loudon 572,045.229 116,294,279 688,339,508 4,980,516 0
Low & Burbank's Grant 0 0 0 0 0
Lyman 59,655.524 16,242,851 ' 75,898,375 0 0
Lyme 355,058.800 21,850,126 376,908,926 189,748 0
Lyndeborough 169,559.380 49,758,987 219,318,367 508 0
Madbury 247,076.568 47,750,139 294,826,707 0 18,616
Madison 486,062.946 114,741,907 600,804,853 1,023,061 0
Manchester 9,250,663.613 2,459,025,680 11,709,689,293 40,832,778 60,959
Marlborough 175,634.358 32,144,433 207,778,791 857,170 0
Maiiow 65,176.460 9,200,230 74,376,690 154,782 0
Martin's Location 210.718 32,887 243,605 0 0
Mason 156,353.288 28,017,365 184,370,653 12,953 0
Meredith 1,959,831.924 364,972,774 ' 2,324,804,698 10,298,988 0
Merrlmack 3,482,841.238 614.606,959 4,097,448,197 357,622 99,929
Middleton 184,392,082 16,431,958 200,824,040 0 0
Milan 127,851,379 12,091,816 139,943,195 160,372 145,286
Milford 1,609,567.432 178,774,456 1.788,341,888 1,681,899 39,290
Millsfield 8,939.653 85,888,477 94,828,130 0 0
Milton 493,984,746 17,347,608 511,332,354 483,326 112,245
Monroe / 440,960,126 31,102,254 472,062,380 0 0
Mont Vernon 311,583.244 6,348,111 317,931,355 0 0
Moultonborough 3,378,763.912 227,125,450 3,605,889,362 4,823,452 0
Nashua 10,454,581,767 1,425.618,270 11,880,200,037 0 204,339
Nelson 124.541.062 5,056,304 129,597,366 207,212 0
New Boston 672,562,782 78.854,021 751,416,803 6,599 0
New Castle 732,102,223 70,640,559 802,742,782 0 0
New Durham 417,902,198 124,022,514 541,924,712 0 0
New Hampton 334,352,402 26,252,373 360,604,775 1,334,510 0
New Ipswich 478,737,830 11,738,046 490,475,876 3,422 0
New London 1,249.778,651 71.300,219 1,321,078,870 0 0
Newbury 752,603,611 ' 158,486,004 911,089,615 2,158,860 0
Newfields 302,132,457 (10.493,796) 291,638,661 0 19,342
Newington 1,064,343,323 6.424,080 1,070,767,403 2,428,920 25,804
Newmarket 983,825,628 86,681,220 1,070,506,848 1,189,732 32,832
Newport 437,053,279 36,926,828 473,980,107 3,108,894 0
'flood control, forest, recreation hnds, and others."Includes utilities and railroads
www.revenue.nh.gov 2020 Annual Report Of the Department Of Revenue Administration 146

MUNICIPAL AND PROPERTY DIVISION
2019 Equalization Survey Including Utilities and Railroad
Alpha Order by Municipality
Municipality -Total '' ' 2019! . 2019' Full: „ % .Equalized'^ . • Local. Equalization Value. . .'.proportion Prdpdrtioh';
Valuation?*;, .• i Tax , • i Ratio! .Tax to'- " ,'.t"oj'' ' ' ^ : -'Rate' Rate'" ; County' . . State;
" Tax ' Tax •
Lebanon 2,514,260.093 30.37 79.0 23.07 15.3893% 1.2094%
Lee 603,422,994 31.49 77.4 23.89 4.2929% 0.2903%
Lempster 156,269,040 27.31 88.4 19.19 2.9502% 0.0752%
Lincoln 1,040,831,599 14.58 82.0 11.86 6.3707% 0.5007%
Lisbon 120,471,035 30.67 98.1 29.92 0.7374% 0.0580%
Litchfield 1,115,576,791 23.65 82.4 19.29 2.0885% 0.5366%
Littleton 922,401,875 23.10 91.4 15.89 5.6459% 0.4437%
Livermore 136,600 0.00 100.0 0.00 0.0008% 0.0001%
Londonderry 4,816,326,189 19.39 97.7 18.39 8.1344% 2.3168%
Loudon 693,320,024 22.98 83.1 18.77 3.6075% 0.3335%
Low & Burbank's Grant 0 0.00 86.5 0.00 0.0000% 0.0000%
Lyman 75,898,375 24.13 78.4 18.86 0.4646% 0.0365%
Lyme 377,098,674 27.19 94.2 25.18 2.3082% 0.1814%
Lyndeborough 219,318,875 29.14 77.2 22.45 .0.4106% 0.1055%
Madbury 294,845.323 29.86 83.8 24.67 2.0976% 0.1418%
Madison 601,827,914 18.26 80.9 14.69 3.8746% 0.2895%
Manchester 11,750,583,030 24.32 79.0 18.86 21.9989% 5.6524%
Martborough 208,635,961 31.47 84.5 26.44 2.6001% 0.1004%
Marlow 74,531,472 31.92 87.5 27.73 0.9288% 0.0359%
Martin's Location 243,605 0.00 86.5 0.00 0.0065% 0.0001%
Mason 184,383,606 26.24 84.8 22.16 0.3452% 0.0887%
Meredith 2,335,103,686 15.89 84.3 13.30 17.8825% 1:1233%
Merrimack 4,097,905,748 24.13 85.0 20.26 7.6719% 1.9712%
Middleton 200,824,040 26.28 91.8 24.04 1.4287% 0.0966%
Milan 140,248,853 23.69 91.3 21.18 3.7512% 0.0675%
Milford 1,790,063,077 25.97 90.0 23.19 3.3513% 0.8611%
Millsfield 94,828,130 7.13 86.5 0.67 2.5363% 0.0456%
Milton 511,927,925 23.56 96.6 *22.49 3.6420% ^ 0.2463%
Monroe 472,062,380 11.34 93.4 9.07 2.8894% 0.2271%
Mont Vernon 317,931,355 25.82 98.0 25.21 0.5952% 0.1529%
Moultonborough 3,610,712,814 7.15 93.7 6.67 23.2461% 1.7369%
Nashua I 11,880,404,376 21.76 88.0 18.69 22.2419% 5.7148%
Nelson 129,804,578 17.25 96.1 16.47 1.6177% 0.0624%
New Boston 751,423,402 25.05 . 89.5 22.23 1.4068% 0.3615%
New Castle 802,742,782 6.19 91.2 5.64 1.3558% 0.3861%
New Durham 541,924,712 23.72 77.1 18.21 3.8554% 0.2607%
New Hampton 361,939,285 19.24 92.7 17.52 2.7718% 0.1741%
New Ipswich 490,479,298 21.73 97.6 21.06 0.9183% 0.2359%
New London 1,321,078,870 14.71 94.6 13.88 6.8738% 0.6355%
Newbury 913,248,475 15.88 82.6 13.07 4.7518% 0.4393%
Newfields 291,658,003 20.59 103.6 21.08 0.4926% 0.1403%
Newington 1,073,222,127 9.34 99.4 8.32 1.8126% 0.5163%
Newmarket 1,071,729,412 24.26 91.9 22.11 1.8101% 0.5155%
Newport 477,089,001 32.53 92.2 29.46 9.0071% 0.2295%
'Flood control, forest, recreation lands, and others.
"Includes utilities and railroads
www.revenue.nh.gov 2020 Annual Report Of the Department Of Revenue Administration 147
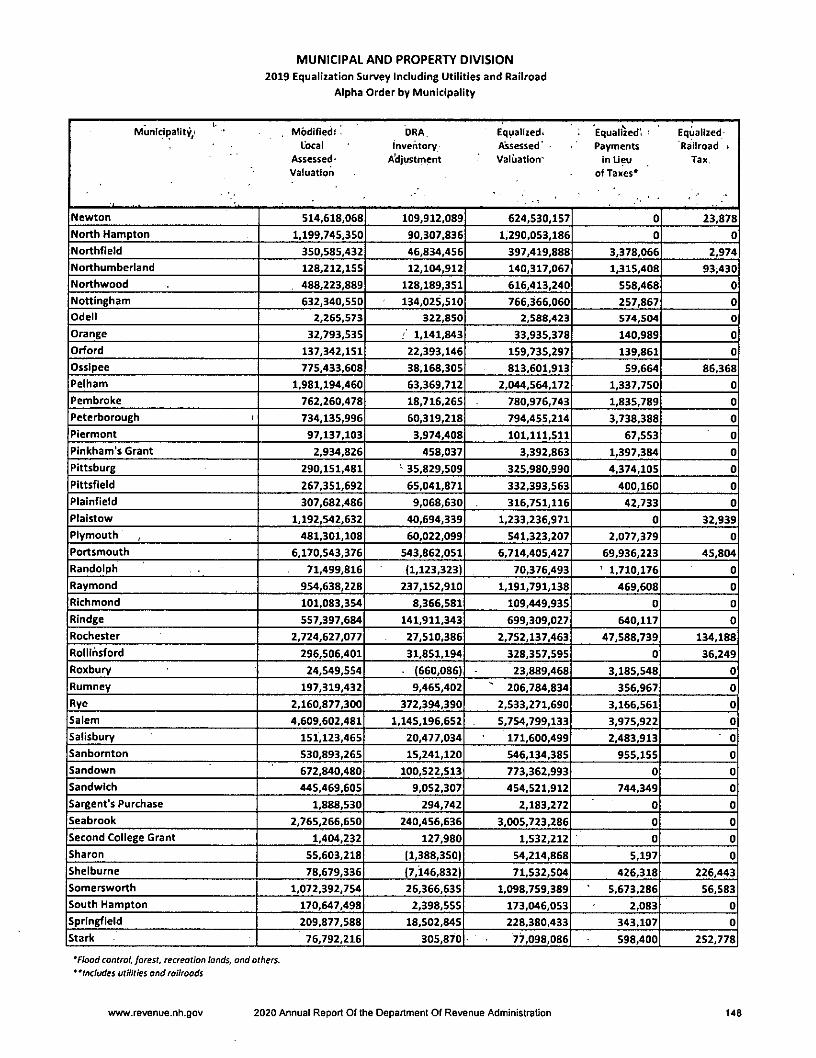
MUNICIPAL AND PROPERTY DIVISION
2019 Equalization Survey Including Utilities and Railroad
Alpha Order by Municipality
Municipality; ' , Modified^ . DRA. Equalized* • Equaiized' • Equalized-Local inventory Assessed' Payments Railroad *
Assessed- A'djustrnent Valuation^ inUeu Tax.Valuation of Taxes*
Newton 514,618.068 109,912,089 624,530,157 0 23,878
North Hampton 1,199,745,350 90,307,836 1,290,053,186 0 0
Northfleld 350,585,432 46,834,456 397,419,888 3,378,066 2,974
Northumberland 128,212,155 12,104,912 140,317,067 1,315,408 93i430
Northwood 488,223,889 128,189,351 616,413,240 558,468 0
Nottingham 632.340,550 134,025,510 766,366,060 257,867 0
Odell 2,265,573 322,850 2,588,423 574,504 0
Orange 32,793,535 1,141,843 33,935,378 140,989 0
Orford 137,342,151 22,393,146 159,735,297 139,861 0
Ossipee 775,433,608 38,168,305 813,601,913 59,664 86,368
Pelham 1,981,194,460 63,369,712 2,044,564,172 1,337,750 0
Pembroke 762,260,478 18,716,265 780,976,743 1,835,789 0
Peterborough > 734,135,996 60,319,218 794,455,214 3,738,388 0
Plermont 97,137,103 3,974,408 101,111,511 67,553 0
PInkham's Grant 2,934,826 458,037 3,392,863 1,397,384 0
PIttsburg 290,151,481 35,829,509 325,980,990 4,374,105 0
PIttsfleld 267,351,692 65,041,871 332,393,563 400,160 0
Plalnfield 307,682,486 9,068,630 316,751,116 42,733 0
Plalstow 1,192,542,632 40,694,339 1,233,236,971 0 32,939
Plymouth , 481,301,108 60,022,099 541,323,207 2,077,379 0
Portsmouth 6,170,543,376 543,862,051 6,714,405,427 69,936,223 45,804
Randolph 71,499,816 (1,123,323) 70,376,493 ^ 1,710,176 0
Raymond 954,638,228 237,152,910 1,191,791,138 469,608 0
Richmond 101,083,354 8,366,581 109,449,935 0 0
Rindge 557,397,684 141,911,343 699,309,027 640,117 0
Rochester 2,724,627,077 27,510,386 2,752,137,463 47,588,739 134,188
Rolllnsford 296,506,401 31,851,194 328,357,595 0 36,249
Roxbury 24,549,554 - (660,086) 23,889,468 3,185,548 0
Rumney 197,319,432 9,465,402 ^ 206,784,834 356,967 0
Rye 2,160,877,300 372,394,390 2,533,271,690 3,166,561 0
Salem 4,609,602,481 1,145,196,652 5,754,799,133 3,975,922 0
Salisbury 151,123,465 20,477,034 171,600,499 2,483,913 0
Sanbomton 530,893,265 15,241,120 546,134,385 955,155 0
Sandown 672,840,480 100,522,513 773,362,993 0 0
Sandwich 445,469,605 9,052,307 454,521,912 744,349 0
Sargent's Purchase 1,888,530 294,742 2,183,272 0 0
Seabrook 2,765,266,650 240,456,636 3,005,723,286 0 0
Second College Grant 1,404,232 127,980 1,532,212 0 0
Sharon 55,603,218 (1,388,350) 54,214,868 5,197 0
Shelburne 78,679,336 (7,146,832) 71,532,504 426,318 226,443
Somersworth 1,072,392,754 26,366,635 1,098,759,389 5,673,286 56,583
South Hampton 170,647,498 2,398,555 173,046,053 2,083 0
Springfield 209,877,588 18,502,845 228,380,433 343,107 0
Stark 76,792,216 305,870 77,098,086 598,400 252,778
'Flood control, forest, recreation lands, and others.
' 'Includes utilities ond rollroods
www.revenue.nh.gov 2020 Annual Report Of the Department Of Revenue Administration 148
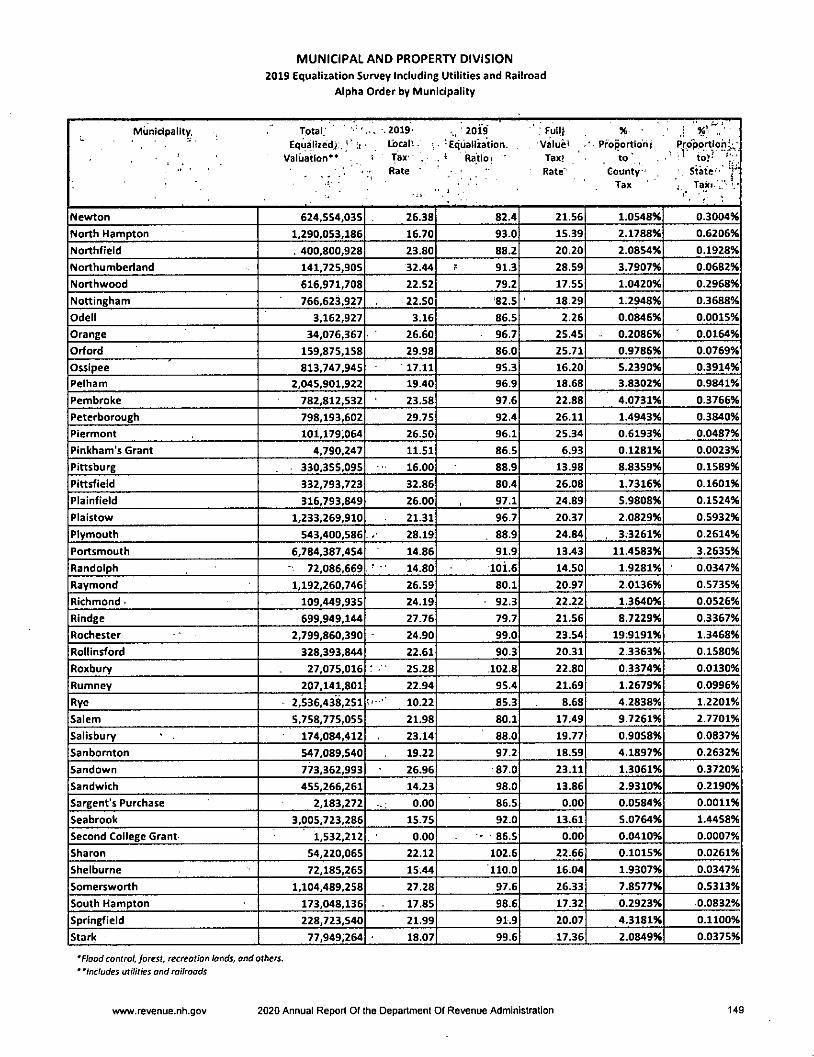
MUNICIPAL AND PROPERTY DIVISION
2019 Equalization Survey Including Utilities and Railroad
Alpha Order by Municipality
Munldpallty, Total ' • •.2019' 2019 ' fuljj X • . JEqualized^.:. ;i - Ibcalt - V' "Equalization. Valued Proportldrij Prpportlont;^-
• _ Valuation** = Tax " Ratio; ' Tax; to" , , • " tor'* ■ ' ' . 1^3*® ' Rate' County' State-'
•V ■ ' .. 1 ' ''' ' • "'"®* • Taxj-T-
Newton 624,554,035 26.38 82.4 21.56 1.0548X 0.3004%
North Hampton 1,290,053,186 16.70 93.0 15.39 2.1788X 0.6206%
Northfield . 400,800,928 23.80 88.2 20.20 2.0854% 0.1928%
Northumberland 141,725,905 32.44 ? 91.3 28.59 3.7907% 0.0682%
Northwood 616,971,708 22.52 79.2 17.55 1.0420% 0.2968%
Nottingham 766,623,927 22.50 82.5 18.29 1.2948% 0.3688%
Odell 3,162,927 3.16 86.5 2.26 0.0846% 0.0015%
Orange 34,076,367 26.60 96.7 25.45 0.2086% 0.0164%
Orford 159,875,158 29.98 86.0 25.71 0.9786% 0.0769%
Ossipee 813,747,945 17.11 95.3 16.20 5.2390% 0.3914%
Pelham 2,045,901,922 19.40 96.9 18.68 3.8302% 0.9841%
Pembroke 782,812.532 23.58 97.6 22.88 4.0731% 0.3766%
Peterborough 798,193,602 29.75 92.4 26.11 1.4943% 0.3840%
Piermont 101,179,064 26.50 96.1 25.34 0.6193% 0.0487%
Pinkham's Grant 4,790,247 11.51 86.5 6.93 0.1281% 0.0023%
Pittsburg 330,355,095 16.00 88.9 13.98 8.8359% 0.1589%
Pittsfield 332,793,723 32.86 80.4 26.08 1.7316% 0.1601%
Plainfield 316,793,849 26.00 97.1 24.89 5.9808% 0.1524%
Plaistow 1,233,269,910 21.31 96.7 20.37 2.0829% 0.5932%
Plymouth 543,400,586 28.19 88.9 24.84 . 3.3261% 0.2614%
Portsmouth 6,784,387,454 14.86 91.9 13.43 11.4583% 3.2635%
Randolph - 72,086,669 14.80 ioi.6 14.50 1.9281% 0.0347%
Raymond 1,192,260,746 26.59 80.1 20.97 2.0136% 0.5735%
Richmond ̂ 109,449,935 24.19 92.3 22.22 1.3640% 0.0526%
Rindge 699,949,144 27.76 79.7 21.56 8.7229% 0.3367%
Rochester 2,799,860,390 24.90 99.0 23.54 19.9191% 1.3468%
Rotlinsford 328,393,844 22.61 90.3 20.31 2.3363% 0.1580%
Roxbury 27,075,016' 25.28 102.8 22.80 0.3374% 0.0130%
Rumney 207,141,801 22.94 95.4 21.69 1.2679% 0.0996%
Rye 2,536,438,251 I ' • 10.22 85.3 8.68 4.2838% 1.2201%
Saiem 5,758,775,055 21.98 80.1 17.49 9.7261% 2.7701%
Salisbury * . 174,084,412 23.14 88.0 19.77 0.9058% 0.0837%
Sanbornton 547,089,540 19.22 97.2 18.59 4.1897% 0.2632%
Sandown 773,362^993 26.96 87.0 23.11 1.3061% 0.3720%
Sandwich 455,266,261 14.23 98.0 13.86 2.9310% 0.2190%
Sargent's Purchase 2,183,272 0.00 86.5 0.00 0.0584% 0.0011%
Seabrook 3,005,723,286 15.75 92.0 13.61 5.0764% 1.4458%
Second College Grant- 1,532,212 0.00 •' 86.5 0.00 0.0410% 0.0007%
Sharon 54,220,065 22.12 102.6 22.66 0.1015% 0.0261%
Shelburne 72,185,265 15.44 110.0 16.04 1.9307% 0.0347%
Somersworth 1,104,489,258 27.28 97.6 26.33 7.8577% 0.5313%
South Hampton 173,048,136 17.85 98.6 17.32 0.2923% 0.0832%
Springfield 228,723,540 21.99 91.9 20.07 4.3181% 0.1100%
Stark 77,949,264 18.07 99.6 17.36 2.0849% 0.0375%
'flood control, forest, recreation lands, and others.
' 'Includes utilities and railroads
www.revenue.nh.gov 2020 Annual Report Of the Department Of Revenue Administration 149
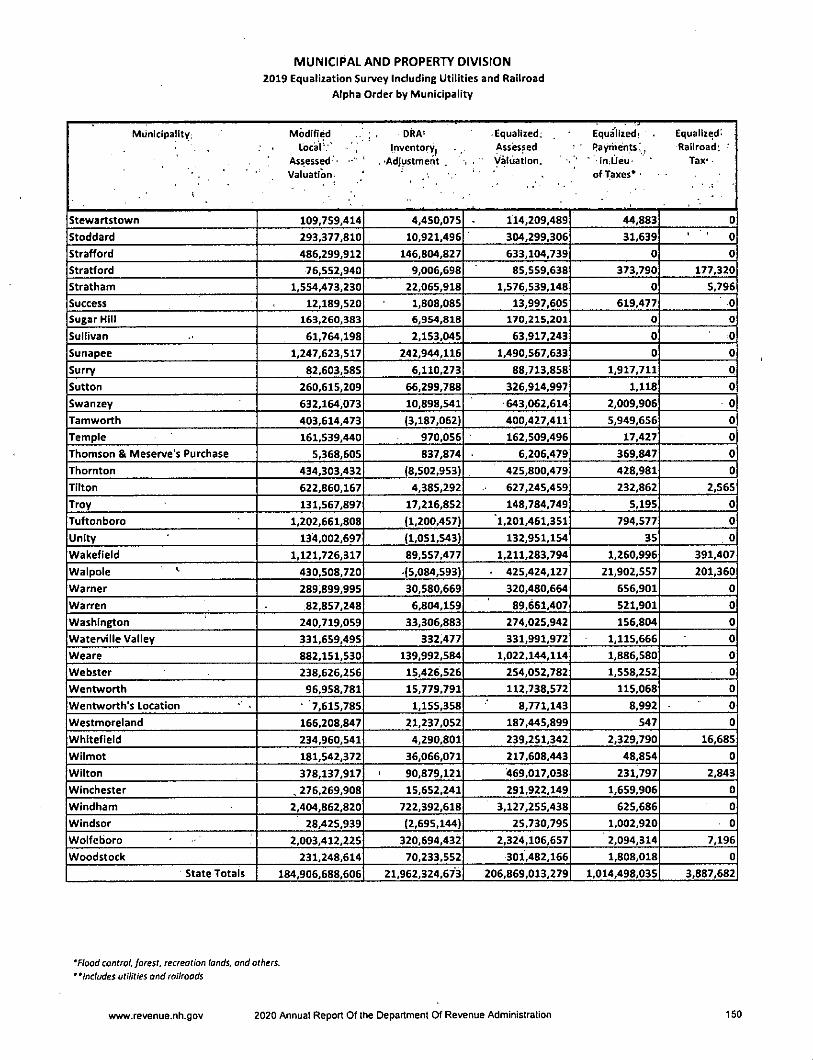
MUNICIPAL AND PROPERTY DIVISION
2019 Equalization Survey Including Utilities and Railroad
Alpha Order by Municipality
Municipality: Modified . DRA' -Equalized; Equalized; ■ Equalized-. , ; . Lbciar:;" Inventoryj Assiessed ■' Rayrhents,!;, Railroad; ■
Assessed - ' .-Adjustmeht , , • ' Valuation. • " iniUeu- Tax*Valuation- / . ofTaxes* ■
Stewaitstown 109,759.414 4,450,075 114,209,489 44,883 0
Stoddard 293,377,810 10,921,496 304,299,306 31,639 ' ' ' 0
Strafford 486,299,912 146,804,827 633,104,739 0 0
Stratford 76,552,940 9,006,698 85,559,638 373,790 177,320
Stratham 1,554,473,230 22,065,918 1,576,539,148 0 5,796
Success 12,189,520 1,808,085 13,997,605 619,477 0
Sugar Hill 163,260,383 6,954,818 170,215,201 0 0
Sullivan 61,764,198 2,153,045 63,917,243 0 0
Sunapee 1,247,623,517 242,944,116 1,490.567,633 0 0
Surry 82,603,585 6,110,273 88,713,858 1,917,711 0
Sutton 260,615,209 66,299,788 326,914,997 1,118 0
Swanzey 632,164,073 10,898,541 643,062,614 2,009,906 0
Tamworth 403,614,473 (3,187,062) 400,427,411 5,949,656 0
Temple 161,539,440 970,056 162,509,496 17,427 0
Thomson & Meserve's Purchase 5,368,605 837,874 6,206,479 369,847 0
Thornton 434,303,432 (8,502,953) 425,800,479 428,981 0
Tilton 622,860,167 4,385,292 627,245,459 232,862 2,565
Troy 131,567,897 17,216,852 148,784,749 5,195 0
Tuftonboro 1,202,661,808 (1,200,457) 1,201,461,351 794,577 0
Unity 134,002,697 (1,051,543) 132,951,154 35 0
Wakefield 1,121,726,317 89,557,477 1,211,283,794 1,260,996 391,407
Walpole ^ 430,508,720 (5,084,593) ' 425,424,127 21,902,557 201,360
Warner 289,899,995 30,580,669 320,480,664 656,901 0
Warren 82,857,248 6,804,159 89,661,407 521,901 0
Washington 240,719,059 33,306,883 274,025,942 156,804 0
Waterville Valley 331,659,495 332,477 331,991,972 1,115,666 0
Weare 882,151,530 139,992,584 1,022,144,114 1,886,580 0
Webster 238,626,256 15,426,526 254,052,782 1,558,252 0
Wentworth 96,958,781 15,779,791 112,738,572 115,068 0
Wentworth's Location • 7,615,785 1,155,358 8,771,143 8,992 0
Westmoreland 166,208,847 21,237,052 187,445,899 547 0
Whitefield 234,960,541 4,290,801 239,251,342 2,329,790 16,685
Wilmot 181,542,372 36,066,071 217,608,443 48,854 0
Wilton 378,137,917 > 90,879,121 469,017,038 231,797 2,843
Winchester . 276,269,908 15,652,241 291,922,149 1,659,906 0
Windham 2,404,862,820 722,392,618 3,127,255,438 625,686 0
Windsor 28,425,939 (2,695,144) 25,730,795 1,002,920 0
Wolfeboro 2,003,412,225 320,694,432 2,324,106,657 2,094,314 7,196
Woodstock 231,248,614 70,233,552 301,482,166 1,808,018 0
State Totals 184,906,688,606 21,962,324,673 206,869,013,279 1,014,498,035 3,887,682
'Flood control, forest, recreation lands, and others.
"Includes utilities and railroads
www.revenue.nh.gov 2020 Annual Report Of the Department Of Revenue Administration 150
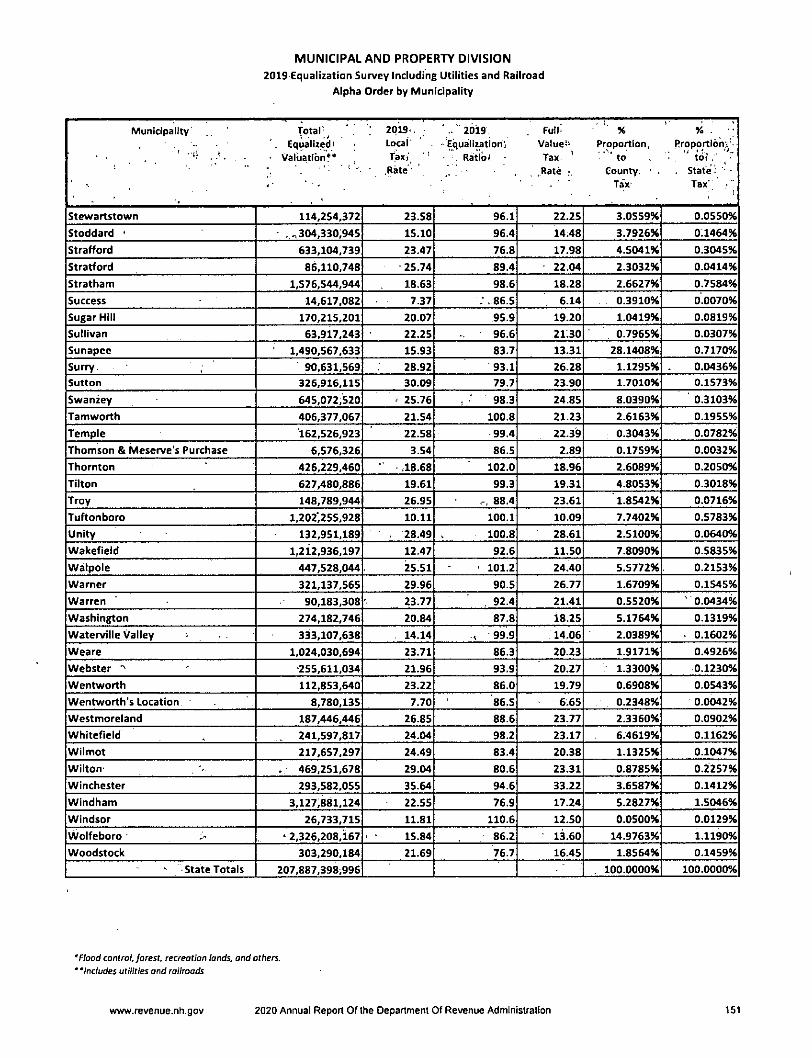
MUNICIPAL AND PROPERTY DIVISION
2019 Equalization Survey Including Utilities and Railroad
Alpha Order by Municipality
Munidpailtv To;ai;^ ' 2019' : ' "2619 . Full> ' %' 'equalized^ > Local' • Equalization'j Value'' Proportion, Proportion^
■ ■ • Valuation** Tax/ • , Ratloi Tax. ' ' " to ■ ' to;'.".Rate " • . .Rate r. County. • . Stated
. ■ ■ - Tax' Tax'
Stewartstown 114,254,372 23.58 96.1 22.25 3.0559% 0.0550%
Stoddard ' .,.304,330,945 15.10 96.4 14.48 3.7926% 0.1464%
Strafford 633,104,739 23.47 76.8 17.98 4.5041% 0.3045%
Stratford 86,110,748 ■25.74 89.4 22.04 2.3032% 0.0414%
Stratham 1,576,544,944 18.63 98.6 18.28 2.6627% 0.7584%
Success 14,617,082 7.37 ;. 86.5 6.14 0.3910% 0.0070%
Sugar Hill 170,215,201 20.07 95.9 19.20 1.0419% 0.0819%
Sullivan 63,917,243 22.25 96.6 2130 0.7965% 0.0307%
Sunapee ' 1,490,567,633 15.93 83.7 13.31 28.1408% 0.7170%
Surry 90,631,569 28.92 93.1 26.28 1.1295% 0.0436%
Sutton 326,916,115 30.09 79.7 23.90 1.7010% 0.1573%
Swanzey 645,072,520 ' 25.76 98.3 24.85 8.0390% 0.3103%
Tamworth 406,377,067 21.54 100.8 21.23 2.6163% 0.1955%
Temple 162,526,923 22.58 99.4 22.39 0.3043% 0.0782%
Thomson & Meserve's Purchase 6,576,326 3.54 86.5 2.89 0.1759% 0.0032%
Thornton 426,229,460 .18.68 102.0 18.96 2.6089% 0.2050%
Tllton 627,480,886 19.61 99.3 19.31 4.8053% 0.3018%
Troy 148,789,944 26.95 88.4 23.61 1.8542% 0.0716%
Tuftonboro 1,202,255,928 10.11 100.1 10.09 7.7402% 0.5783%
Unity 132,951,189 . 28.49 100.8 28.61 2.5100% 0.0640%
Wakefieid 1,212,936,197 12.47 92.6 11.50 7.8090% 0.5835%
Walpole 447,528,044 25.51 ' 101.2 24.40 5.5772% 0.2153%
Warner 321,137,565 29.96 90.5 26.77 1.6709% 0.1545%
Warren 90,183,308 23.77 , 92.4 21.41 0.5520% ' 0.0434%
Washington 274,182,746 20.84 87.8 18.25 5.1764% 0.1319%
Waterville Valley 333,107,638 14.14 99.9 14.06 2.0389% ■ 0.1602%
Weare 1,024,030,694 23.71 86.3 20.23 1.9171% 0.4926%
Webster 255,611,034 21.96 93.9 20.27 1.3300% 0.1230%
Wentworth 112,853,640 23.22 86.0 19.79 0.6908% 0.0543%
Wentworth's Location 8,780,135 7.70 86.5 6.65 0.2348% 0.0042%
Westmoreland 187,446,446 26.85 88.6 23.77 2.3360% 0.0902%
Whitefield 241,597,817 24.04 98.2 23.17 6.4619% 0.1162%
Wilmot 217,657,297 24.49 83.4 20.38 1.1325% 0.1047%
Wilton . 469,251,678 29.04 80.6 23.31 0.8785% 0.2257%
Winchester 293,582,055 35.64 94.6 33.22 3.6587% 0.1412%
Windham 3,127,881,124 22.55 76.9 17.24 5.2827% 1.5046%
Windsor 26,733,715 11.81 110.6 12.50 0.0500% 0.0129%
VVolfeboro ' • 2,326,208,167 ' - 15.84 86.2 - 13.60 14.9763% 1.1190%
Woodstock 303,290,184 21.69 76.7 16.45 1.8564% 0.1459%
" 'State Totals 207,887,398;996 . 100.0000% 100.0000%
'Flood control, forest, recreation lands, and others.' 'Includes utilities and railroads
www.revenue.nh.gov 2020 Annual Report Of the Department Of Revenue Administration 151
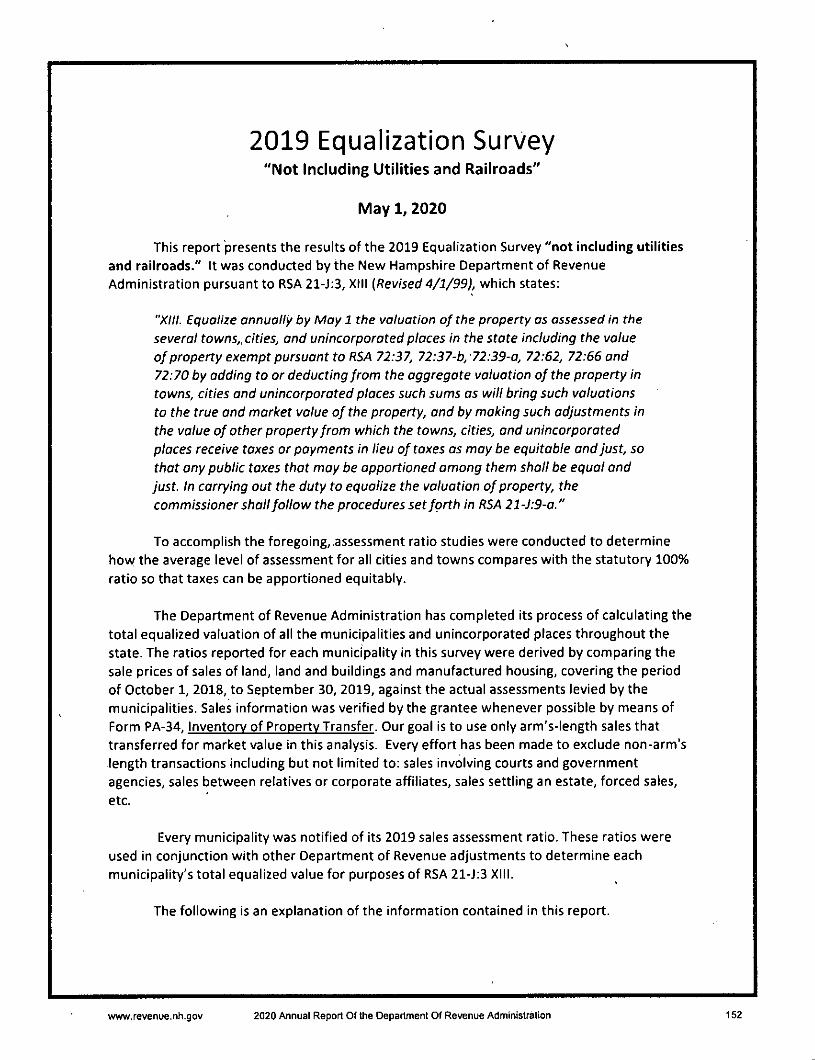
2019 Equalization Survey"Not Including Utilities and Railroads"
May 1, 2020
This report "presents the results of the 2019 Equalization Survey "not Including utilitiesand railroads." It was conducted by the New Hampshire Department of Revenue
Administration pursuant to RSA 21-J;3, XIII {Revised 4/1/99), which states:
"XIII. Equalize annually by May 1 the valuation of the property as assessed in the
several towns,, cities, and unincorporated places in the state including the value
of property exempt pursuant to RSA 72:37, 72:37-b, 72:39-a, 72:62, 72:66 and
72:70 by adding to or deducting from the aggregate valuation of the property intowns, cities and unincorporated places such sums as will bring such valuations
to the true and market value of the property, and by making such adjustments in
the value of other property from which the towns, cities, and unincorporatedplaces receive taxes or payments in lieu of taxes as may be equitable and Just, so
that any public taxes that may be apportioned among them shall be equal and
Just. In carrying out the duty to equalize the valuation of property, thecommissioner shall follow the procedures set forth in RSA 21-J:9-a."
To accomplish the foregoing, assessment ratio studies were conducted to determinehovy the average level of assessment for all cities and towns compares with the statutory 100%
ratio so that taxes can be apportioned equitably.
The Department of Revenue Administration has completed its process of calculating the
total equalized valuation of all the municipalities and unincorporated places throughout the
state. The ratios reported for each municipality in this survey were derived by comparing the
sale prices of sales of land, land and buildings and manufactured housing, covering the period
of October 1, 2018, to September 30, 2019, against the actual assessments levied by themunicipalities. Sales information was verified by the grantee whenever possible by means ofForm PA-34, Inventory of Property Transfer. Our goal Is to use only arm's-length sales thattransferred for market value In this analysis. Every effort has been made to exclude non-arm'slength transactions including but not limited to: sales involving courts and government
agencies, sales between relatives or corporate affiliates, sales settling an estate, forced sales,etc.
Every municipality was notified of its 2019 sales assessment ratio. These ratios were
used in conjunction with other Department of Revenue adjustments to determine eachmunicipality's total equalized value for purposes of RSA 21-J:3 XIII.
The following Is an explanation of the Information contained In this report.
www.revenue.nh.gov 2020 Annual Report Of the Department Of Revenue Administration 152
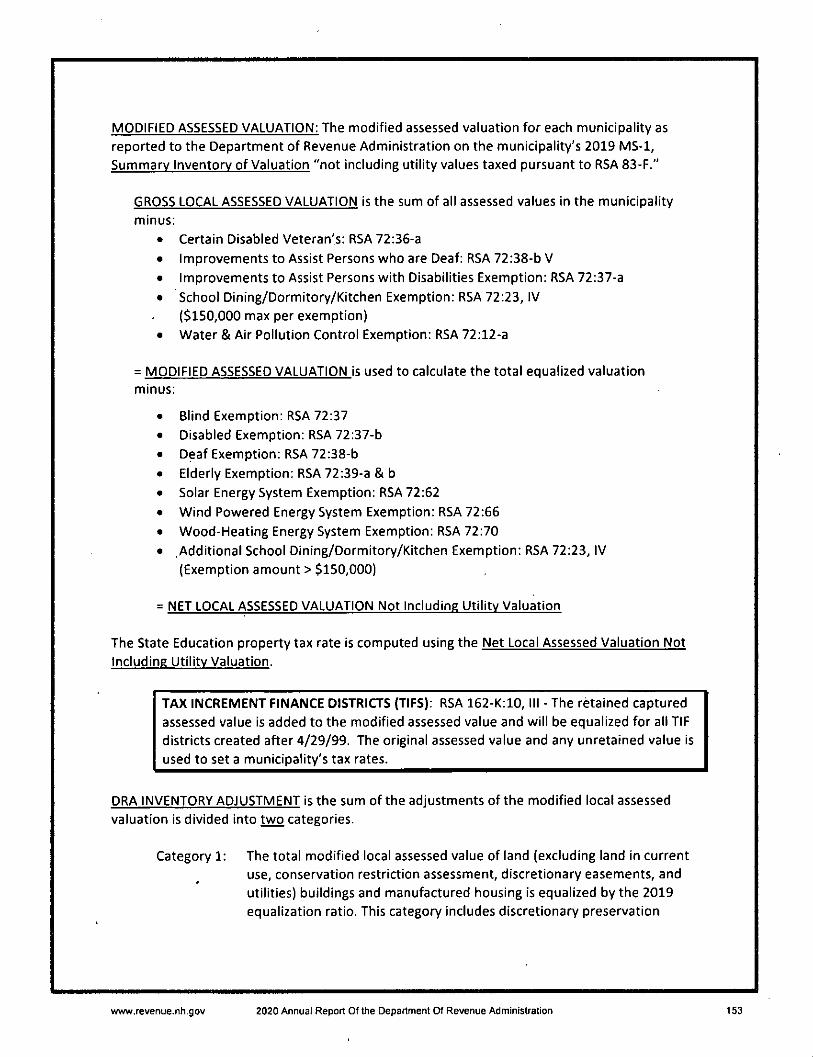
MODIFIED ASSESSED VALUATION: The modified assessed valuation for each municipality as
reported to the Department of Revenue Administration on the municipality's 2019 MS-1,Summary inventory of Valuation "not including utility values taxed pursuant to RSA 83-F."
GROSS LOCAL ASSESSED VALUATION is the sum of all assessed values in the municipality
minus:
• Certain Disabled Veteran's: RSA 72:36-a
• Improvements to Assist Persons who are Deaf: RSA 72:38-b V
• Improvements to Assist Persons with Disabilities Exemption: RSA 72:37-a
• School Dining/Dormitory/Kitchen Exemption: RSA 72:23, IV
($150,000 max per exemption)
• Water & Air Pollution Control Exemption: RSA 72:12-a
= MODIFIED ASSESSED VALUATION is used to calculate the total equalized valuation
minus:
Blind Exemption: RSA 72:37
Disabled Exemption: RSA 72:37-b
Deaf Exemption: RSA 72:38-b
Elderly Exemption: RSA 72:39-a & b
Solar Energy System Exemption: RSA 72:62
Wind Powered Energy System Exemption: RSA 72:66
Wood-Heating Energy System Exemption: RSA 72:70
Additional School Dining/Dormitory/Kitchen Exemption: RSA 72:23, IV(Exemption amount > $150,000)
= NET LOCAL ASSESSED VALUATION Not Including Utility Valuation
The State Education property tax rate is computed using the Net Local Assessed Valuation NotIncluding Utility Valuation.
TAX INCREMENT FINANCE DISTRICTS (TIPS): RSA 162-K:10, III - The retained captured
assessed value is added to the modified assessed value and will be equalized for all TIF
districts created after 4/29/99. The original assessed value and any unretained value is
used to set a municipality's tax rates.
DRA INVENTORY ADJUSTMENT is the sum of the adjustments of the modified local assessedvaluation is divided into two categories.
Category 1: The total modified local assessed value of land (excluding land in current
use, conservation restriction assessment, discretionary easements, and
utilities) buildings and manufactured housing is equalized by the 2019equalization ratio. This category includes discretionary preservation
www.revenue.nh.gov 2020 Annual Report Of the Department Of Revenue Administration 153
easements, taxation of farm structures, and land under farm structures.,
The difference between the modified local assessed valuation of land,
buildings and manufactured housing and the equalized value equals theDRA adjustment for land, buildings, and manufactured housing.
Category 2: An adjustment for land assessed at current use, conservation restrictionassessment, and discretionary easement values are made. This
adjustment is calculated by dividing the total net local assessed valuation
for land in these two categories by the 2018 equalization ratio to obtain
the equalized value of current use, conservation restriction assessments
and discretionary easements. If a municipality has had a full revaluation,
cyclical revaluation or full statistical revaluation as defined by Rev 601.24,Rev 601.16, and Rev 601.25, a ratio of 100.0 is used.
The difference between the local assessed value of the land and the
equalized value equals the DRA adjustment for current use, conservation
restriction assessments, and discretionary easements.
EQUALIZED ASSESSED VALUATION: The equalized assessed valuation represents the sum of the
"modified local assessed valuation" plus the DRA inventory adjustment. The equalized assessedvaluation represents the equalized value of all "taxable" properties in a municipality.
PAYMENT IN LIEU OF TAXES: The equalized value for payments received in lieu of taxes includes
State & Federal Forest Land Reimbursements, Recreation Land Reimbursements, Flood Land
Reimbursements, renewable energy facilities (if applicable) and others.
TOTAL EQUALIZED VALUATIONS NOT INCLUDING UTILITY VALUE AND EQUALIZED RAILROAD
TAXES: This figure represents the sum of the equalized assessed valuation and the equalizedvalue of payments in lieu of taxes.
The 2019 "total equalized valuation not including utility and equalized value of railroad monies
reimbursed to municipalities" will be used to apportion the state education property tax for the
tax year 2021. The 2018 total equalized valuation not including utilities and the value of railroadmonies reimbursed to municipalities was used to apportion the state education property tax for
the tax year 2020.
EQUALIZATION RATIO: The 2019 equalization ratio as determined by a ratio study conducted
by the Department of Revenue Administration's equalization staff.
% PROPORTION TO STATE TAX: The percentage of proportion to $1,000 of tax that is to beallocated to each town within the state by comparing the town's total equalized value to the
total equalized value of the state.
www.revenue.nh.gov 2020 Annual Report Of the Department Of Revenue Administration 154
APPEAL OF TOTAL EQUALIZED VALUATION
\
Municipalities were sent their 2019 Notification of Total Equalized Valuations on April 21, 2020.
Per RSA 71-8:5, II, any municipality aggrieved by the total equalized valuation as determined by
the DRA must appeal to the Board of Tax and Land Appeals in writing within 30 davs of thetown's notification of the municipality's total equalized valuation.
The appeal period is not extended due to any communication, either verbal or written,between the DRA and a municipality regarding the total equalized valuation.
www.revenue.nh.gov 2020 Annual Report Of the Department Of Revenue Administration 155

MUNICIPAL AND PROPERTY DIVISION
2019 Equalization Survey Not Including Utilities and Railroad
County Summary
County Mo^dified DRA Equalized Equalized ^oUj ^Local Inventory Assessed Payments Equalized Equalization Proportion
Assessed Valuation Adjustment Valuation in Lieu Valuation?.* ► Ratio^ to• of Taxes* , -State
Belknap 11,670,038,091 1,165,822,647 12,835,860,738 37,515,708 12,873,376,446 6.4671%
Carroll 14,054,368,529 1,237,076,697 15,291,445,226 22,437,493 15,313,882,719 7.6931%
Cheshire 6,922,811,534 635,429,442 7,558,240,976 67,949,199 7,626,190,175 3.8311%
Coos 2,715,636,176 249,950,606 2,965,586,782 76,902,873 3,042,489,655 1.5284%
Grafton 13,240,451,603 1,811.368,182 15,051,819,785 377,881,275 15,429,701,060 7.7513%
Hillsborough 44,974,228,929 6,788,925,350 51,763,154,279 72,460,360 51,835,614,639 26.0403%
Merrimack 16,597,135,004 • 1,673,500,498 18,270,635,502 79,845,097 18,350,480.599 9.2186%
Rockingham 49,480,479.771 6,086,082,746 55,566,562,517 167,598,507 55,734,161.024 27.9988%
Strafford 12,694,562,760 944,930,910 13,639,493,670 73,457,603 13,712,951,273 6.8889% .
Sullivan 4,582,202,984 519,811,171 5,102,014,155 38,449,920 5,140,464,075 2.5824%
State Totals 176,931,915,381 21,112,898,249 198,044,813,630 1,014,498,035 199,059,311,665 100.00%
' Flood control, forest, recreation lands, and others."Does not include utilities or railroads
www.revenue.nh.gov 2020 Annual Report Of the Department Of Revenue Administration 156
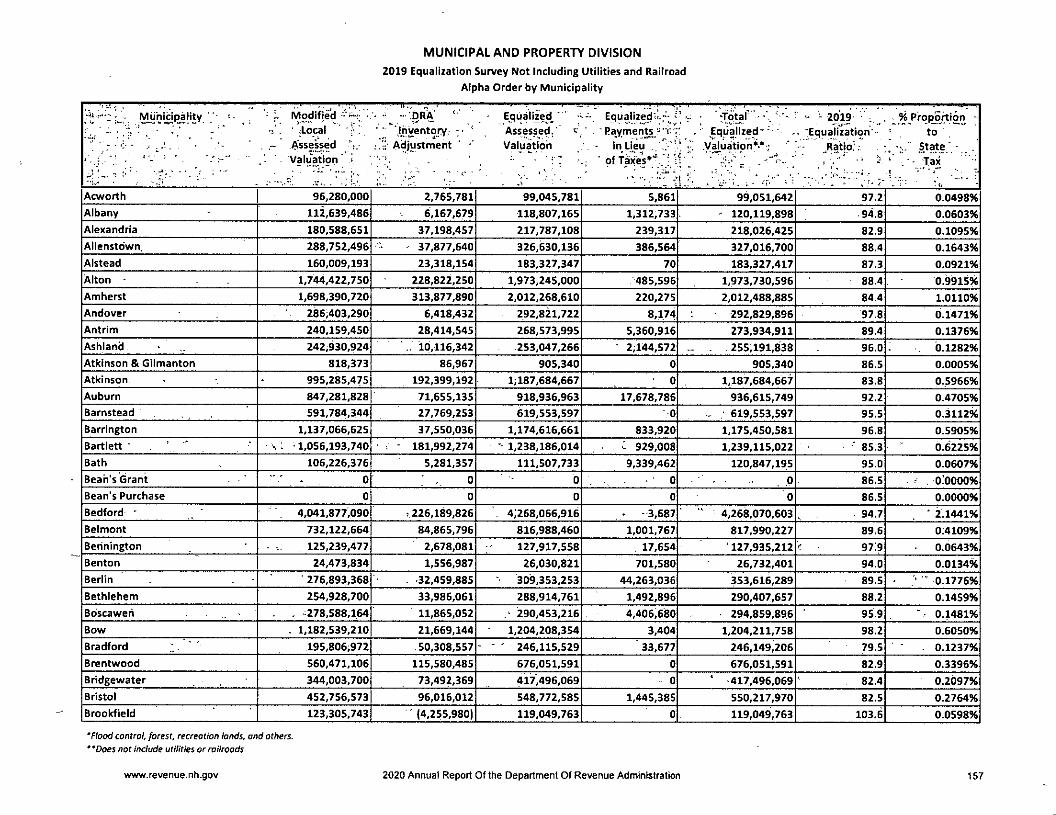
MUNICIPAL AND PROPERTY DIVISION
2019 Equalization Survey Not Including Utilities and Railroad
Alpha Order by Municipality
Modified -OrV ' • Equalized^ Equalized"-;';^'' ;: * ' Tdtaf - <■ 2019 . % Proportion -• ' rl-ooal ' J' ; • ^Jnventojy , Assessed.' - Payments;-' ■ Iquaii^e'd-■ .. .EquaTization'- to .
~ Assessed Adjustment " Valuation in Ueu " V; .V^uatlon*.*; ' _Ratio;r State" .■ ' ■ ■- ■ ■ '. .'"N " . ■ M' ,.' ' -v.'W, 1 V'" '' .-- .Tax
Acworth 96,280,000 2,765,781 99,045,781 5,861 99,051,642 97.2 0.0498%
Albany 112,639,486 6,167,679 118,807,165 1,312,733 - 120,119,898 94.8 0.0603%
Alexandria 180,588,651 37.198,457 217,787,108 239,317 218,026,425 82.9 0.1095%
Allenstown. 288,752,496 37,877,640 326,630,136 386,564 327,016,700 88.4 0.1643%
Alstead 160,009,193 23,318,154 183,327,347 70 183,327,417 87.3 0.0921%
Alton 1,744,422,750 228,822,250 1,973,245,000 485,596 1,973,730,596 88.4 0.9915%Amherst 1,698,390,720 313,877,890 2,012,268,610 220,275 2,012,488,885 84.4 1.0110%
Andover 286;403,290 6,418,432 292,821,722 8,174 292,829,896 97.8 0.1471%
Antrim 240,159,450 28,414,545 268,573,995 5,360,916 273,934,911 89.4 0.1376%
Ashland 242,930,924 10.116,342 253,047,266 ■ 2;144,572 .. . 255,191,838 96.0 0.1282%
Atkinson & Gilmanton 818,373 86,967 905,340 0 905,340 86.5 0.0005%
Atkinson 995,285,475 192,399,192 1;187,684,667 0 1,187,684,667 83.8 0.5966%
Auburn 847,281,828 71,655,135 918,936,963 17,678,786 936,615,749 92.2 0.4705%
Barnstead 591,784,344 27,769,253 619,553,597 0 - 619,553,597 95.5 0.3112%
Barrington 1,137,066,625 37,550,036 1,174,616,661 833,920 1,175.450.581 96.8 0.5905%
Bartlett " 1,056,193,740 - 181,992,274 ■ 1,238,186,014 : 929,008 1,239,115,022 ■ 85.3 0.6225%
Bath 106,226,376 5,281,357 111,507,733 9,339,462 120,847,195 95.0 0.0607%
Bean's Grant ' - 0 0 0 0 0 86.5 . 0:0000%Bean's Purchase 0 0 0 0 0 86.5 0.0000%
Bedford " 4,041,877,090 r 226,189,826 4;268,066,916 - - 3,687 4,268,070,603 . . 94.7 ■ 2.1441%
Belmont 732,122,664 84,865,796 816,988,460 1,001,767 817,990,227 89.6 0:4109%
Behnington 125,239,477 2,678,081 127,917,558 17,654 127,935,212 > 97:9 0.0643%
Benton 24,473,834 1,556,987 26,030,821 701,580 26,732,401 94.0 0.0134%Berlin 276,893,368 - -32,459,885 309,353,253 44,263,036 353,616,289 89.5 '• ' 0.1776%Bethlehem 254,928,700 33,986,061 288,914,761 1,492,896 290,407,657 88.2 0.1459%
Boscaweh . . 278,588,164 11,865,052 / 290,453,216 4,406,680 294,859,896 95.9 "• 0.1481%
Bow . 1,182.539,210 21,669,144 1,204,208,354 3,404 1,204,211,758 98.2 0.6050%
Bradford 195,806,972 .50,308,557 - ■ ' 246,115,529 33,677 246,149,206 79.5 0.1237%
Brentwood 560,471,106 115,580,485 676,051,591 0 676,051,591 82.9 0.3396%
Bridgewater 344,003,700 73,492,369 417,496,069 0 ' 417,496,069 82.4 0.2097%
Bristol 452,756,573 96,016,012 548,772,585 1,445,385 550,217,970 82.5 0.2764%
Brookfield 123,305,743 ' (4,255,980) 119,049,763 0 119,049,763 103.6 0.0598%
'Flood control, forest, recreation lands, and others.' 'Does not include utilities or railroads
www.revenue.nh.gov 2020 Annual Report Of the Department Of Revenue Administration 157
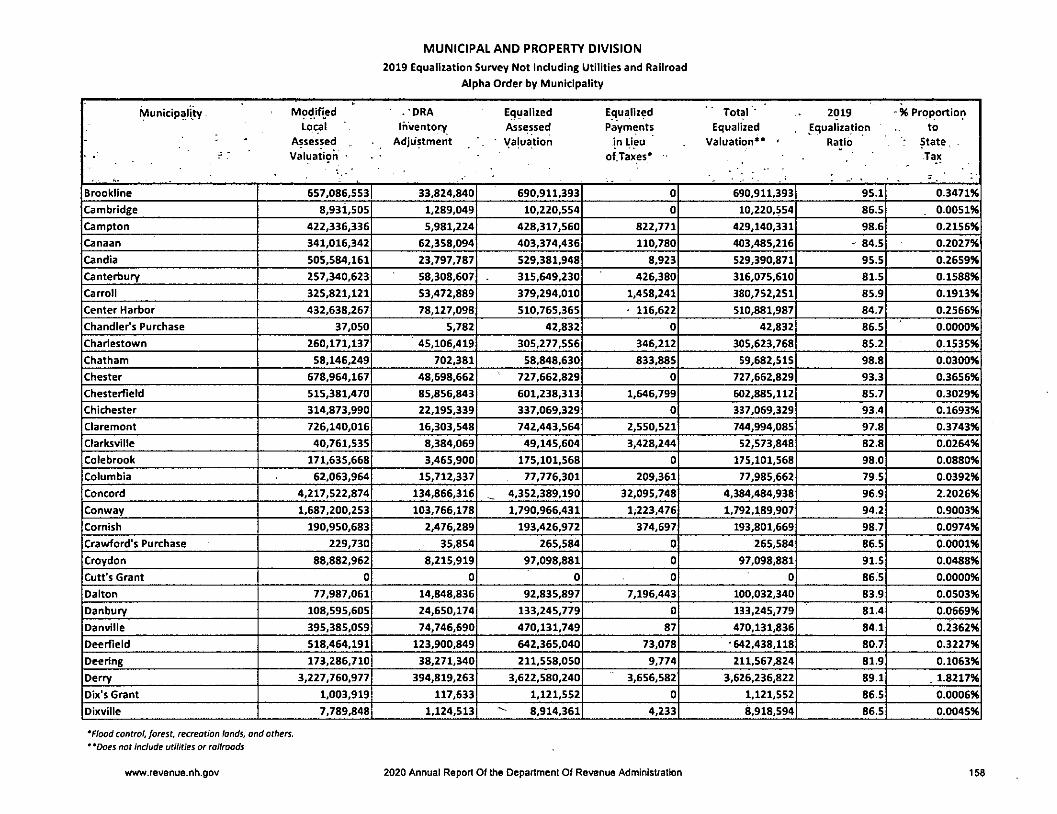
MUNICIPAL AND PROPERTV DIVISION
2019 Equalization Survey Not Including Utilities and Railroad
Alpha Order by Municipality
Municipality Modified .'DRA Equalized Equalized Total ' 2019 ProportionLocal Inventory Assessed Payments Equalized Equalization to
Assessed Adjustment ' Vajuation M.®" Valuation** ■ Ratio State. .^ ' Valuatipn • - • of.Taxes* • Tax
Brookline 657,086,553 33,824,840 690,911,393 0 690,911,393 95.1 0.3471%
Cambridge 8,931,505 1,289,049 10,220,554 0 10,220,554 86.5 0.0051%
Campton 422,336,336 5.981,224 428,317,560 822,771 429,140,331 98.6 0.2156%
Canaan 341,016,342 62,358,094 403,374,436 110,780 403,485,216 ' 84.5 0.2027%
Candia 505,584,161 23,797,787 529,381,948 8,923 529,390,871 95.5 0.2659%
Canterbury 257,340,623 58,308,607 315,649,230 426,380 316,075,610 81.5 0.1588%
Carroll 325,821,121 53,472,889 379,294,010 1,458,241 380,752,251 85.9 0.1913%
Center Harbor 432,638,267 78,127,098 510,765,365 116,622 510,881,987 84.7 0.2566%
Chandler's Purchase 37,050 5,782 42,832 0 42,832 86.5 0.0000%
Chaiiestown 260,171,137 ' 45,106,419 305,277,556 346,212 305,623,768 85.2 0.1535%
Chatham 58,146,249 702,381 58,848,630 833,885 59,682,515 98.8 0.0300%
Chester 678,964,167 48,698,662 727,662,829 0 727,662,829 93.3 0.3656%
Chesterfield 515,381,470 85,856,843 601,238,313 1,646,799 602,885,112 85.7 0.3029%
Chichester 314,873,990 22,195,339 337,069,329 0 337,069,329 93.4 0.1693%
Claremont 726,140,016 16,303,548 742,443,564 2,550,521 744,994,085 97.8 0.3743%
Clarksville 40,761,535 8,384,069 49,145,604 3,428,244 52,573,848 82.8 0.0264%
Colebrook 171,635,668 3,465,900 175,101,568 0 175,101,568 98.0 0.0880%
Columbia 62,063,964 15,712,337 77,776,301 209,361 77,985,662 79.5 0.0392%
Concord 4,217,522,874 134,866,316 _ 4,352,389,190 32,095,748 4,384,484,938 96.9 2.2026%
Conway 1,687,200,253 103,766,178 1,790,966,431 1,223,476 1,792,189,907 94.2 0.9003%
Cornish 190,950,683 2,476,289 193,426,972 374,697 193,801,669 98.7 0.0974%
Crawford's Purchase 229,730 35,854 265,584 0 265,584 86.5 0.0001%
Croydon 88,882,962 8,215,919 97,098,881 0 97,098,881 91.5 0.0488%
Cutt's Grant 0 0 0 0 0 86.5 0.0000%
Dalton 77,987,061 14,848,836 92,835,897 7,196,443 100,032,340 83.9 0.0503%
Danbury 108,595,605 24,650,174 133,245,779 0 133,245,779 81.4 0.0669%
Danville 395,385.059 74,746,690 470,131,749 87 470,131,836 84.1 0.2362%
Deerfield 518,464,191 123,900,849 642,365,040 73,078 -642,438,118 80.7 0.3227%
Dee ring 173,286,710 38,271,340 211,558,050 9,774 211,567,824 81.9 0.1063%
Derry 3,227,760,977 394,819,263 3,622,580,240 3,656,582 3,626,236,822 89.1 . 1.8217%
Dix's Grant 1,003,919 117,633 1,121,552 0 1,121,552 86.5 0.0006%
Dixville 7,789,848 1,124,513 ^ 8,914,361 4,233 8,918,594 86.5 0.0045%
'Flood control, forest, recreation lands, and others.
' 'Does not include utilities or railroads
www.revenue.nh.gov 2020 Annual Report Of the Department Of Revenue Administration 158
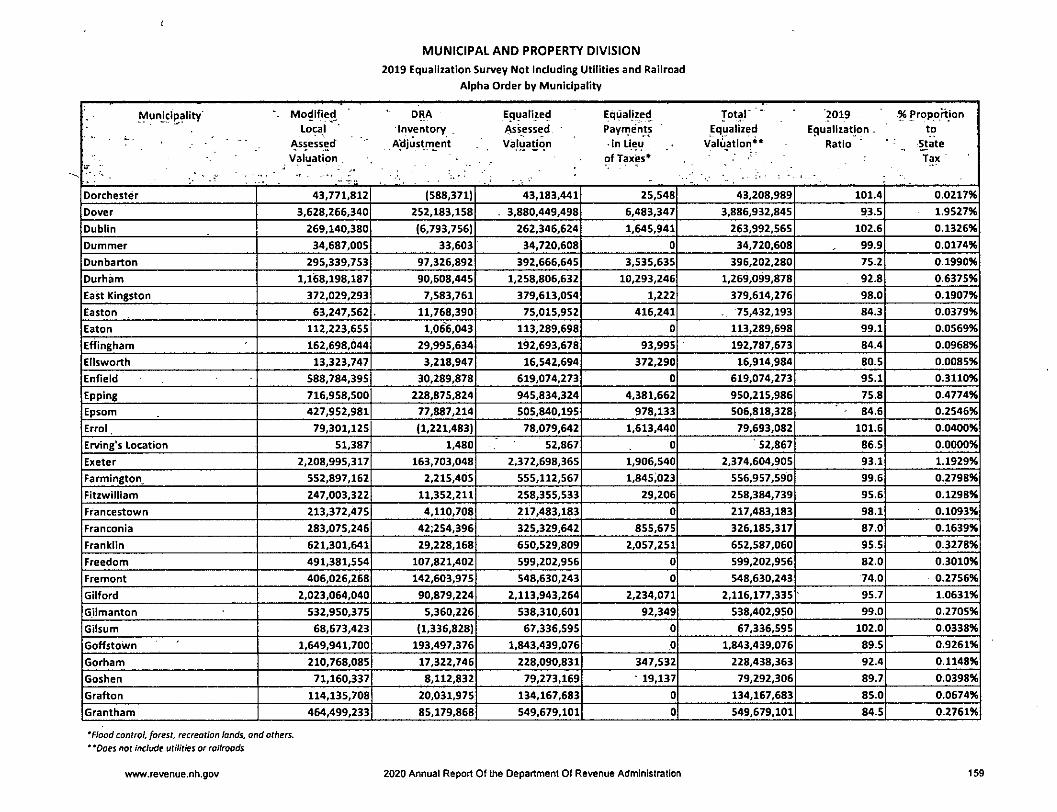
MUNICIPAL AND PROPERTY DIVISION
2019 Equalization Survey Not Including Utilities and Railroad
Alpha Order by Municipality
Municipality Modified ' ' DRA Equalized Eqtjalized Jof®' " 2019 .% ProportionLocal Inventory , Assessed ' Payments Equalized Equalization. to
" Assessed Adjustment Valuation -In Lieu Valuatlori** Ratio ' StateValuation , . of Taxes* Tax
Dorchester 43,771,812 (588,371) 43,183,441 25,548 43,208,989 101.4 0.0217%
Dover 3,628,266,340 252,183,158 . 3,880,449,498 6,483,347 3,886,932,845 93.5 1.9527%
Dublin 269,140,380 (6,793,756) 262,346,624 1,645,941 263,992,565 102.6 0.1326%
Dummer 34,687,005 33,603 34,720,608 0 34,720,608 99.9 0.0174%
Dunbarton 295,339,753 97,326,892 392,666,645 3,535,635 396,202,280 75.2 0.1990%
Durham 1,168,198,187 90,608,445 1,258,806,632 10,293,246 1,269,099,878 92.8 0.6375%
East Kingston 372,029,293 7,583,761 379,613,054 1,222 379,614,276 98.0 0.1907%
Easton 63,247,562 11,768,390 75,015,952 416,241 . 75,432,193 84.3 0.0379%
Eaton 112,223,655 1,066,043 113,289,698 0 113,289,698 99.1 0.0569%
Efflngham 162,698,044 29,995,634 192,693,678 93,995 192,787,673 84.4 0.0968%
Ellsworth 13,323,747 3,218,947 16,542,694 372,290 16,914,984 80.5 0.0085%
Enfield 588,784,395 30,289,878 619,074,273 0 619,074,273 95.1 0.3110%
Epping 716,958,500 228,875,824 945,834,324 4,381,662 950,215,986 75.8 0.4774%
Epsom 427,952,981 77,887,214 505,840,195 978,133 506,818,328 - 84.6 0.2546%
Errol 79,301,125 (1,221,483) 78,079,642 1,613,440 79,693,082 101.6 0.0400%
Erving's Location 51,387 1,480 52,867 0 52,867 86.5 0.0000%
Exeter 2,208,995,317 163,703,048 2,372,698,365 1,906,540 2,374,604,905 93.1 1.1929%
Parmington, 552,897,162 2,215,405 555,112,567 1,845.023 556,957,590 99.6 0.2798%
FItzwilllam 247,003,322 11,352,211 258,355,533 29,206 258,384,739 95.6 0.1298%
Francestown 213,372,475 4,110,708 217,483,183 0 217,483,183 98.1 0.1093%
Franconia 283,075,246 42;254,396 325,329,642 855,675 326,185,317 87.0 0.1639%
Franklin 621,301,641 29,228,168 650,529,809 2,057,251 652,587,060 95.5 0.3278%
Freedom 491,381,554 107,821,402 599,202,956 0 599,202,956 82.0 0.3010%
Fremont 406,026,268 142,603,975 548,630,243 0 548,630,243 74.0 0.2756%
Gilford 2,023,064,040 90,879,224 2,113,943,264 2,234,071 2,116,177,335 95.7 1.0631%
Gilmanton 532,950,375 5,360,226 538,310,601 92,349 538,402,950 99.0 0.2705%
Gilsum 68,673,423 (1,336,828) 67,336,595 0 67,336,595 102.0 0.0338%
Goffstown 1,649,941,700 193.497,376 1,843,439,076 0 1,843,439,076 89.5 0.9261%
Gorham 210,768,085 17,322,746 228,090,831 347,532 228,438,363 92.4 0.1148%
Goshen 71,160,337 8,112,832 79,273,169 19,137 79,292,306 89.7 0.0398%
Grafton 114,135,708 20,031,975 134,167,683 0 134,167,683 85.0 0.0674%
Grantham 464,499,233 85,179,868 549,679,101 0 549,679,101 84.5 0.2761%
'Flood control, forest, recreation lands, and others.
' 'Does not include utilities or railroads
www.revenue.nh.gov 2020 Annual Report Of the Department Of Revenue Administration t59
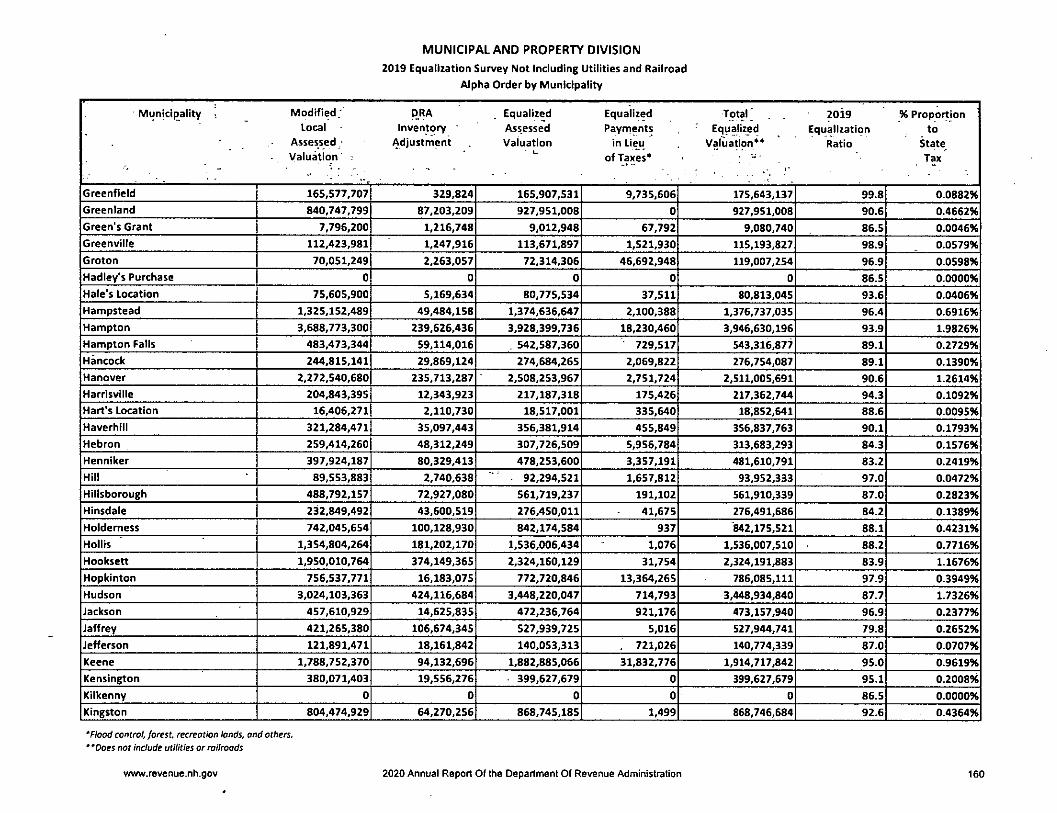
MUNICIPAL AND PROPERTY DIVISION
2019 Equalization Survey Not Including Utilities and Railroad
Alpha Order by Municipality
Municipality Modified; DRA , Equalized Equalized Total . . 20i9 % ProportionLocal Inventory Assessed Paynients Equalized Equalization to
Assessed Adjustment Valuation '"Lieu Valuation** Ratio State
Valuation" t oflaxes* , Tax
Greenfield 165,577,707 329,824 165,907,531 9,735,606 175,643,137 99.8 0.0882%
Greenland 840,747,799 87,203,209 927,951,008 0 927,951,008 90.6 0.4662%
Green's Grant 7,796,200 1,216,748 9,012,948 67,792 9,080,740 86.5 0.0046%
Greenville 112,423,981 1,247,916 113,671,897 1,521,930 115,193,827 98.9 0.0579%
Groton 70,051,249 2,263,057 72.314,306 46,692,948 119,007,254 96.9 0.0598%
Hadley's Purchase 0 0 0 0 0 86.5 0.0000%
Hale's Location 75,605,900 5,169,634 80,775,534 37,511 80,813,045 93.6 0.0406%
Hampstead 1,325,152,489 49,484,158 1,374,636,647 2,100,388 1,376>737,035 96.4 0.6916%
Hampton 3,688,773,300 239,626,436 3,928,399,736 18,230,460 3,946,630,196 93.9 1.9826%
Hampton Falls 483,473,344 59,114,016 . 542,587,360 729,517 543,316,877 89.1 0.2729%
Hancock 244,815,141 29,869,124 274,684,265 2,069,822 276,754,087 89.1 0.1390%
Hanover 2,272,540,680 235,713,287 2,508,253,967 2,751,724 2,511,005,691 90.6 1.2614%
Harrisville 204,843,395 12,343,923 217,187,318 175,426 217,362,744 94.3 0.1092%
Hart's Location 16,406,271 2,110,730 18,517,001 335,640 18,852,641 88.6 0.0095%
Haverhill 321,284,471 35,097,443 356,381,914 455,849 356,837,763 90.1 0.1793%
Hebron 259,414,260 48,312,249 307,726,509 5,956,784 313,683,293 84.3 0.1576%
Henniker 397,924,187 80,329,413 478,253,600 3,357,191 481,610,791 83.2 0.2419%
Hill 89,553,883 2,740,638 92,294,521 1,657,812 93,952,333 97.0 0.0472%
Hillsborough 488,792,157 72,927,080 561,719,237 191,102 561,910,339 87.0 0.2823%
Hinsdale 232,849,492 43,600,519 276,450,011 41,675 276,491,686 84.2 0.1389%
Holdemess 742,045,654 100,128,930 842,174,584 937 '842,175,521 88.1 0.4231%
Hollis 1,354,804,264 181,202,170 1,536,006,434 1,076 1,536,007,510 88.2 0.7716%
Hooksett 1,950,010,764 374,149,365 2,324,160,129 31,754 2,324,191,883 83.9 1.1676%
Hopkinton 756,537,771 16,183,075 772,720,846 13,364,265 786,085,111 97.9 0.3949%
Hudson 3,024,103,363 424,116,684 3,448,220,047 714,793 3,448,934,840 87.7 1.7326%
Jackson 457,610,929 14,625,835 472,236,764 921,176 473,157,940 96.9 0.2377%
Jaffrey 421,265,380 106,674,345 527,939,725 5,016 527,944,741 79.8 0.2652%
Jefferson 121,891,471 18,161,842 140,053,313 . 721,026 140,774,339 87.0 0.0707%
Keene 1,788.752,370 94,132,696 1,882,885,066 31,832,776 1,914,717,842 95.0 0.9619%
Kensington 380,071,403 19,556,276 399,627,679 0 399,627,679 95.1 0.2008%
Kilkenny 0 0 0 0 0 86.5 0.0000%
Kingston 804,474,929 64,270,256 868,745,185 1,499 868,746,684 92.6 0.4364%
'Flood control, forest, recreation lands, and others.
' 'Does not include utilities or railroads
www.revenue.nh.gov 2020 Annual Report Of the Department Of Revenue Administration 160
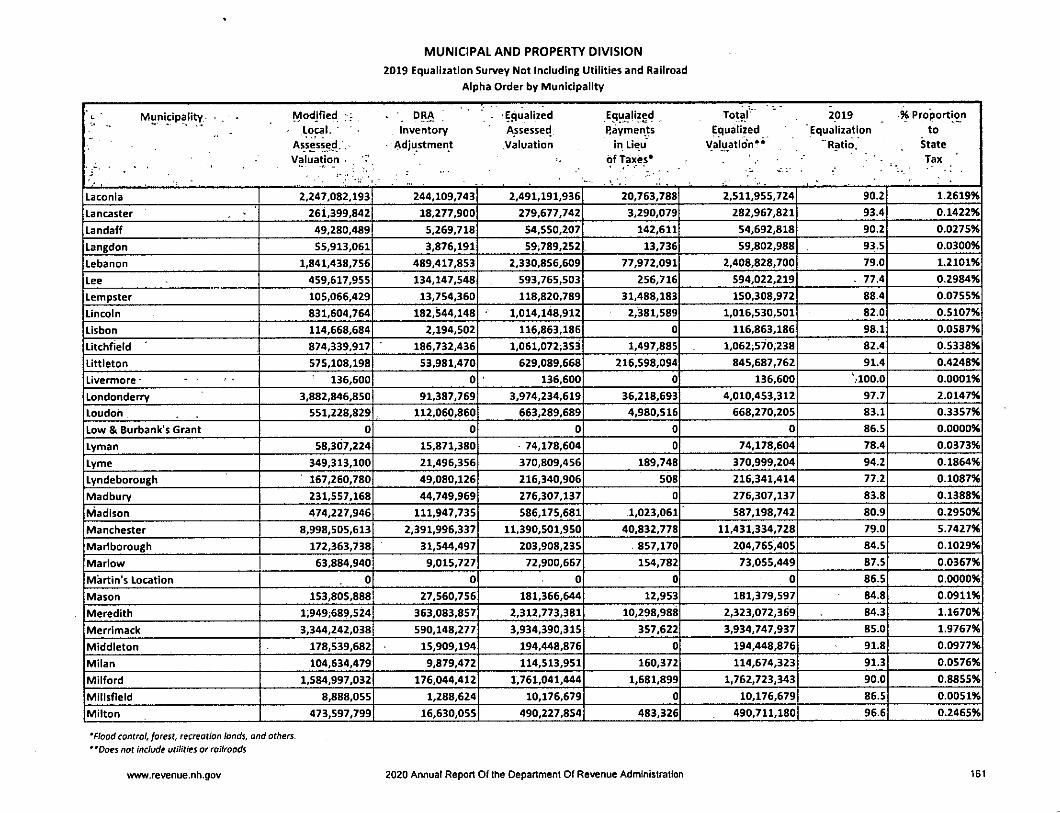
MUNICIPAL AND PROPERTY DIVISION
2019 Equalization Survey Not Including Utilities and Railroad
Alpha Order by Municipality
<■ ■ Municipality • . ■ Modjfied ; : - ' DRA ^ -Equalized Equalized 2pl9 % Proportio^n' . Local. ^ Inventory Assessed Payments Equalized Equalization to
Assessed, , - Adjustment Valuation 'n Lieu Valuation** "Ratio. StateValuation ■ , of Taxes* Tax
Laconia 2.247.082.193 244,109,743 2,491,191,936 20,763,788 2,511,955,724 90.2 1.2619%
Lancaster 261.399,842 18,277,900 279,677,742 3,290,079 282,967,821 93.4 0.1422%
Landaff 49.280.489 5,269,718 54,550,207 142,611 54,692,818 90.2 0.0275%
Langdon 55,913,061 3,876,191 59,789,252 13,736 59,802,988 93.5 0.0300%
Lebanon 1,841,438,756 489,417,853 2,330,856,609 77,972,091 2,408,828,700 79.0 1.2101%
Lee 459,617,955 134,147,548 593,765,503 256,716 594,022,219 - 77.4 0.2984%
Lempster 105,066,429 13,754,360 118,820,789 31,488,183 150,308,972 88.4 0.0755%
Lincoln 831,604.764 182,544,148 1,014,148,912 2,381,589 1,016,530,501 82.0 0.5107%
Lisbon 114,668,684 2,194,502 116,863,186 0 116,863,186 98.1 0.0587%
Litchfield 874,339,917 186,732,436 1,061,072;353 1,497,885 1,062;570,238 82.4 0.5338%
Littleton 575,108,198 53,981,470 629,089,668 216,598,094 845,687,762 91.4 0.4248%
Livermore • 136,600 0 136,600 0 136,600 .100.0 0.0001%
Londonderry 3,882,846,850 91,387,769 3,974,234,619 36,218,693 4,010,453,312 97.7 2.0147%
Loudoh 551,228,829 112,060,860 663,289,689 4,980,516 668,270,205 83.1 0.3357%
Low & Burbank's Grant 0 0 0 0 0 86.5 0.0000%
Lyman 58,307,224 15,871,380 74,178,604 0 74,178,604 78.4 0.0373%
Lyme 349,313,100 21,496,356 370,809,456 189,748 370,999,204 94.2 0.1864%
Lyndeborough 167,260,780 49,080,126 216,340,906 508 216,341,414 77.2 0.1087%
Madbury 231,557,168 44,749,969 276,307,137 0 276,307,137 83.8 0.1388%
Madison 474,227,946 111,947,735 586,175,681 1,023,061 587,198,742 80.9 0.2950%
Manchester 8,998,505,613 2,391,996,337 11,390,501,950 40,832,778 11,431,334,728 79.0 5.7427%
Marlborough 172,363,738 31,544,497 203,908,235 857,170 204,765,405 84.5 0.1029%
Marlow 63,884,940 9,015,727 72,900,667 154,782 73,055,449 87.5 0.0367%
Martin's Location 0 0 0 0 0 86.5 0.0000%
Mason 153,805,888 27,560,756 181,366,644 12,953 181,379,597 84.8 0.0911%
Meredith l;949i689,524 363,083,857 2,312,773,381 10,298,988 2,323,072,369 84.3 1.1670%
Merrimack 3,344,242,038 590,148,277 3,934,390,315 357,622 3,934,747,937 85.0 1.9767%
Middleton 178,539,682 15,909,194 194,448,876 0 194,448,876 91.8 0.0977%
Milan 104,634,479 9,879,472 114,513,951 160,372 114,674,323 91.3 0.0576%
Milford 1,584,997,032 176,044,412 1,761,041,444 1,681,899 1,762,723,343 90.0 0.8855%
Millsfield 8,888,055 1,288,624 10,176,679 0 10,176,679 86.5 0.0051%
Milton 473,597,799 16,630,055 490,227,854 483,326 490,711,180 96.6 0.2465%
'Flood control, forest, recreation lands, and others."Does not include utilities or railroads
www.revenue.nh.gov 2020 Annual Report Of the Department Of Revenue Administration 161
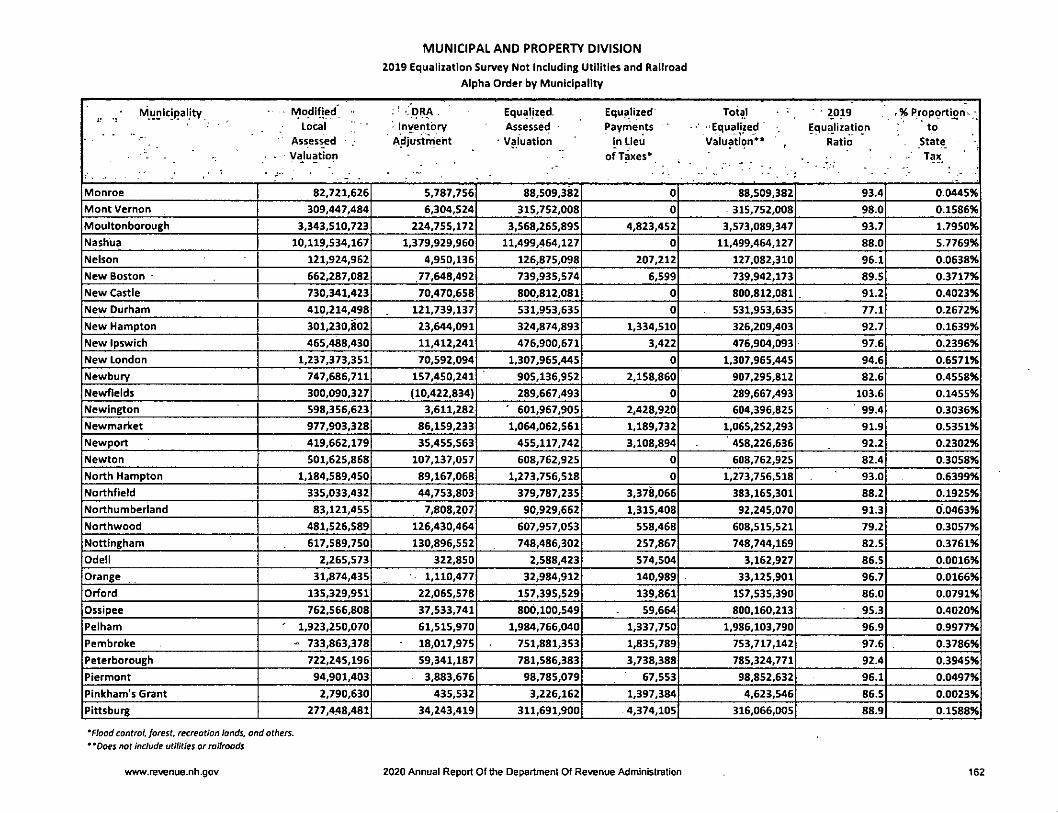
MUNICIPAL AND PROPERTY DIVISION
2019 Equalization Survey Not Including Utilities and Railroad
Alpha Order by Municipality
Municipality ' Modified :' DRA . Equalized. Equalized' 2019 »% Propqrtlori^ •• Local - Inventory Assessed • Payments ' -Equalized Equalization to
■ Assessed Adjustrneht Valuation in Lieu Valuation** , Ratio State
-- . of Taxes* - : ' •
Monroe 82,721,626 5,787,756 88,509,382 0 88,509,382 93.4 0.0445%
Mont Vernon 309,447,484 6,304,524 315,752,008 0 - 315,752,008 98.0 0.1586%
Moultonborough 3,343,510,723 224,755,172 3,568,265,895 4,823,452 3,573,089,347 93.7 1.7950%
Nashua 10,119,534,167 1,379,929,960 11,499,464,127 0 11,499,464,127 88.0 5.7769%
Nelson 121,924,962 4,950,136 126,875,098 207,212 127,082,310 96.1 0.0638%
New Boston 662,287,082 77,648,492 739,935,574 6,599 739,942,173 89.5 0.3717%
New Castle 730,341,423 70,470,658 800,812,081 0 800,812,081 91.2 0.4023%
New Durham 410,214,498 121,739,137 531,953,635 0 531,953,635 77.1 0.2672%
New Hampton 301,230,802 23,644,091 324,874,893 1,334,510 326,209,403 92.7 0.1639%
New Ipswich 465,488,430 11,412,241 476,900,671 3,422 476,904,093 97.6 0.2396%
New London 1,237,373,351 70,592,094 1,307,965,445 0 1,307,965,445 94.6 0.6571%
Newbury 747,686,711 157,450,241 905,136,952 2,158,860 907,295,812 82.6 0.4558%
Newfields 300,090,327 (10,422,834) 289,667,493 0 289,667,493 103.6 0.1455%
Newington 598,356,623 3,611,282 ' 601,967,905 2,428,920 604,396,825 99.4 0.3036%
Newmarket 977,903,328 86,159,233 1,064,062,561 1,189,732 1,065,252,293 91.9 0.5351%
Newport 419,662,179 35,455,563 455,117,742 3,108,894 458,226,636 92.2 0.2302%
Newton 501,625,868 107,137,057 608,762,925 0 608,762,925 82.4 0.3058%
North Hampton 1,184,589,450 89,167,068 1,273,756,518 0 1,273,756,518 93.0 0.6399%
Northfield 335,033,432 44,753,803 379,787,235 3,37^66 383,165,301 88.2 0.1925%
Northumberland 83,121,455 7,808,207 90,929,662 1,315,408 92,245,070 91.3 0.0463%
Northwood 481,526,589 126,430,464 607,957,053 558,468 608,515,521 79.2 0.3057%
Nottingham 617,589,750 130,896,552 748,486,302 257,867 748,744,169 82.5 0.3761%
Odeli 2,265,573 322,850 2,588,423 574,504 3,162,927 86.5 0.0016%
Orange 31,874,435 1,110,477 32,984,912 140,989 33,125,901 96.7 0.0166%
Orford 135,329,951 22,065,578 157,395,529 139,861 157,535,390 86.0 0.0791%
Ossipee 762,566,808 37,533,741 800,100,549 59,664 800,160,213 95.3 0.4020%
Pelham ' 1,923,250,070 61,515,970 1,984,766,040 1,337,750 1,986,103,790 96.9 0.9977%
Pembroke - 733,863,378 18,017,975 751,881,353 1,835,789 753,717,142 97.6 0.3786%
Peterborough 722,245,196 59,341,187 781,586,383 3,738,388 785,324,771 92.4 0.3945%
Piermont 94,901,403 3,883,676 98,785,079 67,553 98,852,632 96.1 0.0497%
Pinkham's Grant 2,790,630 435,532 3,226,162 1,397,384 4,623,546 86.5 0.0023%
Pittsburg 277,448,481 34,243,419 311,691,900 4,374,105 316,066,005 88.9 0.1588%
'Flood control, forest, recreation lands, and others.
' 'Does not include utilities or railroads
www.revenue.nh.gov 2020 Annual Report Of the Department Of Revenue Administration 162
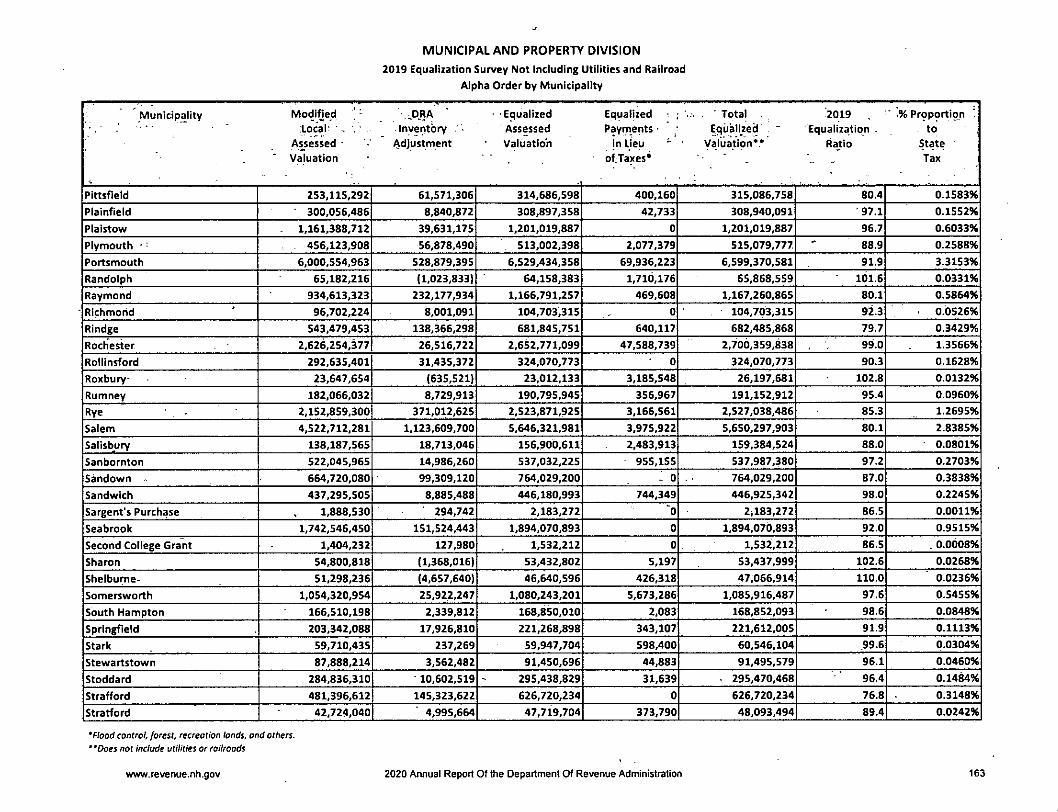
MUNICIPAL AND PROPERTY DIVISION
2019 Equalization Survey Not Including Utilities and Railroad
Alpha Order by Municipality
Municipality Modified ' :PRA • -Equalized Equalized . ' Total 2019 , Proportion 'local' Inventory ' • Assessed Payritents • Equalized ' Equalization . to
Assessed Adjustment Valuation iP Usu yaluation*,* Rajlo StateValuation of.Taxes* Tax
PIttsfleld 253,115,292 61,571,306 314,686,598 400,160 315,086,758 80.4 0.1583%
Plainfield 300,056,486 8,840,872 308,897,358 42,733 308,940,091 97.1 0.1552%
Plalstow 1,161,388,712 39,631,175 1,201,019,887 0 1,201,019,887 96.7 0.6033%
Plymouth - 456,123,908 56,878,490 513,002,398 2,077,379 515,079,777 88.9 0.2588%
Portsmouth 6,000,554,963 528,879,395 6,529,434.358 69,936,223 6,599,370,581 91.9 3.3153%
Randolph 65,182,216 (1,023,833) 64,158,383 1,710,176 65,868,559 101.6 0.0331%
Raymond 934,613,323 232,177,934 1,166,791,257 469,608 1,167,260,865 80.1 0.5864%
Richmond 96,702,224 8,001,091 104,703,315 0 104,703,315 92.3 - 0.0526%
RIndge 543.479,453 138,366,298 681,845,751 640,117 682,485,868 79.7 0.3429%
Rochester 2,626,254,377 26,516,722 2,652,771,099 47,588,739 2,700,359,838 99.0 1.3566%
Rollinsford 292,635,401 31,435,372 324,070,773 0 324,070,773 90.3 0.1628%
Roxbury- 23,647,654 (635,521) 23,012,133 3,185,548 26,197,681 102.8 0.0132%
Rumney 182,066,032 8,729,913 190,795,945 356,967 191,152,912 95.4 0.0960%
Rye 2,152,859,300 371,012,625 2,523,871,925 3,166,561 2,527,038,486 85.3 1.2695%
Salem 4,522,712,281 1,123,609,700 5,646,321,981 3,975,922 5,650,297,903 80.1 2.8385%
Salisbury 138,187,565 18,713,046 156,900,611 2,483,913 159,384,524 88.0 0.0801%
Sanbornton 522,045,965 14,986,260 537,032,225 955,155 537,987,380 97.2 0.2703%
Sandown - 664,720,080 99,309,120 764,029,200 - 0 764,029,200 87.0 0.3838%
Sandwich 437,295,505 8,885,488 446,180,993 744,349 446,925,342 98.0 0.2245%
Sargent's Purchase 1,888,530 294,742 2,183,272 "o 2,183,272 86.5 0.0011%
Seabrook 1,742,546,450 151,524,443 1,894,070,893 0 1,894,070,893 92.0 0.9515%
Second College Grant 1,404,232 127,980 1,532,212 0 1,532,212 86.5 . 0.0008%
Sharon 54,800,818 (1,368,016) 53,432,802 5,197 53,437,999 102.6 0.0268%
Shelbume- 51,298,236 (4,657,640) 46,640,596 426,318 47,066,914 110.0 0.0236%
Somersworth 1,054,320,954 25,922,247 1,080,243,201 5,673,286 1,085,916,487 97.6 0.5455%
South Hampton 166,510,198 2,339,812 168,850,010 2,083 168,852,093 98.6 0.0848%
Springfield 203,342,088 17,926,810 221,268,898 343,107 221,612,005 91.9 0.1113%
Stark 59,710,435 237,269 59,947,704 598,400 60,546,104 .99.6 0.0304%
Stewartstown 87,888,214 3,562,482 91,450,696 44,883 91,495,579 96.1 0.0460%
Stoddard 284,836,310 ' 10,602,519 295,438,829 31,639 ■ 295,470,468 96.4 0.1484%
Strafford 481,396,612 145,323,622 626,720,234 0 626,720,234 76.8 0.3148%
Stratford 42,724,040 4,995,664 47,719,704 373,790 48,093,494 89.4 0.0242%
'Flood control, forest, recreation lands, and offers.
"Does not include utilities or railroads
www.revenue.nh.gov 2020 Annual Report Of the Department Of Revenue Administration 163
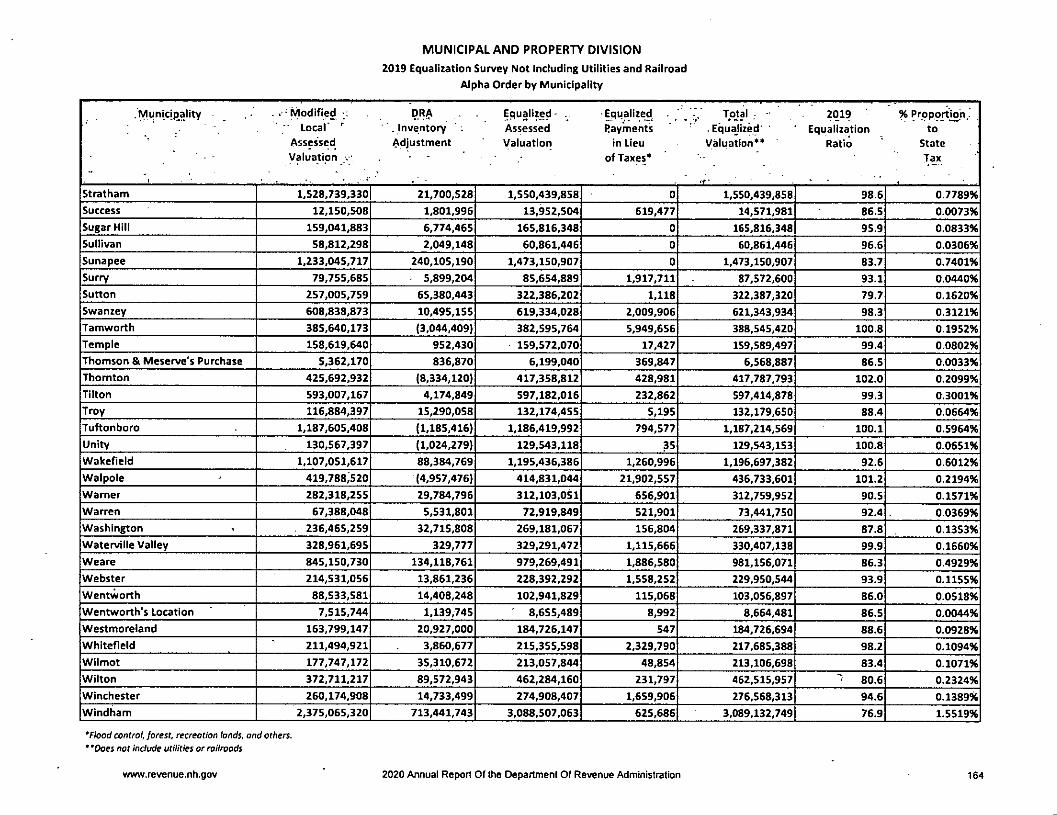
MUNICIPAL AND PROPERTY DIVISION
2019 Equalization Survey Not Including Utilities and Railroad
Alpha Order by Municipality
.l^iinicipality ..■•Modified;; DRA Equalized- Equalized Total ,- 2019 % Proportion.." Local" ■" ' .Inventory i Assessed Payments .Equajized' Equalization to
Assessed Adjustment Valuation in Lieu Valuation** Ratio StateValuation > • of Taxes* Tax
Stratham 1,528,739,330 21,700,528 1,550,439,858 0 1,550,439,858 98.6 0.7789%
Success 12,150,508 1,801,996 13,952,504 619,477 14,571,981 86.5 0.0073%
Sugar Hill 159,041,883 6,774,465 165,816,348 0 165,816,348 95.9 0.0833%
Sullivan 58,812,298 2,049,148 60,861,446 0 60,861,446 96.6 0.0306%
Sunapee 1,233,045,717 240,105,190 1,473,150,907 0 1,473,150,907 83.7 0.7401%
Surry 79,755,685 5,899,204 85,654,889 1,917,711 87,572,600 93.1 0.0440%
Sutton 257,005,759 65,380,443 322,386,202 1,118 322,387,320 79.7 0.1620%
Swanzey 608,838,873 10,495,155 619,334,028 2,009,906 621,343,934 98.3 0.3121%
Tamworth 385,640,173 (3,044,409) 382,595,764 5,949,656 388,545,420 100.8 0.1952%
Temple 158,619,640 952,430 159,572,070 17,427 159,589,497 99.4 0.0802%
Thomson & Meserve's Purchase 5,362,170 836,870 6,199,040 369,847 6,568,887 86.5 0.0033%
Thornton 425,692,932 (8,334,120) 417,358,812 428,981 417,787,793 102.0 0.2099%
Tilton 593,007,167 4,174,849 597,182,016 232,862 597,414,878 99.3 0.3001%
Troy 116,884,397 15,290,058 132,174,455 5,195 132,179,650 88.4 0.0664%
Tuftonboro 1,187.605,408 (1,185,416) 1,186,419,992 794,577 1,187,214,569 100.1 0.5964%
Unity 130,567,397 (1,024,279) 129,543,118 35 129,543,153 100.8 0.0651%
Wakefield 1,107,051,617 88,384,769 1,195,436,386 1,260,996 1,196,697,382 92.6 0.6012%
Walpole 419,788,520 (4,957,476) 414,831,044 21,902,557 436,733,601 101.2 0.2194%
Warner 282,318,255 29,784,796 312,103,051 656,901 312,759,952 90.5 0.1571%
Warren 67,388,048 5,531,801 72,919,849 521,901 73,441,750 92.4 0.0369%
Washington < 236,465,259 32,715,808 269,181,067 156,804 269,337,871 87.8 0.1353%
Waterville Valley 328,961,695 329,777 329,291,472 1,115,666 330,407,138 99.9 0.1660%
Weare 845,150,730 134,118,761 979,269,491 1,886,580 981,156,071 86.3 0.4929%
Webster 214,531,056 13,861,236 228,392,292 1,558,252 229,950,544 93.9 0.1155%
Wentworth 88,533,581 14,408,248 102,941,829 115,068 103,056,897 86.0 0.0518%
Wentworth's Location 7,515,744 1,139.745 ' 8,655,489 8,992 8,664,481 86.5 0.0044%
Westmoreland 163,799,147 20,927,000 184,726,147 547 184,726,694 88.6 0.0928%
Whitefield 211,494,921 3,860,677 215,355,598 2,329,790 217,685,388 98.2 0.1094%
Wilmot 177,747,172 35,310,672 213,057,844 48,854 213,106,698 83.4 0.1071%
Wilton 372,711,217 89,572,943 462,284,160 231,797 462,515,957 " 80.6 0.2324%
Winchester 260,174,908 14,733,499 274,908,407 1,659,906 276,568,313 94.6 0.1389%Windham 2,375,065,320 713,441,743 3,088,507,063 625,686 3,089,132,749 76.9 1.5519%
'Flood control, forest, recreation lands, and others.' 'Does not include utilities or railroads
vvww.revenue.nh.gov 2020 Annual Report Of the Department Of Revenue Administration 164
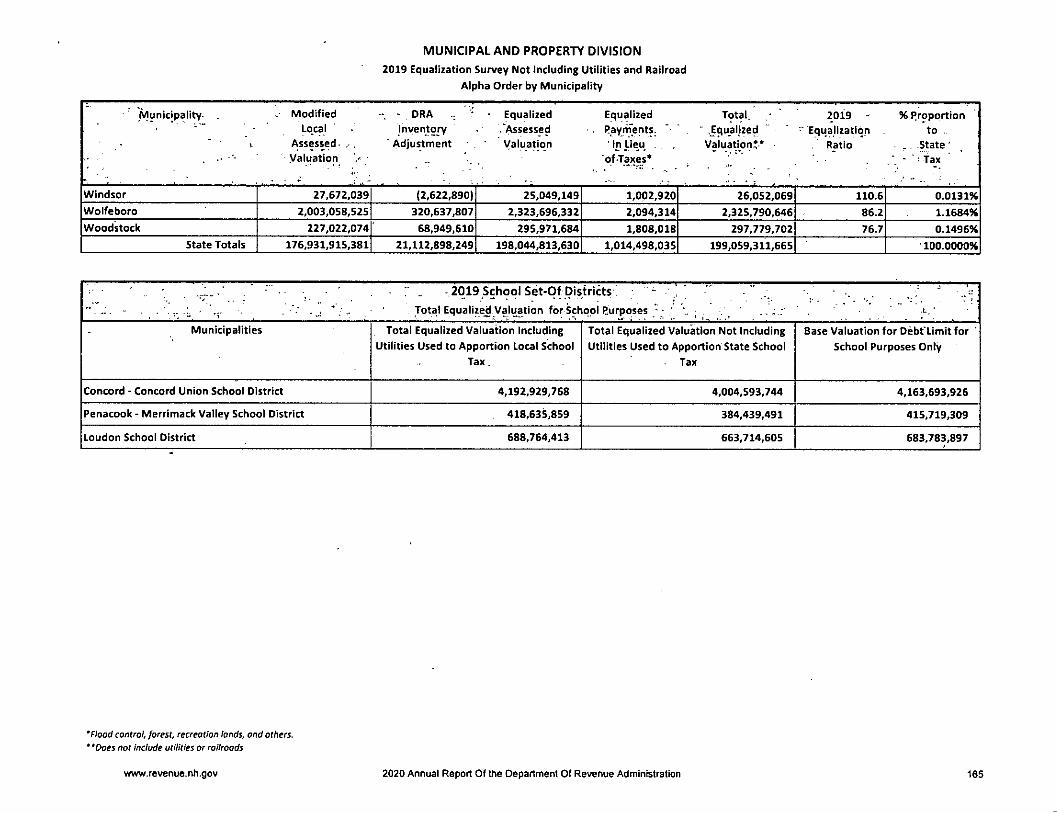
MUNICIPAL AND PROPERTY DIVISION
2019 Equalization Survey Not Including Utilities and Railroad
Alpha Order by Municipality
Municipality-
X
Modified
Lo^calAssessed- .- .
Valuation > •
- DRA
Inventory
" Adjustment
Equalized
• Assessed
Valuation
Equalized
- Payrnents.
' in Lieu .. .
'of-Iaxes*
Total.
' J^ualizedVaiuationV -
2019 -
" Equalization
Ratio
% Proportion
to
.. State'
- ' • Ta_x '
Windsor 27,672,039 (2,622,890) 25,049,149 1,002,920 26,052,069 110.6 0.0131%
Wolfeboro 2,003,058,525 320,637,807 2,323,696,332 2,094,314 2,325,790,646 86.2 1.1684%
Woodstock 227,022,074 68,949,610 295,971,684 1,808,018 297,779,702 76.7 0.1496%
State Totals 176,931,915,381 21,112,898,249 198,044,813,630 1,014,498,035 199,059,311,665 -100.0000%
-.2019 School Set-Of Districts' - !
Total Equalized Valuation for School Purposes ; ; ; * ̂ . .L, '
Municipalities Total Equalized Valuation Including
Utilities Used to Apportion Local School
Tax.
Total Equalized Valuation Not Including
Utilities Used to Apportion State School
- Tax
Base Valuation for Debt'Limit for
School Purposes Only
Concord - Concord Union School District 4,192,929,768 4,004,593,744 4,163,693,926
Penacook • Merrimack Valley School District 418,635,859 384,439,491 415,719,309
Loudon School District 688,764,413 663,714,605 683,783,897
'Flood control, forest, recreation lands, and others.
* 'Does not include utilities or railroads
www.revenue.nh.gov 2020 Annual Report Of the Department Of Revenue Administration 165
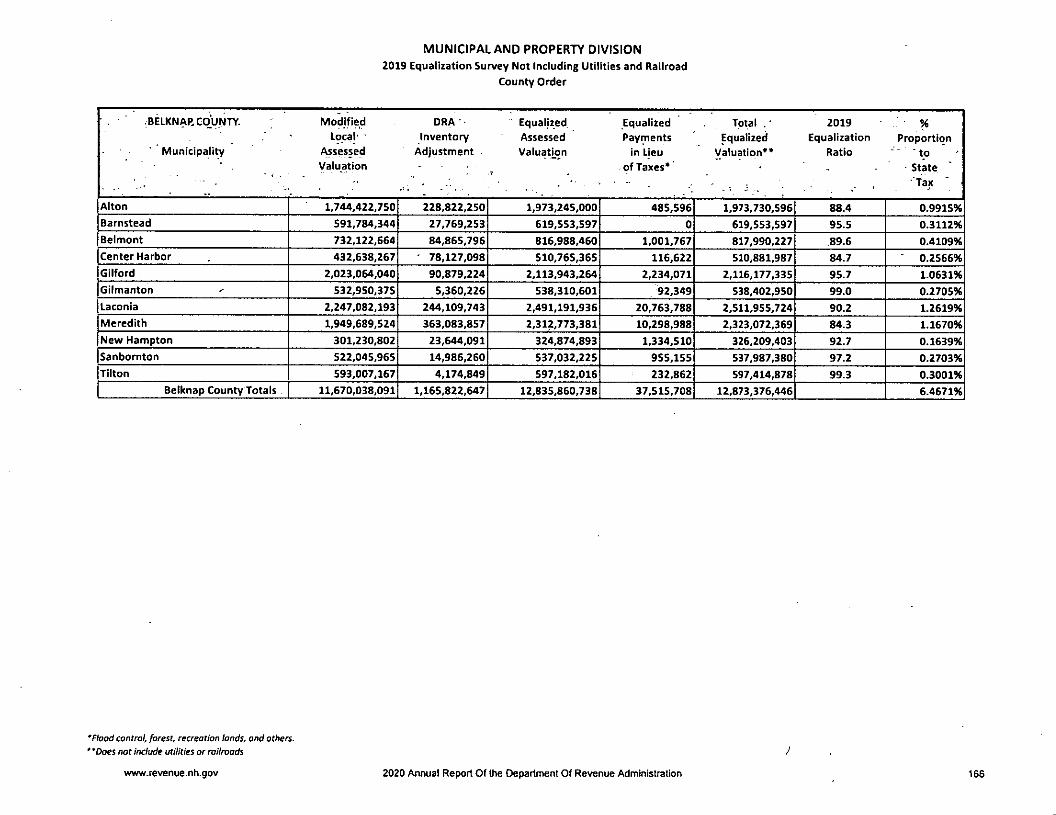
MUNICIPAL AND PROPERTY DIVISION
2019 Equalization Survey Not including Utilities and Railroad
County Order
BELKNAR COUNTY. Modified DRA - " Equaljzed Equalized Total 2019 %Local' ■ Inventory Assessed Payments Equalized Equalization Proportion
Municipality Assessed Adjustment Valuation in Lieu Valuation** Ratio " "toValuation ^ of Taxes*' ' - -State
' ' • " . . . . ■'Tax "Alton 1,744,422,750 228,822,250 1,973,245,000 485,596 1,973,730,596 88.4 0.9915%
Barnstead 591,784,344 27,769,253 619,553,597 0 619,553,597 95.5 0.3112%
Belmont 732,122,664 84,865,796 816,988,460 1,001,767 817,990,227 .89.6 0.4109%Center Harbor 432,638,267 ' 78,127,098 510,765,365 116,622 510,881,987 84.7 0.2566%
Gilford 2,023,064,040 90,879,224 2,113,943,264 2,234,071 2,116,177,335 95.7 1.0631%
Gilmanton -- 532,950,375 5,360,226 538,310,601 92,349 538,402,950 99.0 0.2705%
Laconia 2,247,082,193 244,109.743 2,491,191,936 20,763,788 2,511,955,724 90.2 1.2619%
Meredith 1,949,689,524 363,083,857 2,312,773,381 10,298,988 2.323,072.369 84.3 1.1670%
New Hampton 301,230,802 23,644,091 324,874,893 1,334,510 326,209,403 92.7 0.1639%Sanbomton 522,045,965 14,986,260 537,032,225 955,155 537,987,380 97.2 0.2703%
Tilton 593,007,167 4,174,849 597,182,016 232,862 597,414,878 99.3 0.3001%
Belknap County Totals 11,670,038,091 1,165,822,647 12,835,860,738 37,515.708 12,873,376,446 6.4671%
'Flood control, forest, recreation lands, and others.' 'Does not include utilities or railrwds
www.revenue.nh.gov 2020 Annual Report Of the Department Of Revenue Administration 166

MUNICIPAL AND PROPERTY DIVISION
2019 Equalization Survey Not Including Utilities and Railroad
County Order
CARROLL COUNTY Mqdjfjed. DRA |quallzed ' •_Equ__all2ed ' Total " 2019 %•Loca]^ _ Inventory Assessed F(ayments _ Equalized Equalization Proportion
-Municipality - Assessed Adjustment Valuation in Lieu ."Valuation** Ratio . ' ;to- Valuation - , oftaxes*' - ' .State
Albany 112,639,486 6,167,679 118,807,165 1,312,733 120,119,898 94.8 0.0603%
Bartlett 1,056,193.740 181,992,274 1,238,186,014 929,008 1,239,115,022 85.3 0.6225%
Brookfield 123,305,743 -4,255,980 119,049,763 ,0 119,049,763 103.6 0.0598%
Chatham 58,146,249 702,381 58,848,630 833,885 59,682,515 98.8 0.0300%
Conway 1,687,200,253 103,766,178 1,790,966,431 1,223,476 1,792,189,907 94.2 0.9003%
Eaton 112,223,655 1,066,043 113,289,698 0 113,289,698 99.1 0.0569%
Effingham 162,698,044 29,995,634 192,693,678 93,995 192,787,673 84.4 0.0968%
Freedom 491,381,554 107,821,402 599,202,956 • 0 599,202,956 82.0 0.3010%
Hale's Location 75,605.900 5,169,634 80,775,534 37,511 80,813,045 93.6 0.0406%
Hart's Location 16,406,271 2,110,730 18,517,001 335,640 18,852,641 88.6 0.0095%
Jackson 457,610,929 14,625,835 472,236,764 921,176 473,157,940 96.9 0.2377%
Madison / 474,227,946 111,947,735 586,175,681 1,023,061 587,198,742 80.9 0.2950%
Moultonbo rough 3,343,510,723 224,755,172 3,568,265,895 4,823,452 3,573,089,347 93.7 1.7950%
Ossipee 762,566,808 37,533,741 800,100,549 59,664 800,160,213 95.3 0.4020%
Sandwich 437,295,505 8,885,488 446,180,993 744,349 _ 446,925,342 98.0 0.2245%
Tamworth 385,640,173 -3,044,409 382,595,764 5,949,656 388,545,420 100.8 0.1952%
Tuftonboro 1,187,605,408 -1,185,416 1,186,419,992 794,577 1,187,214,569 100.1 0.5964%
Wakefield 1,107,051,617 88,384,769 1,195,436,386 1,260,996 1,196,697,382 92.6 0.6012%
Wolfeboro 2,003,058,525 320,637,807 2,323,696,332 2,094,314 2,325,790,646 86.2 1.1684%
Carroll County Totals 14,054,368,529 1,237,076,697 15,291,445,226 22,437,493 15,313,882,719 7.6931%
'Flood control, forest, recreation lands, and others.
"Does not include utilities or railroads
www.revenue.nh.gov 2020 Annual Report Of the Department Of Revenue Administration 167
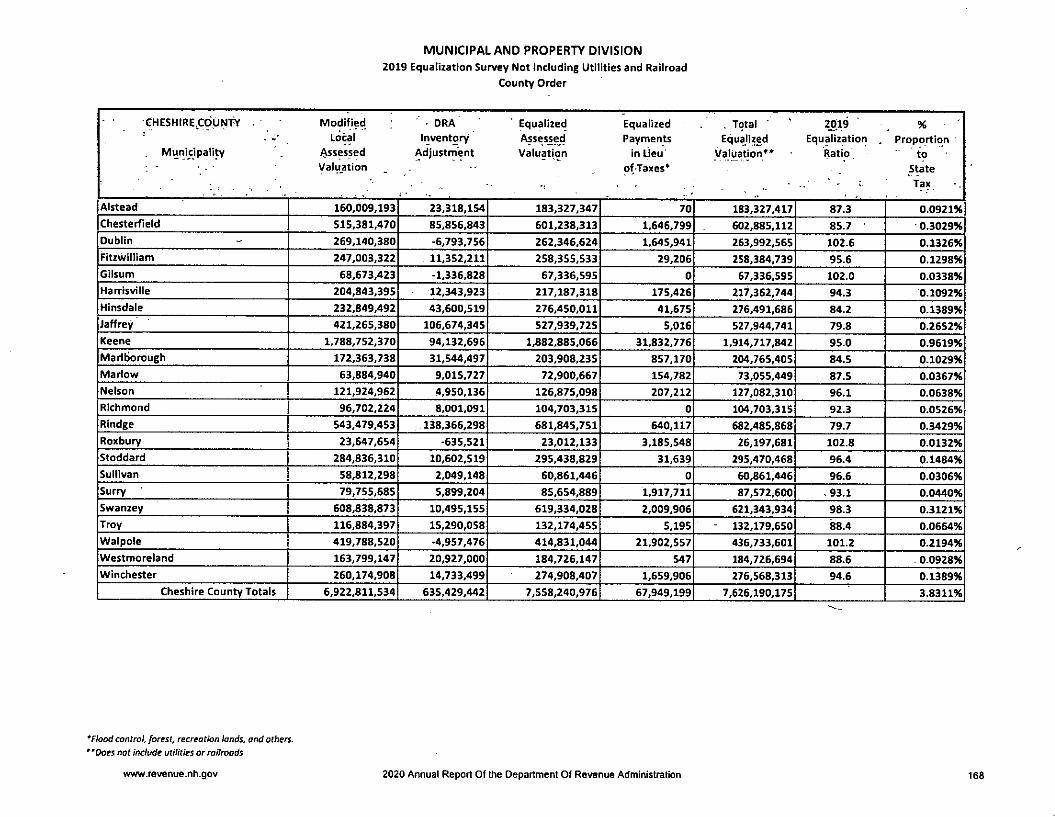
MUNICIPAL AND PROPERTY DIVISION
2019 Equalization Survey Not Including Utilities and Railroad
County Order
GHESHIRE;_CbUNTY IVIodified • DRA ' Equalized Equalized . Total ' ' 2_pl9 %• »' LquI Inventory Assessed Payments Equalized Equalization . Proportion
Municipali^ Assessed Adjustment Valuation in Lieu Valuation** Ratio . toValuation _ . ofTaxes* State
^Tax.
Alstead 160,009,193 23,318,154 183,327,347 70 183,327,417 87.3 0.0921%
Chesterfield 515,381,470 85,856,843 601,238,313 1,646,799 602,885,112 85.7 0.3029%
Dublin 269,140,380 -6,793,756 262,346,624 1,645,941 263,992,565 102.6 0.1326%
Fitzwilliam 247,003,322 11,352,211 258,355,533 29,206 258,384,739 95.6 0.1298%
Gilsum 68,673,423 -1,336,828 67,336,595 0 67,336,595 102.0 0.0338%
Harrisville 204,843,395 12,343,923 217,187,318 175,426 217,362,744 94.3 0.1092%
Hinsdale 232,849,492 43,600,519 276,450,011 41,675 276,491,686 84.2 0.1389%
Jaffrey 421,265,380 106,674,345 527,939,725 5,016 527,944,741 79.8 0.2652%
Keene 1,788,752,370 94,132,696 1,882,885,066 31,832,776 1,914,717,842 95.0 0.9619%
Marl borough 172,363,738 31,544,497 203,908,235 857,170 204,765,405 84.5 0.1029%
Marlow 63,884,940 9,015,727 72,900,667 154,782 73,055,449 87.5 0.0367%
Nelson 121,924,962 4,950,136 126,875,098 207,212 127,082,310 96.1 0.0638%
Richmond 96,702,224 8,001,091 104,703,315 0 104,703,315 92.3 0.0526%
Rindge 543,479,453 138,366,298 681,845,751 640,117 682,485,868 79.7 0.3429%
Roxbury 23,647,654 -635,521 23,012,133 3,185,548 26,197,681 102.8 0.0132%
Stoddard 284,836,310 10,602,519 295,438,829 31,639 295,470,468 96.4 0.1484%
Sullivan 58,812,298 2,049,148 60,861,446 0 60,861,446 96.6 0.0306%
Surry 79,755.685 5,899,204 85,654,889 1,917,711 87,572,600 . 93.1 0.0440%
Swanzey 608,838,873 10,495,155 619,334,028 2,009,906 621,343.934 98.3 0.3121%
Troy 116,884,397 15,290,058 132,174,455 5,195 132,179,650 88.4 0.0664%
Walpole 419,788,520 -4,957,476 414,831,044 21,902,557 436,733,601 101.2 0.2194%
Westmoreland 163,799,147 20,927,000 184,726,147 547 184,726,694 88.6 . 0.0928%
Winchester 260,174,908 14,733,499 274,908,407 1,659,906 276,568,313 94.6 0.1389%
Cheshire County Totals 6,922,811,534 635,429,442 7,558,240,976 67,949,199 7,626,190,175 3.8311%
'Flood control, forest, recreation lands, and others.
"Does not include utilities or railroads
www.revenue.nh.gov 2020 Annual Report Of the Department Of Revenue Administration 168
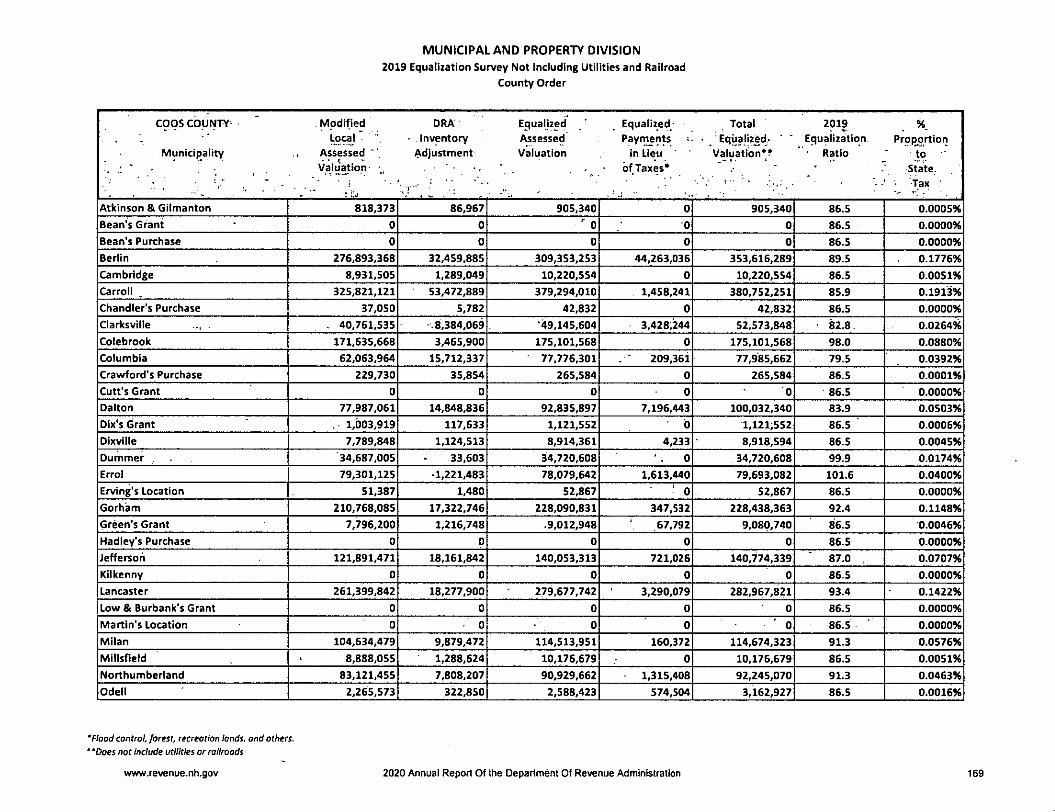
MUNICIPAL AND PROPERTY DIVISION
2019 Equalization Survey Not Including Utilities and Railroad
County Order
cogs COUNTY^ ' Modified' DRA Egualjzed ' , Equalized; Total 2019 %Local ■ " - Inventory Assessed Payments ■ Equalized.- Equalization Proportion
Municli)ality Assessed " Adjustment Valuation in Lieu Valuation"? • Ratio * to
. • Valuation - of Taxes* ' ' • State.
Atkinson & Gilmanton 818,373 86,967 905,340 0 905,340 86.5 0.0005%
Bean's Grant 0 0 ' 0 0 0 86.5 0.0000%
Bean's Purchase 0 0 0 0 0 86.5 0.0000%
Berlin 276,893,368 32,459,885 309,353,253 44,263,036 353,616,289 89.5 0.1776%
Cambridge 8,931,S05 1,289,049 10,220,554 0 10,220,554 86.5 0.0051%
Carroll 32S,821,121 53,472,889 379,294,010 1,458,241 380,752,251 85.9 0.1913%
Chandler's Purchase 37,050 5,782 42,832 0 42,832 86.5 0.0000%
Clarksville ... . - 40,761,535 - 8,384,069 ■49,145,604 3,428,244 52,573,848 82.8. 0.0264%
Colebrook 171,635,668 3,465,900 175,101,568 0 175,101,568 98.0 0.0880%
Columbia 62,063,964 15,712,337 77,776,301 2b9,36i 77,985,662 79.5 0.0392%
Crawford's Purchase 229,730 35,854 265,584 0 265,584 86.5 0.0001%
Cutt's Grant 0 0 0 0 0 86.5 0.0000%
Dalton 77,987,061 14,848,836 92,835,897 7,196,443 100,032,340 83.9 0.0503%
Dix's Grant . 1,003,919 117,633 1,121,552 0 1,121;552 86.5 0.0006%
Dixville 7,789,848 1,124,513 8,914,361 4,233 8,918,594 86.5 0.0045%
Dummer . 34,687,005 33,603 34,720,608 0 34,720,608 99.9 0.0174%
Errol 79,301,125 -1,221,483 78,079,642 1,613,440 79,693,082 101.6 0.0400%
Erving's Location 51,387 1,480 52,867 0 52,867 86.5 0.0000%
Gorh'am 210,768,085 17,322,746 228,090,831 347,532 228,438,363 92.4 0.1148%
Green's Grant 7,796,200 1,216,748 .9,012,948 67,792 9,080,740 86.5 0.0046%
Hadley's Purchase 0 0 0 0 0 86.5 0.0000%
Jeffersort 121,891,471 18,161,842 140,053,313 721,026 140,774,339 87.0 , 0.0707%
Kilkenny 0 0 0 0 0 86.5 0.0000%
Lancaster 261,399,842 18.277,900 279,677,742 3,290,079 282,967,821 93.4 0.1422%
Low & Burbank's Grant 0 0 0 0 0 86.5 0.0000%
Martin's Location 0 0 0 0 ' 0 86.5 " 0.0000%
Milan 104,634,479 9,879,472 114,513,951 160,372 114,674,323 91.3 0.0576%
Millsfield 8,888,055 1,288,624 10,176,679 0 10,176,679 86.5 0.0051%
Northumberland 83,121,455 7,808,207 90,929,662 1,315,408 92,245,070 91.3 0.0463%
Odell 2,265,573 322,850 2,588,423 574,504 3,162,927 86.5 0.0016%
'Flood control, forest, recreation lands, and others."Does not Include utilities or railroads
www.revenue.nh.gov 2020 Annual Report Of the Department Of Revenue Administration 169
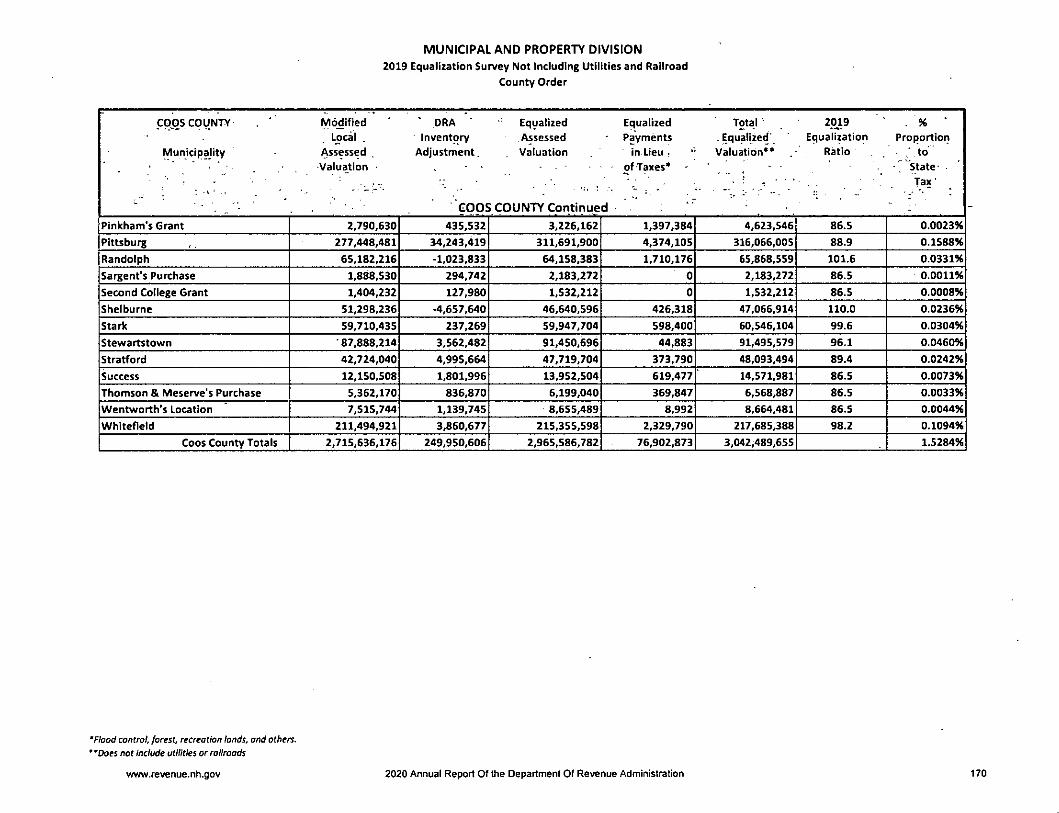
MUNICIPAL AND PROPERTY DIVISION
2019 Equalization Survey Not Including Utilities and Railroad
County Order
COOS COUNTY ' Modified ' DRA Equalized Equalized Total • 2019 . %Local . Inventory Assessed Payments .Equalized' Equalization Proportiort
Municipality Assessed, Adjustment. , Valuation in Lieu • " Valuation** Ratio to. ■ _ Valuation • ofTaxes* * ' , " " • " State- •
\ Tax'
' . , COOS COUNTY Continued " :Pinkham's Grant 2,790,630 435,532 3,226,162 1,397,384 4,623,546 86.5 0.0023%
Pittsburg 277,448,481 34,243,419 311,691,900 4,374,105 316,066,005 88.9 0.1588%
Randolph 65,182,216 •1,023,833 64,158,383 1,710,176 65,868,559 101.6 0.0331%
Sargent's Purchase 1,888,530 294,742 2,183,272 0 2,183,272 86.5 0.0011%
Second College Grant 1,404,232 127,980 1,532,212 0 1,532,212 86.5 0.0008%
Shelburne 51,298,236 •4,657,640 46,640,596 426,318 47,066,914 110.0 0.0236%
Stark 59,710,435 237,269 59,947,704 598,400 60,546,104 99.6 0.0304%
Stewartstown '87,888,214 3,562,482 91,450,696 44,883 91,495,579 96.1 0.0460%
Stratford 42,724,040 4,995,664 47,719,704 373,790 48,093,494 89.4 0.0242%
Success 12,150,508 1,801,996 13,952,504 619,477 14,571,981 86.5 0.0073%
Thomson & Meserve's Purchase 5,362,170 836,870 6,199,040 369,847 6,568,887 86.5 0.0033%
Wentworth's Location 7,515,744 1,139,745 8,655,489 8,992 8,664,481 86.5 0.0044%
Whitefleld 211,494,921 3,860,677 215,355,598 2,329,790 217,685,388 98.2 0.1094%
Coos County Totals 2,715.636,176 249.950,606 2,965,586,782 76,902,873 3,042,489,655 1.5284%
'Flood control, forest, recreation lands, and others.
' 'Does not Include utilities or railroads
www.revenue.nh.gov 2020 Annual Report Of the Department Of Revenue Administration t70
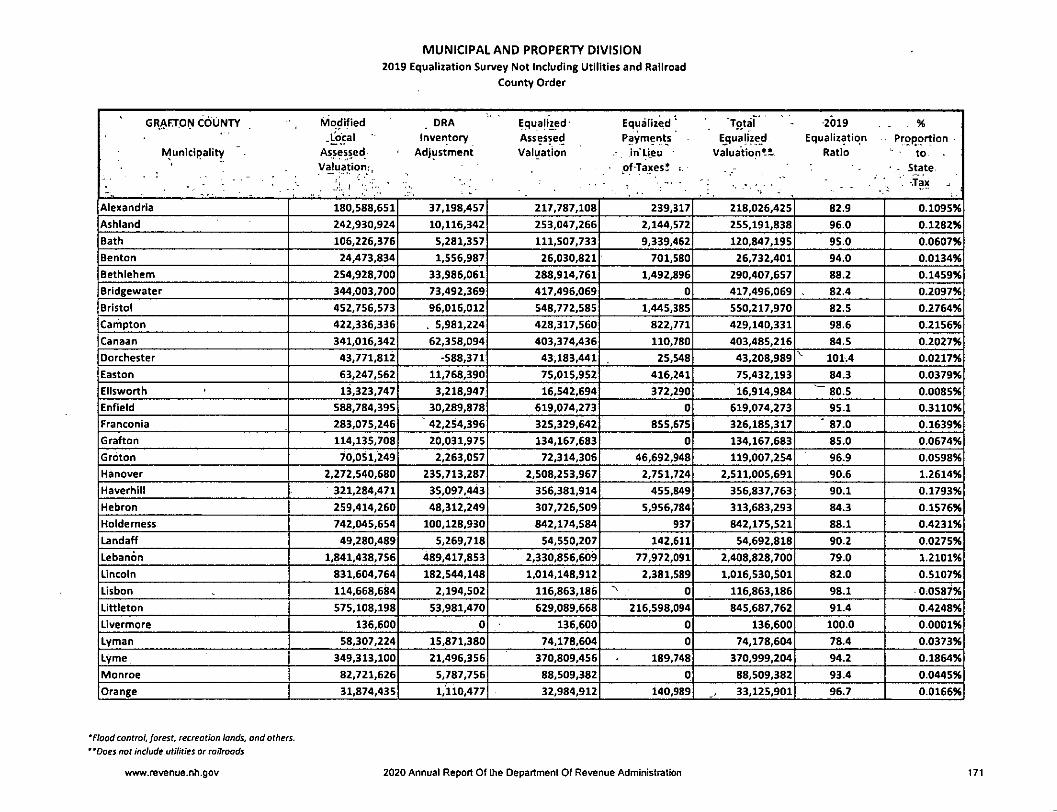
MUNICIPAL AND PROPERTY DIVISION
2019 Equalization Survey Not Including Utilities and Railroad
County Order
GIWFTONCOUNTY , Modified , DRA Equalized' Equalized ' "Totaf - -2019 . . .%.^cal Inventory Assessed Payments Equalized Equalization Proportion
Muriicipaiity Assessed Adjustment Valuation In'Lieu ' Valuation*-! Ratio ' toValuation;, pfTaxesJ t. . • - State.
V . j ■ "• "• "Tax. _
Alexandria 180,588,651 37,198,457 217,787,108 239,317 218,026,425 82.9 0.1095%
Ashland 242,930,924 10,116,342 253,047,266 2,144,572 255,191,838 96.0 0.1282%
Bath 106,226,376 5,281,357 111,507,733 9,339,462 120,847,195 95.0 0.0607%
Benton 24,473,834 1,556,987 26,030,821 701,580 26,732,401 94.0 0.0134%
Bethlehem 254,928,700 33,986,061 288,914,761 1,492,896 290,407,657 88.2 0.1459%
Bridgewater 344,003,700 73,492,369 417,496,069 0 417,496,069 82.4 0.2097%
Bristol 452,756,573 96,016,012 548,772,585 1,445,385 550,217,970 82.5 0.2764%
Canhpton 422,336,336 . 5,981,224 428,317,560 822,771 429,140,331 98.6 0.2156%
Canaan 341,016,342 62,358,094 403,374,436 110,780 403,485,216 84.5 0.2027%
Dorchester 43,771,812 -588,371 43,183,441 25,548 43,208,989 ^ 101.4 0.0217%
Easton 63,247,562 11,768,390 75,015,952 416,241 75,432,193 84.3 0.0379%
Ellsworth 13,323,747 3,218,947 16,542,694 372,290 16,914,984 80.5 0.0085%
Enfield 588,784,395 30,289,878 619,074,273 0 619,074,273 95.1 0.3110%
Franconia 283,075,246 42,254,396 325,329,642 855,675 326,185,317 * 87.0 0.1639%
Grafton 114,135,708 20,031,975 134,167,683 0 134,167,683 85.0 0.0674%
Groton 70,051,249 2,263,057 72,314,306 46,692,948 119,007,254 96.9 0.0598%
Hanover 2,272,540,680 235,713,287 2,508,253,967 2,751,724 2,511,005,691 90.6 1.2614%
Haverhill 321,284,471 35,097,443 356,381,914 455,849 356,837,763 90.1 0.1793%
Hebron 259,414,260 48,312,249 307,726,509 5,956,784 313,683,293 84.3 0.1576%
Holderness 742,045,654 100,128,930 842,174.584 937 842,175,521 88.1 0.4231%
Landaff 49,280,489 5,269,718 54,550,207 142,611 54,692,818 90.2 0.0275%
Lebanon 1,841,438,756 489,417,853 2,330,856,609 77,972,091 2,408,828,700 79.0 1.2101%
Lincoln 831,604,764 182,544,148 1,014,148,912 2,381,589 1,016,530,501 82.0 0.5107%
Lisbon 114,668,684 2,194,502 116,863,186 ^ 0 116,863,186 98.1 0.0587%
Littleton 575,108,198 53,981,470 629,089,668 216,598,094 845,687,762 91.4 0.4248%
Livermore 136,600 0 136,600 0 136,600 100.0 0.0001%
Lyman 58,307,224 15,871,380 74,178,604 0 74,178,604 78.4 0.0373%
Lyme 349,313,100 21,496,356 370,809,456 189,748 370,999,204 94.2 0.1864%
Monroe 82,721,626 5,787,756 88,509,382 0 88,509,382 93.4 0.0445%
Orange 31,874,435 1,110,477 32,984,912 140,989 33,125,901 96.7 0.0166%
'Flood control, forest, recreation lands, and others.
"Does not include utilities or railroads
www.revenue.nh.gov 2020 Annual Report Of the Department Of Revenue Administration 171
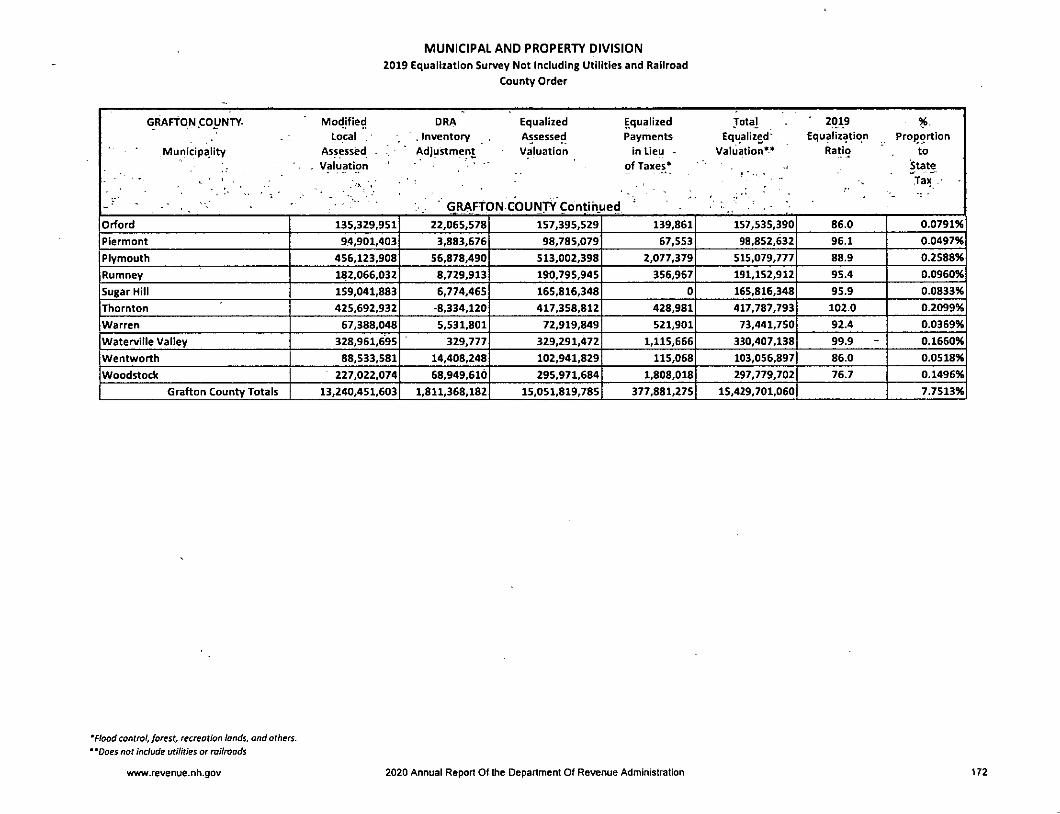
MUNICIPAL AND PROPERTY DIVISION
2019 Equalization Survey Not Including Utilities and Railroad
County Order
GRAFtON COUNTY- Modified DRA Equalized Equalized Total 2019 %.Local .Inventory Assessed Payments Equalized' Equalization ProiJqrtlon
Municipality Assessed . " Adjustment Valuation in Lieu - Valuation** Rsfl? to' . Valuation of Taxes* State
■ ̂ ■■ ■ ■ ■ ■ ^7 '.'- "7 ■■ 7." ' •- • ■ • ^ - GRAFTON COUNTY Continued 'Orford 135,329,951 22,065,578 157,395,529 139,861 157,535,390 86.0 0.0791%
Piermont 94,901,403 3,883,676 98,785,079 67,553 98,852,632 96.1 0.0497%
Plymouth 456,123,908 56,878,490 513,002,398 2,077,379 515,079,777 88.9 0.2588%
Rumney 182,066,032 8,729,913 190,795,945 356,967 191,152,912 95.4 0.0960%
Sugar Hill 159,041,883 6,774,465 165,816,348 0 165,816,348 95.9 0.0833%
Thornton 425,692,932 -8,334,120 417,358,812 428,981 417,787,793 102.0 0.2099%
Warren 67,388,048 5,531,801 72,919,849 521,901 73,441,750 92.4 0.0369%
Waterville Valley 328,961,695 329,777 329,291,472 1,115,666 330,407,138 99.9 0.1660%
Wentworth 88,533,581 14,408,248 102,941,829 115,068 103,056,897 86.0 0.0518%
Woodstock 227,022,074 68,949,610 295,971,684 1,808,018 297,779,702 76.7 0.1496%
Grafton County Totals 13,240,451,603 1,811,368,182 15,051,819,785 377,881,275 15,429,701,060 7.7513%
'Flood control, forest, recreation lands, and others.
"Does not Include utilities or railroads
www.revenue.nh.gov 2020 Annual Report Of the Department Of Revenue Administration 172

MUNICIPAL AND PROPERTY DIVISION
2019 Equalization Survey Not Including Utilities and Railroad
County Order
HILLSBOROUGH COUNTY Modified -DRA ' Equalized Equjilized ' Total ' 2019 %Loc^ • Inventory ' Assessed Payments . Equalized • ' ■ Equaiizatipn Proportion
Municipality • Assessed Adjustment Valuation , in Lieu • Valuation** - .Ratio -to
Val.ustion - ' - ofTaxes* State
; ■ . - , ■ ■■ •' ■ --'yr ■■ ■ ■■ ■ ■' . .-TaK-Amherst 1,698.390,720 313,877,890 2,012,268,610 220,275 2,012,488,885 84.4 1.0110%
Antrim 240,159,450 28,414,545 268,573,995 5,360,916 273,934,911 89.4 0.1376%
Bedford 4,041,877,090 226,189,826 4,268,066,916 3,687 4,268,070,603 94.7 2.1441%
Bennington 125,239,477 2,678,081 127,917,558 17;654 127,935,212 97.9 0.0643%
Brookline 657,086,553 33,824,840 690,911,393 0 690,911,393 95.1 0.3471%
Deering 173,286,710 38,271,340 211,558,050 9,774 211,567,824 81.9 0.1063%
Francestown 213,372,475 4,110,708 217,483,183 0 217,483,183 98.1 0.1093%
Gbffstown 1,649,941,700 193,497,376 1,843,439,076 ' 0 1,843,439,076 89.5 0.9261%
Greenfield 165,577,707 329,824 165,907,531 9,735,606 175,643,137 99.8 0.0882%
Greenville 112,423,981 1,247,916 113,671,897 . 1,521,930 115,193,827 98.9 0.0579%
Hancock 244,815,141 29,869,124 274,684,265 2,069,822 276,754,087 89.1 0.1390%
Hillsborough 488,792,157 72.927,080 561,719,237 191,102 561,910,339 87.0 0.2823%
Hollis 1,354,804,264 181,202,170 1,536,006,434 1,076 1,536,007,510 88.2 0.7716%
Hudson 3,024,103,363 424,116,684 3,448,220,047 714,793 3,448,934,840 87.7 1.7326%
Litchfield 874,339,917 186,732,436 1,061,072,353 1,497,885 1,062,570,238 82.4 0.5338%
Lyndeborough 167,260,780 49,080,126 216,340,906 508 216,341,414 77.2 0.1087%
Manchester 8,998,505,613 2,391,996,337 11,390,501,950 40,832,778 11,431,334,728 79.0 5.7427%
Mason 153,805,888 27,560,756 .181,366,644 12,953 181,379,597 84.8 . 0.0911%
Merrimack 3,344,242,038 590,148,277 3,934,390,315 357,622 3,934,747,937 85.0 1.9767%
Milford 1,584,997,032 176,044,412 1,761,041,444 1,681,899 1,762,723,343 90.0 0.8855%
Mont Vemon 309,447,484 6,304,524 315,752,008 0 315,752,008 98.0 0.1586%
Nashua 10,119,534,167 1,379,929,960 11,499,464,127 0 11,499,464,127 88.0 5.7769%
New Boston 662,287,082 77,648,492 739,935,574 6,599 739,942,173 89.5 0.3717%
New Ipswich 465,488,430 11,412,241 476,900,671 3,422 476,904,093 97.6 0.2396%
Pelham 1,923,250,070 61,515,970 1,984,766,040 1,337,750 1,986,103,790 96.9 0.9977%
Peterborough 722,245,196 59,341,187 781,586,383 3,738,388 785,324,771 92.4 0.3945%
Sharon 54,800,818 -1,368,016 53,432,802 5,197 53,437,999 102.6 0.0268%
Temple 158,619,640 952,430 . 159,572,070 17,427 159,589,497 99.4 0.0802%
Weare 845,150,730 134,118,761 979,269,491 1,886,580 981,156,071 86.3 0.4929%
Wilton 372,711,217 89,572,943 462,284,160 231,797 462,515,957 80.6 0.2324%
Windsor 27,672,039 •2,622,890 25,049,149 1,002,920 26,052,069 110.6 0.0131%
Hillsborough County Totals 44,974,228,929 6,788,925,350 51,763,154,279 • 72,460,360 51,835,614,639 26.0403%
'Flood control, forest, recreation lands, and others."Does not include utilities or railroads
www.revenue.nh.gov 2020 Annual Report Of the Department Of Revenue Administration 173
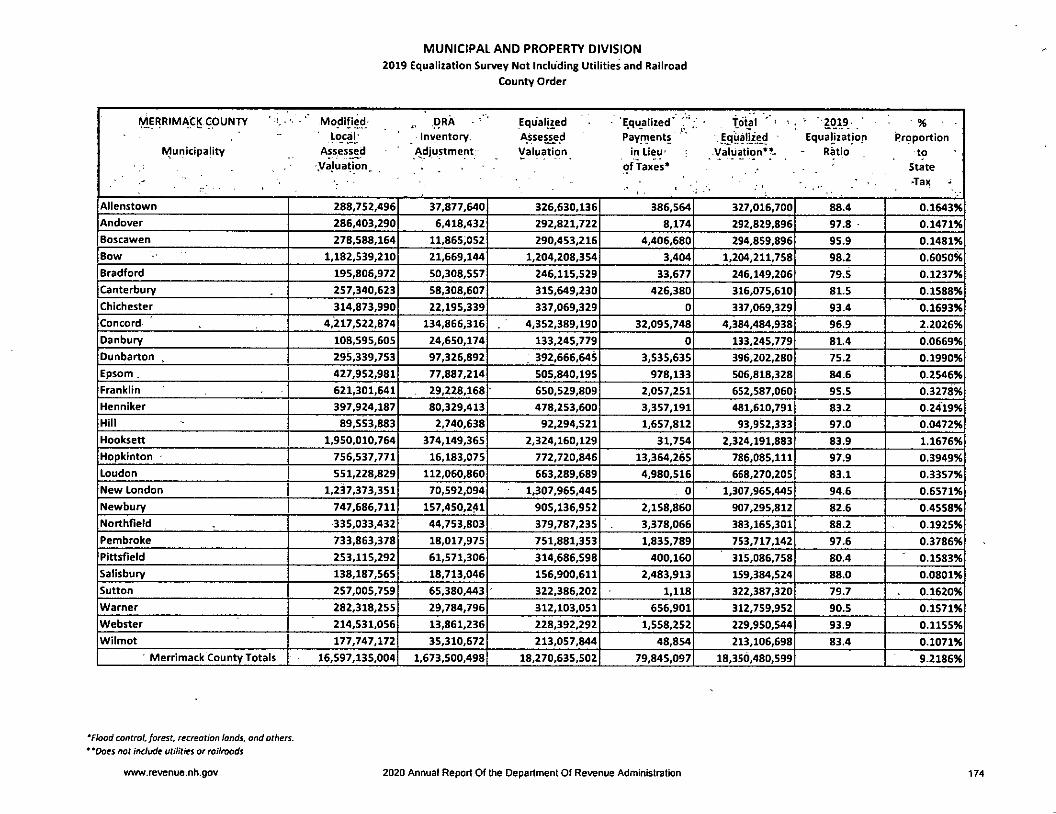
MUNICIPAL AND PROPERTY DIVISION
2019 Equalization Survey Not Including Utilities and Railroad
County Order
MERRIMACK COUNTY Modified- DRA Equalized • • Equalized* '''.; - total **' ' 2019- ' % ■ -Lcy:al' Inventory. Assessed Payrnents ' Equalization Proportion
Municipality Assessed Adjustment: Valuation in Lieu- Valuation*^- - Ratio to-yajuation. of Taxes* State
- . • . ' • • ■ ' ' •' - -Tax -Allenstown 288,752,496 37,877,640 326,630,136 386,564 327,016,700 88.4 0.1643%
Andover 286.403,290 6,418,432 292,821,722 8,174 292,829,896 97.8 0.1471%
Boscawen 278,588,164 11,865,052 290,453,216 4,406,680 294,859,896 95.9 0.1481%
Bow 1,182,539,210 21,669,144 1,204,208,354 3,404 1,204,211,758 98.2 0.6050%
Bradford 195,806,972 50,308,557 246,115,529 33,677 246,149,206 79.5 0.1237%
Canterbury 257,340,623 58,308,607 315,649,230 426,380 316,075,610 81.5 0.1588%
Chichester 314,873,990 22,195,339 337,069,329 0 337,069,329 93.4 0.1693%
Concord 4,217,522,874 134,866,316 4,352,389,190 32,095,748 4,384,484,938 96.9 2.2026%
Danbury 108,595,605 24,650,174 133,245,779 0 133,245,779 81.4 0.0669%
Dunbarton ^ 295,339,753 97,326,892 . 392,666,645 3,535,635 396,202,280 75.2 0.1990%
Epsom . 427,952,981 77,887,214 505,840,195 978,133 506,818,328 84.6 0.2546%
Franklin 621,301,641 29,228,168 650,529,809 2,057,251^ 652,587,060 95.5 0.3278%
Henniker 397,924,187 80,329,413 478,253,600 3,357,191 481,610,791 83.2 0.2419%
Hill 89,553,883 2,740,638 92,294,521 1,657,812 93,952,333 97.0 0.0472%
Hooksett 1,950,010,764 374,149,365 2,324,160,129 31,754 2,324,191,883 83.9 1.1676%
Hopkinton - 756,537,771 16,183,075 772,720,846 13,364,265 786,085,111 97.9 0.3949%
Loudon 551,228,829 112,060,860 663,289,689 4,980,516 668,270,205 83.1 0.3357%
New London 1,237,373,351 70,592,094 1,307,965,445 0 1,307,965,445 94.6 0.6571%
Newbury 747,686,711 157,450,241 905,136,952 2,158,860 907,295,812 82.6 0.4558%
Northfield 335,033,432 44,753,803 379,787,235 3,378,066 383,165,301 88.2 0.1925%
Pembroke 733,863,378 18,017,975 751,881,353 1,835,789 753,717,142 97.6 0.3786%
Pittsfield 253,115,292 61,571,306 314,686,598 400,160 315,086,758 80.4 ' 0.1583%
Salisbury 138,187,565 18,713,046 156,900,611 2,483,913 159,384,524 88.0 0.0801%
Sutton 257,005,759 65,380,443 322,386,202 1,118 322,387,320 79.7 0.1620%
Warner 282,318,255 29,784,796 312,103,051 656,901 312,759,952 90.5 0.1571%
Webster 214,531,056 13,861,236 228,392,292 1,558,252 229,950,544 93.9 0.1155%
Wilmot 177,747,172 35,310,672 213,057,844 48,854 213,106,698 83.4 0.1071%
' Merrimack County Totals 16,597,135,004 1,673,500,498 18,270,635,502 79,845,097 18,350,480,599 9.2186%
'Flood control, forest, recreation lands, and others.
' 'Does not indude utilities or railroads
www.revenue.nh.gov 2020 Annual Report Of the Department Of Revenue Administration 174
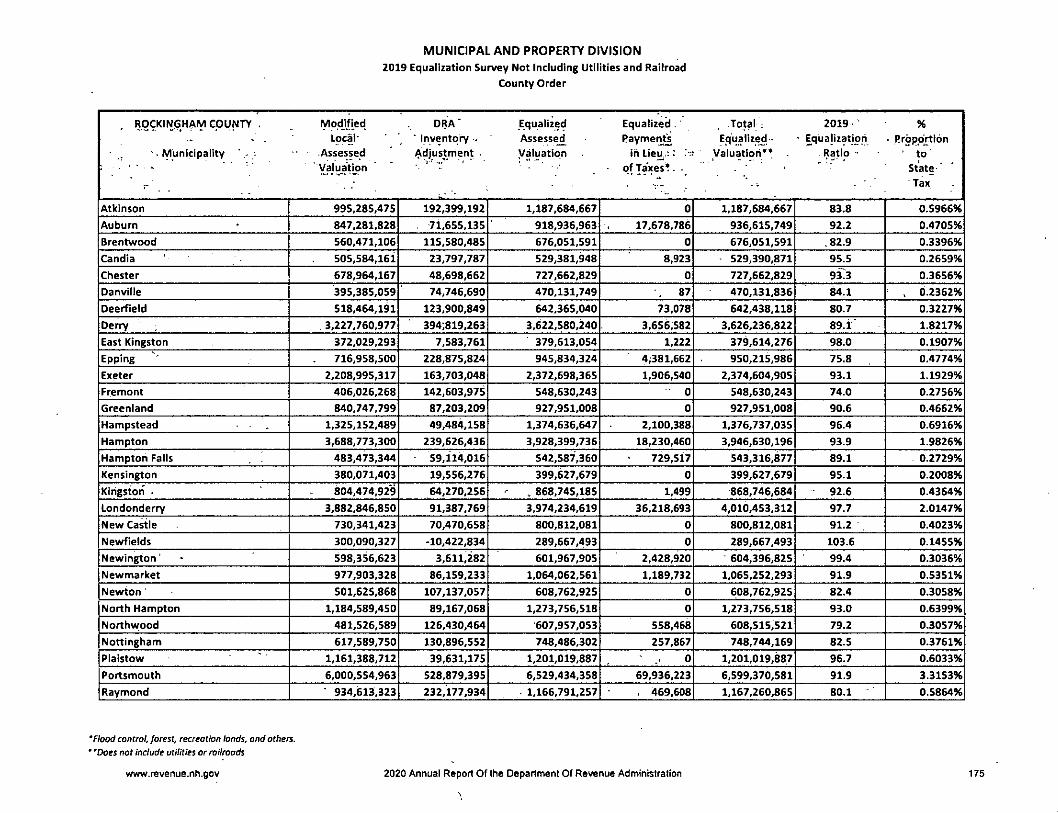
MUNICIPAL AND PROPERTY DIVISION
2019 Equalization Survey Not Including Utilities and Railroad
County Order
R0CKIN6HAM county . fyiodified DRA' Equalized Equalized. . Total ; 2019 %• . ' Local* ■ Inventory •- Assessed Paymerjt^ Equalized- ■ Equalization . Rrpportion
'Municipality ', •* Assessed Adjustrhent . Valuation ihlieUj:: Valuation** ' to'; - ■ ■ ' "Valuation ' ' ' of Taxes*. . " • State'
" . ..:i ' ' '".i . - "Tax -
Atkinson 995,285,475 192,399,192 1,187,684,667 0 1,187,684,667 83.8 0.5966%
Auburn 847,281,828 71,655,135 918,936,963 17,678,786 936,615,749 92.2 0.4705%
Brentwood 560,471,106 115,580,485 676,051,591 0 676,051,591 .82.9 0.3396%
Candia 505,584,161 23,797,787 529,381,948 8,923 529,390,871 95.5 0.2659%
Chester 678,964,167 48,698,662 727,662,829 0 727,662,829 93.3 0.3656%
Danville 395,385,059 74,746,690 470,131,749 87 470,131,836 84^1 , 0.2362%
Deerfield 518,464,191 123,900,849 642,365,040 73,078 642,438,118 80.7 0.3227%
Derry 3,227,760,977 394)819,263 3,622,580,240 3,656,582 3,626,236,822 89.1" 1.8217%
East Kingston 372,029,293 7,583,761 379,613,054 1,222 379,614,276 98.0 0.1907%
Epping 716,958,500 228,875,824 945,834,324 4,381,662 950,215,986 75.8 0.4774%
Exeter 2,208,995,317 163,703,048 2,372,698,365 1,906,540 2,374,604,905 93.1 1.1929%
Fremont 406,026,268 142,603,975 548,630,243 ■ 0 548,630,243 74.0 0.2756%
Greenland 840,747,799 87,203,209 927,951,008 0 927,951,008 90.6 0.4662%
Hampstead 1,325,152,489 49,484,158 1,374,636,647 2,100,388 1,376,737,035 96.4 0.6916%
Hampton 3,688,773,300 239,626,436 3,928,399,736 18,230,460 3,946,630,196 93.9 1.9826%
Hampton Falls 483,473,344 • 59,114,016 542,587,360 729,517 543,316,877 89.1 0.2729%
Kensington 380,071,403 19,556,276 399,627,679 0 399,627,679 95.1 0.2008%
Kingston . 804,474.929 64,270,256 , 868,745,185 1.499 868,746,684 92.6 0.4364%
Londonderry 3,882,846,850 91,387,769 3,974,234,619 36,218,693 4,010,453,312 97.7 2.0147%
New Castle 730,341,423 70,470,658 800,812,081 0 800,812,081 91.2 0.4023%
Newfields 300,090,327 -10,422,834 289,667,493 0 289,667,493 103.6 0.1455%
Newington' 598,356,623 3,611,282 601,967,905 2,428,920 604,396,825 99.4 0.3036%
Newmarket 977,903,328 86,159,233 1,064,062,561 1,189,732 1,065,252,293 91.9 0.5351%
Newton 501,625,868 107,137,057 608,762,925 0 608,762,925 82.4 0.3058%
North Hampton 1,184,589,450 89,167,068 1,273,756,518 0 1,273,756,518 93.0 0.6399%
Northwood 481,526,589 126,430,464 607,957,053 558,468 608,515,521 79.2 0.3057%
Nottingham 617,589,750 130,896,552 748,486,302 257,867 748,744,169 82.5 0.3761%
Plaistow 1,161,388,712 39,631,175 1,201,019,887 0 1,201,019,887 96.7 0.6033%
Portsmouth 6,000,554,963 528,879,395 6,529,434,358 69,936,223 6,599,370,581 91.9 3.3153%
Raymond ' 934,613,323 232,177,934 1,166,791,257 . 469,608 1.167,260,865 80.1 0.5864%
'Flood control, forest, recreation lands, and others.
' 'Does not include utilities or railroads
www.revenue.nh.gov 2020 Annual Report Of the Department Of Revenue Administration 175

MUNICIPAL AND PROPERTY DIVISION
2019 Equalization Survey Not Including Utilities and Railroad
County Order
" R0GKIN6HAM COUNTY Modified - DRA Equalized Equalized ■ Total- . '■2019 %Local Inventory Assessed Payments Equalized Equalization Proportion
Municipality ~ Assessed Adjustment Valuation in Lieu Valuation** . Ratio . toValuation of Taxes* State
' --• Tax
.- . .. . • ROCKINGHAM COUNTY ContinuedRye 2452,859,300 371,012,625 2,523,871,925 3,166,561 2,527,038,486 85.3 1.2695%
Salem 4,522,712,281 1,123,609,700 5,646,321,981 3,975,922 5,650,297,903 80.1 2.8385%
Sandown 664,720,080 99,309,120 764,029,200 0 764,029,200 87.0 0.3838%
Seabrook 1,742,546,450 151,524,443 1,894,070,893 0 1,894,070,893 92.0 0.9515%
South Hampton 166,510,198 2,339,812 168,850,010 2,083 168,852,093 98.6 0.0848%
Stratham 1,528,739,330 21,700,528 1,550,439,858 0 1,550,439,858 98.6 0.7789%
Windham 2,375,065,320 713,441,743 3,088,507,063 625,686 3,089,132,749 76.9 1.5519%
Rockingham County Totals 49,480,479,771 6,086,082,746 55,566,562,517 167,598,507 55,734,161,024 27.9988%
-
STRAFFORD CjDUNTY- ; Mpdifjed. DRA . Equalized E^qualized Total"' . 2019 %Local Inventory • Assessed „ 'Payments Equalized Equalization' Proportion
Municipality ■ • ' .Assessed - 'Adjustment Valuajtion . . . in Lieu Valuation*.*' • Ratio -to
Valuation of Taxes* • >5tate
' ' • ■ . • V .t • -
' " ■ ■.■ . Tax
Barrington 1,137,066,625 37,550,036 1,174,616,661 833,920 1,175,450,581 96.8 0.5905%
Dover 3,628,266,340 252,183,158 3,880,449,498 6,483,347 3,886,932,845 93.5 1.9527%
Durham 1,168,198,187 90,608,445 1,258,806,632 10,293,246 1,269,099,878 92.8 0.6375%
Farmington 552,897,162 2,215,405 555,112,567 1,845,023 556,957,590 99.6 0.2798%
Lee 459,617,955 134,147,548 593,765,503 256,716 594,022,219 77.4 0.2984%
Madbury 231,557,168 44,749,969 276,307,137 0 276,307,137 83.8 0.1388%
Middleton 178,539,682 15,909,194 194,448,876 0 194,448,876 91.8 0.0977%
Milton 473,597,799 16,630,055 490,227,854 483,326 490,711,180 96.6 0.2465%
New Durham 410,214,498 121,739,137 531,953,635 - 0 531,953,635 77.1 0.2672%
Rochester 2,626,254,377 26,516,722 2,652,771,099 47,588,739 2,700,359,838 99.0 1.3566%
Rollinsford 292,635,401 31,435,372 324,070,773 . 0 324,070,773 90.3 0.1628%
Somersworth 1,054,320,954 25,922,247 1,080,243,201 5,673,286 1,085,916,487 97.6 0.5455%
Strafford 481,396,612 .145,323,622 626,720,234 0 626,720,234 76.8 0.3148%
Strafford County Totals • 12,694,562,760 944,930,910 13,639,493,670 73,457,603 13,712,951,273 6.8889%
'Flood control, forest, recreation lands, and others.' 'Does not include utilities or railroads
www.revenue.nh.gov 2020 Annual Report Of the Department Of Revenue Administration 176
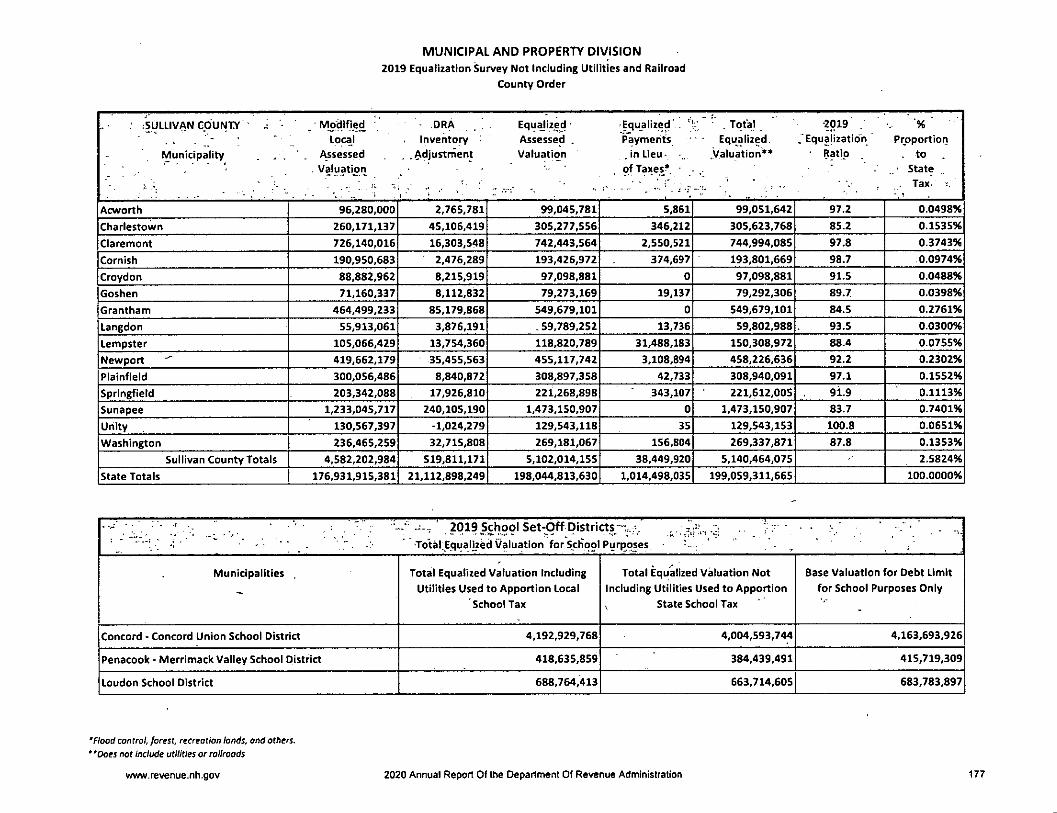
MUNICIPAL AND PROPERTY DIVISION
2019 Equalization Survey Not Including Utilities and Railroad
County Order
;SULLIVAN CbUNTY ■ ^ _ Modified • DRA . . Equalized' Equalized'-. .Total ^. - Local Inventory • Assessed , Payments • Equalized .'EqualizatioTi Proportioti
Municipality . . Assessed , .Adjustrnent Valuation JnLieu- .Valuation** Ratio . to :
• ' - ■ . ?fTaxes^ • . ' - State'." .r. .. . • , .r : . • TSx' x'
Acworth 96,280,000 2,765,781 99,045,781 5,861 99,051,642 97.2 0.0498%
Charlestown 260,171,137 45,106,419 305,277,556 346,212 305,623,768 85.2 0.1535%
Claremont 726,140,016 16,303,548 742,443,564 2,550,521 744,994,085 97.8 0.3743%
Cornish 190,950,683 2,476,289 193,426,972 374,697 193,801,669 98.7 0.0974%
Croydon 88,882,962 8,215,919 97,098,881 0 97,098,881 91.5 0.0488%
Goshen 71,160,337 8,112,832 79,273,169 19,137 79,292,306 89.7 0.0398%
Grantham 464,499,233 85,179,868 549,679,101 0 549,679,101 84.5 0.2761%
Langdon 55,913,061 3,876,191 .59,789,252 13,736 59,802,988 93.5 0.0300%
lempster 105,066,429 13,754,360 118,820,789 31,488,183 150,308,972 88.4 0.0755%
Newport 419,662,179 35,455,563 455,117,742 3,108,894 458,226,636 92.2 0.2302%
Plainfield 300,056,486 8,840,872 308,897,358 42,733 308,940,091 97.1 0.1552%
Springfield 203,342,088 17,926,810 221,268,898 343,107 221,612,005 91.9 0.1113%
Sunapee 1,233,045,717 240,105,190 1,473,150,907 0 1,473,150,907 83.7 0.7401%
Unity 130,567,397 -1,024,279 129,543,118 35 129,543,153 100.8 0.0651%
Washington 236,465,259 32,715,808 269,181,067 156,804 269,337,871 87.8 0.1353%
Sullivan County Totals 4,582,202,984 519,811,171 5,102,014,155 38,449,920 5.140,464,075 2.5824%
State Totals 176,931,915,381 21,112,898,249 198,044,813,630 1,014,498,035 199,059,311,665 100.0000%
-
- ■' V 2019 School Set-Off pistricts-r,..-. . . ' ■ ■■ ". To'talEqualized Valuation for School Pur|joses - - . ' . • . ;
Municipalities Total Equalized Valuation IncludingUtilities Used to Apportion Local
School Tax
Total Equalized Valuation NotIncluding Utilities Used to Apportion
State School Tax
Base Valuation for Debt Limit
for School Purposes Only
Concord • Concord Union School District 4,192,929,768 4,004,593,744 4,163,693,926
Penacook • Merrimack Valley School District 418,635,859 384,439,491 415,719,309
Loudon School District 688,764,413 663,714,605 683,783,897
'flood control, forest, recreation lands, and others.' 'Does not Include utilities or railroads
www.revenue.nh.gov 2020 Annual Report Of the Department Of Revenue Administration 177
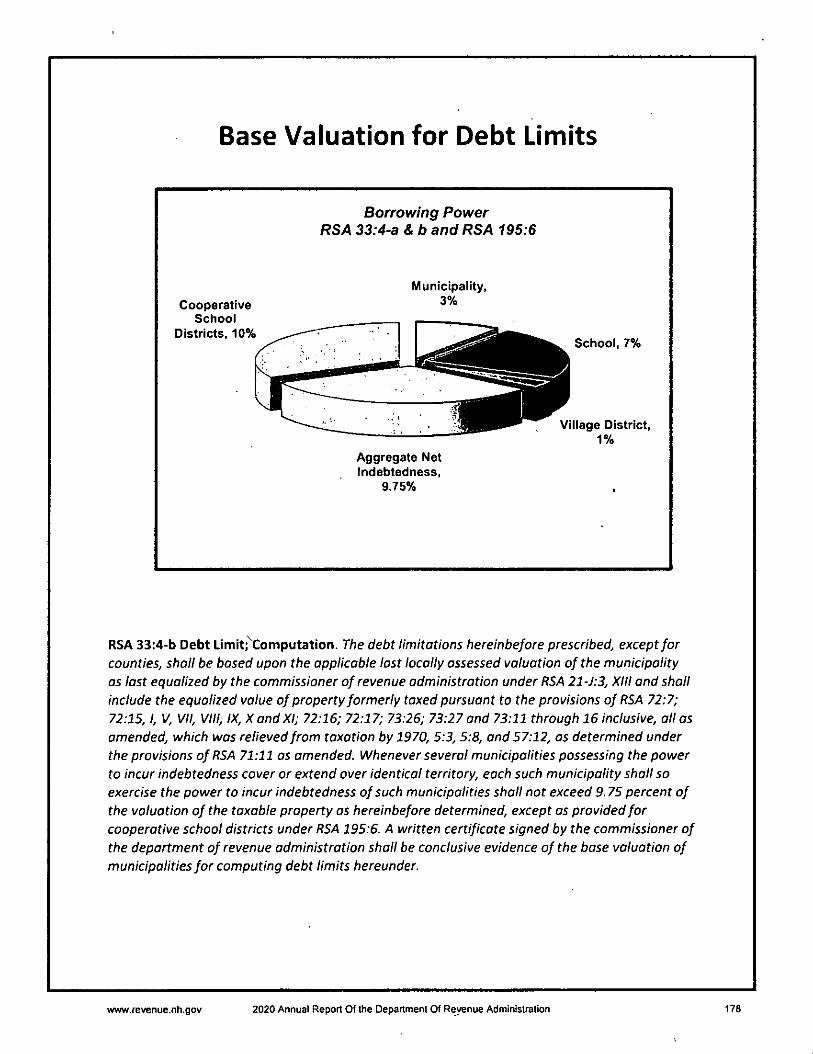
Base Valuation for Debt Limits
CooperativeSchool
Districts, 10%
Borrowing PowerRSA 33:4-a & b and RSA 195:6
Municipality,3%
School, 7%
Aggregate NetIndebtedness,
9.75%
Village District,1%
RSA 33:4-b Debt Limit;^Computatlon. The debt limitations hereinbefore prescribed, except forcounties, shall be based upon the applicable last locally assessed valuation of the municipalityas last equalized by the commissioner of revenue administration under RSA 21-J:3, XIII and shall
include the equalized value of property formerly taxed pursuant to the provisions of RSA 72:7;
72:15,1, V, VII, Vni, IX, X and XI; 72:16; 72:17; 73:26; 73:27 and 73:11 through 16 inclusive, alias
amended, which was relieved from taxation by 1970, 5:3, 5:8, and 57:12, as determined under
the provisions of RSA 71:11 as amended. Whenever several municipalities possessing the power
to incur indebtedness cover or extend over identical territory, each such municipality shall so
exercise the power to incur indebtedness of such municipalities shall not exceed 9.75 percent of
the valuation of the taxable property as hereinbefore determined, except as provided forcooperative school districts under RSA 195:6. A written certificate signed by the commissioner of
the department of revenue administration shall be conclusive evidence of the base valuation of
municipalities for computing debt limits hereunder.
www.revenue.nh.gov 2020 Annual Report Of the Department Of Revenue Administration 178

MUNICIPAL AND PROPERTY DIVISION
2019 Base Valuation for Debt Limits
Alpha Order by Municipality
Municipality ' Modified Local ] .ORA Inyentory , Equalized Shared Base ValuationAssessed i Adjustment Assessed-' . Revenues • ■ for Debt Litmits 'Valuation • j;. . i ~ Valuatjon Adjustment ' i'
'' '• T"' RSA31-A-
Acworth 98,628.456 2,833,432 101,461,888 0 101,461,888
Albany 115,818,686 6,342,066 122,160,752 0 122,160,752
Alexandria 198,167,051 40,824,401 238,991,452 0 238,991,452
Allenstown 297,490.196 39,024,218 336,514,414 0 336,514,414
Alstead 163,278,593 23,793,771 187,072,364 0 187,072,364
Alton 1,752,952,350 229,941,519 1,982,893,869 0 1,982,893,869
Amherst 1,747,592,420 322,972,043 2,070,564,463 0 2,070,564,463
Andover 304,208,590 ...6,818,961 311,027,551 0 311,027,551
Antrim 249,335,950 29,502,586 278,838,536 0 278,838,536
Ashland 247,207,364 10,294,527 257,501,891 0 257,501,891
Atkinson & Gilmanton 818,373 86,967 905,340 0 905,340
Atkinson 1,004,519,575 194,184,304 1,198,703,879 0 1,198,703,879
Auburn 863,385,428 73,017,478 936,402,906 0 936,402,906
Barnstead 601,557,018 28,229,745 629,786,763 0 629,786,763
Barrington 1,150,530,325 37,995,117 1,188,525,442 0 1,188,525,442
Bartlett 1.065,028,740 183,514,836 1,248,543,576 0 1,248,543,576
Bath 125,214,976 6,280,757 131,495,733 0 131,495,733
Beans' Grant 0 0 . 0 0 0
Bean's Purchase 0 0 0 0 0
Bedford 4,095,806,840 229,208,070 4,325,014,910 0 4,325,014,910
Belmont 743,222,782 86,154,203 829,376,985 0 829,376,985
Bennlngton 127,277,077 2.721,789 129,998,866 0 129,998,866
Benton 25,499,534 1,622,457 27,121,991 0 27,121,991
Berlin 412,225,868 .48,336,882 460,562,750 0 460,562,750
Bethlehem 261,286,660 34,836,673 296,123,333 0 296,123,333
Boscawen 288,929,864 . .12,307,189 301,237,053 0 301,237,053
Bow 1,294,517,915 23,721,707 1,318,239,622 0 1,318,239,622
Bradford 201,269,972 51,717,255 252,987,227 0 252,987,227
Brentwood 582,474,006 120,119,081 702,593,087 0 702,593,087
Brldgewater 350,939,300 ' 74,973,759 425,913,059 0 425,913,059
Bristol 471,534,473 99,999,204 571,533,677 0 571,533,677
Brookfield 124,312,043 ^ 4,290,947 ' 120,021,096 0 120,021,096
Brookline 667,344,153 34,353,360 701,697,513 0 701,697,513
Cambridge 9,092,072 1,314,109 10,406,181 0 10,406,181
Campton 436,002,836 6,175,273 442,178,109 0 442,178,109
Canaan 348,470,142 63,725,359 412,195,501 0 ■ 412,195,501
Candia 513,604,108 24,175,690 537,779,798 0 537,779,798
Canterbury 263,980,723 . 59,815,'869 323,796,592 0 323,796,592
Carroll 329,433,801 54,065,890 383,499,691 0 383,499,691
Center Harbor 434,767,397 78,511,699 513,279,096 0 513,279,096
Chandler's Purchase 41,121 6,417 47,538 0 47,538
Charlestown 282982237 49068910 332051147 0 332051147
Chatham 59500049 718824 60218873 0 60218873
Chester 724,050,973 51,936,406 775,987,379 0 775,987,379
Chesterfield 521,216,633 86,830,506 608,047,139 0 608,047,139
Chlchester 323,112,390 22,777,495 345,889,885 0 345,889,885
www.revenue.nh.gov 2020 Annual Report Of the Department Of Revenue Administration 179
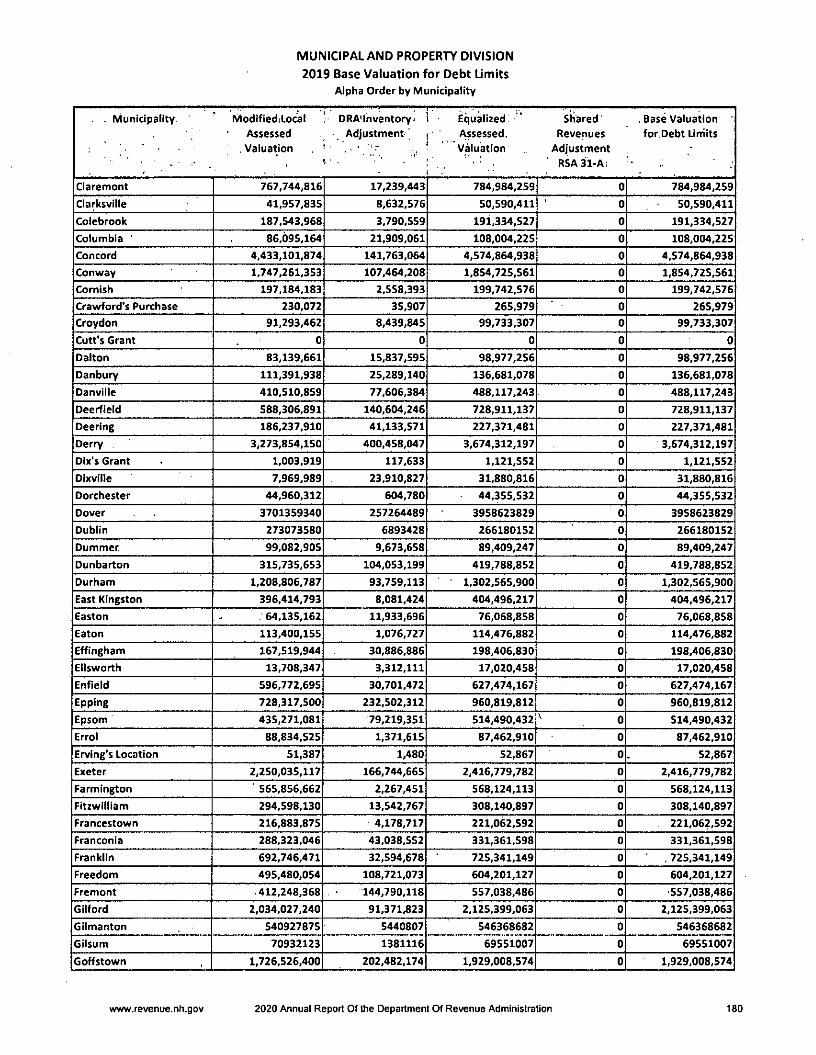
MUNICIPAL AND PROPERTY DIVISION
2019 Base Valuation for Debt Limits
Alpha Order by Munidpalitv
. . Municipality. ' ModlfiedjLo^l ! DRA'Inventory i Equalized ' Shared . Base ValuationAssessed Adjustment' j Assessed. Revenues for.Debt Limits
.Valuation ~ ' Valuation Adjustment, *■ ■ ■ • " : , , " ' RSA31-A; '■
Claremont 767,744,816 17,239,443 784,984,259 0 784,984.259
Clarksvllle 41,957,835 8,632,576 50,590,411 0 50,590,411
Colebrook 187,543.968 3,790,559 191,334,527 0 191,334,527
Columbia ' 86,095,164 21,909,061 108,004,225 0 108,004,225
Concord 4,433,101,874 141,763,064 4,574,864,938 0 4,574,864,938
Conway 1,747,261,353 107,464,208 1,854,725,561 0 1,854,725,561
Cornish 197,184,183 2,558,393 199,742,576 0 199,742,576
Crawford's Purchase 230,072 35,907 265,979 0 265,979
Croydon 91,293,462 8,439,845 99,733,307 0 99,733,307
Cutt's Grant 0 0 0 0 0
Dalton 83,139.661 15,837,595 98,977,256 0 98,977,256
Danbury 111,391.938 25,289,140 136,681,078 0 136,681,078
Danville 410,510.859 77,606,384 488,117,243 0 488,117,243
Deerfield 588,306,891 140,604,246 728,911,137 0 728,911,137
Deering 186,237,910 41,133,571 227,371,481 0 227,371,481
Derry 3,273,854,150 400,458,047 3,674,312,197 0 3,674,312,197
Dix's Grant 1,003,919 117,633 1,121,552 0 1,121,552
Dixville 7,969,989 23,910,827 31,880,816 0 31,880,816
Dorchester 44,960,312 604,780 44,355,532 0 44,355,532
Dover 3701359340 257264489 3958623829 0 3958623829
Dublin 273073580 6893428 266180152 0 266180152
Dummer. 99,082,905 9,673,658 89,409,247 0 89,409,247
Dunbarton 315,735,653 104,053,199 419,788,852 0 419,788,852
Durham 1,208,806,787 93,759,113 1,302,565,900 0 1,302,565,900
East Kingston 396,414,793 8,081,424 404,496,217 0 404,496,217
Easton . 64,135,162 11,933,696 76,068,858 0 76,068,858
Eaton 113,400,155 1,076,727 114,476,882 0 114,476,882
Effingham 167,519,944 30,886,886 198,406,830 0 198,406,830
Ellsworth 13,708,347 3,312,111 17,020,458 0 17,020,458
Enfield 596,772,695 30,701,472 627,474,167 0 627,474,167
Epping 728,317,500 232,502,312 960,819,812 0 960,819,812
Epsom 435,271,081 79,219,351 514,490,432 ^ 0 514,490,432
Errol 88,834,525 1,371,615 87,462,910 0 87,462,910
Erving's Location 51,387 1,480 52,867 0 52,867
Exeter 2,250,035,117 166,744,665 2,416,779,782 0 2,416,779,782
Farmington 565,856,662 2,267,451 568,124,113 0 568,124,113
Fitzwilliam 294,598,130 13,542,767 308,140,897 0 308,140,897
Francestown 216,883,875 4.178,717 221,062,592 0 221,062,592
Franconia 288,323,046 43,038,552 331,361,598 0 331,361,598
Franklin 692,746,471 32,594,678 725,341,149 0 . 725,341,149
Freedom 495,480,054 108,721,073 604,201,127 0 604,201,127
Fremont 412,248,368 144,790,118 557,038,486 0 557,038,486
Gilford 2,034,027,240 91,371,823 2,125,399,063 0 2,125,399,063
Gllmanton 540927875 5440807 546368682 0 546368682
Gilsum 70932123 1381116 69551007 0 69551007
Goffstown 1,726,526,400 202,482,174 1,929,008,574 0 1,929,008,574
www.revenue.nh.gov 2020 Annual Report Of the Department Of Revenue Administration 160
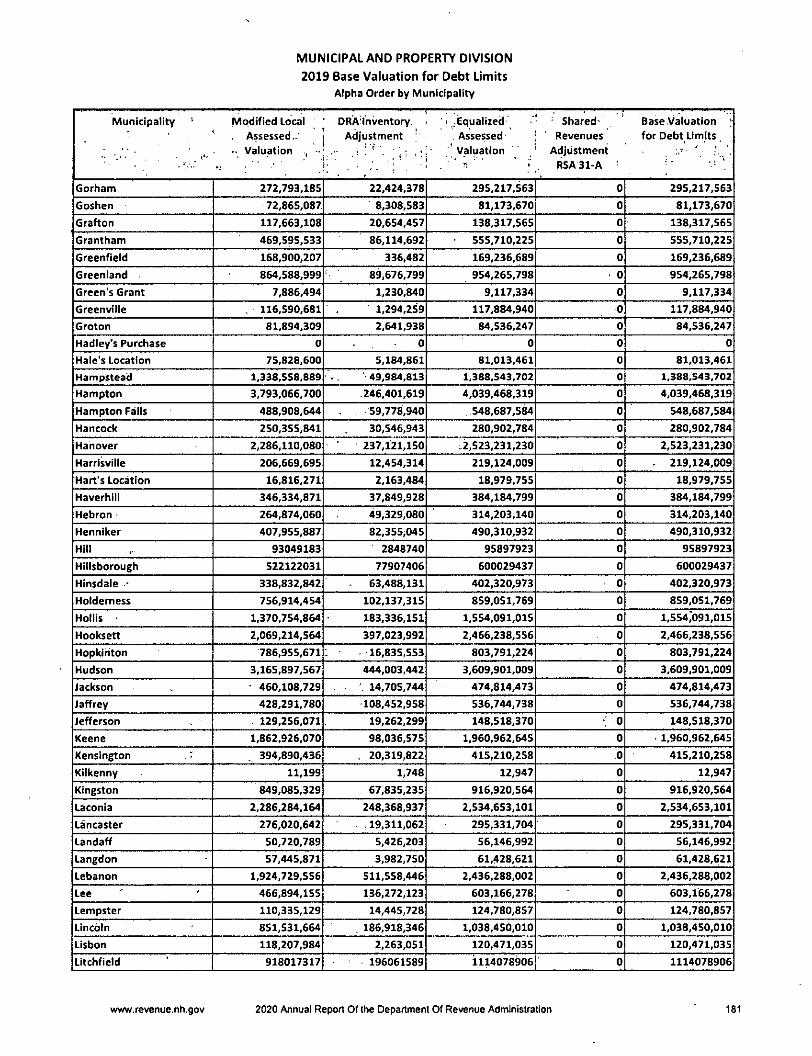
MUNICIPAL AND PROPERTY DIVISION
2019 Base Valuation for Debt Limits
Alpha Order by Municipality
Municipality Modified Locai DRAInventory ' ̂ jEquaiized' ■ ' ■ Shared- ' Base Valuation' . Assessed.. t Adjustment .Assessed ; ' Revenues for Debt Limits,
• , . •• Valuation , Valuation ' ' Adjustment ' ,■ 'j: ■■ ■! RSA31-A' ■
Gorham 272,793.185 22,424,378 295,217,563 0 295,217,563
Goshen 72,865,087 8,308,583 81,173,670 0 81,173,670
Grafton 117,663,108 20,654,457 138,317,565 0 138,317,565
Grantham 469,595,533 86,114,692 • 555,710,225 0 555,710,225
Greenfield 168,900,207 336,482 169,236,689 0 169,236,689
Greenland 864,588,999 89,676,799 954,265,798 0 954,265,798
Green's Grant 7,886,494 1,230,840 9,117,334 0 9,117,334
Greenville 116,590,681 ■ 1,294,259 117,884,940 0 117,884,940
Groton 81,894,309 2,641,938 84,536,247 0 84,536,247
Hadiey's Purchase 0 0 0 0 0
Male's Location 75,828.600 5,184,861 81,013,461 0 81,013,461
Hampstead 1,338,558,889 49,984,813 1,388,543,702 0 1,388,543,702
Hampton 3,793,066,700 .246,401,619 4,039,468,319 0 4,039,468,319
Hampton Fails 488,908,644 59,778,940 548,687,584 0 548,687,584
Hancock 250,355,841 30,546,943 280,902,784 0 280,902,784
Hanover 2,286,110,080 237,121,150 ;2,S23,231,230 0 2,523,231,230
Harrisviiie 206,669,695 12,454,314 219,124,009 0 ■ 219,124,009
Hart's Location 16,816,271 2,163,484 18,979,755 0 18,979,755
Haverhiii 346,334,871 37,849,928 384,184,799 0 384,184,799
Hebron ' 264,874,060 49,329,080 314,203,140 0 314,203,140
Henniker 407,955,887 82,355,045 490,310,932 0 490,310,932
Hill 93049183 2848740 95897923 0 95897923
Hillsborough 522122031 77907406 600029437 0 600029437
Hinsdaie - 338,832,842 63,488,131 402,320,973 0 402,320,973
Holdemess 756,914,454 102,137,315 859,051,769 0 859,051,769
Holiis - 1,370,754,864 183,336,151 1,554,091,015 0 1,554,091,015
Hooksett 2,069,214,564 397,023,992 2,466,238,556 0 2,466,238,556
Hopkiriton 786,955,671 16,835,553 803,791,224 0 803,791,224
Hudson 3,165,897,567 444,003,442 3,609,901,009 0 3,609,901,009
Jackson - 460,108,729 . , 14,705,744 474,814,473 0 474,814,473
Jaffrey 428,291,780 108,452,958 536,744,738 0 536,744,738
Jefferson 129,256,071 19,262,299 148,518,370 • 0 148,518,370
Keene 1,862,926,070 98,036,575 1,960,962,645 0 1,960,962,645
Kensington 394,890,436 . 20,319,822 415,210,258 0 415,210,258
Kilkenny 11,199 1,748 12,947 0 12,947
Kingston 849,085,329 67,835,235 916,920,564 0 916,920,564
Laconia 2.286,284,164 248,368,937 2,534,653,101 0 2,534,653,101
Lancaster 276,020.642 .19,311,062 295,331,704 0 295,331,704
Landaff 50,720.789 5,426,203 56,146,992 0 56,146,992
Langdon 57,445,871 3,982,750 61,428.621 0 61,428,621
Lebanon 1,924.729,556 511,558,446 2,436,288,002 0 2,436,288,002
Lee ' ' 466,894,155 136,272,123 603,166,278 0 603,166,278
Lempster 110,335,129 14,445,728 124,780,857 0 124,780,857
Lincoln 851,531,664 . 186,918,346 1,038,450,010 0 1,038,450,010
Lisbon 118,207.984 2,263,051 120,471,035 0 120,471,035
Litchfield 918017317 196061589 1114078906 0 1114078906
www.revenue.nh.gov 2020 Annuai Report Of the Department Of Revenue Administration 181
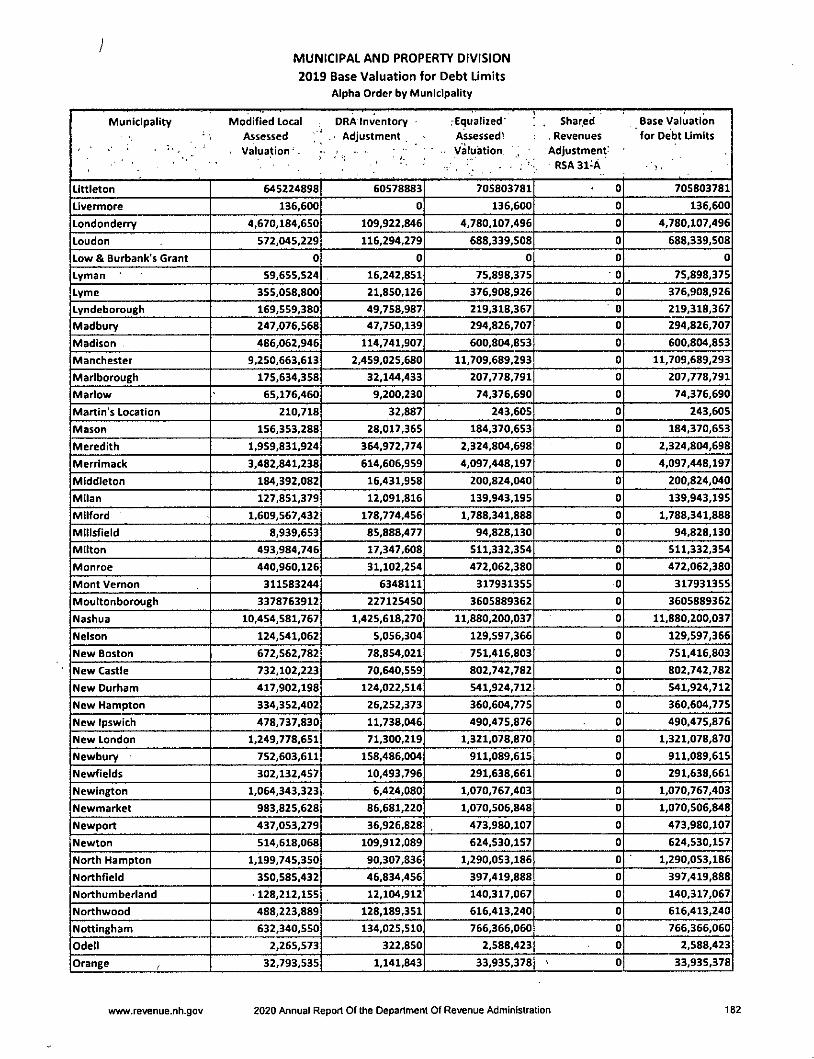
MUNICIPAL AND PROPERTY DIVtSION
2019 Base Valuation for Debt Limits
Alpha Order by Municipality
Municipality Modified Local
Assessed
' Valuation- .
DRA Inventory
. Adjustment
rEqualized'
Assessed:
. Valuiation
Shar.ed
.Revenues
Adjustment'
RSA 31-A
..J.I.
Base Valuation
for Debt Limits
Littleton 645224898 60578883 705803781 0 705803781
Livermore 136.600 0 136,600 0 136,600
Londonderry 4,670,184.650 109,922,846 4,780,107,496 0 4,780,107,496
Loudon 572,045,229 116,294,279 688,339,508 0 688,339,508
Low & Burbank's Grant 0 0 0 0 0
Lyman 59,655,524 16,242,851 75,898,375 0 75,898,375
Lyme 355,058.800 21,850,126 376,908,926 0 376,908,926
Lyndeborough 169,559,380 49,758,987 219,318,367 0 219,318,367
Madbury 247,076,568 47,750,139 294,826,707 0 294,826,707
Madison 486,062,946 114,741,907 600,804,853 0 600,804,853
Manchester 9,250,663,613 2,459,025,680 11,709,689,293 0 11,709,689,293
Mariborough 175,634,358 32,144,433 207,778,791 0 207,778,791
Marlow 65,176,460 9,200,230 74,376,690 0 74,376,690
Martin's Location 210,718 32,887 243,605 0 243,605
Mason 156,353,288 28,017,365 184,370,653 0 184,370,653
Meredith 1,959,831,924 364,972,774 2,324,804,698 0 2,324,804,698
Merrimack 3,482,841,238 614,606,959 4,097,448,197 0 4,097,448,197
Middleton 184,392,082 16,431,958 200,824,040 0 200,824,040
Milan 127,851,379 12,091,816 139,943,195 0 139,943,195
Milford 1,609,567,432 178,774,456 1,788,341,888 0 1,788,341,888
Millsfield 8,939,653 85,888,477 94,828,130 0 94,828,130
Milton 493,984,746 17,347,608 511,332,354 0 511,332,354
Monroe 440,960,126 31,102,254 472,062,380 0 472,062,380
Mont Vernon 311583244 6348111 317931355 0 317931355
Mouttonborough 3378763912 22712S450 3605889362 0 3605889362
Nashua 10,454,581,767 1,425,618,270 11,880,200,037 0 11,880,200,037
Nelson 124,541,062 5,056,304 129,597,366 0 129,597,366
New Boston 672,562,782 78,854,021 751,416,803 0 751,416,803
New Castle 732,102,223 70,640.559 802,742,782 0 802,742,782
New Durham 417,902,198 124,022,514 541,924,712 0 541,924,712
New Hampton 334,352,402 26,252,373 360,604,775 0 360,604,775
New Ipswich 478,737,830 11,738,046 490,475,876 0 490,475,876
New London 1,249,778,651 71,300,219 1,321,078,870 0 1,321,078,870
Newbury 752,603,611 158,486,004 911,089,615 0 911,089,615
Newfields 302,132,457 10,493,796 291,638,661 0 291,638,661
Newington 1,064,343,323 6,424,080 1,070,767,403 0 1,070,767,403
Newmarket 983,825,628 86,681,220 1,070,506,848 0 1,070,506,848
Newport 437,053,279 36,926,828 473,980,107 0 473,980,107
Newton 514,618,068 109,912,089 624,530,157 0 624,530,157
North Hampton 1,199,745,350 90,307,836 1,290,053,186 0 1,290,053,186
Northfleld 350,585,432 46,834,456 397,419,888 0 397,419,888
Northumberland • 128,212,155 12,104,912 140,317,067 0 140,317,067
Northwood 488,223,889 128,189,351 616,413,240 0 616,413,240
Nottingham 632,340,550 134,025,510 766,366,060 0 766,366,060
Odell 2,265,573 322,850 2,588,423 0 2,588,423
Orange ^ 32,793,535 1,141,843 33,935,378 0 33,935,378
www.revenue.nh.gov 2020 Annual Report Of the Department Of Revenue Administration 182

MUNICIPAL AND PROPERTY DIVISION
2019 Base Valuation for Debt Limits
Alpha Order by Municipality
Municipality , Modified Local ' ] DRA'Inventory. , . '.EqualizedAssessed Adjustrnent Assessed-
. ■' . Valuation; , . ^ • - Valuation
5h3red Base Valuation
Revenues for Debt Llrhlts• Adjustment
, . R5A31-A
Orford 137,342.151 22,393,146 159,735,297 0 159,735,297
Ossipee. 775433608 38168305 813601913 0 813601913
Pelham 1981194460 63369712 2044564172 0 2044564172
Pembroke 762,260,478 ' 18,716,265 780,976,743 0 780,976,743
Peterborough 734,135,996 60,319,218 794,455,214 0 794,455,214
Piermont 97,137,103 ■ 3,974,408 101,111,511 0 101,111,511
PInkham's Grant 2,934,826 458,037 3,392,863 0 3,392,863
Pittsburg 290,151,481 35,829,509 325,980,990 0 325,980,990
PIttsfield 267,351,692 65,041,871 332,393,563 0 332,393,563
Plainfield 307,682,486 9,068,630 316,751,116 0 316,751,116
Plaistow 1,192,542,632 40,694,339 1,233,236,971 0 1,233,236,971
Plymouth 481,301,108 . ' 60,022,099 541,323,207 0 541.323,207
Portsmouth 6,170,543,376 543,862,051 6,714,405,427 0 6,714,405,427
Randolph 71,499,816 . 1,123,323 70,376,493 0 70,376,493
Raymond 954,638,228 237,152,910 1,191,791,138 0 1,191,791,138
Richmond 101,083,354 8,366,581 109,449,935 0 109,449,935
Rindge 557,397,684 141,911,343 699,309,027 0 699,309,027
Rochester 2,724,627,077 27,510,386 2,752,137,463 0 2,752,137,463
Rollinsford 296,506,401 31,851,194 328,357,595 0 328,357,595
Roxbury 24,549,554 660,086 23,889,468 0 23,889,468
Rumney 197,319,432 9,465,402 206,784,834 0 206,784,834
Rye 2,160,877,300 ' . 372,394,390 2,533,271,690 0 2,533,271,690
Salem 4,609,602,481 1,145,196,652 5,754,799,133 0 5,754,799.133
Salisbury 151,123,465 20,477,034 171,600,499 0 171,600,499
Sanbornton 530,893,265 15,241,120 546,134,385 0 546,134,385
Sandown 672840480 100522513 773362993 0 . 773362993
Sandwich 445469605 9052307 454521912 0 454521912
Sargent's Purchase 1,888,530 294,742 2,183,272 0 2,183,272
Seabrook 2,765,266,650 240,456,636 3,005,723,286 0 3,005,723,286
Second College Grant 1,404,232 127,980 1,532,212 0 , 1,532,212
Sharon 55,603,218 1,388,350 54,214,868 0 54,214,868
Shelburne 78,679,336 7,146,832 71,532,504 0 71,532,504
Somersworth 1,072,392,754 26,366,635 1,098,759,389 0 1,098,759,389
South Hampton - 170,647,498 2,398,555 173,046,053 0 173,046,053
Springfield 209,877,588 18,502,845 228,380,433 0 228,380,433
Stark 76,792,216 305,870 77,098,086 0 77,098,086
Stewartstown 109,759,414 4,450,075 114,209,489 0 114,209,489
Stoddard 293,377,810 10,921,496 304,299,306 0 304,299,306
Strafford 486,299,912 146,804,827 633,104,739 0 633,104,739
Stratford 76,552,940 9,006,698 85,559,638 0 85,559,638
Stratham 1,554,473,230 22,065,918 1,576,539,148 0 1,576,539,148
Success 12,189,520 . - , 1,808,085 13,997.605 0 13,997,605
Sugar Hill 163,260,383 6,954,818 170,215,201 0 170,215,201
Sullivan 61,764,198 . 2,153,045 63,917,243 0 63,917,243
Sunapee 1,247,623,517 242,944,116 1,490,567,633 0 1,490,567,633
Surry 82,603,585 6,110,273 88,713,858 0 88,713,858
www.revenue.nh.gov 2020 Annual Report Of the Department Of Revenue Administration 183
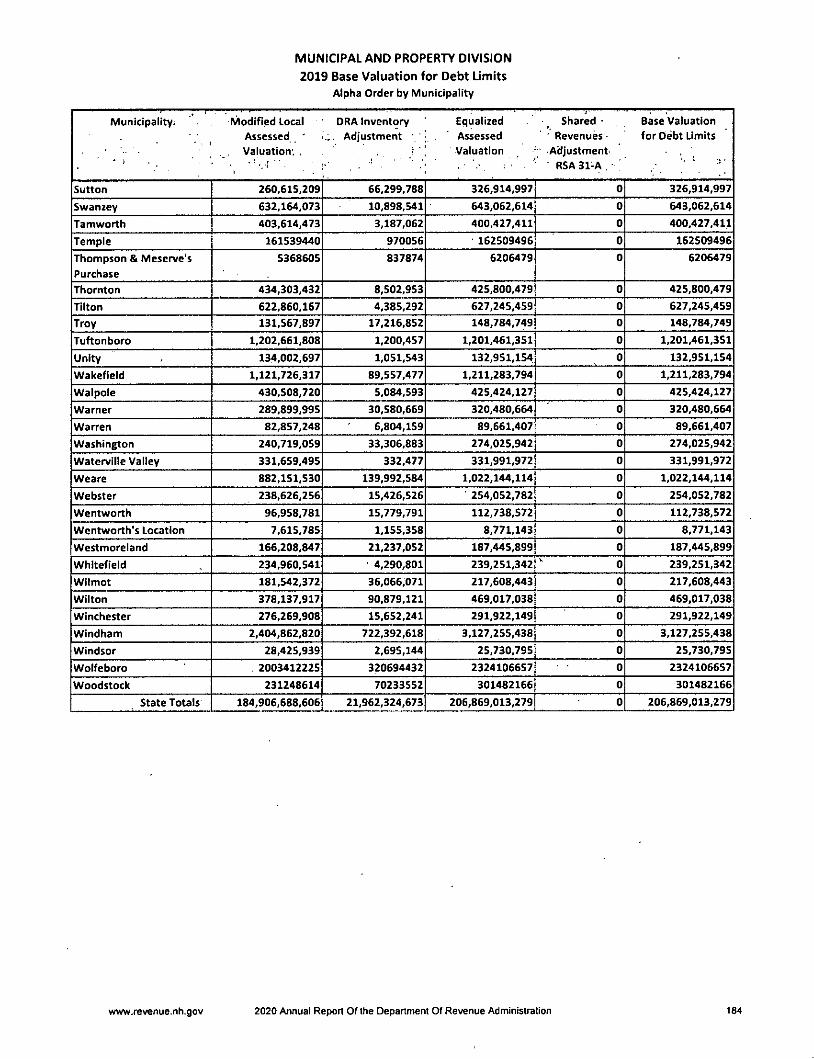
MUNICIPAL AND PROPERTY DIVISION
2019 Base Valuation for Debt Limits
Alpha Order by Municipality
Municipality. Modified Local DRA Inventory Equalized Shared- Base ValuationAssessed ' i:. Adjustment . Assessed 'Revenues- for Debt LimitsValuation: , . i ' '' Valuation •' Adjustment-
■' ■-'* ' • RSA 31-A , - '' ' '' '
Sutton 260,615,209 66,299,788 326,914,997 0 326,914,997
Swanzey 632,164.073 10,898,541 643,062,614 0 643,062,614
Tamworth 403,614,473 3,187,062 400,427,411 0 400,427,411
Temple 161539440 970056 162509496 0 162509496
Thompson & Meserve'sPurchase
5368605 837874 6206479 0 6206479
Thornton 434,303,432 8,502,953 425,800,479 0 425,800,479
Tilton 622,860,167 4,385,292 627,245,459 0 627,245,459
Troy 131,567,897 17,216,852 148,784,749 0 148.784,749
Tuftonboro 1,202,661,808 1,200,457 1,201,461,351 0 1,201,461,351
Unity 134,002,697 1,051,543 132,951,154 0 132,951,154
Wakefield 1,121,726,317 89.557,477 1,211,283,794 0 1,211,283,794
Walpole 430,508,720 5,084,593 425,424,127 0 425,424,127
Warner 289,899,995 30,580,669 320,480,664 0 320,480,664
Warren 82,857,248 6,804,159 89,661,407 0 89,661,407
Washington 240,719,059 33,306,883 274,025,942 0 274,025,942
Waterville Valley 331,659,495 332,477 331,991,972 0 331,991,972
Weare 882,151,530 139,992,584 1,022,144,114 0 1,022,144,114
Webster 238,626,256 15,426,526 254,052,782 0 254,052,782
Wentworth 96,958,781 15,779,791 112,738,572 0 112,738,572
Wentworth's Location 7,615,785 1,155,358 8,771,143 0 8,771,143
Westmoreland 166,208,847 21,237,052 187,445,899 0 187,445,899
Whitefield 234,960,541 4,290,801 239,251,342 0 239,251,342
Wllmot 181,542,372 36,066,071 217,608,443 0 217,608,443
Wilton 378,137,917 90,879,121 469,017,038 0 469,017,038
Winchester 276,269,908 15,652,241 291,922,149 0 291,922,149
Windham 2,404,862,820 722,392,618 3,127,255,438 0 3,127,255,438
Windsor 28,425,939 2,695,144 25,730,795 0 25,730,795
Wolfeboro 2003412225 320694432 2324106657 0 2324106657
Woodstock 231248614 70233S52 301482166 0 301482166
State Totals 184,906,688,606 21,962,324,673 206,869,013,279 0 206,869,013,279
www.revenue.nh.gov 2020 Annual Report Of the Department Of Revenue Administration t84
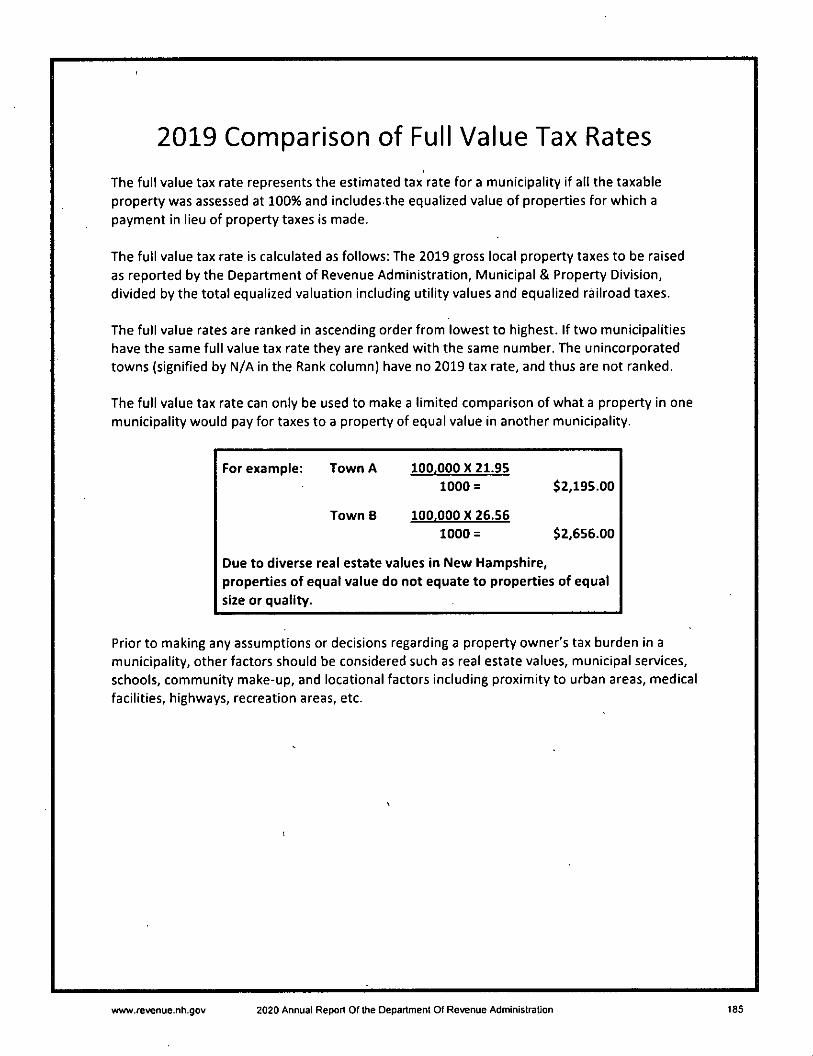
2019 Comparison of Full Value Tax Rates
The full value tax rate represents the estimated tax rate for a municipality if all the taxable
property was assessed at 100% and includes-the equalized value of properties for which apayment in lieu of property taxes is made.
The full value tax rate is calculated as follows: The 2019 gross local property taxes to be raised
as reported by the Department of Revenue Administration, Municipal & Property Division,divided by the total equalized valuation including utility values and equalized railroad taxes.
The full value rates are ranked in ascending order from lowest to highest. If two municipalities
have the same full value tax rate they are ranked with the same number. The unincorporated
towns (signified by N/A in the Rank column) have no 2019 tax rate, and thus are not ranked.
The full value tax rate can only be used to make a limited comparison of what a property in one
municipality would pay for taxes to a property of equal value in another municipality.
For example: Town A 100.000X21.95
1000 = $2,195.00
Town B 100.000X26.56
1000 = $2,656.00
Due to diverse real estate values in New Hampshire,
properties of equal value do not equate to properties of equal
size or quality.
Prior to making any assumptions or decisions regarding a property owner's tax burden in amunicipality, other factors should be considered such as real estate values, municipal services,
schools, community make-up, and locational factors including proximity to urban areas, medical
facilities, highways, recreation areas, etc.
www.revenue.nh.gov 2020 Annual Report Of the Department Of Revenue Administration 185
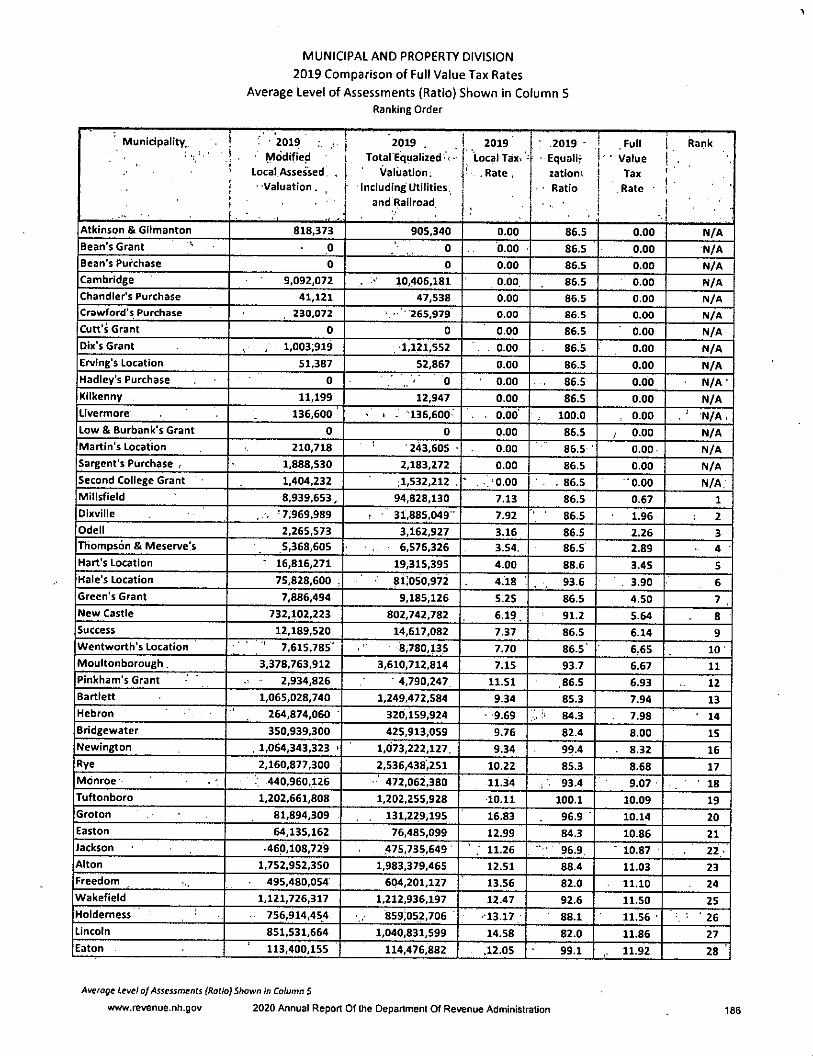
MUNICIPAL AND PROPERTY DIVISION
2019 Comparison of Full Value Tax Rates
Average Level of Assessments (Ratio) Shown In Column SRanking Order
fMunidpality.. j ■' ■ 2019I ' ' Modified
Local Assessed .•' ' -Valuation.
2019 .Total'Equalized'-
Valuation:Including Utilities
and Railroad
i 2019Local Tax>'
' .Rate,
.2019 -
■ Equalifzatiom
- Ratio
i .Full1' * Valuej Tax1 .Rate -1
[ Ranki 't
1 •i
1i
Atkinson & Gllmanton 818,373 905,340 0.00 86.5 0.00 N/ABean's Grant 0 0 0.00 86.5 0.00 N/ABean's Purchase 0 0 0.00 86.5 0.00 N/ACambridge 9,092,072 . ^ 10,406,181 0.00. 86.5 0.00 N/AChandler's Purchase 41,121 47,538 0.00 86.5 0.00 N/ACrawford's Purchase 230,072 , • 265,979 0.00 86.S 0.00 N/ACutt's Grant 0 0 0.00 86.5 0.00 N/ADix's Grant ; 1,003;919 1,121,552 . 0.00 86.5 0.00 N/AErvlng's Location 51,387 52,867 0.00 86.5 0.00 N/AHadley's Purchase 0 . ' 0 0.00 86.5 0.00 N/A •Kilkenny 11,199 12,947 0.00 86.5 0.00 N/ALIvermore 136,600 ' ■ ■ 136,600 . . 0.00 100.0 , 0.00 ■' n/a ,Low & Burbank's Grant 0 0 0.00 86.5 / 0.00 N/AMartin's Location 210,718 ' 243,605 • 0.00 86.5 ' 0.00 N/ASargent's Purchase ■ 1,888,530 2,183,272 0.00 86.5 0.00 N/ASecond College Grant 1,404,232 .1,532,212 , ' -. 0.00 . 86.5 0.00 N/A,Millsfield 8,939,653, 94,828,130 7.13 86.5 0.67 1
Oixvllle . . '7,969,989 - 31,885,049" 7.92 86.5 ' 1.96 2
Odell 2,265,573 3,162,927 3.16 86.5 2.26 3Thompson & Meserve's .5,368,605 . 6,576,326 3.54, 86.5 - 2.89 4 -
Hart's Location ■ 16,816,271 19,315,395 4.00 88.6 3.45 5
Kale's Location 75,828,600 , ■ 8i:050,972 4.18 ■ 93.6 , 3.90 6
Green's Grant 7,886,494 9,185,126 5.25 86.5 4.50 7 ,New Castle 732,102,223 802,742,782 6.19. 91.2 5.64 8Success 12,189,520 14,617,082 7.37 86.5 6.14 9Wentworth's Location 7,615,785' 8,780,135 7.70 86.5' 6.65 10
Moultonborough. 3.378,763,912 3,610,712,814 7.15 93.7 6.67 11
PInkham's Grant 2,934,826 4.790,247 11.51 86.5 6.93 12Bartlett 1,065,028,740 1,249,472,584 9.34 85.3 7.94 13Hebron 264,874,060 320,159,924 - '9.69 84.3 7.98 ■ 14
Bridgewater 350,939,300 425,913,059 9.76 82.4 8.00 15
Newlngton , 1,064,343,323 ' 1,073,222,127. 9.34 99.4 . 8.32 16
Rye 2,160,877,300 2,536,438,251 10.22 85.3 8.68 17
Monroe • V 440,960,126 472,062,380 11.34 93.4 9.07 18Tuftonboro 1,202,661,808 1,202,255,928 10.11 100.1 10.09 19Groton 81,894,309 . 131,229,195 16.83 96.9 " 10.14 20Easton 64,135,162 76,485,099 12.99 84.3 10.86 21Jackson .460,108,729 475,735,649 ' ; 11.26 ' 96.9 ■ 10.87 22Alton 1,752,952.350 1,983,379,465 12.51 88.4 11.03 23Freedom 495,480,054 604.201,127 13.56 82.0 11.10 24
Wakefield 1,121,726,317 1,212,936,197 12.47 92.6 11.50 25
Holderness 756,914,454 859;052,706 •13.17 88.1 11.56 • 26Lincoln 851,531,664 1,040,831,599 14.58 82.0 11.86 27
Eaton 113,400,155 114,476,882 .12.05 99.1 11.92 28
Average Level of Assessments (Ratio) Shown in Column 5
www.revenue.nh.gov 2020 Annual Report Of the Department Of Revenue Administration 186
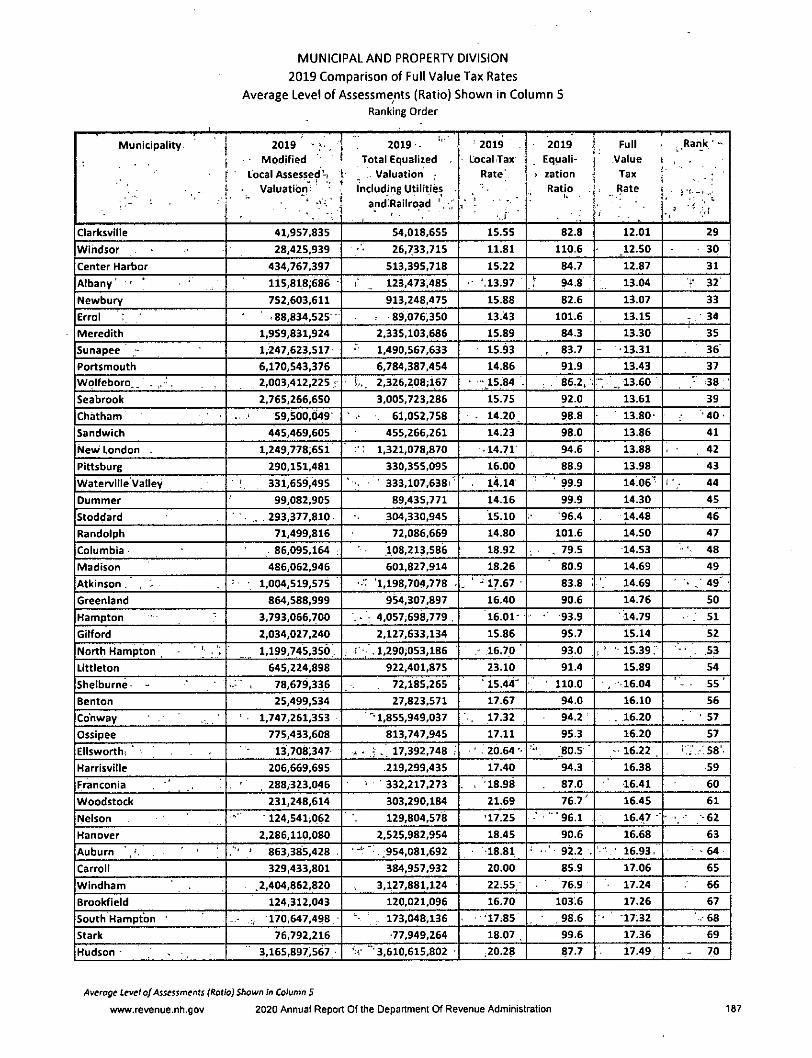
MUNICIPAL AND PROPERTY DIVISION
2019 Comparison of Full Value Tax Rates
Average Level of Assessments (Ratio) Shown in Column 5Ranking Order
'
Municipality
/ • ' '
•
2019 ■ > .
■ Modified '
Local Assessed'i
Valuation-
■
r2019 -
Total Equalized
. Valuation
Including Utilitl^ •and Railrqad '.
2019
Local Tax
Rate'
1 "
2019
Equali*
> zation
Ratio
Full
Value
Tax
Rate
;
Rank ' -
•
3 ' ,',1
Clarksvllle 41,957,835 54,018,655 15.55 82.8 12.01 29
Windsor 28,425,939 26,733,715 11.81 110.6 12.50 30
Center Harbor 434,767,397 513,395,718 15.22 84.7 12.87 31
Albany' ■ ' 115,818;686 123,473,485 ,13.97 94.8 13.04 f' 32
Newbury 752,603,611 913,248,475 15.88 82.6 13.07 33
Errol -88,834,525 c 89,076,350 13.43 101.6 13.15 : 34
Meredith 1,959,831,924 2,335,103,686 15.89 84.3 13.30 35
Sunapee - 1,247,623,517 1,490,567,633 15.93 . 83.7 - 13.31 36
Portsmouth 6,170,543,376 6,784,387,454 14.86 91.9 13.43 37
Wolfeboro.. , , 2,003,412,225 r L. 2,326,208;167 ' •• 15.84 - 86.2. . 13-60 - 38
Seabrook 2,765,266,650 3,005,723,286 15.75 92.0 13.61 39
Ch^ham . ' 59,500,049* . 61,052,758 . 14.20. 98.8 ■ 13.80- 40
Sandwich 445,469,605 455,266,261 14.23 98.0 13.86 41
New London 1,249,778,651 : 1,321,078,870 • 14.71: 94.6 13.88 , 42
Pittsburg 290,151,481 330,355,095 16.00 88.9 13.98 43
Waterville Valley !. 331,659,495 • • 333,107,638[' - 14.14 ' ■ 99.9 14.06 44
Dummer 99,082,905 89,435,771 14.16 99.9 14.30 45
Stoddard .. 293,377,810 304,330,945 15.10 "96.4 14.48 46
Randolph 71,499,816 72,086,669 14.80 101.6 14.50 47
Columbia . 86,095,164 ; 108,213,586 18.92 . 79.5 14.53 48
Madison 486,062,946 601,827,914 18.26 80.9 14.69 49
Atkinson. ; i- 1,004,519,575 1,198,704,778 -, ' - 17.67 83.8 : 14.69 ^ 49
Greenland 864,588,999 9M,307,897 16.40 90.6 14.76 50
Hampton 3,793,066,700 - 4,057,698,779 . 16.01- • 93.9 14.79 . 51
Gilford 2,034,027,240 2,127,633,134 15.86 95.7 15.14 52
North Hampton • 1, '' 1,199,745,350 : . 1,290;053,186 . 16.70 93.0 , ' ' 15.39; " . 53
Littleton 645,224,898 922,401,875 23.10 91.4 15.89 54
Shelburne- - . 78,679,336 72,185,265 ■ 15.44" 110.0 , ■16.04 ' - - 55 'Benton 25,499,534 27,823,571 17.67 94.0 16.10 56
Co'nway 1,747,261,353 " 1,855,949,037 17.32 94.2 . 16.20 57
Ossipee 775,433,608 813,747,945 17.11 95.3 16.20 57
Ellsworth: 13,708:347 „ . > .. 17,392,748 ; • ' . 20.64 . 80.5 ■ - 16.22 . 58'.
Harrisville 206,669,695 .219,299,435 17.40 94.3 16.38 59
Franconia . ' 288,323,046 ' 332,217,273 , 18.98 87.0 16.41 60
Woodstock 231,248,614 303,290,184 21.69 76.7' 16.45 61
Nelson - 124,541>p62 129,804,578 ■17.25 '■ "96.1 16.47 • •62
Hanover 2,286,110,080 2,525,982,954 18.45 90.6 16.68 63
Auburn 863,385,428 . .954,081,692 18.81 ' 92.2 . ■ 16.93, - 64
Carroll 329,433,801 384,957,932 20.00 85.9 17.06 65
Windham .2,404,862,820 3,127,881,124 22;55 76.9 17.24 66
Brookfield 124,312,043 120,021,096 16.70 103.6 17.26 67
South Hampton ' ' 170,647,498 ' . 173,048,136 17.85 . 98.6 17.32 - 68
Stark 76,792.216 •77,949,264 18.07 . 99.6 17.36 69
Hudson - 3,165,897,567 - V ■■'3,610,615,802 ,20.28 87.7 17.49 - 70
Average Level of Assessments (Ratio) Shown in Column 5
www.revenue.nh.gov 2020 Annual Report Of the Department Of Revenue Administration 187

MUNICIPAL AND PROPERTY DIVISION
2019 Comparison of Full Value Tax Rates
Average Level of Assessments (Ratio) Shown in Column 5Ranking Order
'-Municipality'. 2019
• Modified
Local Assessed'
Valuation*
- - • .2bi9>.Total Equalized. Valuation
Including Utilities
and Railroad.
- 2019
Local Tax
■ 1 'Rate
• 2019 ■
Eqiiali- ,zatioh '
Ratio
. full- •
. Value
Tax
Rate*
■
Rank
Salem 4,609,602,481 5,758,775,055 21.98 80.1 17.49 70
New Hampton 334,352,402 361,939,285 19.24 92.7 17.52 71
Candia 513,604,108 537,788,721 18.60 95.5 17.55 72
Northwood 488,223,889 ,616,971,708. 22.52, 79.2 17.55 ' 72
Hooksett 2,069,214,564 2,466,340,975 21.55 83.9 17.64 73
Bedford 4,095,806,840 '4,325,031,946 18.95 94.7 17.72 74
Croydon 91,293,462 99,733,307 19.56 91.5 17.83 75
Strafford 486,299,912 633,104,739 . 23.47 76.8 17.98 76
Laconia 2,286,284,164 2,555,416,889 ' 20.59 90.2 18.06 77
New Durham 417,902,198 , 541,924,712 23.72 77.1 18.21 78
Washington 240,719,059 274,182,746 20.84 87.8 18.25 79
Kensington 1 394,890,436 . 415.210,258 19.46 95.1 18.27 80
Stratham 1,554,473,230 1,576,544,944 18.63 98.6 18.28 81
Nottingharn 632,340,550 766,623,927 22.50 82.5 18.29 82
Deerfield 588,306,891 728,984,215 23.11 80.7 18.34 83
Londonderry ■ 4,670.184,650 ■> 4,816,326,189 ( 19.39 97.7 18.39 84
Dalton 83,139,661 106,232,726 23.86 83.9 18.53 85
Sanbornton 530,893,265 547,089,540 19.22 97.2 18.59 ' 86
Bristol 471,534,473 572,979,062 22.80 82.5 18.65 87
Pelham 1,981,194,460 2,045,901,922 19.40 96.9 18.68 ■ 88:
Nashua 10,454,581,767 11,880,404,376 21.76 88.0 18.69 89
Bath 125,214,976 . .. 140,835,195 ■ 21.40 • 95.0 18.72 90
Loudon 572,045,229 693,320,024 22.98 83.1 18.77 91
Lyman 59,655,524 75,898:375 24.13 78.4 18.86 ' 92
Manchester 9,250,663;613 11,750,583,030 24.32 79.0 18.86 92
Jefferson 129,256,071 149,239,396 . 21.99 87.0 • 18.87 93
Chester 724,050,973 775,987,379 20.80 93.3 18.94 94
Thornton .434,303:432 ' 426,229,460 18.68' 102.0 18.96 .95
Chesterfield 521,216,633 609,693,938 22.32 85.7 19.02 96
Cornish' 197,184,183 200,222,307 19.52 98.7 •• 19.12^ V 97
Lempster 110,335,129 156,269,040 27.31 88.4 19.19 98
Sugar Hill 163,260,383 170,215,201 20.07 95.9 19.20 .99
Litchfield 918,017,317 1,115,576,791 23.65 82.4 19.29 100
Tilton 622,860,167 , 627,480,886 19.61 99.3. 19.31 -101
Danbury 111,391,938 136,681,078 24.00 81.4 19.48 102
Hampton Falls . 488,908,644 - 549,417,101 22.11 89.1 19.48 102
Alexandria 198,167,051 239,230,769 24.04 82.9 19.64 103
Salisbury 151,123,465 174,084,412 ' ; . 23;i4 88.0' 19.77 104
Wentworth 96,958,781 112,853,640 23.22 86.0 19.79 105
Hampstead 1,338,558,889 1,390,644,090 •20.99 96.4 20.04 106.
Springfield 209,877,588 228,723,540 21.99 91.9 20.07 107
Dunbarton 315,735,653 ' 423,324,487 27.21 75.2 20.15 108
Kingston 849,085,329 916,941,662 22.00 92.6 20.18 109
Landaff 50,720,789 56,289,603 22.47 90.2 20.19 110
Average Level of Assessmer\ts (Ratio) S/iown /n Column S
www.revenue.nh.gov 2020 Annual Report Of the Department Of Revenue Administration 188
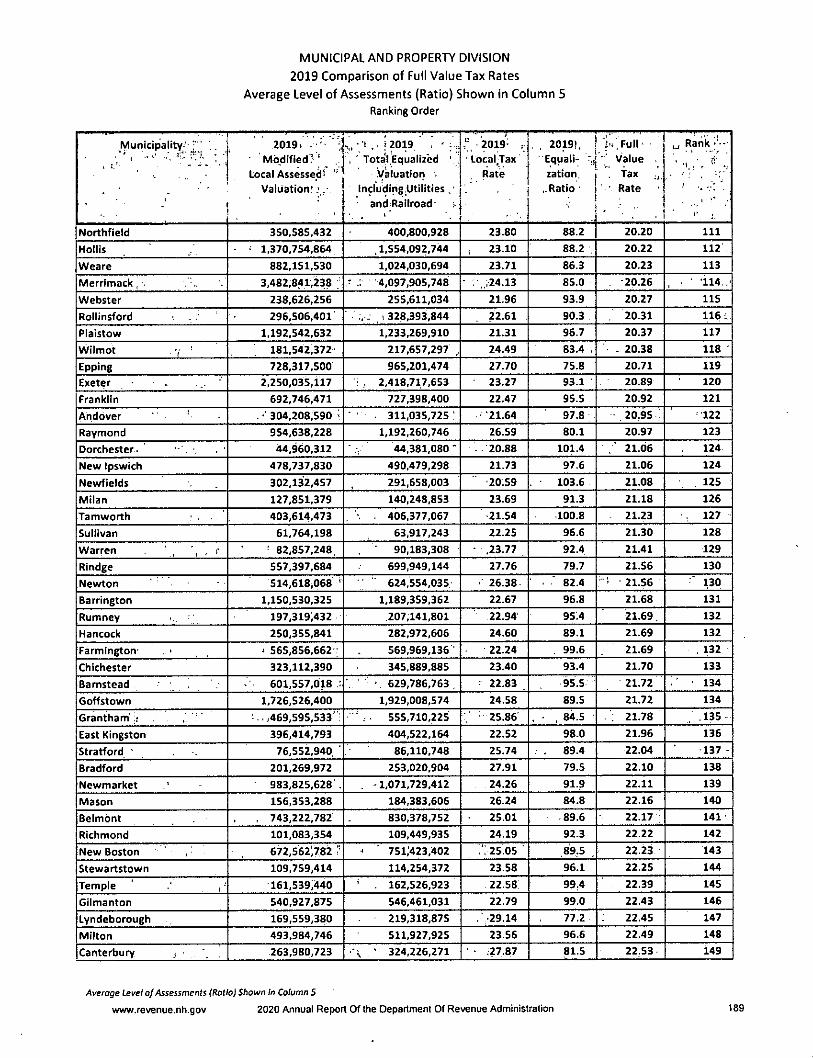
MUNICIPAL AND PROPERTY DIVISION
2019 Comparison of Full Value Tax Rates
Average Level of Assessments (Ratio) Shown in Column 5Ranking Order
Municipality-'- ; "
' '
2019. '
Modified? 'Local Assessed' '*
Valuation!:,'
.. [2019, ! '' Total Equalized '
Valuatiort -
Including Utilities
andRailroad
,'V2019-' LocalTax
Rate
. 2019!,
Equal)-
zation.
..Ratio
k . Full •■' Value .
- Ta*• Rate
'
,j Rank' 1 . .ri;,,
i.
Northfield 350,585,432 400,800,928 23.80 88.2 20.20 Ill
Hollls - ' 1,370,754,864 .1,554,092,744 , 23.10 88.2 20.22 112
Weare 882,151,530 1,024,030,694 23.71 86.3 20.23 113
Merrlmack, - . 3,482,841,238 ,• .: 4,097,905,748 • . , ;24.13 85.0 ■20.26 • '114-'
Webster 238,626,256 255,611,034 21.96 93.9 20.27 115
Rollinsford 296,506,401' . , 328,393,844 22.61 90.3 20.31 1161
Plaistow 1,192,542,632 1,233,269,910 21.31 96.7 20.37 117
Wllmot . 7 181.542i372 217,657,297 24.49 83.4 . - 20.38 118
Epping 728,317,500 965,201,474 27.70 75.8 20.71 119
Exeter 2,250,035,117 • , 2,418,717,653 23.27 93.1 20.89 120
Franklin 692,746,471 727,398,400 22.47 95.5 20.92 121
Andover i • 304,208,590 ^ ' • - 311,035,725 ' '21.64 97.8 20.95 122
Raymond 954,638.228 1,192,260,746 26.59 80.1 20.97 123
Dorchester- 44,960,312 44,381,080" - - 20.88 101.4 ■ 21.06 124
New Ipswich 478,737,830 490,479,298 21.73 97.6 21.06 124
Newfields 302,132,457 291,658,003 •20.59 103.6 21.08 125
Milan 127,851,379 140,248,853 23.69 91.3 21.18 126
Tamworth 403,614,473 . 406,377,067 21.54 100.8 21.23 . 127
Sullivan 61,764,198 63,917,243 22.25 96.6 21.30 128
Warren . r • 82,857,248 90,183,308 • .23.77 92.4 21.41 129
Rindge 557,397,684 699,949,144 27.76 79.7 21.56 130
Newton 514,618,068 ' 624,554,035 • 26.38 82.4 •21.56 130
Barrington 1,150,530,325 1,189,359,362 22.67 96.8 21.68 131
Rumney 197,319;432 207,141,801 22.94 95.4 21.69. 132
Hancock 250,355,841 282,972,606 24.60 89.1 21.69 132
Farmihgton' . • . 565,856,662 : 569,969,136'' 22.24 . 99.6 21.69 , 132
Chichester 323,112,390 345,889,885 23.40 93.4 21.70 133
Barnstead 601,557,018: ' 629,786,763 , 22.83 95.5 21.72 134
Goffstown 1,726,526,400 1,929,008,574 24.58 89.5 21.72 134
Grantharh' 469,595,533' : . 555,710,225 25.86 • , 84.5 ; 21.78 .135
East Kingston 396.414,793 404,522,164 22.52 98.0 21.96 136
Stratford ' 76,552,940 86,110,748 25.74 89.4 22.04 137-
Bradford 201,269,972 253,020,904 27.91 79.5 22.10 138
Newmarket 983,825,628 . . 1,071,729,412 24.26 91.9 22.11 139
Mason 156,353,288 184,383,606 26.24 84.8 22.16 140
Belmont , 743,222,782 830,378,752 25.01 89.6 22.17 141
Richmond 101,083,354 109,449,935 24.19 92.3 22.22 142
New Boston 672,562;782 I' < ' 75i;423,402 25.05 89.5 22.23 143
Stewartstown 109,759,414 114,254,372 23.58 96.1 22.25 144
Temple ' , • 161,539;440 ' . 162,526,923 22.58 99.4 22.39 145
Gilmanton 540,927,875 546,461,031 22.79 99.0 22.43 146
Lyndeborough 169,559,380 219,318,875 . ' -29.14 77.2 22.45 147
Milton 493,984,746 511,927,925 23.56 96.6 22.49 148
Canterbury ^ 263,980,723 s ' 324,226,271 .27.87 81.5 22.53 149
Average Level of Assessments (Ratio) Shown in Column 5
www.revenue.nh.gov 2020 Annual Report Of the Department Of Revenue Administration 189
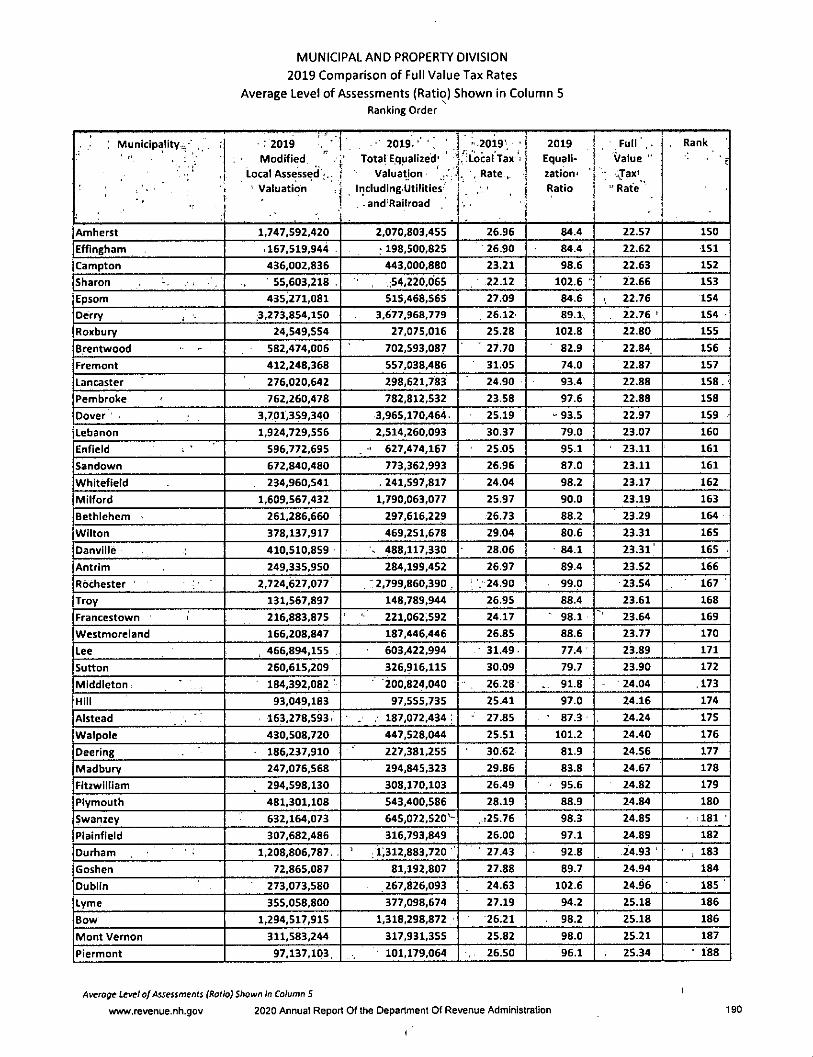
MUNICIPAL AND PROPERTY DIVISION
2019 Comparison of Full Value Tax Rates
Average Level of Assessments (Ratio) Shown in Column 5Ranking Order
; MunlcipalitYiii ' . . : 2019 • 2019.'" ' ' - .2019'. • 2019 Full',. Rank
Modified. Total Equalized' ' '. :Local Tax i Equali Value "
Local Assessed'-.. Valuation . , Rate , zation' • .ijax'
' Valuation Includlng-Utlllties Ratio " Rate
! * r
. .and'Rallroad■
Amherst 1,747,592,420 2,070,803,455 26.96 84.4 22.57 150
Efflngham .167,519,944 . : 198,500,825 26.90 84.4 22.62 151
Campton 436,002,836 443,000,880 23.21 98.6 22.63 152
Sharon , 55,603,218 . , .54,220,065 22.12 102.6 •• 22.66 153
Epsom 435,271,081 515,468,565 27.09 84.6 ^ 22.76 154
Derry , . 3,273,854,150 3,677,968,779 26.12 89.1, 22.76 ' 154
Roxbury 24,549,554 27,075,016 25.28 102.8 22.80 155
Brentwood 582,474,006 702,593,087 27.70 82.9 22.84. 156
Fremont 412,248,368 557,038,486 31.05 74.0 22.87 157
Lancaster 276,020,642 298,621,783 24.90 93.4 22.88 158.
Pembroke ' 762,260,478 782,812,532 23.58 97.6 22.88 158
Dover 3,701,359,340 3.965,170,464. 25.19 - 93.5 22.97 159
Lebanon 1,924,729,556 2,514,260,093 30.37 79.0 23.07 160
Enfield 596,772,695 • 627,474,167 25.05 95.1 23.11 161
Sandown 672,840,480 773,362,993 26.96 87.0 23.11 161
Whitefield 234,960,541 . 241,597,817 24.04 98.2 23.17 162
Milford 1,609,567,432 1,790,063,077 25.97 90.0 23.19 163
Bethlehem ' 261,286,660 297,616,229 26.73 88.2 23.29 164
Wilton 378,137,917 469,251,678 29.04 80.6 23.31 165
Danville 410,510,859 \ 488,117,330 28.06 84.1 23.31' 165
Antrim 249,335,950 284,199,452 26.97 89.4 23.52 166
Rochester ' 2,724.627,077 " 2,799,860,390 . : '. 24.90 99.0 23.54 167
Troy 131,567,897 148,789,944 26.95 88.4 23.61 168
Francestown ' 216,883,875 221,062,592 24.17 ■ 98.1 23.64 169
Westmoreland 166,208,847 187,446,446 26.85 88.6 23.77 170
Lee , 466,894,155 603,422,994 31.49 77.4 23.89 171
Sutton 260,615,209 326,916,115 30.09 79.7 23.90 172
Middleton: 184,392,082 ' 200,824,040 , 26.28 . 91.8 24.04 .173
Hill 93,049,183 97,555,735 25.41 97.0 24.16 174
Alstead 163,278,593. . . 187,072,434 : - 27.85 • 87.3 24.24 175
Walpole 430,508,720 447,528,044 25.51 101.2 24.40 176
Deering 186,237,910 227,381,255 30.62 81.9 24.56 177
Madbury 247,076,568 294,845,323 29.86 83.8 24.67 178
Fit2willlam 294,598,130 308,170,103 26.49 ' 95.6 24.82 179
Plymouth 481,301,108 543,400,586 28.19 88.9 24.84 180
Swanzey 632,164,073 645,072,520"- ,.:25.76 98.3 24.85 • .181 ■
Plainfield 307,682,486 316,793,849 26.00 97.1 24.89 182
Durham 1,208,806,787. . ' ;i;312,883,720 27.43 92.8 24.93 ; 183
Goshen 72,865,087 81,192,807 27.88 89.7 24.94 184
Dublin 273,073,580 267,826,093 24.63 102.6 24.96 185
Lyme 355,058,800 377,098,674 27.19 94.2 25.18 186
Bow 1,294,517,915 1,318,298,872 26;21 . 98.2 25.18 186
Mont Vernon 311,583,244 317,931,355 25.82 98.0 25.21 187
Plermont 97,137,103. 101,179,064 . 26.50 96.1 25.34 ■ 188
Average Level of AssessmerMs (Ratio) Shown In Column S
www.revenue.nh.gov 2020 Annual Report Of the Department Of Revenue Administration 190
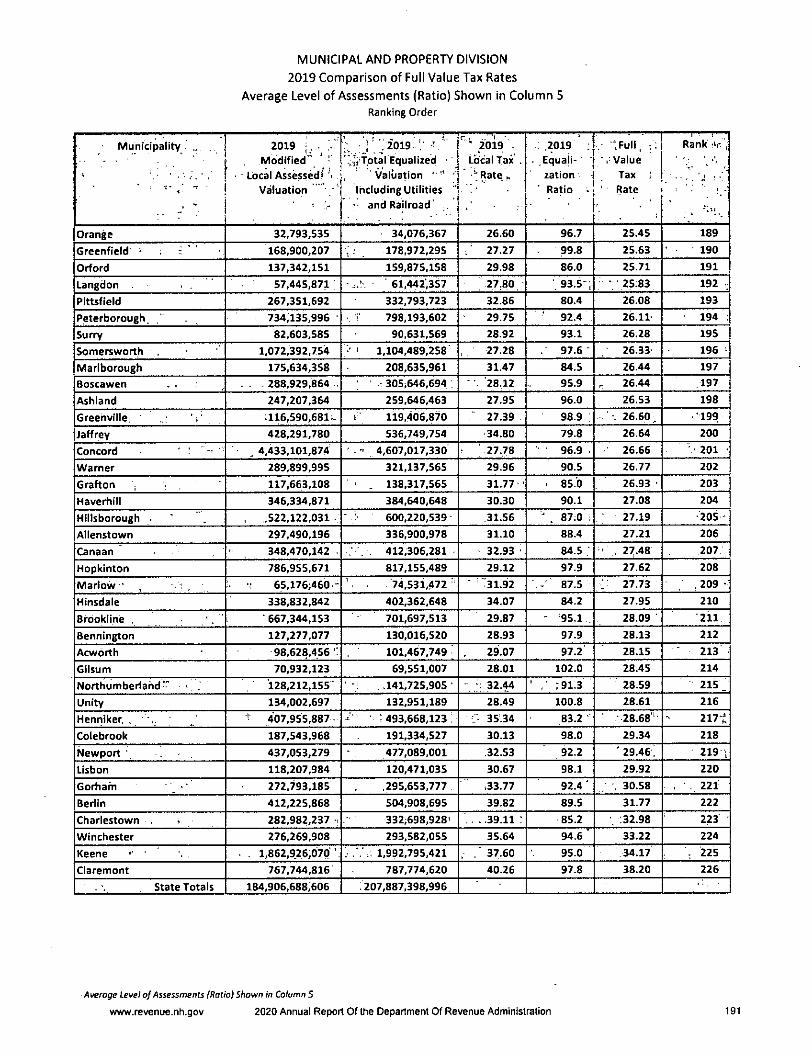
MUNICIPAL AND PROPERTY DIVISION
2019 Comparison of Full Value Tax Rates
Average Level of Assessments (Ratio) Shown in Column SRanking Order
Municipality . 2019 j , . .".rModified"' '
' Local Assessed! '•Valuation
; ̂^2019 : '".[j'Total Equalized •. ' Valuation "" '
Including Utilities■ and Railroad'
C-. . '1■ 2019 -
Local Tax .
' Rate ̂
, .2019
. .Equalization
Ratio •
.■ "tFull ,' Value
Tax
Rate
rr-T—
Rank -ir. ,
t , 1 .
Orange 32.793,535 34,076,367 26.60 96.7 25.45 189
Greenfield ■ 168,900,207 : .1 178,972,295 ; 27.27 99.8 25.63 190
Orford 137,342,151 159,875,158 29.98 86.0 25.71 191
Langdon 57,445,871 61,442,357 27.80 ■. 93.5-, • 25.83 192
Pittsfield 267,351,692 332,793,723 32.86 80.4 26.08 193
Peterborough. 734,135,996 ' 798,193,602 29.75 ■ 92.4 26.11- 194 .
Surry 82,603,585 90,631,569 28.92 93.1 26.28 195
Somersworth 1.072,392,754 ' ' 1,104,489,258 27.28 . 97.6- 26.33 196 -
Marlborough 175,634,358 208,635,961 31.47 84.5 26.44 197
Boscawen .. . . . . 288,929,864 ■ • 305^646,694 28.12 95.9 26.44 197
Ashland 247,207,364 259,646,463 27.95 96.0 26.53 198
Greenville. :116,590,681;~ 1 119,406,870 27.39 98.9 . 26.60 •199
Jaffrey 428,291,780 536,749,754 '34.80 79.8 26.64 200
Concord - : - • ̂ 4,433,101,874 - 4,607,017,330 27.78 ' 96.9 . 26.66 • •201 •
Warner 289,899,995 321,137,565 29.96 90.5 26.77 202
Grafton 117,663,108 • . 138,317,565 31.77 • > 85.0 26.93 • 203
Haverhill 346,334,871 384,640,648 30.30 90.1 27.08 204
Hillsborough • , .522,122,031 600,220,539 .31.56 ^ . 87.0 27.19 205 -
Allenstown 297,490,196 336,900,978 31.10 88.4 27.21 206
Canaan 348,470,142 . 412,306,281 32.93 84.5 : ' . 27.48 207
Hopkinton 786,955,671 817,155,489 29.12 97.9 27.62 208
Marlow • , 65,176;460 - 74,531,472 ' 31.92 87.5 : 27.73 . 209 •
Hinsdale 338,832,842 402,362,648 34.07 84.2 27.95 210
Brookline , •667,344,153 701,697,513 29.87 - 95.1 . 28.09 211
Bennington 127,277,077 130,016,520 28.93 97.9 28.13 212
Acworth 98,628,456': 101,467,749 29.07 97.2 28.15 213
Gllsum 70,932,123 69,551,007 28.01 102.0 28.45 214
Northumberland'" . 128,212,155 ' - ; . . .141,725,905 ' - •: 32.44 ' :9l.3 28.59 215
Unity 134,002,697 132,951,189 28.49 100.8 28.61 216
Henniker, , ' 407,955,887 ; 493,668,123 ; 35.34 83.2 28.68' 217tColebrook 187,543,968 191,334,527 30.13 98.0 29.34 218
Newport ' 437,053,279 477,089,001 .32.53 92.2 ' 29.46\ 219 1Lisbon 118,207,984 120,471,035 30.67 98.1 29.92 220
Gorham 272,793,185 ,295,653,777 ,33.77 92.4' , 30.58 , 221
Berlin 412,225,868 504,908.695 39.82 89.5 31.77 222
Charlestown . • 282,982,237 i 332;698.928< , . . ,39.11 : 85.2 32.98 223
Winchester 276,269,908 293,582,055 35.64 94.6 33.22 224
Keene ' . 1,862,926,070'. .- 1,992,795,421 . 37.60 95.0 34.17 . 225
Claremont 767,744,816 787,774,620 40.26 97.8 38.20 226
State Totals 184,906,688,606 .207,887,398,996
Average Level of Assessments (Ratio) Shown in Column S
www.revenue.nh.gov 2020 Annual Report Of the Department Of Revenue Administration 191