PAPER Special Section on Internet Architectures, Protocols, and Management Methods that Enable...
11
IEICE TRANS. COMMUN., VOL.E96–B, NO.7 JULY 2013 1753 PAPER Special Section on Internet Architectures, Protocols, and Management Methods that Enable Sustainable Development Time Zone Correlation Analysis of Malware/Bot Downloads ∗ Khamphao SISAAT †a) , Student Member, Hiroaki KIKUCHI ††b) , Member, Shunji MATSUO ††† , Nonmember, Masato TERADA †††† , Masashi FUJIWARA †††† , Members, and Surin KITTITORNKUN †c) , Nonmember SUMMARY A botnet attacks any Victim Hosts via the multiple Com- mand and Control (C&C) Servers, which are controlled by a botmaster. This makes it more difficult to detect the botnet attacks and harder to trace the source country of the botmaster due to the lack of the logged data about the attacks. To locate the C&C Servers during malware/bot downloading phase, we have analyzed the source IP addresses of downloads to more than 90 independent Honeypots in Japan in the CCC (Cyber Clean Center) dataset 2010 comprising over 1 million data records and almost 1 thou- sand malware names. Based on GeoIP services, a Time Zone Correlation model has been proposed to determine the correlation coefficient between bot downloads from Japan and other source countries. We found a strong correlation between active malware/bot downloads and time zone of the C&C Servers. As a result, our model confirms that malware/bot down- loads are synchronized with time zone (country) of the corresponding C&C Servers so that the botmaster can be possibly traced. key words: malware, botnet, bot download, time zone correlation, honey- pot 1. Introduction A botnet is a set of malicious software robots running on Compromised Hosts distributed around the globe under the control of the botnet originator, who is known as a “herder” or “botmaster”. The set of Compromised Hosts jointly per- form attacks by identifying vulnerabilities of the target, in- cluding spamming, phishing, key logging, click fraud, iden- tity theft, and DDoS (Distributed Denial of Service). According to a recent report [1], the detection of bot- net traffic is not easy because botnets are evolving from a centralized strategy to a distributed or peer to peer strategy. Moreover, the botnets themselves have been upgraded to be Manuscript received November 7, 2012. Manuscript revised February 23, 2013. † The authors are with the Faculty of Engineering, King Mongkut’s Institute of Technology Ladkrabang, 1 Soi Cha- longkrung1, Chalongkrung Road, Ladkrabang, Bangkok, 10520, Thailand. †† The author is with the Department of Frontier Media Science, School of Interdisciplinary Mathematical Sciences, Meiji Univer- sity, Tokyo, 164-8525 Japan. ††† The author is with the Fujitsu, Ltd., Kawasaki-shi, 211-0041 Japan. †††† The authors are with the Hitachi Incident Response Team (HIRT), Hitachi, Ltd., Kawasaki-shi, 212-8567 Japan. ∗ The primary of this research work has been published in the IPSJ SIG Technical Report Vol.2010-CSEC-51, and the 6th Joint Workshop on Information Security (JWIS2011). a) E-mail: [email protected] b) E-mail: [email protected] c) E-mail: [email protected] DOI: 10.1587/transcom.E96.B.1753 more complicated and advanced. They are highly dynamic in nature, adapting their behavior to evade the most common security defenses [2]. There have been many attempts to analyze botnet traf- fic. Yegneswaran et al. studied botnet control mechanisms in conjunction with host control commands in [3]. Stayer et al. proposed heuristics for detecting botnets based on their flow characteristics such as bandwidth, duration of at- tacks, and packet timings in [4]. Gu et al. developed a system for the automated detection of botnet control chan- nels. This system, known as “BotSniffer”, exploited the spatial–temporal correlation and similarity in network traf- fic [5]. Stone-Gross et al. conducted “active analysis”; i.e., they intercepted communications between C&C Servers and took over the Torpig botnet [6]. Recently, Shin et al. also proposed a bot/malware detection method known as “EF- FORT”, a host-network cooperated detection framework attempting to overcome shortcomings of both approaches without losing their advantages, i.e., effectiveness and effi- ciency in [7]. The first work focusing on time zones of botnet prop- agation is by Dagon et al. in [8], based on a six-month ob- servation of botnets. They proposed a propagation dynam- ics in botnets, which depends on the location of Compro- mised Hosts. Their purpose is to estimate accurately the botnet population growth, while our purpose is to estimate time zone correlation between Compromised Hosts and the Victim Hosts. An alternative method for coping with botnet is “Hon- eypot”. With Honeypots, botnet activities can be traced by the observing malware/bot footprints spreading across the network. Another et al. [9] gave an example of the imple- mentation of a Honeypot that captures useful data about computer attacks in the network. The Honeypot is a de- coy host pretending to be a vulnerable computer that looks attractive to the attackers, i.e., a host dedicated to receiving attacks [10]. In this paper, we investigate time dependency in the CCC dataset 2010 [11], which consists of raw packets cap- tured from more than 90 independent Honeypots over two years. The CCC is the Japanese governmental organiza- tion that observes the backbone of Japanese tier-1 Internet providers. We present a simple but accurate method called Time Zone Correlation for automating the identification of the time difference given unknown traffic (a time series of bot downloads), based on the Time Zone Correlation Coeffi- Copyright c 2013 The Institute of Electronics, Information and Communication Engineers
Transcript of PAPER Special Section on Internet Architectures, Protocols, and Management Methods that Enable...

IEICE TRANS. COMMUN., VOL.E96–B, NO.7 JULY 20131753
PAPER Special Section on Internet Architectures, Protocols, and Management Methods that Enable Sustainable Development
Time Zone Correlation Analysis of Malware/Bot Downloads∗
Khamphao SISAAT†a), Student Member, Hiroaki KIKUCHI††b), Member, Shunji MATSUO†††, Nonmember,Masato TERADA††††, Masashi FUJIWARA††††, Members, and Surin KITTITORNKUN†c), Nonmember
SUMMARY A botnet attacks any Victim Hosts via the multiple Com-mand and Control (C&C) Servers, which are controlled by a botmaster.This makes it more difficult to detect the botnet attacks and harder to tracethe source country of the botmaster due to the lack of the logged data aboutthe attacks. To locate the C&C Servers during malware/bot downloadingphase, we have analyzed the source IP addresses of downloads to morethan 90 independent Honeypots in Japan in the CCC (Cyber Clean Center)dataset 2010 comprising over 1 million data records and almost 1 thou-sand malware names. Based on GeoIP services, a Time Zone Correlationmodel has been proposed to determine the correlation coefficient betweenbot downloads from Japan and other source countries. We found a strongcorrelation between active malware/bot downloads and time zone of theC&C Servers. As a result, our model confirms that malware/bot down-loads are synchronized with time zone (country) of the corresponding C&CServers so that the botmaster can be possibly traced.key words: malware, botnet, bot download, time zone correlation, honey-pot
1. Introduction
A botnet is a set of malicious software robots running onCompromised Hosts distributed around the globe under thecontrol of the botnet originator, who is known as a “herder”or “botmaster”. The set of Compromised Hosts jointly per-form attacks by identifying vulnerabilities of the target, in-cluding spamming, phishing, key logging, click fraud, iden-tity theft, and DDoS (Distributed Denial of Service).
According to a recent report [1], the detection of bot-net traffic is not easy because botnets are evolving from acentralized strategy to a distributed or peer to peer strategy.Moreover, the botnets themselves have been upgraded to be
Manuscript received November 7, 2012.Manuscript revised February 23, 2013.†The authors are with the Faculty of Engineering, King
Mongkut’s Institute of Technology Ladkrabang, 1 Soi Cha-longkrung1, Chalongkrung Road, Ladkrabang, Bangkok, 10520,Thailand.††The author is with the Department of Frontier Media Science,
School of Interdisciplinary Mathematical Sciences, Meiji Univer-sity, Tokyo, 164-8525 Japan.†††The author is with the Fujitsu, Ltd., Kawasaki-shi, 211-0041
Japan.††††The authors are with the Hitachi Incident Response Team
(HIRT), Hitachi, Ltd., Kawasaki-shi, 212-8567 Japan.∗The primary of this research work has been published in the
IPSJ SIG Technical Report Vol.2010-CSEC-51, and the 6th JointWorkshop on Information Security (JWIS2011).
a) E-mail: [email protected]) E-mail: [email protected]) E-mail: [email protected]
DOI: 10.1587/transcom.E96.B.1753
more complicated and advanced. They are highly dynamicin nature, adapting their behavior to evade the most commonsecurity defenses [2].
There have been many attempts to analyze botnet traf-fic. Yegneswaran et al. studied botnet control mechanismsin conjunction with host control commands in [3]. Stayeret al. proposed heuristics for detecting botnets based ontheir flow characteristics such as bandwidth, duration of at-tacks, and packet timings in [4]. Gu et al. developed asystem for the automated detection of botnet control chan-nels. This system, known as “BotSniffer”, exploited thespatial–temporal correlation and similarity in network traf-fic [5]. Stone-Gross et al. conducted “active analysis”; i.e.,they intercepted communications between C&C Servers andtook over the Torpig botnet [6]. Recently, Shin et al. alsoproposed a bot/malware detection method known as “EF-FORT”, a host-network cooperated detection frameworkattempting to overcome shortcomings of both approacheswithout losing their advantages, i.e., effectiveness and effi-ciency in [7].
The first work focusing on time zones of botnet prop-agation is by Dagon et al. in [8], based on a six-month ob-servation of botnets. They proposed a propagation dynam-ics in botnets, which depends on the location of Compro-mised Hosts. Their purpose is to estimate accurately thebotnet population growth, while our purpose is to estimatetime zone correlation between Compromised Hosts and theVictim Hosts.
An alternative method for coping with botnet is “Hon-eypot”. With Honeypots, botnet activities can be traced bythe observing malware/bot footprints spreading across thenetwork. Another et al. [9] gave an example of the imple-mentation of a Honeypot that captures useful data aboutcomputer attacks in the network. The Honeypot is a de-coy host pretending to be a vulnerable computer that looksattractive to the attackers, i.e., a host dedicated to receivingattacks [10].
In this paper, we investigate time dependency in theCCC dataset 2010 [11], which consists of raw packets cap-tured from more than 90 independent Honeypots over twoyears. The CCC is the Japanese governmental organiza-tion that observes the backbone of Japanese tier-1 Internetproviders. We present a simple but accurate method calledTime Zone Correlation for automating the identification ofthe time difference given unknown traffic (a time series ofbot downloads), based on the Time Zone Correlation Coeffi-
Copyright c© 2013 The Institute of Electronics, Information and Communication Engineers
1754IEICE TRANS. COMMUN., VOL.E96–B, NO.7 JULY 2013
Fig. 1 A typical botnet life cycle.
cient relative to the phase shift.The remainder of this paper is organized as follows. In
Sect. 2, we describe the background knowledge including atypical botnet life cycle and the CCC dataset 2010 we usedin our analysis. We introduce our analysis methodology inSect. 3, as well as consider why some malicious activitiesare synchronized with Japanese local time zone, while oth-ers are not. We explain the reason with a hypothesis as wellas validate our model in Sect. 4. After that, provide somediscussions in Sect. 5. Finally, we conclude our paper inSect. 6.
2. Background
2.1 Botnet Life Cycle
A typical botnet can be created and maintained in five phasesincluding: initial infection, secondary injection, connection,malicious command and control, update and maintenance.This life cycle is depicted in Fig. 1 [12].
During the initial infection phase, the attacker scansa target subnet for known vulnerability and infects VictimHosts through different exploitation methods. After initialinfection, in secondary injection phase, the infected hostsexecute a script known as shell-code. The shell-code fetchesthe image of the actual bot binary from the specific locationvia FTP, HTTP, or P2P. The bot binary installs itself on thetarget host. Once the bot program is installed, the VictimHost turns to a “zombie” and runs the malicious code. Thebot application starts automatically each time the zombie isrebooted [13], [14].
In connection phase, the bot program establishes acommand and control (C&C) channel and connects the zom-bie to the C&C Server. Upon the establishment of C&Cchannel, the zombie becomes a part of attacker’s botnetarmy. After the connection phase, the actual botnet C&Cactivities will be started. The botmaster uses the C&C chan-nel to disseminate commands to his bot army. Bot programsreceive and execute commands sent by botmaster. The C&Cchannel enables the botmaster to remotely control the actionof a large number of bots to conduct various illicit activities[14].
The last phase is to maintain and update bots. In thisphase, bots are commanded to download an updated binary.Bot controllers may need to update their botnets for severalreasons. For instance, they may need to update the bot bi-nary to evade detection techniques, or they may intend toadd new functionality to their bot army. Moreover, some-
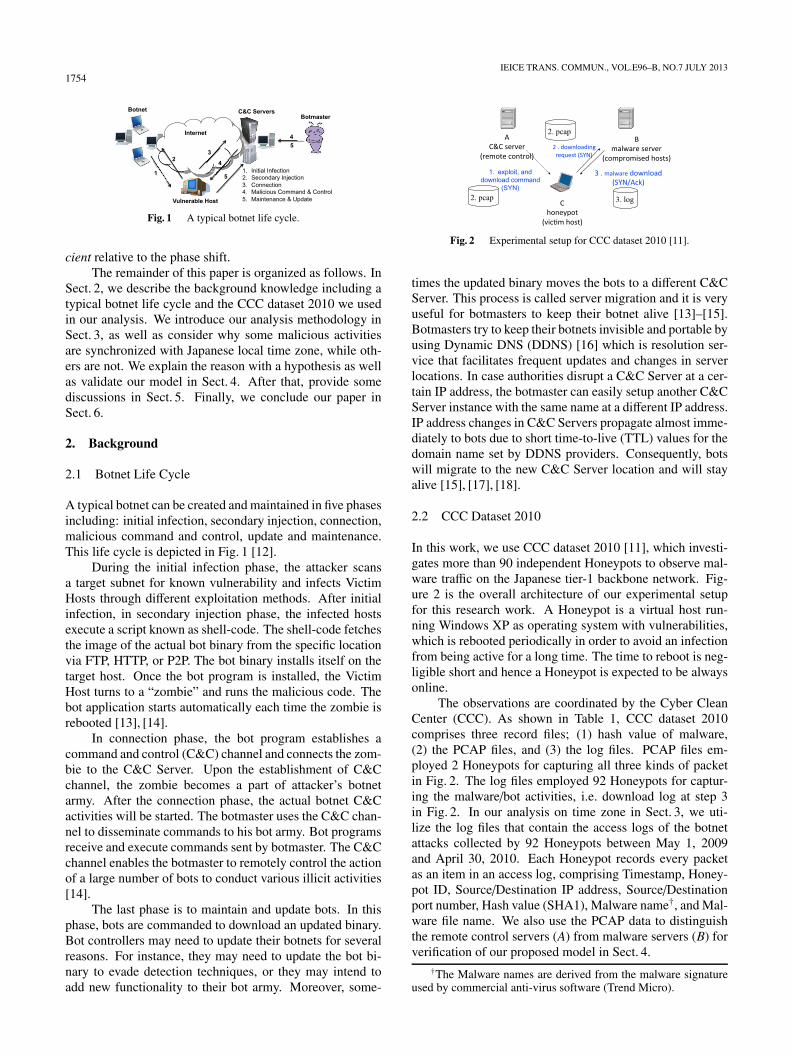
Fig. 2 Experimental setup for CCC dataset 2010 [11].
times the updated binary moves the bots to a different C&CServer. This process is called server migration and it is veryuseful for botmasters to keep their botnet alive [13]–[15].Botmasters try to keep their botnets invisible and portable byusing Dynamic DNS (DDNS) [16] which is resolution ser-vice that facilitates frequent updates and changes in serverlocations. In case authorities disrupt a C&C Server at a cer-tain IP address, the botmaster can easily setup another C&CServer instance with the same name at a different IP address.IP address changes in C&C Servers propagate almost imme-diately to bots due to short time-to-live (TTL) values for thedomain name set by DDNS providers. Consequently, botswill migrate to the new C&C Server location and will stayalive [15], [17], [18].
2.2 CCC Dataset 2010
In this work, we use CCC dataset 2010 [11], which investi-gates more than 90 independent Honeypots to observe mal-ware traffic on the Japanese tier-1 backbone network. Fig-ure 2 is the overall architecture of our experimental setupfor this research work. A Honeypot is a virtual host run-ning Windows XP as operating system with vulnerabilities,which is rebooted periodically in order to avoid an infectionfrom being active for a long time. The time to reboot is neg-ligible short and hence a Honeypot is expected to be alwaysonline.
The observations are coordinated by the Cyber CleanCenter (CCC). As shown in Table 1, CCC dataset 2010comprises three record files; (1) hash value of malware,(2) the PCAP files, and (3) the log files. PCAP files em-ployed 2 Honeypots for capturing all three kinds of packetin Fig. 2. The log files employed 92 Honeypots for captur-ing the malware/bot activities, i.e. download log at step 3in Fig. 2. In our analysis on time zone in Sect. 3, we uti-lize the log files that contain the access logs of the botnetattacks collected by 92 Honeypots between May 1, 2009and April 30, 2010. Each Honeypot records every packetas an item in an access log, comprising Timestamp, Honey-pot ID, Source/Destination IP address, Source/Destinationport number, Hash value (SHA1), Malware name†, and Mal-ware file name. We also use the PCAP data to distinguishthe remote control servers (A) from malware servers (B) forverification of our proposed model in Sect. 4.
†The Malware names are derived from the malware signatureused by commercial anti-virus software (Trend Micro).

SISAAT et al.: TIME ZONE CORRELATION ANALYSIS OF MALWARE/BOT DOWNLOADS1755
Table 1 CCC dataset 2010 and our analysis.
CCC dataset # of honeypots Our analysis Section1. Hash value of malware N/A N/A N/A2. Packet capture (PCAP) 2 SYN packet analysis 4
(Tables 7, 8 and Figs. 6, 7)3. Download log data 92 Time Zone Correlation (Figs. 4, 5) 3
Table 2 Summary of logged data in CCC dataset 2010.
Details AmountNumber of records 1,162,093
(including unknown malware)Based on TCP 1,053,977Based on UDP 108,116IP addresses 176,522Hash values 29,858
Malware names 978(excluding unknown malware)
Table 3 Top 5 malware names of UNKNOWN malware in CCC dataset2010.
Malware name Update # of downloadsWORM PALEVO.AZ 2009-11-10 7,979WORM KOLAB.CV 2009-06-22 4,433
WORM KOLABC.ET 2009-06-02 3,308BKDR VANBOT.RG 2009-08-01 3,219
WORM PALEVO.SMJF 2011-02-24 2,896
Table 4 Sample of logged data in CCC dataset 2010.
Logged items ExampleTimestamp 2010-03-05 03:02:41
Source IP address *.*.166.195Source port No. 1028
Destination IP address *.*.243.167Destination port No. 5824
TCP or UDP TCPHash value (SHA1) ***bc3c8***
Malware name WORM DOWNAD.ADFile name C:/WINDOWS/system32/dhnlr.dll
Table 2 indicates the summary of logged data in CCCdataset 2010. The number of records includes 122,149 ofUNKNOWN† malware attacks; based on TCP of 120,093and UDP of 2,056.
Based on our analysis, we found 3,000 unique hashvalues in overall UNKNOWN malware. However, in ourdataset contains very small number of downloads for eachunique hash value compare to the number of downloads forsome malware names that will be explained in later sectionin our paper. We have listed up top 5 unique hash valuesof UNKNOWN malware and used VirusTotal†† to checkwhether or not they are already classified. Table 3 indicatesall top 5 unique UNKNOWN malware have been classifiedwith the date of their update.
Table 4 shows the sample logged items. Based onthese logged information about malware/botnet activities,we can explore and discover the time zone correlation be-tween Compromised Hosts and the Victim Hosts. Finally,we can identify the countries of origin of the C&C Servers
that control Compromised Hosts to perform botnet attacksto Japan.
3. Analysis Methodology
One of the difficulties encountered while analyzing botnetsis that most Compromised Hosts are controlled by a re-mote command server, which can be located anywhere inthe world. To address this problem, we focus on analyzingthe drift of bot download frequencies over some period oftime in order to locate the source IP address/country . Mostcompromised computers have low security levels and theyare typically for personal use, so they are assumed not torun continuously. Malware/Bot download activities can beregulated according to the active time of the CompromisedHosts, which will vary with a particular distribution. Forexample, activities might increase in the evening until 9 pmor 10 pm and decrease in the early morning until 4 am or5 am in local time of a particular country. Thus, observingchanges in download frequency may allow us to predict thetime zone of the server.
3.1 Malware/Bot Downloads in Japanese Local Time
A botnet can use millions of compromised computers to per-form malicious activities. Contemporary botnets producea malware infection in their target victim using a series ofcomplicated steps. Figure 2 illustrates a simplified proce-dure of malware/bot downloads from Compromised HostsB to Victim Hosts (Honeypots) C. The Victim Hosts Care initially infected and forced to download malware (sec-ondary injection) from the Compromised Hosts B. We callthese steps of delivering malware from several Compro-mised Hosts to the Victim Hosts as bot downloads. Thebotmaster finally uses the command and control server orC&C Servers (A), to control all Compromised Hosts (B).
Standard personal computers are typically under bot-net control because they are less concerned with securityand they are easily compromised. Thus, malicious activitiesdepend on the hourly usage time of these personal comput-ers. For example, the Internet usage reaches its peak around10 pm, according to a survey in [19]. Therefore, there maybe a correlation between malicious activities and the hourswhen legitimate activities are conducted.
†UNKNOWN is a label indicating that the anti-virus softwarefails to identify the given malware when the signature has not beenupdated in its database.††VirusTotal is a free service that analyzes suspicious files and
URLs and facilitates the quick detection of viruses, worms, trojans,and all kinds of malware. https://www.virustotal.com/en/.

1756IEICE TRANS. COMMUN., VOL.E96–B, NO.7 JULY 2013
Fig. 3 Daily Internet Utilization (%) [19] vs. number of malware/botDownloads (%) per hour observed in the CCC dataset 2010 [11].
As plotted in Fig. 3, the number of malware/bot down-loads labeled as Downloads (%) is highly correlated withthe normal Internet daily Utilization (%). It can be observedthat both quantities increase in the evening with a peek at10 pm and decrease until 4-5 am. This strong correlation isobvious because most compromised computers are switchedoff at night and malware/bot downloads are ignored duringthis period of time.
We have verified the correlation between daily Inter-net utilization and malware/bot downloads by computing thecorrelation coefficient.
Let xt be the normal daily Internet utilization, yt be thenumber of malware/bot downloads in CCC dataset 2010, attime t, the time in hour from 0 to 23. The Correlation Coef-ficient between them is given by:
Rx,y=
∑23t=0 xtyt−∑23
t=0 xt∑23
t=0 yt√(∑23t=0 x2
t −(∑23
t=0 xt)2)(∑23
t=0 y2t −(∑23
t=0 yt)2) =0.900
It can be seen that the correlation coefficient betweendaily Internet utilization and malware/bot downloads is ashigh as 0.900 which confirms that malware/bot downloadscorrespond to normal daily Internet utilization.
3.2 Time Zone Correlation Model
We can investigate the geographic information of the sourceIP addresses in the CCC dataset 2010. To identify the sourcecountry of a given IP address, we use a GeoIP Databases[20], a commercial GeoIP service that provides informationincluding country code, city name, latitude, and longitudeinformation for IP addresses worldwide.
However, the variation in the number of bot downloadsfrom different countries is too large to compare. Therefore,the number of downloads should be normalized as follows:
Definition 1: Let the download frequency di(t) be a numberof bot downloads from country i within hour t. LetDi and d̄i denote the total and average frequency fromcountry i, respectively; where Di =
∑23t=0 di(t), and d̄i =
Table 5 Statistics of malware/bot downloads in each group and the TimeZone correlation coefficients between different countries (i) and Japan ( j),S i, j in Eq. (2).
Total # ofGroup Country i unique IPs downloads S i, j
Canada 256 293,693 0.993USA 1,145 127,052 0.816
J Ukraine 180 51,560 0.959Serbia 7 4,948 0.450India 1,212 4,806 0.785Brazil 345 353 -0.429Italy 433 445 -0.073
L New Zealand 282 1,314 0.058Poland 338 347 0.008
Romania 537 580 0.219
Di/24. Therefore, the Normalized download frequencyfrom country i in hour t is:
d′i (t) =di(t)Di. (1)
Definition 2: Let S i, j be the Time Zone Correlation Coeffi-cient between downloads from countries i and j, whichis defined as:
Si, j=
∑23t=0
(di(t) − d̄i
)(dj(t) − d̄ j
)√∑23
t=0 (di(t) − d̄i)2√∑23
t=0 (dj(t) − d̄ j)2. (2)
Our manual analysis shows that the source countriescould be clearly classified† into two groups:
1. Group J: countries where bot downloads are synchro-nized with Japanese local time zone; e.g., Canada,USA, Ukraine, Serbia, and India.
2. Group L: countries where bot downloads are NOT syn-chronized with Japanese local time zone; e.g., Brazil,Italy, New Zealand, Poland, and Romania.
Table 5 shows the total bot downloads and the TimeZone Correlation Coefficients between different countries(i) and Japan ( j), in Eq. (2) for each group. It can be no-ticed that downloads from Group J countries are highly cor-related with Japan (S i, j are close to 1.0), whereas there is noclear correlation between Group L and Japan. For example,Poland is uncorrelated (S Poland,Japan = 0.008) while Braziland Italy are negatively correlated with Japan.
Similar to the Time Zone correlation, Figs. 4(a) showsthe normalized frequencies of bot downloads for Groups J.The bot download behavior from countries in Group J isalmost identical to that from Japan, with the minimas andmaximas at 5 am and 10 pm, respectively. Although, thetime difference between Japan and USA is 16 hours, botdownloads from USA are very similar to Japan for somereasons. We will discuss these reasons shortly. In contrast toGroup J, Group L countries have a totally different behavior
†The classification of countries are based on a subjective eval-uation looking at distributions of bot downloads frequencies. Itwill be automated with a particular threshold value in a procedureintroduced in Sect. 3.3.

SISAAT et al.: TIME ZONE CORRELATION ANALYSIS OF MALWARE/BOT DOWNLOADS1757
Fig. 4 Normalized download frequency d′i (t) in Eq. (1) from country i in (a) Group J and (b) shiftedone, d′i (t − p), in Group L.
Fig. 5 Shifted Time Zone Correlation Coefficients, S i, j(p) in Eq. (3) vs. phase shift p (hours) fromcountry i in (a) Group J and (b) Group L and j=Japan.
compared with that of Group J. After considering these timedifferences, we show the normalized frequency as d′i (t − p)shifted by p hours at local time t of country i in Fig. 4(b).Clearly, the compromised computers in Group L performedtheir bot downloads according to their local time zones.
3.3 Identifying the Optimal Phase Shift of Downloads
The frequencies of malicious activities are time series withlocal time dependency. If a Compromised Host B is con-trolled by a foreign site with a significant time difference,their activities will depend on the remote time zone ratherthan the local time zone of the Compromised Host. Hence,the active time slot of bot downloads can reveal the true lo-cation of a target IP address, which may be consistent withGeoIP location databases. To identify the most possible timezone for a given frequency distribution, we present the fol-lowing method.
By treating the frequency as a wave, we can formalizethe difference using a phase shift p. Thus, we aim to de-termine the optimal phase shift given an unknown time se-ries of bot downloads using a shifted Time Zone Correlationmodel.
Definition 3: Based on Eq. (2), let the shifted Time ZoneCorrelation Coefficient, S i, j(p), be a function of phaseshift p ranging 0, . . . , 23 is
Si, j(p)=
∑23t=0
(di(t − p) − d̄i
)(dj(t − p) − d̄ j
)√∑23
t=0 (di(t − p) − d̄i)2√∑23
t=0 (dj(t − p) − d̄ j)2. (3)
The waves of S i, j(p) reveal the optimal phase shift p∗ asshown in Fig. 5(a) for Group J. We find that all S i, j(p) ofGroup J countries exhibit coherent waves. On the contrary,the countries in Group L exhibit distinct waves, as shown inFig. 5(b), in which we can easily identify the optimal phasep∗ where S i, j(p) is maximized when
p∗ = arg max S i, j(p∗).
This scheme allows us to automatically identify thepossible source country from which malicious activities areemanated with high accuracy. Table 6 shows the optimalphase shift p∗ for both groups. The optimal shift p∗ of GroupJ is almost equal to 0 or within ±3 hours relative to Japanesetime zone. The optimal phase shift p∗ in Group J are quite
1758IEICE TRANS. COMMUN., VOL.E96–B, NO.7 JULY 2013
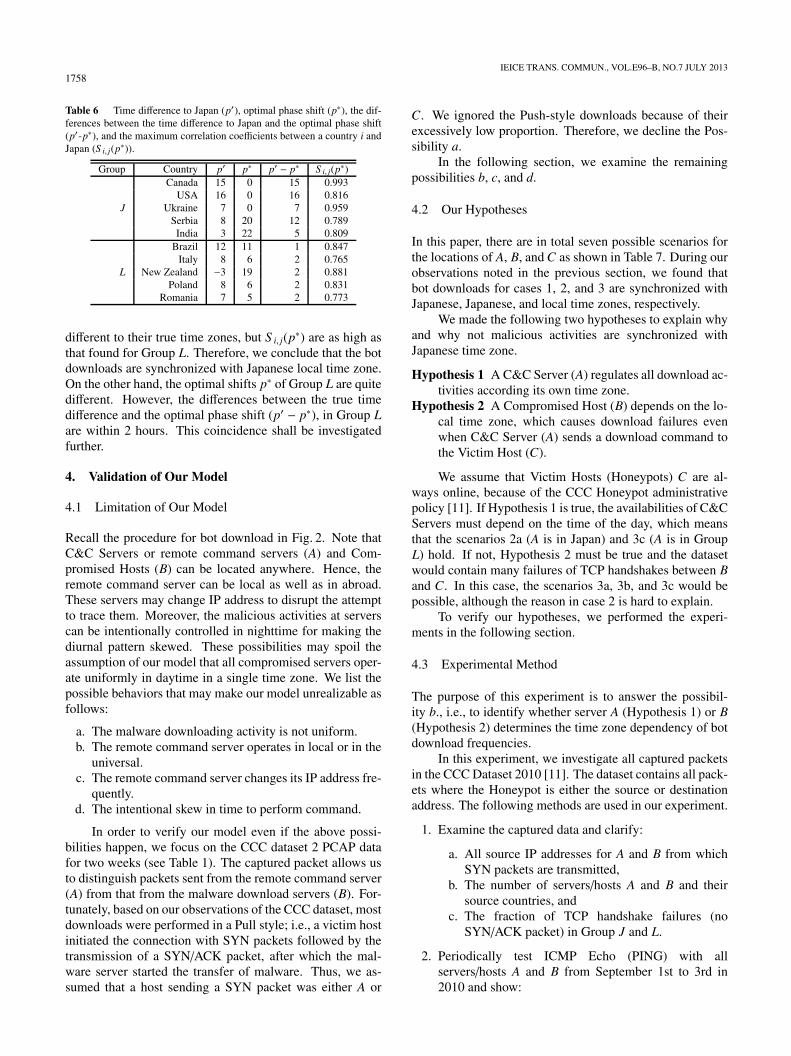
Table 6 Time difference to Japan (p′), optimal phase shift (p∗), the dif-ferences between the time difference to Japan and the optimal phase shift(p′-p∗), and the maximum correlation coefficients between a country i andJapan (S i, j(p∗)).
Group Country p′ p∗ p′ − p∗ S i, j(p∗)Canada 15 0 15 0.993
USA 16 0 16 0.816J Ukraine 7 0 7 0.959
Serbia 8 20 12 0.789India 3 22 5 0.809
Brazil 12 11 1 0.847Italy 8 6 2 0.765
L New Zealand −3 19 2 0.881Poland 8 6 2 0.831
Romania 7 5 2 0.773
different to their true time zones, but S i, j(p∗) are as high asthat found for Group L. Therefore, we conclude that the botdownloads are synchronized with Japanese local time zone.On the other hand, the optimal shifts p∗ of Group L are quitedifferent. However, the differences between the true timedifference and the optimal phase shift (p′ − p∗), in Group Lare within 2 hours. This coincidence shall be investigatedfurther.
4. Validation of Our Model
4.1 Limitation of Our Model
Recall the procedure for bot download in Fig. 2. Note thatC&C Servers or remote command servers (A) and Com-promised Hosts (B) can be located anywhere. Hence, theremote command server can be local as well as in abroad.These servers may change IP address to disrupt the attemptto trace them. Moreover, the malicious activities at serverscan be intentionally controlled in nighttime for making thediurnal pattern skewed. These possibilities may spoil theassumption of our model that all compromised servers oper-ate uniformly in daytime in a single time zone. We list thepossible behaviors that may make our model unrealizable asfollows:
a. The malware downloading activity is not uniform.b. The remote command server operates in local or in the
universal.c. The remote command server changes its IP address fre-
quently.d. The intentional skew in time to perform command.
In order to verify our model even if the above possi-bilities happen, we focus on the CCC dataset 2 PCAP datafor two weeks (see Table 1). The captured packet allows usto distinguish packets sent from the remote command server(A) from that from the malware download servers (B). For-tunately, based on our observations of the CCC dataset, mostdownloads were performed in a Pull style; i.e., a victim hostinitiated the connection with SYN packets followed by thetransmission of a SYN/ACK packet, after which the mal-ware server started the transfer of malware. Thus, we as-sumed that a host sending a SYN packet was either A or
C. We ignored the Push-style downloads because of theirexcessively low proportion. Therefore, we decline the Pos-sibility a.
In the following section, we examine the remainingpossibilities b, c, and d.
4.2 Our Hypotheses
In this paper, there are in total seven possible scenarios forthe locations of A, B, and C as shown in Table 7. During ourobservations noted in the previous section, we found thatbot downloads for cases 1, 2, and 3 are synchronized withJapanese, Japanese, and local time zones, respectively.
We made the following two hypotheses to explain whyand why not malicious activities are synchronized withJapanese time zone.
Hypothesis 1 A C&C Server (A) regulates all download ac-tivities according its own time zone.
Hypothesis 2 A Compromised Host (B) depends on the lo-cal time zone, which causes download failures evenwhen C&C Server (A) sends a download command tothe Victim Host (C).
We assume that Victim Hosts (Honeypots) C are al-ways online, because of the CCC Honeypot administrativepolicy [11]. If Hypothesis 1 is true, the availabilities of C&CServers must depend on the time of the day, which meansthat the scenarios 2a (A is in Japan) and 3c (A is in GroupL) hold. If not, Hypothesis 2 must be true and the datasetwould contain many failures of TCP handshakes between Band C. In this case, the scenarios 3a, 3b, and 3c would bepossible, although the reason in case 2 is hard to explain.
To verify our hypotheses, we performed the experi-ments in the following section.
4.3 Experimental Method
The purpose of this experiment is to answer the possibil-ity b., i.e., to identify whether server A (Hypothesis 1) or B(Hypothesis 2) determines the time zone dependency of botdownload frequencies.
In this experiment, we investigate all captured packetsin the CCC Dataset 2010 [11]. The dataset contains all pack-ets where the Honeypot is either the source or destinationaddress. The following methods are used in our experiment.
1. Examine the captured data and clarify:
a. All source IP addresses for A and B from whichSYN packets are transmitted,
b. The number of servers/hosts A and B and theirsource countries, and
c. The fraction of TCP handshake failures (noSYN/ACK packet) in Group J and L.
2. Periodically test ICMP Echo (PING) with allservers/hosts A and B from September 1st to 3rd in2010 and show:

SISAAT et al.: TIME ZONE CORRELATION ANALYSIS OF MALWARE/BOT DOWNLOADS1759
Table 7 Possible bot download scenarios.
Case C&C Server (A) Compromised Host (B) Victim Host (C) Synchronized Time zone1 * Japan Japan Japan
2a Japan Group J Japan2b Group J Group J Japan Japan2c Group L Group J Japan3a Japan Group L Japan3b Group J Group L Japan local3c Group L Group L Japan
Table 8 Ranking of the unique IP addresses in each group.
C&C Server (A) Compromised Host (B)Group Rank Country code (Country) Unique IPs Rank Country code (Country) Unique IPs
1 JP (Japan) 228 1 JP (Japan) 494 US (USA) 89 3 US (USA) 9
J 8 IN (India) 34 9 UA (Ukraine) 317 CA (Canada) 11 13 IN (India) 222 UA (Ukraine) 9 19 CA (Canada) 16 BR (Brazil) 51 6 RO (Romania) 6
L 9 RO (Romania) 29 10 PL (Poland) 310 IT (Italy) 28 13 BR (Brazil) 212 PL (Poland) 20 19 IT (Italy) 1
Table 9 Source IP addresses from which SYN packets are sent with no SYN/ACK packets (failure).
Time slot IP FQDN Country code (Country)1 67.43.236.xx N/A LB (Lebanon)3 123.205.232.xx xxx.dynamic.seed.net.tw. TW (Taiwan)6 69.64.147.xxx ash.parking.local. US (USA)7 69.64.147.xxx ash.parking.local. US (USA)
10 122.18.181.xxx xxx.tokyo.ocn.ne.jp. JP (Japan)11 41.97.253.xxx N/A DZ (Algeria)16 122.18.181.xxx xxx.tokyo.ocn.ne.jp. JP (Japan)27 189.84.197.xxx xxx.projesom.com.br. BR (Brazil)27 5.160.60.xxx N/A ? (?)29 130.22.1.xx N/A US (USA)57 124.86.121.xx xxx.kanagawa.ocn.ne.jp. JP (Japan)58 124.86.121.xx xxx.kanagawa.ocn.ne.jp. JP (Japan)80 218.232.43.xxx Nothing KR (Korea)89 66.2.3.x xxx.algx.net. US (USA)89 77.28.192.xx N/A MK (Macedonia)89 89.106.98.xx xxx.optilinkbg.com. BG (Bulgaria)
118 39.99.169.xxx N/A US (USA)
a. The availability per day for all servers/hosts A andB,
b. The availability per day for servers/hosts A and Bin Group J, and
c. The availability per day for servers/hosts A and Bin Group L.
4.4 Result of Classification
We extracted 1,164 unique IP addresses and malware namesfrom the captured data in the CCC dataset 2010. Table 8shows the top unique IP addresses and the correspondingcountries for C&C Servers (A) and compromised hosts (B).The most frequent countries are Japan, USA, and Brazil.
Table 8 states that the source address sent from the topcountry are limited within only 228 addresses, which im-plies that the remote command servers do not change their
IP addresses so often. Hence, the possibility c can be re-jected.
We found 39 addresses that failed the TCP hand-shake with SYN, but no SYN/ACK packet is found in thecaptured data. These failure addresses are listed in Ta-ble 9. Most FQDNs (Fully Qualified Domain Name) areassociated with consumer Internet service providers, e.g.,ocn.ne.jp, seed.net.tw. This indicated that personalhosts are compromised for exploitation by a botnet and veryfew of them are located in Group L countries.
4.5 Results of ICMP Echo Tests
We perform a PING (ICMP echo) test for 1,164 unique IPaddresses and show the number of online (with reply) hostsover three days in Fig. 6. As a representative of Group Jand Group L, the distributions of online servers in USA and

1760IEICE TRANS. COMMUN., VOL.E96–B, NO.7 JULY 2013
Italy are illustrated in Figs. 7(a) and (b), respectively. Theservers in group J are quite stable all of the days. Thus, weestimate that always-on servers are in Group J. Group Lshows fluctuating number of online hosts.
From the results, we can see that the number of onlineservers/hosts is stable in Group J; i.e., most of the Compro-mised Hosts B are always on. Our Honeypots C are alsoalways on. Thus, the time dependency must be due to C&CServers A, i.e., the Compromised Hosts in Group J are con-trolled by a large number of C&C Servers in Japan. Ac-
Fig. 6 Distribution of total online C&C Servers and Compromised Hostsinvolved in the first three days of bot downloads/activities.
Fig. 7 Distribution of online C&C Servers and Compromised Hosts involved in the first three days ofbot downloads/activities in (a) USA (Group J), and (b) Italy (Group L).
Table 10 Top ten downloaded malware names in CCC dataset 2010.
Malware name # of downloads Unique IPs Source countries GroupPE VIRUT.AV 194,557 37,481 Japan J
BKDR VANBOT.RG 83,757 6,851 Japan and Canada JWORM AUTORUN.CZU 46,313 1 Canada J
WORM RBOT.SMA 36,171 26,160 Japan JTROJ BUZUS.BEZ 32,172 2,230 Japan, USA, and Ukraine J
WORM KOLABC.ET 31,967 2,119 Japan and Canada JBKDR RBOT.ASA 31,404 23,744 Japan J
BKDR NEPOE.CW 30,118 1,474 Japan and Canada JWORM KOLAB.EA 28,909 4 Ukraine and USA JWORM KOLAB.CV 28,586 2 Japan and Canada J
cording to the unstable behavior of Group L, the time de-pendency in Group L must be due to their own local C&CServers. Thus, we can conclude that
2a. A in Japan, B in Group J and3c. A in Group L, B in Group L
Therefore, Hypothesis 1 is verified and the possibility b isnow clear.
4.6 Dynamic IP Address
As we mentioned before in Sect. 2.1, C&C Servers as wellas Compromised Hosts often change their IP address usingseveral methodologies. So that they can stay alive.
In this context, we analyze top 10 unique malwarenames in our CCC dataset 2010 as indicated in Table 10.It can be seen that most of malware names contain manyunique IP addresses.
In order to verify whether or not our model is stillvalid even though the C&C Servers and Compromised Hostschange their IP address, we find the corresponding sourcecountries of those servers and then map them into somegroup in our model. We found that most of malware’s sourcecountries belong to the same group. This confirms that dy-namic IP address is not significant to our model.
While we investigate the analysis, we found that mal-
SISAAT et al.: TIME ZONE CORRELATION ANALYSIS OF MALWARE/BOT DOWNLOADS1761
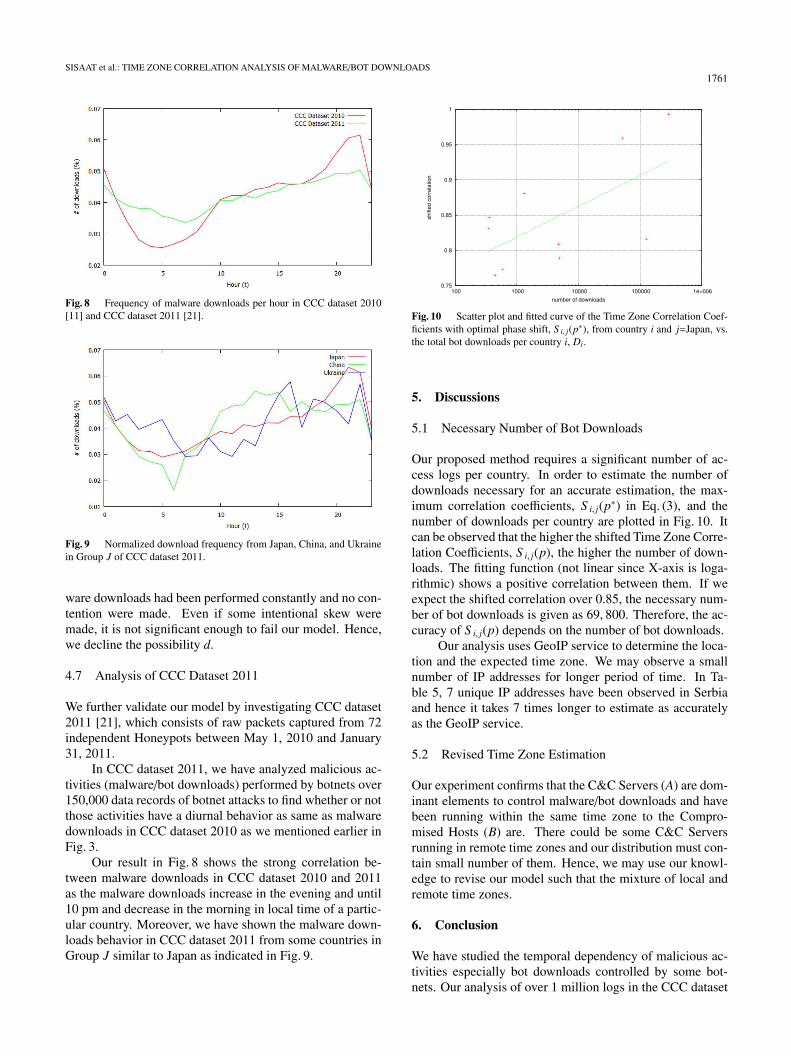
Fig. 8 Frequency of malware downloads per hour in CCC dataset 2010[11] and CCC dataset 2011 [21].
Fig. 9 Normalized download frequency from Japan, China, and Ukrainein Group J of CCC dataset 2011.
ware downloads had been performed constantly and no con-tention were made. Even if some intentional skew weremade, it is not significant enough to fail our model. Hence,we decline the possibility d.
4.7 Analysis of CCC Dataset 2011
We further validate our model by investigating CCC dataset2011 [21], which consists of raw packets captured from 72independent Honeypots between May 1, 2010 and January31, 2011.
In CCC dataset 2011, we have analyzed malicious ac-tivities (malware/bot downloads) performed by botnets over150,000 data records of botnet attacks to find whether or notthose activities have a diurnal behavior as same as malwaredownloads in CCC dataset 2010 as we mentioned earlier inFig. 3.
Our result in Fig. 8 shows the strong correlation be-tween malware downloads in CCC dataset 2010 and 2011as the malware downloads increase in the evening and until10 pm and decrease in the morning in local time of a partic-ular country. Moreover, we have shown the malware down-loads behavior in CCC dataset 2011 from some countries inGroup J similar to Japan as indicated in Fig. 9.
Fig. 10 Scatter plot and fitted curve of the Time Zone Correlation Coef-ficients with optimal phase shift, S i, j(p∗), from country i and j=Japan, vs.the total bot downloads per country i, Di.
5. Discussions
5.1 Necessary Number of Bot Downloads
Our proposed method requires a significant number of ac-cess logs per country. In order to estimate the number ofdownloads necessary for an accurate estimation, the max-imum correlation coefficients, S i, j(p∗) in Eq. (3), and thenumber of downloads per country are plotted in Fig. 10. Itcan be observed that the higher the shifted Time Zone Corre-lation Coefficients, S i, j(p), the higher the number of down-loads. The fitting function (not linear since X-axis is loga-rithmic) shows a positive correlation between them. If weexpect the shifted correlation over 0.85, the necessary num-ber of bot downloads is given as 69, 800. Therefore, the ac-curacy of S i, j(p) depends on the number of bot downloads.
Our analysis uses GeoIP service to determine the loca-tion and the expected time zone. We may observe a smallnumber of IP addresses for longer period of time. In Ta-ble 5, 7 unique IP addresses have been observed in Serbiaand hence it takes 7 times longer to estimate as accuratelyas the GeoIP service.
5.2 Revised Time Zone Estimation
Our experiment confirms that the C&C Servers (A) are dom-inant elements to control malware/bot downloads and havebeen running within the same time zone to the Compro-mised Hosts (B) are. There could be some C&C Serversrunning in remote time zones and our distribution must con-tain small number of them. Hence, we may use our knowl-edge to revise our model such that the mixture of local andremote time zones.
6. Conclusion
We have studied the temporal dependency of malicious ac-tivities especially bot downloads controlled by some bot-nets. Our analysis of over 1 million logs in the CCC dataset

1762IEICE TRANS. COMMUN., VOL.E96–B, NO.7 JULY 2013
2010 shows that more than 90 independent Honeypots areinfected and forced to download malware/bots with a va-riety of common behaviors. We make the hypotheses toexplain why and why not these activities are synchronizedwith Japanese local time and do some experiments to verifyour hypotheses. Based on GeoIP services and the proposedTime Zone Correlation Coefficient relative to the phase shift,we can successfully identify the country of origin of C&CServers A that controlled Victim Hosts C, given an un-known time series of bot downloads with high accuracy.The results of our experiments reveal that CompromisedHosts are located in two country groups: Group J wheredownloads are synchronized with C&C Servers located inJapan, and Group L where downloads are synchronized withGroup L local C&C Servers time zones. Additional experi-ments show that the temporal dependency is due to the C&CServers sending commands to Victim Hosts, rather than bythe Compromised Hosts.
Our future studies include the tracking of processesperformed by the botnet, distinguishing the botnet protocols,and a countermeasure for detecting and avoiding botnet at-tacks.
Acknowledgments
This research is supported by JICA AUN/SEED-Net underCollaborative Research (CR) Grant 2011–2012.
We thank Dr. Anirban Basu, Tokai University for hissuggestions on English expression in our paper.
References
[1] M. Fujiwara, M. Terada, T. Abe, and H. Kikuchi, “Malware analysisand classifications,” IPSJ Technical Report, pp.177–182, 2008.
[2] CISCO White Paper, “Botnet: The new threat landscape,” http://www.cisco.com/en/US/solutions/collateral/ns340/ns394/ns171/ns441/networking solutions whitepaper0900aecd8072a537.html,accessed Oct. 10, 2012.
[3] P. Barford and V. Yegneswaran, “An inside look at botnets,” Ad-vances in Information Security, 2006.
[4] W.T. Strayer, R. Walsh, C. Livadas, and D. Lapsley, “Detecting bot-nets with tight command and control,” Advances in Information Se-curity, pp.195–202, 2006.
[5] G. Gu, J. Zhang, and W. Lee, “BotSniffer: Detecting botnet com-mand and control channels in network traffic,” 15th Annual Networkand Distributed System (NDSS’08), 2008.
[6] B. Stone-Gross, M. Cova, L. Cavallaro, R. Gilbert, M. Szydlowski,R. Kemmerer, C. Kruegel, and G. Vigna, “Your botnet is my botnet:Analysis of a botnet takeover,” Proc. ACM CCS, Chicago, IL, Nov.2009.
[7] S. Shin, Z. Xu, and G. Gu, “EFFORT: Efficient and effective bot mal-ware detection,” Proc. IEEE INFOCOM’12, pp.2846–2850, March2012.
[8] D. Dagon, C. Zou, and W. Lee, “Modeling botnet propagation usingtime zones,” Proc. 13 th Network and Distributed System SecuritySymposium (NDSS), pp.1–15, 2006.
[9] B. McCarty, “Botnets: Big and Bigger,” IEEE Security & Privacy,vol.1, no.4, pp.87–90, 2003.
[10] L. Spitzner, Honeypots: Tracking Hackers, Addison Wesley, 2002.[11] M. Hatada, Y. Nakatsuru, M. Akiyama, and S. Miwa, “Datasets for
Anti-Malware Research — MWS 2010Datasets,” anti Malware engi-neering Workshop 2010 (MWS 2010), with IPSJ CCS 2010, pp.1–
5, 2010 (available at http://www.iwsec.org/mws/2010/manuscript/1A1-1.pdf, accessed Feb. 20, 2013).
[12] M. Feily and A. Shahrestani, “A survey botnet and botnet detection,”Third International Conference on Emerging Security Information,System and Technologies, pp.268–273, 2009.
[13] M. Rajab, J. Zarfoss, F. Monrose, and A. Terzis, “A multifacetedapproach to understanding the botnet phenomenon,” Proc. 6th ACMSIGCOMM Conference on Internet Measurement (ICM’06), pp.41–52, 2006.
[14] Z. Zhu, G. Lu, Y. Chen, Z.J. Fu, P. Roberts, and K. Han, “Botnetresearch survey,” Proc. 32nd Annual IEEE International Conferenceon Computer Software and Applications (COMPSAC’08), pp.967–972, 2008.
[15] D. Dagon, G. Gu, C.P. Lee, and W. Lee, “A taxonomy of bot-net structures,” Proc. 23rd Annual Computer Security ApplicationsConference (ACSAC 2007), pp.325–339, 2007.
[16] P. Vixie, S. Thomson, Y. Rekhter, and J. Bound, “Dynamic Updatesin the Domain Name System (DNS UPDATE),” 1997 (available athttp://www.ietf.org/rfc/rfc2136.txt).
[17] R. Villamarin-Salomon and J.C. Brustoloni, “Identifying botnetsusing anomaly detection techniques applied to DNS traffic,” Proc.5th IEEE Consumer Communications and Networking Conference(CCNC 2008), pp.476–481, 2008.
[18] H. Choi, H. Lee, H. Lee, and H. Kim, “Botnet detection by moni-toring group activities in DNS traffic,” Proc. 7th IEEE InternationalConference on Computer and Information Technology (CIT 2007),pp.715–720, 2007.
[19] D. Shibuya, “Personal Internet usage from survey report,” WhitePaper on Internet 2010, pp.180–193, Impress Japan, 2010. (inJapanese)
[20] MaxMind, “GeoIP Databases,” http://www.maxmind.com/en/geolocation landing, accessed Oct. 10, 2012.
[21] M. Hatada, Y. Nakatsuru, and M. Akiyama, “Datasets for Anti-Malware Research — MWS 2011 Datasets,” Computer SecuritySymposium 2011, pp.1–5, 2011 (available at http://www.iwsec.org/mws/2011/manuscript/1A1-1. pdf, accessed Feb. 20, 2013).
Khamphao Sisaat was born in Laos. Hereceived his B.Eng. and M.Eng. degrees, both inComputer Engineering, from King Mongkut’sInstitute of Technology Ladkrabang, Bangkok,Thailand, in 2001 and from Nara Institute ofScience and Technology, Japan, in 2006, re-spectively. In 2001, he joined the NationalUniversity of Laos as a Lecturer. His re-search interests include network security, In-trusion Detection/Prevention System (IDS/IPS),traceback technologies, network forensics, and
other countermeasures against Denial of Service (DoS) and Distributed De-nial of Service (DDoS) attacks. He is working toward his Ph.D. degree,and is sponsored by JICA AUN/SEED-Net at the School of Computer En-gineering, Faculty of Engineering, King Mongkut’s Institute of TechnologyLadkrabang, Bangkok, Thailand.

SISAAT et al.: TIME ZONE CORRELATION ANALYSIS OF MALWARE/BOT DOWNLOADS1763
Hiroaki Kikuchi was born in Japan. Hereceived his B.E., M.E., and Ph.D. degrees fromMeiji University in 1988, 1990, and 1994, re-spectively. After working at Fujitsu Laborato-ries Ltd. from 1990 through 1993, he joinedTokai University in 1994. He joined Meiji uni-versity in 2013 as a Professor in Departmentof Frontier Media Science, School of Interdisci-plinary Mathematical Sciences. He is a VisitingResearcher at the School of Computer Science,Carnegie Mellon University in 1997. His main
research interests are fuzzy logic, cryptographic protocols, and network se-curity. He is a Member of the Japan Society for Fuzzy Theory and Systems(SOFT), the IEEE, and the ACM. He is a fellow of the Information Pro-cessing Society of Japan (IPSJ).
Shunji Matsuo was born in Japan. Hereceived his B.E. and M.E. degrees from TokaiUniversity in 2008 and 2010. He has been work-ing for Fujitsu Ltd., Network Solution divisionsince 2010. His research interests are in Net-work security and network applications.
Masato Terada was born in Japan. He re-ceived the M.E. in Information and Image Sci-ences from Chiba University, Japan, in 1986. Hejoined Hitachi, Ltd. in 1986. He is currently theChief Researcher at Yokohama Research Labo-ratory, Hitachi. Since 2002, he has been study-ing at the Graduate School of Science and Tech-nology, Keio University and received the Ph.D.in 2006. Since 2004, he has been with the Hi-tachi Incident Response Team. Also, he is avisiting researcher at the Security Center, Infor-
mation Technology Promotion Agency, Japan (ipa.go.jp), JVN associatestaff at JPCERT/CC (jpcert.or.jp) and a visiting researcher at the GraduateSchool of Science and Engineering, Chuo University as well. He is a fellowof the Information Processing Society of Japan (IPSJ).
Masashi Fujiwara was born in Japan. Hereceived his B.E. degrees from Oita Universityin 1999. He joined Hitachi, Ltd. in 2006. He iscurrently working for Hitachi Incident ResponseTeam (HIRT), focusing on incident response,vulnerability handling, and security design re-view. Before that, He worked as Security Engi-neer, specialized in penetration testing, vulner-ability assessment, intrusion detection and pre-vention. He holds CISSP, GIAC, CISA, CEHcertifications.
Surin Kittitornkun was born in Thailand.He received his B.Eng. (Honors) from KingMongkut’s Institute of Technology Ladkrabang(KMITL), Thailand in 1992. In 1995, he earnedM.Eng. (Telecommunications) from Asian Insti-tute of Technology, Thailand with Telecom Fin-land Prize. He received a Ph.D. in Computer En-gineering from U. of Wisconsin-Madison, USAin 2002 and joined KMITL as a faculty memberin Department of Computer Engineering, Fac-ulty of Engineering. His research interests in-
clude high performance computing with FPGA and general purpose CPUsand network security.