Economic Development Policies to Enable Fairness ... - Congress.gov
96
A Economic Development Policies to Enable Fairness for Workers and Communities in Transition Daniel Raimi, Wesley Look, Molly Robertson, and Jake Higdon Report 20-08 August 2020
-
Upload
khangminh22 -
Category
Documents
-
view
4 -
download
0
Transcript of Economic Development Policies to Enable Fairness ... - Congress.gov

Economic Development Policies to Enable Fairness for Workers and Communities in Transition A
Economic Development Policies to Enable Fairness for Workers and Communities in TransitionDaniel Raimi, Wesley Look, Molly Robertson, and Jake Higdon
Report 20-08 August 2020

Economic Development Policies to Enable Fairness for Workers and Communities in Transition i
About the Authors Daniel Raimi is a senior research associate at Resources for the Future and a lecturer at the Gerald R. Ford School of Public Policy at the University of Michigan. He works on a range of energy policy issues with a focus on oil and gas regulation and taxation and climate change policy. The Fracking Debate, his first book, combines stories
from his travels to dozens of oil and gas producing regions with a detailed examination of key policy issues, and is published by Columbia University Press as part of the Columbia University Center on Global Energy Policy book series. Raimi’s current research examines the future of oil and gas development in the United States, with a focus on how producing communities are managing near-term impacts while planning for the future.
Wesley Look is a senior research associate at Resources for the Future. Previously, Look served as Advisor on Energy and Environment to the US Senate Finance Committee and ranking member Senator Ron Wyden (D-OR). Look advised Senator Wyden on a range of clean energy and climate policies, including the
senator’s energy policy portfolio on the Senate Energy Committee. From 2007 to 2010, Look advised US cities on climate and energy policy as Program Officer with the International Council for Local Environmental Initiatives (ICLEI).
Molly Robertson is a research assistant at Resources for the Future. She graduated from the University of Michigan’s Ford School of Public Policy in 2019 with a master’s degree in public policy.
Jake Higdon is a Senior Analyst, US Climate Policy at Environmental Defense Fund, where he researches and develops federal policy to enable an equitable transition to a clean economy. Among other roles, Jake previously has worked as a researcher at Columbia University’s Center on Global Energy Policy and a policy assistant for energy and
climate in the Obama White House. Jake holds an MPA in Environmental Science and Policy from Columbia University and a BA from the University of North Carolina at Chapel Hill.

Resources for the Future ii
About RFFResources for the Future (RFF) is an independent, nonprofit research institution in Washington, DC. Its mission is to improve environmental, energy, and natural resource decisions through impartial economic research and policy engagement. RFF is committed to being the most widely trusted source of research insights and policy solutions leading to a healthy environment and a thriving economy.
The views expressed here are those of the individual authors and may differ from those of other RFF experts, its officers, or its directors.
About EDFEnvironmental Defense Fund (EDF) is one of the world’s leading environmental non-profit organizations. EDF’s mission is to preserve the natural systems on which all life depends. Guided by science and economics, EDF finds practical and lasting solutions to the most serious environmental problems.
About the ProjectThis report is the first in a series prepared by Resources for the Future and the Environmental Defense Fund that examine policies and programs to promote fairness for workers and communities in a transition to a low–greenhouse gas emissions economy, often referred to as a just transition. The series looks at existing public policies and programs, grouped thematically as “tools in the toolbox” for policymakers seeking effective strategies to address economic challenges associated with the transition. This series focuses on policies and programs that can support workers and communities in regions where coal, oil, and natural gas production or consumption has been a leading employer and economic driver. Other reports in the series present illustrative cases in the United States and discuss policy innovation abroad.
This report focuses on federal economic development programs (with limited discussion of state programs) targeting both private and public sectors. Please visit www.rff.org/fairness-for-workers or www.edf.org/ensuring-fairness-workers-clean-economy for more information, other reports in the series, blog posts, and more.

Economic Development Policies to Enable Fairness for Workers and Communities in Transition iii
Acknowledgements The authors would like to thank Amelia Keyes (former RFF), Seth Villanueva (RFF), Derek Walker (EDF), Susanne Brooks (EDF), Sanya Carley (Indiana University), Sara Lawrence (RTI International), Jessica Eckdish (BlueGreen Alliance), and Adrian Deveny for helpful insight and feedback on this report.
Sharing Our WorkOur work is available for sharing and adaptation under an Attribution-NonCommercial-NoDerivatives 4.0 International (CC BY-NC-ND 4.0) license. You can copy and redistribute our material in any medium or format; you must give appropriate credit, provide a link to the license, and indicate if changes were made, and you may not apply additional restrictions. You may do so in any reasonable manner, but not in any way that suggests the licensor endorses you or your use. You may not use the material for commercial purposes. If you remix, transform, or build upon the material, you may not distribute the modified material. For more information, visit https://creativecommons.org/licenses/by-nc-nd/4.0/.
Resources for the Future iv
AbbreviationsARC Appalachian Regional Commission
BRAC Base Realignment and Closure
DOD Department of Defense
DOI Department of Interior
EDA Economic Development Administration (Department of Commerce)
GHG greenhouse gas
JT just transition
LRA local redevelopment authority
NRDP National Rural Development Partnership (US Department of Agriculture)
OEA Office of Economic Adjustment (Department of Defense)
POWER Partnerships for Opportunity and Workforce and Economic Revitalization
RBS Rural Business-Cooperative Service (US Department of Agriculture)
REAP Rural Economic Area Partnership (US Department of Agriculture)
RUS Rural Utility Service (US Department of Agriculture)
SBA Small Business Administration
SRS Secure Rural Schools (US Department of Agriculture)
TAA Trade Adjustment Assistance (Department of Commerce)
USDA US Department of Agriculture

Economic Development Policies to Enable Fairness for Workers and Communities in Transition v
Contents
1. Executive Summary 1
1.1. Insights and implications 2
2. Introduction 3
2.1. Scope of This Review 7
2.2. Types of Economic Development Programs 8
2.2.1. Place-Based Policies and Economic Development 8
2.2.2. Major Mechanisms 10
2.3. Insights and Implications 11
3. Programs Targeting Natural Resource–Dependent Communities 13
3.1. Capacity Building 15
3.1.1. POWER Initiative and Appalachian Regional Commission 15
3.1.2. USDA programs 15
3.2. Financial Support to Public and Nonprofit Organizations 16
3.2.1. Secure Rural Schools 16
3.2.2. USDA Rural Development Programs 18
3.2.3. POWER Initiative and Appalachian Regional Commission 18
3.2.4. State Programs: Colorado and New Mexico 19
3.3. Financial Support to Private Businesses 20
3.3.1. USDA Rural Utility Service 20
3.3.2. USDA Rural Business-Cooperative Service 21
3.3.3. Appalachian Regional Commission 22
4. Programs with Broad Geographic and Economic Scope 23
4.1. Capacity Building 24
4.1.1. Economic Development Integration Program 24
4.1.2. Trade Adjustment Assistance for Firms 24
4.1.3. Small Business Administration Programs 25
4.1.4. Department of Defense’s Office of Economic Adjustment 25
4.1.5. Trade Adjustment Assistance for Communities 26
4.2. Financial Support to Public and Nonprofit Organizations 26
4.2.1. Economic Development Administration Programs 26
4.2.2. Department of Defense’s Office of Economic Adjustment 27

Resources for the Future vi
4.3. Financial Support to Private Businesses 27
4.3.1. Small Business Administration 27
4.3.2. Economic Development Administration Programs 28
5. Conclusion 29
6. Appendix: Summary of Policies 31
6.1. Economic Development Administration Programs 31
6.1.1. Overview 31
6.1.2. Mechanisms and Implementation 32
6.2. Appalachian Regional Commission Programs 38
6.2.1. Overview 38
6.2.2. Mechanisms and Implementation 38
6.3. Small Business Administration Programs 41
6.3.1. Overview 41
6.3.2. Mechanisms and Implementation 42
6.4. USDA Rural Development Programs 50
6.4.1. Overview 50
6.4.2. Mechanisms and Implementation 51
6.5. Community Development Financial Institutions Fund 55
6.5.1. Overview 55
6.5.2. Mechanisms and Implementation 55
6.6. SelectUSA 58
6.6.1. Overview 58
6.6.2. Mechanisms and Implementation 58
6.7. NIST Manufacturing Partnerships 59
6.7.1. Overview 59
6.7.2. Mechanisms and Implementation 60
6.8. DOD Office of Economic Adjustment Programs 62
6.8.1. Overview 62
6.8.2. Mechanisms and Implementation 63
6.9. Trade Adjustment Assistance 66
6.9.1. Overview 66
6.9.2. Mechanisms and Implementation 67
6.10. Secure Rural Schools Program 72
6.10.1. Overview 72

Economic Development Policies to Enable Fairness for Workers and Communities in Transition vii
6.10.2. Mechanisms and Implementation 72
6.11. Colorado: Just Transition Act 74
6.11.1. Overview 74
6.11.2. Mechanisms and Implementation 74
6.12. New Mexico: Energy Transition Act 76
6.12.1. Overview 76
6.12.2. Mechanisms and Implementation 76
7. References 78

Economic Development Policies to Enable Fairness for Workers and Communities in Transition 1
1. Executive SummaryCommunities that are heavily dependent on fossil fuel–related economic activity—including the production of coal, oil, and natural gas and the transformation and consumption of these fuels—would experience substantial effects of a societal shift away from such fuels. This report reviews a range of federal economic development policies and programs that may help affected workers and communities thrive in a low-emissions future. Future reports in this series will examine other tools (e.g., workforce development policy, energy and environmental policy, infrastructure policy) that can play a role in supporting affected workers and communities.
Here, we focus on programs and policies that explicitly seek to support local economic development. In particular, we examine programs led by the Appalachian Regional Commission, the Department of Agriculture’s Rural Development, the Department of Interior’s Secure Rural Schools, the Department of Commerce’s Economic Development Administration, the Department of Defense’s Office of Economic Adjustment, and the Small Business Administration, plus emerging efforts in Colorado and New Mexico.
For ease of analysis, we group economic development programs into two broad categories: those that target local or regional economies historically driven by natural resource development (e.g., coal, agriculture, timber) and programs with a broader geographic and/or economic scope.
We identify three major mechanisms through which the federal government delivers support:
• Capacity building involves programs that provide technical assistance, planning, or research to support local economic development efforts. Such programs can be effective tools to reduce knowledge gaps and increase human capital and productivity. In a concise summary, Wharton (1958) describes this approach as “helping people help themselves.”
• Financial support to public and community organizations helps public or quasi-public organizations deliver local economic development programming. This support may be direct (e.g., grants or loans) or indirect (e.g., loan guarantees) and can enhance the human and physical capital stock (including infrastructure) in a community.
• Financial support to private, for-profit firms may similarly be direct or indirect; the federal government may also offer tax credits, which are not applicable to public entities because they do not pay taxes. These programs are often intended to support small businesses that may struggle to access affordable borrowing, or to jump-start local businesses in sectors that policymakers believe hold promise for future prosperity.
Resources for the Future 2
1.1. Insights and implications
We describe the major federal (and selected state) programs that could help support local economic development to promote fairness for workers and communities adversely affected by a shift away from fossil fuels. We also review the limited evidence from the peer-reviewed literature on the effectiveness of such programs.
Based on this review, we draw five insights that can help inform economic development policy in communities affected by a long-term shift away from fossil energy.
1. Federal intervention can help support medium- and long-term local economic development in numerous contexts. The available empirical studies, while limited, show positive results from both geographically targeted programs and those with a broad geographic and economic scope.
2. The large number of federal, state, and local economic development programs means that any successful attempt to address energy-impacted communities will require substantial coordination across governmental bodies and with local stakeholders. A lack of coordination across federal programs has been highlighted by numerous researchers, and recent efforts have sought to better coordinate and streamline the array of existing federal economic development programs.
3. Existing economic development programs can be augmented or redirected to support fossil fuel–dependent communities and workers, even if a given program was not originally designed for that purpose. Numerous programs examined here have half a century or more of experience in tailoring support to communities facing economic challenges. The POWER Initiative, which leveraged an array of existing programs to deliver support in close partnership with energy communities, could be an important model for federal policy to enable fairness for workers and communities.
4. Federal programs explicitly targeting economic development are modestly funded, with just $80 million designated to support economic development in fossil energy (primarily coal) communities. This level of spending would likely need to grow considerably to support the many workers and communities affected by deep reductions in greenhouse gas emissions across the US economy.
5. Because deep emissions reductions will have geographically concentrated economic effects, policies supporting economic development in these communities will most likely need to be geographically targeted. But policy interventions have to be designed and implemented carefully. Some geographically targeted policies have failed to support their intended beneficiaries, and policy uncertainty about others has created planning challenges for local governments, businesses, and residents.

Economic Development Policies to Enable Fairness for Workers and Communities in Transition 3
2. IntroductionCommunities that are heavily dependent on fossil fuel–related economic activity—including the production of coal, oil, and natural gas and the transformation and consumption of these fuels—would experience substantial effects of a societal shift away from fossil fuels. That shift comes from growth in increasingly competitive low-carbon energy sources, such as wind, solar, and geothermal, along with public policies that drive reductions in greenhouse gas (GHG) emissions. As policymakers consider approaches to deeply reduce emissions and avoid the most dramatic consequences of climate change, it is appropriate to consider policies that will enable affected communities to thrive in a low-emissions future.
The concept of fairness for workers and communities—language we borrow from the Blue Green Alliance—suggests that deep reductions in GHG emissions should not disproportionately burden segments of society that are heavily dependent on the production, transformation, and certain uses of fossil fuels (BGA 2020). This is commonly referred to as a just transition (JT). The term has a range of meanings in various forums; one of the more widely cited definitions is from the International Labour Organization’s “Guidelines for a Just Transition Towards Environmentally Sustainable Economies and Societies for All” (ILO 2015). To maintain consistency with academic literature and major domestic and international policies, such as the Paris Climate Accord, we use “JT” throughout this report, and in so doing we reference the Blue Green Alliance concept of fairness for workers and communities.
At the time of this writing, the COVID-19 pandemic is dramatically affecting the global economic, policy, and social landscape. Effects extend to the energy sector, particularly the oil and coal industry (IEA 2020). As the United States and the world emerge from the pandemic and associated recession, issues surrounding the JT concept may become even more prominent as policymakers consider whether, and to what extent, economic recovery efforts will support affected energy communities as they make low-carbon investments.
The purpose of this review is to provide insight into which economic development policy approaches may play a role in supporting fairness for workers and communities. We review existing federal (and selected state) policies that provide targeted assistance to communities responding to economic disruption, and we assess the evidence on program effectiveness. We are unable to incorporate all of the dozens of federal economic development efforts; we focus on major programs that we believe may play a substantial role in supporting the JT.
We group these programs into two broad categories: those that target local or regional economies historically driven by natural resource development (e.g., coal, agriculture, timber), and programs with a broader geographic or economic scope. Even within these groupings, programs vary widely in administrative structure and specific policy tools.

Resources for the Future 4
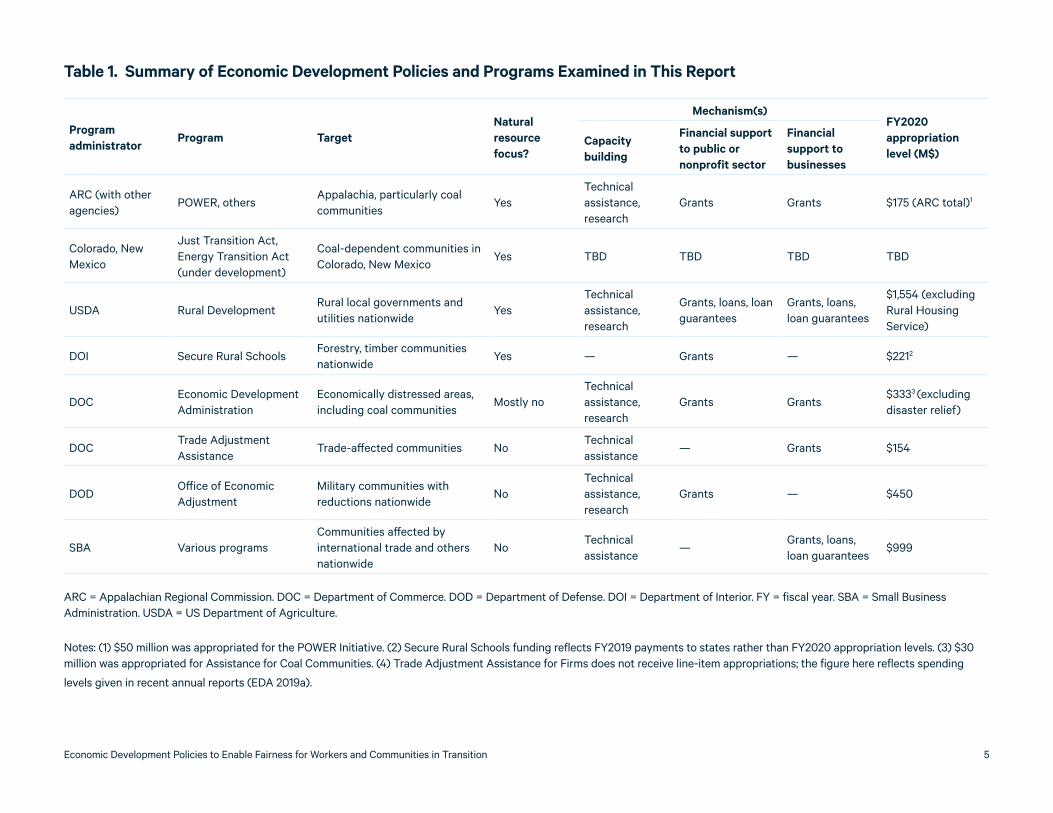
Table 1 is an overview of the major programs reviewed. It indicates the primary mechanisms through which programs deliver support, with details provided in Section 2.2.2. Table 2 summarizes the evidence regarding effectiveness of the programs, based on empirical evaluations published in the peer-reviewed literature, plus two working papers from academic institutions. Because studies are not consistent in the outcomes they measure, we identify the outcomes evaluated.
Economic Development Policies to Enable Fairness for Workers and Communities in Transition 5
Table 1. Summary of Economic Development Policies and Programs Examined in This Report
Program administrator
Program TargetNatural resource focus?
Mechanism(s)FY2020 appropriation level (M$)
Capacity building
Financial support to public or nonprofit sector
Financial support to businesses
ARC (with other agencies)
POWER, othersAppalachia, particularly coal communities
YesTechnical assistance, research
Grants Grants $175 (ARC total)1
Colorado, New Mexico
Just Transition Act, Energy Transition Act (under development)
Coal-dependent communities in Colorado, New Mexico
Yes TBD TBD TBD TBD
USDA Rural DevelopmentRural local governments and utilities nationwide
YesTechnical assistance, research
Grants, loans, loan guarantees
Grants, loans, loan guarantees
$1,554 (excluding Rural Housing Service)
DOI Secure Rural SchoolsForestry, timber communities nationwide
Yes — Grants — $2212
DOCEconomic Development Administration
Economically distressed areas, including coal communities
Mostly noTechnical assistance, research
Grants Grants$3333 (excluding disaster relief)
DOCTrade Adjustment Assistance
Trade-affected communities NoTechnical assistance
— Grants $154
DODOffice of Economic Adjustment
Military communities with reductions nationwide
NoTechnical assistance, research
Grants — $450
SBA Various programsCommunities affected by international trade and others nationwide
NoTechnical assistance
—Grants, loans, loan guarantees
$999
ARC = Appalachian Regional Commission. DOC = Department of Commerce. DOD = Department of Defense. DOI = Department of Interior. FY = fiscal year. SBA = Small Business Administration. USDA = US Department of Agriculture.
Notes: (1) $50 million was appropriated for the POWER Initiative. (2) Secure Rural Schools funding reflects FY2019 payments to states rather than FY2020 appropriation levels. (3) $30 million was appropriated for Assistance for Coal Communities. (4) Trade Adjustment Assistance for Firms does not receive line-item appropriations; the figure here reflects spending
levels given in recent annual reports (EDA 2019a).

Resources for the Future 6
Table 2. Evidence on Program Outcomes
Program Outcome evaluated Results
ARC Broadband expansionGrants expanded access to 150,000 students and 40,000 households, but only 50% of projects met their goals for job creation or expanded broadband access.
ARC Income, employmentCounties receiving ARC grants experienced 5% higher income growth and 4% higher employment growth over 50 years.
USDA Rural Development (multiple programs)
Population, community wealth Each $1,000 in grants per year for public facilities in the 1990s was associated with population growth of 10 people per city per year in a given city. No positive effects of USDA programs on community wealth were found.
USDA Rural Development (water infrastructure)
Various socioeconomic measures
Water and sewer infrastructure investments in Oklahoma had no effect on population, income, or employment, but increased local housing values by 5% over 10–20 years.
USDA Rural Development (broadband)
Various socioeconomic measures
One study found that loans in 2002 and 2003 led to increases in employment (5%), payroll (5%), and number of businesses (7%), but subsequent loans had no effect. Another found that loans increased agricultural sales (by 1% per year) and profits (by $30,000 county-wide). Both studies attributed effects to proximity to metropolitan regions, with no effect in more rural counties.
USDA Rural Development (business loans)
Employment, income, business survival
One analysis showed that county employment increased by 3–6% for each $1,000 of loans per capita, but wages decreased by a similar amount, leading to no county-wide increase in earnings. Another found that loan recipients were 90% and 72% less likely to fail over 2 and 6 years, respectively, but employment increased by just 0.1 job per $1 million in loans.
Secure Rural Schools Local public financesProgram payments are an important part of the local revenue base in certain regions. However, policy design and political uncertainty have led to volatility in payments to local communities, creating planning challenges for local governments.
EDA-supported loan program
Income, employmentLoans had no substantial effects on county-wide income, but increased employment at a cost of $27,000 per job. Larger effects were observed in nonfarming counties than in farming counties.
EDA Trade Adjustment Assistance for Firms
Sales, productivity, employment
Participating firms saw sales increase 5–6% and productivity increase 4%, but no change in employment. 90% of participating firms were satisfied with services received through TAA.
SBA business loans EmploymentEach $1 million in loans increased employment at the firm level by 3 to 3.5 jobs, at cost of $21,000 to $25,000 per job.
ARC = Appalachian Regional Commission. EDA = Economic Development Administration. SBA = Small Business Administration. USDA = US Department of Agriculture.

Economic Development Policies to Enable Fairness for Workers and Communities in Transition 7
2.1. Scope of This Review
Although metrics for evaluating economic growth and employment (e.g., gross domestic product, employment and unemployment rates) are relatively well understood and agreed upon, there is less agreement on how to define economic development (e.g., Eisinger 1988; Blakely and Leigh 2013; Roemer 2014). We use a concise definition summarized in Carley et al. (2011, p. 283):
Bolton (1992) defines economic development policies as those that assist places and people that are economically distressed where policy intervention can increase prosperity. Eisinger (1988, p. 6) extends this to specify that economic development has as its ultimate intent to “enhance the collective well-being” of communities.
This broad definition can make it difficult to distinguish “economic development” policies from others. For example, one could argue that certain major federal spending programs (such as military systems) are at least as important for economic development in some regions as federal efforts whose sole rationale is economic development. Even when one narrows the focus to programs with explicit economic development goals, the list remains expansive, exceeding the scope of our effort.
We focus on programs and policies where government activity is relatively straightforward to observe and measure through metrics such as spending levels, and particularly on programs we believe can provide insights in a JT context. We do not consider in detail tax credit programs because with some exceptions, they are often less targeted on economic development per se.
Our review focuses primarily on geographically targeted policies, rather than those that apply equally to all businesses across the nation (e.g., tax credits for certain types of investments). We do include some programs that span the nation but whose activities consist of geographically-targeted interventions to support local and regional economies; Trade Adjustment Assistance is an example.
We also consider selected policies at the state level. Our focus here is not on the broad range of tax credits or other incentives that state and local governments deploy to attract investment, but instead on a few policies that are explicitly intended to support coal communities undergoing structural changes.
We exclude federal policies that do not explicitly target—even if they contribute to—economic development. Noteworthy examples are affordable housing policies, such as the Rural Housing Service (part of the US Department of Agriculture, USDA), Neighborworks America, and programs administered by the Department of Housing and Urban Development. We also exclude workforce training programs, which we will address in detail in a forthcoming report.

Resources for the Future 8
Finally, we recognize that economic development programs are not the sole tool available to policymakers to promote fairness for workers and communities. In companion reports, we will address additional programs, including those designed to support individual workers, deployment of clean energy and associated infrastructure, environmental remediation, and more.
For details on the economic development policies included in this report, see Section 6.
2.2. Types of Economic Development Programs
We group policy interventions into two categories. The organizational structure illustrated below (Figure 1) provides one useful lens through which to examine similarities, differences, and relevance to the JT concept across programs. We provide the theoretical underpinnings and further description of this structure in Sections 2.2.1 and 2.2.2.
2.2.1. Place-Based Policies and Economic Development
Economists have traditionally been skeptical of geographically targeted (i.e., place-based) economic development policies because of the common belief that aid is best targeted directly to people, who can migrate to locations with greater economic opportunity (Winnick 1966). However, there is a growing consensus that “place” has
Figure 1. Organization of Economic Development Programs examined in this paper
Economic Development Policies
Targeting Natural Resource Economies
CapacityBuilding
Financial Support to Public
Organizations
Financial Support to Businesses
CapacityBuilding
Financial Support to Public
Organizations
Financial Support to Businesses
Broad Geographic and Economic Scope

Economic Development Policies to Enable Fairness for Workers and Communities in Transition 9
economic value beyond the accumulation of firms, workers, and resources in a given geographic region (e.g., Bolton 1992; Markusen and Glasmeier 2008). Prominent economists have recently advocated for place-based approaches to economic development, arguing that such policies can be most effective when tailored to regional economies, rather than pursuing a one-size-fits-all approach (Austin et al. 2018).
What place-based policies might be most successful in a JT context? Three theories of regional economic growth can help motivate specific policy interventions in targeted regions (Drabenstott 2006), particularly those where employment and economic activity are driven by a single sector such as the production of coal, oil, or natural gas (sometimes referred to as “mono-product economies” or “mono-economies”).
• The first focuses on economic clusters (i.e., agglomeration), which are geographic concentrations of related firms that create synergies to accelerate economic growth (Porter 1998). JT policies could seek to spur the development of new clusters in communities where fossil energy production (or related activities) had previously been a central part of the local economy.
• The second is called the “new economic geography,” in which local geographies with certain natural endowments (e.g., access to trade routes) can attract industries or skilled workers, creating pools of labor and capital that can spur new businesses (Krugman 1991). In a JT context, policymakers could work with local stakeholders to identify and capitalize on local endowments in targeted regions.
• The third is focused on developing human capital locally to enhance entrepreneurship and technology innovation and to help individuals take advantage of evolving economic opportunities (Acs and Armington 2004). This approach focuses on workforce development (rather than economic development more broadly), a topic we will address in depth in a forthcoming report.
Because of the distinction drawn in the literature between place-based and non-place-based policies, and for organizational purposes, our analysis groups programs into two categories:
• those designed specifically to support economic development in communities and regions that are, or historically have been, dependent on natural resources (Section 3); and
• those with a broader geographic and economic scope (Section 4).
In the first category, the Appalachian Regional Commission (ARC), Secure Rural Schools (SRS), and state initiatives such as Colorado’s Just Transition Act are examples of programs explicitly designed to support regions that have faced economic challenges due to declining production of commodities such as coal or timber.
Valuable insights are also available, however, from programs with little or no explicit focus on energy or natural resources. The Small Business Administration (SBA),

Resources for the Future 10
the Office of Economic Adjustment (in the Department of Defense, DOD), and the Trade Adjustment Assistance program (administered by multiple federal agencies) illustrate methods for supporting communities experiencing structural changes to their economy—changes that are likely to occur in numerous US regions alongside deep reductions in GHG emissions.
Some recent federal and state efforts focused on the JT concept have blended programs that have an explicit natural resource focus with those that carry out activities across the broader economy. The POWER Initiative stands out as an example of how a federal program can include interventions specifically designed to support challenged natural resource communities, along with leveraging economic development capacity from existing federal efforts to support those communities.
2.2.2. Major Mechanisms
Along with the geographic distinction described above, we identify three broad mechanisms through which public policies support economic development: (1) capacity building; (2) financial support to public and community organizations; and (3) financial support to firms. These three approaches can, in theory, align with key economic principles that drive economic growth: increasing human capital, increasing the capital stock, and increasing productivity through technological advancement (Schultz 1956). Exploring how these mechanisms have been deployed in practice can offer insight into which tools have been most effective, and which may be most appropriate in a JT context.
Capacity building involves programs that provide technical assistance, planning, or research to support local economic development efforts by reducing knowledge gaps, increasing human capital, and enhancing productivity. In these programs, one level of government—for the purposes of this review, typically the federal government—leverages its expertise or financial resources to train or advise efforts carried out on the ground by local governments, businesses, educational institutions, or others. By developing local expertise, these programs enable local professionals, who likely understand regional dynamics better than decisionmakers at the federal or state level, to deploy the tools best suited to their communities. In a concise summary, Wharton (1958) describes this approach as “helping people help themselves.”
Financial support to public and community organizations occurs when one level of government—again, in this review typically the federal government—provides or facilitates funding to support local governments, educational institutions, nonprofit organizations, and other public or quasi-public organizations that deliver local economic development programming. This financial support may be direct (e.g., grants or loans) or indirect (e.g., loan guarantees) and can help enhance both human and physical capital stock in a community or region. In addition, the federal government funds the construction and maintenance of infrastructure, which can play a foundational role in enabling local economic development.

Economic Development Policies to Enable Fairness for Workers and Communities in Transition 11
Financial support to firms is structurally similar to the second mechanism described above, with the crucial distinction that funds are directed to private, for-profit businesses. In addition, government may offer tax credits to encourage companies to invest in certain activities or geographic locations, an approach not applicable to public entities because they do not pay taxes. These policies are often intended to support small businesses who may struggle to access affordable borrowing or to jump-start local businesses in sectors that policymakers believe hold promise for future prosperity. In principle, these interventions can be a useful tool to increase the capital stock. However, because they involve direct government intervention into private markets (where the positive spillovers are less clear than in sectors such as infrastructure or education), they also raise the concern that the government may not be able to identify and appropriately target local market failures, which would limit the societal benefits of government spending (Bartik 1990).
2.3. Insights and Implications
Based on our review of these economic development programs, we make five main observations that can inform JT policymaking.
First, although evidence is limited, the available empirical studies show that federal intervention can play a positive role in supporting medium- and long-term local economic development. Evidence comes from both geographically targeted efforts, such as ARC’s grant-making program (Section 3.2), and broader policies, such as loans from SBA (Section 4.3). These programs, which constitute relatively small interventions into local and regional economies by the federal government, have resulted in relatively small economic benefits. It is unclear whether larger and more widespread interventions, which could occur in a JT context, would correspond with larger and more widespread economic benefits.
Second, the large number of federal, state, and local economic development programs means that any successful attempt to address energy-impacted communities will require substantial coordination across governmental bodies and with local stakeholders. Although previous research has identified significant shortcomings in federal coordination on economic development programs (e.g., Drabenstott 2006; GAO 2011), at least two recent examples offer examples where the federal government has enhanced its coordination efforts. The POWER Initiative, which worked across federal, state, and local jurisdictions to boost struggling coal communities, offers an energy-specific example of such coordination. And in a different context, the Economic Development Integration program (housed in the Economic Development Administration, EDA), is a coordinating entity that increases accessibility and reduces barriers for those seeking support from federal economic development programs.
Third, existing economic development programs and expertise can be augmented or redirected to support communities and workers in a JT context, even if a given program was not originally designed for that purpose. For instance, the DOD Office of
Resources for the Future 12
Economic Adjustment, USDA Rural Development programs, and EDA each have half a century or more of experience tailoring support to communities facing economic challenges. Although empirical evaluations of the POWER Initiative are not available, its approach—leveraging existing programs and expertise to deliver support in close partnership with energy communities—could be an important model for federal policy to enable a JT.
Fourth, federal programs explicitly targeting economic development are modestly funded, with appropriations for the programs examined here totaling roughly $3.5 billion in 2020 (though we note that federal spending on infrastructure, defense, and many other programs that do not have an explicit economic development goal plays a major role in supporting local economies and workers). Of these funds, just $80 million is designated to support economic development in communities that are heavily reliant on the production, transformation, and consumption of fossil fuels. These levels of spending would likely need to grow considerably to support the many workers and communities that would be affected by deep reductions in GHG emissions across the US economy.
Finally, because deep reductions in fossil energy consumption will have disproportionate economic effects on communities and regions heavily dependent on the production, transformation, and—in some cases—consumption of those fuels, policies supporting economic development will most likely need to be geographically targeted, tailored to local circumstances, and carried out in collaboration with local stakeholders (e.g., Carley et al. 2018). However, policy design matters even among more highly targeted programs. For example, because of certain policy design features, the SRS program has not primarily supported schools (as its name would suggest), and volatility in funding has created new challenges for local public finances (Section 3.2). And evidence from the USDA’s broadband expansion grants suggests that programs with broad geographic scope may have benefited communities close to thriving urban hubs more than communities most in need (Section 3.3).

Economic Development Policies to Enable Fairness for Workers and Communities in Transition 13
3. Programs Targeting Natural Resource–Dependent CommunitiesThe federal government and several states have developed programs explicitly designed to support economic development in natural resource–based local economies. Here we define such economies as communities highly economically dependent on mining (including oil and gas development), forestry, and agriculture. We also include communities whose economy is heavily dependent on the concentrated consumption of fossil fuels, such as coal-fired power plants.1 Other natural resource–based economies, such as those reliant on coastal fishing or tourism, may also be relevant but are beyond our current scope.
Because they are geographically targeted using criteria driven—at least in part—by economic dependence on natural resource production, the programs discussed in this section provide a fairly straightforward analogy for understanding the mechanisms that could be deployed to support a JT.
As discussed in Section 2.2, we organize programs into three main categories:
1. Capacity building
2. Financial support to public and nonprofit organizations
3. Financial support to private businesses
Our review of specific programs yields several insights, which we discuss in detail in the following sections, and summarize below:
• Program coordination may be essential. Economic development efforts targeting natural resource-dependent communities can incorporate multiple existing programs to achieve their goals. For example, the POWER Initiative brought numerous federal programs under a single umbrella to deliver coordinated interventions to support economic development (and other goals) in coal communities. This coordination may offer a model for future interventions in a JT context.
• Geographic targeted programs can produce local benefits, as demonstrated by the (fairly limited) empirical evidence on programs administered by ARC and USDA. The research suggests that the magnitude of the benefits has been fairly modest, but this may reflect the relatively modest level of federal funding.
1 Because fossil fuels provide roughly 80 percent of primary energy supply in the United States, most regions are inherently economically reliant on fossil fuels currently. Our focus in this analysis is on those workers and communities that are closely tied to the concentrated consumption of these sources, such as coal-fired power plants.

Resources for the Future 14
• Policy design matters. The SRS program, for example, offers a case where federal funds do not primarily benefit their intended recipients (i.e., schools), and uncertainty around the future of the program has made it difficult for state and local policymakers to develop long-term economic development strategies.
• Geography matters. Evidence from USDA Rural Development programs suggests that economic development efforts have primarily benefited communities that are adjacent to metropolitan centers.
• Politics matters. Any federal program that is geographically targeted based on the discretion of policymakers runs the risk of funds being directed based on political (or other) considerations rather than flowing to the locations most in need.
• State policies provide new models. State governments are beginning to develop programs to support workers and communities affected by state-level goals to deeply reduce GHG emissions. These efforts can provide lessons and potential models for future federal policy.
Table 3 summarizes the programs we review in this section, including distinctive features and their relevance for the JT concept.
Table 3. Summary of Programs for Natural Resource–Dependent Communities
Program or administrator Key features and relevance to a just transition
POWER InitiativeProvides support for public and private institutions in coal communities and illustrates how a coordinated effort can incorporate multiple programs to address a suite of interrelated economic development challenges.
Appalachian Regional Commission
Offers technical, research, and financial support to public and private institutions in Appalachia. ARC also provides an example of a multijurisdictional program where federal, state, and local stakeholders work together.
Secure Rural Schools Provides funding for public institutions in timber communities and offers decades of experience on how federal revenue policy has, or has not, been effective in assisting communities experiencing natural resource–related economic dislocations.
USDA Rural Development
Offers dozens of programs that provide technical and financial support for rural public and private institutions. Major spending areas include housing and utilities. Because many energy-producing regions are rural, lessons from USDA programs may be applicable to workers and communities affected in a JT context.
Colorado Just Transition Act (2019)
Establishes a process to determine how the state will support workers and communities affected by the closure of coal-fired power plants, mines, and related industries.
New Mexico Energy Transition Act (2019)
Establishes a process to determine how the state will support workers and communities affected by closure of coal-fired power plants and mines, particularly in Four Corners (northwestern) region of the state.

Economic Development Policies to Enable Fairness for Workers and Communities in Transition 15
3.1. Capacity Building
The federal government administers a variety of programs to build capacity for local economic development efforts. Although most have a broad geographic focus, several programs directly support natural resource–based local economies.
3.1.1. POWER Initiative and Appalachian Regional Commission
The most pertinent of these programs is the POWER Initiative, launched in 2015 and led by EDA. Among other activities, POWER leveraged existing federal economic development programs to build the capacity of local governments, firms, and community-based organizations in coal communities. In some cases, this targeting consisted of relatively modest efforts to make businesses, local governments, and other entities in coal communities aware of preexisting federal programs. In others, POWER redirected a more substantial portion of existing resources to increase the federal focus on coal communities.
For example, the POWER Initiative partnered with the Department of Commerce’s SelectUSA program, which provides training for firms or communities seeking to attract foreign direct investment. Similarly, the Manufacturing Extension Partnership program (housed in the Department of Commerce’s National Institute for Standards and Technology), which provides technical assistance, market research, and other services for manufacturers, provided targeted support to manufacturers receiving grants through the POWER Initiative.
The POWER Initiative worked with numerous other federal programs to build capacity for coal communities, including USDA’s Rural Development and Rural Business-Cooperative Service, the Environmental Protection Agency’s brownfields program, the Department of Energy’s Jobs Strategy Council, the Department of the Treasury’s Community Development Financial Institutions Fund, and the Corporation for National and Community Service’s Americorps program. Although not funded at high levels, these partnerships offer an example of how a coordinated strategy to address economic development in natural resource communities can direct existing government capacity to support economic development.
In addition to its work under the POWER Initiative, ARC serves as a regional resource for planning and technical assistance for state and local governments. Furthermore, ARC carries out and commissions original research to inform grant making and supports local economic development planning across the broader Appalachian region.
3.1.2. USDA programs
USDA also offers capacity-building programs for rural communities through programs such as the Rural Economic Area Partnership (REAP) and National Rural
Resources for the Future 16
Development Partnership (NRDP). REAP, which also includes grant making (Section 3.2), provides training for economic development professionals in roughly two dozen rural communities identified by USDA as suffering from outmigration or economic challenges (USDA 2020g). NRDP does not provide technical assistance directly but instead plays a coordinating role, bringing together rural economic development councils (independent groups of local businesspeople, government officials, economic development professionals, and others) from more than 25 states to share information and expertise and coordinate activities (USDA 2020a).
We did not identify any empirical analyses that evaluate the effectiveness of these interventions.
3.2. Financial Support to Public and Nonprofit Organizations
For decades, the federal government has deployed resources to support economic development in rural, natural resource–dependent communities (Cowan 2016) that face economic challenges brought about (at least in part) by changing federal environmental standards. Although the decline in coal consumption and production has primarily been driven by market forces (Coglianese et al. 2020), some of these efforts resemble the JT context. For example, in recent years, the POWER Initiative has sought to support coal communities. In other cases, the analogies are less clear but may still be instructive. In addition, state governments with ambitious climate goals have begun to deploy policies to support communities directly affected by reduced demand for coal.
Broadly speaking, these efforts fund locally implemented programs that
• provide technical support and training for local businesses;
• offer educational opportunities, including workforce training and apprenticeship programs; and
• enhance public infrastructure, such as water systems and roads.
The most common financial tool used by the programs reviewed here is grants, though some also have revolving loan funds.
3.2.1. Secure Rural Schools
One of the clearest analogies to future needs associated with deep emissions reductions comes in the form of the SRS program. SRS provides payments to support key public services in communities historically dependent on timber produced from federal lands. Timber revenues declined substantially in the 1990s following changing market conditions and new federal environmental rules that had the effect

Economic Development Policies to Enable Fairness for Workers and Communities in Transition 17
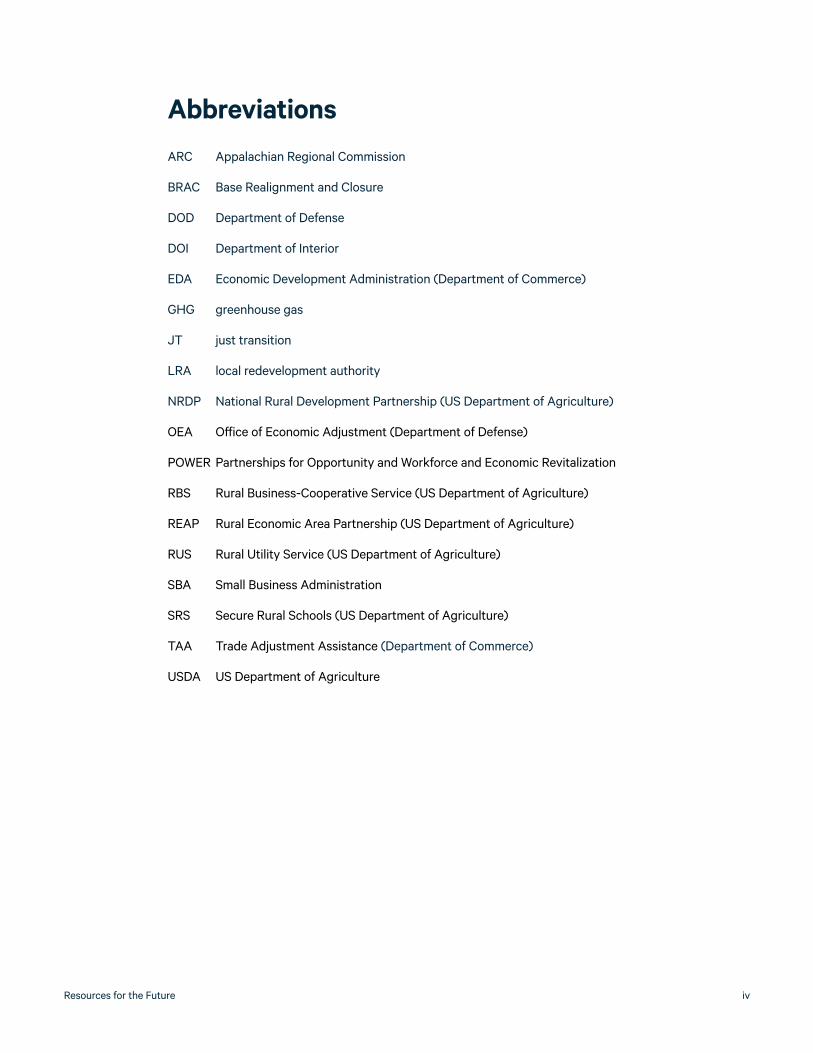
of restricting logging. The federal government had been supporting these counties through payments in lieu of taxes since 1976; SRS began in 2000. SRS was originally envisioned as a temporary measure, with revisions in 2008 stipulating that payments would decline formulaically over time (CRS 2017). In fiscal year (FY) 2019, SRS distributed $221 million in payments (US Forest Service 2020), with recent trends illustrated in Figure 2.
Available evidence points to several issues with the SRS policy design. Gebert et al. (2004) find that the majority of SRS funds are spent on roads rather than schools, and that the funds that do flow to schools do not materially affect overall school funding. This occurs because SRS resources are often used to lower school district tax rates or are offset by funding reductions due to statewide “equalization” policies. Uncertainty and volatility in SRS payments have also created planning challenges for local governments, which Haggerty (2019) argues have exacerbated local fiscal challenges and inhibited efforts to diversify economically.
Nevertheless, SRS payments constitute a substantial portion of the budgets for some rural counties and therefore continue to support local public sector employment in certain locations (Weber et al. 2011). The SRS experience highlights the importance of stability in local public finances because any local economic development initiatives will likely struggle without adequate public infrastructure and services, such as education and public safety.
Figure 2. SRS Payments (Million$, Nominal), FY2001–2015
Data source: CRS (2017).
$0
$100
$200
$300
$400
$500
$600
$700
2005 2010 2015
Forest Service Bureau of Land Management

Resources for the Future 18
3.2.2. USDA Rural Development Programs
The USDA Rural Development programs have a long history of supporting agricultural communities. One major initiative is the Rural Business-Cooperative Service (RBS); it includes subprograms such as the Rural Economic Development Grants program, which enables municipalities and local nonprofits to establish revolving loan programs, which in turn support facilities that house job creation and training programs. Another, larger program is the Rural Utility Service (RUS), which provides grants, loans, and loan guarantees to support the provision of electric, water, wastewater, and telecommunications services in rural areas (Cowan 2016). In 2020, RBS and RUS were appropriated $105 million and $750 million, respectively (Monke 2020a).
Limited evidence finds a mix of positive effects and no effects from USDA Rural Development programs targeted at public and nonprofit entities (we discuss evidence for programs supporting private businesses in the following section). Using community-level data from Oregon, Chen and Weber (2012) estimate that each $1,000 in annual Rural Development program spending on community facilities (similar to spending under the Rural Economic Development Grants program) was correlated with population growth of 10 people per year in a given city, though they are not able to make a causal claim. The same study finds no increase in community wealth associated with USDA programs. Janeski and Whitacre (2014) find that USDA Rural Development spending on water and sewer infrastructure in rural Oklahoma had little to no effect on population, income, or employment, but it did increase median housing values by 5 percent over the long term (10 to 20 years).
3.2.3. POWER Initiative and Appalachian Regional Commission
Another federal program providing financial assistance to public or nonprofit institutions is the POWER Initiative (Section 3.1), which incorporated an array of new and preexisting programs to support Appalachian coal communities. In 2016, the Obama administration announced $39 million in POWER grants through programs administered by ARC and EDA. These grants supported a variety of local economic development activities, including the establishment or expansion of workforce training programs, enhancement of public infrastructure, programs to build capacity for local businesses, and other activities carried out by local public and nonprofit institutions in coal communities (White House 2016).
Although the POWER Initiative’s partnerships with most federal agencies have ceased, ARC and EDA (through its Assistance to Coal Communities program) continue to provide grants to coal communities to support similar activities, making grants totaling $50 million and $33 million, respectively, in 2019. These grants help local governments, nonprofit organizations, educational institutions, economic development organizations, and other entities carry out a variety of projects. To receive grants under the program, proposed projects must meet criteria indicating local economic hardship, and they must be developed collaboratively with state, local, and regional stakeholders. Recent
Economic Development Policies to Enable Fairness for Workers and Communities in Transition 19
grants range from $10,000 (for conducting feasibility studies, for supporting grant writing for future projects) to $3 million (to construct new recreation facilities in Virginia) and $7.5 million (to support a new school of optometry in Kentucky) (EDA 2020e).
Partly because the POWER Initiative began only in 2015, analysis of its effectiveness on spurring economic development is limited.2 The most direct evidence comes from a recent report by the Congressional Research Service, which estimated that the roughly $150 million in POWER grants awarded between 2016 and 2019 had leveraged $772 million in private investment (CRS 2019b).
Two analyses of the broader ARC portfolio of activities also offer insight. Comparing counties receiving ARC grants with non-Appalachian counties with similar socioeconomic characteristics, Gomez et al. (2015) find that those receiving ARC grants experienced 5 percent higher income growth and 4 percent higher employment growth over a 50-year period. An interview-based analysis from Lawrence et al. (2015) examined outcomes for ARC grants supporting broadband deployment, finding that these projects extended service to 150,000 students and 40,000 households, but that only 50 percent of projects met or exceeded their goals in terms of job creation and connectivity.
3.2.4. State Programs: Colorado and New Mexico
State governments are beginning to assemble economic development policies for communities negatively affected by a sharp downturn in coal production and consumption. In Colorado, the 2019 Just Transition Act established a process by which state officials from multiple agencies, working with external experts and stakeholders, are tasked with delivering a detailed Just Transition Plan by the end of 2020. This plan will determine guidelines for allocating funds to support economic development programs implemented by local economic development districts, local governments, Indian tribes, educational institutions, apprenticeship programs, and other public or nonprofit organizations (Becker et al. 2019).
Similarly in New Mexico, the 2019 Energy Transition Act begins a process by which state, local, and tribal officials, along with other experts and key stakeholders, will develop a plan to support economic development in communities negatively affected by the state’s phase-out of coal-fired power (Candelaria et al. 2019). Because these plans are currently under development, it is not clear how specifically they will seek to spur economic development in affected regions.
As other US states craft efforts to deeply reduce GHG emissions, they may also
2 One preliminary assessment (Chamberlin et al. 2019), prepared for ARC, identifies suc-cesses and challenges of project administration and implementation but does not focus on outcomes.
Resources for the Future 20
develop strategies to support affected workers and communities. This is particularly relevant for states that have articulated ambitious climate goals but also have many workers in fossil energy extraction and transformation, such as California and Pennsylvania. Experience at the state level may be helpful in developing effective federal policies.
3.3. Financial Support to Private Businesses
The federal government administers many programs that directly support private businesses across the United States. Although most efforts do not specifically target natural resource–dependent communities, two broad efforts do fall in this category: USDA Rural Development programs, and select components of ARC’s work, including programs under the POWER Initiative.
USDA supports private businesses through numerous channels. Rather than consider all these programs in detail, we focus on two major efforts: the Rural Utility Service, and a grant and loan program of the Rural Business-Cooperative Service, both of which have been evaluated in the peer-reviewed literature.
3.3.1. USDA Rural Utility Service
Along with supporting public infrastructure such as wastewater systems, RUS funds the development of privately operated infrastructure projects, such as telecommunications and electricity, that may be uneconomic for private firms because of the low population density of rural regions. As of FY2018, RUS carried a balance sheet of loans worth $59 billion, along with loan guarantees worth $250 million (USDA 2019). In FY2020, RUS was allocated roughly $750 million to support additional loans for water and waste disposal, electricity infrastructure, and telecommunications and broadband (Monke 2020a).
A substantial body of literature has reviewed the effects of federally funded utility expansion (regardless of whether the funder is USDA), but reviewing the full range of that literature is beyond our scope. Instead, we focus on recent evaluations of federal support for broadband expansion, which has received substantial interest in recent years. Several analyses have identified a clear correlation between increased broadband access and positive economic outcomes, such as employment, number of businesses, and overall economic growth rates (Gillett et al. 2006; Badasyan et al. 2007; Stenberg et al. 2009; Kolko 2012), though this work does not focus on the government’s role in enabling such access.
We identified three papers that specifically address USDA lending programs for broadband expansion. Kandilov and Renkow (2010), using a difference-in-differences approach and propensity score matching with data at the zip code level, find that USDA’s pilot broadband loan program in 2002 and 2003 led to increases

Economic Development Policies to Enable Fairness for Workers and Communities in Transition 21
in employment (5 percent), payroll (4.5 percent), and number of businesses (6.8 percent). However, they find that these effects are concentrated in communities near urban centers (with no effect for more rural counties), and they find no evidence that subsequent broadband loans had any economic effect. LaRose et al. (2011) use surveys and take advantage of a natural experiment from federal rural broadband investments from 2005 to 2008 in four counties across Kentucky, Michigan, and Texas. They find that although broadband access and awareness increased in counties that received expanded service and educational programming, there were no significant effects on residents’ intentions to undertake new business activities or their broader level of satisfaction with their communities.
In a more recent study, Kandilov et al. (2017) use county-level data from 2000 to 2007 to examine the effects of USDA broadband lending on the agriculture sector. They make a causal claim that farm sales increased by an additional 1 percent per year in counties receiving loans, and that county-wide profits were roughly $30,000 (2020$) higher in those counties. However, they again find that the benefits primarily accrue to counties adjacent to metropolitan regions, with no effect for more rural counties.
3.3.2. USDA Rural Business-Cooperative Service
USDA administers other grant and loan programs for private businesses under its RBS, including the Business and Industry (B&I) program and the Rural Business Program Account, which together were appropriated $66.5 million in 2020 (Pascrell 2019). B&I, which provides loans and loan guarantees worth roughly $8 billion to rural businesses (USDA 2019), is of particular interest because several empirical evaluations of the program are available. B&I-backed loans support a wide array of business activities, including the purchase of land or equipment, debt refinancing, and the development or transformation of new and existing businesses, with broad eligibility for those living in designated rural areas.
Johnson (2009) analyzes county-level data on B&I loans from 1985 to 2006, using regression analysis and propensity score matching, and finds mixed results: although each $1,000 worth of loans per capita increased employment at the county level by 3 to 6 percent per capita, earnings per worker decreased by roughly the same amount, leaving no net effect on countywide earnings. Rupasingha et al. (2019) examine firm-level data and B&I loans from 1990 to 2013. Using a matched difference-in-differences approach, they find that loan recipients were 90 percent less likely to fail after two years and 72 percent less likely to fail over six years, but employment increased by just 0.1 job per $1 million in loans.
One potential impediment to efficient allocation of resources under RBS programs, or other programs targeting specific locations, is the tendency for funds to flow toward politically valuable destinations rather than to the regions most in need of assistance, as demonstrated in at least one recent empirical analysis (Matti 2019). In an earlier analysis, Hall (2010) also finds that rural federal grants did not reach the destinations most in need.

Resources for the Future 22
3.3.3. Appalachian Regional Commission
ARC also directly supports private businesses. For example, $15 million was appropriated to ARC in 2019 to support broadband deployment, with substantial funds flowing to companies that install the infrastructure (CRS 2019b). Additionally, under the POWER Initiative, ARC and EDA partnered with SBA to directly support private businesses. However, we are able to identify only one project funded under this arrangement: $500,000 for a regional innovation cluster in southeastern Ohio supporting manufacturers of wood products such as furniture, plywood, flooring, and other goods (SBA 2015).
Finally, ARC administers the Business Development Revolving Loan Fund, which helps provide below-market loans primarily for businesses to create and save jobs. The loans, funded by ARC but administered by states, local economic development authorities, and other public or nonprofit institutions, focus on supporting blight mitigation, industrial modernization, small businesses, and businesses operated by minorities, woman, and members of low-income communities. In 2019, we estimate that ARC distributed $7.5 million under this program, supporting 52 loans.3
3 This estimate is based on data provided in ARC’s recent Performance Accountability Reports (ARC 2018, 2019).

Economic Development Policies to Enable Fairness for Workers and Communities in Transition 23
4. Programs with Broad Geographic and Economic ScopeIn this section, we describe a selection of federal economic development programs with broad geographic scope. As noted in Section 2.1, we do not attempt to identify and describe all federal economic development programs. Indeed, a recent report identified 58 programs across 11 federal agencies that provide various types of support for domestic manufacturers alone (GAO 2017b). We do, however, highlight a selection of programs that may provide insight for JT policy design.
Our review of specific programs yields several insights, which we discuss in detail in the following sections::
• Coordination appears to be critical. The federal government, states, and localities deploy hundreds, perhaps thousands, of economic development initiatives. It is likely that effective economic development strategies will require good coordination and collaboration not just among federal agencies but also with stakeholders at state and local levels.
• Federal expertise can be leveraged. The federal government has administered economic development programs for decades. The experience developed through these programs could be deployed to support workers and communities in transition.
• The evidence on program effectiveness is mixed. The available empirical evidence finds that certain programs have delivered positive economic outcomes, but the evidence is limited and results are mixed. For example, some studies find that federal economic development programs boost employment while others find no effect. One study finds that these programs boost business sales and productivity; another finds that they have no effect on personal income.
• Existing programs can be adapted. Federal economic development programs that are not currently geographically targeted could be adapted to support affected workers and communities. The POWER Initiative (Section 3) provides an example of how such programs could be adapted and coordinated to support specific regions.
Table 4 summarizes the programs we review in this section, their features, and their relevance to the JT concept.

Resources for the Future 24
Table 4. Summary of Programs with Broad Geographic and Economic Scope
Program or administrator Purpose and relevance to just transition
Economic Development Integration program
Coordinates multiple economic development programs across agencies, making delivery more efficient and programs more accessible. If multiple programs are implemented in a JT context, this could serve as a model for coordination.
Small Business Administration
Administers numerous programs targeting private institutions to support entrepreneurship and local economic development, with a large loan and loan guarantee program. In a JT context, SBA programs could support local businesses in affected communities.
Department of Defense Office of Economic Adjustment
Offers technical assistance and grants to support communities experiencing military-related economic disruptions. In a JT context, OEA could serve as an example of targeted federal interventions to support communities affected by changes in federal policy.
Economic Development Administration programs
Includes numerous programs targeting public and private institutions to support economic development, with most spending supporting public infrastructure. In a JT context, EDA programs could target affected communities, as it does today through its Assistance to Coal Communities program.
4.1. Capacity Building
The federal government offers a wide range of capacity-building programs to support state, regional, and local economic development. Some of these efforts focus on training, technical assistance, and other support for public institutions; others provide services to private businesses. These include programs offered by the Departments of Commerce and Agriculture that were incorporated as elements of the POWER Initiative (Section 3.1), along with many others.
4.1.1. Economic Development Integration Program
Some federal programs play an internal coordinating role, working to align and improve the array of federal efforts on economic development. For example, the Economic Development Integration program, housed at EDA, works with other federal agencies to make their existing economic development programs more accessible to potential applicants and less burdensome for grantees (e.g., by streamlining reporting protocols). It also facilitates information sharing and collaboration across government programs, seeking to create a more coordinated federal effort to support economic development in distressed communities (GAO 2017a).
4.1.2. Trade Adjustment Assistance for Firms
Other programs support the delivery of locally administered technical training to the private sector. For example, EDA administers the Trade Adjustment Assistance (TAA) for Firms program, which, among other activities, funds local centers to provide

Economic Development Policies to Enable Fairness for Workers and Communities in Transition 25
technical assistance to companies negatively affected by changes in international trade patterns. The program’s 11 regional centers, which may be administered by universities, state or local governments, or nonprofit institutions, serve as consultancies for firms that demonstrate they have been “trade-impacted” (see Section 6.1). Experts from these centers work with eligible companies to develop new business plans, and companies may apply for direct funding from TAA for Firms to support implementation, subject to matching requirements. Annual funding for this program has been in the range of $15 million in recent years (Fefer 2017). We provide more detail and discuss evidence on the effectiveness of these grants in Section 4.3.
4.1.3. Small Business Administration Programs
SBA offers an array of entrepreneurial development programs, which in 2020 were appropriated $261 million (McCaul 2019). Some programs, which are delivered primarily by educational, nonprofit, or public institutions, support training centers across the United States, such as Small Business Development Centers (900-plus centers nationwide), Procurement Technical Assistance Centers (150-plus), and US Export Assistance Centers (100-plus) (SBA 2020c). More targeted efforts include the Office of Veterans Business Development, a network of Women’s Business Centers, and the Program for Investment in Micro-Entrepreneurs, which focuses its efforts on training low-income and otherwise disadvantaged entrepreneurs. Unique among the programs reviewed here, SBA also has an office of advocacy, which carries out research and advocates for the interests of small businesses in federal and state policymaking.
4.1.4. Department of Defense’s Office of Economic Adjustment
One program that provides technical assistance to both public and private sectors is DOD’s Office of Economic Adjustment (OEA), which supports communities affected by base closures, cancellation of weapons systems, or other military-related economic dislocations. OEA staff provide technical assistance to public and private stakeholders to craft economic development strategies, which vary widely depending on the characteristics of the local economy. OEA experts assist local businesses and regional development authorities in developing economic strategies such as identifying new export markets and implementing worker retraining programs. Additionally, OEA provides technical support to local officials planning for infrastructure projects, with funding to implement these projects coming from congressional appropriations.
OEA’s local redevelopment authority (LRA) framework offers a model for organizing and tailoring local economic development efforts. Upon announcement of base closure or downsizing, OEA meets with community leaders to encourage them to organize an LRA. Under the Base Realignment and Closure (BRAC) grants program in OEA, grantees must form an LRA comprising diverse stakeholders—local officials, federal government experts, business leaders—to jointly craft a community development plan. Only after an LRA is formed and recognized by DOD can it receive grants and technical

Resources for the Future 26
assistance. This process is designed to increase the likelihood that federal assistance fits local needs—and that it is deployed effectively once received.
4.1.5. Trade Adjustment Assistance for Communities
EDA and the Department of Labor jointly (and briefly) administered a similar program to support local governments, known as Trade Adjustment Assistance for Communities. Established in the 2009 American Recovery and Reinvestment Act, the program offered technical support to assist municipalities experiencing job losses due to changes in international trade. Support consisted of assistance in preparing grants that would then be submitted to EDA for possible funding (CRS 2011). The program was operational for only one year (FY2010), during which it distributed $37 million in grants for projects such as buildings to house an innovation center, various infrastructure projects, and programs to provide technical assistance to local businesses (EDA 2010). It was repealed by Congress in 2011.
As with the capacity-building programs described in Section 3.1, we are unaware of any retrospective analyses of these programs’ results.
4.2. Financial Support to Public and Nonprofit Organizations
4.2.1. Economic Development Administration Programs
EDA’s mandate is to support long-term economic development in struggling communities. Of its range of activities, the primary tool is grant making to local public institutions. This work is administered by six regional offices, with total appropriations of $333 million in FY2020 channeled through nine major programs (McCaul 2019).
EDA’s Public Works program, its largest by value (between $100 million and $130 million in recent years), provides grants for public infrastructure—ports, wastewater systems, telecommunications—that can form a foundation for long-term economic growth. Several other programs support efforts by local governments, educational institutions, or other public entities to plan for and implement long-term economic development strategies or programs (this includes the Assistance to Coal Communities program; Section 3.2). EDA also administers disaster relief programs, which are funded on an as-needed basis and can be substantial—adding $600 million each to EDA’s 2018 and 2019 budgets (James 2018). This spending provides grants primarily to public institutions carrying out rebuilding efforts for infrastructure and other projects.
Empirical evidence on the effectiveness of EDA programming is limited. The main sources that we have identified are a series of papers from the early 1980s, which estimate EDA loans had no substantial effect on county-wide income (Martin and

Economic Development Policies to Enable Fairness for Workers and Communities in Transition 27
Graham 1980) but did boost employment, at a cost of $27,000 per job (2020$) (Martin 1981), with larger effects observed in nonfarming counties than in farming counties (Martin 1980).
4.2.2. Department of Defense’s Office of Economic Adjustment
In addition to providing the technical assistance described in Section 4.1, OEA supports local public institutions through grants. In 2020, OEA was appropriated $450 million (DOD 2020), with most grants supporting local economic development programming carried out by public institutions such as local governments or universities. OEA also administers the Downsizing program, which carries out a process for Base Realignment and Closure and is funded on an as-needed basis. The most recent round of BRAC, in 2005, led to the closure of 23 military installations. The OEA Downsizing program provides a combination of technical training and grants to help affected communities identify and develop new economic opportunities. One oft-cited example is the Grand Sky unmanned aerial systems technology park in eastern North Dakota, which was developed in part with grants and planning assistance from BRAC.
Despite the numerous empirical analyses on the economic effects of base closures carried out under the BRAC process (e.g., Krizan 1998; Hooker and Knetter 2001; Hultquist and Petras 2012), we were not able to identify literature that empirically evaluates the effects of subsequent OEA programming.
4.3. Financial Support to Private Businesses
4.3.1. Small Business Administration
The federal agency that plays the largest role in directly supporting businesses to spur economic development is SBA, which has operated at the cabinet level since 1953. It supports businesses through numerous financial interventions, including grants, loans, loan guarantees, and equity investments, with 2020 appropriations of roughly $1 billion. SBA has received considerable attention recently because of its central role in administering federal support for small businesses affected by the Covid-19 pandemic (Cowley 2020).
SBA carries out numerous sets of activities, each including multiple distinct programs. These include multiple loan and loan guarantee programs, capital investment programs, entrepreneurial development programs (Section 4.1), grants to support the expansion of small business exports, and direct loans to businesses and individuals in need of disaster assistance.
SBA’s largest effort is the 7(a) program, which was appropriated $100 million in 2020 (McCaul 2019) and guarantees up to 85 percent of loans worth up to $5 million for small businesses, along with several other subprograms. The CDC/504 program, which

Resources for the Future 28
appears to be a smaller program (though we were unable to find precise appropriations levels), guarantees up to 40 percent of loans for small business equipment and real estate investments.
A review of empirical studies between 1990 and 2009 found higher local employment rates in communities with higher rates of SBA lending (Craig et al. 2009). Most of this effect is observed in low-income markets, suggesting that SBA programs benefit low-income communities most. However, the authors also caution that their results are preliminary and that “much more” research is needed. More recently, Brown and Earle (2017) use richer, firm-level data from all SBA loans issued from 1987 to 2012 and find that each $1 million worth of loans increased employment by 3 to 3.5 jobs, at a cost of $21,000 to $25,000 per job.
In March 2020, Congress appropriated hundreds of billions of dollars in loans to small businesses as part of the CARES Act (2020), administered by SBA. In the coming months and years, researchers will seek to draw insights on the effectiveness of these loans, and any lessons learned may be useful for informing policy in a JT context.
4.3.2. Economic Development Administration Programs
EDA also offers several modest programs that directly support businesses. Its TAA for Firms program (Section 4.1) aids in the preparation and submission of grant proposals, which are then considered by EDA for funding. Grant awards vary but in recent years have been in the range of $15 million annually (Fefer 2017).
In addition, EDA operates the Build to Scale program (previously named Regional Innovation Strategies), which was appropriated $35 million in FY2020 (EDA 2020l) to support three types of activities, primarily carried out by private institutions: business “accelerators” to support entrepreneurship, financial lenders investing in high-risk start-ups, and a pilot program that supports one specific business sector per year (in 2020 it is the “Blue Economy”—aquaculture, offshore wind energy, and other businesses in the marine environment).
According to a 2012 report by the Government Accountability Office, companies participating in the TAA for Firms program experienced a 5 to 6 percent boost in sales, as well as a 4 percent increase in productivity, but no increase in employment. GAO also found that 90 percent of participating firms were satisfied with the services they received from their regional centers (GAO 2012). We were unable to identify any empirical evaluations of TAA for Firms in the peer-reviewed literature.
Economic Development Policies to Enable Fairness for Workers and Communities in Transition 29
5. ConclusionThe federal government offers an array of programs to support economic development across the United States, particularly in rural and low-income communities. This review describes a range of these programs, distinguishing them by geographic scope (i.e., those targeting natural resource communities and those with broader geographic scope) and by the type of intervention they deploy (i.e., capacity building for public and private institutions, financial support for public institutions, and financial support for private entities). We also review existing evidence on the effectiveness of these interventions in spurring economic growth. Our objective is to gain insight into which policy tools may be best suited to support local economies negatively affected by a long-term transition away from the production, transportation, transformation, and consumption of coal, oil, and natural gas.
We distill five main insights from this work:
First, although evidence is limited, the available empirical studies show that federal intervention can play a positive role in supporting medium- and long-term local economic development. Evidence comes from both geographically targeted programs and those with a broad geographic and economic scope. These programs, which constitute relatively small interventions into local and regional economies by the federal government, have delivered relatively small economic benefits. It is unclear whether larger and more widespread interventions, which could occur in a JT context, would correspond with larger and more widespread benefits.
Second, the large number of federal, state, and local economic development programs means that any successful attempt to address energy-impacted communities will require close coordination across governmental entities and with local stakeholders. Lack of coordination across federal economic development programs has been highlighted by numerous researchers, and some recent efforts have sought to better coordinate and streamline the array of existing federal programs.
Third, existing economic development programs and expertise can be augmented or redirected for JT goals, even if a given program was not originally designed for that purpose. For instance, DOD’s Office of Economic Adjustment, USDA’s Rural Development programs, and the Economic Development Administration each have half a century or more of experience tailoring support to communities facing economic challenges. Although empirical evaluations of the POWER Initiative are limited, its approach—leveraging existing programs and expertise to deliver support in close partnership with energy communities—could be a model for federal policy.
Fourth, federal programs explicitly targeting economic development are modestly funded: appropriations for the programs examined here total roughly $3.5 billion in 2020 (though we note that federal spending on infrastructure, defense, and many

Resources for the Future 30
other programs that do not have an explicit economic development goal support many local economies and workers). Of these funds, just $80 million is designated to support economic development in communities that are heavily reliant on the production, transformation, and consumption of fossil fuels. These levels of spending would likely need to grow considerably to support the many workers and communities that would be affected by deep reductions in GHG emissions across the US economy.
Finally, because deep emissions reductions will have geographically concentrated economic effects (while—crucially—providing widespread societal benefits), policies supporting economic development in negatively affected communities will most likely need to be geographically targeted. But these policy interventions will need to be designed carefully. Some of the federal government’s geographically targeted policies have failed to support their intended beneficiaries, and policy uncertainty about others has created planning challenges for local governments, businesses, and residents. As with any geographically targeted federal program, there would remain the risk that political considerations and other factors could steer funds away from the regions most in need.

Economic Development Policies to Enable Fairness for Workers and Communities in Transition 31
6. Appendix: Summary of PoliciesBelow are summaries of economic development efforts related to just transition topics. For each, we provide an overview and then go into more detail on program design, administrative structure, eligibility constraints, and funding levels (where data are available). The programs and policies are as follows:
1. Economic Development Administration programs (Department of Commerce)
2. Appalachian Regional Commission programs
3. Small Business Administration programs
4. Rural Development programs (US Department of Agriculture)
5. Community Development Financial Institutions Fund
6. SelectUSA
7. NIST Manufacturing Partnerships (Department of Commerce)
8. Office of Economic Adjustment programs (Department of Defense)
9. Trade Adjustment Assistance (Department of Commerce)
10. Secure Rural Schools (Department of Interior)
11. Colorado Just Transition Act
12. New Mexico Energy Transition Act
The first efforts are affiliated with the POWER Initiative, begun by the Obama administration to assist communities experiencing economic hardship connected to the decline of the coal industry.
6.1. Economic Development Administration Programs
6.1.1. Overview
The Economic Development Administration (EDA), part of the Department of Commerce, was established with the Public Works and Economic Development Act of 1965. Its mission is to create jobs and boost commercial and industrial growth in underserved US communities, primarily through strategically targeted grants, which in the agency’s early years tended to focus on basic infrastructure (EDA 2020d). EDA aims to integrate economic development resources at the federal, state, local, tribal, and philanthropic levels by investing through regional offices (EDA 2016).
For FY2020, EDA was appropriated $333 million, of which $292.5 million was directed to economic development assistance, trade adjustment assistance, and innovation grants (McCaul 2019).
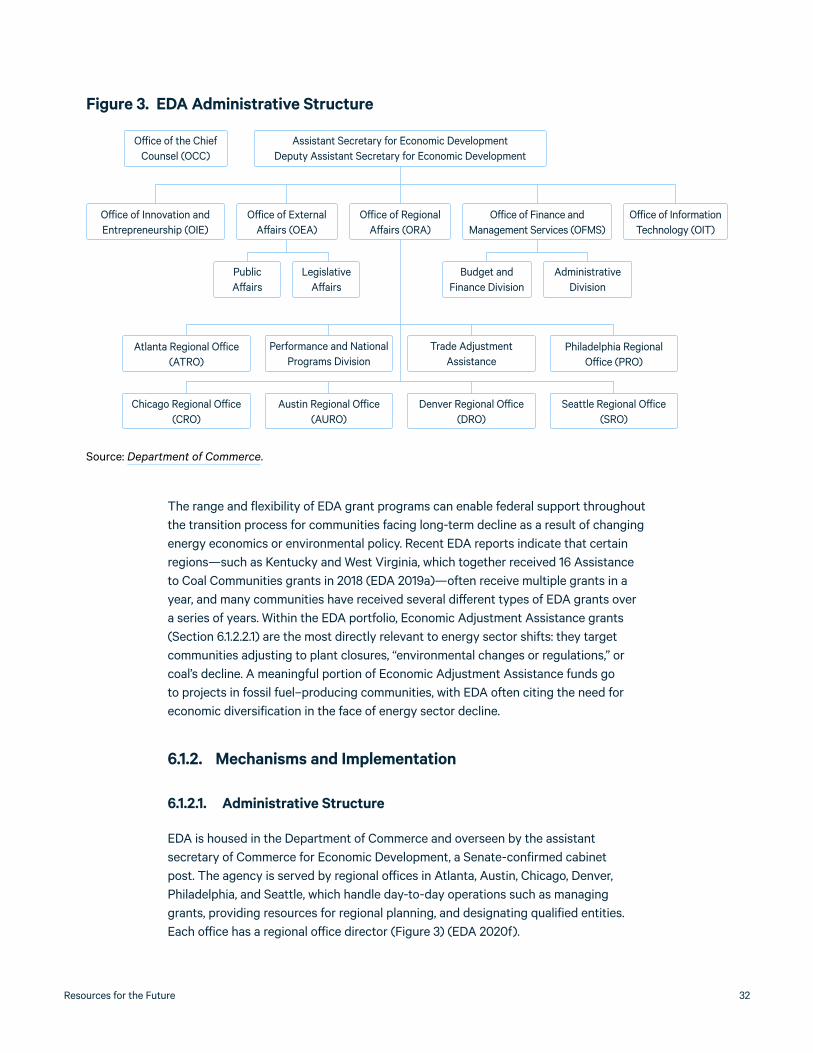
Resources for the Future 32
The range and flexibility of EDA grant programs can enable federal support throughout the transition process for communities facing long-term decline as a result of changing energy economics or environmental policy. Recent EDA reports indicate that certain regions—such as Kentucky and West Virginia, which together received 16 Assistance to Coal Communities grants in 2018 (EDA 2019a)—often receive multiple grants in a year, and many communities have received several different types of EDA grants over a series of years. Within the EDA portfolio, Economic Adjustment Assistance grants (Section 6.1.2.2.1) are the most directly relevant to energy sector shifts: they target communities adjusting to plant closures, “environmental changes or regulations,” or coal’s decline. A meaningful portion of Economic Adjustment Assistance funds go to projects in fossil fuel–producing communities, with EDA often citing the need for economic diversification in the face of energy sector decline.
6.1.2. Mechanisms and Implementation
6.1.2.1. Administrative Structure
EDA is housed in the Department of Commerce and overseen by the assistant secretary of Commerce for Economic Development, a Senate-confirmed cabinet post. The agency is served by regional offices in Atlanta, Austin, Chicago, Denver, Philadelphia, and Seattle, which handle day-to-day operations such as managing grants, providing resources for regional planning, and designating qualified entities. Each office has a regional office director (Figure 3) (EDA 2020f).
Figure 3. EDA Administrative Structure
Source: Department of Commerce.
O�ice of the Chief Counsel (OCC)
Assistant Secretary for Economic DevelopmentDeputy Assistant Secretary for Economic Development
Public A�airs
Legislative A�airs
Budget and Finance Division
Administrative Division
Performance and National Programs Division
Austin Regional O�ice (AURO)
Atlanta Regional O�ice (ATRO)
Chicago Regional O�ice (CRO)
Seattle Regional O�ice (SRO)
Philadelphia Regional O�ice (PRO)
Trade Adjustment Assistance
Denver Regional O�ice (DRO)
O�ice of Regional A�airs (ORA)
O�ice of Innovation and Entrepreneurship (OIE)
O�ice of Finance and Management Services (OFMS)
O�ice of Information Technology (OIT)
O�ice of External A�airs (OEA)

Economic Development Policies to Enable Fairness for Workers and Communities in Transition 33
6.1.2.2. Programs and Qualified Entities
EDA offers grants and loans to community organizations that aim to leverage existing regional assets and provide a foundation for sustainable economic growth. These funds are typically delivered to public community development or planning organizations; different criteria determine eligibility for each grant category. EDA typically requires cost-sharing (usually around 50 percent) from grantees (EDA 2016).
EDA maintains a portfolio of programs, discussed below. EDA also participates in multiagency initiatives such as the Opportunity Zone program, the Americas Competitiveness Exchange, the Trade Adjustment Assistance program (discussed below), and previously the POWER Initiative.
EDA’s core programs are as follows:
1. Economic Adjustment Assistance, which includes Assistance to Coal Communities
2. Public Works
3. Planning
4. Build to Scale, formerly known as Regional Innovation Strategies
5. University Centers
6. Research and National Technical Assistance
7. Local Technical Assistance
8. Economic Development Integration
In certain years EDA also receives supplemental appropriations for disaster relief programs (EDA 2019a).
Figure 4 shows the value of grants for each program.
6.1.2.2.1. Economic Adjustment Assistance
Economic Adjustment Assistance (EAA) grants provide flexible funding for a broad range of development efforts in distressed communities that have experienced sudden or long-term disruption, such as a plant closure. Qualified entities are the same as those for Public Works grants. EAA also includes “strategy grants” for grantees to develop a comprehensive economic development strategy and “implementation grants” for the execution of the approaches identified in the strategy. Although EAA does not receive a congressionally mandated budget, EDA’s grant notice for FY2020 suggests that it expects to make 500 grants across the Economic Adjustment Assistance and Public Works portfolios, ranging between $100,000 and $3 million each (EDA 2019d). Based on recent data, EDA issues roughly $30 million to $60 million in EAA grants per year.

Resources for the Future 34
Eligible applicants are state and local governments, public or private associations acting in cooperation with government, federally recognized Native American tribes, and educational institutions.
Assistance to Coal Communities: Assistance to Coal Communities (ACC) is a subset of EAA activities. It was added as a standalone $30 million carve-out under the EAA portfolio in 2017, an expansion to the $15 million in EDA grants available to coal communities under the POWER Initiative (White House 2015; EDA 2017a). Qualified entities include governments, labor unions, and planning organizations that can demonstrate how the shifting coal economy has caused economic losses (EDA 2020a). ACC grant making has been a priority of the Trump administration, positioned as “fulfilling the President’s promise to America’s coal workers” (EDA 2019c). Recently, EDA has issued the full $30 million per year in ACC grants.
6.1.2.2.2. Public Works
Public Works has been the largest subset of EDA grant making, by dollar value, over the past decade) (EDA 2019b).
The goal of the program is to attract new industry, increase competitiveness, and generally diversify and strengthen local and regional economies. It provides grants for communities to revitalize or expand essential physical infrastructure, such as ports, sewage systems,
Figure 4. EDA Grant Spending, by Program
Data source: EDA, Department of Commerce.
0
100
200
300
400
million $
2012 2013 2014 2015 2016 2017 2018Disaster Relief
Public Works
Planning
Technical Assistance
Trade Adjustment Assistance
Regional Innovation Program
Economic Adjustment Assistance
Assistance to Coal Communities
Research and Evaluation

Economic Development Policies to Enable Fairness for Workers and Communities in Transition 35
telecommunication systems, business parks and manufacturing facilities, and brownfields redevelopment, among others. EDA’s grant notice for FY 2020 suggests that it expects to make 500 grants across the Economic Adjustment Assistance and Public Works portfolios, ranging between $100,000 and $3 million each (EDA 2019d). Based on recent data, EDA issues roughly $100 million to $130 million in Public Works grants per year.
Eligible applicants are state and local governments, public or private associations acting in cooperation with government, federally recognized Native American tribes, and educational institutions.
6.1.2.2.3. Planning
Planning grants support the writing or revision of a comprehensive economic development strategy. The grants are available as (1) planning investments for district organizations, Native American tribes, and other qualifying economic development districts, as designated by a regional EDA office; or (2) short-term investments to states or substate planning regions. In recent years, EDA has issued roughly $30 million in Planning grants per year, at about $300,000 per grant.
Eligible applicants are state and local governments, public or private associations acting in cooperation with government, federally recognized Native American tribes, and educational institutions. Planning and Technical Assistance grants are bundled together into a single notice of funding opportunity and managed by regional EDA offices (EDA 2018a).
6.1.2.2.4. Build to Scale Program, formerly Regional Innovation Strategies
The Regional Innovation Strategies program, established with the Stevenson-Wydler Technology Innovation Act of 1980, was rebranded as the Build to Scale (B2S) program in 2020 (EDA 2020b). Run by EDA’s Office of Innovation and Entrepreneurship, the program consists of three grant challenges:
• The Venture Challenge awards grants to intermediary organizations that support entrepreneurial ventures that are creating jobs and new markets. Eligible entities are accelerators, universities, and nonprofits.
• The Capital Challenge provides operational support to launch entities that increase risk capital availability for start-ups. Eligible entities are investment funds, investor training programs, angel networks, and other organizations that seek to expand capital deployment.
• The Industry Challenge is a pilot program that targets a specific emerging industry. For 2020, the target industry is the “Blue Economy.” Eligible entities are start-ups focused on aquaculture, offshore wind energy, irrigation, and other water-oriented businesses. The 2020 program has $4 million in grants available, in partnership with the Department of Energy (EDA 2020b).

Resources for the Future 36
Of EDA’s FY2020 appropriations, $35 million was specifically earmarked for the Regional Innovation Strategies programs (McCaul 2019). EDA anticipates granting 70 awards at a maximum award value of $1.5 million (EDA 2020k).
6.1.2.2.5. University Centers
The University Center (UC) Economic Development Program leverages and enhances the resources of universities and colleges to promote economic development and entrepreneurship in their regions, through technical assistance, workforce training, business counseling, and planning (EDA 2020j). The UC program is structured as a competitive multiyear grant program, held in two of EDA’s six regional offices on a rotating basis since 2004. In 2018, EDA kicked off a new competition round, providing $2.5 million in grants across 20 colleges and universities in the Austin and Denver regions; the total multiyear pool was $7.4 million.
Eligible entities are accredited institutions of high education (EDA 2020h).
6.1.2.2.6. Research and Evaluation, and National Technical Assistance
The Research and Evaluation and the National Technical Assistance programs both aim to increase understanding of, and tools for, economic development. Research and Evaluation grants and cooperative agreements are used to conduct analysis of the effectiveness of EDA’s initiatives. National Technical Assistance projects are those that develop new economic development tools, such as statistics and data programs, planning guidelines, and investment analysis (EDA 2020i). The two programs have made available $2.5 million in grants ($1.5 million for Research and Evaluation, $1 million for National Technical Assistance) for 2018 to 2020.
Eligible recipients for funding are third-party research groups, in-house researchers at EDA, nonprofits, universities, local governments, businesses, and other entities developing tools for economic development (EDA 2018b).
6.1.2.2.7. Local Technical Assistance
Local Technical Assistance grants aim to strengthen the capacity of recipients to conduct economic development planning projects, such as feasibility studies and impact assessments. As such, they are bundled in the same notice of funding opportunity as Planning grants. The Local Technical Assistance program often leads to future EDA grants. It is not uncommon, for instance, for a Local Technical Assistance recipient to conduct a feasibility study that leads to later receipt of a Public Works grant (EDA 2020g). In recent years, EDA has issued roughly $10 million in Local Technical Assistance grants per year, at about $300,000 per grant.

Economic Development Policies to Enable Fairness for Workers and Communities in Transition 37
Eligible applicants are state and local governments, public or private associations acting in cooperation with government, federally recognized Native American tribes, and educational institutions. Local Technical Assistance grants are managed by regional EDA offices (EDA 2018a).
6.1.2.2.8. Economic Development Integration
The Economic Development Integration program is a team at EDA designated by the White House Office of Management and Budget to coordinate the federal government’s broader economic development agenda across various agencies and promote effective delivery of services. It does not have a designated funding level or issue any grants of its own.
6.1.2.2.9. Disaster Relief
In many years, EDA receives a supplemental appropriation from Congress that funds grants to eligible entities serving communities affected by a presidentially declared disaster in the prior year (EDA 2020c). Disaster Relief grants are delivered by regional offices through the Economic Adjustment Assistance program and may apply to a broad range of projects, including infrastructure investments, as long as they enhance local resilience. The FY2018 and FY2019 budgets appropriated a total of $1.2 billion in emergency-designated funding, or $600 million per year (James 2018). EDA provided $120 million in Disaster Relief grants in 2018.
As for EAA, eligible applicants are state and local governments, public or private associations acting in cooperation with government, federally recognized Native American tribes, and educational institutions (EDA 2019b).
Congress rarely appropriates funds by program. The amount of funds leveraged by each program fluctuates annually based on demand and EDA grantor discretion (EDA 2019b).

Resources for the Future 38
6.2. Appalachian Regional Commission Programs
6.2.1. Overview
The Appalachian Regional Commission (ARC)—a collaboration among local, state, and federal partners—was established by the US Congress in 1965 as a regional agency focused on building community capacity and bolstering economic development across a 13-state area running from New York to Mississippi. ARC was a central component of the POWER Initiative. ARC administers grant, loan, and research programs aimed at the following goals:
• facilitating business development;
• improving education, skills, and public health to ready the workforce and help communities thrive;
• expanding critical infrastructure, such as broadband, transportation, and water and wastewater systems;
• leveraging natural and cultural assets to strengthen the community; and
• building capacity of current and next-generation leaders to sustain community development.
ARC’s enacted appropriations for FY 2020 totaled $175 million, a $10 million increase over the FY2019 enacted appropriations of $165 million. Funding for the POWER Initiative under ARC has been stable at $50 million a year.
6.2.2. Mechanisms and Implementation
6.2.2.1. Administrative Structure
The governing structure of ARC combines federal, state, and local leadership. Its 14 commission members are the governors of 13 Appalachian states (as defined in the founding statute: Alabama, Georgia, Kentucky, Maryland, Mississippi, New York, North Carolina, Ohio, Pennsylvania, South Carolina, Tennessee, Virginia, and West Virginia) and a federal official appointed by the president and subject to Senate confirmation. ARC is cochaired by this federal representative and one of the 13 governors, with a new governor cochair elected each year.
The commission also works with a network of 73 multicounty planning and development agencies called local development districts, with boards composed of local elected officials, businesspeople, and other local leaders. The primary role of these districts is to identify community priorities for ARC programs, to facilitate local economic development planning, and to build local leadership engaged in community development.

Economic Development Policies to Enable Fairness for Workers and Communities in Transition 39
The day-to-day operations of ARC are led by the executive director and a staff of about 50 people, all based in Washington, DC. Administrative costs are shared equally by federal and state governments. Grant budgets are also determined based on cost sharing with recipients.
6.2.2.2. Programs and Qualified Entities
ARC accepts grant applications from state and local agencies (particularly economic development councils), local government boards, and nonprofit organizations. Applicants must coordinate with their state leadership to apply and are expected to coordinate with local, regional, and state stakeholders prior to submitting a grant application. States can either approve an application to be passed on to ARC or decline to submit the proposal. To be funded by ARC, projects must promote the ARC strategic goals (listed above).
ARC is designed to serve residents in Appalachian communities with the greatest economic need. It uses a formal hierarchy of economic distress to prioritize projects in the region, with an index that combines the three-year average unemployment rate, the poverty rate, and per capita income in each county. Organizations and agencies serving counties in greater economic distress are more likely to receive grants from ARC.
Grantees are also expected to match ARC funds to the extent that they are able. Matching requirements are based on the economic distress designations. Grantees can be eligible for up to 80 percent funding allowance for projects if they are proposing a project to benefit a county designated as distressed.
ARC funds projects affecting the Appalachian region in the following program areas:
• asset-based development: helping communities strengthen and build local assets, including “natural, cultural, structural, and leadership” resources;
• community infrastructure: supporting the development and management of key physical infrastructure, with an emphasis on water and wastewater systems;
• telecommunications: helping make advanced communications systems available across Appalachia;
• transportation: facilitating progress in addressing transportation challenges which impact economic growth in Appalachia;
• education and training: promoting workforce skills, early childhood education, dropout prevention and improved college attendance;
• energy: helping communities develop clean energy projects and new energy businesses grow and create local jobs;
• entrepreneurship and business development: investing in businesses and entrepreneurs to strengthen Appalachia’s economy;
• health: promoting wellness and disease prevention and providing resources for hospitals and rural clinics including equipment, training and community education;

Resources for the Future 40
• leadership development and capacity building: building leadership development skills, fostering broad citizen involvement, supporting the development of strategic planning processes, and promoting collaborations among stakeholders; and
• tourism development: supporting tourism projects including rehabbing facilities and infrastructure, training artists to improve marketing skills, and investing in new technologies that increase tourism.
ARC also maintains several programs that cross these focus areas to provide support and funding to economic projects.
6.2.2.2.1. POWER Initiative Grants
Since FY2016, ARC has received $50 million in federal funds annually to administer programs related to the POWER Initiative. The majority of the funding (e.g., $45 million in FY2019) is channeled into various grant-making programs. Currently, there are two main grant-making programs:
• economic policy implementation projects (e.g., to mobilize a policy or plan to create jobs), which are generally capped at $1.5 million per project, except for broadband projects, which are capped at $2.5 million per project; and
• technical assistance and programmatic planning, which can be up to $50,000 per award.
Historically, grants have also been made for “special projects,” which address broader issues in Appalachia. For example, a $750,000 grant was awarded in 2016 to support a collaboration between the National Institute on Drug Abuse and the National Institutes of Health to research the opioid epidemic in Appalachia (White House 2016).
Applications must align with the POWER investment priorities: building a competitive workforce, enabling entrepreneurship, developing community-based industry clusters, improving substance-abuse response, and strengthening broadband access.
To be considered for an ARC POWER grant, applicants must exhibit the following:
• The community has established hardship as a result of the energy transition. In particular, “opportunity zones,” established in 2017 under the Tax Cuts and Jobs Act, receive special consideration and tax breaks for grants and expansive economic projects.
• The project has been developed collaboratively with state, local, and regional stakeholders; prioritizes a large scale approach; includes assessment in the design; leverages market analysis; targets community and economic restructuring; considers sustainability; demonstrates organizational capacity to achieve goals; and offers a return on investment in the form of jobs and economic growth.

Economic Development Policies to Enable Fairness for Workers and Communities in Transition 41
As of the end of 2019, ARC had invested nearly $150 million in POWER-related projects since FY2016, including 185 projects in 312 counties across Appalachia, and leveraging an estimated $772 million of private investment (Cecire 2019).
Between FY2016 and FY2017, 32.5 percent of requested funds were awarded. In FY2018, only 14.9 percent of requested funds were awarded, indicating unmet demand for POWER grants (Cecire 2019).
6.2.2.2.2. Business Development Revolving Loan Fund
The ARC revolving loan fund provides a replenishing lending pool for businesses and (under special circumstances) government agencies to invest in projects that save and create jobs. The fund is meant to function as a supplement to private lending institutions, providing below-market interest rates, reducing risk for private lenders and targeting borrowers with low credit.
The revolving loan program directly contracts with states, local development districts, and other multicounty nonprofit organizations, which are in turn responsible for approving and administering the loan program to the ultimate borrowers. The program targets economic activities planned or under way in the area, with emphasis on projects like small business development, redevelopment of blighted land and vacant facilities, modernization of industrial or manufacturing facilities, and support for businesses owned and operated by minorities, women, and members of low-income communities.
6.2.2.2.3. Research Program
ARC’s robust research program compiles data, advances geospatial mapping, and regularly releases reports on economic and demographic topics associated with the development of the region. Its research includes long-view economic studies and issue briefs on topics like the opioid epidemic and obesity.
6.3. Small Business Administration Programs
6.3.1. Overview
The Small Business Administration was founded as a cabinet-level agency in 1953 to protect and expand the interests of small businesses and to strengthen the US economy overall. SBA provides financial assistance to small businesses, including loans, grants, and equity investment capital; delivers training to small businesses and new entrepreneurs; sets targets for federal procurement dollars to go to small businesses; advocates on behalf of small businesses; and improves job opportunities for veterans, women, and employees with disabilities. In general, SBA also aims to

Resources for the Future 42
promote “free competitive enterprise” and reduce “regulatory burden,” goals that involve advocacy in Congress or federal rule-making contexts (SBA 2020h).
For FY2020, SBA was appropriated $1 billion, of which $155 million was authorized for loan guarantee programs (McCaul 2019).
SBA’s broad and independent mandate, training services, and network of regional and local development centers make it a potential tool for just transition assistance. Under the POWER Initiative, two grant-making tracks were established to provide support to coal communities—planning grants and implementation grants—and SBA was one of four funding sources for the latter. POWER provided $3 million combined through SBA’s Regional Innovation Clusters and Growth Accelerators program to support the development of high-potential industries and workforce opportunities (White House 2015). The programs discussed below are a subset of SBA services that can contribute to economic diversification and community development.
The SBA budget tends to vary significantly, largely based on the levels of congressionally appropriated disaster assistance (Section 6.3.2.2.18); additionally, loan repayment rates and broader macroeconomic trends can affect the total available funds for the agency in any given year. Table 5 displays recent SBA appropriations, as of December 2019 (CRS 2019c).
Table 5. Small Business Administration Appropriations and Available Funds (Million$)
Fiscal YearDisaster Assistance
Disaster Assistance Supplemental
Business Loan Credit Subsidies
Other Programs
AppropriationTotal Available Funds
2020 $177.2 $0.0 $104.0 $717.3 $998.5 N/A
2019 $10.0 $0.0 $4.0 $701.4 $715.4 $1,408.8
2018 $0.0 $1,659.0 $3.4 $697.4 $2,359.8 $1,828.7
Source: CRS (2019c)
6.3.2. Mechanisms and Implementation
6.3.2.1. Administrative Structure
SBA is a cabinet-level federal agency, led by the SBA administrator. It delivers services nationally, regionally, and locally through a network of 10 regional offices—each with its own regional administrator—and 68 district offices, which are overseen by the regional offices (Dilger and Lowry 2019). Additionally, two disaster field offices—one in Atlanta and another in Citrus Heights, California— support the rebuilding of businesses after a disaster.

Economic Development Policies to Enable Fairness for Workers and Communities in Transition 43
SBA also administers financing and small business technical assistance through third parties, among them:
• 63 Small Business Development Centers, public-private partnerships that provide management and technical assistance to small businesses (through a network of 900 outreach locations);
• 125 Women Business Centers, which provide tailored assistance to women-owned businesses;
• 22 Veterans Business Outreach Centers, which provide business training and counseling to veterans, transitioning service members, and military spouses;
• 144 Microloan intermediaries, which provide management and technical training to SBA Microloan Program borrowers and potential borrowers;
• 299 Small Business Investment Companies, which improve small business access to venture capital; and
• Certified Development Companies, nonprofit organizations certified by the SBA that provide loans to small businesses and generally promote economic development in their communities.
Additionally, SBA’s Office of Innovation and Investment manages the Small Business Innovation Research (SBIR) program, an award competition for small businesses to commercialize technologies that were derived from federal R&D, thereby meeting federal innovation goals and supporting small business development (Section 6.3.2.2). The program is required for all federal agencies (currently 11) whose annual budget exceeds $100 million; 3 percent of an agency’s extramural research budget is set aside for the program. Each agency operates its own SBIR programs, but SBA sets the broad guidelines for the competition; provides information to applicants, awardees, and agencies throughout the competitive process; and reports to Congress on the performance of agency programs (SBA 2020g; SBIR 2020a; Dilger and Lowry 2019).
6.3.2.2. Programs and Qualified Entities
SBA’s complex administrative structure, extensive use of third parties, and manifold program areas make it challenging to summarize the full suite of agency services. Instead, we provide an overview of programs relevant to a just transition. We have identified five major categories:
• Loan guaranty programs, which promote lending to small businesses that can’t access credit through conventional channels (Sections 6.3.2.2.1–6.3.2.2.5). In both FY2019 and FY2020, these programs collectively received all-time highs of $155.2 million in appropriations, roughly 10 percent of total available SBA funds (CRS 2019c).
• Capital investment programs, which help small businesses access capital markets and commercialize new technologies (Sections 6.3.2.2.6–6.3.2.2.8).

Resources for the Future 44
• Entrepreneurial development programs, which improve entrepreneur education and target underrepresented demographics in entrepreneurship, such as women, minorities, and veterans (Sections 6.3.2.2.9–6.3.2.2.16).
• Trade support programs, which help small businesses access foreign markets (Section 6.3.2.2.17).
• Disaster assistance programs (Section 6.3.2.2.18).
• Advocacy programs, in which the SBA provides counsel to and advocacy for small businesses (Sections 6.3.2.2.19–6.3.2.2.21).
6.3.2.2.1. 7(a) Loan Guaranty Program
The 7(a) Loan Guaranty Program, one of SBA’s largest loan programs, extends partial loan guarantees to SBA lending partners (mostly banks), which handle the direct lending to small businesses. Among the 7(a) program’s subprograms are the following:
• Standard 7(a) provides guarantees on loans up to $5 million, guaranteed at 75–85 percent, depending on loan size.
• 7(a) Small Loan Advantage provides guarantees on loans up to $350,000, guaranteed at 75–85 percent, depending on loan size.
• SBAExpress provides guarantees on loans up to $350,000, guaranteed at 50 percent, with a streamlined lending process and expedited turnaround time.
• International Trade provides up to $5 million for business expanding to accommodate growing exports or struggling in the face of increasing imports (SBA 2020n).
The interest rates on these loans are ultimately determined by lenders but are capped by SBA (Figure 6). SBA also typically charges an up-front guarantee fee of 0.25 percent for the guaranteed portion of the loan for those with a maturity of 12 months or less, and it has the authority to charge fees of up to 3.75 percent for longer-term loans. SBA may also charge an annual servicing fee of 0.55 percent (Dilger and Lowry 2019).
Qualified entities for 7(a) loan guarantees are small businesses that have “reasonable owner equity to invest” and have exhausted alternative financial avenues before applying for SBA assistance (SBA 2020k).
For FY2020, the 7(a) Loan Guaranty Program was appropriated $99 million in credit subsidies (McCaul 2019).

Economic Development Policies to Enable Fairness for Workers and Communities in Transition 45
6.3.2.2.2. CDC/504 Loan Guaranty Program
The CDC/504 Loan Guaranty Program supports fixed-rate financing for long-term fixed assets, like equipment, land, and buildings. For any given project, at least 50 percent of the financing must be covered by a third-party lender and up to 40 percent by a certified development company (CDC), backed by an SBA loan guaranty. The remaining 10 percent of the project cost must be covered by the borrower, as equity. In FY2019, SBA approved roughly 6,000 CDC/504 loans, equaling about $5 billion in deployed financing. Qualified entities are businesses that (1) are located in the United States; (2) are for profit; 3) can demonstrate and certify that their need for credit is unavailable from other sources; and 4) qualify as small, meaning they have a maximum tangible net worth of $15 million and maximum average net income of $5 million for two fiscal years before the application date (Dilger 2019b).
6.3.2.2.3. Microloan Program and Microloan Technical Assistance Program
The Microloan program is designed to address “disadvantages faced by women, low-income, veteran, and minority entrepreneurs” in accessing credit (CRS 2019c). Under this program, SBA lends directly to “Microloan intermediaries,” which are community-based non-profits that in-turn lend to small business borrowers. Each intermediary has its own lending requirements and interest rates, but rates are generally between 8 and 13 percent (SBA 2020e). SBA also applies a credit subsidy, providing below-market rates to intermediaries so that they in turn can provide the lowest rates to borrowers. The program issues loans up to $50,000 (the average loan is $13,000) for start-up businesses and childcare centers (SBA 2020e). In addition, the SBA Microloan Technical Assistance program provides grants to intermediate lenders for training borrowers in business management, marketing, and other topics. This technical assistance work is funded separately and received $34.5 million in appropriations for FY2020 (CRS 2019c).
Table 6. 7(a) Loan Guaranty Program Interest Rates
Loan amount
Prime rate
(fixed-rate loans)
Max rate if maturity is less than 7 years
(variable-rate loans)
Max rate if maturity is more than 7 years
(variable-rate loans)
< $25,0006% plus 2% allowed by 13 CFR 120.215
Base rate +4.25% Base rate +4.75%
$25,000 to $50,0006% plus 1% allowed by 13 CFR 120.215
Base rate +3.25% Base rate +3.75%
$50,000 to $250,000 6% Base rate +2.25% Base rate +2.75%
> $250,000 5% Base rate +2.25% Base rate +2.75%
Source: SBA (2020a).

Resources for the Future 46
6.3.2.2.4. Special Purpose Loan Guaranty Programs
The Special Purpose Loan Guaranty programs tailor support to small businesses addressing four issues:
• NAFTA. The Community Adjustment and Investment Program covers the fees on 7(a) and CDC/504 loans in communities affecte by the North American Free Trade Agreement.
• Employee stock ownership plans (ESOPs). SBA provides 7(a) loan guarantees to ESOPs to lend money to the employer or purchase control from the owner.
• Pollution control. SBA provides 7(a) loan guarantees for pollution control contracts.
• Short-term capital. CAPLines are five-year loans to help businesses that need short-term or cyclical capital (Dilger and Lowry 2019).
6.3.2.2.5. Rural Lending Initiative
SBA’s Rural Lending Initiative is a pilot program that expands the operating area of CDC/504 loans. Under the initiative, which will last from July 2018 through June 2020 (this analysis was written primarily in Spring 2020), CDC lenders can provide 504 loans to businesses with an address in a rural county in the same SBA region, even if it is outside the jurisdiction of that CDC. The program also waives some typical CDC and grantee requirements to accelerate the distribution of rural loans (SBA 2020i). This program does not have its own appropriations carve-out.
6.3.2.2.6. Small Business Investment Companies
The Small Business Investment Company program provides equity capital to small businesses through small business investment companies (SBICs), which are licensed by SBA and may borrow funds at favorable rates from SBA but raise private capital. SBA currently works with 299 SBICs and in FY2019 provided them with $2 billion in leverage, which was then used to deploy an additional $4 billion in private capital (Dilger and Lowry 2019). In FY2020 appropriations, SBA was authorized to provide up to $4 billion in leverage for SBICs (McCaul 2019).
6.3.2.2.7. Small Business Innovation Research
The Small Business Innovation Research program provides competitive awards to commercialize new technologies, thereby meeting federal R&D goals while supporting small businesses, including women and minority entrepreneurs. The program consists of three award phases: concept development (up to $150,000, with some exceptions), prototype development (up to $1 million, with some exceptions), and commercialization (unfunded). Eleven federal agencies offer SBIR programs, funded through 3 percent set-asides in their extramural research budgets (Dilger and Lowry 2019; SBIR 2020a).

Economic Development Policies to Enable Fairness for Workers and Communities in Transition 47
Eligible entities for SBIR awards must register with the SBIR directory and meet certain requirements for size, ownership structure, and for-profit status. The entity must also conduct at least two-thirds of the R&D work in Phase I and one-half in Phase II (SBIR 2020b).
6.3.2.2.8. Small Business Technology Transfer
The Small Business Technology Transfer (STTR) program, a companion to SBIR, provides funding for research conducted in partnership between private firms and scientists at nonprofit research organizations. STTR offers awards in the same three phases and funding levels as SBIR and is funded through a 0.45 percent set-aside in agency research budgets (Dilger and Lowry 2019).
Eligibility for STTR is roughly the same as SBIR, but the entity must conduct at least 40 percent of the research, and the nonprofit partner, at least 30 percent (SBIR 2020b).
6.3.2.2.9. Small Business Development Centers and Women Business Centers
As described above, Small Business Development Centers (SBDCs) and Women Business Centers (WBCs) are third-party partners that connect small businesses and, in the latter case, women entrepreneurs with support and resources to improve their marketing, strategy, sales, accounting, exporting, and other business efforts. The centers are funded through matching grants from SBA. There are 63 lead SBDC centers (at least one per state) and more than 900 SBDC outreach locations, as well as 125 WBCs.
In FY2020, SBA received $135 million in appropriations for SBDCs and $22.5 million in appropriations for WBCs (Dilger and Lowry 2019).
6.3.2.2.10. Native American Outreach Program
The Native American Outreach (NAO) program provides technical and management assistance to Native American entrepreneurs to build small businesses. In FY2020, NAO received $2 million in congressional appropriations (Dilger and Lowry 2019).
6.3.2.2.11. Veterans Business Outreach Center and Boots to Business
The SBA’s Office of Veterans Business Development houses assistance programs specifically for transitioning service members, veterans, and military spouses. The two highlighted below are the main veterans programs nationwide. In FY2020, the office received $14 million in appropriations.
The Veterans Business Outreach Center (VBOC) program provides entrepreneurial training and resources for transitioning service members, veterans and their spouses.

Resources for the Future 48
Offerings include business plan development, counseling sessions for service-disabled veterans, mentorship programs, and trainings in topics like online marketing, international trade, and accounting. There are 22 VBOCs nationwide, with at least one in each of SBA’s 10 regions (SBA 2020b).
Boots to Business provides a two-day training course to transitioning service members to help them develop entrepreneurial skills. The program, though housed at SBA, also qualifies as part of DOD’s Transition Assistance Program (SBA 2020b). After completion of the initial program, individuals may continue training through SBA partner institutions and Small Business Development Centers. SBA also provides five-year grants to organizations executing Boots to Business programs (SBA 2020d).
6.3.2.2.12. Entrepreneurial Development Initiative (Regional Innovation Clusters)
Also known as Regional Innovation Clusters, the Entrepreneurship Development Initiative began in FY2009 to connect business, research, education, finance, and government institutions to build regional supply chains and develop industry hubs. In FY2020, the program received $5 million in appropriations (Dilger and Lowry 2019).
6.3.2.2.13. Entrepreneurship Education Initiative
The Entrepreneurship Education Initiative offers two tracks of small business assistance, targeted at underserved communities. The first, the Emerging Leaders Initiative, provides a seven-month executive leadership training, which culminates in participants’ producing a three-year growth plan for their businesses. The second provides free online business courses through the SBA Learning Center. In FY2020, the program received $2.5 million in appropriations (Dilger and Lowry 2019).
6.3.2.2.14. SCORE
SCORE, a 501(c)(3) nonprofit partnered with SBA, annually receives a congressional grant through SBA. SCORE provides mentoring, education, and online resources to small businesses entrepreneurs through a network of more than 11,000 volunteer business mentors across 320 local chapters and 800 branch offices. Appropriations for SCORE have increased steadily over the past two decades, with SCORE consistently using its full annual budget (SCORE 2019; CRS 2019c).
6.3.2.2.15. Makerspace Training, Collaboration, and Hiring Pilot Competition
The Makerspace Training, Collaboration, and Hiring (MaTCH) Pilot Competition was a $1 million prize program to fund job and skill training programs in existing Makerspaces (community-operated workspaces for students and/or adults to experiment and learn). The prizes included seed grants of $25,000 for early concepts, proof-of-principle grants of $100,000 for growing yet proven concepts, and scale grants of various sizes
Economic Development Policies to Enable Fairness for Workers and Communities in Transition 49
for capacity building of well-established programs. Winners were announced in August 2019 (SBA 2020l). The program is no longer active.
6.3.2.2.16. Program for Investment in Micro-Entrepreneurs
SBA’s Program for Investment in Micro-Entrepreneurs (PRIME) provides grants to organizations that support low-income or otherwise disadvantaged entrepreneurs. Eligible organizations are nonprofits, development organizations, and Indian tribes focused on micro-enterprise services for entrepreneurs. Grants, up to $250,000, are divided into four categories—technical assistance (75 percent of funds), capacity building (15 percent of funds), research and development (portion of remainder), and discretionary (portion of remainder)—and generally issued for one year (SBA 2020f). PRIME has received roughly $5 million in appropriations annually for the past several years (CRS 2019c).
6.3.2.2.17. State Trade Expansion Program
The State Trade Expansion Program (STEP) aims to increase small business exports by issuing grants to state and territory governments. These governments then administer awards at the local level to give small businesses access to such services as website translation, marketing, trade shows, international travel, training workshops, and procurement of consultants. In FY2019, STEP grants to states ranged from $100,000 to $900,000; the top 10 states in small business exports cannot receive more than 40 percent of the total $18 million budget (SBA 2020j).
6.3.2.2.18. Disaster Assistance
SBA offers long-term, low-interest Disaster Loan Assistance for businesses, nonprofits, homeowners, and renters in declared disaster areas. This SBA program is unique in two ways: loans are issued directly to the ultimate borrower instead of a loan or loan guaranty issued to an intermediary, and the loans are not limited to small businesses.
The loans are designed to help the disaster recovery process through repair or replacement to underinsured property, including real estate, machinery and equipment, and inventory and business assets. Applicants can borrow up to $2 million for demonstrated physical damage or economic injury (SBA 2020m). Because of the variability of disasters, Disaster Loan Assistance contributes significantly to the volatility in SBA appropriations. For instance, SBA received $177.2 million in appropriations in FY2020, but just $10 million in FY2019 and nothing in FY2018. Disaster relief tends to be appropriated in lump sums but then spent over the course of several years (CRS 2019c). Additionally, appropriations volatility is somewhat linked to supplemental appropriations for needs associated with major hurricanes.

Resources for the Future 50
6.3.2.2.19. Office of Advocacy
The Office of Advocacy provides support for small businesses by informing stakeholders of concerns that small businesses face, including those driven by “federal regulatory burdens.” It also intervenes in federal regulatory processes to advocate for small businesses; provides Regulatory Flexibility Act compliance training, which ensures that federal regulations balance the needs of small businesses, to federal officials; and improves communications between federal agencies and small businesses. The office is directed by a chief counsel, nominated by the president and confirmed by the Senate, and has roughly 55 staff members (Dilger and Lowry 2019; Dilger 2019a). The office receives its own appropriation; in FY2020, it received $9.1 million (McCaul 2019).
6.3.2.2.20. National Ombudsman
The SBA Office of the Ombudsman, led by the National Ombudsman, works with small businesses that face excessive or unfair regulation. The office provides a forum for small businesses to comment and express concerns about federal agency activities and files an annual report on affected agencies (Dilger and Lowry 2019).
6.3.2.2.21. National Women’s Business Council
The National Women’s Business Council is an independent, bipartisan federal advisory council that advises the president, Congress, and SBA on “issues of importance to women business owners” (Dilger and Lowry 2019). SBA appoints members to the council.
6.4. USDA Rural Development Programs
6.4.1. Overview
USDA Rural Development (RD) programs provide financial and technical support to rural communities for economic development and basic services, such as housing, health care, electricity, water, and communications (USDA 2020a). RD’s roots extend back to the Great Depression and the efforts of the Federal Emergency Relief Administration to address poverty in rural America. In the early days, when agriculture was the economic engine of most rural communities, rural development policy was focused on helping farmers. However, around the middle of the 20th century, as farming declined as the dominant rural economic activity, focus shifted to revitalization and diversification, much as in coal country today.
For FY2020, Congress appropriated roughly $3.24 billion for RD programs, as well as $38 billion in total loan authority (the amount of loans that can be made or guaranteed) (Monke 2020b).

Economic Development Policies to Enable Fairness for Workers and Communities in Transition 51
Drawing from a pool of $224.5 billion, RD supports rural development through more than 50 financial assistance programs—including loans, grants, and loan guarantees—as well as an array of technical assistance and public education programs. In FY2018, RD issued 155,920 awards for $31 billion in loans, grants, and loan guarantees (USDA 2019).
The POWER Initiative leveraged existing RD programs and offices to provide support for coal communities in transition. The FY2016 POWER budget provided $12 million for grants and $85 million for loans through the Rural Economic Development (RED) Loan and Grant program—a Rural Utility Service program that provides funds for rural utilities to promote employment in rural areas—to regions affected by coal industry changes (White House 2016). Additionally, the POWER Initiative tasked Rural Business-Cooperative Service (Section 3.1) as one of many agencies and programs across the federal government to provide education, outreach, and coordination for POWER partnerships (White House 2015).
6.4.2. Mechanisms and Implementation
6.4.2.1. Administrative Structure
USDA RD is led by an undersecretary and deputy undersecretary, and programming is run through national offices in Washington, DC, and St. Louis. RD programs are managed by three subagencies, each of which has its own administrator: the Rural Housing Service, the Rural Utility Service, and the Rural Business-Cooperative Service. Much of the implementation of RD programs is carried out by 47 state RD offices, which distribute federal funds according to state and local priorities (USDA 2020e).
Additionally, three regional development commissions were created in the 2008 Farm Bill to plan major infrastructure projects for their regions and make grants to states:
• Southeast Crescent Regional Commission, serving counties in southeastern states not already covered by the Appalachian Regional Commission or Delta Regional Authority;
• Southwest Border Regional Commission, serving parts of California, Arizona, New Mexico, and Texas; and
• Northern Border Regional Commission, serving parts of Maine, Vermont, New Hampshire, and New York.
These commissions were each authorized at $30 million through 2012 but received no initial funding. Only the Northern Border Regional Commission remains active; it was appropriated $20 million in FY2019 and currently administers four programs to support economic development in the distressed or transitional border regions of the four states (CRS 2019a).

Resources for the Future 52
6.4.2.2. Programs and Qualified Entities
RD administers a portfolio of more than 50 programs across its three agencies. Here we summarize the activities of each agency and highlight some community development efforts and cross-cutting initiatives.
6.4.2.2.1. Rural Housing Service
The Rural Housing Service (RHS) provides loans, grants, and loan guarantees for housing (including both single- and multi-family housing and both homeownership and rental scenarios) and community facilities, such as hospitals and fire stations. This includes the Section 502 Single Families Housing Direct Loan Program, USDA’s primary housing program, which promotes low-income individuals’ purchase, repair, or building of homes in rural areas; the Section 514 and 516 Farm Labor Housing Program Loan and Grant Program, which supports housing for rural farm laborers; the Section 515 Rural Rental Housing Direct Loans, which houses low-income tenants through 50-year, 1 percent interest loans under which tenants pay no more than 30 percent of their income on rent; and many more comparable programs for multifamily units and critical community facilities (Cowan 2016).
RHS also provides technical assistance and training loans and grants to local governments, nonprofits, and tribes. This includes Mutual Self-Help Housing Technical Assistance grants, which support organizations that oversee low-income individuals in the construction of their own homes, and Community Facilities Technical Assistance and Training grants, which help public bodies and nonprofit organizations plan for community facility needs in their area (USDA 2016, 2020d).
At the end of FY2018, RHS’s loan programs had a total of nearly $160 billion in outstanding principal across its direct and guaranteed loan portfolios and were providing capital for 1.3 million rural housing and community facilities (USDA 2019). For FY2020, Congress appropriated roughly $1.7 billion for RD programs, as well as $29 billion in total loan authority (Monke 2020a).
Eligibility for RHS programs covers a wide range. Single-family and multifamily loans are typically available only to low-income borrowers who otherwise would not be able to obtain credit. Community facilities programs are typically available only to nonprofit organizations and municipal governments. Programs also tend to have varying criteria for housing size (square footage) and qualifying rural areas (population).
An example of an RHS program is the Rural Community Development Initiative, which offers grants to nonprofit housing organizations and local or tribal governments for the purposes of improving housing, community facilities, or economic development projects in low-income rural communities. Grantees may apply for funds to help them train or assist subgrantees in, for example, homeownership education, minority business education, or child care facility improvements. Grants are between $50,000 and $250,000 and must be matched by the recipient (USDA 2020f).

Economic Development Policies to Enable Fairness for Workers and Communities in Transition 53
6.4.2.2.2. Rural Utilities Service
Given the low density of rural regions of the United States, many essential services and infrastructure would be unavailable without federal government support. The Rural Utilities Service (RUS) provides loans, grants, and loan guarantees to expand and modernize utility infrastructure in rural America. It also awards grants to nonprofits that provide communities with technical assistance to develop this infrastructure. RUS offers a variety of loan or grant programs for each of its utility categories—water, electric, and communications, including broadband—with the goal of reducing the cost of capital, addressing high costs for residents, and responding to emergent risks, such as poor drinking water quality, that tend to burden low-income, rural populations (Cowan 2016).
At the end of FY2018, RUS loan programs had a total of nearly $60 billion in outstanding principal awarded to more than 18,000 utilities, almost all in the form of direct loans (USDA 2019). For FY2020, the agency was appropriated roughly $750 million for RUS, as well as $8.4 billion in total loan authority (Monke 2020b).
Entities eligible for RUS grant and loan programs are typically utilities—such as electricity producers and transmitters, telecommunications providers, and water associations—serving rural populations. Some programs also provide grants and loans to local governments and to nonprofit or private organizations with proven ability to deliver services, such as well water systems. Conditions may be tied to community size, service costs (such as high electricity prices), or external circumstances, such as natural disasters (Cowan 2016).
An example of RUS programming is the Substantially Underserved Trust Area (SUTA) initiative, which provides special financing opportunities for infrastructure projects in communities located on trust land that the secretary determines to be underserved.4 Applicants for SUTA support can receive rural electrification loans, high energy cost grants, water and waste disposal grants and loans, broadband loans, and telecommunications infrastructure loans. On a case-by-case basis, the RUS administrator reserves the discretion to use the following SUTA authorities:
• providing financing with interest rates as low as 2 percent;
• extending repayment terms;
• waiving nonduplication restrictions, matching requirements, and credit support requirements from any program administered by SUTA; and
• providing highest funding priority to SUTA projects.
4 Trust Land is any land that “(A) is held in trust by the United States for Native Americans; (B) is subject to restrictions on alienation imposed by the United States on Indian lands (including native Hawaiian homelands); (C) is owned by a Regional Corporation or a Village Corporation, as such terms are defined in section 3(g) and 3(j) of the Alaska Native Claims Settlement Act, respectively (43 U.S.C. 1602(g), (j)); or (D) is on any island in the Pacific Ocean if such land is, by cultural tradition, communally-owned land, as determined by the Secretary” (Electronic Code of Federal Regulations 2012).

Resources for the Future 54
SUTA was initially authorized by the 2008 Farm Bill, but a specific funding level was not appropriated (USDA 2020h).
6.4.2.2.3. Rural Business-Cooperative Service
The Rural Business-Cooperative Service (RBS) provides job training, financial support, and technical support in marketing and other needs for new and existing businesses and cooperatives in rural areas (USDA 2020b). RBS programs range from broad financial support for businesses and cooperatives in rural areas to very specific objectives, such as implementation of sustainable agricultural practices. As an example of broad support, the Rural Economic Development Grants program helps nonprofit and municipal organizations create revolving loan funds to finance community facilities that promote job creation and training. At the other end of spectrum, the Rural Energy for America program provides grants and loans to finance energy efficiency and renewable energy improvements for small businesses and farmers (Cowan 2016).
At the end of FY2018, RBS loan programs had a total of $8 billion in outstanding principal, primarily in the form of loan guarantees for business and industry (USDA 2019). For FY2020, USDA was appropriated roughly $105 million for RBS, as well as $1.1 billion in total loan authority (Monke 2020a).
An example of RBS programming is the Community Economic Development division, which provides grants, low-interest loans, loan guarantees, and technical assistance to improve essential services in impoverished rural areas. Eligible entities are businesses, cooperatives, and other organizations working in communities with “persistent poverty” (i.e., a poverty rate of 20 percent or higher) and few economic opportunities (USDA 2020c). The division guides partner organizations through RD resources and provides support for long-term strategic planning.
Eligible entities for RBS grants and loans vary widely across the programs, but most commonly are not-for-profit entities in rural regions that support the development of local businesses and entrepreneurship (in certain cases, the businesses or individuals themselves can receive USDA funds). Recipients that fall in this category include nonprofit development organizations, small business lenders, state or local government agencies, institutions of higher education, Indian tribes, and cooperatives.
6.4.2.2.4. Rural Economic Area Partnership
The Rural Economic Area Partnership (REAP) program designates certain communities suffering from out-migration or economic crisis to receive assistance from USDA and other federal agencies, as well as preferential treatment under other RD programs. REAP zones are given grants to conduct long-term planning for community economic development, implement the strategic plans, receive USDA training services, and report on progress to USDA. To date, five REAP zones have been designated, each a set of one or more counties that have entered into a memorandum of understanding with USDA (USDA 2020g; Cowan 2016).

Economic Development Policies to Enable Fairness for Workers and Communities in Transition 55
6.4.2.2.5. National Rural Development Partnership
The National Rural Development Partnership (NRDP) coordinates rural development efforts and interests on a national scale. USDA’s National Partnership Office works with a federal, interagency National Rural Development Council and State Rural Development Councils (located in 36 states) to bring together public, private, and nonprofit actors to improve rural communities. State Rural Development Councils are the primary driver of activity and must create their own operating guidelines and action plans (Cowan 2016).
6.5. Community Development Financial Institutions Fund
6.5.1. Overview
The Community Development Financial Institutions (CDFI) Fund was established by the Riegle Community Development and Regulatory Improvement Act of 1994. It was designed to bolster financial services in communities where loans and other financial services are underprovided.
Community development financial institutions (CDFIs) are private entities (including community development banks, credit unions, loan and microloan funds, and venture capital funds) dedicated to serving residents and businesses in low-income communities, who often face challenges accessing essential financial services. The CDFI Fund certifies CDFIs and offers them technical expertise and financial support to incentivize economic investment in struggling communities.
Under the POWER Initiative, the CDFI Fund organized meetings targeting CDFIs that currently invest, or could invest, in coal communities (EDA POWER Initiative 2016). They also provided training on CDFI Fund programs to state and regional stakeholders in coal communities and prioritized investment in struggling coal communities in the 2016 New Market Tax Credit program.
The CDFI Fund enacted FY2020 appropriations totaled $262 million, a $12 million increase over the FY2019 enacted appropriations of $250 million (CDFI Coalition 2020).
6.5.2. Mechanisms and Implementation
6.5.2.1. Administrative Structure
The CDFI Fund is housed in the Department of the Treasury and over the past five years has operated on an annual budget of $210 million to $230 million (CRS 2018).

Resources for the Future 56
Since its creation in 1994, the CDFI Fund has awarded over $2 billion to community development organizations and financial institutions and it has awarded allocations of New Markets Tax Credits expected to attract private-sector investments totaling $54 billion (CDFI Coalition 2019).
6.5.2.2. Programs and Qualified Entities
The CDFI Fund provides resources and support to certified CDFIs and community development entities serving communities across the 50 states, the District of Columbia, Guam, and Puerto Rico. The fund runs a formal certification process for both types of recipients.
An organization applying for CDFI certification must prove that it …
• has a primary mission of promoting community development;
• provides both financial and educational services for development;
• serves and maintains accountability to targeted markets (i.e., services are not offered too broadly); and
• is a legal nongovernmental entity at the time of application.
An organization applying for certification as a community development entity must prove that it…
• is a legal entity at time of application;
• has a primary mission of serving low-income communities; and
• is accountable to the community it serves.
The CDFI Fund runs a variety of programs to increase financial services for economically disadvantaged communities, summarized briefly below (CRS 2018).
6.5.2.2.1. CDFI Financial Assistance Program
The CDFI Financial Assistance program directly invests in CDFIs through loans, grants, equity investments, deposits, and credit union shares, and it supports CDFIs that provide loans, investments, financial services and technical assistance to underserved populations and communities. Grants are up to $2 million each and can be used to support commercial facilities that promote economic stability or development; affordable housing; consumer loans; and businesses that employ, are owned by, or provide products and services to low-income individuals.
Economic Development Policies to Enable Fairness for Workers and Communities in Transition 57
6.5.2.2.2. CDFI Technical Assistance Program
The CDFI Technical Assistance Program builds CDFIs’ capacity to provide needed services in their communities. Technical assistance grants are up to $125,000 and can be used to purchase equipment; procure consulting or contracting services; fund personnel; train staff or board members; or any other appropriate use as determined by the fund.
6.5.2.2.3. New Markets Tax Credit Program
The New Markets Tax Credit program provides nonrefundable tax credits to community development entities, enabling them to attract investment from the private sector and reinvest these amounts in low-income communities. The program is credited through the federal tax code, but the CDFI Fund makes the allocations through a competitive award process.
6.5.2.2.4. Bank Enterprise Award Program
The Bank Enterprise Award Program provides financial incentives to banks to invest in highly distressed communities and in other CDFIs doing the same.
6.5.2.2.5. Native Initiatives
The Native Initiatives program provides financial assistance, technical assistance, and training to CDFIs serving Native American communities and other Native entities proposing to become or create CDFIs.
6.5.2.2.6. CDFI Bond Guarantee Program
The CDFI Bond Guarantee Program functions as a federal credit subsidy program by backing CDFIs or their designees in issuing bonds. The Treasury Department provides a 100 percent guarantee on the bonds, which are issued by the CDFI or designee to the Federal Financing Bank. Bond proceeds are then available to CDFIs investing in community or economic development projects.
6.5.2.2.7. Capital Magnet Fund
The Capital Magnet Fund offers competitively awarded grants to CDFIs and qualified nonprofit housing organizations to finance affordable housing solutions and related community service facilities and economic development activities. Recipients of Capital Magnet Fund proceeds must generate housing and community development investments of at least 10 times the award amount.

Resources for the Future 58
6.6. SelectUSA
6.6.1. Overview
SelectUSA, established in 2011 by President Obama (Executive Order 13577), is a program in the Department of Commerce designed to facilitate business investment to promote local and regional economic development and to retain and create jobs. SelectUSA focuses both on attracting foreign direct investment (FDI) and on “reshoring” the operations of US firms. SelectUSA provides technical expertise to companies seeking foreign investment, builds relationships with global investors, and supports state and local economic development organizations, which do much of the work of soliciting foreign investment. SelectUSA facilitates interagency efforts to achieve these goals, engaging with more than 20 other federal agencies.
Under the POWER Initiative, SelectUSA provided counseling to POWER grantees in coal communities on best practices for foreign direct investment and on retaining or attracting firms involved in global location competitions. The agency also supported coal communities more broadly by assisting them in international tradeshows and preparing them for international investment missions.
SelectUSA enacted FY2020 appropriations total $10 million, the same as the FY2019 enacted appropriations (CRS 2019d).
6.6.2. Mechanisms and Implementation
6.6.2.1. Administrative Structure
SelectUSA is run by the International Trade Administration, an agency of the Department of Commerce.
The program works with many federal agencies to promote foreign investment in the United States. Programs and Qualified Entities
SelectUSA provides services to economic development organizations, US companies, and foreign investors. There are no strict eligibility requirements because the program does not directly fund the organizations it serves. SelectUSA is committed to remaining geographically neutral in advising foreign businesses on investing in the United States (i.e., it does not explicitly promote one region over another); however, it does assist individual economic development organizations with targeted local promotional efforts. SelectUSA offers several programs and services, as described below.

Economic Development Policies to Enable Fairness for Workers and Communities in Transition 59
6.6.2.1.1. Federal Interagency Investment Working Group
The Federal Interagency Investment Working Group, chaired by SelectUSA, promotes business investment in various ways. Members include the Departments of State, Treasury, Defense, Agriculture, and Labor, the Small Business Administration, the Export-Import Bank, and the US Trade Representative. It seeks to coordinate and improve federal investment programs across agencies.
6.6.2.1.2. Information and Counseling
SelectUSA offers data, analytics, and counseling services to companies and economic development organizations to help identify investment opportunities and meet the expectations of international investors. SelectUSA provides technical expertise on local companies, business practices, investment trends, and best practices for attracting foreign investment.
6.6.2.1.3. Marketing and Promotion
SelectUSA also helps market US investment broadly, through relationship building and events. The SelectUSA Investment Summit is the primary annual event promoting investment in the United States; however, SelectUSA also represents US interests at trade shows and “road shows” both domestically and overseas, and it offers (for a fee) customized events for economic development organizations to promote their locations.
6.6.2.1.4. Investment Advocacy
SelectUSA, in collaboration with state, local, and tribal governments, engages potential investors in US firms, including resolving any issues related to the federal government that might be preventing investment.
6.6.2.1.5. Regulatory Assistance
SelectUSA assists investors by addressing questions involving US regulations or programs relating to potential investments.
6.7. NIST Manufacturing Partnerships
6.7.1. Overview
Established in 1988 as part of the National Institute of Standards and Technology (NIST, part of the Department of Commerce), the Manufacturing Extension Partnership (MEP) is a nationwide effort whose mission is “to enhance the productivity and technological performance of US manufacturing.” MEP helps small and mid-sized
Resources for the Future 60
manufacturers (SMMs) and provides its services through the MEP National Network, which comprises 51 MEP centers located in all 50 states and Puerto Rico, and nearly 400 MEP service locations. MEP is a public-private partnership, designed to maximize return on investment to taxpayers (NIST 2020).
MEP provided services to POWER Initiative grantees in coal communities. Services included support for risk mitigation analysis, market research, and entry into new export markets for SMMs. MEP also promoted the POWER Initiative and the needs of the coal communities through their own communications efforts to encourage MEP centers to collaborate future POWER grants applicants.
MEP enacted FY2020 appropriations totaled $146 million, a $6 million increase over the FY2019 enacted appropriations of $140 million (Sargent 2020).
6.7.2. Mechanisms and Implementation
6.7.2.1. Administrative Structure
MEP is housed in the National Institute of Standards and Technology and is advised by a board of directors made up of stakeholders from industry and academia. MEP is a public-private partnership, with partners from both public and private sectors; including multiple federal agencies, state and local government, academic institutions, economic development organizations, and businesses.
Federal MEP appropriations have fluctuated over the years, but since FY2010, they have been between $120 million and $150 million per year. In addition, the MEP receives cost-share revenue from state and local governments, plus client fees from SMMs using the services of the centers. Client fees are designed to increase manufacturing investment in service implementation and to offset the costs for smaller manufacturing firms. Federal funding matches all other sources of funding one to one.
6.7.2.2. Programs and Qualified Entities
MEP primarily operates through its centers—manufacturing extension organizations selected to receive federal support through an application process. Eligible organizations were “any nonprofit institution, or group thereof, or consortium of nonprofit institutions, including entities which already exist or may be incorporated specifically to manage the Center” (MEP 2020). Applications were evaluated based on quality of services that could be provided, geographic reach, and amount of funding available from other sources.
MEP services target SMMs struggling to invest in cutting-edge manufacturing technology and advance productivity. Generally, SMMs have fewer than 500 employees and are seeking assistance from an MEP center for a specific upgrade or investment (MEP 2013).
Economic Development Policies to Enable Fairness for Workers and Communities in Transition 61
Overall, the MEP program attempts to assist SMMs in advancing production processes and product innovation to increase efficiency and competitiveness. Much of what the program does can be understood as facilitating technology transfer of technological and scientific innovation from NIST and other federal agencies and labs, academic and research institutions, and from other firms. Recent focus areas include cybersecurity, food industry safety, and defense supply chain support.
The national network of MEP centers is the core source of activity. The centers offer the following programs (MEP 2018):
• ExportTech: tools and resources for manufacturers to expand into global markets.
• New Product Development: streamlining processes through waste elimination in prototyping and small-batch manufacturing.
• Reshoring Initiative: assistance for manufacturers that are bringing operations back to the United States from abroad. MEP’s Access Cost Everywhere tool shows costs of operating in different locations globally.
• Small Business Innovation Research: a federal grant program that promotes development of innovative products.
• Technology-Drive Market Intelligence: a systematic and comprehensive approach to diversifying businesses by providing research on barriers and opportunities for market expansion.
• Other consulting services: supply chain management, sustainability, technology scouting, and workforce development.
Several other MEP programs are summarized below.
6.7.2.2.1. MEP Assisted Technology and Technical Resource Program
The MEP Assisted Technology and Technical Resource Program (MATTR) provides access to the scientific and engineering resources of NIST laboratories for SMMs. MATTR routinely assists manufacturers with studying, adopting, and integrating new technologies related to advanced manufacturing, robotics, materials design, biosciences, cybersecurity, information and communications technology, and other domains. MATTR also assists SMMs with patents and licensing.
6.7.2.2.2. Competitive Awards Program
The Competitive Awards Program (CAP) allows applicants from a select, high-performing group of MEP centers to compete for funds to advance projects that “solve new or emerging manufacturing problems” (MEP 2020). Applicants highlight new technologies of interest or supply chain management technologies not currently covered by the national MEP network. Projects are selected based on the likelihood of

Resources for the Future 62
improving the competitiveness of US industries, creating and retaining jobs, promoting technology transfer, and other criteria. Project funding under this program ranges from $50,000 to $1,000,000 (MEP 2020b).
6.7.2.2.3. Embedding Project
MEP has provided 14 grants over the past two years of approximately $1.2 million to create partnerships between MEP centers and Manufacturing USA Institutes. The grants fund support from MEP staff in Manufacturing USA Institutes to facilitate knowledge sharing, conduct research, and develop relationships between MEP centers and Manufacturing USA Institutes.
6.7.2.2.4. Research Program
The MEP program also invests in manufacturing research. In addition to core NIST research on emerging manufacturing technologies and processes, MEP also funds research on industry trends. For example, in 2018, MEP funded a study titled “Examining the Quality, Market Value, and Effectiveness of Manufacturing Credentials in the United States.”
6.8. DOD Office of Economic Adjustment Programs
6.8.1. Overview
The Department of Defense’s Office of Economic Adjustment (OEA) supports communities affected by US military decisions, such as base closures, lost contracts, or military and civilian staff layoffs. It was initially created by Secretary McNamara in 1961 to “address the local effects of base closings that caused the loss of 220,000 military and civilian positions from 1961 to 1968” (Army 1987).
In 2020, Congress appropriated $450 million for OEA operations (DOD 2020).
Today, OEA offers needs-based technical and financial assistance to communities that experience a change in military structure or operations that causes substantial local economic consequences. These programs support long-term regional redevelopment efforts through grants and research, including the US Cluster Mapping initiative—a public data set that helps policymakers, developers, private companies, and researchers profile regional economic assets and employment opportunities (US Cluster Mapping 2018). OEA also serves a coordinating role, connecting various development organizations and stakeholders with one another and with federal resources.

Economic Development Policies to Enable Fairness for Workers and Communities in Transition 63
6.8.2. Mechanisms and Implementation
6.8.2.1. Administrative Structure
OEA is overseen by the DOD undersecretary for Adaptation and Sustainment and led by a director who oversees the office’s four main programs: Defense Industry Adjustment, Community Investment, Base Realignment and Closure, and Compatible Use. Each program is staffed with project managers who are assigned to grantees and facilitate the technical assistance, coordination, and grant-making processes.
6.8.2.2. Programs and Qualified Entities
OEA provides assistance and funding to state and local governments or extensions of local government. The baseline budget for all grant programs in FY2020 was $437 million (DOD 2020). OEA determines how to allocate those funds across its grant programs.
6.8.2.2.1. Industry Resilience
Industry Resilience (formerly Defense Industry Adjustment) provides grants to support communities affected by termination of contracts or weapons programs, or by a publicly announced reduction in spending. According to OEA, the most common uses of grants are workforce development, entrepreneurship and small business development, export promotion, industry cluster development, and manufacturing and supply chain resilience. For instance, in 2012, OEA issued a Defense Industry Adjustment grant to the Arizona Commerce Authority in response to procurement cuts that eliminated and reduced several weapons systems being manufactured in Arizona (which derives up to 8 percent of its gross domestic product from the defense sector). The grant was designed to help the authority identify new markets for aviation and defense manufacturing, which led to the launch of the Arizona Diversification Initiative, technical assistance for new business ventures, and a supply chain database to match local companies with new opportunities (OEA 2016).
In addition to offering grants, the Industry Resilience program provides two categories of technical assistance to grantees: (1) supporting key military missions and (2) promoting community and economic development. For the former objective, OEA helps companies improve their production capacity, access new export markets, and develop programs to retrain workers. For the latter, it helps communities develop implementation plans to support a resilient defense industrial base.
Eligible recipients for Industry Resilience support include states and other governmental entities, such as counties, tribal nations, and municipalities (OEA 2020c).

Resources for the Future 64
6.8.2.2.2. Community Investment
Community Investment helps communities invest in public services and infrastructure to support military installations, service members, and families. Although planning for investments is funded through the traditional OEA budget, direct investments in public facilities must be funded through congressional appropriations with specific authority for construction. The Community Investment program has six types of assistance:
• Mission growth funds projects to help communities accommodate an expansion of a military installation, such as grants to plan for the impact of growth on local housing needs. Eligible entities include local, tribal, and state governments with military installations.
• Public schools on military installations provides congressionally appropriated funds for the construction or maintenance of public schools at a military facility. Many of the existing 160 such schools are overburdened and in need of upgrades. Eligible entities include local education authorities.
• Transportation infrastructure improvements associated with medical facilities improves transportation access to facilities in the 2005 round of base realignment. Eligible entities were medical facilities, selected through a competitive process that has since been discontinued.
• Civilian infrastructure on the Territory of Guam improves wastewater systems and other public infrastructure on Guam.
• Defense community infrastructure is a pilot grant program for communities to address deficiencies in infrastructure that supports military installations.
• Defense manufacturing communities supports long-term investments in skills, research, and facilities in designated defense manufacturing communities. This program is not yet operational, and eligible entities have not been determined.
Eligible entities vary across the programs. In additional to the above six lanes of support, Community Investment provides technical assistance for eligible communities in project management, grant scoping, planning, and communication (OEA 2020a).
6.8.2.2.3. Base Realignment and Closure or Downsizing
Base Realignment and Closure (BRAC), also referred to as Downsizing, is the periodic, congressionally authorized process of military installation closure, or a significant drawdown of personnel and/or equipment. The most recent round of BRAC, in 2005, led to the closure of 23 military installations. Upon announcement of downsizing, an OEA project manager meets with community leaders to understand their needs and encourage their coordination through a local redevelopment authority (LRA).

Economic Development Policies to Enable Fairness for Workers and Communities in Transition 65
OEA provides grants and technical support to each local redevelopment authority to develop and implement a community adjustment plan. OEA issues BRAC grants to support communities’ efforts to redevelop former military property, attract investment, and coordinate with military officials. For example, at the Grand Forks Air Force Base in eastern North Dakota, which has gone through several rounds of downsizing, OEA grants helped create Grand Sky, the country’s first unmanned aerial systems business and aviation park, and supported the University of North Dakota in developing industry-specific educational programs OEA 2020b).
Other federal agencies, such as Housing and Urban Development and USDA, often work with OEA to review applications, provide technical assistance during the redevelopment process, or deliver follow-on grants and support (OEA 2020b; HUD 2020).
LRAs are the only eligible entities for BRAC grants. Prospective grantees must establish an LRA composed of local government officials, federal government experts, local business leaders, or others who can prepare a community development plan and coordinate with OEA (Figure 5). Once an LRA is recognized by DOD, it can receive grants and technical assistance.
Figure 5. Local Redevelopment Authority Structure
Source: US Department of Defense, Office of Economic Adjustment
Federal Agencies
Local Governments
Federal Agencies
Private Sector
State Governments
Tribal Government (Where Applicable)
Local Redevelopment Authority (LRA)
Performance and National Programs Division
Austin Regional O�ice (AURO)
Atlanta Regional O�ice (ATRO)
Seattle Regional O�ice (SRO)
Philadelphia Regional O�ice (PRO)
Trade Adjustment Assistance
Denver Regional O�ice (DRO)
LRA Sta�
Executive Council
Department of Defense
• Military Department• Base Transition Coordinator• O�ice of Economic
Adjustment
Sources of Assistance
Potential Members

Resources for the Future 66
6.8.2.2.4. Military Installation Sustainability
Military Installation Sustainability provides technical and financial assistance to states and affected local governments to align local economic development with evolving military needs. The goal is to ensure that communities can continue to grow without interfering with military installations, testing, or training. The program also aims to ensure installation resilience—the ability to adapt to or bounce back from unanticipated external events, such as extreme weather. Factors considered in ensuring installation sustainability include local energy siting, land-use projects, noise, stormwater management, and urban growth.
The grants issued under this program are used to prepare recommendations for community response to a current or potential threat to military operations or sustainability. To generate recommendations, grantees conduct a compatible use study and military installation resilience review to identify risks for the installation, complete technical and financial studies, conduct community outreach, and otherwise prepare for local government action. Grantees are expected to follow through on implementation of community development and infrastructure recommendations that come from this process, even if they are not explicitly funded.
Eligible entities are local, state, or tribal governments if OEA foresees current or potential civilian encroachment on a military installation that will hinder operations, or a current or potential threat to resilience due to resources or activities outside the installation (OEA 2020d).
6.9. Trade Adjustment Assistance
6.9.1. Overview
Free trade agreements can provide broad benefits to US citizens, firms, and workers, but they can also introduce new competition, displacing American workers and potentially contributing to local or regional economic disruption. Established with the 1974 Trade Act, then reauthorized (through FY2021) and restructured by the Trade Adjustment Assistance Reauthorization Act (TAARA) of 2015, Trade Adjustment Assistance (TAA) is a cross-agency initiative to assist four groups—nonfarm workers, farmers, firms, and communities—that are adversely affected by federal trade policy. We include information here on all four areas (the main body of this report looked only at TAA for Firms).

Economic Development Policies to Enable Fairness for Workers and Communities in Transition 67
6.9.2. Mechanisms and Implementation
6.9.2.1. Administrative Structure
The Employment and Training Administration in the Department of Labor (DOL-ETA) manages TAA programs for nonfarm workers; USDA manages programs for farmers; and the Economic Development Administration provides assistance to firms. Both DOL and EDA provided a portion of TAA for Communities (Section 4.1), but this program is no longer active.
6.9.2.2. Programs and Qualified Entities
6.9.2.3. Trade Adjustment Assistance for NonFarm Workers
DOL-ETA administers the TAA for Workers program through its Office of Trade Adjustment Assistance, in partnership with state agencies that handle workforce development and unemployment, and in collaboration with local American Job Centers. TAA funds are distributed to states to administer programs—they are not delivered directly from DOL to workers. States are also in charge of gathering—and submitting—data on program participation and outcomes (Collins 2019).
Workers can receive the following benefits under this program:
• Training and reemployment services: services to prepare workers for new employment, including training subsidies, relocation and job search allowances, and case management.
• Trade readjustment allowance (TRA): weekly payments for TAA-certified workers who have exhausted their state unemployment compensation and are enrolled in an eligible training program. TRA is equivalent in value to unemployment compensation, and the two are available for a combined 130 weeks.
• Reemployment trade adjustment assistance: wage insurance that provides a cash payment for workers over the age of 50 who are reemployed at a lower wage. The cash payment is equal to half (50 percent) of the difference in wages, up to $10,000 over two years.
• Health coverage tax credit: a tax credit covering 72.5 percent of health insurance premiums (Collins 2019).
Eligible individuals are in a worker group that DOL has deemed trade-affected, as defined by the following criteria:
• A significant number or proportion of workers in the group have been displaced or are under threat of displacement.
• One or more of the following criteria triggered that displacement:

Resources for the Future 68
• sales, production, or both decreased absolutely as a result of imports;
• the workers’ firm shifted operations to a foreign country;
• the workers’ firm acquired articles or services from a foreign country;
• the workers’ firm is a supplier to another firm that employs TAA-eligible workers;
• the workers’ firm is a downstream producer to another firm that employs TAA-eligible workers; and/or
• the workers’ firm is publicly identified in an International Trade Commission investigation.
After a group is certified, individuals apply to local job centers for benefits. To be eligible for TRA and the health coverage tax credit, workers must also have exhausted their unemployment compensation benefits and be enrolled in training within 26 weeks of separation or TAA for Workers certification.
In FY2018, DOL-ETA certified 80 percent of worker group petitions, and nearly 35,000 workers received TAA support services. Roughly 60 percent of eligible workers in FY2018 were from manufacturing sectors. Approximately 30,000 workers received employment and case management, 12,000 received occupational training, 7,000 received training leading to an associate’s degree, and 20,000 received TRA (DOL 2019).
TAA funding for nonfarm workers is a mandatory program appropriated annually by Congress into the Federal Unemployment Benefits and Allowances account, which has three arms: training and other activities, trade benefits (i.e., TRA), and alternate and reemployment TAA (DOL 2019). Appropriations for the program in FY2019 were $790 million (Collins 2019).
6.9.2.3.1. Trade Adjustment Assistance for Farmers
USDA administers the Trade Adjustment Assistance for Farmers (TAAF) program, which delivers technical assistance and financial benefits to farmers and fishermen affected by increased imports.
TAAF requires that USDA certify a producer’s eligibility. Once certified, individual producers can receive two kinds of benefits:
• Technical assistance. This includes initial training in marketing and improving the yield of the commodity, as well as the feasibility of substituting an alternate commodity than the one impacted by imports. It may also include supplemental funds to support the cost of any travel to receive this technical assistance.
• Financial assistance to implement a new business plan. Those who have already received technical assistance may apply for up to $4,000 to develop an initial business plan to adjust their operations, and once that plan has been completed, up to $8,000 to implement a long-term business adjustment plan.

Economic Development Policies to Enable Fairness for Workers and Communities in Transition 69
Any producer with a gross income of more than $500,000 in nonfarm income or $750,000 in farm income is ineligible for TAAF support (McMinimy 2016).
Producers must establish their eligibility through a two-step process:
1. A producer group must establish, via a petition, that imports caused at least a 15 percent decline in the price, quantity, or production value of a commodity.
2. Once a producer group is certified, an individual producer within that group must show USDA the following three impacts to receive benefits:
• the commodity was produced in the current year and at least one of the three previous years;
• the quantity of the commodity decreased compared with a previous year, or the price for the commodity decreased compared with the prior three-year average; and
• no benefits were received through another TAA program.
TAAF received annual appropriations of $90 million from 2003 to 2007, and then again in 2009, 2010, and the first quarter of 2011, before lapsing. The Trade Preferences Extension Act of 2015 reauthorized TAAF through FY2021 at up to $90 million per year, subject to annual appropriations. However, no appropriations have been made since the first quarter of FY2011. Even while the program was receiving regular appropriations at the full authorization levels, prior to 2011, it was underutilized; actual budgetary outlays were just $49 million out of a total of $459 million appropriated over a 5¼-year period (McMinimy 2016).
6.9.2.3.2. Trade Adjustment Assistance for Firms
Trade Adjustment Assistance for Firms, administered by the Economic Development Administration (EDA), delivers technical assistance to trade-impacted businesses through 11 regional TAA centers (TAACs), with an aim to help these firms make “strategic adjustments that may allow them to remain competitive in a global economy” (Fefer 2017). TAACs apply for grants from EDA to carry out their technical assistance programs but cannot provide any direct financial assistance to firms. Originally, TAA for firms also included loans and loan guarantees, but these programs were eliminated by Congress in 1986 as part of budget cuts and because of concern over high default rates.
TAACs serve as consultants to businesses within their regions, providing expert support in the development of individualized strategies for firms adjusting to trade impacts. To receive assistance, a firm first submits a petition for certification, indicating that it is trade-impacted. Then, within two years, the firm must develop and submit an adjustment proposal, which the TAAC assists the firm in preparing. EDA approves the proposal if it materially contributes to the firm’s economic adjustment and addresses the needs of the firm’s workers. Finally, the firm must implement the adjustment proposal within five years; it may receive financial assistance from EDA (not the TAAC
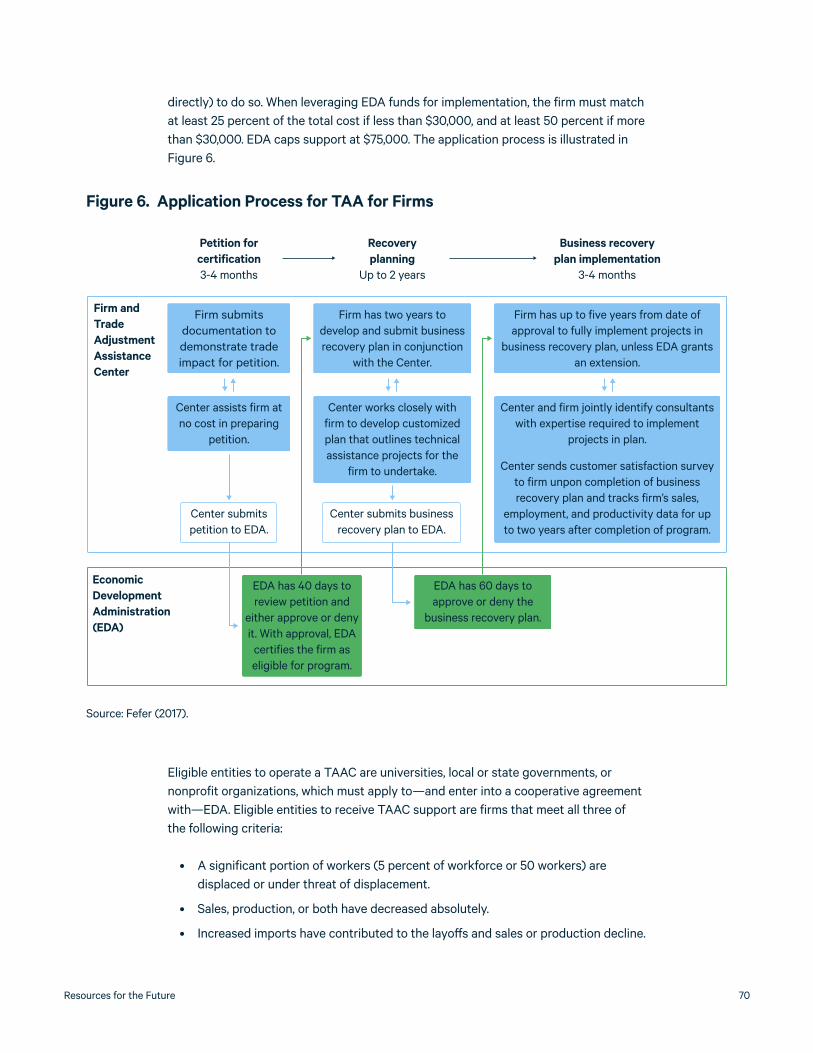
Resources for the Future 70
directly) to do so. When leveraging EDA funds for implementation, the firm must match at least 25 percent of the total cost if less than $30,000, and at least 50 percent if more than $30,000. EDA caps support at $75,000. The application process is illustrated in Figure 6.
Eligible entities to operate a TAAC are universities, local or state governments, or nonprofit organizations, which must apply to—and enter into a cooperative agreement with—EDA. Eligible entities to receive TAAC support are firms that meet all three of the following criteria:
• A significant portion of workers (5 percent of workforce or 50 workers) are displaced or under threat of displacement.
• Sales, production, or both have decreased absolutely.
• Increased imports have contributed to the layoffs and sales or production decline.
Figure 6. Application Process for TAA for Firms
Source: Fefer (2017).
Petition for certification3-4 months
Firm and Trade Adjustment Assistance Center
Economic Development Administration (EDA)
Center submits petition to EDA.
Center submits business recovery plan to EDA.
EDA has 60 days to approve or deny the
business recovery plan.
Recovery planning
Up to 2 years
Business recovery plan implementation
3-4 months
Firm submits documentation to demonstrate trade impact for petition.
Firm has two years to develop and submit business recovery plan in conjunction
with the Center.
Firm has up to five years from date of approval to fully implement projects in
business recovery plan, unless EDA grants an extension.
Center assists firm at no cost in preparing
petition.
Center works closely with firm to develop customized plan that outlines technical assistance projects for the
firm to undertake.
Center and firm jointly identify consultants with expertise required to implement
projects in plan.
Center sends customer satisfaction survey to firm unpon completion of business recovery plan and tracks firm’s sales,
employment, and productivity data for up to two years after completion of program.
EDA has 40 days to review petition and
either approve or deny it. With approval, EDA
certifies the firm as eligible for program.
Economic Development Policies to Enable Fairness for Workers and Communities in Transition 71
The program regularly receives between $10 million and $15 million in annual appropriations. In FY2015, assistance for petitions, adjustment proposal development, and project implementation totaled $9.5 million across 729 firms (Fefer 2017).
6.9.2.3.3. Trade Adjustment Assistance for Communities
Trade Adjustment Assistance for Communities (CTAA) was established in 2009 under the Trade and Globalization Adjustment Assistance Act (a subtitle of the American Recovery and Reinvestment Act) to provide assistance to communities experiencing job losses as a result of international trade. It had three subprograms, implemented by EDA and DOL.
Technical assistance and grants. Technical assistance is available for municipal planning5 focused on diversifying and boosting the local economy. After a plan has been approved by EDA, a community is eligible to receive an implementation grant6 for up to $5 million to realize the plan’s trade adjustment measures. The Interagency Community Assistance Working Group (ICAWG), led by EDA and comprosed of representatives from USDA, DOD, DOL, and several other federal agencies, helps trade-impacted communities access other federal assistance programs.
In FY2009, Congress appropriated $40 million for CTAA, followed by $15.8 million in FY2010, all of which was to be shared with the TAA for Firms program. EDA operated the CTAA program for just one year, FY2010, before it was repealed for being “duplicative.” EDA issued $37 million in grants to 36 entities that year (EDA 2017).
Eligible entities for technical assistance and grants were municipal governments for jurisdictions that contained groups of workers, firms, or agricultural producers that met eligibility criteria under TAA for Workers, Firms, or Farmers. To receive services, EDA had to confirm that the community was significantly threatened by job losses related to one of these three certifications (CRS 2011).
Community College and Career Training grants (CCCT). The second CTAA subprogram was a grant opportunity for community colleges developing training programs for workers experiencing trade impacts. Grants were administered by DOL-ETA and limited to one 36-month grant of $1 million per institution (CRS 2011). In 2010, CCCT was appropriated $2 billion of mandatory spending from 2011–2014, or $500 million per year (DOL 2020).
Eligible entities for CCCT were accredited institutions of higher education (or consortia of institutions), including private and for-profit schools, offering two-year or shorter
5 As directed by EDA, these plans were to be developed with broad stakeholder participation, includ-ing federal, state, and local agencies serving the community, labor, and the business community.
6 EDA was required to prioritize small and medium communities in its distribution of implementation grants.

Resources for the Future 72
programs that served workers eligible for TAA for Workers. EDA funds were awarded based on the likelihood that such programs could deliver employment opportunities, and on the need for such a training program in the community, such as the absence of comparable services (CRS 2011).
Industry or Sector Partnership Grants. This was a never-funded grant program to assist public-private partnerships that contributed to workforce development in trade-affected communities. Recipients could use funds to identify local training gaps, match skilled workers with firms, train and retrain workers, disseminate best practices among local industries, and assist firms in finding qualified employees. Grants were administered by DOL and limited to one grant of $2.5 million per partnership or $3 million for communities with no CCCT funding. Congress authorized a total of $90 million across fiscal years 2009 through 2011 but never appropriated the funds, so it remained unused (CRS 2011).
Eligible partnerships were voluntary organizations operating in communities with populations certified eligible for TAA for Workers, Farmers, or Firms. Grantees were required to have representation from business, labor, nonprofit, educational, and governmental stakeholders.
6.10. Secure Rural Schools Program
6.10.1. Overview
The Secure Rural School (SRS) program was established by the Secure Rural Schools and Community Self-Determination Act of 2000 (Public Law 106-393). The purpose is to ensure adequate funding for public services in communities historically dependent on timber from federal lands, the revenues from which declined substantially in the 1980s. Despite its name, SRS does not directly fund schools but instead provides payments to county governments or similar entities, such as parishes or boroughs. The federal government supported these counties in part through payments in lieu of taxes beginning in 1976; SRS funds began flowing in 2000. Funding for SRS has in recent years been reauthorized in one- or two-year increments (CRS 2017; Haggerty 2019) and expired in 2018 before being reauthorized in 2019, retroactively covering FY2018 and authorizing funding for FY2019 and FY2020.
6.10.2. Mechanisms and Implementation
6.10.2.1. Administrative Structure
SRS payments are primarily administered by the US Forest Service, part of USDA, and to a lesser extent by the Bureau of Land Management, in the Department of Interior. Payments under the program have been authorized on a semiregular basis, typically as part of larger spending bills (CRS 2017).

Economic Development Policies to Enable Fairness for Workers and Communities in Transition 73
6.10.2.2. Programs and Qualified Entities
As defined in the authorizing legislation, any county that contains certain federal lands (primarily national forests) and agrees to receive SRS payments can benefit from the program.
The total level of funding allocated under SRS is determined by congressional authorizations. The distribution of these payments is determined through a calculation that includes a county’s historical (1986 to 1999) share of payments, the acreage of national forest in the county, and the county’s per capita personal income. In recent years, total SRS payments have declined on aggregate (Figure 7).
The authorizing legislation makes some stipulations for how SRS payments may be used, with a substantial portion of funds to be spent on schools and/or roads. Counties receiving more than $100,000 in a given year are required to spend at least 15 to 20 percent on federal lands projects, emergency services, easement purchases, community service programs, and several other programs (CRS 2017).
In FY2016, payments to counties totaled more than $1 million for 30 states, and counties received some level of payment in 42 states. The largest recipients of SRS funds are found in the West, led by Oregon, California, Idaho, and Montana (Table 7).
Figure 7. SRS Payments, FY 2001–2015 (Million$, Nominal)
Source: CRS (2017).
$0
$100
$200
$300
$400
$500
$600
$700
2005 2010 2015
Forest Service Bureau of Land Management
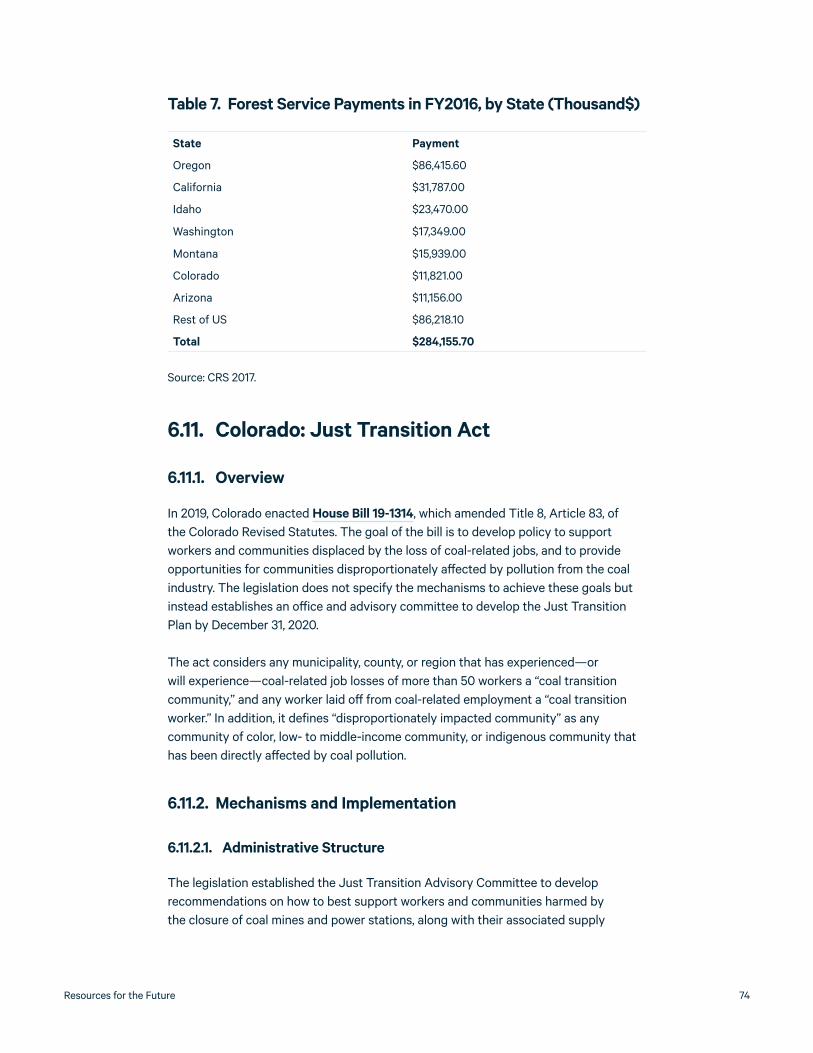
Resources for the Future 74
Table 7. Forest Service Payments in FY2016, by State (Thousand$)
State Payment
Oregon $86,415.60
California $31,787.00
Idaho $23,470.00
Washington $17,349.00
Montana $15,939.00
Colorado $11,821.00
Arizona $11,156.00
Rest of US $86,218.10
Total $284,155.70
Source: CRS 2017.
6.11. Colorado: Just Transition Act
6.11.1. Overview
In 2019, Colorado enacted House Bill 19-1314, which amended Title 8, Article 83, of the Colorado Revised Statutes. The goal of the bill is to develop policy to support workers and communities displaced by the loss of coal-related jobs, and to provide opportunities for communities disproportionately affected by pollution from the coal industry. The legislation does not specify the mechanisms to achieve these goals but instead establishes an office and advisory committee to develop the Just Transition Plan by December 31, 2020.
The act considers any municipality, county, or region that has experienced—or will experience—coal-related job losses of more than 50 workers a “coal transition community,” and any worker laid off from coal-related employment a “coal transition worker.” In addition, it defines “disproportionately impacted community” as any community of color, low- to middle-income community, or indigenous community that has been directly affected by coal pollution.
6.11.2. Mechanisms and Implementation
6.11.2.1. Administrative Structure
The legislation established the Just Transition Advisory Committee to develop recommendations on how to best support workers and communities harmed by the closure of coal mines and power stations, along with their associated supply

Economic Development Policies to Enable Fairness for Workers and Communities in Transition 75
chains. The committee is to be supported by the Just Transition Office, in the state Department of Labor and Employment. The committee is to consist of the directors (or their appointees) from the following units of state government and stakeholder groups:
• Department of Labor and Employment;
• Department of Economic Development;
• Energy Office;
• Department of Local Affairs;
• governor’s office;
• State Senate;
• State House;
• coal transition workers (x3);
• transition community members (x3);
• economic development and workforce training experts (x2);
• disproportionately impacted communities (x2); and
• electric utilities (x2).
Based on recommendations from the committee, the Just Transition Office is tasked with delivering a draft transition plan by July 1, 2020 and a final plan by December 31, 2020. The plan will offer recommendations on the following topics:
• existing local, state, and federal resources to support a just transition;
• new potential revenue sources for the transition;
• transition worker benefits;
• grant programs for communities.
The Just Transition Act also requires utilities retiring any coal-fired generating unit with capacity of 50 MW or greater to develop a workforce transition plan identifying the number of workers who will be affected and describing options for those workers (e.g., opportunities for transfers or early retirement). This provision does not apply to utilities that have submitted a comprehensive just transition plan to the state public utility commission.
6.11.2.2. Programs and Qualified Entities
Details are to be determined by the Just Transition Advisory Committee and the Just Transition Office.

Resources for the Future 76
6.12. New Mexico: Energy Transition Act
6.12.1. Overview
In 2019, New Mexico enacted Senate Bill 489, the Energy Transition Act. The bill sets targets for electricity generators to produce 100 percent of their power from zero-emissions sources by 2045 (for public utilities) and 2050 (for co-ops). The act also requires the state’s coal plants to be abandoned by 2023 (for public utilities) or 2032 (for other utilities) and increases the state’s renewable portfolio standard for both utilities and co-ops.
To help finance the closure of coal plants, particularly one large plant in the state’s northwest, utilities are permitted to issue energy transition bonds of up to $375 million per plant, up to $30 million of which is to be used for plant decommissioning and mine reclamation, $20 million for worker severance and retraining, and the remainder to the undepreciated value of the plant. These bonds will in turn be financed through a dedicated energy transition charge added to ratepayers’ monthly bills.
Finally, the act establishes several requirements for utilities, including that they explicitly account for the local economic and employment benefits of building new generation sources in certain communities, and that they hire a substantial share of apprentices from diverse backgrounds in the construction of new plants.
6.12.2. Mechanisms and Implementation
6.12.2.1. Administrative Structure
To support workers and communities affected by closures, the legislation establishes three funds and tasks three state agencies to develop plans to use these funds to support affected workers and communities. Agencies are required to gather input from stakeholders and the public and hold at least three public meetings each. Local advisory committees are required to have diverse stakeholders.
Table 8 summarizes the three programs and the lead agencies.
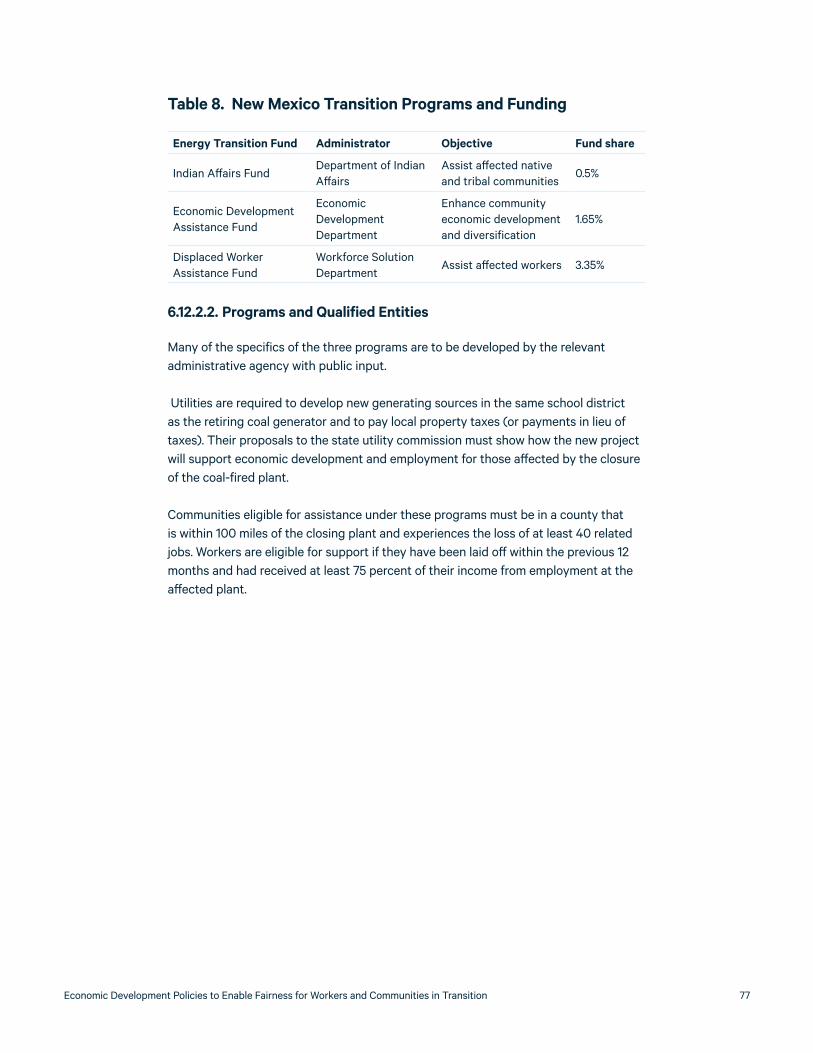
Economic Development Policies to Enable Fairness for Workers and Communities in Transition 77
Table 8. New Mexico Transition Programs and Funding
Energy Transition Fund Administrator Objective Fund share
Indian Affairs FundDepartment of Indian Affairs
Assist affected native and tribal communities
0.5%
Economic Development Assistance Fund
Economic Development Department
Enhance community economic development and diversification
1.65%
Displaced Worker Assistance Fund
Workforce Solution Department
Assist affected workers 3.35%
6.12.2.2. Programs and Qualified Entities
Many of the specifics of the three programs are to be developed by the relevant administrative agency with public input.
Utilities are required to develop new generating sources in the same school district as the retiring coal generator and to pay local property taxes (or payments in lieu of taxes). Their proposals to the state utility commission must show how the new project will support economic development and employment for those affected by the closure of the coal-fired plant.
Communities eligible for assistance under these programs must be in a county that is within 100 miles of the closing plant and experiences the loss of at least 40 related jobs. Workers are eligible for support if they have been laid off within the previous 12 months and had received at least 75 percent of their income from employment at the affected plant.

Resources for the Future 78
7. ReferencesAcs, Zoltan J., and Catherine Armington. 2004. The Impact of Geographic Differences in
Human Capital on Service Firm Formation Rates. Journal of Urban Economics 56(2): 244–78. https://doi.org/10.1016/j.jue.2004.03.008.
ARC (Appalachian Regional Commission). 2018. Performance and Accountability Report 2018. https://www.arc.gov/images/newsroom/publications/fy2018par/FY2018PerformanceandAccountabilityReport.pdf.
———. 2019. Performance and Accountability Report 2019. https://www.arc.gov/images/newsroom/publications/fy2019par/FY2019PerformanceandAccountabilityReport.pdf.
Army. 1987. Army Study of Defense Agencies and DOD Field Activities: Findings and Recommendations for Individual Agencies and Activities. Headquarters, Department of the Army.
Austin, Benjamin A., Edward L. Glaeser, and Lawrence H. Summers. 2018. Jobs for the Heartland: Place-Based Policies in 21st Century America. Working paper 24548. Cambridge, MA: National Bureau of Economic Research. https://doi.org/10.3386/w24548.
Badasyan, Narine, David Shideler, and Laura Taylor. 2007. The Economic Impact of Broadband Deployment in Kentucky. Regional Economic Development. Federal Reserve Bank of St. Louis. https://ideas.repec.org/a/fip/fedlrd/y2007inovp88-118nv.3no.2.html.
Bartik, Timothy J. 1990. The Market Failure Approach to Regional Economic Development Policy. Economic Development Quarterly 4(4): 361–70. https://doi.org/10.1177/089124249000400406.
Becker, K.C., Rochelle Galindo, Faith Winter, and Kerry Donovan. 2019. Just Transition from Coal-Based Electrical Energy Economy. https://leg.colorado.gov/bills/hb19-1314.
BGA (Blue Green Alliance). 2020. Solidarity for Climate Action. http://www.bluegreenalliance.org/wp-content/uploads/2019/07/Solidarity-for-Climate-Action-vFINAL.pdf.
Blakely, Edward J., and Nancey Green Leigh. 2013. Planning Local Economic Development. London: SAGE.
Bolton, Roger. 1992. Place Prosperity vs People Prosperity Revisited: An Old Issue with a New Angle. Urban Studies 29(2): 185–203. https://doi.org/10.1080/00420989220080261.
Brown, J. David, and John S. Earle. 2017. Finance and Growth at the Firm Level: Evidence from SBA Loans. Journal of Finance 72(3): 1039–80. https://doi.org/10.1111/jofi.12492.
Candelaria, Jacob R., Nathan Small, Mimi Stewart, Patricia Roybal Caballero, and Brian Egolf. 2019. Energy Transition Act. https://www.nmlegis.gov/Sessions/19%20Regular/bills/senate/SB0489.html.
CARES (Coronavirus Aid, Relief, and Economic Security) Act. Public Law 116-136, 116th Cong., 2nd sess (March).
Carley, Sanya, Tom P. Evans, and David M. Konisky. 2018. Adaptation, Culture, and the Energy Transition in American Coal Country. Energy Research & Social Science 37(March): 133–39. https://doi.org/10.1016/j.erss.2017.10.007.
Economic Development Policies to Enable Fairness for Workers and Communities in Transition 79
Carley, Sanya, Sara Lawrence, Adrienne Brown, Andrew Nourafshan, and Elinor Benami. 2011. Energy-Based Economic Development. Renewable and Sustainable Energy Reviews 15(1): 282–95. https://doi.org/10.1016/j.rser.2010.08.006.
CDFI Coalition. 2019. FY2020 Programmatic Appropriations Request. https://cdfi.org/wp- content/uploads/2019/06/FY-20-Appropriations-Fact-Sheet_June.pdf.
CDFI Coalition. 2020 Appropriations History. https://cdfi.org/policy-and-advocacy/appropriations-history/.
Cecire, Michael. 2019. The POWER Initiative: Energy Transition as Economic Development. Congressional Research Service Report R46105. https://fas.org/sgp/crs/misc/R46015.pdf
Chamberlin, Molly, Nicole Dunn, Abigail Kelly-Smith, and Dorinda Byers. 2019. Success Factors, Challenges, and Early Impacts of the POWER Initiative: An Implementation Evaluation. PW-19412-18. Prepared for the Appalachian Regional Commission: Chamberlin Dunn LLC. https://www.arc.gov/images/grantsandfunding/POWER2020/POWERFY2019Evaluation-FinalReport.pdf.
Chen, Yong, and Bruce Weber. 2012. Federal Policy, Rural Community Growth, and Wealth Creation: The Impact of the Federal Forest Policy and Rural Development Spending in the Pacific Northwest. American Journal of Agricultural Economics 94(2): 542–48. https://doi.org/10.1093/ajae/aar065.
Coglianese, John, Todd D. Gerarden, and James H. Stock. 2020. The Effects of Fuel Prices, Environmental Regulations, and Other Factors on U.S. Coal Production, 2008-2016. Energy Journal 41(1). https://doi.org/10.5547/01956574.41.1.jcog.
Collins, Benjamin. 2019. Trade Adjustment Assistance for Workers and the TAA Reauthorization Act of 2015. Congressional Research Service, Washington, DC. https://crsreports.congress.gov/product/pdf/R/R44153.
Cowan, Tadlock. 2016. An Overview of USDA Rural Development Programs. 7–5700. Congressional Research Service, Washington, DC. https://fas.org/sgp/crs/misc/RL31837.pdf.
Cowley, Stacy. 2020. F.A.Q. on Coronavirus Relief for Small Businesses, Freelancers and More. New York Times, April 7. https://www.nytimes.com/article/small-business-loans-stimulus-grants-freelancers-coronavirus.html.
Craig, Ben R., William E. Jackson, and James B. Thomson. 2009. The Economic Impact of the Small Business Administration’s Intervention in the Small Firm Credit Market: A Review of the Research Literature*. Journal of Small Business Management 47(2): 221–31. https://doi.org/10.1111/j.1540-627X.2009.00269.x.
CRS (Congressional Research Service). 2011. Trade Adjustment Assistance for Communities: The Law and Its Implementation. R40863. Washington, DC. https://www.everycrsreport.com/reports/R40863.html.
———. 2017. Reauthorizing the Secure Rural Schools and Community Self-Determination Act of 2000. https://www.everycrsreport.com/files/20170606_R41303_efa72e24dcceb76f5df74ba8999ec7b40dd4936b.pdf.
———. 2018. Community Development Financial Institutions (CDFI) Fund: Programs and Policy Issues. R42770. https://fas.org/sgp/crs/misc/R42770.pdf.

Resources for the Future 80
———. 2019a. Federal Regional Commissions and Authorities: Structural Features and Function. R45997. Washington, DC. https://fas.org/sgp/crs/misc/R45997.pdf.
———. 2019b. The POWER Initiative: Energy Transition as Economic Development. R46015. Washington, DC. https://fas.org/sgp/crs/misc/R46015.pdf.
———. 2019c. Small Business Administration (SBA) Funding: Overview and Recent Trends. Congressional Research Service. https://crsreports.congress.gov/product/pdf/R/R43846.
———. 2019d. Trade Related Agencies: FY2019 Appropriations, Commerce, Justice, Science and Related Agencies (CJS). R45335. https://fas.org/sgp/crs/misc/R45335.pdf.
Dilger, Robert Jay. 2019a. SBA Office of Advocacy: Overview, History, and Current Issues. Congressional Research Service. https://fas.org/sgp/crs/misc/R43625.pdf.
———. 2019b. Small Business Administration 504/CDC Loan Guaranty Program, October, 39.
Dilger, Robert Jay, and Sean Lowry. 2019. Small Business Administration: A Primer on Programs and Funding. https://fas.org/sgp/crs/misc/RL33243.pdf.
DOD (Department of Defense). 2020. Office of Economic Adjustment Operation and Maintenance, Defense-Wide Fiscal Year (FY) 2021 Budget Estimates. Washington, DC. https://comptroller.defense.gov/Portals/45/Documents/defbudget/fy2021/budget_justification/pdfs/01_Operation_and_Maintenance/O_M_VOL_1_PART_1/OEA_OP-5.pdf.
———. 2020. Office of Economic Adjustment Operation and Maintenance, Defense-Wide: Fiscal Year (FY) 2021 Budget Estimates. Washington, DC. https://comptroller.defense.gov/Portals/45/Documents/defbudget/fy2021/budget_justification/pdfs/01_Operation_and_Maintenance/O_M_VOL_1_PART_1/OEA_OP-5.pdf.
DOL (Department of Labor). 2019. Trade Adjustment Assistance for Workers Program: FY 2018 Annual Report. U.S. Department of Labor. https://www.doleta.gov/tradeact/docs/AnnualReport18.pdf.
———. 2020. TAA CCCT Funding. Washington, DC. https://www.dol.gov/agencies/eta/tradeact/community-colleges/funding.
Drabenstott, Mark. 2006. Rethinking Federal Policy for Regional Economic Development. Federal Reserve Bank of Kansas City. https://core.ac.uk/download/pdf/6793333.pdf.
EDA (Economic Development Administration). 2010. Annual Report to Congress on the Community Trade Adjustment Assistance Program. Department of Commerce, Washington, DC. https://www.eda.gov/pdf/annual-reports/FY10_CTAA_Annual_Report_to_Congress.pdf.
———. 2016. Eligibility Requirements and Criteria. Department of Commerce, Washington, DC. https://www.eda.gov/archives/2016/how-to-apply/files/Eligibility-Requirements-and-Criteria.pdf.
———. 2017a. EDA Assistance to Coal Communities, Frequently Asked Questions (FAQ). Department of Commerce, Washington, DC, June 19. https://www.eda.gov/files/coal/2017-acc-faq.pdf.
———. 2017b. Elimination of Regulations Implementing Community Trade Adjustment Assistance Program. 82 CFR 48760. Department of Commerce, Washington, DC. https://www.federalregister.gov/documents/2017/10/20/2017-22782/elimination-of-regulations-implementing-community-trade-adjustment-assistance-program.

Economic Development Policies to Enable Fairness for Workers and Communities in Transition 81
———. 2018a. EDA Atlanta FY 2016–FY 2019 Planning Program and Local Technical Assistance Program. Department of Commerce, Washington, DC. March 20, 2018. https://www.grants.gov/web/grants/view-opportunity.html?oppId=301958.
———. 2018b. Economic Development Research and National Technical Assistance FY18-FY20. Department of Commerce, Washington, DC. https://www.grants.gov/web/grants/view-opportunity.html?oppId=305782.
———. 2019a. EDA FY2018 Annual Report. Department of Commerce, Washington, DC. https://www.eda.gov/files/annual-reports/fy2018/EDA-FY2018-Annual-Report-full.pdf.
———. 2019b. FY 2019 EDA Disaster Supplemental. Department of Commerce, Washington, DC. https://www.grants.gov/web/grants/view-opportunity.html?oppId=319126.
———. 2019c. U.S. Department of Commerce Invests to Establish Advanced Carbon Products Innovation Center in Campbell County, Wyoming. Department of Commerce, Washington, DC. September 27, 2019. https://www.eda.gov/news/press-releases/2019/08/26/Gillette-wy.htm.
———. 2019d. FY 2020 EDA Public Works and Economic Adjustment Assistance Programs. Department of Commerce, Washington, DC. October 18, 2019. https://www.grants.gov/web/grants/view-opportunity.html?oppId=321695.
———. 2020a. 2017 Assistance to Coal Communities. Department of Commerce, Washington, DC. https://www.eda.gov/coal/2017/.
———. 2020b. Build to Scale (B2S) Program. Department of Commerce, Washington, DC. https://www.eda.gov/oie/buildtoscale/.
———. 2020c. Disaster Supplemental Funding. Department of Commerce, Washington, DC. https://www.eda.gov/disaster-recovery/supplemental/.
———. 2020d. History: EDA@50. https://www.eda.gov/archives/2016/50/history/.
———. 2020e. Latest EDA Grants. 2020. https://www.eda.gov/grants/.
———. 2020f. Leadership. Department of Commerce, Washington, DC. https://www.eda.gov/about/leadership/.
———. 2020g. Local Technical Assistance and University Center Programs. Department of Commerce, Washington, DC. https://www.eda.gov/pdf/about/Local-TA-and-UC-Program-1-Pager.pdf.
———. 2020h. Previous Funding Opportunities. Department of Commerce, Washington, DC. https://www.eda.gov/funding-opportunities/previous/.
———. 2020i. Research and Evaluation Program. Department of Commerce, Washington, DC. https://www.eda.gov/pdf/about/Research-and-Evaluation-Program-1-Pager.pdf.
———. 2020j. University Center Economic Development Program: Bringing Research to Work. Department of Commerce, Washington, DC. https://www.eda.gov/programs/university-centers/.
———. 2020k. 2020 Build to Scale Program - Concept Proposal. Department of Commerce, Washington, DC. https://www.grants.gov/web/grants/view-opportunity.html?oppId=324375.

Resources for the Future 82
———. 2020l. Build to Scale Webinar. Department of Commerce, Washington, DC. https://www.eda.gov/files/oie/b2s/2020.02.25-Build-to-Scale-Webinar_slidesonly.pdf.
Eisinger, Peter K. 1988. The Rise of the Entrepreneurial State: State and Local Economic Development Policy in the United States. Madison: University of Wisconsin Press.
Electronic Code of Federal Regulations. 2012. E-CFR: Substantially Underserved Trust Areas. Electronic Code of Federal Regulations. https://www.ecfr.gov/cgi-bin/text-idx?SID=46c922a79eb2dfdf3f366dd67f222662&node=7:11.1.2.1.1.4&rgn=div6#se7.11.1700_1102.
Fefer, Rachel F. 2017. Trade Adjustment Assistance for Firms. RS20210. Congressional Research Service, Washington, DC. https://fas.org/sgp/crs/misc/RS20210.pdf.
GAO (Government Accountability Office). 2011. Efficiency and Effectiveness of Fragmented Economic Development Programs Are Unclear. 11-477R. Washington, DC. https://www.gao.gov/products/GAO-11-477R.
———. 2012. Trade Adjustment Assistance: Commerce Program Has Helped Manufacturing and Services Firms, but Measures, Data, and Funding Formula Could Improve. GAO-12-930. Washington, DC. https://www.gao.gov/products/GAO-12-930.
———. 2017a. Economic Development Programs (2011-09) Action Tracker. Action Tracker. 2017. https://www.gao.gov/duplication/action_tracker/Economic_Development_Programs_%282011-09%29/action1#t=0.
———. 2017b. U.S. Manufacturing: Federal Programs Reported Providing Support and Addressing Trends. GAO-17-240. Washington, DC. https://www.gao.gov/assets/690/683753.pdf.
Gebert, Krista M., David E. Calkin, and Ervin G. Schuster. 2004. The Secure Rural Schools Act of 2000: Does It Make Rural Schools Secure? Journal of Education Finance 30(2): 176–86.
Gillett, Sharon E., William H. Lehr, Carlos A. Osorio, and Marvin A. Sirbu. 2006. Measuring Broadbandʼs Economic Impact. National Technical Assistance, Training, Research, and Evaluation Project #99-07-13829. Washington, DC: Prepared for the US Economic Development Administration. http://cfp.mit.edu/publications/CFP_Papers/Measuring_bb_econ_impact-final.pdf.
Gomez, Juan, Gianfranco Piras, Donald Lacombe, and Randall Jackson. 2015. Impact Evaluation of Investments in the Appalachian Region: A Reappraisal. Regional Research Institute Publications and Working Papers, West Virginia University [correct?], August. https://researchrepository.wvu.edu/cgi/viewcontent.cgi?article=1016&context=rri_pubs.
Haggerty, Mark. 2019. Rethinking the Fiscal Relationship Between Public Lands and Public Land Counties: County Payments 4.0. Humboldt Journal of Social Relations 40:116-136. https://headwaterseconomics.org/wp-content/uploads/Paper-Endowing-Federal-Public-Land-Counties.pdf.
Hall, Jeremy L. 2010. The Distribution of Federal Economic Development Grant Funds: A Consideration of Need and the Urban/Rural Divide. Economic Development Quarterly, June. https://doi.org/10.1177/0891242410366562.
Hooker, Mark A., and Michael M. Knetter. 2001. Measuring the Economic Effects of Military Base Closures. Economic Inquiry 39(4): 583–98. https://doi.org/10.1093/ei/39.4.583.
Economic Development Policies to Enable Fairness for Workers and Communities in Transition 83
HUD (Department of Housing and Urban Development). 2020. Overview of the Base Redevelopment Process. Washington, DC. https://www.hud.gov/sites/documents/DOC_17246.PDF.
Hultquist, Andy, and Tricia L. Petras. 2012. An Examination of the Local Economic Impacts of Military Base Closures. Economic Development Quarterly 26(2): 151–61. https://doi.org/10.1177/0891242412442374.
IEA (International Energy Agency). 2020. Global Energy Review 2020. Paris. https://www.iea.org/reports/global-energy-review-2020.
ILO (International Labour Organization). 2015. Guidelines for a Just Transition towards Environmentally Sustainable Economies and Societies for All. Geneva. https://www.ilo.org/wcmsp5/groups/public/---ed_emp/---emp_ent/documents/publication/wcms_432859.pdf.
James, Nathan. 2018. Overview of FY2018 Appropriations for Commerce, Justice, Science, and Related Agencies (CJS). Washington, DC: Congressional Research Service. https://fas.org/sgp/crs/misc/R44877.pdf.
Janeski, Ivica, and Brian E. Whitacre. 2014. Long-Term Economic Impacts of USDA Water and Sewer Infrastructure Investments in Oklahoma. Journal of Agricultural and Applied Economics 46(1): 21–39. https://doi.org/10.1017/S1074070800000614.
Johnson, Janna. 2009. Rural Economic Development in the United States: An Evaluation of the U.S. Department of Agriculture’s Business and Industry Guaranteed Loan Program. Economic Development Quarterly 23 (3): 229–41. https://doi.org/10.1177/0891242408331026.
Kandilov, Ivan T., and Mitch Renkow. 2010. Infrastructure Investment and Rural Economic Development: An Evaluation of USDA’s Broadband Loan Program. Growth and Change 41(2): 165–91. https://doi.org/10.1111/j.1468-2257.2010.00524.x.
Kandilov, Amy M. G., Ivan T. Kandilov, Xiangping Liu, and Mitch Renkow. 2017. The Impact of Broadband on U.S. Agriculture: An Evaluation of the USDA Broadband Loan Program. Applied Economic Perspectives and Policy 39(4): 635–61. https://doi.org/10.1093/aepp/ppx022.
Kolko, Jed. 2012. Broadband and Local Growth. Journal of Urban Economics 71(1): 100–13. https://doi.org/10.1016/j.jue.2011.07.004.
Krizan, C. J. 1998. Localized Effects of California’s Military Base Realignments: Evidence from Multi-Sector Longitudinal Microdata. Working paper 98–19. Washington, DC: Center for Economic Studies, US Census Bureau. https://ideas.repec.org/p/cen/wpaper/98-19.html.
Krugman, Paul. 1991. Increasing Returns and Economic Geography. Journal of Political Economy 99(3): 483–99. https://doi.org/10.1086/261763.
LaRose, Robert, Sharon Strover, Jennifer L. Gregg, and Joseph Straubhaar. 2011. The Impact of Rural Broadband Development: Lessons from a Natural Field Experiment. Government Information Quarterly 28(1): 91–100. https://doi.org/10.1016/j.giq.2009.12.013.
Lawrence, Sarah, Zachary Oliver, Michael Hogan, Jim Baller, John Horrigan, Mark Johnson, Jane Smith Patterson, Ashley Stelfox, and Deborah Watts. 2015. Program Evaluation of Broadband Access Grants in Appalachia. Program Evaluation 0214556.: Prepared by RTI International for the Appalachian Regional Commission, Research Triangle Park, NC. https://www.rti.org/impact/program-evaluation-broadband-access-grants-appalachia-0.

Resources for the Future 84
Markusen, Ann, and Amy Glasmeier. 2008. Overhauling and Revitalizing Federal Economic Development Programs. Economic Development Quarterly, May. http://journals.sagepub.com/doi/10.1177/0891242408314281.
Martin, Randolph C. 1980. Federal Regional Development Programs and Growth in Non-Farm County Income. Annals of Regional Science 14(3): 79–94. https://doi.org/10.1007/BF01287315.
———. 1981. A Note on the Cost per Job Created by Federal Regional Development Programs. Journal of Regional Analysis and Policy 11(1100-2016–89979): 49–55.
Martin, Randolph C., and Robert E. Graham. 1980. The Impact of Economic Development Administration Programs: Some Empirical Evidence. Review of Economics and Statistics 62(1): 52–62. https://doi.org/10.2307/1924272.
Matti, Josh. 2019. The Political Economy of the U.S. Department of Agriculture Rural Business-Cooperative Service. Economic Development Quarterly 33(3): 203–11. https://doi.org/10.1177/0891242419840703.
McCaul, Michael T. 2019. Consolidated Appropriations Act, 2020. https://www.congress.gov/bill/116th-congress/house-bill/1158/text.
McMinimy, Mark A. 2016. Trade Adjustment Assistance for Farmers. https://fas.org/sgp/crs/misc/R40206.pdf.
MEP (Manufacturing Extension Partnership). 2013. Making an Impact on US Manufacturing. https://www.nist.gov/system/files/documents/mep/MEP-PARTNERING-IMPACTS-2013-2.pdf.
———. 2018. NIST MEP Annual Report: 1998-2018 The MEP Program Turns 30. https://www.nist.gov/system/files/documents/2019/11/21/MEP_Annual_Report_2018_web-508- NEW.pdf.
———. 2020a. Rolling Competitive Awards Program. https://www.nist.gov/mep/rolling-competitive-awards-program.
———. 2020b. MEP Statute and Regulations
Monke, Jim. 2020a. Agriculture and Related Agencies: FY2020 Appropriations. Congressional Research Service, Washington, DC. https://crsreports.congress.gov/product/pdf/R/R45974.
———. 2020b. Agriculture and Related Agencies: FY2020 Appropriations. Congressional Research Service. https://crsreports.congress.gov/product/pdf/R/R45974.
NIST (National Institute of Standards and Technology). 2020. Manufacturing Extension Partnership. https://www.nist.gov/mep
OEA (Office of Economic Adjustment). 2016. Arizona Diversification Initiative. Department of Defense, Washington, DC. https://web.archive.org/web/20161220082249/ http://oea.gov/project/arizona-diversification-initiative.
———. 2020a. Community Investment. Department of Defense, Washington, DC. https://www.oea.gov/our-programs/community-investment.
———. 2020b. Downsizing. Department of Defense, Washington, DC. https://www.oea.gov/our-programs/downsizing#block1.

Economic Development Policies to Enable Fairness for Workers and Communities in Transition 85
———. 2020c. Industry Resilience. Department of Defense, Washington, DC. https://www.oea.gov/our-programs/industry-resilience.
———. 2020d. Military Installation Sustainability. Department of Defense, Washington, DC. https://www.oea.gov/our-programs/military-installation-sustainability.
Pascrell, Bill. 2019. Further Consolidated Appropriations Act, 2020. https://www.congress.gov/bill/116th-congress/house-bill/1865/t?q=%7B%22search%22%3A%5B%22consolidated+appropriations%22%5D%7D&r=5&s=5.
Porter, Michael E. 1998. Clusters and the New Economics of Competition. Harvard Business Review, November. https://hbr.org/1998/11/clusters-and-the-new-economics-of-competition.
Roemer, John E. 2014. Economic Development as Opportunity Equalization. World Bank Economic Review 28(2): 189–209. https://doi.org/10.1093/wber/lht023.
Rupasingha, Anil, Daniel Crown, and John Pender. 2019. Rural Business Programs and Business Performance: The Impact of the USDA’s Business and Industry (B&I) Guaranteed Loan Program. Journal of Regional Science 59(4): 701–22. https://doi.org/10.1111/jors.12421.
Sargent, John. 2019. The Manufacturing Extension Partnership Program. Congressional Research Service Report R44308. https://crsreports.congress.gov/product/pdf/R/R44308.
Schultz, Theodore W. 1956. The Role of Government in Promoting Economic Growth. In The State of the Social Sciences, 372–82. Chicago: University of Chicago Press.
SBA (Small Business Administration). 2015. SBA Funds Three New Regional Innovation Clusters. PR Newswire. https://www.prnewswire.com/news-releases/sba-funds-three-new-regional-innovation-clusters-300160112.html.
———. 2020a. 7(a) Loan Program: Terms, Conditions, and Eligibility. Small Business Administration. https://www.sba.gov/partners/lenders/7a-loan-program/terms-conditions-eligibility#section-header-19.
———. 2020b. About Boots to Business. Washington, DC. https://www.sba.gov/offices/headquarters/ovbd/resources/160511.
———. 2020c. Find Local Assistance. Washington, DC. https://www.sba.gov/local-assistance/find/.
———. 2020d. Grants Programs and Eligibility. Washington, DC. https://www.sba.gov/funding-programs/grants/grants-programs-eligibility.
———. 2020e. Microloan Program. Washington, DC. https://www.sba.gov/loans-grants/see-what-sba-offers/sba-loan-programs/microloan-program%20.
———. 2020f. Office of Capital Access. Washington, DC. https://www.sba.gov/offices/headquarters/oca/resources/11416.
———. 2020g. Office of Investment and Innovation. Washington, DC. https://www.sba.gov/offices/headquarters/ooi.
———. 2020h. Organization. Washington, DC. https://www.sba.gov/about-sba/organization.

Resources for the Future 86
———. 2020i. Rural Initiative Pilot Program. Washington, DC. https://www.sba.gov/partners/lenders/cdc504-loan-program/rural-initiative-pilot-program.
———. 2020j. State Trade Expansion Program (STEP). Washington, DC. https://www.sba.gov/funding-programs/grants/state-trade-expansion-program-step.
———. 2020k. Terms, Conditions, and Eligibility. Washington, DC. https://www.sba.gov/partners/lenders/7a-loan-program/terms-conditions-eligibility#section-header-19.
———. 2020l. The Makerspace Training, Collaboration, and Hiring (MaTCH) Pilot Competition. Washington, DC. https://www.sba.gov/match.
———. 2020m. The Three Step Process: Disaster Loans. Washington, DC. https://disasterloan.sba.gov/ela/Documents/Three_Step_Process_SBA_Disaster_Loans.pdf.
———. 2020n. Types of 7(a) Loans. Washington, DC. https://www.sba.gov/partners/lenders/7a-loan-program/types-7a-loans.
SBIR (Small Business Innovation Research). 2020a. About SBIR. Small Business Administration, Washington, DC. https://www.sbir.gov/about/about-sbir.
———. 2020b. Applicants. https://www.sbir.gov/applicants. Small Business Administration, Washington, DC.
SCORE. 2019. About SCORE. SCORE. https://www.score.org/about-score.
Stenberg, Peter L., Mitch Morehart, Stephen Vogel, John Cromartie, Vince Breneman, and Dennis Brown. 2009. Broadband Internet’s Value for Rural America. USDA Economic Research Service. http://www.ers.usda.gov/publications/pub-details/?pubid=46215.
US Cluster Mapping. 2018. U.S. Cluster Mapping. https://www.clustermapping.us/.
USDA (US Department of Agriculture). 2016. Community Facilities Technical Assistance and Training Grant. Washington, DC. https://www.rd.usda.gov/sites/default/files/fact-sheet/RD-RHS-CommunityFacilitiesTAT.pdf.
———. 2019. USDA Rural Development Fiscal Year 2018 Funding. Washington, DC. https://www.rd.usda.gov/files/RD_Loan_Portfolio071119.pdf.
———. 2020a. About RD. Washington, DC. https://www.rd.usda.gov/about-rd.
———. 2020b. Agencies | Rural Development. Washington, DC. https://www.rd.usda.gov/about-rd/agencies.
———. 2020c. Community Economic Development. Washington, DC. https://www.rd.usda.gov/about-rd/initiatives/community-economic-development.
———. 2020d. Mutual Self-Help Housing Technical Assistance Grants. Washington, DC. https://www.rd.usda.gov/programs-services/mutual-self-help-housing-technical-assistance-grants.
———. 2020a. National Rural Development Partnership. https://www.rd.usda.gov/files/USDARD-NRDP.pdf.
———. 2020e. Offices | Rural Development. Washington, DC. https://www.rd.usda.gov/about-rd/offices.

Economic Development Policies to Enable Fairness for Workers and Communities in Transition 87
———. 2020f. Rural Community Development Initiative Grants. Washington, DC. https://www.rd.usda.gov/programs-services/rural-community-development-initiative-grants.
———. 2020g. Rural Economic Area Partnership Program (REAP Zones) | Rural Development. https://www.rd.usda.gov/programs-services/businesses/rural-economic-area-partnership-program-reap-zones.
———. 2020h. Substantially Underserved Trust Area (SUTA). Washington, DC. https://www.rd.usda.gov/about-rd/initiatives/substantially-underserved-trust-area-suta.
US Forest Service. 2020. Final Payment Summary Report. ASR-10-01. US Department of Agriculture, Washington, DC. https://www.fs.usda.gov/Internet/FSE_DOCUMENTS/fseprd718567.pdf.
Weber, Bruce, Paul Lewin, and Bruce Sorte. 2011. Economic Impacts on Oregon of the Termination of Secure Rural Schools Payments to Counties: 2011 Update. Working paper 11-01. Corvallis, OR: Oregon State University Rural Studies Program. https://www.researchgate.net/profile/Paul_Lewin/publication/257526887_Economic_Impacts_on_Oregon_of_the_Termination_of_Secure_Rural_Schools_Payments_to_Counties_2011_Update/links/0deec5255c951ecbc3000000.pdf.
Wharton, Clifton R. 1958. The Nature of Technical Assistance for Economic Development. Economic Development and Cultural Change 6(2): 109–28.
White House. 2015. Fact Sheet: The Partnerships for Opportunity and Workforce and Economic Revitalization (POWER) Initiative. March 27. Whitehouse.Gov. https://obamawhitehouse.archives.gov/the-press-office/2015/03/27/fact-sheet-partnerships-opportunity-and-workforce-and-economic-revitaliz.
———. 2016. Fact Sheet: Administration Announces New Economic and Workforce Development Resources for Coal Communities through POWER Initiative. Washington, DC, August 24. https://obamawhitehouse.archives.gov/the-press-office/2016/08/24/fact-sheet-administration-announces-new-economic-and-workforce.
Winnick, Louis. 1966. Place Prosperity vs. People Prosperity: Welfare Considerations in the Geographic Redistribution of Economic Activity. Essays in Urban Land Economics, 273–83.

Resources for the Future 88