Paper 2 Challenges in the human environment - Sample set ...
34
Summary of changes This is an amended version of the 2018 8035/2 Paper 2: Challenges in the human environment to show the structure of the paper for 2022 only. The purpose of this is specimen is to illustrate the changes made due to the introduction of optionality for 2022 only. It will demonstrate the new rubric and where any marks are being removed or added but does not contain any new questions. Changes to rubric • Students will answer all questions in Section A. • Students will answer either Section B or Section C. • If students choose Section B, they must answer all questions. • If students choose Section C, they must answer Question 3 and either Question 4 or Question 5 or Question 6. Changes to marks • In Section B, the 9 mark question will be replaced with a 6 mark question. To maintain a total of 30 marks, 3 marks will be introduced elsewhere in Section B. • A total of 5 marks will be introduced to Section C. The section will now be worth 30 marks, equivalent to Section B. For the purposes of this illustration, we have added these marks into Q3. In 2022, they could appear anywhere in Section C. Other changes • The total time allocation will reduce from 1 hour 30 minutes to 1 hour 15 minutes. • Total marks will reduce from 88 to 63 (a removal of 25 marks).
-
Upload
khangminh22 -
Category
Documents
-
view
1 -
download
0
Transcript of Paper 2 Challenges in the human environment - Sample set ...

Summary of changes This is an amended version of the 2018 8035/2 Paper 2: Challenges in the human environment to show the structure of the paper for 2022 only. The purpose of this is specimen is to illustrate the changes made due to the introduction of optionality for 2022 only. It will demonstrate the new rubric and where any marks are being removed or added but does not contain any new questions.
Changes to rubric • Students will answer all questions in Section A.• Students will answer either Section B or Section C.• If students choose Section B, they must answer all questions.• If students choose Section C, they must answer Question 3 and either
Question 4 or Question 5 or Question 6.
Changes to marks • In Section B, the 9 mark question will be replaced with a 6 mark question.
To maintain a total of 30 marks, 3 marks will be introduced elsewhere inSection B.
• A total of 5 marks will be introduced to Section C. The section will now beworth 30 marks, equivalent to Section B. For the purposes of this illustration,we have added these marks into Q3. In 2022, they could appear anywhere inSection C.
Other changes • The total time allocation will reduce from 1 hour 30 minutes to 1 hour 15
minutes.• Total marks will reduce from 88 to 63 (a removal of 25 marks).


8035/2
For Examiner’s Use
Question Mark
1
2
3
4
5
6
TOTAL
Time allowed: 1 hour 15 minutes Sample set (2022 exams only)
Materials For this paper you must have: • a pencil• a rubber• a ruler.You may use a calculator.
Instructions • Use black ink or black ball-point pen.• Fill in the boxes at the top of this page.
Answer all questions in Section A. Answer either Section B or Section C. If you choose Section B answer all the questions. If you choose Section C answer Question 3 and either Question 4 or Question 5 or Question 6.
• You must answer the questions in the spaces provided. Do not write outside the boxaround each page or on blank pages. Do all rough work in this book. Cross through anywork you do not want to be marked.
Information • The marks for questions are shown in brackets.• The total number of marks available for this paper is 63.• Spelling, punctuation, grammar and specialist terminology will be assessed in Question 01.9.• HIC is a higher income country.• LIC is a lower income country.• NEE is a newly emerging economy.
Please write clearly in block capitals.
Centre number Candidate number
Surname
Forename(s)
Candidate signature
GCSE GEOGRAPHY Paper 2 Challenges in the human environment
This is an amended version of the 2018 8035/2 Paper 2: Challenges in the human environment to show the structure of the paper for 2022 only. It demonstrates the new rubric and changes to marks in Section B and C.
Sample set 2022 only

2
*02*
Do not write outside the
box
Section A Urban issues and challenges
Answer all questions in this section.
Question 1 Urban issues and challenges
0 1 . 1
Which term is best defined by the phrase, ‘the increasing percentage of the population living in towns and cities’?
Shade one circle only.
A Urban sprawl
B Urbanisation
C Migration
D Urban regeneration
[1 mark]
For the multiple-choice questions, completely fill in the circle alongside the appropriate answer. CORRECT METHOD WRONG METHODS
If you want to change your answer you must cross out your original answer as shown.
If you wish to return to an answer previously crossed out, ring the answer you now wish to select as shown.
Sample set 2022 only

3
*03*
Turn over ►
Do not write outside the
box Study Figure 1, a graph showing the percentage of the population living in urban areas in different parts of the world 1950–2050 (projected).
Figure 1
0 1 . 2 Complete the following paragraph to describe the changes shown in Figure 1.
Choose the three correct answers from this list:
HICs doubled NEEs
slow down trebled speed up
The smallest increase in percentage of urban population 1950–2050 is expected to
be in _______________________.
From 2020 the rate of increase is expected to _____________________ in NEEs.
Between 2000 and 2050, lower income countries are projected to have almost
________________________ in the percentage living in urban areas. [3 marks]
Question 1 continues on the next page
Sample set 2022 only

4
*04*
Do not write outside the
box Study Figure 2, a pie chart showing the reasons for rural–urban migration in a region of Pakistan, a country in Asia.
Figure 2
0 1 . 3 Describe the pattern of reasons for migration shown in Figure 2. [2 marks]
Study Figure 3, some social media comments about traffic in Bangalore, a city in India.
Figure 3
Sample set 2022 only
5
*05*
Turn over ►
Do not write outside the
box 0 1 . 4 Using Figure 3 suggest one problem faced by people in Bangalore as a result of traffic congestion.
[2 marks]
0 1 . 5 Use Figure 3 and a case study of a city in a LIC or NEE to suggest why managing traffic congestion and air pollution may be challenging.
[6 marks]
Extra space
Sample set 2022 only

6
*06*
Do not write outside the
box Study Figure 4, a graph showing GCSE scores along a transect through a UK city.
Figure 4
0 1 . 6 Calculate the range in GCSE scores shown in Figure 4. [1 mark]
0 1 . 7 Using Figure 4 and your own understanding, suggest reason(s) for inequalities in education in urban areas in the UK.
[4 marks]
Sample set 2022 only
7
*07*
Turn over ►
Do not write outside the
box
Extra space
0 1 . 8 Outline one way that national migration has led to change in the character of a named UK city.
[2 marks]
0 1 . 9 To what extent has urban change created environmental challenges in a UK city you have studied?
[9 marks] [+ 3 SPaG marks]
Name of city:
Sample set 2022 only

8
*08*
Do not write outside the
box
Extra space
End of Section A
33
Sample set 2022 only

9
*09*
Turn over ►
Do not write outside the
box Answer either Section B or Section C.
Section B The changing economic world.If you choose Section B answer all questions in this section.
Question 2 The changing economic world
Study Figure 5, a table showing the Gross National Income (GNI) data for selected countries in 2016.
Figure 5
Country name GNI
US$ per person Argentina 11 960 Belgium 41 860 China 8 260 Finland 44 730 Haiti 780 India 1 680 Kenya 1 380 Mali 750 Poland 12 680 Spain 27 520 United Kingdom 42 390
0 2 . 1 Calculate the median value for the GNI data in Figure 5. [2 marks]
Space for working
Median =
0 2 . 2 Suggest one reason why the GNI per person varies between the countries shown in Figure 5.
[1 mark]
Question 2 continues on the next page
Sample set 2022 only
10
*10*
Do not write outside the
box 0 2 . 3 Give one disadvantage of using an economic measure of development such as GNI. [1 mark]
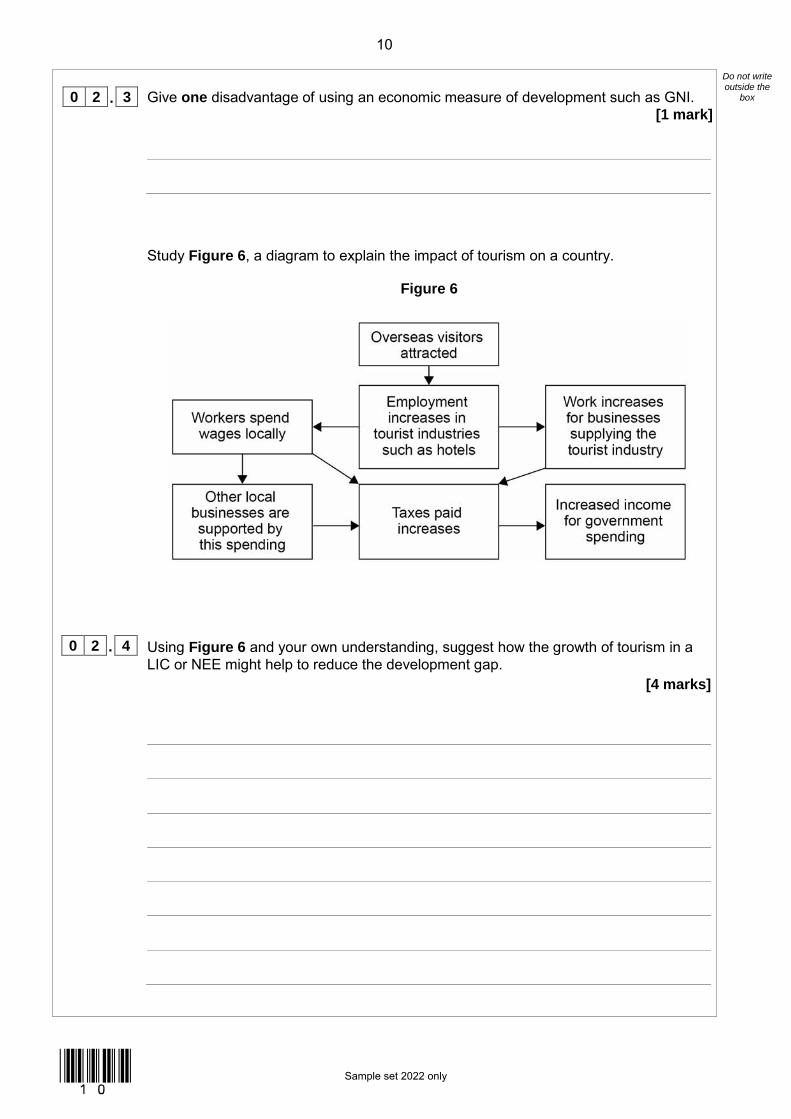
Study Figure 6, a diagram to explain the impact of tourism on a country.
Figure 6
0 2 . 4 Using Figure 6 and your own understanding, suggest how the growth of tourism in a LIC or NEE might help to reduce the development gap.
[4 marks]
Sample set 2022 only

11
*11*
Turn over ►
Do not write outside the
box
Extra space
Question 2 continues on the next page
Sample set 2022 only

12
*12*
Do not write outside the
box Study Figure 7 which describes the effects of an intermediate technology project in an area of Malawi, a country in Africa.
Figure 7 Bicycle Ambulances
There are two small Health Centres in the area serving 45 000 people. 1 in 6 women die in childbirth.
People have to travel vast distances to be seen by a nurse or doctor. Travel to the clinics is usually by ox and cart but this is an expensive and slow mode of transport.
A project was started to build bicycle ambulances and to provide training to the people in the area so more patients can make their way to a health centre. It is hoped that these bicycle ambulances will help save many lives.
0 2 . 5 State two challenges faced by the people living in the area described in Figure 7. [2 marks]
1
2
Sample set 2022 only

13
*13*
Turn over ►
Do not write outside the
box 0 2 . 6 State one characteristic of intermediate technology. [1 mark]
0 2 . 7 Outline one way in which international aid has had an impact on a named LIC or NEE country.
[2 marks]
Question 2 continues on the next page
Sample set 2022 only

14
*14*
Do not write outside the
box 0 2 . 8 Using a case study of a LIC or NEE country, explain the link between Transnational Corporations (TNCs) and industrial development in the country.
[6 marks]
Name of country:
Extra space
Sample set 2022 only

15
*15*
Turn over ►
Do not write outside the
box Study Figure 8, information about the planned spending on transport infrastructure in England’s regions 2016–2021.
Figure 8
0 2 . 9 Using Figure 8, calculate the mean planned spending per person per year 2016–2021 in the nine English regions.
[2 marks]
Show your working here.
Mean planned spending = £
Question 2 continues on the next page
Sample set 2022 only

16
*16*
Do not write outside the
box 0 2 . 1 0 Assess the importance of transport improvements to the UK economy. [9 marks]
Extra space
In section B, the 9 mark question will be replaced with a 6 mark question to ensure comparability with Section C.
To maintain a total of 30 marks, 3 marks will be introduced elsewhere in Section B.
Sample set 2022 only

17
*17*
Turn over ►
Do not write outside the
box
End of Section B
Turn over for Section C
30
Sample set 2022 only

18
*18*
Do not write outside the
box If you have answered Section B, do not answer Section C.
Section C The challenge of resource management
If you choose Section C, answer Question 3 and either Question 4
(Food) or Question 5 (Water) or Question 6 (Energy).
Question 3 The challenge of resource management
Study Figure 9, a map showing world oil consumption in 2016.
Figure 9
0 3 . 1 What is the difference between Africa and North America’s share of world oil consumption shown in Figure 9?
[1 mark]
Sample set 2022 only

19
*19*
Turn over ►
Do not write outside the
box 0 3 . 2 Using Figure 9 and your own understanding, suggest how inequalities in the consumption of resources influence well-being.
[3 marks]
0 3 . 3 Outline one advantage of the trend towards agribusiness in the UK. [2 marks]
Question 3 continues on the next page
Sample set 2022 only

20
*20*
Do not write outside the
box Study Figure 10, a graph showing the UK’s changing energy mix from 2006 to 2016.
Figure 10
An additional 5 marks worth of questions will be added to Section C to make the mark total comparable with Section B.
For the purposes of this illustration, we have added them into Q3 which is reflected in the mark total for this question. In 2022, they could appear anywhere in Section C.
Sample set 2022 only

21
*21*
Turn over ►
Do not write outside the
box 0 3 . 4 Using Figure 10 and your own understanding, discuss the issues arising from the UK’s changing energy mix.
[6 marks]
Extra space
End of Question 3
Turn over for the next question
17
Sample set 2022 only

22
*22*
Do not write outside the
box Answer either Question 4 (Food) or Question 5 (Water) or Question 6 (Energy).
Question 4 Food
Study Figure 11, a map of South and East Asia showing the percentage of people who were undernourished between 2014 and 2016.
Figure 11
0 4 . 1 Name one country where less than 5% of the population were undernourished. [1 mark]
Sample set 2022 only

23
*23*
Turn over ►
Do not write outside the
box 0 4 . 2 How many of the Asian countries shown in Figure 11 had 15–24.9% of their population undernourished?
Shade one circle only. [2 marks]
A 6
B 7
C 8
D 9
What percentage of the 24 countries in Asia for which data is shown had 15–24.9% of their population undernourished?
Answer to 1 decimal place.
0 4 . 3 Describe the distribution of countries which had 15–24.9% of their population undernourished as shown in Figure 11.
[2 marks]
0 4 . 4 Outline one reason why some countries have a limited food supply. [2 marks]
Question 4 continues on the next page
Sample set 2022 only

24
*24*
Do not write outside the
box 0 4 . 5 Explain how different strategies can be used to make food supplies more sustainable. [6 marks]
Extra space
End of Question 4
If you have answered Question 4, do not answer Question 5 or 6.
13
Sample set 2022 only

25
*25*
Turn over ►
Do not write outside the
box There are no questions printed on this page
Turn over for the next question
DO NOT WRITE ON THIS PAGE ANSWER IN THE SPACES PROVIDED
Sample set 2022 only

26
*26*
Do not write outside the
box Question 5 Water
Study Figure 12, a map of Africa showing percentage access to basic drinking water services in 2015.
Figure 12
0 5 . 1 Name one country with a 91–100% access to basic drinking water services. [1 mark]
Sample set 2022 only

27
*27*
Turn over ►
Do not write outside the
box 0 5 . 2 How many of the African countries shown in Figure 12 had less than 50% access to basic drinking water services?
Shade one circle only. [2 marks]
A 8
B 9
C 10
D 11
What percentage of the 48 countries in Africa for which data is shown had less than 50% access to basic drinking water services?
Answer to 1 decimal place.
0 5 . 3 Describe the distribution of countries which had 76–90% access to basic drinking water services as shown in Figure 12.
[2 marks]
0 5 . 4 Outline one reason why some countries have a limited availability of water. [2 marks]
Question 5 continues on the next page
Sample set 2022 only

28
*28*
Do not write outside the
box 0 5 . 5 Explain how different strategies can be used to make water supplies more sustainable. [6 marks]
Extra space
End of Question 5
If you have answered Question 5, do not answer Question 4 or 6.
13
Sample set 2022 only

29
*29*
Turn over ►
Do not write outside the
box There are no questions printed on this page
Turn over for the next question
DO NOT WRITE ON THIS PAGE ANSWER IN THE SPACES PROVIDED
Sample set 2022 only

30
*30*
Do not write outside the
box Question 6 Energy
Study Figure 13, a map of Europe showing the percentage energy consumption from renewable sources in Europe (excluding Russia) in 2014.
Figure 13
0 6 . 1 Name one country which had less than 10.0% of energy consumption from renewable sources.
[1 mark]
Sample set 2022 only

31
*31*
Turn over ►
Do not write outside the
box 0 6 . 2 How many of the European countries shown in Figure 13 had 35.0–49.9% of energy consumption from renewable sources?
Shade one circle only. [2 marks]
A 5
B 6
C 7
D 8
What percentage of the 41 countries in Europe for which data is shown had 35.0–49.9% consumption of energy from renewable sources?
Answer to 1 decimal place.
0 6 . 3 Describe the distribution of countries which had 20.0–34.9% consumption of energy from renewable sources shown in Figure 13.
[2 marks]
0 6 . 4 Outline one reason why some countries have a limited energy supply. [2 marks]
Question 6 continues on the next page
Sample set 2022 only

32
*32*
Do not write outside the
box 0 6 . 5 Explain how different strategies can be used to make energy supplies more sustainable.
[6 marks]
Extra space
If you have answered Question 6, do not answer Question 4 or 5.
END OF QUESTIONS
Copyright information
For confidentiality purposes, from the November 2015 examination series, acknowledgements of third party copyright material will be published in a separate booklet rather than including them on the examination paper or support materials. This booklet is published after each examination series and is available for free download from www.aqa.org.uk after the live examination series.
Permission to reproduce all copyright material has been applied for. In some cases, efforts to contact copyright-holders may have been unsuccessful and AQA will be happy to rectify any omissions of acknowledgements. If you have any queries please contact the Copyright Team, AQA, Stag Hill House, Guildford, GU2 7XJ.
Copyright © 2021 AQA and its licensors. All rights reserved.
13
Sample set 2022 only