Pandemic influenza in Australia: Using telephone surveys to measure perceptions of threat and...
14
BioMed Central Page 1 of 14 (page number not for citation purposes) BMC Infectious Diseases Open Access Research article Pandemic influenza in Australia: Using telephone surveys to measure perceptions of threat and willingness to comply Margo Barr* 1 , Beverley Raphael 2 , Melanie Taylor 2 , Garry Stevens 2 , Louisa Jorm 2 , Michael Giffin 1 and Sanja Lujic 2 Address: 1 Centre for Epidemiology and Research, New South Wales Department of Health, Sydney, Australia and 2 School of Medicine, University of Western Sydney, Sydney, Australia Email: Margo Barr* - [email protected]; Beverley Raphael - [email protected]; Melanie Taylor - [email protected]; Garry Stevens - [email protected]; Louisa Jorm - [email protected]; Michael Giffin - [email protected]; Sanja Lujic - [email protected] * Corresponding author Abstract Background: Baseline data is necessary for monitoring how a population perceives the threat of pandemic influenza, and perceives how it would behave in the event of pandemic influenza. Our aim was to develop a module of questions for use in telephone health surveys on perceptions of threat of pandemic influenza, and on preparedness to comply with specific public health behaviours in the event of pandemic influenza. Methods: A module of questions was developed and field tested on 192 adults using the New South Wales Department of Health's in-house Computer Assisted Telephone Interviewing (CATI) facility. The questions were then modified and re field tested on 202 adults. The module was then incorporated into the New South Wales Population Health Survey in the first quarter of 2007. A representative sample of 2,081 adults completed the module. Their responses were weighted against the state population. Results: The reliability of the questions was acceptable with kappa ranging between 0.25 and 0.51. Overall 14.9% of the state population thought pandemic influenza was very or extremely likely to occur; 45.5% were very or extremely concerned that they or their family would be affected by pandemic influenza if it occurred; and 23.8% had made some level of change to the way they live their life because of the possibility of pandemic influenza. In the event of pandemic influenza, the majority of the population were willing to: be vaccinated (75.4%), be isolated (70.2%), and wear a face mask (59.9%). People with higher levels of threat perception are significantly more likely to be willing to comply with specific public health behaviours. Conclusion: While only 14.9% of the state population thought pandemic influenza was very or extremely likely to occur, a significantly higher proportion were concerned for self and family should a pandemic actually occur. The baseline data collected in this survey will be useful for monitoring changes over time in the population's perceptions of threat, and preparedness to comply with specific public health behaviours. Published: 15 September 2008 BMC Infectious Diseases 2008, 8:117 doi:10.1186/1471-2334-8-117 Received: 23 April 2008 Accepted: 15 September 2008 This article is available from: http://www.biomedcentral.com/1471-2334/8/117 © 2008 Barr et al; licensee BioMed Central Ltd. This is an Open Access article distributed under the terms of the Creative Commons Attribution License (http://creativecommons.org/licenses/by/2.0 ), which permits unrestricted use, distribution, and reproduction in any medium, provided the original work is properly cited.
-
Upload
independent -
Category
Documents
-
view
0 -
download
0
Transcript of Pandemic influenza in Australia: Using telephone surveys to measure perceptions of threat and...
BioMed CentralBMC Infectious Diseases
ss
Open AcceResearch articlePandemic influenza in Australia: Using telephone surveys to measure perceptions of threat and willingness to complyMargo Barr*1, Beverley Raphael2, Melanie Taylor2, Garry Stevens2, Louisa Jorm2, Michael Giffin1 and Sanja Lujic2Address: 1Centre for Epidemiology and Research, New South Wales Department of Health, Sydney, Australia and 2School of Medicine, University of Western Sydney, Sydney, Australia
Email: Margo Barr* - [email protected]; Beverley Raphael - [email protected]; Melanie Taylor - [email protected]; Garry Stevens - [email protected]; Louisa Jorm - [email protected]; Michael Giffin - [email protected]; Sanja Lujic - [email protected]
* Corresponding author
AbstractBackground: Baseline data is necessary for monitoring how a population perceives the threat ofpandemic influenza, and perceives how it would behave in the event of pandemic influenza. Our aimwas to develop a module of questions for use in telephone health surveys on perceptions of threatof pandemic influenza, and on preparedness to comply with specific public health behaviours in theevent of pandemic influenza.
Methods: A module of questions was developed and field tested on 192 adults using the NewSouth Wales Department of Health's in-house Computer Assisted Telephone Interviewing (CATI)facility. The questions were then modified and re field tested on 202 adults. The module was thenincorporated into the New South Wales Population Health Survey in the first quarter of 2007. Arepresentative sample of 2,081 adults completed the module. Their responses were weightedagainst the state population.
Results: The reliability of the questions was acceptable with kappa ranging between 0.25 and 0.51.Overall 14.9% of the state population thought pandemic influenza was very or extremely likely tooccur; 45.5% were very or extremely concerned that they or their family would be affected bypandemic influenza if it occurred; and 23.8% had made some level of change to the way they livetheir life because of the possibility of pandemic influenza. In the event of pandemic influenza, themajority of the population were willing to: be vaccinated (75.4%), be isolated (70.2%), and wear aface mask (59.9%). People with higher levels of threat perception are significantly more likely to bewilling to comply with specific public health behaviours.
Conclusion: While only 14.9% of the state population thought pandemic influenza was very orextremely likely to occur, a significantly higher proportion were concerned for self and familyshould a pandemic actually occur. The baseline data collected in this survey will be useful formonitoring changes over time in the population's perceptions of threat, and preparedness tocomply with specific public health behaviours.
Published: 15 September 2008
BMC Infectious Diseases 2008, 8:117 doi:10.1186/1471-2334-8-117
Received: 23 April 2008Accepted: 15 September 2008
This article is available from: http://www.biomedcentral.com/1471-2334/8/117
© 2008 Barr et al; licensee BioMed Central Ltd. This is an Open Access article distributed under the terms of the Creative Commons Attribution License (http://creativecommons.org/licenses/by/2.0), which permits unrestricted use, distribution, and reproduction in any medium, provided the original work is properly cited.
Page 1 of 14(page number not for citation purposes)
BMC Infectious Diseases 2008, 8:117 http://www.biomedcentral.com/1471-2334/8/117
BackgroundIf an outbreak of pandemic influenza should occur, it isessential that public health authorities are prepared to act.While resources have been prepared to educate the popu-lation about the nature of a threat and planned govern-ment actions,[1] it is necessary to understand thepotential response of a population.
Most of the existing information about a population'sresponse to the threat of pandemics comes from researchon outbreaks of the SARS coronavirus, most notably inHong Kong, Singapore, and Canada, [2-5] and on studiesof risk perception and anticipated behaviours in a poten-tial pandemic in humans from the avian influenza virus(especially the H5N1 subtype). [6-9] To date, Australiahas been relatively unaffected by SARS or H5N1; however,some of Australia's neighbours have experienced limitedoutbreaks: for example, SARS in Hong Kong and Singa-pore; and H5N1 in Indonesia and Hong Kong and China.Globally, the threat of a pandemic of H5N1 is high.
A key component of a population's response is the percep-tion of risk or threat. Research shows that in a SARS out-break willingness to comply with risk-reducingbehaviours is linked to the perceived immediacy and seri-ousness of the threat.[2,3,5] Three risk perception studieson potential avian influenza outbreaks were conducted in2005. In the first study, Lau et al. surveyed residents ofHong Kong on a potential outbreak of H5N1.[7] Theirstudy focussed on protective behaviours and likely com-pliance with them; however, the researchers also askedrespondents about the perceived threat of H5N1 and thelikelihood of it occurring within the next 12 months. Itwas found that 33% of respondents felt the chance of anoutbreak was high or very high. Lau's study also askedrespondents how worried they would be about oneself ora family member contracting the virus in the event of alocal outbreak; 54% said they would be very worried.
In the second study, de Zwart et al. compared the risk per-ceptions of European and Asian respondents to the threatof avian influenza,[8] and measured self-efficacy beliefs toassess the likely compliance with protective health meas-ures. Overall the study found that 45% of respondentsthought they were likely or very likely to become infectedshould an outbreak of avian influenza occur. This figurevaried from 32% (Denmark and Singapore) to 61%(Poland and Spain). The researchers took a compositemeasure of risk perception and found that higher scoreswere observed in Europe rather than Asia. They foundhigher risk perceptions in females and older respondents;while lower self-efficacy beliefs in Europe suggested thatadherence to protective measures would be lower inEurope.
In the third study, Di Giuseppe et al. surveyed the knowl-edge and attitudes of an Italian population to avian influ-enza.[9] They found that around 19% of respondents hada high risk perception and felt very much at risk of con-tracting avian influenza. In this study lower socioeco-nomic status and lower education levels were associatedwith higher risk perception, and those with a higher riskperception were more likely to comply with hygiene prac-tices to avoid the spread of disease.
Our aim was to develop a module of questions for use intelephone health surveys on perceptions of threat of pan-demic influenza, and on preparedness to comply withspecific public health behaviours in the event of pan-demic influenza.
MethodsQuestion designA literature search was conducted to identify existing toolsfor collecting information on perceptions of pandemicinfluenza with the underlying themes of likelihood, effecton family, life changes, and compliance with governmentauthorities. The abovementioned studies by Lau et al. andde Zwart et al. and Di Giuseppe et al. had not beenreported when our literature search was conducted. [7-9]As such, our literature search identified no relevant studieson response to pandemic influenza specifically, althoughother studies have been published on general threat per-ception and compliance with protective behaviours in thecontext of infectious diseases or other emergencies.
The primary reference was a study by Canadian research-ers on anticipated public response to terrorism.[10] Ques-tions on the threat likelihood, effect on family, andbehavioural compliance, were adapted with permissionby subject matter experts and survey methodologists. Eachproposed question was considered for clarity, ease ofadministration, and possible biases. A set of 6 questionswas developed for field-testing (Table 1), as well as anadditional open question: "Do you have any commentsyou would like to make on any of the questions or anyother issues?"
Field testingThe pandemic influenza questions were field tested fortest-retest reliability using the protocol of the New SouthWales Health Survey Program.[11] The questions werethen modified based on the results from the field testingand were re field tested. For both field tests the target sam-ple was 200 persons living in the state aged 16 years andover stratified by geographical region. This sample sizeensures that a kappa of 0.6 (good or excellent) is able tobe detected at a significance level of 5% and a power of80% when compared to a kappa of 0.4 or less (fair orpoor) for response frequencies greater than 20%.[11]
Page 2 of 14(page number not for citation purposes)
BMC Infectious Diseases 2008, 8:117 http://www.biomedcentral.com/1471-2334/8/117
Table 1: Field testing for reliability and convergent validity, including original wording of questions at first test, changes made, and revised wording at second test
First Field Test Initial question and response summary
Changes made Second Field Test Final question and response summary
Q.1 How likely do you think it is that pandemic influenza will occur in Australia?(Not likely, somewhat likely, very likely, extremely likely, don't know)Weighted kappa = 0.43 (0.33–0.54)Agreement = 61%Don't know = 2.1%Refused = 0%
None to question.Response altered to a Likert scale: increased from 4 to 5 options.
Q.1 How likely do you think it is that pandemic influenza will occur in Australia?(Not at all likely, a little likely, moderately likely, very likely, extremely likely, don't know)Weighted kappa = 0.38 (0.28–0.47)Indicator kappa = 0.44 (0.30–0.58)Agreement = 45.5%Don't know = 3.9%Refused = 0%
Q.2 How likely do you think it is that you or your family would be directly affected by an influenza pandemic in Australia?(Not likely, somewhat likely, very likely, extremely likely, don't know)Weighted kappa = 0.48 (0.38–0.58)Agreement = 62%Don't know = 2.6%Refused = 0%
Additional context added before question to provide better context.Likelihood of being affected was changed to concern about being affected, to tap a sense of vulnerability rather than probability.Responses altered to reflect concern and increase to 5 options.
Q.2 If an influenza pandemic were to occur in Australia, how concerned would you be that you or your family would be directly affected by it?(Not at all concerned, a little concerned, moderately concerned, very concerned, extremely concerned, don't know)Weighted kappa = 0.28 (0.18–0.38)Indicator kappa = 0.25 (0.12–0.38)Agreement = 39.1%Don't know = 0%Refused = 0%
Q.3 Do you feel you have changed the way you live your life because of the possibility of an influenza pandemic in Australia?(Yes/No)Kappa = 0.51 (0.34–0.68)Agreement = 87%Don't know = 0%Refused = 0%
Changed from a binary Yes/No question to a Likert scale response assessing the degree to which respondents had made any change.Question wording was altered to reflect that change.
Q.3 How much have you changed the way you live your life because of the possibility of an influenza pandemic?
(Not at all, a little, moderately, very much, extremely, don't know)Weighted kappa = 0.34 (0.24–0.44)Indicator kappa = 0.43 (0.30–0.56)Agreement = 57.5%Don't know = 1.5%Refused = 0%
Q.4 In case of an emergency situation, government authorities might request cooperation from the public in a number of ways. Please indicate how willing would you be to do the following: Receive vaccination?(not willing, somewhat willing, very willing, extremely willing don't know, refused)Weighted kappa = 0.39 (0.28–0.50)Agreement = 53%Don't know = 2.1%Refused = 0%
Additional context added to the introduction to specify pandemic influenza and make questions more relevant.Response altered to a Likert scale: increased from 4 to 5 options.
Q.4 In case of an emergency situation such as an influenza pandemic, government authorities might request cooperation from the public in a number of ways Please indicate how willing would you be to receive vaccination?(not at all willing, a little willing, moderately willing, very willing, extremely willing don't know, refused)Weighted kappa = 0.45 (0.35–0.56)Indicator kappa = 0.51 (0.34–0.67)Agreement = 57.1%Don't know = 0%Refused = 0%
Q.5 Isolate yourself from others?(not willing, somewhat willing, very willing, extremely willing don't know, refused)Weighted kappa = 0.51 (0.42–0.60)Agreement = 56%Don't know = 1.0%Refused = 0%
Question stem repeated.Response altered to a Likert scale: increased from 4 to 5 options.
Q.5 How willing would you be to isolate yourself from others if needed?(not at all willing, a little willing, moderately willing, very willing, extremely willing don't know, refused)Weighted kappa = 0.4 (0.31–0.5)Indicator kappa = 0.48 (0.33–0.62)Agreement = 52.7%Don't know = 1.0%Refused = 0%
Page 3 of 14(page number not for citation purposes)
BMC Infectious Diseases 2008, 8:117 http://www.biomedcentral.com/1471-2334/8/117
Households were contacted using random digit dialling.One person aged 16 years and over from each householdwas randomly selected for field testing. Trained interview-ers conducted the interviews. Up to 7 calls were made toestablish initial contact with a household, and at least 5calls were made to contact a selected respondent. Whenthe respondent completed the first field test, an appoint-ment was made for a retest at least a week later but within3 weeks of the initial field test. If a respondent was unableto be contacted during this 2 week window they weredeemed to be unavailable and their initial field test wasdeleted.[11]
Test-retest reliability and validity were estimated byCohen's kappa statistic for binary variables, and weightedkappa with Cicchetti-Allison weights for ordinal variables.Unbalanced tables were corrected using the methoddescribed by Crewson.[11] Since erroneously low valuesof kappa can arise from skewed data, per cent agreementwas also presented for categorical variables, calculated asthe proportion of respondents in the same category at testand retest. Responses for don't know and refused are alsoreviewed.[11]
Data manipulation and analysis were conducted usingSAS Version 9.2.[11]
The surveyThe New South Wales Population Health Survey is a con-tinuous telephone survey of the health of the state popu-lation using the in-house CATI facility of the New SouthWales Department of Health.[11] Only residential phonenumbers were used in the sample, as residential phonecoverage in Australia still remains high,[12] and resultsfrom persons who only have mobile phones has beenshown to be comparable in the United States.[13,14]
The pandemic influenza module was administered as partof the survey between 22 January and 31 March 2007. Thepandemic influenza questions were submitted to a leadethics committee for approval prior to use. The survey alsoincludes other modules on health behaviours, health sta-tus (including psychological distress, using the KesslerK10 measure, and self-rated health status), and access to
health services, as well as the demographics of respond-ents and households. The target population for the surveyis all state residents living in households with private tel-ephones. Up to 7 calls were made to establish initial con-tact with a household, and 5 calls were made in order tocontact a selected respondent.
Response categories were dichotomised into indicators ofinterest and don't knows and refused were removed. Forthe hypothetical questions – that is, likelihood of pan-demic influenza, likelihood that family or self affected,willingness to comply with vaccination, isolation or wear-ing a face mask – the responses of extremely likely andvery likely were combined into the indicator of interest.For the non-hypothetical question "changed way livebecause of the possibility of an influenza pandemic"responses a little, moderately, very much and extremelywere combined into the indicator of interest: that is,changed life.
The survey data were weighted to adjust for probability ofselection and for differing non-response rates amongmales and females and different age groups.[15] Datawere manipulated and analysed using SAS version9.2.[11] The SURVEYFREQ procedure in SAS was used toanalyse the data and calculate point estimates and 95 percent confidence intervals for the prevalence estimates. Forpairwise comparisons of subgroup estimates, the p-valuefor a two-tailed test was calculated using the normal dis-tribution probability function PROBNORM in SAS,assuming approximate normal distribution of each indi-vidual subgroup estimates with the estimated standarderrors, and approximate normal distribution for the esti-mated difference.
ResultsField testingIn total, 192 residents aged 16 years and over completedthe first field test and 202 residents completed the secondfield test. Estimates of test-retest reliability for the first andsecond field tests are shown in Table 1, including amend-ments made prior to the second test. Kappa and weightedkappa values for the questions ranged between 0.39 and0.51 in the first field test and between 0.28 and 0.48 in the
Q.6 ...Wear a face mask?(not willing, somewhat willing, very willing, extremely willing don't know, refused)Weighted kappa = 0.50 (0.40–0.60)Agreement = 56%Don't know = 1.0%Refused = 0%
Question stem repeated.Response altered to a Likert scale: increased from 4 to 5 options.
Q.6 How willing would you be to wear a face mask?(not at all willing, a little willing, moderately willing, very willing, extremely willing don't know, refused)Weighted kappa = 0.48 (0.39–0.56)Indicator kappa = 0.51 (0.39–0.63)Agreement = 45.8%Don't know = 0.5%Refused = 0%
Source: New South Wales Health Survey Program. Sydney: New South Wales Department of Health, 2008.
Table 1: Field testing for reliability and convergent validity, including original wording of questions at first test, changes made, and revised wording at second test (Continued)
Page 4 of 14(page number not for citation purposes)
BMC Infectious Diseases 2008, 8:117 http://www.biomedcentral.com/1471-2334/8/117
second field test. Kappa values for the indicators derivedfrom the questions ranged between 0.25 and 0.51 in thesecond field test. There were low don't know responserates (0–3.9%) and no respondent refused to answer anyquestion.
In response to the open question "Do you have any com-ments you would like to make on any of the questions orany other issues?": 79% made positive comments aboutthe questions, 48.7% found the question wording easy tounderstand and answer, and 29.9% found the subjectmatter relevant and interesting. Of the respondents whohad difficulty answering the questions, the main issueswere: the questions were too vague (7.1%), responseoptions were not descriptive enough (7.1%), or the topicarea was difficult (6.5%).
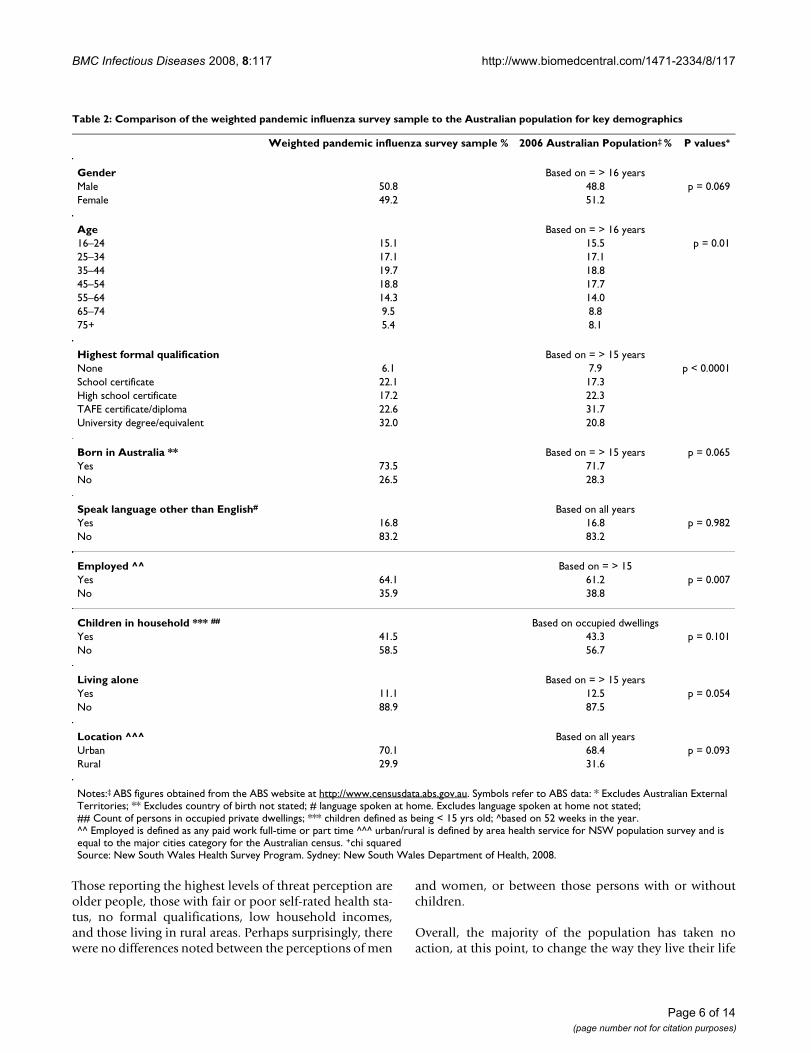
The surveyA total of 2,081 state residents aged 16 years and overcompleted the module on pandemic influenza. The over-all response rate was 65%. The demographics of theweighted survey population were comparable with theAustralian Bureau of Statistics 2006 Census for sex, per-sons born in Australia, persons who speak a languageother than English, children in household, persons wholive alone, and location (Table 2).[16]
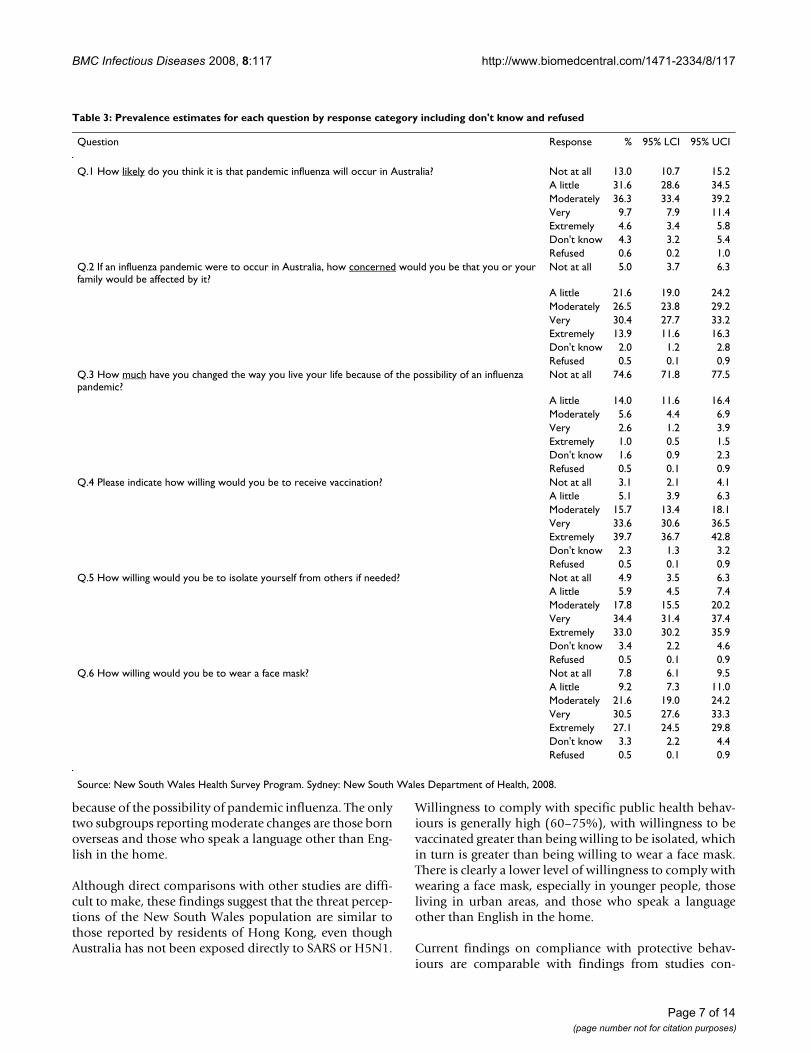
Table 3 shows the responses to each question, includingdon't know and refused. The percentage of don't know orrefused responses was low.
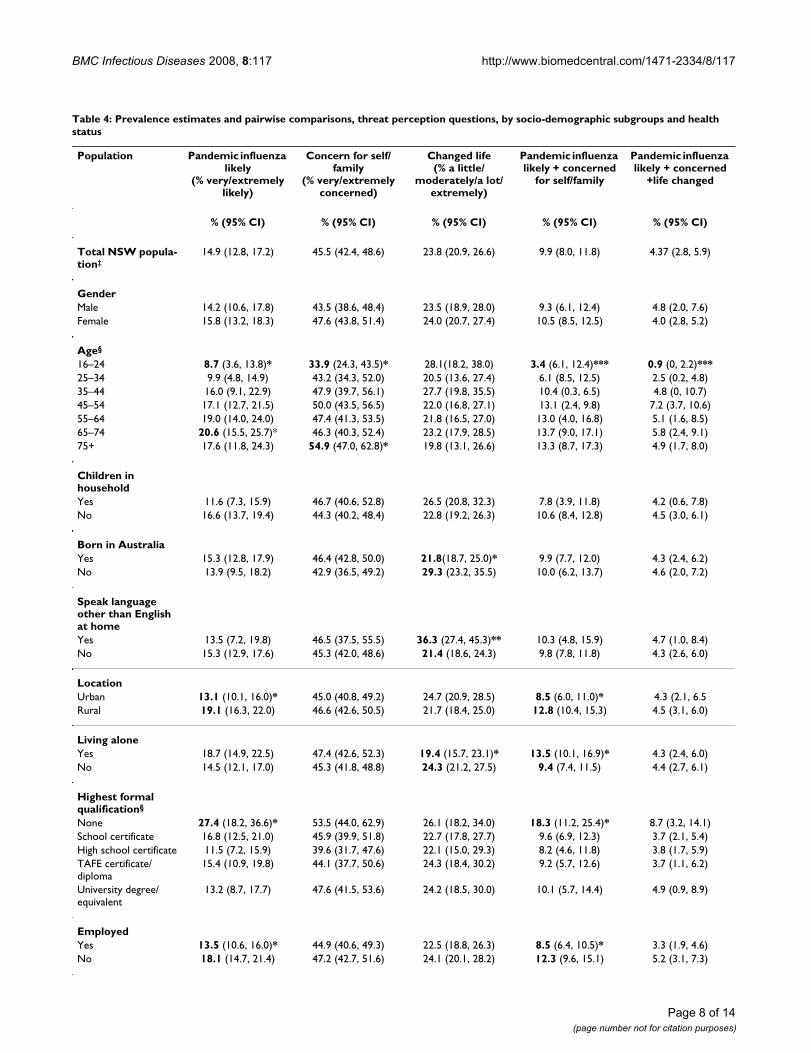
Table 4 shows the indicators for pandemic influenzalikely, concern for self and family, and changed life by sex,age group, demographic characteristics, and the indicatorsof level of psychological distress and general self-ratedhealth status. Overall 14.9% of the population thoughtpandemic influenza was very or extremely likely, 45.5%were very or extremely concerned that they or their familywould be affected by pandemic influenza, and 23.8% hadmade some (small to extreme) level of change to the waythey live their life because of the possibility of pandemicinfluenza.
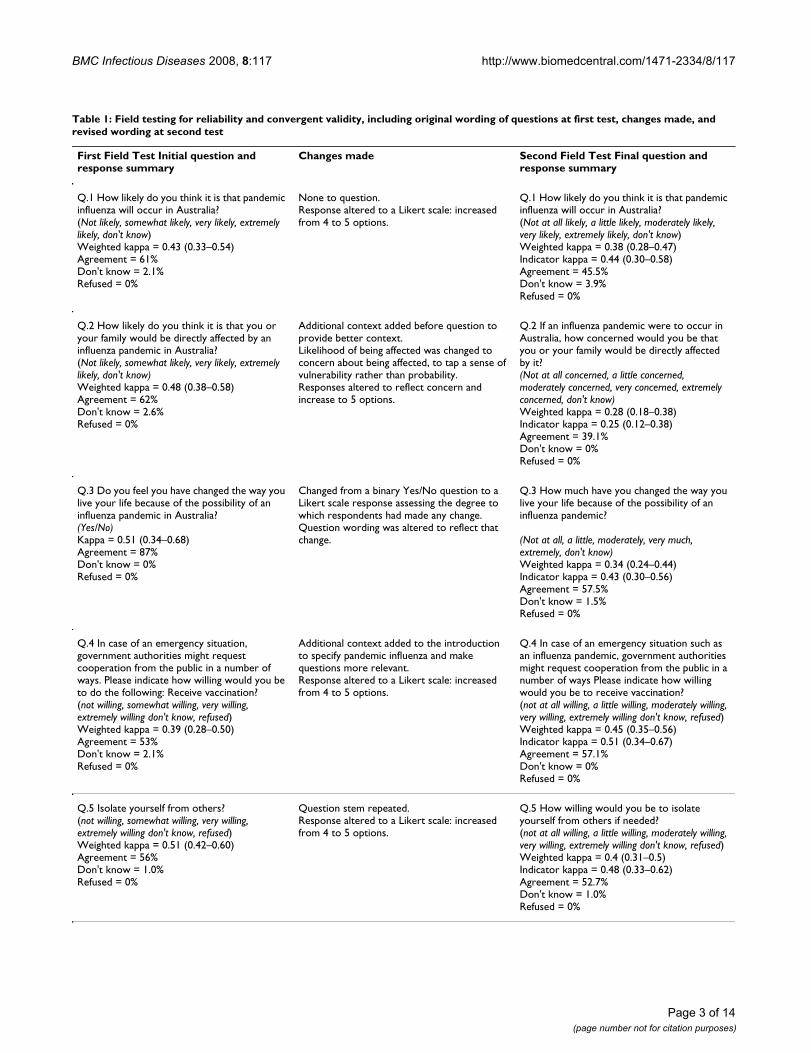
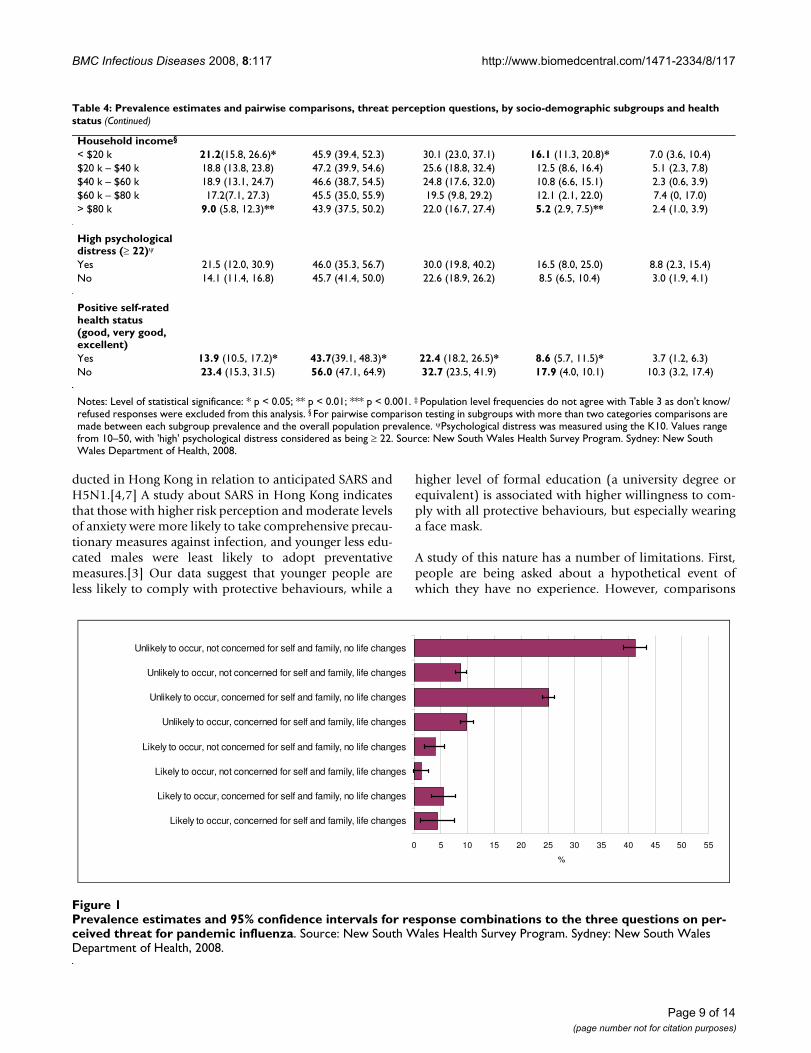
When the indicators for pandemic influenza likelihood,concern for self and family and changed life were com-bined, as shown in Figure 1, the greatest proportion of thepopulation (41.3%) thought pandemic influenza wasunlikely to occur, would not be concerned for themselvesor their family, and had not changed the way they livedtheir life because of the possibility of pandemic influenza.A quarter of the population (25.1%) thought pandemicinfluenza was unlikely to occur and had not made anychanges to their lives, but would be concerned for them-selves and their family in the event of pandemic influenza.
Table 4 also shows the combined indicators pandemicinfluenza likely and concern for self and family as well aspandemic influenza likely and concern for self and familyand changed life by sex, age group, demographic charac-teristics, and the indicators of level of psychological dis-tress and general self-rated health status.
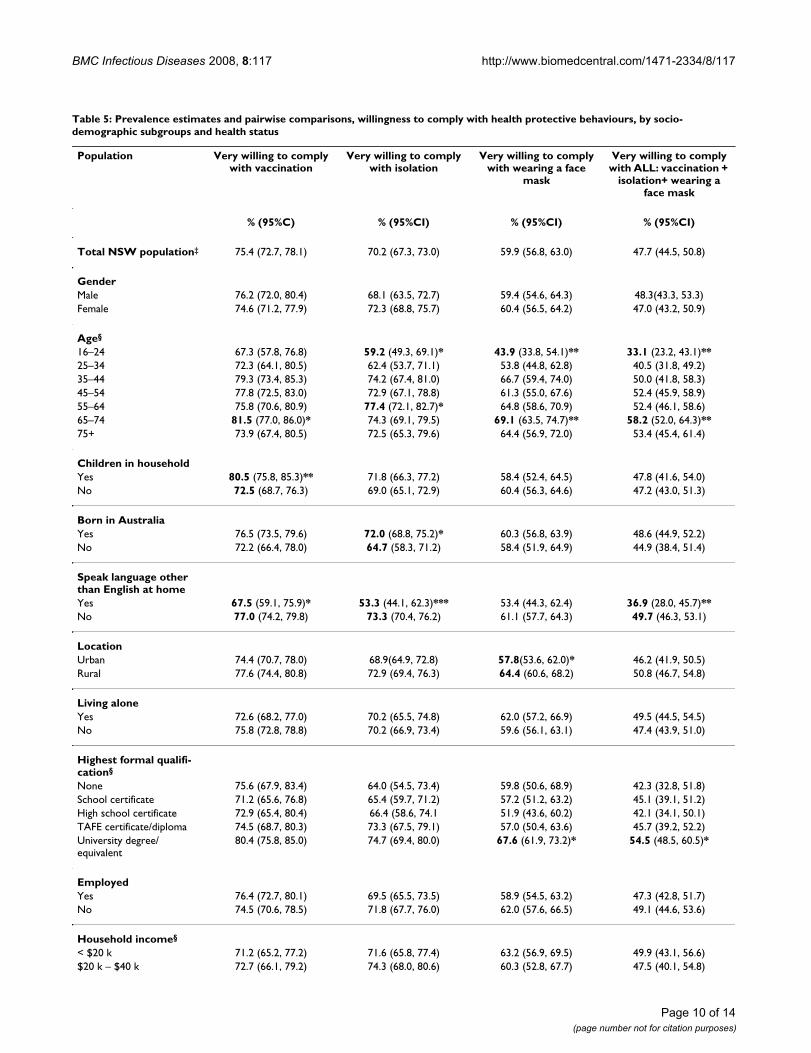
Table 5 shows the indicators willing to receive vaccina-tion, isolate themselves, or wear a face mask by sex, agegroup, demographic characteristics, and the indicators oflevel of psychological distress and general self-ratedhealth status. Overall, the majority of the populationwould be willing to receive vaccination (75.4%), willingto be isolated (70.2%), and willing to wear a mask(59.9%), if pandemic influenza were to occur.
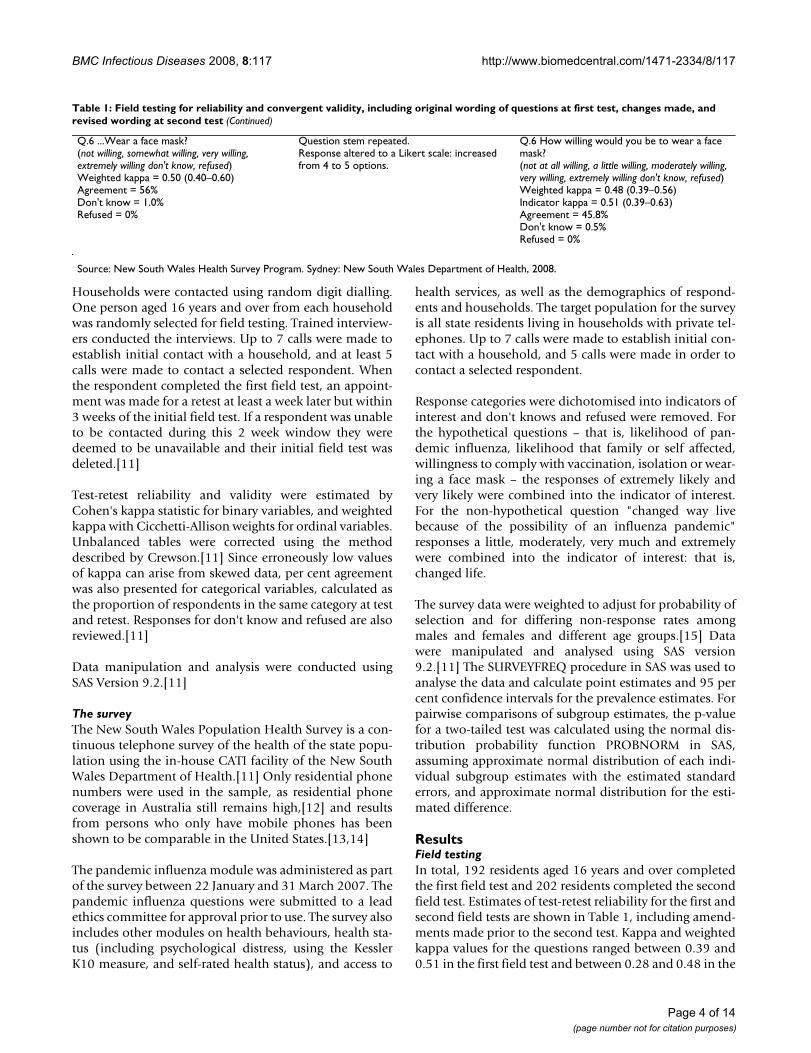
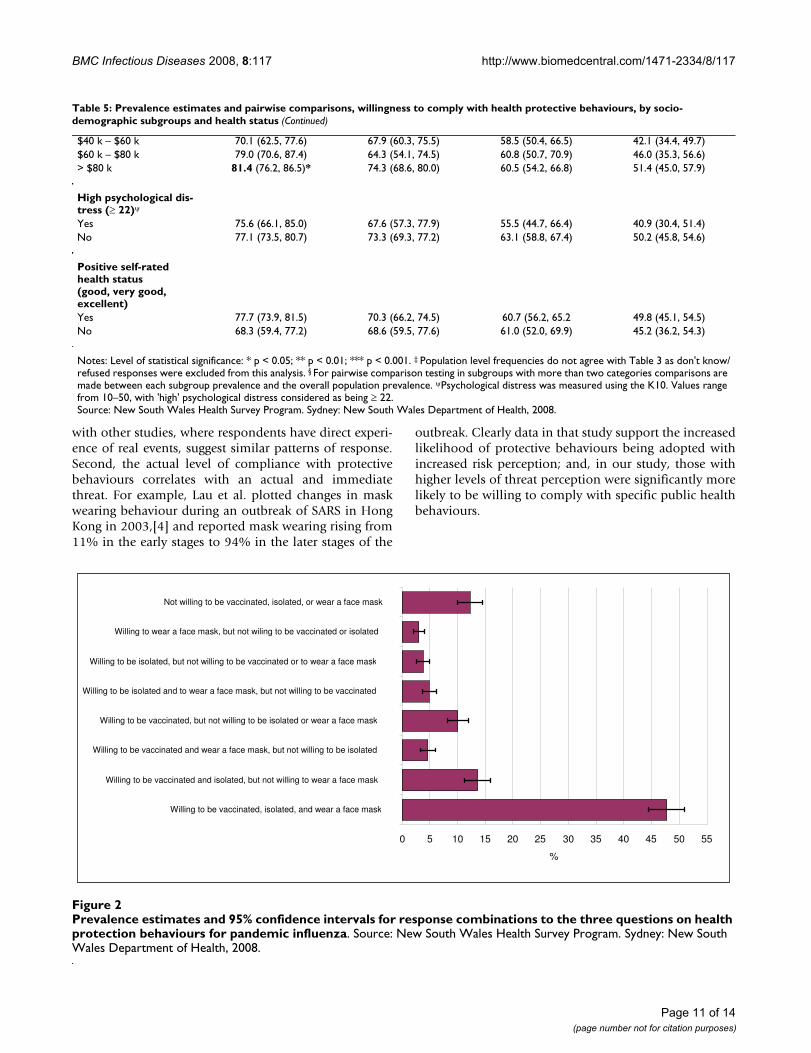
When the indicators for willing to receive vaccination, iso-late themselves, and wear a face mask were combined, asshown in Figure 2, 48.3% reported being willing to receivevaccination, isolate themselves, and wear a face mask ifpandemic influenza were to occur; 13.7% would not bewilling to receive vaccination, isolate themselves and weara face mask; 13.1% would be willing to receive vaccina-tion, isolate themselves but not wear a face mask; and10.4% would be willing to receive vaccination and wear aface mask but not isolate themselves.
Table 5 also shows the combined indicator for willing toreceive vaccination, isolate themselves, and wear a facemask by sex, age group, demographic characteristics, andthe indicators of level of psychological distress and gen-eral self-rated health status.
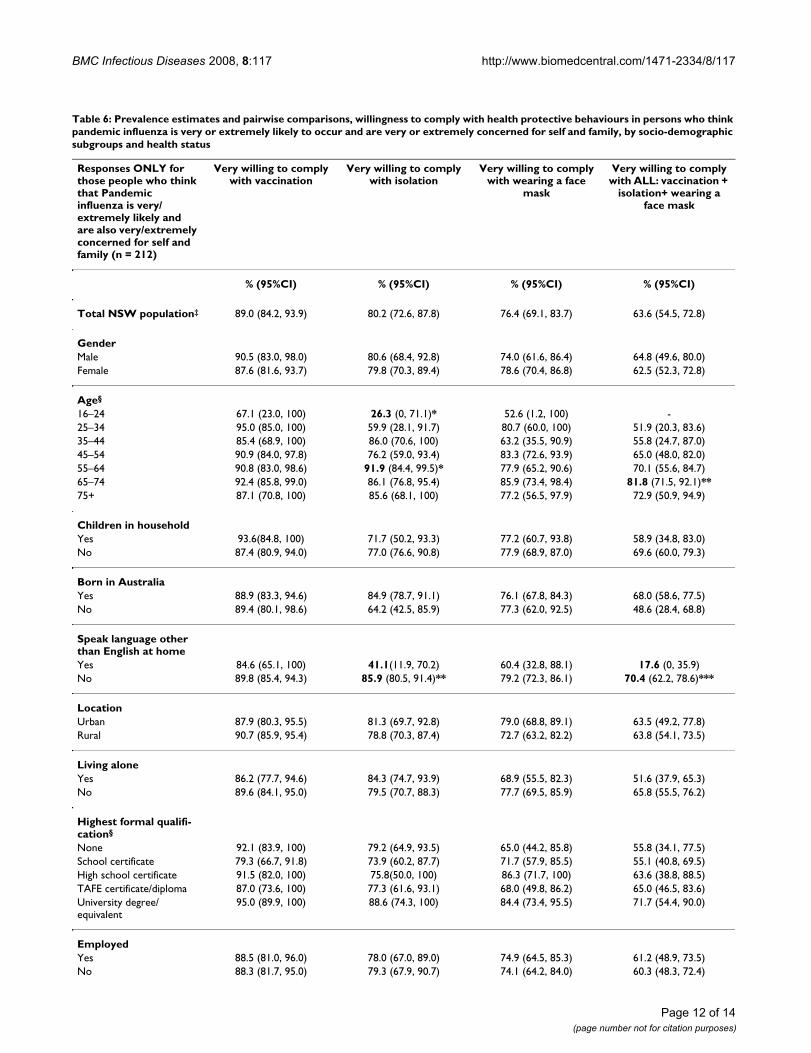
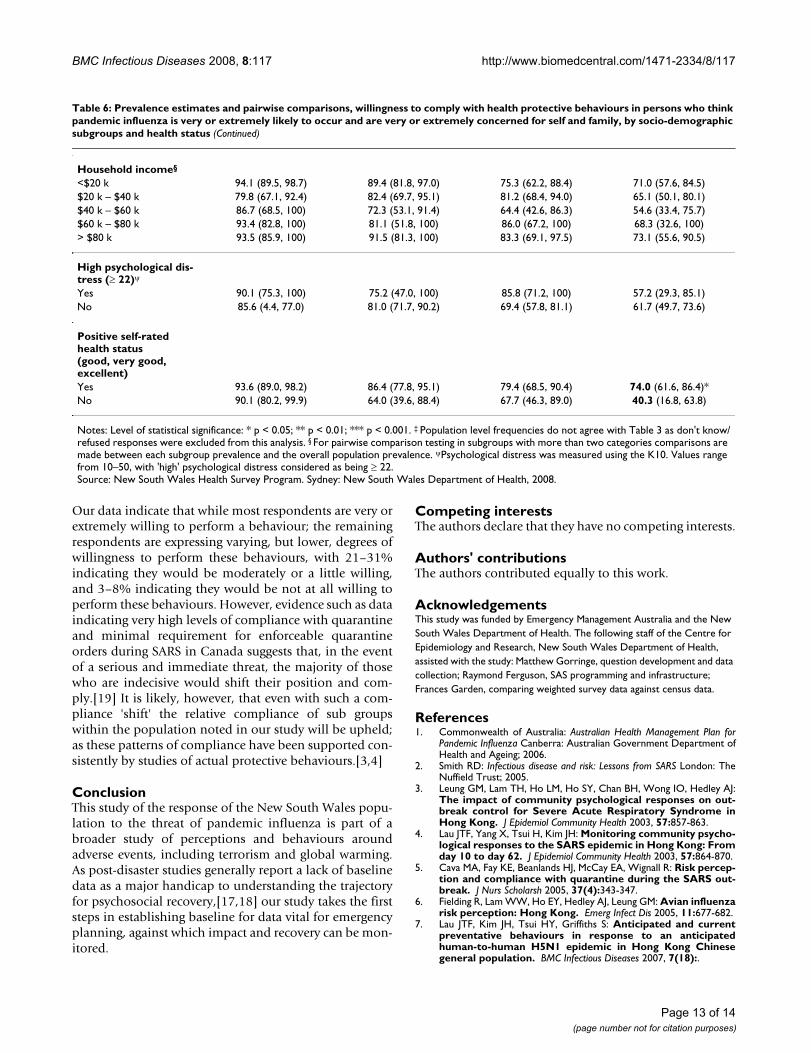
Table 6 shows the indicators for willing to receive vaccina-tion, isolate themselves, or wear a face mask as well ascomplying with all the specific public health behaviours:that is, willing to receive vaccination, isolate themselves,and wear a face in people who think a pandemic influenzais very or extremely likely, and who are also very orextremely concerned for themselves and their family.
DiscussionThis study shows it is possible to construct a small set ofquestions about threat perception for a general popula-tion, which can be used for health surveillance. Field test-ing identifies improvements that can be made to thequestions and the response structure, and highlights thepopulation's interest in surveys of this nature. Kappa val-ues for the indicators ranged from 0.25–0.51, which isacceptable for hypothetical questions. The items had lowdon't know response rates (0–3.9%); no respondentsrefused to answer any of the questions; and the majorityof respondents made positive comments about the ques-tions.
Page 5 of 14(page number not for citation purposes)
BMC Infectious Diseases 2008, 8:117 http://www.biomedcentral.com/1471-2334/8/117
Those reporting the highest levels of threat perception areolder people, those with fair or poor self-rated health sta-tus, no formal qualifications, low household incomes,and those living in rural areas. Perhaps surprisingly, therewere no differences noted between the perceptions of men
and women, or between those persons with or withoutchildren.
Overall, the majority of the population has taken noaction, at this point, to change the way they live their life
Table 2: Comparison of the weighted pandemic influenza survey sample to the Australian population for key demographics
Weighted pandemic influenza survey sample % 2006 Australian Population‡ % P values+
Gender Based on = > 16 yearsMale 50.8 48.8 p = 0.069Female 49.2 51.2
Age Based on = > 16 years16–24 15.1 15.5 p = 0.0125–34 17.1 17.135–44 19.7 18.845–54 18.8 17.755–64 14.3 14.065–74 9.5 8.875+ 5.4 8.1
Highest formal qualification Based on = > 15 yearsNone 6.1 7.9 p < 0.0001School certificate 22.1 17.3High school certificate 17.2 22.3TAFE certificate/diploma 22.6 31.7University degree/equivalent 32.0 20.8
Born in Australia ** Based on = > 15 years p = 0.065Yes 73.5 71.7No 26.5 28.3
Speak language other than English# Based on all yearsYes 16.8 16.8 p = 0.982No 83.2 83.2
Employed ^^ Based on = > 15Yes 64.1 61.2 p = 0.007No 35.9 38.8
Children in household *** ## Based on occupied dwellingsYes 41.5 43.3 p = 0.101No 58.5 56.7
Living alone Based on = > 15 yearsYes 11.1 12.5 p = 0.054No 88.9 87.5
Location ^^^ Based on all yearsUrban 70.1 68.4 p = 0.093Rural 29.9 31.6
Notes:‡ ABS figures obtained from the ABS website at http://www.censusdata.abs.gov.au. Symbols refer to ABS data: * Excludes Australian External Territories; ** Excludes country of birth not stated; # language spoken at home. Excludes language spoken at home not stated;## Count of persons in occupied private dwellings; *** children defined as being < 15 yrs old; ^based on 52 weeks in the year.^^ Employed is defined as any paid work full-time or part time ^^^ urban/rural is defined by area health service for NSW population survey and is equal to the major cities category for the Australian census. +chi squaredSource: New South Wales Health Survey Program. Sydney: New South Wales Department of Health, 2008.
Page 6 of 14(page number not for citation purposes)
BMC Infectious Diseases 2008, 8:117 http://www.biomedcentral.com/1471-2334/8/117
because of the possibility of pandemic influenza. The onlytwo subgroups reporting moderate changes are those bornoverseas and those who speak a language other than Eng-lish in the home.
Although direct comparisons with other studies are diffi-cult to make, these findings suggest that the threat percep-tions of the New South Wales population are similar tothose reported by residents of Hong Kong, even thoughAustralia has not been exposed directly to SARS or H5N1.
Willingness to comply with specific public health behav-iours is generally high (60–75%), with willingness to bevaccinated greater than being willing to be isolated, whichin turn is greater than being willing to wear a face mask.There is clearly a lower level of willingness to comply withwearing a face mask, especially in younger people, thoseliving in urban areas, and those who speak a languageother than English in the home.
Current findings on compliance with protective behav-iours are comparable with findings from studies con-
Table 3: Prevalence estimates for each question by response category including don't know and refused
Question Response % 95% LCI 95% UCI
Q.1 How likely do you think it is that pandemic influenza will occur in Australia? Not at all 13.0 10.7 15.2A little 31.6 28.6 34.5Moderately 36.3 33.4 39.2Very 9.7 7.9 11.4Extremely 4.6 3.4 5.8Don't know 4.3 3.2 5.4Refused 0.6 0.2 1.0
Q.2 If an influenza pandemic were to occur in Australia, how concerned would you be that you or your family would be affected by it?
Not at all 5.0 3.7 6.3
A little 21.6 19.0 24.2Moderately 26.5 23.8 29.2Very 30.4 27.7 33.2Extremely 13.9 11.6 16.3Don't know 2.0 1.2 2.8Refused 0.5 0.1 0.9
Q.3 How much have you changed the way you live your life because of the possibility of an influenza pandemic?
Not at all 74.6 71.8 77.5
A little 14.0 11.6 16.4Moderately 5.6 4.4 6.9Very 2.6 1.2 3.9Extremely 1.0 0.5 1.5Don't know 1.6 0.9 2.3Refused 0.5 0.1 0.9
Q.4 Please indicate how willing would you be to receive vaccination? Not at all 3.1 2.1 4.1A little 5.1 3.9 6.3Moderately 15.7 13.4 18.1Very 33.6 30.6 36.5Extremely 39.7 36.7 42.8Don't know 2.3 1.3 3.2Refused 0.5 0.1 0.9
Q.5 How willing would you be to isolate yourself from others if needed? Not at all 4.9 3.5 6.3A little 5.9 4.5 7.4Moderately 17.8 15.5 20.2Very 34.4 31.4 37.4Extremely 33.0 30.2 35.9Don't know 3.4 2.2 4.6Refused 0.5 0.1 0.9
Q.6 How willing would you be to wear a face mask? Not at all 7.8 6.1 9.5A little 9.2 7.3 11.0Moderately 21.6 19.0 24.2Very 30.5 27.6 33.3Extremely 27.1 24.5 29.8Don't know 3.3 2.2 4.4Refused 0.5 0.1 0.9
Source: New South Wales Health Survey Program. Sydney: New South Wales Department of Health, 2008.
Page 7 of 14(page number not for citation purposes)
BMC Infectious Diseases 2008, 8:117 http://www.biomedcentral.com/1471-2334/8/117
Table 4: Prevalence estimates and pairwise comparisons, threat perception questions, by socio-demographic subgroups and health status
Population Pandemic influenza likely
(% very/extremely likely)
Concern for self/family
(% very/extremely concerned)
Changed life(% a little/
moderately/a lot/extremely)
Pandemic influenza likely + concerned
for self/family
Pandemic influenza likely + concerned
+life changed
% (95% CI) % (95% CI) % (95% CI) % (95% CI) % (95% CI)
Total NSW popula-tion‡
14.9 (12.8, 17.2) 45.5 (42.4, 48.6) 23.8 (20.9, 26.6) 9.9 (8.0, 11.8) 4.37 (2.8, 5.9)
GenderMale 14.2 (10.6, 17.8) 43.5 (38.6, 48.4) 23.5 (18.9, 28.0) 9.3 (6.1, 12.4) 4.8 (2.0, 7.6)Female 15.8 (13.2, 18.3) 47.6 (43.8, 51.4) 24.0 (20.7, 27.4) 10.5 (8.5, 12.5) 4.0 (2.8, 5.2)
Age§
16–24 8.7 (3.6, 13.8)* 33.9 (24.3, 43.5)* 28.1(18.2, 38.0) 3.4 (6.1, 12.4)*** 0.9 (0, 2.2)***25–34 9.9 (4.8, 14.9) 43.2 (34.3, 52.0) 20.5 (13.6, 27.4) 6.1 (8.5, 12.5) 2.5 (0.2, 4.8)35–44 16.0 (9.1, 22.9) 47.9 (39.7, 56.1) 27.7 (19.8, 35.5) 10.4 (0.3, 6.5) 4.8 (0, 10.7)45–54 17.1 (12.7, 21.5) 50.0 (43.5, 56.5) 22.0 (16.8, 27.1) 13.1 (2.4, 9.8) 7.2 (3.7, 10.6)55–64 19.0 (14.0, 24.0) 47.4 (41.3, 53.5) 21.8 (16.5, 27.0) 13.0 (4.0, 16.8) 5.1 (1.6, 8.5)65–74 20.6 (15.5, 25.7)* 46.3 (40.3, 52.4) 23.2 (17.9, 28.5) 13.7 (9.0, 17.1) 5.8 (2.4, 9.1)75+ 17.6 (11.8, 24.3) 54.9 (47.0, 62.8)* 19.8 (13.1, 26.6) 13.3 (8.7, 17.3) 4.9 (1.7, 8.0)
Children in householdYes 11.6 (7.3, 15.9) 46.7 (40.6, 52.8) 26.5 (20.8, 32.3) 7.8 (3.9, 11.8) 4.2 (0.6, 7.8)No 16.6 (13.7, 19.4) 44.3 (40.2, 48.4) 22.8 (19.2, 26.3) 10.6 (8.4, 12.8) 4.5 (3.0, 6.1)
Born in AustraliaYes 15.3 (12.8, 17.9) 46.4 (42.8, 50.0) 21.8(18.7, 25.0)* 9.9 (7.7, 12.0) 4.3 (2.4, 6.2)No 13.9 (9.5, 18.2) 42.9 (36.5, 49.2) 29.3 (23.2, 35.5) 10.0 (6.2, 13.7) 4.6 (2.0, 7.2)
Speak language other than English at homeYes 13.5 (7.2, 19.8) 46.5 (37.5, 55.5) 36.3 (27.4, 45.3)** 10.3 (4.8, 15.9) 4.7 (1.0, 8.4)No 15.3 (12.9, 17.6) 45.3 (42.0, 48.6) 21.4 (18.6, 24.3) 9.8 (7.8, 11.8) 4.3 (2.6, 6.0)
LocationUrban 13.1 (10.1, 16.0)* 45.0 (40.8, 49.2) 24.7 (20.9, 28.5) 8.5 (6.0, 11.0)* 4.3 (2.1, 6.5Rural 19.1 (16.3, 22.0) 46.6 (42.6, 50.5) 21.7 (18.4, 25.0) 12.8 (10.4, 15.3) 4.5 (3.1, 6.0)
Living aloneYes 18.7 (14.9, 22.5) 47.4 (42.6, 52.3) 19.4 (15.7, 23.1)* 13.5 (10.1, 16.9)* 4.3 (2.4, 6.0)No 14.5 (12.1, 17.0) 45.3 (41.8, 48.8) 24.3 (21.2, 27.5) 9.4 (7.4, 11.5) 4.4 (2.7, 6.1)
Highest formal qualification§
None 27.4 (18.2, 36.6)* 53.5 (44.0, 62.9) 26.1 (18.2, 34.0) 18.3 (11.2, 25.4)* 8.7 (3.2, 14.1)School certificate 16.8 (12.5, 21.0) 45.9 (39.9, 51.8) 22.7 (17.8, 27.7) 9.6 (6.9, 12.3) 3.7 (2.1, 5.4)High school certificate 11.5 (7.2, 15.9) 39.6 (31.7, 47.6) 22.1 (15.0, 29.3) 8.2 (4.6, 11.8) 3.8 (1.7, 5.9)TAFE certificate/diploma
15.4 (10.9, 19.8) 44.1 (37.7, 50.6) 24.3 (18.4, 30.2) 9.2 (5.7, 12.6) 3.7 (1.1, 6.2)
University degree/equivalent
13.2 (8.7, 17.7) 47.6 (41.5, 53.6) 24.2 (18.5, 30.0) 10.1 (5.7, 14.4) 4.9 (0.9, 8.9)
EmployedYes 13.5 (10.6, 16.0)* 44.9 (40.6, 49.3) 22.5 (18.8, 26.3) 8.5 (6.4, 10.5)* 3.3 (1.9, 4.6)No 18.1 (14.7, 21.4) 47.2 (42.7, 51.6) 24.1 (20.1, 28.2) 12.3 (9.6, 15.1) 5.2 (3.1, 7.3)
Page 8 of 14(page number not for citation purposes)
BMC Infectious Diseases 2008, 8:117 http://www.biomedcentral.com/1471-2334/8/117
ducted in Hong Kong in relation to anticipated SARS andH5N1.[4,7] A study about SARS in Hong Kong indicatesthat those with higher risk perception and moderate levelsof anxiety were more likely to take comprehensive precau-tionary measures against infection, and younger less edu-cated males were least likely to adopt preventativemeasures.[3] Our data suggest that younger people areless likely to comply with protective behaviours, while a
higher level of formal education (a university degree orequivalent) is associated with higher willingness to com-ply with all protective behaviours, but especially wearinga face mask.
A study of this nature has a number of limitations. First,people are being asked about a hypothetical event ofwhich they have no experience. However, comparisons
Household income§
< $20 k 21.2(15.8, 26.6)* 45.9 (39.4, 52.3) 30.1 (23.0, 37.1) 16.1 (11.3, 20.8)* 7.0 (3.6, 10.4)$20 k – $40 k 18.8 (13.8, 23.8) 47.2 (39.9, 54.6) 25.6 (18.8, 32.4) 12.5 (8.6, 16.4) 5.1 (2.3, 7.8)$40 k – $60 k 18.9 (13.1, 24.7) 46.6 (38.7, 54.5) 24.8 (17.6, 32.0) 10.8 (6.6, 15.1) 2.3 (0.6, 3.9)$60 k – $80 k 17.2(7.1, 27.3) 45.5 (35.0, 55.9) 19.5 (9.8, 29.2) 12.1 (2.1, 22.0) 7.4 (0, 17.0)> $80 k 9.0 (5.8, 12.3)** 43.9 (37.5, 50.2) 22.0 (16.7, 27.4) 5.2 (2.9, 7.5)** 2.4 (1.0, 3.9)
High psychological distress (≥ 22)ψ
Yes 21.5 (12.0, 30.9) 46.0 (35.3, 56.7) 30.0 (19.8, 40.2) 16.5 (8.0, 25.0) 8.8 (2.3, 15.4)No 14.1 (11.4, 16.8) 45.7 (41.4, 50.0) 22.6 (18.9, 26.2) 8.5 (6.5, 10.4) 3.0 (1.9, 4.1)
Positive self-rated health status (good, very good, excellent)Yes 13.9 (10.5, 17.2)* 43.7(39.1, 48.3)* 22.4 (18.2, 26.5)* 8.6 (5.7, 11.5)* 3.7 (1.2, 6.3)No 23.4 (15.3, 31.5) 56.0 (47.1, 64.9) 32.7 (23.5, 41.9) 17.9 (4.0, 10.1) 10.3 (3.2, 17.4)
Notes: Level of statistical significance: * p < 0.05; ** p < 0.01; *** p < 0.001. ‡ Population level frequencies do not agree with Table 3 as don't know/refused responses were excluded from this analysis. § For pairwise comparison testing in subgroups with more than two categories comparisons are made between each subgroup prevalence and the overall population prevalence. ψPsychological distress was measured using the K10. Values range from 10–50, with 'high' psychological distress considered as being ≥ 22. Source: New South Wales Health Survey Program. Sydney: New South Wales Department of Health, 2008.
Table 4: Prevalence estimates and pairwise comparisons, threat perception questions, by socio-demographic subgroups and health status (Continued)
Prevalence estimates and 95% confidence intervals for response combinations to the three questions on perceived threat for pandemic influenzaFigure 1Prevalence estimates and 95% confidence intervals for response combinations to the three questions on per-ceived threat for pandemic influenza. Source: New South Wales Health Survey Program. Sydney: New South Wales Department of Health, 2008.
0 5 10 15 20 25 30 35 40 45 50 55
Likely to occur, concerned for self and family, life changes
Likely to occur, concerned for self and family, no life changes
Likely to occur, not concerned for self and family, life changes
Likely to occur, not concerned for self and family, no life changes
Unlikely to occur, concerned for self and family, life changes
Unlikely to occur, concerned for self and family, no life changes
Unlikely to occur, not concerned for self and family, life changes
Unlikely to occur, not concerned for self and family, no life changes
%
Page 9 of 14(page number not for citation purposes)
BMC Infectious Diseases 2008, 8:117 http://www.biomedcentral.com/1471-2334/8/117
Table 5: Prevalence estimates and pairwise comparisons, willingness to comply with health protective behaviours, by socio-demographic subgroups and health status
Population Very willing to comply with vaccination
Very willing to comply with isolation
Very willing to comply with wearing a face
mask
Very willing to comply with ALL: vaccination +
isolation+ wearing a face mask
% (95%C) % (95%CI) % (95%CI) % (95%CI)
Total NSW population‡ 75.4 (72.7, 78.1) 70.2 (67.3, 73.0) 59.9 (56.8, 63.0) 47.7 (44.5, 50.8)
GenderMale 76.2 (72.0, 80.4) 68.1 (63.5, 72.7) 59.4 (54.6, 64.3) 48.3(43.3, 53.3)Female 74.6 (71.2, 77.9) 72.3 (68.8, 75.7) 60.4 (56.5, 64.2) 47.0 (43.2, 50.9)
Age§
16–24 67.3 (57.8, 76.8) 59.2 (49.3, 69.1)* 43.9 (33.8, 54.1)** 33.1 (23.2, 43.1)**25–34 72.3 (64.1, 80.5) 62.4 (53.7, 71.1) 53.8 (44.8, 62.8) 40.5 (31.8, 49.2)35–44 79.3 (73.4, 85.3) 74.2 (67.4, 81.0) 66.7 (59.4, 74.0) 50.0 (41.8, 58.3)45–54 77.8 (72.5, 83.0) 72.9 (67.1, 78.8) 61.3 (55.0, 67.6) 52.4 (45.9, 58.9)55–64 75.8 (70.6, 80.9) 77.4 (72.1, 82.7)* 64.8 (58.6, 70.9) 52.4 (46.1, 58.6)65–74 81.5 (77.0, 86.0)* 74.3 (69.1, 79.5) 69.1 (63.5, 74.7)** 58.2 (52.0, 64.3)**75+ 73.9 (67.4, 80.5) 72.5 (65.3, 79.6) 64.4 (56.9, 72.0) 53.4 (45.4, 61.4)
Children in householdYes 80.5 (75.8, 85.3)** 71.8 (66.3, 77.2) 58.4 (52.4, 64.5) 47.8 (41.6, 54.0)No 72.5 (68.7, 76.3) 69.0 (65.1, 72.9) 60.4 (56.3, 64.6) 47.2 (43.0, 51.3)
Born in AustraliaYes 76.5 (73.5, 79.6) 72.0 (68.8, 75.2)* 60.3 (56.8, 63.9) 48.6 (44.9, 52.2)No 72.2 (66.4, 78.0) 64.7 (58.3, 71.2) 58.4 (51.9, 64.9) 44.9 (38.4, 51.4)
Speak language other than English at homeYes 67.5 (59.1, 75.9)* 53.3 (44.1, 62.3)*** 53.4 (44.3, 62.4) 36.9 (28.0, 45.7)**No 77.0 (74.2, 79.8) 73.3 (70.4, 76.2) 61.1 (57.7, 64.3) 49.7 (46.3, 53.1)
LocationUrban 74.4 (70.7, 78.0) 68.9(64.9, 72.8) 57.8(53.6, 62.0)* 46.2 (41.9, 50.5)Rural 77.6 (74.4, 80.8) 72.9 (69.4, 76.3) 64.4 (60.6, 68.2) 50.8 (46.7, 54.8)
Living aloneYes 72.6 (68.2, 77.0) 70.2 (65.5, 74.8) 62.0 (57.2, 66.9) 49.5 (44.5, 54.5)No 75.8 (72.8, 78.8) 70.2 (66.9, 73.4) 59.6 (56.1, 63.1) 47.4 (43.9, 51.0)
Highest formal qualifi-cation§
None 75.6 (67.9, 83.4) 64.0 (54.5, 73.4) 59.8 (50.6, 68.9) 42.3 (32.8, 51.8)School certificate 71.2 (65.6, 76.8) 65.4 (59.7, 71.2) 57.2 (51.2, 63.2) 45.1 (39.1, 51.2)High school certificate 72.9 (65.4, 80.4) 66.4 (58.6, 74.1 51.9 (43.6, 60.2) 42.1 (34.1, 50.1)TAFE certificate/diploma 74.5 (68.7, 80.3) 73.3 (67.5, 79.1) 57.0 (50.4, 63.6) 45.7 (39.2, 52.2)University degree/equivalent
80.4 (75.8, 85.0) 74.7 (69.4, 80.0) 67.6 (61.9, 73.2)* 54.5 (48.5, 60.5)*
EmployedYes 76.4 (72.7, 80.1) 69.5 (65.5, 73.5) 58.9 (54.5, 63.2) 47.3 (42.8, 51.7)No 74.5 (70.6, 78.5) 71.8 (67.7, 76.0) 62.0 (57.6, 66.5) 49.1 (44.6, 53.6)
Household income§
< $20 k 71.2 (65.2, 77.2) 71.6 (65.8, 77.4) 63.2 (56.9, 69.5) 49.9 (43.1, 56.6)$20 k – $40 k 72.7 (66.1, 79.2) 74.3 (68.0, 80.6) 60.3 (52.8, 67.7) 47.5 (40.1, 54.8)
Page 10 of 14(page number not for citation purposes)
BMC Infectious Diseases 2008, 8:117 http://www.biomedcentral.com/1471-2334/8/117
with other studies, where respondents have direct experi-ence of real events, suggest similar patterns of response.Second, the actual level of compliance with protectivebehaviours correlates with an actual and immediatethreat. For example, Lau et al. plotted changes in maskwearing behaviour during an outbreak of SARS in HongKong in 2003,[4] and reported mask wearing rising from11% in the early stages to 94% in the later stages of the
outbreak. Clearly data in that study support the increasedlikelihood of protective behaviours being adopted withincreased risk perception; and, in our study, those withhigher levels of threat perception were significantly morelikely to be willing to comply with specific public healthbehaviours.
$40 k – $60 k 70.1 (62.5, 77.6) 67.9 (60.3, 75.5) 58.5 (50.4, 66.5) 42.1 (34.4, 49.7)$60 k – $80 k 79.0 (70.6, 87.4) 64.3 (54.1, 74.5) 60.8 (50.7, 70.9) 46.0 (35.3, 56.6)> $80 k 81.4 (76.2, 86.5)* 74.3 (68.6, 80.0) 60.5 (54.2, 66.8) 51.4 (45.0, 57.9)
High psychological dis-tress (≥ 22)ψ
Yes 75.6 (66.1, 85.0) 67.6 (57.3, 77.9) 55.5 (44.7, 66.4) 40.9 (30.4, 51.4)No 77.1 (73.5, 80.7) 73.3 (69.3, 77.2) 63.1 (58.8, 67.4) 50.2 (45.8, 54.6)
Positive self-rated health status (good, very good, excellent)Yes 77.7 (73.9, 81.5) 70.3 (66.2, 74.5) 60.7 (56.2, 65.2 49.8 (45.1, 54.5)No 68.3 (59.4, 77.2) 68.6 (59.5, 77.6) 61.0 (52.0, 69.9) 45.2 (36.2, 54.3)
Notes: Level of statistical significance: * p < 0.05; ** p < 0.01; *** p < 0.001. ‡ Population level frequencies do not agree with Table 3 as don't know/refused responses were excluded from this analysis. § For pairwise comparison testing in subgroups with more than two categories comparisons are made between each subgroup prevalence and the overall population prevalence. ψPsychological distress was measured using the K10. Values range from 10–50, with 'high' psychological distress considered as being ≥ 22.Source: New South Wales Health Survey Program. Sydney: New South Wales Department of Health, 2008.
Table 5: Prevalence estimates and pairwise comparisons, willingness to comply with health protective behaviours, by socio-demographic subgroups and health status (Continued)
Prevalence estimates and 95% confidence intervals for response combinations to the three questions on health protection behaviours for pandemic influenzaFigure 2Prevalence estimates and 95% confidence intervals for response combinations to the three questions on health protection behaviours for pandemic influenza. Source: New South Wales Health Survey Program. Sydney: New South Wales Department of Health, 2008.
0 5 10 15 20 25 30 35 40 45 50 55
Willing to be vaccinated, isolated, and wear a face mask
Willing to be vaccinated and isolated, but not willing to wear a face mask
Willing to be vaccinated and wear a face mask, but not willing to be isolated
Willing to be vaccinated, but not willing to be isolated or wear a face mask
Willing to be isolated and to wear a face mask, but not willing to be vaccinated
Willing to be isolated, but not willing to be vaccinated or to wear a face mask
Willing to wear a face mask, but not wiling to be vaccinated or isolated
Not willing to be vaccinated, isolated, or wear a face mask
%
Page 11 of 14(page number not for citation purposes)
BMC Infectious Diseases 2008, 8:117 http://www.biomedcentral.com/1471-2334/8/117
Table 6: Prevalence estimates and pairwise comparisons, willingness to comply with health protective behaviours in persons who think pandemic influenza is very or extremely likely to occur and are very or extremely concerned for self and family, by socio-demographic subgroups and health status
Responses ONLY for those people who think that Pandemic influenza is very/extremely likely and are also very/extremely concerned for self and family (n = 212)
Very willing to comply with vaccination
Very willing to comply with isolation
Very willing to comply with wearing a face
mask
Very willing to comply with ALL: vaccination +
isolation+ wearing a face mask
% (95%CI) % (95%CI) % (95%CI) % (95%CI)
Total NSW population‡ 89.0 (84.2, 93.9) 80.2 (72.6, 87.8) 76.4 (69.1, 83.7) 63.6 (54.5, 72.8)
GenderMale 90.5 (83.0, 98.0) 80.6 (68.4, 92.8) 74.0 (61.6, 86.4) 64.8 (49.6, 80.0)Female 87.6 (81.6, 93.7) 79.8 (70.3, 89.4) 78.6 (70.4, 86.8) 62.5 (52.3, 72.8)
Age§
16–24 67.1 (23.0, 100) 26.3 (0, 71.1)* 52.6 (1.2, 100) -25–34 95.0 (85.0, 100) 59.9 (28.1, 91.7) 80.7 (60.0, 100) 51.9 (20.3, 83.6)35–44 85.4 (68.9, 100) 86.0 (70.6, 100) 63.2 (35.5, 90.9) 55.8 (24.7, 87.0)45–54 90.9 (84.0, 97.8) 76.2 (59.0, 93.4) 83.3 (72.6, 93.9) 65.0 (48.0, 82.0)55–64 90.8 (83.0, 98.6) 91.9 (84.4, 99.5)* 77.9 (65.2, 90.6) 70.1 (55.6, 84.7)65–74 92.4 (85.8, 99.0) 86.1 (76.8, 95.4) 85.9 (73.4, 98.4) 81.8 (71.5, 92.1)**75+ 87.1 (70.8, 100) 85.6 (68.1, 100) 77.2 (56.5, 97.9) 72.9 (50.9, 94.9)
Children in householdYes 93.6(84.8, 100) 71.7 (50.2, 93.3) 77.2 (60.7, 93.8) 58.9 (34.8, 83.0)No 87.4 (80.9, 94.0) 77.0 (76.6, 90.8) 77.9 (68.9, 87.0) 69.6 (60.0, 79.3)
Born in AustraliaYes 88.9 (83.3, 94.6) 84.9 (78.7, 91.1) 76.1 (67.8, 84.3) 68.0 (58.6, 77.5)No 89.4 (80.1, 98.6) 64.2 (42.5, 85.9) 77.3 (62.0, 92.5) 48.6 (28.4, 68.8)
Speak language other than English at homeYes 84.6 (65.1, 100) 41.1(11.9, 70.2) 60.4 (32.8, 88.1) 17.6 (0, 35.9)No 89.8 (85.4, 94.3) 85.9 (80.5, 91.4)** 79.2 (72.3, 86.1) 70.4 (62.2, 78.6)***
LocationUrban 87.9 (80.3, 95.5) 81.3 (69.7, 92.8) 79.0 (68.8, 89.1) 63.5 (49.2, 77.8)Rural 90.7 (85.9, 95.4) 78.8 (70.3, 87.4) 72.7 (63.2, 82.2) 63.8 (54.1, 73.5)
Living aloneYes 86.2 (77.7, 94.6) 84.3 (74.7, 93.9) 68.9 (55.5, 82.3) 51.6 (37.9, 65.3)No 89.6 (84.1, 95.0) 79.5 (70.7, 88.3) 77.7 (69.5, 85.9) 65.8 (55.5, 76.2)
Highest formal qualifi-cation§
None 92.1 (83.9, 100) 79.2 (64.9, 93.5) 65.0 (44.2, 85.8) 55.8 (34.1, 77.5)School certificate 79.3 (66.7, 91.8) 73.9 (60.2, 87.7) 71.7 (57.9, 85.5) 55.1 (40.8, 69.5)High school certificate 91.5 (82.0, 100) 75.8(50.0, 100) 86.3 (71.7, 100) 63.6 (38.8, 88.5)TAFE certificate/diploma 87.0 (73.6, 100) 77.3 (61.6, 93.1) 68.0 (49.8, 86.2) 65.0 (46.5, 83.6)University degree/equivalent
95.0 (89.9, 100) 88.6 (74.3, 100) 84.4 (73.4, 95.5) 71.7 (54.4, 90.0)
EmployedYes 88.5 (81.0, 96.0) 78.0 (67.0, 89.0) 74.9 (64.5, 85.3) 61.2 (48.9, 73.5)No 88.3 (81.7, 95.0) 79.3 (67.9, 90.7) 74.1 (64.2, 84.0) 60.3 (48.3, 72.4)
Page 12 of 14(page number not for citation purposes)
BMC Infectious Diseases 2008, 8:117 http://www.biomedcentral.com/1471-2334/8/117
Our data indicate that while most respondents are very orextremely willing to perform a behaviour; the remainingrespondents are expressing varying, but lower, degrees ofwillingness to perform these behaviours, with 21–31%indicating they would be moderately or a little willing,and 3–8% indicating they would be not at all willing toperform these behaviours. However, evidence such as dataindicating very high levels of compliance with quarantineand minimal requirement for enforceable quarantineorders during SARS in Canada suggests that, in the eventof a serious and immediate threat, the majority of thosewho are indecisive would shift their position and com-ply.[19] It is likely, however, that even with such a com-pliance 'shift' the relative compliance of sub groupswithin the population noted in our study will be upheld;as these patterns of compliance have been supported con-sistently by studies of actual protective behaviours.[3,4]
ConclusionThis study of the response of the New South Wales popu-lation to the threat of pandemic influenza is part of abroader study of perceptions and behaviours aroundadverse events, including terrorism and global warming.As post-disaster studies generally report a lack of baselinedata as a major handicap to understanding the trajectoryfor psychosocial recovery,[17,18] our study takes the firststeps in establishing baseline for data vital for emergencyplanning, against which impact and recovery can be mon-itored.
Competing interestsThe authors declare that they have no competing interests.
Authors' contributionsThe authors contributed equally to this work.
AcknowledgementsThis study was funded by Emergency Management Australia and the New South Wales Department of Health. The following staff of the Centre for Epidemiology and Research, New South Wales Department of Health, assisted with the study: Matthew Gorringe, question development and data collection; Raymond Ferguson, SAS programming and infrastructure; Frances Garden, comparing weighted survey data against census data.
References1. Commonwealth of Australia: Australian Health Management Plan for
Pandemic Influenza Canberra: Australian Government Department ofHealth and Ageing; 2006.
2. Smith RD: Infectious disease and risk: Lessons from SARS London: TheNuffield Trust; 2005.
3. Leung GM, Lam TH, Ho LM, Ho SY, Chan BH, Wong IO, Hedley AJ:The impact of community psychological responses on out-break control for Severe Acute Respiratory Syndrome inHong Kong. J Epidemiol Community Health 2003, 57:857-863.
4. Lau JTF, Yang X, Tsui H, Kim JH: Monitoring community psycho-logical responses to the SARS epidemic in Hong Kong: Fromday 10 to day 62. J Epidemiol Community Health 2003, 57:864-870.
5. Cava MA, Fay KE, Beanlands HJ, McCay EA, Wignall R: Risk percep-tion and compliance with quarantine during the SARS out-break. J Nurs Scholarsh 2005, 37(4):343-347.
6. Fielding R, Lam WW, Ho EY, Hedley AJ, Leung GM: Avian influenzarisk perception: Hong Kong. Emerg Infect Dis 2005, 11:677-682.
7. Lau JTF, Kim JH, Tsui HY, Griffiths S: Anticipated and currentpreventative behaviours in response to an anticipatedhuman-to-human H5N1 epidemic in Hong Kong Chinesegeneral population. BMC Infectious Diseases 2007, 7(18):.
Household income§
<$20 k 94.1 (89.5, 98.7) 89.4 (81.8, 97.0) 75.3 (62.2, 88.4) 71.0 (57.6, 84.5)$20 k – $40 k 79.8 (67.1, 92.4) 82.4 (69.7, 95.1) 81.2 (68.4, 94.0) 65.1 (50.1, 80.1)$40 k – $60 k 86.7 (68.5, 100) 72.3 (53.1, 91.4) 64.4 (42.6, 86.3) 54.6 (33.4, 75.7)$60 k – $80 k 93.4 (82.8, 100) 81.1 (51.8, 100) 86.0 (67.2, 100) 68.3 (32.6, 100)> $80 k 93.5 (85.9, 100) 91.5 (81.3, 100) 83.3 (69.1, 97.5) 73.1 (55.6, 90.5)
High psychological dis-tress (≥ 22)ψ
Yes 90.1 (75.3, 100) 75.2 (47.0, 100) 85.8 (71.2, 100) 57.2 (29.3, 85.1)No 85.6 (4.4, 77.0) 81.0 (71.7, 90.2) 69.4 (57.8, 81.1) 61.7 (49.7, 73.6)
Positive self-rated health status (good, very good, excellent)Yes 93.6 (89.0, 98.2) 86.4 (77.8, 95.1) 79.4 (68.5, 90.4) 74.0 (61.6, 86.4)*No 90.1 (80.2, 99.9) 64.0 (39.6, 88.4) 67.7 (46.3, 89.0) 40.3 (16.8, 63.8)
Notes: Level of statistical significance: * p < 0.05; ** p < 0.01; *** p < 0.001. ‡ Population level frequencies do not agree with Table 3 as don't know/refused responses were excluded from this analysis. § For pairwise comparison testing in subgroups with more than two categories comparisons are made between each subgroup prevalence and the overall population prevalence. ψPsychological distress was measured using the K10. Values range from 10–50, with 'high' psychological distress considered as being ≥ 22.Source: New South Wales Health Survey Program. Sydney: New South Wales Department of Health, 2008.
Table 6: Prevalence estimates and pairwise comparisons, willingness to comply with health protective behaviours in persons who think pandemic influenza is very or extremely likely to occur and are very or extremely concerned for self and family, by socio-demographic subgroups and health status (Continued)
Page 13 of 14(page number not for citation purposes)

BMC Infectious Diseases 2008, 8:117 http://www.biomedcentral.com/1471-2334/8/117
Publish with BioMed Central and every scientist can read your work free of charge
"BioMed Central will be the most significant development for disseminating the results of biomedical research in our lifetime."
Sir Paul Nurse, Cancer Research UK
Your research papers will be:
available free of charge to the entire biomedical community
peer reviewed and published immediately upon acceptance
cited in PubMed and archived on PubMed Central
yours — you keep the copyright
Submit your manuscript here:http://www.biomedcentral.com/info/publishing_adv.asp
BioMedcentral
8. De Zwart O, Veldhuijzen IK, Elam G, Aro AR, Abraham T, BishopGD, Richardus JH, Brug J: Avian Influenza Risk Perception,Europe and Asia. Emerg Infect Dis 2007, 13(2):290-293.
9. Di Giuseppe G, Abbate R, Albano L, Marinelli P, Angelillo IF: A sur-vey of knowledge, attitudes and practices towards avianinfluenza in an adult population of Italy. BMC Infect Dis 2008,8:36.
10. Lemyre L, Lee JEC, Krewski D: National public survey of per-ceived CBRN terrorism threat and preparedness. In Universityof Ottawa in partnership with Health Canada and the Canadian FoodInspection Agency Ottawa: Institute of Population Health, University ofOttawa; 2004.
11. Barr M, Baker D, Gorringe M, Fritsche L: NSW Population HealthSurvey: Description of Methods. 2008 [http://www.health.nsw.gov.au/resources/publichealth/surveys/health_survey_method.asp]. Sydney: Centre for Epidemiology andResearch, New South Wales Department of Health (accessed 8August 2008)
12. Australian Bureau of Statistics: Population Survey Monitor. Cat-alogue no. 4103.0 Canberra: ABS; 1996.
13. Brick JM, Dipko S, Presser S, Tucker C, Yuan Y: Estimation Issues inDual Frame Sample of Cell and Landline Numbers; ASA Section on SurveyResearch Methods 2005 [http://www.amstat.org/sections/SRMS/proceedings/y2005/Files/JSM2005-000236.pdf]. (accessed 8 August 2008)
14. Yuan Y, Allen B, Brick JM, Dipko S, Presser S, Tucker C, Han D, BurnsL, Galesic M: Surveying households on cell phones: Results andlessons. Paper presented at the Annual Conference of the American Asso-ciation for Public Opinion Research, Miami, Florida 2005 [http://www.bls.gov/ore/pdf/st050280.pdf]. (accessed 8 August 2008)
15. Steel D: NSW Population Health Survey: Review of Weight-ing Procedures. 2008 [http://www.health.nsw.gov.au/pubs/2006/review_weighting.html]. Sydney: Centre for Epidemiology andResearch, New South Wales Department of Health (accessed 8August 2008)
16. Australian Bureau of Statistics: Census of Population and Housing 2006[http://www.censusdata.abs.gov.au]. Catalogue no. 2914.0. Canberra:ABS
17. Lerner JS, Gonzalez RM, Small DA, Fischhoff B: Effects of fear andanger on perceived risks of terrorism: A national field exper-iment. Psychol Sci 2003, 14(2):144-150.
18. North CS, Pfefferbaum B, Narayanan P, Thielman S, McCoy G,Dumont C, Kawasaki A, Ryosho N, Spitznagel EL: Comparison ofpost-disaster psychiatric disorders after terrorist bombingsin Nairobi and Oklahoma City. Br J Psychiatry 2005, 186:487-493.
19. Svoboda T, Henry B, Shulman L, Kennedy E, Rea E, Ng W, WallingtonT, Yaffe B, Gournis E, Vicencio E, Basrur S, Glazier R: Public healthmeasures to control the spread of the Severe Acute Respira-tory Syndrome during the outbreak in Toronto. N Engl J Med2004, 350(23):2352-2361.
Pre-publication historyThe pre-publication history for this paper can be accessedhere:
http://www.biomedcentral.com/1471-2334/8/117/prepub
Page 14 of 14(page number not for citation purposes)