Paleolithic Diet—Effect on the Health Status and Performance ...
56
nutrients Review Paleolithic Diet—Effect on the Health Status and Performance of Athletes? Barbara Fr ˛ aczek 1, * , Aleksandra Pi ˛ eta 1 , Adrian Burda 2 , Paulina Mazur-Kurach 1 and Florentyna Tyrala 3 Citation: Fr ˛ aczek, B.; Pi ˛ eta, A.; Burda, A.; Mazur-Kurach, P.; Tyrala, F. Paleolithic Diet—Effect on the Health Status and Performance of Athletes? Nutrients 2021, 13, 1019. https:// doi.org/10.3390/nu13031019 Academic Editor: Scott Forbes Received: 24 February 2021 Accepted: 18 March 2021 Published: 21 March 2021 Publisher’s Note: MDPI stays neutral with regard to jurisdictional claims in published maps and institutional affil- iations. Copyright: © 2021 by the authors. Licensee MDPI, Basel, Switzerland. This article is an open access article distributed under the terms and conditions of the Creative Commons Attribution (CC BY) license (https:// creativecommons.org/licenses/by/ 4.0/). 1 Department of Sports Medicine and Human Nutrition, Institute of Biomedical Sciences, University School of Physical Education in Krakow, Jana Pawla II 78, 31-571 Cracow, Poland; [email protected] (A.P.); [email protected] (P.M.-K.) 2 Department of Econometrics and Operational Research, Cracow University of Economics, 31-510 Cracow, Poland; [email protected] 3 Department of Sports Dietetics, Gdansk University of Physical Education and Sport, 80-336 Gdansk, Poland; fl[email protected] * Correspondence: [email protected]; Tel.: +48-126831002 Abstract: The aim of this meta-analysis was to review the impact of a Paleolithic diet (PD) on selected health indicators (body composition, lipid profile, blood pressure, and carbohydrate metabolism) in the short and long term of nutrition intervention in healthy and unhealthy adults. A systematic review of randomized controlled trials of 21 full-text original human studies was conducted. Both the PD and a variety of healthy diets (control diets (CDs)) caused reduction in anthropometric parameters, both in the short and long term. For many indicators, such as weight (body mass (BM)), body mass index (BMI), and waist circumference (WC), impact was stronger and especially found in the short term. All diets caused a decrease in total cholesterol (TC), low-density lipoprotein cholesterol (LDL-C), and triglycerides (TG), albeit the impact of PD was stronger. Among long-term studies, only PD cased a decline in TC and LDL-C. Impact on blood pressure was observed mainly in the short term. PD caused a decrease in fasting plasma (fP) glucose, fP insulin, and homeostasis model assessment of insulin resistance (HOMA-IR) and glycated hemoglobin (HbA1c) in the short run, contrary to CD. In the long term, only PD caused a decrease in fP glucose and fP insulin. Lower positive impact of PD on performance was observed in the group without exercise. Positive effects of the PD on health and the lack of experiments among professional athletes require longer-term interventions to determine the effect of the Paleo diet on athletic performance. Keywords: Paleolithic diet; health status; physical performance; randomized controlled trials; sys- tematic review; meta-analysis 1. Introduction The popularity of the Paleolithic diet has increased in recent years. Paleolithic nutrition is based on the principles of evolutionary biology with a focus on the low or moderate carbohydrate options available to the hunter–gatherers [1–6]. There is no expertise in the history or determination of what Paleolithic hominins ate. There are some papers supporting high intakes of animal food in the Paleolithic diet [1,5,7] and evidence that Paleolithic hominins ate plant foods [8–12]. It seems to be difficult to imagine one basic diet covering the entire period from 2.6 million to 10,000 years ago (when humans began to cultivate plants (predominantly cereal grains) and domesticate animals) and people living in a wide range of climates and geographic regions. What is more, there are still few differing viewpoints and controversies about what Paleolithic hominins really eat, the ability to replicate the Paleolithic diet in modern times, and the degree to which the human genetic profile has evolved to handle foods in the modern diet (based on an assumption that the modern human is not evolutionarily adapted to contemporary nutrition, which may result in a high incidence of diseases considered civilization-related) [2,5,13–20]. As detailed Nutrients 2021, 13, 1019. https://doi.org/10.3390/nu13031019 https://www.mdpi.com/journal/nutrients
-
Upload
khangminh22 -
Category
Documents
-
view
2 -
download
0
Transcript of Paleolithic Diet—Effect on the Health Status and Performance ...

nutrients
Review
Paleolithic Diet—Effect on the Health Status and Performanceof Athletes?
Barbara Fraczek 1,* , Aleksandra Pieta 1, Adrian Burda 2, Paulina Mazur-Kurach 1 and Florentyna Tyrała 3
�����������������
Citation: Fraczek, B.; Pieta, A.;
Burda, A.; Mazur-Kurach, P.; Tyrała, F.
Paleolithic Diet—Effect on the Health
Status and Performance of Athletes?
Nutrients 2021, 13, 1019. https://
doi.org/10.3390/nu13031019
Academic Editor: Scott Forbes
Received: 24 February 2021
Accepted: 18 March 2021
Published: 21 March 2021
Publisher’s Note: MDPI stays neutral
with regard to jurisdictional claims in
published maps and institutional affil-
iations.
Copyright: © 2021 by the authors.
Licensee MDPI, Basel, Switzerland.
This article is an open access article
distributed under the terms and
conditions of the Creative Commons
Attribution (CC BY) license (https://
creativecommons.org/licenses/by/
4.0/).
1 Department of Sports Medicine and Human Nutrition, Institute of Biomedical Sciences, University School ofPhysical Education in Krakow, Jana Pawla II 78, 31-571 Cracow, Poland; [email protected] (A.P.);[email protected] (P.M.-K.)
2 Department of Econometrics and Operational Research, Cracow University of Economics,31-510 Cracow, Poland; [email protected]
3 Department of Sports Dietetics, Gdansk University of Physical Education and Sport, 80-336 Gdansk, Poland;[email protected]
* Correspondence: [email protected]; Tel.: +48-126831002
Abstract: The aim of this meta-analysis was to review the impact of a Paleolithic diet (PD) on selectedhealth indicators (body composition, lipid profile, blood pressure, and carbohydrate metabolism)in the short and long term of nutrition intervention in healthy and unhealthy adults. A systematicreview of randomized controlled trials of 21 full-text original human studies was conducted. Boththe PD and a variety of healthy diets (control diets (CDs)) caused reduction in anthropometricparameters, both in the short and long term. For many indicators, such as weight (body mass (BM)),body mass index (BMI), and waist circumference (WC), impact was stronger and especially foundin the short term. All diets caused a decrease in total cholesterol (TC), low-density lipoproteincholesterol (LDL-C), and triglycerides (TG), albeit the impact of PD was stronger. Among long-termstudies, only PD cased a decline in TC and LDL-C. Impact on blood pressure was observed mainlyin the short term. PD caused a decrease in fasting plasma (fP) glucose, fP insulin, and homeostasismodel assessment of insulin resistance (HOMA-IR) and glycated hemoglobin (HbA1c) in the shortrun, contrary to CD. In the long term, only PD caused a decrease in fP glucose and fP insulin. Lowerpositive impact of PD on performance was observed in the group without exercise. Positive effectsof the PD on health and the lack of experiments among professional athletes require longer-terminterventions to determine the effect of the Paleo diet on athletic performance.
Keywords: Paleolithic diet; health status; physical performance; randomized controlled trials; sys-tematic review; meta-analysis
1. Introduction
The popularity of the Paleolithic diet has increased in recent years. Paleolithic nutritionis based on the principles of evolutionary biology with a focus on the low or moderatecarbohydrate options available to the hunter–gatherers [1–6]. There is no expertise inthe history or determination of what Paleolithic hominins ate. There are some paperssupporting high intakes of animal food in the Paleolithic diet [1,5,7] and evidence thatPaleolithic hominins ate plant foods [8–12]. It seems to be difficult to imagine one basicdiet covering the entire period from 2.6 million to 10,000 years ago (when humans beganto cultivate plants (predominantly cereal grains) and domesticate animals) and peopleliving in a wide range of climates and geographic regions. What is more, there are stillfew differing viewpoints and controversies about what Paleolithic hominins really eat, theability to replicate the Paleolithic diet in modern times, and the degree to which the humangenetic profile has evolved to handle foods in the modern diet (based on an assumption thatthe modern human is not evolutionarily adapted to contemporary nutrition, which mayresult in a high incidence of diseases considered civilization-related) [2,5,13–20]. As detailed
Nutrients 2021, 13, 1019. https://doi.org/10.3390/nu13031019 https://www.mdpi.com/journal/nutrients

Nutrients 2021, 13, 1019 2 of 56
by many investigators, agricultural revolutions have introduced foods that were absentor negligible in the Paleolithic diet: refined cereal grains and their products, nonhumanmammalian milk and its products, energy-dense nutrient-poor foods (readily availableand inexpensive refined carbohydrates, as well as separated fats and oils, all taking a widevariety of forms), and legumes [21–28]. The dietary approach, which is often referred to asthe Paleo diet, targets the restriction of grains, dairy products, and all refined food items.The Paleo diet consists mainly of grass-fed and pasture-raised meats, vegetables, fruits,fungi, roots, and nuts, and excludes grains, legumes, and dairy products and limits refinedsugars, starches, processed foods, and oils. In sum, the Paleo diet is relatively high invitamins B (found in yeast, liver, and vegetables), D (found in mushrooms and liver), E(found in nuts, oils, vegetables, and fruits), and K (found in vegetables and liver), coenzymeQ10 (found in meat, fish, vegetables, and olive oil), alfa-lipoic acid (ALA) (found in organmeat, vegetables, and yeast), polyphenols (found in fruits, vegetables, herbs, nuts, tea, redwine, algae, coffee, chocolate, olives, and olive oil), carotenoids (from fruits, vegetables,olives, algae, and seafood), polyunsaturated fatty acids (from nuts, seeds, olive oil, seaweed,and fish), and elements such as selenium (found in nuts, fish and seafood) and zinc (foundin nuts and seeds) [29–32]. As the diet is defined by the avoidance of particular food sourcesrather than a specific macronutrient distribution, there is a large degree of variation inthe macronutrient composition of various Paleo diet interventions [33]. Kuipers proposesthe following macronutrients distribution range: 25–29% (8–35%) energy from protein,30–39% (20–72%) from fat, and 39–40% (19–48%) from carbohydrates. Cordain proposes,respectively, 19–35%, 28–58%, and 22–40% [34,35]. Authors of most Paleo interventionshave embraced the potential of the ad libitum Paleo diet. Some researchers have found thata Paleo diet intervention yielded an improvement in glucose tolerance that appeared to beindependent of energy intake and macronutrient distribution, prompting them to concludethat avoiding Western foods is more important than counting calories, fat, carbohydrate,or protein [28,36]. Currently, researchers evaluating the nutritional value of the Paleo dietclassify it as a low-carbohydrate diet. On average, the authors estimate the following ratioof macronutrients: 35% energy from fats, 35% from carbohydrates, and 30% from protein(although no specific amount is considered to be the goal) [18,37]. According to this well-known division, it seems that the Paleo diet has a moderate amount of carbohydrates [38].
Recently, the Paleolithic diet became popular due to its possible health benefits. There aremany scientific articles that evaluate the effect of the Paleo diet on health status—on diseasesconsidered civilization-related, such as ischemic heart disease [28], blood lipid disorder [39],overweight or obesity [37,40–49], diabetes [28,42–44,50–52], and metabolic syndrome [53], andeven on healthy, inactive adults [18,47,48,54–56]. Most, albeit not all, studies suggest that a PDhas positive effects on body composition [28,37,39–49,52–56], insulin sensitivity and/or fastingblood glucose [18,28,37,41,42,44,46,48,52,53], blood lipids [18,37,39,41,42,44,46–49,53–55], andblood pressure [18,41,42,44–47,49,53,56]. Coupling dietary interventions with physical activity,which includes aerobic and resistance exercise, has been shown to benefit healthy adults orpopulations with type 2 diabetes mellitus (T2DM) [42–44,50]. Most researchers mentionedabove used nutrition intervention ad libitum energy intake; there are only a few studies inwhich the authors have applied normoenergetic intake [18,52,53]. This resulted in, among otherthings, no reduction (or a non-significant effect), despite improvements in some metabolicindicators. That is why it is uncertain whether any of the positive health effects in these studiescould also be on account of the accompanying weight loss as opposed to the composition of thePaleolithic-type diet per se [53].
The results of many clinical trials show evidence that low-carbohydrate diets (LCDs)with a high protein and fat content or even a ketogenic diet (KD) promote weight loss andimprove the biomarkers of metabolic diseases, e.g., obese and type 2 diabetes [57]. The KDis successful for treating epilepsy in children [58,59]. On the other hand, in the long term,this diet may cause health problems. It increases the threat of kidney stones, blood lipidelevation, and bone fractures. As it is low in fiber, it also leads to constipation [60]. However,despite the positive effects of a low-carbohydrate/high-fat diet on body composition, no

Nutrients 2021, 13, 1019 3 of 56
improvement in athlete performance has been observed [61,62]. A small number of KD(high fat, adequate protein, low carbohydrates) studies showed a minimal negative effecton power sports performance [61,63]. It has been suggested that benefits may be greatest forendurance sports requiring prolonged submaximal effort, including running and cycling,and perhaps also for field sports [58,64–66].
Many prominent CrossFit athletes advocate adherence to the Paleo diet, which hascontributed to a recent boost in the popularity of the diet [55]. Only few studies haveexamined the effects of a PD with exercise on cardiorespiratory fitness in healthy orunhealthy adults [42–44,50,55]. To date, there is no scientific study on the effect of the Paleodiet on professional athletes. There are many studies determining the impact of a diet withvery low amounts of carbohydrates (e.g., KD) on athletic performance, while there areno research trials with the use of a medium/moderate carbohydrate diet carried out in agroup of athletes (which is now a very fashionable nutrition strategy willingly used byathletes). So far, no scientific studies have been carried out to check the use of the Paleodiet among athletes. It should be noted that the relatively small (but sufficient) amount ofcarbohydrates in the Paleo diet is increasingly used by athletes with the aim of using fatduring exercise and saving carbohydrate reserves. That is why we became interested inthis subject and decided to start research assessing the use of the Paleo diet under sportsconditions. There are many positive features of the Paleo diet for athletes, where there is anemphasis on (1) protein and branched-chain amino acids (BCAAs), (2) eating an abundanceof fruits and vegetables, (3) avoiding refined and processed carbohydrates to any highdegree, and (4) health benefits [67]. Taking into consideration the objections to athletes’ useof the Paleo diet, we decided to review the current work on the impact of the Paleo diet onhealth status and physical performance.
The aim of this meta-analysis was to assess the effect of the Paleolithic diet (andhealthy diets) on health status and physical capacity in professional athletes. The meta-analysis presents the results of the study overview regarding the impact of the Paleolithicdiet (PD) on selected health indicators (body composition, lipid profile, blood pressure,and carbohydrate metabolism) and physical performance in the short and long term ofnutritional intervention in healthy and unhealthy adults. The impact of the use of LCDs insports was also researched.
2. Materials and Methods2.1. Search Strategy
We searched EBSCO Discovery Service (http://web.b.ebscohost.com (accessed on20 January 2020) databases, including MEDLINE, Sport Discuss with Full Text, ScienceDirect, and Scopus, from inception to July 2019. All studies found in the search wereused. The research included randomized studies published in English; however, only21 studies met the eligibility criteria. We used the MeSH terms related to the diet: “Pale-olithic nutrition” OR “Paleolithic diet” OR “Paleolithic-type diet” OR “Paleo nutrition” OR“Paleo diet”.
2.2. Eligiblity Criteria
The retrieved studies were included in the review if they were an original articlewith a randomized control trial (RCT) design (parallel or crossover), irrespective of pub-lication status, they involved humans. They assessed the effect of the Paleolithic diet onselected health indicators (body composition, lipid profile, blood pressure, or carbohy-drate metabolism) and physical performance in adult athletes and in healthy (sedentary;physical inactive) or unhealthy adults, and their PD intervention consisted of lean meat,eggs, fish, seafood, nuts, fruits, and vegetables. Studies on diets containing dairy prod-ucts, cereals, legumes, and added sugar or salt were excluded. Energy intake was adlibitum or normoenergetic. They had to assess (1) body mass and body composition, i.e.,anthropometric parameters body mass (BM), body mass index (BMI), waist circumference(WC), and fat mass (FM) (kg and %); (2) lipid profile, i.e., total cholesterol (TC) (mg/dL),

Nutrients 2021, 13, 1019 4 of 56
triglycerides (TG) (mg/dL), high-density lipoprotein cholesterol (HDL-C) (mg/dL), andlow-density lipoprotein cholesterol (LDL-C) (mg/dL); (3) blood pressure (BP), i.e., systolicblood pressure (SBP) (mmHg), diastolic blood pressure (DBP) (mmHg), and heart rate (HR)(bpm); (4) carbohydrate metabolism, i.e., fasting plasma (fP) glucose (mmol/L), fP insulin(mmol/L), homeostasis model assessment of insulin resistance (HOMA-IR), and glycatedhemoglobin (HbA1c) (%); (5) physical performance: VO2max (mL/kg/min), VO2max(L/min), and maximum workload (W max).
Studies were excluded if they (1) were non-RCTs, uncontrolled trials, observationalstudies (e.g., ecologic studies, cohort studies, case–control studies, case reports, case series,editorials, commentaries, letters to the editor, or qualitative research), conference papers,or publications available only in abstract form (no possible contact with the authors),(2) reported duplicate data from other included studies, (3) were conducted among childrenor adolescents aged younger than 18 y, or (4) did not report the targeted outcomes.
2.3. Data Extraction
We evaluated each article independently in the three main stages of the extractionprocess (Figure 1). Two independent researchers summarized the data, which were checkedby two other authors. Firstly, article titles were screened, followed by abstracts and finallyfull texts for eligibility for inclusion in the systematic review and meta-analysis (first au-thor’s name, year of publication, study design, study period, participants’ characteristics(n, age, sex, and health status), components of the dietary patterns consumed in the inter-vention and control groups, and the mean changes with corresponding SDs of measuredoutcomes in the intervention and control arms). Secondly full-text articles were assessedfor eligibility. Disagreements were resolved by discussion between the investigators until aconsensus was reached. All investigators agreed on the final exclusion if the study soughtwas unavailable or was only published in abstract form (Table 1).
We excluded some studies, such as that of Popp et al. [68], as overall results werenot mentioned (only single results). Manousou et al.’s study [69] was also excluded as itreported the same values as that of Mellberg et al. [49]. The same characteristics of groupsand similar outcomes were also noted in studies by Otten et al. [42], Otten et al. [43], andStomby et al. [50]; thus, for all indicators reported in these studies, most outcomes from [43](BMI and FM were included) were excluded, and all outcomes from [50] were excluded.While the majority of the included studies were classified as being of good quality, somestudies had missing information or were not analyzed.

Nutrients 2021, 13, 1019 5 of 56Nutrients 2021, 13, 1019 5 of 59
Figure 1. The search, screening, and selection process for the studies that were included in the review and meta-analyses.
We excluded some studies, such as that of Popp et al. [68], as overall results were not mentioned (only single results). Manousou et al.’s study [69] was also excluded as it re-ported the same values as that of Mellberg et al. [49]. The same characteristics of groups and similar outcomes were also noted in studies by Otten et al. [42], Otten et al. [43], and Stomby et al. [50]; thus, for all indicators reported in these studies, most outcomes from [43] (BMI and FM were included) were excluded, and all outcomes from [50] were ex-cluded. While the majority of the included studies were classified as being of good quality, some studies had missing information or were not analyzed.
2.4. Statistical Analysis For conducting meta-analysis, we applied package “Metafor” in an R environment
(https://www.metafor-project.org/doku.php (accessed on 10 June 2020)). For all variables, we applied a random-effects model, because studies included in the meta-analysis were assumed to be a random selection from a larger population of studies, and the goal of
Figure 1. The search, screening, and selection process for the studies that were included in the reviewand meta-analyses.
2.4. Statistical Analysis
For conducting meta-analysis, we applied package “Metafor” in an R environment(https://www.metafor-project.org/doku.php (accessed on 10 June 2020)). For all variables,we applied a random-effects model, because studies included in the meta-analysis wereassumed to be a random selection from a larger population of studies, and the goal ofanalysis was to apply the results beyond the included studies. We assume the populationof studies is a hypothetical population of an essentially infinite set of studies comprisingall of the studies that have been conducted, that could have been conducted, or that maybe conducted in the future. The “PDs” data group contains all studies concerning thePaleo diet, i.e., PD vs. a control diet (CD), PD pre (pre-intervention effect) vs. PD post(post-intervention effect), and PD vs. PD with an exercise program (PD-EX), and theseare the results that we took into account when answering the question of whether thePaleo diet significantly influences the anthropometric or health indicators (because they arelinked by the greatest number of interventions). Those studies cover the broadest sample ofpossible studies. Studies named as “PD” included only papers on PD vs. CD. Those resultscould be directly compared with control diet results. Here, we could directly compareimpact of the Paleo diet with standard “healthy” diets. Furthermore, selected studies hadvarious characteristic in terms of length (short-term studies between 2 weeks and 6 monthsand long-term studies over 6 months), investigated group characteristics (in terms of age,sex, BMI level, health status, nutrition strategy, or combined physical activity), and detailed

Nutrients 2021, 13, 1019 6 of 56
characteristics of the Paleo diet (exact design, in particular in terms of calories). Finally, weassume that all studies share the same common effects. Thus, most criteria suggest that arand [70]. Weights used in the estimation are equal to wi = 1/(τ2 + vi), with τ2 replacedby its estimate (again, this is the standard “inverse-variance” method for random-effectsmodels). In the tables, we describe weighted average effects within group (control diet,Paleo diet, Paleo diet with exercise) with 95% confidence intervals, p-values of the effects,and the number of studies used for interference about the overall effect (Tables 2–10).Statistically significant results were defined as a p-value < 0.1. A detailed description canbe found below each table. Forest plot graphs were analyzed to examine the overall effectand publication bias. The mean effect described in the publication and its 95% confidencebands are presented. Finally, the results for indicators from fewer than five studies [70]should be interpreted very cautiously, especially because there is no common effect in thepopulation and studies cover a very similar sample and research period.
Due to the large number of analyses, in Appendix A, we present forest plots of theeffect of a PDs (both PD vs. CD and PD pre vs. post; PD vs. PD + EX), PD (PD vs. CDstudies) and CD on indicators of health status (Figures A1–A54). All results presented inthe forest plots are in the main text of this paper in tables and in the description of theresults. We did not present forest plots that included fewer than three studies (in all: PDs,PD, and CD).
3. Results3.1. Characteristics of Included Studies and Search Results
The characteristics of the study participants, research details, and evaluated outcomesare shown in Table 1. In total, 700 subjects were included in the meta-analysis. All studieswere conducted in adult populations. The average age of study participants ranged from30.0 ± 10.0 years [56] to 66.0 ± 6.0 years [51] in the Paleolithic diet group, and similarvalues were observed in the control group. Studies included women, men, or both. In a fewstudies, the information about the sex of study participants was not indicated [28,42,51].Four studies included subjects that had type 2 diabetes mellitus and or were obese [51,52],eleven studies included overweight or obese postmenopausal women [37,40–49], one studyincluded subject with hypercholesterolemia [39], one study recruited subjects with ischemicheart disease plus either glucose intolerance or type 2 diabetes [28], one study was con-ducted in subjects with at least two characteristics of the metabolic syndrome [53], and fourstudies recruited healthy but inactive adults [18,55,56,71]. We examined the significance ofthe change in PD and healthy diets (CDs) based on the Nordic Nutrition Recommenda-tion (NNR) [40,45,46,49], the Dutch Health Council [53], the Australian Guide to HealthyEating (AGHE) [54], the American Diabetes Association (ADA) [52], the American HeartAssociation (AHA) [39], the Mediterranean diet [28], a conventional low-fat diet (LFD) [41],and the so-called “diabetes diet” [51]. There were 14 studies including the analysis of PDvs. CD [28,39–54,56], 3 studies on PD pre vs. post [18,37,71], and 3 on PD vs. PD + EX(physical activity, i.e., combined aerobic and resistant training) [42,44,55]. Interventionsranged from 2 weeks to 24 months. Sixteen studies assessing the impact of the Paleo dieton body composition, i.e., “anthropometric parameters”—body mass (BM), body massindex (BMI), waist circumference (WC), and fat mass (FM) (kg and %), were analyzed. Thechanges in the lipid profile determined by total cholesterol (TC) (mg/dL), triglycerides(TG) (mg/dL), high-density lipoprotein cholesterol (HDL-C) (mg/dL), and low-densitylipoprotein cholesterol (LDL-C) (mg/dL) were analyzed based on the analysis of 14 studies.Analyzing the results of 12 studies, the influence of the Paleo diet on blood pressure,i.e., systolic blood pressure (SBP) (mmHg), diastolic blood pressure (DBP) (mmHg), andHR (bpm), were assessed. Twelve studies assessing the influence of PD on carbohydratemetabolism, i.e., fasting plasma (fP) glucose (mmol/L), fP insulin (mmol/L), homeostasismodel assessment of insulin resistance (HOMA-IR), and glycated hemoglobin (HbA1c)(%), were analyzed. Finally, physical performance, i.e., VO2max (mL/kg/min), VO2max(L/min), and maximum workload (W max), were assessed in three studies.

Nutrients 2021, 13, 1019 7 of 56
Table 1. Articles included in the meta-analyses according to the author, the year of publications, the type of study, the characteristics of the populations undergoing interventions, andevaluated outcomes.
Study and Year Type of Diets/Type of Study
Subjects(n)/Participants
Characteristic/Age/Duration of
Intervention (Time)
Effect on BodyComposition
Effect onLipid Profile
Effect onBlood Pressure
Effect onCarbohydrates
Metabolism
Effect on AthleticPerformance
Andersson et al. 2016[45]
PD vs. CD (NNR)ad libitum
RCT, parallel
[70] healthypostmenopausal
women with body massindex
(BMI) ≥ 27 kg/m2
(overweigh/obese)long-term (24 months)
Partially positive:Both diet groups
decreased their BM andBMI at 6 and 24 months
without significantdifferences between
groups.
No effect: No differencein cholesterol levels
over time or betweengroups.
Partially positive:BP was reduced at 6
months but returned tobaseline levels at
24 months.
No effect: Nodifferences were
observed over time orbetween groups
regarding fastingglucose, insulin
concentrations andHOMA-IR.
Not analyzed
Boers et al. 2014 [53]PD vs. CD (Dutch
Health Cuncil)isocaloric
[32] men (n = 9) andwomen (n = 25) with atleast two characteristics
of the metabolicsyndrome
PD: 52 ± 10.2CD: 55 ± 9
short-term (2 week)
Partially positive: Inboth groups, changewas observed in WC.
Positive: Lower TC andTG and a higher mean
HDL. The TC/HDL andTG/HDL ratios were
lower in the PDcompared to reference.
Positive: Lower SBP,DBP.
Positive:decreased fasting
plasma insulin andHOMA-IR.
Not analyzed
Blomquistet al. 2017 [47]
PD vs. CDad libitum
RCT, parallel
[69] postmenopausalwomen with over-
weightPD: 60 ± 5.6CD: 61 ± 7
short-term (6 months);long-term (24 months)
Partially positive:Android fat decreased
significantly more in thePD group during thefirst 6 months with
weight maintenance at24 months in both
groups.
Positive: HDL levelsincreased in both
groups between 6 and24 months, LDL and TG
levels decreasedsignificantly in the PDgroup after 24 months.
Partially positive:In both groups, blood
pressure decreased at 6months, and the effecton DBP remained after
24 months in the PDgroup.
Partially positive:HOMA-IR decreased
significantly in 6months for PD group,
rest of effect statisticallyinsignificant.
Not analyzed
Blomquist et al. 2018[48]
PD vs. CDad libitum
RCT, parallel
[58] postmenopausalwomen with
over-weight/healthyPD: 60 ± 5.5CD: 62 ± 5.7
short-term (6 months)
Positive: significantlylarger reductions in
body weight and SAGin PD compared to the
CD group.
Partially positive:TG decreased
significantly more in thePD group compared tothe CD group. TC levelsand LDL decreased inboth groups, withoutdifferences betweengroups. The levels of
HDL and FFA remainedstable in both groups.
Not analyzed
Positive:The PD led to improved
insulin sensitivity.The HOMA-IR index
decreased significantlyin the PD group,
without significantdifference between diet
groups.
Not analyzed

Nutrients 2021, 13, 1019 8 of 56
Table 1. Cont.
Study and Year Type of Diets/Type of Study
Subjects(n)/Participants
Characteristic/Age/Duration of
Intervention (Time)
Effect on BodyComposition
Effect onLipid Profile
Effect onBlood Pressure
Effect onCarbohydrates
Metabolism
Effect on AthleticPerformance
Boraxbekk et al. 2015[40]
PD vs. CD (NNR)ad libitum
RCT, parallel
[20] overweight orobese postmenopausal
womenPD = 61 ± 1.6
CD = 61.6 ± 1.7short-term (6 months)
Partially positive:PD and NNR improved
anthropometricmeasurements withoutsignificant differences
between groups.
Partially positive:Levels of FFA in plasma
decreased in bothgroups.
Not analyzedNo effects: no changes
in plasma glucose,insulin, or HOMA-IR.
Not analyzed
Fontes- Villalba et al.2016 [51]
PD vs. CD (diabetesdiet)
ad libitumRCT, crossover
[13] patients with type 2diabetes/
PD: 66 ± 6CD: 63 ± 6
short-term (12 weeks)
Positive:weight loss was
significantly greaterafter the PD than the
diabetes diet
Not analyzed Not analyzedNo effects: did not
change fasting levels ofinsulin.
Not analyzed
Frassetto et al. 2009 [18]
3 days, three ramp-updiets of increasing
potassium and fiber for7 days, then a PD for 10
days;isocaloric
RCT
[9] nonobese sedentaryhealthy
volunteers/healthypopulation in physical
activity38 ± 12
short-term (10 day)
No effects:Not changed
Positive: largesignificant reductions in
TC, LDL, and TG. Nosignificant changeoccurred in HDL.
Positive: significantreductions in BPassociated with
improved arterialdistensibility.
Positive: significantreduction in plasma
insulin vs. time AUCduring the OGTT.
Not analyzed
Genoni et al. 2016 [54]
PD vs. CD(AGHE)
ad libitumRCT, parallel
[39] healthy womenwith BMI 27 ± 4 kg/m2
47 ± 13short-term (4 weeks)
Positive:Significantly greater BMloss and WC occurred
in the PD.
Partially positive:In both dietary groups
experienced withingroup reductions to TCand LDL. No significant
differences in thesechanges between the
dietary groups.
No effect: No significantdifferences.
No effect: No significantdifferences between
dietary groups inbiomarkers of
metabolism (fastingglucose and insulin).
Not analyzed
Lindeberg et al. 2007[28]
PD vs. CD(Mediterranean)
ad libitumRCT, parallel
[29] ischaemic heartdisease plus either
glucose intolerance ortype 2 diabetes
PD: 65 ± 10CD: 57 ± 7
short-term (12 weeks)
Positive: weight lossand a decrease in WC. Not analyzed Not analyzed Positive: improving
glucose tolerance. Not analyzed

Nutrients 2021, 13, 1019 9 of 56
Table 1. Cont.
Study and Year Type of Diets/Type of Study
Subjects(n)/Participants
Characteristic/Age/Duration of
Intervention (Time)
Effect on BodyComposition
Effect onLipid Profile
Effect onBlood Pressure
Effect onCarbohydrates
Metabolism
Effect on AthleticPerformance
Masharani et al. 2015[52]
PD vs. CD (ADA)isocaloric
RCT, parallel
[24] type 2 diabetespatients
PD: 58 ± 8CD: 56 ± 13
short-term (2 weeks)
Partially positive:The average BM
changes were similar inboth groups without
caloric restriction.
Positive: The PD grouphad statistically
significant declines inTC, HDL, and LDL.
No effects:The mean BP did not
significantly change inany of the two groups.
Positive: PD group hadgreater benefits on
glucose control, withsignificant
improvement in insulinsensitivity.
Not analyzed
Mellberg et al. 2014 [49]PD vs. CD (NNR)
ad libitumRCT, parallel
[69], (after 6 m. 61, after2 y: 49) overweight
postmenopausalwomen
PD: 59.9 ± 5.5CD: 60.3 ± 5.9
short-term (6 months);long-term (24 months)
Partially positive:Both groups
significantly decreasedFM at 6 months and 24months, with a more
pronounced loss in thePD at 6 months but notat 24 months. WC andSAG also decreased inboth the groups, with a
more pronounceddecrease in the PD at 6
months.
Partially positive:TG levels decreased
significantly more at 6and 24 months in thePD than in the NNR.
LDL and TC decreasedat both 6 and 24 months,
HDL increased in 24months.
Positive: decreased inboth 6 and 24 mons:
DBP, SBP, HR.
No effect:No differences were
measured over time orbetween groups with
regard to fastingglucose and fasting
insulin concentrationsand tissue plasminogen
activator activity.
Not analyzed
Otten et. al. 2016 [41]
PD vs. CD(LFD)
ad libitumRCT
[41] healthy,overweight/obesepostmenopausal
womenPD: 61 ± 6CD: 66 ± 2
short-term (6 months);long-term (24 months)
Partially positive:Both diet groups
decreased their BM,BMI, WC, and FM. At 6months, the PD groupshowed a greater effect
than the LFD group.The LFD lost less LBMcompared with the PD.
At 24 months, therewere no significantdifferences in body
composition betweendiet groups except forthe better preservation
of LBM in the LFDgroup.
Partially positive:TGs, TC, and LDL
improved significantlymore in the PD group
during the first 6months of the study. At24 months, both study
groups showed animprovement of HDL.
Partially positive:SBP improved in both
study groups at 6months. DBP improvedonly in the PD group.
Partially positive:HOMA-IR improvedsignificantly after 6
months. Between 6 and24 months, hepaticinsulin sensitivity
deterioratedsignificantly in the PDgroup with a similar
trend in the LFD group.
Not analyzed

Nutrients 2021, 13, 1019 10 of 56
Table 1. Cont.
Study and Year Type of Diets/Type of Study
Subjects(n)/Participants
Characteristic/Age/Duration of
Intervention (Time)
Effect on BodyComposition
Effect onLipid Profile
Effect onBlood Pressure
Effect onCarbohydrates
Metabolism
Effect on AthleticPerformance
Österdahl et al. 2008[56]
PD vs. CD (normal diet)ad libitum
Short communication
[14] healthy volunteers30 ± 10
short-term (3 weeks)
Positive:Mean BM and WC
decreased.
No effects:Not changed
Partially positive:Decreased SBP
No effects:Not changed Not analyzed
Pastore et. al. 2015 [39]
PD vs. CD (AHA)ad libitum
4 months CD, followedby 4 months PD;
RCT
[20]hypercholesterolemic
patients53 ± 7
short-term (4 months)
Positive:PD induced a
significant BM loss,compared with AHA.
Positive:PD significantly
lowered mean TC, LDL,and TG and increased
HDL.
Not analyzed Not analyzed Not analyzed
Stomby et al. 2015 [46]PD vs. CD (NNR)
ad libitumRCT, parallel
[49] overweight andobese
postmenopausalwomen
short-term (6 months)long-term (24 months)
Partially positive:At 6 months, the PDgroup had a greater
reduction of BM, BMI,and FM. At 24 months,
there were nosignificant differences in
anthropometricmeasurements between
the groups.
Partially positive:TC decreased after 6
months but wasunaltered at 24 monthscompared with baseline.TGs and LDL decreased
throughout theintervention, whereas
HDL increased after 24months. There were no
group differences inblood lipids.
Partially positive:SBP and DBP decreased
at 6 months but hadincreased to baseline
levels after 24 months.There were no groupdifferences in blood
pressure.
Partially positive:Fasting serum insulin
and HOMA-IRdecreased at 6 monthsbut was unaltered after24 months. There wereno group differences,fasting serum insulin,
and HOMA-IR.
Not analyzed
Otten et al. 2017 [42]
PD vs. PD-EX(PD-EX:
a combination ofaerobic exercise and
resistance training in 1 hsessions three times
weekly)ad libitum
[29] individuals withtype 2 diabetes withBMI 25–40 kg/m2
short-term (12 weeks)
Positive: Both groupsshowed decreases in
BM, FM and WC,without differences
between interventiongroups. Male
participants decreasedtheir WC more in the
PD group compared tothe PD-EX. Males in thePD-EX group retainedmore LBM than males
in the PD group.
Partially positive:TG decreased in both
study groups, while theHDL and LDL levelsremained unchanged
throughout theintervention.
Positive:Blood pressure
decreased during thestudy in both
intervention groupswithout any group
difference.
Positive:Insulin sensitivity and
glycemic controlimproved in bothgroups, without a
difference betweengroups. The HOMA-IR
and revised QUICKIimproved in both
intervention groups,and the HbA1c
decreased during thestudy in both the PDgroup and the PD-EX
group.
Partially positiveThe VO2max and the
ergometer cyclingworkload increased
during the study in thePD-EX group, but not in
the PD group.Resting HR decreased
more in the PD-EXgroup than the PD
group.

Nutrients 2021, 13, 1019 11 of 56
Table 1. Cont.
Study and Year Type of Diets/Type of Study
Subjects(n)/Participants
Characteristic/Age/Duration of
Intervention (Time)
Effect on BodyComposition
Effect onLipid Profile
Effect onBlood Pressure
Effect onCarbohydrates
Metabolism
Effect on AthleticPerformance
Otten et al. 2018 [43]
PD vs. PD-EX(PD-EX: aerobic
exercise/resistancetraining in 1 h sessions
3 times weekly)ad libitum
RCT
[32] individuals withtype 2 diabetes withBMI 25–40 kg/m2
short-term (12 weeks)
Positive: Both studygroups showed a BM,
BMI, FM loss.
Positive:TG decreased in both
gropusNot analyzed
Positive: Both groupsimproved their
peripheral and adiposetissue insulin sensitivity,
but not their hepaticinsulin sensitivity.
Partially positive: TheVO2max increased inthe PD-EX group only.
Otten et al. 2019 [44]
PD vs. PD-EX(exercise training 3 h
per week)ad libitum
[22] overweight andobese subjects with type
2 diabetes mellitusPD: 59
PD-EX: 61short-term (12 weeks)
Positive:significant decreases inboth groups in terms of
BM, BMI, WC
Partially positive:The PD-EX groupshowed significant
decreases in myocardialTG levels.
These variables wereunchanged in the PD
group.There were significant
decreases in bothgroups in terms of
fasting triglycerides.
Positive:significant decreases inboth groups in terms of
SBP and DBP.
Positive: significantdecreases in both
groups in terms offasting glucose, HbA1c,
fasting insulin, andHOMA-IR.
Partially positiveThe VO2max increased
significantly in bothgroups, although theincrease in the PD-EX
group was morepronounced. Mean
resting HR decreasedand the W max.
increased significantlyin the PD-EX group,
while no changes wereseen for these measures
in the PD group.
Markofski et al. 2019[71]
PD pre vs. postad libitum
[7] overweight,physically inactive but
otherwise healthyadults
32.7 ± 4.9short-term (8 weeks)
Positive: time effect pre-to post-intervention for
BM and BMI.Not analyzed
No effect:SBP and DPB were
unchanged followingthe PD intervention.
Not described Not analyzed
Ryberg et al. 2013 [37]
PD pre vs. postad libitum
higher energy intakebefore intervention
[10] healthy,nonsmoking
postmenopausalwomen with
BMI > 27 kg/m2
short-term (5 weeks)
Positive:BMI, waist and hip
circumference,waist/hip ratio, andSAG also decreased
significantly.
Positive:TC, TG, HDL, LDL, and
LDL/HDL decreasedsignificantly.
Positive:DBP and resting HR
decreased significantly.
Partially positive:Fasting serum glucose
and HOMA indicesdecreased significantly.Insulin sensitivity did
not change.
Not analyzed

Nutrients 2021, 13, 1019 12 of 56
Table 1. Cont.
Study and Year Type of Diets/Type of Study
Subjects(n)/Participants
Characteristic/Age/Duration of
Intervention (Time)
Effect on BodyComposition
Effect onLipid Profile
Effect onBlood Pressure
Effect onCarbohydrates
Metabolism
Effect on AthleticPerformance
Smith et al. 2014 [55]
PD pre vs. postsubjects completed a
CrossFit-based exerciseprogram while adhering
to the Paleo diet.ad libitum
[44] healthy populationF: 31.2M: 33.5
short-term (10 weeks)
Positive: FM percentagedecreased significantly,
as did BM.
Partially positive: Asignificant increase in
non-HDL, LDL,TC/HDL, and TC in
healthy subjectsfollowing a PD.
Deleterious changeswere found in thosewith optimal HDL,
non-HDL, TC/HDL,and LDL whereas those
within sub-optimalstratifications showedno significant change.
Not analyzed Not analyzed
Positive:significantly increasingthe VO2max, a common
measure ofcardiorespiratory fitness
Android fat—fat accumulates around the central trunk region; ADA—American Diabetes Association; AGHE—Australian Guide to Healthy Eating; AHA—American Heart Association; AUC—area underthe curve; BM—body mass; BMI—body mass index; BP—blood pressure; CD—control diets; DBP—diastolic blood pressure; FFA—free fatty acid; FM—fat mass; fP—fasting plasma; HbA1c—glycatedhemoglobin; HDL—high-density lipoprotein cholesterol; HOMA-IR—homeostasis model assessment of insulin resistance; HR—heart rate; LBM—lean body mass; LDL—low-density lipoprotein cholesterol;LFD—low-fat diet; NNR—Nordic Nutrition Recommendation; OGTT—oral glucose tolerance test; PD—Paleo diet; PD-EX—Paleo diet with exercise training; QUICKI—quantitative insulin sensitivity checkindex; RCT—randomized control trial; SAG—sagittal abdominal diameter; SBP—systolic blood pressure; TC—total cholesterol; TG—triglycerides; VO2max—maximum oxygen uptake; W max—maximumworkload; WC—waist circumference.

Nutrients 2021, 13, 1019 13 of 56
3.2. Effect of the Paleolithic Diet on Body Composition—Anthropometric Parameters (Body Mass,Body Mass Index, Waist Circumference, Fat Mass, and Fat Free Mass) in the Short (up to6 Months) and Long (over 6 Months) Term
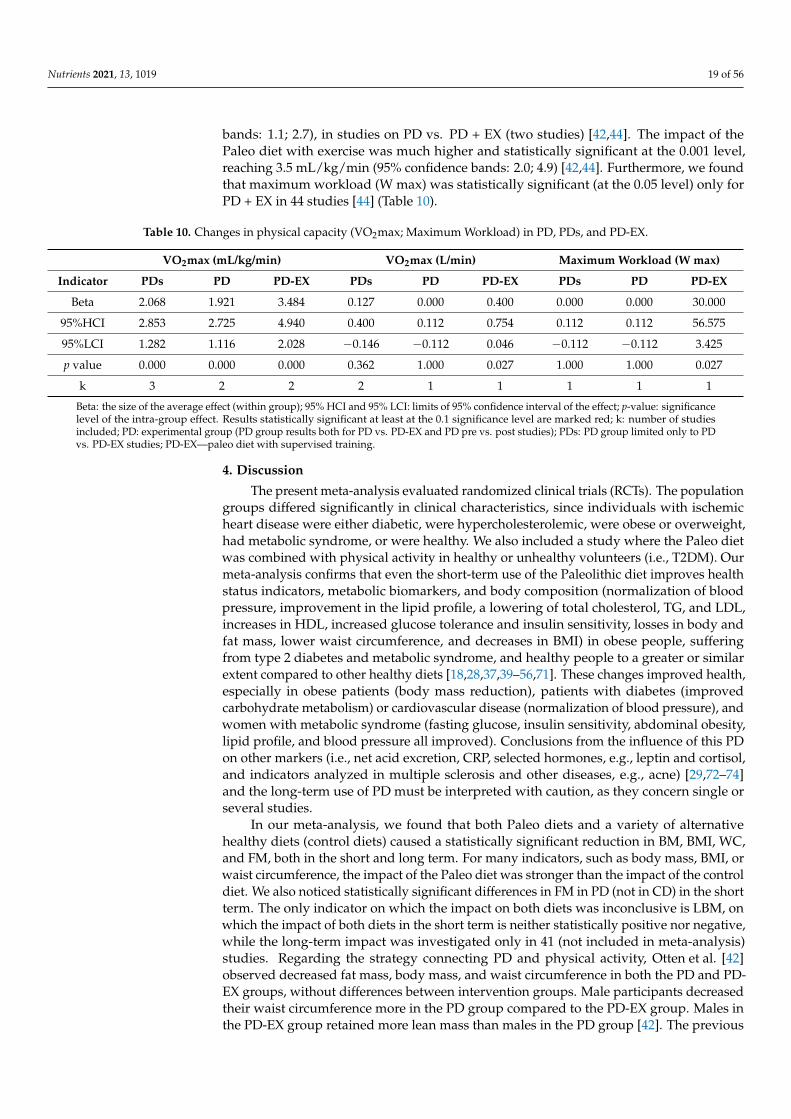
The impact of the Paleo diet on body mass in all independently investigated studies(16) [18,28,37,39,40,42,44,47–49,51,52,54–56] (Figure A1) with this indicator was on average −5.8kg (95% confidence bands: −4.3; −7.3) and was statistically significant at the 0.001 confidencelevel. We observed similar results, with a slightly lower effect (−5.3 kg, 95% confidence bands:−3.2; −7.5) in studies on PD vs. CD (eight studies) [28,40,47–49,51,52,54] (Figure A2). Simulta-neously, CDs in these studies (eight) also significantly reduced the weight of the participants,albeit the average effect was substantially smaller (−3.9 kg with 95% confidence bands: −2.6;−5.3) [28,40,47–49,51,52,54] (Figure A3). The impact of PD on BMI in all independently in-vestigated studies (eight) with this indicator was on average −2.1 (95% confidence bands:−1.4; −2.8) and was statistically significant at the 0.001 confidence level [18,37,40,43,44,47,49,56](Figure A4). We observed similar results, with a higher effect (−3.1; 95% confidence bands:−2.6; −3.6), in studies on PD vs. CD (three studies) [40,47,49] (Figure A5). Simultaneously, theCDs in these studies (three) also significantly reduced the BMI of the participants, albeit theaverage effect was substantially smaller (−1.7 with 95% confidence bands: −1.0; −2.4) [40,47,49](Figure A6). The impact of PD on waist circumference in all independently investigated studies(nine) with this indicator was on average −5.0 cm (95% confidence bands: −3.1; −6.9) andwas statistically significant at the 0.001 confidence level [28,37,40,42,44,49,53,54,56] (Figure A7).We observed similar results, with a slightly lower effect (−4.2cm, 95% confidence bands: −3.0;−5.6), in studies on PD vs. CD (five studies) [28,40,49,53,54] (Figure A8). Simultaneously, theCDs in these studies (five) also significantly reduced the waist circumference of the participants,albeit the average effect was substantially smaller (−3.1 cm with 95% confidence bands: −2.4;−3.8) [28,40,49,53,54] (Figure A9). The impact of the Paleo diet on fat mass (kg) in all indepen-dently investigated studies (three) with this indicator was on average −4.5 kg (95% confidencebands: −1.6; −7.5) and was statistically significant at the 0.003 confidence level [43,49,54]. Weobserved a very similar effect (−4.1 kg, 95% confidence bands: 0.4; −8.6) in studies on PD vs.CD (two studies), though it was statistically significant only at the 0.1 significance level [49,54].While the CDs in these studies (two) also substantially reduced fat mass (−2.1 kg), this effectwas not statistically significant [49,54]. The impact of the Paleo diet on fat mass as a % of totalmass in all independently investigated studies (four) with this indicator was on average −2.4%(95% confidence bands: −1.2; −3.6) and was statistically significant at the 0.001 confidencelevel [42,46,54,55]. We observed a slightly higher impact of the Paleo diet on FM as a % of totalmass, which was statistically significant at the 0.1 confidence level (−2.6%, 95% confidencebands: 0.1; −5.2), in studies on PD vs. CD (two studies) [46,54]. While participants of thosestudies who used CDs also reduced their fat in terms of a % of total mass (on average by 0.3%),this decline was not statistically significant (95% confidence bands: 1.3; −1,9) [46,54] (Table 2).
Table 2. Changes in body composition (body mass, body mass index, waist circumference, and fat mass in kg and %) inshort-term PDs, PD, and CD studies (up to 6 months).
BM (kg) BMI (kg/m2) WC (cm) FM (kg) FM (%)
Indicator PDs PD CD PDs PD CD PDs PD CD PDs PD CD PDs PD CD
beta −5.798 −5.321 −3.916 −2.084 −3.076 −1.697 −5.007 −4.271 −3.114 −4.510 −4.125 −2.136 −2.391 −2.557 −0.281
95%HCI −4.269 −3.163 −2.579 −1.361 −2.560 −0.989 −3.132 −2.977 −2.429 −1.572 0.391 1.234 −1.158 0.128 1.292
95%LCI −7.328 −7.478 −5.254 −2.807 −3.592 −2.406 −6.882 −5.564 −3.798 −7.448 −8.642 −5.506 −3.625 −5.242 −1.866
p value 0.000 0.000 0.000 0.000 0.000 0.000 0.000 0.000 0.000 0.003 0.073 0.214 0.000 0.062 0.722
K 16 8 8 8 3 3 9 5 5 3 2 2 4 2 2
Beta: the size of the average effect (within group); 95% HCI and 95% LCI: limits of 95% confidence interval of the effect; p-value: significancelevel of the intra-group effect. Results statistically significant at least at the 0.1 significance level are marked red; k: number of studiesincluded; PDs: experimental group (both PD vs. CD and PD pre vs. post; PD vs. PD + EX); PD: experimental group limited only to PD vs.CD studies; CD: control group.

Nutrients 2021, 13, 1019 14 of 56
All studies where the long-term impact of the Paleo diet on body composition indica-tors was investigated are PD vs. CD studies. Thus, in what follows, we describe only theimpact of PD and CD, without differentiating the type of study. The long-term impact ofthe Paleo diet on weight was on average −8.7 kg (95% confidence bands: −6.1; −11.3) andwas statistically significant at the 0.001 confidence level [41,47,49] (Figure A10). Simultane-ously, the CDs also significantly reduced the weight of the participants in the long term,albeit the average effect was substantially smaller (−5.8 kg with 95% confidence bands:−4.3; −7.2) [41,47,49] (Figure A11). The long-term impact of the Paleo diet (three studies)on BMI was on average −2.8 (95% confidence bands: −1.9; −3.6) and was statisticallysignificant at the 0.001 confidence level [41,47,49] (Figure A12). Simultaneously, the controldiets (three studies) also significantly reduced the weight of the participants in the longterm, albeit the average effect was substantially smaller (-1.8 with 95% confidence bands:−1.4; −2.2) [41,47,49] (Figure A13). The long-term impact of the Paleo diet (two) on waistcircumference was on average −12.1 cm (95% confidence bands: −7.6; −16.6) and wasstatistically significant at the 0.001 confidence level [41,49]. Simultaneously, the controldiets (two) also significantly reduced the waist of the participants in the long term, albeitthe average effect was substantially smaller (−10.9 cm with 95% confidence bands: −7.6;−14.1) [41,49]. The long-term impact of PD (two) on fat mass was on average −5.5 kg(95% confidence bands: −3.4; −7.5) and was statistically significant at the 0.001 confidencelevel [41,49]. Simultaneously, the CDs (two) also significantly reduced the fat mass of theparticipants in the long term, albeit the average effect was substantially smaller (−4.5 kgwith 95% confidence bands: −2.9; −6.0) [41,49]. The long-term impact of the Paleo diet(two) on fat (as a % of total mass) was on average −2.7% (95% confidence bands: −1.3;−4.1) and was statistically significant at the 0.001 confidence level [41,46]. Simultaneously,the control diets (two) also significantly reduced the fat mass of the participants, with asimilar average effect (−2.6 with 95% confidence bands: −0.8; −4.5) [41,46] (Table 3).
Table 3. Changes in body composition (body mass, body mass index, waist circumference, and fat mass in kg and %) inlong-term PDs, PD, and CD studies (over 6 months).
BM (kg) BMI (kg/m2) WC (cm) FM (kg) FM (%)
Indicator PDs PD CD PDs PD CD PDs PD CD PDs PD CD PDs PD CD
Beta −8.690 −8.690 −5.760 −2.765 −2.765 −1.815 −12.097 −12.097 −10.874 −5.464 −5.464 −4.451 −2.722 −2.722 −2.607
95%HCI −6.070 −6.070 −4.283 −1.937 −1.937 −1.435 −7.624 −7.624 −7.640 −3.441 −3.441 −2.889 −1.323 −1.323 −0.762
95%LCI −11.310 −11.310 −7.236 −3.594 −3.594 −2.196 −16.570 −16.570 −14.108 −7.488 −7.488 −6.013 −4.120 −4.120 −4.452
p value 0.000 0.000 0.000 0.000 0.000 0.000 0.000 0.000 0.000 0.000 0.000 0.000 0.000 0.000 0.006
k 3 3 3 3 3 3 2 2 2 2 2 2 2 2 2
Beta: the size of the average effect (within group); 95% HCI and 95% LCI: limits of 95% confidence interval of the effect; p-value: significancelevel of the intra-group effect. Results statistically significant at least at the 0.1 significance level are marked red; k: number of studiesincluded; PDs: experimental group (both PD vs. CD and PD pre vs. post; PD vs. PD + EX); PD: experimental group limited only to PD vs.CD studies; CD: control group.
3.3. Effect of the Paleolithic Diet on Lipid Profile (Total Cholesterol, Triglycerydes, HDL-C, andLDL-C in the Short (up to 6 Months) and Long (over 6 Months) Term
The impact of the Paleo diet on TC in all independently investigated studies (14) withthis indicator was on average −0.6 mg/dL (95% confidence bands: −0.4; −0.8) and wasstatistically significant at the 0.001 level [18,37,39,41,42,44,45,47–49,52–56] (Figure A14). Weobserved a similar effect, which was statistically significant also at the 0.001 significancelevel (on average −0.7 mg/dL, 95% confidence bands: −0.5; −0.8), in studies Paleo diet vs.control diet (eight studies) [41,45,47–49,52–54] (Figure A15). However, the control diets inthese studies (eight) also had a statistically significant impact on TC [41,45,47–49,52–54](Figure A16). The impact of the Paleo diet on TG in all independently investigated stud-ies (14) with this indicator was on average −0.35 mg/dL (95% confidence bands: −0.2;−0.5) and was statistically significant at the 0.001 level [18,37,39,41,42,44,45,47–49,52–54,56]
Nutrients 2021, 13, 1019 15 of 56
(Figure A17). We observed a similar effect, which was statistically significant at the 0.001level (on average −0.30 mg/dL, 95% confidence bands: 0.2; −0.4), in studies on PD vs.CD (eight studies) [41,45,47–49,52–54] (Figure A18). However, the control diets in thesestudies (eight) had a statistically significant impact on TG as well [41,45,47–49,52–54](Figure A19). The impact of the Paleo diet on HDL-C in all independently investigatedstudies (13) with this indicator was on average near zero and not statistically signifi-cant [18,37,39,41,42,44,45,47–49,52–54,56] (Figure A20). However, the impact of the Pa-leo diet on HDL-C in studies on PD vs. CD (seven studies) was statistically significantat the 0.05 level (−0.08 mg/dL, 95% confidence bands: −0.02; −0.14) [41,47–49,52–54](Figure A21). Similarly, the control diets in these studies (seven) also had a statisticallysignificant impact on HDL-C at the 0.05 significance level (−0.07 mg/dL, 95% confidencebands: 0; −0.14) [41,45,47–49,52–54] (Figure A22). The impact of the Paleo diet on LDL-Cin all independently investigated studies (13) with this indicator was on average −0.37mg/dL. (95% confidence bands: −0.19; −0.56) and was statistically significant at the 0.001level [18,37,39–54,56] (Figure A23). We observed a slightly higher effect, which was sta-tistically significant also at the 0.001 significance level (on average −0.41 mg/dL, 95%confidence bands: −0.32; −0.50), in studies on PD vs. CD (seven studies) [41,47–49,52–54](Figure A24). The CDs in these studies (seven) also had a statistically significant impacton LDL-C (on average −0.23 mg/dL, 95% confidence bands: 0.15; −0.31) [41,47–49,52–54](Figure A25) (Table 4).
Table 4. Changes in lipid profile (total cholesterol, triglycerides, HDL-C, and LDL-C) in short-term PDs, PD, and CD studies(up to 6 months).
TC (mg/dL) TG (mg/dL) HDL-C (mg/dL) LDL-C (mg/dL)
Indicator PDs PD CD PDs PD CD PDs PD CD PDs PDs CD
Beta −0.576 −0.657 −0.336 −0.341 −0.302 −0.089 −0.002 −0.078 −0.072 −0.373 −0.408 −0.227
95%HCI −0.387 −0.544 −0.246 −0.222 −0.156 −0.044 0.104 −0.017 −0.003 −0.189 −0.318 −0.147
95%LCI −0.766 −0.770 −0.427 −0.460 −0.448 −0.134 −0.108 −0.139 −0.142 −0.557 −0.498 −0.308
p value 0.000 0.000 0.000 0.000 0.000 0.000 0.971 0.012 0.042 0.000 0.000 0.000
k 14 8 8 14 8 8 13 7 7 13 7 7
Beta: the size of the average effect (within group); 95% HCI and 95% LCI: limits of 95% confidence interval of the effect; p-value: significancelevel of the intra-group effect. Results statistically significant at least at the 0.1 significance level are marked red; k: number of studiesincluded; PDs: experimental group (both PD vs. CD and PD pre vs. post; PD vs. PD + EX); PD: experimental group limited only to PD vs.CD studies; CD: control group.
All studies where the long-term impact of the Paleo diet on lipid profile metabolismindicators was investigated are PD vs. CD studies. Thus, in what follows, we describeonly the impact of the PD and CD, without differentiating the type of study. The long-termimpact of the Paleo diet on TC within the investigated studies (four) was statisticallysignificant at the 0.05 level, being on average −0.23 mg/dL (95% confidence bands: −0.08;−0.38) [41,45,47,49] (Figure A26). However, the impact of the control diets in these studieswas not statistically significant, with a reverse sign, being on average 0.01 mg/dL (95%confidence bands: 0.05; −0.03) [41,45,47,49] (Figure A27). The long-term impact of the Paleodiet on TG within the investigated studies (four) was statistically significant at the 0.001level, being on average −0.23 mg/dL (95% confidence bands: −0.14; −0.30) [41,45,47,49](Figure A28). The impact of the control diets in these studies (four) was statisticallysignificant at the 0.05 significance level, being on average −0.08 mg/dL (95% confidencebands: −0.00; −0.15) [41,45,47,49] (Figure A29). The long-term impact of the Paleo diet onHDL-C within the investigated studies (three) was statistically significant at the 0.001 level,being on average 0.18 mg/dL (95% confidence bands: 0.13; 0.24) [41,47,49] (Figure A30).Simultaneously, the impact of the control diets in these studies (three) was also statisticallysignificant at the 0.001 level, being on average 0.21 mg/dL (95% confidence bands: 0.15;0.26) [41,47,49] (Figure A31). The long-term impact of the Paleo diet on LDL-C within the

Nutrients 2021, 13, 1019 16 of 56
investigated studies (three) was statistically significant at the 0.001 level, being on average−0.31 mg/dL (95% confidence bands: −0.20; −0.41) [41,47,49] (Figure A32). However,the long-term impact of the control diets in these studies (three) was not statisticallysignificant [41,47,49] (Figure A33) (Table 5).
Table 5. Changes in lipid profile (total cholesterol, triglycerides, HDL-C, and LDL-C in long-term PDs, PD, and CD studies(over 6 months).
TC (mg/dL) TG (mg/dL) HDL-C (mg/dL) LDL-C (mg/dL)
Indicator PDs PD CD PDs PD CD PDs PD CD PDs PD CD
Beta −0.228 −0.228 0.010 −0.225 −0.225 −0.077 0.181 0.181 0.205 −0.307 −0.307 −0.085
95%HCI −0.076 −0.076 0.051 −0.148 −0.148 −0.004 0.235 0.235 0.263 −0.203 −0.203 0.037
95%LCI −0.381 −0.381 −0.031 −0.302 −0.302 −0.151 0.128 0.128 0.147 −0.412 −0.412 −0.208
p value 0.003 0.003 0.639 0.000 0.000 0.040 0.000 0.000 0.000 0.000 0.000 0.172
k 4 4 4 4 4 4 3 3 3 3 3 3
Beta: the size of the average effect (within group); 95% HCI and 95% LCI−limits of 95% confidence interval of the effect; p-value: significancelevel of the intra-group effect. Results statistically significant at least at the 0.1 significance level are marked red; k: number of studiesincluded; PDs: experimental group (both PD vs. CD and PD pre vs. post; PD vs. PD + EX); PD: experimental group limited only to PD vs.CD studies; CD: control group.
3.4. Effect of the Paleolithic Diet on Blood Pressure (Systolic Blood Pressure, Diastolic BloodPressure, and Heart Rate) in the Short (up to 6 Months) and Long (over 6 Months) Term
The impact of the Paleo diet on SBP in all independently investigated studies (12) with thisindicator was on average −6.9 mmHg (95% confidence bands: −4.5; −9.4) and was statisticallysignificant at the 0.001 confidence level [18,37,41,42,44,47,49,52–54,56,71] (Figure A34). Weobserved a visibly higher effect (−8.5 mmHg, 95% confidence bands: −5.5; −11.5) in studies onPD vs. CD (six studies) [41,47,49,52–54] (Figure A35). Simultaneously, the control diets in thesestudies (six) also significantly reduced the SBP of the participants, albeit the average effect wassubstantially smaller (−5.6 mmHg with 95% confidence bands: −2.7; −8.5) [41,47,49,52–54](Figure A36). The impact of the Paleo diet on DBP in all independently investigated studies(12) with this indicator was on average −4.9 mmHg (95% confidence bands: −3.2; −6.6)and was statistically significant at the 0.001 confidence level [18,37,41,42,44,47,49,52–54,56,71](Figure A37). We observed a slightly higher effect (−5.3 mmHg, 95% confidence bands: −3.0;−7.6) in studies on PD vs. CD (six studies) [41,47,49,52–54] (Figure A38). However, the controldiets in these studies (six) on average reduced the DBP of the participants only by 0.8 mmHg,which is not statistically significant [41,47,49,52–54] (Figure A39). The impact of the Paleo dieton HR in all independently investigated studies (four) with this indicator was on average −3bpm and was not statistically significant [37,42,44,49]. Only in one study was the impact ofPD vs. CD on heart rate investigated [49]. The impacts of the PD and CD was statisticallysignificant at the 0.001 level, and that of the CD was greater (3.2 bpm vs. 2.2 bpm) [49] (Table 6).
Table 6. Changes in blood pressure (systolic blood pressure, diastolic blood pressure, and heart rate) in short-term PDs, PD,and CD studies (up to 6 months).
SBP (mmHg) DBP (mmHg) HR (bpm)
Indicator PDs PD CD PDs PD CD PDs PD CD
Beta −6.926 −8.493 −5.579 −4.922 −5.345 −0.848 −3.021 −2.200 −3.200
95%HCI −4.484 −5.467 −2.654 −3.247 −3.047 2.513 0.906 −1.729 −2.785
95%LCI −9.367 −11.519 −8.504 −6.597 −7.643 −4.210 −6.948 −2.671 −3.615
p value 0.000 0.000 0.000 0.000 0.000 0.621 0.132 0.000 0.000
k 12 6 6 12 6 6 4 1 1
Beta: the size of the average effect (within group); 95% HCI and 95% LCI−limits of 95% confidence interval of the effect; p-value: significancelevel of the intra-group effect. Results statistically significant at least at the 0.1 significance level are marked red; k: number of studiesincluded; PDs: experimental group (both PD vs. CD and PD pre vs. post; PD vs. PD + EX); PD: experimental group limited only to PD vs.CD studies; CD: control group.

Nutrients 2021, 13, 1019 17 of 56
All studies where the long-term impact of the Paleo diet on blood pressure indicators wasinvestigated are PD vs. CD studies. Thus, in what follows, we describe only the impact of thePD and CD, without differentiating the type of study. The long-term impact of the Paleo diet(three studies) on SBP was not statistically significant, being on average −1 mmHg [41,47,49](Figure A40). Similarly, the long-term impact of the CDs in these studies (three) was statisticallynot significant but was on average positive (0.8 mmHg) [41,47,49] (Figure A41). The long-termimpact of PD (three) on DBP was on average −4.6 mmHg. (95% confidence bands: −3.8; −5.4)and was statistically significant at the 0.001 confidence level [41,47,49] (Figure A42). However,the long-term impact of the CDs in these studies (three) was statistically not significant, beingon average nearly 0 [41,47,49] (Figure A43) (Table 7).
Table 7. Changes in blood pressure (systolic blood pressure and diastolic blood pressure) in long-term PDs, PD, and CDstudies (over 6 months).
SBP (mmHg) DBP (mmHg)
Indicator PDs PD CD PDs PD CD
Beta −1.021 −1.021 0.828 −4.613 −4.613 0.040
95%HCI 1.785 1.785 2.479 −3.837 −3.837 4.315
95%LCI −3.827 −3.827 −0.822 −5.389 −5.389 −4.234
p value 0.476 0.476 0.325 0.000 0.000 0.985
k 3 3 3 3 3 3
Beta: the size of the average effect (within group); 95% HCI and 95% LCI: limits of 95% confidence interval of the effect; p-value: significancelevel of the intra-group effect. Results statistically significant at least at the 0.1 significance level are marked red; k: number of studiesincluded; PDs: experimental group (both PD vs. CD and PD pre vs. post; PD vs. PD + EX); PD: experimental group limited only to PD vs.CD studies; CD: control group.
3.5. Effect of the Paleolithic Diet on Carbohydrates Metabolism (Fasting Plasma Glucose, FastingPlasma Insulin, HOMA-IR, and HbA1c) in the Short (up to 6 Months) and Long(over 6 Months) Term
The impact of the Paleo diet on fP glucose in all independently investigated studies(12) with this indicator was on average −0.51 mmol/L. (95% confidence bands: −0.2; −0.8)and was statistically significant at the 0.01 level [18,37,41,42,44,47,49,52–54,56,71] (Figure A44).We observed a slightly lower effect, which was statistically significant at the 0.05 level (onaverage −0.45 mmol/L, 95% confidence bands: −0.0; −0.9), in studies on PD vs. CD(eight studies) [28,40,41,46,48,52–54] (Figure A45). The CDs in these studies (seven) hadno statistically significant impact on fP glucose (mmol/L), with an average lower impact(0.17 mmol/L) [28,40,41,46,48,52–54] (Figure A46). The impact of the Paleo diet on fP insulin inall independently investigated studies (11) with this indicator was on average −1.9 mmol/L.(95% confidence bands: −0.9; −2.9) and was statistically significant at the 0.001 level [18,28,37,41,42,44,46,53,54,56,71] (Figure A47). We observed a slightly lower effect, which was alsostatistically significant at the 0.01 level (on average −1.6 mmol/L, 95% confidence bands: −0.3;−2.9), in studies on PD vs. CD (five studies) [28,41,46,53,54] (Figure A48). However, the controldiets in these studies (five) had no statistically significant impact on fP insulin [28,41,46,53,54](Figure A49). The impact of the Paleo diet on HOMA-IR in all independently investigatedstudies (nine) with this indicator was on average −0.4. (95% confidence bands: −0.2; −0.7)and was statistically significant at the 0.001 level [18,28,37,41,44,45,47,53,56] (Figure A50). Weobserved a slightly lower effect, which was also statistically significant at the 0.001 level (onaverage −0.4 mmol/L, 95% confidence bands: −0.2; −0.7), in studies on PD vs. CD (fivestudies) [28,41,45,47,53] (Figure A51). However, the CDs in these studies (five) had no sta-tistically significant impact on HOMA-IR [28,41,45,47,53] (Figure A52). The impact of thePaleo diet on HbA1c in all independently investigated studies (three) with this indicator wason average −0.4% (95% confidence bands: 0.0; −0.8) and was statistically significant at the0.1 level [28,42,52]. We observed a visibly lower effect, which was statistically significant at the0.05 level (on average −0.2%, 95% confidence bands: −0.0; −0.3), in studies on PD vs. CD (two

Nutrients 2021, 13, 1019 18 of 56
studies) [28,52]. The CDs in these studies (two) also had a statistically significant impact onHbA1c at the 0.1 significance level but was visibly lower (on average −0.1%, 95% confidencebands: 0; −0.3) [28,52] (Table 8).
Table 8. Changes in carbohydrate metabolism (fP glucose, fP insulin, HOMA-IR, and HbA1c) in short-term PDs, PD, andCD studies (up to 6 months).
fP Glucose (mmol/L) fP Insulin (mmol/L) HOMA-IR HbA1c (%)
Indicator PDs PD CD PDs PD CD PDs PD CD PDs PD CD
beta −0.511 −0.450 −0.167 −1.922 −1.600 −0.230 −0.442 −0.408 −0.074 −0.404 −0.178 −0.122
95%HCI −0.176 −0.025 0.068 −0.916 −0.323 0.224 −0.196 −0.185 0.037 −0.019 −0.028 0.021
95%LCI −0.847 −0.876 −0.40 −2.928 −2.878 −0.684 −0.687 −0.631 −0.185 −0.831 −0.328 −0.265
p value 0.003 0.050 0.165 0.000 0.011 0.267 0.000 0.000 0.157 0.063 0.020 0.095
k 12 8 7 11 5 5 9 5 5 3 2 2
Beta: the size of the average effect (within group); 95% HCI and 95% LCI: limits of 95% confidence interval of the effect; p-value: significancelevel of the intra-group effect. Results statistically significant at least at the 0.1 significance level are marked red; k: number of studiesincluded; PDs: experimental group (both PD vs. CD and PD pre vs. post; PD vs. PD + EX); PD: experimental group limited only to PD vs.CD studies; CD: control group.
All studies where the long-term impact of PD on carbohydrate metabolism indicatorswas investigated are PD vs. CD studies. Thus, in what follows, we describe only theimpact of the PD and CD, without differentiating the type of study. The long-term impactof the Paleo diet on fP glucose within the investigated studies (two) was not statisticallysignificant [41,46]. Similarly, the impact of the control diets in these studies (two) wasstatistically not significant, being near 0 on average [41,46]. The long-term impact of thePaleo diet (two studies) on fP insulin was not statistically significant [41,46]. The long-termimpact of the control diets in these studies (two) was similar [41,46]. The long-term impactof the Paleo diet on HOMA-IR within the investigated studies (three) was not statisticallysignificant [41,45,47] (Figure A53). However, the impact of control diets in these studies(three) was statistically significant at the 0.01 level, being on average 0.3 (95% confidencebands: 0.09; 0.5) [41,45,47] (Figure A54) (Table 9).
Table 9. Changes in carbohydrate metabolism (fP glucose, fP insulin, and HOMA-IR) in long-term PDs, PD, and CD studies(over 6 months).
fP Glucose (mmol/L) fP Insulin (mmol/L) HOMA-IR
Indicator PDs PD CD PDs PD CD PDs PD CD
beta −0.113 −0.113 0.002 −0.240 −0.240 0.351 −0.022 −0.022 0.304
95%HCI 0.169 0.169 0.115 0.304 0.304 1.186 0.109 0.109 0.523
95%LCI −0.396 −0.396 −0.111 −0.784 −0.784 −0.484 −0.153 −0.153 0.085
p value 0.431 0.431 0.973 0.387 0.387 0.410 0.741 0.741 0.007
k 2 2 2 2 2 2 3 3 3
Beta: the size of the average effect (within group); 95% HCI and 95% LCI: limits of 95% confidence interval of the effect; p-value: significancelevel of the intra-group effect Results statistically significant at least at the 0.1 significance level are marked red; k: number of studiesincluded; PDs: experimental group (both PD vs. CD and PD pre vs. post; PD vs. PD + EX); PD: experimental group limited only to PD vs.CD studies; CD: control group.
3.6. Effect of the Paleolithic Diet on Physical Capacity (Maximum Oxygen Uptake andMaximum Workload)
The impact of PD on VO2max (mL/kg/min) in all independently investigated studies(three) with this indicator without exercise increased on average 2.1 mL/kg/min (95%confidence bands: 1.3; 2.8) and was statistically significant at the 0.001 level [42,44,55].We observed a slightly lower effect of the Paleo diet without exercise, which was alsostatistically significant at the 0.001 level (on average 1.9 mL/kg/min, 95% confidence
Nutrients 2021, 13, 1019 19 of 56
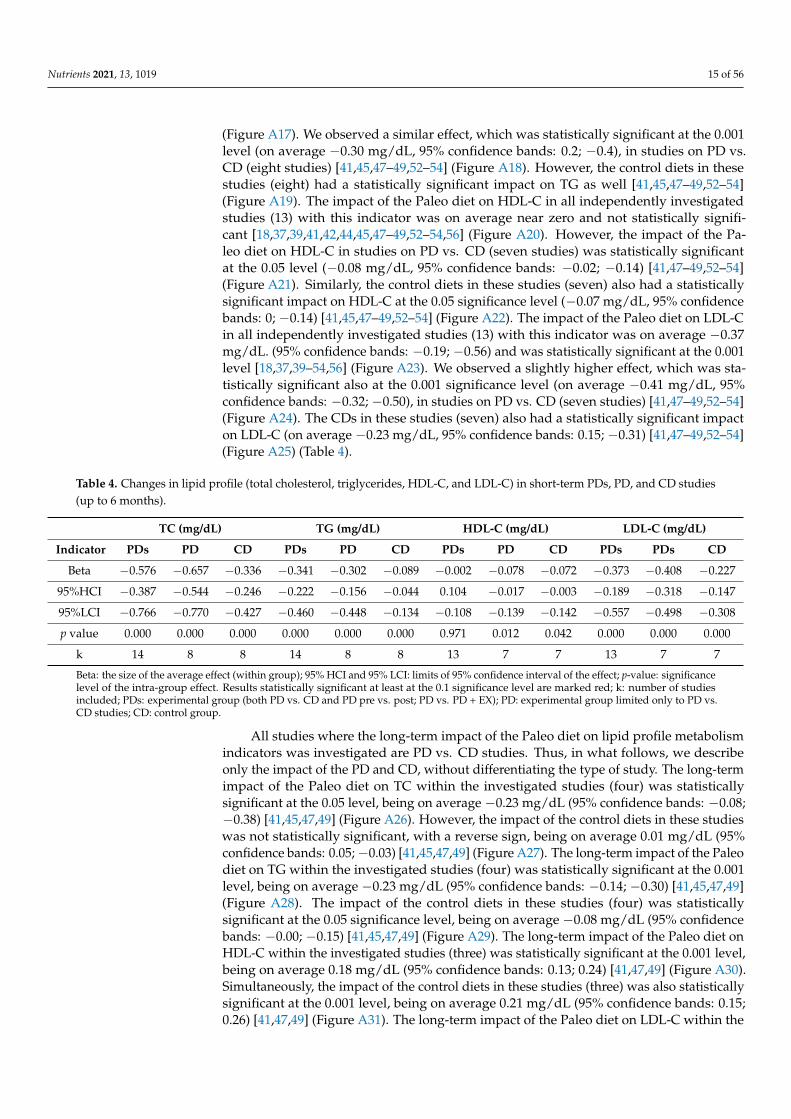
bands: 1.1; 2.7), in studies on PD vs. PD + EX (two studies) [42,44]. The impact of thePaleo diet with exercise was much higher and statistically significant at the 0.001 level,reaching 3.5 mL/kg/min (95% confidence bands: 2.0; 4.9) [42,44]. Furthermore, we foundthat maximum workload (W max) was statistically significant (at the 0.05 level) only forPD + EX in 44 studies [44] (Table 10).
Table 10. Changes in physical capacity (VO2max; Maximum Workload) in PD, PDs, and PD-EX.
VO2max (mL/kg/min) VO2max (L/min) Maximum Workload (W max)
Indicator PDs PD PD-EX PDs PD PD-EX PDs PD PD-EX
Beta 2.068 1.921 3.484 0.127 0.000 0.400 0.000 0.000 30.000
95%HCI 2.853 2.725 4.940 0.400 0.112 0.754 0.112 0.112 56.575
95%LCI 1.282 1.116 2.028 −0.146 −0.112 0.046 −0.112 −0.112 3.425
p value 0.000 0.000 0.000 0.362 1.000 0.027 1.000 1.000 0.027
k 3 2 2 2 1 1 1 1 1
Beta: the size of the average effect (within group); 95% HCI and 95% LCI: limits of 95% confidence interval of the effect; p-value: significancelevel of the intra-group effect. Results statistically significant at least at the 0.1 significance level are marked red; k: number of studiesincluded; PD: experimental group (PD group results both for PD vs. PD-EX and PD pre vs. post studies); PDs: PD group limited only to PDvs. PD-EX studies; PD-EX—paleo diet with supervised training.
4. Discussion
The present meta-analysis evaluated randomized clinical trials (RCTs). The populationgroups differed significantly in clinical characteristics, since individuals with ischemicheart disease were either diabetic, were hypercholesterolemic, were obese or overweight,had metabolic syndrome, or were healthy. We also included a study where the Paleo dietwas combined with physical activity in healthy or unhealthy volunteers (i.e., T2DM). Ourmeta-analysis confirms that even the short-term use of the Paleolithic diet improves healthstatus indicators, metabolic biomarkers, and body composition (normalization of bloodpressure, improvement in the lipid profile, a lowering of total cholesterol, TG, and LDL,increases in HDL, increased glucose tolerance and insulin sensitivity, losses in body andfat mass, lower waist circumference, and decreases in BMI) in obese people, sufferingfrom type 2 diabetes and metabolic syndrome, and healthy people to a greater or similarextent compared to other healthy diets [18,28,37,39–56,71]. These changes improved health,especially in obese patients (body mass reduction), patients with diabetes (improvedcarbohydrate metabolism) or cardiovascular disease (normalization of blood pressure), andwomen with metabolic syndrome (fasting glucose, insulin sensitivity, abdominal obesity,lipid profile, and blood pressure all improved). Conclusions from the influence of this PDon other markers (i.e., net acid excretion, CRP, selected hormones, e.g., leptin and cortisol,and indicators analyzed in multiple sclerosis and other diseases, e.g., acne) [29,72–74]and the long-term use of PD must be interpreted with caution, as they concern single orseveral studies.
In our meta-analysis, we found that both Paleo diets and a variety of alternativehealthy diets (control diets) caused a statistically significant reduction in BM, BMI, WC,and FM, both in the short and long term. For many indicators, such as body mass, BMI, orwaist circumference, the impact of the Paleo diet was stronger than the impact of the controldiet. We also noticed statistically significant differences in FM in PD (not in CD) in the shortterm. The only indicator on which the impact on both diets was inconclusive is LBM, onwhich the impact of both diets in the short term is neither statistically positive nor negative,while the long-term impact was investigated only in 41 (not included in meta-analysis)studies. Regarding the strategy connecting PD and physical activity, Otten et al. [42]observed decreased fat mass, body mass, and waist circumference in both the PD and PD-EX groups, without differences between intervention groups. Male participants decreasedtheir waist circumference more in the PD group compared to the PD-EX group. Males inthe PD-EX group retained more lean mass than males in the PD group [42]. The previous

Nutrients 2021, 13, 1019 20 of 56
meta-analysis conducted by Ghaedi et al. [75] indicated that the Paleolithic diet (eight RCTs)could significantly decrease anthropometric indexes, including BM, WC, BMI, and FM %.These results were also confirmed by Manheimer [76], who pointed out that Paleolithicnutrition was more effective in reducing body weight in comparison to the control diet [76].Menezes [17] in their meta-analysis (11 RCTs) found that PD may assist in controlling BM,BMI, and waist circumference. The summary of the effect showed a loss −3.52 kg in PD [17].It should be noted that increased satiety has been reported in Paleo-type diets comparedwith other types of diets in a few studies [28,77]. It is worth emphasizing that there are fewstudies reporting a significant decrease in body weight, fat mass, and waist circumferencein the short term (after 6 months) that is not sustained in the long term (after 24 months)in a Palaeolithic-type diet compared to a reference diet in a control group [45,46,49]. Ourmeta-analysis confirms the greater effect of changes in the shorter period of diet applicationthan in the longer period. In the majority of the studies included in the meta-analysis(exceptions being those by Masharani et al. [52], Boers et al. [53], and Frassetto et al. [18]),the ad libitum diet regimen was introduced both in the PD and CD groups. The Paleolithicdiet, rich in complete protein and fiber, can actually be characterized by a high degreeof satiety [72,78], which could have resulted in a slightly greater reduction effect in PD.Moreover, in terms of the ad libitum model, energy intake was lower than the energydemand in both groups, and comparing the energy supply in both research groups, itwas lower in the groups with PD in juxtaposition with CD [28,43]. It can therefore beconcluded that the Paleolithic diet can be an effective reduction diet with a shorter durationof use compared to other healthy diets maintaining the ad libitum strategy. Similarly, interms of particular components of the body composition, a more significant reductioneffect was noted in the groups with PD or PD-EX interventions. Short observations (upto 6 months) showed a more notable adipose tissue loss in kg and %. Given the lessereffect in terms of longer interventions, perhaps the regimen associated with maintainingthe Paleolithic diet (abandoning products that are the majority in the “Western” diet, i.e.,highly processed foods, milk, cereal, and dairy products) is difficult to sustain over the longterm. Thus, the lack of difference in measurements in the end could be due to the fact that,over time, the participants allowed themselves to make exceptions in the diet [45,46,49].The above-mentioned changes were observed in obese women in the postmenopausalstage, people suffering from type 2 diabetes (not treated with insulin) and ischemic heartdisease, and healthy people conducting physical activity on purpose. The reduction inenergy intake is perhaps the explanation for the good influence of the Paleo diet on weightand waist circumference [28,37,39,40,42,44,47,48,51,52,54–56]. Additionally, a higher fruitconsumption while on the Paleo diet is associated with a significant reduction in waistcircumference in terms of people with diabetes [28]. No changes in the body weight ofthe participants were reported by Frassetto et al. [18]; in that case, the weight loss was notplanned (the normoenergetic diet). It is worth pointing out that other LCDs that are rich inprotein and/or fat also cause weight loss [79–82].
In our paper, overall, the Paleolithic diet and various healthy diets caused decreasesin TC, LDL-C, and TG, albeit the impact of the Paleo diet was stronger. Among long-termstudies, only the Paleo diet caused a statistically significant decline in TC and LDL-C. In PDand CD, we noticed a similar significant increase in HDL-C. The same results were foundby Manheimer et al. [76], but they also noted beneficial changes in HDL-C, but this did notreach a significant level; however, improvements in metabolic syndrome components afterthe consumption of a Paleolithic nutritional pattern were observed [76]. In Ghaedi et al.’smeta-analysis [75], PD resulted in reduced TC, LDL-C, and TGs and elevated circulatingconcentrations of HDL-C. However, similar to Manheimer’s papers, according to thesensitivity analysis, Ghaedi et al. [75] found that the overall effects of a PD on the lipidprofile were sensitive to the removal of some studies and to the correlation coefficients;thus, the effect of a PD in this field must be interpreted with caution [75]. Nevertheless,all meta-analyses, including ours, emphasize the beneficial effect of diet on the lipidprofile, especially in obese people, those suffering from metabolic diseases, and healthy

Nutrients 2021, 13, 1019 21 of 56
people [18,37,39–56]. Frassetto et al. [18] noticed that even short-term consumption of aPaleolithic type diet improves lipid profiles—just after 10 days, total cholesterol decreasedby −16%, LDL-C decreased by −22%, and triglycerides decreased by −35%. No significantchange occurred in HDL-C in nonobese and sedentary groups [18]. Paleolithic nutritionoffers a promising potential for the nutritional management of hyperlipidemia in adultswhose lipid profiles have not improved after following more traditional heart-healthydietary recommendations [39]. Smith et al. demonstrated that an ad libitum, unrestrictedPD was significantly deleterious to blood lipid profiles in healthy subjects participatingin a CrossFit-based training program (high-intensity). Subjects with optimal initial bloodlipid values demonstrated the greatest increase in LDL, TC, and n-HDL values, along withthe greatest decline in HDL-C values, following a 10-week Paleo diet intervention. Despitethe concurrent improvements in aerobic capacity and body composition noted in thesesubjects, the PD may have negated the positive effects of exercise on blood lipids in Smith’sstudies [55]. PD in overweight or obese postmenopausal women had a significant andpersistent effect on liver fat and differed significantly from a conventional LFD at 6 months.This difference may not be due to greater body weight reduction but to a difference in foodquality, for example, a higher content of mono- and polyunsaturated fatty acids in the PD,due to the authors [41].
Statistically significant impacts of Paleolithic and various healthy diets on blood pres-sure were observed mainly in the short term. Overall, the Paleo diet had a stronger impacton both SBP and DBP. In the long term, the only significant impact on DBP was seen in thePaleo diet. The other, pooled analysis also showed that a PD led to significant reductionsin both SBP and DBP. However, according to a sensitivity analysis, Ghaedi et al. [75] foundthat the overall effects of a PD on SBP concentrations were sensitive to the removal ofsome studies and to the correlation coefficients; thus, the effect of a PD in this field mustbe interpreted with caution as well. [75]. In the studies we took into account in our meta-analysis, a decrease in both systolic and diastolic blood pressure was observed in subjectswith metabolic syndrome, those overweight, those with a sedentary lifestyle, and thosewith type 2 diabetes [18,37,41,42,44,47,49,52–54,56,71]. Even the short-term consumptionof a PD improves blood pressure [18,53,56,71]. In other studies of longer duration (up to 12weeks—still short term), changes in single indices related to blood pressure were observedin healthy subjects (a decrease in systolic blood pressure) [56], obese postmenopausalwomen, and people with type 2 diabetes not treated with insulin (a decrease in diastolicblood pressure) [37,41,78]. A PD can be effective in reducing blood pressure in hypertensivepeople [79] because of the high intake of fruit and vegetables, and this dietary patternis rich in potassium content [83]. Most researchers conclude that, in the prevention ofhypertension, an appropriate potassium/sodium ratio, which is characteristic of the Paleodiet, is important [18,23,83].
In our meta-analysis, PD caused a statistically significant decrease in fP glucose, fPinsulin, HOMA-IR, and HbA1c in the short term—contrary to various CDs, which causedonly a statistically significant decrease in HbA1c. In the long term, the Paleo diet caused nostatistically significant changes in all carbohydrate metabolism indicators. Simultaneously,the various CDs in the long term similarly caused no statistically significant impact onfP glucose and fP insulin, while its impact on HOMA-IR was statistically significant.In a recent meta-analysis, Jamka et al. [84] presented that the PD (four RTCs) did notdiffer from other types of diets commonly perceived as healthy regarding its effect onfasting glucose and insulin concentrations, AUC 0–120 glucose and AUC 0–120 insulinlevels, HbA1c values, and the HOMA-IR index. A decrease in fP glucose concentrationsin the Paleolithic group was observed in the end of the intervention period in most ofthe studies included in this systematic review. The Paleolithic diet did not differ fromother types of diets commonly perceived as healthy with regard to effects on glucoseand insulin homeostasis in subjects with altered glucose metabolism. Several, albeit notall, studies have suggested that the consumption of the Paleolithic diet might improveglucose tolerance, decrease insulin secretion, and increase insulin sensitivity [84]. Similar

Nutrients 2021, 13, 1019 22 of 56
results were found in another meta-analysis, showing that beneficial changes of fP glucosevalues did not reach significance, but the analysis suggested short-term improvementsin metabolic syndrome components after PD consumption [76]. Taking into accountcarbohydrate metabolism, an improvement in glucose tolerance and/or insulin sensitivitywas observed in overweight people and patients with type 2 diabetes [28,37,48,52]. Thenutritional composition of a Paleo diet—high-fiber content, high antioxidants, high mono-and polyunsaturated fats, low sodium, and high potassium—may be particularly beneficialin patients with T2DM, even if they are on medicine to control glucose levels, BP, andlipids [52]. There was a greater positive effect of the Paleo diet on carbohydrate metabolismcompared to the Mediterranean diet [28] and the ADA diet [52]. Moreover, the Paleo diethad the same effect on satiety as the Mediterranean diet, but with a lower caloric intakeduring the day (ad libitum intake in both groups). There was a greater decrease in glucose(but not insulin—the same as noted by Lindeberg et al. [28]) in diabetics following thePaleo diet compared to the usual diet, and it is worth noting that, in the Paleo group,the subjects consumed up to 1 kg of fruit per day (both groups reported energy intake,and the height of the glycemic index was at a similar level) [28,51]. Conventionally, theglycemic index is lower in the Paleolithic nutrition model (GI = 50) compared to thediabetic diet (GI = 55) [78]. According to Frassetto et al., even short-term consumption ofa Paleolithic type diet improves glucose tolerance, decreases insulin secretion, increasesinsulin sensitivity—without weight loss [18]. In addition, studies have shown that the lowcarbohydrate/protein ratio commonly associated with the Paleo diet improves glycemiccontrol and body composition (PD may improve glucose tolerance independently ofpositive changes in WC) [18,28,55]. Similarly, in one intervention, the energy intake andmacronutrients (Paleo vs. control, based on the recommendations of the ADA) was thesame in both groups. In addition, the energy content of both diets was set at a levelthat prevents weight loss. In many studies, the Paleo diet was characterized with lowerenergy and carbohydrate content than the control diets; thus, the question arises: Is thebeneficial effect of the Paleo diet due to the elimination of grain and dairy products ormerely a reduced caloric intake? Both groups improved fasting glucose and lipid profile,but the effect of the Paleo diet was more favorable. Additionally, in the Paleo group, animprovement in insulin sensitivity was noted in patients with the highest insulin resistance.No such effect was noted in the ADA group. Despite a number of advantages, the discussedstudy also has disadvantages: the dietary fiber in the ADA group was much lower than inthe Paleo group (12 g vs. 35 g/d), which could have influenced the results [52]. The largerimprovement of glucose tolerance in the Paleolithic group was independent of energyintake and macronutrient composition, which suggests that avoiding Western foods ismore important than counting calories, fat, carbohydrates, or protein. The study adds tothe notion that healthy diets based on whole-grain cereals and low-fat dairy products areonly the second-best choice in the prevention and treatment of type 2 diabetes [28]. Animprovement in insulin sensitivity and a decrease in the percentage of HbA1c were alsoobserved in Otten’s studies, in which DP was used in combination with resistance training.Lower energy consumption was observed in people who undertook physical activity [42].
It is doubtful whether the positive effect of the ancestral diet on health is caused by theelimination of highly processed foods/specific products (cereals, milk and dairy products,and legume seeds) from a diet, e.g., that is rich in some anti-nutritional substances, hasa high content of vegetables and fruits, or is energy-deficient, which results in weightloss. It has been known for a long time that the correct body structure affects health. It isworth noting that, in the cited scientific studies, the ad libitum model of consumption wasmostly used both in the groups on a Paleo diet and in control groups characterized by adifferent diet, usually therapeutic (e.g., “diabetic”). In addition, in the interventions withthe assumption of caloric intake dictated by the feeling of satiety (ad libitum) [28,37–56,71],a lower energy intake was observed in the PD groups [28,41]. In some of the studies, theparticipants did not have strictly imposed proportions of macronutrients or proportionsof animal and plant products. They reached for the particular products of their prefer-

Nutrients 2021, 13, 1019 23 of 56
ences. There are few scientific reports in which the normoenergetic model of nutrition isproposed [18,52,53]. However, the Paleo diet with the ad libitum nature of consumptioncannot be completely eliminated, because even short-term use of PD with the isocaloricnature has been associated with a normalization of blood pressure, glucose tolerance,decreased insulin, an increase in insulin sensitivity, and lipid profile improvement [18],without weight loss in healthy people, leading to a sedentary lifestyle. A similar effectwas noted in the group with at least two factors of the metabolic syndrome [53]. In thestudies by Masharani et al. [52] in people with type 2 diabetes, a positive effect was notedin the lipid profile (the PD group had statistically significant declines in TC, HDL-C, andLDL-C), carbohydrate metabolism (the PD group had greater benefits on glucose controland significant improvement in insulin sensitivity), and, interestingly, body composition(the average weight changes were similar in both groups without caloric restriction), whilethe pressure remained unchanged (the mean arterial pressure did not significantly changein any of the two groups) [52].
On the other hand, an umbrella review that assessed meta-analyzes of randomizedcontrolled trials of various diets (including PD) effects on anthropometric parameters andcardiometabolic risk factors were recently published and criticized the scientific evidenceon the effects of using this diet. The authors considered two metanalyses which we alsodiscussed (Ghaedi [75] and Manheimer [76]) and as it turned out the evidence for paleolithicdietary patterns was graded as weak [85].
There are studies that include PD + EX which conclude that the Paleolithic diet isa powerful tool to improve body composition and metabolic balance, including insulinsensitivity, glycemic control, and leptin in individuals with type 2 diabetes. Supervisedexercise training did not provide additional effects on these outcomes but preserved leanmass in men and increased cardiovascular fitness were observed [42].
We observed a positive impact of a Paleo diet with exercise on all investigated athleticperformance. All results, due to a low number of studies, should be interpreted cautiously.Despite the low number of studies, we took them into account because they are the onlystudies that analyzed physical performance in unhealthy (obese or T2DM) or healthybut not active subjects on a daily basis. Maximum oxygen (L/min) uptake increasedin the PD-EX group only in Otten et al.’s study [42]. Otten et al. [44] found that a PDwith exercise improves VO2max in subjects with type 2 diabetes while participating insupervised exercise training. It is worth emphasizing, that the difference between PD andPD-EX is the effect of exercise training, not the effect of PD. Smith et al. [55] presentedincreased peak oxygen uptake. However, regarding the Paleo diet, despite concurrentimprovements in aerobic capacity and body composition noted in these subjects, the Paleodiet may have negated the positive effects of exercise on blood lipids [55]. The long-termeffects of this intervention and the prognostic value of our findings need to be addressed inlarger prospective studies. In Popp’s study, the results suggest a MyPlate diet with bothaerobic and resistance training, which, more so than PD recommendations with exercise,improves aerobic fitness [70].
Taking into account athlete health, it has been shown that the use of LCDs adverselyaffects the lipid profile and promotes atherosclerotic changes in athletes [86,87]. The LCDalso shows positive changes in fasting blood TG, LDL-C, glucose, insulin, and HOMA-IR,but they were not significant in a group of basketball players [88]. There is also no negativeimpact of high-protein diets on kidney or liver function in athletes [89]. There is a lack ofmetabolic imbalances and adverse health effects as long as adequate amounts of energyand protein are provided [81,82].
Kang’s review indicates that a non-calorie-restricted KD provides minimal ergogenicbenefits in normal-weight individuals including athletes but can be used for optimizingBM and body composition without compromising aerobic and anaerobic performance [89].Studies conducted on a group of professional and inactive athletes showed weight losswithout energy restrictions when using diets with lower carbohydrate content and increas-ing fat consumption (LCD/VLCD-KD); there was a loss of body weight—specifically, a

Nutrients 2021, 13, 1019 24 of 56
decrease in fat mass while maintaining fat-free mass, which is extremely important in termsof practicing sports [79,90–93]. The benefits of the LCD were the reduction in body fat [59].McSwiney [94] demonstrated that a short-term (seven days), ad libitum KD consumed bytrained men produces a ~3% loss of body mass and marked changes in substrate utilizationacross a range of exercise intensities. Although such changes in substrate utilization may beconsidered to be ergogenic in some performance contexts (ultra-endurance) and generallyreflect the outcomes of longer-term adherence to a KD, it remains to be confirmed whethera short-term KD confers a performance benefit.
Moreover, a KD with a caloric surplus combined with resistance training, in trainedmen, would have a positive effect on the reduction in body fat and would be profitable forthe increase in fat-free body mass [95]. The question is: Would there be any fat-free massgain/fat mass loss if the hypercaloric Paleo diet was combined with resistance training?From the point of view of athletes, strategies that allow them to effectively reduce bodyweight without compromising health, a loss of muscle mass, and exercise capacity areimportant. There are hitherto no studies assessing the impact of the Paleolithic diet on bodycomposition components of competitive athletes. It is also worth noting that changing theconsumption of macronutrients may affect body weight. Michalczyk et al. [87] showedresults that confirm that the level of body fat does not depend on the amount of fat con-sumed in the diet, but on the amount and quality of carbohydrate consumption. Switchingto a low-carbohydrates ketogenic diet (LCKD) reduces fluid retention and, in turn, con-tributes to weight loss. An LCKD changes the efficiency of metabolic pathways [90,96] andincreases the oxidation of fatty acids [65,97]. It seems that the above mechanism does nothave to occur when using a PD, where the intake of carbohydrates is much higher than inan LCKD, but lower than in the usual diet.
On the other hand, LCDs accelerate the feeling of fatigue and reduce concentration,decreasing the effectiveness of training [55,98,99]. Contemporarily, dietary guidelinesfor athletes emphasize a high carbohydrate intake. This is related to concerns about theimpact of glycogen depletion on fatigue and adaptation [100,101], but the role of exogenouscarbohydrates in this context has recently been questioned [102]. For example, there is noevidence that carbohydrates are required for mTORC-1 (mammalian target of rapamycincomplex-1) signaling during muscle protein synthesis [103], when dietary protein intake issufficient [102]. In addition, the metabolic shift induced by an LCKD towards fat oxidation(and glycogen sparing) may have a beneficial effect on ATP resynthesis during strengthtraining [98]. In this context, it is worth analyzing diets that do not lead to ketosis [104]but are characterized by a lower carbohydrate content, e.g., the Paleo diet. It is not entirelyclear whether a moderate-carbohydrate diet can provide ergogenic benefits for athletesthat are characterized by a proper body weight and whose primary goal is to improveperformance and not lose weight. The doubt concerns the fact that, for example, KDsmay affect the loss of body weight and adipose tissue by enhancing the oxidation of fattyacids, and may also reduce glycogen resources, which may result in reduced athleticperformance [89]. It remains unclear whether a similar benefit can be expected from theuse of the normoenergetic Paleo diet by athletes. One certain advantage is the sufficientcarbohydrate content (glycogen), but a disadvantage may be a lack of ketosis in the KD,enabling the use of fatty acids in energy processes.
For some sports, e.g., team sport athletes, a high intake of carbohydrates may not benecessary in a daily diet, due to less training and a shorter competition time; in this case, PDmight be a good choice. However, there are disciplines, e.g., dynamic team sports, for whichthe consumption of carbohydrates is recommended before, during, and after competitionor training [105]. The question is of whether in this case the amount of carbohydrates fromthe Paleo diet will be sufficient. A previous review and meta-analysis showed that, whencomparing the endurance athlete’s ketogenic diet (EAKD) to a high carbohydrate diet,there are mixed findings for the effect of EAKD consumption on endurance performance.Bailey and Hennessy reported non-significant VO2max outcomes [62,92,104,106,107]. This

Nutrients 2021, 13, 1019 25 of 56
review provides evidence that EAKD consumption produces mixed results, in terms ofendurance performance, when compared to a high carbohydrate diet.
According to Bujko and Kowalski, a PD can have an ergogenic impact on the bodyof the athlete due to the high creatine content in the diet corresponding in terms of theamount of branched-chain amino acids (BCAAs). The Paleo diet is a diet rich in animalprotein, which is the best source of BCAAs—valine, leucine, and isoleucine, which stimulatemuscle growth and regeneration. Due to the alkalizing properties of fruit and vegetables,it can also have a normalizing effect on the acid–base balance, despite the high contentof animal protein. The high content of vitamins and minerals and the low amount ofanti-nutritional ingredients (including gluten, phytic acid, lectins, and saponins) in cerealproducts and legumes, important in terms of increased energy and nutrient requirements.Proper proportions of omega-6/omega-3 fatty acids in the diet (difficult to achieve in thelong term) and the elimination of insulinotropic properties may be valuable as well [67]. Itshould be emphasized that there are no studies assessing the impact of the use of the Paleodiet on exercise capacity and the health conditions of professional athletes at present. Theinfluence on exercise capacity (especially during weight reduction) in the case of the adlibitum strategy seems to be even more ambiguous. In such a situation (during ad libitum),there is a risk of a very low supply of energy, vitamins, and minerals. On the other hand, itseems to be relatively difficult to balance a diet for athletes with high energy expenditure(>4000 kcal), who want to apply the diet for reasons such as the potential ergogenic benefits,the elimination of highly processed foods or of gluten and/or lactose, or the reductionin carbohydrate intake. Another question is the amount of carbohydrates: Will it makesense to limit carbohydrates, since their amount coming from high-starch fruits/vegetableswill be so high that the body will likely not switch to the faster use of fatty acids in theseconditions? Will the Paleo diet regulate the acid–base body status (with many fruits andvegetables and a high amount of protein)?
5. Conclusions
The Paleo diet resulted in improvements in body weight and biomarkers linked toobesity, cardiovascular disease, type 2 diabetes, and metabolic syndrome. Even thoughshort-term intervention showed some favorable effects, it can be argued that a short-termdietary intervention is too short to ensure stable effects. These improvements were mostlyobserved when the participants were only coached to change their dietary eating plannot to reduce body weight (ad libitum energy intake). Longer-term interventions arerequired to determine the continued effect of the Paleo diet (1) if a normoenergetic modelof PD is applied, (2) if the reduction in body weight is maintained, especially under sportsconditions, and (3) if enhanced sports performance is desired. The long-term consequencesof these changes remain to be studied. Future research should focus on determiningrecommendations for athletes that embrace the positive aspects of the Paleo diet andminimize any deleterious impacts in terms of athletic performance. A longer follow-upand larger sample size are recommended in future clinical trials on the subject, in additionto a greater standardization of the Paleolithic diet used. In view of the positive short-termeffects of the PD on health, and the lack of experiments on professional athletes, longer-term interventions are required to better determine the effect of the Paleo diet on athletichealth status, body composition, and performance.
Author Contributions: Conceptualization, B.F. and A.P.; contributed to the design of the systematicreview and the interpretation of data, B.F. and A.P.; performed the literature search, B.F., F.T., andP.M.-K.; performed the data extraction and quality assessment process, A.P. and A.B.; performed thestatistical analysis, A.B.: contributed to the writing (review and editing), A.P. and B.F. All authorshave read and agreed to the published version of the manuscript.
Funding: Open Access financed within the framework of the program of the Minister of Science andHigher Education under the name ‘Regional Initiative for Perfection’ within the years 2019–2022,project No. 022/RID/2018/19 in the total of 11,919,908 PLN.

Nutrients 2021, 13, 1019 26 of 56
Institutional Review Board Statement: Not applicable.
Informed Consent Statement: Not applicable.
Data Availability Statement: Not applicable.
Conflicts of Interest: The authors declare no conflict of interest.
Appendix A
Nutrients 2021, 13, 1019 28 of 59
greater standardization of the Paleolithic diet used. In view of the positive short-term ef-fects of the PD on health, and the lack of experiments on professional athletes, longer-term interventions are required to better determine the effect of the Paleo diet on athletic health status, body composition, and performance.
Author Contributions: Conceptualization, B.F. and A.P.; contributed to the design of the systematic review and the interpretation of data, B.F. and A.P.; performed the literature search, B.F., F.T., and P.M.-K.; performed the data extraction and quality assessment process, A.P. and A.B.; performed the statistical analysis, A.B.: contributed to the writing (review and editing), A.P. and B.F. All au-thors have read and agreed to the published version of the manuscript.
Funding: Open Access financed within the framework of the program of the Minister of Science and Higher Education under the name ‘Regional Initiative for Perfection’ within the years 2019–2022, project No. 022/RID/2018/19 in the total of 11,919,908 PLN.
Institutional Review Board Statement: Not applicable.
Informed Consent Statement: Not applicable.
Data Availability Statement: Not applicable.
Conflicts of Interest: The authors declare no conflict of interest.
Appendix A
Figure A1. Forest plot of the effect of a PDs on BM (kg) in the short term (weighted mean difference). Figure A1. Forest plot of the effect of a PDs on BM (kg) in the short term (weighted mean difference).
Nutrients 2021, 13, 1019 29 of 59
Figure A2. Forest plot of the effect of PD on BM (kg) in the short term (weighted mean difference).
Figure A3. Forest plot of the effect of a CD on BM (kg) in the short term (weighted mean difference).
Figure A2. Forest plot of the effect of PD on BM (kg) in the short term (weighted mean difference).

Nutrients 2021, 13, 1019 27 of 56
Nutrients 2021, 13, 1019 29 of 59
Figure A2. Forest plot of the effect of PD on BM (kg) in the short term (weighted mean difference).
Figure A3. Forest plot of the effect of a CD on BM (kg) in the short term (weighted mean difference).
Figure A3. Forest plot of the effect of a CD on BM (kg) in the short term (weighted mean difference).
Nutrients 2021, 13, 1019 30 of 59
Figure A4. Forest plot of the effect of a PDs on BMI in the short term (weighted mean difference).
Figure A5. Forest plot of the effect of PD on BMI in the short term (weighted mean difference).
Figure A4. Forest plot of the effect of a PDs on BMI in the short term (weighted mean difference).

Nutrients 2021, 13, 1019 28 of 56
Nutrients 2021, 13, 1019 30 of 59
Figure A4. Forest plot of the effect of a PDs on BMI in the short term (weighted mean difference).
Figure A5. Forest plot of the effect of PD on BMI in the short term (weighted mean difference).
Figure A5. Forest plot of the effect of PD on BMI in the short term (weighted mean difference).
Nutrients 2021, 13, 1019 31 of 59
Figure A6. Forest plot of the effect of a CD on BMI in the short term (weighted mean difference).
Figure A7. Forest plot of the effect of a PDs on waist circumference (cm) in the short term (weighted mean difference).
Figure A6. Forest plot of the effect of a CD on BMI in the short term (weighted mean difference).
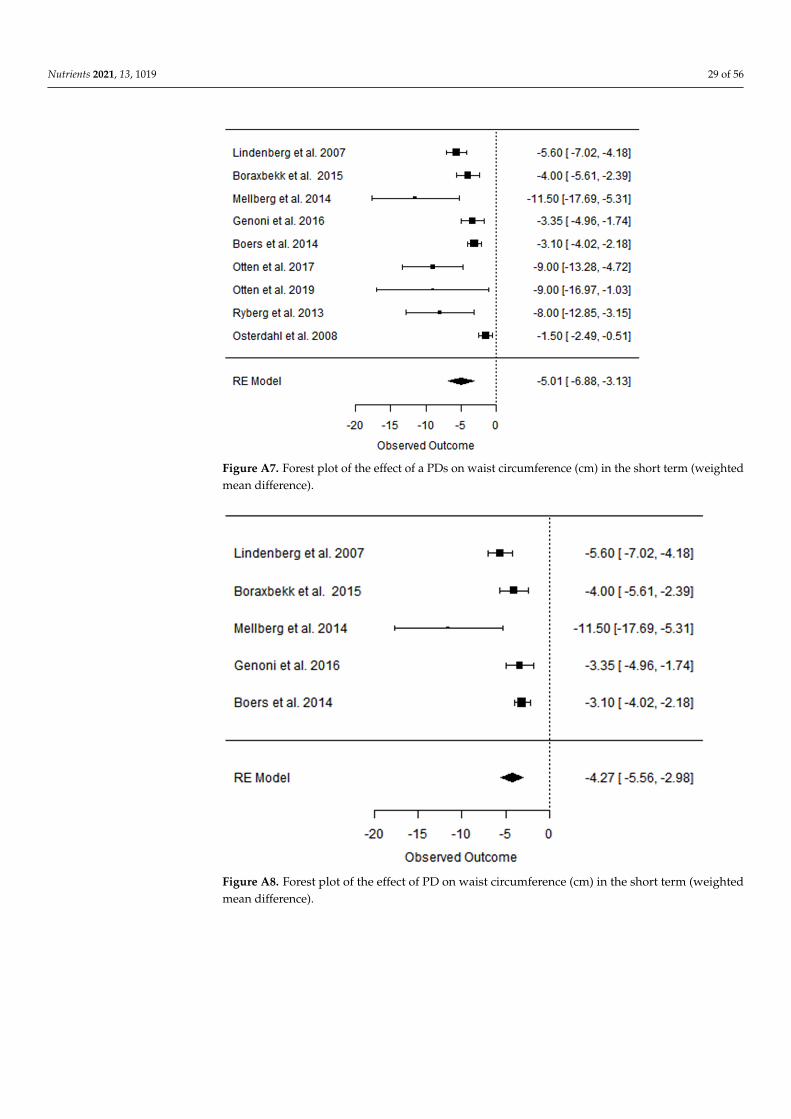
Nutrients 2021, 13, 1019 29 of 56
Nutrients 2021, 13, 1019 31 of 59
Figure A6. Forest plot of the effect of a CD on BMI in the short term (weighted mean difference).
Figure A7. Forest plot of the effect of a PDs on waist circumference (cm) in the short term (weighted mean difference).
Figure A7. Forest plot of the effect of a PDs on waist circumference (cm) in the short term (weightedmean difference).
Nutrients 2021, 13, 1019 32 of 59
Figure A8. Forest plot of the effect of PD on waist circumference (cm) in the short term (weighted mean difference).
Figure A9. Forest plot of the effect of a CD on waist c (cm) in the short term (weighted mean differ-ence).
Figure A8. Forest plot of the effect of PD on waist circumference (cm) in the short term (weightedmean difference).

Nutrients 2021, 13, 1019 30 of 56
Nutrients 2021, 13, 1019 32 of 59
Figure A8. Forest plot of the effect of PD on waist circumference (cm) in the short term (weighted mean difference).
Figure A9. Forest plot of the effect of a CD on waist c (cm) in the short term (weighted mean differ-ence).
Figure A9. Forest plot of the effect of a CD on waist c (cm) in the short term (weighted meandifference).
Nutrients 2021, 13, 1019 33 of 59
Figure A10. Forest plot of the effect of a PD on BM (kg) in the long term (weighted mean difference).
Figure A11. Forest plot of the effect of a CD on BM (kg) in the long term (weighted mean difference).
Figure A10. Forest plot of the effect of a PD on BM (kg) in the long term (weighted mean difference).

Nutrients 2021, 13, 1019 31 of 56
Nutrients 2021, 13, 1019 33 of 59
Figure A10. Forest plot of the effect of a PD on BM (kg) in the long term (weighted mean difference).
Figure A11. Forest plot of the effect of a CD on BM (kg) in the long term (weighted mean difference).
Figure A11. Forest plot of the effect of a CD on BM (kg) in the long term (weighted mean difference).
Nutrients 2021, 13, 1019 34 of 59
Figure A12. Forest plot of the effect of a PD on BMI in the long term (weighted mean difference).
Figure A13. Forest plot of the effect of a CD on BMI in the long term (weighted mean difference).
Figure A12. Forest plot of the effect of a PD on BMI in the long term (weighted mean difference).

Nutrients 2021, 13, 1019 32 of 56
Nutrients 2021, 13, 1019 34 of 59
Figure A12. Forest plot of the effect of a PD on BMI in the long term (weighted mean difference).
Figure A13. Forest plot of the effect of a CD on BMI in the long term (weighted mean difference).
Figure A13. Forest plot of the effect of a CD on BMI in the long term (weighted mean difference).
Nutrients 2021, 13, 1019 35 of 59
Figure A14. Forest plot of the effect of a PDs on TC in the short term (weighted mean difference).
Figure A15. Forest plot of the effect of PD on TC in the short term (weighted mean difference).
Figure A14. Forest plot of the effect of a PDs on TC in the short term (weighted mean difference).

Nutrients 2021, 13, 1019 33 of 56
Nutrients 2021, 13, 1019 35 of 59
Figure A14. Forest plot of the effect of a PDs on TC in the short term (weighted mean difference).
Figure A15. Forest plot of the effect of PD on TC in the short term (weighted mean difference).
Figure A15. Forest plot of the effect of PD on TC in the short term (weighted mean difference).
Nutrients 2021, 13, 1019 36 of 59
Figure A16. Forest plot of the effect of a CD on TC in the short term (weighted mean difference).
Figure A17. Forest plot of the effect of a PDs on TG in the short term (weighted mean difference).
Figure A16. Forest plot of the effect of a CD on TC in the short term (weighted mean difference).
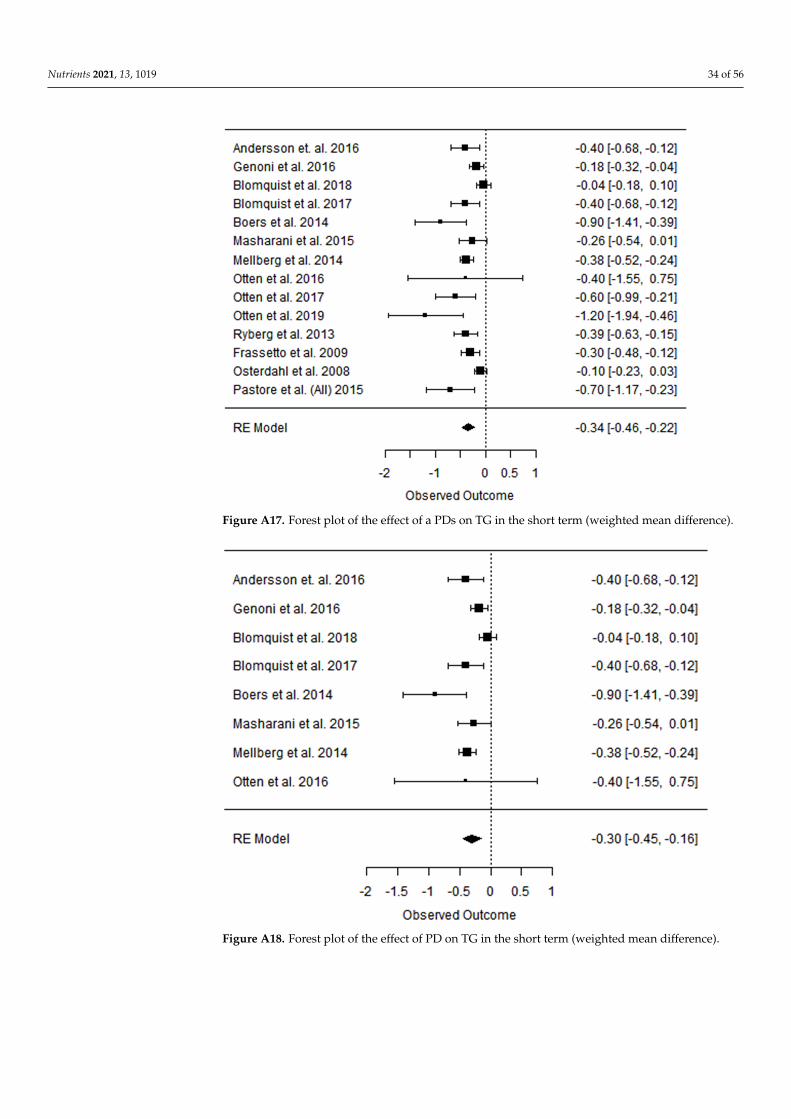
Nutrients 2021, 13, 1019 34 of 56
Nutrients 2021, 13, 1019 36 of 59
Figure A16. Forest plot of the effect of a CD on TC in the short term (weighted mean difference).
Figure A17. Forest plot of the effect of a PDs on TG in the short term (weighted mean difference).
Figure A17. Forest plot of the effect of a PDs on TG in the short term (weighted mean difference).
Nutrients 2021, 13, 1019 37 of 59
Figure A18. Forest plot of the effect of PD on TG in the short term (weighted mean difference).
Figure A19. Forest plot of the effect of a CD on TG in the short term (weighted mean difference).
Figure A18. Forest plot of the effect of PD on TG in the short term (weighted mean difference).

Nutrients 2021, 13, 1019 35 of 56
Nutrients 2021, 13, 1019 37 of 59
Figure A18. Forest plot of the effect of PD on TG in the short term (weighted mean difference).
Figure A19. Forest plot of the effect of a CD on TG in the short term (weighted mean difference).
Figure A19. Forest plot of the effect of a CD on TG in the short term (weighted mean difference).
Nutrients 2021, 13, 1019 38 of 59
Figure A20. Forest plot of the effect of a PDs on HDL-C in the short term (weighted mean difference).
Figure A21. Forest plot of the effect of PD on HDL-C in the short term (weighted mean difference).
Figure A20. Forest plot of the effect of a PDs on HDL-C in the short term (weighted mean difference).

Nutrients 2021, 13, 1019 36 of 56
Nutrients 2021, 13, 1019 38 of 59
Figure A20. Forest plot of the effect of a PDs on HDL-C in the short term (weighted mean difference).
Figure A21. Forest plot of the effect of PD on HDL-C in the short term (weighted mean difference).
Figure A21. Forest plot of the effect of PD on HDL-C in the short term (weighted mean difference).
Nutrients 2021, 13, 1019 39 of 59
Figure A22. Forest plot of the effect of a CD on HDL-C in the short term (weighted mean difference).
Figure A23. Forest plot of the effect of a PDs on LDL-C in the short term (weighted mean difference).
Figure A22. Forest plot of the effect of a CD on HDL-C in the short term (weighted mean difference).

Nutrients 2021, 13, 1019 37 of 56
Nutrients 2021, 13, 1019 39 of 59
Figure A22. Forest plot of the effect of a CD on HDL-C in the short term (weighted mean difference).
Figure A23. Forest plot of the effect of a PDs on LDL-C in the short term (weighted mean difference).
Figure A23. Forest plot of the effect of a PDs on LDL-C in the short term (weighted mean difference).
Nutrients 2021, 13, 1019 40 of 59
Figure A24. Forest plot of the effect of PD on LDL-C in the short term (weighted mean difference).
Figure A25. Forest plot of the effect of a CD on LDL-C in the short term (weighted mean difference).
Figure A24. Forest plot of the effect of PD on LDL-C in the short term (weighted mean difference).

Nutrients 2021, 13, 1019 38 of 56
Nutrients 2021, 13, 1019 40 of 59
Figure A24. Forest plot of the effect of PD on LDL-C in the short term (weighted mean difference).
Figure A25. Forest plot of the effect of a CD on LDL-C in the short term (weighted mean difference).
Figure A25. Forest plot of the effect of a CD on LDL-C in the short term (weighted mean difference).Nutrients 2021, 13, 1019 41 of 59
Figure A26. Forest plot of the effect of a PD on TC in the long term (weighted mean difference).
Figure A27. Forest plot of the effect of a CD on TC in the long term (weighted mean difference).
Figure A26. Forest plot of the effect of a PD on TC in the long term (weighted mean difference).

Nutrients 2021, 13, 1019 39 of 56
Nutrients 2021, 13, 1019 41 of 59
Figure A26. Forest plot of the effect of a PD on TC in the long term (weighted mean difference).
Figure A27. Forest plot of the effect of a CD on TC in the long term (weighted mean difference).
Figure A27. Forest plot of the effect of a CD on TC in the long term (weighted mean difference).
Nutrients 2021, 13, 1019 42 of 59
Figure A28. Forest plot of the effect of a PD on TG in the long term (weighted mean difference).
Figure A29. Forest plot of the effect of a CD on TG in the long term (weighted mean difference).
Figure A28. Forest plot of the effect of a PD on TG in the long term (weighted mean difference).
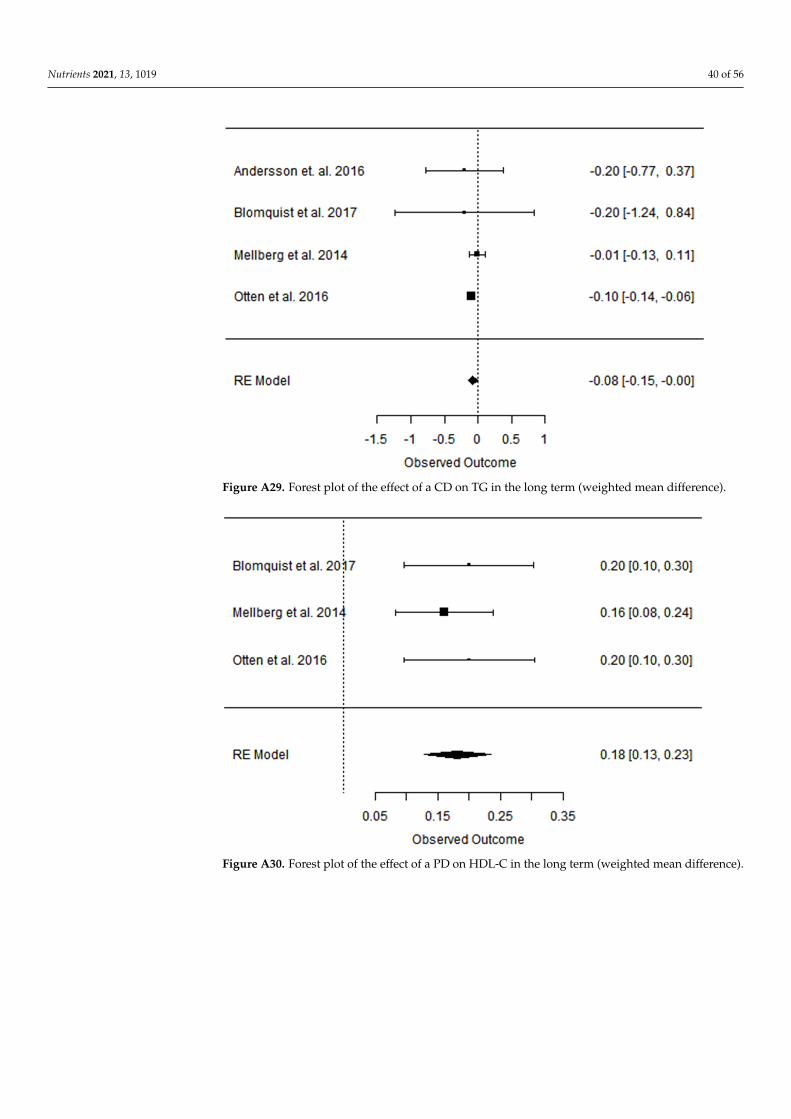
Nutrients 2021, 13, 1019 40 of 56
Nutrients 2021, 13, 1019 42 of 59
Figure A28. Forest plot of the effect of a PD on TG in the long term (weighted mean difference).
Figure A29. Forest plot of the effect of a CD on TG in the long term (weighted mean difference).
Figure A29. Forest plot of the effect of a CD on TG in the long term (weighted mean difference).
Nutrients 2021, 13, 1019 43 of 59
Figure A30. Forest plot of the effect of a PD on HDL-C in the long term (weighted mean difference).
Figure A31. Forest plot of the effect of a CD on HDL-C in the long term (weighted mean difference).
Figure A30. Forest plot of the effect of a PD on HDL-C in the long term (weighted mean difference).

Nutrients 2021, 13, 1019 41 of 56
Nutrients 2021, 13, 1019 43 of 59
Figure A30. Forest plot of the effect of a PD on HDL-C in the long term (weighted mean difference).
Figure A31. Forest plot of the effect of a CD on HDL-C in the long term (weighted mean difference).
Figure A31. Forest plot of the effect of a CD on HDL-C in the long term (weighted mean difference).
Nutrients 2021, 13, 1019 44 of 59
Figure A32. Forest plot of the effect of a PD on LDL-C in the long term (weighted mean difference).
Figure A33. Forest plot of the effect of a CD on LDL-C in the long term (weighted mean difference).
Figure A32. Forest plot of the effect of a PD on LDL-C in the long term (weighted mean difference).

Nutrients 2021, 13, 1019 42 of 56
Nutrients 2021, 13, 1019 44 of 59
Figure A32. Forest plot of the effect of a PD on LDL-C in the long term (weighted mean difference).
Figure A33. Forest plot of the effect of a CD on LDL-C in the long term (weighted mean difference).
Figure A33. Forest plot of the effect of a CD on LDL-C in the long term (weighted mean difference).
Nutrients 2021, 13, 1019 45 of 59
Figure A34. Forest plot of the effect of a PDs on SBP in the short term (weighted mean difference).
Figure A35. Forest plot of the effect of PD on SBP in the short term (weighted mean difference).
Figure A34. Forest plot of the effect of a PDs on SBP in the short term (weighted mean difference).
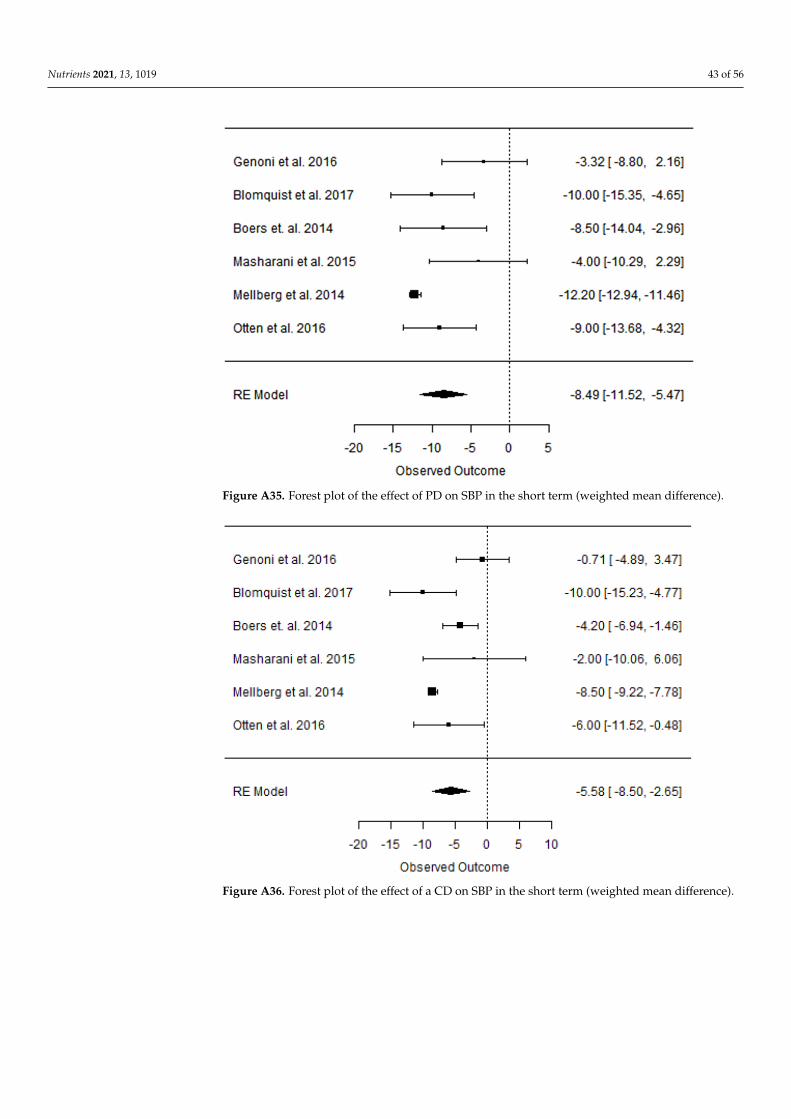
Nutrients 2021, 13, 1019 43 of 56
Nutrients 2021, 13, 1019 45 of 59
Figure A34. Forest plot of the effect of a PDs on SBP in the short term (weighted mean difference).
Figure A35. Forest plot of the effect of PD on SBP in the short term (weighted mean difference).
Figure A35. Forest plot of the effect of PD on SBP in the short term (weighted mean difference).
Nutrients 2021, 13, 1019 46 of 59
Figure A36. Forest plot of the effect of a CD on SBP in the short term (weighted mean difference).
Figure A37. Forest plot of the effect of a PDs on DBP in the short term (weighted mean difference).
Figure A36. Forest plot of the effect of a CD on SBP in the short term (weighted mean difference).

Nutrients 2021, 13, 1019 44 of 56
Nutrients 2021, 13, 1019 46 of 59
Figure A36. Forest plot of the effect of a CD on SBP in the short term (weighted mean difference).
Figure A37. Forest plot of the effect of a PDs on DBP in the short term (weighted mean difference).
Figure A37. Forest plot of the effect of a PDs on DBP in the short term (weighted mean difference).
Nutrients 2021, 13, 1019 47 of 59
Figure A38. Forest plot of the effect of PD on DBP in the short term (weighted mean difference).
Figure A39. Forest plot of the effect of a CD on DBP in the short term (weighted mean difference).
Figure A38. Forest plot of the effect of PD on DBP in the short term (weighted mean difference).

Nutrients 2021, 13, 1019 45 of 56
Nutrients 2021, 13, 1019 47 of 59
Figure A38. Forest plot of the effect of PD on DBP in the short term (weighted mean difference).
Figure A39. Forest plot of the effect of a CD on DBP in the short term (weighted mean difference).
Figure A39. Forest plot of the effect of a CD on DBP in the short term (weighted mean difference).
Nutrients 2021, 13, 1019 48 of 59
Figure A40. Forest plot of the effect of a PD on SBP in the long term (weighted mean difference).
Figure A41. Forest plot of the effect of a CD on SBP in the long term (weighted mean difference).
Figure A40. Forest plot of the effect of a PD on SBP in the long term (weighted mean difference).

Nutrients 2021, 13, 1019 46 of 56
Nutrients 2021, 13, 1019 48 of 59
Figure A40. Forest plot of the effect of a PD on SBP in the long term (weighted mean difference).
Figure A41. Forest plot of the effect of a CD on SBP in the long term (weighted mean difference).
Figure A41. Forest plot of the effect of a CD on SBP in the long term (weighted mean difference).
Nutrients 2021, 13, 1019 49 of 59
Figure A42. Forest plot of the effect of a PD on DBP in the long term (weighted mean difference).
Figure A43. Forest plot of the effect of a CD on DBP in the long term (weighted mean difference).
Figure A42. Forest plot of the effect of a PD on DBP in the long term (weighted mean difference).

Nutrients 2021, 13, 1019 47 of 56
Nutrients 2021, 13, 1019 49 of 59
Figure A42. Forest plot of the effect of a PD on DBP in the long term (weighted mean difference).
Figure A43. Forest plot of the effect of a CD on DBP in the long term (weighted mean difference).
Figure A43. Forest plot of the effect of a CD on DBP in the long term (weighted mean difference).
Nutrients 2021, 13, 1019 50 of 59
Figure A44. Forest plot of the effect of a PDs on fP glucose (mmol/L) in the short term (weighted mean difference).
Figure A45. Forest plot of the effect of PD on fP glucose (mmol/L) in the short term (weighted mean difference).
Figure A44. Forest plot of the effect of a PDs on fP glucose (mmol/L) in the short term (weightedmean difference).

Nutrients 2021, 13, 1019 48 of 56
Nutrients 2021, 13, 1019 50 of 59
Figure A44. Forest plot of the effect of a PDs on fP glucose (mmol/L) in the short term (weighted mean difference).
Figure A45. Forest plot of the effect of PD on fP glucose (mmol/L) in the short term (weighted mean difference).
Figure A45. Forest plot of the effect of PD on fP glucose (mmol/L) in the short term (weighted meandifference).
Nutrients 2021, 13, 1019 51 of 59
Figure A46. Forest plot of the effect of a CD on fP glucose (mmol/L) in the short term (weighted mean difference).
Figure A47. Forest plot of the effect of a PDs on fP insulin (mmol/L) in the short term (weighted mean difference).
Figure A46. Forest plot of the effect of a CD on fP glucose (mmol/L) in the short term (weightedmean difference).

Nutrients 2021, 13, 1019 49 of 56
Nutrients 2021, 13, 1019 51 of 59
Figure A46. Forest plot of the effect of a CD on fP glucose (mmol/L) in the short term (weighted mean difference).
Figure A47. Forest plot of the effect of a PDs on fP insulin (mmol/L) in the short term (weighted mean difference).
Figure A47. Forest plot of the effect of a PDs on fP insulin (mmol/L) in the short term (weightedmean difference).
Nutrients 2021, 13, 1019 52 of 59
Figure A48. Forest plot of the effect of PD on fP insulin (mmol/L) in the short term (weighted mean difference).
Figure A49. Forest plot of the effect of a CD on fP insulin (mmol/L) in the short term (weighted mean difference).
Figure A48. Forest plot of the effect of PD on fP insulin (mmol/L) in the short term (weighted meandifference).

Nutrients 2021, 13, 1019 50 of 56
Nutrients 2021, 13, 1019 52 of 59
Figure A48. Forest plot of the effect of PD on fP insulin (mmol/L) in the short term (weighted mean difference).
Figure A49. Forest plot of the effect of a CD on fP insulin (mmol/L) in the short term (weighted mean difference).
Figure A49. Forest plot of the effect of a CD on fP insulin (mmol/L) in the short term (weightedmean difference).
Nutrients 2021, 13, 1019 53 of 59
Figure A50. Forest plot of the effect of a PDs on HOMA-IR in the short term (weighted mean dif-ference).
Figure A51. Forest plot of the effect of PD on HOMA-IR in the short term (weighted mean differ-ence).
Figure A50. Forest plot of the effect of a PDs on HOMA-IR in the short term (weighted meandifference).

Nutrients 2021, 13, 1019 51 of 56
Nutrients 2021, 13, 1019 53 of 59
Figure A50. Forest plot of the effect of a PDs on HOMA-IR in the short term (weighted mean dif-ference).
Figure A51. Forest plot of the effect of PD on HOMA-IR in the short term (weighted mean differ-ence).
Figure A51. Forest plot of the effect of PD on HOMA-IR in the short term (weighted mean difference).
Nutrients 2021, 13, 1019 54 of 59
Figure A52. Forest plot of the effect of a CD on HOMA-IR in the short term (weighted mean difference).
Figure A53. Forest plot of the effect of a PD on HOMA-IR in the long term (weighted mean difference).
Figure A52. Forest plot of the effect of a CD on HOMA-IR in the short term (weighted meandifference).

Nutrients 2021, 13, 1019 52 of 56
Nutrients 2021, 13, 1019 54 of 59
Figure A52. Forest plot of the effect of a CD on HOMA-IR in the short term (weighted mean difference).
Figure A53. Forest plot of the effect of a PD on HOMA-IR in the long term (weighted mean difference).
Figure A53. Forest plot of the effect of a PD on HOMA-IR in the long term (weighted mean difference).
Nutrients 2021, 13, 1019 55 of 59
Figure A54. Forest plot of the effect of a CD on HOMA-IR in the long term (weighted mean difference).
References 1. Eaton, S.B.; Konner, M. Paleolithic nutrition: A consideration of its nature and current implications. N. Engl. J. Med. 1985, 312,
283–289. 2. Milton, K. Hunter-gatherer diets- a different perspective. Am. J. Clin. Nutr. 2000, 71, 665–667, doi:10.1093/ajcn/71.3.665. 3. Wrangham, R.; Conklin-Brittain, N. Cooking as a biological trait. Comp. Biochem. Physiol. Mol. Integr. Physiol. 2003, 136, 35–46. 4. Wrangham, R.; Cheney, D.; Seyfarth, R.; Sarmiento, E. Shallow-water habitats as sources of fallback foods for hominins. Am. J.
Phys. Anthropol. 2009, 140, 630–642, doi:10.1002/ajpa.21122. 5. Konner, M.; Eaton, S.B. Paleolithic nutrition: Twenty-five years later. Nutr. Clin. Pract. 2010, 25, 594–602. 6. Eaton, S.B.; Eaton, S.B. Paleolithic vs. modern diets-selected pathophysiological implications. Eur. J. Nutr. 2000, 39, 67–70. 7. Cordain, L.; Miller, J.B.; Eaton, S.B.; Mann, N. Macronutrient estimations in hunter-gatherer diets. Am. J. Clin. Nutr. 2000, 72,
1589–1592, doi:10.1093/ajcn/72.6.1589. 8. Ugent, D.; Dillehay, T.; Ramírez, C. Potato remains from a late pleistocene settlement in southcentral Chile. Econ. Bot. 1987, 41,
17–27, doi:10.1007/bf02859340. 9. Mercader, J. Mozambican Grass Seed Consumption during the Middle Stone Age. Science 2009, 326, 1680–1683, doi:10.1126/sci-
ence.1173966. 10. Henry, A.G.; Brooks, A.S.; Piperno, D.R. Microfossils in calculus demonstrate consumption of plants and cooked foods in Ne-
anderthal diets. Proc. Natl. Acad. Sci. USA 2011, 108, 486–491. 11. Henry, A.G.; Ungar, P.S.; Passey, B.H.; Sponheimer, M.; Rossouw, L.; Bamford, M.K.; Sandberg, P.A.; De Ruiter, D.J.; Berger,
L.R. The diet of Australopithecus sediba. Nat. Cell Biol. 2012, 487, 90–93, doi:10.1038/nature11185. 12. Revedin, A.; Aranguren, B.; Becattini, R.; Longo, L.; Marconi, E.; Lippi, M.M.; Skakun, N.; Sinitsyn, A.; Spiridonova, E.; Svoboda,
J. Thirty thousand-year-old evidence of plant food processing. Proc. Natl. Acad. Sci. USA 2010, 107, 18815–18819, doi:10.1073/pnas.1006993107.
13. Turner, B.L.; Thompson, A.L. Beyond the Paleolithic prescription: Incorporating diversity and flexibility in the study of human diet evolution. Nutr. Rev. 2013, 71, 501–510, doi:10.1111/nure.12039.
14. Holden, C.; Mace, R. Phylogenetic analysis of the evolution of lactose digestion in adults. Hum. Biol. 1997, 69, 606–628. 15. Knight, C. Most people are simply not designed to eat pasta: Evolutionary explanations for obesity in the low carbohydrate diet
movement. Public Underst. Sci. 2011, 20, 706–719. 16. Perry, G.H.; Dominy, N.J.; Claw, K.G.; Lee, A.S.; Fiegler, H.; Redon, R.; Werner, J.; Villanea, F.A.; Mountain, J.L.; Misra, R.; et
al. Diet and the evolution of human amylase gene copy number variation. Nat. Genet. 2007, 39, 1256–1260, doi:10.1038/ng2123. 17. De Menezes, E.V.A.; Sampaio, H.A.D.C.; Carioca, A.A.F.; Parente, N.A.; Brito, F.O.; Moreira, T.M.M.; De Souza, A.C.C.; Arruda,
S.P.M. Influence of Paleolithic diet on anthropometric markers in chronic diseases: Systematic review and meta-analysis. Nutr. J. 2019, 18, 41, doi:10.1186/s12937-019-0457-z.
Figure A54. Forest plot of the effect of a CD on HOMA-IR in the long term (weighted meandifference).
References1. Eaton, S.B.; Konner, M. Paleolithic nutrition: A consideration of its nature and current implications. N. Engl. J. Med. 1985, 312,
283–289. [CrossRef]2. Milton, K. Hunter-gatherer diets—A different perspective. Am. J. Clin. Nutr. 2000, 71, 665–667. [CrossRef] [PubMed]3. Wrangham, R.; Conklin-Brittain, N. Cooking as a biological trait. Comp. Biochem. Physiol. Mol. Integr. Physiol. 2003, 136, 35–46.
[CrossRef]4. Wrangham, R.; Cheney, D.; Seyfarth, R.; Sarmiento, E. Shallow-water habitats as sources of fallback foods for hominins. Am. J.
Phys. Anthropol. 2009, 140, 630–642. [CrossRef] [PubMed]5. Konner, M.; Eaton, S.B. Paleolithic nutrition: Twenty-five years later. Nutr. Clin. Pract. 2010, 25, 594–602. [CrossRef]

Nutrients 2021, 13, 1019 53 of 56
6. Eaton, S.B.; Eaton, S.B. Paleolithic vs. modern diets-selected pathophysiological implications. Eur. J. Nutr. 2000, 39, 67–70.[CrossRef] [PubMed]
7. Cordain, L.; Miller, J.B.; Eaton, S.B.; Mann, N. Macronutrient estimations in hunter-gatherer diets. Am. J. Clin. Nutr. 2000, 72,1589–1592. [CrossRef]
8. Ugent, D.; Dillehay, T.; Ramírez, C. Potato remains from a late pleistocene settlement in southcentral Chile. Econ. Bot. 1987, 41,17–27. [CrossRef]
9. Mercader, J. Mozambican Grass Seed Consumption during the Middle Stone Age. Science 2009, 326, 1680–1683. [CrossRef]10. Henry, A.G.; Brooks, A.S.; Piperno, D.R. Microfossils in calculus demonstrate consumption of plants and cooked foods in
Neanderthal diets. Proc. Natl. Acad. Sci. USA 2011, 108, 486–491. [CrossRef] [PubMed]11. Henry, A.G.; Ungar, P.S.; Passey, B.H.; Sponheimer, M.; Rossouw, L.; Bamford, M.K.; Sandberg, P.A.; De Ruiter, D.J.; Berger, L.R.
The diet of Australopithecus sediba. Nat. Cell Biol. 2012, 487, 90–93. [CrossRef]12. Revedin, A.; Aranguren, B.; Becattini, R.; Longo, L.; Marconi, E.; Lippi, M.M.; Skakun, N.; Sinitsyn, A.; Spiridonova, E.; Svoboda,
J. Thirty thousand-year-old evidence of plant food processing. Proc. Natl. Acad. Sci. USA 2010, 107, 18815–18819. [CrossRef][PubMed]
13. Turner, B.L.; Thompson, A.L. Beyond the Paleolithic prescription: Incorporating diversity and flexibility in the study of humandiet evolution. Nutr. Rev. 2013, 71, 501–510. [CrossRef] [PubMed]
14. Holden, C.; Mace, R. Phylogenetic analysis of the evolution of lactose digestion in adults. Hum. Biol. 1997, 69, 606–628. [CrossRef][PubMed]
15. Knight, C. Most people are simply not designed to eat pasta: Evolutionary explanations for obesity in the low carbohydrate dietmovement. Public Underst. Sci. 2011, 20, 706–719. [CrossRef]
16. Perry, G.H.; Dominy, N.J.; Claw, K.G.; Lee, A.S.; Fiegler, H.; Redon, R.; Werner, J.; Villanea, F.A.; Mountain, J.L.; Misra, R.; et al.Diet and the evolution of human amylase gene copy number variation. Nat. Genet. 2007, 39, 1256–1260. [CrossRef] [PubMed]
17. De Menezes, E.V.A.; Sampaio, H.A.D.C.; Carioca, A.A.F.; Parente, N.A.; Brito, F.O.; Moreira, T.M.M.; De Souza, A.C.C.; Arruda,S.P.M. Influence of Paleolithic diet on anthropometric markers in chronic diseases: Systematic review and meta-analysis. Nutr. J.2019, 18, 41. [CrossRef]
18. Frassetto, L.A.; Schloetter, M.; Mietus-Snyder, M.; Morris, R.C.; Sebastian, A. Metabolic and physiologic improvements fromconsuming a Paleolithic, hunter-gatherer type diet. Eur. J. Clin. Nutr. 2009, 63, 947–955. [CrossRef]
19. Jabr, F. How to Really Eat Like a Hunter-Gatherer: Why the Paleo Diet Is Half-Baked. Scientific American. 2013. Availableonline: https://www.scientificamerican.com/article/why-paleo-diet-half-baked-how-hunter-gatherer-really-eat/ (accessedon 24 February 2021).
20. Zuk, M. Paleofantasy: What Evolution Really Tells Us about Sex, Diet, and How We Live; WW Norton & Co.: New York, NY, USA,2013; pp. 52–65.
21. Eaton, S.B.; Konner, M.; Shostak, M. Stone Agers in the fast lane: Chronic degenerative diseases in evolutionary perspective. Am.J. Med. 1988, 84, 739–749. [CrossRef]
22. Cohen, M. Health and the Rise of Civilization; Yale University Press: New Haven, CT, USA, 1989; pp. 131–141.23. Jansson, B. Dietary, total body, and intracellular potassium-to-sodium ratios and their influence on cancer. Cancer Detect. Prev.
1990, 14, 563–565.24. Eaton, S.; Cordain, L. Evolutionary Aspects of Diet: Old Genes, New Fuels. World Rev. Nutr. Diet. 1997, 81, 26–37. [CrossRef]25. O’Keefe, H.; Cordain, L. Cardiovascular disease resulting from a diet and lifestyle at odds with our Paleolithic genome: How to
become a 21st-century hunter-gatherer. Mayo Clin. Proc. 2004, 79, 101–108. [CrossRef] [PubMed]26. Cordain, L.; Eaton, S.B.; Sebastian, A.; Mann, N.; Lindeberg, S.; Watkins, B.A.; O’Keefe, J.H.; Brand-Miller, J. Origins and evolution
of the Western diet: Health implications for the 21st century. Am. J. Clin. Nutr. 2005, 81, 341–354. [CrossRef] [PubMed]27. Sebastian, A.; Frassetto, L.A.; Sellmeyer, D.E.; Merriam, R.L.; Morris, R.C., Jr. Estimation of the net acid load of the diet of
ancestral preagricultural Homo sapiens and their hominid ancestors. Am. J. Clin. Nutr. 2002, 76, 1308–1316. [CrossRef] [PubMed]28. Lindeberg, S.; Jonsson, T.; Granfeldt, Y.; Borgstrand, E.; Soffman, J.; Sjostrom, K.; Ahren, B. A Palaeolithic diet improves glucose
tolerance more than a Mediterranean-like diet in individuals with ischemic heart disease. Diabetologia 2007, 50, 1795–1807.[CrossRef] [PubMed]
29. Irish, A.K.; Erickson, C.M.; Wahls, T.L.; Snetselaar, L.G.; Darling, W.G. Randomized control trial evaluation of a modifed Paleolithicdietary intervention in the treatment of relapsing-remitting multiple sclerosis: A pilot study. Degener. Neurol. Neuromuscul. Dis.2017, 7, 1–18.
30. Kidd, P.M. Neurodegeneration from mitochondrial insufficiency: Nutrients, stem cells, growth factors, and prospects for brainrebuilding using integrative management. Altern. Med. Rev. J. Clin. Ther. 2005, 10, 268–293.
31. Torkildsen, Ø.; Løken-Amsrud, K.I.; Wergeland, S.; Holmøy, T.; Myhr, K.-M. Fat-soluble vitamins as disease modulators inmultiple sclerosis. Acta Neurol. Scand. 2013, 196, 16–23. [CrossRef]
32. Sanoobar, M.; Dehghan, P.; Khalili, M.; Azimi, A.; Seifar, F. Coenzyme Q10 as a treatment for fatigue and depression in multiplesclerosis patients: A double blind randomized clinical trial. Nutr. Neurosci. 2016, 19, 138–143. [CrossRef]
33. Eaton, S.B.; Eaton, S.B., III; Sinclair, A.J.; Cordain, L.; Mann, N.J. Dietary intake of long-chain polyunsaturated fatty acids duringthe Paleolithic. World. Rev. Nutr. Diet. 1998, 83, 12–23.

Nutrients 2021, 13, 1019 54 of 56
34. Kuipers, R.S.; Luxwolda, M.F.; Dijck-Brouwer, D.A.J.; Eaton, S.B.; Crawford, M.A.; Cordain, L.; Muskiet, F.A.J. Estimatedmacronutrient and fatty acid intakes from an East African Paleolithic diet. Br. J. Nutr. 2010, 104, 1666–1687. [CrossRef]
35. Cordain, L.; Friel, J. The Paleo Diet for Athletes: The Ancient Nutritional Formula for Peak Athletic Performance; Rodale Books: Emmaus,PA, USA, 2012.
36. Holt, S.H.; Miller, J.C.; Petocz, P.; Farmakalidis, E. A satiety index of common foods. Eur. J. Clin. Nutr. 1995, 49, 675–690.37. Ryberg, M.; Sandberg, S.; Mellberg, C.; Stegle, O.; Lindahl, B.; Larsson, C.; Hauksson, J.; Olsson, T. A Palaeolithic-type diet
causes strong tissue-specific effects on ectopic fat deposition in obese postmenopausal women. J. Intern. Med. 2013, 274, 67–76.[CrossRef]
38. Accurso, A.; Bernstein, R.K.; Dahlqvist, A.; Draznin, B.; Feinman, R.D.; Fine, E.J.; Gleed, A.; Jacobs, D.B.; Larson, G.;Lustig, R.H.; et al. Dietary carbohydrate restriction in type 2 diabetes mellitus and metabolic syndrome: Time for a criticalappraisal. Nutr. Metab. 2008, 5, 8. [CrossRef] [PubMed]
39. Pastore, R.L.; Brooks, J.T.; Carbone, J.W. Paleolithic nutrition improves plasma lipid concentrations of hypercholesterolemicadults to a greater extent than traditional heart-healthy dietary recommendations. Nutr. Res. 2015, 35, 474–479. [CrossRef]
40. Boraxbekk, C.-J.; Stomby, A.; Ryberg, M.; Lindahl, B.; Larsson, C.; Nyberg, L.; Olsson, T. Diet-Induced Weight Loss AltersFunctional Brain Responses during an Episodic Memory Task. Obes. Facts 2015, 8, 261–272. [CrossRef]
41. Otten, J.; Mellberg, C.; Ryberg, M.; Sandberg, S.; Kullberg, J.; Lindahl, B.; Larsson, C.; Hauksson, J.; Olsson, T. Strong andpersistent effect on liver fat with a Paleolithic diet during a two-year intervention. Int. J. Obes. 2016, 40, 747–753. [CrossRef]
42. Otten, J.; Stomby, A.; Waling, M.; Isaksson, A.; Tellström, A.; Lundin-Olsson, L.; Brage, S.; Ryberg, M.; Svensson, M.; Olsson, T.Benefits of a Paleolithic diet with and without supervised exercise on fat mass, insulin sensitivity, and glycemic control: Arandomized controlled trial in individuals with type 2 diabetes. Diabetes Metab. Res. Rev. 2017, 33, e2828. [CrossRef] [PubMed]
43. Otten, J.; Stomby, A.; Waling, M.; Isaksson, A.; Söderström, I.; Ryberg, M.; Svensson, M.; Hauksson, J.; Olsson, T. A heterogeneousresponse of liver and skeletal muscle fatt the combination of a Paleolithic diet and exercise in obese individuals with type 2diabetes: A randomized controlled trial. Diabetes 2018, 61, 1548–1559.
44. Otten, J.; Andersson, J.; Ståhl, J.; Stomby, A.; Saleh, A.; Waling, M.; Ryberg, M.; Hauksson, J.; Svensson, M.; Johansson, B.; et al.Exercise Training Adds Cardiometabolic Benefits of a Paleolithic Diet in Type 2 Diabetes Mellitus. J. Am. Heart Assoc. 2019, 8,e010634. [CrossRef] [PubMed]
45. Andersson, J.; Mellberg, C.; Otten, J.; Ryberg, M.; Rinnström, D.; Larsson, C.; Lindahl, B.; Hauksson, J.; Johansson, B.; Olsson, T.Left ventricular remodeling changes without concomitant loss of myocardial fat after long-term dietary intervention. Int. J.Cardiol. 2016, 216, 92–96. [CrossRef] [PubMed]
46. Stomby, A.; Simonyte, K.; Mellberg, C.; Ryberg, M.; Stimson, R.H.; Larsson, C.; Lindahl, B.; Andrew, R.; Walker, B.R.; Olsson, T.Diet-induced weight loss has chronic tissue-specific effects on glucocorticoid metabolism in overweight postmenopausal women.Int. J. Obes. 2015, 39, 814–819. [CrossRef] [PubMed]
47. Blomquist, C.; Alvehus, M.; Burén, J.; Ryberg, M.; Larsson, C.; Lindahl, B.; Mellberg, C.; Söderström, I.; Chorell, E.; Olsson, T.Attenuated Low-Grade Inflammation Following Long-Term Dietary Intervention in Postmenopausal Women with Obesity.Obesesity 2017, 25, 892–900. [CrossRef]
48. Blomquist, C.; Chorell, E.; Ryberg, M.; Mellberg, C.; Worrsjö, E.; Makoveichuk, E.; Larsson, C.; Lindahl, B.; Olivecrona, G.;Olsson, T. Decreased lipogenesis-promoting factors in adipose tissue in postmenopausal women with overweight on a Paleolithic-type diet. Eur. J. Nutr. 2018, 57, 2877–2886. [CrossRef] [PubMed]
49. Mellberg, C.; Sandberg, S.; Ryberg, M.; Eriksson, M.; Brage, S.; Larsson, C.; Olsson, T.; Lindahl, B. Long-term effects of aPalaeolithic-type diet in obese postmenopausal women: A 2-year randomized trial. Eur. J. Clin. Nutr. 2014, 68, 350–357.[CrossRef]
50. Stomby, A.; Otten, J.; Ryberg, M.; Nyberg, L.; Olsson, T.; Boraxbekk, C.-J. A Paleolithic Diet with and without Combined Aerobicand Resistance Exercise Increases Functional Brain Responses and Hippocampal Volume in Subjects with Type 2 Diabetes. Front.Aging Neurosci. 2017, 9, 391. [CrossRef]
51. Fontes-Villalba, M.; Lindeberg, S.; Granfeldt, Y.; Knop, F.K.; Memon, A.A.; Carrera-Bastos, P.; Picazo, Ó.; Chanrai, M.; Sunquist, J.;Sundquist, K.; et al. Palaeolithic diet decreases fasting plasma leptin concentrations more than a diabetes diet in patients withtype 2 diabetes: A randomised cross-over trial. Cardiovasc. Diabetol. 2016, 15, 80. [CrossRef]
52. Masharani, U.; Sherchan, P.; Schloetter, M.; Stratford, S.; Xiao, A.; Sebastian, A.; Nolte Kennedy, M.; Frassetto, L. Metabolicand physiologic effects from consuming a hunter-gatherer (Paleolithic)-type diet in type 2 diabetes. Eur. J. Clin. Nutr. 2015, 69,944–948. [CrossRef]
53. Boers, I.; Muskiet, F.A.; Berkelaar, E.; Schut, E.; Penders, R.; Hoenderdos, K.; Wichers, H.J.; Jong, M.C. Favourable effects ofconsuming a Palaeolithic-type diet on characteristics of the metabolic syndrome: A randomized controlled pilot-study. LipidsHealth Dis. 2014, 13, 160. [CrossRef]
54. Genoni, J.L.; Lyons-Wall, P.; Devine, A. Cardiovascular, metabolic effects and dietary composition of ad- libitum Paleolithic vs.Australian Guide to Healthy Eating Diets in Healthy Women: A 4-week randomized trial. Nutrients 2016, 8, 314. [CrossRef]
55. Smith, M.M.; Trexler, E.T.; Sommer, A.J.; Starkoff, B.E.; Devor, S.T. Unrestricted Paleolithic diet is associated with unfavorablechanges to blood lipids in healthy subjects. Int. J. Exerc. Sci. 2014, 7, 128–139.
56. Österdahl, M.; Kocturk, T.; Koochek, A.; Wändell, P. Effects of a short-term intervention with a Paleolithic diet in healthyvolunteers. Eur. J. Clin. Nutr. 2008, 62, 682–685. [CrossRef]

Nutrients 2021, 13, 1019 55 of 56
57. Bolla, A.M.; Caretto, A.; Laurenzi, A.; Scavini, M.; Piemonti, L. Low-Carb and Ketogenic Diets in Type 1 and Type 2 Diabetes.Nutrients 2019, 11, 962. [CrossRef] [PubMed]
58. Chang, C.-K.; Borer, K.; Lin, P.-J. Low-Carbohydrate-High-Fat Diet: Can it Help Exercise Performance? J. Hum. Kinet. 2017, 56,81–92. [CrossRef] [PubMed]
59. Paoli, A.; Rubini, A.; Volek, J.S.; Grimaldi, K.A. Beyond weight loss: A review of the therapeutic uses of vary-low-carbohydrate(ketogenic) diets. Eur. J. Clin. Nutr. 2013, 67, 789–796. [CrossRef]
60. Retelny, V.S. Can Extremely Fat-Restricted or High-Fat Diets Be Effective-and Safe-for Weight Loss? Food Nutr. 2015. Availableonline: www.foodandnutrition.org/January-February-2016/Oil-Free-Plant-based-Diet-Versus-Ketogenic-Diet/ (accessed on21 June 2017).
61. Burke, L.M.; Hawley, J.A. Effects of short-term fat adaptation on metabolism and performance of prolonged exercise. Med. Sci.Sports Exerc. 2002, 13, 1–21. [CrossRef] [PubMed]
62. Zinn, C.; Wood, M.; Williden, M.; Chatterton, S.; Maunder, E. Ketogenic diet benefits body composition and well-being but notperformance in a pilot case study of New Zealand endurance athletes. J. Int. Soc. Sports Nutr. 2017, 14, 1–9. [CrossRef]
63. Walker, J.L.; Heigenhauser, G.J.F.; Hultman, E.; Spriet, L.L. Dietary carbohydrate, muscle glycogen content, and enduranceperformance in well-trained women. J. Appl. Physiol. 2000, 88, 2151–2158. [CrossRef]
64. Rhyu, H.-S.; Cho, S.-Y. The effect of weight loss by ketogenic diet on the body composition, performance-related physical fitnessfactors and cytokines of Taekwondo athletes. J. Exerc. Rehabil. 2014, 10, 326–331. [CrossRef]
65. Volek, J.S.; Freidenreich, D.J.; Saenz, C.; Kunces, L.J.; Creighton, B.C.; Bartley, J.M. Metabolic characteristics of keto-adapted ultra-endurance runners. Metabolism 2016, 65, 100–110. [CrossRef]
66. Zajac, A.; Poprzecki, S.; Maszczyk, A.; Czuba, M.; Michalczyk, M.; Zydek, G. The Effects of a Ketogenic Diet on ExerciseMetabolism and Physical Performance in Off-Road Cyclists. Nutrients 2014, 6, 2493–2508. [CrossRef] [PubMed]
67. Bujko, J.; Kowalski, Ł.M. The question of ergogenic potential of the Paleolithic diet. Trends Sport Sci. 2014, 21, 213–219.68. Popp, C.J.; Brown, M.M.B.; Bridges, W.C.; Jesch, E.D. The Effectiveness of MyPlate and Paleolithic-based Diet Recommendations,
both with and without Exercise, on Aerobic Fitness, Muscular Strength and Anaerobic Power in Young Women: A RandomizedClinical Trial. Int. J. Exerc. Sci. 2018, 11, 921–933. [PubMed]
69. Manousou, S.; Stål, M.; Larsson, C.; Mellberg, C.; Lindahl, B.; Eggertsen, R.; Hulthén, L.; Olsson, T.; Ryberg, M.; Sandberg, S.; et al.A Paleolithic-type diet results in iodine deficiency: A 2-year randomized trial in postmenopausal obese women. Eur. J. Clin. Nutr.2018, 72, 124–129. [CrossRef]
70. Tufanaru, C.; Munn, Z.; Stephenson, M.; Aromataris, E. Fixed or random effects meta-analysis? Common methodological issuesin systematic reviews of effectiveness. Int. J. Evid. Based Health 2015, 13, 196–207. [CrossRef]
71. Markofski, M.M.; Jennings, K.; Dolan, C.; Davies, N.A.; LaVoy, E.C.; Ryan, E.J.; Carrillo, A.E. Single-Arm 8-Week Ad LibitumSelf-Prepared Paleo Diet Reduces Cardiometabolic Disease Risk Factors in Overweight Adults. Am. J. Lifestyle Med. 2019.[CrossRef]
72. Bisht, B.; Darling, W.G.; White, E.C.; White, K.A.; Shivapour, E.T.; Zimmerman, M.B.; Wahls, T.L. Effects of a multimodalintervention on gait andbalance of subjects with progressive multiple sclerosis: A prospective longitudinal pilot study. Degener.Neurol. Neuromuscul. Dis. 2017, 7, 79–93.
73. Melnik, B.C.; John, S.M.; Schmitz, G. Over-stimulation of insulin/IGF-1 signaling by western diet may promote diseases ofcivilization: Lessons learnt from laron syndrome. Nutr. Metab. 2011, 8, 41. [CrossRef]
74. Melnik, B.C.; John, S.M.; Carrera-Bastos, P.; Cordain, L. The impact of cow’s milk-mediated mTORC1-signaling in the initiationand progression of prostate cancer. Nutr. Metab. 2012, 9, 74–93. [CrossRef]
75. Ghaedi, E.; Mohammadi, M.; Mohammadi, H.; Ramezani-Jolfaie, N.; Malekzadeh, J.; Hosseinzadeh, M.; Salehi-Abargouei, A.Effects of a Paleolithic Diet on Cardiovascular Disease Risk Factors: A Systematic Review and Meta-Analysis of RandomizedControlled Trials. Adv. Nutr. 2019, 10, 634–646. [CrossRef]
76. Manheimer, E.W.; van Zuuren, E.J.; Fedorowicz, Z.; Pijl, H. Paleolithic nutrition for metabolic syndrome: Systematic review andmeta-analysis. Am. J. Clin. Nutr. 2015, 102, 922–932. [CrossRef] [PubMed]
77. Jönsson, T.; Granfeldt, Y.; Lindeberg, S.; Hallberg, A.-C. Subjective satiety and other experiences of a Paleolithic diet compared toa diabetes diet in patients with type 2 diabetes. Nutr. J. 2013, 12, 105. [CrossRef] [PubMed]
78. Jönsson, T.; Granfeldt, Y.; Ahrén, B.; Branell, U.-C.; Pålsson, G.; Hansson, A.; Söderström, M.; Lindeberg, S. Beneficial effects of aPaleolithic diet on cardiovascular risk factors in type 2 diabetes: A randomized cross-over pilot study. Cardiovasc. Diabetol. 2009,8, 35. [CrossRef] [PubMed]
79. Bueno, N.B.; de Melo, I.S.V.; de Oliveira, S.L.; da Rocha Ataide, T. Very-low-carbohydrate ketogenic diet v. low-fat diet forlong-term weight loss: A meta-analysis of randomized controlled trials. Br. J. Nutr. 2013, 110, 1178–1187. [CrossRef] [PubMed]
80. Brown, G.; Swendener, A.; Shaw, B.; Shaw, I. Comparison of anthropometric and metabolic responses to a short-term carbohydraterestricted diet and exercise versus a traditional diet and exercise. Afr. J. Phys. Health Educ. Recreat. Dance 2010, 16, 535–544.[CrossRef]
81. Hession, M.; Rolland, C.; Kulkarni, U.; Wise, A.; Broom, J. Systematic review of randomized controlled trials of low-carbohydratevs. low-fat/low-calorie diets in the management of obesity and its comorbidities. Obes. Rev. 2009, 10, 36–50. [CrossRef]
Nutrients 2021, 13, 1019 56 of 56
82. Hu, T.; Mills, K.T.; Yao, L.; Demanelis, K.; Eloustaz, M.; Yancy, W.J., Jr.; Kelly, T.N.; He, J.; Bazzano, L.A. Effects of low-carbohydratediets versus low-fat diets on metabolic risk factors: A meta-analysis of randomized controlled clinical trials. Am. J. Epidemiol.2012, 176, 44–54. [CrossRef]
83. Palmer, B.F.; Clegg, D.J. Achieving the Benefits of a High-Potassium, Paleolithic Diet, Without the Toxicity. Mayo Clin. Proc. 2016,91, 496–508. [CrossRef]
84. Jamka, M.; Kulczynski, B.; Juruc, A.; Gramza-Michałowska, A.; Stokes, C.S.; Walkowiak, J. The Effect of the Paleolithic Diet vs.Healthy Diets on Glucose and Insulin Homeostasis: A systematic review and meta-analysis of randomized controlled trials. J.Clin. Med. 2020, 9, 296. [CrossRef]
85. Dinu, M.; Pagliai, G.; Angelino, D.; Rosi, A.; Dall’Asta, M.; Bresciani, L.; Ferraris, C.; Guglielmetti, M.; Godos, J.; Del Bo’, C.; et al.Effects of Popular Diets on Anthropometric and Cardiometabolic Parameters: An Umbrella Review of Meta-Analyses ofRandomized Controlled Trials. Adv. Nutr. 2020, 11, 815–833. [CrossRef]
86. Paoli, A.; Grimaldi, K.; D’Agostino, D.; Cenci, L.; Moro, T.; Bianco, A.; Palma, A. Ketogenic diet does not affect strengthperformance in elite artistic gymnasts. J. Int. Soc. Sports Nutr. 2012, 9, 34. [CrossRef]
87. Michalczyk, M.; Zajac, A.; Mikolajec, K.; Zydek, G.; Langfort, J. No Modification in Blood Lipoprotein Concentration but Changesin Body Composition After 4 Weeks of Low Carbohydrate Diet (LCD) Followed by 7 Days of Carbohydrate Loading in BasketballPlayers. J. Hum. Kinet. 2018, 65, 125–137. [CrossRef] [PubMed]
88. Antonio, J.; Ellerbroek, A.; Silver, T.; Vargas, L.; Peacock, C.A. The effects of a high protein diet on indices of health and bodycomposition—A crossover trial in resistance-trained men. J. Int. Soc. Sports Nutr. 2016, 13, 41–54. [CrossRef]
89. Kang, J.; Ratamess, N.A.; Faigenbaum, A.D.; Bush, J.A. Ergogenic Properties of Ketogenic Diets in Normal-Weight Individuals: ASystematic Review. J. Am. Coll. Nutr. 2020, 39, 665–675. [CrossRef]
90. Paoli, A.; Bianco, A.; Grimaldi, K.A. The ketogenic diet and sport: A possible marriage? Exerc. Sport Sci. Rev. 2015, 43, 153–162.[CrossRef]
91. Bazzano, L.A.; Hu, T.; Reynolds, K.; Yao, L.; Bunol, C.; Liu, Y.; Chen, C.S.; Klag, M.J.; Whelton, P.K.; He, J. Effects of low-carbohydrate and low-fat diets: A randomized trial. Ann. Intern. Med. 2014, 161, 309–318. [CrossRef] [PubMed]
92. McSwiney, F.T.; Wardrop, B.; Hyde, P.N.; Lafountain, R.A.; Volek, J.S.; Doyle, L. Keto-adaptation enhances exercise performanceand body composition responses to training in endurance athletes. Metabolism 2018, 8, 25–34. [CrossRef] [PubMed]
93. Sawyer, J.C.; Wood, R.J.; Davidson, P.W.; Collins, S.M.; Matthews, T.D.; Gregory, S.M.; Paolone, V.J. Effects of a Short-TermCarbohydrate-Restricted Diet on Strength and Power Performance. J. Strength Cond. Res. 2013, 27, 2255–2262. [CrossRef]
94. McSwiney, F.T.; Fusco, B.; McCabe, L.; Lombard, A.; Crowley, P.; Walsh, J.; Hone, M.; Egan, B. Changes in body composition andsubstrate utilization after a short- term ketogenic diet in endurance- trained males. Biol. Sport 2021, 38, 145–152. [CrossRef]
95. Vargas, S.; Romance, R.; Petro, J.L.; Bonilla, D.A.; Galancho, I.; Espinar, S.; Kreider, R.B.; Benitez-Pores, J. efficacy of ketogenic dieton body composition during resistance training in trained men: A randomized controlled trail. J. Int. Soc. Sports Nutr. 2018, 15,31. [CrossRef]
96. Phinney, S.D. Ketogenic diets and physical performance. Nutr. Metab. 2004, 1, 2. [CrossRef]97. Waldman, H.S.; Krings, B.M.; Basham, S.A.; Smith, J.E.W.; Fountain, B.J.; McAllister, M.J. Effects of a 15-Day Low Carbohydrate,
High-Fat Diet in Resistance-Trained Men. J. Strength Cond. Res. 2018, 32, 3103–3111. [CrossRef]98. Bergman, B.C.; Butterfield, G.E.; Wolfel, E.E.; Lopaschuk, G.D.; Casazza, G.A.; Horning, M.A.; Brooks, G.A. Muscle net glucose
uptake and glucose kinetics after endurance training in men. Am. J. Physiol. Content 1999, 277, E81–E92. [CrossRef]99. Westman, E.C.; Feinman, R.D.; Mavropoulos, J.C.; Vernon, M.C.; Volek, J.S.; Wortman, J.A.; Yancy, W.S.; Phinney, S.D. Low-
carbohydrate nutrition and metabolism. Am. J. Clin. Nutr. 2007, 86, 276–284. [CrossRef] [PubMed]100. Burke, L.M.; Van Loon, L.J.C.; Hawley, J.A. Postexercise muscle glycogen resynthesis in humans. J. Appl. Physiol. 2017, 122,
1055–1067. [CrossRef]101. Philp, A.; Hargreaves, M.; Baar, K. More than a store: Regulatory roles for glycogen in skeletal muscle adaptation to exercise. Am.
J. Physiol. Endocrinol. Metab. 2012, 302, E1343–E1351. [CrossRef]102. Phillips, S.M. A Brief Review of Critical Processes in Exercise-Induced Muscular Hypertrophy. Sports Med. 2014, 44, 71–77.
[CrossRef] [PubMed]103. Creer, A.; Gallagher, P.; Slivka, D.; Jemiolo, B.; Fink, W.; Trappe, S. Influence of muscle glycogen availability on ERK1/2 and Akt
signaling after resistance exercise in human skeletal muscle. J. Appl. Physiol. 2005, 99, 950–956. [CrossRef] [PubMed]104. Bailey, C.P.; Hennessy, E. A review of the ketogenic diet for endurance athletes: Performance enhancer or placebo effect? J. Int.
Soc. Sports Nutr. 2020, 17, 33. [CrossRef]105. Bartlett, J.D.; Hawley, J.A.; Morton, J.P. Carbohydrate availability and exercise training adaptation: Too much of a good thing?
Eur. J. Sport Sci. 2015, 15, 3–12. [CrossRef]106. Phinney, S.; Bistrian, B.; Evans, W.; Gervino, E.; Blackburn, G. The human metabolic response to chronic ketosis without caloric
restriction: Preservation of submaximal exercise capability with reduced carbohydrate oxidation. Metabolism 1983, 32, 769–776.[CrossRef]
107. Shaw, D.M.; Merien, F.; Braakhuis, A.; Maunder, E.D.; Dulson, D.K. Effect of a Ketogenic Diet on Submaximal Exercise Capacityand Efficiency in Runners. Med. Sci. Sports Exerc. 2019, 51, 2135–2146. [CrossRef] [PubMed]