P-Series Power Meter/Sensor LTE Measurement - TestEquity
17
Agilent Technologies P-Series Power Meter/Sensor LTE Measurement Technical Overview with Self-Guided Demonstration Guide
-
Upload
khangminh22 -
Category
Documents
-
view
1 -
download
0
Transcript of P-Series Power Meter/Sensor LTE Measurement - TestEquity

Agilent Technologies
P-Series Power Meter/Sensor LTE Measurement
Technical Overview with Self-Guided Demonstration Guide

2
Accelerate your LTE Signal Burst Power Measurement with Agilent P-Series Power Meter/Sensor
Using the industry’s latest development technology, the long term evolution
(LTE) standard from the 3rd Generation Partnership Project (3GPP) is deployed
all around the world. The complexity of the LTE system requires comprehensive
signal and modulation analysis as well as RF power measurement. The Agilent
P-Series power meter/sensor makes it possible to measure the sub-frame
signal of time-division-duplex (LTE-TDD) and average burst power signal of
frequency-division-duplex (LTE-FDD) with built-in LTE predefined measurement
setup and statistical complementary cumulative distribution function (CCDF)
measurement.
This document explains how to generate LTE-TDD and LTE-FDD signals using
Agilent N7624B/N7625A Signal Studio software along with Agilent ESG Vector
Signal Generator. A step-by-step guide demonstrates time-gated/average burst
signal measurement as well as CCDF measurement for LTE-TDD and LTE-FDD
signals using Agilent P-Series power meter and sensor.
Introduction
The combination of N1911A/12A P-Series power meters and N1921A/22A
wideband power sensors can quickly and accurately measure peak, average,
peak-to-average ratio power measurement, rise/fall time, pulse width, and
complementary cumulative distribution function (CCDF) statistical data for
wideband signals.
The 30 MHz video bandwidth and 100 x 106 samples per second sampling rate
of the P-Series power meter make it possible to capture signals with high crest
factor and fast transition times which is the characteristic of LTE signals. The
diode-based P-Series power sensor offers a higher frequency range of up to
40 GHz and wider dynamic range of up to 55 dB for better sensitivity to enable
reliable measurements of peak and average burst power.
Further simplifying measurement set up, the one-button predefined preset LTE
setup of the P-Series power meter reduces the setup time required to capture
the signal effectively. By following a few easy steps, you can use the P-Series
power meter/sensor to obtain power versus time (PvT) measurement and
statistical CCDF for LTE-TDD and LTE-FDD signals.
Introduction 2
Power versus Time (PvT)• 3
Complementary Cumulative •
Distribution Function
(CCDF)
4
LTE Overview 5
Demonstration Preparation 7
Part 1 : LTE-TDD Sub-Frame
Burst Power Measurement
Measuring Downlink •
Sub-Frame Burst Power
9
10
Measuring Uplink •
Sub-Frame Burst Power
12
Part 2 : LTE-TDD CCDF Power
Statistical Measurement
13
Part 3 : LTE-FDD Average
Burst Power Measurement
15
Conclusion 16
Ordering Information 16
Related Agilent Literature 16
Reference 16
Related Web Resorces 16
Contents

3
Power versus Time (PvT)
Power level transmission is an important LTE conformance specification. It is
defined as the time-average power over the useful period of a downlink or uplink
subframe burst. Peak-to-average power can also be obtained during this period.
To make accurate and stable measurements, it is important that the power
meter is able to capture the desired complete subframe consistently within
the fixed timeframe. This can be achieved by applying a proper time-triggering
mechanisms, such as trigger level, holdoff, and delay, which are available in the
P-Series power meters.
The trigger level of a P-Series power meter is typically set at auto-level. Trigger
holdoff ensures that the acquisition will not occur until the holdoff time has
passed and a valid trigger is found. This is very useful for burst signals that have
amplitude variations, because these variations can cause false triggering.
Trigger delay allows measurement of different signals. By just changing the
delay setting of the power meter, you can make a power measurement of the
next subframe.
Furthermore, the P-Series power meter is optimized to operate in the trace
display when measuring a burst signal. Downlink or uplink subframe burst
signals can be captured via time-gated methodology by applying the markers
(1 & 2) of the trace.
Figure 1. Burst power signal structure without constant duty cycle. In the P-Series power
meter, green lines (Marker 1 and Marker 2) are indicate the start and end burst sub-frame
signal power measurement.
Burst power signal
Duty cycle

4
Complementary Cumulative Distribution Function (CCDF)
The complementary cumulative distribution function (CCDF) is a plot of
probability versus peak-to-average (PAR), which characterizes the statistical
power of a signal. CCDF is one of the important measurements in designing
LTE power amplifiers that must be capable of handling high PAR signal exhibits
while constantly maintaining good adjacent-channel leakage performance.
The CCDF plot is primarily used in the wireless communication market for
evaluating multicarrier power amplifier performance. It measures the percentage
of time when the PAR is at or exceeds a specific power level.
Figure 2. CCDF plot shows the Y-axis represents the percentage of time the signal power
is at or exceeds the power specified by the X-axis

5
LTE Overview
LTE is the next major step in mobile
radio communications, and will be
introduced in 3GPP Release 8.
The LTE specifi cation provides a
framework for increasing capacity,
improving spectrum effi ciency,
improving coverage, and reducing
latency compared with current high
speed packet access (HSPA)
implementations. In addition,
transmission with multiple input and
multiple output (MIMO) antennas
will be supported for greater
throughput, as well as enhanced
capacity or range.
Key Attributes for LTE
Downlink capacity • – Peak data rates up to 172.8 Mbps with 20 MHz
bandwidth and 2x2 SU-MIMO
Uplink capacity• – Peak data rates up to 86.4 Mbps with 20 MHz bandwidth
and 64QAM
Spectrum flexibility• – Scalable bandwidth up to 20 MHz
Spectral efficiency• – Increased spectral efficiency over Release 6 HSPA by a
factor of two to four
Latency• – Sub-5 ms latency for small internet protocol (IP) packets
Mobility• – Optimized for low mobile speed from 0 to 15 km/h; higher mobile
speeds up to 120 km/h supported with high performance
Support for packet-switched domains only• .
Multiple Access Technology
Downlink and uplink transmission in LTE are based on the use of multiple
access technologies, specifically, orthogonal frequency division multiple access
(OFDMA) for downlink and single-carrier frequency division multiple access
(SC-FDMA) for the uplink.
Transmission Bandwidth
In order to address the international wireless market and regional spectrum
regulations, LTE allows selection of varying channel bandwidths, from 1.4 to
20 MHz, with sub-carrier spacing of 15 kHz. In the case of multimedia broadcast
multicast service (MBMS), a sub-carrier spacing of 7.5 kHz is also possible.
Sub-carrier spacing is constant regardless of channel bandwidth. To allow
for operation with differently sized spectrum allocations, the transmission
bandwidth is instead altered by varying the number of OFDM sub-carriers as
shown in Table 1.
Transmission bandwidth
for LTE FDD (MHz)
1.4 3 5 10 15 20
Number of sub-carriers 72 180 300 600 900 1200
Table 1: Number of sub-carriers for the different downlink and uplink transmission
bandwidths
This LTE overview information
provides a quick review of some of
the physical-layer characteristic of
an LTE signal. Please refer to the
Agilent 3GPP Long Term Evolution
application note, literature number
5989-8139EN, for in-depth LTE
technical information.

6
LTE Overview (continued)
Frame Structure
There are two radio frame structures for LTE: frame structure type 1 (FS1) for full
duplex and half duplex FDD, and frame structure type 2 (FS2) for TDD. The frame
structure for full duplex FDD is shown in Figure 3.
FS1 is optimized to co-exist with 3.84 Mbps UMTS system. This structure consists of
ten 1 ms sub-frames, each composed of two 0.5 ms slots, for total duration of 10 ms.
The FSQ is the same in the uplink and downlink in terms of frame, sub-frame, and
slot duration, although the allocation of the physical signals and channels is quite
different. Uplink and downlink transmission are separated in the frequency domain.
#0 #1 #2 #3 #18 #19
Figure 3. LTE frame structure type 1 (TS 36.211 V8.30)
Figure 4. LTE frame structure Type 2 (5 ms switch-point periodicity) (TS 36.211 V8.20)
One radio frame, Tf = 307200 T
s = 10 ms
One slot, Tslot
= 15360 Ts = 0.5 ms
One subframe
The structure of FS2 is much more flexible than the structure of FS1. An example
of an FS2 structure is shown in Figure 4. This example shows 5 ms switch-point
periodicity and it consists of two 5 ms half-frames for a total duration of 10 ms.
Sub-frames consist of either an uplink or downlink transmission or a special
sub-frame containing the downlink and uplink pilot timeslots (DwPTS and UpPTS)
separated by a transmission gap guard period (GP). The allocation of the sub-frames
for the uplink, downlink, and special sub-frames is determined by one of seven
different configurations. Sub-frames 0 and 5 are always downlink transmissions, and
sub-frame 1 is always a special sub-frame, but the composition of the other
sub-frames vary depending on the frame configuration.
One radio frame, Tf = 307200 T
s = 10 ms
One half-frame, 153600 Ts = ms
One slot,
Tslot
= 15360 Ts
30720 Ts
One subframe,
30720 Ts
DWPTS GP UPPTS DWPTS GP U
PPTS
Subframe #0 Subframe #2 Subframe #3 Subframe #4 Subframe #5 Subframe #7 Subframe #8 Subframe #9

7
Demonstration Preparation
These demonstrations focuses on
LTE measurements over a LAN
connection.
The following instruments and
software are used in this demo guide:
E4438C ESG vector signal •
generator[1]
N1911A/N1912A P-Series power •
meter
N1921A/1922A P-Series wideband •
power sensor
N7625A (for LTE-TDD) and N7624B •
(for LTE-FDD) Signal Studio
software[2]
Agilent Signal Studio is a Windows®
-
based utility software that simplifi es
creation of standard or customized
LTE waveform. With the Signal Studio
software, the desired LTE waveform
profi le can be confi gured and
downloaded into a signal generator,
and the signal generator will then
generate the waveform for testing.
To download and update instrument
fi rmware and software, visit:
www.agilent.com/find/wideband_•
powermeters
www.agilent.com/fi nd/esg•
www.agilent.com/fi nd/mxg•
www.agilent.com/fi nd/signlstudio•
Alternatively, you can use the N5182A MXG vector signal generator, fi rmware revision A.01.45 or later, frequency range option 503 or 506, and 1.
baseband generator option: 651 or 652.
N7625A is the LTE-TDD signal measurement PC platform software. For LTE-FDD signal measurement, N7624B can be used.2.
Product type Required option
ESG Vector Signal
Generator
E4438C firmware revision C.04.98 or later•
Frequency range option: 503 or 506•
Baseband generator option: 601 or 602•
P-Series Power Meter N1911A or N1912A firmware revision A.05.03 •
or later
P-Series Wideband Power
Sensor
N1921A or N1922A•
Signal Studio software N7625A version 1.1.2.0 or later (for LTE-TDD)•
N7624B version 7.5.0.1• or later (for LTE-FDD)
Agilent IO Libraries Suite IO Libraries Suite version 15.1 or later•
Controller PC for Signal
Studio
Install N7625A Signal Studio software for •
LTE-TDD or N7624B for LTE-FDD.
Refer to the online documentation for •
installation and setup.
Connecting the PC, ESG, and P-Series instructions
Connect the PC to the E4438C ESG signal generator via a LAN cable.1.
Launch the Agilent Connection Expert application (Agilent IO Libraries 2.
Suite) and verify the connection of the ESG signal generator.
Connect the P-Series power meter and sensor as shown in Figure 5.3.
Connect a BNC cable from the ESG signal generator’s rear-panel Event 1 to 4.
the rear panel Trig In of the P-Series power meter.
LAN on ESG
back panel
ESG signal
generator
Event 1
BNC CableTrig In
P-Series
Power Meter
P-Series
Power Sensor
Figure 5. P-Series power meter and ESG signal generator setup diagram

8
Establishing a communication link between EGS Signal Generator, Agilent IO Libraries Suite, and N7624B/N7625A Signal Studio software
Keystrokes surrounded by [ ]
represent front-panel keys of the
instruments, while keystrokes
surrounded by { } represent softkeys
of the instrument and software.
Instructions Keystrokes
On the ESG :
1. Set the instrument to its default
settings.
Press [Preset].
2. Check the IP address. Press [Utility] {GPIB/RS-232/LAN}
{LAN Setup}
If connecting to network, press • {LAN Confi g} {DHCP} {Proceed
With Reconfi guration} {Confi rm
Change (Instrument Will Reboot)}
If direct connection from PC to ESG, • press {LAN Confi g} {Manual}, enter
the appropriate IP Address, Subnet
Mask and Default Gateway. Press
{Proceed With Reconfi guration}
{Confi rm Change (Instrument Will
Reboot)}.
On Agilent IO Libraries Suit Software :
3. Start the Agilent IO Libraries
Suite.
Start > All Programs > Agilent IO
Libraries Suit > Agilent Connection
Expert.
4. Establish the LAN connection of
PC to ESG.
Right-click on LAN (TCPIO) and select
Add Instrument. Click on Auto Find.
Select the ESG LAN connection and
click OK.
On N7624B/N7625A Signal Studio software :
5. Start the Signal Studio for
LTE-TDD or LTE-FDD
Start > All Program > Agilent Signal
Studio > 3GPP LTE TDD > 3GPP LTE
TDD or 3GPP LTE FDD.
6. Confi gure the ESG as hardware
connected via LAN TCP/IP.
From the {System} pull-down menu at
the top of the Signal Studio program
window, select {Change Hardware
Connections}, {Next}, select {LAN} and
enter the hostname or IP address of the
ESG in the address is. Click {Test I/O
Connection} {Next}.
7. The software should return a
“success” connection status.
If connection is successful, click • {Finish}.
If connection is not successful, • verify the instrument connection
and the IP address or TCP/IP link.

9
Downloading LTE-TDD mode profi le into ESG Signal Generator
Most parameters are in their default
settings when Signal Studio is
launched. Values in bold indicate
modifi ed parameters.
Generate a downlink sub-frame signal
of LTE-TDD using N7625A Signal
Studio software along with ESG
vector signal generator.
You should see the burst power
measurement as shown in Figure
6. If you do not, make sure you
have downloaded the Signal Studio
waveform to the ESG and that the
ESG’s RF is turned ON [RF on/off].
Instructions Keystrokes
On N7625A Signal Studio software :
1. Set the basic parameters of the
Signal:
2 GHz frequency•
0 dBm Amplitude•
RF Output turned ON.•
In the view, select Instrument under
Hardware:
Set Frequency to 2 GHz
Set Amplitude = 0 dBm
RF Output = On
2. Set the LTE signal for
10 MHz LTE profi le and 16 QAM
modulation format.
In the tree view, select Carrier 1 under
Waveform Setup:
Under Channel Confi guration, from drop
down list, select Full fi lled 16QAM 10
MHz (50 RB).
3. Turn on downlink signal. In the tree view, select Downlink under
Carrier 1 Waveform Setup:
Under Cell Parameters, set State to On.
4. Turn off uplink signal. In the tree view, select Uplink under
Carrier 1 Waveform Setup:
Under Cell Parameters, set State to Off.
5. Download the signal to the ESG. Press Generate and Download button
on the top tool bar; if you encounter
any errors, please refer to the online help
of Signal Studio software.
Profi le setting
Part 1: LTE-TDD Sub-Frame Burst Power Measurement
Figure 6. Sub-frame duration 1.2 ms of downlink signal captured with N7625B Signal Studio software
10 ms frame duration
10
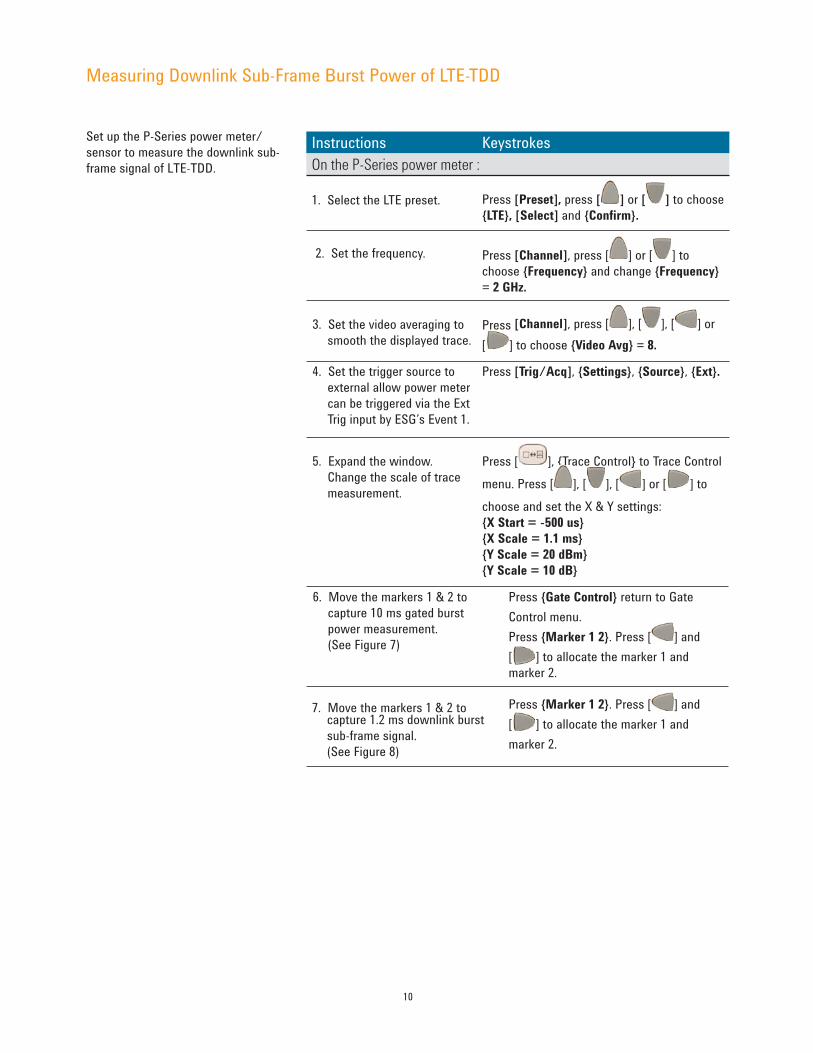
Instructions Keystrokes
On the P-Series power meter :
1. Select the LTE preset. Press [Preset], press [ ] or [ ] to choose
{LTE}, [Select] and {Confi rm}.
2. Set the frequency. Press [Channel], press [ ] or [ ] to
choose {Frequency} and change {Frequency}
= 2 GHz.
3. Set the video averaging to
smooth the displayed trace.Press [Channel], press [ ], [ ], [ ] or
[ ] to choose {Video Avg} = 8.
4. Set the trigger source to
external allow power meter
can be triggered via the Ext
Trig input by ESG’s Event 1.
Press [Trig/Acq], {Settings}, {Source}, {Ext}.
5. Expand the window.
Change the scale of trace
measurement.
Press [ ], {Trace Control} to Trace Control
menu. Press [ ], [ ], [ ] or [ ] to
choose and set the X & Y settings:
{X Start = -500 us}
{X Scale = 1.1 ms}
{Y Scale = 20 dBm}
{Y Scale = 10 dB}
Measuring Downlink Sub-Frame Burst Power of LTE-TDD
Set up the P-Series power meter/
sensor to measure the downlink sub-
frame signal of LTE-TDD.
6. Move the markers 1 & 2 to
capture 10 ms gated burst
power measurement.
(See Figure 7)
Press {Gate Control} return to Gate
Control menu.
Press {Marker 1 2}. Press [ ] and
[ ] to allocate the marker 1 and
marker 2.
7. Move the markers 1 & 2 to capture 1.2 ms downlink burst
sub-frame signal.
(See Figure 8)
Press {Marker 1 2}. Press [ ] and
[ ] to allocate the marker 1 and
marker 2.

11
Figure 7. LTE waveform duration at 10 ms in TDD mode. In the P-Series power meter,
green lines (Marker 1 and Marker 2) indicate the start and end burst waveform of the
signal.
Figure 8. Downlink average burst power signal measures -1.40 dBm at 1.2 ms sub-frame
duration. In the P-Series power meter, green lines (Marker 1 and Marker 2) indicate the
start and end burst sub-frame signal of the downlink.
Measuring Downlink Sub-Frame Burst Power of LTE-TDD (continued)

12
Instructions Software Requirements
On the Signal Studio signal :
1. Turn off downlink signal.
In the tree view, select Downlink under
Carrier 1 Waveform Setup.
Under Cell Parameters, set State to Off.
2. Turn on uplink signal. In the tree view, select Uplink under
Carrier 1 Waveform Setup.
Under Cell Parameters, set State to On.
3. Download the signal to the ESG. Press Generate and Download button
on the top tool bar; if you encounter
any errors; please refer to the online
help for Signal Studio software.
Figure 9. Sub-frame duration 3 ms of uplink signal captured with Signal Studio
Instructions Keystrokes
On the P-Series power meter :
1. Move the markers 1 & 2 to
capture 3 ms uplink burst
sub-frame signal.
(See Figure 10).
From Gate Control menu, press
{Marker 1 2}.
Press [ ] and [ ] to allocate the
marker 1 and marker 2.
Figure 10. Uplink average burst power signal measures 0 dBm at 3 ms sub-frame
duration. In the P-Series power meter, green lines (Marker 1 and Marker 2) indicate the
start and end burst sub-frame signals of uplink.
Measuring Uplink Sub-Frame Burst Power of LTE-TDD
Generate an uplink sub-frame
signal using N7625A Signal Studio
software along with ESG vector signal
generator.
Set up the P-Series power meter/
sensor to measure the uplink sub-
frame signal of LTE-TDD.
10 ms frame duration
3 ms uplink sub-frame

13
CCDF is generally measured with data that is as random as possible to match
the Gaussian curve. The CCDF waveform provides statistics for the input signal,
analyzed over 1 seconds asynchronously to any features of the signal. 100 MHz
samples are histogrammed in real time so we can have the statistics on 100
million samples.
The P-Series power meter provides waveform CCDF measurement in graphical
and table formats (See Figure 12 and Figure 13). In Figure 11, the Signal Studio
under waveform setup shows that the CCDF plot and the table to the left of
the CCDF plot display the calculated peak-to-average values. The blue line
represents the Gaussian noise and the yellow line represents the input signal.
Prior to measurement, a reference trace is set and compared with the Gaussian
noise trace.
Figure 11. Waveform CCDF calculates the CCDF and peak-to-average ratio using the entire LTE-TDD waveform (with downlink signal off
and uplink signal on)
Part 2 : LTE-TDD CCDF Power Statistical Measurement

14
Instructions Keystrokes
On the P-Series power meter :
1. Set the acquisition to
“Free Run”.
Press [Trig/Acq], {Acqn A}, {Free Run}.
2. Set the CCDF in trace format. Press [Disp], {Disp Type}, {1 of 2}, {CCDF
Trace}.
3. Set the trace scale to 20 dB. Press {Trace Control}, {Scale/Div 2dB}.
4. Set the Gaussian noise trace. Press {Trace Display}, {Gaussian}. Press
[Prev/Esc] return to Trace Ctrl menu.
5. Set marker 1 to 10% and marker
2 to 1% of time. (See Figure 12).
Press {Marker Control}, press {Marker
1 2}.
Press [ ] and [ ] to allocate the
marker 1 and marker 2.
6. Set the CCDF in table format
and expand the display.
(See Figure 13).
[Disp], {Disp Type}. {1 of 2}, {CCDF
Table}, [ ].
Figure 12. CCDF graphical format. The yellow line is the input signal. The blue reference
line is the band-limited Gaussian noise curve. Marker 1 and Marker 2 indicate 10% and
1% of time at a specified power measurement.
Figure 13. CCDF table format
Set up the P-Series power meter/
sensor to measure the LTE-TDD
statistical CCDF (downlink signal off
and uplink signal on only).

15
Downloading LTE-FDD mode profi le into ESG Signal Generator
Generate a downlink LTE signal using
3GPP LTE-FDD Signal Studio along
with the Agilent ESG vector signal
generator.
Instructions Keystrokes
On N7624B Signal Studio software :
1. Set the basic parameters of the
Signal:
2 GHz frequency•
0 dBm Amplitude•
RF Output turned ON.•
In the view, select Instrument under
Hardware:
Set Frequency to 2 GHz
Set Amplitude = 0 dBm
RF Output = On
2. Download the signal to the ESG. Press Generate and Download button
on the top tool bar; if you encounter
any errors, please refer to the online help
of Signal Studio software.
Profi le setting
Instructions Keystrokes
On the P-Series power meter :
1. Preset the power meter. Press [Preset], press [ ] or [ ] to
choose {Default}, [Select] and {Confi rm}.
2. Set the frequency. Press [Channel], press [ ] or [ ] to
choose {Frequency} and change {Frequency}
= 2 GHz. (See Figure 14 for measurement
result).
Measuring Average Burst Power of LTE FDD
Set up the P-Series power meter/
sensor to measure average burst
power of LTE-FDD.
Figure 14. Average burst power of LTE-FDD measurement at 0 dBm
Part 3 : LTE-FDD Average Burst Power Measurement
Note: To establish a communication link between ESG signal generator, Agilent IO libraries Suite and N7624B Signal
Studio software for LTE-FDD, please refer to page 8 for detailed procedures.

16
CONCLUSIONAccurately measuring the sub-frame burst power of LTE-TDD and average burst power of LTE-FDD are very important
for LTE conformance testing. The P-Series power meter/sensor are capable to measure downlink/uplink sub-frame
signal of LTE-TDD and average burst power of LTE-FDD accurately. This document outlines the following key features
of the P-Series power meter/sensor for LTE power measurement conformance testing:
One-button LTE predefined preset to simplify the measurement setup effectively•
Auto-trigger with hold off•
30 MHZ video bandwidth capable to capture 20 MHz video bandwidth of LTE signal•
100 Msa/s•
Measurement speed match burst rate: useful for high speed dynamic transmitter power calibration•
Power statistical CCDF graphical and tabular format•
Ordering Information For further information, refer to P-Series Power Meters and Power Sensors Configuration Guide, Literature No : 5989-1252EN
Product Type Model NumberP-Series power meter N1911A or N1912A
P-Series wideband power sensor N9121A or N1922A
Publication title Pub number
P-Series Power Meters and P-Series Wideband Power Sensors
Technical Overview5989-1049EN
P-Series Power Meters and Power Sensors Configuration Guide 5989-1252EN
N1911A/N1912A P-Series Power Meters and N1921A/N1922A
Wideband Power Sensors Data Sheet5989-2471EN
Publication title Pub number
Agilent 3GPP Long Term Evolution Application Note 5989-8139EN
Agilent Technologies Solutions for 3GPP LTE Technical Overview 5989-6331EN
Agilent Move Forward to What’s Possible in LTE 5989-7871EN
Related Web ResourcesFor the latest and most complete applications and information, please refer to the following URL:
www.agilent.com/find/wideband_powermeters
www.agilent.com/find/lte
Reference
Related Agilent Literature

Remove all doubt
Our repair and calibration services will
get your equipment back to you, per-
forming like new, when promised. You
will get full value out of your Agilent
equipment through-out its lifetime.
Your equipment will be serviced by
Agilent-trained technicians using the
latest factory calibration procedures,
automated repair diagnostics and genu-
ine parts. You will always have the ut-
most confidence in your measurements.
For information regarding self mainte-
nance of this product, please contact
your Agilent office.
Agilent offers a wide range of additional
expert test and measurement services
for your equipment, including initial
start-up assistance, onsite education
and training, as well as design, system
integration, and project management.
For more information on repair and
calibration services, go to:
www.agilent.com/find/removealldoubt
Agilent Email Updates
www.agilent.com/find/emailupdates
Get the latest information on the
products and applications you select.
www.lxistandard.org
LXI is the LAN-based successor to
GPIB, providing faster, more efficient
connectivity. Agilent is a founding
member of the LXI consortium.
Agilent Channel Partners
www.agilent.com/find/channelpartners
Get the best of both worlds: Agilent’s
measurement expertise and product
breadth, combined with channel
partner convenience.
For more information on Agilent Technologies’
products, applications or services, please
contact your local Agilent office. The complete
list is available at:
www.agilent.com/fi nd/contactus
AmericasCanada (877) 894 4414 Latin America 305 269 7500United States (800) 829 4444
Asia Pacifi cAustralia 1 800 629 485China 800 810 0189Hong Kong 800 938 693India 1 800 112 929Japan 0120 (421) 345Korea 080 769 0800Malaysia 1 800 888 848Singapore 1 800 375 8100Taiwan 0800 047 866Thailand 1 800 226 008
Europe & Middle EastAustria 43 (0) 1 360 277 1571Belgium 32 (0) 2 404 93 40 Denmark 45 70 13 15 15Finland 358 (0) 10 855 2100France 0825 010 700* *0.125 €/minute
Germany 49 (0) 7031 464 6333 Ireland 1890 924 204Israel 972-3-9288-504/544Italy 39 02 92 60 8484Netherlands 31 (0) 20 547 2111Spain 34 (91) 631 3300Sweden 0200-88 22 55Switzerland 0800 80 53 53United Kingdom 44 (0) 118 9276201Other European Countries: www.agilent.com/fi nd/contactusRevised: October 1, 2009
Product specifications and descriptions in this document subject to change without notice.
© Agilent Technologies, Inc. 2010Printed in USA, November 19, 20105990-4063EN
www.agilent.comwww.agilent.com/find/signalstudio
Windows and MS Windows are U.S.
registered trademarks of Microsoft
Corporation.