Ozonized Water in Microbial Control: Analysis of the Stability ...
20
biology Article Ozonized Water in Microbial Control: Analysis of the Stability, In Vitro Biocidal Potential, and Cytotoxicity Laerte Marlon Conceição dos Santos 1 , Eduardo Santos da Silva 1 , Fabricia Oliveira Oliveira 1 , Leticia de Alencar Pereira Rodrigues 1 , Paulo Roberto Freitas Neves 2 ,Cássio Santana Meira 1 , Greta Almeida Fernandes Moreira 1 , Gabriela Monteiro Lobato 3 , Carlos Nascimento 3 , Marcelo Gerhardt 3 , Arlene Souza Lessa 4 , Luis Alberto Breda Mascarenhas 1 and Bruna Aparecida Souza Machado 1, * Citation: Santos, L.M.C.d.; Silva, E.S.d.; Oliveira, F.O.; Rodrigues, L.d.A.P.; Neves, P.R.F.; Meira, C.S.; Moreira, G.A.F.; Lobato, G.M.; Nascimento, C.; Gerhardt, M.; et al. Ozonized Water in Microbial Control: Analysis of the Stability, In Vitro Biocidal Potential, and Cytotoxicity. Biology 2021, 10, 525. https:// doi.org/10.3390/biology10060525 Academic Editor: Katsutoshi Hori Received: 11 May 2021 Accepted: 10 June 2021 Published: 12 June 2021 Publisher’s Note: MDPI stays neutral with regard to jurisdictional claims in published maps and institutional affil- iations. Copyright: © 2021 by the authors. Licensee MDPI, Basel, Switzerland. This article is an open access article distributed under the terms and conditions of the Creative Commons Attribution (CC BY) license (https:// creativecommons.org/licenses/by/ 4.0/). 1 University Center SENAI/CIMATEC, SENAI Institute of Innovation in Health Advanced Systems (ISI SAS), Salvador 41650-010, Bahia, Brazil; [email protected] (L.M.C.d.S.); [email protected] (E.S.d.S.); [email protected] (F.O.O.); leticiap@fieb.org.br (L.d.A.P.R.); cassio.meira@fieb.org.br (C.S.M.); greta.moreira@fieb.org.br (G.A.F.M.); breda@fieb.org.br (L.A.B.M.) 2 University Center SENAI/CIMATEC, SENAI Computational Modeling and Industrial Technology, Salvador 41650-010, Bahia, Brazil; paulo.neves@fieb.org.br 3 China Three Gorges Corporation—CTG Brazil, Rio Paraná Energia S.A. Rodovia MS-444 s/nº km 58, Ilha Solteira 79590-000, Selviria, Brazil; [email protected] (G.M.L.); [email protected] (C.N.); [email protected] (M.G.) 4 Gonçalo Moniz Institute, FIOCRUZ Microscopy Service, Technological Platforms Network, Salvador 40296-710, Bahia, Brazil; arlene.lessa@fiocruz.br * Correspondence: brunam@fieb.org.br Simple Summary: Controlling microbial infections, especially nosocomial infection, is a task that continues to be a burden in many societies. The current pandemic has brought new concerns on this matter, mainly on how to better control the dissemination of microbial agents in the environ- ment/surfaces and among humans. Therefore, the search for alternative methods and agents for disinfection is warranted. The aim of our study was to analyze the disinfecting potential of ozonized water in different in vitro tests. By performing microbiological and cell lineage in vitro assays, the biocidal effect of ozonized water was confirmed. Upon a short incubation time, bacterial strains and a yeast were killed by ozonized water, whereas there was no cytotoxicity in the mammalian cell line. These findings lead to the conclusion this agent can be safely tested in technologies for water spray disinfection devices. Abstract: O 3 dissolved in water (or ozonized water) has been considered a potent antimicrobial agent, and this study aimed to test this through microbiological and in vitro assays. The stability of O 3 was accessed following modifications of the physicochemical parameters of water, such as the temperature and pH, with or without buffering. Three concentrations of O 3 (0.4, 0.6, and 0.8 ppm) dissolved in water were tested against different microorganisms, and an analysis of the cytotoxic effects was also conducted using the human ear fibroblast cell line (Hfib). Under the physicochemical conditions of 4 ◦ C and pH 5, O 3 remained the most stable and concentrated compared to pH 7 and water at 25 ◦ C. Exposure to ozonized water resulted in high mortality rates for Escherichia coli, Pseudomonas aeruginosa, Staphylococcus aureus, Enterococcus faecalis, and Candida albicans. Scanning electron micrograph images indicate that the effects on osmotic stability due to cell wall lysis might be one of the killing mechanisms of ozonized water. The biocidal agent was biocompatible and presented no cytotoxic effect against Hfib cells. Therefore, due to its cytocompatibility and biocidal action, ozonized water can be considered a viable alternative for microbial control, being possible, for example, its use in disinfection processes. Keywords: aqueous ozone; antimicrobial; antimicrobial resistance; sanitizer; cytotoxicity Biology 2021, 10, 525. https://doi.org/10.3390/biology10060525 https://www.mdpi.com/journal/biology
-
Upload
khangminh22 -
Category
Documents
-
view
0 -
download
0
Transcript of Ozonized Water in Microbial Control: Analysis of the Stability ...

biology
Article
Ozonized Water in Microbial Control: Analysis of the Stability,In Vitro Biocidal Potential, and Cytotoxicity
Laerte Marlon Conceição dos Santos 1, Eduardo Santos da Silva 1 , Fabricia Oliveira Oliveira 1,Leticia de Alencar Pereira Rodrigues 1, Paulo Roberto Freitas Neves 2, Cássio Santana Meira 1,Greta Almeida Fernandes Moreira 1, Gabriela Monteiro Lobato 3, Carlos Nascimento 3, Marcelo Gerhardt 3,Arlene Souza Lessa 4, Luis Alberto Breda Mascarenhas 1 and Bruna Aparecida Souza Machado 1,*
�����������������
Citation: Santos, L.M.C.d.; Silva,
E.S.d.; Oliveira, F.O.; Rodrigues,
L.d.A.P.; Neves, P.R.F.; Meira, C.S.;
Moreira, G.A.F.; Lobato, G.M.;
Nascimento, C.; Gerhardt, M.; et al.
Ozonized Water in Microbial Control:
Analysis of the Stability, In Vitro
Biocidal Potential, and Cytotoxicity.
Biology 2021, 10, 525. https://
doi.org/10.3390/biology10060525
Academic Editor: Katsutoshi Hori
Received: 11 May 2021
Accepted: 10 June 2021
Published: 12 June 2021
Publisher’s Note: MDPI stays neutral
with regard to jurisdictional claims in
published maps and institutional affil-
iations.
Copyright: © 2021 by the authors.
Licensee MDPI, Basel, Switzerland.
This article is an open access article
distributed under the terms and
conditions of the Creative Commons
Attribution (CC BY) license (https://
creativecommons.org/licenses/by/
4.0/).
1 University Center SENAI/CIMATEC, SENAI Institute of Innovation in Health Advanced Systems (ISI SAS),Salvador 41650-010, Bahia, Brazil; [email protected] (L.M.C.d.S.);[email protected] (E.S.d.S.); [email protected] (F.O.O.); [email protected] (L.d.A.P.R.);[email protected] (C.S.M.); [email protected] (G.A.F.M.); [email protected] (L.A.B.M.)
2 University Center SENAI/CIMATEC, SENAI Computational Modeling and Industrial Technology,Salvador 41650-010, Bahia, Brazil; [email protected]
3 China Three Gorges Corporation—CTG Brazil, Rio Paraná Energia S.A. Rodovia MS-444 s/nº km 58,Ilha Solteira 79590-000, Selviria, Brazil; [email protected] (G.M.L.);[email protected] (C.N.); [email protected] (M.G.)
4 Gonçalo Moniz Institute, FIOCRUZ Microscopy Service, Technological Platforms Network,Salvador 40296-710, Bahia, Brazil; [email protected]
* Correspondence: [email protected]
Simple Summary: Controlling microbial infections, especially nosocomial infection, is a task thatcontinues to be a burden in many societies. The current pandemic has brought new concerns onthis matter, mainly on how to better control the dissemination of microbial agents in the environ-ment/surfaces and among humans. Therefore, the search for alternative methods and agents fordisinfection is warranted. The aim of our study was to analyze the disinfecting potential of ozonizedwater in different in vitro tests. By performing microbiological and cell lineage in vitro assays, thebiocidal effect of ozonized water was confirmed. Upon a short incubation time, bacterial strains anda yeast were killed by ozonized water, whereas there was no cytotoxicity in the mammalian cell line.These findings lead to the conclusion this agent can be safely tested in technologies for water spraydisinfection devices.
Abstract: O3 dissolved in water (or ozonized water) has been considered a potent antimicrobialagent, and this study aimed to test this through microbiological and in vitro assays. The stability ofO3 was accessed following modifications of the physicochemical parameters of water, such as thetemperature and pH, with or without buffering. Three concentrations of O3 (0.4, 0.6, and 0.8 ppm)dissolved in water were tested against different microorganisms, and an analysis of the cytotoxiceffects was also conducted using the human ear fibroblast cell line (Hfib). Under the physicochemicalconditions of 4 ◦C and pH 5, O3 remained the most stable and concentrated compared to pH 7and water at 25 ◦C. Exposure to ozonized water resulted in high mortality rates for Escherichia coli,Pseudomonas aeruginosa, Staphylococcus aureus, Enterococcus faecalis, and Candida albicans. Scanningelectron micrograph images indicate that the effects on osmotic stability due to cell wall lysis mightbe one of the killing mechanisms of ozonized water. The biocidal agent was biocompatible andpresented no cytotoxic effect against Hfib cells. Therefore, due to its cytocompatibility and biocidalaction, ozonized water can be considered a viable alternative for microbial control, being possible,for example, its use in disinfection processes.
Keywords: aqueous ozone; antimicrobial; antimicrobial resistance; sanitizer; cytotoxicity
Biology 2021, 10, 525. https://doi.org/10.3390/biology10060525 https://www.mdpi.com/journal/biology

Biology 2021, 10, 525 2 of 20
1. Introduction
Ozone (O3) is a gas that has a natural configuration of three oxygen atoms. It isconsidered an elemental form of oxygen that occurs naturally in the Earth’s atmosphere,protecting the Earth from harmful solar ultraviolet radiation [1]. O3 is naturally producedby the irradiation of sunlight and the action of compounds, such as nitrogen oxides andvolatile organic compounds [1]. O3 can also be produced artificially by the use of electricitygenerators [2,3], in which both air and oxygen can be used for gas formation. Its formationoccurs from oxygen (O2) atoms that are supplied by the separation of the O2 moleculesthrough the application of electrical discharges [2]. The free atom of O2 quickly combineswith an available molecule of O2 (O + O2 > O3) forming O3 [2,4]. Once formed, the O3rapidly decomposes into O2 (t1/2 = 20/30 min), and, for this reason, it must be producedin the place where it will be used [2,5].
As more antimicrobials are becoming ineffective to drug-resistant microorganisms,the focus should be shifted to alternative therapies. Research into new and non-antibioticapproaches to overcome infectious disease should be the focus of high priority research anddevelopment projects [6–10]. In addition, a search for methodologies aimed at reducing thespread and transmission rate for these pathogens, through contact either between humansor between humans and environments/surfaces, is warranted [11].
In several adapted in vitro sensitivity assays, the biocidal effect of O3 gas was con-firmed, leading to a reduction in the load of bacteria, such as Escherichia coli, Bacillus cereus,Pseudomonas aeruginosa, Staphylococcus aureus, and Bacillus cereus (as well as B. anthracisand B. subtilis), among others [3,4,12–14]. This effect was also observed in species offungi [15,16], such as the filamentous Aspergillus brasiliensis and the yeast Candida albi-cans [17]. Additionally, the antiviral activity of O3 was confirmed in Murine Norovirus(MNV-1), Bacteriophages, Hepatitis A Virus (HAV), and Polyvirus type 1 [18–20].
A problem associated with O3 gas is its toxicity [21,22]. One way to minimize thiseffect is its use dissolved in water. Given the toxicity of O3 and due to its reasonablesolubility in water, increasing attention has been given to the use of this gas as a sanitizingagent [11,23]. O3 solubility in water indeed allows its immediate reaction with any solublecompounds and biomolecules present in biological fluids [23,24].
The generation of O3 in water (or other aqueous medium) occurs using O3 generatorsbased on the dielectric barrier discharge method, also known as the corona effect [2]. Thistype of discharge is produced by applying a high voltage between two parallel electrodes,having between them a dielectric and a free space through which the air flows. Somesystems perform this transformation from the ambient air, while others are coupled to highpurity O2 cylinders. The air is bubbled directly into the water through an air outlet. Afterthis ozonation process, it is necessary to perform the quantification and determination ofthe dissolved O3 concentration [25–27].
O3 dissolved in water (or ozonized water) can be defined as water obtained after an O3infusion by the ozonation process. During this process, the only chemical reactions that canoccur are those between O3 and inorganic matter, organic matter, or biological materialsthat are available, emphasizing that there is no reaction with the pure water itself [25,26].Some parameters of evaluation and maintenance of the stability of ozonized water areimportant for this process of production and use, such as the pH and temperature, thesebeing among other important factors for the half-life of the gas dissolved in water [26,28].
Among the advantages presented by ozonized water is the reduction of gas toxicitywithout the loss of the O3 sanitizing action. Experimental studies have proven the effec-tiveness of ozonized water as a microbicide agent. This feature is related to its powerfuloxidizing action occurring from its decomposition process (O(3) � O + O(2)), with therelease of free radicals capable of acting in the inactivation of bacteria, fungi, viruses,and protozoans [12,15,16,19,27,29,30]. The biocidal action can also be identified by thedirect form of action of this agent under the organic compounds of these microorganisms,affecting, in turn, their metabolisms [27,29].
Biology 2021, 10, 525 3 of 20
Considering the need for new strategies for the control of microbial infections, theuse of sanitizing agents, such as ozonized water, can be considered a safe strategy, evenin emergencies, such as the current pandemic [11]. Therefore, the objective of this studywas to evaluate the O3 stability in water under different pH and temperature conditions.In addition, the antimicrobial potential of ozonized water and its cytotoxic effects onmammalian cells were evaluated.
2. Materials and Methods
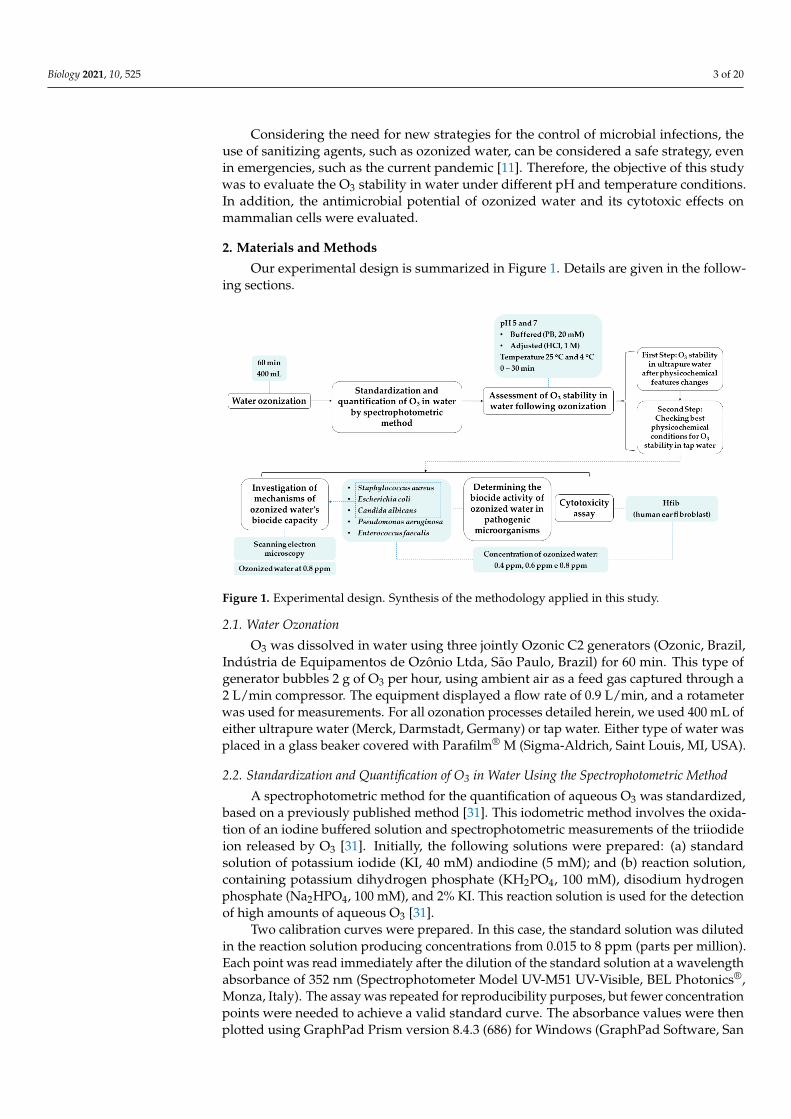
Our experimental design is summarized in Figure 1. Details are given in the follow-ing sections.
Biology 2021, 10, x FOR PEER REVIEW 3 of 21
Considering the need for new strategies for the control of microbial infections, the
use of sanitizing agents, such as ozonized water, can be considered a safe strategy, even
in emergencies, such as the current pandemic [11]. Therefore, the objective of this study
was to evaluate the O3 stability in water under different pH and temperature conditions.
In addition, the antimicrobial potential of ozonized water and its cytotoxic effects on
mammalian cells were evaluated.
2. Materials and Methods
Our experimental design is summarized in Figure 1. Details are given in the follow-
ing sections.
Figure 1. Experimental design. Synthesis of the methodology applied in this study.
2.1. Water Ozonation
O3 was dissolved in water using three jointly Ozonic C2 generators (Ozonic, Brazil,
Indústria de Equipamentos de Ozônio Ltda, São Paulo, Brazil) for 60 min. This type of
generator bubbles 2 g of O3 per hour, using ambient air as a feed gas captured through a
2 L/min compressor. The equipment displayed a flow rate of 0.9 L/min, and a rotameter
was used for measurements. For all ozonation processes detailed herein, we used 400 mL
of either ultrapure water (Merck, Darmstadt, Germany) or tap water. Either type of water
was placed in a glass beaker covered with Parafilm® M (Sigma-Aldrich, Saint Louis, MI,
USA).
2.2. Standardization and Quantification of O3 in Water Using the Spectrophotometric Method
A spectrophotometric method for the quantification of aqueous O3 was standardized,
based on a previously published method [31]. This iodometric method involves the oxi-
dation of an iodine buffered solution and spectrophotometric measurements of the triio-
dide ion released by O3 [31]. Initially, the following solutions were prepared: (a) standard
solution of potassium iodide (KI, 40 mM) andiodine (5 mM); and (b) reaction solution,
containing potassium dihydrogen phosphate (KH2PO4, 100 mM), disodium hydrogen
phosphate (Na2HPO4, 100 mM), and 2% KI. This reaction solution is used for the detection
of high amounts of aqueous O3 [31].
Two calibration curves were prepared. In this case, the standard solution was diluted
in the reaction solution producing concentrations from 0.015 to 8 ppm (parts per million).
Figure 1. Experimental design. Synthesis of the methodology applied in this study.
2.1. Water Ozonation
O3 was dissolved in water using three jointly Ozonic C2 generators (Ozonic, Brazil,Indústria de Equipamentos de Ozônio Ltda, São Paulo, Brazil) for 60 min. This type ofgenerator bubbles 2 g of O3 per hour, using ambient air as a feed gas captured through a2 L/min compressor. The equipment displayed a flow rate of 0.9 L/min, and a rotameterwas used for measurements. For all ozonation processes detailed herein, we used 400 mL ofeither ultrapure water (Merck, Darmstadt, Germany) or tap water. Either type of water wasplaced in a glass beaker covered with Parafilm® M (Sigma-Aldrich, Saint Louis, MI, USA).
2.2. Standardization and Quantification of O3 in Water Using the Spectrophotometric Method
A spectrophotometric method for the quantification of aqueous O3 was standardized,based on a previously published method [31]. This iodometric method involves the oxida-tion of an iodine buffered solution and spectrophotometric measurements of the triiodideion released by O3 [31]. Initially, the following solutions were prepared: (a) standardsolution of potassium iodide (KI, 40 mM) andiodine (5 mM); and (b) reaction solution,containing potassium dihydrogen phosphate (KH2PO4, 100 mM), disodium hydrogenphosphate (Na2HPO4, 100 mM), and 2% KI. This reaction solution is used for the detectionof high amounts of aqueous O3 [31].
Two calibration curves were prepared. In this case, the standard solution was dilutedin the reaction solution producing concentrations from 0.015 to 8 ppm (parts per million).Each point was read immediately after the dilution of the standard solution at a wavelengthabsorbance of 352 nm (Spectrophotometer Model UV-M51 UV-Visible, BEL Photonics®,Monza, Italy). The assay was repeated for reproducibility purposes, but fewer concentrationpoints were needed to achieve a valid standard curve. The absorbance values were thenplotted using GraphPad Prism version 8.4.3 (686) for Windows (GraphPad Software, San

Biology 2021, 10, 525 4 of 20
Diego, CA, USA, www.graphpad.com, accessed on 25 March 2021). The curves were fittedin the software by choosing simple linear regression. As shown in Figure S1, the similarityof the calibration curves as well as the high R square indicate the validity of the generatedcurves and the reproducibility of the method.
For the detection of O3 in water, samples of ozonized water were incubated with thereaction solution (1:1) and allowed to react for 30 min. The incubation was performed in adark chamber at 4 ◦C. The reaction solution was used as a blank. A Spectroquant® OzoneTest kit 100607 (Merck, Darmstadt, Germany) was used to confirm the concentrationsdetermined by the standardized method.
2.3. Assessment of O3 Stability in Water Following Ozonation2.3.1. First Step: O3 Stability in Ultrapure Water after Physicochemical Feature Changes
Considering the previous data on the stability of O3 in ultrapure water, which waspreviously considered the best type of water for increased O3 stability [26,32], changeswere applied in its physicochemical parameters. Samples of ultrapure water with thesedifferent physicochemical characteristics are displayed in Table S1, and the changes arerelated to the temperature and pH. Regarding the temperature, water was kept in a fridgeuntil it achieved a temperature of 4 ◦C, which was checked using a thermometer (K29-7070,Kasvi, Sao Jose dos Pinhais, PR, Brazil).
For pH-adjustment evaluations, hydrochloric acid (HCl) 1 M was used to adjustthe pH, which was verified using a pH meter (Mettler Toledo FiveEasy™ Plus, MerckDarmstadt, Germany). Additionally, buffering was tested as a potential condition forstability by using sodium phosphate (PB) buffer (20 mM) with pH 5 or 7. The aim of thesechanges was to define which of these physicochemical parameters would maintain O3longer in the water. After 1 h of ozonation for each test (Table S1) and considering the endof this process as the primary point of stability, aliquots of ozonized water were collectedat 0, 5, 10, 15, 20, and 30 min, and determination of the concentration was performed asmentioned in the Section “Standardization and quantification of O3 in water using thespectrophotometric method”.
Considering 0 min as reference, the percentage of O3 reduction in water was calculatedin all tested conditions (Table S1) and for each time of the stability curve. The calculationwas performed using the formula % R = [(A − B)/A] ∗ 100, with A the amount in ppm ofozone dissolved in water at time 0 and B the amount of ozone dissolved in water after thestudy time. In the cases of certain tests, an ice bath was used to keep low temperatures inthe glass beakers. The pH and temperature were checked before and after the ozonationprocesses. The experiment was in duplicate and repeated once. The data were then plottedusing GraphPad Prism.
2.3.2. Second Step: Checking Best Physicochemical Conditions for O3 Stability inTap Water
Due to its easy obtainment and help in reducing costs during the development ofozonized water technologies, tests in tap water were also performed, applying the bestphysicochemical conditions found in the stability experiments using ultrapure water. Giventhe results with ultrapure water, only pH 5 (adjusted or buffered) was evaluated at differenttemperatures, which is shown in Table S2. The ozonizing and quantification practices werethe same as those described above. However, considering that there was still detectableO3 in the tests with ultrapure water after 30 min, we added more points to the stabilitycurve, with the following time points: 40, 50, and 60 min. The experiment was performedin duplicate and repeated once. The data were then plotted using GraphPad Prism.
2.4. Determining the Biocidal Activity of Ozonized Water in Pathogenic Microorganisms
The bacterial strains Staphylococcus aureus (ATCC 6538), Escherichia coli (ATCC 25922),Pseudomonas aeruginosa (ATCC 27853), and Enterococcus faecalis (ATCC 29212) were culti-vated on tryptone soy agar (TSA) for 18–24 h at 37 ◦C. The yeast Candida albicans (ATCC

Biology 2021, 10, 525 5 of 20
18804) was grown on Sabouraud chloramphenicol agar (SCA) for 48 h at 30 ◦C. After TSAor SCA growth, at least three well-isolated colonies were selected and transferred with aninoculation loop into a tube, which contained 5 mL of saline (0.85% NaCl). The turbidity ofthe broth culture was adjusted to obtain an optical turbidity comparable to that of the Mc-Farland 0.5 standard solution, which contains approximately 1–2 × 10⁸ CFU mL−1 of E. coliATCC 25922. Then, the microorganisms were diluted in saline to obtain concentrations of5 × 105, 5 × 10⁴, and 5 × 10³ CFU mL−1.
Based on previous studies and the unique characteristics of O3 reactions [33,34], theconcentrations of 0.8, 0.6, and 0.4 ppm of O3 dissolved in tap water were tested in theassay, whose best water physicochemical features were used as follows: non-buffering,a temperature of 4 ◦C, and a pH 5 adjustment with HCl. Briefly, 1 mL of inoculum wasincubated with 4.0 mL of ozonized water in the three concentrations of dissolved O3. Theincubation time of these samples was 1 min at 20 ◦C. Following this interval, 0.5 mL of theinoculum, under the action of the different concentrations of O3 in the ozonized water, wereadded to 4.5 mL of a neutralizer (PB buffer pH 7, 20 mM, with 5 g/L sodium thiosulfate).
A control without exposure to ozonized water was performed for each dilution,although this control went through the same dilution process as the tests. Then, the sampleswere inoculated in duplicate in PCA (plate count agar) for bacteria and SCA for the yeast,which were grown at 37 and 30 ◦C for 24 and 48 h, respectively. The number of colonies oneach agar plate was calculated after this incubation. Using the mean values of these counts,the death rate was calculated according to the following formula: Death rate (%) = (CFUof the control − CFU of the test)/CFU of the control) [13]. Additionally, the logarithmicscale (Log10) reduction factor was calculated using the formula RF = Log10 (A) − Log10 (B)(where A is the number of colonies recovered from the unexposed (control) and B is thenumber of colonies recovered from the exposed (test) to O3) [35]. The data were thenplotted using GraphPad Prism.
2.5. Analysis of Microbials’ Morpho-Structural Changes Using Scanning Electron Microscopy
Scanning electron microscopy (SEM) was used to infer possible mechanisms of thekilling capacity of ozonized tap water. In this case, to represent bacteria with distinctivecell walls and morphologies, one Gram-positive (S. aureus) and one Gram-negative bacteria(E. coli) were randomly included in this verification, as well as one yeast (C. albicans) ofthe present study. The turbidity of the broth culture was adjusted to obtain inoculumscomparable to that of the McFarland 2 standard solution. The triplicated samples of thecells were centrifuged at 4000× g, 20 min, at room temperature.
The pellets were then resuspended in 100 µL of saline and incubated with 400 µL ofozonized water containing 0.8 ppm of O3. Following 1 min of incubation, a neutralizer(PB buffer pH 7, 20 mM with 5 g/L sodium thiosulfate) was used. A control withoutexposure to ozonized water was also performed and went through the same incubationsand dilutions as the tests. Following another centrifugation, the microbial pellets werewashed using saline and centrifuged again.
For SEM visualizations, the microorganisms in the pellets were fixed sequentially intwo fixatives: (i) 2.5% glutaraldehyde in 0.1 M sodium cacodylate buffer, pH 7.4, for 1–2 h,followed by three washes with the same buffer; and (ii) 1% osmium tetroxide in 0.1 Msodium cacodylate for 1 h at room temperature, and washed three times with distilledwater. Following fixation, they were then dehydrated in increasing concentrations ofethanol (30%, 50%, 70%, 90%, and absolute alcohol) and dried to the critical point usinga drying machine with liquid CO2 as the transitional medium. The specimens were thenexamined by a JEOL, JSM-6390LV SEM.
2.6. Cytotoxicity Assay
The cell line Hfib (human ear fibroblast) was used for the cytotoxicity assays andobtained as previously stated [36]. The cells were cultivated in RPMI 1640 medium (Sigma-Aldrich, St. Louis, MO, USA) supplemented with 10% fetal bovine serum (FBS; GIBCO)
Biology 2021, 10, 525 6 of 20
and 50 µg mL−1 of gentamicin (Life, Carlsbad, CA, USA) at 37 ◦C and 5% of CO2. Toconfirm that the cell line was free of mycoplasma, this pathogenic microorganism wasdetected using the Mycoplasma Stain Kit (Sigma-Aldrich, St. Louis, MO, USA).
The cytotoxicity assay followed the method described by Colombo et al. [37] withcertain modifications. Cells were plated in 96-well plates at 5 × 10⁴ cells mL−1 and incu-bated for 24 h at 37 ◦C and 5% CO2. Following that, the media was removed, and the celllines were exposed to ozonized water (0.4, 0.6, and 0.8 ppm), using the best water physico-chemical conditions (non-buffering, temperature of 4 ◦C, and pH 5 adjustment with HCl),for 1 min. After this incubation, the ozonized water was removed from the wells, whichwere washed with saline solution twice. Then, 20 µL of medium plus 10% AlamarBlue(Thermo Fisher Scientific, Carlsbad, CA, USA) were added in the wells. Incubations werefollowed for 4 h at 37 ◦C, and absorbance measurements were carried out at λ = 570 nmand λ = 600 nm.
The percentage of cell viability of exposed cells was calculated considering the ab-sorbance of the control cells (without O3 exposure) as 100%. Then, using this value as areference, we calculated the percentage for the exposed cells. Cell cultures containing 10%Triton X-100 were used as a positive control. The data were then plotted using GraphPadPrism. The same software was used for statistical analyses. The Kolmogorov–Smirnov testwas used to verify the data distribution. Considering the non-parametric distribution, theKruskal–Wallis test with Dunn’s post test was used to access statistical differences amongthe exposures. * represents p < 0.0001.
3. Results and discussion3.1. O3 stability in Water
Figure 2 details the decay of the concentration (left y-axis) and the percentage of O3reduction (left y-axis) in ultrapure water for 30 min and under several physicochemical con-ditions (Table S1). In fact, the concentration of O3 in water decays depending on the physic-ochemical state of the water. From Conditions 1A and 2A (pH 5 and 7, respectively, at 25 ◦C)to Conditions 3A and 4A (pH 5 and 7, respectively, at 4 ◦C) (Table S1 and Figure 2A,B), O3did not fall to 100%. The decrease in pH and temperature was clearly positive in terms ofincreasing the initial concentration of O3 in the water as well as decreasing the percentageof reduction. Specifically, when the temperature was decreased, the initial concentrationincreased from 0.571 ± 0.198 to 1.045 ± 0.021 ppm in ultrapure water with the pH adjustedto 7 and 4, respectively.
In addition, O3 took longer to decay at low temperatures, either at acidic or neutral pH.However, at pH 5, the concentration was always higher at any of the times on the stabilitycurve (Figure 2B). We estimate that, at pH 5 and 4 ◦C, the concentration of approximately0.3 ppm was maintained for about 30 min. This effect of pH on the slower decay of theO3 concentration in water was also observed in ozonized water at room temperature(Figure 2A), despite lower concentrations. The ultrapure water samples from Tests 2A(pH 7 at 25 ◦C) and 4A (pH 7 at 4 ◦C) (Table S1), initially adjusted to pH 7, displayed areduction in pH at the end of bubbling, to 3.7 and 5, respectively.
Regarding buffering, the profile of the stability curves from Tests 5B and 6B (pH 5 and7, respectively, at 25 ◦C) to Tests 7B and 8B (pH 5 and 7, respectively, at 4 ◦C) (Table S1)was not similar to the results with the samples with pH adjusted with HCl, but it waswith regard to pH 5 at 4 ◦C (Figure 2C,D). However, the concentrations and percentages ofreduction decreased and increased, respectively, in comparison with the same conditionsin the adjusted pH of ultrapure water. We observed that, when using the 20 mM PB buffer,O3 was not detected after 5 min in Condition 6B (pH 7 at 25 ◦C) (Table S1 and Figure 2C).Despite this, we confirmed that cooling helped to increase the concentration and stabilityof O3 in ultrapure water, and this was more evident at pH 5.
At pH 5, after an initial drop after 5 min, the concentration of aqueous O3 remainedvirtually constant for 30 min (Figure 2D) in buffered ultrapure water, as it was for thewater with pH adjusted with HCl (Figure 2B). In terms of concentration, while there was

Biology 2021, 10, 525 7 of 20
almost no increase in the concentration at pH 7 in both temperatures, in buffered waterwith pH 5, the concentration increased from 0.269 ± 0.112 to 0.695 ± 0.262 ppm at 25 and4 ◦C, respectively. Comparing the four stability curves, buffering did not display effects onincreasing the solubility of O3 in water.
Biology 2021, 10, x FOR PEER REVIEW 7 of 21
S1) was not similar to the results with the samples with pH adjusted with HCl, but it was
with regard to pH 5 at 4 °C (Figure 2C,D). However, the concentrations and percentages
of reduction decreased and increased, respectively, in comparison with the same condi-
tions in the adjusted pH of ultrapure water. We observed that, when using the 20 mM PB
buffer, O3 was not detected after 5 min in Condition 6B (pH 7 at 25 °C) (Table S1 and
Figure 2C). Despite this, we confirmed that cooling helped to increase the concentration
and stability of O3 in ultrapure water, and this was more evident at pH 5.
At pH 5, after an initial drop after 5 min, the concentration of aqueous O3 remained
virtually constant for 30 min (Figure 2D) in buffered ultrapure water, as it was for the
water with pH adjusted with HCl (Figure 2B). In terms of concentration, while there was
almost no increase in the concentration at pH 7 in both temperatures, in buffered water
with pH 5, the concentration increased from 0.269 ± 0.112 to 0.695 ± 0.262 ppm at 25 and 4
°C, respectively. Comparing the four stability curves, buffering did not display effects on
increasing the solubility of O3 in water.
This finding was confirmed at both temperatures; however, the difference in the sta-
bility curves at 25 °C was striking at both pH values with buffering inducing a complete
decay of O3 in 10 min (Figure 2C), whereas adjustment of the pH with O3 was still seen in
the water after 30 min (Figure 2A). This behavior was less drastic at 4 °C given that there
was still an O3 presence in the buffered water at pH 5 (Figure 2D). In contrast, at pH 7, O3
was not detected after 10 min (Figure 2D). Considering that, under the adjustment condi-
tions, there was a fluctuation of pH in ultrapure water, at either 25 or 4 °C (something that
did not occur in buffered ultrapure waters), our findings indicate that non-buffering can
lead to an increase in the O3 solubility in water.
Figure 2. Ozone stability curves in ultrapure water. Ozonation of non-buffered ultrapure water at
25 °C (A) and 4 °C (B). The left y-axis is fitted the mean with standard deviation for the concentration
in parts per million (ppm). The right y-axis is fitted the percentage of the O3 reduction in water. Both
displayed y-axes were obtained from the same experiment. The percentage of O3 reduction in water
was calculated considering the first sample (0 min) as the basis. Adjustment of pH was performed
with 1 M HCl. Ozonation of buffered (PB, 20 mM) ultrapure water at 25 °C (C) and 4 °C (D).
Bearing in mind that pH 5 appeared to be a key chemical parameter and the fact that
tap water is known for its several organic compounds, which can reduce the O3 solubility
and stability in water, we only tested this pH in two temperatures. Analyzing the results
Figure 2. Ozone stability curves in ultrapure water. Ozonation of non-buffered ultrapure water at25 ◦C (A) and 4 ◦C (B). The left y-axis is fitted the mean with standard deviation for the concentrationin parts per million (ppm). The right y-axis is fitted the percentage of the O3 reduction in water. Bothdisplayed y-axes were obtained from the same experiment. The percentage of O3 reduction in waterwas calculated considering the first sample (0 min) as the basis. Adjustment of pH was performedwith 1 M HCl. Ozonation of buffered (PB, 20 mM) ultrapure water at 25 ◦C (C) and 4 ◦C (D).
This finding was confirmed at both temperatures; however, the difference in thestability curves at 25 ◦C was striking at both pH values with buffering inducing a completedecay of O3 in 10 min (Figure 2C), whereas adjustment of the pH with O3 was still seenin the water after 30 min (Figure 2A). This behavior was less drastic at 4 ◦C given thatthere was still an O3 presence in the buffered water at pH 5 (Figure 2D). In contrast, atpH 7, O3 was not detected after 10 min (Figure 2D). Considering that, under the adjustmentconditions, there was a fluctuation of pH in ultrapure water, at either 25 or 4 ◦C (somethingthat did not occur in buffered ultrapure waters), our findings indicate that non-bufferingcan lead to an increase in the O3 solubility in water.
Bearing in mind that pH 5 appeared to be a key chemical parameter and the factthat tap water is known for its several organic compounds, which can reduce the O3solubility and stability in water, we only tested this pH in two temperatures. Analyzing theresults plotted in Figure 3, we noted that not only did a reduction in temperature increasethe concentration of O3 in tap water (Figure 3A), but also the percentage of reductionin O3 in this water was slightly lower at 4 ◦C in comparison with 25 ◦C (Figure 3A). Aswith ultrapure water, the buffering clearly reduced the concentration and stability of O3(Figure 3B). In comparison with ultrapure water, the buffering of tap water was moredrastic as O3 was absent in the water after 5 min at either 25 or 4 ◦C.
When comparing the two conditions, at 4 ◦C, the pH-adjusted water maintained theO3 concentration between 0.65 and 0.25 ppm for 60 min, while, in the buffered water,the initial concentration of approximately 0.25 ppm decreased by about 70% in 5 min

Biology 2021, 10, 525 8 of 20
(Figures 3A and 4B). At 25 ◦C, the outcomes were similar regarding both the percentage ofreduction and concentration, but with lower values of concentration, which were almostnot detected in the buffered samples (Figure 3A,B).
Biology 2021, 10, x FOR PEER REVIEW 8 of 21
plotted in Figure 3, we noted that not only did a reduction in temperature increase the
concentration of O3 in tap water (Figure 3A), but also the percentage of reduction in O3 in
this water was slightly lower at 4 °C in comparison with 25 °C (Figure 3A). As with ul-
trapure water, the buffering clearly reduced the concentration and stability of O3 (Figure
3B). In comparison with ultrapure water, the buffering of tap water was more drastic as
O3 was absent in the water after 5 min at either 25 or 4 °C.
When comparing the two conditions, at 4 °C, the pH-adjusted water maintained the
O3 concentration between 0.65 and 0.25 ppm for 60 min, while, in the buffered water, the
initial concentration of approximately 0.25 ppm decreased by about 70% in 5 min (Figures
3A and 4B). At 25 °C, the outcomes were similar regarding both the percentage of reduc-
tion and concentration, but with lower values of concentration, which were almost not
detected in the buffered samples (Figure 3A,B).
Figure 3. Sixty-minute ozone stability in tap water. Ozonation of non-buffered (A) and buffered (B)
tap water. The left y-axis is fitted the mean with standard deviation for the concentration in parts
per million (ppm). The right y-axis is fitted the percentage of the O3 reduction in water. Both dis-
played y-axes were obtained from the same experiment. The percentage of O3 reduction in water
was calculated considering the first sample (0 min) as the basis. Adjustments of the pH and buffer-
ing were performed with 1 M HCl and 20 mM PB, respectively.
As shown in Figure 4A,B, when comparing the O3 concentrations of the two types of
water in 30 min, it is apparent that the physicochemical parameters influenced the con-
centration of O3. The concentration of dissolved O3 was higher in ultrapure water after 1
h of ozonation, with initial concentrations of 1.045 ± 0.021 and 0.332 ± 0.011 ppm in water
at temperatures of 4 and 25 °C, respectively. In contrast, the concentration of O3 in tap
water remained lower than ultrapure water only at 4 °C, with initial concentrations of O3
of 0.673 ± 0.230 ppm (Figure 4A and Table S3). Comparing the O3 concentration in the two
types of water with the addition of buffer solution, the ultrapure buffered water contained
more dissolved O3 in relation to the buffered tap water. In numbers, at 4 °C, the initial
concentrations were 0.695 ± 0.262 ppm for ultrapure and 0.237 ± 0.160 ppm for tap, while,
at 25 °C, they were 0.269 ± 0.112 ppm for ultrapure and 0.094 ± 0.020 ppm for tap (Figure
4B and Table S3).
Figure 4C,D displays the comparative results of the percentage of O3 reduction in two
types of water. O3 was more stable in tap water at 4 °C in comparison with ultrapure water
at almost all time points of the stability curve, with the exception of 5 min. On the other
hand, at 25 °C, the stability of O3 in ultrapure water was higher compared to tap water at
all evaluated times in the stability curve. These outcomes indicate that lower temperatures
were more important for stability than the purity of the water (Figure 4C and Table S4).
The O3 reduction was clearly higher in buffered tap water, with 100% loss in 15 and 10
min at temperatures of 4 and 25 °C, respectively. The O3 reduction was also evident in the
Figure 3. Sixty-minute ozone stability in tap water. Ozonation of non-buffered (A) and buffered (B) tap water. The left y-axisis fitted the mean with standard deviation for the concentration in parts per million (ppm). The right y-axis is fitted thepercentage of the O3 reduction in water. Both displayed y-axes were obtained from the same experiment. The percentage ofO3 reduction in water was calculated considering the first sample (0 min) as the basis. Adjustments of the pH and bufferingwere performed with 1 M HCl and 20 mM PB, respectively.
Biology 2021, 10, x FOR PEER REVIEW 9 of 21
buffered ultrapure water, with a maximum reduction of 82.73% at 4 °C and 100% after 20
min in water at 25 °C (Figure 4D and Table S4).
Figure 4. Comparisons of O3 concentration and stability in ultrapure and tap waters at pH 5. Ozonation of the two types
of water at 25 °C (A) and 4 °C (B). The mean with standard deviation for the concentration in parts per million (ppm) were
used to calculate the percentage of O3 reduction, considering the first sample (0 min) as the basis. The percentage values
were then plotted as graphs for (C) 25 °C and (D) 4 °C. Adjustments of the pH and buffering were performed with 1 M
HCl and 20 mM PB buffer, respectively.
These findings confirm that reducing the temperature and pH can help in O3 stability,
even in the buffering condition that appeared to lack stability. Henry’s Law defines the
solubility of O3, where a given temperature is linearly proportional to the partial pressure
of the gas, when it is present in a solution. This means that the lower is the water temper-
ature, the better is the dissolution of the gas in water [38]. At high temperatures, the rates
of decomposition are higher, and, in addition, there is a reduction in the solubility of O3
in water [39].
The reaction of O3 with organic compounds in aqueous solution may occur through
direct reaction, or indirectly involving reactions with hydroxyl radicals (OH−). This indi-
rect reaction is fundamental to understand another important factor in the fast or slow
decomposition of O3 in aqueous media: the pH levels. The stability of O3 in water de-
creases when the pH of the medium increases; when the pH is higher than 8.0, practically
half of the introduced O3 is decomposed into various intermediate forms of oxygen in a
period of 10 min [5,40].
No O3 was detected in buffers with pH 9.0 in previous studies, while a greater stabil-
ity of O3 in solution occurred when the pH was 5.0 [24,41], as in the results demonstrated
in this study. The concentration of OH− can interfere considerably in the ozonation process
as well as the acid–base balance of ozonized water, reflecting directly in the concentration
of dissociated/non-dissociated forms present in the medium. However, the mathematical
description is not yet well defined in relation to the performance of OH− in the ozonation
process and in the acid–base balance [26,32].
Figure 4. Comparisons of O3 concentration and stability in ultrapure and tap waters at pH 5. Ozonation of the two types ofwater at 25 ◦C (A) and 4 ◦C (B). The mean with standard deviation for the concentration in parts per million (ppm) wereused to calculate the percentage of O3 reduction, considering the first sample (0 min) as the basis. The percentage valueswere then plotted as graphs for (C) 25 ◦C and (D) 4 ◦C. Adjustments of the pH and buffering were performed with 1 M HCland 20 mM PB buffer, respectively.

Biology 2021, 10, 525 9 of 20
As shown in Figure 4A,B, when comparing the O3 concentrations of the two typesof water in 30 min, it is apparent that the physicochemical parameters influenced theconcentration of O3. The concentration of dissolved O3 was higher in ultrapure water after1 h of ozonation, with initial concentrations of 1.045 ± 0.021 and 0.332 ± 0.011 ppm inwater at temperatures of 4 and 25 ◦C, respectively. In contrast, the concentration of O3 intap water remained lower than ultrapure water only at 4 ◦C, with initial concentrationsof O3 of 0.673 ± 0.230 ppm (Figure 4A and Table S3). Comparing the O3 concentration inthe two types of water with the addition of buffer solution, the ultrapure buffered watercontained more dissolved O3 in relation to the buffered tap water. In numbers, at 4 ◦C, theinitial concentrations were 0.695 ± 0.262 ppm for ultrapure and 0.237 ± 0.160 ppm for tap,while, at 25 ◦C, they were 0.269 ± 0.112 ppm for ultrapure and 0.094 ± 0.020 ppm for tap(Figure 4B and Table S3).
Figure 4C,D displays the comparative results of the percentage of O3 reduction in twotypes of water. O3 was more stable in tap water at 4 ◦C in comparison with ultrapure waterat almost all time points of the stability curve, with the exception of 5 min. On the otherhand, at 25 ◦C, the stability of O3 in ultrapure water was higher compared to tap water atall evaluated times in the stability curve. These outcomes indicate that lower temperatureswere more important for stability than the purity of the water (Figure 4C and Table S4).The O3 reduction was clearly higher in buffered tap water, with 100% loss in 15 and 10 minat temperatures of 4 and 25 ◦C, respectively. The O3 reduction was also evident in thebuffered ultrapure water, with a maximum reduction of 82.73% at 4 ◦C and 100% after20 min in water at 25 ◦C (Figure 4D and Table S4).
These findings confirm that reducing the temperature and pH can help in O3 stability,even in the buffering condition that appeared to lack stability. Henry’s Law defines thesolubility of O3, where a given temperature is linearly proportional to the partial pressure ofthe gas, when it is present in a solution. This means that the lower is the water temperature,the better is the dissolution of the gas in water [38]. At high temperatures, the rates ofdecomposition are higher, and, in addition, there is a reduction in the solubility of O3 inwater [39].
The reaction of O3 with organic compounds in aqueous solution may occur throughdirect reaction, or indirectly involving reactions with hydroxyl radicals (OH−). Thisindirect reaction is fundamental to understand another important factor in the fast orslow decomposition of O3 in aqueous media: the pH levels. The stability of O3 in waterdecreases when the pH of the medium increases; when the pH is higher than 8.0, practicallyhalf of the introduced O3 is decomposed into various intermediate forms of oxygen in aperiod of 10 min [5,40].
No O3 was detected in buffers with pH 9.0 in previous studies, while a greater stabilityof O3 in solution occurred when the pH was 5.0 [24,41], as in the results demonstrated inthis study. The concentration of OH− can interfere considerably in the ozonation processas well as the acid–base balance of ozonized water, reflecting directly in the concentrationof dissociated/non-dissociated forms present in the medium. However, the mathematicaldescription is not yet well defined in relation to the performance of OH− in the ozonationprocess and in the acid–base balance [26,32].
In relation to the presence of organic compounds in the water, a lower concentration(but not very significant) of O3 was observed in tap water. The presence of organicmatter can cause a severe reduction of O3 in water [42–44], due to the rapid action ofthis agent with the aqueous compounds. However, it is precisely for this reason that O3(in its gas form) is widely used in the treatment of wastewater [40,45,46]—for example,reacting with the dirtiness by the direct action of molecular O3 or by indirect reaction ofthe radical OH− [32,46]. On the other hand, during comparisons with the two types ofwater, the stability of O3 in cold tap water was higher than that of the ultrapure water atthe same temperature.
A possible explanation for this outcome is because the higher is the amount of solutesin water, the lower is the temperature changes, leading to a longer maintenance of the

Biology 2021, 10, 525 10 of 20
cold temperature [47,48] and, in turn, a slightly higher O3 stability in tap water. Thepresence of a solute in water makes the liquid state less organized because solutes or ionsare freer to move at random. Therefore, the liquid water molecules possibly become moredisordered in tap water, taking more energy to decrease this entropy as well as increasingthe temperature [47–49]. Although we used an ice bath to keep the temperature as fixed aspossible at 4 ◦C, during the ozonation process, some decreases occurred with values closeto 0 ◦C. Taking this into consideration and the fact that physicochemical water parametersin Brazil are usually associated with the dispersion of a high amount of organic matterin the rivers, especially during rainfall season [50], ions (Ca2+, K+, and Na+) commonlyencountered in soils are notorious for depressing the freezing point of water [48,49].
Another result, regarding the stability of O3, indicated that the buffering did notpositively affect the increase of O3 solubility. This finding was confirmed at 25 ◦C; however,the difference in the stability curves at 4 ◦C was quite marked, especially at pH 5.0. Consid-ering that, in the adjustment conditions, there was pH fluctuation (final pH of 4.0 after theexperiments) in the water at either 25 or 4 ◦C—something that did not occur in bufferedwater—this is presented as another indication that non-buffering can lead to an increaseof O3 solubility in the water due to pH fluctuations. If the oscillation is downwards, thiscan cause a higher permanence of O3 in the water, since the lower is the pH, the greateris the half-life of the gas in the water. A previous report indicated clearly that dissolvedsubstances, either ionic or non-ionic, could affect the solubility of O3 in aqueous solutions,and buffering decreased both the solubility and stability of the gas [51].
3.2. Biocidal Effect of Ozonized Tap Water
To evaluate the biocidal action of ozonized water (non-buffering, temperature of 4 ◦C,and pH 5 adjustment with HCl), the mortality rates of each microorganism studied arepresented in Figures 5–7. This condition of microbial death represents the effect of exposureof microorganisms for 1 min to ozonized water in different concentrations.
Figure 5 shows the results for the Gram-negative bacteria evaluated in the study. Theexposure of E. coli to ozonized water showed a bacterial death rate higher than 95% fromthe inoculum concentration of 5 × 10⁵ CFU mL−1 in the three concentrations tested (0.4,0.6, and 0.8 ppm). Better results in relation to P. aeruginosa were observed in this study. Themortality rate of the P. aeruginosa strain was equal to 100% from the lowest concentration ofozonized water (0.4 ppm) tested.
The average colony counts for each concentration of ozonized water were calculatedand converted to Log10. When E. coli was exposed to ozonized water at the inoculumconcentration of 5 × 10⁵ CFU mL−1, a reduction of >2.23 Log10 CFU mL−1 was observed.However, at an inoculum concentration equal to or lower than 5 × 10⁴ CFU mL−1, a higherreduction (>6 Log10 CFU mL−1) was observed. The logarithmic reduction for P. aeruginosawas higher than the results observed for E. coli after the same exposure time at differentconcentrations of ozonized water.
While Figure 6 shows the results for the Gram-positive bacteria, Figure 7 displaysthe findings for the evaluated yeast C. albicans. Similar to the results demonstrated for theGram-negative bacteria P. aeruginosa, the mortality rate of the S. aureus and E. faecalis strainswere equal to 100% from the lowest concentration of ozonized water (0.4 ppm) tested.The best biocidal activity was observed against C. albicans, with a high death rate at theinoculum concentration of 1.5 × 10⁸ CFU mL−1. The logarithmic reduction for S. aureus,E. faecalis, and C. albicans proved to be higher than the results with E. coli in the sameconditions tested. These results indicate the greater resistance of E. coli to treatment withozonized water when in high inoculum concentrations.

Biology 2021, 10, 525 11 of 20
Biology 2021, 10, x FOR PEER REVIEW 11 of 21
Figure 5. Action of ozonized water on Gram-negative bacteria. Analysis of the percentage of death and growth reduction
in Log10 for the microorganisms E. coli (A,B) and P. aeruginosa (C,D). The concentrations of 0.8, 0.6, and 0.4 ppm of O3
dissolved in tap water were tested, and the number of colonies on each agar plate was calculated after incubation (1.0 mL
of inoculum and 4.0 mL of ozonized water at 20 °C for 1 min).
While Figure 6 shows the results for the Gram-positive bacteria, Figure 7 displays the
findings for the evaluated yeast C. albicans. Similar to the results demonstrated for the
Gram-negative bacteria P. aeruginosa, the mortality rate of the S. aureus and E. faecalis
strains were equal to 100% from the lowest concentration of ozonized water (0.4 ppm)
tested. The best biocidal activity was observed against C. albicans, with a high death rate
at the inoculum concentration of 1.5 × 10⁸ CFU mL−1. The logarithmic reduction for S. au-
reus, E. faecalis, and C. albicans proved to be higher than the results with E. coli in the same
conditions tested. These results indicate the greater resistance of E. coli to treatment with
ozonized water when in high inoculum concentrations.
Although C. albicans suffered growth reduction at the inoculum concentration of 1.5
× 108 CFU mL−1, all the tested bacteria did not reduce growth as much at this concentration
(for this reason, the inoculum concentration of 108 for the bacteria was not plotted on the
graphs), not allowing colony counting (bacterial confluence in the plaque). However, im-
ages of the plates (only bacteria) clearly revealed a microbial reduction following exposure
to ozonized water in comparison with the control plates (Figures S3–S5). While in the test
plates it was possible to notice isolated colonies, but still impossible to count them, the
density of the biomass is clearly so high in the control plates that no isolated colonies can
be observed (Figures S3–S5). On the other hand, C. albicans growth was strongly different
from the bacteria evaluated in the present study (Figure S6). It is important to emphasize
that the greater effect observed of the action of ozonized water in higher concentrations
of microorganism inoculum can be explained because the higher is the inoculum, the
greater is the colony forming unit in the control. For this reason, Log10 is higher at higher
concentrations of microorganisms and is lower at lower concentrations. However, to bet-
ter understand this, it is necessary to evaluate the results of Log10 and death rate together,
Figure 5. Action of ozonized water on Gram-negative bacteria. Analysis of the percentage of deathand growth reduction in Log10 for the microorganisms E. coli (A,B) and P. aeruginosa (C,D). Theconcentrations of 0.8, 0.6, and 0.4 ppm of O3 dissolved in tap water were tested, and the numberof colonies on each agar plate was calculated after incubation (1.0 mL of inoculum and 4.0 mL ofozonized water at 20 ◦C for 1 min).
Biology 2021, 10, x FOR PEER REVIEW 12 of 21
noting that the reduction was mostly 100%, regardless of the inoculum used. The antimi-
crobial action of O3 herein showed is related to its powerful oxidizing action. O3 has been
widely used as an antimicrobial, in both its gaseous and aqueous form, due to its wide
range of microbiological, cleaning, and metabolic activities [6,13,15,16,24,34,45,52,53]. The
antimicrobial action of O3 is related to its powerful oxidizing action. When it decomposes,
this gas generates an oxidant reaction by the liberation of reactive oxygen species (ROS),
including generating hydroxyl radicals (OH−) that have a greater oxidative potential (2.83
volts) over O3 and both act in the inactivation of several microorganisms [38,42,46,54,55].
Figure 6. Action of ozonized water on Gram-positive bacteria. Analysis of the percentage of death
and growth reduction in Log10 for the microorganisms S. aureus (A,B) and E. faecalis (C,D). The con-
centrations of 0.8, 0.6, and 0.4 ppm of O3 dissolved in tap water were tested, and the number of
colonies on each agar plate was calculated after incubation (1.0 mL of inoculum and 4.0 mL of ozo-
nized water at 20 °C for 1 min).
Figure 7. Action of ozonized water on yeast C. albicans. Analysis of the percentage of death (A) and
growth reduction in Log10 (B) for C. albicans. The concentrations of 0.8, 0.6, and 0.4 ppm of O3 dis-
solved in tap water were tested, and the number of colonies on each agar plate was calculated after
incubation (1.0 mL of inoculum and 4.0 mL of ozonized water at 20 °C for 1 min).
Figure 6. Action of ozonized water on Gram-positive bacteria. Analysis of the percentage of deathand growth reduction in Log10 for the microorganisms S. aureus (A,B) and E. faecalis (C,D). Theconcentrations of 0.8, 0.6, and 0.4 ppm of O3 dissolved in tap water were tested, and the numberof colonies on each agar plate was calculated after incubation (1.0 mL of inoculum and 4.0 mL ofozonized water at 20 ◦C for 1 min).

Biology 2021, 10, 525 12 of 20
Biology 2021, 10, x FOR PEER REVIEW 12 of 21
noting that the reduction was mostly 100%, regardless of the inoculum used. The antimi-
crobial action of O3 herein showed is related to its powerful oxidizing action. O3 has been
widely used as an antimicrobial, in both its gaseous and aqueous form, due to its wide
range of microbiological, cleaning, and metabolic activities [6,13,15,16,24,34,45,52,53]. The
antimicrobial action of O3 is related to its powerful oxidizing action. When it decomposes,
this gas generates an oxidant reaction by the liberation of reactive oxygen species (ROS),
including generating hydroxyl radicals (OH−) that have a greater oxidative potential (2.83
volts) over O3 and both act in the inactivation of several microorganisms [38,42,46,54,55].
Figure 6. Action of ozonized water on Gram-positive bacteria. Analysis of the percentage of death
and growth reduction in Log10 for the microorganisms S. aureus (A,B) and E. faecalis (C,D). The con-
centrations of 0.8, 0.6, and 0.4 ppm of O3 dissolved in tap water were tested, and the number of
colonies on each agar plate was calculated after incubation (1.0 mL of inoculum and 4.0 mL of ozo-
nized water at 20 °C for 1 min).
Figure 7. Action of ozonized water on yeast C. albicans. Analysis of the percentage of death (A) and
growth reduction in Log10 (B) for C. albicans. The concentrations of 0.8, 0.6, and 0.4 ppm of O3 dis-
solved in tap water were tested, and the number of colonies on each agar plate was calculated after
incubation (1.0 mL of inoculum and 4.0 mL of ozonized water at 20 °C for 1 min).
Figure 7. Action of ozonized water on yeast C. albicans. Analysis of the percentage of death (A)and growth reduction in Log10 (B) for C. albicans. The concentrations of 0.8, 0.6, and 0.4 ppm of O3
dissolved in tap water were tested, and the number of colonies on each agar plate was calculatedafter incubation (1.0 mL of inoculum and 4.0 mL of ozonized water at 20 ◦C for 1 min).
Although C. albicans suffered growth reduction at the inoculum concentration of1.5 × 108 CFU mL−1, all the tested bacteria did not reduce growth as much at this concen-tration (for this reason, the inoculum concentration of 108 for the bacteria was not plottedon the graphs), not allowing colony counting (bacterial confluence in the plaque). However,images of the plates (only bacteria) clearly revealed a microbial reduction following expo-sure to ozonized water in comparison with the control plates (Figures S3–S5). While in thetest plates it was possible to notice isolated colonies, but still impossible to count them, thedensity of the biomass is clearly so high in the control plates that no isolated colonies canbe observed (Figures S3–S5). On the other hand, C. albicans growth was strongly differentfrom the bacteria evaluated in the present study (Figure S6). It is important to emphasizethat the greater effect observed of the action of ozonized water in higher concentrationsof microorganism inoculum can be explained because the higher is the inoculum, thegreater is the colony forming unit in the control. For this reason, Log10 is higher at higherconcentrations of microorganisms and is lower at lower concentrations. However, to betterunderstand this, it is necessary to evaluate the results of Log10 and death rate together,noting that the reduction was mostly 100%, regardless of the inoculum used. The antimi-crobial action of O3 herein showed is related to its powerful oxidizing action. O3 has beenwidely used as an antimicrobial, in both its gaseous and aqueous form, due to its widerange of microbiological, cleaning, and metabolic activities [6,13,15,16,24,34,45,52,53]. Theantimicrobial action of O3 is related to its powerful oxidizing action. When it decomposes,this gas generates an oxidant reaction by the liberation of reactive oxygen species (ROS),including generating hydroxyl radicals (OH−) that have a greater oxidative potential (2.83volts) over O3 and both act in the inactivation of several microorganisms [38,42,46,54,55].
In this study, the results show a considerable effectiveness of the ozonized wa-ter in the different concentrations of inoculums tested, except for the concentration of1.5 × 108 CFU mL−1 in most of the isolates. Megahed et al. [27] observed that the bacterialload is a strong predictor for the reduction of pathogens present in cattle manure exposedto ozonized water. In the study conducted by Białoszewski et al. [14], the concentration ofO3 in water capable of eliminating the microorganisms contained in a suspension with adensity of 1.5–5.0 × 10⁸ CFU mL−1 was up to nine times (1.2–3.6 ppm).
These findings were higher than the efficacy of the ozonized water of our study atthe same density of microorganism tested. On the other hand, the use of ozonized water(0.4 and 8 ppm) against E. coli in an inoculum concentration equal to 3 × 10⁴ CFU mL−1
was efficient in decontaminating the hands [5]. However, it is important to considerthat the number of medically important microorganisms, such as S. aureus, P. mirabilis,Klebsiella spp., and E. coli, present in intact areas of human skin can vary between 102 and106 CFU/cm2 [56,57].

Biology 2021, 10, 525 13 of 20
The susceptibility of microorganisms to O3 varies according to the physiological stateof the cells, the pH of the medium, the temperature, the humidity, and the presence ofadditives, such as acids, surfactants, and sugars [3,58]. Relatively low concentrationsof O3 and a short contact time were sufficient to inactivate pure suspensions of severalmicroorganisms [44,58–60]. In this research, 1 min of exposure followed by the neutral-ization of O3 in the sodium thiosulfate buffer was effective in microbial reduction in thedifferent concentrations of inoculum tested [13,58]. According to the structure of the cellwall, microorganisms can exhibit different sensitivities to ozonized water. In this study, weobserved the greatest antimicrobial effect of ozonized water on Gram-positive bacteria [13].
These results are similar to those found by Zhang et al. [61] and Giuliani et al. [24],who, in their studies on the effect of ozonized water on different types of bacteria, reportedthat the effect of the ozonation process was greater in the action on Gram-positive microor-ganisms. However, in this work, a similar effect was observed for P. aeruginosa, whichis a Gram-negative bacterium. Therefore, it is still necessary to investigate this behavior,taking into consideration the individual characteristics of each microorganism. Factorsthat can be associated to the distinct presentation of these results are the amount of lipidsand lipoprotein present in the cell wall of the microorganisms, as well as the interactionbetween them and the behavior of the different membrane proteins [55,62].
Moore et al. [63] observed that, after ozonation (2 ppm per 4 h), Gram-negativebacteria (E. coli, S. liquefaciens, and L. innocua) were more sensitive to O3 compared withS. aureus. Białoszewsk et al. [14,33] concluded that all strains of S. aureus, E. coli, E. hirae,and C. albicans were rapidly killed in ozonized water with an O3 concentration in the rangeof 1.3–1.5 ppm during 1 min of exposure. P. aeruginosa ATCC 15442 was less sensitiveto the effects of O3, with a decimal logarithm of reduction of 4.97 between the testedconcentrations that was close to the limit level required by EN 1040:2006 [64]. The mostevident action of ozonized water against C. albicans may be related to the mechanism ofaction of O3 in fungi through the oxidative mechanism in cell membranes.
The cell walls of fungi are multifaceted and composed of approximately 80% carbohy-drates and 20% proteins and glycoproteins. The disulfide bonds in the fungal cell wall allowO3 to enter its cytoplasm and alter vital cell functions [65]. Similar results regarding theeffectiveness of ozonized water under C. albicans could be observed in other studies. Theozonized water displayed inhibitory effects on the growth and colonization of C. albicansadhered to the surface of acrylic resins for a prosthesis base [66], and there was a reductionin the CFU count of Candida spp. in the saliva of patients with oral candidiasis [67].
Zargaran et al. [68] demonstrated that O3 was effective in controlling the growth ofC. albicans and that it acted in the prevention of the formation of germ tubes and decreasedthe formation of biofilms. O3 acts under fungal species in a similar manner to the effectobserved in viruses, promoting modifications to the genetic material [21,34,55,69], and oneof the consequences is an increase in the resistance of some isolates to antifungals [68].
Considering the relevant biocidal aspect of ozone shown by our results, ozonizedwater is a potential sanitizer not only for decontamination of surfaces but as an agent todecrease the spreading of drug-resistant microorganisms in the environment. Some authorshave previously stated the possibility of future pandemics, whose pathogenic agents maybe bacteria for instance. Therefore, ozonized water can be useful in many spray devicescurrently available or under construction because it has high biocompatibility and couldbe used in these methodologies or devices to replace disinfectants considered toxic byregulatory agencies.
3.3. Microbials’ Morpho-Structural Changes Upon Incubation of Ozonized Tap Water
SEM micrograph visualizations were used to infer possible mechanisms for the ob-served decreases in the microorganisms’ growth. Figure 8 shows that, after exposure toozonized tap water at 0.8 ppm of O3, morphological and structural changes were observed.For C. albicans, while the non-exposed cells did not display any damage or structural modi-

Biology 2021, 10, 525 14 of 20
fications (Figure 8), the incubation with ozonized water led to severe cell wall disruptionas well as a high presence of cell debris (Figure 8).
Biology 2021, 10, x FOR PEER REVIEW 14 of 21
Considering the relevant biocidal aspect of ozone shown by our results, ozonized
water is a potential sanitizer not only for decontamination of surfaces but as an agent to
decrease the spreading of drug-resistant microorganisms in the environment. Some au-
thors have previously stated the possibility of future pandemics, whose pathogenic agents
may be bacteria for instance. Therefore, ozonized water can be useful in many spray de-
vices currently available or under construction because it has high biocompatibility and
could be used in these methodologies or devices to replace disinfectants considered toxic
by regulatory agencies.
3.3. Microbials’ Morpho-Structural Changes Upon Incubation of Ozonized Tap Water
SEM micrograph visualizations were used to infer possible mechanisms for the ob-
served decreases in the microorganisms’ growth. Figure 8 shows that, after exposure to
ozonized tap water at 0.8 ppm of O3, morphological and structural changes were ob-
served. For C. albicans, while the non-exposed cells did not display any damage or struc-
tural modifications (Figure 8), the incubation with ozonized water led to severe cell wall
disruption as well as a high presence of cell debris (Figure 8).
Additionally, the formation of vesicles on C. albicans’s cell surface was noticed (Fig-
ure 8, arrows), indicating an increase in the permeability of the plasma membrane. In the
case of E. coli, in comparing the control (Figure 8) with the exposed bacteria, we found
severe cell dissipation (Figure 8), cell wall lysis, and the presence of cell debris (Figure 8,
arrows). S. aureus suffered the same damages (Figure 8). These findings indicate that O3,
even dissolved in water, not only directly induced damage in the cell walls and plasma
membranes but also likely interfered in the cells’ osmolality.
Figure 8. Scanning electron microscopy of C. albicans, E. coli, and S. aureus non-treated or treated
with ozonized tap water at 0.8 ppm of O3. Microorganisms used in the test are displayed in left side
of the chart. Conditions (control or test) for the assay are shown above. Normal cells (Nc), cell de-
formity (Dc), and cellular debris (Db) are indicated in the pictures. Arrows were added to the images
to highlight other Db in the slides.
Oxygen radicals cause cellular lysis by penetrating the microbial cell membrane in
the presence of water, affecting its osmotic stability or interfering with cellular metabo-
lism. However, additional biocidal mechanisms occur from the direct reaction of aqueous
Figure 8. Scanning electron microscopy of C. albicans, E. coli, and S. aureus non-treated or treated withozonized tap water at 0.8 ppm of O3. Microorganisms used in the test are displayed in left side of thechart. Conditions (control or test) for the assay are shown above. Normal cells (Nc), cell deformity(Dc), and cellular debris (Db) are indicated in the pictures. Arrows were added to the images tohighlight other Db in the slides.
Additionally, the formation of vesicles on C. albicans’s cell surface was noticed (Figure 8,arrows), indicating an increase in the permeability of the plasma membrane. In the caseof E. coli, in comparing the control (Figure 8) with the exposed bacteria, we found severecell dissipation (Figure 8), cell wall lysis, and the presence of cell debris (Figure 8, arrows).S. aureus suffered the same damages (Figure 8). These findings indicate that O3, even dis-solved in water, not only directly induced damage in the cell walls and plasma membranesbut also likely interfered in the cells’ osmolality.
Oxygen radicals cause cellular lysis by penetrating the microbial cell membrane in thepresence of water, affecting its osmotic stability or interfering with cellular metabolism. How-ever, additional biocidal mechanisms occur from the direct reaction of aqueous O3 with organiccompounds of these microorganisms, thus influencing their metabolisms [17,27,30,70,71]. TheSEM analyses performed in the present study indicate that ozonized tap water may haveacted on the plasma membrane and cell walls of two of the bacteria and a yeast tested. TheSEM micrographs demonstrated in the results corroborated this type of O3 mechanismof action, which previously inactivated several pathogenic microorganisms [72,73]. Suchfindings were observed by Thanomsub [72], where O3 inhibited the growth and causedstructural changes, such as deformation and cell lysis in E. coli, Salmonella sp., S. aureus,and Bacillus subtilis, after 60 min of exposure. Clearly, the data found herein underscoresthe efficacy of O3 as an oxidizer, given the much shorter exposure time used and theachievement of structural damage in most of the E. coli, S. aureus, and C. albicans cells testedin the present research.
The formation of vesicles on the cell surface of C. albicans occurred due to the in-creased permeability of the plasma membrane and may represent the leakage of cellularconstituents of cells during exposure to O3 [3,72,74]. However, it is important to note

Biology 2021, 10, 525 15 of 20
that cellular inactivation by O3 includes damage to the intracellular components, such asprotein oxidation, damage to DNA, and alterations of enzymatic activity that cannot beobserved from SEM [75]. Additionally, the presence of normal cells in the SEM imagesindicates that genes related to oxidative stress, such as SoxR, OxyR, and RpoS, favored thesurvival of those cells [54,76].
The rising resistance of microbes to the current sanitizers and pharmacological treat-ments raises concerns for future pandemics and control difficulties for the environmentaland human dissemination of these pathogenic and resistant microorganisms. Therefore,the data presented herein indicate that the use of ozonized water in technologies for thedisinfection of surfaces, medical instruments, and even humans may be an alternativeand reliable approach to delay or stop the spread of microbes, as discussed by a recentlypublished patent prospecting [11]. Ozone therapy has been indeed effective not onlyin dentistry but also in endocrinology and physical therapy [24,67,73,77–81], leading, insome cases, to the control of microbial infections while treating other illnesses [53,79,82].Even methicillin-resistant S. aureus have been killed by O3 dissolved in oil during anexperimental model of infected ulcer [53].
As another important example in this context, major world health organizationsidentified a highly pathogenic yeast Candida auris, which is one of the causes of nosocomialbloodstream infections, leading to outbreaks in several healthcare facilities around theglobe, including Brazil, and associated with high mortality rates [83,84]. The control ofsuch dangerous fungi has been difficult due its resistance toward most antifungals and theusual disinfectants used in hospital environments [85,86].
Although a recent study demonstrated C. auris resistance toward low concentrationsand low exposure time of gaseous ozone [87], another study concluded a higher efficacyof repeated exposure of aqueous ozone, reducing the contamination of this yeast at aconcentration range of 0.9–0.1 ppm [88], which is similar to the optimal concentrationof 0.8 ppm in the present study. Considering this and the current efficacious use ofdissolved ozone in many therapeutic and disinfecting procedures, ozonized tap water maybe efficiently included in technologies for disinfection.
3.4. Cytotoxicity of Ozonized Tap Water
Figure 9 shows that the mammalian cell line exposed to any concentration of ozonizedwater was as viable as non-exposed cells (C-), showing no degradation of cell membranesor release of intracellular content, when visualized in inverted optical microscopy. Theexposed cells displayed 100% cell viability in almost all tested concentrations, with theexception of 0.6 ppm, in which one of the replicates achieved 98.02% viability. This outcomewas reflected in the non-significance of Dunn’s statistical test with comparisons betweenexposure of the three concentrations and the non-exposed cells. On the other hand, thepositive control (Triton-X), as expected, strongly affected viability, leading to completedeath of the cells in a significant manner. These results indicate that 1 min exposure toozonized water, for this cell line, did not present cytotoxic effects.
Before the application of ozonized water in human disinfection, it is important toverify the possibility of cytotoxic effects of ozonized water in mammalian cells. We testedthis parameter and confirmed cytotoxic effects in this mammalian cell line. These findingsare corroborated by previous studies, whose outcomes showed that some mammalian cellspossess complex antioxidant systems, which do not allow ozonolysis at the cytoplasmicmembrane and resist other oxidant properties of O3, even when the gas is dissolved inwater or oils [37,77,89].
Not only antioxidant enzymes but also hydro-liposoluble compounds are consideredcomponents of the antioxidant systems of certain eukaryotic cells, such as blood cellsand lineages cultured in vitro [77,78,89]. Additionally, it appears that O3 induces thesecells to deliver other biochemical reactions in the mitochondrion. This organelle producesadenosine triphosphate (ATP) as a response to free radicals, and this energy molecule, in

Biology 2021, 10, 525 16 of 20
turn, improves the cell viability, given that it is used as a physiological improvement forthe cells [37,77,89].
Biology 2021, 10, x FOR PEER REVIEW 16 of 21
complete death of the cells in a significant manner. These results indicate that 1 min expo-
sure to ozonized water, for this cell line, did not present cytotoxic effects.
Figure 9. The behavior of Hfib cells upon ozonized water exposure. The different concentrations
of ozonized water are displayed in the figure. C- represents the cells that were exposed to the me-
dium only and 10% Triton-X was used as the positive control (cell death); ***Statistical difference
between the positive control and the different concentrations of ozonated water.
Before the application of ozonized water in human disinfection, it is important to
verify the possibility of cytotoxic effects of ozonized water in mammalian cells. We tested
this parameter and confirmed cytotoxic effects in this mammalian cell line. These findings
are corroborated by previous studies, whose outcomes showed that some mammalian
cells possess complex antioxidant systems, which do not allow ozonolysis at the cytoplas-
mic membrane and resist other oxidant properties of O3, even when the gas is dissolved
in water or oils [37,77,89].
Not only antioxidant enzymes but also hydro-liposoluble compounds are considered
components of the antioxidant systems of certain eukaryotic cells, such as blood cells and
lineages cultured in vitro [77,78,89]. Additionally, it appears that O3 induces these cells to
deliver other biochemical reactions in the mitochondrion. This organelle produces aden-
osine triphosphate (ATP) as a response to free radicals, and this energy molecule, in turn,
improves the cell viability, given that it is used as a physiological improvement for the
cells [37,77,89].
4. Conclusions
Given the results exposed, ozonized water is characterized as a potential antimicro-
bial agent. The O3 concentration increases according to the variation of the temperature
and the pH value of the water. We demonstrated that the higher concentration of O3 in
water at 4 °C and pH 5 resulted in greater efficacy in the decontamination process. In
addition, ozonized water with a minimum concentration of 0.6 ppm was sufficient to
clearly reduce the number of tested microorganisms, indicating that it can be used as a
sanitizing agent. These results were corroborated with the SEM analysis (using ozonized
water at 0.8 ppm of O3), which indicated that the effects on osmotic stability—due to cell
wall lysis—might be one of the killing mechanisms of ozonized water. The ozonized water
was also shown to be a biocompatible agent, as it did not present cytotoxic effects in mam-
malian cells. Therefore, due to its cytocompatibility and biocidal action, ozonized water
was considered a viable alternative for microbial control, including for use in disinfection
methodologies or devices (even for human use) to replace biocidal agents considered toxic
by regulatory agencies.
Figure 9. The behavior of Hfib cells upon ozonized water exposure. The different concentrations ofozonized water are displayed in the figure. C- represents the cells that were exposed to the mediumonly and 10% Triton-X was used as the positive control (cell death); *** Statistical difference betweenthe positive control and the different concentrations of ozonated water.
4. Conclusions
Given the results exposed, ozonized water is characterized as a potential antimicrobialagent. The O3 concentration increases according to the variation of the temperature andthe pH value of the water. We demonstrated that the higher concentration of O3 in waterat 4 ◦C and pH 5 resulted in greater efficacy in the decontamination process. In addition,ozonized water with a minimum concentration of 0.6 ppm was sufficient to clearly reducethe number of tested microorganisms, indicating that it can be used as a sanitizing agent.These results were corroborated with the SEM analysis (using ozonized water at 0.8 ppm ofO3), which indicated that the effects on osmotic stability—due to cell wall lysis—might beone of the killing mechanisms of ozonized water. The ozonized water was also shown to bea biocompatible agent, as it did not present cytotoxic effects in mammalian cells. Therefore,due to its cytocompatibility and biocidal action, ozonized water was considered a viablealternative for microbial control, including for use in disinfection methodologies or devices(even for human use) to replace biocidal agents considered toxic by regulatory agencies.
Supplementary Materials: The following are available online at https://www.mdpi.com/article/10.3390/biology10060525/s1, Figure S1: Calibration curves for ozone quantification in water. Theassay was performed two times with twenty-three (A) and ten (B) X values (iodide dilutions) for thedetection of aqueous O3, respectively, Figure S2: Representative images of plating Escherichia coliexposed to different O3 concentrations. The concentrations of 0.8, 0.6, and 0.4 ppm of O3 dissolvedin tap water were tested and the number of colonies of the agar plate duplicates was calculatedafter incubation (1.0 mL of inoculum and 4.0 mL of ozonized water at 20 ◦C for 1 min), Figure S3:Representative images of plating Pseudomonas aeruginosa exposed to different O3 concentrations. Theconcentrations of 0.8, 0.6, and 0.4 ppm of O3 dissolved in tap water were tested and the number ofcolonies of the agar plate duplicates was calculated after incubation (1.0 mL of inoculum and 4.0 mL ofozonized water at 20 ◦C for 1 min), Figure S4: Representative images of plating Staphylococcus aureusexposed to different O3 concentrations. The concentrations of 0.8, 0.6, and 0.4 ppm of O3 dissolvedin tap water were tested and the number of colonies of the agar plate duplicates was calculatedafter incubation (1.0 mL of inoculum and 4.0 mL of ozonized water at 20 ◦C for 1 min), Figure S5:Representative images of plating Enterococcus faecalis exposed to different O3 concentrations. Theconcentrations of 0.8, 0.6, and 0.4 ppm of O3 dissolved in tap water were tested and the number ofcolonies of the agar plate duplicates was calculated after incubation (1.0 mL of inoculum and 4.0 mLof ozonized water at 20 ◦C for 1 min), Figure S6: Representative images of plating Candida albicans

Biology 2021, 10, 525 17 of 20
exposed to different O3 concentrations. The concentrations of 0.8, 0.6, and 0.4 ppm of O3 dissolvedin tap water were tested and the number of colonies of the agar plate duplicates was calculatedafter incubation (1.0 mL of inoculum and 4.0 mL of ozonized water at 20 ◦C for 1 min), Table S1.Physicochemical changes in ultrapure water to assess ozone stability, Table S2. Physicochemicalchanges in tap water to assess ozone stability, Table S3. Differences among O3 concentrations inultrapure and tap waters, Table S4. Comparisons of O3 stability in ultrapure and tap Waters.
Author Contributions: Conceptualization, G.A.F.M., G.M.L., C.N., M.G., L.A.B.M. and B.A.S.M.;Data curation, B.A.S.M.; Formal analysis, L.M.C.d.S., E.S.d.S., F.O.O., L.d.A.P.R., P.R.F.N., C.S.M.,A.S.L., L.A.B.M. and B.A.S.M.; Funding acquisition, C.N., M.G. and B.A.S.M.; Investigation, P.R.F.N.,G.A.F.M., G.M.L., C.N., L.A.B.M. and B.A.S.M.; Methodology, L.M.C.d.S., E.S.d.S., F.O.O., L.d.A.P.R.,P.R.F.N., C.S.M., A.S.L. and B.A.S.M.; Project administration, M.G., L.A.B.M. and B.A.S.M.; Resources,G.A.F.M., G.M.L., C.N., M.G. and L.A.B.M.; Software, L.M.C.d.S., E.S.d.S., F.O.O. and C.S.M.; Su-pervision, L.d.A.P.R., G.A.F.M., G.M.L., L.A.B.M. and B.A.S.M.; Validation, P.R.F.N.; Visualization,G.A.F.M.; and Writing—original draft, L.M.C.d.S., E.S.d.S., F.O.O., G.M.L., C.N., M.G., L.A.B.M. andB.A.S.M. All authors have read and agreed to the published version of the manuscript.
Funding: This research was funded by China Three Gorges Corporation–CTG BRASIL (Rio ParanáEnergia S.A. Rodovia MS-444 s/nº km 58, Ilha Solteira, Selviria—MS), with resources for the ANEELR&D Program (PD-10381-0420/2020) and SENAI CIMATEC.
Institutional Review Board Statement: Not applicable.
Informed Consent Statement: Not applicable.
Data Availability Statement: All the results found are available in this manuscript.
Acknowledgments: The authors greatly thank the University Center SENAI/CIMATEC (NationalService for Industrial Training—Serviço Nacional de Aprendizagem Industrial)—SENAI CIMATEC(Bahia—Brazil), China Three Gorges Corporation—CTG Brazil (Rio Paraná Energia S.A) and ANEEL(Agência Nacional de Energia Elétrica).
Conflicts of Interest: The authors declare no conflict of interest.
References1. Cicerone, R.J. Changes in Stratospheric Ozone. Science 1987, 237, 35–42. [CrossRef] [PubMed]2. Eliasson, B.; Hirth, M.; Kogelschatz, U. Ozone synthesis from oxygen in dielectric barrier discharges. J. Phys. D Appl. Phys. 1987,
20, 1421–1437. [CrossRef]3. Scott, D.B.; Lesher, E.C. Effect of Ozone on Survival and Permeability of Escherichia Coli. J. Bacteriol. 1963, 85, 567–576. [CrossRef]
[PubMed]4. Baysan, A.; Beighton, D. Assessment of the Ozone-Mediated Killing of Bacteria in Infected Dentine Associated with Non-Cavitated
Occlusal Carious Lesions. Caries Res. 2007, 41, 337–341. [CrossRef]5. Breidablik, H.; Lysebo, D.; Johannessen, L.; Skare, Å.; Andersen, J.; Kleiven, O. Ozonized water as an alternative to alcohol-based
hand disinfection. J. Hosp. Infect. 2019, 102, 419–424. [CrossRef] [PubMed]6. De Alba, A.M.; Rubio, M.; Morán-Diez, M.; Bernabéu, C.; Hermosa, R.; Monte, E. Microbiological Evaluation of the Disinfecting
Potential of UV-C and UV-C Plus Ozone Generating Robots. Microorganisms 2021, 9, 172. [CrossRef]7. Maurya, D.; Gohil, M.K.; Sonawane, U.; Kumar, D.; Awasthi, A.; Prajapati, A.K.; Kishnani, K.; Srivastava, J.; Age, A.; Pol, R.; et al.
Development of Autonomous Advanced Disinfection Tunnel to Tackle External Surface Disinfection of Covid-19 Virus in PublicPlaces. Transact. Indian Natl. Acad. Eng. 2020, 5, 281–287. [CrossRef]
8. Ghosh, C.; Sarkar, P.; Issa, R.; Haldar, J. Alternatives to Conventional Antibiotics in the Era of Antimicrobial Resistance. TrendsMicrobiol. 2019, 27, 323–338. [CrossRef] [PubMed]
9. Grace, K.; Shukla, M.; Dasgupta, A.; Chopra, S. Alternative Therapies to Antibiotics to Combat Drug-Resistant Bacterial Pathogens.In Antibacterial Drug Discovery to Combat Mdr: Natural Compounds, Nanotechnology and Novel Synthetic Sources; Iqbal, A., Shamim,A., Rumbaugh, K.P., Eds.; Springer: Singapore, 2019; pp. 193–212.
10. Aslam, B.; Wang, W.; Arshad, M.I.; Khurshid, M.; Muzammil, S.; Rasool, M.H.; Nisar, M.A.; Alvi, R.F.; Aslam, M.A.; Qamar, M.U.;et al. Antibiotic resistance: A rundown of a global crisis. Infect. Drug Resist. 2018, 11, 1645–1658. [CrossRef] [PubMed]
11. Mascarenhas, L.A.; Oliveira, F.O.; da Silva, E.S.; dos Santos, L.M.; de Alencar Pereira Rodrigues, L.; Neves, P.R.; Santos, A.Á.;Moreira, G.A.; Lobato, G.M.; Nascimento, C.; et al. Technological Advances in Ozone and Ozonized Water Spray DisinfectionDevices. Appl. Sci. 2021, 11, 3081. [CrossRef]
12. Wood, J.P.; Wendling, M.; Richter, W.; Rogers, J. The use of ozone gas for the inactivation of Bacillus anthracis and Bacillus subtilisspores on building materials. PLoS ONE 2020, 15, e0233291. [CrossRef] [PubMed]
Biology 2021, 10, 525 18 of 20
13. Song, M.; Zeng, Q.; Xiang, Y.; Gao, L.; Huang, J.; Huang, J.; Wu, K.; Lu, J. The antibacterial effect of topical ozone on the treatmentof MRSA skin infection. Mol. Med. Rep. 2017, 17, 2449–2455. [CrossRef]
14. Białoszewski, D.; Bocian, E.; Bukowska, B.; Czajkowska, M.; Sokół-Leszczynska, B.; Tyski, S. Antimicrobial activity of ozonatedwater. Med. Sci. Monit. 2010, 16, 71–75.
15. Akbar, A.; Medina, A.; Magan, N. Potential Control of Mycotoxigenic Fungi and Ochratoxin A in Stored Coffee Using GaseousOzone Treatment. Microorganisms 2020, 8, 1462. [CrossRef] [PubMed]
16. Porto, Y.D.; Trombete, F.M.; Freitas-Silva, O.; de Castro, I.M.; Direito, G.M.; Ascheri, J.L.R. Gaseous Ozonation to ReduceAflatoxins Levels and Microbial Contamination in Corn Grits. Microorganisms 2019, 7, 220. [CrossRef] [PubMed]
17. Hubbezoglu, I.; Zan, R.; Tunç, T.; Sumer, Z.; Hurmuzlu, F. Antifungal Efficacy of Aqueous and Gaseous Ozone in Root CanalsInfected by Candida albicans. Jundishapur J. Microbiol. 2013, 6, 8150. [CrossRef]
18. Dubuis, M.-E.; Dumont-Leblond, N.; Laliberté, C.; Veillette, M.; Turgeon, N.; Jean, J.; Duchaine, C. Ozone efficacy for the controlof airborne viruses: Bacteriophage and norovirus models. PLoS ONE 2020, 15, e0231164. [CrossRef]
19. Jiang, H.J.; Chen, N.; Shen, Z.Q.; Yin, J.; Qiu, Z.G.; Miao, J.; Yang, Z.W.; Shi, D.Y.; Wang, H.R.; Wang, X.W.; et al. Inactivation ofPoliovirus by Ozone and the Impact of Ozone on the Viral Genome. Biomed. Environ. Sci. 2019, 32, 324–333. [PubMed]
20. Brié, A.; Boudaud, N.; Mssihid, A.; Loutreul, J.; Bertrand, I.; Gantzer, C. Inactivation of murine norovirus and hepatitis A virus onfresh raspberries by gaseous ozone treatment. Food Microbiol. 2018, 70, 1–6. [CrossRef]
21. Victorin, K. Review of the genotoxicity of ozone. Mutat. Res. Genet. Toxicol. 1992, 277, 221–238. [CrossRef]22. Gandhi, C.K.; Mikerov, A.N.; Durrani, F.; Umstead, T.M.; Hu, S.; Wang, G.; Phelps, D.S.; Floros, J. Impact of Ozone, Sex, and
Gonadal Hormones on Bronchoalveolar Lavage Characteristics and Survival in SP-A KO Mice Infected with Klebsiella pneumoniae.Microorganisms 2020, 8, 1354. [CrossRef]
23. Da Silva, L.M.; Jardim, W.F. Trends and strategies of ozone application in environmental problems. Quím. Nova 2006, 29, 310–317.[CrossRef]
24. Giuliani, G.; Ricevuti, G.; Galoforo, A.; Franzini, M. Microbiological aspects of ozone: Bactericidal activity and antibi-otic/antimicrobial resistance in bacterial strains treated with ozone. Ozone Ther. 2018, 3. [CrossRef]
25. Langlais, B.; Reckhow, D.A.; Brink, D.R.; Awwa Research Foundation; Compagnie Générale des Eaux. Ozone in Water Treatment:Application and Engineering: Cooperative Research Report; Lewis Publishers: Chelsea, MI, USA, 1991.
26. Filho, F.A.L. Ozone application in water sources: Effects of operational parameters and water quality variables on ozone residualprofiles and decay rates. Braz. J. Chem. Eng. 2010, 27, 545–554. [CrossRef]
27. Megahed, A.; Aldridge, B.; Lowe, J. The microbial killing capacity of aqueous and gaseous ozone on different surfaces contami-nated with dairy cattle manure. PLoS ONE 2018, 13, e0196555. [CrossRef] [PubMed]
28. Martínez-Sánchez, G. Ozonized Water, Background, General Use in Medicine and Preclinic Support. Ozone Therapy Glob. J. 2019,9, 33–60.
29. United States Environmental Protection Agency. Alternative Disinfectants and Oxidants Guidance Manual; United States Environ-mental Protection Agency: Washington, DC, USA, 1999; p. 328.
30. Fontes, B.; Heimbecker, A.M.C.; Brito, G.D.S.; Costa, S.F.; van der Heijden, I.M.; Levin, A.S.; Rasslan, S. Effect of low-dose gaseousozone on pathogenic bacteria. BMC Infect. Dis. 2012, 12, 358. [CrossRef] [PubMed]
31. Shechter, H. Spectrophotometric method for determination of ozone in aqueous solutions. Water Res. 1973, 7, 729–739. [CrossRef]32. Gardoni, D.; Vailati, A.; Canziani, R. Decay of Ozone in Water: A Review. Ozone Sci. Eng. 2012, 34, 233–242. [CrossRef]33. Bialoszewski, D.; Pietruczuk-Padzik, A.; Kalicinska, A.; Bocian, E.; Czajkowska, M.; Bukowska, B.; Tyski, S. Activity of ozonated
water and ozone against Staphylococcus aureus and Pseudomonas aeruginosa biofilms. Med. Sci. Monit. 2011, 17, BR339–BR344.[CrossRef] [PubMed]
34. Ding, W.; Jin, W.; Cao, S.; Zhou, X.; Wang, C.; Jiang, Q.; Huang, H.; Tu, R.; Han, S.-F.; Wang, Q. Ozone disinfection ofchlorine-resistant bacteria in drinking water. Water Res. 2019, 160, 339–349. [CrossRef] [PubMed]
35. De Vries, T.A.; Hamilton, M.A. Estimating the Antimicrobial Log Reduction: Part Quantitative Assays. Quant. Microbiol. 1999, 1,29–45. [CrossRef]
36. Bastos, T.M.; Russo, H.M.; Moretti, N.S.; Schenkman, S.; Marcourt, L.; Gupta, M.P.; Wolfender, J.-L.; Queiroz, E.F.; Soares,M.B.P. Chemical Constituents of Anacardium occidentale as Inhibitors of Trypanosoma cruzi Sirtuins. Molecules 2019, 24, 1299.[CrossRef] [PubMed]
37. Colombo, M.; Ceci, M.; Felisa, E.; Poggio, C.; Pietrocola, G. Cytotoxicity evaluation of a new ozonized olive oil. Eur. J. Dent. 2018,12, 585–589. [CrossRef]
38. Khadre, M.; Yousef, A.E.; Kim, J.-G. Microbiological Aspects of Ozone Applications in Food: A Review. J. Food Sci. 2001, 66,1242–1252. [CrossRef]
39. Di Bernardo, L.; Dantas, A.D. Métodos E Técnicas De Tratamento De Água. Engenharia Sanitaria e Ambiental 2006, 11, 107.[CrossRef]
40. Qingshi, Z.; Cunli, L.; Zhengyu, X. A Study of Contacting Systems in Water and Wastewater Disinfection by Ozone. Mechanismof Ozone Transfer and Inactivation Related to the Contacting Method Selection. Ozone Sci. Eng. 1989, 11, 169–188. [CrossRef]
41. Tjahjanto, R.T.; Wardhani, S.; Brawijaya University. Ozone Determination: A Comparison of Quantitative Analysis Methods. J.Pure Appl. Chem. Res. 2012, 1, 18–25. [CrossRef]

Biology 2021, 10, 525 19 of 20
42. Westerhoff, P.; Aiken, G.; Amy, G.; Debroux, J. Relationships between the structure of natural organic matter and its reactivitytowards molecular ozone and hydroxyl radicals. Water Res. 1999, 33, 2265–2276. [CrossRef]
43. Rahman, M.F.; Jasim, S.Y.; Yanful, E.K.; Ndiongue, S.; Borikar, D. Advanced Oxidation Treatment of Drinking Water: Part II.Turbidity, Particles and Organics Removal from Lake Huron Water. Ozone Sci. Eng. 2010, 32, 295–304. [CrossRef]
44. Kim, J.-G.; Yousef, A.E.; Khadre, M.A. Ozone and its current and future application in the food industry. Adv. Food Nutr. Res.2003, 45, 167–218. [CrossRef] [PubMed]
45. Gorito, A.M.; Pesqueira, J.F.; Moreira, N.F.; Ribeiro, A.R.; Pereira, M.F.; Nunes, O.C.; Almeida, C.M.; Silva, A.M. Ozone-BasedWater Treatment (O3, O3/Uv, O3/H2O2) for Removal of Organic Micropollutants, Bacteria Inactivation and Regrowth Prevention.J. Environ. Chem. Eng. 2021, 9, 105315. [CrossRef]
46. Nöthe, T.; Fahlenkamp, H.; von Sonntag, C. Ozonation of Wastewater: Rate of Ozone Consumption and Hydroxyl Radical Yield.Environ. Sci. Technol. 2009, 43, 5990–5995. [CrossRef] [PubMed]
47. Ge, X.; Wang, X. Estimation of Freezing Point Depression, Boiling Point Elevation, and Vaporization Enthalpies of ElectrolyteSolutions. Ind. Eng. Chem. Res. 2009, 48, 5123. [CrossRef]
48. Ginot, F.; Lenavetier, T.; Dedovets, D.; Deville, S. Solute strongly impacts freezing under confinement. Appl. Phys. Lett. 2020, 116,253701. [CrossRef]
49. Collins, K.D.; Neilson, G.W.; Enderby, J.E. Ions in water: Characterizing the forces that control chemical processes and biologicalstructure. Biophys. Chem. 2007, 128, 95–104. [CrossRef] [PubMed]
50. Sória, M.; Tavares, V.E.Q.; Pinto, M.A.B.; Stumpf, L.; Zarnott, D.; Bubolz, J.; Nörenberg, B.G. Evaluation of physicochemical waterparameters in watersheds of southern Brazil. Ambient. Agua Interdiscip. J. Appl. Sci. 2020, 15, 1–11. [CrossRef]
51. Andreozzi, R.; Caprio, V.; Ermellino, I.; Insola, A.; Tufano, V. Ozone Solubility in Phosphate-Buffered Aqueous Solutions: Effectof Temperature,tert-Butyl Alcohol, and pH. Ind. Eng. Chem. Res. 1996, 35, 1467–1471. [CrossRef]
52. Vannini, A.; Canali, G.; Pica, M.; Nali, C.; Loppi, S. The Water Content Drives the Susceptibility of the Lichen Evernia prunastriand the Moss Brachythecium sp. to High Ozone Concentrations. Biology 2020, 9, 90. [CrossRef] [PubMed]
53. Silva, V.; Peirone, C.; Capita, R.; Alonso-Calleja, C.; Marques-Magallanes, J.; Pires, I.; Maltez, L.; Pereira, J.; Igrejas, G.; Poeta, P.Topical Application of Ozonated Oils for the Treatment of MRSA Skin Infection in an Animal Model of Infected Ulcer. Biology2021, 10, 372. [CrossRef] [PubMed]
54. Dantas, A.D.S.; Day, A.; Ikeh, M.; Kos, I.; Achan, B.; Quinn, J. Oxidative Stress Responses in the Human Fungal Pathogen,Candida albicans. Biomolecules 2015, 5, 142–165. [CrossRef] [PubMed]
55. Ersoy, Z.G.; Barisci, S.; Dinc, O. Mechanisms of the Escherichia Coli and Enterococcus Faecalis Inactivation by Ozone. LWT 2019,100, 306–313. [CrossRef]
56. World Health Organization. Who Guidelines on Hand Hygiene in Health Care: First Global Patient Safety Challenge: Clean Care is SaferCare; WHO: Geneva, Switzerland, 2010.
57. Larson, E.L.; Cronquist, A.B.; Whittier, S.; Lai, L.; Lyle, C.T.; Della Latta, P. Differences in skin flora between inpatients andchronically ill outpatients. Heart Lung 2000, 29, 298–305. [CrossRef] [PubMed]
58. Kim, J.-G.; Yousef, A.E.; Dave, S. Application of Ozone for Enhancing the Microbiological Safety and Quality of Foods: A Review.J. Food Prot. 1999, 62, 1071–1087. [CrossRef] [PubMed]
59. Inagaki, H.; Saito, A.; Sudaryatma, P.E.; Sugiyama, H.; Okabayashi, T.; Fujimoto, S. Rapid Inactivation of Sars-Cov-2 with OzoneWater. bioRxiv 2020. [CrossRef]
60. Shin, G.-A.; Sobsey, M.D. Reduction of Norwalk Virus, Poliovirus 1, and Bacteriophage MS2 by Ozone Disinfection of Water.Appl. Environ. Microbiol. 2003, 69, 3975–3978. [CrossRef] [PubMed]
61. Zhang, Y.; Wu, Q.; Zhang, J.; Yang, X.; Desk, S. Alteration in Escherichia coli and Streptococcus faecalis cells induced by ozone.SDRP J. Food Sci. Technol. 2017, 1. [CrossRef]
62. Komanapalli, I.R.; Lau, B.H. Inactivation of Bacteriophage Lambda, Escherichia Coli, and Candida Albicans by Ozone. Appl.Microbiol. Biotechnol. 1998, 49, 766–769. [CrossRef]
63. Moore, G.; Griffith, C.; Peters, A. Bactericidal Properties of Ozone and Its Potential Application as a Terminal Disinfectant. J. FoodProt. 2000, 63, 1100–1106. [CrossRef] [PubMed]
64. European Committee for Standardization. EN 1040-Basic Bactericidal Activity. UNE-EN 1040: 2006. Quantitative Suspension Testfor the Evaluation of Basic Bactericidal Activity (Phase 1). Accredited by ENAC; European Committee for Standardization: Brussels,Belgium, 2006; Volume 44.
65. Ouf, S.A.; Moussa, T.A.; Abd-Elmegeed, A.M.; Eltahlawy, S.R. Anti-fungal potential of ozone against some dermatophytes. Braz.J. Microbiol. 2016, 47, 697–702. [CrossRef] [PubMed]
66. Mirmortazavi, A.; Haghi, H.R.; Fata, A.; Zarrinfar, H.; Bagheri, H.; Mehranfard, A. Kinetics of antifungal activity of home-generated ozonated water on Candida albicans. Curr. Med. Mycol. 2018, 4, 27–31. [CrossRef]
67. Moger, G.; Khatri, I.; Kumar, N.A. Evaluation of effect of topical ozone therapy on salivary Candidal carriage in oral candidiasis.Indian J. Dent. Res. 2015, 26, 158–162. [CrossRef] [PubMed]
68. Zargaran, M.; Fatahinia, M.; Mahmoudabadi, A.Z. The efficacy of gaseous ozone against different forms of Candida albicans.Curr. Med. Mycol. 2017, 3, 26–32. [CrossRef] [PubMed]
69. Wigginton, K.R.; Kohn, T. Virus disinfection mechanisms: The role of virus composition, structure, and function. Curr. Opin. Virol.2012, 2, 84–89. [CrossRef] [PubMed]

Biology 2021, 10, 525 20 of 20
70. Freitas-Silva, O.; Morales-Valle, H.; Venâncio, A. Potential of Aqueous Ozone to Control Aflatoxigenic Fungi in Brazil Nuts. ISRNBiotechnol. 2013, 2013, 1–6. [CrossRef] [PubMed]
71. Taubeneck, U.; Hugo, W.B. (Eds.) Inhibition and Destruction of the Microbial Cell. Xiii + 819 S., 47 Abb., 118 Tab; Academic Press:London, UK; New York, NY, USA, 1971.
72. Thanomsub, B.; Anupunpisit, V.; Chanphetch, S.; Watcharachaipong, T.; Poonkhum, R.; Srisukonth, C. Effects of ozone treatmenton cell growth and ultrastructural changes in bacteria. J. Gen. Appl. Microbiol. 2002, 48, 193–199. [CrossRef]
73. Elvis, A.M.; Ekta, J.S. Ozone therapy: A clinical review. J. Nat. Sci. Biol. Med. 2011, 2, 66–70. [CrossRef] [PubMed]74. Zhang, Y.; Wu, Q.; Zhang, J.; Yang, X. Effects of ozone on membrane permeability and ultrastructure in Pseudomonas aeruginosa.
J. Appl. Microbiol. 2011, 111, 1006–1015. [CrossRef] [PubMed]75. Alia, A.S.; Kholoud, K.H.A.-O. The effect of ozone on bacterial vaginosis and how it is affected by ultrastructural changes of cells
by transmission electron microscope (TEM). Afr. J. Microbiol. Res. 2014, 8, 1060–1069. [CrossRef]76. Patil, S.; Valdramidis, V.; Karatzas, K.A.G.; Cullen, P.; Bourke, P. Assessing the microbial oxidative stress mechanism of ozone
treatment through the responses of Escherichia coli mutants. J. Appl. Microbiol. 2011, 111, 136–144. [CrossRef] [PubMed]77. Tonus, S.S.; Oguzkan, S.B.; Ugras, H.I.; Kıılıç, I.H. Determining the cytotoxic effect potential of ozonated hazelnut oil. Ozone Ther.
2018, 3. [CrossRef]78. Bocci, V. Ozone as Janus: This controversial gas can be either toxic or medically useful. Mediat. Inflamm. 2004, 13, 3–11. [CrossRef]
[PubMed]79. Khan, S.A.; Seyam, O.; Smith, N.L.; Reid, I.; Gandhi, J.; Jiang, W. Clinical utility of ozone therapy for musculoskeletal disorders.
Med. Gas. Res. 2018, 8, 103–110. [CrossRef] [PubMed]80. Oliveira Junior, J.O.; Lages, G.V. Ozonioterapia Em Lombociatalgia. Rev. Dor 2012, 13, 261–270. [CrossRef]81. Gavazza, A.; Marchegiani, A.; Rossi, G.; Franzini, M.; Spaterna, A.; Mangiaterra, S.; Cerquetella, M. Ozone Therapy as a Possible
Option in COVID-19 Management. Front. Public Health 2020, 8, 417. [CrossRef]82. Izadi, M.; Kheirjou, R.; Mohammadpour, R.; Aliyoldashi, M.H.; Moghadam, S.J.; Khorvash, F.; Jafari, N.J.; Shirvani, S.; Khalili, N.
Efficacy of comprehensive ozone therapy in diabetic foot ulcer healing. Diabetes Metab. Syndr. Clin. Res. Rev. 2019, 13, 822–825.[CrossRef] [PubMed]
83. ANVISA, National Health Surveillance Agency. Identificação De Possível Caso De Candida Auris No Brasil. Available on-line: https://www.gov.br/anvisa/pt-br/assuntos/noticias-anvisa/2020/identificacao-de-possivel-caso-de-candida-auris-no-brasil/ALERTA012020CANDIDAAURIS07.12.2020_2.pdf (accessed on 4 January 2021).
84. Alfouzan, W.; Dhar, R.; Albarrag, A.; Al-Abdely, H. The emerging pathogen Candida auris: A focus on the Middle-Easterncountries. J. Infect. Public Health 2019, 12, 451–459. [CrossRef] [PubMed]
85. Rutala, W.A.; Kanamori, H.; Gergen, M.F.; Sickbert-Bennett, E.E.; Weber, D.J. Susceptibility of Candida auris and Candida albicansto 21 germicides used in healthcare facilities. Infect. Control. Hosp. Epidemiology 2019, 40, 380–382. [CrossRef] [PubMed]
86. Cadnum, J.L.; Shaikh, A.A.; Piedrahita, C.T.; Sankar, T.; Jencson, A.L.; Larkin, E.L.; Ghannoum, M.A.; Donskey, C.J. Effectivenessof Disinfectants against Candida Auris and Other Candida Species. Infect. Control. Hosp. Epidemiol. 2017, 38, 1240–1243.[CrossRef] [PubMed]
87. Fu, L.; Le, T.; Liu, Z.; Wang, L.; Guo, H.; Yang, J.; Chen, Q.; Hu, J. Different efficacies of common disinfection methods againstcandida auris and other candida species. J. Infect. Public Health 2020, 13, 730–736. [CrossRef]
88. Livingston, S.; Cadnum, J.L.; Gestrich, S.; Jencson, A.L.; Donskey, C.J. Efficacy of automated disinfection with ozonated water inreducing sink drainage system colonization with Pseudomonas species and Candida auris. Infect. Control. Hosp. Epidemiol. 2018,39, 1497–1498. [CrossRef] [PubMed]
89. Nogales, C.G.; Ferreira, M.B.; Montemor, A.F.; Rodrigues, M.F.D.A.; Lage-Marques, J.L.; Antoniazzi, J.H. Ozone therapy as anadjuvant for endondontic protocols: Microbiological—Ex vivo study and citotoxicity analyses. J. Appl. Oral Sci. 2016, 24, 607–613.[CrossRef] [PubMed]