Ozonation Air Purification Technology in HVAC Applications
9
Lexuan Zhong is a postdoctoral fellow at Concordia University, Montreal, QC, and Fariborz Hghighat is a professor in the Building, Civil, and Environmental Engineering Department, Concordia University, Montreal, QC. Ozonation Air Purification Technology in HVAC Applications Lexuan Zhong, PhD Fariborz Haghighat, PhD Student Member ASHRAE Fellow ASHRAE ABSTRACT The conventional approach to improve indoor air quality is to ventilate a building with outdoor air. This is a costly and an energy inefficient approach. Ozonation air cleaners have been suggested as an alternative method for indoor applications. Ozone is a powerful oxidizing agent, employment of which has shown a promising prospect in wastewater treatment. However, little is known about the ozonation of a variety of volatile organic compounds (VOCs) for indoor environment application. In addition, ozone itself is a problematic product that may seriously threaten people’s health through harming the lung normal function and irritating the respiratory system. Therefore, it is of the upmost necessity to conduct a comprehensive research on the evaluation of the performance of ozonation air cleaners, so that a correct direction of its application prospects can be provided. This paper presents details of an innovative ozonation duct system which employs ozone producing lamps as an ozone source to exam the ozonation performance under the conditions relevant to the actual applications. Eight types of single compound (toluene, p-xylene, ethanol, 1- butanol, methyl ethyl ketone, acetone, hexane, and octane) are selected as representative indoor air pollutants with an inlet concentration range of 0.5-2 ppm. A systematic parametric evaluation of the effects of various kinetic parameters, including compound type, inlet VOCs concentration, and ozone concentration, is conducted, and new interpretations are provided from a fundamental analysis. Also, the by-products generated from the background test and the ozonation tests are studied in order to have a better understanding of the kinetics and mechanisms involved in the gas- phase ozonation. Experimental results indicate that ozonation process can lead to reductions of tested VOCs in the indoor air environment, which may have a profound impact on ozonation technological developments. INTRODUCTION Modern building ventilation design must take into account the health and comfort of the occupants as well as energy consumption and the environment. The system needs to protect occupants against chemical contaminants from numerous internal sources - office equipment, furniture, building materials, appliances, as well as bio-contaminants from the occupants themselves. To reduce exposure to internal contaminants outdoor air is brought in to dilute the contaminants and exhaust a portion to outdoors. The quantity of the outdoor air brought into the building can have a direct negative effect on the energy cost of ventilation. There is a cost to heat, cool, humidify or dehumidify the outdoor air depending on the location and season. This leads to a balancing act between Indoor Air Quality (IAQ) and ventilation cost. Presently, enormous air cleaners based on new technologies rather than the traditional adsorption/filtration technology are available in the market. It has been claimed that these devices are safe and effective in controlling indoor air pollution. Actually, there is insufficient data in literature to verify the efficiency and feasibility of these units. Also, the NY-14-C004 © 2014 ASHRAE (www.ashrae.org). Published on ASHRAE Papers CD: 2014 ASHRAE Winter Conference. For personal use only. Additional reproduction, distribution, or transmission in either print or digital form is not permitted without ASHRAE's prior written permission. 1
Transcript of Ozonation Air Purification Technology in HVAC Applications

Lexuan Zhong is a postdoctoral fellow at Concordia University, Montreal, QC, and Fariborz Hghighat is a professor in the Building, Civil, and
Environmental Engineering Department, Concordia University, Montreal, QC.
Ozonation Air Purification Technology in HVAC Applications
Lexuan Zhong, PhD Fariborz Haghighat, PhD
Student Member ASHRAE Fellow ASHRAE
ABSTRACT
The conventional approach to improve indoor air quality is to ventilate a building with outdoor air. This is a costly and an energy inefficient
approach. Ozonation air cleaners have been suggested as an alternative method for indoor applications. Ozone is a powerful oxidizing agent,
employment of which has shown a promising prospect in wastewater treatment. However, little is known about the ozonation of a variety of volatile
organic compounds (VOCs) for indoor environment application. In addition, ozone itself is a problematic product that may seriously threaten
people’s health through harming the lung normal function and irritating the respiratory system. Therefore, it is of the upmost necessity to conduct a
comprehensive research on the evaluation of the performance of ozonation air cleaners, so that a correct direction of its application prospects can be
provided.
This paper presents details of an innovative ozonation duct system which employs ozone producing lamps as an ozone source to exam the
ozonation performance under the conditions relevant to the actual applications. Eight types of single compound (toluene, p-xylene, ethanol, 1-
butanol, methyl ethyl ketone, acetone, hexane, and octane) are selected as representative indoor air pollutants with an inlet concentration range of
0.5-2 ppm. A systematic parametric evaluation of the effects of various kinetic parameters, including compound type, inlet VOCs concentration,
and ozone concentration, is conducted, and new interpretations are provided from a fundamental analysis. Also, the by-products generated from the
background test and the ozonation tests are studied in order to have a better understanding of the kinetics and mechanisms involved in the gas-
phase ozonation. Experimental results indicate that ozonation process can lead to reductions of tested VOCs in the indoor air environment, which
may have a profound impact on ozonation technological developments.
INTRODUCTION
Modern building ventilation design must take into account the health and comfort of the occupants as well as energy
consumption and the environment. The system needs to protect occupants against chemical contaminants from numerous
internal sources - office equipment, furniture, building materials, appliances, as well as bio-contaminants from the
occupants themselves. To reduce exposure to internal contaminants outdoor air is brought in to dilute the contaminants
and exhaust a portion to outdoors.
The quantity of the outdoor air brought into the building can have a direct negative effect on the energy cost of
ventilation. There is a cost to heat, cool, humidify or dehumidify the outdoor air depending on the location and season.
This leads to a balancing act between Indoor Air Quality (IAQ) and ventilation cost.
Presently, enormous air cleaners based on new technologies rather than the traditional adsorption/filtration
technology are available in the market. It has been claimed that these devices are safe and effective in controlling indoor air
pollution. Actually, there is insufficient data in literature to verify the efficiency and feasibility of these units. Also, the
NY-14-C004
© 2014 ASHRAE (www.ashrae.org). Published on ASHRAE Papers CD: 2014 ASHRAE Winter Conference. For personal use only. Additional reproduction, distribution, or transmission in either print or digital form is not permitted without ASHRAE's prior written permission.
1

information regarding the major functions and features of these devices is not clear. For the purpose of the performance
comparison of various air cleaners, the project first selected ozonation technology for exploration. Ozonation, an
innovative and developing technology, gradually becomes an alternative to improve indoor air quality (IAQ) through
airborne microbial and volatile organic compounds (VOCs) destruction (Chalmers et al., 1998; Chen et al., 2005; Zhong et
al., 2010).
Ozone (O3), the triatomic form of oxygen, is a powerful oxidizing agent which can react with organic compounds. In
the past half-century, kinetics and the mechanisms of the gas-phase reactions of O3 with organic compounds, mainly those
containing unsaturated carbon-carbon bonds, have been well examined in the atmospheric field. The possible reaction
mechanisms of the chain reactions of the photolysis of O3 are:
O3 + hν (λ≤3100 Å (310 nm)) → O(1D) + O2 (1)
O(1D) + H2O → 2∙ OH (2)
∙ OH + Pollutant + O2 → Products (CO2, H2O, etc.) (3)
O(1D) + M (M=air) → O(3P) + M (4)
Atkinson and Carter (1984) discussed gas-phase reactions of O3 with various classes of organics under the conditions
relevant to the atmosphere, and they found that O3 usually plays a positive role in removing alkenes. For alkanes, aromatics
and oxygen-containing organics, these reactions are of negligible atmospheric importance. It is worthwhile to mention that
their conclusions were made under atmospheric conditions, that is, O3 mixing ratios were generally at around 10-40 ppb
ground level, which is much less than the level created by O3-generating lamps.
As a method for purification of air stream, ozonation technology has been studied for decades. A review of scientific
research shows that O3 generators are not effective in removing toluene, formaldehyde, and acetaldehyde (Chen et al., 2005;
Esswein and Boeniger, 1994), but O3 readily reacted with d-Limonene, leading to form a variety of by-products, such as
organic acids, organic aerosols, and ultrafine particles (Chen et al., 2005; Fan et al., 2005; Alshawa et al., 2007; Yu et al.,
2011). Some studies utilizing electrostatic air cleaners or ionization air purifiers demonstrate O3 generation is associated
with ambient conditions, such as fan speed, humidity level, temperature, operation time, and electrode status (clean or
contaminated) (Dorsey and Davidson, 1994; Liu et al., 1997). Recently, several studies investigated the removal
performance of toluene and benzene by using a bench-top reactor with O3-producing UV lamps (Jeong et al., 2005;
Kibanova et al., 2009; Quici et al., 2010), and they found that O3 played a certain role to removal these compounds in the
presence of some catalysts. It is well known that O3 itself is a problematic compound that may seriously threaten people’s
health through harming the normal function of the lungs and irritating the respiratory system. Nevertheless, high O3
concentrations exceeding public health standards set by OSHA / NIOSH (100 ppb) were observed at outlet of some
devices (Chen et al., 2005), which indicates O3 generators are not suitable to be designed for the application in occupied
spaces. Ozonation technology could be applied in ductwork provided a strict control is conducted for O3 exposure. Hence,
it is of the upmost necessity to add O3 scrubbers at downstream to remove the excess O3.
O3 is highly unstable, readily reverting to derivatives, particularly in the presence of organic compounds or any
surfaces, and therefore the gas cannot be easily stored; consequently it is normally generated on site. In this study, O3 is
produced by using a vacuum VU (VUV) light which generates 1850 Å (185 nm) ultraviolet light. This wavelength has
sufficient energy to break oxygen into atomic oxygen. Single oxygen atom is highly unstable species, and thus rapidly
combines with oxygen to form O3. This paper attempts to evaluate ozonation performance for a wide range of VOCs using
an innovative duct system. A systematic parametric evaluation of the effects of various kinetic parameters, including
2

compound type, inlet concentration of VOCs, and O3 concentration, is conducted, and new interpretations are provided
from a fundamental analysis. Also, the by-products generated from the background test and the ozonation tests are
explored in order to have a better understanding of the kinetics and mechanisms involved in the gas-phase ozonation.
EXPERIMENTAL AND METHODOLOGY
Materials
Low-pressure mercury lamps of each 0.025 hp (18.4 W) (Ster-L-Ray, Atlantic Ultraviolet Inc.) were employed as an O3
source: a G18T5VH/U O3-producing (VUV) lamp with a maximum emission at 2540 Å (254nm) and a minor emission at
1850 Å (185nm). All lamps were powered by ballasts for ionization of the mercury vapor. The specifications of UV lamps
provided by the manufacturer are listed in Table 1.
Table 1 Manufacturer’s specifications of UV lamps (Ster-L-Ray, Atlantic Ultraviolet Inc.)
Lamp description Length
inch (mm) Lamps hp
(W)a
UV Output Total hp
(W)b
UV Output at 39.4 inch
(1 m)c
Ozone Outputd
Rated Effective
Hours Ozone producing lamp
G18T5VH/U 7.9 (201) 0.025 (18.4) 7.8×10⁻³
(5.8) 5.1×10⁻³ (59) 45.36 (1.6) 10,000
Notes: (a) Wattages is lamp watts only and does not include ballast loss.
(b) Ultraviolet output at 2540 Å (254 nm) at 100 hours and 902.5ºF (26.7℃) (approximate).
(c) Horsepower per square inch (microwatts per square centimeter) at 39.4 inch (1 m) from lamp. (d) Approximate O3 output in ounce per hour (grams per hour) under favorable conditions. Please note that O3
output is subject to considerable variation due to conditions under which the lamp is used; under many conditions, the O3
output may be only a fraction of the specified figure.
Eight reagent grade chemicals were selected as representative of indoor air contaminants, which included toluene
(99.9%), p-xylene (99.9%), 1-butanol (99.9%), n-hexane (96%), octane (95%), MEK (99.9%), and acetone (99.5%) from
Fisher Scientific Inc. (Canada), and ethanol (99%) from SAQ (Société des alcools du Québec - Québec Alcohol Board).
Other HPLC grade chemicals used for HPLC analysis include methanol (99.9%) and acetonitrile (99.9%) from Fisher
Scientific Inc. (Canada).
Experimental Set-up
A single pass mode test rig (shown in Figure 1) was built to evaluate the effectiveness of O3 removal for the selected
VOCs at three inlet concentration levels. The test rig was composed of four parallel test ducts with 1 ft × 1 ft (0.3 m × 0.3
m) of cross-sectional area each. Laboratory air was introduced directly to the system after passing through a pleated fabric
pre-filter. Four electronic low-flow probes (ELF-1200, EBTRON), based on the thermal dispersion technology, were
mounted at upstream to accurately measure the airflow rates in each ducts. The reactor section was designed to be versatile
so that different UV lamps with various geometries can be installed. Each duct had a fan with a variable speed control at
the end of the system so that the airflow rate could be controlled regardless of the flow resistances of different ozonation
systems. In this study, four O3 concentration levels were established by placing different numbers of lamps in each duct.
After the reactor, there was a probe installed at the center of each duct to monitor RH and temperature of air stream at
downstream, respectively. Upstream and downstream of each duct were fitted with cross sampling tubes to collect VOCs
samples, and bulkhead unions at downstream provided ports for the collection of O3. The adsorption module after
sampling section contained carbon and chemical absorbents, which trapped the residual VOCs and the generated by-
products. At the end of the duct system metal honeycomb coated with MnO2 post-filters were installed for residual O3
3

decomposition. The number of layers of MnO2 post-filters employed in experiments were determined by the O3
concentration generated downstream, and, for all experiments, the outlet O3 concentrations after the duct system were
controlled in less than 50 ppb.
VOCs
Duct1
Duct2
Duct3
Duct4
Figure 1 Schematic diagram of the experimental setup
Analytical Methods
The inlet and outlet concentrations of VOCs and gaseous by-products were qualitatively and quantitatively monitored
by an online calibrated photo-acoustic multi-gas monitor (B&K 1302) equipped with an auto sampler (CBISS MK3) and an
offline calibrated High Performance Liquid Chromatography and Gas Chromatography (HPLC, GC/MS-ATD, Perkin
Elmer). The concentration of O3 in each effluent stream was measured by a calibrated six-channel O3 analyzer (Model
465L) which was programmed to alternatively and continuously take sample from the downstream of each duct with an
accuracy of ±1% of reading.
For the HPLC analysis, potential carbonyl by-products were trapped on a high purity silica adsorbent coated with 2, 4-
dinitrophenylhydrazine (2, 4-DNPH) (Supelco LpDNPH S10L). Sample eluate was separated and analyzed by the HPLC
with UV detection (3600Å (360 nm)) equipped with a C18 Brownlee validated micro-bore column (5.9 inch × 0.2 inch
(150 mm x 4.6 mm) ID, 0.2 mil (5 μm) film thickness). Acetonitrile and distilled water were used as mobile phase with a
flow rate of (3.7 ft3/hr) (1.0 mL/min). A gradient analysis method was developed: the ratio of 70% acetonitrile/ 30% water
was held for 6 minutes, then the ratio increased to 100% acetonitrile/ 0% water and maintained for 3 minutes, and finally
the ratio returned back to 70% acetonitrile/ 30% water for 4 minutes.
Two calibrated UV radiometers (Steril-Aire and ILT900-R) were used to measure irradiance at 2540 Å (254 nm) and
1850 Å (185nm).
Experimental Procedure and Method
The selected VOCs were injected using an automatic syringe pump (KD Scientific). The laboratory compressed air
was used as the carrier gas and its flow rate was controlled by a mass flow controller. The target concentration of the
selected challenge gases was a sub-ppm level (0.25-2 ppm) which closely represented indoor air pollution conditions. All
experiments were carried out at similar operational conditions, except humidity was unregulated in this system. Table 2
summarizes the detailed experimental conditions.
Table 2: Experimental conditions
Parameter Experimental Conditions Max. Test Standard Deviation
Inlet concentration (ppm) 0.25-2 ±0.27 Volumetric flow rate cfm (m3/h) 100 (170) ±7.2 (12.2 ) RH (%) 35-60 ±2.4 Light intensity (W/m2) 16-43 ±1.0
4

Temperature ºF (℃) 676-744 (20-22) ±27.0 (0.8)
Ozone (ppb) 500-2300 ±20
First, the fans were turned on and were set at an appropriate airflow rate; the multi-gas analyzer and the O3 monitor
were turned on to measure the background for 30 minutes; and then UV lamps were switched on to get a stable UV output.
When the experimental conditions became stable, the ozonation could be initiated by first injection of a challenge VOC
with an appropriate injection rate, and the real-time concentration was recorded by the online measurement system. Once
the steady-state condition was reached, 2,4-DNPH samples were taken at sampling rate of 79.3 ft3/min (1.3 L/min) for 1.5
hours to explore the generation of by-products. The experimental data collected from the upstream and the downstream
measurement ports was employed to calculate the effectiveness of an ozonation air cleaner, and it was calculated from the
following equation:
(5)
where ηt (%) is the single-pass efficiency of a pollutant; Cup,t (mg/m3) is the VOC concentration at upstream as a function
of time and Cdown,t (mg/m3) is the VOC concentration at downstream as a function of time.
RESULTS AND DISCUSSION
Effect of VOCs Type
Single compound with three inlet concentration levels was employed to explore the ozonation effect. Figure 2 shows
the single-pass removal efficiencies of O3 with similar concentrations for various compounds at the 100 cfm (170 m3/h)
airflow rate. It clearly shows acetone and MEK were scarcely removed by O3. This low reactivity in the reaction is due to
the weaker electron withdrawing power of the carbonyl group compared to the hydrocarbons. Hence, ketones react with
O3 much less readily than the other compounds do. In a duct system, the effect of ozonation on the elimination of ketones
is negligible. Contrary to the claims by atmosphere scientists that O3 is not effective at removing VOCs except alkenes, a
reaction of O3 with alcohols, alkanes, and aromatics can be observed, which implies that highly reactive hydroxyl radicals
generated from photolysis of O3 (Eq. 1-3) in the presence of UV radiation are a key reaction species during the ozonation
(Bailey, 1982). Another feasible explanation is the contribution of photolysis effect since photons with energy at UV
wavelengths can affect the chemical bonds. The results also indicate the strong interaction of photons and O3 with the
heavier compounds in the same class resulting in higher removal efficiency, especially for aromatics. For toluene and p-
xylene with similar inlet concentrations, the single-pass removal efficiency of p-xylene by the synergistic effect was around
twice of toluene. This is consistent with the results reported by Bailey (1982) that the rate of O3 attack on substituted
benzenes increases with increasing alkyl group substitution.
0
200
400
600
800
1000
1200
1400
1600
0%
5%
10%
15%
20%
25%
30%
35%
250 500 1000 250 500 800 250 500 1000 250 500 1000 250 500 1000 250 500 1000 500 10002000 250 500 1000
ethanol (ppb) 1-butanol (ppb) hexane (ppb) octane (ppb) toluene (ppb) p-xylene (ppb) acetone (ppb) MEK (ppb)
Ozo
ne c
once
ntra
tion
(ppb
)
Sin
gle
-pas
s re
mov
al e
ffici
ency
by
O3
and
phot
ons
Efficiency
Ozone concentration
Figure 2 Single-pass removal efficiencies of various VOCs at three concentration levels by ozonation (RH=35%-58%)
5
Effect of Concentration
VOC Concentration. The inlet concentration of 250 ppb, 500 ppb and 1000 ppb was adopted for the selected VOC,
except that maximum 800 ppb was selected for 1-butanol due to difficult evaporation and minimum 500 ppb was used for
acetone because of detection limit. Figure 2 shows that under the condition of a constant O3 concentration, an increased
concentration of a challenge compound reduced significantly the single-pass removal efficiency. This can be interpreted by
the limited amount of hydroxyl radicals initiated by photolysis of O3 at similar concentrations. The amount of VOC
molecules effectively participating in the ozonation is not enhanced at the same ratio as an increase of the inlet
concentration resulting in a decrease of removal efficiency. Since the typical indoor VOC levels are at tens of ppb, it is
predictable to claim that the ozonation technology is capable of achieving satisfactory removal efficiency for real HVAC
applications.
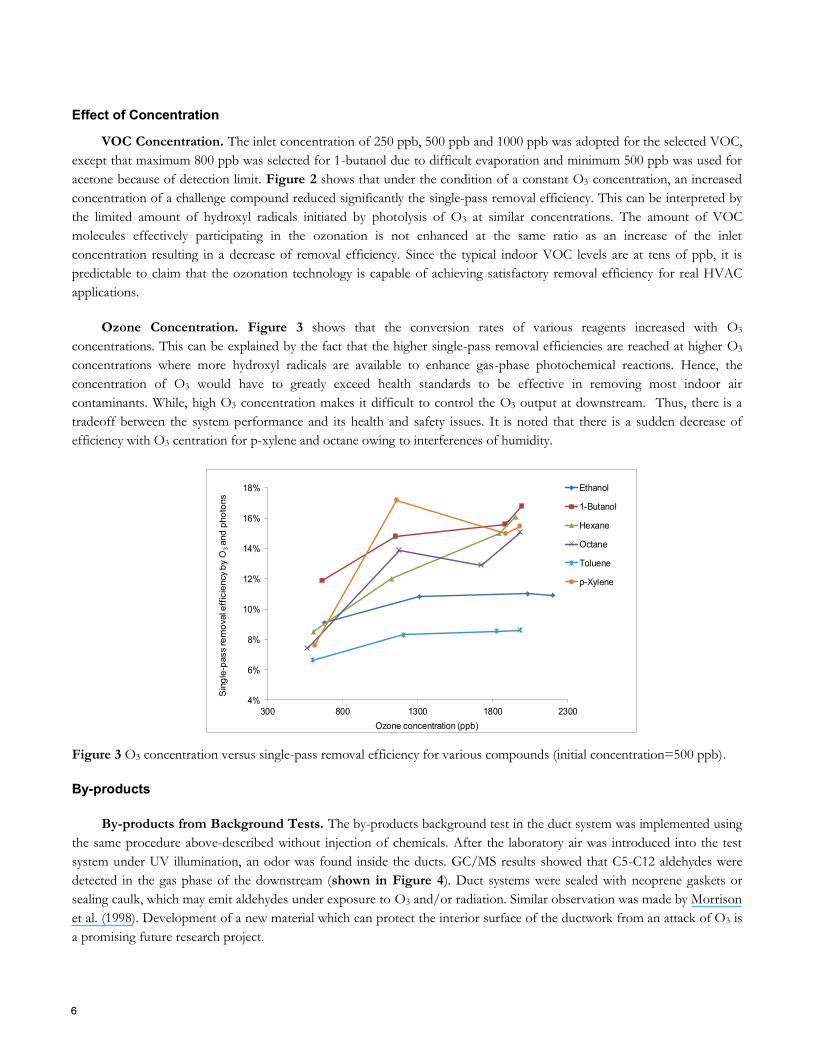
Ozone Concentration. Figure 3 shows that the conversion rates of various reagents increased with O3
concentrations. This can be explained by the fact that the higher single-pass removal efficiencies are reached at higher O3
concentrations where more hydroxyl radicals are available to enhance gas-phase photochemical reactions. Hence, the
concentration of O3 would have to greatly exceed health standards to be effective in removing most indoor air
contaminants. While, high O3 concentration makes it difficult to control the O3 output at downstream. Thus, there is a
tradeoff between the system performance and its health and safety issues. It is noted that there is a sudden decrease of
efficiency with O3 centration for p-xylene and octane owing to interferences of humidity.
4%
6%
8%
10%
12%
14%
16%
18%
300 800 1300 1800 2300
Sin
gle
-pass re
mo
val e
ffic
iency b
y O
3 a
nd
pho
tons
Ozone concentration (ppb)
Ethanol
1-Butanol
Hexane
Octane
Toluene
p-Xylene
Figure 3 O3 concentration versus single-pass removal efficiency for various compounds (initial concentration=500 ppb).
By-products
By-products from Background Tests. The by-products background test in the duct system was implemented using
the same procedure above-described without injection of chemicals. After the laboratory air was introduced into the test
system under UV illumination, an odor was found inside the ducts. GC/MS results showed that C5-C12 aldehydes were
detected in the gas phase of the downstream (shown in Figure 4). Duct systems were sealed with neoprene gaskets or
sealing caulk, which may emit aldehydes under exposure to O3 and/or radiation. Similar observation was made by Morrison
et al. (1998). Development of a new material which can protect the interior surface of the ductwork from an attack of O3 is
a promising future research project.
6
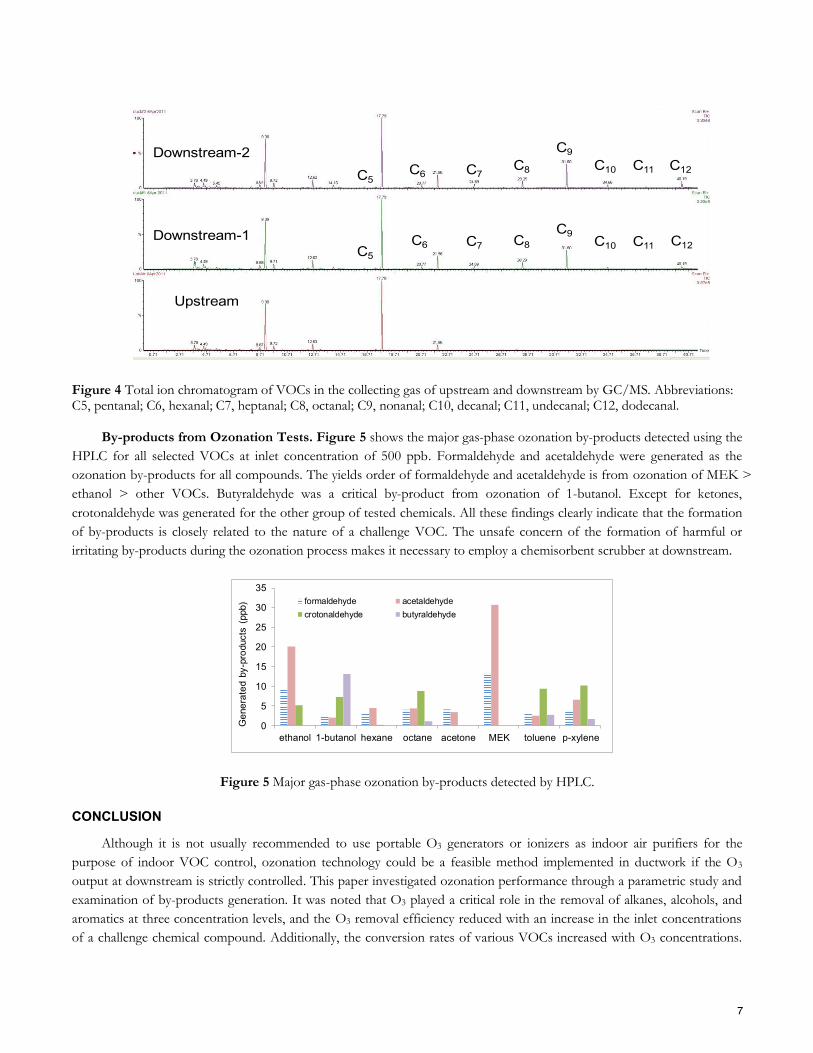
C5C6 C7
C8
C9
C10 C11 C12
Upstream
Downstream-2
Downstream-1
C5
C6 C7 C8
C9C10 C11 C12
Figure 4 Total ion chromatogram of VOCs in the collecting gas of upstream and downstream by GC/MS. Abbreviations: C5, pentanal; C6, hexanal; C7, heptanal; C8, octanal; C9, nonanal; C10, decanal; C11, undecanal; C12, dodecanal.
By-products from Ozonation Tests. Figure 5 shows the major gas-phase ozonation by-products detected using the
HPLC for all selected VOCs at inlet concentration of 500 ppb. Formaldehyde and acetaldehyde were generated as the
ozonation by-products for all compounds. The yields order of formaldehyde and acetaldehyde is from ozonation of MEK >
ethanol > other VOCs. Butyraldehyde was a critical by-product from ozonation of 1-butanol. Except for ketones,
crotonaldehyde was generated for the other group of tested chemicals. All these findings clearly indicate that the formation
of by-products is closely related to the nature of a challenge VOC. The unsafe concern of the formation of harmful or
irritating by-products during the ozonation process makes it necessary to employ a chemisorbent scrubber at downstream.
0
5
10
15
20
25
30
35
ethanol 1-butanol hexane octane acetone MEK toluene p-xylene
Ge
ne
rate
d b
y-p
roducts
(ppb) formaldehyde acetaldehyde
crotonaldehyde butyraldehyde
Figure 5 Major gas-phase ozonation by-products detected by HPLC.
CONCLUSION
Although it is not usually recommended to use portable O3 generators or ionizers as indoor air purifiers for the
purpose of indoor VOC control, ozonation technology could be a feasible method implemented in ductwork if the O3
output at downstream is strictly controlled. This paper investigated ozonation performance through a parametric study and
examination of by-products generation. It was noted that O3 played a critical role in the removal of alkanes, alcohols, and
aromatics at three concentration levels, and the O3 removal efficiency reduced with an increase in the inlet concentrations
of a challenge chemical compound. Additionally, the conversion rates of various VOCs increased with O3 concentrations.
7

Formation of by-products had a close relationship with the ozonation mechanisms of different VOCs. The formation and
the concentrations of the by-products depended on the experimental conditions as well as the nature of a challenge VOC.
Ozonation combined with other purification technology could be a possible approach to remove harmful by-products and
excess O3, and to improve the removal efficiency of the in-duct air cleaners .
ACKNOWLEDGMENTS
The authors would like to express their gratitude to the Natural Science and Engineering Research Council Canada
(NSERC) for the financial support and Circul-Aire, Inc. for providing the ductwork and UV lights. They would like also to
acknowledge of the financial support of ASHRAE through a Grand-In-Aid scholarship.
REFERENCES
Alshawa, A., Russell, A. R., Nizkorodov, S. A. 2007. Kinetic analysis of competition between aerosol particle removal and generation by ionization air purifiers. Environmental Science and Technology, 41(7): 2498-2504.
Atkinson, R., Carter, W.P.L. 1984. Kinetics and mechanisms of the gas-phase reactions of ozone with organic compounds under atmospheric conditions. Chemical Reviews, 84: 437-470.
Bailey, P.S. 1982. Ozonation in organic chemistry, Volume II Nonolefinic Compounds. Academic press, Inc., New York. Chalmers, I.D., Baird, R.C., Kelly, T. 1998. Control of an ozone generator- theory and practice. Measurement Science and
Technology, 9: 983-988. Chen, W., Zhang, J.S., Zhang, Z. 2005. Performance of air cleaners for removing multiple volatile organic compounds in
indoor air. ASHRAE Transactions, 111 (1): 1101-1114. Dorsey, J.A., Davidson, J.H. 1994. Ozone production in electrostatic air cleaners with contaminated electrodes. IEEE
Transactions on Industry Applications, 30(2): 370-376. Esswein, E.J., Boeniger, M.F. 1994. Effects of an ozone-generating air-purifying device on reducing concentrations of
formaldehyde in air. Applied Occupational Environmental Hygiene. 9(2):139-146. Fan, Z., Weschler, C. J., Han, In-K., Zhang, J. 2005. Co-formation of hydroperoxides and ultra-fine particles during the
reactions of ozone with a complex VOC mixture under simulated indoor conditions. Atmospheric Environment, 39(28): 5171-5182.
Jeong, J., Sekiguchi, K., Lee, W., Sakamoto, K. 2005. Photodegration of gaseous volatile organic compounds (VOCs) using TiO2 photoirradiated by an ozone-producing UV lamp: decomposition characteristics, identification of by-products and water-soluble organic intermediates. J. Photochem. Photobiol. A Chem. 169: 279-287.
Kibanova, D., Cervini-Silva, J., Destaillats, H. 2009. Efficiency of clay-TiO2 nanocomposites on the photocatalytic elimination of a model hydrophobic air pollutant, Environ. Sci. Technol. 43: 1500-1506.
Liu, L., Guo, J., Li, J., Sheng, L. 1997. The effect of corona wire heating and geometry on ozone generation in a negative ion air cleaner. Conference Record of the 1997 IEEE Industry Applications Conference Thirty-Second IAS Annual Meeting (Cat. No.97CH36096), 3: 1744-1749.
Morrison, G.C., Nazaroff W.W., Cano-Ruiz, J. A., Hodgson, A.T., Modera, M.P. 1998. Indoor air quality impacts of ventilation ducts: ozone removal and emissions of volatile organic compounds. Journal of the Air & Waste Management Association, 48: 941-952.
Quici, N., Vera, M.L., Choi, H., Li Puma, G., Dionysiou, D.D., Litter, M.I., Destaillats, H. 2010 Effect of key parameters on the photocatalytic oxidation of toluene at low concentrations in air under 254 + 185 nm UV irradiation, Appl. Catal. B: Environ. 95: 312-319.
Yu, K.-P., Lee, G. W.-M., Hsieh, C.-P.; Lin, C.-C. 2011 Evaluation of ozone generation and indoor organic compounds removal by air cleaners based on chamber tests. Atmospheric Environment, 45( 1): 35-42.
Zhong, L., Haghighat, F., Blondeau, P., and Kozinski, J. 2010. Modeling and physical interpretation of photocatalytic oxidation efficiency in indoor air applications. Building and Environment, 45: 2689-2697.
8

Copyright of ASHRAE Transactions is the property of ASHRAE and its content may not becopied or emailed to multiple sites or posted to a listserv without the copyright holder'sexpress written permission. However, users may print, download, or email articles forindividual use.