
FarSense: pushing the range limit of WiFi-based respiration ...
Oxygen isotope content of CO2 in nocturnal ecosystem respiration:
2. Short-term dynamics of foliar and soil component fluxes in an
old-growth ponderosa pine forest
D. R. Bowling,1 N. G. McDowell,2,3 J. M. Welker,4 B. J. Bond,2 B. E. Law,2
and J. R. Ehleringer1
Received 16 April 2003; revised 29 August 2003; accepted 29 October 2003; published 23 December 2003.
[1] The oxygen isotope contents (d18O) of soil, xylem, and leaf water and ecosystemrespiration were studied in a ponderosa pine forest during summer 2001. Our goal was toassess whether d18O of CO2 could be used to quantify the relative contributions ofsoil and foliar respiration to total nocturnal ecosystem respiration. The d18O in leaf andsoil water showed enrichment over a 2-week sampling period as the weather became hotand dry (leaves 0.9 to 15.0%, and soil �10.4 to �3.1%), while d18O of xylem waterremained constant (�12.9%). Water in the soil was enriched in 18O near the soil surface(�6.4% at 5 cm depth) relative to greater depths (�11.1% at 20 cm). The d18O ofecosystem respiration became gradually enriched over the 2-week sampling period (from24.2 initially to 32.9% at the end, VSMOW scale). Soil respiration contributed 80 ± 12percent to the total respiratory flux, close to estimates from scaled-up chamber data(77% [Law et al., 2001a]). Quantitative application of the isotopic approach to determinerespiratory proportions required direct measurement of d18O of soil and xylem water, airand soil temperature, and humidity. Better estimates of the isotopic signatures of componentfluxes could be achieved with additional measurements and more detailed modeling.Results demonstrate that (1) there is variability in d18O of precipitation inputs to ecosystems,(2) immediately following a precipitation event, d18O of ecosystem respiration may reflectd18O of precipitation, (3) periods of hot dry weather can substantially enrich ecosystemwater pools and subsequently alter the isotope content of CO2 in ecosystem respiration, and(4) stable oxygen isotopes in CO2 can be used to quantify the foliar and soil components ofecosystem respiration. INDEX TERMS: 0315 Atmospheric Composition and Structure: Biosphere/
atmosphere interactions; 0365 Atmospheric Composition and Structure: Troposphere—composition and
chemistry; 1615 Global Change: Biogeochemical processes (4805); 1818 Hydrology: Evapotranspiration;
KEYWORDS: soil water, leaf water, carbon cycle, Oregon, d18O, flux, Metolius
Citation: Bowling, D. R., N. G. McDowell, J. M. Welker, B. J. Bond, B. E. Law, and J. R. Ehleringer, Oxygen isotope content of
CO2 in nocturnal ecosystem respiration: 2. Short-term dynamics of foliar and soil component fluxes in an old-growth ponderosa pine
forest, Global Biogeochem. Cycles, 17(4), 1124, doi:10.1029/2003GB002082, 2003.
1. Introduction
[2] Interactions between respired CO2 and water pools inleaf tissue and the soil profile impart distinct oxygen isotopesignatures to CO2 in foliar and soil respiratory fluxes. Suchisotopic labels may provide an opportunity to quantify the
contributions of each component flux to total ecosystemrespiration. However, we presently have a poor understand-ing of how the oxygen isotope content (d18O) of totalecosystem respiration might be influenced by variation ind18O of precipitation and isotopic modification of soil andleaf water pools through evaporative enrichment. Suchvariation could contribute to a dynamic pattern in d18O ofrespiratory fluxes on timescales of hours to seasons. Anunderstanding of these dynamics is a prerequisite to theirquantitative application in separating foliar and soil respi-ratory contributions to total nocturnal ecosystem respiration.[3] Factors influencing the oxygen isotope content of
ecosystem respiration (dR) are discussed in a companionpaper [Bowling et al., 2003b]. Keeling [1958, 1961]observed that d18O of CO2 in air within ecosystems varied,but did not correlate well with CO2 concentration. Thiscontrasted with the pattern observed for carbon isotopes of
GLOBAL BIOGEOCHEMICAL CYCLES, VOL. 17, NO. 4, 1124, doi:10.1029/2003GB002082, 2003
1Stable Isotope Ratio Facility for Environmental Research, Departmentof Biology, University of Utah, Salt Lake City, Utah, USA.
2Department of Forest Science, Oregon State University, Corvallis,Oregon, USA.
3Now at Earth and Environmental Sciences Division, Hydrology,Geochemistry and Geology Group, Los Alamos National Laboratory, LosAlamos, New Mexico, USA.
3Natural Resource Ecology Laboratory, Colorado State University, FortCollins, Colorado, USA.
Copyright 2003 by the American Geophysical Union.0886-6236/03/2003GB002082$12.00
34 - 1
CO2, and was an indication that different processes con-trolled the carbon and oxygen isotope ratios of respiratoryCO2. Francey and Tans [1987] and Friedli et al. [1987]suggested that isotopic exchange with vegetation and soilsstrongly influenced d18O of CO2 in the atmosphere. Enrich-ment of leaf water in 18O associated with transpiration wasfirmly established [Dongmann et al., 1974; Forstel, 1978;Farris and Strain, 1978], and leaf-level gas exchangeexperiments demonstrated a strong connection between leafwater enrichment and exchange with CO2. These andsubsequent studies led to a firm mechanistic understandingof the factors controlling leaf water enrichment in 18O andthe accompanying isotopic effects on CO2 during photo-synthesis [Flanagan et al., 1991; Farquhar et al., 1993;Farquhar and Lloyd, 1993; Roden and Ehleringer, 1999;Gillon and Yakir, 2000a, 2000b].[4] Theory behind the isotopic composition of CO2 in soil
profiles and soil fluxes is fairly well advanced [Ciais et al.,1997; Tans, 1998; Amundson et al., 1998], but there havebeen few experimental studies that measured d18O of thesoil-respired flux (which we denote dsoil). Hesterberg andSiegenthaler [1991] demonstrated that CO2 within the soilwas in isotopic equilibrium with soil water in an alpinegrassland in Switzerland, and further measurements in othersoil types suggest that isotopic equilibrium is reached atdepth [Amundson et al., 1998]. Miller et al. [1999] showedclearly that dsoil was controlled by interaction with soilwater.[5] The above studies provide a solid basis from which
we can begin to interpret isotopic patterns that are observedat the ecosystem scale. Flanagan and Varney [1995] andFlanagan et al. [1997] showed that diurnal variation in d18Owithin coniferous forests in Canada could be attributed tooxygen isotopic discrimination by photosynthesis andinteractions between soil-respired CO2 and soil water.Exchange with water within a thick moss layer present atsome boreal black spruce forests also caused isotopic effectson CO2 produced by respiration belowground [Flanagan etal., 1997, 1999].[6] Other studies have also observed pronounced diurnal
and vertical variation in d18O of CO2 within temperatedeciduous forests [Harwood et al., 1999; Bowling et al.,1999], temperate coniferous forests [Mortazavi andChanton, 2002], tropical forests [Buchmann et al., 1997;Sternberg et al., 1998], and agricultural crops [Yakir andWang, 1996; Buchmann and Ehleringer, 1998]. In general,these studies have focused on the opposing isotopic influ-ences of daytime photosynthesis and respiration on canopyCO2. Photosynthesis tends to make canopy CO2 moreenriched in 18O, while respiration depletes it of the heavyisotope (leaving the canopy with more negative d18O). Veryfew studies have addressed the temporal or spatial variabil-ity of d18O in the nocturnal respiratory fluxes within a night[Langendorfer et al., 2002; Cuntz et al., 2003a].[7] Flanagan et al. [1999] observed a shift of more than
5% in d18O of soil-respired CO2 from one day to the next ina Canadian black spruce forest. They attributed the differ-ence to the new isotopic input from rainfall that occurred onthe night in between. This is reasonable since precipitationevents are likely to alter d18O of soil water (and moss water
in work by Flanagan et al. [1999]). The degree to whichvariability in precipitation inputs and isotopic modificationof ecosystem water pools over time is transferred to eco-system respiration has not been established.[8] The companion paper [Bowling et al., 2003b] exam-
ined seasonal and interannual variation in d18O of ecosys-tem respiration (dR) in several forests across a precipitationgradient in western Oregon. That study suggested a trend ofmore positive d18OR at the dry inland sites relative to themesic sites near the coast, indicating that fractionation dueto evaporative enrichment overshadowed the original iso-topic composition of precipitation as a first order control ondR. In the present study we focus on hourly to weeklyvariation in dR. The primary objectives were to (1) describethe natural variability in ecosystem water pools thatinfluence d18O of respiratory fluxes, (2) demonstrate thatisotopic variation in d18O of ecosystem water pools istransferred to d18O of respiratory fluxes in mechanisticallypredictable ways, and (3) evaluate the potential for using ameasurement-based modeling approach to interpret d18O ofatmospheric CO2 in an ecosystem, to quantify the foliar andsoil component fluxes of the total ecosystem respiratoryflux. Observations are presented that were made overseveral time periods, but we focus particularly on a two-week period in summer 2001 when extensive measure-ments were conducted in a ponderosa pine forest in centralOregon.
2. Methods
2.1. The D18O of Precipitation in Oregon
[9] We sought to characterize natural variability in d18Oof ecosystem water pools over various timescales (diel toannual), including d18O of precipitation. Our ecosystemmeasurements, however, focused on a short-term experi-ment at a single forest. Therefore, we characterized vari-ability in d18O of precipitation using data collected at othersites in Oregon, and assume that these provide a reasonableindication of general variability. Precipitation samples werecollected approximately weekly at three locations during1996, 1997, and 2000 as part of the National AtmosphericDeposition Program (http://nadp.sws.uiuc.edu/). The siteswere the Starkey and H. J. Andrews Experimental Forests,and the Alsea Guard Ranger Station [Welker, 2000], and arelocated along a strong precipitation gradient [Taylor andHannan, 1999]. The d18O of precipitation was determinedby isotope ratio mass spectrometry as described by Welker[2000]. No additional measurements were made at thesesites.
2.2. Primary Study Site
[10] Research was conducted in a forest dominated byold-growth ponderosa pine (Pinus ponderosa) at the Meto-lius Research Natural Area in central Oregon, USA(44�300N, 121�370W, 915 m elevation). The Metolius forestis a component of the AmeriFlux network of ecosystem-atmosphere carbon exchange sites (http://public.ornl.gov/ameriflux/Participants/Sites/Map/index.cfm) and has beenthe focus of several ongoing studies [Anthoni et al., 1999,2002; Law et al., 1999, 2000; Irvine et al., 2002; Irvine and
34 - 2 BOWLING ET AL.: 18O CONTENT OF ECOSYSTEM RESPIRATION, 2
Law, 2002]. The forest comprises two age classes of pines,roughly 50 yrs and 250 years. Soils are freely drainingsandy loams with 65% sand, 25% silt, and 10% clay. Thecanopy is 10–34 m tall and fairly open with a leaf areaindex of 2.1 m2 m�2 [Law et al., 2001b]. A sparseunderstory of bitterbrush (Purshia tridentata), strawberry(Fragaria vesca), and bracken fern (Pteridium aquilinum) ispresent. The 30-year mean annual temperature is 8.1�C andmean annual precipitation is 524 mm. A suite of environ-mental variables (air and soil temperatures, humidity, etc.)are measured continuously at the Metolius site; details havebeen published elsewhere [Anthoni et al., 1999, 2002].A preliminary analysis of the oxygen isotope ratios ofecosystem respiration at this and other sites along a precip-itation transect in Oregon has been previously published[Ehleringer and Cook, 1998]. During summer 2001, isoto-pic measurements were conducted every night from June 28to July 10 (days 179 to 191) and are described in thefollowing sections.
2.3. The D18O and CO2 in Ecosystem Air Samples
[11] Air samples were collected at night, beginning 1 hourafter sunset, at several heights within the forest (0.2, 0.8,and 11.4 m) from tubing (Dekoron 1300, GWS Supply,Appleton, Wisconsin) located on a scaffolding tower. Sam-ples were collected in glass flasks (34–5671, Kontes GlassCo., Vineland, New Jersey) using a portable photosynthesissystem (LI-6200, LI-COR, Inc., Lincoln, Nebraska) down-stream of the flasks to provide an initial indication of CO2
mole fraction ([CO2]) in the flasks. The goal during sam-pling was to achieve a maximal range in [CO2] in flaskscollected during a single night, which has been shown tominimize the uncertainty in estimates of the carbon isotopecontent of ecosystem respiration using the Keeling plottechnique [Pataki et al., 2003]. Ten samples were collectedper night. On one night, two separate sampling sessionswere performed, one early in the night (near the end of day186) and one late in the night (early on day 187). Allsamples were chemically dried during collection usingmagnesium perchlorate to avoid isotopic exchange withminute quantities of liquid water in flasks [Gemery et al.,1996]. Samples were analyzed for d18O of CO2 via contin-uous-flow isotope ratio mass spectrometry (details given byBowling et al. [2002]) with a precision of 0.15%. Finalanalysis of [CO2] was performed in the laboratory usinginfrared gas analysis and the method of Bowling et al.[2001] with a precision of 0.3 mmol mol�1.
2.4. The D18O of Ecosystem Respiration
[12] The isotopic composition of ecosystem respiration(d18OR or dR) was calculated using a two-ended mixingmodel known as the Keeling plot approach [Keeling, 1958].We assumed that air in an ecosystem with initial [CO2] andd18O background compositions of Cb and db mixed with anocturnal respiratory source that had a constant isotopiccomposition dR. As CO2 increased within the nocturnalboundary layer, mole fraction and isotope ratio (Cm anddm) changed concomitantly and these changes weremonitored with flask samples collected and analyzed asdescribed above. Keeling [1958] showed that these changes
could be graphically interpreted along a mixing line definedby
dm ¼ Cb db � dRð Þ=Cm þ dR: ð1Þ
Geometric mean regressions were performed betweenmeasured d18O and the inverse of measured [CO2], andthe y-intercept was taken as an estimate of dR.[13] Samples collected at different heights in the forest
were combined for a single Keeling plot. Bowling et al.[2003b] presented a set of data quality criteria to determinewhen Keeling plots can be interpreted with confidence foroxygen isotopes of CO2. All Keeling plots in this study metthose requirements, which included (1) significant linearregressions (p < 0.01, Student’s t-test) and (2) air samplingdurations less than 5 hours. Outliers on individual Keelingplots were removed as described by Bowling et al. [2002].In the present study, the outlier test resulted in a maximumremoval of 1 sample per Keeling plot. [CO2] rangesin Keeling plots in the present study ranged from 68 to121 mmol mol�1, and sampling durations varied from 1.1 to3.8 hours.
2.5. The D18O of Xylem, Leaf, and Soil Water
[14] Xylem (stem), leaf, and soil samples were collectedfor analysis of d18O of water near the end of the airsampling period each night (2200–0100 local time (LT)).Samples were stored in glass vials wrapped with wax film,and kept refrigerated or frozen until analysis. Stem samples(5–7 cm long � 0.5–1 mm diameter) were collected fromthree trees in the 50-year age class on days 181, 186, and191. Bark was removed upon collection. Leaf samples(from the same trees used for the stems) were collected intriplicate every night from days 179 to 191. Leaf and xylemwater data are presented as means and standard errors oftriplicate samples.[15] Soil samples were bulked, averaged, and subsampled
from 0–10 cm mineral soil depth collected with a smallshovel. Soil samples were collected every 20 m along a200-m transect, roughly 200 m east of the air-samplingtower. Ten soil samples were collected each night, one pertransect location. Not all soil samples were analyzed; dataare presented as means and standard errors of 3–10 repli-cates. On day 229, 2001 (a month after the intensive studyperiod), samples were collected at several depths (5, 10, 15,and 20 cm, all ± 2 cm) in three separate soil pits to examinethe depth profile of d18O of soil water. Water was extractedfrom all samples by cryogenic vacuum distillation in thelaboratory, and d18O of the water was analyzed by isotoperatio mass spectrometry [Fessenden et al., 2002].
2.6. Modeling of Leaf Water Enrichment andRespiratory CO2 Fluxes
[16] McDowell et al. [2003] presented direct measure-ments of the carbon isotope content of leaf and soilrespiration at the Metolius pine forest during the time periodof the present study. However, the oxygen isotope contentof respiration by leaves and particularly by soils is quitedifficult to measure with confidence [Flanagan et al., 1999;Miller et al., 1999; Mortazavi and Chanton, 2002]. Thebag-based chamber method used by McDowell et al. [2003]
BOWLING ET AL.: 18O CONTENT OF ECOSYSTEM RESPIRATION, 2 34 - 3
to measure d13C of leaf respiration was unreliable foroxygen isotopes due to isotopic fractionation effects ond18O of CO2 stored in the bags [Bowling et al., 2003a]. Weelected instead to model leaf and soil-respired fluxes basedon established principles of oxygen isotopic fractionationin leaves and soils. Uncertainties associated with thesemodeled flux estimates are addressed in section 3.[17] Evaporative enrichment of leaf water was modeled
using the Craig-Gordon model [Craig and Gordon, 1965] asdescribed by Flanagan et al. [1991, 1997]. As inputs to thismodel we (1) applied the average of all measured xylemwater values (�12.9%) as d18O of source water, (2) used airtemperature and relative humidity data collected at 45 mheight (canopy top), (3) assumed leaf temperature wasequal to air temperature, and (4) estimated d18O of atmo-spheric water vapor in the following two ways. Initially, weassumed water vapor was in isotopic equilibrium withmeasured xylem water (�12.9%) at the mean air temper-ature (19.7�C) observed during days 179 to 191 to obtain aconstant d18O of vapor (dvapor) of �22.5%. For liquid-vaporequilibrium fractionation we used Majoube’s [1971] equa-tions. At the Metolius forest the equilibrium assumptionresulted in a relatively poor comparison between measuredand modeled leaf water (dmodeled = 1.18*dmeasured � 4.7%,r2 = 0.88, n = 13). We then chose a constant value for dvapor(�16.6%) that minimized the residual error in the regres-sion between measured and modeled values. The resultscompared more favorably with observations (dmodeled =0.97*dmeasured � 0.04%, r2 = 0.88, n = 13). Modeled leafwater results are presented for both cases, which we refer toas the equilibrium case (dvapor = �22.5%) and the best fitcase (dvapor = �16.6%).[18] The d18O of CO2 in nocturnal leaf respiration was
modeled by assuming complete isotopic equilibration be-tween CO2 and modeled leaf water at leaf (air) tempera-ture. The equations of Brenninkmeijer et al. [1983] wereused to describe the temperature-dependent equilibriumfractionation factor between liquid water and gaseousCO2. An assumed 8.8% kinetic fractionation factor, basedon kinetic theory of gaseous diffusion, was applied toaccount for diffusion of CO2 from the leaf. We are unawareof studies which have experimentally addressed whetheror not the 8.8% fractionation is fully expressed in thenocturnal leaf respiration flux. Recent work has shown thatthe degree of isotopic equilibration in leaves is dependenton carbonic anhydrase activity [Gillon and Yakir, 2001].Lack of perfect isotopic equilibrium between leaf waterand CO2 would confound our modeled estimates, butcarbonic anhydrase activity is generally high in conifers[Gillon and Yakir, 2001]. The d18O of leaf-respired CO2
during daylight hours was not modeled since all ourmeasurements and modeling of d18O in respiratory fluxeswere conducted at night.[19] The d18O of soil water was measured once per night,
and extended in time to produce a continuous time series byassuming that the measured value was representative of aperiod 12 hours before and after the measurement. The d18Oof the soil-respired flux was modeled similarly to leafrespiration. Complete isotopic equilibrium was assumedbetween CO2 and measured d18O of soil water (0–10 cm
depth) at measured soil temperature (15 cm depth). Alloxygen isotope ratios in this paper (for water and for carbondioxide) are referenced to the Vienna Standard Mean OceanWater (VSMOW) scale [Coplen, 1996] and are presented indimensionless ‘‘units’’ of %.
3. Results and Discussion
[20] To describe comprehensively the sources of variationthat are likely to influence d18O of ecosystem respiration,we present data collected over a period of 3 years from threesites with widely varying annual precipitation that demon-strate the variability in d18O of individual precipitationevents. We then show how environmental variables causemodification of d18O of leaf water and of water in the soilprofile. Next, we describe how these water pools influencethe isotopic composition of soil and foliar respiratory fluxes,and use this information to quantify their relative contribu-tions to the total nocturnal respiration flux. Finally, wediscuss the limitations of our approach in the context ofother studies.
3.1. Variation in D18O of Precipitation, Leaf, and Soil
Water and Implications for D18O of Respiration
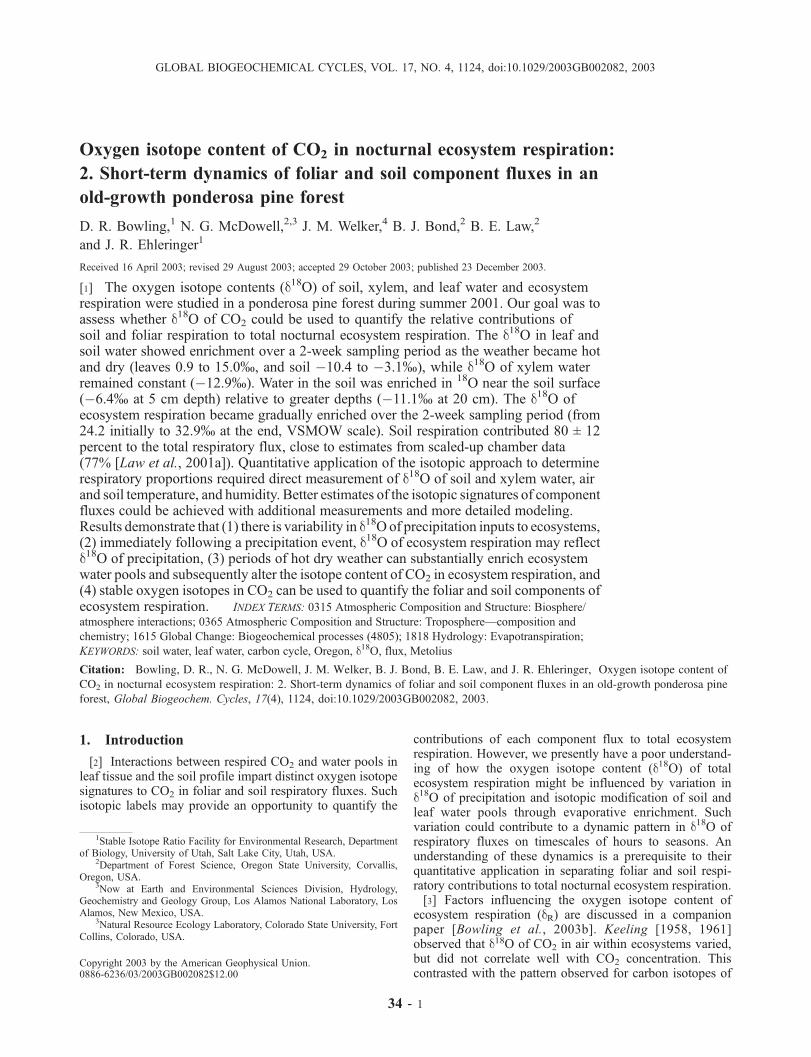
[21] The isotopic composition of precipitation at threesites across Oregon is shown in Figure 1. In general, d18O ofprecipitation was more negative during the winter and lessnegative during the summer, a seasonal pattern that isgenerally observed at temperate locations where air andsea surface temperatures vary seasonally [Rozanski et al.,1982; Gat, 1996; Araguas-Araguas et al., 1998]. The sitethat was farthest from the Pacific coast (Starkey) generallyexhibited more negative d18O, and precipitation at thecoastal site (Alsea) was less negative (as expected) basedon the continental effect [Rozanski et al., 1993; Welker,2000; Bowling et al., 2003b]. Temporal and spatial patternssuch as these (winter/summer or coastal/inland patterns)are most easily discerned in long-term means, but means
Figure 1. The d18O of precipitation in Oregon. Precipita-tion samples were collected in 1996, 1997, and 2000 atAlsea Guard Ranger Station (solid circles), and H. J.Andrews (open circles) and Starkey Experimental Forests(solid squares). The distances from the Pacific coast at thesites are 45, 150, and 450 km for Alsea, H. J. Andrews, andStarkey, respectively.
34 - 4 BOWLING ET AL.: 18O CONTENT OF ECOSYSTEM RESPIRATION, 2
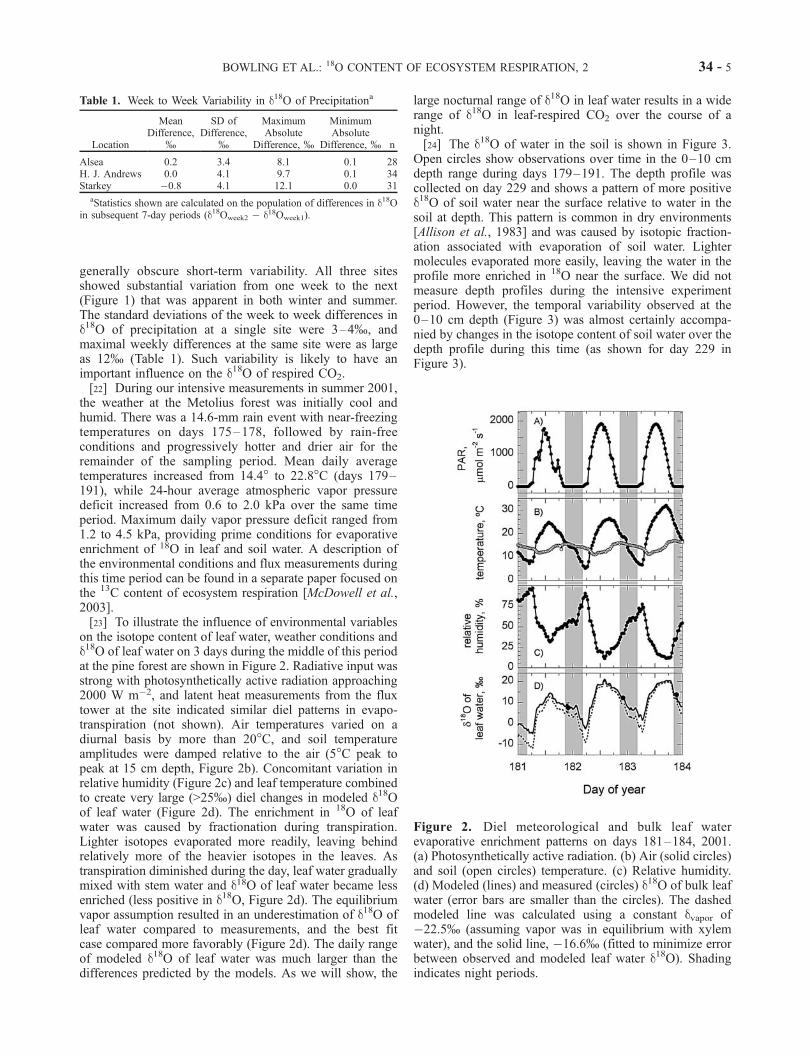
generally obscure short-term variability. All three sitesshowed substantial variation from one week to the next(Figure 1) that was apparent in both winter and summer.The standard deviations of the week to week differences ind18O of precipitation at a single site were 3–4%, andmaximal weekly differences at the same site were as largeas 12% (Table 1). Such variability is likely to have animportant influence on the d18O of respired CO2.[22] During our intensive measurements in summer 2001,
the weather at the Metolius forest was initially cool andhumid. There was a 14.6-mm rain event with near-freezingtemperatures on days 175–178, followed by rain-freeconditions and progressively hotter and drier air for theremainder of the sampling period. Mean daily averagetemperatures increased from 14.4� to 22.8�C (days 179–191), while 24-hour average atmospheric vapor pressuredeficit increased from 0.6 to 2.0 kPa over the same timeperiod. Maximum daily vapor pressure deficit ranged from1.2 to 4.5 kPa, providing prime conditions for evaporativeenrichment of 18O in leaf and soil water. A description ofthe environmental conditions and flux measurements duringthis time period can be found in a separate paper focused onthe 13C content of ecosystem respiration [McDowell et al.,2003].[23] To illustrate the influence of environmental variables
on the isotope content of leaf water, weather conditions andd18O of leaf water on 3 days during the middle of this periodat the pine forest are shown in Figure 2. Radiative input wasstrong with photosynthetically active radiation approaching2000 W m�2, and latent heat measurements from the fluxtower at the site indicated similar diel patterns in evapo-transpiration (not shown). Air temperatures varied on adiurnal basis by more than 20�C, and soil temperatureamplitudes were damped relative to the air (5�C peak topeak at 15 cm depth, Figure 2b). Concomitant variation inrelative humidity (Figure 2c) and leaf temperature combinedto create very large (>25%) diel changes in modeled d18Oof leaf water (Figure 2d). The enrichment in 18O of leafwater was caused by fractionation during transpiration.Lighter isotopes evaporated more readily, leaving behindrelatively more of the heavier isotopes in the leaves. Astranspiration diminished during the day, leaf water graduallymixed with stem water and d18O of leaf water became lessenriched (less positive in d18O, Figure 2d). The equilibriumvapor assumption resulted in an underestimation of d18O ofleaf water compared to measurements, and the best fitcase compared more favorably (Figure 2d). The daily rangeof modeled d18O of leaf water was much larger than thedifferences predicted by the models. As we will show, the
large nocturnal range of d18O in leaf water results in a widerange of d18O in leaf-respired CO2 over the course of anight.[24] The d18O of water in the soil is shown in Figure 3.
Open circles show observations over time in the 0–10 cmdepth range during days 179–191. The depth profile wascollected on day 229 and shows a pattern of more positived18O of soil water near the surface relative to water in thesoil at depth. This pattern is common in dry environments[Allison et al., 1983] and was caused by isotopic fraction-ation associated with evaporation of soil water. Lightermolecules evaporated more easily, leaving the water in theprofile more enriched in 18O near the surface. We did notmeasure depth profiles during the intensive experimentperiod. However, the temporal variability observed at the0–10 cm depth (Figure 3) was almost certainly accompa-nied by changes in the isotope content of soil water over thedepth profile during this time (as shown for day 229 inFigure 3).
Table 1. Week to Week Variability in d18O of Precipitationa
Location
MeanDifference,
%
SD ofDifference,
%
MaximumAbsolute
Difference, %
MinimumAbsolute
Difference, % n
Alsea 0.2 3.4 8.1 0.1 28H. J. Andrews 0.0 4.1 9.7 0.1 34Starkey �0.8 4.1 12.1 0.0 31
aStatistics shown are calculated on the population of differences in d18Oin subsequent 7-day periods (d18Oweek2 � d18Oweek1).
Figure 2. Diel meteorological and bulk leaf waterevaporative enrichment patterns on days 181–184, 2001.(a) Photosynthetically active radiation. (b) Air (solid circles)and soil (open circles) temperature. (c) Relative humidity.(d) Modeled (lines) and measured (circles) d18O of bulk leafwater (error bars are smaller than the circles). The dashedmodeled line was calculated using a constant dvapor of�22.5% (assuming vapor was in equilibrium with xylemwater), and the solid line, �16.6% (fitted to minimize errorbetween observed and modeled leaf water d18O). Shadingindicates night periods.
BOWLING ET AL.: 18O CONTENT OF ECOSYSTEM RESPIRATION, 2 34 - 5
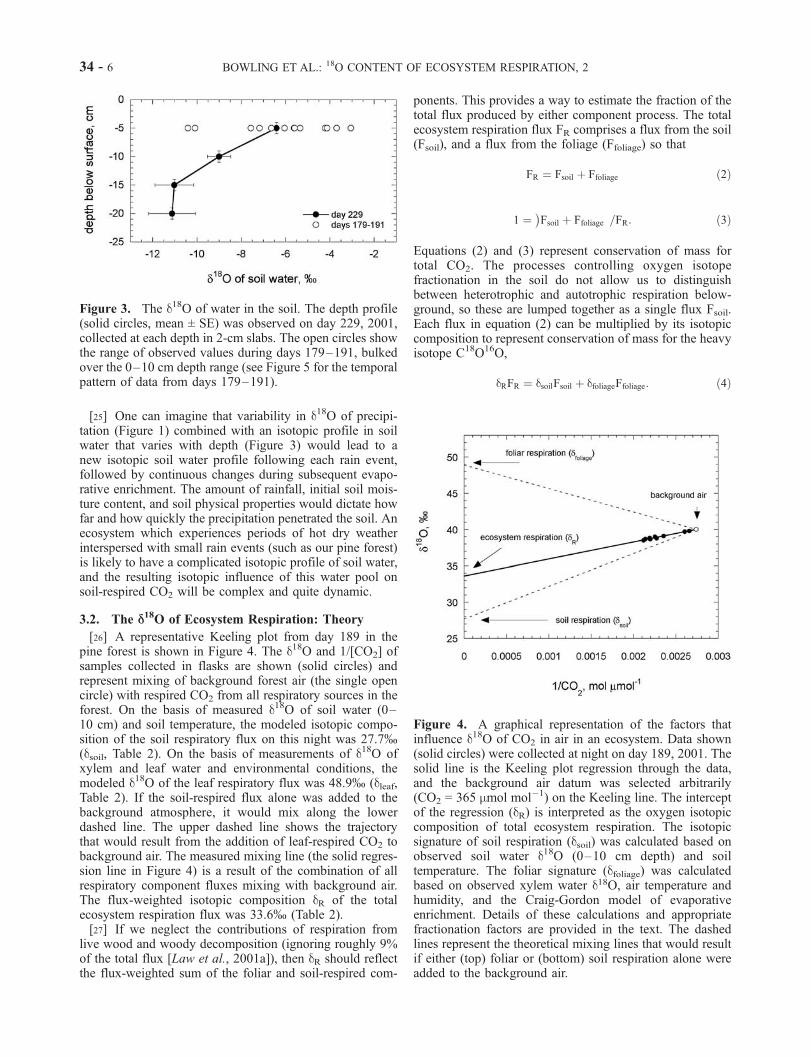
[25] One can imagine that variability in d18O of precipi-tation (Figure 1) combined with an isotopic profile in soilwater that varies with depth (Figure 3) would lead to anew isotopic soil water profile following each rain event,followed by continuous changes during subsequent evapo-rative enrichment. The amount of rainfall, initial soil mois-ture content, and soil physical properties would dictate howfar and how quickly the precipitation penetrated the soil. Anecosystem which experiences periods of hot dry weatherinterspersed with small rain events (such as our pine forest)is likely to have a complicated isotopic profile of soil water,and the resulting isotopic influence of this water pool onsoil-respired CO2 will be complex and quite dynamic.
3.2. The D18O of Ecosystem Respiration: Theory
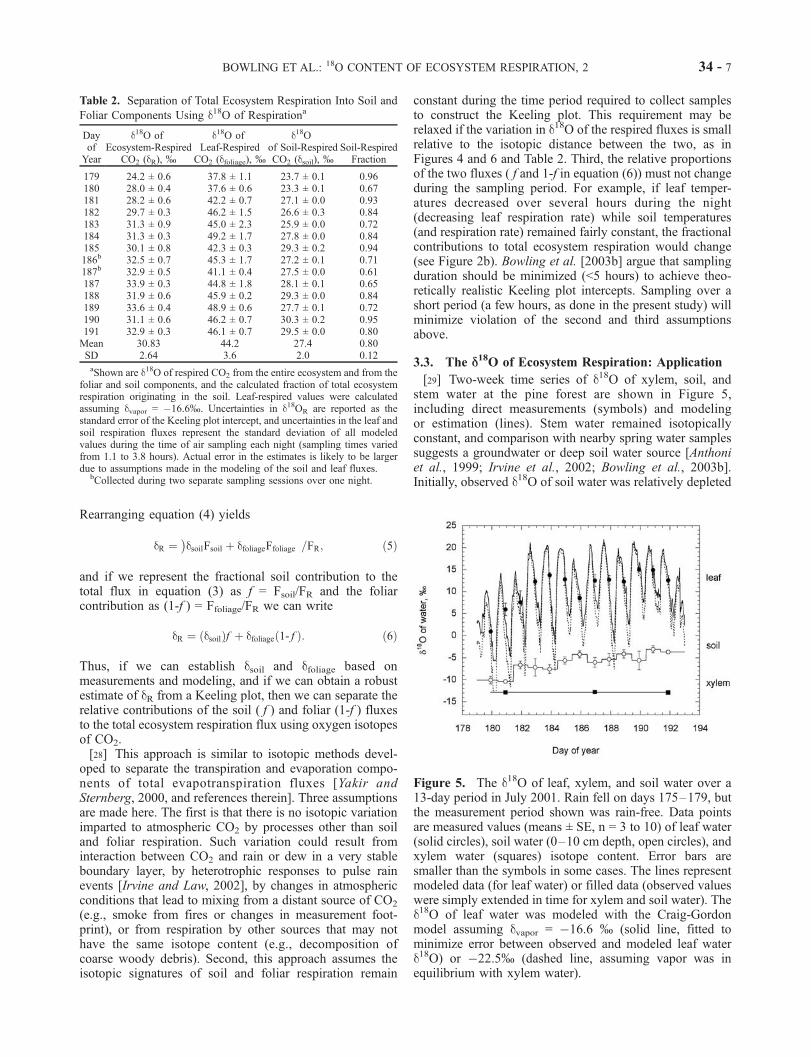
[26] A representative Keeling plot from day 189 in thepine forest is shown in Figure 4. The d18O and 1/[CO2] ofsamples collected in flasks are shown (solid circles) andrepresent mixing of background forest air (the single opencircle) with respired CO2 from all respiratory sources in theforest. On the basis of measured d18O of soil water (0–10 cm) and soil temperature, the modeled isotopic compo-sition of the soil respiratory flux on this night was 27.7%(dsoil, Table 2). On the basis of measurements of d18O ofxylem and leaf water and environmental conditions, themodeled d18O of the leaf respiratory flux was 48.9% (dleaf,Table 2). If the soil-respired flux alone was added to thebackground atmosphere, it would mix along the lowerdashed line. The upper dashed line shows the trajectorythat would result from the addition of leaf-respired CO2 tobackground air. The measured mixing line (the solid regres-sion line in Figure 4) is a result of the combination of allrespiratory component fluxes mixing with background air.The flux-weighted isotopic composition dR of the totalecosystem respiration flux was 33.6% (Table 2).[27] If we neglect the contributions of respiration from
live wood and woody decomposition (ignoring roughly 9%of the total flux [Law et al., 2001a]), then dR should reflectthe flux-weighted sum of the foliar and soil-respired com-
ponents. This provides a way to estimate the fraction of thetotal flux produced by either component process. The totalecosystem respiration flux FR comprises a flux from the soil(Fsoil), and a flux from the foliage (Ffoliage) so that
FR ¼ Fsoil þ Ffoliage ð2Þ
1 ¼ Fsoil þ Ffoliage� �
=FR: ð3Þ
Equations (2) and (3) represent conservation of mass fortotal CO2. The processes controlling oxygen isotopefractionation in the soil do not allow us to distinguishbetween heterotrophic and autotrophic respiration below-ground, so these are lumped together as a single flux Fsoil.Each flux in equation (2) can be multiplied by its isotopiccomposition to represent conservation of mass for the heavyisotope C18O16O,
dRFR ¼ dsoilFsoil þ dfoliageFfoliage: ð4Þ
Figure 3. The d18O of water in the soil. The depth profile(solid circles, mean ± SE) was observed on day 229, 2001,collected at each depth in 2-cm slabs. The open circles showthe range of observed values during days 179–191, bulkedover the 0–10 cm depth range (see Figure 5 for the temporalpattern of data from days 179–191).
Figure 4. A graphical representation of the factors thatinfluence d18O of CO2 in air in an ecosystem. Data shown(solid circles) were collected at night on day 189, 2001. Thesolid line is the Keeling plot regression through the data,and the background air datum was selected arbitrarily(CO2 = 365 mmol mol�1) on the Keeling line. The interceptof the regression (dR) is interpreted as the oxygen isotopiccomposition of total ecosystem respiration. The isotopicsignature of soil respiration (dsoil) was calculated based onobserved soil water d18O (0–10 cm depth) and soiltemperature. The foliar signature (dfoliage) was calculatedbased on observed xylem water d18O, air temperature andhumidity, and the Craig-Gordon model of evaporativeenrichment. Details of these calculations and appropriatefractionation factors are provided in the text. The dashedlines represent the theoretical mixing lines that would resultif either (top) foliar or (bottom) soil respiration alone wereadded to the background air.
34 - 6 BOWLING ET AL.: 18O CONTENT OF ECOSYSTEM RESPIRATION, 2
Rearranging equation (4) yields
dR ¼ dsoilFsoil þ dfoliageFfoliage� �
=FR; ð5Þ
and if we represent the fractional soil contribution to thetotal flux in equation (3) as f = Fsoil/FR and the foliarcontribution as (1-f ) = Ffoliage/FR we can write
dR ¼ dsoilð Þf þ dfoliage 1- fð Þ: ð6Þ
Thus, if we can establish dsoil and dfoliage based onmeasurements and modeling, and if we can obtain a robustestimate of dR from a Keeling plot, then we can separate therelative contributions of the soil ( f ) and foliar (1-f ) fluxesto the total ecosystem respiration flux using oxygen isotopesof CO2.[28] This approach is similar to isotopic methods devel-
oped to separate the transpiration and evaporation compo-nents of total evapotranspiration fluxes [Yakir andSternberg, 2000, and references therein]. Three assumptionsare made here. The first is that there is no isotopic variationimparted to atmospheric CO2 by processes other than soiland foliar respiration. Such variation could result frominteraction between CO2 and rain or dew in a very stableboundary layer, by heterotrophic responses to pulse rainevents [Irvine and Law, 2002], by changes in atmosphericconditions that lead to mixing from a distant source of CO2
(e.g., smoke from fires or changes in measurement foot-print), or from respiration by other sources that may nothave the same isotope content (e.g., decomposition ofcoarse woody debris). Second, this approach assumes theisotopic signatures of soil and foliar respiration remain
constant during the time period required to collect samplesto construct the Keeling plot. This requirement may berelaxed if the variation in d18O of the respired fluxes is smallrelative to the isotopic distance between the two, as inFigures 4 and 6 and Table 2. Third, the relative proportionsof the two fluxes ( f and 1-f in equation (6)) must not changeduring the sampling period. For example, if leaf temper-atures decreased over several hours during the night(decreasing leaf respiration rate) while soil temperatures(and respiration rate) remained fairly constant, the fractionalcontributions to total ecosystem respiration would change(see Figure 2b). Bowling et al. [2003b] argue that samplingduration should be minimized (<5 hours) to achieve theo-retically realistic Keeling plot intercepts. Sampling over ashort period (a few hours, as done in the present study) willminimize violation of the second and third assumptionsabove.
3.3. The D18O of Ecosystem Respiration: Application
[29] Two-week time series of d18O of xylem, soil, andstem water at the pine forest are shown in Figure 5,including direct measurements (symbols) and modelingor estimation (lines). Stem water remained isotopicallyconstant, and comparison with nearby spring water samplessuggests a groundwater or deep soil water source [Anthoniet al., 1999; Irvine et al., 2002; Bowling et al., 2003b].Initially, observed d18O of soil water was relatively depleted
Table 2. Separation of Total Ecosystem Respiration Into Soil and
Foliar Components Using d18O of Respirationa
DayofYear
d18O ofEcosystem-Respired
CO2 (dR), %
d18O ofLeaf-Respired
CO2 (dfoliage), %
d18Oof Soil-RespiredCO2 (dsoil), %
Soil-RespiredFraction
179 24.2 ± 0.6 37.8 ± 1.1 23.7 ± 0.1 0.96180 28.0 ± 0.4 37.6 ± 0.6 23.3 ± 0.1 0.67181 28.2 ± 0.6 42.2 ± 0.7 27.1 ± 0.0 0.93182 29.7 ± 0.3 46.2 ± 1.5 26.6 ± 0.3 0.84183 31.3 ± 0.9 45.0 ± 2.3 25.9 ± 0.0 0.72184 31.3 ± 0.3 49.2 ± 1.7 27.8 ± 0.0 0.84185 30.1 ± 0.8 42.3 ± 0.3 29.3 ± 0.2 0.94186b 32.5 ± 0.7 45.3 ± 1.7 27.2 ± 0.1 0.71187b 32.9 ± 0.5 41.1 ± 0.4 27.5 ± 0.0 0.61187 33.9 ± 0.3 44.8 ± 1.8 28.1 ± 0.1 0.65188 31.9 ± 0.6 45.9 ± 0.2 29.3 ± 0.0 0.84189 33.6 ± 0.4 48.9 ± 0.6 27.7 ± 0.1 0.72190 31.1 ± 0.6 46.2 ± 0.7 30.3 ± 0.2 0.95191 32.9 ± 0.3 46.1 ± 0.7 29.5 ± 0.0 0.80Mean 30.83 44.2 27.4 0.80SD 2.64 3.6 2.0 0.12
aShown are d18O of respired CO2 from the entire ecosystem and from thefoliar and soil components, and the calculated fraction of total ecosystemrespiration originating in the soil. Leaf-respired values were calculatedassuming dvapor = �16.6%. Uncertainties in d18OR are reported as thestandard error of the Keeling plot intercept, and uncertainties in the leaf andsoil respiration fluxes represent the standard deviation of all modeledvalues during the time of air sampling each night (sampling times variedfrom 1.1 to 3.8 hours). Actual error in the estimates is likely to be largerdue to assumptions made in the modeling of the soil and leaf fluxes.
bCollected during two separate sampling sessions over one night.
Figure 5. The d18O of leaf, xylem, and soil water over a13-day period in July 2001. Rain fell on days 175–179, butthe measurement period shown was rain-free. Data pointsare measured values (means ± SE, n = 3 to 10) of leaf water(solid circles), soil water (0–10 cm depth, open circles), andxylem water (squares) isotope content. Error bars aresmaller than the symbols in some cases. The lines representmodeled data (for leaf water) or filled data (observed valueswere simply extended in time for xylem and soil water). Thed18O of leaf water was modeled with the Craig-Gordonmodel assuming dvapor = �16.6 % (solid line, fitted tominimize error between observed and modeled leaf waterd18O) or �22.5% (dashed line, assuming vapor was inequilibrium with xylem water).
BOWLING ET AL.: 18O CONTENT OF ECOSYSTEM RESPIRATION, 2 34 - 7
(�10.1% on day 179) but became enriched in 18O by soilevaporation (�3.7% on day 191) as the weather became hotand dry. This gradual enrichment is likely to be associatedwith a complex soil depth profile like the one shown inFigure 3. The isotopic composition of the rain that fell justprior to our sampling period was not measured, but thevalue must have been near �10% to produce the observedsoil values. The d18O of leaf water collected at roughlythe same hour each night also showed gradual enrichment(0.9 to 12.6%, Figure 5). However, the enrichment over thetwo weeks of the experiment was dwarfed by large dielchanges in modeled d18O of leaf water (on some daysgreater than 25%). In general, modeled d18O values forleaf water compared well with measurements consideringthe large diurnal range and the assumptions made inmodeling leaf water.[30] The data in Figures 1, 2, 3, and 5 illustrate the
importance of short-term (hourly) environmental controlson d18O of leaf water, and also how leaf and soil water d18Ocan change in response to synoptic scale weather events(days to weeks). Changes in d18O of leaf and soil waterpools will be directly conferred to respired CO2.[31] The nightly isotopic compositions of the respiratory
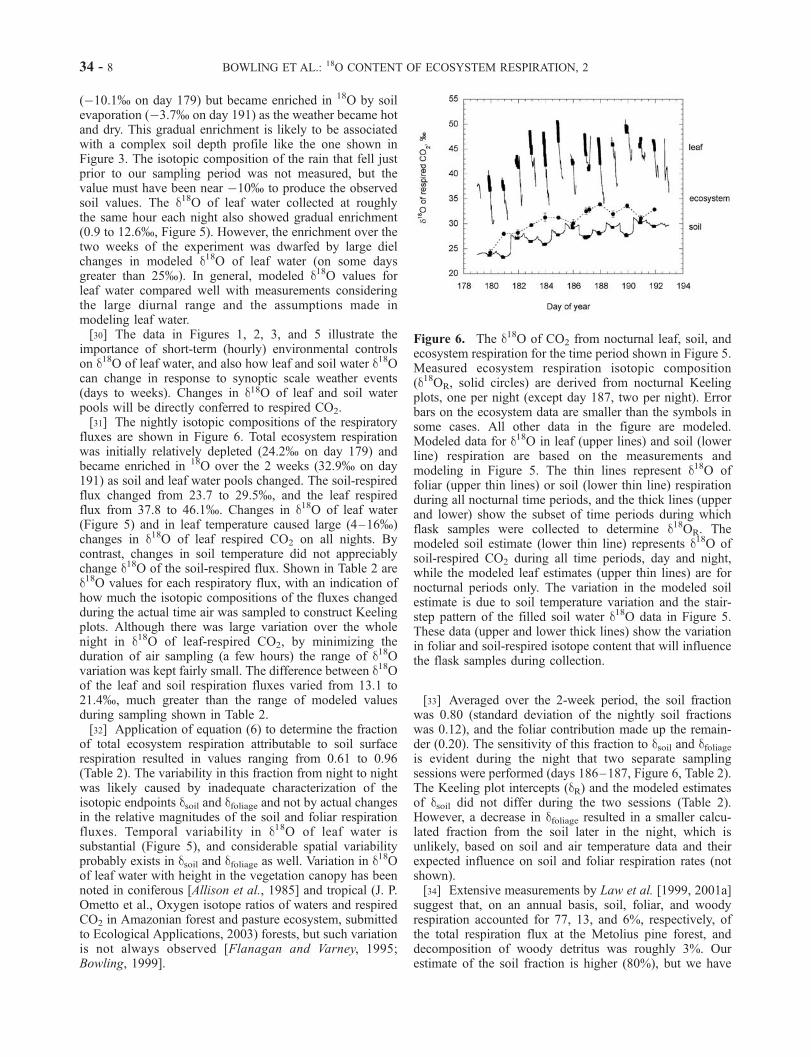
fluxes are shown in Figure 6. Total ecosystem respirationwas initially relatively depleted (24.2% on day 179) andbecame enriched in 18O over the 2 weeks (32.9% on day191) as soil and leaf water pools changed. The soil-respiredflux changed from 23.7 to 29.5%, and the leaf respiredflux from 37.8 to 46.1%. Changes in d18O of leaf water(Figure 5) and in leaf temperature caused large (4–16%)changes in d18O of leaf respired CO2 on all nights. Bycontrast, changes in soil temperature did not appreciablychange d18O of the soil-respired flux. Shown in Table 2 ared18O values for each respiratory flux, with an indication ofhow much the isotopic compositions of the fluxes changedduring the actual time air was sampled to construct Keelingplots. Although there was large variation over the wholenight in d18O of leaf-respired CO2, by minimizing theduration of air sampling (a few hours) the range of d18Ovariation was kept fairly small. The difference between d18Oof the leaf and soil respiration fluxes varied from 13.1 to21.4%, much greater than the range of modeled valuesduring sampling shown in Table 2.[32] Application of equation (6) to determine the fraction
of total ecosystem respiration attributable to soil surfacerespiration resulted in values ranging from 0.61 to 0.96(Table 2). The variability in this fraction from night to nightwas likely caused by inadequate characterization of theisotopic endpoints dsoil and dfoliage and not by actual changesin the relative magnitudes of the soil and foliar respirationfluxes. Temporal variability in d18O of leaf water issubstantial (Figure 5), and considerable spatial variabilityprobably exists in dsoil and dfoliage as well. Variation in d18Oof leaf water with height in the vegetation canopy has beennoted in coniferous [Allison et al., 1985] and tropical (J. P.Ometto et al., Oxygen isotope ratios of waters and respiredCO2 in Amazonian forest and pasture ecosystem, submittedto Ecological Applications, 2003) forests, but such variationis not always observed [Flanagan and Varney, 1995;Bowling, 1999].
[33] Averaged over the 2-week period, the soil fractionwas 0.80 (standard deviation of the nightly soil fractionswas 0.12), and the foliar contribution made up the remain-der (0.20). The sensitivity of this fraction to dsoil and dfoliageis evident during the night that two separate samplingsessions were performed (days 186–187, Figure 6, Table 2).The Keeling plot intercepts (dR) and the modeled estimatesof dsoil did not differ during the two sessions (Table 2).However, a decrease in dfoliage resulted in a smaller calcu-lated fraction from the soil later in the night, which isunlikely, based on soil and air temperature data and theirexpected influence on soil and foliar respiration rates (notshown).[34] Extensive measurements by Law et al. [1999, 2001a]
suggest that, on an annual basis, soil, foliar, and woodyrespiration accounted for 77, 13, and 6%, respectively, ofthe total respiration flux at the Metolius pine forest, anddecomposition of woody detritus was roughly 3%. Ourestimate of the soil fraction is higher (80%), but we have
Figure 6. The d18O of CO2 from nocturnal leaf, soil, andecosystem respiration for the time period shown in Figure 5.Measured ecosystem respiration isotopic composition(d18OR, solid circles) are derived from nocturnal Keelingplots, one per night (except day 187, two per night). Errorbars on the ecosystem data are smaller than the symbols insome cases. All other data in the figure are modeled.Modeled data for d18O in leaf (upper lines) and soil (lowerline) respiration are based on the measurements andmodeling in Figure 5. The thin lines represent d18O offoliar (upper thin lines) or soil (lower thin line) respirationduring all nocturnal time periods, and the thick lines (upperand lower) show the subset of time periods during whichflask samples were collected to determine d18OR. Themodeled soil estimate (lower thin line) represents d18O ofsoil-respired CO2 during all time periods, day and night,while the modeled leaf estimates (upper thin lines) are fornocturnal periods only. The variation in the modeled soilestimate is due to soil temperature variation and the stair-step pattern of the filled soil water d18O data in Figure 5.These data (upper and lower thick lines) show the variationin foliar and soil-respired isotope content that will influencethe flask samples during collection.
34 - 8 BOWLING ET AL.: 18O CONTENT OF ECOSYSTEM RESPIRATION, 2
ignored the contribution of live woody respiration anddecomposition of woody debris to the total ecosystemrespiration flux (a total of 9% of ecosystem respiration).No published studies have addressed d18O of CO2 respiredby living or dead woody biomass, and we were uncertainhow to describe isotopic effects from these sources. Atpresent the quantitative application of Keeling plots inseparating above and belowground components of ecosys-tem respiration is limited to an approach like ours.[35] Clearly, the oxygen isotope content of ecosystem
respiration and its foliar and soil components is dynamicin time. The d18O of leaf water can change over severalhours within a single night (Figure 2), and from one night tothe next based on changing environmental conditions(Figure 5). Soil evaporation alters the isotopic profile ofsoil water over a timescale of days to weeks (Figures 3and 5). The d18O of precipitation is quite variable fromevent to event (Figure 1) and can change soil water d18O.Heterotrophic activity can increase strongly in response torain events [Cui and Caldwell, 1997; Irvine and Law, 2002;Kelliher et al., 2003], and it is likely that autotrophicrespiration of shallowly rooted plant species can increaseas well [e.g., Sala and Lauenroth, 1982; BassiriRad et al.,1999; Schwinning et al., 2003]. These factors combine tocreate a complex array of soil water pools that directlyinfluence the isotope content of respired CO2. Despite thiscomplexity, we were able to construct realistic estimates ofthe isotope ratios of the respired component fluxes withdirect measurements of soil and xylem water d18O, air andsoil temperature, and humidity (Figure 6). These estimatesallowed us, via equation (6), to quantify the foliar and soilrespiratory contributions to total ecosystem respiration(Table 2), and our results are comparable to the scaledchamber estimates of Law et al. [1999, 2001a].
3.4. Model Assumptions and Limitations
[36] Our results suggest that some realistic understandingof ecosystem respiration may be achievable using oxygenisotopes of CO2, subject to a few caveats. There are severalsimplifying assumptions made in our models which limitour ability to quantitatively determine the isotopic signa-tures of the respiration fluxes dsoil and dfoliage.[37] We did not directly measure dvapor, and hence some
estimate of this parameter was required. The assumptionthat atmospheric water vapor is in equilibrium with localgroundwater may be valid at humid inland locationsbut water vapor at coastal and arid regions is likely todepart from equilibrium with local groundwater [Jacob andSonntag, 1991; Flanagan, 1993; Gat, 1996; Araguas-Araguas et al., 2000]. This is a potentially serious problemthat could alter our modeled estimates of dfoliage by several% or more [Jacob and Sonntag, 1991]. Direct measure-ments of dvapor should be made in future studies of thistopic.[38] The Craig-Gordon model of evaporative enrichment
as applied to leaf water has been shown to be robust under awide range of environmental conditions for a wide range ofplant species [Roden and Ehleringer, 1999, and referencestherein]. However, most of these comparisons were madeduring the daytime when transpiration was active. Very few
published studies have assessed the validity of the model atnight [Cernusak et al., 2002]. Recall that we initiallyassumed d18O of atmospheric water vapor was in equilib-rium with local xylem water, and that led to an underesti-mation of bulk leaf water values (Figure 2). Bowling [1999]noted that the Craig-Gordon model underestimated bulk leafwater at night by 2% in white oak (Quercus alba) and redmaple (Acer rubrum). The best fit assumption for dvaporresulted in a favorable match with observations (Figures 2and 5), but is less than satisfying since it is a fit to makethings match.[39] The Craig-Gordon model assumes steady state
conditions (leaf transpiration rate, dvapor, leaf temperature,etc.) which can be controlled in the laboratory, but suchconditions are not likely to be met in the field [Wang andYakir, 1995]. Cernusak et al. [2002] examined d18O of bulkleaf water in lupine (Lupinus angustifolius) in the field withrepeated measurements through a night, and convincinglyshowed the steady state Craig-Gordon model underesti-mated d18O of leaf water at night by several %. Theypresented a non-steady-state variant of the model thatreproduced observed leaf water isotope content throughoutthe night with minimal error. Cernusak et al.’s [2002] modelwas based on several parameters obtained from leaf levelgas exchange measurements such as leaf transpiration rate,leaf conductance, and leaf water concentration, whichunfortunately were not available in the present study.Further, our assumption that leaf temperature equals airtemperature, a common assumption for conifers, is likely tofail at low wind speeds [Martin et al., 1999]. Regardless,given the large difference in dfoliage and dsoil, meaningfuldetermination of the soil respiration fraction ( f ) of totalecosystem respiration can still be achieved with errors of afew % in d18O of leaf water.[40] Variation with depth in d18O of soil water is quite
important for d18O of CO2 produced by soil respiration.CO2 is produced at some depth in the soil or litter layer, anddiffuses to the surface and out as a respiration flux.Respiratory CO2 undergoes a hydration reaction and equi-librates isotopically with soil water, although equilibrationmay not be complete. Production rates of CO2 by respira-tion differ with depth as respiratory substrate and nutrientavailability, microbial and macrofaunal activity, and rootingdepth vary. The degree to which the competing hydrationand diffusion rates will influence isotopic exchange of CO2
with soil water should also change as a function of depth.Miller et al. [1999] proposed the ‘‘setting point depth,’’ adepth at which CO2 in the surface flux is in apparentcomplete isotopic equilibrium with water in the soil profile.In reality, perfect equilibrium at a particular depth probablynever occurs, and the CO2 that effluxes from the soil surfacerepresents a flux-weighted average of CO2 in partial equi-libria with water at various depths in the soil [Miller et al.,1999].[41] The d18O of respired CO2 is influenced by the
diffusion of CO2 from the atmosphere that exchangesoxygen atoms with soil water and diffuses back out [Tans,1998]. This has been referred to as ‘‘atmospheric invasion’’[Tans, 1998] or ‘‘abiotic oxygen isotope exchange’’ [Sternet al., 2001]. Invading CO2 has an apparent oxygen isotopic
BOWLING ET AL.: 18O CONTENT OF ECOSYSTEM RESPIRATION, 2 34 - 9
signature that mimics that of CO2 produced by respiration,although it is not a direct product of biological respiration.The importance of invasion under natural conditions has notbeen established, but laboratory studies suggest it has asignificant influence under stable atmospheric conditionsand with soil chamber measurements of respired d18O[Miller et al., 1999]. Modeling results suggest the invasioncomponent of soil respiration can be as large as 0.7 mmolm�2 s�1 under some conditions [Stern et al., 2001]. Wehave entirely ignored invasion in our simple model.[42] Observations in Figure 3 show variation in d18O of
soil water with depth (4.7% over 15 cm). A modeledestimate of d18O of soil-respired CO2 that depends onmeasured d18O of soil water (such as the data we presentin Figure 6) is potentially in error by several % if thecomplexities of soil water d18O are not appropriatelycharacterized. There can be very pronounced isotopicenrichment (or depletion following rain) in the top fewcentimeters of the soil [Allison et al., 1983; Bariac et al.,1994; Melayah et al., 1996; Miller et al., 1999], but it is notclear that extreme near-surface enrichment in soil watersubstantially alters 18O of respired CO2 [Miller et al., 1999].Diffusion of CO2 produced very near the surface presum-ably occurs faster than the time required for isotopicchanges by hydration.[43] We used a simple approach to model d18O of soil-
respired CO2 which required measurements only of soilwater d18O and soil temperature. Tans [1998], Stern et al.[2001], and other papers by these groups have establishedelaborate process models to predict dsoil that compare wellwith observations in the laboratory [Miller et al., 1999].These models require information about soil water contentand isotope ratio variation with depth, soil physical proper-ties (porosity, tortuosity, diffusivity), and respiration rate(also as a function of depth). With detailed measurements ofthese parameters a more accurate estimate of dsoil could beobtained.[44] Efforts have been made to model the influence of
terrestrial ecosystems on the oxygen isotope ratio of atmo-spheric CO2 at regional, continental, and global scales[Ciais et al., 1997; Peylin et al., 1999; Cuntz et al., 2002,2003a, 2003b; Styles et al., 2002; Ishizawa et al., 2002].These models are fundamentally dependent on knowledgeof the isotopic composition of precipitation, which isalso typically modeled [e.g., Cuntz et al., 2003a, 2003b].Results from the present study, Bowling et al. [2003b], andFlanagan et al. [1999] suggest that to adequately capturethe dynamics of d18O of ecosystem respiration, models mustbe able to accurately characterize the seasonal and spatialvariation in environmental factors such as temperature andhumidity, and d18O of precipitation, soil water, and xylemwater. Ecosystem-scale studies of d18O in respiration clearlymust address the temporal variability in water pools andecosystem fluxes that we have observed. Future studies thatseek to use d18O in CO2 to partition ecosystem respirationfluxes should make an effort to improve determination ofdsoil and dfoliage via more extensive measurements andapplication of the latest improvements in modeling of leaf[Roden and Ehleringer, 1999; Gillon and Yakir, 2000a,2000b; Cernusak et al., 2002] and soil [Tans, 1998;
Amundson et al., 1998; Miller et al., 1999; Stern et al.,2001] isotopic effects on 18O.
4. Conclusions
[45] We have examined the factors that influence short-term variation (hours to days) in the oxygen isotopiccomposition of ecosystem respiration. d18O of precipitationwas variable from storm to storm, and in general thisvariability is expected to result in variation in d18O of soilwater. Within a ponderosa pine forest, synoptic changes inair and soil temperature and humidity influenced d18O of soilwater and leaf water over several days, and these water poolsaffected d18O of respired CO2. Isotopic estimates of thefractional contribution of soil respiration to total ecosystemrespiration in this forest averaged 80%, with large variabilitythat might be explained by changes in physical (e.g.,diffusion) and biological (e.g., heterotrophic) processes.
[46] Acknowledgments. Meridith Kurpius and Peter Anthoni provid-ed the meteorological data used in this study. Thanks to S. Kincaid,C. Lunch, and J. Roden for help with field work, and to D. Galvez,T. Jensen, S. Kincaid, M. Lott, C. Cook, S. Bill, and E. Perro-Grande forhelp with laboratory analyses. This work was supported by grants from theUnited States Department of Agriculture (for B. J. Bond, D. R. Bowling,J. R. Ehleringer, and N. G. McDowell, 99-35101-7772), the Department ofEnergy (for B. E. Law and the Metolius flux site, FG0300ER63014), andfrom the National Science Foundation Earth System History program (forJ. M. Welker, 0196475). Any opinions, findings, and conclusions orrecommendations expressed in this publication are those of the authorsand do not necessarily reflect the views of USDA, NSF or DOE.
ReferencesAllison, G. B., C. J. Barnes, and M. W. Hughes, The distribution ofdeuterium and 18O in dry soils: 2. Experimental, J. Hydrol., 64, 377–397, 1983.
Allison, G. B., J. R. Gat, and F. W. J. Leaney, The relationship betweendeuterium and oxygen-18 delta values in leaf water, Chem. Geol., 58,145–156, 1985.
Amundson, R., L. Stern, T. Baisden, and Y. Wang, The isotopic composi-tion of soil and soil-respired CO2, Geoderma, 82, 83–114, 1998.
Anthoni, P. M., B. E. Law, and M. H. Unsworth, Carbon and water vaporexchange of an open-canopied ponderosa pine ecosystem, Agric. For.Meteorol., 95, 151–168, 1999.
Anthoni, P. M., M. H. Unsworth, B. E. Law, J. Irvine, D. D. Baldocchi,S. Van Tuyl, and D. Moore, Seasonal differences in carbon and watervapor exchange in young and old-growth ponderosa pine ecosystems,Agric. For. Meteorol., 111, 203–222, 2002.
Araguas-Araguas, L., K. Froehlich, and K. Rozanski, Stable isotopecomposition of precipitation over southeast Asia, J. Geophys. Res.,103, 28,721–28,742, 1998.
Araguas-Araguas, L., K. Froehlich, and K. Rozanski, Deuterium andoxygen-18 isotope composition of precipitation and atmospheric moist-ure, Hydrol. Processes, 14, 1341–1355, 2000.
Bariac, T., J. Gonzalez-Dunia, N. Katerji, O. Bethenod, J. M. Bertolini, andA. Mariotti, Variabilite spatio-temporelle de la composition isotopique del’eau (18O, 2H) dans le continuum sol-plante-atmosphere 2. Approche enconditions naturelles, Chem. Geol., 115, 317–333, 1994.
BassiriRad, H., D. C. Tremmel, R. A. Virginia, J. F. Reynolds, A. G. deSoyza, and M. H. Brunell, Short-term patterns in water and nitrogenacquisition by two desert shrubs following a simulated summer rain,Plant Ecol., 145, 27–36, 1999.
Bowling, D. R., Stable isotope analysis of carbon dioxide exchange in aTennessee hardwood forest, Ph.D. dissertation, Univ. of Colorado,Boulder, Colo., 1999.
Bowling, D. R., D. D. Baldocchi, and R. K. Monson, Dynamics of isotopicexchange of carbon dioxide in a Tennessee deciduous forest, GlobalBiogeochem. Cycles, 13, 903–922, 1999.
Bowling, D. R., C. S. Cook, and J. R. Ehleringer, Technique to measureCO2 mixing ratio in small flasks with a bellows/IRGA system, Agric.For. Meteorol., 109, 61–65, 2001.
34 - 10 BOWLING ET AL.: 18O CONTENT OF ECOSYSTEM RESPIRATION, 2
Bowling, D. R., N. G. McDowell, B. J. Bond, B. E. Law, and J. R.Ehleringer, 13C content of ecosystem respiration is linked to precipita-tion and vapor pressure deficit, Oecologia, 131, 113–124, 2002.
Bowling, D. R., D. E. Pataki, and J. R. Ehleringer, Critical evaluation ofmicrometeorological methods for measuring ecosystem-atmosphere iso-topic exchange of CO2, Agric. For. Meteorol., 116, 159–179, 2003a.
Bowling, D. R., N. G. McDowell, J. M. Welker, B. J. Bond, B. E. Law,and J. R. Ehleringer, Oxygen isotope content of CO2 in nocturnalecosystem respiration: 1. Observations in forests along a precipitationtransect in Oregon, USA, Global Biogeochem. Cycles, 17, doi:10.1029/2003GB002081, in press, 2003b.
Brenninkmeijer, C. A. M., P. Kraft, and W. G. Mook, Oxygen isotopefractionation between CO2 and H2O, Isot. Geosci., 1, 181–190, 1983.
Buchmann, N., and J. R. Ehleringer, CO2 concentration profiles, and carbonand oxygen isotopes in C3, and C4 crop canopies, Agric. For. Meteorol.,89, 45–58, 1998.
Buchmann, N., J. M. Guehl, T. S. Barigah, and J. R. Ehleringer, Intersea-sonal comparison of CO2 concentrations, isotopic composition, andcarbon dynamics in an Amazonian rainforest (French Guiana), Oecolo-gia, 110, 120–131, 1997.
Cernusak, L. A., J. S. Pate, and G. D. Farquhar, Diurnal variation in thestable isotope composition of water and dry matter in fruiting Lupinusangustifolius under field conditions, Plant Cell Environ., 25, 893–907,2002.
Ciais, P., et al., A three-dimensional synthesis study of d18O in atmosphericCO2: 1. Surface fluxes, J. Geophys. Res., 102, 5857–5872, 1997.
Coplen, T. B., New guidelines for reporting stable hydrogen, carbon, andoxygen isotope-ratio data, Geochim. Cosmochim. Acta, 60, 3359–3360,1996.
Craig, H., and L. I. Gordon, Deuterium and oxygen 18 variations in theocean and the marine atmosphere, in Proceedings of a Conference onStable Isotopes in Oceanographic Studies and Paleotemperatures, editedby E. Tongiorgi, pp. 9–130, Lab. Di Geol. Nucleare, Cons. Naz. DelleRic., Spoleto, Italy, 1965.
Cui, M., and M. M. Caldwell, A large ephemeral release of nitrogen uponwetting of dry soil and corresponding root responses in the field, PlantSoil, 191, 291–299, 1997.
Cuntz, M., P. Ciais, and G. Hoffman, Modelling the continental effect ofoxygen isotopes over Eurasia, Tellus, Ser. B, 54, 895–909, 2002.
Cuntz, M., P. Ciais, G. Hoffmann, and W. Knorr, A comprehensive global3D model of d18O in atmospheric CO2: 1. Validation of surface processes,J. Geophys. Res., 108(D17), 4527, doi:10.1029/2002JD003153, 2003a.
Cuntz, M., P. Ciais, G. Hoffmann, C. E. Allison, R. J. Francey, W. Knorr,P. P. Tans, J. W. C. White, and I. Levin, A comprehensive global 3Dmodel of d18O in atmospheric CO2: 2. Mapping the atmospheric signal,Journal of Geophysical Research, J. Geophys. Res., 108(D17), 4528,doi:10.1029/2002JD003154, 2003b.
Dongmann, G., H. W. Nurnberg, H. Forstel, and K. Wagener, On theenrichment of H2
18O in the leaves of transpiring plants, Radiat. Environ.Biophys., 11, 41–52, 1974.
Ehleringer, J. R., and C. S. Cook, Carbon and oxygen isotope ratiosof ecosystem respiration along an Oregon conifer transect: Preliminaryobservations based on small-flask sampling, Tree Physiol., 18, 513–519,1998.
Farquhar, G. D., and J. Lloyd, Carbon and oxygen isotope effects in theexchange of carbon dioxide between terrestrial plants and the atmo-sphere, in Stable Isotope and Plant Carbon-Water Relations, edited byJ. R. Ehleringer, A. E. Hall, and G. D. Farquhar, pp. 47–70, Academic,San Diego, Calif., 1993.
Farquhar, G. D., J. Lloyd, J. A. Taylor, L. B. Flanagan, J. P. Syvertsen, K. T.Hubick, S. C. Wong, and J. R. Ehleringer, Vegetation effects on theisotope composition of oxygen in atmospheric CO2, Nature, 363, 439–443, 1993.
Farris, F., and B. R. Strain, The effects of water-stress on leaf H218O
enrichment, Radiat. Environ. Biophys., 15, 167–202, 1978.Fessenden, J. E., C. S. Cook, M. J. Lott, and J. R. Ehleringer, Rapid 18Oanalysis of small water and CO2 samples using a continuous-flow isotoperatio mass spectrometer, Rapid Commun. Mass Spectrom., 16, 1257–1260, 2002.
Flanagan, L. B., Environmental and biological influences on the stableoxygen and hydrogen isotopic composition of leaf water, in StableIsotope and Plant Carbon-Water Relations, edited by J. R. Ehleringer,A. E. Hall, and G. D. Farquhar, pp. 71–90, Academic, San Diego, Calif.,1993.
Flanagan, L. B., and G. T. Varney, Influence of vegetation and soil CO2
exchange on the concentration and stable oxygen isotope ratio of atmo-spheric CO2 within a Pinus resinosa canopy, Oecologia, 101, 37–44,1995.
Flanagan, L. B., J. P. Comstock, and J. R. Ehleringer, Comparison ofmodeled and observed environmental influences on the stable oxygenand hydrogen isotope composition of leaf water in Phaseolus vulgarisL., Plant Physiol., 96, 588–596, 1991.
Flanagan, L. B., J. R. Brooks, G. T. Varney, and J. R. Ehleringer, Discri-mination against C18O16O during photosynthesis and the oxygen isotoperatio of respired CO2 in boreal forest ecosystems, Global Biogeochem.Cycles, 11, 83–98, 1997.
Flanagan, L. B., D. S. Kubien, and J. R. Ehleringer, Spatial and temporalvariation in the carbon and oxygen stable isotope ratio of respired CO2 ina boreal forest ecosystem, Tellus, Ser. B, 51, 367–384, 1999.
Forstel, H., The enrichment of 18O in leaf water under natural conditions,Radiat. Environ. Biophys., 15, 323–344, 1978.
Francey, R. J., and P. P. Tans, Latitudinal variation in oxygen-18 of atmo-spheric CO2, Nature, 327, 495–497, 1987.
Friedli, H., U. Siegenthaler, D. Rauber, and H. Oeschger, Measurements ofconcentration, 13C/12C and 18O/16O ratios of tropospheric carbon dioxideover Switzerland, Tellus, Ser. B, 39, 80–88, 1987.
Gat, J. R., Oxygen and hydrogen isotopes in the hydrologic cycle, Annu.Rev. Earth Planet. Sci., 24, 225–262, 1996.
Gemery, P. A., M. Trolier, and J. W. C. White, Oxygen isotope exchangebetween carbon dioxide and water following atmospheric sampling usingglass flasks, J. Geophys. Res., 101, 14,415–14,420, 1996.
Gillon, J. S., and D. Yakir, Internal conductance to CO2 diffusion andC18OO discrimination in C3 leaves, Plant Physiol., 123, 201 –213,2000a.
Gillon, J. S., and D. Yakir, Naturally low carbonic anhydrase activity in C4
and C3 plants limits discrimination against C18OO during photosynthesis,Plant Cell Environ., 23, 903–915, 2000b.
Gillon, J., and D. Yakir, Influence of carbonic anhydrase activity in terres-trial vegetation on the 18O content of atmospheric CO2, Science, 291,2584–2587, 2001.
Harwood, K. G., J. S. Gillon, A. Roberts, and H. Griffiths, Determinants ofisotopic coupling of CO2 and water vapour within a Quercus petraeaforest canopy, Oecologia, 119, 109–119, 1999.
Hesterberg, R., and U. Siegenthaler, Production and stable isotopic compo-sition of CO2 in a soil near Bern, Switzerland, Tellus, Ser. B, 43, 197–205, 1991.
Irvine, J., and B. E. Law, Contrasting soil respiration in young and old-growth ponderosa pine forests, Global Change Biol., 8, 1183–1194,2002.
Irvine, J., B. E. Law, P. M. Anthoni, and F. C. Meinzer, Water limitations tocarbon exchange in old-growth and young ponderosa pine stands, TreePhysiol., 22, 189–196, 2002.
Ishizawa, M., T. Nakazawa, and K. Higuchi, A multi-box model study ofthe role of the biospheric metabolism in the recent decline of d18O inatmospheric CO2, Tellus, Ser. B, 54, 307–324, 2002.
Jacob, H., and C. Sonntag, An 8-year record of the seasonal variation of 2Hand 18O in atmospheric water vapour and precipitation at Heidelberg,Germany, Tellus, Ser. B, 43, 291–300, 1991.
Keeling, C. D., The concentration and isotopic abundances of atmosphericcarbon dioxide in rural areas, Geochim. Cosmochim. Acta, 13, 322–334,1958.
Keeling, C. D., The concentration and isotopic abundances of atmosphericcarbon dioxide in rural and marine air, Geochim. Cosmochim. Acta, 24,277–298, 1961.
Kelliher, F. M., D. J. Ross, B. E. Law, D. D. Baldocchi, and N. J. Rodda,Carbon and nitrogen mineralization in litter and mineral soil of young andold ponderosa pine forests during summer drought and after wetting, For.Ecol. Manage., in press, 2003.
Langendorfer, U., M. Cuntz, P. Ciais, P. Peylin, T. Bariac, I. Milyukova,O. Kolle, T. Naegler, and I. Levin, Modelling of biospheric CO2 grossfluxes via oxygen isotopes in a spruce forest canopy: A 222Rn calibratedbox model approach, Tellus, Ser. B, 54, 476–496, 2002.
Law, B. E., M. G. Ryan, and P. M. Anthoni, Seasonal and annual respirationof a ponderosa pine ecosystem, Global Change Biol., 5, 169–182,1999.
Law, B. E., M. Williams, P. M. Anthoni, D. D. Baldocchi, and M. H.Unsworth, Measuring and modeling seasonal variation of carbon dioxideand water vapour exchange of a Pinus ponderosa forest subject to soilwater deficit, Global Change Biol., 6, 613–630, 2000.
Law, B. E., P. E. Thornton, J. Irvine, P. M. Anthoni, and S. Van Tuyl,Carbon storage and fluxes in ponderosa pine forests at different devel-opmental stages, Global Change Biol., 7, 755–777, 2001a.
Law, B. E., S. van Tuyl, A. Cescatti, and D. D. Baldocchi, Estimationof leaf area index in open-canopy ponderosa pine forests at differentsuccessional stages and management regimes in Oregon, Agric. For.Meteorol., 108, 1–14, 2001b.
BOWLING ET AL.: 18O CONTENT OF ECOSYSTEM RESPIRATION, 2 34 - 11
Majoube, M., Fractionnement en oxygene 18 et en deuterium entre l’eau etsa vapeur, J. Chim. Phys., 58, 1423–1436, 1971.
Martin, T. A., T. M. Hinckley, F. C. Meinzer, and D. G. Sprugel, Boundarylayer conductance, leaf temperature and transpiration of Abies amabilisbranches, Tree Physiol., 19, 435–443, 1999.
McDowell, N. G., D. R. Bowling, B. J. Bond, J. Irvine, B. E. Law,P. Anthoni, and J. R. Ehleringer, Response of the carbon isotopic contentof ecosystem, leaf, and soil respiration to meteorological and physiolog-ical driving factors in a Pinus ponderosa ecosystem, Global Biogeochem.Cycles, 18, doi:10.1029/2003GB002049, in press, 2003.
Melayah, A., L. Bruckler, and T. Bariac, Modeling the transport of waterstable isotopes in unsaturated soils under natural conditions: 2. Compar-ison with field experiments, Water Resour. Res., 32, 2055–2065, 1996.
Miller, J. B., D. Yakir, J. W. C. White, and P. P. Tans, Measurement of18O/16O in the soil-atmosphere CO2 flux, Global Biogeochem. Cycles,13, 761–774, 1999.
Mortazavi, B., and J. P. Chanton, Carbon isotopic discrimination and con-trol of nighttime canopy d18O-CO2 in a pine forest in the southeasternUnited States, Global Biogeochem. Cycles, 16(1), 1008, doi:10.1029/2000GB001390, 2002.
Pataki, D. E., J. R. Ehleringer, L. B. Flanagan, D. Yakir, D. R. Bowling,C. J. Still, N. Buchmann, J. O. Kaplan, and J. A. Berry, The applicationand interpretation of Keeling plots in terrestrial carbon cycle research,Global Biogeochem. Cycles, 17(1), 1022, doi:10.1029/2001GB001850,2003.
Peylin, P., P. Ciais, A. S. Denning, P. P. Tans, J. A. Berry, and J. C. White,A 3-dimensional study of d18O in atmospheric CO2: Contribution ofdifferent land ecosystems, Tellus, Ser. B, 51, 642–667, 1999.
Roden, J. S., and J. R. Ehleringer, Observations of hydrogen and oxygenisotopes in leaf water confirm the Craig-Gordon model under wide-ranging environmental conditions, Plant Physiol., 120, 1165–1173, 1999.
Rozanski, K., C. Sonntag, and K. O. Munnich, Factors controlling stableisotope composition of European precipitation, Tellus, 34, 142–150,1982.
Rozanski, K., L. Araguas-Araguas, and R. Gonfiantini, Isotopic patterns inmodern global precipitation, in Climate Change in Continental IsotopicRecords, Geophys. Monogr. Ser., vol. 78, edited by P. K. Swart et al.,pp. 1–36, AGU, Washington, D. C., 1993.
Sala, O. E., and W. K. Lauenroth, Small rainfall events: An ecological rolein semiarid regions, Oecologia, 53, 301–304, 1982.
Schwinning, S., B. I. Starr, and J. R. Ehleringer, Dominant cold desertplants do not partition warm season precipitation by event size, Oecolo-gia, 136, 252–260, 2003.
Stern, L. A., R. Amundson, and W. T. Baisden, Influence of soils on oxygenisotope ratio of atmospheric CO2, Global Biogeochem. Cycles, 15, 753–759, 2001.
Sternberg, L. S. L., M. Z. Moreira, L. A. Martinelli, R. L. Victoria, E. M.Barbosa, L. C. M. Bonates, and D. Nepstad, The relationship between18O/16O and 13C/12C ratios of ambient CO2 in two Amazonian tropicalforests, Tellus, Ser. B, 50, 366–376, 1998.
Styles, J. M., J. Lloyd, D. Zolotoukhine, K. A. Lawton, N. Tchebakova, R. J.Francey, A. Arneth, D. Salamakho, O. Kolle, and E.-D. Schulze, Estimatesof regional surface carbon dioxide exchange and carbon and oxygen iso-tope discrimination during photosynthesis from concentration profiles inthe atmospheric boundary layer, Tellus, Ser. B, 54, 768–783, 2002.
Tans, P. P., Oxygen isotopic equilibrium between carbon dioxide and waterin soils, Tellus, Ser. B, 50, 163–178, 1998.
Taylor, G. H., and C. Hannan, The Climate of Oregon: From Rainforest toDesert, Oregon State Univ. Press, Corvallis, Oreg., 1999.
Wang, X.-F., and D. Yakir, Temporal and spatial variations in the oxygen-18 content of leaf water in different plant species, Plant Cell Environ., 18,1377–1385, 1995.
Welker, J. M., Isotopic (d18O) characteristics of weekly precipitation col-lected across the USA: An initial analysis with application to watersource studies, Hydrol. Processes, 14, 1449–1464, 2000.
Yakir, D., and L. S. L. Sternberg, The use of stable isotopes to studyecosystem gas exchange, Oecologia, 123, 297–311, 2000.
Yakir, D., and X.-F. Wang, Fluxes of CO2 and water between terrestrialvegetation and the atmosphere estimated from isotope measurements,Nature, 380, 515–517, 1996.
�������������������������B. J. Bond and B. E. Law, Department of Forest Science, Oregon State
University, Corvallis, OR 97331, USA. ([email protected]; [email protected])D. R. Bowling and J. R. Ehleringer, Stable Isotope Ratio Facility for
Environmental Research, Department of Biology, University of Utah, 257South 1400 East, Salt Lake City, UT 84112, USA. ([email protected]; [email protected])N. G. McDowell, Earth and Environmental Sciences Division, Hydrol-
ogy, Geochemistry and Geology Group, EES-6, MS-D462, Los AlamosNational Laboratory, Los Alamos, NM 87545, USA. ([email protected])J. M. Welker, Natural Resource Ecology Laboratory, Colorado State
University, Fort Collins, CO 80523, USA. ( [email protected])
34 - 12 BOWLING ET AL.: 18O CONTENT OF ECOSYSTEM RESPIRATION, 2
Copyright © 2022 FDOKUMEN