Overview of StressCheck Capabilities - afgrow
51
James A. Harter Alexander V. Litvinov LexTech, Inc. 8285 Rhine Way Centerville, OH 45458
-
Upload
khangminh22 -
Category
Documents
-
view
4 -
download
0
Transcript of Overview of StressCheck Capabilities - afgrow

James A. Harter
Alexander V. Litvinov
LexTech, Inc.
8285 Rhine Way
Centerville, OH 45458

Agenda
AFGROW Fundamentals & New Capabilities
Alex Litvinov, LexTech, Inc.
Jim Harter, Consultant, LexTech, Inc.
Break
BAMF Demonstration and Latest Capabilities
Robert Pilarczyk, Hill Engineering, LLC.
Josh Hodges, Hill Engineering, LLC.
1:00 – 3:00
3:30 – 5:00
3:00 – 3:10

AFGROW, Version 5.3.4
New Capabilities & Features
Topics
New Classic K-Solutions
Residual Stress Capability for Advanced Models *
Bearing & Bending Loading for Continuing Damage Models
New Tabular Crack Growth Rate Capabilities **
Damage Tagging
Environmental Tagging
Spectrum Management/Generation
Future Development Plans
* Introduced in Version 5.3.3
** Introduced in Version 5.3.1

New Classic Models
• Internal Axial Crack in Pipe
• External Axial Crack in Pipe
• Interdependent Through Cracks
• Single Edge Through Crack in a Finite Height Plate
• Constant K Specimen
• Axial Through Crack in Pipe
Recent Improvements to the AFGROW
Residual Stress Capability
5
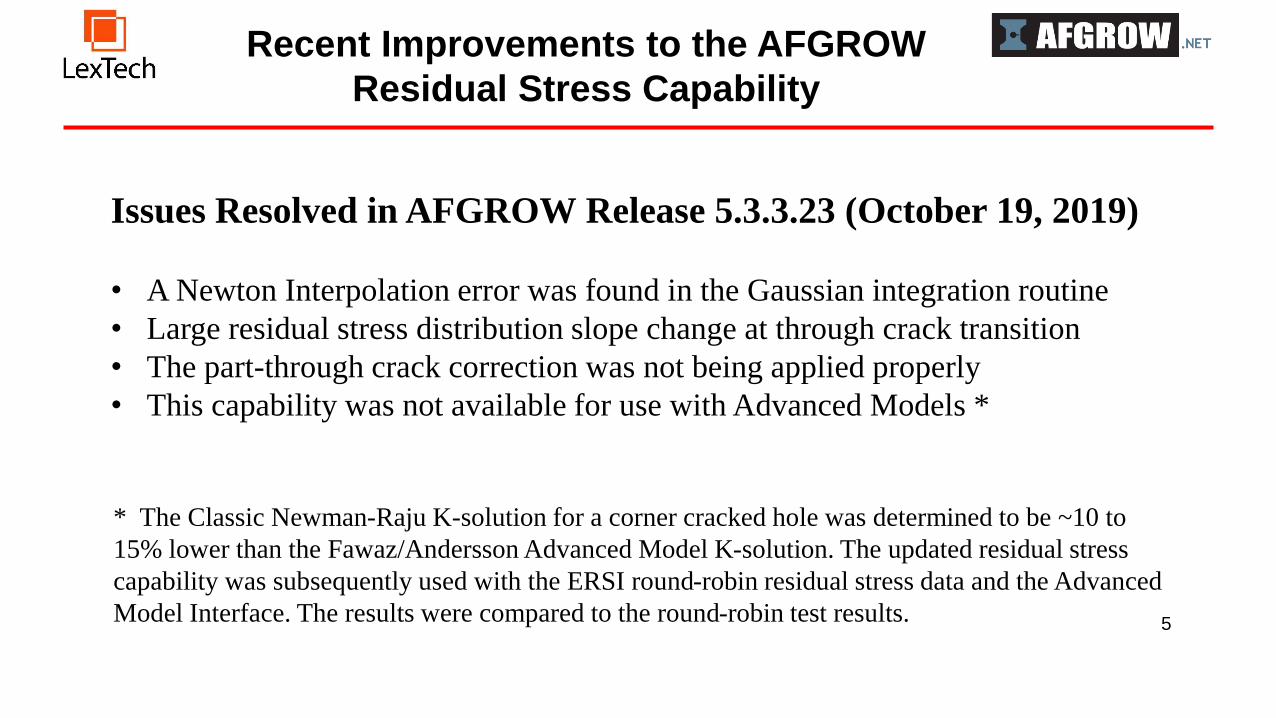
Issues Resolved in AFGROW Release 5.3.3.23 (October 19, 2019)
• A Newton Interpolation error was found in the Gaussian integration routine
• Large residual stress distribution slope change at through crack transition
• The part-through crack correction was not being applied properly
• This capability was not available for use with Advanced Models *
* The Classic Newman-Raju K-solution for a corner cracked hole was determined to be ~10 to
15% lower than the Fawaz/Andersson Advanced Model K-solution. The updated residual stress
capability was subsequently used with the ERSI round-robin residual stress data and the Advanced
Model Interface. The results were compared to the round-robin test results.

AFGROW 2-D Gaussian Integration Method
6
For part-through Cracks, the
integration is now performed twice:
Integration is performed first for r <= thickness.
This results in a residual K table for the corner
crack.
Integration is performed again for all integration
points with S(0,r) (a-direction) set to 0.0
(equivalent to a 1-D crack case). This is the
residual K table used after transition to a through
crack.

AFGROW 2-D Gaussian Integration Method
7
Important Note:
Two integration points are needed beyond the
longest crack expected for each integration process.
The Gaussian integration method uses a Newton
polynomial interpolation method that requires two
points ahead of each integration point for valid
results.

Two Points on the Crack Front are Currently Used for
the Advanced Model Residual Stress Implementation
8
When performing analyses for the ERSI round robin effort, the best correlation was obtained when
mapping the 3-D residual stress field approximately 5 degrees from either free surface.
Modeling Two Points along the Crack Front

9
Modeling Two Points along the Crack Front
-70
-60
-50
-40
-30
-20
-10
0
10
0 0.2 0.4 0.6 0.8 1 1.2 1.4 1.6 1.8
Re
sid
ua
l S
tre
ss (
Ksi)
Radial Distance from Crack Origin
5 Degrees Inside Free Surface
C - Dimension
A - Dimension

Life Prediction Demonstration

Bearing & Bending Loading for
Continuing Damage Models
• Bearing Load Solution is Curve Fit Using FEM results and the
Newman-Raju Format
• Corner Crack Parameter, G2, Based on the Through Crack Infinite
Plate Solution
• Parameters G4 & G5 Modified as Necessary
• Parameters G6 & G7 Added to Minimize Curve Fit Errors
• Transverse Through Crack Bending Solution Employs the (1/3 –
2/3) User-Defined Fraction of the Axial Solution

Bearing & Bending Loading for
Continuing Damage Models
New Tabular Growth Rate Capabilities
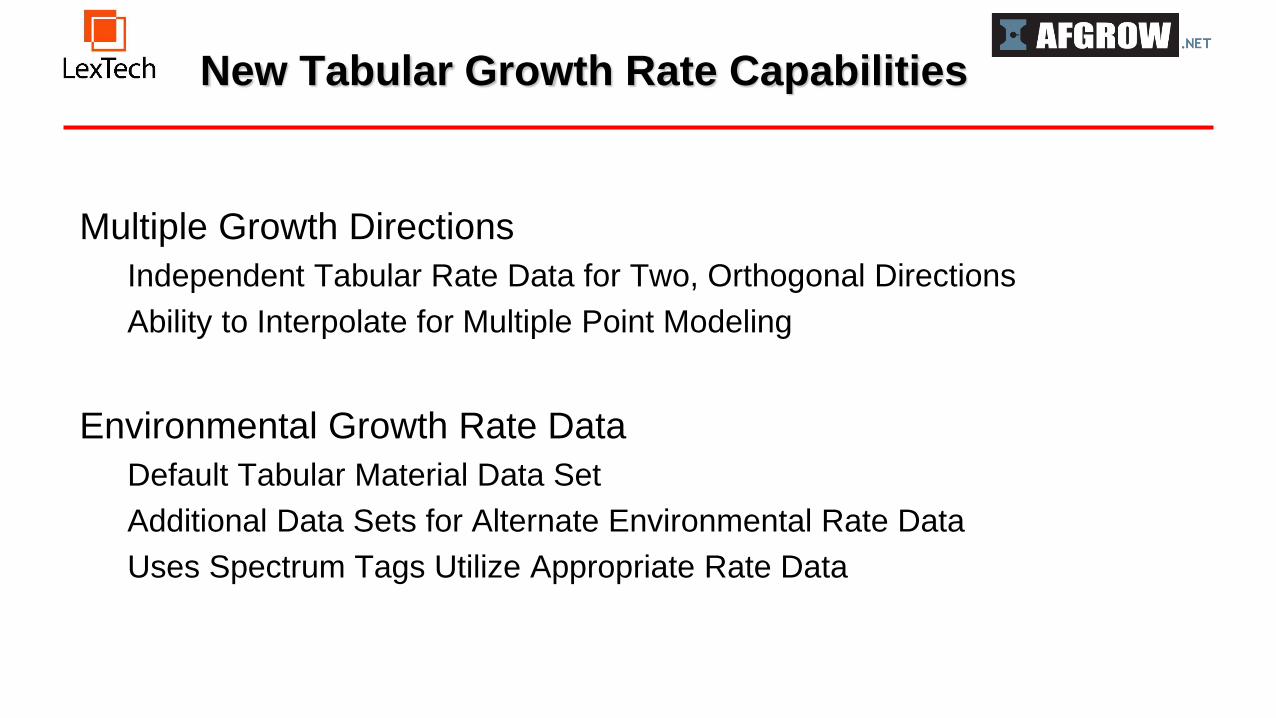
Multiple Growth Directions
Independent Tabular Rate Data for Two, Orthogonal Directions
Ability to Interpolate for Multiple Point Modeling
Environmental Growth Rate Data
Default Tabular Material Data Set
Additional Data Sets for Alternate Environmental Rate Data
Uses Spectrum Tags Utilize Appropriate Rate Data

Using Data for Multiple Crack Growth
Directions
Crack Growth Rate Data for
L-S, T-S, and S-L Orientations
are Very Difficult to Find

Using Data for Multiple Crack Growth
Directions
Multiple Point Solutions
Require a Method to
Interpolate Rate Data Along
the Crack Front
AFGROW, Version 5.3.5
(upcoming release) will allow
interpolation using an
interpolation angle (g)

Multiple Crack Growth Directions
1.E-06
1.E-05
1.E-04
1 10 100
C Length (Specimen 1)
A Length (Specimen 1)
Through Crack (Specimen1)
C Length (Specimen 2)
A Length (Specimen 2)
Through Crack (Specimen2)
C Length (Specimen 3)
A Length (Specimen 3)
Through Crack (Specimen3)
C Length Fit (Dual Rate)
A Length Fit (Dual Rate)
Round Robin Fit
AFGROW Round-Robin Data

Multiple Crack Growth Directions

Multiple Crack Growth Directions
0.00
0.05
0.10
0.15
0.20
0.25
0.30
0 10,000 20,000 30,000 40,000 50,000
Cra
ck L
en
gth
, a
-tip
(in
)
Cycles
PC-CX7075-2 a-tip
Test
MacAllan A
MacAllan B
MacAllan C
Finlaggan
Black Label
Dewars B
Jura
Cathead
Round Robin Fit
Dual Rate Fit
0.0
0.2
0.4
0.6
0.8
1.0
1.2
1.4
1.6
1.8
2.0
0 20,000 40,000 60,000 80,000 100,000 120,000
Cra
ck L
en
gth
, c-t
ip (
in)
Cycles
PC-CX7075-2 c-tip
Test
MacAllan A
MacAllan B
MacAllan C
Dalwhinnie
Finlaggan
Black Label
Dewars B
Jura
Cathead
Round Robin Fit
Dual Rate Fit
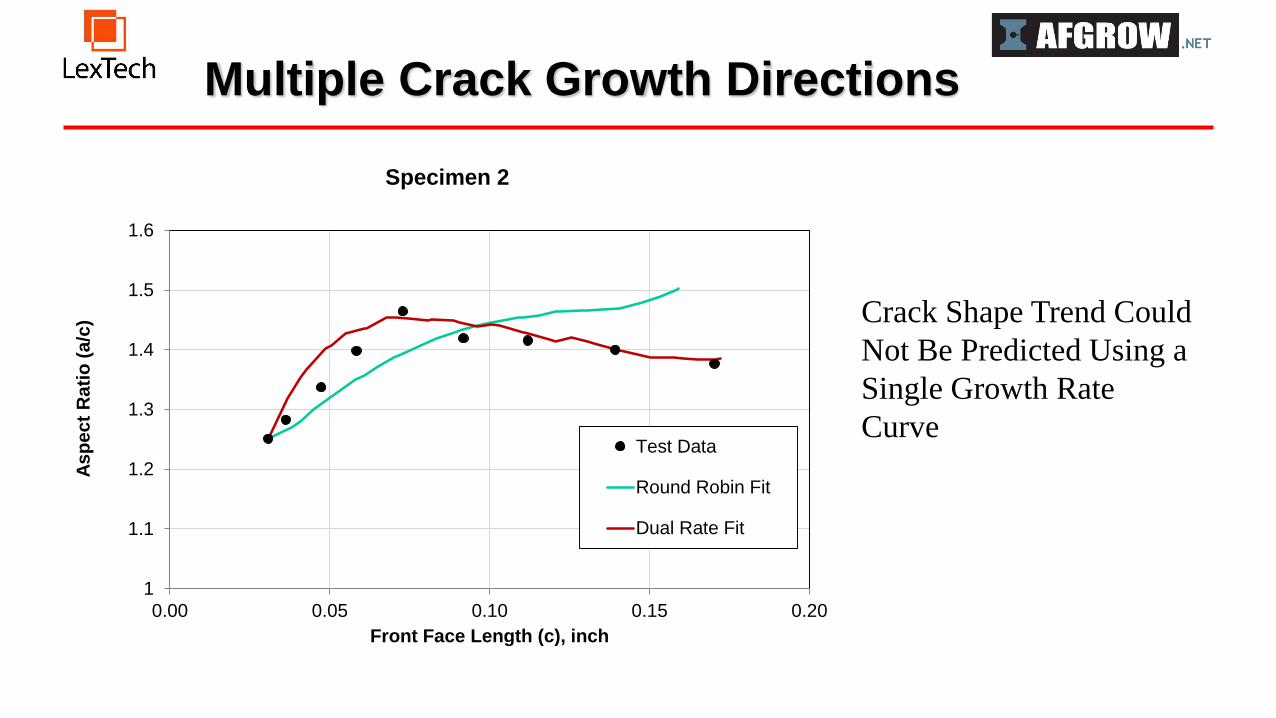
Multiple Crack Growth Directions
Crack Shape Trend Could
Not Be Predicted Using a
Single Growth Rate
Curve
1
1.1
1.2
1.3
1.4
1.5
1.6
0.00 0.05 0.10 0.15 0.20
As
pe
ct
Ra
tio
(a
/c)
Front Face Length (c), inch
Specimen 2
Test Data
Round Robin Fit
Dual Rate Fit

Multiple Crack Growth Directions
AFMAT Demonstration
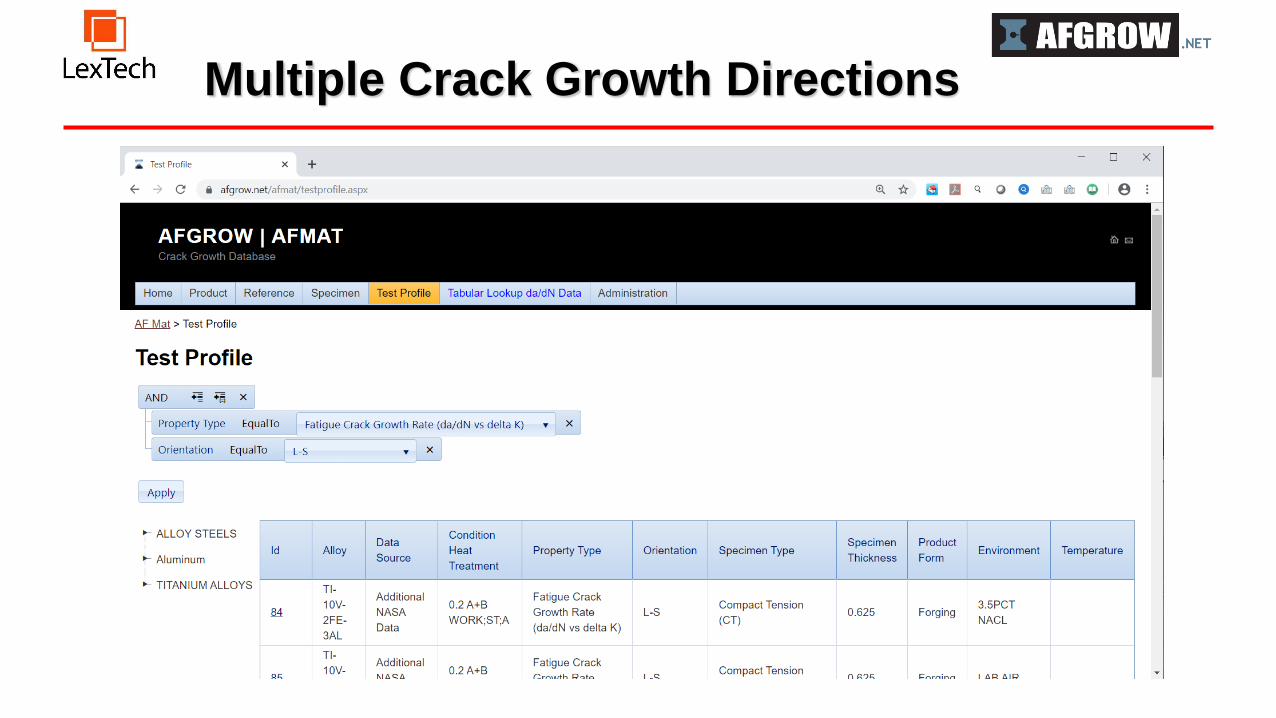
Multiple Crack Growth Directions

Multiple Crack Growth Directions

Multiple Crack Growth Directions

Multiple Crack Growth Directions
1.00E-09
1.00E-08
1.00E-07
1.00E-06
1.00E-05
1.00E-04
1.00E-03
1.00E-02
1 10 100
2024-T851 Lab Air Plate (L-S) R=0.1
ID 16328
ID 16329
ID 16330
ID 16331
Tabular Fit (L-T)
Corner Cracked Plate Test Specimens
L-S Data from Krupp, Pettit, and
Hoeppner (1974)
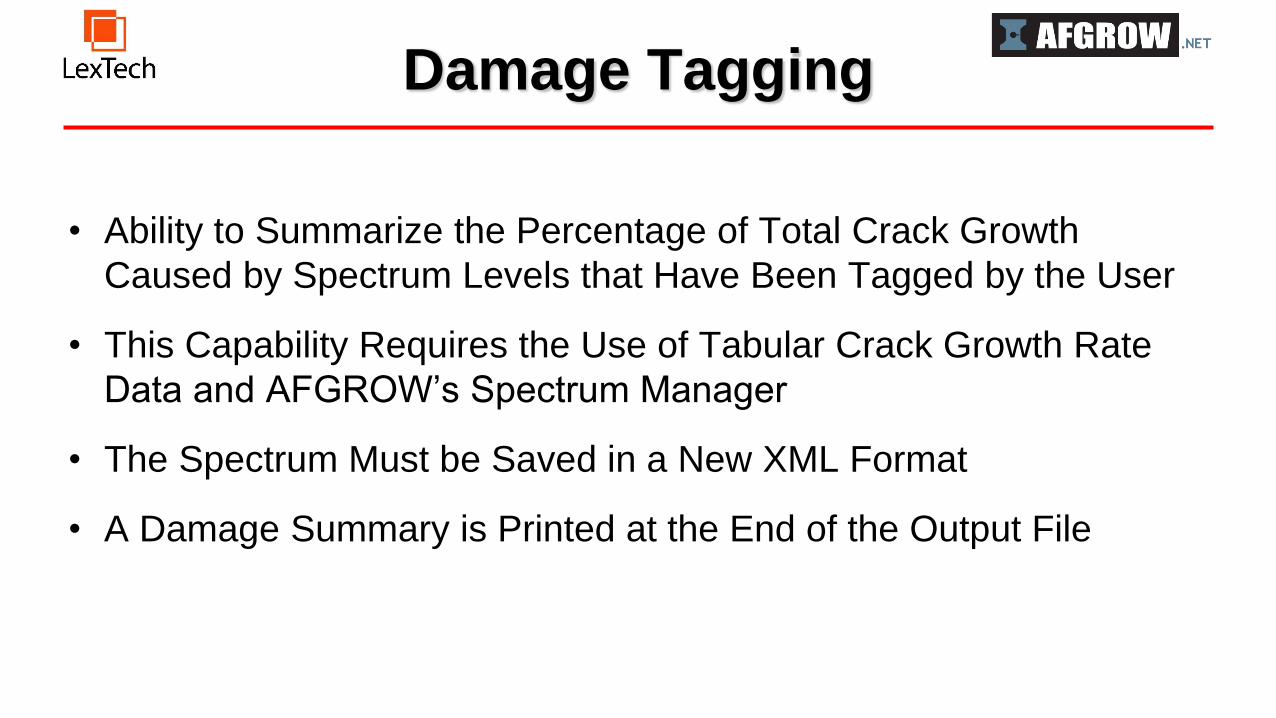
Damage Tagging
• Ability to Summarize the Percentage of Total Crack Growth
Caused by Spectrum Levels that Have Been Tagged by the User
• This Capability Requires the Use of Tabular Crack Growth Rate
Data and AFGROW’s Spectrum Manager
• The Spectrum Must be Saved in a New XML Format
• A Damage Summary is Printed at the End of the Output File

Damage Tagging
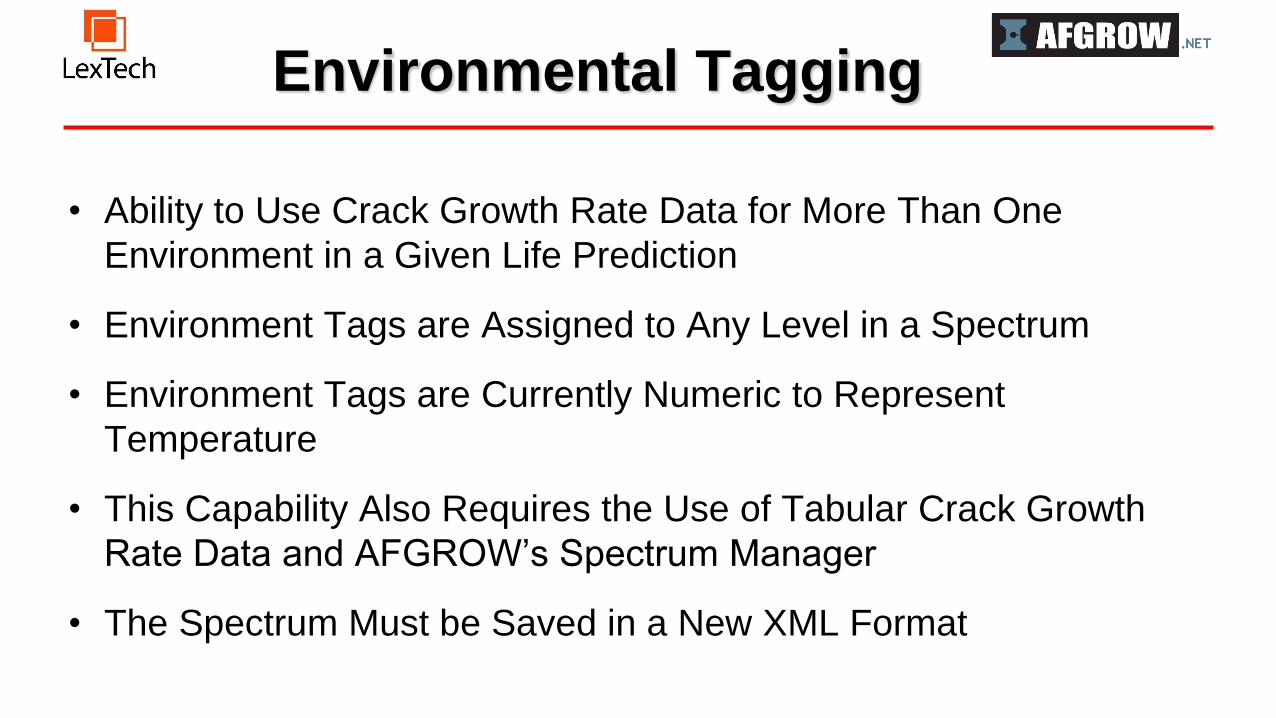
Environmental Tagging
• Ability to Use Crack Growth Rate Data for More Than One
Environment in a Given Life Prediction
• Environment Tags are Assigned to Any Level in a Spectrum
• Environment Tags are Currently Numeric to Represent
Temperature
• This Capability Also Requires the Use of Tabular Crack Growth
Rate Data and AFGROW’s Spectrum Manager
• The Spectrum Must be Saved in a New XML Format

Environmental Tagging

Spectrum Issues
Vs
Life Prediction Validation Testing

Load History
Peak-Valley Reversals

Definition: Stress or Load Cycle
A cycle is defined as a stress (or load) excursion which starts at a
certain level and returns to the same level over time. A cycle may
be characterized by it’s maximum and minimum value.
Load reversals and cycles are NOT the same!

Cycles vs. Reversals
Reversal data may be used by a test machine to
apply a sequence of loads to a test specimen
since each peak is greater than the previous valley
Cycles are extracted from reversal data with no
assurance that each maximum will be greater than
the minimum of the previous cycle

Definition: Stress Ratio (R)
R = smin/smax
A stress cycle is defined by it’s minimum and maximum value, but
the resulting crack growth rate is determined by the stress intensity
range (DK) and the stress ratio (R).
Crack growth life is determined based on cycles that have been
extracted (counted) from a known (or simulated) loading history.

Variable Amplitude Loading Discussion
Spectrum development, analysis, and testing formats
Dallen L. Andrew
© 2018 Hill Engineering, LLC
hill-engineering.com 35
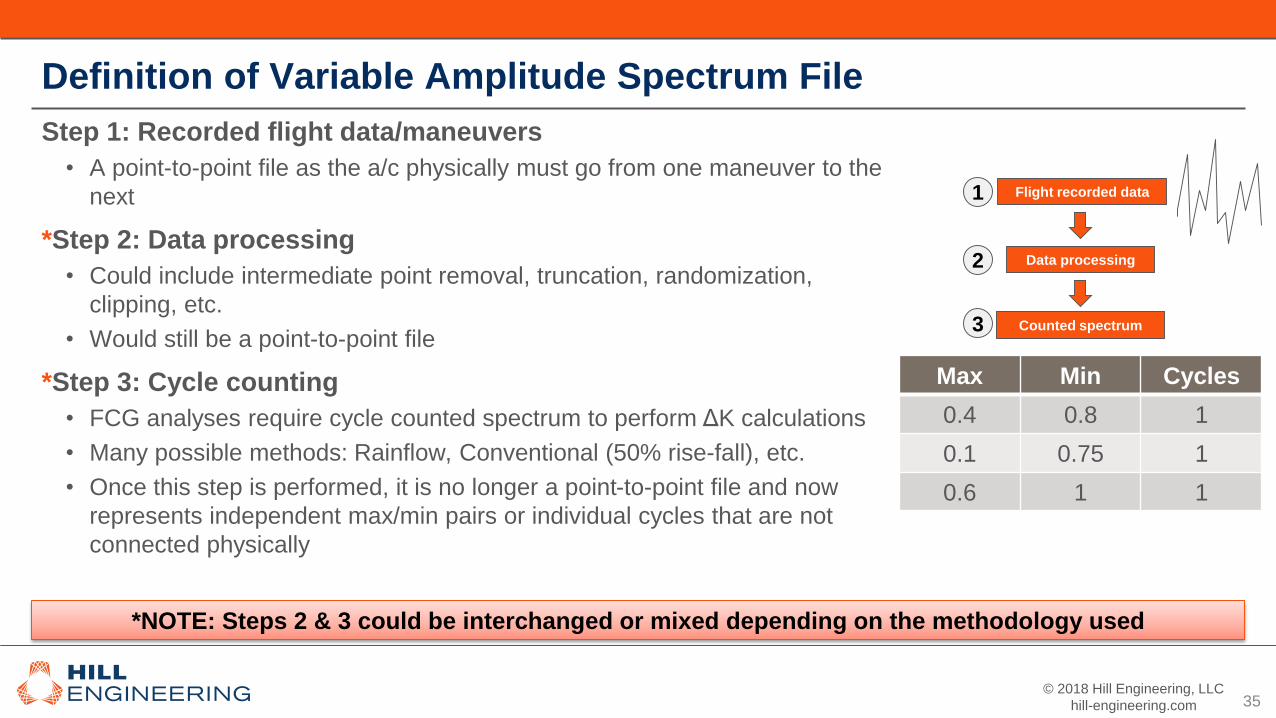
Definition of Variable Amplitude Spectrum File
Max Min Cycles
0.4 0.8 1
0.1 0.75 1
0.6 1 1
Data processing
Counted spectrum
Flight recorded data1
Step 1: Recorded flight data/maneuvers
• A point-to-point file as the a/c physically must go from one maneuver to the
next
*Step 2: Data processing
• Could include intermediate point removal, truncation, randomization,
clipping, etc.
• Would still be a point-to-point file
*Step 3: Cycle counting
• FCG analyses require cycle counted spectrum to perform ΔK calculations
• Many possible methods: Rainflow, Conventional (50% rise-fall), etc.
• Once this step is performed, it is no longer a point-to-point file and now
represents independent max/min pairs or individual cycles that are not
connected physically
2
3
*NOTE: Steps 2 & 3 could be interchanged or mixed depending on the methodology used

© 2018 Hill Engineering, LLC
hill-engineering.com 36
Definition of Variable Amplitude Spectrum File
Counted Spectrum
• The format used to implement a counted spectrum file into FCG
analysis software varies:
• Min-Max pairs, Max-Min pairs, Base-Peak-Base, etc.
• But all represent the same thing:
• Independent, Separate, Full Cycles Line # Max Min # Cycles
1 11 4 1
2 8 1 1
3 14 6 1
Line # Base Peak Base # Cycles
1 4 11 4 1
2 1 8 1 1
3 6 14 6 1
Line # Min Max # Cycles
1 4 11 1
2 1 8 1
3 6 14 1
0
2
4
6
8
10
12
14
Max1 = 11
Min1 = 4
Max2 = 8
Min2 = 1
Max3 = 14
Min3 = 6Str
es
s
1 full cycle 1 full cycle 1 full cycle
Counted spectrum represent independent, separate, full cycles
© 2018 Hill Engineering, LLC
hill-engineering.com 37
Point # Load
1 11
2 4
3 8
4 1
5 14
6 6
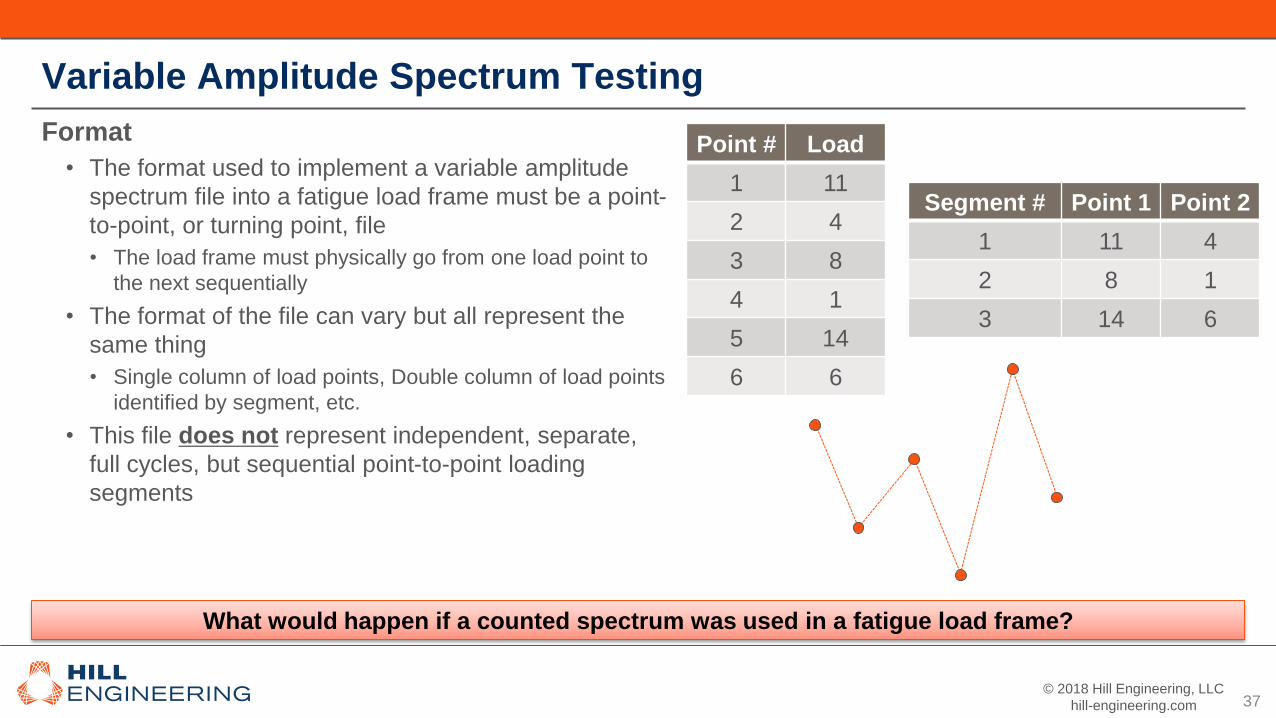
Variable Amplitude Spectrum Testing
Format
• The format used to implement a variable amplitude
spectrum file into a fatigue load frame must be a point-
to-point, or turning point, file
• The load frame must physically go from one load point to
the next sequentially
• The format of the file can vary but all represent the
same thing
• Single column of load points, Double column of load points
identified by segment, etc.
• This file does not represent independent, separate,
full cycles, but sequential point-to-point loading
segments
Segment # Point 1 Point 2
1 11 4
2 8 1
3 14 6
What would happen if a counted spectrum was used in a fatigue load frame?

© 2018 Hill Engineering, LLC
hill-engineering.com 38
0
2
4
6
8
10
12
14
Str
es
s
Variable Amplitude Spectrum Testing
Counted Spectrum
• Taking the previous example of a counted spectrum (left), the
applied load cycles can be identified by color, with a full cycle
indicated by the colored arrows (right)
0
2
4
6
8
10
12
14
Max1 = 11
Min1 = 4
Max2 = 8
Min2 = 1
Max3 = 14
Min3 = 6Str
es
s
1 full cycle 1 full cycle 1 full cycle
Line # Max Min # Cycles
1 11 4 1
2 8 1 1
3 14 6 1

© 2018 Hill Engineering, LLC
hill-engineering.com 39
Line # Max Min # Cycles
1 11 4 1
2 8 1 1
3 14 6 1
Variable Amplitude Spectrum Testing
Counted Spectrum
• Left image: The counted spectrum identified by color
• Center image: The purple dashed lines identify how a fatigue load frame would interpret a counted spectrum
file format of max/min pairs
• Right image: The colored dashed lines with arrows identify the corresponding applied load cycle and direction
seen in the fatigue load frame
0
2
4
6
8
10
12
14
Str
es
s
0
2
4
6
8
10
12
14
Str
es
s
0
2
4
6
8
10
12
14
Str
es
s

© 2018 Hill Engineering, LLC
hill-engineering.com 40
Line # Max Min # Cycles
1 11 4 1
2 8 1 1
3 14 6 1
0
2
4
6
8
10
12
14
Str
es
s
0
2
4
6
8
10
12
14
Str
es
s
1 full cycle
1 full cycle
1 full cycle
Extra ½
cycle
Variable Amplitude Spectrum Testing
Counted Spectrum
• Left image: The colored dashed lines with arrows identify the
corresponding applied load cycle and direction seen in the fatigue load frame
• Black dashed lines are added to indicate additional damage imparted to the coupon, not part of any full colored cycle
• Right image: Applied damage comparison
• The full cycle indicated by a counted spectrum file for use in FCG analysis are shown in solid colored lines with arrows
• The segments applied by a fatigue load frame are shown in dashed colored lines with arrows
• The black dashed lines indicate additional segment (½ cycle) that were applied in the fatigue load frame that do not exist
in the analysis using a counted spectrum

© 2018 Hill Engineering, LLC
hill-engineering.com 41
Line # Max Min # Cycles
1 11 4 1
2 8 1 1
3 14 6 1
0
2
4
6
8
10
12
14
Str
es
s
1 full cycle
1 full cycle
1 full cycle
Extra ½
cycle
Variable Amplitude Spectrum Testing
Counted Spectrum
• Now imagine a spectrum file with thousands of max/min counted pairs
• The difference between the test and the analysis could become quite significant due to the additional load segments
What format of data should be used for variable amplitude spectrum testing?

© 2018 Hill Engineering, LLC
hill-engineering.com 42
Variable Amplitude Spectrum Testing
Review the spectrum development process:
• Step 1: Recorded flight data/maneuvers
• A point-to-point file as the a/c physically must go from one maneuver to the next
• Step 2: Data processing
• Could include intermediate point removal, truncation, randomization, clipping, etc.
• Would still be a point-to-point file
**Prior to Step 3, the point-to-point load spectrum should be identified, as this is the spectrum
that should be used in a fatigue load frame
• Then that test spectrum should then be cycle counted for use in FCG analyses
• Validation should be performed to ensure the counting methodology utilized is consistent with the original
point-to-point spectrum
• Step 3: Cycle counting
• FCG analyses require cycle counted spectrum to perform ΔK calculations
• Many possible methods: Rainflow, etc.
• Once this step is performed, it is no longer a point-to-point file and now represents independent max/min pairs or
individual cycles that are not connected physically

© 2018 Hill Engineering, LLC
hill-engineering.com 43
Variable Amplitude Spectrum Testing
Intermediate Points
• When a subsequent ‘max’ point is less than the previous ‘min’, an
intermediate point is now part of the loading spectrum
• Test frame software may not accept this, as it needs to be a turning point file
• One approach used is to strip out all intermediate points
0
2
4
6
8
10
12
14
Str
es
s
0
2
4
6
8
10
12
14
Max1 = 18
Min1 = 10
Max2 = 15
Min2 = 7
Max3 = 6
Min3 = -4
Str
es
s
Line # Max Min # Cycles
1 18 10 1
2 15 7 1
3 6 -4 1
© 2018 Hill Engineering, LLC
hill-engineering.com 44
Variable Amplitude Spectrum Testing
Cycle Counting
• Crack growth life prediction programs use cycle counted spectra since crack growth extension is calculated
based on the change in stress intensity factor for a fully reversed (complete) cycle
• Uncounted load (or stress) spectra consist of a series of values which are not necessarily arranged as a
sequence of complete cycles
• These spectra are generally in a peak-valley format with each point representing a reversal of load
• Complete cycles are imbedded within the uncounted spectrum
• Various counting options are commonly used:
• Rainflow
• Conventional (50% rise-fall) count
• Range pair peak (fixed increment) count
• Mean crossing count
• Level counting
© 2018 Hill Engineering, LLC
hill-engineering.com 45
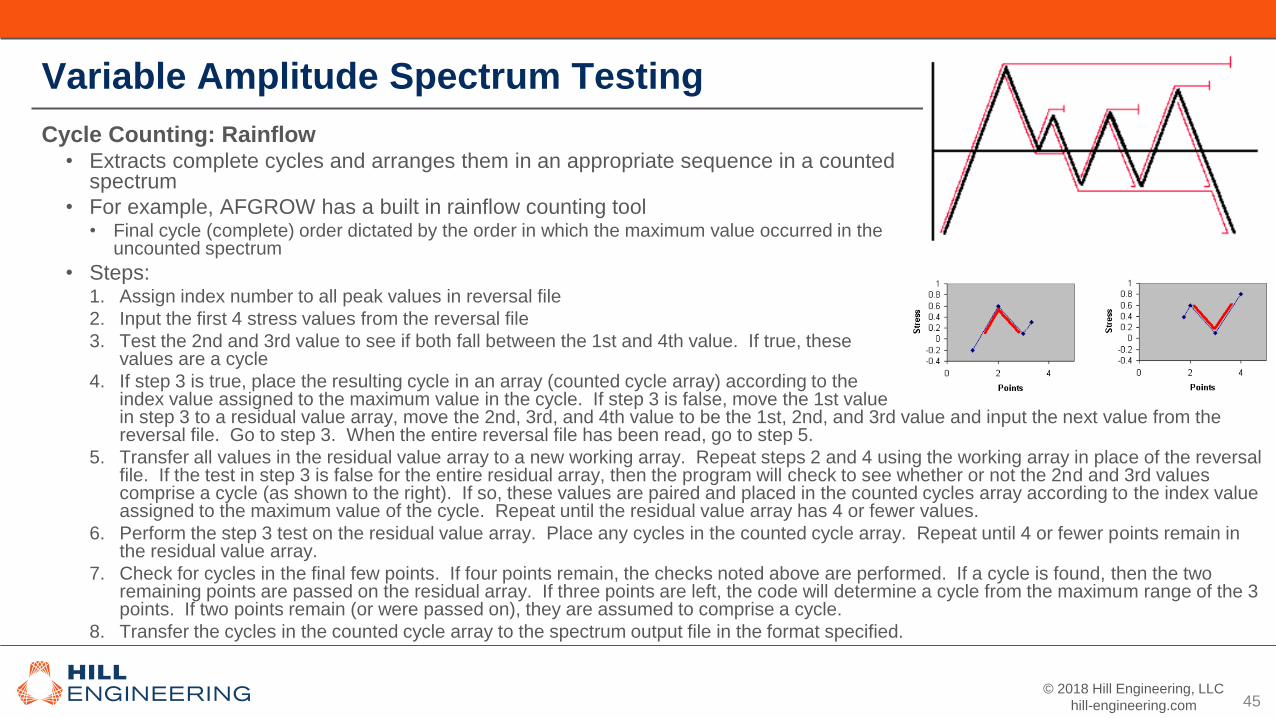
Variable Amplitude Spectrum Testing
Cycle Counting: Rainflow• Extracts complete cycles and arranges them in an appropriate sequence in a counted
spectrum
• For example, AFGROW has a built in rainflow counting tool• Final cycle (complete) order dictated by the order in which the maximum value occurred in the
uncounted spectrum
• Steps:1. Assign index number to all peak values in reversal file
2. Input the first 4 stress values from the reversal file
3. Test the 2nd and 3rd value to see if both fall between the 1st and 4th value. If true, these values are a cycle
4. If step 3 is true, place the resulting cycle in an array (counted cycle array) according to the index value assigned to the maximum value in the cycle. If step 3 is false, move the 1st value in step 3 to a residual value array, move the 2nd, 3rd, and 4th value to be the 1st, 2nd, and 3rd value and input the next value from the reversal file. Go to step 3. When the entire reversal file has been read, go to step 5.
5. Transfer all values in the residual value array to a new working array. Repeat steps 2 and 4 using the working array in place of the reversal file. If the test in step 3 is false for the entire residual array, then the program will check to see whether or not the 2nd and 3rd values comprise a cycle (as shown to the right). If so, these values are paired and placed in the counted cycles array according to the index value assigned to the maximum value of the cycle. Repeat until the residual value array has 4 or fewer values.
6. Perform the step 3 test on the residual value array. Place any cycles in the counted cycle array. Repeat until 4 or fewer points remain in the residual value array.
7. Check for cycles in the final few points. If four points remain, the checks noted above are performed. If a cycle is found, then the two remaining points are passed on the residual array. If three points are left, the code will determine a cycle from the maximum range of the 3 points. If two points remain (or were passed on), they are assumed to comprise a cycle.
8. Transfer the cycles in the counted cycle array to the spectrum output file in the format specified.
© 2018 Hill Engineering, LLC
hill-engineering.com 46
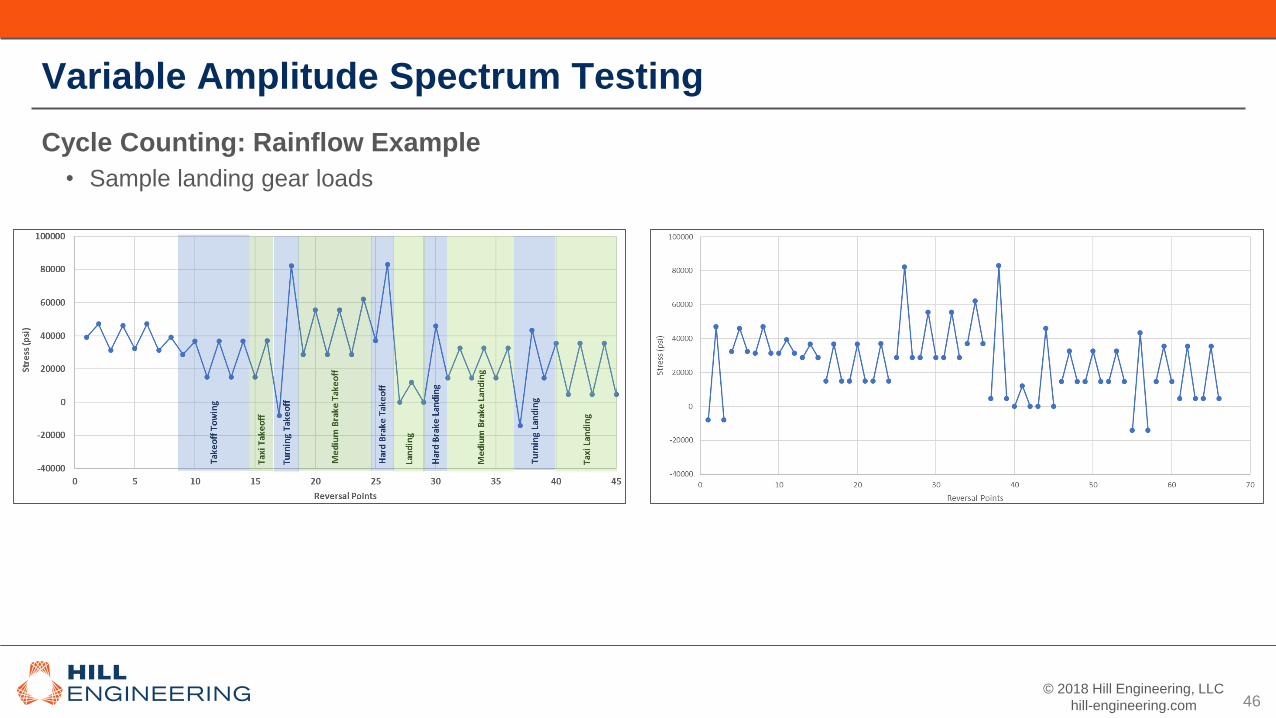
Variable Amplitude Spectrum Testing
Cycle Counting: Rainflow Example
• Sample landing gear loads

© 2018 Hill Engineering, LLC
hill-engineering.com 47
Variable Amplitude Spectrum Testing
Cycle Counting: Validation
• Whatever cycle counting methodology is used, validation testing should be performed to ensure that the
method generates a representative spectrum
How well does this
really represent this?

© 2018 Hill Engineering, LLC
hill-engineering.com 48
Conclusions
What questions should be asked when receiving/using/giving a spectrum?
• Is this spectrum to be used in a fatigue crack growth analysis, or for spectrum testing, or both?
• Is this a turning point spectrum or a counted spectrum?
Key considerations:
• All spectrum are not created equal
• Make sure you understand what step in the process your data represents
• Uncounted spectrum cannot be used for fatigue crack growth analyses
• Counted spectrum should not be used for fatigue testing

Spectrum Manager

Spectrum Manager
• Visual spectrum design
• Create Spectra from Exceedance Data
• Spectrum level reordering
• Sub-spectra organized in any user-
defined sequence
• Sub-spectra may be placed in the
sequence more than once
• Sub-spectra may be re-ordered in the
sequence
• Spectrum statistics at a glance
• Exceedance curve plotting
• R-plots
• Sub-spectra tagging
• Synchronized data views
• Spectrum level damage tagging
• Spectra normalization/de-normalization
• Clipping/Truncation capability
• Import data from “old” text sub files
• Context-Sensitive Help
Spectrum Manager
Demonstration