
Comparison of the estimation capabilities of response surface
12
ORIGINAL PAPER Comparison of the estimation capabilities of response surface methodology and artificial neural network for the optimization of recombinant lipase production by E. coli BL21 Rubina Nelofer • Ramakrishnan Nagasundara Ramanan • Raja Noor Zaliha Raja Abd Rahman • Mahiran Basri • Arbakariya B. Ariff Received: 14 February 2011 / Accepted: 9 July 2011 / Published online: 11 August 2011 Ó Society for Industrial Microbiology 2011 Abstract Response surface methodology (RSM) and artificial neural network (ANN) were used to optimize the effect of four independent variables, viz. glucose, sodium chloride (NaCl), temperature and induction time, on lipase production by a recombinant Escherichia coli BL21. The optimization and prediction capabilities of RSM and ANN were then compared. RSM predicted the dependent vari- able with a good coefficient of correlation determination (R 2 ) and adjusted R 2 values for the model. Although the R 2 value showed a good fit, absolute average deviation (AAD) and root mean square error (RMSE) values did not support the accuracy of the model and this was due to the inferi- ority in predicting the values towards the edges of the design points. On the other hand, ANN-predicted values were closer to the observed values with better R 2 , adjusted R 2 , AAD and RMSE values and this was due to the capability of predicting the values throughout the selected range of the design points. Similar to RSM, ANN could also be used to rank the effect of variables. However, ANN could not predict the interactive effect between the vari- ables as performed by RSM. The optimum levels for glu- cose, NaCl, temperature and induction time predicted by RSM are 32 g/L, 5 g/L, 32°C and 2.12 h, and those by ANN are 25 g/L, 3 g/L, 30°C and 2 h, respectively. The ANN-predicted optimal levels gave higher lipase activity (55.8 IU/mL) as compared to RSM-predicted levels (50.2 IU/mL) and the predicted lipase activity was also closer to the observed data at these levels, suggesting that ANN is a better optimization method than RSM for lipase production by the recombinant strain. Keywords Process optimization Response surface methodology Artificial neural network Lipase production Recombinant Escherichia coli Introduction Optimization of medium components and environmental factors is an important step in a high-performance fermen- tation process [11]. Various techniques have been proposed and used for the optimization of industrial processes. The classical technique of one parameter at a time is time con- suming and not effective for the identification of interac- tions and also for the predictions of parameters involved in the process. Nowadays, mathematical methods such as response surface methodology (RSM) [1, 11, 20, 23] and artificial neural network (ANN) [9, 13, 27] are commonly used for modelling and optimization of processes. RSM is based on a collection of statistical and mathe- matical techniques. This technique is useful in developing, improving and optimizing processes in which a response of interest is influenced by several independent variables and R. Nelofer A. B. Ariff (&) Department of Bioprocess Technology, Faculty of Biotechnology and Biomolecular Sciences, University Putra Malaysia, 43400 Serdang, Selangor, Malaysia e-mail: [email protected] R. N. Ramanan Chemical and Sustainable Process Engineering Research Group, School of Engineering, Monash University, 46150 Bandar Sunway, Selangor, Malaysia R. N. Z. R. A. Rahman Department of Microbiology, Faculty of Biotechnology and Biomolecular Sciences, University Putra Malaysia, 43400 Serdang, Selangor, Malaysia M. Basri Department of Chemistry, Faculty of Science, University Putra Malaysia, 43400 Serdang, Selangor, Malaysia 123 J Ind Microbiol Biotechnol (2012) 39:243–254 DOI 10.1007/s10295-011-1019-3
-
Upload
independent -
Category
Documents
-
view
3 -
download
0
Transcript of Comparison of the estimation capabilities of response surface

ORIGINAL PAPER
Comparison of the estimation capabilities of response surfacemethodology and artificial neural network for the optimizationof recombinant lipase production by E. coli BL21
Rubina Nelofer • Ramakrishnan Nagasundara Ramanan •
Raja Noor Zaliha Raja Abd Rahman •
Mahiran Basri • Arbakariya B. Ariff
Received: 14 February 2011 / Accepted: 9 July 2011 / Published online: 11 August 2011
� Society for Industrial Microbiology 2011
Abstract Response surface methodology (RSM) and
artificial neural network (ANN) were used to optimize the
effect of four independent variables, viz. glucose, sodium
chloride (NaCl), temperature and induction time, on lipase
production by a recombinant Escherichia coli BL21. The
optimization and prediction capabilities of RSM and ANN
were then compared. RSM predicted the dependent vari-
able with a good coefficient of correlation determination
(R2) and adjusted R2 values for the model. Although the R2
value showed a good fit, absolute average deviation (AAD)
and root mean square error (RMSE) values did not support
the accuracy of the model and this was due to the inferi-
ority in predicting the values towards the edges of the
design points. On the other hand, ANN-predicted values
were closer to the observed values with better R2, adjusted
R2, AAD and RMSE values and this was due to the
capability of predicting the values throughout the selected
range of the design points. Similar to RSM, ANN could
also be used to rank the effect of variables. However, ANN
could not predict the interactive effect between the vari-
ables as performed by RSM. The optimum levels for glu-
cose, NaCl, temperature and induction time predicted by
RSM are 32 g/L, 5 g/L, 32�C and 2.12 h, and those by
ANN are 25 g/L, 3 g/L, 30�C and 2 h, respectively. The
ANN-predicted optimal levels gave higher lipase activity
(55.8 IU/mL) as compared to RSM-predicted levels
(50.2 IU/mL) and the predicted lipase activity was also
closer to the observed data at these levels, suggesting that
ANN is a better optimization method than RSM for lipase
production by the recombinant strain.
Keywords Process optimization � Response surface
methodology � Artificial neural network �Lipase production � Recombinant Escherichia coli
Introduction
Optimization of medium components and environmental
factors is an important step in a high-performance fermen-
tation process [11]. Various techniques have been proposed
and used for the optimization of industrial processes. The
classical technique of one parameter at a time is time con-
suming and not effective for the identification of interac-
tions and also for the predictions of parameters involved in
the process. Nowadays, mathematical methods such as
response surface methodology (RSM) [1, 11, 20, 23] and
artificial neural network (ANN) [9, 13, 27] are commonly
used for modelling and optimization of processes.
RSM is based on a collection of statistical and mathe-
matical techniques. This technique is useful in developing,
improving and optimizing processes in which a response of
interest is influenced by several independent variables and
R. Nelofer � A. B. Ariff (&)
Department of Bioprocess Technology,
Faculty of Biotechnology and Biomolecular Sciences,
University Putra Malaysia, 43400 Serdang, Selangor, Malaysia
e-mail: [email protected]
R. N. Ramanan
Chemical and Sustainable Process Engineering Research Group,
School of Engineering, Monash University,
46150 Bandar Sunway, Selangor, Malaysia
R. N. Z. R. A. Rahman
Department of Microbiology, Faculty of Biotechnology
and Biomolecular Sciences, University Putra Malaysia,
43400 Serdang, Selangor, Malaysia
M. Basri
Department of Chemistry, Faculty of Science,
University Putra Malaysia, 43400 Serdang, Selangor, Malaysia
123
J Ind Microbiol Biotechnol (2012) 39:243–254
DOI 10.1007/s10295-011-1019-3

the objective is to optimize this response. Besides analys-
ing the effects of the independent variables, this experi-
mental methodology generates a mathematical model,
which can be used to describe the process for better
understanding. Before applying the RSM, some pre-
liminary studies are needed such as selection of the
experimental design [5]. If the number of variables is too
large, screening of the significant variables shall be carried
out first, prior to selection of appropriate optimization
design. Various experimental designs may be used for
RSM optimization [7, 8, 25]. RSM has many advantages
over the conventional one parameter at a time technique,
but it is not applicable to all optimization and modelling
studies. The major drawback of RSM is the need for a
second-order polynomial to fit the data [3]. All systems
containing curvature such as symmetrical or non-symmet-
rical bell-shaped curves may not be well explained by the
second-order polynomial [3, 6].
ANNs are computational models formed from hundreds
of single units, artificial neurons, inspired by biological
neurons and connected with coefficients (weights) which
constitute the neural structure [7]. These neurons are
sometimes called processing elements (PE) as they process
information. These weights are just like the synaptic
activity in a biological neuron. The weights of the inputs
are summed, and the threshold subtracted, to determine the
activation of the neuron [22]. The other important capa-
bility of neural networks is that they can learn the input/
output relationship through training. ANN analysis is quite
flexible as regards to the amount and form of the training
(experimental) data, which makes it possible to use more
informal experimental designs than with statistical
approaches [22].
A neural network does not need any model or screening
before the development of a network. Neural networks may
be applied on designed data or on the data that is not sta-
tistically designed. Sufficient data with all possible oper-
ating conditions of input variables are needed to develop a
neural network. A network model is then constructed
according to the systems behaviour. The constructed model
may be used for predictions and other applications within
the assessed operating conditions. Since the regression
analysis is dependent on predetermined statistically sig-
nificant levels, the less significant factors are not included
in the model. ANN uses all the data making the model
more accurate [7]. A neural network can perform tasks that
cannot be performed by linear programming. If an element
of the neural network fails, the network can still continue to
perform the task owing to its parallel nature. Neural net-
works learn and there is no need for reprogramming [15].
The main disadvantage of ANN is the requirement of
training in order to operate. A neural network needs to be
emulated because the architecture is different from that of
microprocessors [15], where high processing time is
required for a large network. Different architectures may
also be involved in ANN which requires different types of
algorithms.
The development of accurate models for a biological
reaction on chemical and physical bases is still a critical
challenge, mainly due to the non-linear nature of the bio-
chemical network interactions. The use of advanced non-
linear data analysis techniques such as ANN has been
applied in various areas such as food science [26], bio-
technology [12], chemical processes [4], equipment
development [22] and biochemical engineering [13].
Comparative studies of ANN and RSM for fermentation
processes employing wild strains have been reported [7–9].
To our knowledge, comparison of ANN and RSM for
optimization of cultural conditions for enzyme production
by a recombinant strain has not been reported in the
literature.
The objective of the present study was to compare the
efficiency of ANN in modelling and optimization of
lipase production by a recombinant E. coli BL21 with
optimization using RSM from data of the previous study
[21]. The optimization and prediction capabilities of RSM
and ANN were compared by the coefficient of correlation
determination (R2), adjusted R2, absolute average devia-
tion (AAD) and root mean square error (RMSE) values
for the models.
Materials and methods
Microorganism and inoculum preparation
The microorganism used in this study was E. coli BL21
(DE3) pLysS [9, 14] harbouring the organic solvent toler-
ant and thermostable lipase gene of Bacillus sp. 42 [10].
Inoculum was prepared by adding a single colony grown
from an LB agar plate in 50 mL LB broth in 250-mL
screw-cap Schott Duran bottles and incubating in a rotary
shaker with a shaking speed of 200 rpm at 37�C for
16–18 h.
Lipase production
All fermentations were conducted under aerobic conditions
in 250-mL screw cap Schott Duran bottles with 50 mL
production medium (5 g/L yeast extract, 10 g/L tryptone,
1–9 g/L NaCl and 10–90 g/L glucose). The pH of all
media was adjusted to 7 using either 0.1 M HCl or NaOH
prior to sterilization. Ampicillin (50 lg/mL) and chlor-
amphenicol (35 lg/mL) were added to all media to inhibit
growth of bacteria without lipase gene. Fermentation was
carried out in a rotary shaker agitated at 200 rpm for 24 h.
244 J Ind Microbiol Biotechnol (2012) 39:243–254
123

The culture pH was not controlled throughout the culti-
vations but the pH was measured at time intervals. In all
fermentations, isopropyl b-D-1-thiogalactopyranoside
(IPTG) at a concentration of 0.5 mM was used as an
inducer. Induction time was varied from 1 to 5 h and the
fermentation was carried out for 24 h. The variations in
medium components and other fermentation variables are
given in Table 1.
Experimental design
The optimization of fermentation conditions was con-
ducted using the Plackett–Burman (PB) design as described
earlier [21]. In this experimental design, four significant
variables (glucose, NaCl, temperature and induction time)
were selected. A total of 32 experiments were conducted
according to Box-Wilson (BW) 24 full factorial central
Table 1 Box-Wilson 24 factorial central composite design for optimization of lipase production by recombinant E. coli used for RSM [21] and
ANN
Exp. no. Glucose
(X1) (g/L)
NaCl (X2)
(g/L)
Temperature
(X3) (�C)
Induction
(X4) time (h)
Lipase activity (Y) (IU/mL) Final
culture
pHObserved Predicted by
RSM (% differencea)
Predicted by
ANN (% differencea)
1 70 7 43 4 04.2 07.2 (69) 04.9 (15) 4.93
2 70 7 43 2 12.9 14.4 (10) 12.9 (0.5) 4.91
3 70 7 31 4 18.9 18.2 (4) 18.8 (0.6) 4.52
4 70 7 31 2 29.7 30.0 (1) 29.2 (1) 4.53
5 70 3 43 4 06.0 08.0 (33) 06.6 (9) 4.95
6 70 3 43 2 15.7 16.9 (8) 15.9 (2) 4.94
7 70 3 31 4 22.0 20.6 (6) 21.5 (2) 4.67
8 70 3 31 2 35.3 34.2 (3) 35.6 (0.8) 4.69
9 30 7 43 4 0.02 1.9 (9076) 0.01 (33) 5.29
10 30 7 43 2 12.9 14.7 (13) 12.4 (4) 5.29
11 30 7 31 4 22.6 21.7 (4) 22.3 (2) 5.28
12 30 7 31 2 40.3 39.0 (3) 42.3 (5) 5.29
13 30 3 43 4 0.04 -0.02 (134) 0.03 (31) 5.30
14 30 3 43 2 12.9 14.4 (11) 12.6 (3) 5.30
15 30 3 31 4 21.9 21.3 (3) 21.6(2) 5.29
16 30 3 31 2 43.1 40.4 (6) 44.0 (2) 5.30
17 90 5 37 3 23.4 21.6 (8) 23.7 (2) 4.21
18 10 5 37 3 21.8 22.5 (3) 21.9 (0.3) 7.27
19 50 9 37 3 26.9 24.7 (8) 26.6 (1) 4.28
20 50 1 37 3 25.9 26.9 (4) 25.6 (1) 4.45
21 50 5 49 3 0.05 -5.7 (11132) 0.04 (15) 5.74
22 50 5 25 3 26.6 31.3 (17) 26.9 (1) 4.78
23 50 5 37 5 02.9 01.9 (33) 02.7 (10) 4.28
24 50 5 37 1 28.4 28.3 (0.4) 28.6 (0.4) 4.29
25 50 5 37 3 34.2 35.3 (3) 34.7 (2) 4.30
26 50 5 37 3 35.8 35.3 (1) 34.7 (3) 4.31
27 50 5 37 3 34.9 35.3 (1) 34.7 (0.6) 4.31
28 50 5 37 3 35.3 35.3 (0.2) 34.7 (1) 4.30
29 50 5 37 3 34.9 35.3 (1) 34.7 (0.6) 4.31
30 50 5 37 3 35.5 35.3 (0.6) 34.7 (2) 4.29
31 50 5 37 3 36.0 35.3 (2) 34.7 (3) 4.30
32 50 5 37 3 35.9 35.3 (2) 34.7 (3) 4.29
The italic, bold and normal values represent the experiments used for selection, training and testing, respectively, by the selected ANNa % difference was calculated as the % difference between the observed value and corresponding predicted value over the observed value
J Ind Microbiol Biotechnol (2012) 39:243–254 245
123

composite design (CCD). Each variable was set at five
different levels of variations (Table 1). The first 16
experiments (24 = 16, factorial CCD) were at factorial
points, eight at axial points (a = 2) and eight replications
for the central points.
Response surface methodology
The optimization results of lipase fermentation conditions
by recombinant E. coli using RSM as reported in the pre-
vious study [21] with some extensions in experiments and
statistical analysis were used in this study. In the RSM
method, a second-order model (Eq. 1) was used to calcu-
late the predicted response and optimal levels:
Y ¼ b0 þ b1X1 þ b2X2 þ b3X3 þ b4X4 þ b11X21
þ b22X22 þ b33X2
3 þ b44X24 þ b12X1 � X2 þ b13X1
� X3 þ b14X1 � X4 þ b23X2 � X3 þ b24X2
� X4 þ b34X3 � X4 ð1Þ
where Y represents the response variable and b0 is the
interception coefficient. b1, b2, b3 and b4 are coefficients of
the linear effects, b11, b22, b33 and b44 are coefficients of
quadratic effects and b12, b13, b14, b23, b24 and b34 are
coefficients of interaction effects for the four independent
variables (X1 = glucose, X2 = NaCl, X3 = temperature
and X4 = induction time).
Artificial neural network
For comparison, the same data of lipase fermentation by
recombinant E. coli applied for optimization using RSM, as
reported in the previous study [21], were applied to ANN.
The intelligent problem solver in STATISTICA software
version 7 was used to construct the regression-based net-
works from the data. A total of 60 different trained net-
works were observed for selection on the bases of the
highest coefficient of correlation determination (R2) and
the lowest selection error. A multilayer perception network
(MPN) was selected from them. Back propagation (BP)
and conjugate gradient descent (CG) algorithms were used
in the training of the neural network on the basis of varying
input/output pair data sets. The experiments used for
selection (8), training (16) and testing (8) are indicated in
Table 1. The topology of the network consists of three
layers with one hidden layer.
Comparison of optimization capability of ANN
and RSM
Adjusted R2, AAD and RMSE were calculated in addition
to the R2 for the comparison of estimation capabilities of
RSM and ANN. The R2 was calculated using Eq. 2:
R2 ¼P
i¼1�n ðXi � YiÞ2P
i¼1�n ð �Yi � YiÞ2ð2Þ
where X is the predicted lipase activity (by either RSM or
ANN), Y is the observed lipase activity and �Y is the average
observed lipase activity.
The adjusted R2 was calculated using Eq. 3:
Adjusted R2 ¼ 1� ð1� R2Þ � N � 1
N � K � 1
� �
ð3Þ
where N is the total number of observations and K is the
number of input variables.
The AAD was calculated using Eq. 4:
AAD ¼Xp
i¼1ðjyi;exp � yi;calj=yi;exp
h i.P
n o� 100 ð4Þ
where yi,exp and yi,cal are the experimental and calculated
responses, respectively, and P is the number of
experiments.
The RMSE was calculated using Eq. 5:
RMSE ¼
ffiffiffiffiffiffiffiffiffiffiffiffiffiffiffiffiffiffiffiffiffiffiffiffiffiffiffiffiffiffiffiffiffiffiffiPðyi;exp � yi;calÞ2
n
s
ð5Þ
where yi,exp is the experimental response, yi,cal is the cal-
culated response and n is the number of experiments.
Statistical analysis
The statistical analysis of data and plots were constructed
using STATISTICA software version 7. The analysis of
variance (ANOVA) was employed to determine the sig-
nificance of model parameters in RSM. R2 and adjusted R2
values were calculated to evaluate the performance of the
regression model. The optimum levels of the selected
variables were obtained from the desirability charts (data
not shown). The intelligent problem solver in STATISTICA
neural network was used to construct various neural
networks, the best of which was selected and used for
prediction and optimization. Sensitivity analysis was con-
ducted by the selected ANN to rank the input variables.
Analytical procedures
Culture samples were centrifuged at 10,7009g (TA-14-50,
Allegra�250R, Beckman Coulter, USA) for 10 min to
obtain the cell pellets. The collected cell pellets were
washed and resuspended in 20 mM phosphate buffer at pH
7 and then lysed by sonication for 2 min on ice. Superna-
tant was used for lipase determination after removal of the
cell debris by centrifugation. Lipase activity was deter-
mined according to the method proposed by Hamid et al.
[14], which is a modified form of Kwon and Rhee’s [17]
method. In this method, 1 mL of diluted sample was mixed
246 J Ind Microbiol Biotechnol (2012) 39:243–254
123

with 2.5 mL olive oil emulsion in phosphate buffer with a
ratio of 1:1. Subsequently, 20 lL of 20 mM CaCl2 was
added to the mixture. The reaction was carried out at 60�C
in a water bath, agitated at 200 rpm for 30 min. The
reaction was stopped by the addition of 6 N HCl (1 mL).
The free fatty acids liberated by the action of lipase were
extracted in 5 mL isooctane. Pyridine cupric acetate
reagent (1 mL) was then added to the extracted free fatty
acids in isooctane (4 mL) and vortexed. The absorbance of
the upper layer was read at 715 nm. A standard curve
constructed from different concentrations of oleic acid was
used to determine the concentration of free fatty acids in
each sample. One unit of lipase activity is defined as 1 lM
free fatty acids released per minute. The cell concentration
was determined as dry cell weight by drying the cell pellet
at 80�C until a constant weight was achieved, normally for
at least 24 h.
Results
Optimization using RSM
The full quadratic second-order model obtained by multi-
ple regression analysis of the experimental data by apply-
ing RSM was expressed in Eq. 6. This model was used for
the prediction of lipase activity.
Y ¼ �110:933þ 0:024X1 þ 4:657X2 þ 8:401X3
þ 11:996X4 � 0:008X21 � 0:593X2
2 � 0:157X23
� 5:046X24 � 0:017 X1 � X2 þ 0:018X1 � X3
þ 0:033X1 � X4 þ 0:069X2 � X3 þ 0:221X2 � X4
þ 0:193X3 � X4 ð6Þ
where Y is the lipase activity and X1, X2, X3 and X4
are glucose, NaCl, temperature and induction time,
respectively.
The model is a highly significant model according to the
statistical analysis (Table 2). The calculated F value was
16.4 with a very small P value (0.0008). The high R2 value
(0.97) supported the model’s accuracy. Only 3% of the
total variations were not explained by the model, as is
obvious from the R2 value. The significance of the model is
also represented by the value of the adjusted R2 (0.96).
The regression coefficient values and P values (Table 2)
indicated that the main effects of temperature and induction
time were significant. Quadratic effects of all four variables
glucose, NaCl, temperature and induction time were sig-
nificant. The maximum effect was due to the temperature
followed by induction time, NaCl and glucose sequentially.
The temperature–glucose and induction time–glucose
interaction effects were significant. The interaction effects
are represented by 3D surface plot (Figs. 1, 2).
Optimization using ANN
The selected network (MPN) has a better R2 (0.999) than
RSM. Predicted values of this model were also closer to the
observed values than the RSM-predicted values (Table 1).
The topology of the network consisted of three layers
(4:9:1), an input layer consisting of four fermentation
variables, a middle hidden layer of nine neurons and one
output layer for lipase activity. The activation level of the
neurons for ANN processing is represented by different
colours (Fig. 3). The optimum levels of glucose (25 g/L),
NaCl (3 g/L), induction time (2 h) and temperature (30�C)
predicted by ANN were different from those predicted by
RSM. The highest effect was from the temperature, fol-
lowed by induction time as calculated by the sensitivity
analysis (Table 3). These results are in agreement with
those obtained by RSM. Glucose and NaCl represented the
third and fourth in terms of significant effect, respectively.
The interaction effects are represented by surface plots
(Figs. 4, 5).
Comparison of optimization using RSM and ANN
The predicted values using the selected model of RSM and
selected network of ANN for the experimental runs with
their percentage differences from the observed lipase val-
ues are provided in Table 2. In most of the cases ANN-
predicted values were closer to the observed values. This
difference between the RSM and ANN was more promi-
nent in the experiments at the edge points such as in
experiments 1, 2, 5, 9, 10, 13, 14 and 21, whereas at the
centre points the predicted levels by RSM and ANN were
more similar.
Verification experiments including RSM- and ANN-
predicted optimum levels for the tested variables are rep-
resented in Table 4. The RSM-predicted levels were
32.4 g/L, 5 g/L, 31.7�C and 2.121 h for glucose, NaCl,
temperature and induction time, respectively. The pre-
dicted lipase activity at these optimum levels was 48.9 IU/
mL. The ANN-predicted levels were 25 g/L, 3 g/L, 30�C
and 2 h for glucose, NaCl, temperature and induction time,
respectively, with 56.3 IU/mL predicted activity. Experi-
ments were conducted in triplicate at these optimum levels
to calculate the observed response. The observed lipase
activity at the predicted optimum levels of tested variables
was 50.2 IU/mL at RSM optimum levels and 55.8 IU/mL
at ANN predicted levels (Table 4). The lipase activity
predicted by ANN was closer to the observed lipase
activity at mean levels of four variables, at the levels used
before optimization and in some other verification experi-
ments near ANN-predicted optimum levels as compared to
RSM (Table 4). In these verification experiments only
glucose concentration was varied because other parameters
J Ind Microbiol Biotechnol (2012) 39:243–254 247
123

Table 2 Analysis of variance for optimization of lipase production by recombinant E. coli using Box-Wilson design (data shown in Table 1),
calculated by RSM regression [21]
Variables Analysis of variance Parameter estimates
SS Deg. of
freedom
MS F Estimates t values P values Confidence limits
-95% ?95%
Intercept 103.5437 1 103.5437 16.4015 2110.933 24.0499 0.000832 2168.724 253.1414
Glucose (X1) 0.0560 1 0.0560 0.0089 0.024 0.0942 0.926090 -0.520 0.5686
Glucose2 (X12) 325.1179 1 325.1179 51.4991 20.008 27.1763 0.000002 20.011 20.0059
NaCl (X2) 20.5663 1 20.5663 3.2577 4.657 1.8049 0.088831 -0.787 10.1004
NaCl2 (X22) 166.1063 1 166.1063 26.3114 20.593 25.1295 0.000084 20.837 20.3490
Temperature (X3) 388.8201 1 388.8201 61.5896 8.401 7.8479 0.000000 6.143 10.6599
Temperature2 (X32) 939.7712 1 939.7712 148.8609 20.157 212.2009 0.000000 20.184 20.1296
Induction time (X4) 32.5716 1 32.5716 5.1594 11.996 2.2714 0.036401 0.854 23.1393
Induction time2 (X42) 752.0353 1 752.0353 119.1233 25.046 210.9144 0.000000 26.021 24.0704
Glucose (X1) * NaCl (X2) 7.8338 1 7.8338 1.2409 -0.017 -1.1140 0.280802 -0.051 0.0156
Glucose (X1) * temperature
(X3)
76.2758 1 76.2758 12.0822 0.018 3.4759 0.002891 0.007 0.0292
Glucose (X1) * induction time
(X4)
2.4380 1 2.4380 0.3862 0.033 0.6214 0.542560 -0.078 0.1430
NaCl (X2) * temperature (X3) 30.4991 1 30.4991 4.8311 0.069 2.1980 0.042092 0.003 0.1353
NaCl (X2) * temperature (X3) 3.1237 1 3.1237 0.4948 0.221 0.7034 0.491317 -0.442 0.8836
Temperature (X3) * induction
time (X4)
21.4360 1 21.4360 3.3955 0.193 1.8427 0.082885 -0.028 0.4138
Error 107.3224 17 6.3131
Bold letters represent the significant variables and their calculated values. SS and MS are sum of squares and mean sum of squares, respectively
The asterisk between two variables represents interaction effects of the two variables
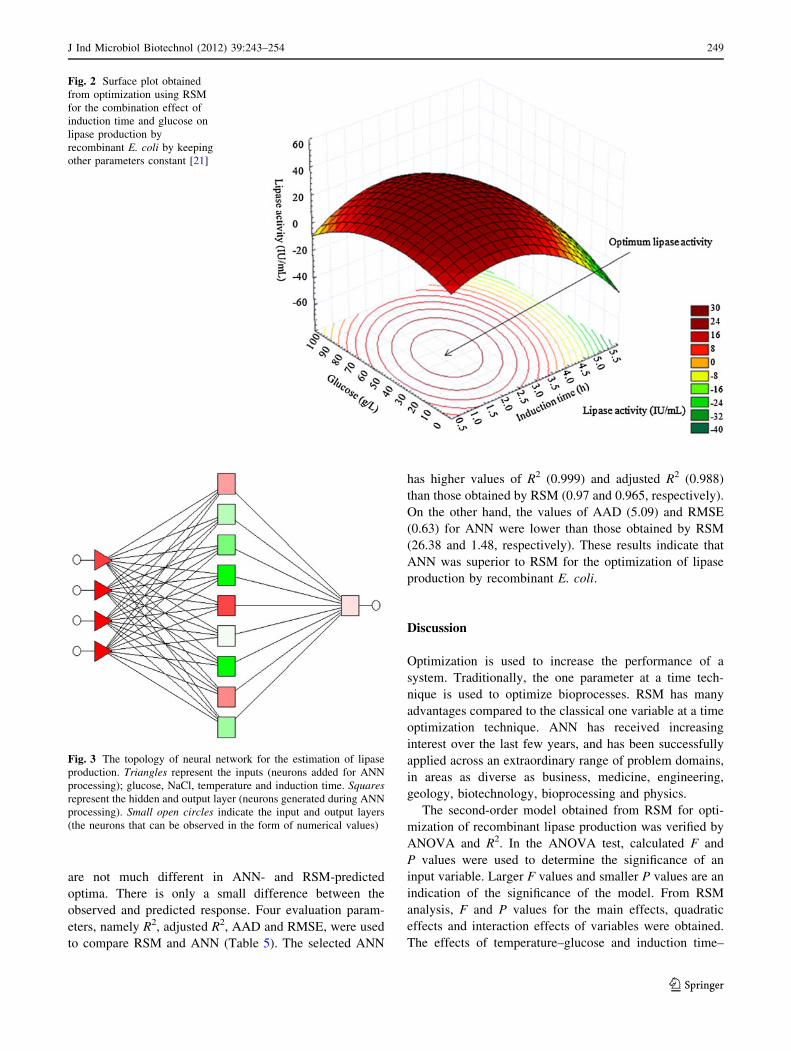
Fig. 1 Surface plot obtained
from optimization using RSM
for the combination effect of
temperature and glucose on
lipase production by
recombinant E. coli by keeping
other parameters constant [21]
248 J Ind Microbiol Biotechnol (2012) 39:243–254
123
are not much different in ANN- and RSM-predicted
optima. There is only a small difference between the
observed and predicted response. Four evaluation param-
eters, namely R2, adjusted R2, AAD and RMSE, were used
to compare RSM and ANN (Table 5). The selected ANN
has higher values of R2 (0.999) and adjusted R2 (0.988)
than those obtained by RSM (0.97 and 0.965, respectively).
On the other hand, the values of AAD (5.09) and RMSE
(0.63) for ANN were lower than those obtained by RSM
(26.38 and 1.48, respectively). These results indicate that
ANN was superior to RSM for the optimization of lipase
production by recombinant E. coli.
Discussion
Optimization is used to increase the performance of a
system. Traditionally, the one parameter at a time tech-
nique is used to optimize bioprocesses. RSM has many
advantages compared to the classical one variable at a time
optimization technique. ANN has received increasing
interest over the last few years, and has been successfully
applied across an extraordinary range of problem domains,
in areas as diverse as business, medicine, engineering,
geology, biotechnology, bioprocessing and physics.
The second-order model obtained from RSM for opti-
mization of recombinant lipase production was verified by
ANOVA and R2. In the ANOVA test, calculated F and
P values were used to determine the significance of an
input variable. Larger F values and smaller P values are an
indication of the significance of the model. From RSM
analysis, F and P values for the main effects, quadratic
effects and interaction effects of variables were obtained.
The effects of temperature–glucose and induction time–
Fig. 2 Surface plot obtained
from optimization using RSM
for the combination effect of
induction time and glucose on
lipase production by
recombinant E. coli by keeping
other parameters constant [21]
Fig. 3 The topology of neural network for the estimation of lipase
production. Triangles represent the inputs (neurons added for ANN
processing); glucose, NaCl, temperature and induction time. Squaresrepresent the hidden and output layer (neurons generated during ANN
processing). Small open circles indicate the input and output layers
(the neurons that can be observed in the form of numerical values)
J Ind Microbiol Biotechnol (2012) 39:243–254 249
123

glucose interactions were significant according to the cal-
culated F and P values. These values also gave information
about the ranking of variables. For example, a variable with
a large value has a large effect on the response and vice
versa for a variable with a small value.
According to RSM analysis, the maximum effect on
lipase yield was due to temperature. Lipase activity gradu-
ally increased with temperature ranging from 25 to 30�C and
then decreased sharply with an increase in temperature from
32 to 45�C. The probable reason for the low lipase activity
with respect to high temperature is due to the aggregation of
inclusion bodies. High temperature favours the aggregation
of inclusion bodies whereas lower temperature enhances the
secretion of recombinant protein in soluble form [24]. At
lower temperature, reduced growth of E. coli [2] might be
the reason for decreased lipase production.
The induction time was in second place according to the
significance ranking by RSM. Induction time is one of the
important parameters that affect the expression of recom-
binant proteins. The optimal time of induction (2 h) for
lipase production by recombinant E. coli obtained in this
study corresponded to the early log phase, with cell con-
centrations ranging from 0.3 to 0.5 g/L. Induction was
performed at mid log phase as a base case prior to opti-
mization. The selection of appropriate induction time for
enhancement of recombinant protein production is strain
dependent. The strains, which are sensitive to IPTG con-
centration, need to be induced at late loge phase for
enhancement of recombinant protein production. On the
other hand, strains which are not sensitive to IPTG can be
induced at early log phase [2]. The recombinant E. coli
used in this study for lipase production most probably
belongs to the strain that is not sensitive to IPTG. The
effects of sodium chloride and glucose on lipase production
were not significant and were ranked in third and fourth
place, respectively. RSM analysis also generates informa-
tion on the positive and negative effect that could be
determined by the respective coefficient of the parameters
or variables investigated. The effect of the individual var-
iable or parameter on the process performance could be
evaluated in a more obvious way using RSM as compared
to ANN [8].
Table 3 Sensitivity analysis by ANN for optimization of lipase production by recombinant E. coli
Parameter Glucose (X1) (g/L) NaCl (X2) (g/L) Temperature (X3) (�C) Induction time (X4) (h)
Ratio 1.517316 0.960510 3.990739 2.839100
Rank 3.000000 4.000000 1.000000 2.000000
Ratios are values given by ANN as a result of sensitivity analysis to input variables
Rank is the order according to the ratios
Fig. 4 Surface plot obtained
from optimization using ANN
for the combination effect of
temperature and glucose on
lipase production by
recombinant E. coli by keeping
other parameters constant
250 J Ind Microbiol Biotechnol (2012) 39:243–254
123
RSM gives quantitative interaction effects of paired
variables, which cannot be estimated by ANN. From RSM,
it was observed that the glucose–temperature and glucose–
induction time interaction effects have P values smaller
than 0.05, indicating that these interaction effects were
significant. The glucose–temperature interaction effect
(F value is 12.08) was stronger than the temperature–
induction time interaction effect (F value is 4.83). Other
interaction effects were not significant as they have P val-
ues greater than 0.5.
ANN is widely used in various processes to solve
problems related to prediction, classification and control
[7, 9, 12, 19, 26]. ANN is a modern modelling technique
capable of modelling extremely complex systems, in which
any non-linear systems with large numbers of variables can
be handled. The ANN architecture is represented by its
topology rather than by a model as used in RSM. Topology
in ANN mostly consists of three layers: one input layer,
one hidden layer and one output layer. In most of the
estimation cases one hidden layer is sufficient. Two or
more layers are used for the systems with discontinuities
[4]. The number of hidden neurons is determined according
to the size of the input vector and the number of input–
output space classifications. Under-fitting may occur when
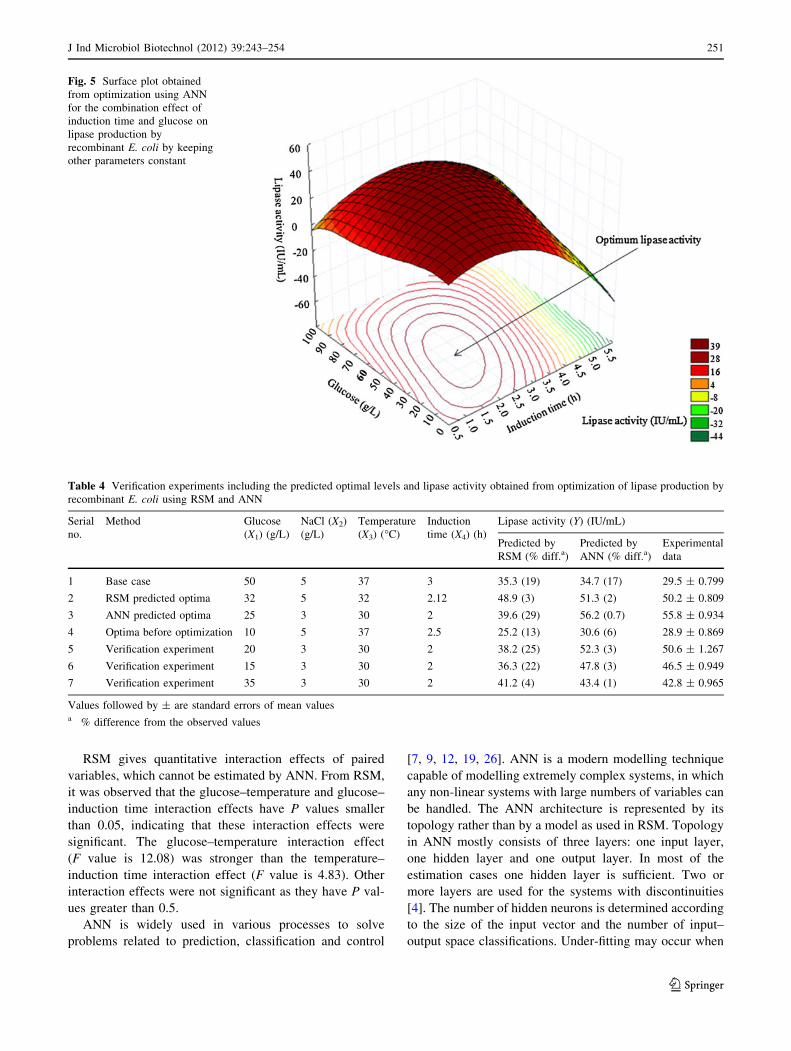
Fig. 5 Surface plot obtained
from optimization using ANN
for the combination effect of
induction time and glucose on
lipase production by
recombinant E. coli by keeping
other parameters constant
Table 4 Verification experiments including the predicted optimal levels and lipase activity obtained from optimization of lipase production by
recombinant E. coli using RSM and ANN
Serial
no.
Method Glucose
(X1) (g/L)
NaCl (X2)
(g/L)
Temperature
(X3) (�C)
Induction
time (X4) (h)
Lipase activity (Y) (IU/mL)
Predicted by
RSM (% diff.a)
Predicted by
ANN (% diff.a)
Experimental
data
1 Base case 50 5 37 3 35.3 (19) 34.7 (17) 29.5 ± 0.799
2 RSM predicted optima 32 5 32 2.12 48.9 (3) 51.3 (2) 50.2 ± 0.809
3 ANN predicted optima 25 3 30 2 39.6 (29) 56.2 (0.7) 55.8 ± 0.934
4 Optima before optimization 10 5 37 2.5 25.2 (13) 30.6 (6) 28.9 ± 0.869
5 Verification experiment 20 3 30 2 38.2 (25) 52.3 (3) 50.6 ± 1.267
6 Verification experiment 15 3 30 2 36.3 (22) 47.8 (3) 46.5 ± 0.949
7 Verification experiment 35 3 30 2 41.2 (4) 43.4 (1) 42.8 ± 0.965
Values followed by ± are standard errors of mean valuesa % difference from the observed values
J Ind Microbiol Biotechnol (2012) 39:243–254 251
123

the number of neurons used in the hidden layer is too small
and vice versa [16]. The developed network in this study
contains three layers: (1) an input layer with four neurons,
(2) one hidden layer with nine neurons and (3) an output
layer with one neuron. The number of hidden neurons is
not too large or too small and represents the best network
system from the observed 60 networks. An increase in the
number of hidden layers and number of neurons therein did
not increase the prediction accuracy.
ANN sensitivity analysis could be carried out to calcu-
late the ratio and thereby the ranking of the variables. Ratio
is the basic measure of sensitivity, which is calculated as
the ratio of the error with missing value substitution to the
original error. Ratio shows how much the network is sen-
sitive for a particular input value. The variable which has a
ratio equal to or less than 1 is not significant, whereas the
variable with a ratio larger than 1 has a significant effect on
output [18]. From the sensitivity analysis conducted in this
study, temperature (ratio = 3.99) gave the highest effect
on lipase production by recombinant E. coli and the lowest
effect was from sodium chloride (ratio = 0.96) (Table 3).
According to significance criteria, the effect of tempera-
ture, induction time and glucose were significant whereas
the effect of NaCl was insignificant. Results from RSM and
ANN indicate that the ranking for temperature and induc-
tion time was similar, whereas the ranking for glucose and
NaCl was different. It is important to note that the qua-
dratic and interaction effects could not be evaluated using
ANN.
The optimum level for glucose (25 g/L) as predicted by
ANN was smaller than that predicted by RSM (32 g/L).
The levels of NaCl (3 g/L), temperature (30�C) and
induction time (2 h) predicted by ANN were also lower
than that those predicted by RSM. The optimum induction
time predicted by ANN was similar to that predicted by
RSM. Higher lipase activity was observed at optimum
levels predicted by ANN as compared to RSM. The lipase
activity predicted by ANN also fitted the observed data at
the optimum levels better than the case for RSM (Table 4).
Results from this study showed that the estimation capa-
bility of ANN for optimum levels of variables for lipase
production by recombinant E. coli was more accurate than
RSM. Similar observations have also been reported [8, 28,
29]. Both methods (RSM and ANN) estimated low glucose
concentration as optimal levels. The production of acetate
and other organic acids, as indicated by a drastic drop in
the final culture pH at higher glucose levels, may reduce
the growth and lipase production (Table 1).
Several methods could be used to evaluate the goodness
and accuracy of a given model and to compare two or more
models. The overall predictive capability of the model is
normally determined by R2, but the efficiency of a model
may not be explained by R2 alone [9]. Besides R2, adjusted
R2 may be used to support the model’s accuracy. In a
multiple linear regression model, adjusted R2 measures the
proportion of the variation in the dependent variable
accounted for by the explanatory variables. Adjusted R2 is
generally considered to be a more accurate goodness-of-fit
measure than R2. Results from this study show that the
adjusted R2 values for both RSM and ANN support the
models’ accuracy as their values are not much different
from R2 values. For a good model, R2 must be closed to 1
whereas the difference between the values of adjusted R2
and R2 must be very small.
Large values of R2 and adjusted R2 do not always mean
that the regression model is an efficient model. Other
values such as AAD and RMSE are also used to validate
and compare more than one model. For a good model, the
AAD value must be as small as possible whereas the
RMSE value must be close to zero. The AAD value (26.38)
for RSM was almost five times higher than the AAD value
(5.09) for ANN (Table 5). In addition, the RMSE value
(1.48) for RSM was two times higher than the RMSE
value (0.63) for ANN. Larger values of RMSE and AAD
mean higher chances of errors in prediction. Therefore,
ANN predictions with lower RMSE and ADD values are
more reliable and accurate than RSM predictions.
The ANN optima were closer to the true optima as
observed from the verification experiments (Table 4). It
was noted that the optimum levels of most of the variables
predicted by RSM and ANN were closer to the edges of
topology. In some other cases as reported in the literature,
the optima predicted by ANN and RSM were located at the
edges [7–9] and in one case the optima were even located
outside of the topology [8]. It was also observed from the
present studies that the RSM-predicted optima was closer
to the centre points as compared to the ANN-predicted
optima.
The present study indicated that the values predicted by
RSM and ANN were similar to the observed values
towards the centre points. However, the values predicted
by RSM were different from the observed values towards
the edges. At the edges, the effect was observed mainly
from glucose concentration. When glucose concentration
Table 5 Comparison of optimization and prediction capability by
ANN and RSM for lipase production by recombinant E. coli
Serial no. Statistic RSM ANN
1 R2 0.97 0.99
2 Adjusted R2 0.965 0.988
3 AAD 26.38 5.09
4 RMSE 1.48 0.63
AAD absolute average deviation, RMSE root mean square error,
R2 coefficient of correlation determination, adjusted R2 adjusted
coefficient of correlation determination
252 J Ind Microbiol Biotechnol (2012) 39:243–254
123

was decreased from the RSM-predicted optimum glucose
level, the lipase activity predicted by RSM decreased
sharply. Therefore, it can be concluded that RSM-predicted
optima were not as close to the real optima as the ANN-
predicted optima of the lipase production by recombinant
E. coli. For many other bioprocesses, ANN was a better
optima predictor than RSM [7–9].
Conclusion
Results from this study have demonstrated that ANN gave
better estimation capabilities throughout the range of
variables as compared to RSM in the optimization of lipase
production by a recombinant E. coli. Lipase production
predicted by ANN at optimal variables fitted well to the
experimental data. The constructed ANN has larger R2 and
adjusted R2 values, whereas AAD and RMSE values are
smaller as compared to those observed from the application
of RSM. Similar to the application of RSM, ANN could
also rank the independent variables. In addition, ANN does
not need a model for prediction, a specified design or
preliminary knowledge about the system. However, the
application of RSM enables the estimation of the quantity
of effect of independent variables as well as the interaction
effects.
Acknowledgments The work presented here is part of Ms Rubina
Nelofer’s Ph.D. studies, funded by the Pakistan Council of Scientific
and Industrial Research. The research work is funded by Universiti
Putra Malaysia.
References
1. Azaman SN, Ramanan RN, Tan JS, Rahim RA, Abdulla MP,
Ariff AB (2010) Optimization of an induction strategy for
improving interferon-alpha2b production in the periplasm of
Escherichia coli using response surface methodology. Biotechnol
Appl Biochem 56:141–150
2. Azaman SN, Ramanan RN, Tan JS, Rahim RA, Abdullah MP,
Ariff AB (2010) Screening for the optimal induction parameters
for periplasmic producing interferon-2b in Escherichia coli. Afr J
Biotechnol 9:6345–6354
3. Bas D, Boyaci IH (2007) Modeling and optimization I: usability
of response surface methodology. J Food Eng 78:836–845
4. Basheer IA, Hajmeer M (2000) Artificial neural networks: fun-
damentals, computing, design, and application. J Microbiol
Method 43:3–31
5. Bezerra MA, Santelli RE, Oliveira EP, Villar SL, Escaleira LA
(2008) Response surface methodology (RSM) as a tool for opti-
mization in analytical chemistry. Talanta 76:965–977
6. Cornish-Bowden A (2001) Detection of errors of interpretation in
experiments in enzyme kinetics. Methods 24:181–190
7. Dasari VRRK, Donthireddy SRR, Nikku MY, Garapati HR
(2009) Optimization of medium constituents for cephalosporin C
production using response surface methodology and artificial
neural networks. J Biochem Technol 1:69–74
8. Desai KM, Survase SA, Saudagar PS, Lele SS, Singhal RS (2008)
Comparison of artificial neural network (ANN) and response
surface methodology (RSM) in fermentation media optimization:
case study of fermentative production of scleroglucan. Biochem
Eng J 41:266–273
9. Ebrahimpour A, Rahman RNZRA, Ch’ng DH, Basri M, Salleh
AB (2008) A modelling study by response surface methodology
and artificial neural network on culture parameters optimization
for thermostable lipase production from a newly isolated ther-
mophilic Geobacillus sp. strain ARM. BMC Biotechnol 8:96
10. Eltaweel MA, Rahman RNZRA, Salleh AB, Basri M (2005) An
organic solvent-stable lipase from Bacillus sp. strain 42. Ann
Microbiol 55:187–192
11. Farliahati MR, Ramanan NR, Mohamad R, Puspaningsih NNT,
Ariff AB (2010) Enhanced production of xylanase by recombi-
nant Escherichia coli DH5 through optimization of medium
composition using response surface methodology. Ann Microbiol
60:279–285
12. Ghaffari A, Abdollahi H, Khoshayand MR, Bozchalooi IS,
Dadgar A, Rafiee-Tehrani M (2006) Performance comparison of
neural network training algorithms in modeling of bimodal drug
delivery. Int J Pharm 327:126–138
13. Haider MA, Pakshirajan K, Singh A, Chaudhry S (2008) Artifi-
cial neural network-genetic algorithm approach to optimize
media constituents for enhancing lipase production by a soil
microorganism. Appl Biochem Biotechnol 144:225–235
14. Hamid THTA, Eltaweel MA, Rahman RNZRA, Basri M, Salleh
AB (2009) Characterization and solvent stable features of strep-
tagged purified recombinant lipase from thermostable and solvent
tolerant Bacillus sp. strain 42. Ann Microbiol 59:111–118
15. Hill T, Lewicki P (2007) Statistics: methods and applications.
StatSoft, Tulsa
16. Karnik SR, Gaitonde VN, Davim JP (2008) A comparative study
of the ANN and RSM modeling approaches for predicting burr
size in drilling. Int J Adv Manuf Technol 38:868–883
17. Kwon DY, Rhee JS (1986) A simple and rapid colorimetric
method for determination of free fatty acids for lipase assay.
J Am Oil Chem Soc 63:89–92
18. Lou W, Nakai S (2001) Application of artificial neural networks
for predicting the thermal inactivation of bacteria: a combined
effect of temperature, pH and water activity. Food Res Int
34:573–579
19. Low CT, Mohamed R, Tan CP, Long K, Ismail R, Lo SK, Lai OM
(2007) Lipase-catalyzed production of medium-chain triacylgly-
cerols from palm kernel oil distillate: optimization using response
surface methodology. Eur J Lipid Sci Technol 109:107–119
20. Maldonado LMTP, Hernandez VEB, Rivero EM, Rosa AB,
Flores JLF, Acevedo LGO, Rodrıguez ADL (2007) Optimization
of culture conditions for a synthetic gene expression in Esche-richia coli using response surface methodology: the case of
human interferon beta. Biomolecul Eng 24:217–222
21. Nelofer R, Ramanan NR, Rahman RNZRA, Basri M, Ariff AB
(2010) Sequential optimization of production of a thermostable
and organic solvent tolerant lipase by recombinant Escherichiacoli. Ann Microbiol. doi:10.1007/s13213-010-0170-9
22. Noorossana R, Davanloo TS, Saghaei A (2009) An artificial
neural network approach to multiple-response optimization. Int J
Adv Manuf Technol 40:1227–1238
23. Pan H, Xie Z, Bao W, Zhang J (2008) Optimization of culture
conditions to enhance cis-epoxysuccinate hydrolase production in
Escherichia coli by response surface methodology. Biochem Eng
J 42:133–138
24. Qiao CL, Shen BC, Xing JM, Huang J, Zhang JL, Zhao DH,
Yang B (2006) Culture and characteristics of recombinant protein
production of an Escherichia coli strain expressing carboxylest-
erase B1. Int Biodeterior Biodegrad 58:77–81
J Ind Microbiol Biotechnol (2012) 39:243–254 253
123

25. Rajendran A, Palanisamy A, Thangavelu V (2008) Evaluation of
medium components by Plackett-Burman statistical design for
lipase production by Candida rugosa and kinetic modelling. Chin
J Biotechnol 24:436–444
26. Razmi-Rad E, Ghanbarzadeh B, Rashmekarim J (2008) An arti-
ficial neural network for prediction of Zeleny sedimentation
volume of wheat flour. Int J Agric Biol 10:422–426
27. Singh V, Khan M, Khan S, Tripathi CKM (2009) Optimization of
actinomycin V production by Streptomyces triostinicus using
artificial neural network and genetic algorithm. Appl Microbiol
Biotechnol 82:379–385
28. Tsao CC (2008) Comparison between response surface method-
ology and radial basis function network for core-center drill in
drilling composite materials. Int J Adv Manuf Technol 37:1061–
1068
29. Youssefi SH, Emam-Djomeh Z, Mousavi SM (2009) Comparison
of artificial neural network (ANN) and response surface meth-
odology (RSM) in the prediction of quality parameters of spray-
dried pomegranate juice. Dry Technol 27:910–917
254 J Ind Microbiol Biotechnol (2012) 39:243–254
123