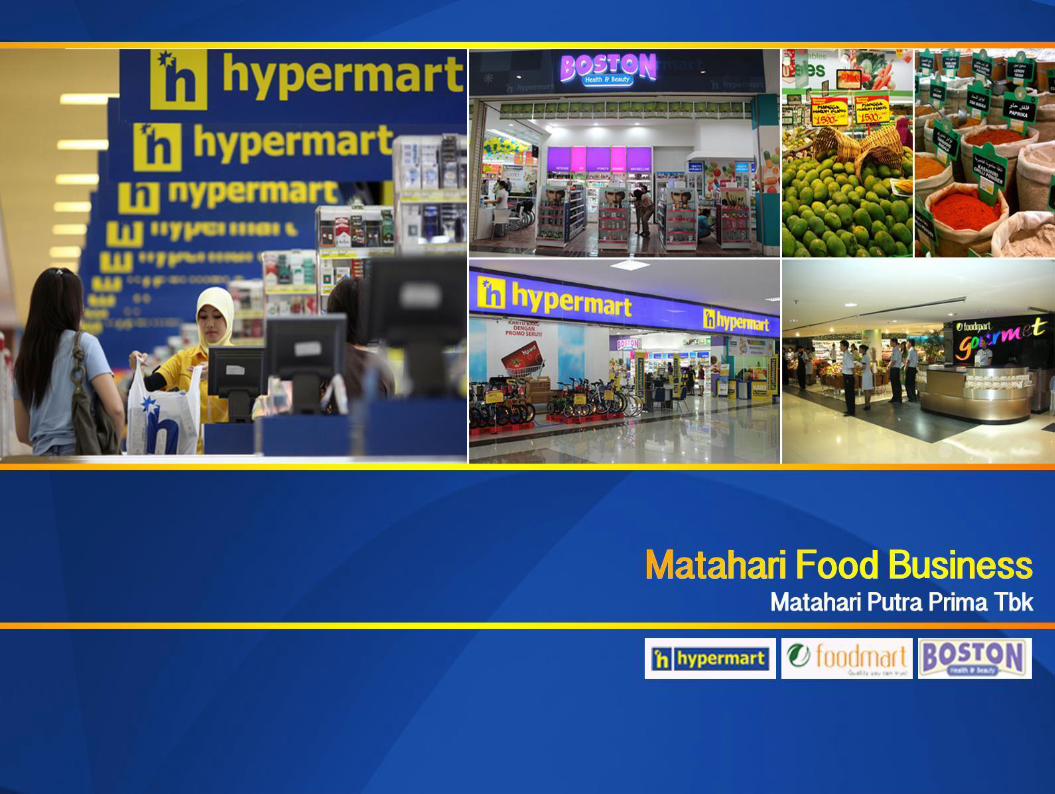
Overview of Matahari Food Business Key investment ...
35
CONFIDENTIAL
-
Upload
khangminh22 -
Category
Documents
-
view
2 -
download
0
Transcript of Overview of Matahari Food Business Key investment ...

CONFIDENTIAL

1
Agenda
Overview of Matahari Food Business
Key investment highlights
Vision and strategy
Financial overview

Overview of Matahari Food Business
Section 1

Matahari Putra Prima (“MPPA”)
Fastest-growing FMCG modern multi-format food retailer in Indonesia
Key highlights
Largest hypermarket in Indonesia with market cap of IDR
12,907bn (US$1,133m)(a) as at 30 Sep 2013
Excellent sales and EBITDA growth with 2010 – 2012 CAGR
of 19.1% and 24.8% respectively
Rapidly gaining market share each year with 32.3% market
share in 2012(b) and target of 35% market share in 2013
Largest footprint of stores versus our competitors as we are
located in over 60 cities
Rapid annual expansion with 20+ store openings planned and
over 100 new stores in the pipeline
Strong infrastructure to support future growth
Award winning retailer
Company structure
2
Temasek Holdings Multipolar (“MLPL”) Public
Anderson Investments
Hypermart Foodmart Health and beauty
(a) As at 7 Nov 2013 (b) Market share as per Euromonitor (c) Currently held by a subsidiary of Multipolar until exchange rights are exercised in the future Source: Company data, FactSet
50.23% 23.67%
Exchange rights for 26.1% stake in MPPA(c)
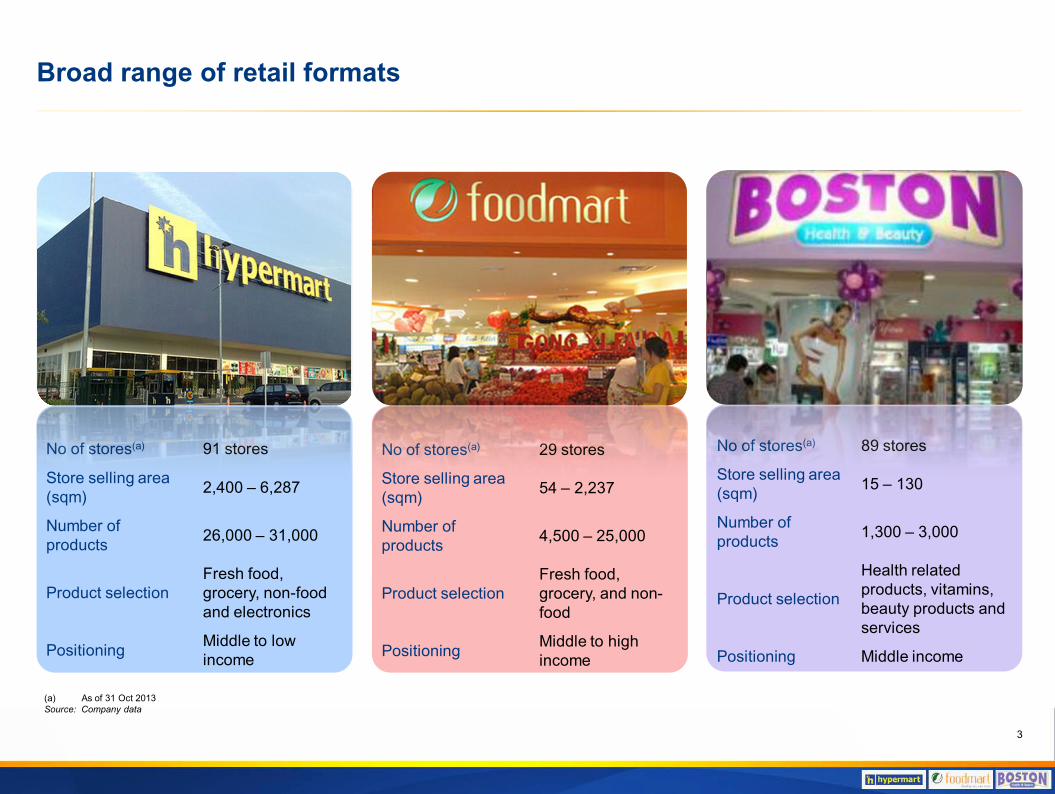
No of stores(a) 91 stores
Store selling area (sqm) 2,400 – 6,287
Number of products 26,000 – 31,000
Product selection Fresh food, grocery, non-food and electronics
Positioning Middle to low income
3
(a) As of 31 Oct 2013 Source: Company data
Broad range of retail formats
No of stores(a) 29 stores
Store selling area (sqm) 54 – 2,237
Number of products 4,500 – 25,000
Product selection Fresh food, grocery, and non-food
Positioning Middle to high income
No of stores(a) 89 stores
Store selling area (sqm) 15 – 130
Number of products 1,300 – 3,000
Product selection
Health related products, vitamins, beauty products and services
Positioning Middle income

Proven business model that reinforce market position and drive future growth
Asset-light business model 100% leased store base which is highly scalable
Self-funding working capital Cash conversion cycle is 5 days(a)
Low capital expenditure requirement Capital expenditure 4.3% of sales(b)
Fast payback and attractive returns
New stores cash flow positive in first year Average repay of capital investments within 4 years
4
(a) As at 30 Sep 2013 (b) As at 31 Dec 2012 Source: Company data

Key milestones
5
1992
1996
2000
2002
2004
2005 2006
2007 2008
2009 2010
2011 2012 2013
MPPA initial public offering
Launch of Matahari Club Card program
(MCC)
Launch of Hypermart
Open 10 MDS, 13 Hypermart
First MDS opened in China
Open 10 Hypermart / MDS / Specialty
Stores
Open 15 Hypermart / MDS
Open 3rd DC in East Indonesia
Open 6 MDS, 7 Hypermart, 6
Foodmart, 4 Times bookstore
Open 12 Hypermart Open 17 Hypermart
US$100m 5-yr bond issuance
Restructuring of MDS, Matahari
Supermarket and Timezone
Awarded Top 500 Asia Pacific Retail
Award #1 (Indonesia) 2004 – 2010
US$150 3-yr bond issuance
Divestment of MDS for IDR 7.2tn Special interim dividend of IDR 3tn
Awarded Top 500 Asia Pacific Retail Award "Hall of Fame"
Awarded Superbrand award
Awarded 1st by SWA: Indonesia
Best Public Companies 2011 (Retail category)
Divestment of assets from MPPA, incl.
MDS shares US$200m 3-yr bond issuance
MPPA to be listed on the MSCI Indonesia
small cap Index effective 26 Nov
2013
6
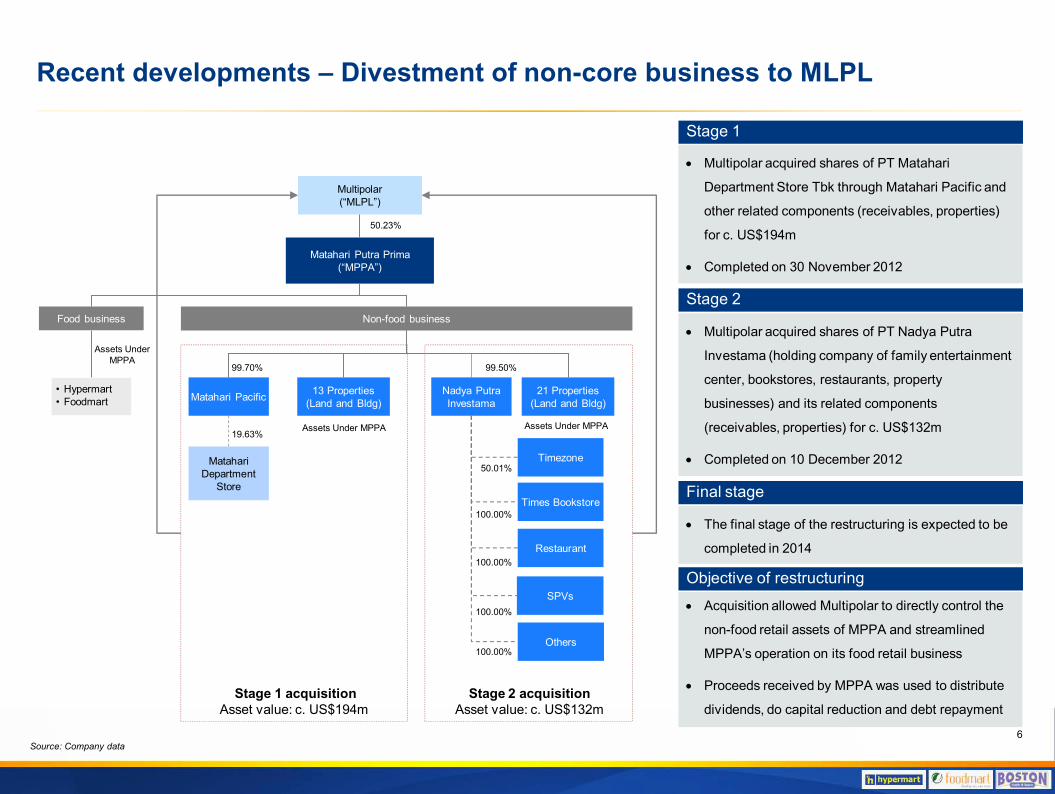
• Multipolar acquired shares of PT Matahari
Department Store Tbk through Matahari Pacific and
other related components (receivables, properties)
for c. US$194m
• Completed on 30 November 2012
• Multipolar acquired shares of PT Nadya Putra
Investama (holding company of family entertainment
center, bookstores, restaurants, property
businesses) and its related components
(receivables, properties) for c. US$132m
• Completed on 10 December 2012
• Acquisition allowed Multipolar to directly control the
non-food retail assets of MPPA and streamlined
MPPA’s operation on its food retail business
• Proceeds received by MPPA was used to distribute
dividends, do capital reduction and debt repayment
Matahari Putra Prima (“MPPA”)
Multipolar (“MLPL”)
Matahari Pacific Nadya Putra Investama
Timezone
Times Bookstore
Restaurant
SPVs
Others
Matahari Department
Store
13 Properties (Land and Bldg)
21 Properties (Land and Bldg)
Stage 1 acquisition Asset value: c. US$194m
Stage 2 acquisition Asset value: c. US$132m
Food business Non-food business
50.23%
50.01%
100.00%
100.00%
100.00%
100.00%
99.50% 99.70%
19.63% Assets Under MPPA Assets Under MPPA
Assets Under MPPA
• Hypermart • Foodmart
Stage 1
Stage 2
Objective of restructuring
Recent developments – Divestment of non-core business to MLPL
Source: Company data
• The final stage of the restructuring is expected to be
completed in 2014
Final stage

7
Current/pending ownership Fund/share flow
Multipolar (“MLPL”)
Matahari Putra Prima (“MPPA”)
50.23%
Temasek
US$300m
Exchange Rights for 26.1% stake in MPPA within four years
Public Use proceeds received from Temasek to acquire shares of MPPA from Public
1 PT Ciptadana
2 Anderson
Investments
Prime Star
23.67%
99.99%
26.10%
In February 2013, Temasek agreed to indirectly purchase a 26.1% stake in Matahari Putra Prima (“MPPA”) worth US$300 million facilitated through Multipolar, offer implies IDR2,050 (US$0.21) a share for MPPA
Multipolar issued a US$300 million equity-link instrument, whereby Temasek is the sole buyer
− The exchange rights will have a zero coupon rates and a tenor of five years
− Temasek will be able to exchange its rights into 26.1% stake of MPPA within a period of four years from the execution of the subscription agreement
All of the proceeds from the instrument sale will be used by Multipolar to purchase MPPA shares
− Multipolar intends to maintain its 50.2% stake in MPPA and an affiliate of Multipolar was appointed to pool shares from the public investors which was completed by June 2013
Recent developments – Temasek as a strategic investor
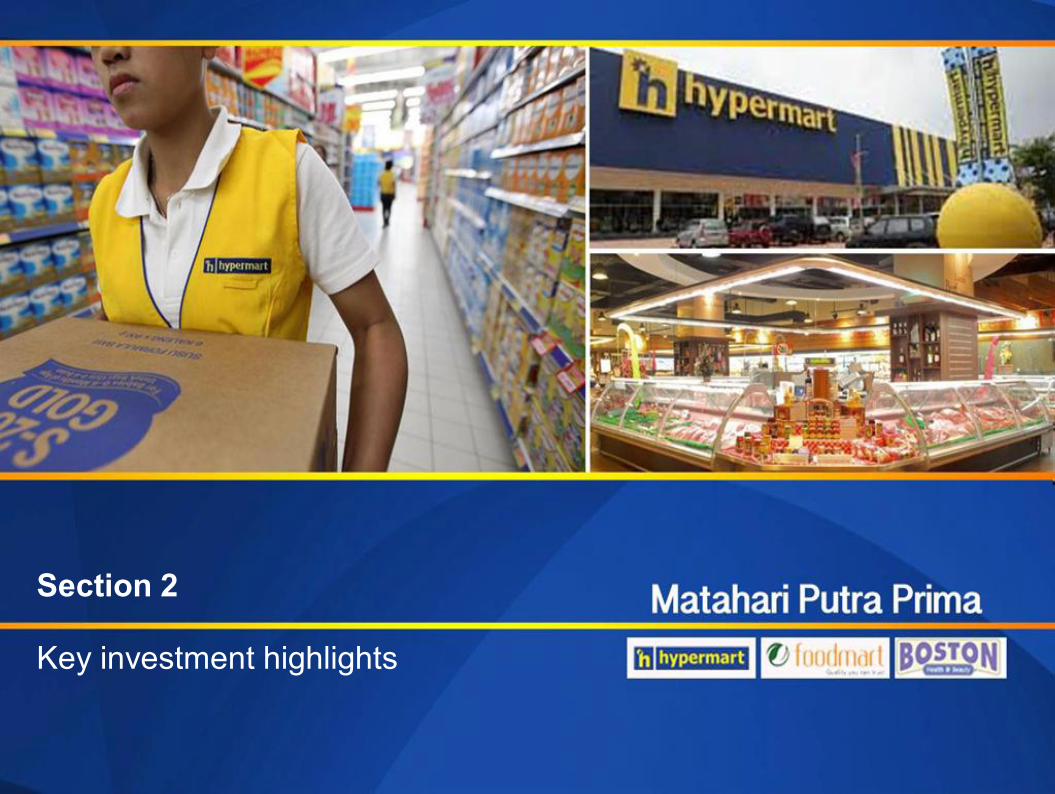
Key investment highlights
Section 2

Key investment highlights
8
Attractive exposure to large and growing middle-income class and underpenetrated modern grocery retail sector
Fastest growing hypermarket with well-recognized and trusted retail brand in Indonesia
Extensive and attractive nationwide store footprint
Efficient logistics platform driving productivity improvement
Customer driven merchandise mix with consistent marketing strategy
Strategic infrastructure with advanced management information systems
Strategic relationship with Lippo Group
1
2
4
3
5
6
7

14 17 20 28 37 46 55 65 75 84 9315 20 21 24 27 31 35 39 44 48 53
26 28 3238
4450
5662
6874
81
55 65 7390
108127
146166
187206
229
2007 2008 2009 2010 2011 2012 2013F 2014F 2015F 2016F 2017FConvenience stores HypermarketsSupermarkets Other modern grocery retailers
1,322 1,437 1,563 1,707 1,846
2013E 2014E 2015E 2016E 2017E
(US$
bn)
9
Modern grocery retail penetration still low
Source: Euromonitor, Central Bureau Statistics and Mark Plus
GDP (US$ PPP)
High income > US$475
Middle income > US$74 – 475
Low income < US$74
2009 population (million) 2012 population (million) Expenditure per person per month
Attractive exposure to large and growing middle-income class and underpenetrated modern grocery retail sector
Attractive Indonesia macro story… Modern grocery retailing grows even faster than overall retailing (IDR tn)
Vast
Growing
Rising middle class
Population of c. 248 million people as of 2012
Fourth most populated country in the world
Modern grocery retail as % of total grocery retail
4%
14%
25%
42%
44%
53%
62%
63%
71%
84%
Vietnam
Indonesia
Philippines
Thailand
Taiwan
Malaysia
Hong Kong
China
Singapore
US
1
5
92
121
7
132
106
+40%
+43%
-12%
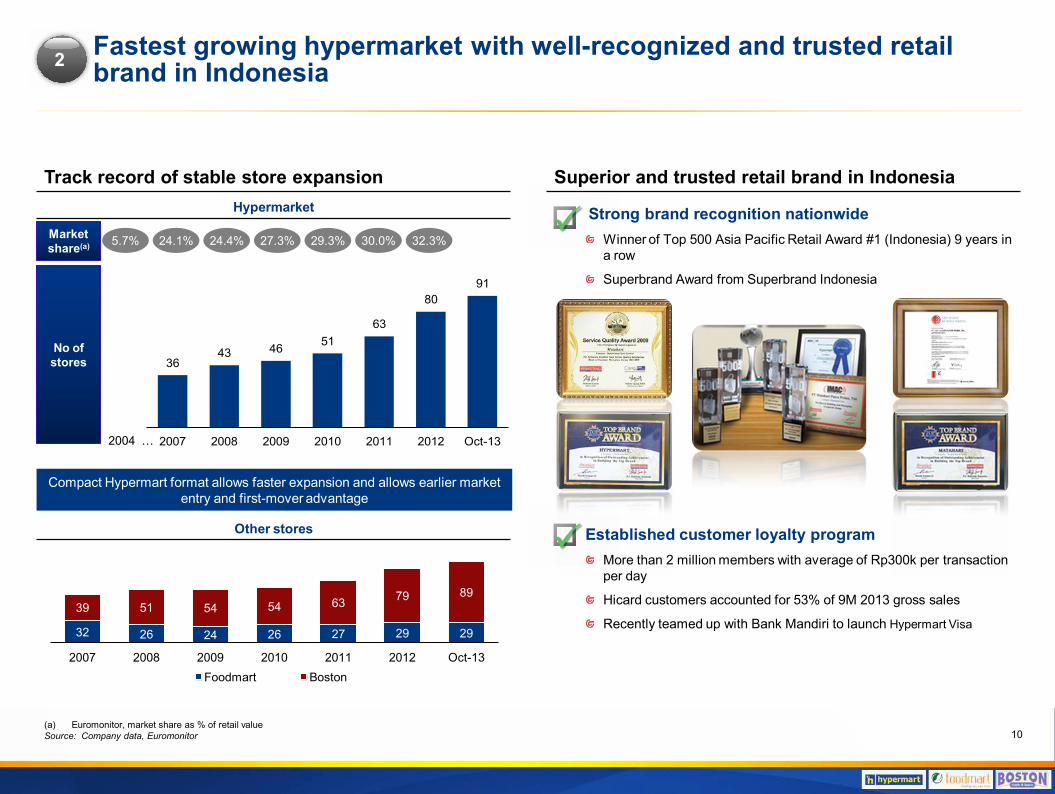
Strong brand recognition nationwide Winner of Top 500 Asia Pacific Retail Award #1 (Indonesia) 9 years in a row
Superbrand Award from Superbrand Indonesia
Fastest growing hypermarket with well-recognized and trusted retail brand in Indonesia
Track record of stable store expansion
10
Market share(a)
No of stores
2004 …
24.1% 5.7% 24.4% 27.3% 29.3% 30.0% 32.3%
(a) Euromonitor, market share as % of retail value Source: Company data, Euromonitor
Hypermarket
Compact Hypermart format allows faster expansion and allows earlier market entry and first-mover advantage
Other stores
2
Superior and trusted retail brand in Indonesia
3643 46 51
63
8091
2007 2008 2009 2010 2011 2012 Oct-13
32 26 24 26 27 29 29
39 51 54 54 63 79 89
2007 2008 2009 2010 2011 2012 Oct-13Foodmart Boston
Established customer loyalty program More than 2 million members with average of Rp300k per transaction per day
Hicard customers accounted for 53% of 9M 2013 gross sales
Recently teamed up with Bank Mandiri to launch Hypermart Visa

Description
Hypermart is MPPA’s hypermarket brand Foodmart supermarket Largest footprint of coverage
Recent conversion to local ownership Operates supermarket and minimarket Concentrates in Java region
Diary Farm International through its subsidiaries operates as an Asian retailer of fresh foods, consumer and durable goods Operates hypermarket Giant brand
LOTTE Co through its subsidiaries, engages in food, hotels, construction, and other businesses in Asia Lotte Mart is the hypermarkets chain of LOTTE Co and is prevalent in South Korean and Japan It entered Indonesia in 2010
Hypermarket brands
Target customer of hypermart Middle to low income Middle to upper income Middle to low income Middle to upper income
Hypermarket market share(a)
No of stores
(Sep-13)
Greater Jakarta 22 32 30
Other Java 28 17 15
Outer Java 39 7 4
Total 89 56 49
21.7% 24.8%
2007 2012
53.6%40.5%
2007 2012
(a) Euromonitor, market share as % of retail value Source: Company data, Euromonitor 11
Indonesia hypermarket competitive landscape
Competition’s focus is within Java
2
24.1%32.3%
2007 2012
0.3% 1.9%
2010 2012

12
Indian Ocean
Kalimantan
Java
Sulawesi
Irian Jaya
Maluku
East Timor
Pacific Ocean
Bali
Extensive and attractive nationwide store footprint
The only hypermarket player with meaningful presence outside Java area which is growing even faster
• 8 Hypermart • 6 Boston • Population 17.4m
Sulawesi
• 18 Hypermart • 1 Foodmart • 18 Boston • Population: 50.6m
Sumatera
• 7 Hypermart • 2 Foodmart • 7 Boston • Population: 13.8m
Kalimantan
• 53 Hypermart • 22 Foodmart • 53 Boston • Population: 136.5m
Java and Bali
Large retail network of 91 Hypermart, 29 Supermarket and 89 Health and Beauty outlets covering more than 60 cities and 23 provinces in Indonesia with focus on Java and expanding to new cities(a)
1
Store locations are strategically located in the best areas in each city serving growing demand for modern retail 2
Combo formats (Hypermart + Matahari Department Store) also gaining popularity 3
3
(a) As at 31 Oct 2013 Source: Company data
• 5 Hypermart • 4 Foodmart • 5 Boston • Population: 19.3m
East Indonesia

Segmentation of distribution centers Dry Goods Fresh
Location Balaraja Surabaya Cibitung Space 30,000 m2 10,000 m2 4,000 m2
Capacity 30,523 Plts 9,000 Plts 2,300 Plts No of SKUs 12,500 3,000 950 WMS Manhattan Manhattan Manhattan
Current logistics arrangement
Superior logistics infrastructure and distribution process allows MPPA to: • Establish the broadest geographic footprint • Carry higher in-stock levels • Improve overall service level and increase productivity of employees • Improve the distribution centers throughput:
• IDR 691bn (28% of total sales) in 2005 • IDR 6,394bn (59% of total sales) in 2012
In 2012, the three distribution centers (“DC”) operated at between 70% (low season) and 90% (high season) of full capacity • New distribution center in East Java will be opened by 2014
3 DCs: Two dry goods DCs located in Tangerang and Surabaya and a fresh food products DC located in Cibitung
DCs allow MPPA to: • Maintain assortment availability • Inventory accuracy • Quality control • Reduced delivery time • Reduces out-of-stock items for all its stores nationwide
Distribution center
DC throughput (IDR bn)
13
Surabaya Balaraja Cibitung
The only hypermarket chain with dedicated DC in Indonesia
Efficient logistics platform driving productivity improvement 4
691 1,286 1,859
3,028 3,552 4,393
5,149 6,395
5,763 28%
35%42%
53% 55% 58% 59% 59%63%
2005 2006 2007 2008 2009 2010 2011 2012 9M13DC throughput Throughput as % of sales
14
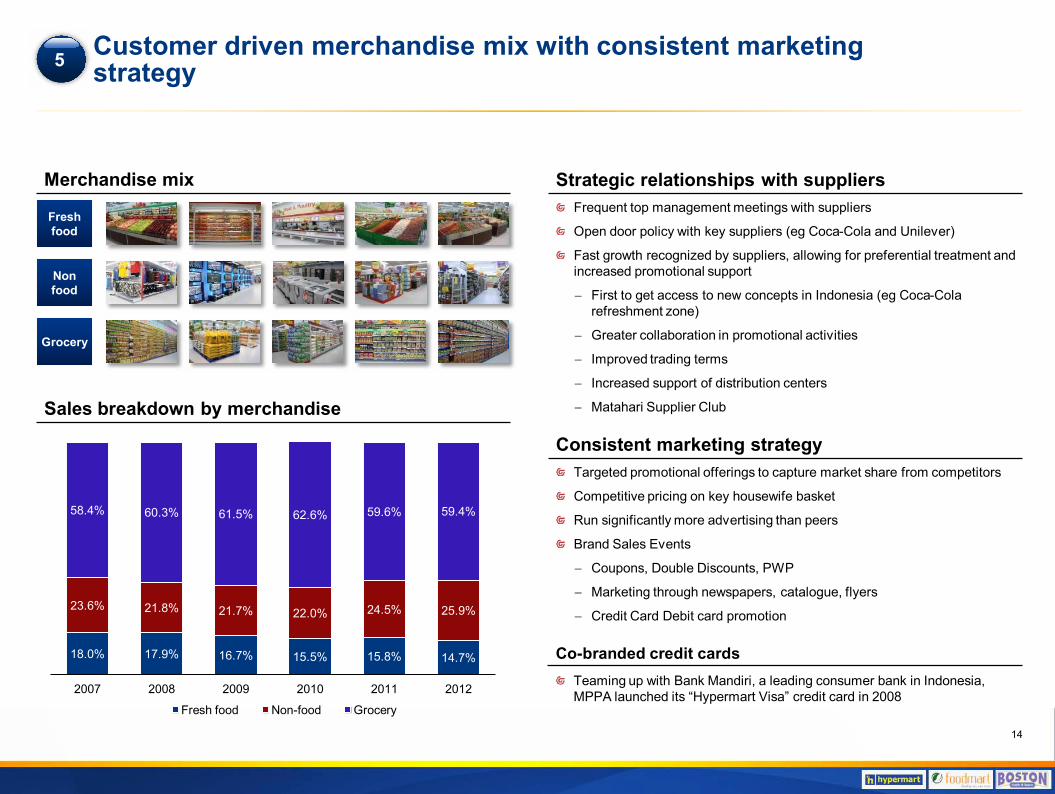
Sales breakdown by merchandise
Frequent top management meetings with suppliers
Open door policy with key suppliers (eg Coca-Cola and Unilever)
Fast growth recognized by suppliers, allowing for preferential treatment and increased promotional support
− First to get access to new concepts in Indonesia (eg Coca-Cola refreshment zone)
− Greater collaboration in promotional activities
− Improved trading terms
− Increased support of distribution centers
− Matahari Supplier Club
Strategic relationships with suppliers
Consistent marketing strategy
Merchandise mix
Targeted promotional offerings to capture market share from competitors
Competitive pricing on key housewife basket
Run significantly more advertising than peers
Brand Sales Events
− Coupons, Double Discounts, PWP
− Marketing through newspapers, catalogue, flyers
− Credit Card Debit card promotion
Fresh food
Non food
Grocery
Customer driven merchandise mix with consistent marketing strategy
Co-branded credit cards Teaming up with Bank Mandiri, a leading consumer bank in Indonesia, MPPA launched its “Hypermart Visa” credit card in 2008
5
18.0% 17.9% 16.7% 15.5% 15.8% 14.7%
23.6% 21.8% 21.7% 22.0% 24.5% 25.9%
58.4% 60.3% 61.5% 62.6% 59.6% 59.4%
2007 2008 2009 2010 2011 2012
Fresh food Non-food Grocery
15
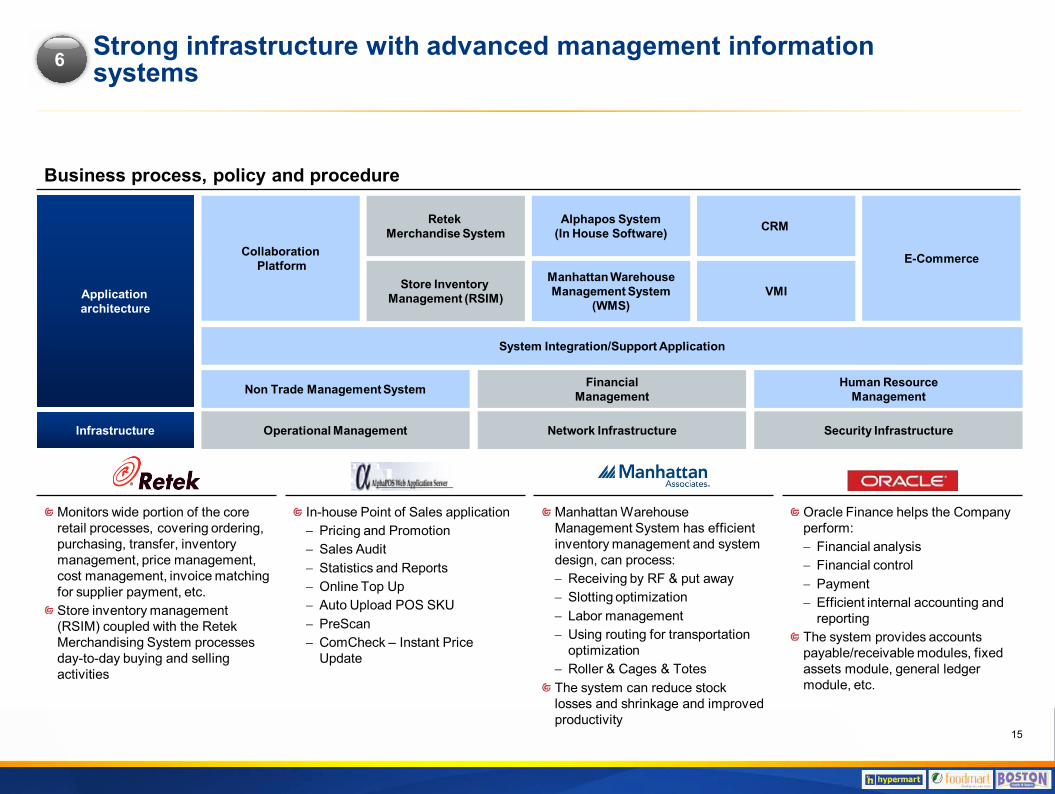
Strong infrastructure with advanced management information systems
Business process, policy and procedure
Application architecture
System Integration/Support Application
Financial Management
Alphapos System
(In House Software)
Manhattan Warehouse Management System
(WMS)
CRM
Collaboration Platform
VMI
Human Resource Management Non Trade Management System
Infrastructure
Retek
Merchandise System
Store Inventory
Management (RSIM)
Operational Management Network Infrastructure Security Infrastructure
E-Commerce
Monitors wide portion of the core retail processes, covering ordering, purchasing, transfer, inventory management, price management, cost management, invoice matching for supplier payment, etc. Store inventory management (RSIM) coupled with the Retek Merchandising System processes day-to-day buying and selling activities
In-house Point of Sales application − Pricing and Promotion − Sales Audit − Statistics and Reports − Online Top Up − Auto Upload POS SKU − PreScan − ComCheck – Instant Price
Update
Manhattan Warehouse Management System has efficient inventory management and system design, can process: − Receiving by RF & put away − Slotting optimization − Labor management − Using routing for transportation
optimization − Roller & Cages & Totes The system can reduce stock losses and shrinkage and improved productivity
Oracle Finance helps the Company perform: − Financial analysis − Financial control − Payment − Efficient internal accounting and
reporting The system provides accounts payable/receivable modules, fixed assets module, general ledger module, etc.
6
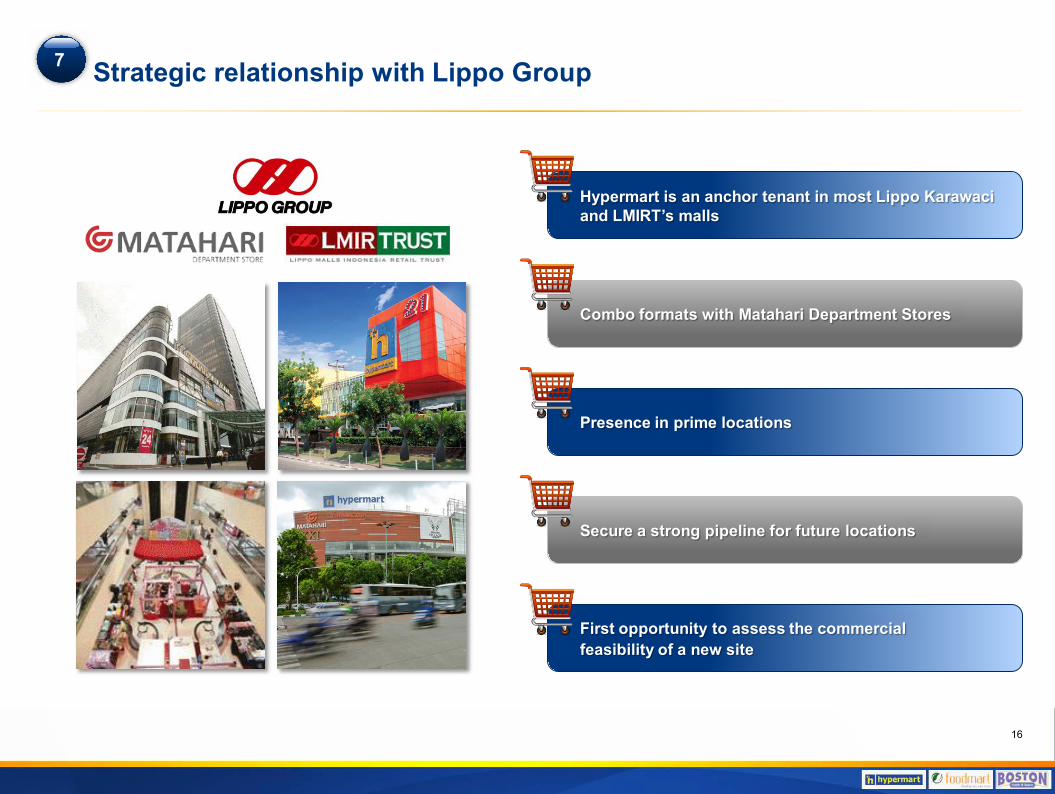
Strategic relationship with Lippo Group
16
7
Hypermart is an anchor tenant in most Lippo Karawaci and LMIRT’s malls
Combo formats with Matahari Department Stores
Secure a strong pipeline for future locations
Presence in prime locations
First opportunity to assess the commercial feasibility of a new site
Vision and strategy
Section 3
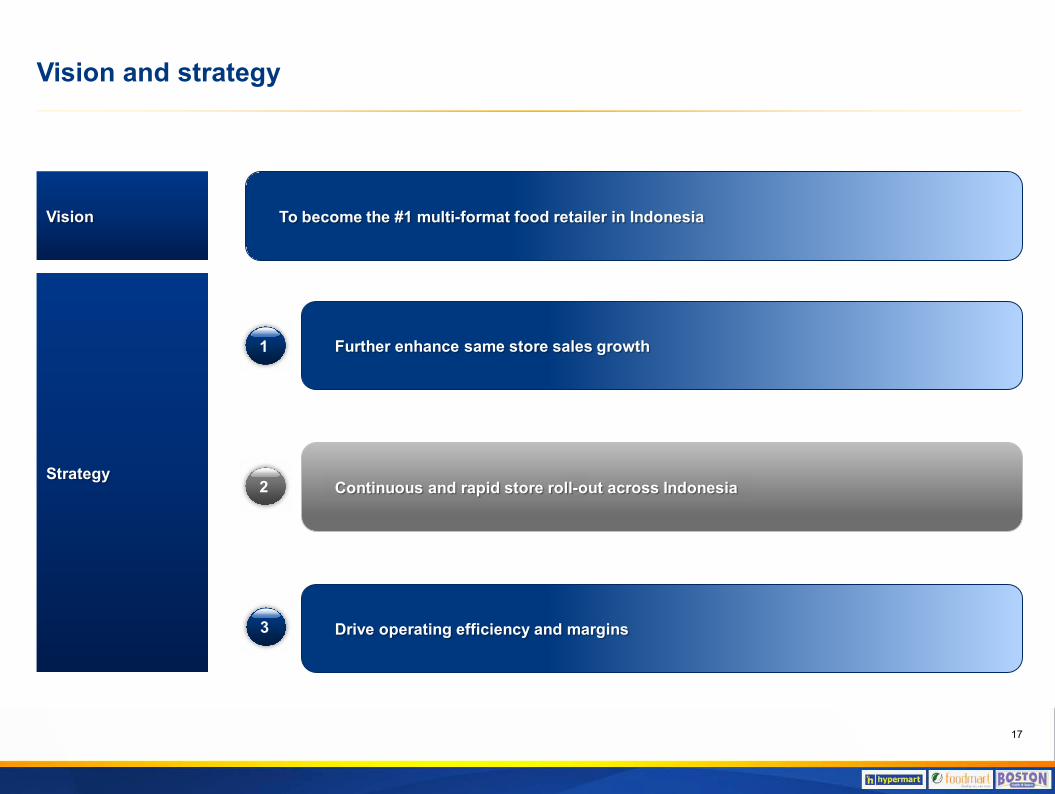
Vision
Strategy
To become the #1 multi-format food retailer in Indonesia
Vision and strategy
17
1
2
3
Further enhance same store sales growth
Continuous and rapid store roll-out across Indonesia
Drive operating efficiency and margins

19.6%
17.0%17.4% 17.1%
15.5%14.7%
13.3% 13.3% 13.5%
2004 2005 2006 2007 2008 2009 2010 2011 2012
12.1%
7.9% 7.8%
4.1%
2010 2011 2012 9M13
Our growth and business strategies
Further enhance same store sales growth
Provide products at competitive pricing
Strong in-stock program
Improve product space allocation and mix
Aggressive and targeted promotions
Focus on quality customer service
Strong loyalty programs
Realize economies of scale in sourcing and procurement
Negotiate additional discounts from suppliers
Continue optimization of procurement and inventory management functions
Further improve distribution logistics efficiencies
Drive operating efficiency and margins
Comparable store growth
18
1 2
Growth has lowered the expense ratio Operating expenses(a) as % of sales
(a) Operating expenses excluding depreciation and amortization Source: Company data

Our growth and business strategies (cont’d)
Continuous and rapid store roll-out
20+ store openings planned for 2013 and over 100 new stores in the
pipeline
Greater emphasis on stand-alone formats or combo formats with Matahari
Department Stores
Target to enter 10 new cities in 2013
Focus on penetration outside Java where there is less competition and
typically higher profitability
Maximize utilization of the superior logistics infrastructure and distribution
process to cater to these markets ahead of our competitors
Focus on more profitable outer islands
Islands outside Java are more profitable
19
3
Bangka Tengah Mataram
Maluku City Mall Pematang Siantar
2013YTD – 11 new Hypermart store openings
Sales contribution(a) EBITDA contribution(a)
Sulawesi 8.0% 10.0%
Kalimantan 11.3% 16.5%
East Indonesia 3.6% 7.8%
Sumatera 19.5% 21.5%
Java 26.1% 19.4%
Greater Jakarta 31.5% 24.8%
Source: Company data
(a) As at 30 Sep 2013 Source:

Financial overview
Section 4

8,545
8,431 10,380
7,570
8,709 8,909
10,868
7,971
2010 2011 2012 9M 2012 9M 2013
(IDR
bn)
Pro-forma
301
120
239
116
321
170
3.5%
1.4%
2.3%
1.5%
3.7%
2010 2011 2012 9M 2012 9M 2013
(IDR
bn)
Pro-forma Net income margin
Attractive earnings growth driven by continued store rollout
Sales Gross profit
EBITDA Net profit
20
(a) Pro-forma numbers excludes non-core subsidiaries which are no longer consolidated as part of the 2012 restructuring activities. The historical numbers that include the non-core subsidiaries results are not directly comparable to the pro-forma financial results excluding non-core subsidiaries
(b) Exclude one time gain on disposal of subsidiary Source: Company data
(a)
(a)
(b)
(a)
1,867 1,558
1,898
1,444 1,365
21.8%
17.5% 17.5% 18.1%15.7%
2010 2011 2012 9M 2012 9M 2013
(IDR
bn)
Gross profit marginPro-forma
769 669
785
555 541
9.0%7.5% 7.2% 7.0% 6.2%
2010 2011 2012 9M 2012 9M 2013
(IDR
bn)
EBITDA marginPro-forma
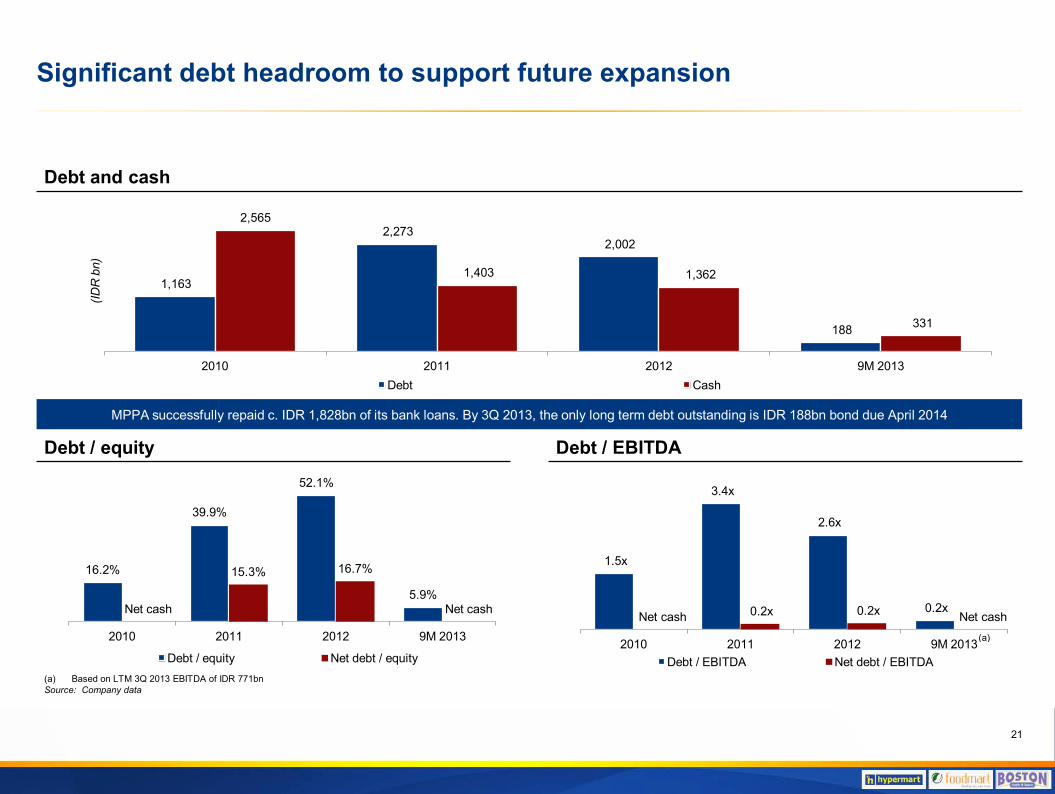
Significant debt headroom to support future expansion
Debt and cash
Debt / equity Debt / EBITDA
21
1,163
2,273 2,002
188
2,565
1,403 1,362
331
2010 2011 2012 9M 2013
(IDR
bn)
Debt Cash
16.2%
39.9%
52.1%
5.9%Net cash
15.3% 16.7%
Net cash
2010 2011 2012 9M 2013
Debt / equity Net debt / equity
1.5x
3.4x
2.6x
0.2x Net cash 0.2x 0.2x Net cash
2010 2011 2012 9M 2013Debt / EBITDA Net debt / EBITDA
(a)
MPPA successfully repaid c. IDR 1,828bn of its bank loans. By 3Q 2013, the only long term debt outstanding is IDR 188bn bond due April 2014
(a) Based on LTM 3Q 2013 EBITDA of IDR 771bn Source: Company data

Investor relations contacts
22
Danny Crayton Director of Investor Relations Email : [email protected] Mobile : +62 811 880 1534 Office : +62 21 546 9333 Ext. 9145 +62 21 547 5333 Ext. 9145
Danny Kojongian Director of Corporate Communication Email : [email protected] Office : +62 21 546 9333 Ext. 9501 +62 21 547 5333 Ext. 9501
PT Matahari Putra Prima Tbk Address : Menara Matahari, 17th Floor 7 Boulevard Palem Raya Lippo Village Tangerang 15811 Banten – Indonesia Website : www.mataharigroup.co.id www.hypermart.co.id

Additional information
Appendix I

MPPA share price performance
MPPA share price performance 2012 – 2013YTD
23
(a) Source: Newsrun, Bloomberg and FactSet as at 14 Nov 2013
% change MPPA JCI Index
Jan 2012YTD +136.4% +14.3%
Jan 2013YTD +89.1% +1.2%
Average Daily Traded Value (ADTV)
US$m IDRbn
1M ADTV 5.5 61
3M ADTV 4.2 45
6M ADTV 3.5 36
1Y ADTV 2.2 22
-
20
40
60
80
100
-
500
1,000
1,500
2,000
2,500
3,000
3,500
01-Jan-12 16-May-12 29-Sep-12 12-Feb-13 28-Jun-13 11-Nov-13
Volu
me
(m)
Shar
e pr
ice
(IDR
)
Volume (m) MPPA JCI Index (rebased)
5 Feb 2013Temasek agreed to indirectly purchase a 26.1% stake in Matahari Putra Prima

Overview of Lippo Group
Malls • Singapore, China,
Indonesia • 42 malls + 31 in pipeline • in Indonesia • 20-30% of total modern • Indonesian retail space
Retail • Indonesia & China • 230 dept stores, hyper -
markets & supermarkets • >USD 2.4bn revenue
Healthcare • Largest hospital group
in Indonesia • 13 hospitals in
Indonesia, and another 37 hospitals over next 7 years
Properties & Property
Developments • Presence in all major markets in Asia • Largest property group in Indonesia • 2 REITs with USD 2.5bn assets
Hotels
• >6,000 rooms • China, Singapore, Malaysia,
Indonesia
Financial Services
• Banking, insurance, brokerage, asset management, investment banking services
TMT • Dominant English media in Indonesia • Dominant cable TV, largest • broadband internet, data comm • 4G LTE license • Leading IT solutions provider • for major banks
Education & Research
• 42 schools + 4 int’l schools • Top private universities in
Indonesia • Teachers’ college • Cancer research center
24

Carmelito Regalado Non-affiliated Director Joined the Company in March 2002, has over 35 years of experience and was elected as President of Matahari Food Business Division of MPPA in late 2009
Johanes Jany Director Joined the Company in 1989, later assumed several key positions in different subsidiaries, including Timezone, Matahari Department Store
Lina H. Latif Director Joined the Company in 2001 and started her career as Senior Auditor at Prasetio & Utomo Co since 1979 and joined Lippo Group since 1985
Benjamin Jonathan Mailool President Director Prior to joining the Company in 2002, he assumed his position as CEO of PT Bukit Sentul Tbk, and Vice President in Citibank N.A, and has more than 20 years of experience in the industry
Richard H. Setiadi Director Joined the Company in 2001, and he started his career as an auditor with Arthur Andersen 1994 where he conducted audits in several reputable companies
25
MPPA Board of Directors
Ishak Kurniawan Director Joined the Company in April 2008. Prior to joining the Company, he serves as the Country Human Resources Officer in Citibank N.A with more than 24 years of experience
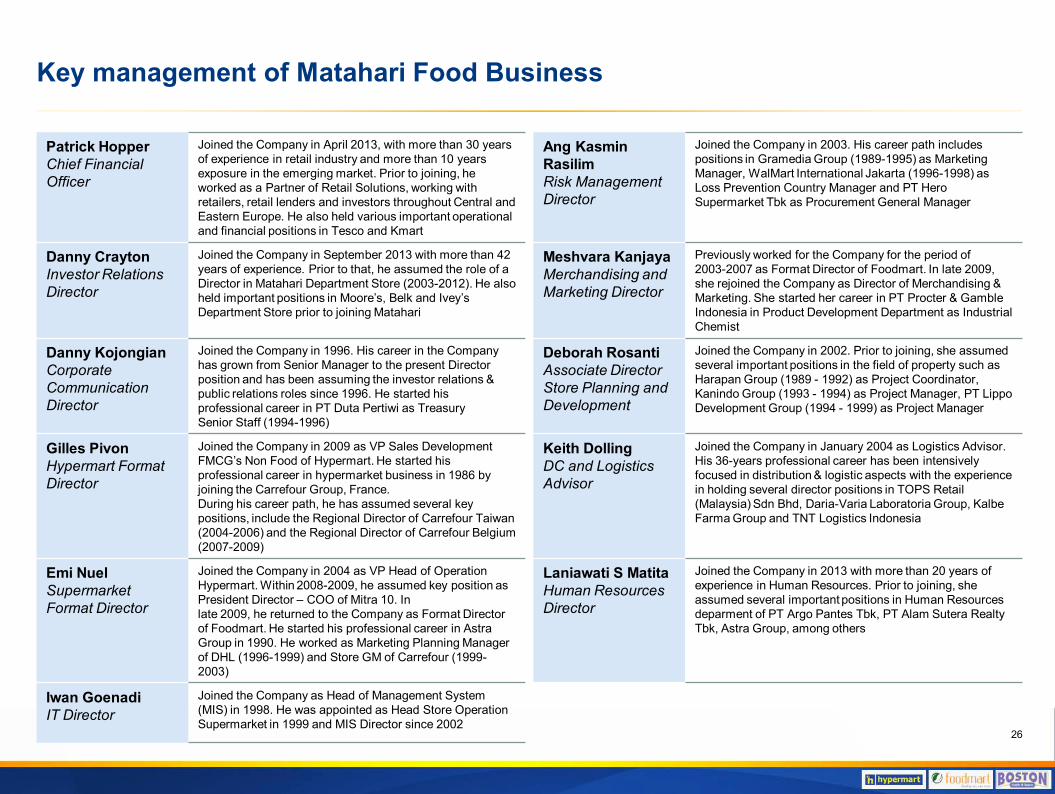
Key management of Matahari Food Business
Patrick Hopper Chief Financial Officer
Joined the Company in April 2013, with more than 30 years of experience in retail industry and more than 10 years exposure in the emerging market. Prior to joining, he worked as a Partner of Retail Solutions, working with retailers, retail lenders and investors throughout Central and Eastern Europe. He also held various important operational and financial positions in Tesco and Kmart
Ang Kasmin Rasilim Risk Management Director
Joined the Company in 2003. His career path includes positions in Gramedia Group (1989-1995) as Marketing Manager, WalMart International Jakarta (1996-1998) as Loss Prevention Country Manager and PT Hero Supermarket Tbk as Procurement General Manager
Danny Crayton Investor Relations Director
Joined the Company in September 2013 with more than 42 years of experience. Prior to that, he assumed the role of a Director in Matahari Department Store (2003-2012). He also held important positions in Moore’s, Belk and Ivey’s Department Store prior to joining Matahari
Meshvara Kanjaya Merchandising and Marketing Director
Previously worked for the Company for the period of 2003-2007 as Format Director of Foodmart. In late 2009, she rejoined the Company as Director of Merchandising & Marketing. She started her career in PT Procter & Gamble Indonesia in Product Development Department as Industrial Chemist
Danny Kojongian Corporate Communication Director
Joined the Company in 1996. His career in the Company has grown from Senior Manager to the present Director position and has been assuming the investor relations & public relations roles since 1996. He started his professional career in PT Duta Pertiwi as Treasury Senior Staff (1994-1996)
Deborah Rosanti Associate Director Store Planning and Development
Joined the Company in 2002. Prior to joining, she assumed several important positions in the field of property such as Harapan Group (1989 - 1992) as Project Coordinator, Kanindo Group (1993 - 1994) as Project Manager, PT Lippo Development Group (1994 - 1999) as Project Manager
Gilles Pivon Hypermart Format Director
Joined the Company in 2009 as VP Sales Development FMCG’s Non Food of Hypermart. He started his professional career in hypermarket business in 1986 by joining the Carrefour Group, France. During his career path, he has assumed several key positions, include the Regional Director of Carrefour Taiwan (2004-2006) and the Regional Director of Carrefour Belgium (2007-2009)
Keith Dolling DC and Logistics Advisor
Joined the Company in January 2004 as Logistics Advisor. His 36-years professional career has been intensively focused in distribution & logistic aspects with the experience in holding several director positions in TOPS Retail (Malaysia) Sdn Bhd, Daria-Varia Laboratoria Group, Kalbe Farma Group and TNT Logistics Indonesia
Emi Nuel Supermarket Format Director
Joined the Company in 2004 as VP Head of Operation Hypermart. Within 2008-2009, he assumed key position as President Director – COO of Mitra 10. In late 2009, he returned to the Company as Format Director of Foodmart. He started his professional career in Astra Group in 1990. He worked as Marketing Planning Manager of DHL (1996-1999) and Store GM of Carrefour (1999-2003)
Laniawati S Matita Human Resources Director
Joined the Company in 2013 with more than 20 years of experience in Human Resources. Prior to joining, she assumed several important positions in Human Resources deparment of PT Argo Pantes Tbk, PT Alam Sutera Realty Tbk, Astra Group, among others
Iwan Goenadi IT Director
Joined the Company as Head of Management System (MIS) in 1998. He was appointed as Head Store Operation Supermarket in 1999 and MIS Director since 2002
26
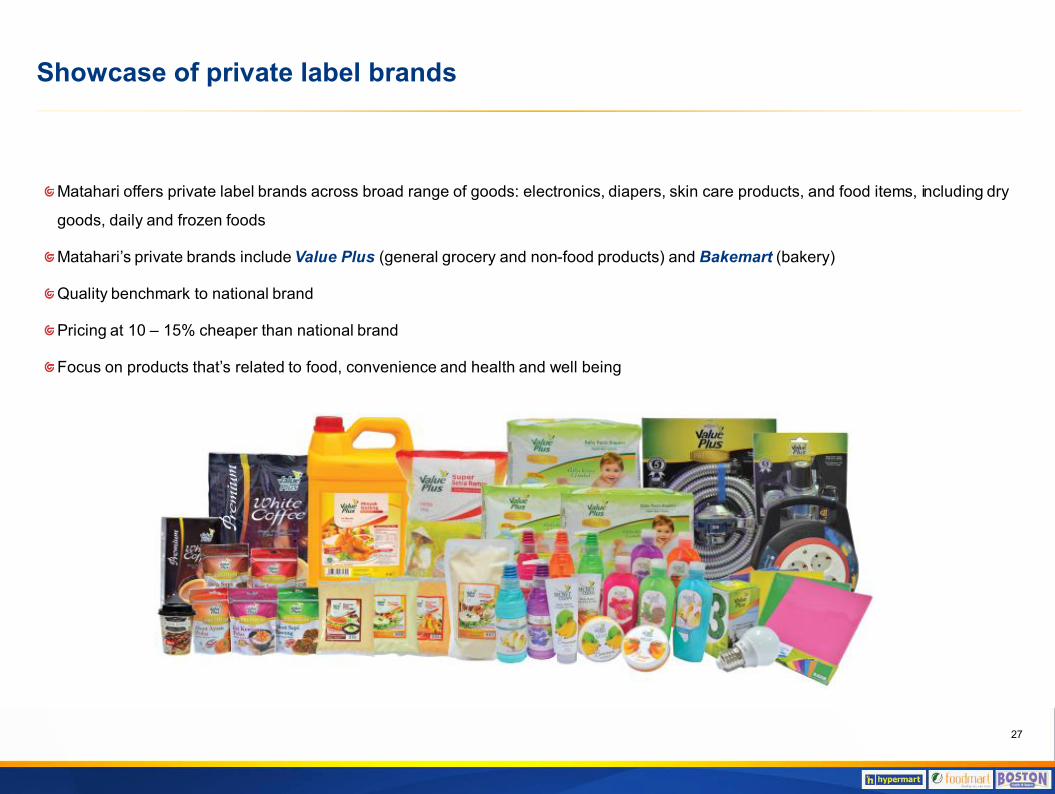
Showcase of private label brands
Matahari offers private label brands across broad range of goods: electronics, diapers, skin care products, and food items, including dry
goods, daily and frozen foods
Matahari’s private brands include Value Plus (general grocery and non-food products) and Bakemart (bakery)
Quality benchmark to national brand
Pricing at 10 – 15% cheaper than national brand
Focus on products that’s related to food, convenience and health and well being
27
Disclaimer
This presentation has been prepared by PT Matahari Prima Putra Tbk (“MPPA”) and is circulated for the purpose of general information only. It is not intended for any
specific person or purpose and does not constitute a recommendation regarding the securities of MPPA. No warranty (expressed or implied) is made to the accuracy
or completeness of the information. All opinions and estimations included in this report constitute our judgment as of this date and are subject to change without prior
notice. MPPA disclaims any responsibility or liability whatsoever arising which may be brought against or suffered by any person as a result of reliance upon the
whole or any part of the contents of this presentation and neither MPPA nor any of its affiliated companies and their respective employees and agents accepts liability
for any errors, omissions, negligent or otherwise, in this presentation and any inaccuracy herein or omission here from which might otherwise arise.
Forward-Looking Statements
The information communicated in this presentation contains certain statements that are or may be forward looking. These statements typically contain words such as
"will", "expects" and "anticipates" and words of similar import. By their nature, forward looking statements involve a number of risks and uncertainties that could cause
actual events or results to differ materially from those described in this presentation. Factors that could cause actual results to differ include, but are not limited to,
economic, social and political conditions in Indonesia; the state of the retail industry in Indonesia; prevailing market conditions; increases in regulatory burdens in
Indonesia, including environmental regulations and compliance costs; fluctuations in foreign currency exchange rates; interest rate trends, cost of capital and capital
availability; and related capital expenditures and investments; the cost of construction; availability of real estate property; competition from other companies and
venues; shifts in customer demands; changes in operation expenses, including employee wages, benefits and training, governmental and public policy changes;
MPPA’s ability to be and remain competitive; MPPA’s financial condition, business strategy as well as the plans and objectives of MPPA’s management for future
operations; generation of future receivables; and environmental compliance and remediation. Should one or more of these uncertainties or risks, among others,
materialize, actual results may vary materially from those estimated, anticipated or projected. Specifically, but without limitation, capital costs could increase, store
openings could be delayed and anticipated improvements in production, capacity or performance might not be fully realized. Although MPPA believes that the
expectations of its management as reflected by such forward-looking statements are reasonable based on information currently available to us, no assurances can be
given that such expectations will prove to have been correct. You should not unduly rely on such statements. In any event, these statements speak only as of the date
hereof, and MPPA undertakes no obligation to update or revise any of them, whether as a result of new information, future events or otherwise.
28