Outcome of the Board Meeting.pdf - Gland Pharma Limited
43
GLAND GLAND PHARMA LIMITED January 22, 2021 BSE Limited Corporate Relationship Department Phiroze Jeej eebhoy Towers 25th floor, Dalal Street Mumbai - 400 001 Scrip Code: 543245 National Stock Exchange of India Limited Listing Department Exchange Plaza, sth floor Plot no. C-1 , Block G, Bandra Kurla Complex Bandra (East), Mumbai - 400 05 l Symbol : GLAND EQ (ISIN: INE068VOl023) Dear Sir/Madam, Sub: Outcome of Board Meeting In continuation to our intimation dated December 31, 2020 regarding the Board Meeting Notice, We would like to inform you that the Board of Directors of the Company at its Meeting held on January 22, 2021 has inter-alia approved the Unaudited Financial Results of the Company for the Quarter ended and Nine months ended December 31, 2020. In this regard, we are enclosing herewith the following: 1. Unaudited Financial Results of the Company for the Quarter ended and Nine months ended December 31, 2020 prepared in compliance with Indian Accounting Standards (Ind AS). 2. Press Release and Investor Presentation on the Financial Results of the Company for the above period. Pursuant to Regulation 33 of the SEBI (Listing Obligations and Disclosure Requirements) Regulations, 2015, the Limited Review Report of the Statutory Auditors on the Unaudited Financial Results is also enclosed. The Board Meeting commenced at 16.00 Hrs IST and the agenda item for approval of the Unaudited Financial Results for the Quarter ended and Nine months ended December 31, 2020 was concluded at 16.30 Hrs IST. This is for your information and records. Thanking you, Yours faithfully, iv For Gland Pharma Limited S t h Kumar Pallerlamud . i Company Secretary and Compliance Officer Encl: as above Factory & Regd. Office: Survey No. 143-148, 150 & 151, Near Gandimaisamma 'X' Roads, D.P. Pally, Dundigal, Dundigal-Gandimaisamma Mandal, Medchal-Malkajgiri District, Hyderabad 500043,Telangana, India Tel: +91-40-30510999 Fax: +91-40-30510800, email: [email protected] | www.glandpharma.com CIN: U24-39TG1978PLC002276 GLAND GLAND PHARMA LIMITED January 22, 2021 BSE Limited Corporate Relationship Department Phiroze Jeej eebhoy Towers 25th floor, Dalal Street Mumbai - 400 001 Scrip Code: 543245 National Stock Exchange of India Limited Listing Department Exchange Plaza, sth floor Plot no. C-1 , Block G, Bandra Kurla Complex Bandra (East), Mumbai - 400 05 l Symbol : GLAND EQ (ISIN: INE068VOl023) Dear Sir/Madam, Sub: Outcome of Board Meeting In continuation to our intimation dated December 31, 2020 regarding the Board Meeting Notice, We would like to inform you that the Board of Directors of the Company at its Meeting held on January 22, 2021 has inter-alia approved the Unaudited Financial Results of the Company for the Quarter ended and Nine months ended December 31, 2020. In this regard, we are enclosing herewith the following: 1. Unaudited Financial Results of the Company for the Quarter ended and Nine months ended December 31, 2020 prepared in compliance with Indian Accounting Standards (Ind AS). 2. Press Release and Investor Presentation on the Financial Results of the Company for the above period. Pursuant to Regulation 33 of the SEBI (Listing Obligations and Disclosure Requirements) Regulations, 2015, the Limited Review Report of the Statutory Auditors on the Unaudited Financial Results is also enclosed. The Board Meeting commenced at 16.00 Hrs IST and the agenda item for approval of the Unaudited Financial Results for the Quarter ended and Nine months ended December 31, 2020 was concluded at 16.30 Hrs IST. This is for your information and records. Thanking you, Yours faithfully, iv For Gland Pharma Limited S t h Kumar Pallerlamud . i Company Secretary and Compliance Officer Encl: as above Factory & Regd. Office: Survey No. 143-148, 150 & 151, Near Gandimaisamma 'X' Roads, D.P. Pally, Dundigal, Dundigal-Gandimaisamma Mandal, Medchal-Malkajgiri District, Hyderabad 500043,Telangana, India Tel: +91-40-30510999 Fax: +91-40-30510800, email: [email protected] | www.glandpharma.com CIN: U24-39TG1978PLC002276
-
Upload
khangminh22 -
Category
Documents
-
view
1 -
download
0
Transcript of Outcome of the Board Meeting.pdf - Gland Pharma Limited

GLAND GLAND PHARMA LIMITED January 22, 2021
BSE Limited Corporate Relationship Department Phiroze Jeej eebhoy Towers 25th floor, Dalal Street Mumbai - 400 001 Scrip Code: 543245
National Stock Exchange of India Limited Listing Department Exchange Plaza, sth floor Plot no. C-1 , Block G, Bandra Kurla Complex Bandra (East), Mumbai - 400 05 l
Symbol : GLAND EQ (ISIN: INE068VOl023)
Dear Sir/Madam,
Sub: Outcome of Board Meeting
In continuation to our intimation dated December 31, 2020 regarding the Board Meeting Notice, We would like to inform you that the Board of Directors of the Company at its Meeting held on January 22, 2021 has inter-alia approved the Unaudited Financial Results of the Company for the Quarter ended and Nine months ended December 31, 2020.
In this regard, we are enclosing herewith the following:
1. Unaudited Financial Results of the Company for the Quarter ended and Nine months ended December 31, 2020 prepared in compliance with Indian Accounting Standards (Ind AS).
2. Press Release and Investor Presentation on the Financial Results of the Company for the above period.
Pursuant to Regulation 33 of the SEBI (Listing Obligations and Disclosure Requirements) Regulations, 2015, the Limited Review Report of the Statutory Auditors on the Unaudited Financial Results is also enclosed.
The Board Meeting commenced at 16.00 Hrs IST and the agenda item for approval of the Unaudited Financial Results for the Quarter ended and Nine months ended December 31, 2020 was concluded at 16.30 Hrs IST.
This is for your information and records.
Thanking you,
Yours faithfully,
iv
For Gland Pharma Limited
S t h Kumar Pallerlamud . i
Company Secretary and Compliance Officer
Encl: as above Factory & Regd. Office: Survey No. 143-148, 150 & 151, Near Gandimaisamma 'X' Roads, D.P. Pally, Dundigal,
Dundigal-Gandimaisamma Mandal, Medchal-Malkajgiri District, Hyderabad 500043,Telangana, India Tel: +91-40-30510999 Fax: +91-40-30510800, email: [email protected] | www.glandpharma.com
CIN: U24-39TG1978PLC002276

S.R. BATLI8OI & ASSOCIATES Chartered Accountants
LLP THE SKYVIEW 10 18th Floor, "NORTH LOBBY" Survey No. 83/1, Raidurqam Hyderabad - 500 032, India Tel :+91 40 6141 6000
Independent Auditor's Review Report on the Quarterly and Year to Date Unaudited Financial Results of the Company Pursuant to the Regulation 33 of the SEBI (Listing Obligations and Disclosure Requirements) Regulations, 2015, as amended
Review Report to The Board of Directors Gland Pharma Limited
I We have reviewed the accompanying statement oflunaudited financial results of Gland Pharma Limited (the "Company") for the quarter ended December 3 I, 2020 and year to date from April Ol, 2020 to December 31, 2020 (the "Statement") attached herewith, being submitted by the Company pursuant to the requirements of Regulation 33 of the SEBI (Listing Obligations and Disclosure Requirements) Regulations, 201 5, as amended (the "Listing Regulations").
2. This Statement, which is the responsibility of the Company's Management and approved by the Company's Board of Directors, has been prepared in accordance with the recognition and measurement principles laid down in Indian Accounting Standard 34, (lnd AS 34) "Interim Financial Reporting" prescribed under Section 133 of the Companies Act, 2013 as amended, read with relevant rules issued thereunder and other accounting principles generally accepted in India. Our responsibility is to express a conclusion on the Statement based on our review.
3. We conducted our review of the Statement in accordance with the Standard on Review Engagements (SRE) 2410, "Review of Interim Financial Information Performed by the Independent Auditor of the Entity" issued by the Institute of Chartered Accountants of India. This standard requires that we plan and perform the review to obtain moderate assurance as to whether the Statement is free of material misstatement. A review of interim financial information consists of making inquiries, primarily of persons responsible for financial and accounting matters, and applying analytical and other review procedures. A review is substantially less in scope than an audit conducted in accordance with Standards on Auditing and consequently does not enable us to obtain assurance that we would become aware of all significant matters that might be identified in an audit. Accordingly, we do not express an audit opinion.
ARTERED ANTS
S.R. saznboi 8 Re a t
iabihty Partnership with LLP Identity No. AAB-4295 ~-t, Block 'B', 3rd Floor, Kolkata-700 016

S.R. BATL 1BO1 & ASSOCIATES LLP Chartered Accountants
4. Based on our review conducted as above, nothing has come to our attention that causes us to believe that the accompanying Statement, prepared in accordance with the recognition and measurement principles laid down in the aforesaid Indian Accounting Standards ('Ind AS') specified under Section 133 of the Companies Act, 2013 as amended, read with relevant rules issued thereunder and other accounting principles generally accepted in India, has not disclosed the information required to be disclosed in terms of the Listing Regulations, including the manner in which it is to be disclosed, or that it contains any material misstatement.
5. Attention is drawn to the fact that the figures for the financial result for the corresponding quarter and nine months period ended December 3 l , 2019 and for the preceding quarter ended September 30, 2020 as reported in these Unaudited Financial Results have been prepared solely based on the information compiled by the management, but have not been subject to audit or review. Further, we report that the figures for the quarter ended December 3 l , 2020 represent the derived figures between the reviewed figures in respect of the nine months period ended December 3 l , 2020 and the figures for the half year ended September 30, 2020, which were not subject to audit or review.
For S.R. BATLIBOI & ASSOCIATES LLP Chartered .AccoLmtants
1010-49W/E300004 ICAI Firm registration number:
NO M Ki . 1 per Navneet Rai Kabra Partner Membership No.: 102328
R v T CHARTERED ¢\ACCOUNTANTS of*
* "*0ERr\%° UDIN: '2.llo 1518 499 Q QRBHoE Hyderabad January 22, 2021

CLAND PHARMA Ll;\llTEl)
GLAND E Corporate Identity Number: U24239TGl978PLC002276 Registered Ofliee: So. No. 143 - 148. 150 and ISI. Ncar Gaudi Maisamma `X` Roads. D.P. Pally. Dundiual
Dundigal - Gandi Maisamma (M), Medchal-Malkajgiri District, Hyderabad 500 043, Telangana. India Tel: +91 40 3051 0999: Website: www.glandphamla.com; E-mail: [email protected]
Statement of Unaudited Financial Results for the Quarter and Nine months ended December 31, 2020 (T in millions)
Particulars Quarter ended Nine months ended Year ended
3l-Dec-20 30-Sep-20 31-Dec-I9 31-Dec-20 31-Dec-I9 31-Mar-20 (Unaudited) (Unaudited) (Unaudited) (Unaudited) (Unaudited) (Audited)
1. Income Revenue from opcratiolls Other income
Total income 2. Expenses
Cost of materials consumed Purchases of traded goods Changes in inventories of t"i11islled goods, stock-in- trade and work-in-progress Power and fuel Employee benefits expense Depreciation expense
Finance expense Other expenses Total expenses
3- Frofit before tax (l-2) 4. Tax expense
Current tax
Deferred tax charge/(credit) Taxes for earlier years
Total tax expense
S. Profit for the period/year (3-4) 6. Other comprehensive income not to be
reclassi.ficd to profit or loss in subsequent periods: Re-measurement loss/(gain) on employee defined benefit plans Deferred tax charge/(credit) on remeasurement of defined benefit plans Other comprehensive income (net of tax)
7. Total comprehensive income (after taxes) (5-6) 8* Paid up equity share capital (Face value o i l
each) 9. Other equity
10. Earnings per equity share (Face value oil¥l each): (Nor ammlisedfor the quarter and nine mon//is ended) Basic ii) Diluted (2)
8,594. 19 35 1.30
8,3 I 5.00 203.52
6,459.35 252.88
25,75 I .28 875.62
19,980.02 929.67
26,332.40 1891.68
8,948.49 8,518.52 6,712.23 26,626.90 20,909.69 27,724.08
4,607.73 28.5 I
(56756)
193.40 821.67 249.65
11.59 868.12
5.402.96 46.21
(1,714. 14)
192. 15 785.58 246.63
7.60 625.24
2,889.35 104.14
(2l9. l6)
199. I5 672.12 2428 l
56.78 696.04
13,066.68 120.72
(2, 184. 17)
553.26 2,330.64
738.58 23.90
2,1 18.62
9,027.94 165.07
(728.27)
603.32 2.104.59
705.09 67.08
L65 l.33
10,902.54 186.73
(69.04)
785,00 2,776.62
945.87 71.82
2, 195.88
6.213.1 l 5,592.23 4,640.73 16,768.23 13,596.18 17,795.42 2,732.38 2,926.29 2,071.50 9,858.67 7,313.54 9,928.66
692.56 (1.25)
743.88 (6. l6)
520.62 5.57 4.32
2,505.06 (1 1.93)
1,845.54 (316.97)
4.32
2,513.97 (3 l6.211
4.32
691.31 737.72 530.51 2,493.13 1,532.89 2,200.08
2,041.07 2,188.57 1,540.99 7,365.54 5,780.65 7,728.58
(10.51)
2.65
13.01
(3.27)
6.84
(1.72)
16.27
(4.09)
45.50
(11.45)
69.75
(17.55)
(7.86) 9.74 5.12 12.18 34.05 52.20 2,048.93 2,178.83 1,535.87 7,353.36 5,746.60 7,676.38
163.28
12.83 12.82
154.95
14.12 14.12
154.95
9.95 9.95
163.28
47.12 47.10
154.95
37.3 l 37.3 l
154.95
36,307.40
49.88 49.88
* \ IGLAND
UH*
R\O_N
HYDERABAD
Ffonlco v *

Notes:
I . In terms of Regulation 33 of the SFBI (Listing Obligations and Disclosure Requirements) 2015. this Statement of Unaudited Financial Results for the quarter and nine months ended December 31. 2020 ("Unauditcd Financial Rcsults") of the Company has been reviewed by the Audit Committee and approved by the Board of Directors at their meeting held on January 22. 2021 and have been subject to a limited review by the stanton auditors of the Company.
2. The financial results for the corresponding quarter and nine months ended December 31. 2019 and for the preceding quarter ended September 30, 2020 have not been subject to an audit or review by our statutory auditors. However. the management has exercised necessary due diligence to ensure that the financial results for these periods provide a tme and fair view of the Company's affairs.
3. The Unaudited Financial Results of the Company have been prepared in accordance with the Indian Accounting Standards notified under Section 133 ollthe Companies Act 2013, as amended. read with relevant rules thereunder and in terms of Regulation 33 of the SEBI (Listing Obligations and Disclosure Requirements) 2015, as amended (the "Listing requirements").
4. The Company has completed Initial Public Offer ("lPO") of 43.196.968 Equity Shares of the face value of ?1/- each at an issue price of €l,500/- per Equity Share, comprising offer for sale of 34.863.635 shares by Selling Shareholders and fresh issue of 8.333,333 shares. The Equity Shares of the Company were listed on BSE Limited ("BSE") and National Stock Exchange of India Limited ("NSE") on November 20, 2020. Accordingly, the Unaudited Financial Results for the quarter and nine months ended December 3 I. 2020 are drawn up for the first time in accordance with the Listing requirements.
5. The total offer expenses are estimated to be ?1392.52 million (inclusive of taxes) which are proportionately allocated between the selling shareholders and the Company as per respective offer size. The Company's share of these expenses ?221.77 (excluding taxes) has been adjusted against securities premium.
6. The utilisation of the net IPO proceeds is summarised below: Particulars
(2 in millions) Utilisation upto Unutilised amounts
31-Dec-20 as on 31-Dec-20 1,681.00 6,014.00
7.38 1,672.62 840.04 2.02464
2,528.42 9,711.26 in deposits with scheduled commercial bank and in
Objects of the issue as per prospectus .
Funding incremental working capital requirement 7.695.00 . Funding capital expenditure requirement 1,680.00 . General corporate purpose 2,864.68 Total 12,239.68 IPO Proceeds which were unutilised as al December 31, 2020 were temporarily invested monitoring agency account.
7. The Code of Social Security 2020 ('Code') relating to employee benefits during employment and post-employment received Presidential assent in September 2020. The Code has been published in the Gazette of India. However, the date on which the Code will come into effect has not been notified and the final rules/interpretation have not yet been issued. Thc Company will assess the impact of the Code when it comes into effect and will record any related impact in the period in which the Code becomes effective.
8. The Company operates in one single reportable business segment- "Pharmaceuticals".
9. The outbreak of COVID-19 in many countries has brought about disruptions to businesses around the world and uncertainty to the global economy, which had some impact on the Company's supply chain. The Company is closely monitoring the impact of the pandemic on all aspects of its business, including how it will impact its customers, employees, vendors and business partners. Based on the current estimates, the Company expects to fully recover the carrying amount of assets and does not foresee any impact on its operations. The Company will continue to closely monitor any material changes to f`uture economic conditions.
10. The previous periods numbers have been regrouped/rearranged wherever necessary to conform the current period presentation.
I I . The above Unaudited Financial Results of the Company are available on the Company's website www.glandpharma.com and also on the website of BSE (www.bseindia.com) and NSE (www.nseindia.com), where the shares of the Company are listed.
For and on behalf of the Board Gland Pharma Limited @ € m i w 1
\-\ARM §? 4 3 Q if '8 'pa *
Y_
' S ? , q 8 A 0 . \ * S r i n i v a s Sadu Managing Director and CEO
DIN No. 06900659 Hyderabad January 22, 202 I
\
Particulars per prospectus
purpose
Objects of the issue as Utilisation upto 31-Dec-20
Unutilised amounts as on 31-Dec-20
Funding incremental working capital requirement 7.695.00 1,68 l .00 6,014.00 Funding capital expenditure requirement 1,680.00 7.38 1,672.62 General corporate 2.864.68 840.04 2.024.64 Total 12,239.68 2,528.42 9,711.26
\*'[email protected]\°*§°00Y'P4
HYDERABAD
2ao*>»»w»°;,<>1 as * t~

Press Release
Gland Pharma’s Q3FY21 Revenue rises by 33% and Net Profit grew by 32%
Hyderabad, January 22, 2021: Gland Pharma limited (BSE: 543245 I NSE: GLAND), a generic injectablefocused pharmaceutical company, today announced its financial results for the quarter and nine monthsended December 31, 2020.
Commenting on the results, Mr. Srinivas Sadu, MD & CEO of Gland Pharma said “Our growth momentum hascontinued in the third quarter and we reported Revenue growth of 33% and Net Profit growth of 32% overthe corresponding quarter of the previous year. The business growth drivers were new product launches,geographic expansion of business and volume growth in existing portfolio, which is in line with our strategy.During the quarter, 12 ANDAs were filed from our sites and 6 ANDA approvals were obtained. We have alsofiled 1 DMF during the same period. Our success is predicated by our ability to deliver products withoutcompromising on the quality, safety, and customer satisfaction. We are committed to our objective ofbuilding a sustainable business model to achieve long term profitable growth.”
Financial summary:
(₹ in millions)
Particulars Q3FY21 Q3FY20 YoY growth 9MFY21 9MFY20 YoY growth
Revenue from operations 8,594 6,459 33% 25,751 19,980 29%
Total Income 8,945 6,712 33% 26,627 20,910 27%
EBITDA(1) 2,994 2,371 26% 10,621 8,086 31%
EBITDA Margin (%)(2) 33% 35% 40% 39%
PBT 2,732 2,072 32% 9,859 7,314 35%
PBT Margin (%) 31% 31% 37% 35%
PAT 2,041 1,541 32% 7,366 5,781 27%
PAT Margin (%) 23% 23% 28% 28%(1) EBITDA stands for earnings before interest, taxes, depreciation and amortisation which has been arrived at by adding finance expense,depreciation expense and total tax expense to the profit for the period.(2) EBITDA Margin= EBITDA/Total Income
Revenue from operations for the nine months ended December 31, 2020 grew by 29% as compared to thecorresponding period of previous year. The Company has maintained consistent and healthy margin profileand reported EBITDA margin of 40% and PAT margin of 28%. It has achieved a growth of 27% in PAT.
CLAND

Marketwise Revenue:(₹ in millions)
Particulars Q3FY21 Q3FY20 YoY growth 9MFY21 9MFY20 YoY growth
USA, Europe, Canada andAustralia (Core Markets) 6,021 4,853 24% 17,415 14,556 20%
India 1,495 1,193 25% 4,317 3,593 20%
Rest of the world 1,078 413 161% 4,019 1,831 119%
TOTAL 8,594 6,459 33% 25,751 19,980 29%
The Company witnessed a stable growth in USA and India markets during the quarter and nine months endedDecember 31, 2020. The Company has reported a strong growth in Rest of the world market driven by newpartnerships and increased penetration geographically. The Company has entered new markets likeSingapore, Israel, Armenia and Saudi Arabia.
Research and Development:
During the nine months ended December 31, 2020, the Company has filed 19 ANDAs, 5 DMFs and received24 ANDA approvals. The total R&D expense was ₹916 million as compared to ₹749 million during thecorresponding nine months of the previous year, which is at 4% of the Revenue. As on December 31, 2020,the Company has filed 282 ANDAs, out of which 226 were approved and 56 are pending approval. TheCompany has launched 41 products comprising of 23 molecules during the period.
Capex:
Total Capex incurred during the nine months ended December 31, 2020 was ₹1,826 million. The Companyis expanding its sterile injectable facility located in Hyderabad. It is also enhancing its production capacityfor both APIs and finished formulations in line with the planned launches.
CLAND

Earnings Call details:
The Company will conduct an earning’s call at 6.30 PM (IST) on January 22, 2021 to discuss the Company’sperformance and answer questions from participants. To participate in this conference call, please dial thenumbers provided below ten minutes ahead of the scheduled start time.
Universal Access +91 22 6280 1214Diamond pass link Click here to registerLocal Access Number (Available all over India) +91-7045671221
International Toll Number
USA +1 3233868721UK +44 2034785524Hong Kong +852 30186877Singapore +65 31575746
A replay of this call will also be available from the conclusion of the call till January 24, 2021 on +91 2271945757/ +91 22 66635757, Playback Code: 87917#. Audio record and Transcript of the conference call willbe uploaded on the Company’s website in due course.
About Gland Pharma Limited (BSE: 543245, NSE: GLAND)
Gland Pharma was established in 1978 in Hyderabad, has grown over the years from a contract manufacturerof small volume liquid parenteral products, to become one of the largest and fastest growing injectable-focused companies, with a global footprint across 60 countries, including the United States, Europe, Canada,Australia, India and other markets. It operates primarily under a business to business (B2B) model and havean excellent track record in the development, manufacturing and marketing of complex injectables. It has awide range of injectables, including vials, ampoules, pre-filled syringes, lyophilized vials, dry powders,infusions, oncology and ophthalmic solutions and also enjoys the distinction of having pioneered Heparintechnology in India.
Contacts:
Sampath Kumar Pallerlamudi Sumanta BajpayeeCompany Secretary and Compliance Officer Vice President – Investor [email protected] [email protected]
This press release may include statements of future expectations and other forward-looking statements based onmanagement's current expectations and beliefs. Actual results may vary materially from those expressed or implied bythe statements herein due to changes in economic, business, competitive, technological and/or regulatory factors.Gland Pharma Limited, its directors and any of the affiliates or employee is under no obligation to, and expressly assumeany obligation to update any particular forward-looking statement contained in this release.
CLAND
22nd January 2021
Financial Results
Q3 & 9M FY21
Gland Pharma Limited
GLAND

2
Safe Harbor Statement
The Presentation is to provide the general background information about the Company’s activities as at the date of
the Presentation. The information contained herein is for general information purposes only and based on estimates
and should not be considered as a recommendation that any investor should subscribe / purchase the company
shares.
This presentation may include certain “forward looking statements”. These statements are based on current
expectations, forecasts and assumptions that are subject to risks and uncertainties which could cause actual
outcomes and results to differ materially from these statements. Important factors that could cause actual results to
differ materially from our expectations include, amongst others general economic and business conditions in India
and any other country, ability to successfully implement our strategy, our research and development efforts, our
growth and expansion plans and technological changes, changes in the value of the Rupee and other currencies,
changes in the Indian and international interest rates, change in laws and regulations that apply to the Indian and
global pharmaceuticals industries, increasing competition, changes in political conditions in India or any other country
and changes in the foreign exchange control regulations in India. Neither the company, nor its directors and any of
the affiliates or employee have any obligation to update or otherwise revise any forward-looking statements. The
readers may use their own judgment and are advised to make their own calculations before deciding on any matter
based on the information given herein.
No part of this presentation may be reproduced, quoted or circulated without prior written approval from Gland
Pharma Limited.
I
GLAND

3
Financial Highlights (1/3)
Resilient growth across all financial metrics
Note: (1) EBITDA stands for earnings before interest, taxes, depreciation and amortisation which has been arrived at by adding finance expense, depreciation expense and total tax expense to the profit for the period (2) EBITDA margin = EBITDA / Total Income; (3) PAT margin = Profit for the period / Total Income
Revenue from Operations(INR Mn)
EBITDA (1) / EBITDA Margin (2)
(INR Mn / %)
PAT / PAT Margin (3)
(INR Mn / %)
R&D Expenses / R&D (% of Revenue)(INR Mn / %)
6,459
8,594
Q3 FY20 Q3 FY21
19,980
25,751
9M FY20 9M FY21
312
434
Q3 FY20 Q3 FY21
5% 5%
749
916
9M FY20 9M FY21
4% 4%
2,371
2,994
Q3 FY20 Q3 FY21
35% 33%
8,086
10,621
9M FY20 9M FY21
39%40%
1,541 2,041
Q3 FY20 Q3 FY21
23% 23%
5,781
7,366
9M FY20 9M FY21
28% 28%
33°/o Y 29°/° r 26°/° r 31°/o Y
I I I | I I I I I I I I
32°/0 27°/° v
I I
39°/0 r
22°/o
I
r
I
GLAND

4
Net Worth (1)
(INR Mn)
Cash and Bank Balances / Net Cash (2)
(INR Mn)
Note: (1) Net Worth refers to sum of equity share capital and other equity. (2) Net Cash refers to Cash and Bank Balances less Non-current borrowings (including current maturities). (3) Net Working Capital refers to Current assets (excluding cash and bank balances) less Current liabilities.
Financial Highlights (2/3)
Net Working Capital (3)
(INR Mn)
Capital Expenditure(INR Mn)
1,342
1,826
9M FY20 9M FY21
11,621
15,357
Mar'20 Dec'20
Strong balance sheet and cash position
13,252
28,169
13,202
28,128
Mar'20 Dec'20
Total Cash Net Cash
36,462
43,943
12,278
Mar'20 Dec'20
Networth Fresh issue of equity
56,221
I I I I I I
GLAND

5
Note: (1) Asset Turnover is calculated as Total Income for the period divided by total assets on the last day of the period; (2) Fixed Asset Turnover is calculated as Total Income for the period divided by total fixed assets (Property, plant and equipment on the last day of the period + Right-of-use assets +
Capital work in progress on the last day of the period; (3) Return on Capital Employed (ROCE) = Profit for the period / Capital Employed on the last day of the period. Capital Employed represents Total Assets – Current Liabilities; (4) Return on Net Worth (RONW) = Profit for the period / Net Worth on the
last day of the period. Net Worth represents sum of equity share capital and other equity; (5) COGS means cost of goods sold includes cost of materials consumed, purchases of traded goods, change in inventories of finished goods, traded goods and work-in-progress and manufacturing overheads (6)
Receivable days calculated as current trade receivables as on balance sheet date divided by revenue from operations * over 270 / 365 days, inventory days calculated as inventory as on balance sheet date divided by COGS* over 270 / 365 days, & payable days calculated as trade payable as on
balance sheet date divided by COGS* over 270 / 365 days. CCC calculated as Receivable days + Inventory days - Payable days
Financial Highlights (3/3)
Asset Turnover Ratio (1)(2)
Cash Conversion Cycle (CCC) (5)(6)
(# of Days)
ROCE (3) / RONW (4)
(Annualised %)
Capital efficient business with healthy return on capital
0.7
2.5
0.6
2.8
Total Asset Turnover Fixed Asset Turnover
9M FY20 9M FY21
267
92
131
228
174
83 57
200 232
6782
217
Inventory days Receivable days Payable days Cash conversion cycle
FY19 FY20 9M FY21
Cash Flow from Operations (INR Mn)
4,244 4,056
9M FY20 9M FY21
21.8%17.2%
22.3%17.5%
31.6% 34.0%
9M FY20 9M FY21
I
o
I I
-o-Ro4IIE»casm -l-RDCE -in-Runw
I I I
GLAND

6
P&L Highlights
Amount in INR Mn Q3 FY21 Q3 FY20YoY
growth9M FY21 9M FY20
YoY
growthQ2 FY21
Revenue from operations 8,594 6,459 33.1% 25,751 19,980 28.9% 8,315
Other Income 351 253 38.9% 876 930 -5.8% 204
Total income 8,945 6,712 33.3% 26,627 20,910 27.3% 8,519
Gross Margin(1) 4,525 3,685 22.8% 14,748 11,515 28.1% 4,580
% margin 52.7% 57.0% 57.3% 57.6% 55.1%
EBITDA(2) 2,994 2,371 26.3% 10,621 8,086 31.4% 3,181
% margin(3) 33.5% 35.3% 39.9% 38.7% 37.3%
PBT 2,732 2,072 31.9% 9,859 7,314 34.8% 2,926
% margin 30.5% 30.9% 37.0% 35.0% 34.4%
PAT 2,041 1,541 32.4% 7,366 5,781(4) 27.4% 2,189
% margin 22.8% 23.0% 27.7% 27.6% 25.7%
Note: (1) Gross Margin = Revenue from Operations – Materials consumed; (2) EBITDA stands for earnings before interest, taxes, depreciation and amortisation which has been arrived at by adding finance expense, depreciation expense and total tax expense to the profit for the period; (3) EBITDA margin = EBITDA / Total Income; (4) In Sep 2019 ,Government of India announced the new Income tax rate. In Q2 FY20 the income tax rate of the company was changed from 34.94% to 25.17% and due to that there was one time impact in Deferred Tax amounting to INR 324 Mn in 9M FY20
I
GLAND

7
USA, Europe, Canada and Australia (Core Markets)
9M FY21: Rs. 17,415 Mn
YoY Growth: 20%
Core Markets (1)
Revenue Contribution
61%
7%
9M
FY21
Revenue:
Growth observed on account of new launches, supported
by volume growth in existing portfolio with ramping up of
capacities
New launches:
Q3 FY21: 6 Product SKUs (4 molecules)
9M FY21: 31 Product SKUs (19 molecules)
US filings update:
As of December 31, 2020, we along with our partners had
282 ANDA filings in the United States, of which 226 were
approved and 56 pending approval.
Note: ANDA count includes technology transfer ANDAs (1) Core markets includes USA, Europe, Canada and Australia (2) Includes 5 tentative approvals
Q3 FY21: Rs. 6,021 Mn
YoY Growth: 24%
USA Europe, Canada and Australia
Q3 FY21 9M FY21
ANDA Filed 12 19
ANDA Approved 6 24(2)
DMFs Filed 1 5 66%7%
9M
FY20
IL )L )
GLAND
8
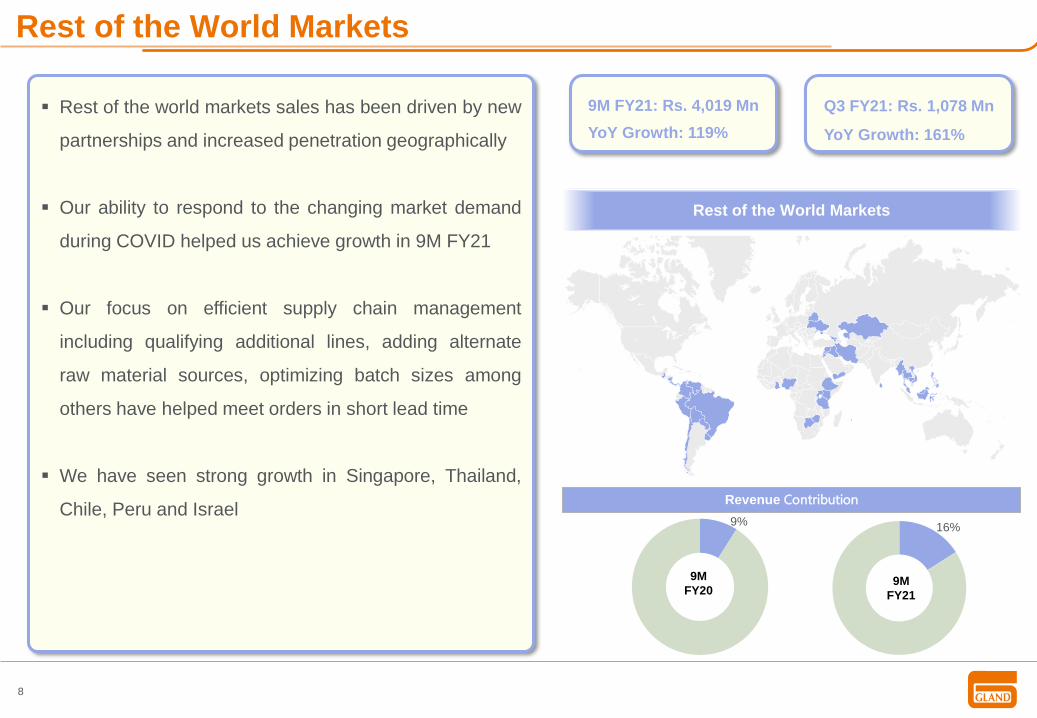
Rest of the World Markets
Rest of the World Markets
Rest of the world markets sales has been driven by new
partnerships and increased penetration geographically
Our ability to respond to the changing market demand
during COVID helped us achieve growth in 9M FY21
Our focus on efficient supply chain management
including qualifying additional lines, adding alternate
raw material sources, optimizing batch sizes among
others have helped meet orders in short lead time
We have seen strong growth in Singapore, Thailand,
Chile, Peru and IsraelRevenue Contribution
16%
9M
FY21
9M FY21: Rs. 4,019 Mn
YoY Growth: 119%
Q3 FY21: Rs. 1,078 Mn
YoY Growth: 161%
9%
9M
FY20
L lL )
GLAND

9
Domestic Market
Domestic Indian Market
Domestic markets sales growth has been driven by
strong demand of core product portfolio
Commissioning of new Pre-filled syringe line at
Pashamylaram facility helped increase volumes for
domestic market
We also initiated manufacturing of Remdesivir for the
domestic market from Pashamylaram facility
New launches:
Q3 FY21: 4 Product SKUs (2 molecules)
9M FY21: 10 Product SKUs (4 molecules)
Revenue Contribution
17%
9M
FY21
9M FY21: Rs. 4,317 Mn
YoY Growth: 20%
Q3 FY21: Rs. 1,495 Mn
YoY Growth: 25%
18%
9M
FY20
L )L )
GLAND
10
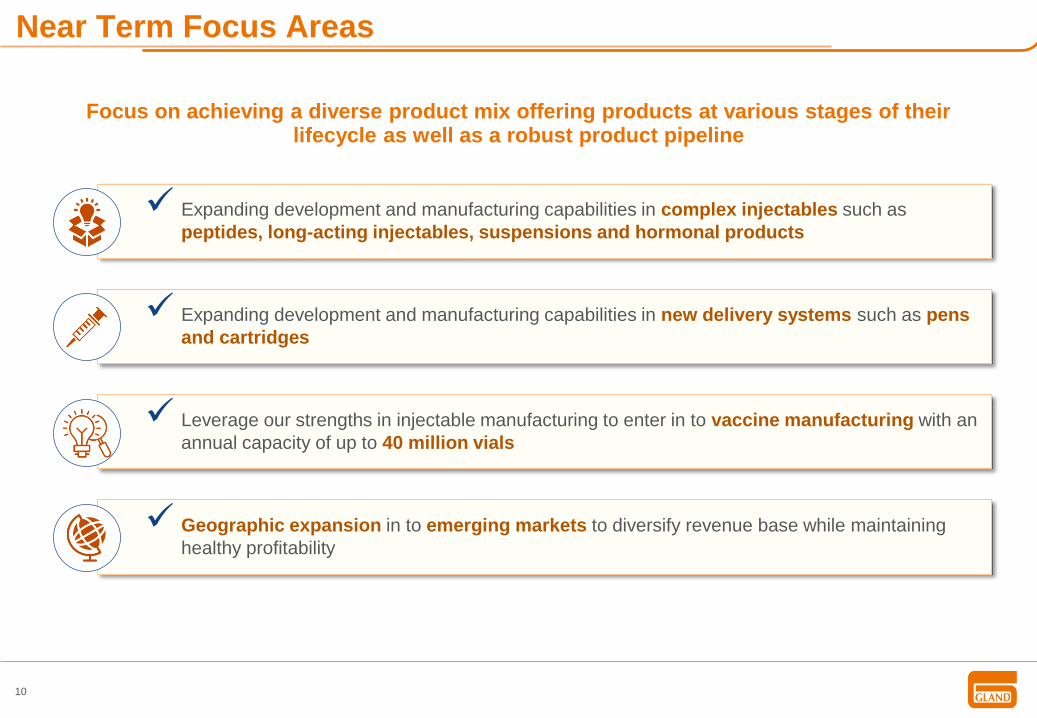
Near Term Focus Areas
Expanding development and manufacturing capabilities in complex injectables such as
peptides, long-acting injectables, suspensions and hormonal products
Expanding development and manufacturing capabilities in new delivery systems such as pens
and cartridges
Leverage our strengths in injectable manufacturing to enter in to vaccine manufacturing with an
annual capacity of up to 40 million vials
Geographic expansion in to emerging markets to diversify revenue base while maintaining
healthy profitability
Focus on achieving a diverse product mix offering products at various stages of their lifecycle as well as a robust product pipeline
I
#49
\ l I
\ | I
GLAND
Investor Presentation
GLAND

12
Centralized R&D
Laboratory with Team of
~265 Personnel
Portfolio of Injectable
Products Across
Therapeutic Areas and
Delivery Systems
FY15 – 20 (3):Revenue CAGR: 21.3%
PAT CAGR:29.9%
EBITDA margin(4)(5)
FY20 (3): 39.5% | 9M FY21:
39.9%
PAT margin(5)
FY20: 27.9% | 9M FY21: 27.7%
Wide Portfolio of Complex Products Supported
by Internal R&D
Extensive and Vertically Integrated
Injectables Manufacturing Capabilities
Consistent Compliance Track Record with
Range of Regulatory Regimes
Diversified B2B-led Model Across Markets
Complemented by a Targeted B2C Model in India
Track Record of Growth and Profitability
from a Diversified Revenue Base
Snapshot
Note: (1) As of December 31, 2020. (2) Filed by Gland Pharma, along with partners. (3) Based on Financial Information prepared in accordance with Ind AS (4) EBITDA stands for earnings before interest, taxes, depreciation and amortization which has been arrived at by adding finance expense, depreciation expense, exceptional items and total tax expense to the profit for the year or period. (5) EBITDA margin = EBITDA / Total Income; PAT margin = PAT / Total Income.
Greater Control Over
Manufacturing Processes
7 Manufacturing
Facilities –
4 Finished Formulation
and 3 API
282 ANDA Filings in
the US (1) (2):
226 Approved; 56
Pending Approval
No Warning Letters
from USFDA Since
Inception of Each
Facility
Exports to Over 60
Countries(1)
Successful Track
Record of Operating
B2B Model with Leading
Pharma Companies
74 N
®
r L it:
@
GLAND

13
Journey
1978 2003
2000
2016
2010 2014
2017 201920182007
2004-05
Land leased at
Vishakhapatnam SEZ on
which Oncology facility
and API facilities situated
Set up In-house R&D
facility at Dundigal,
Hyderabad
Incorporation
by P.V.N. Raju
Received USFDA
approval for the
manufacturing
facility at Dundigal
USFDA and EU
approval for
Oncology plant,
Vishakhapatnam
SEZ
Filed first ANDA
from Penems
facility
USFDA approval for facilities at
Visakhapatnam, Visakhapatnam
SEZ and the manufacturing
facility at Pashamylaram
Commenced commercial sales in
the US from Pashamylaram
facility
Capital infusion of
~₹1,000 million pursuant
to PE investment
Launched Heparin
Sodium Injection
in the US
Launch of Enoxaparin Sodium
Injection (Cutenox) in India
and Rest of the world markets
BGV Hamburg
(Germany)
approval for
Dundigal facility
PE investment of US$
200mn from KKR
Fosun Singapore
acquired 74%
stake
Received ANDA approval for Enoxaparin Sodium Injection USP
Received ANDA approval for first Ophthalmic product
2012
Commissioned
Pashamylaram unit
First filing with
National Medical
Products
Administration,
China, and received
clinical waiver for
Dexrazoxane
Commission of Asset Investor / Capital Infusion Launch / Filings
2020
Listed on Indian
stock exchanges,
NSE & BSE
First OTC launch in
US market for
Olopatadine
ophthalmic solution
.-.-'
lllllllllll lllllllllll lllllllllll
GLAND

14
Business Overview
Extensive and Vertically Integrated Manufacturing Capabilities With Consistent Compliance Track Record
Note: (1) As of December 31, 2020.
3 API facilities provide in-house
manufacturing capabilities for
critical APIs, thereby
• Controlling costs and quality, and
• Mitigating supply chain related
risks around key product
Quality Assurance and Quality ControlConsistent Compliance Track Record
• No USFDA warnings letters since inception of each facility
• Certified as GMP compliant at all manufacturing facilities by the
USFDA
• Certain facilities certified by the MHRA (UK), ANVISA (Brazil),
AGES (Austria), TGA (Australia) and BGV Hamburg (Germany)
• Team of 1,165 full-time employees, 29.95% of total employees(1)
• Regular quality management reviews
• 35+ audits per year on average, including customer audits and
regulatory agency audits
• GMP certifications for facilities
7 Facilities
4 Finished
Formulation Facilities
767 million units
&3 API Facilities
11,000 kg / year and
R&D Pilot Plant
Dundigal, Hyderabad
• Sterile Injectables Facility
(Flagship)
• API Facility
Pashamylaram, Hyderabad
• Sterile Injectables Facility
• Penems Facility
Vishakhapatnam
• Oncology Facility
• 2 API Facilities
I
I
J
GLAND

15
Business Overview (Cont’d)
Diversified B2B-led Model Across Markets Complemented by B2C Model in India
Note: (1) As per IQVIA Report. (2) Reflects typical features of such business models in regulated markets.
B2B (Global) B2C (India)
B2B – IP LedB2B Tech Transfer B2B CMO B2C
Own Filing Partner Filing
Overview
• Out-license to Marketing partners
• Long term product supply contracts
• Co-development with Partner
• Manufacturing by Gland
• Fill and finish service
• Loan and license
agreements
• Direct marketing of products
Revenue Model
• License and milestone payments
• Selling price per unit dose + Profit Share
• Tech transfer fee
• Selling price per unit dose +
Royalty
• Fixed per unit price • Direct sale of products
ANDA Ownership(2)
IP Ownership(2)
Co-owned
• Operating in 60+ countries as of December 31, 2020
• One of the fastest growing generic injectables-focused companies by revenue in the US from 2014 to 2019 (1)
• Successful track record of operating B2B model with leading companies, complemented by a B2C model in home market of India leveraging brand strength
and sales network
Grow market share while reducing the marketing
investments
Leverage reputation of
marketing partners
Build reputation as a
complex injectables manufacturer with compliance record
Advantages
of B2B
models
Drive profitability with
higher capacity utilization
I
1'm J
GLAND

16
Extensive Portfolio of Complex Products Internal R&D & Regulatory Capabilities
Business Overview (Cont’d)
Present in sterile injectables, oncology and ophthalmics, and focus
on complex injectables, NCE-1s, First-to-File products and
505(b)(2) filings
Delivery Systems:
• Liquid vials
• Lyophilized vials
• Pre-filled syringes
• Ampoules
• Bags
• Drops
• Anti-diabetic
• Anti-infectives
• Anti-malarials
• Anti-neoplastics
(Oncology)
• Blood-related
• Cardiac
• Gastro-intestinal
• Hormones
• Neurological and Central
Nervous System
• Ophthalmics and Otologicals
• Pain, neuro-muscular
blocking agents & analgesics
• Respiratory
• Vitamins, minerals &
nutrients
Therapeutic Areas:
Centralized R&D Laboratory located at Dundigal, Hyderabad
facility, with supporting personnel at each manufacturing facility
~265 personnel team including PhDs, pharmacy post
graduates and chemists
Plan to set up a new R&D building at Pashamylaram,
Hyderabad
R&D expertise supports regulatory filings globally
Regulatory Track Record
• 282 ANDA Filings in US – 226 approved; 56 pending (1)
Of 282, 113 owned by Gland Pharma out of which
79 are approved and 34 are pending for approval
204 for sterile injectables, 51 for oncology and 27
for ophthalmics related products
• 1,478 product registrations globally, of which 387 in
United States, Europe, Canada and Australia, 69 in
India and 1022 in Rest of the world (1)
Note: (1) As of December 31, 2020; refer to ANDA filings by Gland Pharma, along with partners.
I
kg J
GLAND
17
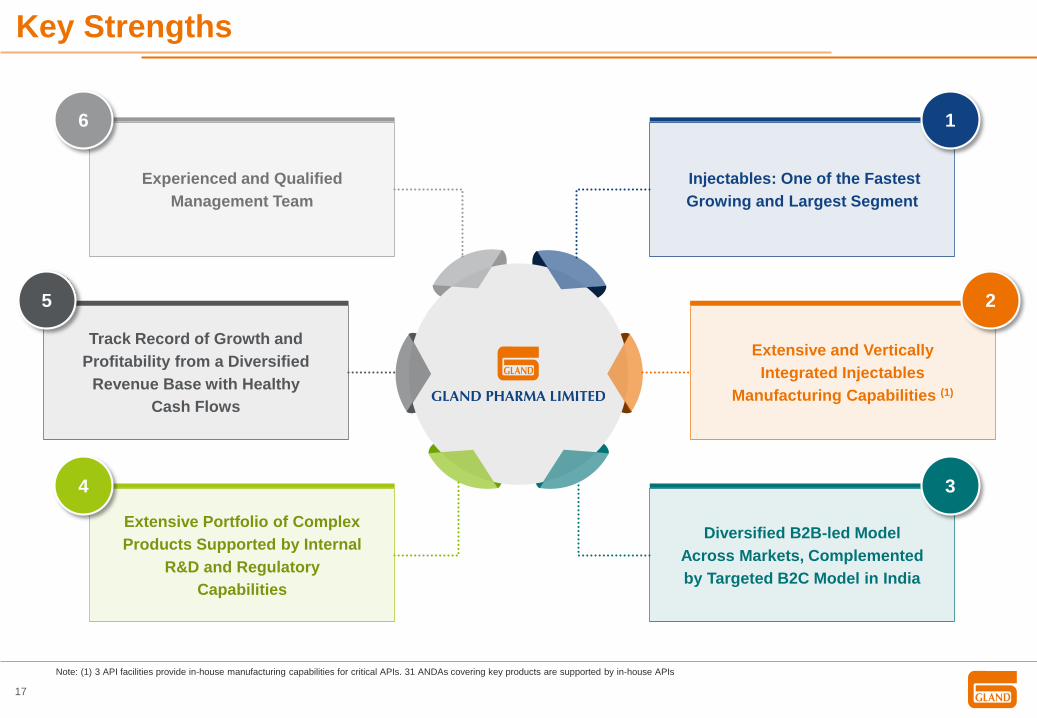
Key Strengths
Track Record of Growth and
Profitability from a Diversified
Revenue Base with Healthy
Cash Flows
Extensive Portfolio of Complex
Products Supported by Internal
R&D and Regulatory
Capabilities
Experienced and Qualified
Management Team
Injectables: One of the Fastest
Growing and Largest Segment
Extensive and Vertically
Integrated Injectables
Manufacturing Capabilities (1)
Diversified B2B-led Model
Across Markets, Complemented
by Targeted B2C Model in India
1
2
34
5
6
Note: (1) 3 API facilities provide in-house manufacturing capabilities for critical APIs. 31 ANDAs covering key products are supported by in-house APIs
J . . . . . . . . . . . . . . . . . . . . . . . . . . . . . . . . . . .
1 4
. . . . . . . . . . . CLAND
GLAND PHARMA LIMITED
. . . . . . . . . . .
_ - -
. . . . . . . . . . . . . . . . . . . . . . . . . . . . . . . . . .
GLAND

18
Injectables: One of the Largest and Fastest Growing Segment
Growth
Opportunity
Injectable formulations is the fastest growing segment in global pharmaceuticals, recording a 2014-2019 CAGR of
10.1% vs overall pharma market at 5.8%
Global generic injectables market is estimated at c.US$131bn growing at a 2014-19 CAGR of c. 8%
US the largest market (i.e. c. 33-34% of market) is expected to grow at a c.16% CAGR from 2019-2024E
c.US$61.3bn in injectable brand sales expected to lose patent protection between 2020-24 (vs c. US$33bn in sales which
lost patent protection lost between 2014-19)
1
Growth Drivers for
Injectables
Rising prevalence of chronic diseases
Convenience and benefits of New Drug Delivery Systems (“NDDS”)
New market opportunities
Drug shortages in the US – from 2014 to 2019 c. 40-60% of the shortages have been in injectables space
2
Market Entry
Barriers
High capital investments
Manufacturing complexities to meet stringent quality standards
High level of compliance and regulatory requirements
Consolidation trend expected to favour established players
3
Source: IQVIA Report.
I
GLAND

19
Generic Injectables: Growth Opportunity
412 490
267432147
174826
1,096
2014 2019
Oral Solids Injectable Others
Sizeable Injectable Market … … Growing Faster than Broader Market … with Robust Growth in Generics
267
432
2014 2019
Global Injectable Market
Injectable is a >US$400bn market Injectable recorded CAGR of 10.1% vs broader
market at 5.8% Key injectable markets like US, Europe and India
demonstrated double digit / high single digit growth
Significant increase in value of injectable brand sales
scheduled to lose exclusivity c.40-60% of US drug shortages are in injectables Convenience and benefits of New Drug Delivery
Systems driving growth across delivery formats
32% 39%
3%
10%
4%
(US$bn)
14-19
CAGR
Global Pharma – Drug Delivery Mix Geographic Mix- Generic Injectable
2546
18
2914
20 30
34
1
2
89
131
2014 2019
North America Europe China India
6%
10%
13%
(US$bn)
3%
9%
8%
c.10% CAGR
LoE Offering Significant Opportunity Demand Driven by Drug Shortages Accessibility and Ease of Use
83 64 97 85 102 65
10278 57 61
84101
2014 2015 2016 2017 2018 2019
Injectables Non-Injectables
(#)
45% 45% 63% 58% 55% 39%(% Injectables
Share)
Global Injectable Market
33
61
2014-19 2019-24
Loss of Exclusivity – Injectables
(US$bn)
826 1,096Global Pharma
Market Size
(US$bn) 6%
Source: IQVIA Report.Note: MAT September 2014-2019. (1) Generic Injectable market share as a percentage of overall injectable market in the respective country.
US$131bn Market with Multiple Growth Levers Driven by LoEs, Opportunity from Shortages and Ease of Use
14-19
CAGR
81 13867
13177
9742
66267
432
2014 2019
Infusions Pre-filled Syringes Vials Others
5%
15%
11%
(US$bn)
10%
10%
14-19
CAGR
I
( )
V ( )
-> . . . . . . . .
. . . . . . . .
CC
)
)))) of
I
e 0 _ 0 0
( J
GLAND
20
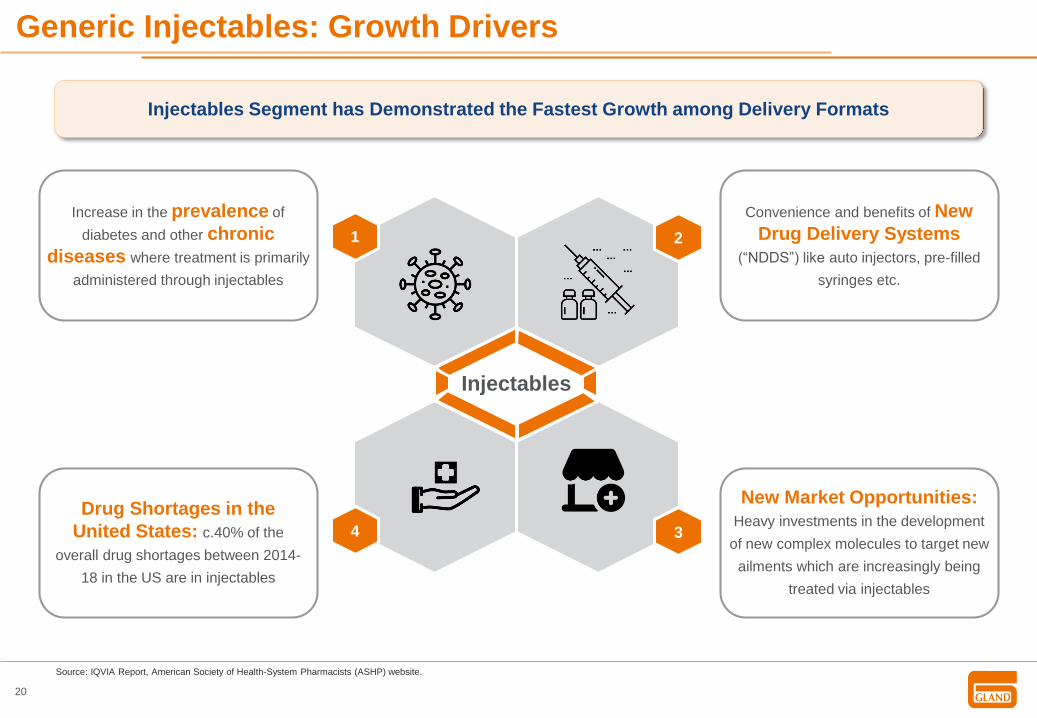
Generic Injectables: Growth Drivers
Increase in the prevalence of
diabetes and other chronic
diseases where treatment is primarily
administered through injectables
Convenience and benefits of New
Drug Delivery Systems
(“NDDS”) like auto injectors, pre-filled
syringes etc.
Drug Shortages in the
United States: c.40% of the
overall drug shortages between 2014-
18 in the US are in injectables
New Market Opportunities:
Heavy investments in the development
of new complex molecules to target new
ailments which are increasingly being
treated via injectables
1 2
Injectables
4 3
Injectables Segment has Demonstrated the Fastest Growth among Delivery Formats
Source: IQVIA Report, American Society of Health-System Pharmacists (ASHP) website.
° d P O
.LG
GLAND

21
Generic Injectables: Market Entry Barriers
Stringent Quality Requirements
c.62% of drugs in shortage are associated with
manufacturing or product quality problems
Significant Capital Investments
Injectable plants require 1.3x - 1.5x more capex
vs oral solids plants due to requirements of
sterilisation and/or aseptic manufacturing
For the US Generic Injectables Market, c.70% of the Market by Value has
Less than Half the Number of Manufacturers Compared to the Oral Solids Segment
Manufacturing Complexities to Meet
Stringent Quality Standards
Complexities involving sterilisation, packaging,
sterile fill/finish, with stability assessment at each
stage, among others
High Level of Compliance and
Regulatory Requirements
High level of regulatory enforcement of cGMP
standards
Source: IQVIA Report.
GLAND
GLAND
22
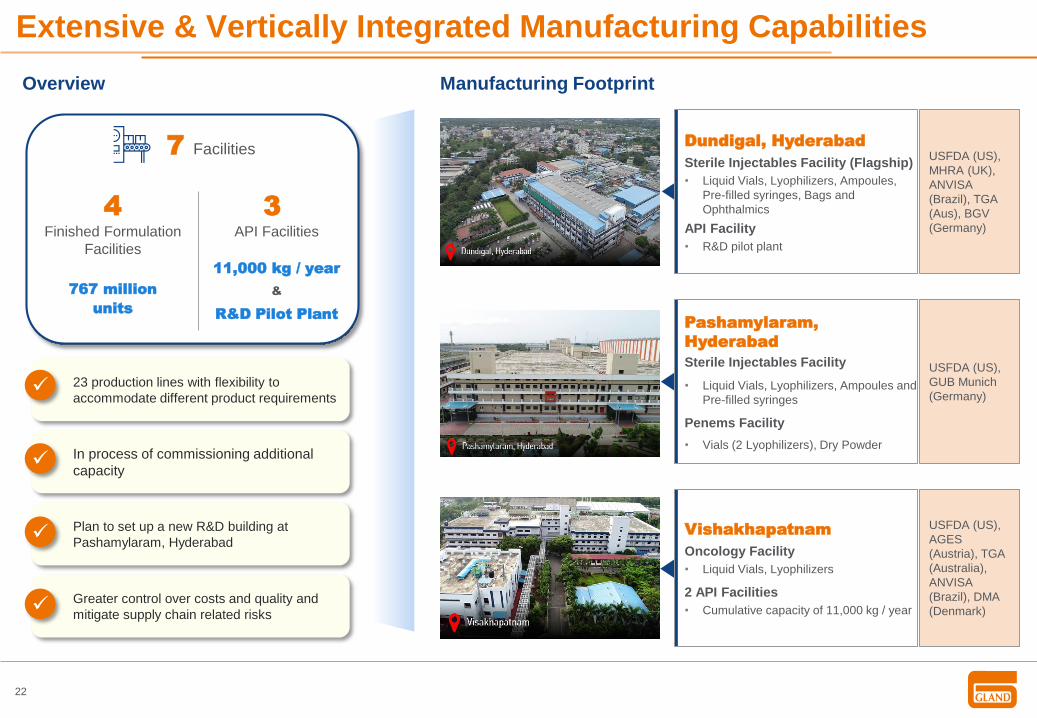
Dundigal, Hyderabad
Sterile Injectables Facility (Flagship)
• Liquid Vials, Lyophilizers, Ampoules,
Pre-filled syringes, Bags and
Ophthalmics
API Facility
• R&D pilot plant
Pashamylaram,
Hyderabad
Sterile Injectables Facility
• Liquid Vials, Lyophilizers, Ampoules and
Pre-filled syringes
Penems Facility
• Vials (2 Lyophilizers), Dry Powder
Vishakhapatnam
Oncology Facility
• Liquid Vials, Lyophilizers
2 API Facilities
• Cumulative capacity of 11,000 kg / year
Manufacturing Footprint
USFDA (US),
MHRA (UK),
ANVISA
(Brazil), TGA
(Aus), BGV
(Germany)
USFDA (US),
GUB Munich
(Germany)
USFDA (US),
AGES
(Austria), TGA
(Australia),
ANVISA
(Brazil), DMA
(Denmark)
Overview
23 production lines with flexibility to
accommodate different product requirements
Plan to set up a new R&D building at
Pashamylaram, Hyderabad
In process of commissioning additional
capacity
7 Facilities
4Finished Formulation
Facilities
3API Facilities
767 million
units
11,000 kg / year
R&D Pilot Plant
&
Extensive & Vertically Integrated Manufacturing Capabilities
Greater control over costs and quality and
mitigate supply chain related risks
'I
. . . . . . . . . . . . . . . . . . . . . . . . . . . . . . . . . . . . . . . . . . . . . . . . . . . . . . .
"\ IL
"\
I
I
l 52: I smut__
ill
IN
4
'n
GLAND

23
1,165 fulltime employees in
Quality Control and
Quality Assurance (2)
29.95% of the workforce in
Quality Control and
Quality Assurance (2)
35+ audits on average
per year, including
customer audit and
regulatory agency
audit
Consistent Regulatory Compliance Track Record
Note: (1) 3 ISO certifications as of December 31, 2020 for quality management, environment management and occupational health and safety management systems applicable to design, development and production of pharmaceuticals and contract manufacture of small volume parenterals. (2) As of December 31, 2020.
No warning letters
from USFDA (whether
as a result of facility
inspection or otherwise)
since inception of each
facility
All facilities Certified
GMP compliant by
USFDA, and certain
facilities by MHRA (UK),
ANVISA (Brazil), AGES
(Austria), TGA
(Australia) and BGV
Hamburg (Germany)
WHO GMP
certifications from the
Drugs Control
Administration
(Governments of
Telangana and Andhra
Pradesh, India) (DCA)
3 ISO certifications as
of December 31, 2020 (1)
Focus on Quality Control
Highlights
Quality Standards throughout the business units
and facilities
Quality
Improvement
Corporate Quality
Establishment Quality Audits
Laboratory Information
Management System
software for quality
control at all
manufacturing locations
Corporate reporting
structure for
identifying and
developing standard
operating procedures
Conduct internal audits
across all facilities on a
quarterly basis
l!!l
"1 I 1 1 II* \ _
I i
GLAND

24
Diversified Business Model with Focus on Growth & Stability
B2B (c.96% of FY20 Revenue) B2C (c.4% of FY20 Revenue)
B2B – IP LedB2B Tech Transfer B2B CMO B2C
Own Filing Partner Filing
Overview• Out-license to marketing partners
• Long term product supply contracts
• Co-development with Partner
• Manufacturing by Gland
• Fill and finish service
• Loan and license agreements
• Direct marketing of products
Revenue Model
• License and milestone payments
• Selling price per unit dose + Profit Share
• Tech transfer fee
• Selling price per unit dose +
Royalties
• Fixed per unit price • Direct sale of products
ANDA Ownership (1)
Development (1)
IP Ownership (1) Co-owned
Marketing Rights (1)
Royalty / Profit
Sharing (1) Not Applicable
Key Markets
Select Clients /
Partners
• Global Pharma Companies • Indian Pharma Companies • c.2,000 corporate hospitals,
nursing homes & govt. facilities
(2)
Diversified B2B-led Model Across Markets, Complemented by a Targeted B2C Model in India
Note: (1). Information reflects typical features of the respective business models in regulated markets. (2). Exhibit batches and stability studies are performed by Gland.
um @
0 ® w (QD
0 (4
ca#
4 4 [lb
O
(E
) ®
l~w
®
4@ .al @ T
GLAND

25
Gland’s B2B Model: Salient Features
Steady / Predictable Cash Flow
Long-term supply contracts with marketing partners
ranging from 3-5 years
Stronger partnerships due to lack of injectables
manufacturers with good regulatory track record
Products licensed to marketing partners strong in
particular therapeutic areas resulting in higher
market share Better Operating Profits
Efficient cost profile due to relatively lower SG&A vs
B2C players
Economies of Scale
Due to differentiated B2B Model, Gland can derive
scale benefit at a product as well as formulation level
Reduce risk by partnering with a marketing partner
to cover R&D litigation expenses
Lower R&D Litigation Risks
IP-led model helps generate revenue from transfer
pricing and profit sharing
Lower RM1 / Formulation Pricing Risk
Revenues and profits through transfer pricing are
immune to raw material price fluctuations
Lower requirements due to better inventory
management, planned payables and better visibility
on receivables
Lower Working Capital Requirement
15.4%
3.4%
Gland B2C Players
Revenue Growth: 2014-19
58.1%40.1%
Gland B2C Players
Gross Margins: 2019
Advantages Include Stable Cash Flows, Better Profitability Profile, Margin Stability from Natural
Hedge Against Raw Material Pricing and End-formulation Pricing Fluctuations
Source: IQVIA Report.Note: (1) RM – Raw Material.
Gland has Demonstrated Faster Revenue Growth in Last 5 Years While Generating Superior Margins vs B2C and B2B Players
Transfer pricing also helps regulate any adverse
impact from price erosion in end-formulations, as it
gets restricted to the profit share component
I l l I \ /
GLAND

26
Complex Product Portfolio Supported by Strong R&D…
Right Capability Matrix in Products and Delivery Systems
Present in:
Oncology
Ophthalmics and
Otologicals
Blood-related
Neurological and
Central Nervous
System
Pain, neuro-muscular
agents and
analgesics
Focused on:
Complex
injectables
NCE-1s
First-to-File
products
505(b)(2) filings
Expanding
capabilities in:
Peptides
Long-acting
injectables
Suspensions
Hormonal products
Expanding in new
delivery systems:
Pens
Cartridges
Expertise in
synthesis of
complex drug
molecules:
Low Molecular
Weight Heparins
Steroids
Cytotoxics
Centralized R&D team of c.265 members including PhDs, pharmacy post
graduates and chemists
Significant R&D Investment
Track record of coming up with new complex products
Translating into Revenue From New Launches
615
966 922
FY18 FY19 FY20
Total R&D expenditure (₹mn)
3.8% 4.7% 3.5%
R&D expenditure as % of revenue from operations
3,4932,717 2,292
FY18 FY19 FY20
Revenue from new product launch (₹mn)
22% 13% 9%
As % of revenue from operations
45 51
# products launched
Key products
include:
Cis-Atracurium
Besylate
Enoxaparin Sodium
Heparin Sodium
Rocuronium
Bromide
I
_ .
K 4 v l - _ . *
r r
'L
GLAND

27
…Supported by Proven Regulatory Capabilities
Geographic Breakdown
(FY20)
US67%
India18%
Europe4%
Canada2%
Australia1%
RoW9%
Extensive experience in regulatory requirements of key markets to
facilitate new product registrations
Global Platform of Approved and Filed Registrations
Constantly engaged with regulators including the USFDA
Successful track record and pipeline
79
34
113
147
22
169
22656 282
Approved Pending Total
Owned Partner Owned
387
69
1022
US, Canada,Europe, Australia
India RoW
Total 1,478 Product Registrations Globally1
Total 282 ANDAs (1)
Revenue
from
operations
₹26bn
35%
65%
39%
61%
Product Development Capabilities Supported by Regulatory Expertise and Track Record in Filing and
Approval of Large Number of Product Registrations
Established Expertise
Broad Range of Filings
Different jurisdictions
Diverse dosage forms
ANDA filings for sterile
injectables (204), oncology
(51), ophthalmics (27)
Supportive filings to drive
sustainability
Undertaking CBE filings for
site and line changes
Timely filing of applications
like CBE/PAS for alternate
APIs and components
Note: (1) Information in relation to the product filings and registration is as on December 31, 2020.
I
I
.lllllllll
. _|
_ GLAND
28
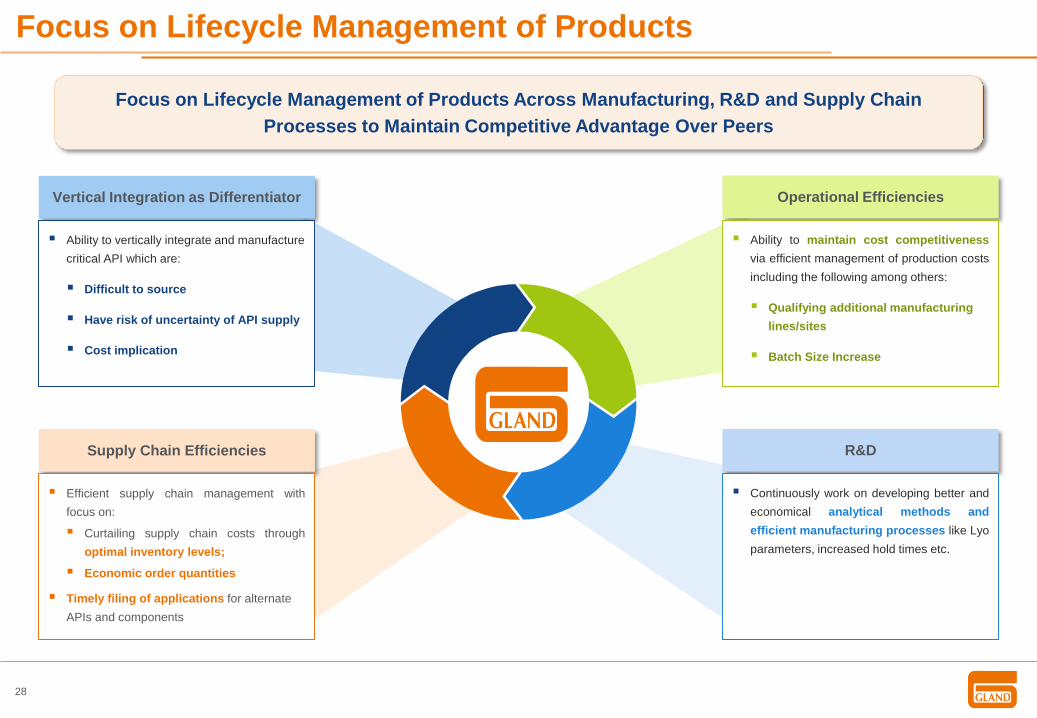
Focus on Lifecycle Management of Products
Vertical Integration as Differentiator
Ability to vertically integrate and manufacture
critical API which are:
Difficult to source
Have risk of uncertainty of API supply
Cost implication
Supply Chain Efficiencies
Efficient supply chain management with
focus on:
Curtailing supply chain costs through
optimal inventory levels;
Economic order quantities
Timely filing of applications for alternate
APIs and components
Operational Efficiencies
Ability to maintain cost competitiveness
via efficient management of production costs
including the following among others:
Qualifying additional manufacturing
lines/sites
Batch Size Increase
R&D
Continuously work on developing better and
economical analytical methods and
efficient manufacturing processes like Lyo
parameters, increased hold times etc.
Focus on Lifecycle Management of Products Across Manufacturing, R&D and Supply Chain
Processes to Maintain Competitive Advantage Over PeersI
GLAND
29
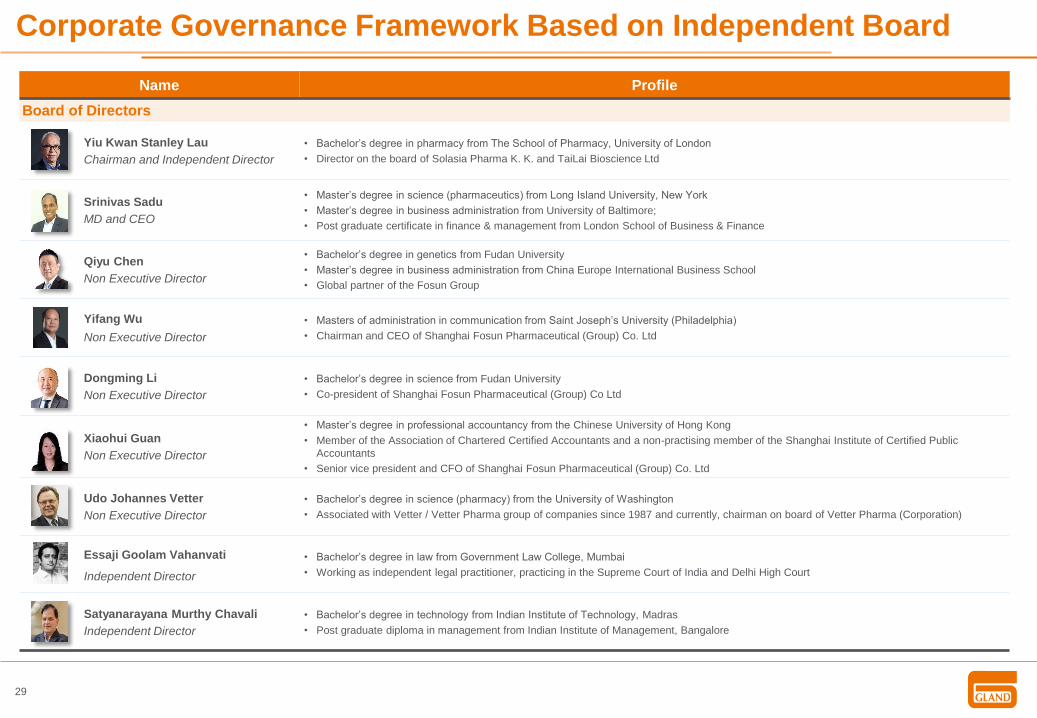
Name Profile
Board of Directors
Yiu Kwan Stanley Lau
Chairman and Independent Director
• Bachelor’s degree in pharmacy from The School of Pharmacy, University of London
• Director on the board of Solasia Pharma K. K. and TaiLai Bioscience Ltd
Srinivas Sadu
MD and CEO
• Master’s degree in science (pharmaceutics) from Long Island University, New York
• Master’s degree in business administration from University of Baltimore;
• Post graduate certificate in finance & management from London School of Business & Finance
Qiyu Chen
Non Executive Director
• Bachelor’s degree in genetics from Fudan University
• Master’s degree in business administration from China Europe International Business School
• Global partner of the Fosun Group
Yifang Wu
Non Executive Director
• Masters of administration in communication from Saint Joseph’s University (Philadelphia)
• Chairman and CEO of Shanghai Fosun Pharmaceutical (Group) Co. Ltd
Dongming Li
Non Executive Director
• Bachelor’s degree in science from Fudan University
• Co-president of Shanghai Fosun Pharmaceutical (Group) Co Ltd
Xiaohui Guan
Non Executive Director
• Master’s degree in professional accountancy from the Chinese University of Hong Kong
• Member of the Association of Chartered Certified Accountants and a non-practising member of the Shanghai Institute of Certified Public
Accountants
• Senior vice president and CFO of Shanghai Fosun Pharmaceutical (Group) Co. Ltd
Udo Johannes Vetter
Non Executive Director
• Bachelor’s degree in science (pharmacy) from the University of Washington
• Associated with Vetter / Vetter Pharma group of companies since 1987 and currently, chairman on board of Vetter Pharma (Corporation)
Essaji Goolam Vahanvati
Independent Director
• Bachelor’s degree in law from Government Law College, Mumbai
• Working as independent legal practitioner, practicing in the Supreme Court of India and Delhi High Court
Satyanarayana Murthy Chavali
Independent Director
• Bachelor’s degree in technology from Indian Institute of Technology, Madras
• Post graduate diploma in management from Indian Institute of Management, Bangalore
Corporate Governance Framework Based on Independent Board
11
as
GLAND
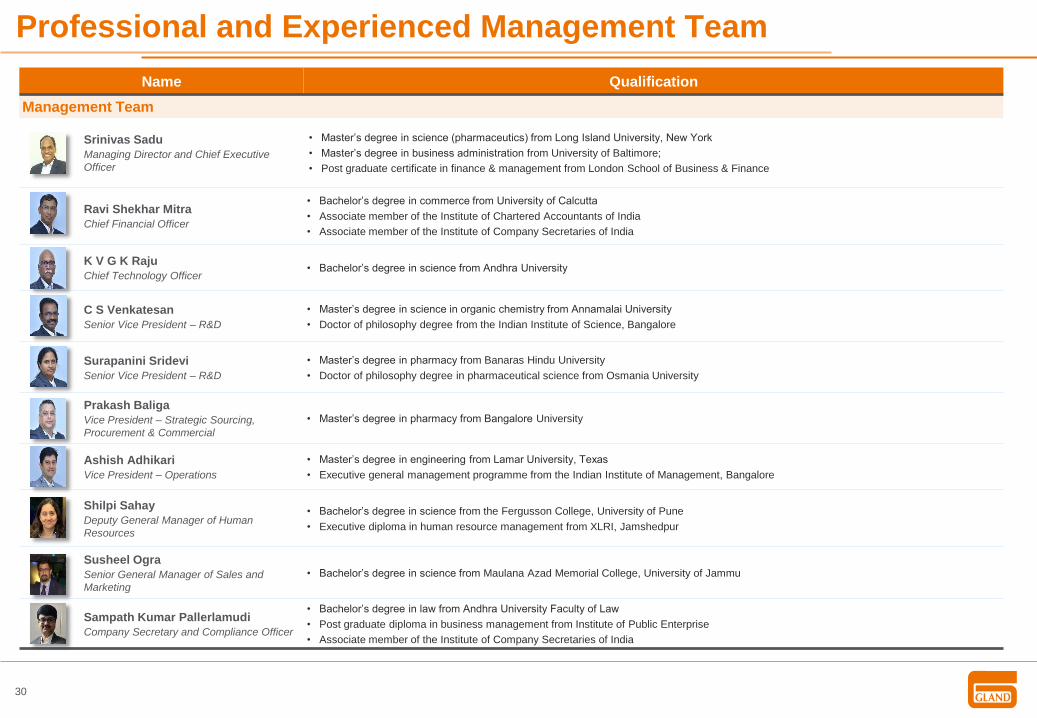
30
Name Qualification
Management Team
Srinivas Sadu
Managing Director and Chief Executive
Officer
• Master’s degree in science (pharmaceutics) from Long Island University, New York
• Master’s degree in business administration from University of Baltimore;
• Post graduate certificate in finance & management from London School of Business & Finance
Ravi Shekhar Mitra
Chief Financial Officer
• Bachelor’s degree in commerce from University of Calcutta
• Associate member of the Institute of Chartered Accountants of India
• Associate member of the Institute of Company Secretaries of India
K V G K Raju
Chief Technology Officer• Bachelor’s degree in science from Andhra University
C S Venkatesan
Senior Vice President – R&D
• Master’s degree in science in organic chemistry from Annamalai University
• Doctor of philosophy degree from the Indian Institute of Science, Bangalore
Surapanini Sridevi
Senior Vice President – R&D
• Master’s degree in pharmacy from Banaras Hindu University
• Doctor of philosophy degree in pharmaceutical science from Osmania University
Prakash Baliga
Vice President – Strategic Sourcing,
Procurement & Commercial
• Master’s degree in pharmacy from Bangalore University
Ashish Adhikari
Vice President – Operations
• Master’s degree in engineering from Lamar University, Texas
• Executive general management programme from the Indian Institute of Management, Bangalore
Shilpi Sahay
Deputy General Manager of Human
Resources
• Bachelor’s degree in science from the Fergusson College, University of Pune
• Executive diploma in human resource management from XLRI, Jamshedpur
Susheel Ogra
Senior General Manager of Sales and
Marketing
• Bachelor’s degree in science from Maulana Azad Memorial College, University of Jammu
Sampath Kumar Pallerlamudi
Company Secretary and Compliance Officer
• Bachelor’s degree in law from Andhra University Faculty of Law
• Post graduate diploma in business management from Institute of Public Enterprise
• Associate member of the Institute of Company Secretaries of India
Professional and Experienced Management Team
e I
GLAND

31
Promoted by Shanghai Fosun Pharma
(1) Market cap of US$ 19.3 bn as of December 31, 2020.
Shanghai Fosun Pharma is Global Pharmaceutical Major with Extensive Pharmaceutical
Manufacturing, Distribution and R&D Expertise Globally
Access extensive sales,
logistics and distribution
network to enable market
penetration in China
Benefit from bargaining
power and scale to procure
raw materials & equipment
from China
Leverage ability to access
key markets to provide
coverage for a portfolio of
products
Leverage existing
infrastructure and global
presence to access new
markets, including China
and Africa
Benefit from regulatory
know-how to navigate the
rapidly evolving healthcare
landscape in China
Continue Strategic Alignment with Shanghai Fosun Pharma to Increase Market Reach
● Fosun Pharma is a Global pharmaceutical major, whose shares are listed on the Shanghai Stock
Exchange and the Stock Exchange of Hong Kong Limited (1)
● Relationship with Shanghai Fosun Pharma provides widened market access opportunities arising from
its own continuing internationalization
● Benefitted from Shanghai Fosun Pharma's established presence in China and Africa, both of which we
consider to be key growth markets for injectables
FOSUNPHARMA EEIZZ5
GLAND

32
Building Blocks to Implement Future Strategy
Expand Product
Portfolio
and Delivery
Systems
Increase Current
Market Presence
and Enter New
Markets
Continue to
Invest in
Manufacturing
and
Technological
Capabilities
Align with
Shanghai Fosun
Pharma to
Increase Market
Share
Pursue Strategic
Acquisitions and
Partnerships
Continued Focus on
Cost Management
12
34
56
I
GLAND
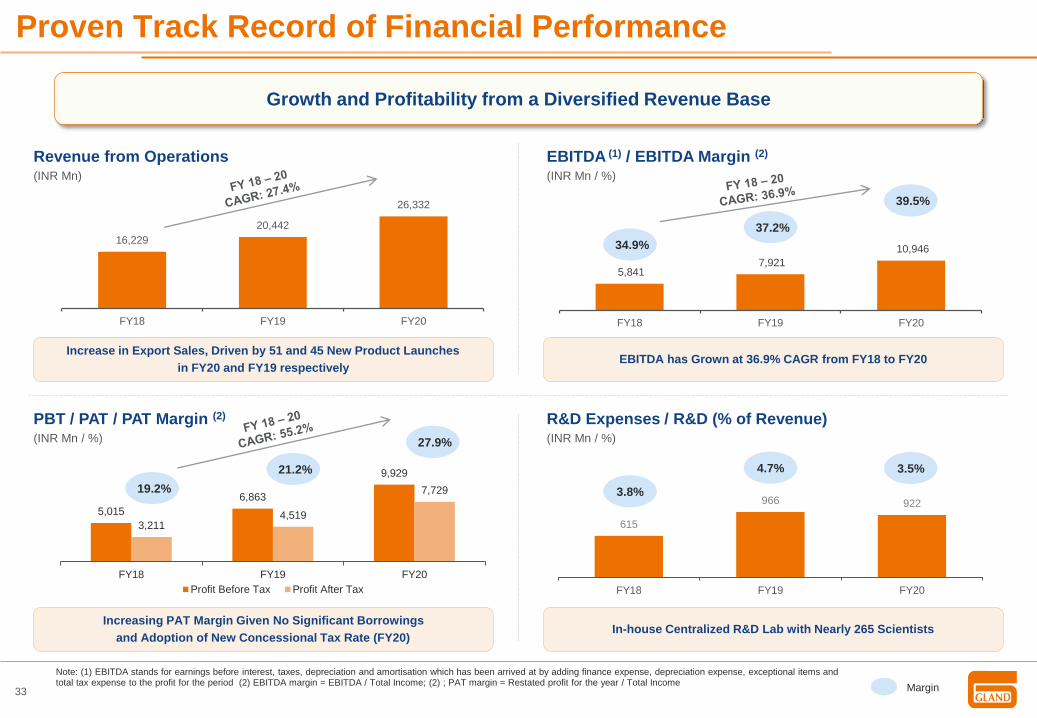
33
615
966 922
FY18 FY19 FY20
16,229
20,442
26,332
FY18 FY19 FY20
Revenue from Operations(INR Mn)
EBITDA (1) / EBITDA Margin (2)
(INR Mn / %)
Increase in Export Sales, Driven by 51 and 45 New Product Launches
in FY20 and FY19 respectively
5,841 7,921
10,946
FY18 FY19 FY20
34.9%
37.2%
39.5%
EBITDA has Grown at 36.9% CAGR from FY18 to FY20
PBT / PAT / PAT Margin (2)
(INR Mn / %)
R&D Expenses / R&D (% of Revenue)(INR Mn / %)
Margin
Increasing PAT Margin Given No Significant Borrowings
and Adoption of New Concessional Tax Rate (FY20)In-house Centralized R&D Lab with Nearly 265 Scientists
Note: (1) EBITDA stands for earnings before interest, taxes, depreciation and amortisation which has been arrived at by adding finance expense, depreciation expense, exceptional items and total tax expense to the profit for the period (2) EBITDA margin = EBITDA / Total Income; (2) ; PAT margin = Restated profit for the year / Total Income
Proven Track Record of Financial Performance
Growth and Profitability from a Diversified Revenue Base
3.8%
4.7% 3.5%
5,015
6,863
9,929
3,2114,519
7,729
FY18 FY19 FY20
Profit Before Tax Profit After Tax
19.2%
21.2%
27.9%
FY 18 20
CAGR: 21.4%
o /0 -_ 0 : 5 25 .2 18
R Y G
F c A
o A -20 : 3 6 .9 1 8
R Y G
F C A

34
Net Worth (1)
(INR Mn)
Cash and Bank Balances / Net Cash (2)
(INR Mn)
Strong Profitability Driving Growth in the Capital Base Maintained a Significant Net Cash Position over the Last 3 Years
Asset Turnover Ratio (3)(4)
Consistent Improvement in Asset Utilization to Generate Revenue
Note: (1) Net Worth refers to sum of equity share capital and other equity. (2) Net Cash refers to Cash and Bank Balances less Non-current borrowings (including current maturities). (3) Asset Turnover is calculated as Total Income for the year divided
by total assets on the last day of the fiscal year. (4) Fixed Asset Turnover is calculated as Total Income for the year divided by total fixed assets (Property, plant and equipment on the last day of the fiscal year + Right-of-use assets + Capital work in
progress on the last day of the fiscal year). (5) Return on Capital Employed (ROCE) = Restated profit for the year / Capital Employed on the last day of the fiscal year. Capital Employed represents Total Assets – Current Liabilities. (6) Return on Net
Worth (RONW) = Restated profit for the year / Net Worth on the last day of the fiscal year. Net Worth represents sum of equity share capital and other equity;
Proven Track Record of Financial Performance (Cont’d)
Strives to be a Capital Efficient Business. Company has no Significant Borrowings
ROCE (5) / RONW (6)
(%)
Consistent Improvement in Profitability
24,10428,620
36,462
FY18 FY19 FY20
23% CAGR
6,7087,533
13,252
6,6497,479
13,202
FY18 FY19 FY20
Total Cash Net Cash
0.6
0.6
0.7
Asset Turnover
FY18 FY19
1.6
2.0
2.4
Fixed Asset Turnover
FY20
12.6%15.1%
20.7%13.3%
15.8%
21.2%17.1%
20.2%
32.2%
FY18 FY19 FY20
RoCE RoNW RoCE (ex-cash)
A
Jl11,[1 * l
+
GLAND
35
Gland Pharma Limited
Survey No. 143-148, 150 & 151
Near Gandimaisamma 'X' Roads
D.P. Pally, Dundigal Gandimaisamma Mandal
Medchal-Malkajgiri District
Hyderabad 500043, Telangana, India
Registered Office
543245 GLAND GLAND:IN
GLAND
lllllllllllll
BSE H NSE B oomberg