OUTCOME BUDGET DEPARTMENT OF COMMERCE ... - TGPG
173
1 OUTCOME BUDGET 2013-2014 DEPARTMENT OF COMMERCE GOVERNMENT OF INDIA
-
Upload
khangminh22 -
Category
Documents
-
view
1 -
download
0
Transcript of OUTCOME BUDGET DEPARTMENT OF COMMERCE ... - TGPG

1
OUTCOME BUDGET
2013-2014
DEPARTMENT OF COMMERCE
GOVERNMENT OF INDIA

2
CONTENTS ____________________________________________________ _____________________________________ Page Nos.
PREFACE 3
EXECUTIVE SUMMARY 4-5 CHAPTER I INTRODUCTION 6-29 CHAPTER II FINANCIAL OUTLAYS AND QUNATIFIABLE 30-45 DELIVERABLES CHAPTER III REFORM MEASURES& POLICY INITIATIVES 46-89 CHAPTER IV REVIEW OF PAST PERFORMANCE 90-131 CHAPTER V FINANCIAL REVIEW 132-142 CHAPTER VI REVIEW OF PERFORMANCE OF 143-167 AUTONOMOUS BODIES & STATUTORY BODIES

3
PREFACE
The “Outcome Budget” reflects the endeavour of the Government to convert
“Outlays” into “Outcomes” by planning expenditure, fixing appropriate targets and
quantifying deliverables of each scheme. The “Outcome Budget” is an effort of the
Government to be transparent and accountable to the people.
In addition to an Executive Summary, the Outcome Budget 2013-14 contains six
chapters relating to the Demands for Department of Commerce under Grant No.11. The
chapters discuss the statement of outlays and outcomes; reform measures; policy
initiatives and programmes initiated; review of past performance; financial review for
three years and a review of the performance of statutory and autonomous bodies.

4
EXECUTIVE SUMMARY
Department of Commerce is responsible for regulation, development and
promotion of India’s international trade and commerce. The Department of Commerce
administers the Demand No.11.
The Outcome Budget 2013-2014 document of the Department of Commerce
highlight the various programmes and activities undertaken/envisaged to be undertaken
by the Department in furtherance of the core objective of strengthening India’s foreign
trade performance in the context of the related targets and achievements for 2011-12
and first nine months of 2012-13 ( up to December 2012) and targets set for 2013-14,
wherever possible in terms of financial outlays, physical outputs/quantifiable
deliverables and outcomes.
Scheme of chapters contained in the Outcome Budget 2013-14 documents are
summarized below:
Chapter I brings out a brief introductory note on the goals, objectives and
functions; the organizational set up; its mandate and the list of major programmes/
schemes implemented by the Department.
Chapter II presents the vertical compression and horizontal expansion of
Statement of Budget Estimates. The main objective is to establish a one to one
correspondence between (financial) Budget 2011-12 and Outcome Budget 2011-12.
The details comprise of the financial outlays, projected physical outputs and projected/
budgeted outcomes.
Chapter III highlights the details of reforms measures and policy initiatives
undertaken by the Department and how these relate to the intermediate outputs and
final outcomes in areas such as public private partnership, delivery mechanisms,
social and gender empowerment processes, greater decentralization, transparency
etc.
Chapter IV reviews the scheme-wise past performance of the various
programmes and activities undertaken by the Department during 2009-10 and 2010-
11 in terms of targets already set.
Chapter V deals with financial review covering overall trends in expenditure vis-
à-vis Budget Estimates/Revised Estimates in recent years, including the current year
i.e. 2013-14 (scheme-wise, object head wise, and institution wise in the case of

5
autonomous institutions), and the position of outstanding utilization certificates and
unspent balances with States and implementation agencies.
Chapter VI reviews the performance of the Statutory and Autonomous Bodies
under the administrative control of the Department.
Mechanism and the Public Information System to monitor the physical and
financial progress
Each Administrative Division is provided the Guidelines for release of budget to the
implementing agencies. The implementing agencies put in place their own mechanism
for providing assistance to the ultimate beneficiaries to ensure compliance and monitor
the implementation and outcomes. The Department also monitors execution of the
scheme and its impact towards achieving the desired objectives. Each Administrative
Head monitors and reviews the physical and financial progress of schemes under their
charge on a quarterly basis, which is further supervised and overseen by the Financial
Advisor and the Secretary as and when required.
The Government is committed to facilitate efficiency, transparency and
decentralization of decision making process through intensive use of Information and
Communication Technologies (ICT) based tools. To facilitate quick appraisal of inter-
ministerial and inter-agency trade related matters, an Executive Video Conference
System (EVCS) has been installed in the Department, connecting Secretaries to
Government of India and all Chief Secretaries/Administrators of States/UTs over NIC
network (NICNET). For bilateral and multilateral international negotiations, a Video
Conferencing Studio has been setup in the Ministry of Commerce & Industry. The
Department's web site (http://commerce.nic.in) is the major source of information
dissemination and provides Government-to-Citizen (G2C) and Government-to-
Business (G2B) interface for electronic delivery of services, trade facilitation and
monitoring various applications. The access to various e-governance and office
automation systems/applications and databases is available to the user in the
Department through an Intranet Portal.
DGFT maintains a comprehensive website www.dgft.gov.in having available
Foreign Trade Policy, Hand Book of Procedures, all Notifications, Public Notices,
Circulars, minutes, Office Orders etc. on it. Application forms for all the
schemes/activities are also available on the website

6
CHAPTER I
INTRODUCTION
I. Goals & Objectives
The basic role of the Department is to facilitate the creation of an enabling
environment for accelerated growth of international trade. The Department formulates
implements and monitors the Foreign Trade Policy which provides the basic framework
of policy and strategy to be followed for promoting exports and trade. The Trade Policy
is periodically reviewed to incorporate changes necessary to take care of emerging
economic scenarios both in the domestic and international economy. Besides, the
Department is also entrusted with responsibilities relating to multilateral and bilateral
commercial relations, Special Economic Zones, state trading, export promotion & trade
facilitation, and development and regulation of certain export oriented industries and
commodities.
The Department has set a long term vision of making India a major player in
world trade. The macro policy framework of the international trade policies being
followed by the country are guided by this basic vision.
Strategy Paper
The Department of Commerce has formulated a strategy to put exports in a high
growth trajectory leading to overall economic growth of the country. The strategy
suggests following steps to achieve the desired target:
A mix of policy instruments including, fiscal incentives, institutional changes, enhanced market access across the world and diversification of export markets, improvement in infrastructure related to exports, reducing transaction costs and refund of all indirect taxes and levies.
Aggressive export promotion of high value products that have a strong domestic manufacturing base.
Product diversification in labour intensive leather, gems & jewellery and textile.
Retain presence and market share in our old developed country markets, move up the value chain in providing products in these old developed markets.
Focus on markets in Asia (including ASEAN), Africa and Latin America to strengthen our presence in newly opened up markets.
Efforts to build a brand image for important Indian exports, and promote a thrust for quality up-gradation. Domestic standards for export related products be

7
raised, assurances put in place of quality enforcement through appropriate agencies and certification of export products encouraged.
Objectives & Thrust areas of 12th Five Year Plan (2012-17)
Objectives
(i) Rapid increase in exports to balance the Trade Deficit.
(ii) Enhancing the proportion of Manufacturing in the export basket (61.5 percent
at present) to realise higher value addition.
Thrust areas
(i) Strengthening the institutions providing support services to the exporters like
Export Inspection Council (EIC) and Indian Institute of Packaging (IIP).
(ii) Facilitating the provision of critical infrastructure necessary for promoting
exports in collaboration with States through schemes like ASIDE and various
schemes under APEDA and MPEDA.
(iii) Promoting exports of Tea, Coffee, Rubber and Spices through massive
support for schemes administered by Tea Board, Coffee Board, Rubber
Board and Spices Board.
(iv) Strengthening various institutions involved in consultancy, design, human
resource development and information services needed for export promotion
like WTO Centre, Indian Institute of Foreign Trade IIFT), Indian Institute of
Packaging(IIP) and Footwear Design and Development Institute (FDDI).
(v) Expansion and modernization of infrastructure and quality control mechanism
through up gradation of technology and greater use of IT.
(vi) Introducing new schemes for Gems & Jewellery, Leather and Pharma
Sectors.
II. Organisational Set Up
The Department is headed by a Secretary who is assisted by an Additional
Secretary & Financial Adviser, three Additional Secretaries and thirteen Joint
Secretaries and Joint Secretary level officers and a number of other senior officers.
The Department is functionally organized into the following eight Divisions:
1. Administration and General Division
2. Finance Division
3. Economic Division
4. Trade Policy Division

8
5. Foreign Trade Territorial Division
6. State Trading & Infrastructure Division
7. Supply Division
8. Plantation Division.
Various offices/organizations under the administrative control of the Department
are: (A) three Attached Offices, (B) eleven Subordinate Offices, (C) ten Autonomous
Bodies, (D) five Public Sector Undertakings, (E) Advisory Bodies, (F) fourteen Export
Promotion Councils and (G) other Organizations. The broad organizational set up and
major role and functions of these bodies are discussed below
(A) Attached Offices
(i) Directorate General of Foreign Trade (DGFT)
This Directorate, with headquarters at New Delhi, is headed by the Director
General, an officer of the rank of Additional Secretary. It is responsible for
implementing the Foreign Trade Policy with the main objective of promoting Indian
exports. It includes implementation of various duty neutralization schemes such as
Advance Authorization, Duty Free Import Authorization (DFIA), Duty Entitlement
Passbook (DEPB), Deemed Export Duty Drawback and Terminal Excise Duty (TED)
refund, Export Promotion Capital Goods (EPCG) and incentive schemes like Focus
Market, Focus Product, Vishesh Krishi & Gram Udyog Yojana and Served from India.
DGFT through its various offices provides facilitation to exporters in regard to
developments in the area of international trade, to help the exporters strategize their
import and export decisions in an internationally dynamic environment. DGFT also
issues authorisations to exporters/importers and monitors their corresponding
obligations through a network of 35 Regional Offices.
(ii) Directorate General of Supplies and Disposal (DGS&D)
The DGS&D, with headquarters at New Delhi, is headed by the Director General
an officer of the rank of Additional Secretary. It functions as the executive arm of the
Supply Division of the Department of Commerce for conclusion of rate contracts for
common user items, procurement of stores and inspection of stores, shipment and
clearance of imported stores/cargo. It has four Regional Offices located at Chennai,
Hyderabad, Mumbai and Kolkata. The functions of DGS&D are carried out through its
functional wings and supporting service wings.

9
(iii) Directorate General of Anti-Dumping & Allied Duties (DGAD)
The Directorate General of Anti-Dumping & Allied Duties was constituted in April,
1998 and is headed by the Designated Authority of the level of Additional Secretary to
the Government of India who is assisted by a Joint Secretary and an Adviser (Cost) and
an Additional Economic Adviser. Besides, there are twelve Investigating and Costing
Officers to conduct investigations. The Directorate is responsible for carrying out
investigations and for recommending, where required, under the Customs Tariff Act, the
amount of anti-dumping duty/countervailing duty on the identified articles which would
be adequate to remove injury to the domestic industry.
(B) Subordinate Offices
(i) Directorate General of Commercial Intelligence and Statistics (DGCI&S)
The Directorate General of Commercial Intelligence & Statistics (DGCI&S) is the
premier organization of Government of India for collection, compilation and
dissemination of India’s trade statistics and commercial information. This Directorate,
with its office located at Kolkata, is headed by the Director General. The foreign trade
data generated by the Directorate are disseminated through (i) Monthly Press Release
brought out every month by the Ministry of Commerce and Industry, (ii) Monthly Foreign
Trade Statistics of India by Principal Commodities & Countries, (iii) Monthly Statistics of
Foreign Trade of India (Import & Export), and (iv) Quarterly Statistics of Foreign Trade
of India by Countries. The Directorate brings out a number of publications on, inter alia,
inland and coastal trade statistics, revenue statistics, shipping & air cargo statistics.
The dynamic pages of the DGCI&S website www.dgciskol.nic.in are mainly for online
data transmission and provide access to data under PIS (Priced Information System).
(ii) Office of Development Commissioner of Special Economic Zones (SEZs)
The main objectives of the SEZ Scheme are generation of additional economic
activity, promotion of exports of goods and services, promotion of investment from
domestic and foreign sources, creation of employment opportunities along with the
development of infrastructure facilities. All laws of India are applicable in SEZs unless
specifically exempted as per the SEZ Act/ Rules. Each Zone is headed by a
Development Commissioner and is administered as per the SEZ Act, 2005 and SEZ
Rules, 2006. There are currently twelve Development Commissioners of SEZs. Units
may be set up in the SEZ for manufacturing, trading or for service activity. The units in
the SEZ have to be net foreign exchange earners but they are not subjected to any
predetermined value addition or minimum export performance requirements. Sales in
the Domestic Tariff Area from the SEZ units are treated as if the goods are being
imported and are subject to payment of applicable customs duties.

10
(iii) Pay and Accounts Office (Supply)
The payment and accounting functions of Supply Division, including those of
DGS&D, are performed by the Chief Controller of Accounts (CCA) under the
Departmentalized Accounting System. Payment to suppliers across the country is made
through this organization at its headquarters in New Delhi and regional offices situated
in Kolkata, Mumbai and Chennai. Internal Audit functions are also carried out in respect
of 9 CDDO and 16 non CDDO situated at various locations in the country.
(iv) Pay and Accounts Office (Commerce & Textiles)
The Pay and Accounts Office, common to both the Department of Commerce
and the Ministry of Textiles, is responsible for the payment of claims, accounting of
transactions and other related matters through the four Departmental Pay & Accounts
Offices in Delhi, two in Mumbai, two in Kolkata and two in Chennai. These
Departmental Pay and Accounts Offices are controlled by the Principal Accounts Office
at Delhi with the Chief Controller of Accounts (CCA) as the Head of the Department of
the Accounts Wing.
C) Autonomous Bodies
(i) Coffee Board
The Coffee Board is a statutory organisation constituted under Section (4) of the
Coffee Act, 1942 and functions under the administrative control of the Ministry of
Commerce and Industry, Government of India. The Board is headed by a Chairperson,
an officer of the rank of Joint Secretary. The Board is mainly focusing its activities in the
areas of research, extension, development, quality up gradation, economic & market
intelligence, external & internal promotion and labour welfare. The Board has a Central
Coffee Research Institute at Balehonnur (Karnataka) and Regional Coffee Research
Stations at Chettalli (Karnataka), Chundale (Kerala), Thandigudi (Tamil Nadu),
R.V.Nagar (Andhra Pradesh), Diphu (Assam) and Bio-technology centre at Mysore,
apart from the extension offices located in coffee growing regions of Karnataka, Kerala,
Tamil Nadu, Andhra Pradesh, Orissa and North Eastern Region.
(ii) Rubber Board
Rubber Board was set up under Section (4) of the Rubber Act, 1947. The
Chairman is the Chief Executive Officer of the Board and its head office is located at
Kottayam in Kerala. The Board is responsible for the development of the rubber industry

11
in the country by way of assisting and encouraging scientific, technical and economic
research; providing training to growers in improved methods of planting, cultivation,
manuring, spraying, harvesting; improving processing and marketing of rubber; and
collecting statistics from the owners of estates, dealers, processors and rubber product
manufacturers. It is also the function of the Board to secure better working conditions
and provide/improve amenities and incentives to rubber plantation workers. The Board
has nine departments, viz., Administration, Rubber Production, Research, Processing &
Product Development, Statistics & Planning, Finance & Accounts, Training, Market
Promotion and Licensing & Excise Duty.
(iii) Tea Board
The Tea Board is an autonomous body under the Ministry of Commerce &
Industry, Government of India, set up as a statutory body on 1st April, 1954 as per
provision under Section (4) of the Tea Act, 1953. It is an apex body, which looks after
the overall interests of the tea industry. The Board is headed by a Chairman (an officer
of the rank of Joint Secretary) and consists 30 Members representing the Parliament(3),
owners of tea estates(8), Government of principal tea growing states(6), workers
unions(5), Manufacturers of tea(2), consumers(2) and other interest(2). The Head
Office of the Board is located in Kolkata, West Bengal and has 16 regional/ sub-
regional offices throughout India and three overseas offices located at London, Moscow
and Dubai whose activities are mostly promotional in nature to boost export. Tea Board
has wide functions and responsibilities which include measures for development of the
tea industry and trade, extending financial and technical assistance to the tea growers,
manufacturers and producers, export promotion and domestic generic promotion,
regulating and controlling different marketing activities including that of tea auctions,
facilitating R&D activities, market liaison, assistance to labour welfare activities,
maintenance of statistical data, etc.
(iv) Tobacco Board
The Tobacco Board was constituted as a statutory body on 1st January, 1976
under Section (4) of the Tobacco Act, 1975. The Board is headed by a Chairperson (an
officer of the rank of Joint Secretary) with 25 other members, and its headquarters at
Guntur, Andhra Pradesh. The Board is responsible for the development & regulation of
the tobacco industry. The Board also has a Directorate of Auctions at Bangalore and 18
auction platforms across the states of Andhra Pradesh and Karnataka. The primary
functions of the Board include regulating the production and curing of Virginia Tobacco;
keeping a constant watch on the Virginia Tobacco market in India and abroad; ensuring
fair and remunerative prices to growers; maintaining and improving existing markets

12
and developing new markets abroad by devising appropriate marketing strategies. The
Board is entrusted with the task of recommending to the Central Government the
minimum prices that may be fixed; regulating tobacco marketing in India with due regard
to the interest of growers, manufacturers and dealers; propagating information useful to
growers, traders and manufacturers and purchasing Virginia Tobacco from the growers
when the same is considered necessary for protecting the interests of growers.
(v) Spices Board
The Spices Board was constituted as a Statutory Body on 26th February, 1987
under Section (3) of the Spices Board Act, 1986. The Board is headed by a Chairman
with its head office in Kochi and is responsible for the development of cardamom
industry and promoting the export of all the 52 Spices listed in the schedule of Spices
Board Act, 1986.
The primary functions of the Board include increasing the production and
productivity of small and large cardamom; development, promotion and regulation of
export of spices; granting certificate for export of spices; undertaking programmes and
projects for promotion of export of spices (like setting up of spices parks, support of
infrastructure improvement in spices processing etc.); assisting and encouraging
studies and research for improvement of processing, grading and packaging of spices;
striving towards stabilization of prices of spices for export and controlling and upgrading
quality for export (including setting up of regional quality evaluation labs and training
centers). With regard to cardamom, the Board also provides financial and other
assistance for cultivation and processing of cardamom; monitoring prices; increasing
domestic consumption; improving marketing; issue of license to auctioneers and
dealers, conducting electronic auction for cardamom; undertaking/ assisting or
encouraging scientific, technological and economic research and improving quality. The
Board also implements programmes for development of spices in NE region and
organic spices in the country. It also supports programmes aimed at better post harvest
practices.
(vi) The Marine Products Export Development Authority (MPEDA)
The Marine Products Export Development Authority was set up as a Statutory
Body formed in 1972 under an Act of Parliament (No.13 of 1972) under Ministry of
Commerce and Industry. The authority is responsible for development of marine
industry with special form on marine export. The Authority, with its headquarters at
Kochi and Field Offices in all the maritime states of India and 4 highly equipped Quality
Control Laboratories in Kochi, Bhimavaram, Nellore and Bhubaneswar respectively.
Besides, it has three trade promotion offices, one in Delhi and another two in overseas

13
(Tokyo & New York). MPEDA implement various developmental activities for export
promotion and extend assistance to promote aquaculture of exportable items. Deep-
sea fishing, value addition and increased production through aquaculture are the major
thrust areas identified for augmenting export of marine products. Two overseas Trade
Promotion Offices liaise with the importers and various agencies for promoting seafood
exports to the respective countries. The Authority has one field office in North East
(Guwahati). The Quality Control Laboratories serve the industry by analyzing and
disseminating test results of marine products to sustain/promote the sophisticated
export market. The Authority functions under the overall supervision of the Chairman,
supported by a team of officials both at the Head Office and the field units.
MAJOR SCHEMES/PROGRAMMES MARKET PROMOTION
Promotion of Indian Seafood in various overseas markets through appointment of
reputed professional agencies as Marketing Consultants, printing publicity literature,
brochures etc., to disseminate the information among the exporters regarding markets,
product price, enquiry for products, release of advertisements in reputed commercial
and seafood international publications, organize trade delegations to strengthen trade
relations, to settle common issues of exporters, conducting Indian International Seafood
Show, Aqua Aquaria India, regular participation in major international seafood fairs
being held in EU countries, Japan, USA etc., development of software for collection and
analysis of export statistics, membership in international organizations, operation of
trade promotion offices, to produce India a seafood processing hub by importing raw
material for processing and export of value added marine products, provide market
assistance like market survey, assistance for export of ornamental/aquarium fishes etc.,
are the major activities under Market Promotion.
CAPTURE FISHERIES
Under Capture Fisheries MPEDA aims at promotion of fishing tuna and other under
exploited resources, better preservation of catch using insulated/refrigerated fish
hold/RSW system on board fishing vessel, engagement of technical consultants for
imparting training to our fishermen in scientific tuna long lining and onboard handling
catch, issue ‘catch certificates’ insisted on by European Union for eliminating illegal
fishing etc., etc.,

14
CULTURE FISHERIES
MPEDA through its Field Offices is advocating an environmental friendly and
sustainable aquaculture implementing schemes to motivate private entrepreneurs for
investing in the farming of commercially important species, encourage farming of
diversified species, adopt best management practices in farming, discourage use of
banned chemicals and antibiotics, impart training to farmers, demonstrate farming of
diversified species. MPEDA organizes seminar, fairs and farmers meets to facilitate
exchange of information on farming techniques, source of inputs, improving the farming
practices. MPEDA also interacts with other government agencies to sort out the
problems of farmers. MPEDA is also assisting for ornamental fish production in a big
way.
PROCESSING INFRASTRUCTURE & VALUE ADDITION
The Scheme is to assist seafood processors to set up tuna cannery/processing
facilities for value added tuna products, promotion of value addition in seafood
processing and setting up of new units by providing subsidy assistance, expand the
existing production capacity for value added products and diversifying into value
addition. To maintain quality of the seafood products, subsidy assistance is being
provided to set up new modern ice plant/renovation of existing ice plants, acquisition of
refrigerated truck/containers, to set up large cold storage, subsidized distribution of
insulated fish boxes etc., and schemes are also being operated to assist exporters of
chilled fish/dried fish.
QUALITY CONTROL
The biggest issue facing the marine products sector today is to build capacity to
meet health and consumer safety requirements in the importing countries. Facilities at
the landing centres and processing plants are required to be upgraded and HACCP
system of quality assurance is implemented. Health Authorities from the importing
countries especially from the EU and US FDA make periodic visits to the landing
centres, processing facilities and laboratories in India to see themselves the adequacy
of these facilities in India. MPEDA has set up 20 Elisa labs and 4 full-fledged labs for
analyzing aquaculture products for various parameters such antibiotics, pesticides,
heavy metals etc., monitoring of residue level of pesticides and antibiotic in farmed
shrimp to meet EU standards, quality upgradation through assistance for
construction/renovation of captive pre-processing centres, independent pre-processing
centres, setting up of mini lab. Under quality system management MPEDA give training
for seafood processing technologists employed in registered processing plants, inviting
health authorities of importing countries/sending delegates abroad, upgrade fishing

15
harbours, and implement marine product logo, and assistance for upgradation of
seafood plants to EU standards.
RESEARCHE AND DEVELOPMENT
To disseminate new technology for export oriented aquaculture, MPEDA has set
up a Society called Rajiv Gandhi Centre for Aquaculture at Mayiladuthurai, Tamil Nadu.
The following are the projects being implemented under RGCA:-
1) Seabass Hatchery
2) Mud Crab Hatchery
3) Aquaculture Demonstration Farm
4) Domestication of Tiger Shrimp
5) Technology Transfer Training
6) Scampi Broodstock Development
7) Artemia Project
8) Tilapia Project
9) Marine Finfish hatchery Project
10) Grouper Project
11) RGCA FOUNDATION
12) Tuna Pilot scale Hatchery Project
13) L.vannamei Broodstock Mulitiplication Centre
(vii) Agricultural and Processed Food Products Export Development Authority
(APEDA)
The Agricultural and Processed Food Products Export Development Authority
(APEDA) was established in 1986 as a Statutory Body under an Act of Parliament. The
Authority, with its headquarters at New Delhi, is headed by a Chairperson. The Authority
has five Regional Offices at Guwahati, Hyderabad, Kolkata, Bangalore and Mumbai and
is entrusted with the task of promoting agricultural exports, including the export of
processed foods in value added form. APEDA has also been entrusted with monitoring
of export of 14 agricultural and processed food product groups listed in the Schedule to
the APEDA Act. APEDA has been actively engaged in the development of markets
besides up gradation of infrastructure and quality to promote the export of agro
products. In its endeavour to promote agro products, APEDA provides financial
assistance to the registered exporters under its Schemes for Market Development,
Infrastructure Development, Quality Development and Transport Assistance.
Mechanism for monitoring financial assistance schemes:

16
The financial assistance, under the schemes, is provided on reimbursement
basis to the exporters.
The claims are duly supported with invoices, project reports, financial status
reports and C.A. certificates etc.
The proposals are evaluated by the technical committee before
recommendations for approval.
Before the release of the claims, the assets created under the schemes are
physically verified by APEDA officials to ensure that the assets have been
created as per the “in principle” approval accorded by APEDA.
(viii) Export Inspection Council (EIC)
The Export Inspection Council was set up as a Statutory Body on 1st January,
1964 under Section 3 of the Export (Quality Control and Inspection) Act, 1963 to ensure
sound development of export trade of India through quality control and inspection and
for matters connected therewith. The Council is an advisory body to the Central
Government, with its office located at New Delhi and is headed by a Chairperson. The
Executive Head of the EIC is the Director of Inspection & Quality by Control who is
responsible for the enforcement of quality control and compulsory pre-shipment
inspection of various commodities meant for export and notified the Government under
the Export (Quality Control and Inspection) Act, 1963. The Council is assisted in its
functions by the Export Inspection Agencies (EIAs), which are field organizations
located at Chennai, Delhi, Kochi, Kolkata and Mumbai. These EIAs have a network of
twenty nine sub-offices located at different ports or major industrial centers and four
state-of-the-art laboratories with the required logistic support for the pre-shipment
inspection and certification activities.
(ix) Indian Institute of Foreign Trade (IIFT)
The Indian Institute of Foreign Trade (IIFT) is a Society registered under the
Societies Registration Act XXI of 1860 (Punjab Amendment) Act of 1957 and functions
under the aegis of Ministry of Commerce, Govt. of India. The Institute came into
existence on 2nd May 1963 and was granted Deemed University status by Ministry of
HRD in 2002. Over the years, the Institute has attained the status of premier institution
for imparting education in the field of International Business. The Institute is currently
operating from its campus in Delhi and leased Centre at Kolkata. Construction of
permanent campus at Kolkata is going-on on the land allotted by Government of West
Bengal.

17
The Institute was set up as an autonomous organization to help professionalize
country’s foreign trade management and increase exports by developing human
resources; generating, analyzing and disseminating data; and conducting research.
Apart from offering MBA level education in the field of International business, the
Institute is also involved in the research activity and consultancy for studies in the field
of international business on behalf / and for Ministry of Commerce. Apart from this the
Institute also conducts management development programs on topics related to
international business and trade. From these activities the Institute generates
resources for partly meeting its expenditure.
(x) Indian Institute of Packaging (IIP)
The Indian Institute of Packaging (IIP), Mumbai was set up in 1966 by the
packaging fraternity in association with the Ministry of Commerce & Industry. The
primary objective of the Institute is to stimulate consciousness of good packaging;
undertake and promote R&D in packaging technology and package design, provide
short-term and long-term educational and training programme in packaging technology.
IIP also organizes seminars and conferences in collaboration with different
Ministries/Departments of the Government, and industry associations. The Institute has
its regional branches in Delhi, Kolkata, Chennai, and Hyderabad. The Institute has also
planned to set up its branches at Ahemedabad and North East under the 12th five year
plan.
(D) Public Sector Undertakings (PSUs)
(i) State Trading Corporation of India Limited (STC)
STC was set up on 18th May, 1956, primarily with a view to undertake trade with
East European Countries and to supplement the efforts of private trade and industry in
developing exports from the country. STC has played an important role in country’s
economy by arranging imports of essential items of mass consumption (such as wheat,
pulses, sugar, etc.) into India and developing exports of a large number of items from
India. The core strength of STC lies in handling exports/ imports of bulk agro
commodities. During the past 4-5 years, STC has diversified into exports of steel raw
materials, gold jewellery and imports of bullion, hydrocarbons, minerals, metals,
fertilizers, petro-chemicals, etc.
STCL Ltd., having its headquarters at Bangalore, is a subsidiary of STC. It was
initially established in 1982 as Cardamom Trading Corporation Ltd., a Government of
India undertaking under the Ministry of Commerce & Industry. The company diversified

18
its trading activities from cardamom to spices to become Spices Trading Corporation
Ltd., in 1987. With globalization and opening of trade world over, the Spices Trading
Corporation Ltd. was renamed as STCL Ltd. STCL became a wholly owned subsidiary
of the State Trading Corporation of India Ltd. in 1999. STCL is involved in trading of
spices, value added spice products, agricultural commodities, fertilizers and pesticides.
The CMD of STC is the Chairperson of STCL Ltd.
(ii) MMTC Limited
The MMTC Limited (Minerals and Metals Trading Corporation) was created in
1963 as an individual entity on separation from State Trading Corporation of India Ltd.
primarily to deal in exports of minerals and ores and imports of non-ferrous metals. In
1970, MMTC took over imports of fertilizer raw materials and finished fertilizers. It is
actively involved in exploring overseas markets for exports and sourcing material for
domestic needs. With focus on bulk operations and having infrastructure spreading
across the country, MMTC has primarily six core commodity groups Viz., fertilizers,
Agro commodities, coal and hydrocarbons, Minerals & Precious metals. The company is
recognized as India’s largest international trading company and first Public Sector
Undertaking to be awarded “Premier Trading House” status in the country.
(iii) PEC Limited
The Project and Equipment Corporation of India Ltd. (PEC) was carved out of the
STC in 1971-72 to take over the canalized business of STC’s railway equipment
division, to diversify into turn-key projects especially outside India and to aid and assist
in promotion of exports of Indian engineering equipment. With effect from 23rd May,
1990, PEC became a subsidiary of the then newly formed Holding Company, Bharat
Business International Ltd. Thereafter, from 27th March, 1991, PEC became an
independent company directly owned by Government of India. The main functions of
PEC Ltd. includes export of projects, engineering equipment and manufactured goods,
defence equipment & stores; import of industrial raw materials, bullion and agro
commodities; consolidation of existing lines of business and simultaneously developing
new products and new markets; diversification in export of non-engineering items eg.
coal & coke, iron ore, edible oils, steel scraps, etc.; and structuring counter trade/
special trading arrangements for further exports.
(iv) Export Credit Guarantee Corporation of India Limited (ECGC)
The Export Credit Guarantee Corporation of India Ltd.(ECGC) Mumbai has the
primary objective of supporting the country’s exports by extending Insurance and

19
Guarantee facilities to the Indian exporters and the commercial banks. The paid up
capital at the end of 2011-12 was Rs. 900.00 crore.
The total gross direct premium income from all schemes of corporation during
the year 2011-12 amounted to Rs. 1004.83 crore as compared to Rs. 885.47 crore in
the year 2010-11. The growth came from the Export Credit Insurance to Bank
business, accounting for 59.89% of the total premium income, followed by Short Term
Policy sector including factoring, which contributed 35.42%. The income from medium
and long term sector accounted for just 4.69% (Rs. 47.27 crore) of the total premium
income. During the year ECGC achieved a growth of 13.48% in gross premium income.
(v) India Trade Promotion Organization (ITPO)
Following the merger of the Trade Fair Authority of India (TFAI) and the Trade
Development Authority (TDA), India Trade Promotion Organisation (ITPO) came into
existence in 1992. ITPO is the premier trade promotion agency of India and provides a
broad spectrum of services to trade and industry so as to promote India’s exports.
These services include organisation of trade fairs in India and abroad, Buyer-Seller
Meets and Contact Promotion Programmes apart from information dissemination on
products and markets. With its Headquarters at Pragati Maidan, New Delhi and regional
offices at Bangalore, Chennai, Kolkata and Mumbai, ITPO ensures representative
participation of trade and industry from different regions of the country in its events in
India and abroad
(E) Export Promotion Councils (EPCs)
Presently, there are fourteen Export Promotion Councils under the administrative
control of the Department of Commerce. These Councils are registered as non-profit
organizations under the Companies Act/ Societies Registration Act. The Councils
perform both advisory and executive functions. The role and functions of these
Councils are guided by the Foreign Trade Policy. These Councils are also the
registering authorities for exporters under the Foreign Trade Policy 2009-14.
(F) Advisory Bodies
(i) Board of Trade (BOT)
The Board of Trade was set up on 5th May, 1989 with a view to provide an
effective mechanism to maintain continuous dialogue with trade and industry in respect
of major developments in the field of International Trade. The Board was reconstituted
on 16th July, 2009 under the Chairpersonship of Commerce & Industry Minister. The

20
Board, inter-alia, advises the Government on policy measures connected with the
Foreign Trade Policy in order to achieve the objectives of boosting India’s exports.
(ii) Inter State Trade Council
The Inter State Trade Council was set up on 24th June, 2005 with a view to
serve as a mechanism for institutionalized dialogue between the Union and the States
in matters relating to trade facilitation and to create a framework for making States
partners in India’s export effort. The Council is represented by Chief Ministers of the
States or State Cabinet Ministers nominated by Chief Ministers, Lt. Governors or
Administrators of the Union Territories or their nominees, Secretaries of the
Departments of Commerce, Revenue, Industrial Policy & Promotion, Agriculture &
Cooperation, Shipping, Road Transport & Highways, Ministries of External Affairs,
Power and Chairperson, Railway Board. It also co-opts the Chairperson-cum-Managing
Director of Export Credit Guarantee Corporation, Managing Director of EXIM Bank,
Deputy Governor of Reserve Bank of India, Chairperson of Agricultural and Processed
Food Products Export Development Authority, Chairperson of Marine Products Export
Development Authority and presidents of CII, FICCI, FIEO, ASSOCHAM and Export
Promotion Council for EOUs/ SEZs.
(G) Other Organizations
(i) Federation of Indian Export Organizations (FIEO)
The Federation of Indian Export Organizations set up in 1965, is an apex body of
various export promotion organizations and institutions with its major regional offices at
Delhi, Mumbai, Chennai and Kolkata. The main objective of FIEO is to render an
integrated package of services to various organizations connected with export
promotion. It provides the content, direction and thrust to India’s global export effort. It
also functions as a primary servicing agency to provide integrated assistance to its
members comprising professional exporting firms holding recognition status granted by
the government, consultancy firms and service providers. The Federation organizes
seminars and arranges participation in various exhibitions in India and abroad. It also
brings out ‘FIEO News’, for creating awareness amongst its member exporters and
importers.
(ii) Indian Council of Arbitration (ICA)
The Indian Council of Arbitration, India’s premier Arbitral Institution, is a society
registered under the Societies Registration Act, 1860 operating on no profit basis, with

21
its head office in New Delhi and eight branches with a pan India network. The
organization originally established in 1965 promotes and administers the use of
alternative dispute resolution mechanisms in commercial disputes. The main objective
of the Council is to promote the knowledge and use of arbitration and provide arbitration
facilities for amicable and quick settlement of commercial disputes with a view to
maintaining the smooth flow of trade, particularly export trade on a sustained and
enduring basis.
(iii) Indian Diamond Institute (IDI)
With the objective of enhancing the quality, design and global competitiveness of
the Indian jewellery, the Indian Diamond Institute (IDI) was established as a society in
1978 with its office located at Surat. The Institute is sponsored by the Department of
Commerce and patronized by the Gems and Jewellery Export Promotion Council
(GJEPC). The Institute conducts various diploma and other courses related to diamond,
Gems & Jewellery. It also offers the three year diploma course on Diamond, Gem &
Jewellery Design & Manufacture. Institute’s Diamond Certification & Grading
Laboratory has been recognized world over and its laboratory is also authorized by the
DGFT, MOC&I, as per Chapter 4 of FTP 2009-14 for certification/Grading of Diamonds
of 0.25 Ct & above. Indian Diamond Institute has been accorded with recognition as a
Scientific & industrial Research Organizations (SIRO), by the Department of Scientific &
industrial Research, Ministry of Science & Technology, Government of India. It has also
been recognized as Anchor Institute (Gem & Jewellery) by Industries Commissionerate,
Government of Gujarat.
(iv) Footwear Design & Development Institute (FDDI)
Footwear Design and Development Institute established in the year 1986 under
the aegis of Ministry of Commerce, Government of India, with an objective to provide
one stop solution to the footwear and leather product industry is the premier institute of
the country. Since more than two decades FDDI is involved in Human Resource
Development and providing other technical services such as testing, inspection,
designing, consultancy etc. the Leather and Leather product industry.
The brief details of the schemes are summarized below:
(A) Ongoing Scheme
Establishment of FDDI Branch at Jodhpur

22
In order to ensure high end institutional infrastructure in all the major clusters,
Govt. of India had approved establishment of a full-fledged campus in Jodhpur
(Rajasthan) under 11th Five year Plan at a total outlay of Rs.97.12 crore.
The modern infrastructure and facilities with training capacity of 800-1000
students have been completed in the Jodhpur campus within the stipulated period. In
the new campus state of art infrastructure and facilities such as Smart class rooms,
Workshops with latest machines and equipment, High tech IT Lab, Library etc. have
been established to accommodate training and services in various disciplines in line
with existing campuses of FDDI. The support infrastructure such as Auditorium with
modern gadgets, Sports complex, residential facilities for staffs along with separate
Boys and Girls Hostel have also been established simultaneously to encourage high
end training and research facilities in the campus.
(B) New Schemes:
The new schemes during XII Five Year Plan are as under:
(i) Establishment of FDDI branch at Guna:
In order to ensure high end institutional infrastructure in all the major
clusters, Govt. of India has approved establishment of a full-fledged campus in
Guna, Madhya Pradesh under 12th Five year Plan with total outlay of Rs.109.50
Crore. The campus in Guna (Madhya Pradesh) will cater to the need of trained
manpower for the present need and future expansion of the industry and provide all
technical value added services for the global competence of the Industry. 1st
installment of Rs. 20.00 Crore has been released to FDDI. The Construction work
of Buildings of FDDI Branch at Guna has already started. The Procurement of
Machinery and Equipment are under process. The admission process of students
for UG& PG programme is being initiated along with other branches.
(ii) In addition to the above, it is projected to implement the following three schemes during 12th Five Year plan: a) Expansion and up-gradation of Training Centre of FDDI at Chhindwara into
a full-fledged campus.
b) Establishment of 2 new campuses at Patna (Bihar) and Hyderabad
(Andhra Pradesh).
c) Establishment of Campus Networking Centre (CNC) and Upgradation of
existing campuses.
(v) National Centre for Trade Information (NCTI)

23
The National Centre for Trade Information (NCTI) was incorporated on 31st
March, 1995 as a company under Section 25 of Companies Act, 1956. The company
started functioning w.e.f. March 1996. It has a Board of Directors for administration of its
affairs, which includes representatives from Ministry of Commerce & Industry, National
Informatics Centre (NIC), Indian Institute of Foreign Trade (IIFT), and Directorate
General of Commercial Intelligence & Statistics (DGCI&S).
The ITPO and NIC are co-promoters of the company and have contributed a sum
of Rs.4.00 crore (Rs.2.00 crore each) as Corpus Fund in the equity contribution of the
Company. The ITPO provides fully furnished office space and the NIC provides the
software and hardware against their equity contribution in kind.
The Centre provides value added information in the field of electronic trading
opportunities, live trade leads from World Trade Point Federation (WTPF), trade data
analysis and organized export awareness seminars and updating/uploading information
on its website. The centre uploads 52 issues of E-weekly ‘Trade Point-India’ annually on
its website containing approximately 250 trade leads each week.
(vi) Price Stabilization Fund Trust
The Price Stabilization Fund (PSF) Scheme was launched by Government of
India in April 2003 against the backdrop of decline in international and domestic prices
of tea, coffee, rubber, and tobacco causing distress to primary growers. The growers of
these commodities were particularly affected due to substantial reduction in unit value
realization for these crops, at times falling below their cost of production. The objective
of the Scheme is to safeguard the interests of the growers of these commodities and
provide financial relief when prices fall below a specified level. The Scheme is being
operationalized through the Price Stabilization Fund Trust.
III. Mandate of the Department
The mandate of the Department of Commerce is the regulation, development
and promotion of India’s international trade and commerce through formulation of
appropriate international trade and commercial policy and implementation of the various
provisions thereof. The work allocated to Department of Commerce in accordance with
the Allocation of Business Rules, 1961 is given below:
A. International Trade
International Trade and Commercial Policy including tariff and non-tariff barriers.

24
International Agencies connected with Trade Policy (e.g. UNCTAD, ESCAP,
ECA, ECLA, EEC, EFTA, GATT/WTO, ITC and CFC).
International Commodity Agreements other than agreements relating to wheat,
sugar, jute and cotton.
International Customs Tariff Bureau including residuary work relating to the Tariff
Commission.
B. Foreign Trade (Goods & Services)
All matters relating to foreign trade.
Import and Export Trade Policy and Control excluding matters relating to -
import of feature films;
export of Indian films- both feature length and shorts; and
Import and distribution of cine-film (unexposed) and other goods.
C. State Trading
Policies of state trading and performance of organizations established for the
purpose and including -
STC Ltd. and its subsidiary STCL Limited; (excluding Handicrafts and
Handlooms Export Corporation and Central Cottage Industries Corporation;
the Tea Trading Corporation of India Limited which are now not its
subsidiaries);
Projects & Equipment Corporation of India Limited (PEC);
India Trade Promotion Organization and its subsidiaries; and
Minerals and Metals Trading Corporation (MMTC) and its subsidiaries.
Production, distribution (for domestic consumption and exports) and development
of plantation crops, tea, coffee, rubber, spices, tobacco and cashew.
Processing and distribution for domestic consumption and exports of instant tea
and instant coffee:-
(a) Tea Board.
(b) Coffee Board.
(c) Rubber Board.
(d) Spices Board.
(e) Tobacco Board.
D. Management of Certain Services
Cadre Management of Indian Trade Service and all matters pertaining to training,
career planning and manpower planning for the service.

25
Cadre Management of Indian Supply Service and all matters pertaining to
training, career planning and manpower planning for the service.
Cadre Management of Indian Inspection Service and all matters pertaining to
training, career planning and manpower planning for the service.
E. Special Economic Zones
All matters relating to development, operation and maintenance of Special
Economic Zones and units in special economic zones, including export and
import policy, fiscal regime, investment policy, other economic policy and
regulatory framework.
Note: All fiscal concessions and policy issues having financial implications are
decided with the concurrence of the Ministry of Finance or failing such
concurrence with the approval of the Cabinet.
F. Export Products and Industries and Trade Facilitation
Gems and Jewellery.
Matters relating to Export Promotion Board, Board of Trade and International
Trade Advisory Committee.
Matters relating to concerned EPCs/Export Promotion Organizations.
Indian Institute of Foreign Trade and Indian Institute of Packaging.
Indian Diamond Institute and Footwear Design and Development Institute.
Coordination for export infrastructure.
Development and expansion of export production in relation to all commodities,
products, manufacturers and semi-manufacturers including -
agricultural produce within the meaning of the Agricultural Produce (Grading
and Marking) Act, 1937 (1 of 1937);
marine products;
Industrial products (engineering goods, chemicals, plastics, leather goods
etc.);
fuels, minerals &mineral products; and
Specific export oriented products including plantation crops, etc. but
excluding jute products and handicrafts.
All organizations and institutions connected with the provision of services relating
to the export effort including -
Export Credit and Export Insurance including ECGC;
Export Inspection Council Standards including Quality Control;
Directorate General of Commercial Intelligence and Statistics; and
Free Trade-Zones.

26
Projects and programmes for stimulating and assisting the export efforts.
G. Attached and Subordinate Offices
Directorate General of Foreign Trade.
Directorate General of Supplies and Disposals.
Directorate General of Anti-Dumping and Allied Duties and related matters.
Directorate General of Commercial Intelligence and Statistics.
H. Statutory Bodies
Marine Products Export Development Authority.
Agricultural and Processed Food Products Export Development Authority.
I Major Schemes:
(i)Assistance to States for Development of Export Infrastructure and Allied
Activities (ASIDE):
In pursuance of the EXIM Policy announcement in March, 2000, ASIDE scheme
was launched on 13.3.2002. The Scheme subsumed erstwhile Central Schemes viz. the
Critical Infrastructure Balance Scheme, the Export Promotion Industrial Park Scheme
and the Export Development Fund (EDF) Scheme for the North East; all of which were
being operated by the Commerce Department. Rs. 2050 crore and Rs 3048 Cr were
spent under this scheme during the 10th Five Year Plan (2002-2007) and the 11th Five
Year Plan (2007-2012) respectively.
The objective of the scheme is to involve States / UTs in export effort by
providing assistance to the State Governments / UT Administrations for creating
appropriate infrastructure for development and growth of exports. Such involvement will
be based on projects to be prioritized by States / UTs to address the critical link both at
the point of production and the point of evacuation in the industrial cluster, largely within
the contour of the first mile and the last mile consideration.
The scheme shall provide an outlay for development of export infrastructure
which will be distributed to the States / UTs according to pre-defined criteria.
The activities aimed at development of infrastructure for exports can be funded
from the scheme provided such activities have an overwhelming export content and
their linkage with exports is fully established. The scheme shall be exclusively used for
creating infrastructure which does not get reflected either in the State / UT plan or in the
plans of the Central Ministries or its organization(s), yet such infrastructure is critical for
growth of exports.

27
Funds are provided to States/UTs as per the following criteria:-
The outlay of the scheme has two components: State Component (80% of the
total outlay) and Central Component (20% of the total outlay). 90% of total outlay under
State Component of ASIDE i.e. ASIDE (State Component--General) is earmarked for
allocation to States / UTs on the basis of the approved criteria to be utilized for the
approved purposes. The balance 10% of State Component of ASIDE i.e. ASIDE (
State Component-- Incentive ONER) will be allocated by DoC for incentivizing the
better performance of ONER States / UTs ( States / UTs other than NER including
Sikkim) as per Incentive guidelines. At the State Level, a State Level Export Promotion
Committee (SLEPC) headed by Chief Secretary of the State and consisting of States
Secretaries of concerned Departments, a representative of the States Cell of
Department of Commerce (DoC), Joint Director General of Foreign Trade posted in that
State/ region and Development Commissioner of SEZs in the State scrutinizes and
approves specific projects and oversees its implementation.
90% of total outlay, under Central Component of ASIDE i.e. ASIDE ( Central
Component--General) shall be earmarked at the central level to cater projects
emanating from Central SEZs, other sector specific central agencies like spices Board,
Tea Board, Gems and Jewellery Export Promotion Councils, Airports, Ports etc and any
other activity considered important by the Central Government from the regional or the
national perspective. At the Central Level, an Empowered Committee under
chairmanship of Commerce Secretary with representatives of other Departments,
approves and monitors the projects under the Central Sector. This Empowered
Committee also periodically reviews progress of projects and takes steps to ensure
achievement of objectives of the scheme. The balance 10% of Central Component of
ASIDE i.e. ASIDE(Central Component--Incentive NER) is allocated by DoC for
incentivizing the better performance of NER States including Sikkim as per Incentive
guidelines of Scheme.
The progress of the Scheme in States is closely monitored by States Cell of DoC.
In order to evaluate progress in the implementation of projects, its impact on exports
etc., the projects sanctioned under ASIDE/CIB are being visited by field formations of
Department of Commerce who submit consolidated report in the prescribed format to
Department of Commerce, State Government and the nodal agency of the State for
appropriate action. Senior Officers of the Department of Commerce have also been
made Nodal Officers and allocated certain States/UTs for on the spot inspection of the
projects being taken up by the States/UTs from ASIDE funds.
Review Meetings with the State Governments are held by the Department of
Commerce for evaluation of the progress of the Scheme in the States. A web-enabled
monitoring system of the projects has been developed on the website of the Department

28
for online assessment of the progress of the projects. In this system, we have entry
module and reporting module. In the entry module Nodal Agency of the respective State
Govt. /UT administration has been authorized to enter details of the projects approved
by the concerned SLEPC and also the physical and financial progress pertaining to
each project on quarterly basis. In the report module the administrative division in the
Ministry enters the details of funds released from time to time. Based on these two
entries, we get number of reports including that about utilization of funds and also un-
utilized balance left with the Nodal Agency. Pending utilization certificate are also
tracked through the monitoring system of website. The reports generated through web
enabled monitoring system in used for monitoring of ASIDE scheme as well as for
further release of funds to various agencies.
Approval of Projects and Implementation
As per the ASIDE guidelines there shall be a State Level Export Promotion
Committee (SLEPC) headed by the Chief Secretary of the State and consisting of the
Secretaries of concerned Departments at the State level, & a representative of the
States cell of the Department of Commerce (DoC) and the Joint Director General of
Foreign Trade posted in that State/region and the Development Commissioners of the
SEZ/EPZ in the State within their jurisdiction as Members. SLEPC will scrutinize and
approve specific projects and oversee the implementation of the Scheme.
Each State/UT shall appoint/designate one of its officers as Export
Commissioner who shall be the convener of SLEPC and with whom DoC will interact on
the issues pertaining to ASIDE. He shall draw up five year and annual export plans for
the State/UT in consultation with the trade & industry, the Export Promotion Councils
and the DoC. He shall also draw up a shelf of location specific projects, for the approval
of the SLEPC, which are proposed to be taken up under this scheme. He shall also act
as a single point interface with the exporters from the State/UT.
The SLEPC will ensure that the proposals will be location specific and selection
of location and inter-se prioritizing will be done by the SLEPC. For this, SLEPC will draw
a list of centres to be focused for developing export infrastructure over next 2-3 years
and a shelf of projects will be kept in advance to take full advantage of this Scheme
each year. The list of Centres may be drawn in consultation with Export Promotion
Councils (EPCs) and other export promotion bodies. On approval of the proposals by
the SLEPC, funds shall be disbursed to the implementing agency of the project by the
Nodal Agency. State Governments are advised to put in place a system for
Disbursement of funds by Nodal Agency to Implementing Agency of the project. As far
as possible the States may leverage the funds released by the DoC with other schemes

29
and projects of the State Govt. Private Sector could be involved in the infrastructure
projects as per the guidelines.
Before sanctioning new projects, the SLEPC will allocate funds for the likely
expenditure of the ongoing projects. The SLEPC will ensure that except in exceptional
cases no new project has a gestation period of more than 2 years.
For outlays under the Central component, there shall be an Empowered
Committee in the Department of Commerce, headed by the Commerce Secretary and
consisting of representatives from the Planning Commission and the respective
ministries to consider and sanction the proposals received as per the procedure
prescribed. If any project has any bearing on the external sector, a representative of the
Ministry of External Affairs would be invited for the meeting of the Empowered
Committee.
The 20% Central component would be approved as per the delegation of powers under Financial Rules of Government of India. The 80% State component would be approved by the State Government as per the Rules of Business of the State Government.
Payments made under the scheme will be subject to audit by the Controller & Auditor General of India as also by other means as deemed fit by Government of India. Government of India will cause physical verification and other such enquiries as deemed fit, of the projects sanctioned under the Scheme.
The Implementing Agency of each project will see that wherever feasible, users of the infrastructure will pay a service charge for the same, which could meet the expenditure on operation and maintenance of the infrastructure so created.
J. Miscellaneous
Purchase and inspection of stores for Central Government Ministries/
Departments including their attached and subordinate offices and Union Territories,
other than the items of purchase and inspection of stores which are delegated to other
authorities by general or special order.
****

30
CHAPTER – II
FINANCIAL OUTLAYS AND QUANTIFIABLE DELIVERABLES - PHYSICAL
OUTPUTS & FINAL OUTCOMES
For the year 2012-13, an outlay of Rs.5023.00 crore was approved for the
various Plan and Non-Plan schemes of the Department. Out of this, Plan outlay was
Rs.2100.00 crore. The provisional Plan Expenditure (up to 20.02.2013) for the year
2012-13 is estimated at Rs. 1617.80 Crore. As against this, an outlay of Rs 5391.00
crore has been approved for the year 2013-14; consisting of Plan outlay of Rs.2226.00
crore and Non-Plan outlay of Rs. 3165.00 Crore. As export promotion and market
development is the core of the activities of the Department, assistance in the form of
export subsidy at Rs. 1300.00 crore, grants-in-aid at Rs. 50.00 crore and interest
subsidy to banks at Rs. 1,200.00 crore constitutes the bulk of the Non-Plan
expenditure. On the Plan side, the Centrally-sponsored scheme of Assistance to States
for the Development of Export Related Infrastructure and Allied Activities (ASIDE)
constitutes the single most important activity accounting for an outlay of Rs. 960.00
crore(including NER & SCSP).
The scheme-wise details of the financial allocations and the quantifiable
deliverables/outputs for the year 2013-14, wherever possible, are given below in the
tabular form.

31
OUTLAYS, QUANTIFIABLE DEVLIVERABLES/PHYSICAL OUTPUTS & OUTCOMES
SL.No.
Name of Scheme Objective/Outcome Outlay 2013-14 ( Rs. in crore)
Quantifiable/ deliverables/ physical Outputs
Projected Outcomes
Processes/Timelines
Remarks/ Risk factors
1. 2. 3. 4.
7. 8. 9.
Plan Non Plan IEBR
4(i) 4(ii) 4(iii)
1. Secretariat – Economic Services
The Department is responsible for the formulation & Implementation of Foreign Trade Policy, matters relating to multilateral and bilateral commercial relations, state trading, export promotion etc. The provision is for secretariat expenditure of the Department.
0.00 60.50 0.00 Exchange of information in a transparent and efficient manner resulting in quicker disposal of work and higher productivity.
2013-14 Administrative Expenses
2. Foreign Trade and Export Promotion
Trade Commissioners
The Commercial Offices abroad, provide the institutional framework and are meant to promote India’s trade and economic exchanges with the world. The provision is for establishment related expenses of these commercial offices.
0.00 121.35 0.00 2013-14 Administrative expense
Directorate General of Foreign Trade
Administrative expenditure of the head quarter of the O/o DGFT and its 32 regional offices
0.00 95.40 0.00 FY 2013-14
Administrative expense
Total(Foreign Trade & Export Promotion)=
0.00 216.75 0.00
3. Assistance for Export

32
Promotion and Market Development
Export Subsidy (Duty Draw Back/DBK/CST)
0.00 1300.00 0.00
Interest Subsidy to Banks
0.00 1200.00 0.00
Grant in aid to Export Promotion and Market Development Organisations
P 0.00 50.00 0.00
Total(Assistance for Export Promotion and Market Development)=
0.00 2550.00 0.00
4. Development of Free Trade/Export Processing Zones/Special Economic Zones
Kandla SEZ To provide a duty free environment for export promotion.
0.00 9.55 0.00 As on 31st Dec., 2012
direct employment in the SEZ sector is estimated at 10,19,146 persons and investment is estimated at Rs. 2,38,990.18 crore, 154 SEZs have commenced export and exports from the SEZs were of the order of Rs. 3,53,194,90 crore in the current year, i.e, 2012-13(up to 31
st Dec., 2012)
15 new units are expected to be added this increasing the potential of exports over Rs. 1500 lakh
Electronics (SEEPZ) SEZ
0.00 8.10 0.00
Falta 0.00 4.30 0.00
Chennai 0.00 6.65 0.00
Cochin SEZ 0.00 6.80 0.00
NOIDA SEZ 0.00 8.25 0.00
Visakhapatnam SEZ 0.00 6.80 0.00
Indore SEZ 0.00 1.60 0.00
Jaipur SEZ 0.00 0.63 0.00
Manikanchan SEZ (Kolkata)
0.00 0.73 0.00
Moradabad SEZ 0.00 0.40 0.00
Mahamumbai SEZ 0.00 0.57 0.00

33
Jodhpur ZEZ 0.00 0.50 0.00
Surat SEZ 0.00 0.48 0.00
Investment in ECGC 100.00 0.00 0.00
National Export Insurance Account
30.00 0.00 0.00
. Total(Development of Free Trade/Export Processing Zones/Special Economic Zones)=
130.00 55.36 0.00
5. Agricultural and Processes Food Products Export Development Authority
Develop and promote the export of agro products, provide financial assistance to the exporters under schemes Market Development, Infrastructure Development, Quality Development and Transport Assistance
180.00 1.00 0.00 Plan to set up approx. 20 common pack-house and 4 projects of Common Infrastructure facilities in PPP Mode(New Components) Centers for Perishable Cargo(CPC), 5 Transport Units facilities, 20 setting up of sheds for storage/grading, 7 mechanized handling facilities for sorting/grading, 4 pre-cooling facilities and 8 Integrated post harvest system/pack house. Participate in 20 international trade fairs all over the world , provide financial assistance to at least 191 exports for usage of packaging material , setting up/strengthening of labs for exports-20, up
The setting up and up gradation of infrastructure under the scheme will help in maintaining the quality of the produce for exports and also attain incremental export of the APEDA monitored products. Programmes under Market Development Schemes will help in achieving market access in new markets and increase exports of APEDA monitored products in the existing markets. Transport
Ongoing scheme

34
gradation/recognition of labs for export testing-12, organization seminars/group activities-5, and at least 335 exporters will be provided transport assistance.
Assistance will enhance competitiveness of our agro products by mitigating transaction/freight cost disadvantage in comparison to the competing countries.
6. Marine Products Export Development Authority
To promote marine products abroad, provide assistance for warehousing, transportation, slotting expenses in retail outlets in abroad market, publicity & advertisement of marine products, extend assistance to deep sea/merchandised fishing vessels to tuna long liners, installation GPS/ Fish finder/Radio telephone on board vessels(new), provide assistance for better preservation of catch, promote overseas delegation visits, buyer seller meets, invitation of overseas buyers/experts.
115.00 5.00 0.00 Promotion of value added fish and fishery products, process, increase acceptance of Indian seafood in overseas markets, help to resolve the trade issues like tariff and non tariff barriers and trade disputes
7. Other Schemes of Foreign Trade and Export Promotion
. Directorate General of Commercial Intelligence and Statistics
Compilation & Dissemination of Trade Statistics(Non Plan)
3.00 25.74 0.00 Compilation and dissemination of foreign trade data through monthly,

35
quarterly and annual publications; meeting the day to day expenses for smooth functioning of the office of DGCI&S
8. Export Promotion Quality Control and Inspection
Export Inspection Councils
Computerization of the activities of the organization with a view to bring about transparency and efficiency, modernization of the organisation in terms of latest office automation, equipment & facilities, Upgradation of the labs of EIC/EIAs with state of the art equipment as per requirements of the importing country.
8.00 0.00 0.00 Effective, efficient and transparent system having client interface. Reliable information dissemination in r/o quality and other related issues of India’s trading partners. Reliable and credible test results and analysis meeting requirement of the trading partners.
Ongoing process. Target envisaged likely to be met by March, 2014.
Market Access Initiatives
180.00 0.00 0.00
Centre for WTO Studies
To develop the centre as an expert body for providing inputs on various trade policy issues. To provide institutional mechanism for coordination domestic stakeholders consultations To Develop the centre for training activities To conduct research in frontier areas of concern for India in sphere of International Trade
8.00 0.00 0.00 Physical deliverables are not quantifiable as the outlay is need based.

36
9. Trade Remedies and Trade Defence
0.00 9.50 0.00
10.
Assistance to Institutions
IIFT Full fledged campus at Kolkata especially for imparting training/capacity building for MBA aspirants all over India and
60.00 0.00 0.00 Construction of IIFT, Kolkata campus with residential facility for faculty and staff, hostel for students and library/IT and and modern facilities for students.
Capacity building of larger number of students in international business , Research studies and Management Development programmes will be conducted in large numbers
July, 2013 Subject to inherent technological limitations/ constraints in achieving projected outputs in cost effective and timely manner and release of grant by DoC
IIP Meeting requirement of industries by introducing state of the art testing equipments, library books & IT equipments, setting of NER Regional Centre for the benefit of fresh & Processed food industries. Expansion of Food Packaging lab facilities at Delhi to serve the industries.
3.00 0.00 0.00 Upgradation of infrastructural facilities at all centres of IIP including laboratory, Training, library, consultancy & projects & R&D Division.
continuous
FDDI 0.00 0.00 0.00
IIPM 0.00 0.00 0.00
Total (Assistance to Institutions)=
63.00 0.00 0.00
11.
Modernization Up gradation
Sectt.-Economic Services
Modernization and Up gradation of Department of Commerce
4.00 0.00 0.00 e-Governance Project implemented in the Department w.e.f. April, 2011 with the
Similar activities relating to computerization and other

37
help of TCS at a total project cost of Rs. 15.75 crore (including 5 years AMC)leading to less paper office, electronic movement of files and complete e-filing system, Computerization and LAN up gradation have been made.
modernization works of the Department are to be carried out during the 12 th Plan Period.
DGFT Making DGFT a paperless Organization to reduce transaction cost and time, seamless electronic Data Interchange with its community partners, introduction of digital signatures in its operations, issuance and implementation of paperless licenses
10.00 0.00 0.00 No Quantification can be made, with the ongoing computerization. We would be able to process applications online which will lead to more transparent decision making and reduce transaction cost to the exporting community. The achievable results can only be gauged in terms of intangible outcomes. As on date Advance Authorization, DFIA and EPCG Scheme is completely online. The message exchange between DGFT and Customs for Advance Authorization, DFIA and EPCG licenses has been implemented for all EDI Ports for
Software Development of new schemes.
Digital certification of documents.
Restructuring and improvisation of website of DGFT and all RAs.
Acquisition of additional bandwidths (leased lines/ Broadband)
Modern Workstations
FY 2013-14

38
authorizations issues after 1.4.2009.
DGCI&S Construction of Meeting Hall, Digitization of rare documents, Retro conversion, survey of service sector trade, strengthening of IT infrastructure, training of officers, compilation of data on inter-state movement of goods by road etc.
3.00 0.00 0.00 1) Construction of Meeting Hall: Super structure, internal electrification, etc. 2)Digitization of rare books & document of Commercial Library 3) Updation of frame & conduct of surveys in health and other sectors. 4) Development of software for technical and administrative work. 5) Compilation of inter-state trade data.
Computerization in DGS&D
25.00 0.00 0.00 A computerized system has been developed in house with NIC providing e-support in developing software modules. In the initial phases, e-tendering was out sourced through a third party, acting as ASP, on PPP mode. However, after expiry of third party ASP contract for e- tendering services, e tendering module has been developed in house with the e support of NIC. The
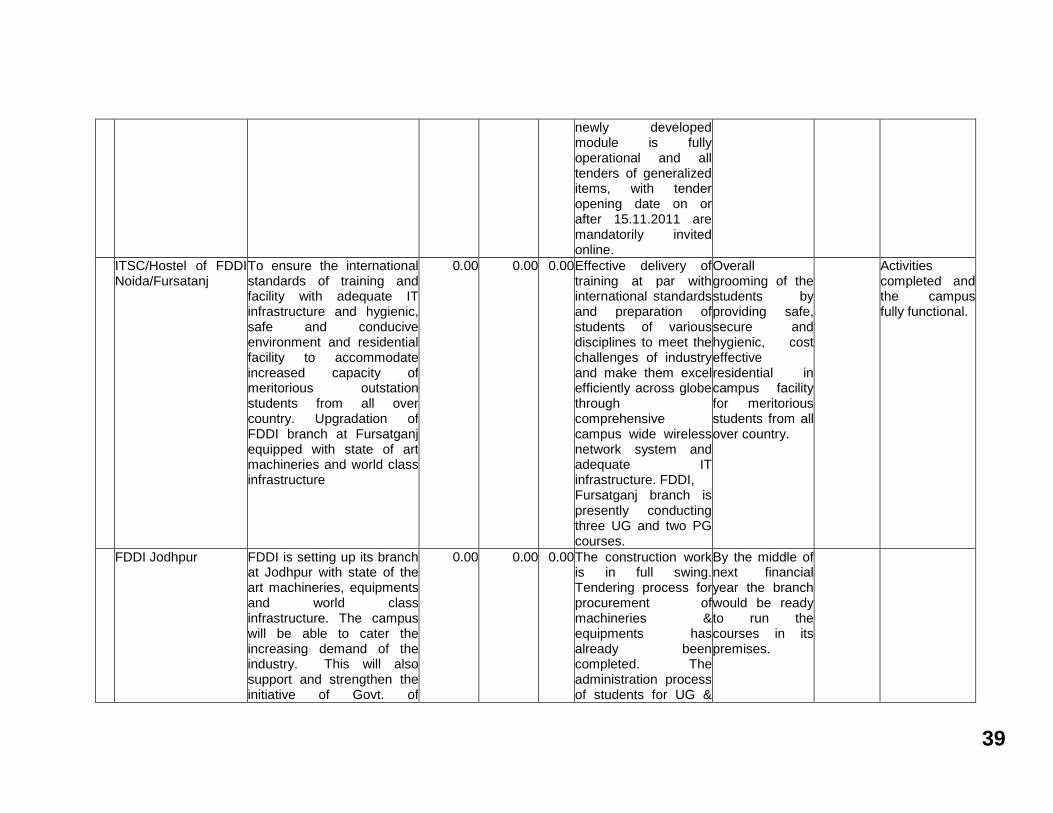
39
newly developed module is fully operational and all tenders of generalized items, with tender opening date on or after 15.11.2011 are mandatorily invited online.
ITSC/Hostel of FDDI Noida/Fursatanj
To ensure the international standards of training and facility with adequate IT infrastructure and hygienic, safe and conducive environment and residential facility to accommodate increased capacity of meritorious outstation students from all over country. Upgradation of FDDI branch at Fursatganj equipped with state of art machineries and world class infrastructure
0.00 0.00 0.00 Effective delivery of training at par with international standards and preparation of students of various disciplines to meet the challenges of industry and make them excel efficiently across globe through comprehensive campus wide wireless network system and adequate IT infrastructure. FDDI, Fursatganj branch is presently conducting three UG and two PG courses.
Overall grooming of the students by providing safe, secure and hygienic, cost effective residential in campus facility for meritorious students from all over country.
Activities completed and the campus fully functional.
FDDI Jodhpur FDDI is setting up its branch at Jodhpur with state of the art machineries, equipments and world class infrastructure. The campus will be able to cater the increasing demand of the industry. This will also support and strengthen the initiative of Govt. of
0.00 0.00 0.00 The construction work is in full swing. Tendering process for procurement of machineries & equipments has already been completed. The administration process of students for UG &
By the middle of next financial year the branch would be ready to run the courses in its premises.

40
Rajasthan to promote industrial growth of the state.
PG programme is being initiated along with other branches.
Total(Modernization Up gradation)=
12.
Contributions to International Organisations
0.00 32.00 0.00 Released annual contribution for GSTP for 2012-13 US$ 15000.
13.
International Conferences
0.00 0.50 0.00
14.
Scheme for Central Assistance to the States for developing infrastructure and other allied activities(ASIDE)
The objective of the scheme is to involve States/UTs in export infrastructure development and finally achieve higher export growth.
640.00 0.00 0.00 Every export infrastructure project carries number of social objectives with like employment generation, growth in per-capital income, growth in human development index, increase in connectivity etc. Hence is not possible to quantify the achievement of objectives by individual project.
NER under ASIDE 100.00 0.00 0.00
SCSP under ASIDE 60.00 0.00 0.00
Total(ASIDE)= 800.00 0.00 0.00
Jem & Jewellery Sector
15.
Convention centre in Mumbai
0.01 0.00 0.00
16.
Common Facility Centre
0.48 0.00 0.00
17.
Gem bourse in Jaipur 0.48 0.00 0.00
18.
Gems and Jewellery Park in Mumbai
0.01 0.00 0.00

41
19.
Jewellery Sector 0.02 0.00 0.00
Total(Jewellery Sector)= 1.00 0.00 0.00
Leather and Leather product Sector
20.
New Branches of FDDI
108.50 0.00 0.00
21.
Networking Centre(FDDI CNC)
1.00 0.00 0.00
22.
Creation of Venture Capital Fund for corporisation of leather sector- creation of seed fund
0.50 0.00 0.00
Total(Leather & Leather Products Sector)=
110.00 0.00 0.00
Pharma Sector
23.
Venture Capital Fund 0.00 0.00 0.00
24.
Boisimilar/ Bioequivalent studies
0.01 0.00 0.00
Total(Pharma Sector)= 0.01 0.00 0.00
25.
Others 0.00 1.40 0.00
26.
Tea
Programme Component
Increase production, improve quality and value addition and change the product mix for producing more orthodox teas, increase domestic consumption & export of Indian tea by supporting the exporter in their marketing endeavour, extend support to the Tea Research Institutes, encourage small
114.00 39.00 0.00 Production 1080 mkg Export 218 mkg, Extension Planting 1000 ha, Replanting/ replacement planting 7000 ha, Rejuvenation 1000 ha, Irrigation 2000 ha , New Planting 1000 ha, SAGs of small growers 75 nos.,
Increase in production and productivity, quality improvement, better price realization, awareness generation of origin specific teas like Assam, Darjeeling,
12th Plan
(2012-17)
Small Growers Development Scheme
5.00 0.00 0.00
Implementation of regulatory provision of Tea Act including e-auction and allied activities
1.00 0.00 0.00
Lump sum provision for projects/schemes for the benefit of
50.00 0.00 0.00

42
North Eastern region and Sikkim
tea growers in collectivization and formation SHGs, providing incentives to exports under transport subsidy, supporting welfare measures for the benefit of tea garden workers
Kangra & Nilgiri, increase trade activities, creation of visibility of Indian brands overseas, increase in exports.
SCSP 20.00 0.00 0.00
Total(Tea)= 190.00 39.00 0.00
27.
Coffee
Coffee Board To achieve sustainability in Indian coffee production through R&D support, Transfer of Technology through extension centers. Extend development support for re plantation, water augmentation, quality up gradation & pollution abatement measures.
87.00 39.80 0.00 Research support in the form of providing high yielding, disease tolerant plant material, pest, disease management, transfer of technology from lab to land by the extension centers, providing financial support to the coffee growers
Production target: 334800 MT(P), Estate visists-20000 nos. re plantation/ expansion – 5500 ha, expansion/ consolidation – 550 Ha
2013-14 of XII Plan Period
Adverse Weather conditions, outbreak of pest & disease due to climatic changes
Lump sum provision for projects/schemes for the benefit of North Eastern region and Sikkim
To undertake coffee development related activities to improve production and productivity in North Eastern Region Development Programmes in nontraditional area.
23.00 0.00 0.00 Providing financial support to the growers for coffee development and infrastructure facilities for improving production productivity and quality of coffee.
Expansion/ Consolidation on – 550 Ha. Quality Up gradation – 365 Units
2013-14 of XII Plan Period
Investment capacity and quantum of support
SCSP 5.00 0.00 0.00
Total(Coffee)= 115.00 39.80 0.00
28.
Rubber
Programme Component
To increase natural rubber production, productivity,
120.00 37.50 10.00 Planting 7000 ha Tribal settlement 75 ha,
Increase in rubber
2013-14

43
enhancement, promotion of extension activities, etc.
generation of quality planting materials 7 lakh nos., farmer education programmes & field training – 10000 participants, apiculture – 2500 nos. irrigation: 100 ha, boundary protection 150 ha
production through expansion of cultivation, replanting, uneconomic holdings and promoting the adoption of productivity enhancing agronomic practices
Statistical Information Services and e-Governance
0.01 0.00 0.00
Nirayat Bandhu Scheme
1.00 0.00 0.00
Office/Residential Building
2.97 0.00 0.00
Training /Capacity Building
1.00 0.00 0.00
IIP 0.01 0.00 0.00
Lump sum provision for projects/schemes for the benefit of North Eastern region and Sikkim
40.00 0.00 0.00
SCSP 10.00 0.00 0.00
Total(Rubber)= 174.92 37.50 0.00
29.
Spices
Spices Board Increase production and productivity of cardamom, quality of produce, export of spices, Trade promotion, development of spices in NE, post harvest
90.00 9.35 0.00 Export : 622000 tons (value Rs. 9800 cr.), Replantation (1820 ha) Irrigation & land development (720 ha), Replanting 500 ha,
Overall production development of cardamom, post harvest & quality improvement of
2013-14
Lump sum provision for projects/schemes for the benefit of North Eastern region and Sikkim
10.00 0.00 0.00

44
SCSP improvement of spices, organic cultivation of spices, extension of advisory service, replantation & rejuvenation of pepper in wayanand district of Kerala and NE states, marketing services, publicity & public relations , improvement of skill.
5.00 0.00 0.00 New planting 400 ha, organic seed bank 20 ha, establishment of export oriented processing units 3 nos., , 50000 sample analysis, quality improvement training (40000 persons)
spices, increase in export of spices, post harvest quality improvement, capture and expand business opportunities, introduction of new end products.
Total(Spices)= 105.00 0.00 0.00
30..
Cashew Export Promotion Council
Identification of new buyers, markets, understanding latest market trends/requirements, creating awareness about the industry, availability, capacity to deliver, quality standard, Market scenario, interaction with buyers and sellers and thereby promoting exports.
1.00 0.00 0.00
31.
Other Schemes of Plantations
PSFT To provide relief to small growers when the prices of coffee, tea, rubber and tobacco fall below a specified level, without resorting to the practice of procurement operations by Government agencies.
0.00 0.10 0.00 As on 31.12.2012, 46243 growers have enrolled under the scheme, cumulative committed financial assistance under the scheme stood at Rs 6.22 crore
PSF Scheme payout – 29186 growers, Modified PAIS – 57.17 lakh growers/workers
2013--14
Crop Insurance 0.00 0.00 0.00
Total(Other Schemes of Plantations)=
0.00 0.00 0.00
33..
Supplies & Disposals

45
DGS&D This Directorate is for finalization of Rate Contracts for common user items, procurement, inspection, shipment and clearance of stores. The provision is for administrative expenditure of the DGS&D and its regional offices
0.00 81.50 0.00 Administrative expenses
Grand Total (Grant No11)= 2226.00 3165.00 0.00

46
CHAPTER III
REFORM MEASURES AND POLICY INITIATIVES
Policy making is a dynamic and continuous process involving necessary
periodic interventions with a view to achieving the stated objectives and to fulfill the
desired goals. Sustained accelerated growth of exports and trade is the primary goal
being followed by the Department of Commerce. Since global economic outlook is a
major determinant of export performance of any country. Export growth cannot,
therefore, be viewed in isolation from economic outlook in the world economy.
Department of Commerce endeavors for doubling merchandise exports in three
years from US $ 251.14 billion in 2010-11 to US $ 500 billion in 2013-14. Exports
are envisaged to increase at compounded average growth of 26.7% per annum. The
shares of top five Principal Commodity Groups in India’s total exports during 2012-
13 (April-December) are Petroleum (Crude & Products) 10.9%, Gems & Jewellery
14.8%, Transport Equipments 6.3%, Machinery and Instruments 5.2%, Drugs,
Pharmcutes & Fine Chemicals 5.1% & Others 49.8%.In consonance with the
Government’s vision of making India a major player in the world trade, the Foreign
Trade Policy (FTP) is announced every five years that provides the basic policy
framework of translating this vision into specific strategies, goals and targets and
since has been reviewed on 13.10.2011 in order to boost and expand the export and
the following initiatives has been taken:
The objectives of the Foreign Trade Policy (FTP), 2004-09 was doubling of
India’s share in global trade in the next five years and making trade an effective
instrument of economic growth by giving a thrust to employment generation. The
Policy, with clearly enunciated objectives and strategies and necessary initiatives
taken by the Government during the last five years, has been very effective in
putting India’s exports on a higher growth trajectory. The Indian exports grew from
US$ 83.5 billion in 2004-05 to US$ 185.3 billion in 2008-09, registering an average
annual growth rate of about 24%. As far as giving special thrust to employment
generation is concerned, sectors with significant export potential coupled with
employment generation in semi-urban and rural areas were identified and specific
sectoral strategies were prepared.
The Foreign Trade Policy (FTP), 2009-14 was announced by the Government
on 27th August, 2009. The new Policy was unveiled in the backdrop of
unprecedented economic slow-down and one of the most severe global recessions
in the post-war period that affected countries across the globe in varying degrees.
The short term objective of FTP (2009-14) is to arrest and reverse the declining
trend of exports and to provide additional support especially to those sectors which

47
have been hit badly by recession in the developed world. The Policy also aims to
achieve an annual export growth of 15% with an annual export target of US$ 200
billion by March, 2011.
The medium/long term objectives of the Policy include:
(i) Achieving an export growth of about 25% per annum in the remaining
three years of the FTP (2009-14).
(ii) Doubling of India’s exports of goods and services by 2014.
(iii) Doubling of India’s share in global trade by 2020.
Trade Policy Measures taken by the Government in 2009-10 and 2010-11
focused on reviving exports and exports related employment. Many measures
were undertaken at the time of release of the FTP, 2009-14, announcements
made in January / March, 2010 and in the Annual Supplement to FTP released
in August, 2010.
Additional measures were taken on 11.2.2011 to help the exports sector in
general and the employment intensive sectors effected by the World recession,
in particular. Export incentives were announced for more than 600 products (in
respect of their exports with effect from 1/1/2011) in labour intensive and / or
technology intensive sectors like agriculture, chemicals, carpets, engineering,
electronics and plastics to enhance their competitiveness.
Some of these measures undertaken in the FTP, 2009-14 are given in Box 3.1.
Box 3.1
Trade Policy Measures taken under Foreign Trade Policy 2009-14
and thereafter
A. Market and product diversification and expansion of markets:
I. Measures undertaken in FTP 2009-14, January / March, 2010 and in Annual
Supplement, 2010-11:
27 new markets added under Focus Market Scheme (FMS) with incentive
of duty credit scrip @ 3% of exports.
Market Linked Focus Product Scheme (MLFPS) with incentive of duty
credit scrip @ 2%, has been significantly broadened by inclusion of a
large number of products linked to their markets.

48
Full Africa, Latin America and large part of Oceania covered under FMS &
MLFPS (13 countries added in MLFPS at the time of release of FTP,
2009-14 in August, 2009 and 2 countries added in January, 2010).
The incentive available under FMS has been raised from 2.5% to 3%; and
for Focus Product Scheme (FPS) & MLFPS from 1.25% to 2%; and
Special Focus Products Scheme @ 5%.
Additional benefit of 2% bonus, over and above the existing benefits of
5% / 2% under FPS, allowed for about 135 existing products, which had
suffered due to recession in exports. Major sectors include all Handicrafts
items, Silk Carpets, Toys and Sports Goods (all of which were earlier
eligible for 5% benefits), Leather Products and Leather Footwear,
Handloom Products and some of the Engineering Items including Bicycle
parts and Grinding Media Balls (all of which were earlier eligible for 2%
benefit).
256 new products added under FPS (at 8 digit level), which became
entitled for benefits @ 2% of FOB value of exports to all markets. Major
Sectors / Product Groups covered are Engineering, Electronics, Rubber &
Rubber Products, Other Oil Meals, Finished Leather, Packaged Coconut
Water and Coconut Shell worked items.
Instant Tea and CSNL Cardinol included for benefits under Vishesh Krishi
and Gram Udyog Yojana (VKGUY) @ 5% of FOB value of exports.
Nearly 300 products (at 8 digit level) from the readymade garment sector
incentivised under MLFPS for further 6 months from October, 2010 to
March, 2011 for exports to 27 EU countries.
II. Additional measures announced on 11th February, 2011:
Under Market Linked Focus Product Scheme (MLFPS):-
1. 335 New Products incentivised under MLFPS at 8 digit level, eligible
for benefits @ 2% of FOB value of exports to 15 specified markets like
Agricultural Tractors of more than 1800 cc, all inorganic chemicals and
inorganic / organic compounds of metals, Flexible Intermediate Bulk
Containers and Narrow Woven Fabrics;
2. 71 new products of Chapter 63 (Textile Made ups) at 8 digit level for
exports to EU (27 Countries).
Under Focus Product Scheme (FPS):-
1. 147 products incentivized for Bonus Benefits (additional 2%) under
FPS at 8 digit level, henceforth eligible for benefits @ 4% or 7% of

49
FOB value of exports to all markets. These includes Engineering
items, Electronic items, Stationery items, Handmade carpets and other
Floor Coverings under Chapter 57 (7%);
2. 57 New products incentivized under FPS at 8 digit level, eligible for
benefits @ 2% of FOB value of exports to all markets. These include
products from Sectors viz. Engineering, Chemical, paper products etc.
Under Special Focus Products Scheme (SFPS), Egg powder included for
benefit @ 5% of FOB value of exports.
Under Vishesh Krishi and Gram Udyog Yojana (VKGUY), 6 New products
(Castor Oil Meal – Defatted Variety and Instant Coffee) incentivised under
VKGUY at 8 digit level, eligible for benefits @ 5% of FOB value of exports
to all markets.
B. Support for Technological up-gradation
Zero duty Export Promotion Capital Goods (EPCG) scheme and Status
Holder Incentive Scrip (SHIS) scheme introduced in 2009 for limited
sectors and valid for only 2 years initially, extended by one more year till
31.3.2012 and the benefit of the scheme expanded to additional sectors.
3 Additional Towns of Export Excellence (TEEs) announced, bringing the
list upto 24.
C. Availability of concessional Export Credit:
Interest subvention of 2 per cent extended upto March 2011 for certain
labour-intensive sectors of exports namely handloom, handicrafts, carpet,
SMEs and a few products from the sectors namely engineering, textiles,
leather and jute.
Interest rates on export credit in foreign currency reduced to LIBOR + 200
basis points in February 2010 from the earlier LIBOR+350 basis points.
D. EOUs / STPIs:
Section 10A and 10B (Sunset clauses for STPI and EOU schemes
respectively), extended for the financial year 2010-2011. Anomaly
removed in Section 10AA relating to taxation benefit of ‘unit vis-à-vis
assessee’.
E. Services:
FTP also provided fillip to services sector (Hotels) by doubling duty free
entitlement under Served from India Scheme (SFIS) from 5% to 10% of
foreign exchange earnings.
F. Others:
Duty Entitlement Passbook (DEPB) scheme extended beyond 31.12.2010
till 30.06.2011.
Time period of export realization for non-status holder exporters increased
to 12 months, at par with the Status holders. This facility has been
extended upto 31.3.2011.

50
Advance Authorization for Annual Requirement now exempted from
payment of Anti-dumping & Safeguard duty. The Scheme has been made
more flexible for import of required inputs.
Value limit on duty free import of commercial samples enhanced from Rs.
1 lakh to Rs. 3 lakh per annum.
DEPB and Freely Transferable Incentive Schemes provisionally allowed
without awaiting receipt of Bank Realisation Certificate (BRC).
Export Obligation Period under Advance Authorization Scheme enhanced
from 24 months to 36 months without payment of composition fee.
To facilitate tracing and tracking of pharmaceutical products and hence to
provide assurance about the quality of Indian pharma products to
prospective importers, requirement of affixing bar codes has been made
mandatory w.e.f. 01.07.11.
A new facility of Input combination for pharma products manufactured
trough Non-Infringing process, allowing actual quantum of duty free inputs
required for manufacturing such export product, has been introduced.
This will facilitate pharma manufacturers to work towards getting a major
share of exports of such products to potential regulated markets such as
US or EU.
Facilitation of Trade through various Electronic Data Interchange (EDI)
initiatives taken on online message exchange facility.
Additional facility of filing “online” application for obtaining IEC introduced.
Measures announces in the Annual Supplement to FTP on 5th June, 2012
7 new markets have been added to Focus Market Scheme (FMS). These
countries are Algeria, Aruba, Austria, Cambodia, Myanmar, Netherland
Antilles, and Ukraine.
7 new markets have been added to the Special Focus Market Scheme
(Special FMs). These countries are Belize, Chile, El Salvador, Gautemala,
Honduras, Morocco, and Uruguay.
46 new items have been added to Market Linked Focus Product Scheme
(MLFPS). This has the effect of including 12 new markets for the first time.
100 new items have been added to the Focus Product Scheme (FPS) list.
3 new items have been added to VKGUY. These are roasted cashew kernel,
and protein concentrates & textured protein substances.
3 new towns have been declared as Towns of Export Excellence (TEE).
These are Ahemedabad (Textiles, Kolhapur(Textiles), and Saharanpur
(Handicrafts).
Export of specified products through notified Land Customs Stations of North
Eastern Region has been provided additional incentive to the extent of 1% of

51
FOB value of exports. This benefit is in addition to any other benefit that may
be available under Foreign Trade Policy in respect of these exports.
Now Duty Credit Scripts shall be permitted to be utilized for payment of
Excise Duty for domestic procurement. Earlier only scrips under SFIS
were so permitted for procurement of goods from domestic market so as to
encourage manufacturing, value addition and employment. This will be an
important measure for import substitution and will help in saving of foreign
exchange in addition to creating additional employment.
It is now decided that up to 10% of the value of Status Holders Incentive
Scrip (SHIS) will be allowed to be utilized to import components and
spares of capital goods imported earlier. Since a status holder may or
may not have manufacturing facility, it is now decided to allow limited
transferablility of SHIS script. However, such Transferee shall have to (a)
be a status holder and (b) have manufacturing facility.
Now agri. Infra scrips will be eligible for import of 14 specified equipments for
setting up of Pack-houses.
Measures announced as Trade Facilitation measures by widening and deepening of export incentives under Chapter 3 of FTP in December, 2012 to be made effective from 01.01.2013.
5 new markets have been added to Focus Market Scheme (FMS). These countries are Cayman Islands, New Zealand, Latvia, Lithuania and Bulgaria.
One new market i.e. Eritrea have been added to the Special Focus Market Scheme (Special FMS).
62 new items have been added to Market Linked Focus Product Scheme (MLFPS).
102 new items have been added to the Focus Product Scheme (FPS) list.
Additional Incentives
2% Interest Subvention Scheme was earlier available only to Handloom,
Handicrafts, SMEs and Carpets. In June, 2012, it had been extended to
labour intensive sectors, namely, Toys, sports goods.
Further, the scheme has been widened to include 134 sub sectors of
Engineering Sector w.e.f. 1st January, 2013. The validity of the scheme has
been extended till March 31, 2013.
Incremental Exports Incentivisation Scheme has been announced. Incentive
will be admissible only if the IEC holder has achieved growth in the financial
year 2012-13 vis a vis financial year 2011-12. The policy pertaining to
Incremental Export Incentive Scheme is given in para 3.14.4 of FTP and
procedure is as per Para 3.8.3 in the Handbook of Procedures Vol.I.
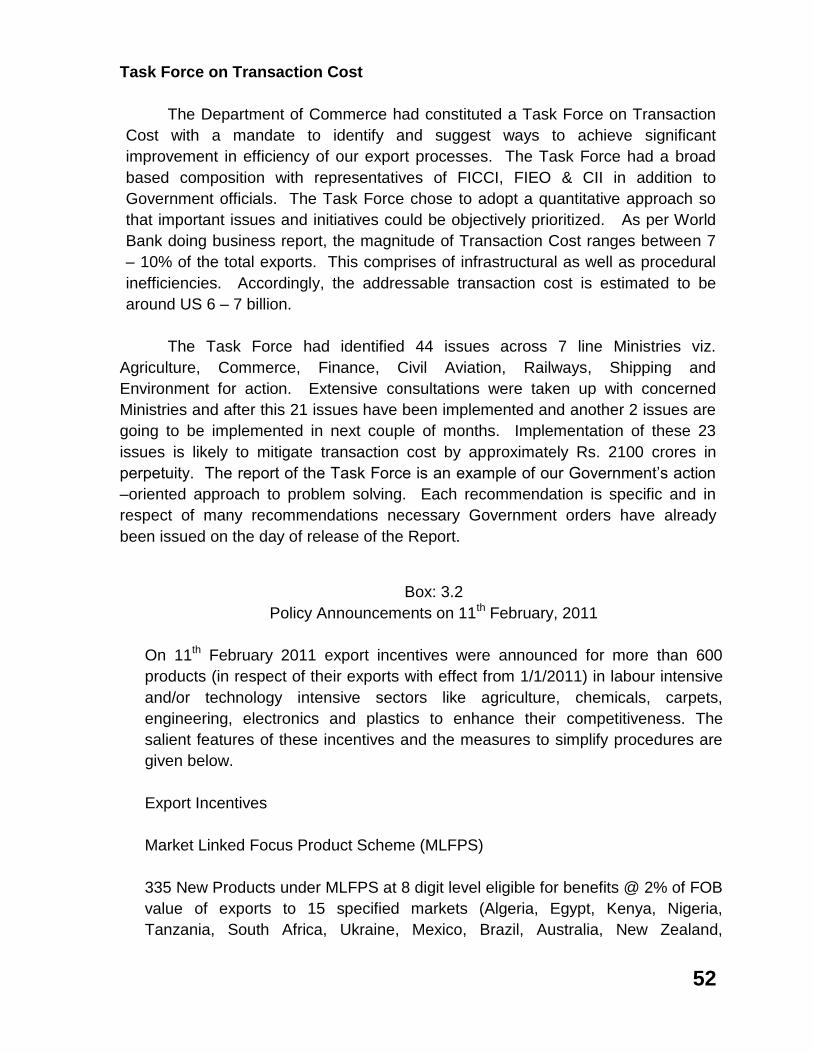
52
Task Force on Transaction Cost
The Department of Commerce had constituted a Task Force on Transaction
Cost with a mandate to identify and suggest ways to achieve significant
improvement in efficiency of our export processes. The Task Force had a broad
based composition with representatives of FICCI, FIEO & CII in addition to
Government officials. The Task Force chose to adopt a quantitative approach so
that important issues and initiatives could be objectively prioritized. As per World
Bank doing business report, the magnitude of Transaction Cost ranges between 7
– 10% of the total exports. This comprises of infrastructural as well as procedural
inefficiencies. Accordingly, the addressable transaction cost is estimated to be
around US 6 – 7 billion.
The Task Force had identified 44 issues across 7 line Ministries viz.
Agriculture, Commerce, Finance, Civil Aviation, Railways, Shipping and
Environment for action. Extensive consultations were taken up with concerned
Ministries and after this 21 issues have been implemented and another 2 issues are
going to be implemented in next couple of months. Implementation of these 23
issues is likely to mitigate transaction cost by approximately Rs. 2100 crores in
perpetuity. The report of the Task Force is an example of our Government’s action
–oriented approach to problem solving. Each recommendation is specific and in
respect of many recommendations necessary Government orders have already
been issued on the day of release of the Report.
Box: 3.2
Policy Announcements on 11th February, 2011
On 11th February 2011 export incentives were announced for more than 600
products (in respect of their exports with effect from 1/1/2011) in labour intensive
and/or technology intensive sectors like agriculture, chemicals, carpets,
engineering, electronics and plastics to enhance their competitiveness. The
salient features of these incentives and the measures to simplify procedures are
given below.
Export Incentives
Market Linked Focus Product Scheme (MLFPS)
335 New Products under MLFPS at 8 digit level eligible for benefits @ 2% of FOB
value of exports to 15 specified markets (Algeria, Egypt, Kenya, Nigeria,
Tanzania, South Africa, Ukraine, Mexico, Brazil, Australia, New Zealand,

53
Cambodia, Vietnam, China and Japan). Some examples are Agricultural Tractors
of more than 1800 cc; all inorganic chemicals and inorganic/organic compounds
of metals of Chapter 28; Flexible Intermediate Bulk Containers; and Narrow
Woven Fabrics.
71 new products of Chapter 63 (Textile Made ups at 8 digit level) for exports to
EU (27 Countries) under MLFPS for benefits @ 2% of FOB value of exports.
Focus Product Scheme (FPS)
147 products for Bonus Benefits (additional 2%: thus total benefit 4 % or 7 %)
under FPS at 8 digit level for export to all markets. Some examples are:
Engineering Items like Galvanized Flanges on Iron and Steel, Threaded Nuts
(7%); Ferro & Silico Manganese; Electronic Items like co-axial cables and other
co-axial electric conductors, Watches; Stationery items like Pencils, Pens; Textile
Items like Silk (of Chapter 50), Grey Rayon Tyre Cord Fabric, and Handmade
Carpets and other Floor Coverings under Chapter 57 (7%).
57 New products under FPS at 8 digit level eligible for benefits @ 2% of FOB
value of exports to all markets.
Special Focus Products: 1 product (Egg powder) under Special Focus Product at
8 digit level eligible for benefits @ 5% of FOB value of exports to all markets.
Vishesh Krishi and Gram Udyog Yojana (VKGUY):
6 New products (Castor Oil Meal – Defatted Variety and Instant Coffee) under
VKGUY at 8 digit level, eligible for benefits @ 5% of FOB value of exports to all
markets.
Procedural Simplifications
The report of the Task Force on transaction costs has been released by Hon’ble
Finance Minister on the 8th February 2011. Action on 23 issues by different line
ministries is likely to reduce transaction cost to the tune of Rs. 2100 crores in
perpetuity.
In order to make filing and issuance of IE Code hassle free with minimum human
interface between the applicant and the Regional Offices, an additional facility of
filing “on-line” application for obtaining IEC is being introduced.
The scope of Advance authorization for Annual Requirement is being enlarged to
allow a maximum of five authorizations in a licensing year (instead of only one at
54
present) for the product(s) falling within the same product group.
Technical characteristics / quality etc of certain specified items of imports shall be
required to be declared at the time of clearance of import consignment and not at
the time of filing application (current stipulation) for annual advance authorization
to Regional authority. By this facility, the exporter shall have the flexibility to
import the relevant inputs, without the need to approach the Regional authority of
DGFT to amend the authorization for clearance of such consignment.
The period to fulfill the export obligation under advance authorization scheme 36
months from the date of issuance of the authorization. However this period is
shorter for products being manufactured from certain duty free imported inputs,
which are sensitive from domestic angle. In such cases, the period for fulfillment
of export obligation is presently counted from the date of clearance of first import
consignment even when a number of consignments have been cleared in
different dates. Henceforth, with a view to provide greater flexibility, Export
obligation period in such shorter EO period cases of advance authorizations shall
be counted from the date of clearance of each consignment and not the first
consignment. This will allow a more reasonable time period for EO fulfillment to
exporters.
Improving Quality and deepening market access
Initiatives for pharma sector are as under:
Exporters of pharmaceutical products will be required to affix barcodes on their
export products, with effect from 1st July 2011, as per GS 1 global standards, to
facilitate tracing and tracking of their products. This will provide assurance about
the quality of Indian pharma products to prospective importers.
We are providing a new facility of Input combination for pharma products
manufactured through Non-Infringing process, allowing actual quantum of duty
free inputs required for manufacturing such export product. This will facilitate our
pharma manufacturers to work towards getting a major share of exports of such
products to potential regulated markets such as US or EU.
Trends in Authorisations
Trends of authorizations issued under Export promotion & duty neutralization
schemes of Foreign Trade Policy during the period April, 2012- Nov., 2012 are
indicated below. During the period April 2012–Nov., 2012, a total of 1, 27,726

55
authorisations having CIF/Duty credit value of Rs.1, 95,531 Crore and FOB/Export
Obligation of Rs. 4, 78,622 Crore have been issued. This represents a decrease of
28.89% in number, 3.07% increase in CIF/Duty credit value and decreasing 22.9%
in FOB value/EO over the corresponding period of last year.
Some of the major policy initiatives undertaken by the Department during the
year are given below:
a) Exports of all Garments under Chapters 61 and Chapter 62 of ITCHS
Classification of Export and Import incentivized under the Market Linked
Focus Product Scheme (MLFPS), for duty credit scrip @ 2% of FOB value of
exports to USA and European Union from 1.4.2011 to 31.3.2012.
b) Special Bonus Benefit Scheme has been announced to provide duty credit
script @ 1% of FOB value of exports from 1.10.2011 till 31.3.2012 covering
49 products in Engineering, Pharmaceutical and Chemical sectors
c) Special Focus Market Scheme (SFMS) has been announced to provide
additional duty credit script @ 1% of FOB valued of exports to 41 markets
under FMS from 1.4.2011.
d) 130 additional items mostly from Ch Chemical/Pharmaceuticals, Textiles,
Handicrafts, Engineering and Electronics sector included in Focus Product
Scheme(FPS) for duty credit scrip @ 2% of FOB value of exports with effect
from 1.4.2011.
e) Market Linked Focus Product Scheme (MLFPS) has been extended to cover
new items to specified countries for duty credit scrip @ 2% of FOB value of
exports with effect from 1.4.2011.
f) The Status Holders Incentive Scrip (SHIS) scheme has been extended for
2012-2013 also.
Exporters of pharmaceutical products have been mandated to affix bar codes
on their export products w.e.f. 1st October, 2011 on the tertiary packs as per GS 1
global standards, to facilitate tracing and tracking of their products. This will provide
assurance about the quality of Indian pharma products to prospective importers as
also prove the Made in India products in case of any dispute.

56
A new facility of Input combination for pharma products manufactured through Non-
Infringing process has been given viz., allowing actual quantum of duty free inputs
required for manufacturing such export product. This will facilitate our pharma
manufacturers to work towards getting a major share of exports of such products to
potential regulated markets such as US, EU and other markets.
I. National Export Insurance Account (NEIA)
A separate Fund with an approved corpus of Rs. 2, 000 crore called the
National Export Insurance Account (NEIA) was set up in 2006, out of which Rs. 916
crores have been funded by the Government so far. During the year 2012-13, Rs.
30 crores allocated for NEIA has been released.
The objectives of NEIA is to promote project export from India, which may not
take place but for the support of a credit risk insurance cover which the ECGC is not
in a position to provide because of its own underwriting capacity. The NEIA is
maintained and operated by a Public Trust set up jointly by the Department of
Commerce and ECGC.
NEIA guidelines have been revised to provide risk cover for buyer credits
which may be extended by EXIM Bank to overseas agencies. Under the revised
guidelines projects which are backed by sovereign guarantees will be covered for
100% of value, without recourse, to deserving exporters. Provisions have also been
made to cover the risks arising due to exchange and interest fluctuations.
II. Market Access Initiative (MAI) Scheme
The Market Access Initiative (MAI) Scheme is a Plan Scheme formulated to
act as a catalyst to promote India’s exports on a sustained basis, based upon
‘Focus Product’ and ‘Focus Market’ concept. The Scheme was revised after a
thorough review and extensive consultation with all the stake holders in the year
2006 and the revised scheme was launched with effect from January, 2007. The
revised scheme embodies enhancement of scope of the scheme, increase in the
number of eligible agencies and increase in scale of assistance.
Under the scheme, assistance is extended to the Departments of Central
Government and organizations of Central/State Government, Export Promotion
Councils, Registered Trade Promotion organizations, Commodity Boards,
Recognized Apex Trade Bodies, Recognized Industrial Clusters and individual
Exporters for product registration and testing charges for engineering products
abroad, Indian Missions, National Level institutions like Indian Institutes of
Technology (IITs), Indian Institutes of Management (IIMs), National Institute of

57
Fashion Technology (NIFT) etc., Research Institutions, Universities and recognized
laboratories.
The activities eligible for financial assistance under the Scheme are
Marketing Projects Abroad, Capacity Building, Support for Statutory Compliances,
Studies, Project Development etc.
Rs. 129.99 crore has been allocated during 2012-13 for MAI scheme. During
the year, financial assistance under MAI was provided to 158 projects/export
promotion events, etc. to eligible agencies which include export promotion councils,
trade promotion organizations, national level institutions, etc. The 12th Plan
allocation for the scheme is Rs. 820 crores.
III. Marketing Development Assistance (MDA) Scheme
To facilitate various measures being undertaken to stimulate and diversify the
country’s export trade, Marketing Development Assistance (MDA) Scheme is under
operation through the Department of Commerce.
The Non-Plan scheme supports the following activities:
(i) Assist exporters for their participation in approved EPC/Trade Promotion
Organizations led export promotion events abroad.
(ii) Assist Export Promotion Council (EPCs) to undertake export promotion
activities for their product(s) and commodities.
(iii) Assist approved organizations/ trade bodies in undertaking exclusive
nonrecurring innovative activities connected with export promotion efforts
for their members.
(iv) Assist Focus export promotion programmes in specific regions abroad like
FOCUS (LAC), Focus (Africa), Focus (CIS) and Focus (ASEAN + 2).
(iv) Residual essential activities connected with marketing promotion efforts
abroad.
IV. Initiatives in Plantation Sector
Plantation crops have been the traditional exports of India providing
employment to millions of workers. Ageing bushes/plants which result in low
productivity, high cost of production, low value addition, lack of strong buildup of
‘Brand India’ and volatility of international demand and prices are the major
constraints facing the sector. Some of the major initiatives undertaken in this sector
during the year to promote this sector include:

58
A. TEA
Reform measures in Tea Sector:
1. Tea Plantation Development Scheme The main objective of the Tea Plantation Development Scheme is to
encourage the tea plantations in undertaking various field oriented developmental
measures aimed at increasing field productivity and decreasing cost of production.
In order to achieve these objectives, and given the high cost of production mainly
due to the labour cost accounting for more than 60% of the total cost of production
and high fluctuation in the tea prices, it has become necessary to continue the
scheme during XII Plan period for providing financial incentives in the form of
subsidy for a set of activities to be undertaken by the growers. When compared to XI
Plan scheme, the following changes have been proposed for the XII Plan period.
Extension Planting: Given in the imbalance in demand and supply,
extension planting was not encouraged during the previous two plan periods.
It was however allowed on a limited scale for small growers particularly in NE
Region and Hilly areas. During the course of last ten years while the overall
supply was around 130 million kgs the domestic demand was in the order of
170 million kgs leading to a gap of 40 million kgs. In order to bridge this gap it
is proposed to extend support for new planting by way of subsidy @ 25% of
the planting cost.
Irrigation: The irregularity in the monsoon (both in terms of lack of adequate
rainfall and prolonged dry period) is forcing the industry to invest on irrigation
infrastructure. Moreover, large scale replanting would bring large area under
young bushes. These young sections require irrigation much more than older
sections. Hence, irrigation should be a focus area for the XIIth Plan period.
Currently the irrigation subsidy being offered is 25% of the total expenditure
subject to a maximum of Rs. 10,000 per Ha. Moreover, the total expenditure
per garden is also capped at a maximum of Rs. 10 Lakhs. Considering the
current cost of creating irrigation facility – tube wells, check-dams, sprinklers,
drip irrigation etc (Estimated to be around Rs. 80,000 per ha), it is proposed
to offer subsidy @ 25% of the actual cost not exceeding Rs.80,000/ha and
raise the ceiling limit per garden to 200 ha.
Subsidy for Field Mechanization: Due to growing problem of labour scarcity
across the producing regions (more predominant in South India), the industry
needs to explore use of mechanization and use of new technology for

59
activities that are traditionally undertaken manually. Accordingly, it is
proposed to incentivize use of following field mechanization equipment’s:
Mechanical harvesting equipment
Pruning machines
JCV machines
SPTF: Special Purpose Tea Fund was formulated for assisting the tea
gardens in undertaking replanting, replacement planting and rejuvenation of
old aged tea bushes so that the industry becomes more viable, competitive
and financially sustainable. During XI Plan, Tea Board through Special
Purpose Tea Fund (SPTF) tried to address this issue by extending a loan
component in addition to subsidy. However, the loan component has not
received adequate response. The performance of the scheme has been
critically reviewed by the CAG through a separate performance Audit and
recommended for adequate compensation of the crop loss due to uprooting.
Keeping this in view it is proposed to modify the existing scheme with
additional features as under:
Withdrawal of loan component
Revision of unit cost and revise the subsidy rate from 25% to 30%
Encourage gardens to have own nursery: Use of good quality planting
materials as prescribed by research institutions have a lasting impact on the
long term sustainability of the industry. In order to encourage tea gardens
establishing their own nurseries, it is proposed to advance 25% of the
subsidy up front out of the total subsidy payable under the scheme on
completion of replanting. The advance shall be adjusted against the subsidy
payable for replanting.
Relaxation of age limit for closed tea gardens: The subsidy is permitted
only for uprooting and replanting of the sections which are 50 years and
above. It is proposed to relax this age limit in the case of gardens that were
closed and abandoned for three consecutive years immediately prior to the
year of application. In case of such gardens, age would not be a factor for
sanction and release of subsidy provided TRA/ UPASI-TRF certifies
uprooting and replanting as the best option for revival of the concerned
section.
Tea Quality Up-gradation and Product Diversification Scheme (QUPDS) o The main objective of QUPDS is to serve as a catalyst for tea
factories/ blending/ packaging units to undertake investments in modern
technologies/ processes (either for expansion or for replacement), which
would eventually enable quality improvement, and higher realizations through

60
the production of better quality/ value added teas. The important components
to be supported under the scheme would include:
Quality assurance certification – ISO/HACCP and Organic Tea Certification
Value Addition in packaging and blending units, Setting up of speciality Tea Units and Warehousing for Tea storage
Incentive for Orthodox / Green Tea production in order to increase production of exportable tea
2. Market Promotion Scheme
The project entails the following tea promotion activities to be conducted by
the Board on actual cost basis, which would be undertaken during the 12th plan
period. The above has dual objectives viz. (i) creating greater awareness &
knowledge about the regional varieties of teas in domestic as well as overseas
markets and (ii) increasing consumption of tea in the domestic market. Such active
promotion will highlight the health & wellness benefits of tea drinking as well as
reposition it as the lifestyle beverage so as to create awareness and a positive
disposition amongst the consumers, especially youth and thereby increase the
overall consumption of tea.
Domestic promotion
(i) Undertaking domestic campaign aimed at increasing per capita tea
consumption (PCC) in the states where PCC is low (average PCC is 0.73 kg
per annum in India at present)
(ii) Generic campaign in print & electronic media based on wellness benefits
& lifestyle aspects
(iii) Promotion of single-origin teas jointly with Tea Associations are proposed
to be undertaken in India through road shows, generic as well as specialty
tea campaign, protection and promotion of various intellectual properties of
the Board (Darjeeling GI, Assam (Orthodox) GI, Nilgiri (Orthodox) GI etc)
(iv) Viral advertising through established social networks like Twitter, Face
book for propagating the diversity & richness of Indian tea during domestic
promotion
Incentives to Exporters/Associations
(i) Transport subsidy for direct export of Tea from Amingaon Dry Port in
Assam – it is proposed to be enhanced from Rs. 1.5/kg in the 11-th Plan to
Rs. 2.0/kg in the 12-th Plan
(ii) For promoting exports of packaged teas of Indian origin packed &
exported from India, the costs incurred by individual Indian companies for in-

61
store promotions, launch of promotional campaign, development of web sites
and/or publicity literatures etc are proposed to be reimbursed to the tune of
25%. This ‘Brand Promotion’ Scheme covers all Indian exporters selling
100% Indian teas in packets less than 1 kg and having “India Tea Logo”
printed on their packs. More weightage will be given for exports of high value
teas
Overseas promotion (i) Origin Promotion to build equity for Indian tea in international markets - It
is proposed to promote Darjeeling, Assam, Nilgiri & Kangra teas and the
respective logos among consumers. Promotion would be undertaken with
inputs and advice from the Industry
(ii) Promotion of India teas are proposed to be undertaken in the overseas
markets by the Board from the H.O. and three foreign offices through road
shows, participation in trade fairs & exhibitions, generic as well as specialty
tea campaign through Tea Councils in U.K., Germany, Canada and U.S.A.,
participation in fairs & exhibitions, trade facilitation through arranging Buyer-
Seller Meets, exchange of trade delegations (inbound & outbound),
information dissemination through gathering of market intelligence, protection
and promotion of various intellectual properties of the Board (Darjeeling GI,
Assam (Orthodox) GI, Nilgiri (Orthodox) GI etc)
(iii) Viral advertising through established social networks like Twitter, Face
book for propagating the diversity & richness of Indian tea during overseas
promotion
Project 5-5-5
(i) Campaign for Indian tea for restoring the position of Indian tea in select
markets viz. U.S.A., Russia, Kazakhstan, Iran and Egypt .Extensive &
intensive promotional intervention through execution of five specific activities
over five years . The foremost objective of the entire exercise would be to
position “Indian Tea” as an over-arching umbrella brand under which five
identified promotional activities would be designed, coordinated and
implemented through reinforcing “Brand India” connects amongst the target
trade and consumers. This is expected to result in prominent brand recall for
“Indian Tea” over the short to medium term so as to translate into significant
increase in value market shares in the targeted markets for years to come.
62
3. Trade-related activities
(i) In order to facilitate export of quality teas in world class packaging,
infrastructure like Integrated Tea Park consisting of common infrastructure
like processing, blending, packaging, warehousing & testing laboratories is
proposed to be created. Creation of warehouses in close proximity to the
ports is also proposed to be set up. This will enhance the quality of tea being
exported from the country thereby enhancing the unit price realization of tea
and also establishment of brands in the world market
Publicity material (i) Production of appropriate publicity materials for trade and consumer
education in various international languages is including films, audio visual
aids, gift items, publicity literature, postures etc depicting Indian tea as a
brand.
4. Human Resource Development Scheme
Securing better working conditions for the plantation workers being one of
the primary functions of Tea Board, over the past several years, the Board has been
supporting certain welfare measures through the Human Resource Development
Scheme. Under this scheme projects will be undertaken for the following critical
areas-
1. Health and Hygiene of tea garden workers
2. Educational support for wards of tea garden workers
3. Training for workers, supervisors and managerial staff of tea gardens.
5. Research and Development Schemes
The activities covered under this scheme includes – meeting recurring
expenditure on some of the identified items of TRA and UPASI-TRF, up-gradation of
DTR&DC, supporting research projects of Tea Research Institutes and other
recognized Institutes on quality up- gradation, Integrated Pest and Disease
Management, value addition and product diversification, nutrition management, tea
and human health, setting up of quality control laboratories etc.
(A) Ongoing Research Schemes: The research schemes that have been
initiated during the XI Plan period are under various stages of completion and
some of the schemes are to be continued for one or two years of the XII plan
period for their completion.
(B) Justification for continuation during XII Plan: Long term Research is
necessary for developing and improving the techniques for modernization of
processing, as well as, for finding answers to emerging constraints and
limitations. Streamlining and strengthening of the research and creating

63
suitable mechanism to ensure that research remains responsive and in tune
with the time is cardinal for future progress and growth of the industry.
6. Small Grower Development Scheme
The small grower sector has emerged as an important sector contributing
nearly one third of the country’s production of made tea. Considering growing
contribution of the small grower sector, there is a need to put increased attention to
this sector. Accordingly, various subsidies and supports that are available to the
small growers under various schemes of XI Plan have been clubbed/ consolidated
under one umbrella scheme i.e. Small Grower Development Scheme (SGDS). The
primary objective of the scheme is to encourage the small growers to move up in the
value chain instead of remaining for ever as only green leaf producers. Through
collectivization, the growers could move up as manufacturers and marketer of their
teas in a branded and value added form so that the teas from the small sector could
be exported at competitive prices. Currently Indian teas are getting priced out in the
international markets owing to the high cost of production in the organized sector
and thereby share of Indian tea in the global market is steadily declining. This
downward slide in export could be arrested by directing the tea produced by the
small sector for exports. Thus the key objective of the scheme is the facilitation of
collectivization of small tea growers in the form of Primary Producer Societies/SHGs
and become business entities engaged in quality tea production and marketing it for
better price realization.
7. Scheme for monitoring the implementation of Regulatory provisions of
Tea Act.
One of the primary functions of the Tea Board is to regulate the activities of
the various stakeholders in the cultivation of tea and its business in accordance
with the provisions of the Tea Act and orders issued there under- Tea (Marketing)
Control Order, Tea (Distribution and Export) Control Order, Tea Ware House
control order and Tea Waste Control Order The effectiveness of Regulatory
functions also aid in the effective discharge of other functions like Developmental
Activities, Marketing & Promotional Activities and Research Activities.
In consequence of observations of the CAG audit the Tea Board will perform
the following regulatory activities for effective implementation and monitoring of the
regulatory provisions of the Tea Act and the control orders thereof through e-
governance initiatives for automation of the licensing activities to ensure
transparency.

64
Mandatory check mechanism to ensure supply of quality Green leaf to the manufacturer and the process of manufacturing quality tea for the consumers.
To introduce regular monitoring mechanism of checking of Tea Waste generated at the factory level to ensure maintenance of quality tea at the factory.
To introduce Region wise / State wise study on the status of the tea estates / tea manufacturing factories.
To undertake a Micro level study on the extent of implementation of the different regulatory provisions of Tea Act and Control Orders.
To undertake a Region wise / State wise assessment of extent of programme implementation by the beneficiaries under different schemes of Tea Board, its impact & economic analysis.
To study the cost of production of tea leaf of the small grower vis-à-vis by estates and cost of manufacturing of made tea by the Estate Factories / Bought Leaf Factories & Co-operative factories.
Strengthening of e-auction and bringing other allied activities under electronic platform.
Tea Board needs to strengthen following functional areas, in order to become a more effective development and regulatory agency:
Cost accounting: Tea Board has to rely extensively on external
agencies for undertaking studies on cost structure, cost
competitiveness, etc of tea industry on a regular basis. It needs to have
an in-house cost accounting cell for undertaking such exercises.
Economics & Policy Research Unit: For effective planning and policy
formulation for the industry, an in-house economics and policy research
cell should be part of Tea Board’s internal structure. This cell should
carry out high level policy research, best practice studies in terms of
policies and planning, and provide specific periodic recommendations to
the authorities in terms of suggested policy interventions.
HRD Cell: Human Resource Development is a crucial function. Tea
Board currently does not have any HRD cell. The same should be
created in order to effectively monitor and implement HRD Scheme
related initiatives and activities.
A. Rubber Board
Cenvatability of cess on NR
Domestic rubber consuming industry had been demanding cenvatability of
cess on NR. The Panel of Experts constituted as per the direction of Hon’ ble Delhi

65
High Court had recommended examination of the issue by the Revenue
Department. Accordingly, the Department of Commerce had referred the issue to
the Department of Revenue. The Department of Revenue vides OM
No.354/316/2011-TRU dt. 8th December 2011, stated that revenue collected as cess
on NR does not become part of indirect tax revenue. Therefore the Department is
not in a position to make the cess on NR cenvatable.
New Expert Panel constituted by Department of Commerce Department of Commerce constituted a Nine-Member Expert Panel for
examining the duty structure of dry forms of NR and latex and for making suitable
recommendations vide OM F. No. 8/5/2011-Plant C dated 6 January 2012. The
Expert Panel also shall make recommendations on various issues related to the
rubber industry including duties, pricing, shortage, export, import, latex related
issues and futures trading. The Expert Panel is serviced by Rubber Board. Three
meetings of the expert panel were conducted so far.
Exemption on quality inspection of rubber imported by manufacturers Ministry of Commerce and Industry, vide OM F. No. 8/12/2011-Plant C dated
3 January 2012, granted exemption from random checking on imported rubber for a
period of one year on experimental basis for manufacturers with effect from 1
January 2012. The direction under Notification No.S.O.1205 (E) dated 12.12.2001
of the Ministry of Commerce and Industry that for ensuring quality standards the
natural rubber imported into India shall be in conformity with such standards as are
specified by the BIS and the subsequent decisions on international and source
country standards are still legally valid.
Rubber Board was carefully monitoring the situation and has requested to
extend exemption for one more year or a suitable period with effect from 1 January
2013.
Annual mass contact programme – 2012 Annual Mass Contact Programme for the year 2012 with the theme ‘Capture
the world with quality’ was conducted during May - June 2012 at 857 centres and
covered 71,155 growers/tappers. Improvement in the quality of sheet rubber is
essential for ensuring healthy growth and sustainability of Indian rubber plantation
industry. The programme was organized in association with ATMA, AIRIA, IRDA
and RPS. Farm school workshops are being conducted as a follow-up activity of the
mass contact programme.

66
Sample survey to verify stock of NR Report of a sample survey undertaken to verify the stock of NR was
submitted before the Statistics & Market Development Committee of the Board held
on 20 January 2012. NR stock figures were revised from June 2011 onwards.
Market Linked Focus Product Scheme (MLFPS) Indian Natural Rubber” branded NR was included in the Market Linked Focus
Product Scheme (MLFPS) vide Director General of Foreign Trade Public Notice No.
3 (RE 2012)/2009-14 dated 5 June 2012. Branded rubber will be incentivized at 2%
of f.o.b value when exported to the linked markets such as Malaysia, China, Turkey,
Brazil, Belgium, Italy, Spain, Germany, Sri Lanka, Bulgaria, Austria, Korea, Mexico,
Israel, Singapore, Indonesia, Portugal, Argentina, Australia and USA.
Coordination among Commodity Boards Additional Secretary (Plantations) chaired a meeting of the Chairmen and
Heads of the Research and Extension Departments of commodity boards under the
Department of Commerce on 31 August 2012 at Rubber Board to identify to identify
areas of common concerns/interests and evolve combined strategies to address
common issues wherever possible. The meeting identified several areas where
synergy among the boards can be used and formed Working Groups to prepare
action plan in the identified.
Database of Rubber Tappers
A programme was formally launched on 1 October 2012 at Chirakkadavu
Model RPS for the preparation of a database of rubber tappers. The database will
be useful for planning welfare programmes for rubber tappers and formulating
programmes to counter the growing shortage of labourers. Field level briefing of the
action plan is in progress and the enumeration is scheduled to be carried out
between April and September 2013 by utilizing the services of RPS.
Rubber Park at Pathanapuram
Project Report prepared by Rubber Board for setting up a Rubber Park at
Pathanapuram in Kollam District with a total project cost of Rs. 36.70 Crore was
approved by the state level committee for inclusion under ASIDE Scheme. The
project is expected to be completed within two years. Government of Kerala has
accorded sanction to utilize 51 acres of land under the possession of KINFRA for
the Park. This will be the 2nd unit of Rubber Park India Pvt. Ltd, jointly owned by the
Rubber Board and KINFRA.

67
Spices:
Replantation & Rejuvenation of Cardamom Plantations: The programme on Replantation of Cardamom Plantations has got very good
response from the farmers and the independent study conducted by the Indian
Institute of Management, Bangalore recommended for the continuation of this
programme in the XII plan also. Due to lack of response, the rejuvenation
programme for cardamom has been discontinued during XII plan. In 2012-13, a
target of 6000 hectares will be covered under replantation of cardamom large &
small. It is proposed to cover an equal area of 6000 hectares in 2013-14. This
includes areas replanted by the farmers with the technical advice of the Board but
without availing subsidy. This scheme has been now merged with the scheme of
Export Oriented Production during XII Plan.
Pepper Production Development in Idukki district of Kerala
The National Horticultural Mission under the Ministry of agriculture, Govt. of
India has approved a programme for replantation/rejuvenation of pepper in Idukki
District of Kerala. The programme is implemented by Spices Board. Idukki is the
major production centre of pepper in Kerala. The total cost of the project is Rs.230.58
crores of which the approved total NHM assistance is to the tune of Rs.120.00 crores
for a period of 5 years starting from 2009-10. The programme is being implemented in
Idukki district of Kerala from 2009-10 onwards. So far, an area of 14305 hectares has
been replanted with high yielding planting materials. The target set for 2012-13 is
3760 hectares. This programme will be continued during 2013-14 subject to approval
of NHM in an area of 5500 Ha.
Pepper Production Development in Wayanand district of Kerala and N.E States
The scheme has been approved in October 2009 with a subsidy component
of Rs.53.28 crores for implementation from 2010-11. The implementation of various
components of the scheme has been started from 2010-11 covering an area of 8152
hectares under replantation. During 2011-12, 2860 ha have been covered under
replantation. The scheme is continued during 2012-13 with a target of 3650 ha. The
target fixed for 2013-14 is 3150 ha.
Spices Parks
Spices Park is a common infrastructure facility for processing and value
addition of Spices and Spice products which offers both primary and higher end
processing facilities. The Regional crop specific Spices Park is a well-conceived
approach to have an integrated operation for cultivation, post harvesting, processing

68
for value addition, packaging, storage and exports of spices and spice products by
meeting the quality specifications of the consuming countries. The basic objective of
the concept is to provide common infrastructure facilities for both post harvest and
processing operations of spices and spice products, which also aims at backward
integration by providing rural employment. Apart from the above facilities, the Board
will develop the common infrastructure facilities like Roads, Water supply system,
Power stations, Fire fighting & Control systems, Weighing bridges, effluent
Treatment Plants, Quality Lab for checking basic parameters, Bank & Post office
counters, Restaurant, Business centers, Guest house etc. Currently, the Board had
completed the establishment of the Spices Park at Chhindwara, Madhya Pradesh,
Puttady at Kerala and Jodhpur at Rajasthan. The Spices Park at Chhindwara is
mainly meant for garlic dehydration and extraction of chili and other Spices. The
operation of the park is started. The Spices Park at Puttady is mainly meant for
cardamom and pepper. The operation is started and continuing successfully. The
spices park at Jodhpur is mainly for cumin and coriander and the operation will
commence.
The Board is establishing Spices Parks in few other major spices growing
states/market centers and the progress is as follows.
(1) Guntur, Andhra Pradesh
The Board has acquired 124.78 acres of land in Edlapadu Mandal in Guntur district
from Government of Andhra Pradesh for setting up of Spices Park. The civil work
related to the basic infrastructure like internal roads, compound wall, drainage,
Administrative block, plant building, Power station etc are almost completed. Board
is establishing a full line processing facility for chili and also a steam sterilization unit
with 500 Kg/hour capacity. Board has already allotted 35 acres of land to the
prospective exporters for developing their own processing plant in the park. The first
phase of the project is expected to be completed by March 2013.
(2) Sivagangai, Tamil Nadu
The Board has acquired land admeasuring 72.70 acres in Kottagudi Village,
Sivagangai Taluk from the Government of Tamil Nadu for setting up the Spices
Park. The civil work related to basic infrastructure like Compound wall, drainage,
Administrative Block, 4 numbers of Godowns, 2 Plant Buildings, Canteen building,
Time House etc are almost completed. All civil work related to the establishment is
in the final stage. Board is establishing one full line processing system for Chili and
another full line system for Turmeric. The first phase of the project is expected to be
completed by March 2013. The Board is in the process of allotting land to private
entrepreneurs for developing their own processing unit.

69
(3) Kota, Rajasthan
The Govt. of Rajasthan has allotted around 12.14 hectares of land in Ramganj Mandi of Kota district for setting up of Spices Park. The work related to the establishment of the Park is in progress. The processing facility installed in the park in a final process for coriander. The allotment of the land to private entrepreneurs is completed.
(4) Guna, Madhya Pradesh
Government of Madhya Pradesh had allotted 100 acres of land to the Board
on lease basis for establishing the Park. The Project will be established under
ASIDE Scheme. All the civil work related to the Park completed. Currently the Board
is in the process of allotting land to prospective exporters for developing their own
processing unit. The installation of the machinery is in progress and the park will be
ready by February 2013.
(5) Rae Bareli
Government has given approval to establish a Spices Park for Mint at Rae
Bareli under ASIDE Scheme at a cost of Rs.19.00 crores.
Electronic auction system for cardamom
The electronic auction (e-Auction) system introduced for cardamom is functioning
successfully at two centres viz., in the Spice Park at Puttadi in Kerala and
Bodinayakanur in Tamil Nadu with infrastructure facilities provided by the Board.
This will be continued in 2013-14 and the scope for introducing more electronic
auction centers will be considered.
Quality evaluation
Sampling and quality checking of spices export consignments of chili/chili products
and turmeric powder by the Spices Board in its laboratories prior to exports to
ensure its conformity with the international standards are being continued since
2003. The aflatoxins test for the export consignment of nutmeg to EU region has
been made it mandatory in 2011. This quality enforcement initiative has led to
significant boost in consumer confidence in overseas markets and has increased
exports. Technical and financial support to exporters of spices to upgrade the
quality of spices are also provided by the Board for setting up of in-house laboratory,
quality certification, training of technical personnel in analysis of various parameters
besides disseminating quality requirements specified by various buying countries to
exporters.

70
Training on GAP on spice production
9th Batch of three months’ residential programme on “Good Agricultural
Practices on Quality spice production” was conducted by Indian Cardamom
Research Institute of the Board to train unemployed youths from farming families to
adopt Good Agricultural Practices (GAP) for quality spice production during 2012-
13. This programme will be continued in 2013-14.
COFFEE BOARD
New Policy Initiatives of Coffee Sector - Proposals for XII Plan (2012-17)
The coffee sector underwent unprecedented crisis during the period 2001-
2004. Despite that, the sector has shown signs of recovery towards the end of XI
Plan period thanks to various relief/ support measures announced by the
Governments both at Central and State levels. The country’s coffee production has
crossed the 2000-01 level (3, 00,600MT) during 2010-11 (3, 02,200 MT). However,
issues like stagnant production, declining productivity, erratic weather due to climate
change, shortage of workers etc., remain as the major constraints towards the full
revival of coffee sector in the country especially to meet the future requirements of
domestic and export markets.
Based on the lessons learnt during the implementation of XI Plan schemes,
priorities/ thrust areas and strategies have been identified for the XII Plan period for
supporting the growth and sustainability of Indian coffee sector. All the XI Plan
schemes, which continue to be relevant from the point of growth & development of
the industry, will be continued with suitable modifications based on inputs from
stakeholders’ consultation meetings, the recommendations made under the study
Structural Infirmities in Plantation Sector- Coffee and the recommendations of expert
committee which went into evaluation of XI Plan schemes on coffee. The
modifications in the schemes include restructuring of schemes by rearranging the
components, conversion of existing components into full –fledged schemes,
inclusion of certain modified/new components into the existing schemes etc.
The details of new components proposed in the XII Plan are:
Strengthening of Transfer of Technology and Capacity Building programme
As recommended by various Expert Committees, it is proposed to strengthen
the Transfer of Technology in coffee so as facilitate efficient dissemination of
research findings from Lab-to-Land and also bring the field problems by making the
Transfer of Technology an independent scheme by rearranging the erstwhile
components from R&D scheme and Development Support schemes. Presently the

71
extension wing of the Board is working under Director of Research with JDEs
reporting to him directly. the extension services to the coffee industry have
increased many folds and with the Research functions too increasing tremendously
the Director of Research is hard pressed to cater to the supervision and monitoring
needs of both research and extension functions.
Hence, it is proposed for setting up of a separate Directorate of Extension to
strengthen the extension activities and capacity building programmes and to monitor
the effective implementation of envisaged programmes. The proposed Directorate of
extension will be headed by a Director of Extension
Expansion of Coffee
Apart from replantation, it is proposed to include new planting/ expansion in
view of significance of increasing the overall production of coffee in the country.
Special emphasis will be made on Arabica coffee since the share of Arabica coffee
is declining steadily over the past few decades due to decline in productivity due to
senile plantations and ravages of pests & diseases. During the XII plan, the Board is
proposing to pay focused attention towards finding effective measures against
coffee white stem borer through multi-institutional collaborative R&D programmes as
well as for reviving the Arabica plantation by providing suitable incentives for
replantation and expansion
Database on coffee growing areas
The Census of coffee estates was done some three decades ago. Since then
the data is being updated using the Coffee Board extension network spread over
entire coffee growing areas. However, this has its own limitation because many
activities undertaken by the growers may not come to the notice of Board’s
extension officials, if such activity is carried out beyond the scope of development
support schemes implemented by Coffee Board. It is evident that reliable data on
coffee area and holding pattern is a pre-requisite to prepare specific strategic
planning for different areas. Hence, it is proposed to update the database on coffee
area, holding pattern, infrastructure facilities, water resources etc. using remote
sensing application.
Modernization of coffee curing works
Before liberalization, almost all the coffee curing works were functioning
under the guidance and supervision of Coffee Board. At present there are 75
licensed coffee curing works apart from an equal number of unlicensed units. Most
of the licensed units were established more than 40-50 years back. The technology
of green coffee processing used by these curing works is obsolete and the

72
machineries are very old and hence these curing works are not able to meet the
present day requirement of high quality processing. Besides, many of these coffee
curing works are running under loss and they are not in a position to upgrade their
machineries established long back. At present the technology of secondary
processing has improved and hi-technology machineries have been developed.
Hence, there is a need to upgrade the existing curing works with latest/hi-technology
machineries on par with international standards to improve the overall quality
standards of Indian coffees. Modernization also helps in automation of some of the
operations of coffee curing, thus ensuring reduction in operational costs.
Support for marketing by growers collectives / cooperatives
Indian coffee growing sector is dominated by small and tiny growers. These
growers are forced to sell their produce at farm gate level thus affecting their overall
returns. In many producing countries in Central & South America and Africa
smallholders form collectives/cooperatives for processing of coffee at a central
location and marketing their entire coffee in big lots sometimes directly exporting to
different destinations. By this way they are able to not only improve the quality of
coffee but also realize better value for their coffees. Hence, the Board is proposing
to encourage formation of growers’ collectives/ SHGs/ cooperatives by offering
different level of support under different developmental activities like processing,
mechanization etc. Under this component, it is proposed to provide one-time support
for growers’ collectives/ SHGs/ cooperatives for marketing of coffee by these groups
Support for Value addition
Traditionally bulk of Indian Coffee exports are in the form of conventional,
commercial product i.e., green bean form because of which the producers receive
less than 20% of the final value realized at retail level. Hence, apart from increasing
the productivity levels there is need to improve the unit value realization for the
coffee sold by producers. This is possible by approaches like quality improvement,
differentiation and value addition. By adopting systematic improvements in quality of
beans, the coffees can be sold at higher value compared to commercial beans.
There are also opportunities for exporting certified coffees under the sustainable
coffees category, for which good demand exists in the global market. India’s fast
growing domestic coffee market also provides a unique opportunity for the growers
to enter into R&G coffee segment directly through value addition.
In this regard, apart from continuing the existing XI Plan scheme of providing
support for setting up of Coffee Roasting, Grinding and Packaging Units, it is
proposed to extend support for modernization of curing works and support for
setting up of quality testing laboratories by stakeholders.

73
V. MPEDA
POLICY/ REFORM MEASURES
POLICY
The MPEDA has formulated a vision document for the marine products
industry. This document addresses all the vital linkages that are needed for the
industry in marketing capture and culture fisheries, processing, quality control and
sustainability. The future growth of the industry will be based on the country’s
capability to produce adequate raw materials for export and additional value to the
products which are the present day requirement of the consumer. The corner
stones of the strategy are:
1. Aggressive marketing
2. Exploitation of un-exploited resources like tuna and other oceanic resources
3. Expansion and diversification of aquaculture.
4. Value addition.
5. Quality and sustainability.
It is envisaged that the country’s exports would reach US $ 4.2 billion by
2012-13 and US $ 6 billion by 2017. Though this overall strategy for improvement of
seafood exports, there will be significant improvement in employment generation
and rural development. The employment generation of the industry is targeted to
reach a level of at least 5 million during this period and it is expected to revitalise the
rural sector with improvement in quality of life.
CURRENT AREAS OF FOCUS (MAJOR POLICY ITEMS) To facilitate enhanced export of marine products MPEDA has been giving greater attention in the following areas.
Development of Tuna fishery by extending financial assistance and technical advice for conversion / construction of Tuna Long Liners and chilled tuna packing facilities and imparting training to crew.
Sea freight Assistance for import of raw material for export of specified value added products to make India a Seafood Processing Hub which will also help in maximum utilization of processing units and thereby create more employment generation especially for women.
Promoting diversification to increase the share of culture fishery resources by cage farming of finfish and organic culture of shrimps.
Upgradation of fishing harbours and landing centers to improve the quality of marine products landed.

74
Assisting setting up of state of the art processing facilities for value added marine products meant for export.
Ensuring production of quality seafood by setting up sophisticated laboratories in the maritime states.
Extending linkages to the grass root level by ensuring better extension packages to fishermen / farmers and the workers engaged in various stages of processing of marine products.
Enhancing the brand equity and to promote co-branding and joint ventures for strengthening marketing strategies abroad.
Participating in International Seafood Shows to show case the strength of Indian marine products industry.
Facilitating supply of healthy and disease free seed and to demonstrate culture practices of various species.
Strengthening R & D activities to develop technology for aquaculture.
Appropriate schemes/measures have been devised to achieve these objectives.
CURRENT POLICY INITIATIVES TO INCREASE PRODUCTION AND EXPORTS
a. To increase the production
MPEDA in association with SIPPO has taken up organic culture of scampi
in an area of 50 hectares in Kerala and Andhra Pradesh.
Discussion is in the advanced stage to get financial and technical
assistance for popularizing marine finfish farming through cage culture, in
association with NORAD an agency identified by Innovation Norway with
whom MPEDA entered into an MOU.
Culture of sea bass in cages and ponds with the seeds produced by
RGCA on a pilot scale.
Introduction and adoption of code of practices in shrimp farms addressing
thereby sustainability concerns.
Assistance for conversion of fishing vessels into Tuna Long Liners and provide long line materials to tap otherwise unexploited Tuna resources.
b. To improve quality and sustainability of marine products meant for
Export.
The National Residue Control Plan (NRCP) to monitor the residue levels
of various environmental contaminants in aquaculture was continued more
vigorously.
Hazard Analysis Critical Control Point (HACCP) team continues to assist
seafood processing units for preparing HACCP manual and
implementation of HACCP system.

75
MPEDA laboratories at Kochi, Nellore and Bhimavaram, accredited
laboratories’ test results are accepted by the importing countries without
further verification.
The new laboratory made operational at Bhubaneswar tests for antibiotics
like Nitrofurans and Chloramphenicol of marine products meant for export.
NETFISH and NaCSA, the two societies formed for undertaking extension
education programmes continue their effort in capture and culture fisheries
sectors, for quality upgradation.
To prevent, deter and eliminate illegal, unreported and unregulated fishing,
implemented Catch Certificate for export of seafood consignments to
European Union.
c. Other developmental/promotional activities
Upgradation and modernization programmes of various fishing
harbours/landing centres are progressing.
Conversion work on fishing vessels underway for tapping the tuna
resources.
Ornamental fish breeding units coming up in a big way to boost the export
of ornamental fish.
Rajeev Gandhi Centre for Aquaculture continues its pioneering effort in
research and development of various efforts in production of seed and
culture thereof.
MILE STONES FOR 12TH PLAN
Promotion of Brand equity of Indian Products
Increase in production of Tuna.
Increase production from aquaculture.
Products exported to be value added
Improve capacity utilisation of processing plants
Improvement of hygiene in landing centres/fishing boats
Create a foundation for Rajiv Gandhi Centre for Aquaculture.
Make India a Seafood Processing Hub.
Increased production of L.vannamei Shrimp
It shall be MPEDA’s endeavor to realize the above goals by following a road
map, which focuses attention on the areas identified above. The schemes and
financial outlay of MPEDA’s 12th Plans will follow the vigorous road map. As
mentioned earlier, it is inevitable that the areas to be addressed by MPEDA might
sometimes fall within the purview of other Ministries/departments/organizations.

76
This is sought to be resolved through convergence with the programmes of the
Ministry of Food Processing Industry. Department of Animal Husbandry, Dairying
and Fisheries, National Fisheries Development Board etc. whose resources will be
adequately utilized by the MPEDA to supplement its own resources. It is expected
that they will also give due attention to the complex needs of the export sector and
lend their unstinted support to MPEDA.
REFORMS
1. Network for Fish Quality Management & Sustainable Fishing (NETFISH)
A society named Network for Fish Quality Management & Sustainable
Fishing (NETFISH), registered with MPEDA, under the Travancore Cochin Literary,
Scientific and Charitable Societies Registration Act, 1955 at Ernakulum, has been
formulated to organize the extension programmes of MPEDA in all maritime states
and a budget of Rs.1000 lakh has been included in the 12th 5 year plan. The
headquarters of NETFISH is at Ernakulum.
NETFISH will undertake capacity building for providing training to fishermen
on board handling, training to trainees, training to stakeholders in handling fish in
landing centers, training on TED, and training to Societies for conservation of fishery
resources, training to pre-processing plant workers, training in hygienic maintenance
of fishing boats, etc.
NETFISH will evolve a new mechanism for capacity building in quality
management at grassroots levels by networking with fishermen societies,
federations and other non-governmental organization which work closely with the
fishing community, which will be more effective in imparting training to fishermen
and fish workers. NETFISH will also promote capacity building for stakeholders etc
in planning, marketing, technology dissemination, processing etc and thereby
facilitate their empowerment. NETFISH will also bring out extension training
materials for all training programmes in various languages; prepare video extension
materials, brochures, etc.
2. India Organic Aquaculture Project (IOAP)
MPEDA implemented organic aquaculture in India by availing the consultancy
and technical collaboration from the Swiss Import Promotion Programme (SIPPO),
Zurich, Switzerland.
The brackish water area available in India for shrimp farming includes the
existing traditional prawn filtration fields also, which are located in West Bengal
(46100 ha) and Kerala (10700 ha). These vast filtration areas are actually paddy

77
fields, belonging to several entrepreneurs, who do salt resistance paddy cultivation
by themselves and later auction the area, after paddy cultivation for doing the
seasonal traditional prawn filtration, when the water become saline in nature due to
inundation. The traditional type of prawn filtration system is highly environment-
friendly as they use no antibiotics, chemicals, etc and hence the paddy fields can
easily be adopted for organic aquaculture. Organic aquaculture ensures that the
farming activity is in harmony with the nature, with due care for the good health and
welfare of the cultured organisms. Organic products have become very popular now
a days due to rise in health and environmental awareness, concerns on food safety
and there is a growing demand in developed countries, especially; US, EU, etc. The
premium for the organic products is also high in the international markets.
3. National Centre for Sustainable Aquaculture (NaCSA)
The National Centre for Sustainable Aquaculture (NaCSA) is an outreach
organization of MPEDA to provide technical support to the primary aquaculture
societies and build capacity among small farmers to produce quality shrimps in a
sustainable manner. It is envisaged that NaCSA will serve as a link between
primary aquaculture societies and the farmers in turn to facilitate formulation of
common policies, strategies etc. to benefit farming community as a whole in the
country. The objective of community participation in coastal aquaculture is expected
to augment shrimp production for raising the seafood export from India.
Chief Executive Officer (CEO) and essential staffs have been already
appointed besides housing the headquarters of NaCSA at Kakinada. The
requirement to the field offices of NaCSA in various maritime states is being
attended. A detailed work plan has been formulated for streamlining the activities,
for which a workshop was organized with the Stake holders. Action as per the work
plan has already been initiated.
SCHEMES/ PROGRAMMES FOR WOMEN
The major schemes/programmes of the Authority which are benefiting women are
as follows:-
1. Financial Assistance for extending insurance coverage for workers employed
in fish processing units. This is a welfare scheme mainly for the benefits of
the women workers employed in seafood pre-processing/processing plants.
It aims to provide social and financial security for the insured and their
dependents.
2. Development of Hatcheries – a good number of women are working as
technicians and aids.

78
3. Field level extension programme – ensures 20% of women participation in
meetings.
4. Training programme for SC/ST – ensures 20% of women participation in
these trainings.
5. Developmental assistance to set up PCR Labs – a good number of
technicians in labs is women.
6. Setting up of Ornamental Fish Marketing Societies (OFMS)/Fish Breeding
Units (OFBU) – 50% of the persons engaged in the OFMS and OFBU are
women.
7. Assistance for construction/renovation captive and independent pre-
processing centers – Most of the workers in these centers are women and
they are able to get gainful employment and hygienic working environment.
EVALUATION RESULTS OF MPEDA PLAN SCHEMES
1. Results of the independent evaluation of the MPEDA’s financial
assistance schemes
The Marine Products Export Development Authority (MPEDA), implemented
several financial assistance (subsidy) schemes during 11th Plan period (2007-08 to
2011-12). As directed by the Planning Commission through the Ministry of
Commerce and Industry, it was necessary to evaluate the schemes to assess the
impact in enhancing the capability of the seafood industry to export different
products and in enabling the exporters to augment their exports. Accordingly, M/s
Gujarat Industrial Technical Consultancy Organisation Ltd (GITCO) was assigned
the work for independent evaluation of MPEDA schemes. The work was undertaken
based on a set of Terms of Reference (TOR) and scope of the work mutually agreed
upon. M/s GITCO completed the work and submitted their final report in November
2012.
VI APEDA
Under the scheme Market Development, APEDA has a proposal to initiate a
number of programmes for market promotion of agro products as under:
a. Participate in 20 international trade fairs all over the world on the basis of
export potential and the focus area/focus products.
b. At least 10-15 exporters are likely to participate in APEDA pavilion in each
fair.
c. Participation will also be organized in AAHAR international at New
Delhi/Mumbai and Chennai.
d. Buyer Seller meets will be organized by APEDA (2).

79
e. Visits of the international delegations for meat and meat products, fresh
fruits and vegetables, basmati rice etc. will also be organized during 2013-
14.
f. Financial assistance will also be provided to at least 191 exporters for
usage of packaging material as per approved standards of IIP to enhance
the packaging of the fruits, vegetables, flowers and processed foods etc.
VII. Trade Facilitating Reforms and Export Promotion Measures
During the year, the ongoing reforms on the trade facilitation and export
promotion fronts were further deepened and new initiatives undertaken. The major
initiatives in this regard include:
A. e-TRADE Project
The project entitled “Electronic Trade (eTRADE)” is pursued by this
Department in various trade regulatory and facilitating agencies like DGFT, customs,
seaports, airports, Container Corporation of India (CONCOR), banks, carriers,
importers, exporters, agents to facilitate efficient and effective mode of transacting
business in the area of foreign trade. The services covered under the project are
electronic delivery of services in online environment i.e electronic filing/clearance of
export/import documents, e-Payment of duties, charges (handling/freight etc.) and
the electronic message exchange between community partners.
Major developments during the year are as follows:
1. The digitally signed electronic message exchange between Customs and
DGFT for Annual Advance authorization and Duty Free Import Authorisation
is being finalized. The message exchange between DGFT and Customs for
DEPB, DES and EPCG schemes is already operational for all EDI ports.
2. The Centralized Port Community System (PCS) which is operational at major
seaports to provide single window interface is now being extended to other
non-major seaports. Other seaports like Mundra, Dahej, Pipavav and
Gangavaram, which contribute large share in terms of traffic of non-major
seaports, are at an advance stage of implementation.
3. The electronic Express Courier Clearance System has been started at the
airports of New Delhi and Mumbai. This would facilitate the faster clearances
of express courier consignments.
4. The Customs has implemented the Central Server system for which roll out
has already been done at around 90 locations. A total of 115 locations are
planned to be covered by the Customs under central server system in the
current phase. The implementation of message exchange with community
partners under central server environment is under process.

80
5. The new version of Risk Management System (RMS 3.1) under central
server environment has been started at around 50 EDI locations.
6. To enhance the ePayment usage, Customs is integrating ePayment of duties
from any of its authorized banks for all Customs locations. Eight banks have
already started collection of customs duties through e-payment. To facilitate
the electronic Pay and Account Office (e-PAO) software has also been
developed which is under implementation.
B. e-Procurement
DGS&D initiated its journey towards implementation of e-Procurement
platform in the financial year 2004-05 and over a period of time developed an end-
to-end solution beginning with the identification of new items for bringing on Rate
Contract(R/C), consultative meetings to finalize deletion/addition of items, governing
specification and terms and conditions, formulation of governing specifications,
creation and invitation of tender, receiving and opening of bids through secured e-
tendering platform, comparative and ranking Statements, information regarding
dispatch of supplies and receipt by the consignee, e-payments and debit
adjustments. Different software modules have been extensively used for its internal
activities concerning purchase and inspection. The platform has since stabilized.
A computerized system based on client server architecture on LAN/WAN
working at Headquarters and regional/sub-ordinate offices with adequate
communication links and website & Web enabled systems has been established in
the organization.
The system has been developed in-house with NIC providing e-support in
developing software modules. In the initial phases, E-tendering was out-sourced
through a third party, acting as ASP, on PPP mode. However, after expiry of third
party ASP contracted for e-tendering module is fully operational and all tenders of
generalized items, with tender opening date on or after 15-11-2011, are mandatorily
invited on-line.
DGS&D has finalized a procedure for secure on-line placement of supply
order through user login-id, password and digital signature of the officer placing
such supply order. A Channel of authentication has also been prescribed. From
1.10.2008, placement of on-line Supply Order has been made mandatory for all
Central Government Director Demanding Officers (DDOs) except for items viz.
Primary Oil, Automobiles and Spares. During the financial ear 2011-12 till 31-12-
2011, 73796 Nos. of on line supply order and 142039 nos. of online Inspection notes
for stores worth Rs. 2189.27 crore, have been issued.

81
DGS&D budget expenditure for computerization activities for the financial
year 2011-12 is Rs. 4.00 crores.
C. Online Services by Director General of Foreign Trade (DGFT)
The Department is committed to simplifying procedures, facilitating electronic
clearances, and putting in place an exporter friendly regime for obtaining
authorizations under various export promotion schemes. The Directorate General of
Foreign Trade (DGFT) is engaged in enabling web based international trade
transactions so as to facilitate exporting community in expeditious import/export
clearances. The Director General of Foreign Trade (DGFT) maintains a
comprehensive website www.dgft.gov.in. The details of Foreign Trade Policy, Hand
Book of Procedures, all important Notifications, Public Notices, Circulars, minutes,
etc. are available on the website. Single online application form for all the schemes/
activities is also available on the website. Several steps are being taken under the
Electronic Data Interface (EDI) programme.
Box 3.3
Initiatives under Electronic Data Interface (EDI) Programme
Filing of applications for various authorizations through EDI mode has been
made compulsory in majority of schemes.
DEPB scheme is completely online. The message exchange between DGFT
and Customs for Advance Authorization and EPCG licenses has been
implemented for all EDI ports for authorization issued after 1.4.2009.
24 out of 37 EPC’s have registered on DGFT’s Website. Complete online
uploading of RCMC data is expected to map shortly.
Two additional banks namely (i) Bank of Baroda (ii) United Bank of India have
also been included for Electronic Fund Transfer (EFT) facility for DGFT users.
• An offline data entry module has been provided for Advance Authorisation and
EPCG applications in August, 2010 to provide flexibility in filing applications by
exporters, and reducing online server time which would improve efficiency and
reduce cost.
• Online filing of IEC application and its online processing w.e.f. 1.1.2011.
Online validation of PAN is also likely to be integrated by 31.1.2011 for which
NSDL has been engaged.
• Message exchange of DFIA authorization would be started from 13.10.2011
between DGFT and customs.

82
• Software to make PRC cases filing, processing and tracking an ‘online’
system is under development. The tracking/Monitoring package for Advance
Authorization and EPCG has been functionally tested and placed on intranet.
It will be made available to Regional Authorities after security audit by NIC,
which is likely to complete by 31.12.2011.
D. Use of Information and Communication Technology
Information and Communication Technologies (ICT) and its tools have
become integral part of the functioning of the Department. These have facilitated the
efficient and effective administration, monitoring, trade facilitation, delivery of
services and information dissemination to the users. The Computer Centre in the
department is being manned and managed by National Informatics Centre (NIC). It
provides necessary assistance and support in developing and implementing various
ICT systems and applications for decision making, monitoring, analysis, office
automation and e-governance. All officers/ divisions/ sections are equipped with
necessary ICT infrastructure for their desktop computing and functioning. These are
connected to a Local Area network (LAN), providing round the clock facilities for e-
mail, and Intranet/ Internet operations. The ICT infrastructure in the department is
being regular reviewed for its better utilization and upgradation.
Video conferencing is being effectively used as cost effective solution through
Video Conferencing Studio at NIC- Head Quarter for national and international
meetings and negotiations. An Executive Video Conference System (EVCS) is also
available in the Chamber of the Commerce Secretary, connecting Secretaries to
Government of India and all Chief Secretaries/ Administrators of States/UTs over
NIC network (NICNET) to facilitate quick appraisal of inter-ministerial and state
matters.
Various ICT based systems, applications and packages have been deployed
in the department in order to provide necessary support in decision making,
monitoring, analysis, office automation and e-governance. The electronic interface
with community partners for trade facilitation, electronic payment through net
banking and digital signature are integrated with the systems wherever applicable.
The website of the department (http://commerce.gov.in) is being regularly
enriched and strengthened for information dissemination, electronic delivery of
services, trade facilitation and monitoring. It provides Government-to-Citizen (G2C)
and Government-to-Business (G2B) interfaces. A separate website for the Standing
Committees on Promotion of Exports by Air and Sea (http://escope.gov.in), is also

83
hosted to provide an open forum for the Trading community for direct and quick
interface for communication and information dissemination with the Department.
An Intranet Portal is hosted in the department for providing e-governance and
office automation applications to the employees and internal users. It is being
regularly updated with latest circulars and notices.
VIII. Policy Initiative
Following New schemes have been proposed by Department of Commerce for 12th Five
Year Plan (2012-17)
Gems and Jewellery
i) Convention Centre in Mumbai on PPP basis: To hold large scale
international/Indian exhibitions, seminars etc. for organizing business to business
trade shows and displaying the new product lines to the global world. The Centre
would be useful for exhibitions and business meets to display products of industries
such as apparel, electronics, pharmaceuticals, machine tools, automobiles, oil and
gas etc.
ii) Common facility centre on PPP basis: After the 2008 global recession, the
Gems and Jewellery sector is faced with the acute scarcity of skilled artisans as a
large number have migrated to their home towns in Gujarat. The artisans engaged
in diamond cutting and polishing industry are reluctant to return to the city because
of high cost of living and loss of confidence because of sudden unemployment.
Urgent steps are needed to maintain Indian’s competitiveness in this sector which is
mainly due to its human resource. Therefore, it is necessary to provide additional
facilities to attract the Gems & Jewellery workers in clusters.
iii) Gem Bourse in Jaipur on PPP basis: Jaipur is an international hub for color
stone studded jewellery. To institutionalize the largest and oldest industry of the
city, it is proposed to develop Jaipur as an international hub of gemstones. The
Gem Bourse in Jaipur will act as a market place focusing on the activities to promote
trade and the specific needs of the industry creating a platform for the buyers from
around the world for purchasing gems and jewellery. It would have facilities such as
Customs, Banks, Clearing and Forwarding Agents, etc.
iv) Gem & Jewellery Park in Mumbai on PPP basis: Mumbai has developed as
one of the foremost trading centre of the diamonds in the world accounting for 90%
of the total diamond exports of the country to plan for the future infrastructure
needs to be developed which can integrate the cutting and polishing of diamonds
and the manufacturing of jewellery in the same place. The integrated facility would

84
provide for workers accommodation, training and other ancillary facilities like
business, hotel convention centre, incubation centre etc.
v) Technology upgradation in Gems & Jewellery sector on PPP basis: Gems
and Jewellery sector is an important component in India`s export basket and
employs nearly 3.4 million workers. To maintain its competitiveness, the sector
requires constant technology upgradation.
Pharma
vi) R & D Financing and Cluster Development for Pharma through a venture
capital fund: Strengthening the manufacturing of Pharma Products for increasing
pharma exports.
vii) Reimbursement for plant registration and bio similar/bio equivalent studies to
pharma exporters: Incentivising new market access to pharma exporters.
Leather
viii) Footwear Design and Development Institute (FDDI) : After the success
achieved in the establishment of FDDI, NOIDA, and upgradation of FDDI,
Fursatganj, Rae Bareilly another branch of FDDI is being set up at Jodhpur. In the
12th Plan it is proposed to establish three additional branches of FDDI to meet the
requirements of the leather industry for trained human resources and to provide
consultancy in design, technology and quality. To create strong institutional
capacity within the country for the development and growth of the entire leather
sector i.e. footwear, apparels, retail management etc. FDDI intends to set up a
networking centre and take up responsibility as a Centre of Excellence
ix) Creation of Venture Capital Fund for corporatization of Leather sector -
creation of seed fund.
Tea Board
x) Small Growers Development Scheme: To provide due consideration to the
special needs of the small growers sector and increasingly important role that the
sector is playing in the Indian tea industry, a separate scheme has been proposed
for the sector with various sub-components covering all aspects of development for
the sector. Small growers have significant skill-gaps and very large training needs
which can’t be catered to through a few centralized institutions. There is a need for
undertaking more field oriented training programs for the small growers, while
making available a team of qualified/trained advisors to address their needs on a
continuous basis. In addition, the Small Growers’ Development Directorate would
also organize training workshops and field training sessions for STGs and their

85
workers on a regular basis. In addition to technical trainings, small growers and
SHGs need to be provided extensive training on group formation, basic accounting
and book keeping, office management, office automation, leadership skills, etc.
xi) Monitoring the implementation of Regulatory provisions of Tea Act:
There are certain regulatory and compliance related activities of Tea Board that are
not covered under any scheme. Such activities include Mandatory check-
mechanism to ensure quality of tea meant for export from India, Mandatory check
mechanism to ensure supply of quality Green leaf to the manufacturer and the
process of manufacturing quality tea for the consumers, regular monitoring
mechanism of checking of Tea Waste generated at the factory level to ensure
maintenance of quality tea at the factory, introduce Region wise/State wise study on
the status of the tea estates / tea manufacturing factories, undertaking of Micro
level study on the extent of implementation of the different regulatory provisions of
Tea Act and Control Orders, undertake a Region wise/State wise assessment of
extent of programme implementation by the beneficiaries under different schemes of
Tea Board, its impact & economic analysis, study the cost of production of tea leaf
of the small grower vis-à-vis by estates and cost of manufacturing of made tea by
the Estate Factories/Bought Leaf Factories & Co-operative factories, Strengthening
of e-auction and bringing other allied activities under electronic platform.
DGFT
Policy Initiatives Taken:
Filling of applications for various authorizations through EDI mode has been
made compulsory in majority of schemes.
The message exchange between DGFT and Customs for Advance, DFIA and
EPCG Authroization has been implemented for all EDI ports for authorization issued
after 1.42009.
Link on DGFT’s website for e-RCMC project has been provided on DGFT’s
server and transmission of RCMC data by EPC’s has started in August, 2010.
28 out of 37 EPC’s have registered on DGFT’s website. Complete online
uploading of RCMC data is expected to maped shortly.
Two additional Certifying Authorities i.e. M/s. 3 I Infotech Consumer Services
Ltd. (Brand Name – eMundhra) and M/s. TCS Ltd. Have been permitted to issue
Digital Signature Certificates to the users of DGFT system. M/s. 3 Consumer
Services Ltd. has since signed MOU to initiate this activity.

86
As off now 20 Banks have been signed MOU with DGFT for Electronic Fund
Transfer (EFT) facility for DGFT users.
An offline data entry module has been provided for Advance Authorization
and EPCG applications in August, 2010 to provide flexibility in filing applications by
exporters, and reducing online server time which would improve efficiency and
reduce cost.
Online filing of IEC application and its online processing w.e.f. 1.1.2011,
online validation of PAN is also completed.
A PRC ‘On-line” filing and tracking system has been developed and is
available on DGFT’s website w.e.f. 31.12.2012.
ASIDE
The implementation of the scheme by States / UTs has been encouraging. The
salient findings of a mid-term appraisal of scheme during 11th Five Year Plan
commissioned to IL&FS are as under:-
It has been now established that there has been an upswing in exports from
States and in concomitance there has been an upswing in allocation,
sanction and utilization and number of projects being implemented.
Exports have more than doubled in the last four years and although the
increase in exports cannot be attributed solely to ASIDE, the scheme has
contributed substantially and handsomely to export efforts. In fact, most of the
states are now warming up to the scheme having understood and grasped
benefits of leveraging ASIDE funds.
A quantum jump in allocation of funds is imperative if substantial
improvements are to be expected in infrastructure, and therefore, exports.
Changes brought in ASIDE Guidelines:
ASIDE guidelines for 12th FYP (2012-17) have been revised. The revised
ASIDE guidelines may be seen at http:// www.commerce.nic.in or
http://www.commerce.gov.in under Head–National Trade, Subhead--Trade
Promotion Assistance as “Revised ASIDE guidelines 12th FYP (2012-17)”.

87
Projectised Basket Approach: In view of doubling of exports envisaged in
FTP 2009-14, involvement of States / UTs is now based on the projectised basket
approach. Herein a general basket of 500-600 critical export infrastructure projects
with visible and tangible impact for implementation during 12th FYP (2012-17) is
being prepared. The basket shall form the basic boundary of the Scheme. The list
shall serve as the benchmark for the type and size of the projects. Such basket will
consists of shelf of projects (20-40 in number) received from all States / UTs and
States are to implement these ASIDE projects during 12th FYP(2012-17) on priority
basis.
Four Category of States / UTs: All States/ UTs have been grouped in four
categories: Large, Medium, Small and North Eastern States. Punjab and Haryana
fall in Medium Category States.
The project size should be such that tangible infrastructural projects are taken
up. For this the ASIDE contribution shall be a minimum of Rs 5.00 Crores for large
States and Rs 2.50 Crores for Medium / Small / North Eastern States including
Sikkim. In case the State wishes to take projects outside the list of the basket of the
projects, mandatory concurrence of the DoC will have to be obtained to ascertain
the relevance of the project for export. In such a case the State would also need to
co- finance the project where ASIDE contribution would be limited to 50%.
10 % of ASIDE outlay is reserved for incentivizing States / UTs for their better
performance under ASIDE as per Incentive guidelines.
Other Activities
Land free from all encumbrances is prerequisite for consideration of
projects for assistance under ASIDE.
The assistance covered under ASIDE is only for capital infrastructure.
The estimated total project works cost to be taken for consideration for
assistance under ASIDE Scheme should be vetted (both technical and financial
aspects) by the competent authority either of the State Governments/ UT
Administration or Local Bodies like municipalities etc or other statutory bodies etc on
the basis of prevailing Schedule of Rates (SOR) in the State / UT concerned at that
point of time of Competent Authority of Central Public Works Department (CPWD)
as per Delhi Schedule of Rates (DSR).

88
Social and Gender Empowerment Processes
In accordance with the policy of the Government of India, a SC/ST cell is
functioning in the Department of Commerce to ensure due compliance of the orders
of reservation issued from time to time in favour of SCs and STs. A Liaison Officer
has been nominated in the Department to ensure prompt disposal of the grievances
of the employees of these classes and to scrutinize and consolidate the statistical
data. So far as services and posts in the Department and organizations under its
administrative control are concerned, none of the posts has been exempted from the
purview of the reservation orders. The Liaison Officer examines and rectifies,
wherever necessary, the roster maintained by the various organizations for ensuring
representation to SCs/STs/OBCs. The Liaison Officer also provides relevant
guidelines to the officers in the Department of Commerce, its attached and
subordinate offices and the Public Sector Undertakings, in accordance with the
instructions issued by the Department of Personnel and Training (DOP&T) from time
to time. The Cell is also looking after the work regarding implementation of the
Government Orders in respect of reservation for Other Backward Classes (OBCs) to
the extent of 27% in direct recruitment.
The Commodity Boards under the administrative control of the Department
of Commerce have certain specific schemes under Special Tribal Plans, which are
operated with a view to supplementing the efforts of the Government in improving
the socio-economic conditions of the SC/ST workers in the non-traditional areas.
The attached and subordinate offices, PSUs, autonomous bodies etc. under the
administrative control of the Department have also undertaken number of welfare
activities.
Women Cell
An independent Women Cell has been set up in Department of Commerce with
the following broad functions:
Prevention and redressal of sexual harassment at workplace,
constitution of Complaints Committee in the Department of Commerce,
its attached and subordinate offices, PSUs, autonomous bodies etc.,
monitoring their performance and providing necessary help and
guidance.
Coordination with the Department of Women & Child Development,
National Commission for Women and other concerned agencies in
respect of the matters connected with welfare and economic
empowerment of women and other related issues.

89
Review of the various programmes of Department of Commerce to
ensure that various aspects of women welfare, development and
empowerment are promoted through the programmes and schemes of
the Department.
Preparation of Action Plan pertaining to the Department of Commerce
for the overall development of women in line with the National Policy
for empowerment of women.
Other incidental matters pertaining to the subject.
The Women Cell actively participated in the various workshops/seminars on
gender issues organized by National Commission for Women and others.
Gender Budget Cell
The Gender Budget Cell is functioning in the Department to ensure that the
budget allocations made in the various schemes implemented by the Department
benefitted women. Most of the schemes under the Commodity Boards such as Tea,
Rubber, Coffee, Spices etc. as well as agencies like the Indian Instituting of
Packaging, the Marine Products Export Development Authority, and the Footwear
Design & Development Institute etc. have programmes targeting women
beneficiaries. Though funds are not specifically earmarked for this group, all the
aforementioned schemes subsume the targeted category.
*******

90
CHAPTER-IV
REVIEW OF PAST PERFORMANCE
Global Economic slowdown and India’s Trade performance
India had the fastest export growth among major traders in the world in 2011.
As per WTO’s International Trade Statistics, 2012, in merchandise trade, India is the
19th largest exporter in the world with a share of 1.7 percent and the 12th largest
importer with a share of 2.5 percent in 2012. In commercial services, India is the 8th
largest exporter with a share of 3.3% in world exports ad 7th largest with 3.1 percent
of the world’s share imports.
Indian Economy, being much more globally integrated today, with share of
exports of goods & services in GDP at 26.3 percent in 2011-12 (in 2002-03 this
share was only 10.3%), has not been immune to these developments in the World.
Following the global financial crisis in 2007-08, India’s exports registered a 3.5 %
decline in 2009-10. The sovereign debt crisis in the Euro zone periphery in 2011-12
impacted negatively economic growth in and exports from India. Between 2010-11
and 2011-12 India’s Growth rate of exports declined from 8.4% in 2010-11 to 6.5%
in 2011-12. During the same period growth rate exports declined from 40.5% in
2010-11 to 21.3% in 2011-12. The projected growth rates in different countries are
expected to determine the markets for our exports. To take advantage of the trends,
economic management over the first few years of the Twelfth Plan will have to cope
with the uncertainty in the global economy.
India’s merchandise exports reached a level of US$ 304.6 billion during 2011-
2 (P) registering a growth of 21.3 percent as compared to a growth of 40.5 percent
during the previous year. India’s export sector has exhibited remarkable resilience
and dynamism in the recent years. Despite the recent setback faced by India’s
export sector due to global slowdown, merchandise exports recorded a Compound
Annual Growth Rate (CAGR) of 20.3 percent from 2004-05 to 2011-12.
During the year 2011-12, the cumulative value of exports was US$ 304.6
billion as against US $ 251.1 billion registering a growth of 21.3 percent over the
corresponding period of the previous year.
Cumulative value of imports for the same period was US $ 489.2 billion as
against US $ 369.8 billion during the corresponding period of the previous year
registering a growth of 32.3 percent.
The Trade deficit in 2011-12 was estimated at US % 184.6 billion which was
higher than the deficit of US $ 118.6 billion during 2010-11.
The value of both exports and imports in April-November 2012-13 are lower
than the values in the corresponding period of last year (Exports are US $ 189.2

91
billion in April-November 2012-13 vis-a-vis US $ 201.2 billion in April-November
2011-12. Imports are US $ 318.7 billion in April-November 2012-13 vis-a-vis US $
323.8 billion in April-November 2011-12). Our merchandise trade deficit is higher in
April-November 2012-13 at US $ 129.5 billion as compared to US $ 122.6 billion
during the corresponding period of the previous year.
Trends in Exports and Imports
Annual data on merchandise exports, imports and balance of trade since 2002-03 to 2009-10 are set out in Table-4.1.
Table 4.1
Exports, Imports & Balance of Trade (Values in US $ billions)
Year Exports Growth
Rate (%) Imports
Growth
Rate (%)
Balance
of Trade
2002-03 52.7 20.3 61.4 19.4 -8..7
2003-2004 63.8 21.1 78.2 27.3 -14.3
2004-2005 83.5 30.9 111.5 42.7 -28.0
2005-2006 103.1 23.4 149.2 33.8 -46.1
2006-2007 126.4 22.6 185.7 24.5 -59.3
2007-2008 163.1 29.1 251.7 35.5 -88.5
2008-2009 185.3 13.6 303.6 20.7 -118.3
2009-10 178.6 -3.6 286.8 -5.5 -108.2
Source: DGCI&S
Current Global Scenario
As per IMF’s World Economic Outlook October, 2012, prospects of growth of
world output has been reduced to 3.3 percent in 2012 and 3.6 percent in 2013.
Growth in advanced economies is projected to expand by 1.3 percent in 2012 and
1.5 percent in 2013. Correspondingly, for emerging economies the envisaged
growth rates are 5.3 percent and 5.6 percent respectively. However, for India these
numbers have been reduced to 4.9 and 6.0 per cent for years 2012 and 2013 (this is
as against the original estimate of 6.1 and 6.5 per cent respectively).
According to United Nation’s World Economic Situation and prospects 2013,
conditioned on a set of assumptions in the United Nations baseline forecast, growth
of world gross product (WGP) is expected to reach 2.2 percent in 2012 and is
forecast to remain well below potential at 2.4 per cent in 2013 and 3.2 per cent in
2014. At this moderate pace, many economies will continue to operate below

92
potential and will not recover the jobs lost during the Great Recession. As per this
report, India’s growth rate is likely to be 5.5% for 2012 and 6.1% for 2013.
Impact on Global Trade
The volume of world merchandise trade rose 5.0 percent in 2011,
accompanied by global output growth of 2.4 per cent. This marked a
significant slowdown from 201, when trade advanced 13.8 percent and output
expanded by 3.8 percent.
According to WTO Press Release dated 21st September, 2012, slowing global
output growth has led World Trade Organisation (WTO) to downgrade its
2012 forecast for world trade expansion to 2.5% in September, 2012 from
3.7% in April, 2012 and to scale back their 2013 estimate to 4.5% from 5.6%
for the same period. On the export side, developed economies’ trade is
anticipated to grow at 1.5% increase in (down from 2%) and a 3.5%
expansion for developing countries (down from 5.6%) is expected. On the
import side, nearly stagnant growth of 0.4% in developed economies (down
sharply from 1.9%) is forecast and a more robust 5.4% increase in
developing countries (down from 6.2%) is expected.
Implications for Asia
The economies in developing Asia have weakened considerably during 2012
as the region’s growth engines, China and India, both shifted into lower gear. A
significant deceleration in exports has been a key factor for the slowdown.
Domestic investment has softened markedly.
Asian economies increased by 6.6 per cent which was highest in all regions.
India had the fastest exporting major traders in 2011, with shipments rising 16.1
percent. Meanwhile, China had the second-fastest export growth of any major
economy at 9.3 per cent.
The scheme-wise performance in respect of major schemes being
implemented by the Department is given below:-
I. Assistance to States for Development of Export Infrastructure and
Allied Activities (ASIDE) Scheme:
Basic objective of the scheme is to involve the States / UTs in export efforts
by providing incentive-linked assistance to concerned Governments and to create
appropriate infrastructure for development and growth of exports. It has been
possible to achieve this in spite of various constraints as is evident from active
participation of States/UTs in sponsoring a large number of export related projects
for assistance from ASIDE Scheme. Efforts have also been made by them to

93
leverage ASIDE funds for taking up several projects. Demands received far
outweigh availability of funds. Under the state component of the said scheme a
total number of 1371 projects worth Rs. 17622.18 crore have been approved by the
State Level Export Promotion Committees (SLEPCs) since 2002-03 to 2012-13 (as
on date). Out of this Rs. 5450.08 crore only has been proposed by State Govt./UTs
to be met from the ASIDE funds released to them under the state component and
the balance of Rs. 17077.17 crore have been/are being leveraged from State
Govt/UTs contribution and other sources identified by the State Govt./UTs.
Similarly in the Central Component a total of number 425 projects worth Rs. 2451.62
crore have been approved so far and out of that Rs. 1426.13 crore only has been/ is
to be funded from the central component of ASIDE scheme. Balance Rs. 1025.49
crore has been/is being leveraged from other sources including states, private
partnership and agencies of states. Thus in the project under central component of
the said scheme also it has been possible to involve states/central agencies.
During 2011-12, total numbers of projects approved by State Governments
under ASIDE scheme are 151 worth Rs. 1381.27 crore have been approved by the
State Level Export Promotion Committees (SLEPCs). Out of this Rs. 843.52 crore
only has been proposed by state govt./UTs to be met from the ASIDE funds and the
balance have been/are being leveraged from State Govt/UTs and other sources
identified by the State Govt./UTs.. Similarly in the Central Component a total of
number 33 projects worth Rs. 209.47 crore have been approved so far and out of
that Rs. 126.99 crore only has been/ is to be funded from the central component of
ASIDE scheme. Balance has been/is being leveraged from other sources including
states, private partnership and agencies of states.
The past performance of the scheme has been reviewed by IL&FS and as
per the Study Report submitted by them, some of the major achievements of the
scheme are as under:-
(i) ASIDE funds have been able to bring Economic and Social benefits like
growth in exports, growth in employment, growth in per-capita income and
increase in connectivity, the impact has been restricted to local or at the most
city level where such projects have been undertaken due to the fact that
contribution under ASIDE is extremely low vis-à-vis total infrastructure
development cost.
(ii) Investment in infrastructure has resulted in increase in exports as would be
evident from the fact that India’s exports has gone up from Rs. 208,978 crore
in 2001-02 to Rs. 456,422 crore in 2005-06 registering a compound annual
growth of 121%.

94
(iii) Funding pattern in respect of various projects shows a healthy mixture of
ASIDE funds, State Government Funds, and Private Sector Participation, in a
ratio of 4:4:2 indicating successful leverage of funds.
A mid-term appraisal of scheme during 11th Five Year Plan has been commissioned
to IL&FS, the report has been received. Salient findings of this report are as under:-
(i) During current appraisal process it has been now established that there has
been an upswing in exports from States and in concomitance there has been
an upswing in allocation, sanction and utilization and number of projects
being implemented.
(ii) Exports have more than doubled in the last four years and although the
increase in exports cannot be attributed solely to ASIDE, the scheme has
contributed substantially and handsomely to export efforts. In fact, most of the
states are now warming up to the scheme having understood and grasped
benefits of leveraging ASIDE funds.
(iii) A quantum jump in allocation of funds is imperative if substantial
improvements are to be expected in infrastructure, and therefore, exports.
II. Special Economic Zones (SEZs)
Setting up of SEZs is one of the major initiatives undertaken by the
Department. The Special Economic Zones (SEZs) set up as enclaves, separated
from the Domestic Tariff Area by fiscal barriers, are intended to provide a duty free
environment for export production. There are seven EPZs set up by the Central
Government which were converted to SEZs upon announcement of the SEZ Policy.
Santacruz Special Economic Zone (SEEPZ SEZ)
The Santacruz Special Economic Zone was set up in September 1974 in 100
acres of land. At present, there are 336 units in operation in the zone. The export
performance of the zone since 2008-09 is given in Table 4.2.
Table 4.2 Export Performance by SEEPZ
(Rs. Crore)
Year Target Exports
2006-07 ---- 12,047.67 2008-09 ---- 10,134.00
2009-10 ---- 10,151.00
2010-11 ---- 11,582.00
2011-12 ----- 12,607.65
2012-13(Upto Oct., 2012) 10,384.50
Source: SEEPZ

95
Noida Special Economic Zone
The Noida Special Economic Zone (NSEZ) was set up in 1985 in Noida
(U.P). This zone has been developed in a phased manner on 310 acres of land. At
present, there are 427 units in operation providing employment to 44071 persons.
The NSEZ is a multi product zone with units engaged in manufacturing of electronic
items, software products, engineering goods, gem and jewellery, toys, garments and
pharmaceuticals, Leather & Sports, Plastic & Rubber, and Food & Agro etc. The
export performance of the zone since 2008-09 is given in Table 4.3.
Table 4.3 Export Performance by NSEZ
(Rs. Crore)
Year Target Exports
2008-09 10,000.00 16,308.00
2009-10 9,000.00 8,560.27
2010-11 9,000.00 9,405.88
2011-12 1,000.00 10,820.11
2012-13(upto Dec., 2012) ------------ 5,440.12 (projected )
Source: SEEPZ
Kandla Special Economic Zone (KSEZ)
Kandla Free Trade Zone was set up in 1965 as Asia’s first export processing
Zone (EPZ) was converted into Special Economic Zone (KASEZ) with effect from
November, 2000. Kandla SEZ is situated in the Gulf of Kutch on the west coast of
India, at distance of only 9 kms away from the major port of Kandla, fully developed
all weather port. Mundra port with world class container terminal is only 60 kms
away. The Zone’s adjectives are earning foreign exchange for the country,
developing more employment opportunities. The zone has achieved all these
objectives in significant measures.
The total number of units operating in the zone are 185 and 15 are on the
approved list at various stages of implementation. New industries are coming up for
various products like auto components, drugs and pharmaceuticals, chemicals and
readymade garments. Developed plot and readymade sheds are made available to
them. The working unit includes those for manufacturing of engineering goods,
readymade garments, perfumes and cosmetics, castor oil products and plastic
products.
About 15 new units are expected to be added this year, increasing the
potential of exports over Rs. 1500 lakh and additional investment to the tune
of Rs. 3240 lakh. . The export performance of the zone since 2008-09 is given in
Table 4.4.

96
Table 4.4 Export Performance by KASEZ
(Rs. Crore)
Year Target Exports
2008-09 ---- 2420.38
2009-10 ---- 2205.79
2010-11 ---- 2672.29
2011-12 ----- 2960.82
2012-13 (upto Dec., 2012) 2240.47
Source: SEEPZ
Madras Special Economic Zone (MEPZ SEZ)
MPEZ Special Economic Zone was established in May1984 as a Multi
product Export Zone with the main objective of augmenting exports and thereby
enhancing foreign exchange earnings by setting up Units inside the Zone. The Zone
ensure excellent infrastructure required for setting up industrial units, including
developed plots and modules in Standard Design Factory buildings for immediate
occupation. There are at present 114 active exporters within the Zone. The year-
wise exports from MEPZ SEZ since 2008-09 are given in Table 4.5.
Table 4.5
Export from MEPZ SEZ (Rs. Crore)
Year Target Exports
2008-09 4000.00 4139.15
2009-10 4600.00 5977.59
2010-11 ---- 9019.08
2011-12 ---- 10688.53
2012-13 (upto Dec., 2012) 8336.00
Source: MEPZ SEZ
Cochin Special Economic Zone (CSEZ)
CSEZ, a multi-product zone, came in to existence in 1984 and became
operational in 1986. It was converted into a Special Economic Zone on November 1,
2000. CSEZ stands out amongst the SEZs in India as having the best infrastructure.
It is the only Government owned SEZ in India distributing power within the Zone. It
has an integrated water management system comprising a 2.25 mld water supply
system and a 1.8 mld Common Effluent Treatment Plant. The Zone has round the
clock on-site Customs clearances. A VSNL 15 GBPS gateway is installed in the
Zone which provides internet connection through optical fibre cable to users. The

97
Zone has state-of-art 1000 line telephone exchange, a video conferencing studio, a
foreign post offshore banking unit, a health dispensary and branches of State Bank
of India and Indus Bank with ATM facilities. CSEZ has also pioneered public-private
participation in infrastructure development. The year-wise exports since 2008-09 are
given in Table 4.6
Table 4.6
Export from CSEZ
(Rs. Crore)
Year Target Exports
2008-09 ---- 11,549.05
2009-10 ---- 17,003.53
2010-11 ---- 18,311.97
2011-12 ---- 29,961.61
2012-13(upto Dec., 2012) ---- 24,618.01
Source: CSEZ
Falta Special Economic Zone (FSEZ)
The Falta Special Economic Zone has been set up over an area of 280 acres.
The zone is engaged in manufacturing of electronic items, engineering goods, gems
& jewellery, readymade garments, rubber products, frozen foods, tea etc. The year-
wise exports from the zone since 2008-09 are given in Table 4.7.
Table 4.7 Export from FSEZ
(Rs. Crore)
Year Target Exports
2008-09 ----- 961.26
2009-10 ----- 1172.56
2010-11 ----- 14852.43
2011-12 ----- 1470.13
2012-13(upto Dec., 2012) ----- 582.92
Source: FSEZ
Visakhapatnam Special Economic Zone (VSEZ)
The Visakhapatnam Special Economic Zone was established in March, 1989
as a multi product Export zone. At present, there are 55 active exporters within the
zone. The year-wise exports from the zone since 2008-09 are given in Table 4.8.

98
Table 4.8 Export from VSEZ
(Rs.Crore)
Year Target Exports
2008-09 850.00 901.84
2009-10 900.00 917.85
2010-11 1100.00 1583.00
2011-12 2000.00 2404.15
2012-13(upto Dec., 2012) ----- 2532.27
Source: VSEZ
In addition to the above mentioned 8 Central Government owned SEZs, 12
SEZs were set up by the State Governments/private sector prior to the coming into
force of the SEZ act, 2005.
After the coming into force of the SEZ Act, 2005 on 10th February 2006, 577
formal approvals (as on 20.01.2012) have been granted for setting up of Special
Economic Zones. Out of these, 385 SEZs have been notified and are in various
stages of operation.
Development of Infrastructure in Special Economic Zones
The capital outlay of Special Economic Zones for development of
infrastructure is funded under the Assistance to States for Developing Export
Infrastructure and Allied Activities (ASIDE) Scheme from 1.4.2002.
Employment in the SEZs
As on 31st December, 2012, the total direct employment in the SEZ sector is
estimated at 10, 19,146 persons. It includes incremental employment of 8, 84, 442
persons generated since February, 2006. The composition of total employment
generated in the SEZ sector is given in Table 4.9.
Table 4.9
Employment in SEZs (as on 31st Dec.2012)
Sl.No Category Employment (Nos.)
1. 7 Central Govt. SEZs 2, 21,833 persons
2. 12 Private/State Govt. new generation SEZs set up/notified prior to SEZ Act, 2005
93,087 persons
3. SEZs notified under the SEZ Act, 2005 7,04, 226 persons
TOTAL 10,19,146 persons

99
Investment in the SEZs
As on 31st December, 2012, the total private sector investment in the SEZ
sector in India is estimated at Rs.2, 38, 990.00 crore. Incremental private investment
after the SEZ Act, 2005 came into force, is estimated at Rs.2, 45, 595.31crore. The
composition of the total private sector investment (as on 31st December, 2012) is in
Table 4.10.
Table 4.10 Private Investment in SEZs (as on 31st Dec.2012)
Sl.No. Category Investment (Rs. Crore)
1. 7 Central Govt. SEZs 11,545.40
2. 12 Private/State Govt. new generation SEZs set up/notified prior to SEZ Act, 2005
8,525.42
3. SEZs notified under the SEZ Act, 2005 2,18,919.16
TOTAL 2,38,990.18
Exports from SEZs
As on 31st December, 2012, 154 SEZs have commenced exports. The
exports in the current year i.e. 2012-13 (up to 31st December, 2012) from the SEZs
in the country as a whole were of the order of Rs 3,53,194,90 crore as compared to
Rs 3,64,478.00 crore during the complete year of 2011-12. Exports from the
functioning Special Economic Zones during the last 5 years are as indicated in
Table 4.11.
Table: 4.11 Exports from the SEZs (2008-2009)
Year Value (Rs. Crore)
Increase (%) (Over previous year)
2008-09 99,689 50
2009-10 2,20,711 121
2010-11 3,15,867.85 43.11
2011-12 3,64,478.00 15.39
2012-13 (upto December, 2012) 3,53,194.90 35.34

100
III. Tea Board
REVIEW OF SCHEME WISE PERFORMANCE DURING 2012-13 (April 12-
December 2012)
Sl No Name of the XI Plan Schemes
XII Plan outlay (Rs in Crore)
XII Plan Physical Major Targets
Targets 2011-12
Achievements-2011-12
Targets 2012-13 (as per BE-12-13)**
Achievements-2012-13 (Upto 31
st
December, 2012)
Fin Phy Fin Phy Fin Phy Fin Phy
1 Plantation Development Scheme
400
Irrigation (ha) Field Mechanization Self-Help Group (Nos.) Extension Planting (ha)
13.00
1500 - 45 500
18.44
17905.4 - 98 653.24
10.00
4000 NQ 25 1500
8.10
1307.29 - 12 551.39
1.1 Special Purpose Tea Fund
Replanting (ha) Rejuvenation (ha)
60.00 (45.00+15.00)
6000 1000
43.16 6504.28 1113.26
60.00 6000 1000
42.49 2802.66 807.05
2.1 Quality Up-gradation & Product Diversification Scheme
300
Factory Modernization (units) Value Addition (units) Quality certification (units) Product diversification (units)
42.00
100 25 25 -
42.54
424 49 80 2
45.00 350 13 110
29.87 192 6 7
2.2 Orthodox Production Subsidy
Orthodox Production Subsidy (m. kg.) 33.00 80 72.32 90.19 25.00 95 19.00 35
3 Market Promotion Scheme
200
International Fairs & Exhibitions- 100 Nos.(for entire 12th Plan period )
15.00 14 19.02 225 26.00
13 + 2 International Exhibitions approved
19.90
12 International exhibitions
4. i. Human Resource Development
150
i. Health care: Drinking water- Sanitation Capital grant to Hospitals / clinics ii. Education: Educational stipend / uniforms /book grants etc. Capital grant to schools & hostels Assistance for organizing Bharat Scouts and Guides & sports activities in
5.00
1000 10 10 1000
4.66
0 1 1392 17 3773
12.00
Drinking water-3000 Sanitation - 1666 units Hospital grant - 12 Book Grant-20000 units
12.00

101
** The Financial target of Rs. 200.20 Cr which was based on Budget Estimate will have to be reduced if the Revised Budget Estimate remains at the intimated level of Rs. 164.67 Crore
plantation Districts Training: Training of small growers+ workers Training of garden managers
Training of Extension service providers to SHGs
Planters Productivity councils
4000 500 83 3
4500 500 20 7
5 iii. Research & Development
150
12.00 NQ 18.82 NQ 12.00 NQ 8.95
6 iv. Small Grower Development Scheme
200
New Planting (ha) Replanting(ha) Rejuvenation(ha) Irrigation(ha) Nos. of SGH/ Producers’ Society Setting up of new factories by SHGs Strenthening of field offices of Tea Board Field Mechanization
New schemes proposed for 12th
Plan
0.10
1300 200 300 1000 75 7 NQ NQ
0
7 v. National Programme for Tea Regulation
25
0.10 NQ 0
8 vi. Scheduled Caste-Sub Plan
0 10 420 9.31 420 10.00 2.74
vii. Total 1425 190.00 9.31
200.20
143.05

102
IV. Coffee Board
REVIEW OF SCHEME-WISE PERFORMANCE DURING 2010-11, 2011-12 & 2012-13 (April – Dec. 2012)
Sl. No
Name of Scheme/ programme
Objective/ Outcome
Physical Performance during 2010-11
Physical Performance during 2011-12
Physical Target during 2012-13
Physical Performance upto Apr.-Dec. 2012
Reason for variation
1 2 3 4 5 6 7 8
1 R & D for Sustainable coffee production
To increase coffee production, productivity and quality through sustainable research & develop- mental approach.
Production estimates – 3,02,000 MT Productivity – 838 kg. /ha.
Production estimates – 3,14,000 MT Productivity – 852 kg. /ha.
Production estimates – 3,10,000 MT Productivity – 841 kg. /ha.
3,15,500 MT (P) 855 kg. /ha.
On account of weather conditions, rainfall and pest & diseases during monsoon.
2
Development Support
To provide development support to enhance farm productivity through replanting, water augmentation, pollution abatement, coffee development in NE Region and NTA (Andhra Pradesh & Orissa), capacity building among various stake holders in the Indian coffee sector, welfare support to coffee sector workers and tiny coffee growers.
3 Market Develop-ment
To enhance domestic coffee consumption and carry out market research and intelligence and dissemination of information to stake holders
Domestic Consumption : 1,08,000 MT
Domestic Consumption : 1,15,000 MT
Domestic Consumption : 1,20,000 MT
--
Yet to be assessed.
4 Risk Management to coffee growers
To provide effective risk management aid to those coffee growers likely to be impacted by adverse rainfall.
Monsoon risk for about 19400 small growers of less than 10 ha. category have been covered benefiting around 24400 ha.
Small Growers : 6384 nos.
Small Growers : 5000 nos.
-- To be achieved in IV qtr.

103
5 Export Promotion of coffee
To enhance market share of value added and high value coffees in key overseas markets to augment export earnings and to enhance market share of Indian coffees in far off key international markets.
Export of coffee : Qty in MT: 2,99,725
Export of coffee : Qty in MT: 3,24,052
Export of coffee : Qty in MT: 2,97,800
Export of coffee : Qty in MT : 2,10,858 (P)
Likely to
achieve the target.
6 Support for coffee processing
To achieve value addition in coffee by supporting the processing activities and to support small and medium entrepreneurs for setting up quality coffee processing units.
Setting up -26 nos of Coffee processing units
Setting up- 33 nos of Coffee processing units
Setting up- 10 nos of Coffee processing units
Setting up - 5 nos of Coffee processing units
Achievement is likely
to improve.
7 Support for Mechanisa-tion of farm operations
To provide support to coffee growers to encourage the use of farm machineries to improve productivity and efficiency in carrying out crucial farm operations for coffee in time particularly in the context of farm labour.
Machineries – 1564 units.
Machineries – 18380 units.
Machineries – 8000 units.
Machineries – 3051 units.
Achievement is likely
to improve.
Production
The post monsoon crop estimates for the 2012-13 season has been placed at
3,15,500 MT consisting of 1,00,225 MT of Arabica and 2,15,275 MT of Robusta as
compared to the final crop estimates for 2011-12 season which was 3,14,000 MT
comprising of 1,01,500 MT of Arabica and 2,12,500 MT of Robusta.
The crop estimate projected for 2013-14 season is 3, 34,800 MT.
Exports
The quantity of coffee exported during 2011-12 was, 3, 24,052 MT valued at
Rs.4, 544.03 crore as against the total quantity of 2, 99,725 MT of coffee exported
during previous year valued at Rs. 3365.41 crore. The coffee exports during 2011-
12 have reached an all time record.
During the year 2012-13, the provisional exports as on 31.12.2012 is 2,
10,858 MT valued at Rs. 3,270.09 crore, as against the export target of 2, 97,800
MT.
The export target for the year 2013-14 is projected at 2, 56,000 MT.

104
V. Rubber Board
Key statistics on the NR sector from 2007-08 to 2011-12 are presented in the following table.
Table 2: Key statistics on the NR sector in India
Year Planted
area (ha)
Production (tonne)
Export (tonne)
Import (tonne)
Consumption (tonne)
2007-08 635400 825345 60353 86394 861455
2008-09 661980 864500 46926 77762 871720
2009-10 686515 831400 25090 177130 930565
2010-11 711560 861950 29851 190692 947715
2011-12 734780 903700 27145 213785 964415
There are more than one million small and marginal farmers with an average
size of holding of 0.54 ha engaged in rubber cultivation. The smallholding sector
accounts for 90 per cent of rubber planted area and 93 per cent of rubber
production.
Performance of NR sector in 2011-12
Rubber planted area in 2011-12 was 734,780 ha and tapped area extended
to 67% of the total. Production of NR in 2011-12 increased by 4.8% over that of
2010-11 to 903,700 tonnes while consumption of NR increased by 1.8% to 964,415
tonnes. NR consumption in tyre sector increased by 5.7% whereas the
consumption in non-tyre sector declined by 4.9%. The closing stock of NR in 2011-
12 was 236,275 tonne.
Table 3 Performance of NR sector in 2011-12
Planted area (ha) 734,780
Tapped area (ha) 490,870
Productivity (kg/ha) 1,841
Opening stock (tonne) 288,300
Production (tonne) 903,700
Consumption (tonne) 964,415
Import (tonne) 213,785
Export (tonne) 27,145
Closing stock (tonne) 236,275

105
Performance of NR sector in 2012-13
Monthly NR production had decreased in April and May 2012 due to adverse
weather conditions. However, during April-December 2012 NR production grew by
1.7%. Consumption of NR grew by 3.3% during April-December 2012. But
consumption of NR in November and December 2012 declined by 4% and 8%
respectively as compared to the same months in the previous year due to the impact
of economic recession. Import and export of NR during April to December 2012
were 173,422 tonnes and 10,782 tonnes respectively. Import of NR through duty
free channels accounted for 46% of the total during April-December 2012. The
estimated stock of NR at the end of December 2012 was 290,000 tonne.
Table 4. Projections and performance during 2012-13 (Tonne)
Major indicators Original projections
Revised projections (September 2012)
Revised Projections (January 2013)
April- December 2012
Production 942,000 930,000 920,000 693,200
Consumption 1006,000 1006,000 970,000 742,815
Import 150,000 160,000 200,000 173,422
Export 50,000 40,000 20,000 10,782
Stock at the end of the year
266,000 270,000 293,000 290,000
Projections for current year were revised based on the actual performance of
NR sector during April-December 2012. Projection of NR production is further
reduced to 920,000 tonnes and projection on consumption was revised downwards
to 970,000 tonnes. Projection on NR import was revised upwards to 200,000 tonnes
and that of export was revised as 20,000 tonnes. The projected closing stock of NR
in 2012-13 is 290,000 tonnes.
Projection for 2013-14
Production and consumption of NR in 2013-14 are projected at 960,000
tonnes and 1,020,000 tonnes respectively.

106
Review of past performance- Scheme-wise Physical Targets & Achievement
Schemes Major Physical Components 2011-12 2012-13
Target Achievement Target Provisional Achievement upto 31.12.12
Scheme 1 a) New Planting (ha) 2000 4806
9000 6028
Rubber Plantation Development Scheme (RPDS)
b) Replanting (ha) 6350 4488
c) Input Supply with price concession (ha) 20000 19000 20000 19000
d) Formation of New RPS/SHGs (No.) 150 127 50 67
e) Group Processing Centres (No.) 8 7 5 2
f) Apiculture (nos.) 3000 2593 2500 626
Scheme 2 a) Cross pollination (No.) 10123 11000 3811
Research
b) Testing of soil. leaf, latex, ethephon and rainguarding material (No.)
No target fixed
70015 90000 51244
c) Scientific and popular publications (No.) 115 60 189
Scheme 3 Technically Specified Rubber (TSR)
Processing Quality Upgradation & Product Development (PQUPDS)
a) Quality Upgradation (No.) 5 21 5 6
b) Modernisation (No.) 6 19 6 10
Rubberwood
a) Processing, value addition and quality improvement (No.) 4 2 4 2
b) Waste utilisation and management (No.) 2 2 2 0
Scheme 4 Rubber
Market Development & Export Promotion (MD&EP)
a) Godown - 100 MT (No.) 5 0 1 0
b) Strengthening RPS sector in marketing (No.) 11 25 11 12
Rubberwood
Rubberwood promotion – domestic (No.) 15 2 15 0
Export Promotion
a) Export of NR (tonnes) 50000 27145 20000 10782
b) Participation in international trade fairs (No.) 10 6 4 4
Scheme 5
Human Resource Development (HRD)
a) Training (no. of participants) 10020 11372 10020 7170
b) Labour Welfare Programmes (no. of beneficiaries) 26510 26930 21650 12019
Scheme 6 a) New Planting (ha) 7000 9795 7500 4006
Rubber Dev. in the NE Region (RDNE)
b) Input Supply with Price concession (ha) 5000 947 5000 0

107
VI. SPICES BOARD
Review of past performances:
Spices Board had been constituted on 26th February 1987 under the Spices
Board Act 1986 (No.10 of 1986) by merging the erstwhile Cardamom Board and
Spices Export Promotion Council with the responsibility of export development and
promotion of 52 spices listed in the schedule of the Act and the overall development
and marketing of both small and large cardamom. The programmes for development
of spices in North East, organic spices, and post harvest improvement as an export
enhancing measure are also undertaken by the Board.
Production of spices
Production development of cardamom (small & large) is looked after by
Spices Board and production development of all other spices is under the Union
Agriculture Ministry and the concerned State Agriculture/Horticulture Departments.
The Directorate of Arecanut & Spice Development, Calicut, monitors the Central
Sector Schemes of the Ministry of Agriculture on spices in this regard.
Cardamom (small & large)
The estimated production of cardamom (small & large) during the last three years is
given in table I and II
Table I
State-wise area and production of cardamom (small)
(Area in Hect. , Production in Tons)
State 2010-11 2011-12 2012-13[*]
Area Production Area Production Area Production
Kerala 41242 7935 41425 10222 41600 8400
Karnataka 25210 1710 25125 1911 25125 1470
Tamilnandu 4560 735 4560 842 4560 630
Total 71012 10380 71110 12975 71285 10500
(*) Preliminary crop estimation

108
Table II
State-wise area and production of cardamom (large)
(Area in Hect. , Production in Tons)
State 2010-11 2011-12 2012-13[*]
Area Production Area Production Area Production
Sikkim 23679 3310 23155 3234 22755 3483
West Bengal 3305 608 3305 626 3305 662
Total 26984 3918 26460 3860 26060 4145
(*) Preliminary crop estimation
Export of spices
The export of spices from India during the last few years is given below.
Export of spices from India
Year
Quantity (Tons)
Value (Rs.crores)
Value (US$ Million)
2005-06 350,363 2627.62 592.90
2006-07 373,750 3575.75 792.95
2007-08 444,250 4435.50 1101.80
2008-09 470,520 5300.25 1168.40
2009-10 502,750 5560.50 1173.75
2010-11 5,25,750 6840.71 1500.00
2011-12 5,75,270 9783.42 2037.76
2012-13 (APR-OCT] 3,85,915 5941.24 1079.78
Spices export from the country continued its momentum of growth and
recorded yet again a new peak both in quantity and value during the financial year
2011-12. The total export of spices during the period has also crossed US$ 2.0
billion mark. During the financial year 2011-12, a total of 5,75,270 tons of spices and
spice products valued Rs.9783.42 crore (US$ 2037.76 Million) has been exported
as against 525,750 tons valued Rs.6840.70 crore (US$ 1502.85 million) in 2010-11,
registering an increase of nine per cent in volume and 43% in rupee terms of value.
The increase in dollar terms over the previous year is 36%. Compared to the spices
export target of 500,000 tons valued Rs.6500.00 crore (US$1450 million) set for the
financial year 2011-12, the achievement is 115% in terms of quantity and 151 % in
rupee and 141% dollar in terms of value. The itemwise export of spices during Apr –
Mar 2011-12 and Apr – Oct 2012 is given in Table III:

109
Table III
Import of spices:
India is importing all spices mainly spices like pepper, fresh ginger, cassia,
clove, cardamom (large) etc. Pepper is mainly imported for the industrial purposes.
The estimated Import of spices during 2011-12 was 111,136 tons valued at 2094.48
crores (US$ 445.18 million) as compared to 86,775 tons valued at 1175.51 crores
(US$ 257.00 million) in 2010-11.
Item 2011-12
2012-13 (April-Oct 2012)
Quantity Tons
Value (Crores)
Qty Tons
Value (Crores)
Pepper 26,700 878.13 7850 325.43
Cardamom (small) 4,650 363.22 1075 93.24
Cardamom (large) 935 68.3 635 41.07
Chili 241,000 2144.08 160000 1299.13
Ginger 21,550 204.2 14650 108.49
Turmeric 79,500 734.35 43250 266.96
Coriander 28,100 164.02 20000 104.63
Cumin 45,500 644.42 39400 530.02
Celery 3,650 23.4 2050 13.34
Fennel 8,100 72.09 7525 57.39
Fenugreek 21,800 72.75 14500 51.39
Other seeds (1) 13,050 58.81 10200 59.74
Garlic 2,200 14.16 13000 36.06
Nutmeg & mace 3,620 240.98 2080 145.66
Other spices (2) 35,900 320.33 25350 194.46
Curry powders/paste 17,000 252.08 10050 159.32
Mint products (3) 14,750 2223.72 9430 1712.72
Spice oils & oleoresins
7,265 1304.38 4870 742.19
Total 575270 9783.42 385915 5941.24
Value in Million US$ 2037.76 1079.78
(1) include mustard, aniseed, ajwanseed, dill seed, poppy seed etc
(2) include tamarind, asafetida, cassia, saffron etc
(3) include mint oils, menthol & menthol crystal

110
Plan Schemes
Based on the proposals submitted by Spices Board the Government has approved the following six schemes for implementation for implementation during the XI Plan period.
1. Export oriented production and post harvest improvement of spices
2. Export development & promotion of spices
3. Export oriented research
4. Quality improvement and strengthening of quality evaluation laboratory
5. Human resource development & capital works
The Board had decided to discontinue the rejuvenation programme due to
lack of demand. The replantation programme is proposed to be continued during XII
plan also since it is an ongoing programme and it is merged with Export Oriented
production during XII plan.
The scheme for replantation and rejuvenation of pepper in Waynad district of
Kerala and NE region with a subsidy component of Rs.53.28 crores out of the total
outlay of Rs.100.81 crores has been approved in October 2009 for implementation
for five years. So far, an area of 8152 ha. has been covered during XI plan. It is
proposed to continue the programme during 2012-13 and 2013-14 with a physical
target of 3650 ha and 3150 ha respectively.
VII. Tobacco Board
Tobacco is an important commercial crop in India. The FCV tobacco is grown
principally in the states of A.P. 57%, Karnataka 42% and Maharashtra & Orissa
below 1%. The Board fixes the Flue Cured Tobacco crop size every year in
Karnataka, Andhra Pradesh, Maharashtra and Orissa states to match the demand
for the same both for domestic and export front.
Production:
FCV tobacco is the major tobacco variety exported accounting for 73% of the
total exports by volume and major type utilized upto 90% of total usage by the
domestic cigarette industry. The FCV tobacco is grown principally in the states of
Andhra Pradesh (57%), Karnataka (42%), Maharashtra and Orissa (below 1%)
The year-wise crop targets and actual production of FCV Tobacco products during the last four years are as given in Table

111
Table
Crop Season Target fixed (quantity in M. Kgs.)
(AP & KK)
Quantity Marketed (Quantity in M. Kgs.)
Marketed Value (Rupee in Crores)
2009-10 270.00 323.25 2944.44
2010-11 270.00 301.10 2968.46
2011-12 262.00 266.99 2510.77
2012-13* 268.00 44.19 536.29
*(as on 08.02.2003 for KK only and AP actions will commence in the month of
February, 2013)
Exports
The Board undertakes the following measures for sustaining and improving
the exports of Indian tobacco.
Participation in international trade fairs and exhibitions.
Intensive interaction at high level bilateral official meetings.
Undertaking an extensive advertisement campaign in the international print
media to create brand image for Indian tobacco.
Sponsoring trade delegations to various countries and inviting delegations
from abroad.
During 2011-12, a quantity of 240395 M.T. of unmanufactured tobacco and
tobacco products valued at Rs. 4100.30 crore (854.94US$) was exported as
compared to 154171 MT valued at Rs. 2523.14 crore(543.43 US$) exported during
the corresponding period of 2011-12(April-November, 2011).
During 2012-13 (April-November, 2012) a quantity of 169869 M.T. of
unmanufactured tobacco and tobacco products valued at Rs. 3053.29 crore (559.93
US$) was exported as compared to 154171 M.T. valued at Rs. 2523.14 crore
(543.43US$) exported during 2011-12(April-November, 2011).
Auctions:
Auction system for sale of FCV tobacco was introduced during 1984 in
Karnataka and during 1985 in Andhra Pradesh. At present, Board is conducting
auctions at 11 auction platforms in Karnataka and 20 auctions plat forms in Andhra
Pradesh.
The progress made in this regard is given below:

112
During 2011, the volume of 173.25 M.kgs of tobacco marketed with an
average price of Rs. 87.64 per kg in AP and the volume of 60.06 M.kgs of tobacco
marketed with an average price of Rs. 98.26 per kg in Karnataka.
During 2012, the volume of 162.70 M.kgs of tobacco marketed with an
average price of Rs. 94.90 per kg in AP and the volume of 44.19 M.kgs of tobacco
marketed with an average price of Rs. 121.39 per kg in Karnataka(as on
08.01.2013)..
Export Promotion Activities
With a view to promote exports of tobacco and tobacco products, the Board
participated in the following fairs and exhibitions during 2012-13:
Fairs & Exhibitions Abroad:
World Tobacco Middle East, Dubai, UAE during 2-3 April, 2012.
Inter-Tabac, Dortmund, Germany during 14-16 September, 2012.
World Tobacco Asia 2012, Jakarta, Indonesia during 19-21 September,
2012.
Trade Delegations Abroad:
Participation by Chairman, tobacco Board in GTNF 2012, Antwerp,
Belgium during 11-15 June, 2012.
The Board has issued advertisements in various internationally published
tobacco magazines for creating brand image for Indian Tobacco and tobacco
products.
VIII. Marine Products Export Development Authority (MPEDA)
EXPORT PERFORMANCEMARINE PRODUCTS EXPORTS CROSSED 3.5 BILLION MARK IN 2011-12
During the financial year 2011-12, for the first time in the history of Marine
product exports, the export earnings have crossed USD 3.5 billion. This is also first
time export has crossed all previous records in quantity, rupee value and US $
terms. Exports aggregated to 862021 tonnes valued at Rs. 16597.23 crores and
USD 3508.45 million. Compared to the previous year, seafood exports recorded a

113
growth of 6.02% in quantity, 28.65% in rupee and 22.81% growth in US$ earnings
respectively.
MARINE PRODUCTS EXPORT GROWTH IN US$ TERMS
The figures must be viewed in the light of the scenario of continuing
recession in the international markets, debt crisis in EU economies, continuing
antidumping duty in US, sluggish growth in US economy and the political instability
in the Arab world. The increased production of Vannamei shrimp, increased
productivity of Black tiger shrimp and better price realization of major items like
Shrimp, Squid and Cuttlefish helped us to gain such a higher export turnover.
Exports during 2011-12 compared to 2010-11
Export details 2011-12 2010-11 Growth %
Quantity Tonnes 862021 813091 6.02
Value Rs.crore 16597.23 12901.47 28.65
Value US $ Million 3508.45 2856.92 22.81
Marine Products Export Growth in US $ Terms
12531425
13311478
1644
1853 1899 1909
2133
2857
3508
0
500
1000
1500
2000
2500
3000
3500
4000
2001-02 2002-03 2003-04 2004-05 2005-06 2006-07 2007-08 2008-09 2009-10 2010-11 2011-12
US
$ M
in.

114
Major items of export
Frozen Shrimp continued to be the major export value item accounting for
49.63% of the total US $ earnings. Shrimp exports during the period increased by 24.86%, 42.97% and 37.99% in quantity, rupee value and US$ value respectively.
Fish, has retained its position as the principal export item in quantity terms and the second largest export item in value terms, accounted for a share of about 40.27% in quantity and 19.48% in US$ earnings.
Fr. Cuttlefish recorded a growth of 21.92% in rupee value and 15.58% in
USD terms. Unit value also increased by 25.06%, however, there is a decline in quantity (7.59%). Export of Fr. Squid showed an increase of 21.53% in rupee value and 17.46% in US$ realization. Unit value also increased by 32.95%. However, there is a decrease of 11.65% in terms of quantity.
Live items also showed a growth in quantity by 8.76% in terms of rupee value and 3.18 % in terms of US$ realization , however, shows a decline of 19.37% in terms of quantity compared to the previous year.
Exports during 2011-12 compared to 2010-11
862021
165972
350845
813091
129015
285692
0
100000
200000
300000
400000
500000
600000
700000
800000
900000
1000000
Quantity Tonnes Value Rs.10 lakh US $ '000'
2011-12
2010-11

115
Dried items showed a drastic decline in quantity, value and USS terms by 32.05%. 41.08% and 44.56% respectively. The details are given in the following table:
MAJOR ITEM WISE EXPORTS
ITEM Share% 2011-12 2010-11 Variation (%)
FROZEN SHRIMP Q: 22 189125 151465 37660 24.86
V: 49.26 8175.26 5718.13 2,457.13 42.97
$: 49.63 1741.20 1261.81 479.39 37.99
UV$: 9.21 8.33 1 10.51
FROZEN FISH Q: 40 347118 312358 34759 11.13
V: 19.79 3284.15 2623.89 660.25 25.16
$: 19.48 683.50 583.48 100.02 17.14
UV$: 1.97 1.87 0 5.41
FR CUTTLE FISH Q: 6 54671 59159 -4488 -7.59
V: 8.11 1346.72 1104.57 242.15 21.92
$: 8.06 282.72 244.62 38.10 15.58
UV$: 5.17 4.13 1 25.06
FR SQUID Q: 9 77373 87579 -10207 -11.65
V: 7.40 1228.19 1010.57 217.61 21.53
$: 7.49 262.72 223.67 39.04 17.46
UV$: 3.40 2.55 1 32.95
DRIED ITEM Q: 6 53721 79059 -25338 -32.05
V: 3.39 562.65 954.94 -392.30 -41.08
$: 3.35 117.66 212.22 -94.56 -44.56
UV$: 2.19 2.68 0 -18.41
LIVE ITEMS Q: 0 4199 5208 -1009 -19.37
V: 0.93 154.61 142.15 12.45 8.76
$: 0.93 32.46 31.46 1.00 3.18
UV$: 7.73 6.04 2 27.98
CHILLED ITEMS Q: 2 21278 21118 160 0.76
V: 2.15 357.42 257.54 99.88 38.78
$: 2.11 74.03 56.93 17.10 30.03
UV$: 3.48 2.70 1 29.05
OTHERS Q: 13 114538 97145 17393 17.90
V: 8.97 1488.24 1089.67 398.57 36.58
$: 8.95 314.16 242.72 71.44 29.43
UV$: 2.74 2.50 0 9.78
TOTAL Q: 100 862021 813091 48931 6.02
V: 100 16597.23 12901.47 3,695.76 28.65
$: 100 3508.45 2856.92 651.53 22.81
UV$: 4.07 3.51 1 15.83

116
Item wise Exports 2011-12
(In Qty)
FROZEN SHRIMP
23%
FROZEN FISH
41%
FR CUTTLE FISH
6%
FR SQUID
9%
DRIED ITEM
6%
LIVE ITEMS
0%
CHILLED ITEMS
2%
OTHERS
13%

117
Major export markets
South East Asia became the largest buyer of Indian marine products with a
share of 39.90 % in volume and 25.09 % in US $ realization. European Union (EU)
got into the second place with a share of 22.96% followed by USA 18.17%, Japan
13.01%, China 7.51%, Middle East 5.33% and Other Countries by 7.95%.
Exports to South East Asia registered a growth of 87.51 % in US$
realization and 47.01% in terms of volume. Increase in export of Fr. Shrimp, Fr.
Fish and Chilled items contributed to the growth. Exports to US had registered a
positive growth of 36.45% in quantity and 45.39% in US$ realization and is mainly
attributed by the export of Fr. Shrimp and cephalopods. . Exports of Vannamei
shrimp showed a tremendous increase in US market by 212 % in quantity and
208% in US $ realization.
Export to Japan also registered a positive growth of 21.33% in quantity
and 22.35% in US $ terms. Exports of chilled items showed a tremendous increase
in Japanese market by 118.59% in quantity and 220.34% in US $ realization.
ITEM WISE EXPORTS 2011-12
( IN VALUE)
FR SQUID
7%
DRIED ITEM
3%
LIVE ITEMS
1%
CHILLED ITEMS
2%
FR CUTTLE FISH
8%
OTHERS
9%
FROZEN SHRIMP
50%
FROZEN FISH
20%

118
Exports to China showed a drastic decline of 46.89% in quantity and 40.17% in US$ terms. The marine products exports have strengthened India’s presence in South East Asia. There is a significant increase in exports to South East Asian Countries compared to the previous year.
Export of Fr. Shrimp to South East Asia has registered a growth of about 222.39% in volume and 356.21% in US$ terms. Export of Fr. Shrimp to USA has also showed a growth of about 47.67% in volume and 47.52% in US$ terms. Export of Vannamei shrimp had also picked up. We have exported about 40787 MT of Vannamei shrimp during this period.
Export to Middle East countries showed an increase of 25.98% in US$ realization but declined in quantity by 13.25%. The details are given in the following table.
MAJOR MARKET WISE EXPORTS
Q: Quantity in Tons, V: Value in Rs. Crore, $: US$ Million
Country Share % Apr-2011 -
Mar-2012 Apr-2010 -
Mar-2011 Variation (%)
JAPAN Q: 10 85800 70714 15085 21.33
V: 12.90 2,140.67 1,683.39 457.28 27.16
$: 13.01 456.35 373.00 83.36 22.35
USA Q: 8 68354 50095 18259 36.45
V: 17.94 2,977.53 1,990.26 987.26 49.60
$: 18.17 637.53 438.49 199.04 45.39
EUROPEAN UNION Q: 18 154221 170963 -16742 -9.79
V: 22.96 3,810.44 3,459.40 351.04 10.15
$: 22.96 805.38 765.15 40.23 5.26
CHINA Q: 10 84515 159147 -74631 -46.89
V: 7.59 1,259.23 1,977.81 -718.58 -36.33
$: 7.51 263.30 440.10 -176.80 -40.17
SOUTH EAST ASIA Q: 40 343962 233964 109998 47.01
V: 25.27 4,193.27 2,114.48 2,078.79 98.31
$: 25.09 880.09 469.36 410.73 87.51
MIDDLE EAST Q: 4 38155 43983 -5827 -13.25
V: 5.39 894.38 670.35 224.03 33.42
$: 5.33 186.85 148.31 38.53 25.98
OTHERS Q: 10 87014 84225 2789 3.31
V: 7.96 1,321.72 1,005.77 315.94 31.41
$: 7.95 278.94 222.50 56.44 25.37
Total Q: 100 862021 813091 48931 6.02
V: 100 16,597.23 12,901.47 3,695.76 28.65
$: 100 3,508.45 2,856.92 651.53 22.81

119
Market wise Exports 2011-12
(In Qty)
JAPAN
10% USA
8%
EUROPEAN UNION
18%
CHINA
10%
MIDDLE EAST
4%
OTHERS
10%
SOUTH EAST ASIA
40%
Market wise Exports 2011-12
(In Value)
JAPAN
13%
USA
18%
EUROPEAN UNION
23%
CHINA
8%
SOUTH EAST ASIA
25%
MIDDLE EAST
5%
OTHERS
8%

120
Outlook for 2012-13
MPEDA envisage an ambitious target of USD 4.2 Billion for the year 2012-13.
Increased production of L.vannamei shrimp and increase in infrastructure facilities
for production of Value added items are the helping factors to achieve the target.
IX. Agricultural and Processed Food Products Export Development Authority (APEDA)
Scheme-wise targets and achievements, Financial and Physical performance for the
year 2011-12, 2012-13 (till Dec., 2012) & targets for the year 2013-14 are as follows:
(Rs. in crores)
Name of the
scheme
Targets 2011-12
Achievements 2011-12
Targets 2012-13
Achievements 2012-13
(till Dec’ 2012)
Targets 2013-14
Fin Phy. Fin. Phy. Fin Phy. Fin Phy. Fin Phy.
Development of
Infrastructure
facilities
50.00 117 36.13 66 66.00 70 25-89 22 62.00 82
Research and
development
0.50 8 0.03 1 0.00 0 0 0 0.00 0
Quality
development
7.50 145 7.13 55 8.00 100 3-37 27 9.00 105
Market
development
23.00 151 17.82 135 23.00 190 11-92 90 29.00 240
Transport
assistance
99.00 230 95.88 360 89.00 300 51-34 210 116.00 335
Total 180.00 651 156.99 617 180.00 660 92-52 349
216.00
762
Scheme-wise objectives and achievements for the year 2011-12, 2012-13 &
performance targets for the year 2013-14are as follows:
1. INFRASTRUCTURE DEVELOPMENT
Development of a strong infrastructure is critical for the growth of agro
industries sector and export of agricultural products. The emphasis is primarily on
setting up of post harvest handling facilities so as to reduce losses caused due to
spoilage and to ensure quality production of agro products. This scheme seeks to

121
provide financial assistance to the exporters and export related government/
cooperative institutions for setting up of infrastructure such as cargo centers at
International airports & seaports and pack house facilities with packing/grading lines,
pre-cooling units, cold storages and refrigerated transportation etc. The high cost of
investment to maintain cold chain and its economic unavailability has always
restrained exporters to invest in post harvest handling Infrastructural facilities.
Therefore it has become imperative for APEDA to set up common facilities to
maintain cold chain and to improve the quality of the produce such as integrated
pack houses, (pre-cooling, cold storages and mechanized handling facilities),
perishable cargo handling centers at exit points like airports, seaports etc.,
This has helped in improving the quality of the perishables by maintaining
complete cold chain and enhanced credibility of agro exports from India.
The CPC projects at Nashik and Goa has been completed. APEDA is also
setting up of walk in cold room at Srinagar Airport. The equipment has reached the
site but AAI has advised that they will provide alternate location on airside. Till such
time the installation has to wait.
a. The Common Pack house facility for ginger in Assam has been completed.
b. Apart from this, pack house/ facilities i.e. pre-cooling, cold storage facilities
with mechanized handling systems are also being set up by individual
exporters for export of fresh fruits & vegetables.
c. Common laboratory facilities for export testing of pesticide residues, heavy
metals, aflatoxins, drugs and toxins etc. have been upgraded and set up with
APEDA’s financial assistance at NRC Grapes-Pune, CFTRI-Mysore,
AGMARK laboratory at Mumbai, Maharashtra Government laboratory at
Pune, IIIM, and Jammu.
d. Laboratory facilities are being set up at Herbal Research & Development
Institute, Gopeshwar (Uttarakhand) and will be completed in 2012-13. Apart
from this, private laboratories are being upgraded with APEDA’s financial
assistance for export testing of agro products.

122
Outcome of the Scheme:
The scheme has helped in integration of supply chain (cool chain) and
improvement of quality of fresh horticulture perishables like fruits, vegetables,
flowers, and processed food products etc., which has led to enhancement in the
export of APEDA monitored products. The quality of the produce has been widely
accepted in the European and other markets in developed countries. The export of
fresh grapes, honey, egg products and ground nuts to European market has been
possible due to the up gradation of Infrastructure facilities like laboratories and pack
house facilities in the major growing areas. The year-on-year growth in APEDA
products exports is also a result of continuous efforts to up gradate infrastructure
facilities by APEDA.
2. MARKET DEVELOPMENT
Good packaging is extremely important both in terms of quality of the product
as well as its image. It is, thus, necessary to encourage exporters to make use of
good quality packaging material. Similarly, compilation and consolidation of data is
very important for exporters to enable them to formulate export marketing strategies.
The marketing strategies are implemented through Market Development which
involves participation in International trade fairs, exchange of trade delegations and
conducting buyer seller meets etc. The scheme has helped in achieving the market
access in new markets and also to sustain the present level of exports in the
existing markets.
APEDA has initiated the following steps for market promotion of agro
products:
1. As result of APEDA’s effort the Australian market for Indian mangoes has
been opened in 2011-12 & 2012-13.
2. Efforts are being made constantly for opening up of Australian market for
Indian grapes, US market for grapes and Litchi, Chinese market for fruit &
vegetables & Korean market for walnuts.
3. Efforts are also being made to lift the ban on poultry products in Oman,
Kuwait, UAE and Saudi Arabia.
4. Efforts are also being made to open up markets like Russia and Kazakhstan
for Bovine meat and a FSVPS team was invited to visit India for the purpose.

123
Outcome of the Scheme:
The scheme has helped in achieving market access for export of Indian
mangoes into Japan, Grapes, Mangoes, Basmati rice and Bitter gourd into China.
A 3-member team from custom union/FSVPS visited meat processing plants
and laboratories in Oct., 2011. Further work is in progress and this will lead to
opening of custom union market for Indian bovine meat.
The participation in the International Trade Fairs has substantially helped in
incremental exports and also in developing new markets. The packaging of the agro
products has been substantially upgraded and improved under the scheme.
3. QUALITY DEVELOPMENT
The concept of food safety and quality is a growing global concern. Keeping
in view the growing global concerns for quality and phytosanitary requirements; it
has become essential to continue with the ongoing quality development scheme.
There is a need to promote exports in consumer packs and value added products.
To promote the export of organic products, we need to develop organic farming. In
view of the changes taking place in international trade, different systems are being
developed to improve quality of food products. The exporters have to comply with
the specific quarantine and technical requirements of the importing countries.
Hence, it is essential that financial assistance is given for the implementation of food
safety management systems like TQM, HACCP, BRC, EUREPGAP and ISO-
9001:2000 etc. to enhance the export capability and credibility of Indian agro
products.
The scheme has helped the exporters in certification of their manufacturing
units for HACCP, EUREP-GAP and ISO 9001:2000 systems etc. which has further
enhanced the acceptability of the Indian agro products in international markets.
In order to maintain our exports to European Union, we need to continue the
implementation of residue monitoring plan for honey, poultry products and grapes as
per their requirement.
To enhance the acceptability of Indian agro products in the international
markets, we have to promote implementation of HACCP, EUREP-GAP, TQM, ISO
9001:200 in processed food sector and fresh produce.
In-house laboratories of the exporters are also required to be upgraded for
on-going testing of products for exports.

124
ORGANIC PRODUCTION FOR EXPORTS:
a. Presently 24 certification bodies have been accredited under NPOP, 4 new
domestic bodies in 2012 (Biocert, Indore MPOSCA, Bhopal EIA, Delhi,
OSOCA, Bhubaneswar), As part of implementation of National Programme
Organic Promotion(NPOP) 22
b. APEDA has successfully achieved Equivalence agreement with European
Union and Switzerland.
c. APEDA has also completed the processes of conformity assessment by
USDA for organic products.
Outcome of the scheme:
The scheme has helped in improvement of the quality of agro products and
we have been able to meet out the food safety and hygiene requirements of the
importing countries. The export of honey, ground nuts, fresh grapes, poultry
products etc. has been possible to Europe only due to the implementation of residue
monitoring plans by APEDA as per the European Union requirements.
The export of processed food products, Basmati rice, fresh fruits and
vegetables and other products has steadily grown due to implementation of TQM,
HACCP, ISO – 9001: 2000, BRC and Eurep-gap etc. coupled with up gradation of
in-house laboratories.
4. TRANSPORT ASSISTANCE
Indian exporters of fresh perishables, processed food products, poultry
products, dairy products etc. have been facing the disadvantage of high freight rates
from India in comparison to the competing countries and our agro products have
become in-competitive. The export of horticultural perishables has been carried out
by air transport and airfreight rates are comparatively very high. In order to mitigate
the dis-advantage of high air freight and sea freight rates, it has become imperative
upon Govt. of India to provide transport assistance on selected fruits, vegetables,
flowers, poultry, dairy and other processed food products etc. for exports both by
sea and air to enable the agro products to compete in the international markets.
The scheme has helped in continues incremental exports in this sectors.
125
Outcome of the scheme:
The scheme has helped in incremental exports as export of fresh fruits and
vegetables, floriculture, dairy & poultry products and processed food products have
registered a constant growth during the Xth Five year plan. Transport Assistance
Schemes was approved for continuation in XIth Plan. Major benefit of the Schemes
as listed below has been achieved.
1. Exporters of identified products continue to face a transaction cost and
freight cost disadvantage vis-à-vis their international competitors. Hence
the TAS has helped to mitigate this disadvantage enhancing the overall
competitiveness of Indian agricultural product exporters.
2. TAS has helped in promoting exports of identified products where India
has strong export potential but so far has been unable to make a dent in
international markets due to the transaction/ freight cost disadvantage.
3. TAS has helped in promoting exports of value added processed products
rather than unprocessed low value products.
4. TAS has helped in the employment generation potential for these
commodities due to an increase in exports.
5. The Scheme is a medium term support to enable these eligible items to
gain a foothold in global markets.
X. Market Access Initiative (MAI) Scheme
The MAI scheme was launched in 2003 to act as a catalyst to promote India’s
export on sustained basis. The scheme is formulated on focus product – focus
country approach to evolve specific strategy for specific market and specific product.
The scheme was launched with a total outlay of Rs.552 crores during the Xth Plan.
However in view of the apparent short fall in achieving of financial target in the initial
years of the Xth Plan, the department held extensive consultations with the
stakeholders to evaluate the scheme in 2006. Based on the above, the revised
scheme was approved in December, 2006. Thereafter the present revised MAI
scheme was notified in January 2007.
The scheme was restructured to include enhancement of scope of the
scheme, increase in number of eligible agencies and increase in scale of
assistance. After the scheme was revised there is no short fall in respect of

126
achievement of physical and financial targets. The scheme is being continued in the
XIIth Plan with approved allocation of Rs.820 crores and no shortfalls in the physical
targets/actual achievements.
Under the scheme, assistance is extended to the Departments of Central
Government and organisations of Central/State Government, Export Promotion
Councils, Registered Trade Promotion organisations, Commodity Boards,
Recognised Apex Trade Bodies, etc. The activities eligible for financial assistance
under the Scheme are Marketing Projects Abroad, Capacity Building, Support for
Statutory Compliances, Studies, Project Development etc.
During the year 2011-13 (upto 31.12.20121), 158 projects/export promotion
events and studies/export promotion surveys were approved for assistance of under
the MAI scheme, by different Export Promotion Organisations/Trade Promotion
Organisations/National Level Institution etc. details of outlays allocated and actual
expenditure incurred under the scheme during the period 2008-09 to 2012-13 are as
under:
Outlay and Expenditure (Rs. In crore)
Year Outlay Actual Expenditure
2008-09 50.00 49.99
2009-10 64.00 64.00
2010-11 110.00 110.00
2011-12 149.99 149.99
2012-13 129.99 120.32 (upto 31.12.2012)
XI. Marketing Development Assistance (MDA) Scheme
To facilitate various measures being undertaken to stimulate and diversify the
country’s export trade, Marketing Development Assistance (MDA) Scheme is under
operation in the Department of Commerce. This non-plan scheme supports the
following activities:
Individual exporters for approved EPC/Trade bodies led export promotion
activities abroad.

127
Export Promotion Councils (EPCs) to undertake export promotion activities
for their products and commodities
Approved organisations/trade bodies in undertaking limited exclusive non-
recurring innovative activities connected with export promotion efforts for their
members.
Focus Area export promotion programmes in specific regions abroad like
Focus LAC Focus Africa, Focus CIS and ASEAN+2 programmes.
Residual essential activities connected with marketing promotion efforts
abroad.
During the year 2012-13 (upto 31.12.2012), 324 projects/export promotion
events were approved for assistance with funds, sanctioned under the MDA
scheme, by the Export Promotion Councils and other approved organisations/trade
bodies. During this year Export Promotion Council status was granted to Telecom
Equipment and Services EPC. Details of outlays approved and actual expenditure
under the MDA scheme during the period 2008-09 to 2012-13 are as under.
Outlay and Expenditure (Rs. In crore)
Year Outlay Actual Expenditure
2008-09 52.25 52.25
2009-10 53.00 53.00
2010-11 56.00 56.00
2011-12 49.99 49.99
2012-13 49.99 24.99 (upto 31.12.2012)
XI. National Export Insurance Account (NEIA)
A separate Fund with an approved corpus of Rs.2, 000 crore called the
National Export Insurance Account (NEIA) was set up in 2006, out of which Rs.886
crores have been funded by the Government so far. The present corpus of NEIA is
Rs. 1208.04 crore (constituting premium and interest accrued) which has been
invested in fixed deposits with banks.
The objectives of NEIA is to promote project export from India, which may not
take place but for the support of a credit risk insurance cover which the ECGC is not
in a position to provide because of its own underwriting capacity. The NEIA is
maintained and operated by a Public Trust set up jointly by the Department of
Commerce and ECGC.

128
The objectives of NEIA were expanded by the Government in December,
2008, in view of the Global Financial Crisis, to also provide for short term cover and
use of NEIA funds upto Rs.350 crore for the financial years 2008-09 and 2009-10, to
mitigate the effects of global financial crisis. During the year 2011-12, Rs. 6.78 crore
claim was paid to Indian exporter and bankers.
During the year NEIA guidelines were revised to provide risk cover for buyer
credits which may be extended by EXIM Bank to overseas agencies. Under the
revised guidelines projects which are backed by sovereign guarantees will be
covered upto 100% of value, without recourse, to eligible exporters.
XIII. Price Stabilization Fund Scheme (PSF)
The Price Stabilisation Fund Scheme was started from April 2003 with the objective
of providing relief to small growers when the prices of coffee, tea, rubber and
tobacco fall below a specified level, without resorting to the practice of procurement
operations by Government agencies.
As on 31.12.2012, 46243 growers have been enrolled under the PSF
Scheme, out of which 18919 are rubber growers, 11594 coffee growers and
15730 tea growers. Tobacco growers have expressed their unwillingness to
join the scheme. Based on Price Spectrum Band 2011, Tea, Coffee (Arabica and Robusta)
and Rubber have been classified under Boom Year due to good prices. Tea
is placed under NORMAL year category. Rs. 78.56 lakh is payable towards
assistance under PSF Scheme – PSB 2011 to eligible growers from Tea
Sector.
Cumulative committed financial assistance under PSF scheme stood at Rs
6.22 crore ( as detailed under), out of which only Rs.150.64 lakh have been
released till date due to default on the part of the growers.
Commodity PSB
2003
PSB
2004
PSB
2005
PSB
2006
PSB
2007
PSB
2008*
PSB
2009
PSB
2010*
PSB
2011
Total
RUBBER 0 0 0 0 0 0 0.95 0 0 0.95
COFFEE 0.82 0.58 0 0 0 0 0 0 0 1.40
TEA 0.09 0.73 0.74 0.75 0.77 0 0 0 0.79 3.08
TOTAL 0.91 1.31 0.74 0.75 0.77 0 0.95 0 0.79 5.43
* Boom year for all crops.

129
As decided in the 28th BOT meeting held on 20 October 2010 a final cut off
date of 15/12/2010 for release of assistance under PSB 2003 to 2007 (2008
was boom year for all the three commodities) was fixed. Hence, there is no
assistance pending for release to Growers for PSB 2003 to PSB 2008. Tea
Board has also been advised to send the claim for eligible growers under
PSB 2011.
XIV. Personal Accident Insurance Scheme (PAIS)
Personal Accident Insurance Scheme was introduced by PSF Trust, Department of Commerce, Government of India as a social security measure for the grower members of Price Stabilisation Fund Scheme in 2005 with a cover of Rs. 25, 000/- per grower. The PAI Scheme was modified between 2005 and 2008.
Scope of cover
The insurance covers death / disablement due to accidents caused by external violent and visible means e.g. fire, drowning, snake bite, road/rail accidents, electrocution, attack by wild animals. Sterilization risk is also covered. The scope of cover under Modified PAIS (in Rs.) is:
Premium
During 2012-13, annual premium is Rs 22.06, 50% of which is contributed by PSF Trust. As on 03.01.2013 an amount of Rs 10.06 lakh has been released to M/s
1. Death due to accident 1.00 lakh
2. Permanent total disablement due to accident 1.00 lakh
3. Loss of two limbs or two eyes 1.00 lakh
4. Loss of one eye and one limb 1.00 lakh
5. Loss of one eye or one limb 0.60 lakh
6. Compensation for loss of employment to workers due to major and serious accidental injury for a continuous period of three months or more
0.15 lakh or equivalent to three months prevalent wages whichever is lower.

130
Chola MS GIC Ltd. The details of persons covered since inception of PAI Scheme is as under:
Year No of Growers/ Workers
covered Partner Insurance Company
2004-05 23926 United India Insurance Co Ltd (01.01.2005 to 30.06.2006) 2005-06 27864
2006-07 44704 ICICI Lombard General Insurance Co Ltd (01.01.2006 to 30.09.2007) 2007-08 3505
2008-09 0
National Insurance Co. Ltd (09.02.2009 to 31.03.2011)
2009-10 50172
2010-11 135355
2011-12 60300 Cholamandalam MS GIC Ltd (19.05.2011 to 31.03.2013 2012-13* 91103
*as on 03.01.2013
436929
Claims Status for the Fiscal Year 2011-2012:
Board Claims
Total No. of claims
No. of claims settled/(Amount
paid)
No. of Claims rejected
Claims under
Process
Tea 16 6 (Rs.50635) 5 5
Coffee 1 - - 1
Tobacco 2 2 (Rs 200000) - -
Spices 1 1 (Rs.100000) - -
Rubber 12 8 (Rs 101571) - 4
32 17 (Rs.452206) 5 10
Claims Status for the Fiscal Year 2012-2013:
Board Claims
Total No. of claims
No. of claims settled/(Amount
paid)
No. of Claims rejected
Claims under
Process
Tea 14 1 (Rs 50,000) 2 11
Coffee - - -
Tobacco 3 2 (Rs 200000) - 1
Spices - - - -
Rubber - - - -
17 3(Rs.2,50,000) 2 12

131
Restructuring of PSF Scheme and proposal for Plantation Crop Insurance Scheme
Department of Commerce constituted High Powered Sub-committee under
chairmanship of AS( Plantations) on 27.10.2011
Committee met five times and finalised Modified Price Stabilisation Fund
(MPSF) Scheme and broad parameters of Plantation Crop Insurance
Scheme (PCIS)
DoC, GoI approved simultaneous implementation of MPSF and PCIS
CCEA note circulated for MPSF in Oct 2012, inviting comments of concerned
departments. A comment of concerned departments is under consideration of
DoC.
Draft Plantation Crop Specific Insurance Schemes finalised by Commodity
Boards and AICI is to be discussed in the 6th Sub Committee Meeting.
The Central Govt liability under PCIS over the five year implementation
period has been estimated at Rs 256.75 Cr. The year wise – crop wise breakup of
the Central liability is as under:
CENTRAL GOVT. PREMIUM LIABILITY - PCIS ( Rs. in Lakhs)
Year Penetration % Tea Coffee Tobacco Cardamom Rubber Total
1 10 421.84 679.97 240.62 125.89 1099.17 2567.48
2 15 632.76 1019.95 360.93 188.83 1648.75 3851.22
3 20 843.68 1359.93 481.24 251.78 2198.34 5134.96
4 25 1054.60 1699.91 601.55 314.72 2747.92 6418.70
5 30 1265.53 2039.90 721.86 377.66 3297.50 7702.44
Total 4218.42 6799.65 2406.19 1258.88 10991.68 25674.82
****

132
CHAPTER V
Financial Review
The total expenditure (Plan and Non-Plan) of the Department during the
financial year 2010-11 was Rs.5274.17 crore. As against this, the total expenditure
for the year 2011-12 was Rs.4443.60 crores compared to the Budget Estimate for
2011-12 was Rs.6511.58 crore and Revised Estimate for 2011-12 was Rs.4466.00
crore.
The Budget Estimate for the year 2012-13 was Rs. 5023.00 crore which was
revised for the year 2012-13 to Rs. 4708.00 Crore. As against this, the total
expenditure 20th February, 2013 was Rs. 4163.71 crore.
Revenue Section
Plan: During 2011-12, the Plan expenditure was Rs. 1059.67 crore as against
Rs.986.22 crore during 2010-2011. The provision in Budget Estimates for the year
2012-13 was Rs. 1128.32 crore and Revised Estimate was Rs. 973.85 crore.
Non-Plan: During 2011-12, the Non-Plan expenditure was Rs.2648.74 crore as
against Rs.3601.26 crore during 2010-2011. The provision in Budget Estimates for
the year 2012-13 was Rs.2923.00 crore and the Revised Estimate for the year 2012-
13 was Rs.2908.00 crore.
Capital Section
Plan: During the year 2011-2012, the Plan expenditure was Rs.735.19 crore as
against Rs.686.69 crore during the year 2010-11. The provision in Budget Estimates
for the year 2012-2013 was Rs.971.68 crore and provision in Revised Estimates for
2012-13 was Rs. 826.15 crore
Year-wise & scheme wise outlay of fund and expenditure:
Detailed account of outlay and expenditure for both Plan as well as Non-Plan
schemes of the Department during the XIth five year Plan & 2011-12, 2012-13
(expenditure up to 20.02.2013) , 2013-14(only outlay)& XII th Plan(Only Outlay) are
given in Table 5.1(Plan), Table 5.2(Plan – XIIth Plan Outlay, Annual Plan Outlay &
Exp. upto 20.02.2013) and Non Plan Schemes in Table 5.3 respectively.

133
Utilization Certificates (UCs)
There were 180 UCs outstanding as on 1.4.2012 involving Rs. 610 crore. 10
UCs have been received upto 25.02.2013 amounting to Rs. 138.00 crore and 170
UCs are outstanding as on 25.02.2013 involving Rs. 486.67 crore.
Opening Balances
The detailed statement for Outstanding Unspent Balance with the States
and implementing agencies as on 31.01.2013 is shown in Table 5.4

134
Table 5.1(Detailed account of Plan Outlay & Expenditure in r/o Department of Commerce)
(Rs. in crore)
Major 2007-12 2011-12 2012-13 2013-14
Head BE RE Actual BE RE Actual BE RE Actual as
on 20.02.13 BE
A Industry & Mineral Sector
1 Assistance for Developing Infrastructure & Other Allied Activities
For other than NER under head Major Works 5453 2920.94 2716.14 2717.60 730.96 556.94 559.55 666.00 521.50 461.13 640.00
For NER under head Major Works 4552 273.00 273.00 273.00 60.00 60.00 60.00 70.00 70.00 69.11 100.00
SCSP 5453 60.00 60.00 60.00 60.00 60.00 53.43 64.00 64.00 43.00 60.00
Total 3253.94 3049.14 3050.60 850.96 676.94 672.98 800.00 655.50 573.24 800.00
2 Agricultural Products Export Development Authority
Grants-in-aid 3453 237.00 251.00 235.75 55.00 55.00 39.75 55.00 52.00 52.00 55.00
Subsidies 3453 388.00 401.02 393.26 125.00 125.00 117.24 125.00 98.00 98.00 125.00
Total= 625.00 652.02 629.01 180.00 180.00 156.99 180.00 150.00 150.00 180.00
3 Marine Products Exports Development Authority
Subsidies 3453 470.00 460.50 460.13 110.00 110.00 110.00 110.00 95.00 69.00 115.00
4 National Export Insurance Account
Grants in aid 3453 640.01 640.01 640.00 0.01 0.01 0.00 30.00 30.00 30.00 30.00
5 Export Credit Guarantee Corporation
Investment 5465 201.02 100.02 100.00 0.01 0.01 0.00 100.00 100.00 100.00 100.00
Export Promotion, Quality Control & Inspection
6 Export Inspection Council
Grants-in aid 3453 52.75 58.58 55.07 8.00 8.00 7.99 8.00 6.28 6.28 8.00
7 Market Access Initiative
Grants-in-aid 3453 475.00 400.00 400.00 150.00 150.00 149.99 130.00 125.00 120.31 180.00
Other charges 3453 19.00 19.00 18.69 0.00 0.00 0.00 0.00 0.00 0.00 0.00
Total 494.00 419.00 418.69 150.00 150.00 149.99 130.00 125.00 120.31 180.00
8 Center for WTO Studies
Other charges 3453 16.00 20.58 20.01 5.00 9.58 9.58 7.00 5.05 5.05 8.00
Assistance to Institutions
Grants-in-aid
9 Indian Institute of Foreign Trade 3453 85.78 50.14 40.66 50.00 12.85 12.50 40.00 34.00 21.00 60.00
10 Indian Institute of Packaging 3453 19.00 17.90 14.13 6.00 6.00 3.50 3.00 1.50 1.50 3.01
11 IIPM 3453 0.50 1.25 1.25 - - - - - - -

135
Major 2007-12 2011-12 2012-13 2013-14
Head BE RE Actual BE RE Actual BE RE Actual as on
20.02.13 BE
Total(Assistance to Institutions)= 105.28 69.29 56.04 56.00 18.85 16.00 43.00 35.50 22.50 63.01
Modernisation & Upgradation
12 Secretariat-Economic Services 3451 25.00 22.50 12.34 5.00 5.00 3.00 4.00 3.00 1.67 4.00
13 Director General of Foreign Trade
Other Administrative Expenses 3453 31.00 31.00 30.90 4.00 10.00 11.15 10.00 6.00 4.20 10.00
Niryat Bandhu Scheme 3453 0.00 0.00 0.00 0.00 0.00 0.00 0.01 0.00 0.00 1.00 Office/Residential Building 3453 0.00 0.00 0.00 0.00 0.00 0.00 0.01 0.00 0.00 2.97 Training/Capacity Building 3453 0.00 0.00 0.00 0.00 0.00 0.00 0.01 0.00 0.00 1.00 Total(DGFT)= 31.00 31.00 30.90 4.00 10.00 11.15 10.03 6.00 4.20 14.97
14 DGCI & S
Other Administrative Works 3453 0.00 0.00 0.00 0.00 0.00 0.00 0.00 0.00 0.00 3.00
Major Work 5453 28.00 89.28 82.79 10.00 10.00 3.10 4.65 3.65 0.61 3.00
Total(DGCI&S)= 28.00 89.28 82.79 10.00 10.00 3.10 4.65 3.65 0.61 6.00
15 FDDI
FDDI, Fursatganj, Major Work 5453 41.23 41.23 41.23 0.01 0.01 0.00 0.00 0.00 0.00 0.00 FDDI, Jodhpur, Major Work 5453 60.00 60.00 60.00 60.00 60.00 60.00 37.00 37.00 37.00 0.00
Footwear Design & Dev. Inst, Noida
Grants-in-aid-general 3453 15.00 18.12 18.12 1.00 4.13 4.13 0.00 0.00 0.00 0.00
16 Computerization in DGS&D
Other administrative Expenses/OE 2057 22.00 58.72 18.54 4.00 40.72 4.29 20.00 2.35 1.74 25.00
Gem & Jewellery Sector
Convention Centre in Mumbai 3453 0.00 0.00 0.00 0.00 0.00 0.00 0.01 0.00 0.00 0.01
Common Facility Centre 3453 0.00 0.00 0.00 0.00 0.00 0.00 0.01 0.00 0.00 0.48
Gem bourse in Jaipur 3453 0.00 0.00 0.00 0.00 0.00 0.00 0.01 0.00 0.00 0.48
Gems and Jewellery Park in Mumbai 3453 0.00 0.00 0.00 0.00 0.00 0.00 0.01 0.00 0.00 0.01
Jewellery Sector 3453 0.00 0.00 0.00 0.00 0.00 0.00 0.01 0.00 0.00 0.02
Total( Gem & Jewellery Sector )= 0.00 0.00 0.00 0.00 0.00 0.00 0.05 0.00 0.00 1.00
Leather and Leather Products Sector
New Branches of FDDI 5453 0.00 0.00 0.00 0.00 0.00 0.00 30.01 30.00 20.00 108.50
Networking Centre (FDDI CNC) 5453 0.00 0.00 0.00 0.00 0.00 0.00 0.01 0.00 0.00 1.00
Creation of Venture Capital Fund for Corporisation of leather Sector- Creation of Seed Fund
5453 0.00 0.00 0.00 0.00 0.00 0.00 0.01 0.00 0.00 0.50
Total( Leather and Leather Products Sector )= 0.00 0.00 0.00 0.00 0.00 0.00 30.03 30.00 20.00 110.00
Pharma Sector
Venture Capital Fund 3453 0.00 0.00 0.00 0.00 0.00 0.00 0.01 0.00 0.00 0.00

136
(Rs. in crore)
Major 2007-12 2011-12 2012-13 2013-14
Head BE RE Actual BE RE Actual BE RE Actual as on
20.02.13 BE
Biosimilar/Bioequivalent Studies 3453 0.00 0.00 0.00 0.00 0.00 0.00 0.01 0.00 0.00 0.01
Total( Pharma Sector )= 0.00 0.00 0.00 0.00 0.00 0.00 0.02 0.00 0.00 0.01
Total( A- Industry & Mineral Sector)= 6080.23 5789.99 5693.46 1444.99 1276.75 1209.20 1513.75 1284.33 1141.60 1644.99
B Agricultural Sector
17 Tea Board
Subsidies 2407 235.00 291.05 266.90 61.00 117.15 117.15 96.00 79.17 72.00 110.00
Grants-in-aid: (R&D) 2407 81.00 88.00 75.74 4.00 4.00 3.74 4.00 4.00 3.00 4.00
Subsidies to small growers 2407 0.00 0.00 0.00 0.00 0.00 0.00 0.00 0.00 0.00 0.00 Subsidies to NER 2407 310.00 310.00 278.00 82.00 82.00 82.00 82.00 61.50 61.50 42.00
Grants-in-aid to NER 2407 49.00 49.00 46.84 8.00 8.00 7.84 8.00 6.00 6.00 8.00
SCSP -Subsidies 2407 10.00 10.00 10.00 10.00 10.00 10.00 10.00 10.00 1.67 20.00
Small Growers Development Scheme 2407 0.00 0.00 0.00 0.00 0.00 0.00 0.00 0.00 0.00 5.00
Implementation of regulatory Provision of Tea Act including e-auction and allied activities
2407 0.00 0.00 0.00 0.00 0.00 0.00 0.00 0.00 0.00 1.00
Contribution to SPTF 4407 60.00 45.00 45.00 15.00 0.00 0.00 0.00 0.00 0.00 0.00
Total(Tea Board)=
745.00 793.05 722.48 180.00 221.15 220.73 200.20 160.67 144.17 190.00
Tea Plantation Fund
Grants-in-aid: Tea development fund 2407 67.80 74.00 63.74 0.00 6.20 6.20 0.00 0.00 0.00 0.00
-67.80 -74.00 -57.54 0.00 0.00 0.00 0.00 0.00 0.00 0.00
18 Coffee Board
Subsidies 2407 204.50 187.50 168.28 43.50 43.50 43.50 48.50 43.50 36.38 40.00
Grants-in-aid-General 2407 203.75 207.73 209.93 51.00 51.00 51.99 56.00 56.00 42.01 47.00
Grants-in-aid-General(NER) 2407 17.00 14.00 13.96 4.00 4.00 3.00 4.00 4.00 3.01 15.00
Subsidies to NER 2407 14.50 11.50 8.14 1.50 1.50 1.50 1.50 1.50 1.13 8.00
SCSP -Subsidies 2407 5.00 5.00 5.00 5.00 5.00 5.00 5.00 0.00 0.00 5.00
Total= 444.75 425.73 404.01 105.00 105.00 104.99 115.00 105.00 82.53 115.00
19 Rubber Board
Grants-in-aid-General 2407 499.50 486.57 486.57 125.50 104.57 104.57 125.50 110.50 110.50 120.00
Subsidies (NER) 2407 134.50 147.00 147.00 34.50 44.50 44.50 34.50 29.00 29.00 40.00
SCSP-Grants-in-aid-General 2407 10.00 10.00 10.00 10.00 10.00 10.00 10.00 10.00 10.00 10.00
Statistical and Information Services and e-governance
2407 0.00 0.00 0.00 0.00 0.00 0.00 0.01 0.00 0.00 0.01
Total(Rubber Board)= 644.00 643.57 643.57 170.00 159.07 159.07 170.04 149.50 149.50 170.01

137
(Rs. in crore) Major 2007-12 2011-12 2012-13 2013-14
Head
BE RE Actual BE RE Actual BE RE Actual as
on 20.02.13 BE
20 SPICES BOARD
Grants-in-aid-General 2407 148.00 158.00 158.00 36.00 36.00 36.00 36.00 36.00 36.00 41.00
Subsidies 2407 158.00 161.60 160.98 49.00 49.00 49.00 49.00 49.00 49.00 49.00
Grants-in-aid: NER 2407 17.00 17.00 17.00 5.00 5.00 5.00 5.00 5.00 5.00 5.00
Subsidies (NER) 2407 17.00 17.00 16.00 5.00 5.00 5.00 5.00 5.00 5.00 5.00
SCSP-Grants-in-aid-General 2407 2.50 2.50 2.50 2.50 2.50 2.50 2.50 2.50 2.50 2.50
SCSP -Subsidies 2407 2.50 2.50 2.50 2.50 2.50 2.50 2.50 2.50 2.50 2.50
Total(Spices Board)= 345.00 358.60 356.98 100.00 100.00 100.00 100.00 100.00 100.00 105.00
21 Cashew EPC
Grants-in-aid-General 2407 5.00 9.02 9.02 0.00 4.02 4.02 1.00 0.50 0.00 1.00
22 Crop Insurance 2407 11.02 1.03 0.00 0.01 0.01 0.00 0.01 0.00 0.00 0.00
Total(B-Agricultural Sector)= 2194.77 2231.00 2142.26 555.01 589.25 595.01 586.25 515.67 476.20 581.01
Grand Total(Department of Commerce)= Grant-11 8275.00 8020.99 7835.72 2000.00 1866.00 1804.21 2100.00 1800.00 1617.80 2226.00

138
TABLE 5.2
11th
& 12th
Year Five Year-wise vis-a-vis year-wise (2011-12, 2012-13, 2013-14) Plan Outlay and Exp. (Rs. In crore)
11th
Plan(2007-12) 12th
Plan Outlay (2007-12) 2011-12 2012-13 2013-14
Outlay Actuals Outlay Outlay Actuals Outlay Actuals (as on 20.02.2013
Outlay
A Industry & Mineral Sector
1 Assistance for Developing Infrastructure & Other Allied Activities
3253.94 3050.60 5775.00 850.96 672.98 800.00 573.24 800.00
2 Agricultural Products Export Development Authority
625.00 629.01 1100.00 180.00 156.99 180.00 150.00 180.00
3 Marine Products Exports Development Authority
470.00 460.13 750.00 110.00 110.00 110.00 69.00 115.00
4 Export Credit Guarantee Corporation 201.02 100.00 800.00 0.01 0.00 100.00 100.00 100.00
5 National Export Insurance Account 640.01 640.00 300.00 0.01 0.00 30.00 30.00 30.00
6 Export Inspection Council 52.75 55.07 60.00 8.00 7.99 8.00 6.28 8.00
7 Market Access Initiative 494.00 418.69 820.00 150.00 149.99 130.00 120.31 180.00
8 Center for WTO Studies 16.00 20.01 45.00 5.00 9.58 7.00 5.05 8.00
Assistance to Institution
9 Indian Institute of Foreign Trade 85.78 40.66 100.00 50.00 12.50 40.00 21.00 60.00
10 Indian Institute of Packaging 19.00 14.13 70.00 6.00 3.50 3.00 1.50 3.01
Modernisation & Up gradation
11 Secretariat-Economic Services 25.00 12.34 11.00 5.00 3.00 4.00 1.67 4.00
12 Director General of Foreign Trade 31.00 30.90 268.00 10.00 11.15 10.00 4.20 14.97
13 DGCI & S 28.00 82.79 26.00 5.00 3.10 4.65 0.61 6.00
14 FDDI((Fursatganj), Major Work 41.23 41.22 0.00 0.01 0.00 - 0.00 0.00
15 FDDI, Jodhpur, Major Work 60.00 60.00 37.00 60.00 60.00 37.00 37.00 0.00
16 FDDI, Noida 15.00 18.12 0.00 4.13 0.00 0.00 0.00
16 (a)Computerization in DGS&D 22.00 18.54 20.00 4.00 4.29 20.00 1.74 25.00
(b)E-Procurement MMP-DGS&D 0.00 0.00 61.00 0.00 0.00 0.00 0.00
17 Gem & Jewellery Sector 0.00 0.00 395.00 0.00 0.00 0.05 0.00 1.00
18 Leather and Leather Products Sector 0.00 0.00 500.00 0.00 0.00 30.03 20.00 110.00
19 Pharma Sector 0.00 0.00 20.00 0.00 0.00 0.02 0.00 0.01
Total – (A)-I&M Sector)= 6079.73 5692.21 11158.00 1444.99 1209.20 1513.75 1141.60 1644.99
B Agricultural Sector 1 Tea Board 745.00 728.68 1425.00 180.00 226.93 200.20 144.17 190.00
2 Coffee Board 444.75 404.01 950.00 105.00 104.99 115.00 82.53 115.00

139
(Rs. in crore)
11
th Plan(2007-12) 12
th Plan Outlay (2007-12)
2011-12 2012-13 2013-14
Outlay Actuals Outlay Outlay Actuals Outlay Actuals (as
on 20.02.2013
Outlay
3 Rubber Board 644.00 643.57 910.00 170.00 159.07 170.04 149.50 170.01
4 Spices Board 345.00 356.98 670.00 100.00 100.00 100.00 100.00 105.00
5 Cashew EPC 5.00 9.02
30.00
0.00 4.02 1.00 0.00 1.00
6 IIPM 0.50 1.25 0.00 0.00 0.00 0.00 0.00 0.00
7 Crop Insurance 11.02 0.00 0.00 0.01 0.00 0.01 0.00 0.00
Total – (B)-Agriculture Sector)= 2195.27 2143.51 3985.00 555.01 589.25 586.25 476.20 581.01
Grand Total(Department of Commerce)=
8275.00 7835.72
15143.00 2000.00 1804.21 2100.00 1617.80 2226.00

140
Table 5.3 (Detailed account of Non Plan Outlay & Expenditure in r/o Department of Commerce)
(Rs. in Crore)
Major 2007-12(11th
Plan) 2011-12 2012-13 2013-14
Head BE RE Actual BE RE Actual BE RE Actual (as on 20.02.2013)
BE
1. Secretariat-Economic Services 3451 251.75 260.72 257.79 63.47 63.47 59.64 65.57 65.55 58.00 60.50
Foreign Trade and Export Promotion
2. Trade Commissioners 3453 468.49 483.40 468.20 110.81 110.81 114.13 112.25 124.65 113.76 121.35
3. Director General of Foreign Trade 3453 301.96 337.74 336.98 83.32 83.32 81.08 87.00 92.61 79.54 95.40
4. Assistance for Export Promotion and Market Development
4.01 Export Subsidy 3453 8058.27 9989.69 8700.19 3000.00 931.42 1021.21 1300.00 1262.30 1013.61 1300.00
4.02 Grants in aid to Export Promotion and Market Development Organisation
3453 271.00 266.25 263.49 50.00 50.00 49.99 50.00 39.50 24.75 50.00
4.03 Interest Subsidy to Banks 3453 1250.00 2650.00 2650.00 1000.00 996.00 996.00 1000.00 1000.00 1000.00 1200.00
Total= 9579.27 12905.94 11613.68 4050.00 1977.42 2067.20 2350.00 2301.80 2038.36 2550.00
5 Development of Free Trade/ Export Processing Zones/Special Economic Zones
5.01 Kandla SEZ 3453 35.22 41.93 40.30 9.81 9.81 8.57 9.00 8.80 7.21 9.55
5.02 Electronics (SEEPZ) SEZ 3453 34.17 37.31 37.02 6.66 6.66 7.29 7.70 7.50 6.22 8.10
5.03 Falta SEZ 3453 17.79 19.27 16.76 3.75 3.75 3.08 3.80 4.00 3.40 4.30
5.04 Chennai SEZ 3453 26.10 26.41 27.38 5.53 5.53 5.69 6.25 6.48 5.68 6.65
5.05 Cochin SEZ 3453 23.54 25.08 22.05 6.30 6.30 5.42 6.40 6.30 5.05 6.80
5.06 Noida SEZ 3453 31.00 33.10 31.80 6.30 6.30 6.31 6.65 7.61 5.61 8.25
5.07 Visakhapatnam SEZ 3453 19.03 20.54 20.98 4.60 4.60 5.28 5.70 6.30 5.63 6.80
5.08 Indore SEZ 3453 3.71 4.22 4.48 1.15 1.15 1.23 1.32 1.48 1.23 1.60
5.09 Jaipur SEZ 3453 2.34 2.36 2.05 0.57 0.57 0.53 0.60 0.58 0.47 0.63
5.10 Manikanchan SEZ, 3453 3.06 3.07 2.71 0.72 0.72 0.61 0.70 0.67 0.58 0.73
5.11 Moradabad SEZ 3453 1.66 1.57 1.40 0.37 0.37 0.33 0.40 0.38 0.28 0.40
5.12 Maha Mumbai SEZ 3453 2.20 1.83 0.73 0.48 0.48 0.34 0.45 0.52 0.38 0.57
5.13 Jodhpur SEZ 3453 1.87 1.88 1.43 0.46 0.46 0.37 0.47 0.45 0.37 0.50
5.14 Surat SEZ 3453 1.23 1.50 1.22 0.46 0.46 0.29 0.40 0.45 0.44 0.48
Total(SEZ)= 202.92 220.07 210.31 47.16 47.16 45.34 49.84 51.52 42.55 55.36
6 Agricultural Products Export Development Authority
3453 3.00 3.50 3.50 1.00 1.00 1.00 1.00 1.00 1.00 1.00

141
Table 5.3(Detailed account of Non Plan Outlay & Expenditure in r/o Department of Commerce) (Rs. in crore)
Major 2007-12(11th
Plan) 2011-12 2012-13 2013-14
Head
BE RE Actual BE RE Actual BE RE Actual (as on
20.02.2013) BE
7 Marine Products Exports Development Authority
3453 27.00 27.00 26.41 5.00 5.00 5.00 5.00 4.00 2.50 5.00
8 Other Schemes of Foreign Trade & Export Promotion
8.01 Directorate General of Commercial Intelligence & Statistics.
3453 88.10 96.05 93.04 23.96 23.96 22.66 24.40 24.13 21.63 25.74
8.03 Contribution to International Organisations
3453 85.25 90.75 61.68 20.00 24.00 19.53 24.00 28.00 19.05 32.00
8.04 International conferences 3453 3.10 3.85 3.14 0.50 0.50 0.27 0.50 0.50 0.00 0.50 8.09 Others 3453 8.79 7.90 6.29 1.40 1.40 1.23 1.40 2.25 1.10 1.40 8.10 Director General Trade Remedies 3453 9.50
9 Commodity Boards 9.01 Tea Board 2407 98.60 130.71 130.71 9.10 38.10 38.10 39.00 37.00 29.26 39.00 9.02 Rubber Board 2407 62.24 95.24 95.24 6.74 36.74 36.74 37.50 35.50 35.50 37.50 9.03 Coffee Board 2407 135.49 466.19 466.18 7.41 97.41 97.41 39.80 47.15 29.85 39.80 9.04 Spices Board 2407 9.35 18.35 18.35 9.35 6.35 9.35 9.35 9.00 9.00 9.35
Total(Commodity Boards)= 305.38 710.49 710.48 32.60 181.60 181.60 125.65 128.65 103.61 125.65 11 Other Schemes of Plantation
11.01 Price Stabilisation Fund 2407 0.25 0.55 1.52 0.13 0.13 0.03 0.13 0.03 0.00 0.10 11.02 Payment to PSFT under PS Scheme 2407 4.50 4.50 1.17 4.50 4.50 1.17 4.50 4.50 0.00 6.27
2407 -4.50 -4.50 0.00 -4.50 -4.50 0.00 -4.50 -4.50 0.00 -6.27 13 Supplies & Disposals
13.01 01-DGS&D 2057 322.37 374.44 346.94 80.23 89.65 71.08 76.26 83.31 64.81 81.50 02-Less: Receipts 0.00 -9.42 -9.42 0.00 -9.42 -9.42 0.00 0.00 0.00 0.00 Grants-in-Aid-Export to Cuba 282.00 0.00 124.73 0.00 0.00 0.00 0.00 0.00 0.00 0.00 Grand Total(Commerce)= 11929.63 15512.98 14255.84 4511.58 2600.00 2661.54 2923.00 2908.00 2545.91 3165.00

142
State Wise Unspent balance (Actual) as on 31.1.13 for the Scheme for Central Assistance to the States for Developing Export Infrastructure and Other Allied Activities (ASIDE)
Table 5.4 (Rs. in crore)
Andhra Pradesh
Arunachal Pradesh
Assam Bihar Chandigarh Chhattisgarh Goa Gujarat Haryana Himachal Pradesh
J&K Sikkim Tamil Nadu
0 1.38 0 0 1.40 0 0 0 0 0 5.51 0 0
Kerala Madhya Pradesh
Maharashtra Manipur` Meghalaya Jharkhand Mizoram Nagaland Orissa Punjab Rajasthan Pondicherry
0 0 0 0 0 5.49 0 0 0 0 0 1.37
Tripura UP Uttaranchal WB Karnataka A&N D&N Haveli Daman & Diu
Delhi Lakshadweep Total
0 0 0 0 0 0.57 1.50 3.34 0.00 0.00 13.67
Unspent Balance for the ASIDE Scheme- Central Sector
(Rs. in crore)
APEDA Border Road Org.
Chennai Port Trust
CSEZ Engg. EPC Kol.
CONCOR Council for Leather Exports
DC(SSI) DM North 24 Pargana
Handloom EPC
EPC Handicrafts
FSEZ FDDI, Noida
0.00 0 0.00 0 0 0.00 0 0.86 0 0 0 0 0
ILFS ITPO KSEZ MSEZ G&J EPC Rubber Board
MMTC NIFT NSEZ RITES MP. SEDC Bhopal
Mani SEZ Kol
MPEDA
0 0 0 0 0.00 0 0.00 0 0 0.00 0.00 0
DOC Govt. of Kerala
Govt. of West Bengal
GNIDA HRDI HPSIDC IDI J&KSIDCL MPAKVNL NCTI Proj. EPC STCL Ltd. TNWICL, Chennai
0.15 0 5.00 6.00 2.40 5.40 0 5.00 0 0.00 0.00 0.00 0.00
NMPT M’lore
PSIEC CWC Cashew EPC
SEEPZ SIDICO Sikkim
Spices Board
VSEZ WEFPI& HDC.Kol
WE TPO Govt. of Gujarat
Govt. of Mizoram
Govt. of Tripura
0.00 0 0 0 0 0 0 0 1.84 0.00 4.50 0 4.00
Tea Board Govt. Of Meghalaya
Total
0 1.44 29.24

143
CHAPTER VI
REVIEW OF PERFORMANCE OF AUTONOMOUS AND STATUTORY BODIES
(A) Autonomous Bodies
(B) Public Sector Undertakings
I. State Trading Corporation of India Ltd. (STC)
STC, set up on 18th May 1956, has played an important role in country’s
economy. It has arranged imports of essential items of mass consumption (such as
wheat, pulses, sugar, edible oils, etc.) into India and developing exports of a large
number of items from India. STC is today able to structure and execute trade deals
of any magnitude, as per the specific requirement of its customers.
The overall performance of STC during 2010-11, 2011-12 and April-
December, 2012 vis-a-vis figures for April-December, 2012 and estimates for 2012-
13 is given below:
Table: 6.1
Performance of STC
(Rs. in Crore)
April – December
2010-11 2011-12 Provisional 2012-13
Actuals 2012 2011 (Estimates)
Exports 492 344 687 257 1400
Imports 18938 29961 13081 24409 16500
Domestic 555 139 70 107 100
Total Turnover 19985 30444 13838 24772 18000
Profit Before Tax 80 18 10 21 14
Performance: 2011-12
Total Turnover
The Corporation achieved the highest ever turnover of Rs. 30, 444 crore
during 2011-12 thereby exceeding the previous year’s turnover by 52%.
Exports
During 2011-12, the Corporation made exports worth Rs. 344 crore with iron ore
being the single largest export item with an all-time high sale of Rs. 195 crore.
Other major items handled were rice, castor oil, maize and molasses.

144
Imports
The Corporation attained an all time high import turnover of Rs. 29961 crore
during 2011-12. Bullion continued to occupy the foremost position on import front
with highest ever sales of Rs. 17905 crore as compared to Rs. 14964 crore in the
previous year. During 2011-12, the Corporation continued to arrange supplies of
imported thermal coal to NTPC, which resulted in sales worth Rs. 9885 crore. It
also imported 5.6 lakh MT of urea valuing Rs. 1393 crore on the directives of the
Government of India. The Corporation imported edible oils both on its own account
as well as for the state governments for distribution to the weaker section under
Public Distribution System (PDS) resulting in overall sales of Rs. 484 crore. The
Corporation also imported and sold pulses worth Rs. 205 crore on behalf of
Government of India.
Domestic Sales
During 2011-12, the corporation effected total domestic sales worth Rs. 139
crore contributed mainly by oils, seeds jute goods, coal, pulse and tea. During the
year, the Corporation undertook, though on a modest scale, stock and sale of soya
bean, mustard seeds and desi chana and also opened retail outlets for sale of own
brand “STC Tea” in southern India in 250 grams packs.
Profitability
During 2011-12, STC earned a Profit Before Tax (PBT) of Rs. 18 crore. The
profitability of the Corporation remained under strain due to thin trading margins,
high interest costs and provisioning/write offs in certain cases.
Dividend
The Corporation paid a dividend of 20% of its paid-up equity capital for the year
2011-12.
Performance: April – December, 2012
Total Turnover
The Corporation achieved a turnover of Rs.13838 crore during April-Dec.,
2012 as against Rs. 24773 crore in April-Dec., 2011.The decline is mainly due to
lower imports of coal and bullion.
Exports
Total exports of the Corporation at Rs. 687 crore during April-Dec., 2012 were over
2.5 times the exports achieved during corresponding period of previous year.

145
During the period, the Corporation undertook exports of wheat out of Central Pool
stocks as one of the nominated agencies of the Government of India. Total
contracting of wheat stood at 6 lakh MT as on 31.12.2012 against which shipments
worth Rs. 650 crore have already been made. The Corporation also exported rice
amounting to Rs. 30 crore and manufactured products worth Rs. 6 crore. Total
exports of the Corporation would have been higher but for high export duty and
restrictions on mining and transportation of iron ore imposed by various state
governments resulting in no exports of iron ore during the current financial year as
against Rs. 114 crore in April-Dec., 2011.
Imports
The import turnover of the Corporation for the period April.-December, 2012
amounted to Rs. 13081 crore. Lower import turnover is mainly attributable to
reduced imports of bullion and coal. These two items contributed Rs. 22311 crore
in the import turnover during the previous year which fell to Rs. 7669 crore during
the current year – a decline of over Rs. 14600 crore. Coal imports decreased by
Rs.7962 crore and bullion imports by Rs. 6680 crore.
Bullion continued to be single largest item of import with sales valuing Rs.
7533 crore. However, the volume of bullion business was significantly lower as
compared to sales valuing Rs. 14213 crore made during April-Dec., 2011 due to
increase in customs duty on gold and silver leading to reduction in import demand.
The Corporation continued to import urea on behalf of the Government and
arranged imports amounting to Rs. 4964 crore during April-December, 2012 as
against imports worth Rs. 1394 crore during the same period last year.
Import of coal was drastically lower at Rs. 136 crore due to a change in the
system for import of coal by NTPC whereby its per plants are now individually
importing coal to meet their requirements and inability of the Corporation to get a
share of non NTPC coal business. During April-Dec., 2011, The Corporation had
imported about Rs. 8100 crore worth of coal for NTPC. Edible oils worth Rs. 367
crore were imported during April-Dec., 2012 as against Rs. 369 crore during the
same period last year. Pulses and manganese ore worth Rs. 26 crore and Rs. 25
crore respectively were also imported during the period April-Dec., 2012.
Domestic Sales
During April-Dec., 2012, sales by the Corporation amounted to Rs. 70 crore
mainly accounted for by oilseed/extractions (Rs. 30 crore), jute goods (Rs. 12 crore)
and pulses (Rs. 25 crore).

146
Profitability
During period under review, STC earned a Profit Before Tax (PBT) of Rs.10 crore.
Notable Achievements during 2012-13
All time high urea imports – full year turnover estimated at Rs. 5000 crore
(Previous year – Rs. 1400 crore).
Quantum jump in agricultural exports – full year turnover estimated at Rs.
1400 crore (Previous year – Rs. 150 crore).
Turnover excluding bullion and coal estimated at Rs. 7300 crore for full year –
about 2.75 times the corresponding figure of Rs. 2650 crore in the previous
year.
II. Minerals and Metals Trading Corporation (MMTC)
MMTC Ltd was incorporated in the year 1963 for trading in minerals and
metals. It is actively involved in exploring overseas markets for exports and
sourcing material for domestic needs. With focus on bulk operations and having
infrastructure spreading across the country, MMTC has primarily six core commodity
groups’ viz., fertilizers, Agro commodities, coal and hydrocarbons, minerals &
precious metals. The company is recognized as India’s largest international trading
company and the first Public Sector Undertaking to be awarded “Premier Trading
House” status in the country.
The summary of financial performance of MMTC Limited for the period
ending December, 2012 is given below in table 6.2.
Table 6.2
Financial Performance of MMTC (Rs. in Crore)
Trade Performance
MOU 2012-13 Prop. Target Apr-Dec.’12
Actual Apr-Dec’12
Increase (%)
Excellent Rating Excellent Rating
Exports 3500 2625 1477 (44)
Imports 64750 48563 16168 (67)
Domestic 3150 2362 3483 (47)
Total Turnover 71400 53550 21128 (61)
Profit Before Tax 111 83 94 13
Profit After Tax 75 56 (73) (230)
Net Profit To Turnover (%)
0.11 0.11 (0..34) (409)
Source: MMTC

147
The highlights of the financial performance of MMTC during 2012-13 are as
follows:
The Company has achieved a turnover of Rs. 21,128 crore for period ended
on 31 December, 2012 against MOU target of Rs. 53,550 crore falling short of the
target by 61%. In one segments of trading business, namely, domestic trade, the
company has witnessed growth as compared to proportionate MOU targets to the
extent of 47%. Net profit at Rs. (73) crore has a shown a decrease of 230% as
against the MOU target of Rs. 56 crore.
Subsidiary/Associates
MMTC Transnational Pte. Ltd. (MTPL), Singapore:
The wholly owned foreign subsidiary was set up in the year 1994 for
promoting international trade. During April-Sept., 2012 it has achieved a business
turnover of USD 392 million. MTPL continues to enjoy “Global Trader” status
awarded to it by IE Singapore. To expand and give impetus to growing trade
between India and Africa, MMTC has opened an office at Johannesburg, South
Africa in January, 2011.
Neelachal Ispat Nigam Limited (NINL):
Neelachal Ispat Nigam Limited, a company promoted by MMTC, IPICOL,
NMDC, MECON etc., has set up an iron & steel plant of 1.1 million tonnes capacity,
coke oven of 0.8 million tone capacity along with a by-product plant, captive power
plant of 62.50 MW etc., with total expenditure of Rs 2,000 crores at Kalinganagar,
District Jajpur, Orissa. During this period also, NINL maintained its position of being
the largest Pig Iron producer & exporter in the country.
The total turnover and cash profit/loss of the company for the half year was
Rs. 768 crore and Rs. 16.98 crore respectively. Construction of Phase II expansion
of Plan of NINL for steel making facility (Billets, wire rods) is under progress.
Other Projects
Aiming at diversification and with a view to add value to its existing trading
operation, the Company has undertaken various strategic initiatives following
public-private partnership route. These strategic initiatives are aimed to enhance
future sustainability include:
Commodity Exchange under the name and style of “Indian Commodity
Exchange (ICEX)” which has commenced operations during November,
2009.
Participation in equity of Currency Exchange under the name and style of
“United Stock Exchange of India Ltd.” which has commenced operations
during September, 2010.

148
Joining hands with an international producer as a joint venture partner for
setting up a gold/silver medallion manufacturing unit, which would also
include a gold refinery as an integral part, under the name and style of
“MMTC-Pamp India private Limited”. The civil construction activities for
medallion manufacturing unit located in Haryana are already complete and
the trial production for minting of medallions commenced.
For promoting retail sales of value added products like medallions, silverware
and jewellery on all India basis, MMTC has set up a joint venture “MMTC
Gitanjali Private Limited” . The JV commenced operation in April 2009 and
17 showrooms are operational in different cities in India under the Brand
name “SHUDHI”.
Setting up permanent berth with loading facilities for Iron ore at Ennore Port
jointly with M/s SICAL and L&T Infrastructure under the name and style of
M/s. SICAL Iron Ore Terminals Limited, Chennai.
Development of deep draught iron ore berth at Paradip Port jointly with Noble
Group Ltd and Gammon Infrastructure Projects Ltd. under the name and style
of M/s. Blue Water Iron Ore Terminal Private Limited.
Towards investing in mining infrastructure MMTC has promoted a joint
venture Company with M/s. TATA Steel Ltd. for exploration and development
of mines for minerals, ferrous and non-ferrous ores, precious metals,
diamonds and coal etc.
MMTC has been allotted a coal mine in Jharkhand having estimated reserves
of about 700 million MT. The prospecting license for the said mine has been
issued by the concerned authorities and pre-feasibility study commenced.
III. Project and Equipment Corporation of India Ltd.(PEC)
PEC Limited was formed on 21st April, 1971 as a wholly owned subsidiary of
STC. PEC Limited became an independent Company under the Department of
Commerce w.e.f. 27th March, 1991.
Activities
PEC is primarily engaged in export of projects, engineering equipment and manufactured goods, defence equipment & stores and import of industrial raw materials, bullion and agro commodities.
Consolidation of existing lines of business and simultaneously developing new products and new markets.
Diversification in export of non-engineering items e.g. coal & coke, iron ore, edible oils, steel scraps, etc.

149
Counter trade/special trading arrangements for further exports.
Objectives
To be a profit oriented international trading organization.
To provide adequate return to the stakeholder, commensurate with the
market expectations.
To seek new opportunities in the global and domestic market.
To focus on export of engineering projects and equipment especially from
small and medium enterprises.
To trade in commodities such as agricultural products, industrial raw
materials, chemicals and bullion.
To continuously strive for enhancement of the corporate image of a reliable,
long term and professionally competent organization.
To continuously strive for improvement in productivity and competitiveness.
To serve as an effective instrument of public policy and social responsibility.
Performance
Table: 6.3
The Overall Performance of the Corporation since 2010-11 is given below:
(Rs. On crore)
Items 2010-11 2011-12
20121-13
MOU Targets
2012-13
Achievement
(Provisional)
upto
30.09.2012
2013-14
MOU
Targets
(Projected)
Sales Turnover 9969.94 11026.27 11500.00 *5000.00 12000.00
Income 146.40 159.73 170.80 75.00 180.35
Expenditure 39.84 41.20 51.40 26.00 55.35
Profit before Tax 106.56 118.53 119.40 49.00 125.00
Profit after tax 70.92 79.55 77.40 35.85 83.10
Dividend & Corporate tax 17.43 17.43 18.00 8.72 17.43
Equity 20.00 20.00 20.00 20.00 20.00
Reserves 265.51 327.63 377.48 349.87 449.06
Net Worth 285.51 347.63 397.48 369.87 469.06
* Includes Bullion – Rs. 30.00 crore.

150
Sales Turnover
Table: 6.4
The Sales turnover of the Company since 2010-11 is given below:
(Rs. in crore)
Year Sales Turnover
2010-11 9969.94
2011-12 11026.27
2012-13(Prov. Upto 30.09.2012) 5000.00
During the year 2011-12, PEC has achieved sales turnover of Rs. 11026.27
crore as compared to Rs. 9969.94 crore in the previous year, an increase of 11%.
Consequently, the Profit before tax increased to Rs. 118.53 crore from Rs. 106.56
crore, an increase of 11%. The Profit after tax increased to Rs. 79.55 crore as
compared to Rs. 70.92 crore in the previous year, recording an increase of 12%.
The earnings Per Share (Basic & diluted) was Rs. 398 during the year 2011-
12 as compared to Rs. 355 in the previous year.
MOU rating for 2011-12 is ‘Excellent’.
During the year 2012-13, as against MOU target of Rs. 11500.00 crore, the
Company has registered a turnover of Rs. 5000.00 crore upto September, 2012 and
as per current expectations, it is estimated to achieve a total turnover of Rs.
10500.00 crore.
Exports
Table: 6.5
The item-wise composition of exports since 2010-11 is given below:
(Rs. Crore)
Item 2010-11 2011-12 2012-13
Provisional
Upto
30.09.2012)
Agro commodities 553.81 622.18 486.00
Minerals (Iron Ore) 552.87 391.55 52.00
Engineering & Manufactured Goods 26.42 20.88 11.00
Others 3.15 2.12 1.00
T O T A L 1136.25 1036.65 550.00
Export sales aggregated to Rs.1036.55 crore during the year 2011-12.

151
During the year, PEC continued its efforts in maintaining is potential export
markets such as Bhutan, Nepal, Bangladesh, Sri Lanka, Mauritius, Ethiopia, Kenya,
Liberia, Mauritania, etc. The Company has secured contracts from Bhutan, Nepal,
Kenya, Ethiopia and Liberia for supply of transformers, stay rods, conductors,
cables, transmission and distribution hardware, insulators etc.
Agro business continues to be key contributor to the growth of the
corporation. PEC exported rice, wheat and soya meal during the year. Other major
exports were iron ore fines to China, home appliances & spares and medical
equipment to various nations.
Imports
Table: 6.6
The item-wise composition of imports since 2010-11 is given below:
(Rs. in Crore)
Item 2010-11 2011-12 2012-13
Provisional upto
30.09.2012
Agro Commodities 2530.25 1775.13 1175.00
Industrial Raw material 3987.97 5242.02 2370.00
Bullion (including Diamond) 1311.26 971.35 50.00
Engineering & Manufactured Goods 69.16 149.08 100.00
Others 8.16 53.72 25.00
T O T A L 7906.80 8191.30 3720.00
During the year 2011-12, PEC achieved import turnover of Rs.8191.30 crore.
Bullion import aggregate to Rs. 971.35 crore during the year.
PEC undertook bulk import of coal, manganese ore, industrial chemicals,
diamonds, etc. during the year.
Agricultural commodities like edible oil, pulses, jute were also imported during
the year.
During the year, contracts for import of new chemicals & resins, namely
LUPOL-Polycarbonate and Poly Propylene, were also executed.

152
Domestic Trade
Domestic sales during the year almost doubled to Rs. 1798.32 crore from Rs.
926.89 crore in the previous year. The domestic sales include coal, steel, cotton
seeds , edible oil, cotton yarn, defence stores and other miscellaneous items.
Dividend
During the year 2011-12, PEC has paid dividend and tax thereon of Rs.
17.43 crore at the rate of 75% on the share capital of Rs.20 crore.
MOU rating for 2011-12 is “Excellent” (Provisional). MOU for the year 2012-
13 has been signed with the Ministry of Commerce & Industry.
Key Initiatives
PEC continues with its commitment to promote export of engineering and
manufactured goods.
Over the years, business of PEC has changed with industrial raw materials,
agro commodities and bullion constituting major part of its turnover and profit. Some
of the key initiatives have been consolidation of existing line of business and
selective diversification into sustainable business areas, improving operational
efficiency and cost effectiveness.
PEC continues to strive in its efforts to capture new opportunities in
international as well as domestic trade to sustain. PEC looks forward optimistically
to achieve targets in future.
PEC has sought to be adaptable, anticipating and responding to the changing
needs of the economy, dynamic business environment and public policy. PEC
believes in innovation to enhance the range of products and services.
PEC has developed our business to serve diverse needs of the trade and
economy. Given the volatile operating environment, the focus was on capital
conservation, liquidity management and risk containment.
Corporate Social Responsibility
PEC has set aside a budget of Rs. 2.10 crores for its CSR activities for the
year 2012-13. Under its CSR activities PEC has undertaken projects, as per DPE
guidelines, for the education of physically and mentally handicapped children, solar

153
lighting in rural areas, sponsoring mid-day meal scheme, provision of hand-paddled
tricycles and fitment of foot/limbs and calipers to differently-abled/ bilateral polio
patients and/or amputees, vocational education program for underprivileged women,
Camps for Prevention of Avoidable Blindness and Visual Impairment among other
projects.
Sustainable Development
PEC has allocated a budget of Rs. 40 lakhs towards Sustainable
Development Initiatives for the financial year 2012-13. The projects/activities
undertaken in the year 2012-13 include Contribution towards Tiger Protection Fund,
Construction of Rain Water Harvesting Pits, Deep Aquifer Recharge through the
Technology of Recharge Shaft Planting of Trees through External Agency and
Training to employees on Sustainable Development.
IV. Spices Trading Corporation of India Ltd (STCL)
STCL was originally incorporated in the name and style as “Cardamom
Trading Corporation Limited” as a Private Limited Company under the Companies
Act 1956 in October 1982. Consequent to the change of name, the Company
obtained a fresh certificate of incorporation under the name of SPICES TRADING
CORPORATION LIMITED with effect from August 1987 in order to widen its
marketing base from Cardamom to other range of spices.
Thereafter, STCL became a subsidiary of The State Trading Corporation of
India Ltd., with effect from 14.9.1999 and shares held by the Ministry of commerce
were transferred to the State Trading Corporation of India Ltd.
With the diversified trading activities, the company’s name has been further
amended from Spices Trading Corporation Limited to “STCL LIMITED” and fresh
Certificate of Incorporation under the name of STCL Limited has been obtained with
effect from August 13, 2004.
Objectives
To trade in spices, other agricultural commodities, fertilizers, pesticides in the
domestic as well as global markets.
To develop core competitiveness in selected areas and exploit the market opportunities in these areas to the best advantage of the Company and to lay emphasis on quality of services to its Clientele in the long-term business relationship.
154
To promote sale/export of Indian spices and other Agricultural commodities.
To make optimum utilization of infrastructure available with the Company.
To strive to pay adequate returns to the parent company (The State Trading Corporation of India Limited).
To fulfill Company’s social responsibility by following ethical business practices and reinforcing commitment to customers, employees, partners and communities.
To undertake on a continuous basis training/re-training of existing manpower and induct professionally qualified young talent so as to create a cadre of highly professional and motivated managers.
To become a credible company of international standards of corporate governance and offer quality services.
Share Capital
The Share Capital of the company as laid down in its amended Memorandum of
Association is Rs. 5,00,00,000/- (Rupees Five Crores), divided into 5,00,000/- equity
shares of Rs. 100/- each (Five Lakhs equity shares of Rs. One hundred) .The Paid
up Share Capital of the Company as on today is Rs. 1,50,00,000/-(Rupees one
Crore fifty lakhs) comprising of 1,50,000 equity shares.
Achievements:
During the Financial Year 2011-12, the Company has achieved a turnover of
Rs. 127.77 crore. The company is estimated to achieve turnover of Rs. 108.75
crore during 2012-13.
Service to Farmers
The presence of STCL in Plantation areas in the State of Karnataka and
effects of distribution of fertilizers, agro chemicals and other inputs
manufactured by reputed companies at competitive prices and thus the
farmers interests are not exploited by the middlemen and traders. The timely
supply of fertilizers helped the farmers in carrying out their fertilizer
application/operations on time, which has boosted their productivity /
production.

155
STCL is regularly conducting cardamom Auctions and due to the good
auctioning practices adopted; the growers are assured of realizing
reasonable price for their produce. The auction practices followed are also
benchmark for other auctioneers.
V. National Centre for Trade Information (NCTI)
The National Centre for Trade Information (NCTI) was incorporated on 31st
March, 1995 as a Company under Section 25 of Companies Act, 1956. The
Company started functioning w.e.f. March 1996. It has a Board of Directors for
administration of its affairs, which includes representatives from Ministry of
Commerce & Industry, National Informatics Centre (NIC), Indian Institute of Foreign
Trade (IIFT), and Directorate General of Commercial Intelligence & Statistics
(DGCI&S).
The ITPO and NIC are co-promoters of the Company and have contributed a
sum of Rs.4.00 crore (Rs.2.00 crore each) as Corpus Fund in the equity contribution
of the Company. The ITPO provides fully furnished office space and the NIC
provides the software and hardware against their equity contribution in kind.
The Centre provides value added information in the field of electronic trading
opportunities, live trade leads from World Trade Point Federation (WTPF), trade
data analysis and organize export awareness seminars and update/upload
information on its website. The Centre uploads 52 issues of E-weekly ‘Trade Point-
India’ annually on its website containing approximately 250 Trade Leads each week.
Studies undertaken
ASEAN FTA/PTA Work
GCC FTA/PTA
India-Chile FTA/ PTA
Trade data analysis for WTO Division
India-MERCOSUR FTA/PTA
India-New Zealand FTA/PTA
Study under ‘Duty Free Tariff Preference (DFTP) Scheme
Trade Data Analysis of Agriculture items for APEDA
Trade data support for AEPC

156
Other major activities
• Setting up and Operationalization and Management of Computerized Trade
Information Centre (CTIC) at Dharwad for Visvesvaraya Industrial Trade
Centre, Bangalore
• Electronic Trading Opportunities (ETO) service to APEDA, NSIC and VITC,
Bangalore.
• Trade data support for AEPC.
• Development and maintenance of websites, Creation of databases and
conducting feedback surveys for ITPO events.
• Trade leads and trade data support to Govt. and Public Sector Organisations
and SMEs etc.
VI. India Trade Promotion Organization (ITPO)
The Trade Fair Authority of India (TFAI) and the Trade Development
Authority (TDA) were merged together in 1992 and the new organization was
renamed as India Trade Promotion Organisation (ITPO). ITPO is the premier trade
promotion agency of India and provides a broad spectrum of services to trade and
industry so as to promote India’s exports. These services include organisation of
trade fairs in India and abroad, Buyer-Seller Meets and Business Meets &
Conventions, Contact Promotion Programmes apart from information dissemination
on products and markets. With its Headquarters at Pragati Maidan, New Delhi and
regional offices at Bangalore, Chennai, Kolkata and Mumbai; ITPO ensures
representative participation of trade and industry from different regions of the
country in its events in India and abroad.
Financial Highlights During 2012-13, ITPO’s total income would be Rs.301.50 Crore (provisional)
as compared to Rs.373.79 Crore in 2011-12 while the total expenditure is
anticipated at Rs.191.50 Crore (provisional) as against Rs.190.76 Crore incurred in
2011-12. ITPO is anticipating a surplus of Rs.110.00 Crore (provisional) during the
year 2012-13 as compared to actual surplus of Rs.183.03 Crore in 2011-12.
Fairs in India India Trade Promotion Organization (ITPO) organized specialized events
during 2012-13. During the period from 1.4.2012 to 31.12.2012, ITPO organized
India International Leather Fair, Pragati Maidan, New Delhi, Aahar-the International
Food Fair, Chennai, 18th Delhi Book Fair, Pragati Maidan, New Delhi, 14th Stationery
Fair, Pragati Maidan, New Delhi, 15th India International Security Expo, Pragati
Maidan, New Delhi, 32nd edition of India International Trade Fair (IITF-2012). Other

157
regular events of ITPO namely India International Leather Fair at Chennai,
International Leather Goods Fair at Kolkata, Nakshatra, Pragati Maidan, New Delhi,
Aahar – the International Food & Hospitality Fair, Pragati Maidan, New Delhi etc. are
scheduled to be held during the period January to March 2013.
Lifestyle Pakistan
ITPO successfully hosted “Lifestyle Pakistan” exhibition at Pragati Maidan
from April 10-15, 2012. The event was organized by Trade Development Authority
of Pakistan (TDAP) and supported by Department of Commerce, Government of
India and ITPO. The event was a huge success and attracted a good number of
business visitors and general public. The event was attended by Shri Anand
Sharma, Hon’ble Minister of Commerce & Industry and Textiles, Government of
India.
India International Leather Fair – Delhi
The 2nd edition of India International Leather Fair (IILF), Delhi 2011 was
organized at Pragati Maidan, New Delhi from July 5-7, 2012.
The fair was inaugurated by Shri S.R.Rao, Commerce Secretary, Govt. of
India
CLE, CLRI, ISF, IFCOMA and IFLMEA were the co-organizers of the Fair
A total number of 128 companies participated in the Fair (including 40 from
overseas mainly from Italy, China, Taiwan and Singapore)
Aahar-the international Food Fair, 2012, Chennai
Aahar, the international food fair-2012 was organized in Chennai from
August 23-25, 2012.
ITPO & TNTPO were the co-organizers and supported by MoFPI,
APEDA, ARCHI, NSIC, IFCA and HOTREMAI.
The fair was inaugurated by Mrs. M.P.Nirmala, Secretary (Food Supplies)
Govt. of Tamilnadu.
A total number of 119 companies participated in an area of 1799 sq. mtrs.
18th Delhi Book Fair, New Delhi
The 18th Delhi Book Fair 2012 was organized by ITPO from September 1-9,
2012 at Pragati Maidan, New Delhi. The Federation of Indian Publishers (FIP)
was the co-organizer of this event.
The Federation of Indian Publishers (FIP) was the co-organizer of this event.
Hon’ble Lt. Governor of Delhi, Shri Tejender Khanna inaugurated the event.

158
The net area sold to 230 participants was 5355 sq. mtrs.
A number of seminars were conducted during the period of the fair.
Four foreign countries namely USA, China, Pakistan and UK also participated
in the fair.
The theme for the year was “eBooks”.
Stationery Fair
Concurrent to Delhi Book Fair ITPO also organized 14th Stationery Fair.
Over 38 companies participated in this twin fair.
15th International Security Expo
ITPO organized 15th edition of India International Security Expo, Pragati
Maidan, New Delhi (September 13-16, 2012)
The fair was inaugurated by Mrs. Rita Menon, CMD, ITPO.
65 companies displayed their products including Home land security, disaster
management & NBC equipment, radio communication system etc.
Foreign delegates and visitors from 25 countries visited the event.
The fair was visited by 3573 business visitors who registered their names for
their visits to the fair.
32nd India International Trade Fair 2012
32nd edition of ITPO’s popular annual event, the India International Trade Fair
(IITF) was organized in Pragati Maidan, New Delhi from November 14 to 27,
2012 (First five days were exclusively for business visitors).
The fair was inaugurated by Shri Pranab Mukherjee, Hon’ble President of
India.
The Theme of the Fair was -“Skilling India”
Uttarakhand was the Partner States.
Andaman & Nicobar Islands were the Focus States.
Online allotment of space to domestic exhibitors was streamlined for better
transparency.
Space rent payment by NEFT and RTGS was encouraged.
To facilitate the visit of overseas delegates, exclusive International Business
Lounge was operated near Gate No. 7, Pragati Maidan. The facilities
provided at International Business Lounge include registration of foreign
delegates, foreign exchange counter, Cyber Café.

159
For convenience of the visitors a Round Robin Bus Service and Three Hop-
on-Hop-off (HOHO) Low floor buses for plying on Round Robin Route were
operated.
Protocol was shifted to Gate No.1 so as to decongest Mathura Road.
Elaborate arrangements were made for safety & security of visitors, which
included X-Ray baggage scanners at all entry points, explosive detectors for
the anti-sabotage check, enhanced number of CCTV, observation towers,
Walkie- talkie sets and inverted mirrors, flap-barriers to regulate entry with
bard coded badges, tickets, fire-fighting systems inside all halls as per the
requirement of Delhi Fire Service, emergency lights in case of sudden power
failure, arrangements of standby generators and barrier-free access to the
halls.
Park & ride facility was available for the visitors.
Over 6000 exhibitors from India and abroad took part in the event as detailed
below:-
Domestic Participants in IITF 2012
32 States and Union Territories, 38 Central government Ministries/
Departments, Public Sector Companies, etc., participated in the fair.
Foreign Participants in IITF 2011
About 414 Overseas Exhibitors from 26 countries took part in the event.
12 countries participated at country level i.e., Afghanistan, Bangladesh,
Belarus, China, Cuba, Iran, Pakistan, Papua New Guinea, South Africa, Sri
Lanka, Tanzania, Thailand.
New Initiatives in IITF 2012
The allotment of space to private sector companies was done electronically.
Potential exhibitors had to apply online for allotment of space and were
encouraged to send booking amount and participation fee through
NEFT/RTGS.
Locations were divided into A, B and C categories. The objective was to give
prime location to good companies.
The display profile was restricted to the product groups identified for each hall.
Hall No. 6 and 18 were kept for foreign and government participation.

160
Mobile Application: Key information on IITF, as also floor-plans of all halls,
details of exhibitors was available on Blackberry, Android, Google play and i-
phones.
New Product Launch: Two slots (11.00 a.m. -1.00 p.m./3.00 p.m.- 5.00p.m.)
were earmarked in Hall No.8 for new product launches, at a nominal fee of
Rs. 50000/slot. Four new products (3 by M/s Ambrane and 1 by M/s, GXT
Green) were launched.
This year, for the first time, ITPO introduced the Cuisine of the State Awards
in IITF. In this category, Maharashtra bagged the Gold Medal, Kerala won
the Silver, while Uttarakhand received the Commendation and special
appraisal certificates were given to Karnataka and West Bengal. Mementos
and Certificates were also presented to the Partner and Focus countries as
well as Partner and Focus States.
India-ASEAN Business Trade Fair (IABF)
2nd India-ASEAN Business Trade Fair (IAFB) was successfully organized in
Pragati Maidan from December 18-20, 2012 by Department of Commerce,
Government of India with the support of FICCI and ITPO. The event was attended
by Trade Ministers of a number of ASEAN countries along with Shri Anand Sharma,
Hon’ble Minister of Commerce & Industry and Textiles, Government of India.
Fairs Abroad
Overseas fairs during April-December, 2012
During the year 2012-13, ITPO proposes to organise participation in 24
overseas trade fairs including two mini India shows in Osaka, Japan.
Out of 24 events, ITPO has organised participation in 19 events from
April-December, 2012)
Out of 19 events held so far, 5 events were held in Europe, 5 in Africa &
Middle East region, 4 in LAC/NAFTA, 2 in Asia, 1 in CIS region and 1 in
Australia. Further, out of 19 events, 6were general fairs, 13 were
specialised fairs including two exclusive Mini India Shows.
Proposed overseas fairs during 2012-13
During 2013-14, ITPO proposes to organise 36 overseas trade fairs including
1 India Shows and 2 Mini India Shows.

161
Brand India Shows
India Garment Fair & India Home Furnishing Fair, Japan
During the year, two exclusive Indian commodity shows were organised in
Japan in the month of July, 2012 i.e. the 33rd India Garment Fair and 23rd
India Home Furnishing Fair 2012.
The shows for Home Furnishings and Garments are being organised
annually for the last several years are well established and have become
major sourcing avenues for these products.
The simultaneous organisation of the Shows for Furnishing and Garments
during 2012 provided ample opportunity for buyers and sellers to conduct
business under one roof, not only in terms of Home Furnishings but also in
Garments. These two events generated business worth US $ 28.14 million
and were attended by 2057 business visitors.
Participation in overseas events as “Guest/Partner Country”
ITPO organized India’s participation in 2 overseas event i.e. Muba, Basel
(Switzerland) in April, 2012 as “Guest Country” and in Africa’s Big Seven/SAITEX,
Johannesburg (South Africa) in July, 2012 as “Partner Country”. Trade Delegations
35 trade delegations visited India Trade Promotion Organization from April
2012 till December 31, 2012. These included a 13 member delegation from The
Export Promotion Council of Kenya, a 2 member delegation from the Hong Kong
Trade Development Council, a two member delegation from Japan External trade
Delegation and 3 member delegation from Messee Frankfurt visited ITPO and were
given an introduction of ITPO and its trade promotion activities and exploring
possibilities of collaborating in trade promotion activities and exploring possibilities
of collaborating in trade development activities for furtherance of bilateral trade. 31
trade delegations visited the India International Trade Fair, 2012.
Membership ITPO provided a package of services to export worthy units which are
enrolled as Members. These services include trade enquiries received from Indian
Missions abroad, market reports, details of importers and arranging meetings with
visiting delegations during Trade Fairs & Exhibitions organized by ITPO. This year,
till December 2012 about 315 trade enquiries received from Indian Missions abroad
were disseminated among the members through Trade Intelligence Bulletin enabling
them to explore business opportunities with the overseas counterparts. In addition,

162
trade information related to overseas tenders and trade fairs & exhibitions organized
by ITPO and overseas agencies are also published in the Indian Export Bulletin.
Networking with TPOs ITPO has been actively participating in Asian Trade Promotion Forum
(ATPF), a gathering of Trade Promotion Organisations (TPOs) since very beginning.
All the activities of ATPF are coordinated by Japan External Trade Organisation
(JETRO). Under the programme, the working-level meeting with representatives of
the TPOs of the member countries and the meeting of the CEOs of the member
organizations is held annually. The 25th AT`PF CEO Meet, held at Bangkok-
Thailand from April 18-20, 2012 was attended by CMD and a senior official of ITPO.
ITPO was also represented by senior officials at the 21st Working level Meeting
(WLM) in Fukuoka, Japan from December 10-12, 2012. The 26th ATPF CEO
Meeting is being hosted by ITPO in Agra, India, from March 5-7, 2013.
Export Potential Seminars 19 seminars were organized during IITF 2012 in association with FICCI &
State Governments like Government of Bihar, West Bengal, Uttarakhand,
Department of Science & Technology, NSIC, etc. Some of the seminars organized
by FICCI were (i) Skill for All: For the people, by the people; (ii) Workshop I on
‘Contact Creation for the Media & Entertainment’ and Workshop II on ‘Opportunities
in the Food Processing Industry’. Department of Industries, Govt. of Bihar
organized a Seminar on Investment & Business Opportunities in Bihar. Govt. of
West Bengal organized Seminar on Business Opportunities in West Bengal and
Uttarakhand organized Seminar on Investment & Business Opportunities in
Uttarakhand.
Computerization Knowledge management system – A Section on Knowledge Management
System has been created on ITPO’s website and this Section is being
updated regularly.
IT infrastructure in ITPO – The present IT infrastructure in ITPO includes
about 350 desktop computers, 10 servers, 6 work-stations, attached
peripherals and supporting application software which are operational in the
networking environment.
Mobile Application for IITF’2012 – A mobile application was developed for
Smart Phones/Tablets to view information and updates about IITF’2012. The
mobile application was developed for various platforms such as iphone/iPods,
Android and a compatible website (m.iitf.in) was also created for viewing the
IITF’2012 details on web/internet enabled phones. The application contains

163
the information on IITF, exhibitors, floor plans, factsheets, facilities, safety
and security etc.
Development and Maintenance of Software Modules for Online Space
Booking and Deposit of Space Rent – To provide the facility of online space
booking to the potential exhibitors for greater transparency and doing
business; Software module for online booking of space and online payment of
space rent has been developed for IITF’2012. The online booking of space
and online payment of space rent module for Aahar International Fair and
Leather Fairs, 2013 are also being implemented.
Besides facilitating various Divisions in their IT enabled functions on day-to-
day basis, the Computer Department of ITPO has also been facilitating
development, hosting and maintenance of corporate website of ITPO, two
trade portals and fair specific websites
Trade Information During 2011-12, over 100 titles of periodicals of which 8 priced ones and rest
on gratis basis and about 10 CD-ROMS were added in the Business Information
Centre. Out of these titles (about 1500 issues of these titles), 80 were trade related
periodicals and others non trade related periodicals (i.e. Grah Shobha, Sarita, India
Today etc.). During April-December 2012 over 100 titles of periodicals of which 9
priced ones and rest on gratis basis as mentioned above and 34 CDs were received
in BIC Library. Besides 39 issues of Indian Export Bulletin were brought out and
hosted on the website up to December 2012. Business Information Centre With a view to provide reliable trade information to Indian exporters and
overseas buyers, the ITPO has set up the Business Information Centre and Trade
Portal www.tradeportalofindia.org at Pragati Maidan. The trade portal was set up by
the Government of India under the EU – India Trade Investment and Development
Programme for promoting trade between India and EU. This provides information
on the EU countries and covers other countries and regions as well. It also offers
linkages to relevant government websites that provide information access, both off-
line and online, on countries, trade statistics, market surveys, sector – based
information and statistics, country regulations, trade events, business directory etc.
At present this portal contains information on more than 100 countries including 27
countries of EU.

164
The Centre provides online access of KOMPASS – (a database of 1.8 million
companies for 82 countries, searchable by country and product, classified by
manufacturer/importer/distributor/agent) to its members.
Setting up of Regional Trade Centres ITPO is providing assistance to State Governments in setting up Regional
Trade Promotion Centres (RTPCs) for creating Export Infrastructure in State
Capital/major cities. The present status is as given below:
1. Tamilnadu Trade Promotion Organisation
TNTPO has three AC Halls having area of 4400 sq. mtrs. 1760 sq. mtrs and
4400 sq. mtrs respectively. A modern Convention Centre having built up
area of 6672 sq.mtrs on Ground Floor and 1817 sq. mtrs on First Floor with
seating capacity of 2000 is also operational since November, 2004 in the
Chennai Trade Centre (CTC). CTC is also having 4000 sq. mtrs open area
for display.
During 2012-13 (April, 2012 to 1 December, 2012), 175 events were
organized at Exhibition and Convention Halls of TNTPO. 38 events are
anticipated to be organized at CTC during January – March, 2013.
The important events organized at Chennai Trade Centre include IILF, Hindu
Metro Plus, Tyre Expo, Weld India, Medicall, Acetech, RSSDI, ISNT, Gems &
Jewellery, Roof India, BAICON, Print Expo, India International Build Expo,
Textile and Garment Show, Electrica.
2. Karnataka Trade Promotion Organisation
The Trade Centre at Bangalore was set up in 2004 and is managed by a
Joint Venture Company called Karnataka Trade Promotion Organisation
(KTPO). KTPO is a Joint Venture of ITPO and Karnataka Industrial Area
Development Board (KIADB).
KTPO is having one Exhibition Hall measuring 5371 sq. mtrs. and one
Conference Hall measuring 1500 sq. mtrs.
During 2011-12 (April – December 2011), KTPO hosted 24 events and it is
expected to organize 6 more events during January – March, 2012.
The important events organized at KTPO during April – December, 2011
includes IPCA Expo 2011, SS-12 Range Presentation, All Thai Products,
SAP TechED-2011, The Great Indian October Fest 2011, Bengaluru
Midnight Marathon and Grace Hopper Celebration for Women in Computing
etc.

165
Commercial Publicity & Public Relations
During the current year, ITPO made extensive publicity arrangement for its
B2B and B2C and B2C events through multimedia campaign viz. Print,
electronic and outdoor media in India and overseas. This publicity campaign
was supplemented with brochures, invitation mailers, posters etc. Fair
catalogues were printed for both domestic and overseas events.
ITPO worked in close coordination with the print and electronic media to
ensure meaningful coverage through newspapers, magazines, radio and TV
channels disseminating information for attracting quality visitorship.
Close liaison with All India radio and Doordarshan who in turn cooperate with
ITPO in disseminating information of its fairs and other promotional activities.
ITPO’s activities and its exhibition infrastructure were highlighted in the
Calendar of Events booklet which also listed ITPO’s programmes of events in
India and abroad over a period of two years. The booklet was mailed to its
target audience comprising trade and industry associations in India and
abroad, overseas missions in India as well as Indian missions abroad and
nodal industry organisations in different States.
ITPO also brought out a quarterly newsletter ‘Log On’ for updates on ITPO’s
activities and events to trade and industry in India and overseas, Central
Ministries and Departments, State Governments, PSUs, EPCs etc. As part
of corporate publicity efforts, advertorials were brought out in publications/
newspaper supplements in respect of major fairs while corporate
advertisements on major fairs were released in prominent publications.
Tender Notices pertaining to various matters were also released in various
publications from time to time apart from uploading on ITPO’s website.
Infrastructure
During the year 2012-13 (April-December, 2012), works of
creation/upgradation of facilities in Pragati Maidan undertaken by ITPO are
as follows:
Construction of toilet block at mezzanine floor of Hall No.18.
Up gradation of toilet block at the basement of Hall No.18.
Up gradation of Phoolwari as Convention and Conference hall.
Up gradation of Shakuntalam as Convention and Conference hall.

166
Up gradation of toilet blocks in Administrative building.
Renovation/up gradation of ITPO Cafeteria/Canteen.
Construction of Ticket Booth & Toilet at Gate No.10.
Renovation of Hall C at Gate no.1.
Construction of general toilet block (outside of hall) at Hall No.7.
VII. Export Credit Guarantee Corporation of India Limited (ECGC)
The Export Credit Guarantee Corporation of India Ltd. (ECGC) Mumbai was
set up in 1957 under the Companies Act, 1956. It has the primary objective of
supporting the country’s exports by extending Insurance and Guarantee facilities to
the Indian exporters and the commercial banks. The paid up capital at the end of
2011-12 was Rs. 900.00 crores. ECGC has registered itself with the IRDA on 27th
September, 2002 bearing Registration No. 124.
The standard policies provide insurance cover to exporters against
commercial and political risks for shipment made on short-term credit. Transfer
guarantee are issued to banks in India which add confirmation to letter of credit and
such guarantees protect the banks against losses that may be sustained by them
due to default of the banks or because of certain political risks. There were 13005
short-term policies including transfer guarantees and 62 long term policies, in force
on 31.03.2012. The total value of shipment declared under the schemes (short-term
policies, transfer guarantees and Domestic Credit Insurance) in the year 2011-12
amounted to Rs.99550.01 crores as compared to Rs.93127.40 crores in 2010-11,
recording a growth of 10.25%.
The total claims paid during 2011-12 amounted to Rs. 713.03 crores as
compared to Rs.620.53 crores in 2010-11. Claims paid during April to September,
2012 were Rs. 201.70 crore as compared to Rs. 162.50 crore paid during the
corresponding period in previous year.
During the year 2011-12, a total sum of Rs. 168.64 crores was recovered
(previous year Rs. 136.06 crore) consisting of Rs. 6.31 crore from the short term
policy cases, Rs. 152.59 crore from the Export Credit Insurance to Bank cases and
Rs. 9.74 crore from Medium and Long term cases. An amount of Rs. 63.81 crore
was recovered during the period April to September, 2012 as against Rs. 96.35
crore recovered during the same period in the previous year.
The total gross premium income from all the schemes of ECGC during the
year 2011-12 amounted to Rs.1004.83 crores as compared to Rs. 885.47 crores in

167
201-11. The growth came from the Export Credit Insurance to Bank business,
accounting for 59.89% of the total premium income, followed by Short Term Policy
sector including factoring, which contributed 35.42%. The income from medium and
long term sector accounted for just 4.69% (Rs. 47.27 crores) of the total premium
income.
The total gross income of the corporation amount to Rs. 1355.72 crores (previous year Rs. 971.72 crore) of which net earned premium income was Rs. 766.25 crore (previous year Rs. 674.86 crore). Of the other income, interest on investments earned last year alone, accounted for Rs. 353.59 crore (previous year Rs. 280.17 crore). The year under review i.e., 2011-12, ended with a profit of about Rs. 327.72 crore before tax (previous year Rs. 117.63 crore).
ECGC covers exports to 237 countries. The top five countries covered by
ECGC during the year were USA, UK, Germany, UAE and Italy. They represent
about 42.10% of its total cover. Engineering Goods, Leather and leather
manufactures, readymade garments, Cotton & Handloom and Agricultural Products
(including Dairy and processed foods) are the top five commodities covered by
ECGC during the year. These aggregate to Rs. 51766 crore, representing 52% of
the total value covered by ECGC during the year. ECGC was having 23%
Proportional reinsurance which includes 10% Quota share with GIC of India Ltd and
1% each with New India Assurance, Oriental Insurance, and United India insurance.
The Corporation has declared and paid dividend of Rs. 54.00 crores for the year 2011-12 as compared to Rs. 26.10 crores dividend paid during the previous year.
Given the economic meltdown and recession world over which affected the
export trade and resulted in increased incidence of defaults & claim, the Corporation
extended full support to bankers and exporters by huge amount of claim settlement,
without leaving an adverse impact on its balance sheet.
****

168

169

170

171

172

173