B_Sc_-Zoology-2017-Syllabus.pdf - St. Xavier's College for ...
Upload
khangminh22Category
view
2download
0


YOUTHINK2022 | Vol. XVI
XAVIER’S COMMERCE SOCIETY
RECKONING
ISSN : 2347-6222

MESSAGES 04
EDITORIAL 08
FEATURE
SPACs: IPO Buster or Reverse Merger Evolution? 09Aniruddha Sureka
To Be or Not to Be? 15Sankalp Ghosh
The Paradigm of Change Inflicted upon 24the Art Market through Non-Funglible TokensAnant Kedia and Reet Nahata
An Overview of Consumer Behaviour towards 29Casual-Dine Restaurants and its Influencing FactorsSoham Chakraborty
INTERVIEWS
MR. ABHINAV BINDRA 37
MR. ANAND GROVER 41
DR. ANIL KAKODKAR 46
MR. BOMAN IRANI 52
MS. DUTEE CHAND 61
MR. KARAN THAPAR 66
MR. MANISH MALHOTRA 69
MR. MONTEK SINGH AHLUWALIA 72
MS. USHA UTHUP 75
GUEST ARTICLES
What Critics of Insolvency and Bankruptcy 81Code Get Wrong about the Recovery Model?Dr. Hemant Kumar Manuj
Investing in a Win-Win Association: 85Family Businesses and the Start-Up EcosystemDr. Tulsi Jayakumar
Growing Inequality and Why is it of Concern? 88Dr. Nisigandha Bhuyan
BEYOND
A Study on Behavioural Finance in Investment 92Decisions of Investors and Financial Market Prof. Soumi Bhattacharya and Varnika Lohia
Effects of Branding and Sales Promotion on Indian 100Consumer Buying Behaviour: An Explorative StudyDr. Sumana Guha and Kabir Raj Arora
Actualizing a Relationship Model between 107Anthropomorphic Communication and Product EvaluationSamuel S Mitra
‘Do Not Mind That You Are Taken’ - A Case Study 113on the Hostile Takeover of Mindtree by Larsen & Toubro Prof. Saptarshi Ray and Sumedha Banerjee
CONTENTS
Published by the Department of Commerce, St. Xavier’s College (Autonomous), Kolkata. Copyright in the Journal belongs to the Department of Commerce, St. Xavier’s College (Autonomous), Kolkata. Copyright in individual articles belongs to the authors who have asserted their moral rights ©2022. No part of this publication may be reproduced or transmitted in any form without the prior written permission of the publishers.Information contained in this journal has been obtained from sources believed to be reliable. However, neither the Department of Commerce, St. Xavier’s College (Autonomous), Kolkata nor its contributors guarantee the accuracy of or completeness of any information published here, and shall not be held for any errors or omissions.
Printed at The Cybernetics
Youthink is a free-distribution journal. NOT FOR SALE.Feedback and suggestions are welcome at:[email protected]
CREDITSPATRONRev. Dr. Dominic Savio, SJ – Principal.
EDITORIAL ADVISORY BOARDRev. Fr. Joseph Kulandai, SJ – Vice Principal, Dept. of Commerce (Morning).Rev. Fr. Peter Arockiam, SJ – Vice Principal, Dept. of Commerce (Evening).Dr. Amitava Roy – Dean, Dept. of Commerce (Morning).Dr. Soheli Ghose – Dean, Dept. of Commerce (Evening).
EDITORIAL AND REVIEWER BOARD (STAFF)Dr. Partha Pratim Ghosh, Dr. Atish Prosad Mondal, Dr. Amitava Roy, Dr. Saswati Chaudhuri, Dr. Shivaji Banerjee, Dr. Samrat Roy, Prof. Soumi Bhattacharya, Dr. Arup Kumar Mitra, Dr. Sourav Tarafder, Dr. Madhu Agnihotri, Dr. Debanjana Dey, Prof. Saptarshi Ray, Dr. Jayita Bit, Dr. Soma Nath, Prof. Souvik Sircar, Prof. Rinita Das, Prof. Saradia Dutta, Prof. Chandrima Banerjee, Prof. Koushik Chatterjee, Prof. Ramit Roy, Prof. Shaunak Roy, Dr. Tapalina Bhattasali, Dr. Tuhina Manna, Dr. Soheli Ghose, Dr. Sreemoyee Guha Roy, Dr. Anulekha Banerjee, Dr. Sanjib Kumar Basu.
Dr. Vaneeta Patnaik (WNUJS), Dr. Anjan Ghosh (Indian Institute of Engineering Science and Technology, Shibpur), Dr. Mohua Banerjee (IMI, Kolkata), Dr. Kumarjit Mandal (Department of Economics, CU), Dr. Sanjay Mukherjee (IIM, Shillong), Dr. Bibek Raychowdhury (Indian Institute of Foreign Trade), Prof. Arabinda Bhattacharya (Department of Business Management, CU), Dr. Ananda Mohan Pal (Department of Business Management, CU), Mr. Malay Mitra (Tata Consultancy Services, Kolkata), Dr. Debrupa Pal (Narula Institute of Technology, Kolkata), Dr. Sunil Karforma (Burdwan University, Burdwan).
EDITORIAL BOARD (STUDENTS)Anjali Dugar, Meghan Ann D’Souza, Muskan Jain, Pratham Mittal, Ronit Sanghai, Vanessa Chung, Yash Sanghvi.
MANAGING EDITORDr. Sumona Ghosh.
JOINT EDITORS-IN-CHIEFAleya Ghosh and Saksham Dalmia.
FINANCE COMMITTEEAaron Gerard Daniel, Aayushi Maskara, Abhimanyu Kakrania, Aleya Ghosh, Aniket Poddar, Aniruddha Sureka, Anjali Dugar, Arihant Jain, Ayush Mehra, Ayush Tharad, Bhagwan Parnani, Diksha Gulgulia, Esheta Rathi, Giraj Agarwal, Iccha Kankani, Ishika Poddar, Ishprit Singh Batra, Keshav Harlalka, Madhav Poddar, Manavi Agarwal, Megh Gupta, Meghan Ann D’Souza, Muskan Jain, Naman Agarwal, Nikhil Kumar Agarwal, Nimisha Bothra, Pranay Mukherjee, Pratham Mittal, Raj Kabra, Reet Nahata, Ronit Sanghai, Roshani Toshniwal, Saksham Dalmia, Shinjini Sengupta, Tanisha Shah, Vanessa Chung, Vasisth K Bafna, Veer Mundhara, Vidhi Saraogi, Vishal Mishra, Wajiha Tuz Zehra, Yash Haralalka, Yash Sanghvi.
YOUTHINK l 2022 l Vol. XVI

An Analytical Study of Investments: 123With an Empahsis on IPOsProf. Ruby Mary Notts and Garima Khanna
Paradox of Indian Financial Mechanism 130Rev. Fr. Joseph Kulandai, SJ and Suraj Dhanawat
The Progression and Integration of 141Genome Sequencing in IndiaProf. Arpita Dey and Ishika Gupta
A Study on the Application of Behavioural 150Finance in Analyzing Investor BehaviourProf. Saptarshi Ray and Ruchika Chandak
Investigating the Determinants of Stress 162among Teachers of Christian SchoolsRev. Fr. Joseph Kulandai, SJ
Exploring the Determinants of 168Workplace Spirituality among Teachers of Jesuit Schools: Insights from KolkataRev. Fr. Peter Arockiam, SJ
ASCENT
An Exploration of the Copious Factors 173Affecting Investment Decisions among Indian Individual InvestorsDr. Joyita Banerji and Tanay Goel
Growth Prospects of Electric Vehicles in India 181Prof. Sourav Das and Jahnvi Bayanwala
A Study on the EdTech Industry: 188The Future of EducationProf. Hanzala Awais and Aarushi Saraf
Unified Payments Interface (UPI): 201The Game ChangerDr. Sreemoyee Guha Roy and Murli Agarwal
Escalation of Non-Performing Assets in the Banking 210Sector Impedes Growth and Prosperity of that Sector and the Overall Economy: An Analytical Study Dr. Sumana Guha and Anirudh Shah
Tea Industry in India - Study on Goodricke, 218Gillanders Arbuthnot and Company Limited, Mcleod Russel, Jayshree Tea and Industries Limited and Bengal Tea and Fabrics LimitedDr. Tuhina Manna and Yashish Doshi
Examining the Relation between Productivity 229and Working Hours in the Education Sector Prof. Aparajita Hembrom and Marissa Anne Sum
An Empirical Approach to the Potential 235Valuation of LICDr. Joyita Banerji and Ashutosh Jaiswal
India under Pandemic: A Study on Factors 241Influencing Purchasing Decisions of BicycleDr. Arijit Ghosh and Harsh Prakash Nahata
Performance of Banks in Disbursement and 248Recovery of Agricultural Credit: A Comparative AnalysisProf. Shirsendu Roychowdhury and Dattatreya Dutta
PROJECTS
Cognitive Analysis of the Elusive Retail Investment: 258An Empirical Study Based in IndiaDr. Soma Nath and Aditi Pareek
Consumer Behaviour Towards a Cashless Economy 270in India - Special Reference to KolkataDr. Madhu Agnihotri and Rohit Patwari
The Sensory Customer - A Study on the General 279Awareness of Sensory Marketing in Cafes and Restaurants in KolkataDr. Tridib Sengupta and Krish Madhogaria
Impact of Minimalistic Advertising on 285Consumer Behaviour and Brand PerceptionProf. Aparajita Hembrom and Avani Mohta
Electronic Overload: Is Your Screen Time 298Affecting Your Mental Health?Prof. Arpita Dey and Ansu Bagri
A Study on How Social Media Affects 307the Behaviour of the ConsumersDr. Sourav Tarafder and Dewans Gopalka
Changing Nature of Consumer Behàviour Reshapes 318
Retail Garment Shops: A Study Based in BiharProf. Santa Ghosal and Mahima Kumari
A Study on the Nature of Environmental Kuznets 327Curve in the Context of Four East Indian States for the Period 2013-2019 Prof. Shirsendu Roychowdhury and Avinaba Sarkar
Deglobalization and its Impact on Indian Economy 335Prof. Anirban Ghosal and Ankit Kumar Singh
PROFESSOR’S DESK
Talent Analytics: A Game Changer for 342OrganizationsDr. Tapalina Bhattasali
Whether Competitor Collaboration During 348Pandemic Amounts to Anti-Competitive Conduct under the India Competition LawProf. Oyndrila Ganguly
Role of Communication Language in Business 355Dr. Madhu Agarwal Agnihotri and Prof. Arkajyoti Pandit
LOOKING BACK 362
TRIBUTE 365
FUN SECTION 367
ADVERTISEMENTS 368

Message | PRINCIPAL
It is every student's
introspection of
one’s mortal self
that serves as a
source to the
highest form of
experiential
learning, thus
serving the
purpose of
evolution, spiritual
conditioning and
unprejudiced
awakening.
“Tradition is not the worship of ashes but the preservation of fire."
St. Xavier’s College (Autonomous), Kolkata has always believed in and stood for the enhancement and development of each and every individual involved with the institution. Being a frontier that is aimed at making education a pathway to success, it continues its pursuit in moulding each student’s destiny by unravelling their latent potential. Since its inception, it has always been devoted to excellence within and beyond the classroom. It is this practical worldview, imparted by an array of extracurricular activities, that shapes Xaverians into well-rounded personalities with foresight and compassion, which are vital in achieving their aspirations.
As the representative body of the Department of Commerce, the Xavier’s Commerce Society has been the touchstone of excellence and expertise. In constant pursuit of its motto of Dreams, Development and Destiny, the society has expanded its horizons to give everyone a chance to enhance, grow and evolve. Youthink Volume XVI is the foremost representation of its commitment towards intellectual discourse, novel ideas, and progressive solutions to multi-faceted societal problems.
I commend the editorial board for choosing Reckoning as the theme, thus bearing testimony to its eminence as the highest form of truth. To be able to anticipate the reverberations of one’s endeavours is a unique distinction possessed by a few. Here, at St. Xavier’s College (Autonomous), Kolkata, it is every student's introspection of one’s mortal self that serves as a source to the highest form of experiential learning, thus serving the purpose of evolution, spiritual conditioning and unprejudiced awakening. The hard work of everyone associated with this edition, which has culminated into such insightful articles, strengthens my conviction that the sixteenth edition will be reckoned with for ages to come.
The sixteenth edition of Youthink is the culmination of the efforts, aptitude and acuity of all those who have, in any manner, been associated with it. Youthink would not have been able to uphold its legacy without the tireless support of Rev. Fr. Joseph Kulandai SJ, Vice Principal, Department of Commerce (Morning) and Rev. Fr. Peter Arockiam SJ, Vice Principal, Department of Commerce (Evening), along with the priceless guidance of Dr. Amitava Roy, Dean, Department of Commerce (Morning) and Dr. Soheli Ghose, Dean, Department of Commerce (Evening). I would like to express my gratitude to the professors who constituted the reviewer board for their advice and support. I sincerely applaud the Professor-in-Charge, Prof. Shaunak Roy, the Managing Editor, Dr. Sumona Ghosh, the Editorial Board of Youthink and the student body of the Xavier’s Commerce Society. Lastly, to all those who contributed and added value to the journal, their insightful work will inspire generations. I wish the team of Youthink Volume XVI the very best as it adds another, very riveting chapter, to this impeccable legacy.
Rev. Dr. Dominic Savio, SJ
St. Xavier’s College (Autonomous), Kolkata
Rev. Dr. Dominic Savio, SJPrincipal
YOUTHINK l 2022 l Vol. XVI 4

Message | VICE PRINCIPAL (DEPARTMENT OF COMMERCE, MORNING)
When this journey
of life ends, it is
this change that
one looks back
upon, embracing
the indiscretions
and transgressions
finally laid bare,
which induces one
to reckon the
purpose which
gives life its
meaning.
The world often demands a change in the age-old perceptions that confine its progress. The necessity of this change arises from the fact that these perceptions, if given a chance to thrive, can prove to be a deterrent to required evolution and reform. It takes courage, vision and allegiance towards the greater good to bring about this revolution. When one moves forward on this journey, they imprint a legacy with the hope that it would act as a beacon for generations to follow. And when this journey of life ends, it is this change that one looks back upon, embracing the indiscretions and transgressions finally laid bare, which induces one to reckon the purpose which gives life its meaning.
St. Xavier’s College (Autonomous), Kolkata has established itself as a premier institute for fostering a passionate pursuit for academic and intellectual excellence, promoting the strong commitment of character towards society and inspiring inventiveness in all endeavours. We have always encouraged our students to strive for excellence and to work relentlessly to bring about the required change in our society. We aim to instill a sense of competence, compassion, resilience and responsibility in our students, by providing them with a platform full of diversified opportunities to explore new possibilities. The Xavier’s Commerce Society has constantly motivated students to capitalize on their skills and employ them beyond the walls of the classroom. This very essence has been highlighted in their endeavour, Youthink, which allows students and experts to undertake the initiative of voicing their views by traversing different spheres of the corporate world like finance, entrepreneurship, global affairs, economy, et al.
I would like to commend the Youthink Editorial Board for throwing light on an indispensable truth and giving prominence to an important aspect of existence through their theme. Motivating students to embrace the unorthodox, Youthink envisions to stimulate innovation and ingenuity in students, encouraging them to reach new standards. I would like to express my appreciation for all the professors and guests whose insights add indispensable value to this journal.
The launch of the sixteenth edition of Youthink bears testimony to the hard work and dedication of the students of the Xavier’s Commerce Society, who perpetually strive towards redefining the impossible by surpassing impediments and setting new benchmarks for themselves. They have continued to develop as individuals who persevere to uphold the pillars of leadership and responsibility.
I wish Youthink Volume XVI the very best as it inspires students to delve deep into themselves and transcend conventional perceptions, while aspiring to achieve their ambitions. It gives me immense pride and satisfaction to congratulate the Editorial Board for publishing a journal that is reflective of the true spirit of a Xaverian and upholds the values of St. Xavier’s College (Autonomous), Kolkata.
May God bless you!
Rev. Fr. Joseph Kulandai, SJ
St. Xavier’s College (Autonomous), Kolkata
Rev. Fr. Joseph Kulandai, SJVice Principal (Morning)
YOUTHINK l 2022 l Vol. XVI 5

Message | VICE PRINCIPAL ( OF COMMERCE, EVENING)DEPARTMENT
The rationale
behind all
evolution lies in
the resolve to
persevere and
break all barriers,
empower what’s
ahead, and
accomplish what’s
invaluable.
Evolution has been the cornerstone of development for the world, the origin of which lies in the resolution and persistence of humankind to transcend the odds and discover what lies ahead. The never-ending quest for knowledge and the will to explore new possibilities has ignited the determination to discover, control and conquer. The rationale behind all evolution lies in the resolve to persevere and break all barriers, empower what’s ahead, and accomplish what’s invaluable. Holding on to our values while also embracing change is the essence of effective education, and Youthink captures the spirit of evolution and blends it into a paradigm of wisdom and proficiency.
The Xavier’s Commerce Society sets an exemplary archetype of how consistency, combined with undeterred diligence, gives way to unimaginable accomplishments, expanding horizons, and transforming oneself by obtaining unparalleled experiences. Their vision is to provide the students of St. Xavier’s College, a platform to express their opinions on vital matters by presenting well-researched articles that shape readers’ perspectives and shed light on new topics, thus bringing about a positive change in the society. The journal displays the power of knowledge, which directs the readers towards a more developed outlook and brings about a more practical transformation of distinct domains based on facts and thesis.
The sixteenth edition of Youthink, ‘Reckoning’, is the rightful successor to 'Allegiance' and transcends the legacy that has been bestowed upon it over the years. Each of the articles which constitutes this volume is a representation of the exemplary cognitive abilities of the contributors, which have facilitated them in bringing forward novel ideas and poignant opinions. These articles seek to add value for the readers on matters that hold significance in the modern geopolitical era. The varied, and even contrarian opinions presented in the journal, would shape public discourse and lead to the betterment of the society.
As Youthink continues to represent a culmination of diverse thoughts, I am delighted to see the sixteenth edition of the annual journal uphold the principles that the Xavier's Commerce Society strives to live by. The society has been the flag bearer and stalwart in providing the students with a variety of experiences, thus enabling their holistic growth. With the impressive interviews from luminaries and a wide range of articles, Youthink has been able to create an indelible impact on the minds of the readers. I would extend my warmest gratitude to everyone who has been associated with this journal and hope that it has been an enriching experience for all those involved.
May all your valuable inputs bring desired outcomes. God bless you all!
Rev. Fr. Peter Arockiam, SJ
St. Xavier’s College (Autonomous), Kolkata
Rev. Fr. Peter Arockiam, SJVice Principal (Evening)
YOUTHINK l 2022 l Vol. XVI 6

Message | MANAGING EDITOR
The legacy of an
empire which
has been created
by the
predecessors,
sets the tone and
acts as a
foundational
stone for the
generations to
come.
"Truth is truth to the end of reckoning."
Legacy is fundamental to what it is to be human and giving and receiving of the same can evoke, all at once, the entire spectrum of basic human emotions. The legacy of an empire which has been created by the predecessors, sets the tone and acts as a foundational stone for the generations to come. Allegiance, conviction, transcendence and resilience are the core pillars of an institution's ability to prosper and flourish. As one treads on the path of victory, he confronts hurdles, ambiguity and paradoxes. During such turbulent times, when there is a conflict raging between ethics - which guide one's actions, and consciousness - which arises from one's intellect, reckoning plays a quintessential role in aiding mankind to combat uncertainty in pursuit of nobility. Reckoning, like a mirror, reveals one's true identity, imparting us with the power of righteousness, to liberate us from the constraints of oblivion and indecision. The roots of excellence and enlightenment, engraved within Youthink, continually strive to surpass the conventional and establish a fruitful learning experience for all its readers.
In the journey of introspection, it is important for one to embrace the truth, because only when one reckons with themselves, will they uncover their true purpose of life, which will act as a source of guidance in their future endeavours.
Youthink is an initiative that gives a framework for students at the institution as well as many other educators throughout the country to share their opinions on thought-provoking instances. It provides an individual with the opportunity to shed light on current world developments, with the aim of providing valuable knowledge. It encapsulates the generation's values and their desire to become leaders of a better world. True success is based on holistic development, in which the youth can take advantage of the opportunities presented to them, and Youthink has continually proven to be the ideal platform for it.
As we unveil Youthink Volume XVI, I would like to express my deepest gratitude to the faculty and administration for their essential expertise and enduring commitment, which has been the catalyst for our advancement, year after year. I admire the diligence of the Joint Editors-In-Chief, Aleya Ghosh and Saksham Dalmia, and the entire Editorial Board of the sixteenth edition for consistently pushing the boundaries and setting new benchmarks with each passing year.
Youthink Volume XVI: Reckoning would not have seen its fruition if it had not been for the unwavering support of Rev. Dr. Dominic Savio, Principal, the constant supervision of Rev. Fr. Joseph Kulandai, SJ, Vice Principal, Department of Commerce (Morning) and Rev. Fr. Peter Arockiam, SJ, Vice Principal, Department of Commerce (Evening) and the constant encouragement from Dr. Amitava Roy, Dean, Department of Commerce (Morning). I would also like to thank Dr. Soheli Ghose, Dean, Department of Commerce (Evening), for her guidance.
The first morning of creation writes what the last day of reckoning shall read. With immense credence and belief in my heart, I proudly present to you the sixteenth edition of Youthink.
Dr. Sumona Ghosh
Youthink Volume XVI
Dr. Sumona GhoshManaging Editor
YOUTHINK l 2022 l Vol. XVI 7

Message | JOINT EDITORS
For every high
there is a low,
for every
victory there is
a defeat and for
every action,
there is a
reckoning.
“You cannot disown what is yours. Flung out, there is always the return, the revenge, perhaps the reconciliation. There is always the reckoning.”
For every high there is a low, for every victory there is a defeat and for every action, there is a reckoning. As was rightly said, ‘With great power there must also come great responsibility’ and while our deeds and beliefs may differ, we have to face the truth all the same. Whether that truth stems from a legacy bygone, or our own decisions, we must have the resilience to do what’s right, and achieve redemption, for that is the only way home. The very idea of reckoning is subjective; for some, it might be the endgame, and for others, it is an eternal path, where every step brings a new resolution. Yet, at the final hour, it is our allegiance to the cardinal principles - ones that we hold for ourselves, and ones that form the virtues of society. As the space-time continuum postulates, the fabric of our existence is timeless. And yet, amidst this inconceivable realm, each of us manages to be different. We owe that to our experiences, and how we reckon with them.
As the world around us evolves at an unprecedented rate, Youthink strives to be a leading ground of change as we continue to provide a platform to reflect upon these developments through novel perceptions and discourse. The sixteenth edition of Youthink seeks to transcend the scope of traditional knowledge and encourages detailed and analytical thinking, the spirit of which is shown in articles in the Feature Section, which analyze the new age financial tools and their relevance, one of the most heated issues in international geopolitics and the effects of consumer behaviour to a business. The Beyond, Ascent and Projects Sections highlight Xaverian’s along with their professor guides, wherein they critically examine a host of topics across various disciplines. These include in-depth exploration of the market transformations and the applications of behavioural finance, the implications of recent economic policies as well as the way forward, and the metamorphosis of the education industry.
The Professor's Desk section puts forth ingenious observations and highlights the varied dynamics of the corporate world, both within the organization and outside with articles on topics like Talent Analytics, Competitor Collaboration and the Competition Law, as well as the Role of Communication Language in Business. We are also grateful to have insightful Guest Articles from Dr. Hemant Kumar Manuj, Associate Professor in Finance, SPJIMR, Dr. Tulsi Jayakumar, Professor of Economics at SPJIMR, and Dr. Nisigandha Bhuyan, Associate Professor at IIM(C).
Every year, the 'Interviews' section of the journal immerses the reader in the enthralling world of many revered luminaries from around the world. This year, we bring forth the interviews of nine exceptional personalities from diverse domains - Mr. Abhinav Bindra, Mr. Anand Grover, Dr. Anil Kakodkar, Mr. Boman Irani, Ms. Dutee Chand, Mr. Karan Thapar, Mr. Manish Malhotra, Mr. Montek Singh Ahluwalia and Ms. Usha Uthup.
We would like to express our heartfelt gratitude to Rev. Dr. Dominic Savio, SJ, Principal, Rev. Fr. Joseph Kulandai, SJ, Vice-Principal, Department of Commerce (Morning), and Rev. Fr. Peter Arockiam, SJ, Vice-Principal, Department of Commerce (Evening), for their sustained encouragement and blessings. We are grateful to Dr. Amitava Roy, Dean, Department of Commerce (Morning), and Dr. Soheli Ghose, Dean, Department of Commerce (Evening), for their constant support in our endeavours.
Our Managing Editor, Dr. Sumona Ghosh, has been a constant source of motivation and reassurance, without whom this journey would not have been possible. We would also like to express our gratitude towards the Editorial Board comprising Anjali Dugar, Meghan Ann D'Souza, Muskan Jain, Pratham Mittal, Ronit Sanghai, Vanessa Chung and Yash Sanghvi.
Finally, we would like to thank the students of St. Xavier's College for their continued support as readers and contributors towards Youthink.
Welcome to Youthink Volume XVI: Reckoning.
Aleya Ghosh
Youthink Volume XVI
Aleya Ghosh and Saksham DalmiaJoint Editors-in-Chief
YOUTHINK l 2022 l Vol. XVI 8
Saksham Dalmia

FEATURE
YOUTHINK l 2022 l Vol. XVI9
SPACs: IPO Buster or Reverse Merger Evolution?Aniruddha SurekaDepartment of Commerce (Morning)
In a world where
financial disasters
have a cascading
effect on global
economies,
removing this
systemic risk is
what the
centralized
authorities should
focus on.
ABSTRACT
Special Purpose Acquisition Companies (SPACs) are blank cheque
companies that raise money from investors for the sole purpose of acquiring
an operational company. Though SPACs have been around for decades, the
financial manoeuvre has gained traction over the last few years. Although
some call it an evolution to the reverse merger, its usage guidelines are still not
very clear, and the regulatory bodies are rampantly working on it. Investors
completely bank on the management and founders, and even though
generating post-merger returns is highly unlikely, redeeming shares pre-
merger can generate decent returns for them. In this article, we find out the
boom and bust of the reverse mergers, reckon how they planted the seeds of
their own demise and figure out why SPACs have overcome all regulatory
hurdles to surpass the book-building process to become a more prevalent
process. We also analyze whether SPACs is a new-age financial bubble, or
will it sustain its operations over the years to come.
KEYWORDS: Company, Public, Merger, Investors, Shares, Investment
Banks.
WHAT IS A SPAC?
Special Purpose Acquisition Company (SPAC) has disrupted the traditional
book-building IPO process, which private companies used, to go public. So,
what are these companies? They are shell companies that have no
commercial operations, and which go public through a regular IPO process.
They have 24 months to acquire or merge with a fully operational company.
STRUCTURAL AND OPERATIONAL COMPOSITION OF SPACs
When going public, SPACs hire investment banking firms to underwrite their
issue of common stocks and warrants. The process is a lot easier and faster

SPACs: IPO Buster or Reverse Merger Evolution?FEATURE
YOUTHINK l 2022 l Vol. XVI 10
than that of a traditional Initial Public Offering (IPO)
since the bankers do not need to value the company or
carry out due diligence. Usually, a SPAC is listed at $10
per share. This $10 per share pricing has no underlying
value and is a hypothetical figure.
Big-ticket investors, industry veterans, and celebrities
are the ones who typically form a SPAC. Those involved
in the formation of a SPAC are called the 'sponsors'.
They also receive 20 per cent of the shares of the SPAC
as a fee called a ‘promote’ or ‘founder shares’ at a
heavily discounted price.
The sponsors then go on a roadshow to find investors
who are willing to invest in the company. Empirically,
close to 85 per cent of the company’s equity paid-up
capital is purchased by institutional and anchor
investors. The remaining stake is diluted in a public
issue that lists the SPAC on the bourses. Similar to the
Draft Red Herring Prospectus issued by companies
during an IPO, the SPAC management team also files a
prospectus. However, this prospectus does not contain
any financial or company statistics rather just the vision
and the acquisition plan of the management team.
Hence, when retail investors are subscribing to the
issue, they are essentially betting on the company’s
management rather than the company. Figure 1 gives a
brief overview of how a SPAC is formed and wounded
up.
WHAT MAKES SPACs SO SPECIAL?
IPO is not the only process that has been prevalent over
the years as a means for private companies to go public.
A few companies have also gone public through Direct
Listing and Reverse Merger. Companies that do not
want to dilute their existing shares and do not have the
financial strength to hire underwriters are the ones that
usually raise capital through a direct listing. While in a
reverse merger a private company acquires a publicly
listed company. In a way, SPACs are an evolution to the
reverse merger process of going public.
What is common in all the methods of raising capital is
high regulatory compliance and legal scrutiny that
makes the process very lengthy. Moreover, these
companies are under-priced by the investment banks.
This typically means that the companies are leaving
money on the table. The three major reasons for this
are:
Investment Bankers’ Monopoly: Since investment
bankers have a monopoly over underwriting shares,
they under-price the shares. Investment bankers are
Figure 1: Structure of a SPAC (Source: aswathdamodaran.blogspot.com)

FEATURESPACs: IPO Buster or Reverse Merger Evolution?
YOUTHINK l 2022 l Vol. XVI11
obligated to guarantee a certain number of shares, this
means if any outstanding number of shares go
unsubscribed it stays in the books of the investment
bank thus blocking their capital.
Information Asymmetry: Huge information
asymmetry exists during an IPO. The investors are
buying into a relatively unknown business. Even though
there are disclosure requirements that the companies
have to adhere to, there remains a huge information
asymmetry.
Insider-Outsider Theory: This theory assumes that
under-pricing is the best strategy given the asymmetry. If
the shares are under-priced, the insiders will buy them
because they know it’s true. The outsiders will buy
assuming it to be the fair value. Hence, when the shares
rise to match their fair valuation both parties gain from
it.
The growing redundancy, increased costs, and high
regulatory scrutiny are a few things that have inculcated
a question of whether it is the right way of raising
interest-free capital. This is where the SPAC
phenomenon has risen. Now, SPACs have been in
existence since the late 80s and early 90s.
Predominantly, the reverse merger method was more
prevalent in the 1990s where they saw a steep rise in
the number. They were then outgrown to their
existence due to larger market participation,
overheated markets, and more scrutiny from the
Securities and Exchange Commission, planting the
seeds of its own demise. Since then, one may find very
few reverse mergers or SPAC deals taking place.
However, in 2019, SPAC dealings saw a huge rise. More
than 50 per cent of the companies went public through
SPAC deals. In 2020, there were around 254 filings that
rose close to $74 billion. Up until now, in 2021, there
have been 359 SPAC filings garnering a combined $95
billion. As seen in Figure 2, out of the 254 filings that
were placed in 2020, 65 stood completed and 13
pending. However, quarter two of 2021 alone has seen
61 completed SPAC mergers and
153 pending SPAC deals.
HOW DOES A SPAC
ACQUISITION TAKE PLACE?
Though SPACs have been around
for decades, the f inancial
manoeuvre has gained traction
over the last year - with high-
profile investors such as Bill
Ackman’s Pershing Square Tontine
H o l d i n g s L t d . , C h a m a t h
Palihapitiya’s Social Capital
Hedosophesia Holdings Corp.
raising billions of dollars from
investors. Buzzfeed, Taboola,
23andMe are a few companies
that have gone public through this
process.
The money raised from the IPO is put in a blind trust
where it is further invested in interest-bearing risk-free
short to medium term investment vehicles. The
shareholders can redeem their shares until the
acquisition is finalized. After the SPAC has been
established, the management team goes on a hunt for
target companies. There are no restrictions on the type
of 'target company', although many founders highlight
their target industry in the prospectus. Once a company
has been identified, a letter of intent is issued to the
shareholders stating the terms of the deal. The
Figure 2: Growth of SPACs over the Past Five Years
(Source: cbinsights.com)
SPACs: IPO Buster or Reverse Merger Evolution?FEATURE
YOUTHINK l 2022 l Vol. XVI 12
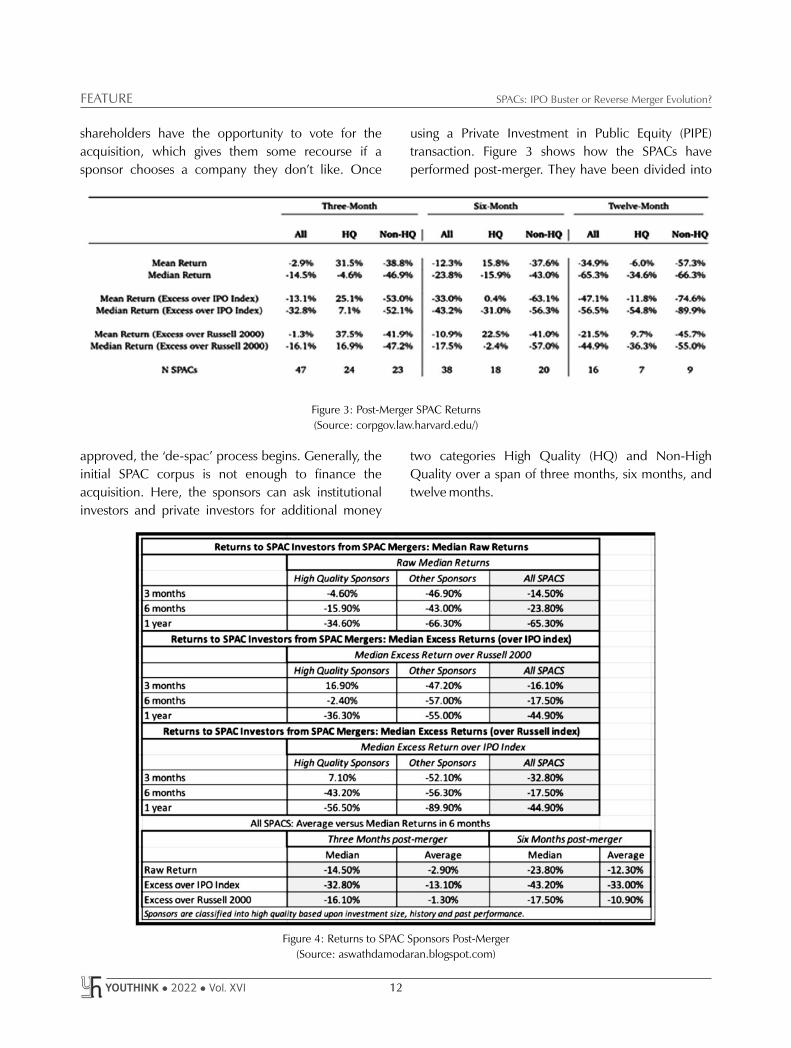
shareholders have the opportunity to vote for the
acquisition, which gives them some recourse if a
sponsor chooses a company they don’t like. Once
approved, the ‘de-spac’ process begins. Generally, the
initial SPAC corpus is not enough to finance the
acquisition. Here, the sponsors can ask institutional
investors and private investors for additional money
using a Private Investment in Public Equity (PIPE)
transaction. Figure 3 shows how the SPACs have
performed post-merger. They have been divided into
two categories High Quality (HQ) and Non-High
Quality over a span of three months, six months, and
twelve months.
Figure 3: Post-Merger SPAC Returns
(Source: corpgov.law.harvard.edu/)
Figure 4: Returns to SPAC Sponsors Post-Merger
(Source: aswathdamodaran.blogspot.com)

FEATURESPACs: IPO Buster or Reverse Merger Evolution?
YOUTHINK l 2022 l Vol. XVI13
The shares are redeemable at the time the merger is
proposed. So if SPAC investors don’t like a proposed
merger, they get back their full investment plus a very
high return. At the time of offering shares to potential
investors, SPAC founders offer a very high rate of return
to attract investors to subscribe to their issue. This rate of
interest becomes a selling point for the shareholders.
Most shareholders make an exit to their investment at
the time the merger is proposed to book profits that
would otherwise be uncertain post-merger. The
primary source of poor post-merger performance is
dilution built into the circuitous two-year route they
take to bring a company public. Along the way of
finding a target, SPACs give shares, warrants, and rights
to parties that do not contribute cash to the merger. This
includes the sponsors and other interested third parties.
When the merger is proposed, the sponsors offer shares
and warrants to Private Investors (PIPE) to fund the
merger. While the existing shareholders have pre-
emptive rights to keep their stakes in the company
intact by infusing more capital, empirically most
shareholders have already backed out. Hence, even
though the price of each share is purportedly worth
$10, there is approximately $6.67 in cash and $3.33 in
dilution overhanging in the merger. This cost is
ultimately borne by the shareholders. If the merger goes
successful, the sponsors are the biggest winners.
Figure 4 shows median returns and median excess
returns over Russell 2000 that the sponsors generate.
SCOPE IN INDIA
Blank-cheque companies have gained huge traction
globally in recent years. However, its prevalence in
India remains questionable as Indian laws prevent it
from being operational. For instance, the company law
states that any company that does not have an
operational business within a year of its incorporation is
under the law required to be wound up. Moreover,
according to the Securities and Exchange Board of India
Act, only companies with at least 300 million in net
tangible assets and 150 million of pre-tax profit can be
listed on the Indian Stock Exchange. Therefore, until
amendments are made to the various acts governing the
investment and company incorporation process, the
likeness of SPACs being a way to go public remains
sceptical. Since these companies have gained so much
traction, more and more start-ups are considering this
route of going public by listing in the overseas markets.
Hence, there has been an emerging requirement for
regulated SPACs in India as well, to facilitate and ease
the listing of start-ups. Else, they may seek the foreign
route for a public listing, making India a hub for
subsidiaries rather than start-ups. On the other hand,
we can have a separate Act to govern the
implementation of SPACs in India so as to facilitate the
establishment of this structure in the future.
DOES A SPAC BUBBLE EXIST?
Currently, it is difficult to identify whether or not a SPAC
bubble exists. For the time being, the procedure
appears to be legitimate. The companies are going
public, no fraudulent instances have been discovered,
and the entire system is running smoothly. In terms of
structure, there are still a lot of unsolved problems that
the Securities and Exchange Commission needs to
address. But given that it is a relatively new concept with
limited economic impact, the chances of it becoming a
bubble are slim, at least for the time being.
BRINGING IT ALL TOGETHER: RECKONING THE
VIABILITY OF BLANK-CHEQUE COMPANIES
As we near the end of our discussion on SPACs, I would
like to state the obvious - change is inevitable, the IPO
process has been prevalent for as long as financial
systems have aggregated towards investor protection.
However, they are starting to become obsolete for
investors. In a world where financial disasters have a
cascading effect on global economies, removing this
systemic risk is what the centralized authorities should
focus on. SPACs are just the beginning of a more
decentralized system of doing things. The markets have
been heated since September 2020, after the world
partially recovered from the pandemic. That was one of
the reasons SPACs found so much limelight. The long-
drawn overhaul of blank cheque companies stands
corrected to supersede the book-building process. The
need is to generalize them and launch a systematic
framework for their functioning.

SPACs: IPO Buster or Reverse Merger Evolution?FEATURE
YOUTHINK l 2022 l Vol. XVI 14
REFERENCES
1. https://www.policyholder.gov.in/Indian_Insurance_1.
https://www.nytimes.com/2021/08/30/business/dealbook/s
pac-lawsuits.html
2. https://www.cbinsights.com/research/report/what-is-a-spac/
3. http://aswathdamodaran.blogspot.com/2021/06/the-rise-
of-spacs-ipo-disruptors-or.html
4. h t t p s : / /www. sec . gov /o i ea / i n ve s t o r - a l e r t s - and -
bulletins/what-you-need-know-about-spacs-investor-
bulletin
5. https://www.mossadams.com/articles/2021/05/tax-issues-
and-considerations-for-spacs
6. https://www.reuters.com/business/exclusive-us-sec-
focuses-bank-fee-conflicts-it-steps-up-spac-inquiry-
sources-2021-0713/#:~:text=SPAC%20sponsors%20
typically%20pay%20banks,upon%20completion%20of%2
0the%20merger.
7. https://hbr.org/2021/02/the-spac-bubble-is-about-to-burst
8. https://corpgov.law.harvard.edu/2020/11/19/a-sober-look-
at-spacs/
9. https://www.managementstudyguide.com/why-do-ipos-
get-underpriced.htm
10. https: / /www.thehindubusiness l ine.com/business -
l aws / r egu l a to r y - cha l l enge s - fo r - spac s - i n - ind i a /
article34124252.ece
11. https://www.spglobal.com/marketintelligence/en/news-
insights/latest-news-headlines/tech-and-spacs-sec-
regulation-could-result-in-fewer-but-better-spacs-
64000801
12. https://www.investopedia.com/terms/s/spac.asp
13. https://ecgi.global/sites/default/files/working_papers/
documents/klausnerohlroggeruanfinal.pdf

FEATURE
YOUTHINK l 2022 l Vol. XVI15
To Be or Not to Be?
Sankalp GhoshDepartment of Commerce (Morning)
Exploited by the
colonizers,
ravaged by
slavery, divided as
per foreign
interests, and left
off when the
need dissipated -
the trail of Africa’s
history has been
pitiful.
ABSTRACT
Africa had always been considered the antithesis of civilization by the
Europeans, also referred to as 'the heart of darkness', in the words of Joseph
Conrad. Centuries of external neglect, internal strife and vested interests
have torn open gashes into this cradle of humankind. Exploited by the
colonizers, ravaged by slavery, divided as per foreign interests, and left off
when the need dissipated - the trail of Africa’s history has been pitiful.
However, the turn of the twenty-first century brought along with itself
another scramble for Africa, with the nations of the world fighting for
influence and stake in it. How did this come about and where does this lead?
Can we expect to see Africa commanding significant geopolitical influence
by this century? Or, do we see a similar trajectory just like the nineteenth
century?
KEYWORDS: Africa, Neo-Colonialism, Extremism, Debt, Vested Interests,
Corruption.
COLONIZED
During the majority of the nineteenth and twentieth centuries, Africa had
been colonized for the benefit of foreign powers. European powers
ransacked their colonies and took advantage of their mineral deposits to
further the growth of their lands, thus pushing their colonies into the nadir of
poverty. A similar trajectory followed in Africa. They divided the continent
into bizarre political regions, as per the Berlin Conference of 1884, without
taking the natives or their opinions into consideration (see Figure 1).
It was only in the mid-twentieth century, after the creation of the United
Nations, that Africa was given her independence.

To Be or Not to Be?FEATURE
YOUTHINK l 2022 l Vol. XVI 16
GEOGRAPHY
Geography can make or break a civilization. One of
Africa's major issues to this day is its unforgiving
geography. It stretches from Morocco in the north,
having a Mediterranean climate, to South Africa in the
south, experiencing Tropical climate, thereby stretching
from 37°N to 35°S latitudes. The Sahara Desert, at the
north, occupies around 31 per cent of Africa's land. The
shortage of fresh water in the heart of the continent is
another factor that has added to Africa's woes.
Furthermore, the continent possesses a variety of
climatic types, with countries sharing borders passing
through those climates (see Figure 2). This creates a lot
of problems for expansion and growth for each country
as a whole.
Asia is a good example of the contrary. Despite being
the largest continent on the planet, it faces a distinct
boundary of climatic types, each of which corresponds
to a powerful contemporary region - arid Gulf regions
became the Middle Eastern countries, polar tundra
regions became Russia, temperate grasslands became
China, the cold desert regions became Mongolia and
tropical monsoonal regions became India (see Figure 3).
Figure 1: Map of African Colonies (1913)
(Source: Wikipedia)
Figure 2: Political Map of Africa Superimposed on
the Climatic Map of Africa
(Source: Encyclopaedia Britannica, Inc.)
Figure 3: Political Map of Asia Superimposed
in the Climatic Map of Asia
(Source: Encyclopaedia Britannica, Inc.)

FEATURETo Be or Not to Be?
YOUTHINK l 2022 l Vol. XVI17
This powerplay occurs because climate influences
geography, which in turn influences the culture and
lifestyle of people. The similarity in lifestyle makes the
people of a particular region face similar problems,
strive for similar solutions to those problems, and
ultimately prosper together cohesively.
For Africa, their political boundaries overlap
haphazardly with their climatic regions, making a single
country face antipodal climatic conditions through the
expanse of their region, thus being a driving force
towards division and making uniformity in life as well as
finding solutions to problems impossible.
TERROR AND
MACHTPOLITIK
Upon taking a closer look at
Africa's ethnicities and tribes
(see Figure 4), we find
another reason for division.
After colonialism ended,
African leaders insisted upon
maintaining their colonial
political boundaries, as per
the Cairo Conference of
1 9 6 4 h e l d b y t h e
Organization of African
U n i t y, w h i c h l e d t o
i n c r e a s i n g l y d i f f i c u l t
c h a l l e n g e s f o r t h e
g o v e r n m e n t s o f t h e
countr ies . A sense of
togetherness binds people
towards a common goal,
which is something that the
African countries lack. Each
tribe wages wars with the
other, giving rise to grave
insurgencies and political
upheavals. The Sudan-South
S u d a n c o n f l i c t - a n
insurgency that amounted to the breaking up of the
Sudanese state into two, based on tribal and ethnic
divisions, is a prime example of this.
Another issue in Africa is that of extremism. Poor
management of the country's economy, lack of
development, and insurgencies coalesce together to
become the perfect breeding ground for radicalization.
An important fact to take cognizance of is the religious
identity of the African continent (see Figure 5). The
northern regions consist of Muslims, due to the
influence of the Middle East, whereas the south
primarily consists of Christians.
Figure 4: Political Map of Africa Superimposed on the Tribal Identity of the African People
(Source: Harvard University, 2002)

To Be or Not to Be?FEATURE
YOUTHINK l 2022 l Vol. XVI 18
The start of radicalization began in Northern Africa - in
Algeria, in the year 1992. The Algerian army staged a
coup to resist the Islamic Salvation Front (ISF) from
winning the country’s first democratic elections. A
faction of separatists and insurgents from the ISF came
together to take down the Algerian government. They
went southwards and took refuge in the deserts of
northern Mali, wherein they swore allegiance to the Al-
Qaeda and called themselves the Al-Qaeda in the
Islamic Maghreb (AQIM). Travelling southwards
towards Nigeria, the AQIM helped establish Boko
Haram. This Islamist radical organization had one goal -
to push forward their agenda of radicalization deep into
the African mainland. Despite being ousted from
Nigeria with French assistance, they grouped in the
nearby Lake Chad region, which is one of the poorest
regions of the world. It is a part of the Sahel, i.e., a band
of Sub-Saharan Africa stretching from the Atlantic
Ocean in the east, to the Red Sea in the west (see Figure
6). Arid, hot and humid, the people of the Sahel are the
most economically vulnerable in the world. This is
where Boko Haram radicalizes people to commit
crimes in exchange for sustenance. They are
responsible for some of the horrors that have shaken
Africa in the past - the Grand Bassam shootings which
killed several expatriates, the kidnapping of school boys
and girls and brainwashing them into becoming suicide
bombers, the Ouagadougou attacks in the French and
other European embassies, and so on.
Their ideology started spreading far and has led to the
establishment of more such groups, which include the
Ansar-ul-Islam, the Islamic Movement of Nigeria, the
Nusrat-al-Islam, and so on. The reason behind the
success of such groups in Africa is simple: ‘Faith is the
strongest in an empty stomach’.
Furthermore, politics and in-fighting amongst African
countries have deteriorated the situation. The
Figure 5: Religious Identity of Africa along with its Political Borders
(Source: PBS Learning Media)

FEATURETo Be or Not to Be?
YOUTHINK l 2022 l Vol. XVI19
Moroccan-Algerian tensions emerging from the Spanish
acquisition of Western Sahara and its subsequent
independence in 1975, the Grand Ethiopian
Renaissance Dam (GERD) and the ongoing tensions
with Egypt and Sudan concerning the White Nile, the
civil clashes between the blacks and whites of South
Africa and the border disputes between Eritrea and
Ethiopia, as well as Tanzania and Malawi, are issues that
present huge challenges to the economic development
and stability of the region, i.e., the three Trans-
Mediterranean Trade Corridors Europe plans to build
into Africa, namely, the West Africa-Western Europe
Corridor through Morocco, the East Africa-
Eastern/Central Europe Corridor through Egypt and the
Central Maghreb Corridor through Algeria.
NEO-COLONIALISM
Africa has huge deposits of natural resources, but does
not have the infrastructure to harness the power of
these resources (see Figure 7). Africa’s slower
development has made it inevitable for the
governments of the countries to resort to
overdependence on the natural resources and
agriculture to earn revenue. Other avenues of income
generation have not been discovered and utilized
simply because there has never been enough money in
the hands of the government to invest in manufacturing
and services exports. However, this has had an
overwhelmingly negative domino effect on their
economies.
Due to the overdependence of natural resource
exports, the governments have been at the mercy of
Figure 6: The Sahel Region on the African Political Map
(Source: Global Security, UNODC, BBC Somali Service)

To Be or Not to Be?FEATURE
YOUTHINK l 2022 l Vol. XVI 20
global demand-supply mechanisms to generate
competitive prices at the global markets. Ever since the
fall of prices of primary commodities in the 1970’s, the
revenue earned has been decreasing substantially.
Further, African debt has increased ten-fold in the same
time period. This has led to huge fiscal deficits and
economic instability throughout major regions of the
continent. Yet another factor in this domino is the effect
of population pressure. The countries of Africa have
witnessed a boom in population - more than what the
land could sustain. This has led to a population surge in
the cities in order to find non-farm work and thereby
provide sustenance. This has given rise to less time
being devoted to the fields and the subsequent
utilization of environmentally harmful forms of
chemicals being used in order to extract more from the
soil to earn revenues. Hence, what remains is a vicious
cycle - overdependence on agriculture leading to
excessive chemical appliance, thereby leading to
worsening soil fertility and ultimately concluding in
economic instability, which gives rise to meagre
investment in industries; necessitating over-
dependence on natural resources for revenue and
exploitation of its environment.
Several countries have established economic relations
with Africa, namely, Israel, India, China, the European
Union (EU) and the United States (U.S.). However, such
deals have always been made for vested interests of the
above-mentioned countries.
1. Israel: Benjamin Netanyahu, the ninth Prime
Minister of Israel, met with African leaders for the
first time in 50 years, promising economic help in
the form of solar and agricultural technologies, in
exchange for votes against Palestine in the UNGA.
When Senegal co-sponsored a resolution against
illegal Jewish settlements in the West Bank,
Netanyahu cancelled the Mashav Drip-Irrigation
project.
2. EU: The EU promised billions of dollars in
sustainable investment in Africa so that it
could get access to Africa’s 1.3 billion strong
market and could counter China’s ever-
growing influence in the region.
3. India: India has made various deals with
Africa, including scholarships, healthcare
assistance, credit lines, and so on, to deal
with China's cheque-book diplomacy.
4. U.S.: The U.S.-Africa relations date back
centuries. Initially off to a rocky start due to
African enslavement and mistreatment
across the Atlantic, the two blocs started
amicable dialogue from the end of the
nineteenth century. The U.S.’ initial partners
in Africa were limited to the semi-
autonomous Egypt, Ethiopia and its old
colony of Liberia. However, at the turn of
the twenty-first century, the strategic ties
between the U.S. and Africa deepened with
the help of the passing of the African Growth
and Opportunity Act, 2000 (AGOA) during
Bill Clinton’s presidency as well as the
development of the African Continental
Free Trade Area (AfCFTA). These made Figure 7: Mineral Resources of Africa along with the Political Borders
(Sources: CIA Factbook; Simran Khosla/Global Post)

FEATURETo Be or Not to Be?
YOUTHINK l 2022 l Vol. XVI21
strides towards advancement of the entire
continent. The AGOA helps African countries
boost their exports in agricultural sectors to the
U.S. with almost zero customs and tariffs and
without any need for reciprocity. This has
generated huge revenues for the African countries,
and helped lift a sizeable portion of the people
from poverty due to the creation of jobs. However,
this too had an expiry date. Despite having been
renewed two times in
the past, it has been
cracking under opposing
pressures of the parties.
For the U.S., Africa is a
huge, untapped market,
which due to AGOA,
they have not been able
to tap into. For the
A f r i c a n s , t h e i r
development initiatives
and expectations of
g r o w t h h a v e n o t
capitalized the way they
thought it would have.
Such a strain is creating a
vacuum in Africa which
other countries and
blocs are more than
wi l l ing to occupy.
Despite that, the United
States still remains the
second-largest investor
in the continent. Much
remains to be seen as to
how their relations
persist after the AGOA
terminates in 2025. The
U.S. now considers
Africa to be its trade
b a t t l e g r o u n d w i t h
China, for power and
influence.
5. China: China is the
leading investor in Africa
(see Figures 8 and 9).
Currently, China has been funding infrastructure
projects, giving loans, and setting up foreign direct
investment taps and more in the form of loans. It
has built the continent's longest railway line,
connecting Ethiopia and Djibouti, a standard
gauge railway link between Nairobi and
Mombasa, as well as the African Union
headquarters in Addis Ababa. China's vested
benefits in these undertakings are exponential. It
Figure 8: U.S. vs. China - Trade with Africa (2000-2010)
(Source: www.coons.senate.gov)
Figure 9: U.S. vs. China - Export to Africa (2000-2010)
(Source: www.coons.senate.gov)

To Be or Not to Be?FEATURE
YOUTHINK l 2022 l Vol. XVI 22
gets geopolitical influence, cheap labour, as well as
allies in world forums. Several African countries
already use the Chinese Yuan. Moreover, it has
developed an off-shore military base in Djibouti,
in the Horn of Africa.
In July 2019, 22 nations co-signed a letter to the United
Nations Human Rights Council (UNHRC) expressing
grave violations in human rights conditions of the
Uyghur Muslims living in the Chinese province of
Xinjiang. A couple of days later, a list of 37 countries;
which later increased to 50, co-signed another letter to
the UNHRC, stating their trust and faith in the policies
of the People's Republic of China (PRC) and asked the
'relevant countries to refrain from employing
unfounded charges against China', as per UNHRC
statements (see Figure 10).
The majority of the signatories to the second letter were
Muslim majority countries of Africa, who turned a blind
eye to the 'Muslim brotherhood' and supported the PRC
despite there being ample evidence to the contrary of
what they believed. This goes to show China’s
geopolitical hold on Africa.
This presents to us a familiar story - China's policy of
debt traps. China has already been quite successful in
implementing and benefitting from its Belt and Road
Initiative (BRI). If the majority of the African continent
becomes China's, it would become impossible to pass
any resolution against it as 54 votes of the African
continent would bail it out, thus gaining itself
diplomatic immunity. This is bringing about a wave
called neo-colonialism. It echoes the words of John
Adams, ‘There are two ways to conquer and enslave a
nation. One is by the sword. The other is by debt’.
CONCLUSION
A f r i c a h a s m a n y
challenges in front of it.
However, it has just as
many opportunities
that it can capitalize
on. It is the youngest
continent in the world,
with a huge number of
people falling within
the working bracket. It
also has a very cheap
labour cost , thus
becoming a viable
place for outsourcing
businesses. Six out of
the ten fastest-growing
economies are African.
Rwanda and Nigeria
are showing sustained
economic growth and
potential. Education of the young workforce is helping
African economies export services and limit imports of
know-how, thus improving the economy qualitatively
and quantitatively. However, Africa must choose its
Figure 10: Signatories to the Two Letters Signed to the UNHRC
(Source: UNHRC)

FEATURETo Be or Not to Be?
YOUTHINK l 2022 l Vol. XVI23
allies judiciously, because just like the nineteenth
century, there is a (neo) colonial scramble for Africa,
from which Africa has nothing to gain.
REFERENCES
1. https://en.wikipedia.org/wiki/Colonisation_of_Africa
2. https://www.britannica.com/place/Asia/Climate
3. https://www.britannica.com/place/Africa/Climate
4. https://www.nationalgeographic.org/encyclopedia/africa-
physical-geography/
5. https://www.theatlantic.com/international/archive/2012/
09/the-dividing-of-a-continent-afr icas- separatist-
problem/262171/
6. https://www.pbslearningmedia.org/resource/sj14-soc-
religmap/world-religions-map/
7. https://geopoliticalfutures.com/africas-sahel-strategy-
containment/
8. https://worldbulletin.dunyabulteni.net/world/mapping-
africas-natural-resources-h191272.html
9. https://blog .oup.com/2014/05/15-facts-on-african-
religions/
10. https: / /www.jpost .com/Israel-News/Pol i t ics -And-
Diplomacy/Jerusalem-orders-to-cancel-all-aid-programs-
to-resolution-co-sponsor-Senegal-476421
11. https://www.dw.com/en/eu-investment-in-africa-europe-
racing-to-catch-up/a-45500068
12. https://www.brookings.edu/testimonies/us-trade-and-
investment-in-africa/
13. https://www.ibef.org/news/india-promises-us-10bn-line-of-
credit-to-africa
14. https://knowledge.wharton.upenn.edu/article/chinas-
investments-in-africa-whats-the-real-story/
15. https://jamestown.org/program/the-22-vs-50-diplomatic-
split-between-the-west-and-china-over-xinjiang-and-
human-rights/
16. https://www.vox.com/2015/11/10/9698574/africa-
diversity-map
17. Wenjie Chen, David Dollar and Heiwai Tang (August 2015):
ht tps: / /www.brookings.edu/wp-content/uploads/
2016/06/Why-is-China-investing-in-Africa.pdf#:~:text=
China’s%20investment%20in%20Africa%20includes%20so
me%20large%20deals,and%20the%20private%20compan
y%20Zhejiang%20Huayou%20Cobalt%2C%20in

FEATURE
YOUTHINK l 2022 l Vol. XVI 24
With the
formulation of
blockchain
technology and
smart contracts,
the art industry
has seen a
revolutionary
change.
The Paradigm of Change Inflicted upon the Art Market through Non-Fungible TokensAnant KediaDepartment of Commerce (Morning)
ABSTRACT
In this protean world, technology has become the basis of all development
and the ‘mother of all inventions’. With the formulation of blockchain
technology and smart contracts, the art industry has seen a revolutionary
change. The digitized version of art is not restricted to canvas anymore. The
introduction of Non-Fungible Tokens (NFTs) has changed the landscape of
Reet NahataDepartment of Commerce (Evening)

FEATUREThe Paradigm of Change Inflicted upon the Art Market through Non-Fungible Tokens
YOUTHINK l 2022 l Vol. XVI25
the art market, with Ethereum having appropriated
cash payments and bank transfers. Is the rapidly
emerging online art market here to persist in the long
term, indicating that the shift is permanent? The article
seeks to critically analyze the shift in the nature of the
art industry, quantifying the change with the help of
relevant parameters and highlighting fundamental
subjects covering the valuation and operation of NFTs
to contemplate the sustainability of the market.
KEYWORDS: Art Market, NFT,
Sa le s , Smar t Cont rac t s ,
Ethereum.
ESSENTIAL DETERMINANTS
OF THE MARKET
What are NFTs?
Non-fungible tokens are unique
digital assets existing on a
blockchain currency that give
the buyer exclusive ownership
rights. The data is stored in a
digital ledger and is non-
interchangeable. To verify proof
of ownership, NFTs can be used to represent easily-
producible items such as GIFs, photos, audios, videos,
et al., while utilizing blockchain technology.
Foundational Pillars of the Industry
A $60 billion industry, honed and chiselled by the
pointed yet flair wings of talented visionary
professionals and the home galleries of devoted
enthusiastic art connoisseurs, the global art market is
the place of trading commodities, services, and works
of art. This industry is fuelled by the likes of eons of
revolutionary creators and collectors, who have, since
the birth of the 20th century, discovered a common
ground for exchange.
The Market
Supply and demand are not the sole driving factors of
the market. It is an amalgamation of the past monetary
value of the work, the authenticity of the artist, the
usability of the collector, and the value on the
prediction market. The beauty of the market is such
that the producer does not originally create the piece
with the intention of selling it off to a noteworthy
collector. An aficionado buys what is soothing to his/her
eyes, irrespective of the monetary value of the work,
and the middlemen exploit both the parties by
camouflaging and suppressing the details of the
transaction.
Offline Sink, Online Float
A 22 per cent fall in the offline art market pushed the
sales down from $64.4 billion in 2019 to $50.1 billion
in 2020. To survive, art dealers ramped up their IT
spending rapidly. Gallery expenditures were being
journaled as Online Viewing Room expenditure.
Expenses on art fairs decreased in accounting, from 26
per cent of galleries’ overall costs in 2019 to 16 per cent
in 2020. Looking at the figures, online sales have more
than doubled, showcasing sales worth $12.9 billion in
2020, having increased from $6 billion in 2019, thus,
indicating a 16 per cent increment in governance over
the industry, from 9 per cent to 25 per cent.
Analysis of Revenue from Sales (see Figure 2)
A remarkable epitome of this change is the
transmogrification of the contemporary art forms into
the crypto art market. This surging market comprises
digital artworks, which are authenticated and
converted into Non-Fungible Tokens (NFTs) - unique
identification assets stored in blockchains.
From just $13.7 million in the first half of 2020, NFTs
Figure 1: Percentage Share of Offline and Online Market
(Source: Statista 2021)

The Paradigm of Change Inflicted upon the Art Market through Non-Fungible TokensFEATURE
YOUTHINK l 2022 l Vol. XVI 26
have witnessed overwhelming sales of $2.5 billion in
the first half of 2021, elucidating that the digitalization
of the industry is veritably perpetual.
The buyers of NFTs are more than double the
number of sellers, thus illustrating a salient
imbalance. The fact that 53,198 buyers were
reported as compared to the 18,429 sellers, is
indicative of the major interest in the fresh
NFTs being listed by upcoming entrants. This
asymmetry is also a depiction of the current
holders, who are unwilling to get rid of the
holdings, thus generating scarcity in the
market.
THE SHIFT FROM MATERIAL TO DIGITAL
AUCTIONS
Comparative Growth of NFTs
The digitalization of art has started to cast a shadow on
the traditional products showcased at auction houses.
Contrasting between the highest-priced works of NFT
and non-NFT, the latter seems to be gradually catching
up. The highly disputed work of Leonardo Da Vinci,
‘Salvator Mundi’, is the most exorbitant painting ever
sold in the history of auctions, at a price of $450 million
in 2017. Whereas, the highest-selling NFT, i.e., ‘The
First 5000 Days’, created by a recognized digital artist,
Beeple, was recently sold for $69 million. Taking only a
few months to reach such volumes of sales, auction
houses have started to accept the convention of NFTs,
owing to its expected burgeoning future.
Volume of Sales
The exchange volume of NFTs has skyrocketed in
the year 2021, with even popular celebrities
hopping on the bandwagon. As of September 2021,
the average number of NFTs sold (both primary and
secondary) shot up to 94,500 (see Figure 3) over 30
days. With a proliferation of approximately 300 per
cent in six months, the propagation of NFTs is yet to
reach its peak in the international market.
The inception of NFTs at major auction houses like
Christie’s and Sotheby’s has jump-started the
evolution of the industry. The primary ace up the
sleeve of crypto art is a smart contract, which allows
the abolition of duplication and forgery of both historic
and contemporary pieces, thus giving the exclusive art
collectors a sense of premiere ownership of the
product. Along with the duplication predicament, the
focus is equally highlighted upon upcoming artists
instead of just commercializing the established ones.
VALUATION AND OPERATION
The primary foundation of collecting and buying art
used to be influenced by the world of marketable
Figure 2
(Source: Nonfungible.com)
Figure 3
(Source: Statista, 2021)
FEATUREThe Paradigm of Change Inflicted upon the Art Market through Non-Fungible Tokens
YOUTHINK l 2022 l Vol. XVI27
renaissance artists. This historic factor has been
replaced by a much more social factor. With time, art
has become a representation of the recent past and
future societal matters. Hence, the seller has also
evolved the valuation techniques.
Factors Impacting Valuation
The dealers’ pricing procedures and programmes are
very different while pedalling in NFTs. The four key
principles evaluating the value of an NFT are mainly
categorized as - the Utility of the NFT, History of
Proprietorship, Future Projection of the NFT Value, and
the Liquidity Premium. These four factors determine
the value that is to be listed on the market for the initial
disbursement.
The ‘utility factor’ is the capitalization of the NFTs in the
market. The alternative usage of just one NFT counts for
utilization. An NFT is held by a sole proprietor at one
point in time. However, the ownership can easily be
transferred with a new NFT entry into the ledger.
Hence, ‘historic ownership’ plays a key role in value
settling and demand generation. Valuation is highly
driven by the ‘projected cash flows’. Speculation is a
mere but trivial part of human nature, driving future
prices in the forward market. As a digital asset, it is
needless to say that NFTs are prone to similar market
driving forces as any regular financial product. A higher
‘liquidity premium’ immediately indicates a higher
valuation of the NFT. NFTs having a larger trade volume
are eyed more by investors, which in turn, makes them
stellar and speculative in nature.
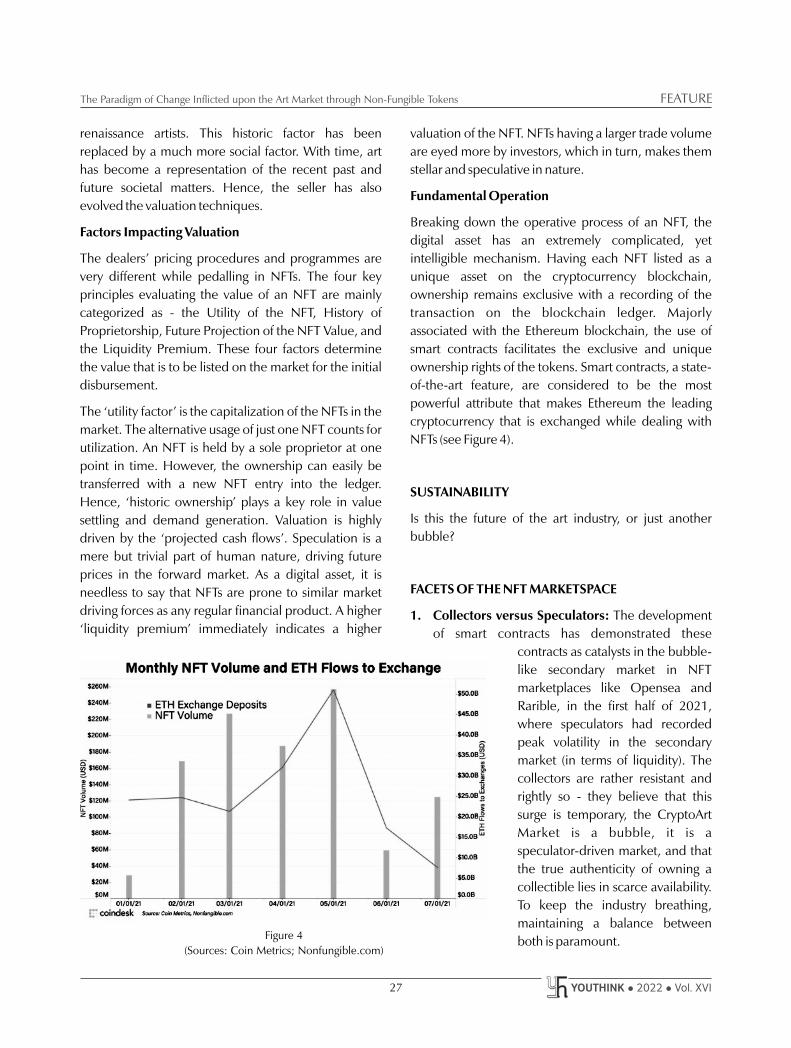
Fundamental Operation
Breaking down the operative process of an NFT, the
digital asset has an extremely complicated, yet
intelligible mechanism. Having each NFT listed as a
unique asset on the cryptocurrency blockchain,
ownership remains exclusive with a recording of the
transaction on the blockchain ledger. Majorly
associated with the Ethereum blockchain, the use of
smart contracts facilitates the exclusive and unique
ownership rights of the tokens. Smart contracts, a state-
of-the-art feature, are considered to be the most
powerful attribute that makes Ethereum the leading
cryptocurrency that is exchanged while dealing with
NFTs (see Figure 4).
SUSTAINABILITY
Is this the future of the art industry, or just another
bubble?
FACETS OF THE NFT MARKETSPACE
1. Collectors versus Speculators: The development
of smart contracts has demonstrated these
contracts as catalysts in the bubble-
like secondary market in NFT
marketplaces like Opensea and
Rarible, in the first half of 2021,
where speculators had recorded
peak volatility in the secondary
market (in terms of liquidity). The
collectors are rather resistant and
rightly so - they believe that this
surge is temporary, the CryptoArt
Market is a bubble, it is a
speculator-driven market, and that
the true authenticity of owning a
collectible lies in scarce availability.
To keep the industry breathing,
maintaining a balance between
both is paramount.Figure 4
(Sources: Coin Metrics; Nonfungible.com)

The Paradigm of Change Inflicted upon the Art Market through Non-Fungible TokensFEATURE
YOUTHINK l 2022 l Vol. XVI 28
2. Price Indetermination and Copyright Issues:
Determinants for the surging prices are highly
obscure. At this stage, the market space is too
nascent to be correctly valued. Correlating this to
the ‘dot-com’ bubble back in the 2000s, once the
‘weeding out’ effect filters the trend, the refined
value-based companies will determine the correct
valuation. A buyer must conduct thorough research
before investing, otherwise, they might end up
facing serious Intellectual Property Rights charges.
Renowned photography platforms, like Deviant
Art, are being used by fraudsters to steal and
tokenize some of these images and sell them on
NFT market spaces.
3. Employment Generation: From community-
owned NFT trading houses like Rarible to award-
winning start-ups like Veristat, which authenticate
and certify digital assets, a plethora of start-ups have
emerged in the industry, illustrating indispensable
growth. Opening streams of participation, the NFT
marketspace has created employment for
unknown artists. The unique feature of granting the
original artist a commission every time an NFT is
resold has also been applauded by many. Viewing
NFTs as a valuable investment prospect, a major
percentage of the speculators and collectors are
millennials, indicating the acquaintance of the
demographic with the sector, thus depicting the
longevity of the industry.
According to a survey done by Art Basel, most dealers
and collectors were extremely affirmative about the
impact of NFTs, as it has had a magnifying effect on
gathering attention from people of different age groups,
who have an interest in art and collectibles among a
wider ambit of collectors.
However, with the advent of a new technology that
demonstrates a steep change in the scenario of an entire
industry, comes expectations, speculations,
experimentations, and a few scams. Generating real
use-value for buyers, sellers, auction houses, art
galleries, dealers; spawning employment, attracting
millennials, and enhancing the blockchain technology,
NFTs are judiciously estimated to persist in the art
finance environment, with growing demand and
growth of modern art. Deemed to be the dealers of the
future, it can be said that even after the weeding out of
the hype, NFTs are here to stay.
REFERENCES
1. Art Market Mid-Year Review, 2021: https://d2u3kfwd
92fzu7.cloudfront.net/The_Art_Market_Mid_Year_Review
_2021.pdf
2. Collectors Art Market Report, 2019: https://www.artsy.net/
article/artsy-editorial-collectors-art-market-2021-report
3. Economic Times: https://economictimes.indiatimes.com/
magazines/panache/the-worlds-priciest-painting-salvator-
m u n d i - m a y - b e - a - l e o n a r d o - d a - v i n c i - a f t e r -
all/articleshow/82047 189.cms?from=mdr
4. New York Times: https://www.nytimes.com/2021/02/24/
arts/design/christies-beeple-nft.html
5. Reuters: https://www.reuters.com/technology/nft-sales-
volume-surges-25-bln-2021-first-half-2021-07-05/
6. Statista: https://www.statista.com/statistics/1235228/nft-art-
monthly-sales-volume/

FEATURE
YOUTHINK l 2022 l Vol. XVI29
An Overview of Consumer Behaviour towards Casual-Dine Restaurants and its Influencing FactorsSoham ChakrabortyDepartment of Commerce (Morning)
There are two major
factors that have the
most influence over
consumer
behaviour; the
explicit factor -
quality, and the
implicit factor -
price.
ABSTRACT
There are various factors that would influence the decision of a customer to
not only choose to spend their money at a restaurant once, but also to keep
spending their money, thus converting into a repeat customer. In this study,
factors like the price of the food, quantity of the food, quality of the food,
ambience of the restaurant and staff behaviour have been taken into
account. By and large, these are the five main factors that help a customer
form his/her decision to spend money in a restaurant. This study will illustrate
the extent to which these factors influence the same. The study will also
illustrate various behavioural traits of consumers, including the changes
during the pandemic.
KEYWORDS: Restaurant, Price, Quality, Ambience, Spending, Consumer,
Behaviour.
INTRODUCTION
This study was conducted to understand the factors that affect consumer
decisions with respect to Casual-Dine restaurants. Here, three restaurants
are also taken into account, whose data will be used in order to further
determine and illustrate the factors. For the sake of convenience, they will be
called a ‘business entity’, when referred to as a collective in this paper. In
order to avoid skewed results, all data in this study, apart from the consumer

An Overview of Consumer Behaviour towards Casual-Dine Restaurants and its Influencing FactorsFEATURE
YOUTHINK l 2022 l Vol. XVI 30
data, is of FY 2019-20, unless otherwise mentioned.
Inclusion of data related to FY 2020-21 will reflect
abnormal inferences due to the COVID-19 pandemic.
The restaurants in question were already achieving pre-
COVID level of sales in Q1 of 2021. Further, after the
second wave has passed and a vaccination drive is in
effect, 70 per cent of pre-COVID level of sales are being
achieved, and thus, the pandemic can be classified as
an anomaly in the long run. In order to completely
understand the data and its inferences, differences
between types of eateries have to be known:
LITERATURE REVIEW AND RESEARCH GAP
According to Parsa et al., 2012, customers in both
upscale and quick service restaurants are willing to
spend more if the restaurants' resources are focused on
attributes that are appropriate for that segment.
It has to be noted that the above conclusion is in relation
to Fine-Dine and Quick Service Restaurants (QSR).
There are virtually no research papers specifically on
this topic. There are various papers on consumer
behaviour towards restaurants in U.S./UK and
consumer behaviour towards QSRs in India. However,
there are no papers that have Casual-Dine Restaurants
as the research topic. We cannot equate the consumer
behaviour of Indians with that of westerners as the
differences in taste, cuisine and expectations are such
that they cannot be reconciled. Further, observations
made in papers related to Fine-Dine Restaurants and
QSRs would majorly be inapplicable in the context of
Casual-Dine Restaurants, as there are stark differences
in what a consumer expects from each of them, along
with them having completely different target
audiences.
RESEARCH OBJECTIVES
The primary objectives of this paper are:
?To gain an insight on the behavioural trends of
consumers and their influencing factors towards
Casual-Dine Restaurants.
?To map the spending pattern of consumers in
relation to their occupation.
?To infer the effect of digitalization of services of
restaurants on the consumers.
RESEARCH
METHODOLOGY
This paper makes use of
two kinds of data -
primary and secondary
data. Pr imary data
related to consumer
behaviour is sourced
through the usage of a
questionnaire, and the responses to each question are
analyzed to provide a conclusive inference. Primary
data, called ‘restaurant data’, is procured from the
audited financial statements of the restaurants.
The number of respondents of the consumer (primary)
data is 200, and all age groups and occupations are
equitably represented. Convenience sampling has
been used for the consumer data, in accordance with
the business entity’s target audience. Further, the data
collected is solely applicable in the context of Casual-
Dine Restaurants, as the respondents were made
adequately aware of the same.
Secondary data retrieved from the staff and
management of the business entity have also been
used. Hence, observation research has also been
employed.
All the data collected is used to draw conclusions and
also provide either data-centric or observational bases
for those conclusions.
Table 1: Differences Between Types of Eateries
Basis Fine-Dine Casual-Dine QSR
Price High Moderate Low
Ambience Posh Laid-Back Bare Minimum
Target Audience Upper Class Middle Class and Students Millennials and Gen Z
Service Speed Maximum Time Moderate Time Minimal Time
Examples Mainland China Chowman KFC

FEATUREAn Overview of Consumer Behaviour towards Casual-Dine Restaurants and its Influencing Factors
YOUTHINK l 2022 l Vol. XVI31
LIMITATIONS OF THE STUDY
The researcher has tried to mitigate the limitations
as far as possible by the usage of secondary data.
However, for the sake of disclosure, the following
are the primary limitations of the study:
The number of respondents is 200. Compared to
the number of people frequenting Casual-Dine
restaurants, the sample size is quite small.
Data of FY 2020-21 is ignored, since it would not
reflect true and normal consumer behaviour
because of the COVID-19 pandemic.
Primary data on ‘Effect of Digitalization’ is
somewhat skewed, due to its collection during the
COVID-19 pandemic, wherein use of digital media was
at an all-time high.
DATA COLLECTION AND ANALYSIS
This section will include the responses to the
questionnaire. The insights of the senior management
of the business entity have helped in a better
understanding of the consumer data. However,
inferences on the analysis of data have been made
independently.
Frequency of Eating from a Restaurant:
The collected data indicates that most
respondents are willing to eat from a Casual-Dine
restaurant on a weekly basis. Taking in inputs from
the management, the data appropriately reflects
the behaviour of their consumers. Most customers
visit the restaurants on a weekly basis, mostly on
Friday nights and weekends. Further, the
composition of the customers is:
?Daily: Very rarely does a customer dine out on
a regular basis.
?Fortnightly and Once a Month: Joint families,
wo r k i n g p r o f e s s i ona l s and young
businesspersons.
?Weekly: Student groups, nuclear families and
couples.
Amount Spent in a Month:
Restaurant data indicates that the average per order sale
is 826. Since most respondents order weekly, the
average amount collected by the restaurant would be
3,304 (826 x 4 weeks). This figure concurs with the
figures extracted from the consumer data, which show
that the maximum percentage of respondents spend
between 2,000 and 3,000 in a month. The variance of
304 is due to certain factors like increase in spending
during festive seasons, customers falling outside the
bracket of 2,000 to 3,000, and overperformance of the
business entity.
Preferred Time of Respondents:
The consumer data here concurs with the restaurant
data wherein the maximum volume of sales takes place
Figure 1: Frequency of Eating from a Restaurant
(Source: Primary Data)
Figure 2: Amount Spent in a Month
(Source: Primary Data)

An Overview of Consumer Behaviour towards Casual-Dine Restaurants and its Influencing FactorsFEATURE
YOUTHINK l 2022 l Vol. XVI 32
during dinner. Unsurprisingly, dinner is the preferred
option, since that is the time frame post the traditional
nine-to-five office timings. Further, there is also a rush
during lunch in the hotter months of May and June. This
is because salaried employees tend to rush to A.C.
restaurants in order to beat the midday heat. Since this
visit is unplanned by the customer, the bill amount is less
than the average, but the restaurants’ collection
increases due to the volume of customers. It is to be
noted that ‘Breakfast’ has received no response. This is
because people either prefer eating breakfast in places
that exclusively serve breakfast food or skip breakfast
and take an early lunch - brunch.
Preferred Cuisine of the Respondents:
Consumer data reflects that Indian cuisine is the most
preferred with Chinese and Continental equally
preferred. The business entity’s data also concurs. With
the popularity of eateries like Arsalan and Aminia, it is
shocking to see that only 5 per cent of the respondents
preferred Mughlai. However, this can be satisfactorily
justified by the business unit’s management. In
Mughlai, consumers majorly prefer one dish, Biryani.
The reason is that it in itself, is a complete dish. The
consumers get rice, meat and egg for a fixed price, and
are assured that they will be satiated. Since Biryani takes
an extremely long time to cook, restaurants offering
multiple cuisines often cook or half-cook the Biryani in
the morning and dispatch it throughout the day.
However, the aforementioned eateries specialize in
Biryani and run as ‘One-Dish Restaurants’. This
ensures that the main item on their menu, Biryani,
would be a constant item in every customer order.
This enables them to keep preparing Biryani on a
roll-over basis, assuring that it will be sold out in the
day itself and hence, enabling them to provide the
customers with relatively fresh Biryani. As a result,
customers deciding to eat Biryani choose such
eateries over Multi-Cuisine Casual-Dine
Restaurants.
It is also observed that Indian and Chinese are
ordered by larger groups, while Continental is
ordered by smaller groups, irrespective of the
customers’ age. This behaviour can be attributed to
the very nature of the cuisines; Indian and Chinese
are easy to divide among people, while it is extremely
difficult to equitably divide Continental in a group.
SPENDING PATTERN IN RELATION TO
OCCUPATION
Spending Pattern of Self-Employed
Respondents:
The data here indicates the spending pattern of
respondents who are ‘self-employed’. There are
three blocks:
?̀0 to `1,000 - Low earning freelancers, new
businesspersons and businesspersons with low
profits.
Figure 3: Preferred Time of Respondents
(Source: Primary Data)
Figure 4: Preferred Cuisine of Respondents
(Source: Primary Data)

FEATUREAn Overview of Consumer Behaviour towards Casual-Dine Restaurants and its Influencing Factors
YOUTHINK l 2022 l Vol. XVI33
?̀2,000 to ̀ 3,000 - Decent earning freelancers and
established businesspersons earning decent profits.
?̀5,000 and above - People earning high profits.
Alternatively, this also exhibits the mindset of self-
employed people; conservative, moderate and liberal.
Spending Pattern of Salaried Employees:
The data here reflects that the upper limit of spending is
`3,000, with the majority of the respondents spending
in the bracket of `2,000-`3,000. With respect to the
business entity, most salaried employees are part of
nuclear families and as such, they frequently visit the
restaurants on a weekly or fortnightly basis, on
weekends. The lack of respondents in the higher
brackets indicates that newly placed employees and
employees with a mid-range salary frequently visit
Casual-Dine Restaurants the most.
Spending Pattern of Unemployed Respondents:
On analyzing the data, it becomes evident that
when unemployed, consumers are almost always
supported by an earning member in the family.
Objectively speaking, a family with a sole earning
member who is now unemployed, would not be
spending even the bare minimum on things other
than necessities, much less on restaurants.
Therefore, by process of elimination, and taking
into account the demographics of the city, we can
state that the respondents are either recent
graduates or housewives. The spending pattern
can be explained as:
?̀0 to `1,000 - Recent graduates who are
cash strapped and housewives from conservative
households.
?̀4,000 to `5,000 - Recent graduates who
have an abundance of cash and housewives
from liberal households.
Spending Pattern of Student Respondents:
Given the fact that students are the most
experimentative, it is expected that their
spending pattern will be diverse. Almost 90 per
cent of the respondents stay below the limit of
`5,000, which exhibits their tendency of not
spending an exorbitant amount of money in
Figure 5: Spending Pattern of Self-Employed Respondents
(Source: Primary Data)
Figure 6: Spending Pattern of Salaried Employees
(Source: Primary Data)
Figure 7: Spending Pattern of Unemployed Respondents
(Source: Primary Data)

An Overview of Consumer Behaviour towards Casual-Dine Restaurants and its Influencing FactorsFEATURE
YOUTHINK l 2022 l Vol. XVI 34
Casual-Dine Restaurants. Interestingly, however,
significant percentages of the respondents spend above
`2,000 a month, which indicates that they are not only
well financed by their families, but have active social
lives. Restaurant data concurs with the above point,
indicating that the frequency of students visiting the
business entity exceeds the quantity of food ordered.
Further, when the quantity of the food ordered is high,
the students are usually in a group, which results in a
low per-student bill contribution.
MAJOR FACTORS AFFECTING CONSUMER
DECISIONS
According to consumer data, the quality of food is the
most important factor by far. It was expected that the
price of food would also be among the top contenders
in Rank 1, but the degree to which consumers prefer
quality over price is extreme.
There is very little difference between price, ambience
and quantity in Rank 2. This implies that once the basic
demand of quality is fulfilled:
1. consumers either want the price to be
reasonable, or
2. want the ambience to be welcoming, or
3. want the quantity of the food to justify the
higher price, since these respondents would
have placed price after Rank 2.
In Rank 3, the quantity takes a clear lead. It implies
that unless you’re serving gourmet food, customers
expect a certain quantity of food which would not
only justify the price, but also satiate them.
In Ranks 4 and 5, the service and behaviour of the
staff come into effect, indicating that after all the
baser needs are met, the majority of the consumers
give importance to how well they’re taken care of
by the staff and how politely their issues are dealt
with. Being in the lower ranks, it also shows that
customers are willing to wait for a longer period of time
for their food, if the food itself makes up for it.
If the data is analyzed on a macro level,
it can be understood that price holds a
considerable percentage in the higher
ranks, even though it is not outrightly
the majority in any. Combined with the
business unit’s observations, it can be
inferred that price acts as an implicit
factor rather than an explicit one.
Consumers of Casual-Dine restaurants,
even though they might not actively
p a y a t t e n t i o n t o p r i c e , d o
subconsciously keep a track of it. This
argument can be further strengthened
by referring to Figure 2. Figure 2 shows
that the cumulative majority of the
customers spend between `1,000 and
`3,000 a month, a fairly conservative
Figure 8: Spending Pattern of Student Respondents
(Source: Primary Data)
Figure 9: Major Factors Influencing Consumer Decisions
(Source: Primary Data)

FEATUREAn Overview of Consumer Behaviour towards Casual-Dine Restaurants and its Influencing Factors
YOUTHINK l 2022 l Vol. XVI35
range by all standards, which does not reconcile
with the data in Figure 9. Further, with reference
to the section on the ‘Type of Menu Card’ in this
project, a major reason given by customers to
prefer physical menu cards is being able to see
and compare the prices more easily. Theoretically
speaking, as depicted by Figure 9, if price was a
factor that consumers did not actively think was
as important as quality, ambience, et al., the total
amount spent in a month would be much higher.
Hence, we can say that there are two major
factors that have the most influence over
consumer behaviour; the explicit factor - quality,
and the implicit factor - price.
EFFECT OF DIGITALIZATION
Types of Menu Card:
Consumer data indicates that some customers prefer
digital menu cards over physical menu cards, with the
majority being indifferent to the type of menu card
provided. However, restaurant data indicates
otherwise, i.e., customers heavily prefer physical menu
cards. Further, on being offered digital menu cards,
customers still tended to make the conscious and
deliberate choice of choosing the physical one.
The variance in the consumer data can be attributed to
its collection during the COVID-19 pandemic.
Subconsciously, respondents might have chosen digital
menu cards, given the prevalent media environment.
The restaurant concurs with this analysis. According to
them, for a very brief period, customers enquired about
digital menu cards, but that quickly died away and most
customers preferred physical menu cards, for a number
of reasons, the main ones being:
1. Ability to glance at all the prices quickly.
2. Ability to read more text with one glance.
3. Larger text on the menu card than on their phones.
4. The physical feel of a menu card in their hands.
5. The ‘annoying’ act of swiping and scrolling on the
phone when deciding the order.
Mode of Consumption:
The consumer data shows that both the options are
almost equally subscribed for. The high percentage of
respondents opting for the ‘Ordering Online’ option
shows that customers are no longer solely dependent
on going out to a restaurant to eat such food. The rise of
online food delivery apps, coupled with the discounts
provided by them in order to gain market share from
their rival apps, have enabled customers to make this
switch. However, this data is somewhat overstated
since most restaurants, other than ghost or cloud
kitchens, do not clock anywhere near 40 per cent in
online sales. Further, the data was collected during the
COVID-19 period, when there was an unnatural rise in
online orders. However, since offline orders fell, this rise
in online orders was simply the replacement and not a
trend. This inference is backed by the fact that
restaurants across the country clocked in an abnormal
number of customers visiting their premises when the
lockdown was lifted during festivities. In general,
customers go out to restaurants for a change of scenery,
the ambience, and to avoid the hassle of cleaning up
afterward.
Looking at the business entity’s data, we see online
orders accounting for 15 per cent of the total sales. Even
after considering the skewness of the consumer data, it
is clear that the business entity is underperforming in
Figure 10: Types of Menu Card
(Source: Primary Data)

An Overview of Consumer Behaviour towards Casual-Dine Restaurants and its Influencing FactorsFEATURE
YOUTHINK l 2022 l Vol. XVI 36
online sales. The entity should take relevant steps in
order to promote their presence on online delivery
apps.
CONCLUSION
Given the findings of the project, the researcher draws
the following conclusions:
?The business entity should allocate a budget towards
online marketing in order to build an online
presence. Social Media Marketing should be done
in an integrated manner wherein all the three units
are represented. This would help establish a
consolidated brand.
?Consumers are sensitive towards the topic of price,
but it is still one of the most important factors.
?With respect to the digitization of services,
consumers are temporarily swayed towards
gimmicks/fads which might not be long-lasting and
wear out soon.
?Consumers tend to dine out in festivals even if that
means longer waiting lines and a drop in food
quality due to pressure on restaurants.
?Consumers prefer a decent ambience that makes
them feel comfortable but does not make them feel
out of place.
?The occupation of the consumer makes a drastic
impact on the amount spent when compared to
age.
?There are two major factors that have the most
influence over consumer behaviour; the explicit
factor - quality, and the implicit factor - price.
Figure 11: Mode of Consumption
(Source: Primary Data)

INTERVIEW
YOUTHINK l 2022 l Vol. XVI37
YT : You spent a lot of the formative months of your
career training in Germany, living alone and
testing your wits against some of the best
shooters in the world. What was the reason
behind the same? Do you think that the
athletes who train abroad turn out to be more
proficient because of the exposure they
receive?
AB: A lot of expertise and the technology I received
access to was, and still is, relatively unheard of in
India. I was fortunate enough to travel to
Germany and the USA to hone my skills. While I
know that many things played a part in my
success both in India and abroad, the time I
spent training and utilizing the Global Best
Practices did give a new facet to my training.
Through the Abhinav Bindra Foundation Trust, I
have championed the cause of providing
accessibility, affordability and availability of such
Global Best Practices to the Indian grassroots
athletes. These are facets of training that
enhance an athlete’s performance and help
them get that one per cent edge over others
which can be the difference during elite
competitions.
YT: There are instances in which an athlete’s
performance is affected due to certain factors
that are beyond their control. This happened
to you when the unstable wooden flooring had
cost you a medal in Athens in 2004. How did
you cope with this incident, where your hard
work was denied fruition by reasons beyond
your control?
AB: The 2004 Athens Olympics was an extremely
low point for me. I had a very disappointing
score in the finals after what I believe was the
best I had ever shot. I found out later that the tile
under me at the arena was loose, which can have
a serious impact in a sport that requires complete
accuracy. I was extremely upset and even
considered quitting the sport. However, after a
lot of introspection, I decided to train even
harder and moulded myself to be perfect on an
imperfect day. I wanted to be prepared for every
possibility and did not want to leave anything to
chance. I trained after that with a loose tile in my
range, I even booked a marriage hall and
designed it as an arena to give myself a better feel
for the final competition. The most important
thing I learnt along the way is that nothing
MR. ABHINAV BINDRAOlympic Gold Medalist and Businessman
Taken by the Editorial Board

Mr. Abhinav BindraINTERVIEW
YOUTHINK l 2022 l Vol. XVI 38
matters more than honesty to the work that you
do, and ensuring that you have done everything
you could to succeed. The process is all that
matters and following it without worrying about
external factors is what helped me get better as
an athlete as well as a person.
YT: In the year 2005, you suffered from a
prolonged injury because of which you had to
stop practicing for almost a year. How did you
ensure that you maintained positivity and that
you didn’t go out of practice during that time?
How difficult was it for you to make a
comeback after recovery?
AB: Physically, it was tough, yes. Coming back from
an injury is never easy, since you have to realign
every movement and it takes time to get back to
full throttle. But my mind had recovered from
the disaster of Athens 2004. The thought of
redemption drove me and even though my back
was in constant agony, I decided to not go for
surgery, instead opting for intense rehabilitation
in Germany. The pain did reduce me to tears
sometimes, it was unforgiving but I did
everything I could, spending five to six hours a
day with a physio, trying to balance and
strengthen my muscles, and alternating between
exercise and therapy. It was draining but I learnt
to dig deep, which is a very important lesson for
any champion. As a professional athlete, you
have to sometimes live with injuries and that
means missing training. I too coped with it.
YT: In shooting, even the slightest of errors can
affect the results of the sport significantly. In
addition to this, there is an immense pressure
that follows in representing your country at
the international stage. How did you remain
calm and maintain precision under such
circumstances?
AB: It is very important to immerse yourself in the
process and only worry about things that are
under your control. It is obviously not as easy as it
sounds and some people are able to do it much
earlier while others, like me, take time.
Accepting the pressure of competing so that you
can use your mind and energy on other things is
the first step. The pressure can then drive you
forward rather than hold you back. Once you
accept pressure, it helps you perform better and
gives you that little bit of edge to do your best.
YT: Many athletes, including you, have stressed
on the importance of sports psychologists in
India. Do you think that athletes, who focus on
fitness and health considerably, being vocal
about it can contribute immensely towards
destigmatizing mental illness? With the
aspirations and effort involved in striving for
success, what are the issues that athletes
sometimes face in regard to mental health and
what, according to you, can be done to help
those who experience this?
AB: I would recommend that as a first step, we need
to understand that athletes are not
superhumans. They are like any other person -
they feel overwhelmed, face the sadness of
rejection heavily and are prone to a variety of
competition related stress. This is the mindset
that sets the foundation for becoming advocates
of athlete mental health. Whether it is a simple
affirmation, a friendly chat, or just simply being
there, each of these small gestures help build
trust and a comfort level that will help an athlete
open up to you, just like anyone else. It is
important to make an athlete aware of what they
are facing as well, many may be oblivious to why
they feel the way they do. Grounding them in
their strengths, and encouraging them to work
on their weaknesses is an important and integral
part. Moreover, we need to make them aware
that winning and losing is not the measure of
their success. Winning medals is great but it is not
everything and it should not be the only aim in
your life. These conversations may seem rather
insignificant in a vacuum, but these are the
building blocks to help athletes through dark

INTERVIEW
YOUTHINK l 2022 l Vol. XVI39
Mr. Abhinav Bindra
times, reduce the stigma associated with mental
health, and even find a way to see this permeate
into the society that we live in.
YT: Having obtained a Bachelor’s Degree in
Business Administration from the University
of Colorado, you have not only performed
exceptionally well in sports but also in
academics. What advice would you like to give
to young athletes, who, considering the time
and effort that is required in this field, choose
to drop out of education to focus on fulfilling
their dream? What, according to you, can be
done to ensure that these aspiring athletes
from all around the country have access to
education?
AB: Education is extremely important for an athlete,
considering they do not really have another
option to fall back upon in case things do not
work out in professional sport. Additionally, after
retiring from sport at a relatively young age of say
40, most athletes do not have any other career
option and are entirely dependent on the
pension they receive. Of course, some might not
find it easy to balance both but it makes practical
sense to pursue both in some form at least. What
can also be done is to opt for courses that will
help them in the sporting ecosystem, something
they are already passionate about. That is what
we have been trying to do through the Abhinav
Bindra Sports Medicine and Research Institute,
which is a one of its kind institutes bridging the
gap between Indian healthcare and the sporting
ecosystem. Currently, there are bachelors and
masters level programmes with an aim to
achieve excellence by bringing Global Best
Practices to Indian healthcare and sports
medicine.
YT: A key initiative for your outreach to Indian
sports is through the Abhinav Bindra
Foundation, a non-profit initiative where
athletes are provided access to the latest
sports technology and physical training for
f ree . Cons ider ing your s ign i f i cant
contribution in this field, what in your opinion
is it that we lack in terms of technology and
what can the government do in this regard to
provide a boost to the sportspersons of the
country?
AB: There is no doubt that champions have to be
built through systems and processes;
governments and sports authorities have a huge
role to play in helping build those systems. The
technological advancements in the sporting
ecosystem are the need of the hour and it is
imperative that we as a sporting nation stay at par
with the Global Best Practices, if we want to keep
building on our success in the Tokyo Olympics
and Paralympics 2020. Look at the example of
Odisha, the infrastructure they have
implemented in partnership with various
stakeholders to assist athletes through various
High-Performance Centers. They did not
achieve this overnight, instead they identified
the need to build from the grassroots through
state-wide talent identification programmes,
and are now reaping the rewards with numerous
athletes bringing glory to the state and the
nation.
YT: In your autobiography, 'A Shot at History: My
Obsessive Journey to Olympic Gold', you have
mentioned that the sports with significant
commercial advantage are prioritized over
other sports as they are held more frequently
and thus, provide the sportsperson with
innumerable opportunities to prove
themselves. Considering this situation, do you
think that the Olympics should be held more
frequently so as to give athletes more
opportunities? Also, what can be done to
ensure that these sports receive the required
support from the administrators?
AB: Comparing the Olympics with commercial sport
is not fair since it is a stage which comprises many

Mr. Abhinav BindraINTERVIEW
YOUTHINK l 2022 l Vol. XVI 40
sports and different categories of events under
those sports. For example, the Tokyo Olympics
2020 had athletes from 50 sporting disciplines
competing in 339 different events. Some of
those sports like badminton or tennis or football
are more commercially viable than other sports.
That is because their sporting federations or
authorities have built a strong structure with
relevant tournaments attracting audiences and
viewers. All landmark sporting events are held
after every four years. An alternative solution is to
promote the less popular sports and make them
more accessible and less niche. Neeraj Chopra
won a Gold in javelin throw, but how popular is
his sport compared to cricket or football or
basketball? So, yes, these sports require support
from the administrators, require funding and
definitely require a proper cycle of tournaments
to bring them to the eyes of the public.
YT: Your journey to the pinnacle of success has
been a source of inspiration for millions of
Indians; the students of St. Xavier’s College
(Autonomous), Kolkata, are no different. What
message would you like to give to them?
AB: I believe that regardless of how you choose to
pursue success, as a student, an athlete, a
businessman or an employee in any industry,
make sure to be perseverant and always be ready
to learn. The landscape is changing rapidly
around the world and it is yours for the taking as
long as you stay dedicated and focused on what
you do. More important, however, is to always
look at the bigger picture. It is a cliche but also
the most important truth that everyone should
accept - failure is not a setback. Failure, in fact, is
a crucial step to success. You are bound to fall
short sometimes even though you worked
immensely hard for something. It is completely
okay. Learn from it, reassess and restart. For
example, only a minuscule percentage of the
athletes win medals in the Olympic Games. That
does not mean the majority of us are failures and
should stop trying. Believe in the process, give
your best. That is the only controllable factor,
your only success. The result will come -
sometimes early and sometimes, a bit later.

INTERVIEW
YOUTHINK l 2022 l Vol. XVI41
YT: Brain drain has been a major problem for India
as we have seen a large number of students
pursue education abroad and eventually settle
there. Having been born in Kenya and educated
in England, what were your thoughts behind
your move to India and what do you think can
be done to address the rampant migration of
personnel from India?
AG: I had stayed in India between the time we were in
Kenya and England, for various reasons, which
was only from 1965 to 1966. After that, we left for
England. I came back to India later because I felt
that I should do something useful for the country
and try to change the situation for the betterment
of the people here. I had this vision because there
is a lot of poverty and a lot of difficulties for the
ordinary people here, in terms of the rights of
women, rights of the lower caste, worker, et al.
Therefore, I thought that I would be able to do
much better in India than in England.
I think the reason for brain drain is partly the lack
of opportunities of employment in India, along
with the lure of a better lifestyle, for which nobody
can be blamed. I don't think anyone can be
castigated for wishing to and yearning to have a
better lifestyle, whether they be from the rich or
the poor. But I think that an important educational
element in our country should involve inculcating
the idea of service within people. Certain lawyers
whom we see on television earn a lot of money; in
fact, most lawyers do. But a lot of my work is free
and I am happy with that. I feel that I do a lot of
service that helps people, and that the attitude of
service and actually giving to the people is
something that has to be inculcated among
students and the society at large. Moreover, I have
been a teacher for a really long time and have
even done a diploma in education in England. I
started teaching in a school when I came back to
India because that is what I wanted. Infact, I got a
call from NLU Odisha asking me to teach there
and I accepted, without even thinking about the
money, because I want students to learn from
what I have experienced. I also teach at
Georgetown in Washington every year. While the
money they pay is a lot by Indian standards, they
value the quality of work a lot, which enforces a
system that I think is good, both for marks and
merit.
MR. ANAND GROVERLawyer and Legal Activist
Taken by the Editorial Board

Mr. Anand GroverINTERVIEW
YOUTHINK l 2022 l Vol. XVI 42
Therefore, I think that brain drain is an effect of
the lack of opportunities of employment. We
need to ensure that employment opportunities
are available, which is, unfortunately, dependent
on the government and the economic model it
adopts. As we have seen during COVID, the
lockdown had a devastating impact on many
industries. For example, 30 per cent of the hotel
industry has been completely closed down. On
the other hand, in other countries, they are
putting in a lot of money to make sure that there is
a revival. So, people cannot be blamed for brain
drain. Either money, or some sort of other value
system, has to be converted into an opportunity.
To add on to all this, there is also a huge issue of
bureaucracy in India that people have to fear. A lot
of people want to come back to India, but where
do they work if they want to do something good?
They do not have many opportunities, which is
something that needs to be provided to them.
Anybody who is prepared to help, should be
welcomed.
YT: Picking on your idea that there is nothing wrong
with expecting a good standard of living, a lot of
people migrate towards the field of corporate
law because it provides a lucrative career path.
What made you choose to serve the society
through human rights activism and human
rights law over the monetary path?
AG: When I was a student in England, I was an activist
as well as the Deputy President of the student’s
union at the University of Surrey. For me, working
for corporations was not very attractive. In fact, a
lot of my friends who went into the corporate
world do not want to do that work anymore
because they do not get the same work
satisfaction. Moreover, a lot of corporate lawyers
now want to do Public Interest Litigation so that
they can be seen helping the poor.
It is difficult to only do public interest work, except
for some very rich people who have wealth in
their families. But for me, it was necessary to
combine both commercial and public work. In
fact, I believe that if one wants to be a lawyer, one
needs to do commercial work as well in order to
actually gain considerable experience in the field.
Doing work in the public interest for free and
providing legal aid to people who are poor gives
me a lot of satisfaction. When we had set up the
Lawyers’ Collective to make sure that there are
people who can do good work, we were attacked
for the issues we took up, but we were prepared to
face those attacks. Even if government agencies
come after us, we are prepared to stand up for
who we are.
When it comes to activism, you cannot let yourself
down or let your work be squandered just
because people think otherwise. People are
pushed by their own morals. We did a lot of social
work from 1981 to 1998, when we received
funding, and we continue to do such work even
today, even when we do not have funds. The HIV-
AIDS unit, with me as its Director, drafted the HIV
Bill and got it through. Moreover, Indira Jaising
was the Director of the Women’s Right Initiative,
and they got a very important domestic violence
law passed in the parliament. We even went
ahead to subsidize a lot of free work that is done
for people. Even today, I still donate what I earn to
a lot of charitable organizations even though I do
not earn as much as other lawyers do. I think that
lawyers in my position are quite comfortable as
compared to others, but I do not have any
complaints about not earning money from other
work. I am quite happy and I love my job so much
that I can spend 24 hours on it and enjoy it.
Besides, I have ways of balancing work with other
things.
YT: On the 11th of December, 2013, the Supreme
Court ruled against decriminal iz ing
homosexual activity, a case in which you had
been at the forefront for many years. How did
you deal with such a huge setback?
AG: I believe that if justice is on your side, you have to
fight and you will not lose. After having to go
through a lot of difficulties, you will win
eventually. On the day of that judgement itself, I
decided that we would file a review petition, a
curative petition, and that we would keep the fire
burning, which is exactly what happened.

INTERVIEW
YOUTHINK l 2022 l Vol. XVI43
Mr. Anand Grover
I was there when we filed the petition in 2001; it
was me and my colleagues’ idea in the Lawyers’
Collective to file this petition against Article 377 in
the Delhi High Court through the Naz
Foundation. I had come to the conclusion that
Article 377 was a sin and was used to blackmail
the LGBTQ+ community. When we took up this
case, we consciously used the way the media was
playing out the whole thing in order to break
down the stigma against same-sex relationships.
Moreover, India, in the early ancient period, did
not have this sort of prejudice. It was only with the
colonization by the British and the law imposed
by them in 1871, that this practice came into
being. We had a completely different history and
culture but unfortunately, we imbibed British
culture through Article 377. So, even with what
happened on 11th December 2013, I knew that
we were on the right side. I wrote multiple articles
in the press at that time and gave innumerable
reasons as to why the judgement of the Supreme
Court was wrong. I used all the criticism on my
command because it was, morally and ethically, a
wrong judgement.
YT: You have been working to promote the right to
physical and mental health with the United
Nations Human Rights Council. In your
opinion, what steps can be undertaken to
address the epidemic of mental health issues,
especially amongst the student community?
AG: Mental health issues affect everyone in their life at
some point or the other. It is just like any other
ailment and I have been through it as well. So, we
should actually accept it as a part of our normal
life. When one feels distressed because of some
reason and cannot deal with it, they need friends,
family and peers to support them. So, the job of
friends and family is to say that we are there for
you, you can come out of it. All that’s required is
the necessary support.
At a later stage, one might also need medical help.
Due to the exorbitant costs, only rich people can
go to a psychologist or psychiatrist. But what about
the poor people? There's nothing available for
them. A vast majority of people are under mental
strain today because of COVID-19. These issues
are also faced by people belonging to the
LGBTQ+ because of the constant conflict that is
going on in their minds from having to live two
separate lives, publicly and privately. All these
people who are suffering from these issues require
proper counselling.
When I was a student, we had peer counsellors in
our college who would help people, under the
guidance of a professional counsellor. This can be
implemented by anyone in whichever college
they are in, so that they can help their fellow
students. I think that if people, instead of talking
about what they can do, go ahead and actually
help out others in need, they can do anything
anywhere, no matter what.
YT: You were the Special Rapporteur of the UN on
right to health from 2008-2014 and have
extensive knowledge about public health
systems. Is there any country whose response
to the pandemic was commendable and
praiseworthy? What do you feel about India’s
response?
AG: There are two basic facets in the question. Firstly, I
think that the general public health infrastructure
has been extremely important in dealing with the
pandemic, and we can see the difference
between Kerala, which has a good public health
care infrastructure, and other states. I will not
mention them but you can see it for yourself,
because Kerala has actually been investing in
healthcare for nearly seven decades now. They
have been able to deal with things better.
Similarly, those countries that have good public
health care infrastructure, public health meaning
government-funded, are able to cope with things
better. The difference between Maharashtra,
Kerala and Bihar is so clearly evident because of
the money that is spent by Kerala. The healthcare
system in Kerala is so good that a lot of people
from the Middle East came to be treated there
with the confidence that they will be treated well.
Can one mention any other state in our country
which had that kind of experience? No.

Mr. Anand GroverINTERVIEW
YOUTHINK l 2022 l Vol. XVI 44
Similarly, some people ran to the U.S. and
England. The U.S. treated COVID very differently
from their normal response. Of course, there is
Obama healthcare now and the Biden
administration is trying to push public health care
from the primary health infrastructure to the
tertiary structure, but even there, for example,
they realized after the first wave that vaccines
must be made available fast. They actually put in a
lot of money in key purchase agreements to give
the vaccine manufacturers a head start to develop
and manufacture the vaccines. This made the U.S.
a capitalist economy behaving like a socialist
country, which is a good thing, and that is why
they succeeded in getting vaccination for so many
people, or in fact everybody, at least everyone I
have talked to. The people in the U.S. are very
happy and do not have to worry about whether
they are going to get the vaccine. They just have to
wait for their turn as the government is pushing the
number of vaccines up as quickly as possible. And
what did we do? It is very sad that firstly, we have
never been able to anticipate any pandemic,
including the Spanish Flu of 1918 to 1920, where
India had the largest number of dead people, i.e.,
18 million. When we experienced the second
phase, they said that they could not anticipate the
wave or its extent. But certainly, not only should
they have anticipated it, but they should also have
taken precautions. Everyone was saying that the
pandemic was over and that COVID had been
conquered with India showing the way. Everyone
went to sleep except for some states. Chhattisgarh
and Kerala ensured that they at least adopted the
necessary measures required to tackle the next
wave, which is why they did not have as big a
problem as Delhi did. In Delhi, the Central
Government and the State Government are
fighting with each other but, in my opinion, both
of them are at fault. India, in my opinion, has
retrogressed. For example, we had to pay for the
vaccines, but we never paid pre-purchasing prices
to the Serum Institute or Bharat Biotech or any
other company. Moreover, why restrict the
manufacturers to only two when the entire
population needs to be vaccinated? We ignored
the advice of experts who told us that the second
wave was coming. The state elections, Kumbh
Mela, and a lot of other things led to the surge of
the second wave of the pandemic. Unfortunately,
a lot of people have to pay for this throughout their
lives, which is a sad thing. Currently, it is better to
expect the third wave than to not expect it,
because it is people’s lives that are being dealt
with. So, I think that we have not played well,
especially in the second wave and all the reasons
that I have stated are what I am going to argue in
the Supreme Court when the matter comes up.
Fortunately, Moderna is not insisting on the
Intellectual Property Rights reckoned in the
beginning. The government should pick it up and
make sure that the children between the age of
twelve to eighteen get it immediately, because
they need to go to school. They have been out of
school for a year and a half already. Their lives are
being ruined in terms of mental health, which we
were talking about earlier. They need to go to
school and be with their friends. They need to be
vaccinated.
YT: There are a total of 43.90 million cases pending
in courts at various levels in the country. This
problem is coupled with the lack of judges.
What is the social cost of the resultant delays in
delivering the verdict?
AG: There is indeed a lot of delay, especially in
criminal cases. People are often unable to get bail,
having to spend years in jail, and even if they are
acquitted, there is no accountability - they do not
get any compensation. The state of the system is
very bad and unfortunately, work is concentrated
on the High Courts and Supreme Court. All the
work should, on the other hand, be concentrated
on the lower courts, because there are so many
cases in the High Court currently that it cannot
deal with all of them. Moreover, we need judges
as well as lawyers to be competent. Another
problem is that adjournments in these courts are
given for the asking. I have had so many problems
with lawyers, but I do not take adjournments and I
am extremely proud of that. There is a reason we
have clocks; one needs to work properly from
10:30 A.M. to 5:00 P.M. every day, but whether it
be judges or lawyers, people do not work. With
people not willing to work for five hours and

INTERVIEW
YOUTHINK l 2022 l Vol. XVI45
Mr. Anand Grover
adjournments being up for the asking, these
delays take place. There are, however, some
lawyers and judges who work hard, but that is a
minority.
Besides, there are a lot of cases against the
government. The government keeps on filing
appeals, not concerned whether they win or lose.
The lawyers are also there to make money and
they continue to file these appeals. They should
be put to heavy cost, but this is not happening.
There are no damages that may actually deter a
person from going to court for a wrong case. There
are even some frivolous Public Interest Litigations
(PILs) that should be dismissed with huge costs,
such as `50,000 or `100,000, which is not
happening. Even though there are a lot of genuine
cases, we can get rid of a lot of others.
YT: Privacy has a bearing on the lives of every
individual and thus, the recognition of a
fundamental right to privacy was a landmark
decision. However, in today’s day and age,
social media applications are indispensable,
but raise multiple concerns in regards to
privacy. With the ongoing tussle between such
companies and governments globally, what
solution can be reached?
AG: I think that rules of the Ultra Vires Act are beyond
the Act and are constitutionally invalid. However,
even the big companies are sometimes playing
truant. Governments welcome them when they
are in the governments’ favour, and attack them
when they go against them. There should be a
proper system that should be administered
impartially and transparently. But today, things do
not happen like that. The law must, first of all, be
constitutionally valid, fair, just and reasonable.
Secondly, this should also apply for the
administration procedure.
If one wants to go to the government to
adjudicate, under the IT Rules, one has to first file
a complaint, for which they need to have a
grievance officer under the rules. After the
complaint is made, an internal group adjudicates
systems like videos and television systems. There
are a lot of companies that appoint their own
chosen person to become the judge, who plays
the role of the adjudicator or the mediator. After
that, the complaint goes to the government
department. Why does it go to a government
department? It should go to court, but it does not,
which is a problem. According to us, the law does
not talk of any rule like that, so why should it be
made? Moreover, companies themselves do not
follow the procedures of data privacy, and the
major problem right now is that, despite the
Puttaswamy and the Aadhar cases, there is no
Data Protection Act. How many years has it been?
It has been two years and the Act, still on the anvil,
has not seen the light of the day. So, at the
moment, all of us are doing without any data
privacy or protection.
YT: As an eminent lawyer and activist whose
contributions to society are unmatched, is
there any message which you would like to
convey to the students of St. Xavier's College
(Autonomous), Kolkata?
AG: I think that students should look forward, with
passion, to a career that they want to pursue and
that complements their beliefs. They should
believe in what they are doing. If they do not
enjoy or believe in what they are doing, they
should not do it. At the same time, if they are
passionate about their work and believe in it, they
should never give up their fight. Everyone meets a
lot of hurdles, whether it be in their career or their
personal life, but one should never give up.
Everyone should have their own value system
which, in my opinion, is in the constitution to a
large extent. But at a personal level, I feel that this
value system should have to do with treating each
person with dignity and respect. My advice for the
students is for them to break down their barriers
and get to know each other in whatever they do,
always keeping in mind the respect and dignity of
the other person. One should never treat any
other person with indignity.

INTERVIEW
YOUTHINK l 2022 l Vol. XVI 46
YT: Throughout your life, you have led different projects of national importance, be it the development of India's Pressurized Heavy Water Reac tor Techno logy o r the demonstration of the nuclear submarine power pack technology. Emphasizing on the importance of leadership in today’s generation, do you have any suggestions to help the youth of today develop this skill?
AK: The question, in my opinion, is not restricted to youth or rather the new generation. It is actually a much wider domain including the impact of the academic institutions one has been a part of and the grooming received in one's family that are vital in the formation of the various traits. Leadership is an innate skill that is to be further cultivated and honed, and must be acquired organically within one self rather than being spoon-fed. Instead of making individuals face intense pressure, we should pose a challenge to young minds and offer them the liberty to come up with their own solutions. It is critical to instill desire and support them to do so, as well as to provide or rather create a safe environment and setting in which they can develop their leadership qualities fairly. It is not an instant outcome, but rather one that develops over time. Given that today's youth is far better equipped than previous generations as a result of
their exposure to technology and new ideas, mentors must supply them with sound advice rather than holding them back. Every individual has the ability to bring out the best leader in them with the right guidance, resources and environment.
YT: Over the years, you have held significant positions such as the Director of the Bhabha Atomic Research Centre and the Chairman of the Atomic Energy Commission, which has helped India earn significant achievements. Is there any specific incident or decision that you recall which has been the most gratifying for you?
AK: Yes, there have been numerous instances that have been quite rewarding. The Dhruva Project began in the1970s. I was young and fortunate then to be given an opportunity to work on such an important mission. It is fairly common for people to replicate and imitate projects that have already been accomplished by others. The bigger the project, the more likely that it would be copied. This is so because, we cannot over look the risk that comes with it. When an individual is placed in a position of responsibility, he must ensure that one makes the best and most appropriate choice and puts in all efforts to succeed and not simply copy something that has
DR. ANIL KAKODKARIndian Nuclear Physicist and Mechanical Engineer
Taken by the Editorial Board
INTERVIEW
YOUTHINK l 2022 l Vol. XVI47
Dr. Anil Kakodkar
been done in the past, which is a common tendency because no one wants to be held responsible for a failure. So, when I was hired for the project, the first thing I asked for was confirmation that I will be given enough freedom to implement my own ideas since I did not want to blend in with the crowd and follow the beaten track even where better choices were available. With the assurance, I was gratefully given a lot of support and encouragement.
A large project is an integrated activity in which multiple elements must work together. It makes no sense to combine concepts that are incompatible with one another. When I first started, there were people in different departments at my level, and it was really difficult to persuade them about the practicality of my ideas. When you are interacting with people of your own age, it is easier, but when you are put in a situation where you have to work with somebody ten years older than you, it is challenging. For a duration of four to five years, it was a continuing uphill battle to convince them and gain their trust as the project took shape. I was able to convince my colleagues most of the time after describing the advantages and merits that we may have by following my ideas. However, there have been times when my seniors have threatened me, indicating that I wouldn’t be spared for the ideas I have been pursuing that were not to their liking. Now that I think about it, I am pretty content with the choices I have made. It is essential to have the courage to make the right decisions, which must also be examined on a sound basis. For you to succeed, you must do thorough evaluations. If you succeed, you will have support, but if you fail, you will have no one to console you. This was a very early occurrence in my profession, and the independent decisions I took have undoubtedly enriched me and made me more confident about my work.
YT: When India first stepped into the field of atomic energy, it lacked resources compared to the other nations in this field. However, since then, technology has come a long way. Having worked in this field your entire life, how has India’s progress been through this entire journey?
AK: Non-cooperation, distractions, and embargoes have all hampered India's nuclear energy effort. When we were discussing a sensitive subject like atomic energy, we knew we were being watched by the rest of the world. In terms of bigger geopolitics, India has always pursued peaceful decisions but had kept its options open because we, as a country, lacked a nuclear security umbrella. Regardless of how many countries were covered by a nuclear umbrella, they were all members of a bloc. We followed the policy of Non-Alignment and we had always a very strong peaceful orientation of our policy. We had to, however, ensure our security by ourselves. This led to a lot of skepticism and high demands in technological development.
Nuclear explosions were once thought to be useful for peaceful purposes, there were international conferences organised on peaceful nuclear explosions, but after India did a peaceful nuclear explosion in 1974, the rules seemed to shift. However, India has been pursuing breakthroughs in the realm of atomic energy in a very comprehensive manner. The peaceful side of atomic energy was widely regarded as a part of the program, but when India followed suit, the term ‘peaceful nuclear explosion’ vanished from the international lexicon. As a result, the embargo and other restrictions were tightened even more. India, however, continued to make progress against all odds, and our technology, such as the power reactors which we created for energy, are credited with setting world records for continuous uninterrupted operation in terms of city. It has demonstrated such uninterrupted operations for more than a year a large number of times, with some lasting nearly three years. So, yes, we have accomplished a great deal.
The scarcity of Uranium in the Indian landmass was the next difficulty we faced. As a result, an aggressive exploration program was launched. We persuaded the world that by failing to provide us with appropriate resources, they cannot prevent us from strengthening our security, but rather delaying our power program will have a significant impact on global level. If we continue to use coal for energy, instead of Uranium, carbon emissions will sky rocket, endangering the Earth. Similar arguments were used to persuade people, and we eventually

Dr. Anil KakodkarINTERVIEW
YOUTHINK l 2022 l Vol. XVI 48
realized the International Civil Nuclear Cooperation, which enabled sourcing of Uranium for civilian power production while preserving our strategic autonomy for national security. So, it's been a difficult path thus far, but now we should be able to go forward much more expeditiously.
YT: Your work on the Dhruva reactor, among many other projects, is an example of how people should not be deterred by the opinions framed by people around them. In the present day and age, with the world becoming increasingly smaller, how do you think people should move towards achieving their dreams and not get distracted by the criticism they face?
AK: This is a vital question to address. A huge sheep mentality exists in our society. If one person takes on a task, others will soon follow, and the number will eventually snowball. It's funny how most people forget what the core mission was in the first place. They're only aware that someone might have started this, and all they have to do now is to follow the form. I believe it is important for a person to realize and comprehend what the basic purpose is, in the first place. One needs to ponder- Will my action actually have a positive impact on the people who will be engaged in the mission? The next step is to devise a well-thought-out plan of action and to visualize the final shape that we expect our actions will lead to.
There were people in Dhruva who couldn't see visions of such a large project being implemented so well since they had not seen anything similar to this before. In this instance, we should accept the challenge and develop appropriate ways to meet it successfully. One of the difficulties I have had was deciding which technology to use. We are frequently swayed by those who have a personal motivation for endorsing a particular strategy.
Vendors usually propagate technological strategies that would allow them to sell their products. However, one should be able to assess the value or the liability that would accrue in the short and long run, as a result of choices being made. The basis for decision-making should be well-structured, with the ability to assess the
benefits and draw backs. People nowadays are more daring and open-minded, which allows them to experiment without being swayed by lobbyists. There will always be those in your vicinity who will try to cast doubt on your decisions and question your abilities, attempting to dissuade you from following the road you have chosen. But, in the end, it is our self-confidence and persistence that allows us to make and implement our own decisions.
YT: Having observed the functioning of IIT Bombay closely as the Governor of the institution, do you think that there is a vast difference between institutes like Harvard and IIT? What are the areas in which we can improve?
AK: I would like to address a few elements here. A major difference is the mindset of common Indians vs common people in countries where universities such as Harvard are located. When it comes to the education system, especially when it comes to higher research and study in technology, the progress that takes place in institutions necessitates the collaboration of multiple people with diverse capabilities, which is not so prevalent in India. In the United States, for example, there are places where university students participate in and contribute to big programs involving multi-disciplinary work that is carried out as coordinated research projects. Creating a system like this necessitates the creation of an ecosystem. IITs have begun to create such ecosystems, and the results have been impressive. If we focus on the ranks of a discipline like Electrical Engineering from IIT Bombay, the number will be about 50. We are not on the same level as Harvard, which is ranked among the top four or five universities. Our institutions may become the greatest in the country, but they have not yet achieved global recognition. When we compare our institutions to Harvard, a few things stand out - the Indian mentality.
If people's mindset is not in the right place, the ones in charge of the institution, including the external funding sources and stakeholders, will have a negative impact on its operations. There have been century - old institutions that have maintained and improved their excellence.

INTERVIEW
YOUTHINK l 2022 l Vol. XVI49
Dr. Anil Kakodkar
However, if the human minds within and outside the institutions are not enlightened enough and the peer processes become ineffective, the institution will begin to degenerate, as many Indian institutions have. IITs, fortunately, do not fall under this category. They're always expanding. The only disadvantage is that IITs are smaller and less comprehensive than Harvard. IITs are mostly focused on technology, whereas Harvard also provides a more comprehensive knowledge environment, including humanities and liberal arts programs.
Nonetheless, I have witnessed IIT Bombay's ranking increase significantly during the last decade. We must continue to develop the institutions and provide them with high-quality facilities, as well as other incentives for students. Infrastructure, Institution, Incentive, and Technology are the four areas that must be prioritized in order to achieve excellence and compete with Harvard and Stanford. We have our Indian Institute of Science in Bangalore, and the IITs are performing well, but we still have a long way to go before they can go to the top level globally. So, number one, we need to change our cultural perspective, and number two, we need to allow these institutions to grow holistically and large enough to manage trans disciplinary challenges and difficulties, which I believe will happen eventually.
YT: Your work on the development of higher education in India has inspired a lot of people. What do you think is the future of higher education in India and what are the changes required in the education system to achieve it? In this context, what are your thoughts on the New Education Policy 2020 and how, in your opinion, will it prove itself to be instrumental?
AK: I believe education is the most important factor in taking India forward and that applies to education at all levels, right from the early childhood education to the highest level of education and research. However, this requires plenty of resources and unfortunately, we are not deploying. In many countries there are norms on what fraction of GDP should be spent on education, healthcare, etc. In India as well, there are norms but we are deficient in terms of the meeting it and we are not spending enough on
education and healthcare. The second aspect is that education flourishes only when there is autonomy. If we make things binding on teachers and try to dictate in micro-management terms with regards to the curriculum, way of teaching and marking, then eventually it would lead to a factory assembly model of education which is bound to fail. We must allow individuals to create their own learning space, consistent with their respective aptitude and help them to explore their potential with suitable guidance and the required mentoring. At times, there could be multiple answers to a particular question and I think we should encourage children to debate with their peers and allow that discussion between students as this is the very essence of learning. However, in modern times, education is only restricted to books and theoretical knowledge. I believe we should rather take up a more holistic approach to learning and evolve mentoring ecosystem.
On the other hand, for example, previously we had the National Curriculum Framework which was adopted and the thought was that the teacher will observe and support students through comprehensive continuous evaluation and then wherever the student is doing well, we encourage the child to go faster, wherever there are difficulties or child is not doing so well, we provide some additional attention and help the child to pick up but do not fail the child in the exam. In my opinion, we require teachers to pay attention to individual students in the class and have a liberal approach of treating children differently in terms of helping them. I believe, what has really happened is that the number of students in a class are so many that we forget about giving individual attention. Many a times, teachers may not even remember the names of all children in the class. So, carrying out this comprehensive continuous evaluation is a far cry, particularly in the rural areas. The Human Resource Ministry then had a major meeting with the Education Ministers of States and they concluded that they would conduct an examination for evaluation in between and detain student where necessary. I believe this decision was right because that is the ground situation and we cannot be just idealistic and completely unaware of the ground situation

Dr. Anil KakodkarINTERVIEW
YOUTHINK l 2022 l Vol. XVI 50
although in theory this was a retrograde step.
Children face fierce competition as they aim to get into good professional colleges. The coaching class culture has also flourished as a result, on one side. On the other hand, we are not able to make efforts to make sure whether the concepts of children are clear or not? Are they interested in that or are they interested in something else? Do they have a choice at all? There are issues on that and I think the important aspect is that we need to liberalize education, we need to create different kinds of choices for students, that match the opportunities around. Teachers have to become facilitators and mentors rather than following the old Macaulay era learning processes. We need to carry out things in a manner, where on one side we reduce the pressure of competition and on the other side we create more choices for children so that they can explore career options according to their aptitude and choices. We need to think how we can create space for the resources of the private sector in more holistic education rather than serious distortions that have got created by the coaching class culture.
In my opinion, the New Education Policy 2020 is a very well written and thought policy which aligns with my ideologies. The National Curriculum Framework also seemed to be an effective policy but was not executed well. The framework of NEP 2020 is not the problem, but its effective implementation is a major task. So, the New Education Policy will deliver dividends, provided it is implemented in at he right manner. I hope that we achieve the desired goal and this policy proves to be instrumental in bringing about the required change.
YT: India is one of the four nations of the UN, which has never signed the Treaty on the Non-Proliferation of Nuclear Weapons (NPT). Do you think that the treaty still maintains any practical significance in the modern geopolitical scenario and do you see India ever being a part of it?
AK: We have always considered the Non-Proliferation Treaty (NPT) to be discriminatory and so we did not sign it. The fact, however, still remains that because of the NPT, the total number of countries that possess nuclear
weapons has been contained. India has conducted itself in a very responsible manner all along. While India has to be responsible enough to safeguard her own security, India's policy has been total universal non-discriminatory nuclear disarmament for a long time and I think it will still continue.
However, I think we must accept that the NPT has contained the number of countries which possess nuclear weapons and to that extent it has done its role. I am not sure if India will become a part of NPT or not. Certainly, India is now a nuclear weapon state. NPT has its own definition of a nuclear weapon state which talks about having done a nuclear weapons test before a particular date. So, just for admitting India, will they modify that clause of the treaty or will they take India in spite of it? Making India an exception for NPT is a far-fetched idea but at the same time we have, for example, the Civil Nuclear Corporation, which has opened civil nuclear trade making an exception for India. Therefore, we are able to deploy nuclear energy for peaceful civilian application in larger measures. I hope sooner or later we become a member of the NSG to start with. So, that is the first step which should be taken. There are also talks about India finding a place as a permanent member of the Security Council and in a way, it also has a correlation with it being a nuclear weapon state. So, at the moment, I think we should work towards becoming a member of NSG.
YT: You have continued to remain passionate about your work, publishing multiple research papers and your own book in 2019. What has kept you motivated in a day and age where people take the route of retirement?
AK: I always enjoy whatever I do. For example, I don’t get tired when I am working. If we are engaged in an activity which we truly enjoy then we will not end up getting bored of it. So, even at this age, whatever I do, I simply enjoy and hence there is a lot of happiness that I derive from the same. It drives me to contribute to something good, something of benefit to the society and to the nation as a whole. It motivates me and allows me to keep doing work without getting tired.

INTERVIEW
YOUTHINK l 2022 l Vol. XVI51
Dr. Anil Kakodkar
YT: Your contr ibut ions in the nuc lear development of the country have been unequivocal, for which you have received prestigious awards at various stages in your career, including the Padma Vibhushan. How important a role do you think awards play in motivating individuals in the world of science?
AK: Yes, awards do play an important role. However, I have never worked for awards as it has never made a big difference to me whether an award has come my way or not. I consistently do my work, but generally one can say that awards are important. Now, if somebody else gets an award and I don’t, then I don’t feel unworthy or sad but happy for the person who has won the award. Infact, when I am a part of a big project, people say that after the project gets completed and everybody gets into a very jubilant mood. That is something that does not happen with me either. As soon as my job is completed, I check that everything is satisfactory and move on to the next work because if we have done things right, it has to give results. While working, I derive joy because every time there is a challenge, I overcome that challenge and I learn something new. So, that is what drives me and not awards but I do still accept that awards in general are important in motivating individuals and not just in the world of science but in every field. I mentioned earlier as well that at the national level, one of the four key parameters is incentive. So, awards are important but for me they have not made any difference.
YT: Sir, you have your own theory of 'self-reliance' for India. According to you, how important is it for India to be self-reliant when it comes to atomic energy in specific and as a country in general. How do you think India can go about achieving this goal?
AK: Self-reliance to me is creating a framework where the country will never become vulnerable. We can develop whatever we are in need of and pursue a particular path or direction autonomously, ensuring that we will not become vulnerably dependent on others. Vulnerability can come out of competition, tendency to exploit and jealousy on part of others, but self-reliance means that it should never be allowed to set in. This is the principle which we follow in
atomic energy and I think this is the same principle which we should follow for the country as a whole because after all, we are living in an interdependent world and if we decide to do every small thing on our own, then we will get trapped in being uncompetitive and might lose track of the bigger opportunities and doing great things. There is a school poem which says that for the want of a nail, the shoe was lost and ultimately the kingdom was lost. This should not be allowed to happen and we must understand the entire dynamics around us in the current contemporary interdependent world. We must also understand the supply chain to make sure that we make the most competitive product to dominate the marketplace. At the same time, we must remain aware of the fact that a disruption in the supply chain can actually create a big jolt to whatever we are trying to do. Hence, this in my opinion, is the correct approach to self-reliance.
YT: Having overcome challenges every step of his way, you are someone who has consistently proved that nothing is impossible. As a person with unparalleled experience, what message would you like to pass on to the students of St. Xavier’s College (Autonomous), Kolkata?
AK: Firstly, I would say that one needs to trust himself. Secondly, learning is a lifelong process, it is not that an individual is learning only to pass an examination. One must take interest and initiative in everything that goes on around and the process of learning should continue even when one passes out of a good college. Thirdly, rather than blindly chasing the path which others have followed, I think we should go through a deep soul-searching as to what is it that we like to do and which way can we make the largest positive impact on our neighborhood, society and country. We need to find a way through which we can return the best to the soil from where we emerged. If we prepare ourselves well and have enough confidence to create an opportunity out of every adversity, by using our learning process, then there will be no reasons as to why anyone of us cannot be successful. I have full faith that all of you will achieve success in your endeavors for which I would like to wish you all good luck.

INTERVIEW
YOUTHINK l 2022 l Vol. XVI 52
YT: Right from your debut, your screen presence
and meticulous acting has been appreciated
by critics and audiences alike. Across the past
two decades you have played several roles
and many of them are remembered by the
masses even today. In your opinion, does the
distinguishing factor between a role that is
unnoticed and one which creates a mark on
the audience, lie in the writing of the character
or, the way an actor performs and executes it
on screen?
BI: This might get a little complicated in the answer
but I will say that there are two things that an
actor can do, one is to act badly, which is not
paying attention and the other is to do his best.
Now, we are assuming that an actor will do his
best and put all his heart and soul into the role.
Let us consider that the writing is weak and
somehow the actor manages to put up a good
performance then good luck to him for being
honest to his work. However, if the writing is
good, there are a lot of things that will happen.
The first thing is that the acting will be much
more organic. The acting will be far more
layered no matter how much histrionics you add
to that moment. You can decide to perform, in
spite of a weak writing and people might
appreciate a good performance but no one is
really paying attention. On the other hand, if the
writing is strong, everybody is paying attention
including the actor, the character, and the
audience. Now you may turn around and say,
how does that work? It is very simple. Everything
finally comes and sits on the head of the writer. A
director can direct as much as he wants, he can
make the actors g ive their best , a
cinematographer can shoot the best frames but if
you are not engaged in the story, in what the
story is trying to say, in the journey of the
character, you can act your skin off but no one is
really registered. The moment you are engaged
in the story, the audience notices everything.
If I, as an audience, am disengaged in the story, I
am only noticing when the actor is showing
histrionics and that is not what acting is all about.
Acting is to understand the journey of the
character, to understand what he wants, what
his obstacles are and will he achieve what he
MR. BOMAN IRANI
Indian Actor and Voice Artist
Taken by the Editorial Board

INTERVIEW
YOUTHINK l 2022 l Vol. XVI53
Mr. Boman Irani
wants to achieve at the end or fail, fail miserably,
spectacularly but try and audiences are looking
at that. They are not saying ‘Oh, how natural is
the acting!’. You can act naturally and make it
look so organic and charming but nobody is
paying attention because they are not looking at
the journey of the character. So, what is the
journey of the character, who is writing that? An
actor cannot write it. A writer graphs the journey
of the character and sometimes the actor has to
pick up that journey or rather recognize that
journey from somewhere. Once that happens,
the audience notices you, critics notice you, it
touches you and you empathize with it and
without empathy, you can act all you want,
nobody really cares.
YT: Having purchased a camera in the early stages
of your life, you made an earning by selling
sports pictures at low prices and went on to
become the photographer for Adajania and
the Norwegian boxing team. Considering that
even in contemporary society, pursuing
creative art forms are not incentivized
enough, what according to you can be done to
overcome these archaic perceptions and
encourage the youth to undertake them?
BI: According to me, there are two different things.
One is monetary incentive, for which one must
look at other people who have made it in a
career of creativity and say, ‘If he can make it,
even I can make it’. I don't need someone to tell
me that you will get a job soon after you pass out
of photography college or acting college, if there
is such a thing. That is never going to happen in
the creative field and it is very subjective. The
other part I can pay attention to, is what happens
with the family. That is, I think, a problem that
may exist is whether you want to be creative or
you want to be a doctor. Somebody may turn
around and say, we have a family of lawyers, why
do you want to be a doctor? So, you say that
being a doctor is such a respectable profession,
why should I not be a doctor? I am not
generalizing this but families tend to have the
word ‘parampara’ within their vocational
history. No Irani will ever be a make-up artist or
no Irani will ever be a dancer, says who? So, that
problem can never be solved unless parents
from a very early age are made to understand
that anything creative is as respectful as any
other job. When you look at the industry, I
cannot tell you the number of people who were
IT graduates or worked in the business or
bankers, and are now directors because that is
what they always wanted to do. Now who is to
blame for that? Is it the father or the mother or
the uncle? I don’t know. The point is that it is
upto the individual eventually whatever he/she
does. I can incentivize it and say that when you
come out of college, you will get a job as a
photographer or as any other creative
professional. However, I don’t think it is a good
idea at all because creativity has its own little way
of organically spreading and individualizing the
person’s art form. He becomes an individual, he
cannot be part of a system which has been
incentivized. That is my take on it and I might be
wrong, however, it is about what people term as
respectable vocation that comes in the way.
We can look at somebody like Shiamak Davar.
He comes from a whole lineage of educationists
and both his father and mother are lecturers at
MIT. However, Shiamak Davar wanted to be a
dancer and he went ahead. Who incentivized
him? Absolutely no one. Say, someone wants to
be an actor but there is no company that hires
actors and we need to understand the fact that
creativity is a very individual pursuit. Either I like
your art form or I don’t and it boils down to how
badly an individual wants to be an actor, a
photographer, a make-up artist, a hair stylist or
anything else for that matter. An individual who
wants something very badly, I think it is only
about awareness and the right mindset. Look at
somebody like Ritesh Deshmukh. He comes
from a family of politicians but his family
supported him. He might turn around and say, ‘I
don’t want to do politics, I want to be a writer’.
What were they going to do? You need to have
the support within the core of the family for
whatever you want and if not, then you have to
take a call ahead and say ‘No, I am sorry, I am

Mr. Boman IraniINTERVIEW
YOUTHINK l 2022 l Vol. XVI 54
going ahead and doing it anyway’. In any case,
you should know what you want ahead of life. I
feel that it does take some individuals to be the
beacon of light for a lot of other individuals.
There was a very famous photographer named
Homai Vyaravalla, one of the best women
Indian press photographers. She has been
behind all the popular photographs of Pandit
Nehru, and we are talking about the 1930s and
1940s. A woman photographer, going out there
and jostling between crowds. When a young girl
sees or gets to know about it, it becomes an
inspiration for her. So, are we looking for
inspiration? Because for me that is also
incentivizing in its own way. So, it is up to a lot of
people who go out and do what they have to do.
Otherwise, we will just be saying the
government does not support us, we will just sit
and complain, and the game is over. The
moment you say that we do not have a support
system, what are we going to do? You need to
understand that it is individualism and creativity
is a very unique individual pursuit. If you look at
my simple career, sure my mother encouraged
me but there were a whole lot of other people
who would say, and they still tell me, why did
you close that wafer shop? Even today people
say what happened to golden wafers, you shut it
down? Yes, I did as I was a little distracted being
an actor and pursuing a career in acting because
at the end of the day it is just about being yourself
and doing whatever you love to do.
YT: Before entering the Indian film industry, you
began your on-screen career by playing roles
in advertisements. Considering that the
advertisement industry worked out in your
favour and you found profound success in
both these industries, according to you, what
role does the advertising industry play with
respect to acting as a gateway for aspiring
actors?
BI: I don’t know if the advertising industry acts as a
gateway for the film industry. I would say that
advertising helped me big time because I
learned how to face the camera, I learned my
techniques, I learned my tools and I learned how
to develop a new character every day. Let us put
that aside for the time being. In my opinion, the
gateway to acting is theatre. Even if you are the
most handsome man in the whole wide world, if
you don’t have screen presence or you don’t
know how to act, it is very difficult to make it,
especially today. So, advertising helped me. It
made the face a little familiar but it became an
added advantage because I was doing theatre
parallelly. ‘Join advertising and you will become
a great character actor’ is the worst piece of
advice I can give you, to be very honest. First day
when I went for the movie shoot, I was not green
horn. When I went there, I was aware of what
the set looked like. I knew what was to be done
when the camera rolls and what the clappers do.
It just warms you up. It is a training ground but it
is not a gateway, let there be no disillusionment
about this fact. Advertising is a good way to make
money, to get used to the technique and
mechanics of studio work, but theatre discipline
is the best way to learn acting. I had done about
14 years of theatre before I did my first film. So
that actually helped me understand character
development, rehearsal process, building a
character, and making a graph. Advertising
made me warm up to the studio, a familiarity in
an unchartered territory or something like that. I
did a lot of advertisements and it helped me
create characters because of what happened in
advertising during that period. Advertising was
all about the good-looking model, the perfect
body, the perfect face and perfect everything
and people like me just walked in at that point of
time. There were a couple of advertisement film
makers who did not use the model and his
clothes alone to sell their goods. They sold real-
life characters, the everyday man and every
man’s problem became the problem of the
consumer. So, I became every man and I started
doing advertisements that were funny, that were
relatable, that were not clotheshorse. I was
competing against the Milind Somans and Arjun
Rampals but I learnt how to develop characters.
Who is this guy? Where does he come from?
What does he want? What are his strengths and

INTERVIEW
YOUTHINK l 2022 l Vol. XVI55
Mr. Boman Irani
weaknesses? Every day, I would take that very
seriously, make it a developmental process, and
use acting chops to deliver characters but once
again I am saying, it is not a gateway to becoming
an actor, it can help.
YT: Generally perceived as one of the most
difficult roles, comedy is a genre in which you
have played characters on screen which are
loved by the audience even today. According
to you, why do most of the actors find it
difficult and what makes you so good in the
same?
BI: I will try to tell you about comedy as a genre. I
have a personal philosophy about doing comedy
in the movies, unlike theatres. There have been
many instances in which I have done roles where
I just play true to the character and I don’t play
thinking whether at that point, the audience will
laugh or not because I will never know the
answer. On the other hand, if I am doing theatre,
I know that there is a punchline and I deliver the
punchline and the audience does not laugh,
then it becomes clear that I didn’t do justice to
that punchline. However, in cinema, I never
know. What I then do is that I take the pressure
off me and just stay true to the moment like I
should have done. Theatre gives you immediate
feedback. If the audience doesn’t laugh at a
punchline, don’t be upset, there will be another
chance. However, if you are not true to the
character, you derail your whole rhythm when
you try to make people laugh. Stay true to the
moment in real time, stay true to the character in
a real situation and react to it. That is it. To turn
around and say 'I am going to make them laugh',
is nothing but putting a lot of pressure on
yourself. So, in cinema, I don’t put that pressure
on myself. Most people make mistakes in
comedy by trying to make people laugh. There is
a big distinction there. Either you try to make
people laugh or you stay true to the character
and nine times out of ten, if you stay true to the
character, true to the moment, true to the
ridiculous situation that you are in, people will
laugh. But if you say, 'I am here to laugh and
make people laugh', they are not going to laugh.
The pressure to make people laugh is the death
of comedy. Enjoy yourself and people will
definitely laugh. If you are not enjoying it, they
will also not enjoy it. So, it is as simple as that.
Don’t try to be funny, don’t try to be emotional
either. If it is truthful, cry. If it is not truthful, don't
cry. If it is truthful and the tears are not coming,
never mind. Just do not say they cannot see my
tears. They will feel, if you feel. They will not feel
it if they see the tear. So, the pressure to make
people cry, the pressure to make people laugh,
remove it. True to the moment, true to the
situation is all that you need to do. Are you trying
to impress the other person? If yes, then you are
not true to yourself. Simply, I am not saying that
you should not care, you should care, but about
the truthfulness of the moment and nothing else.
YT: You have, through your venture known as
‘Spiral Bound’, conducted more than 300+
screenwriting sessions, teaching and training
people of all age groups about this nuanced
art. What inspired you to take a step in the
direction of imparting knowledge about
screenwriting to people across the globe?
BI: Spiral bound came about a couple of years ago
when I launched my company Irani Movietone.
I wanted my company to be launched with a
certain belief system and I truly believe that
everything that comes out of our good movies,
including our script, great direction, great acting,
great cinematography, great editing and great
music can sell it upto a point. So, I was writing a
script and halfway through the writing process I
said I have got to start learning how to write. I got
to learn as a student, no matter how late in life
because I have been a little bit of a late bloomer
myself. So, I started learning and befriended a
guy who was an Oscar winning writer who
started teaching me the few nuances of script
writing. I had a reasonable amount of
knowledge and that knowledge was in my head
and there were lots of young writers who used to
call me up asking for advice on certain projects
that they were working on. Over the years, I
have always shown interest in the process of

Mr. Boman IraniINTERVIEW
YOUTHINK l 2022 l Vol. XVI 56
writing and the importance of writing, the one
thing that you cannot make a movie without. So,
I decided to say that there are writers in this
country but maybe there are not enough writing
teachers around. There are just a few writing
teachers, Mr. Anjum Rajabali being one of them
and my respects to all the writing teachers I
know. However, considering the shortage of
writing teachers, I started sharing my knowledge
with young writers who came with the scripts
where they don’t know why it is not working and
discussing the general things. So, when I
launched the company, I flew down this writer
instead of having a big bash party or a grand gala
launch and arranged a workshop. So, I invited
every student who was in the area, from
Mumbai, from Pune, from Xavier’s institute, TII,
everywhere. Come down and you can share the
genius of my friend Alex Dinelaris who wrote the
film ‘Birdman’. I had great plans of taking it
forward but the pandemic broke out and it did
something else which was quite astonishing, it
gave us time. We had lots of time in our hands
and lots of frustrated people who couldn’t go to
work. So, when that happened, I decided to start
conducting workshops, free of charge, because I
think everybody needs it. If you go to America,
there are 500 institutes of writing workshops,
short ones, long ones, one-year, two-year, and
even degree courses. I said we must share and it
started with four students, next day there were
10, the next day there were 25. This number
seemed to be the cap but now we have got
around 300-400 who just signed in and we
conduct the workshops which have been
successful as far as learning is concerned. So, it is
very important for me to understand that if I
want to exist in a business that I benefit from,
there will be a point in time when I will have to
give back. A business will thrive only if there is
excellent work coming up on a higher
percentage level. So, the good movie
percentage level has to go up. How does that
happen? Good writing. So, I think I have
identified that and it is a big hill to climb but we
are working on it every single day. It is a part of
my belief system that if you want your business
to thrive, hits are one thing but the success of a
good film is even more important. Money is
important for the success of a good film because
you will then spawn a whole generation of good
writers, good actors, good directors, and good
cinematographers. Hits actually depend upon
the start system but now hits will start depending
on good movies and how do you make good
movies? Sometimes a movie is a hit whether
good or bad and sometimes bad movies become
hits. I don't hold grudges because some of my
bad movies have become hits but that is not the
point. The point I am trying to make is that if the
industry has to grow exponentially, we have got
to make good films that are also hits and those
good films can only happen with good writing.
YT: Being a recognized name in the film industry,
you launched 'Irani Movietone', your own
production house, in 2019. What was it that
motivated you to start your own production
house? How is your responsibility and role as
a producer in a project different from when
you are the part of a project as an actor?
BI: I keep it the same and I say this proudly. I do not
speak well of myself very often. I will say this
today and I am saying this not because I want to
brag but because this is something I live by.
According to me, the job of an actor and the job
of a producer are the same because we are
making the same movie. He is not making
another movie and I am not making another
movie. So, if I do not support the producer as I
would expect the producer to support me, how
are we going to make a good movie? I am, as an
actor doing a five-day job or a ten-day job, it is
exactly the same as that of the producer. We are
just in different departments but we are all
producers of the film. I truly believe that if I am
thorn in the flesh of a producer, how will we ever
make a good movie? So as an actor, I am a
producer. On the other hand, as a producer, I am
not just the person who would put it all together
but I am someone who is interested in making a
good movie and I expect the support of all the
actors, all the technicians, and everyone who is
involved in any way. So, as a producer or as an

INTERVIEW
YOUTHINK l 2022 l Vol. XVI57
Mr. Boman Irani
actor, if everyone is not happy on the set, I think
it reflects in the outcome. As an actor, my
responsibility is the same as that of a producer. I
believe that and I am proud of it. It is the only
thing that I will brag about.
The first part of your question, I kind of already
answered. I wanted to make a movie of my own
with the idea that I may have issues with the fact
that this story is not mine so how can I assert my
stories on someone else's vision. Have your own
vision, write your own movie and make it
yourself so that no one can tell you that ‘No sir,
thank you, as an actor you gave me this idea but I
am making the film’. I respect the director and
the makers of the film. I may contribute, he may
take my suggestions, he may love it and still not
use it because it is his film. So, I am a little fed-up
and frustrated in the sense that I have a lot of
ideas of my own and a way to work on my own,
which encouraged me to make my own film. So,
that prompted me to launch my own production
house.
YT: The general consensus of a majority of
Bollywood actors is that theatre as a medium
has made a huge impact on their lives, as they
had been associated with theatre in the past.
Having been a part of theatre roles since your
school days, how important a role do you
think has it played in your life and your art?
BI: There are a handful of actors who are huge stars
and they are blessed. They have got something
in them to actually step on to the screen, and
very few people have that quality. Sharukh Khan
and Salman Khan are one of the kinds who
possess this quality. On the other hand, there are
some people who don't have that quality. So,
you will never know whether you have that
quality or not until you reach that hallmark.
Salman, Shahrukh or for that matter Akshay or
even Ranbir, they just step on the screen and
undoubtedly, they have the ability to electrify.
Everyone does not have that God's gift.
Shahrukh is the most charming person you will
ever meet, where did he learn that from? Did he
go to a school of charming? Of course not. He
has it and it is part of his being. It certainly gives
him the edge. Actors like Anupam Kher, Paresh
Rawal, Naseeruddin Shah, Om Puri, all these
great people, they are fun and they have all been
through the theatre process. Somebody like
Naseeruddin Shah continues to be dedicated
towards the theatre process. Whether their films
are hits or flops or whether they have that charm,
I don’t know but they will always work till the
end of time. Why? Because they have got acting
chops, and where did it come from? From a
theatre process, from a process of foundational
theatre that will never leave them. People may
not even recognize, but whatever I have learnt, I
have learnt on the job. Imagine taking away
theatre periods from their life, they will be
different people altogether. There are so many
actors out there who work for years and after a
point they choose to work as per their
requirements. Whenever they want, they can
put up the hand and say I am available and they
will get work simply because of their theatre
experience. I think theatre has inspired me
enough to say that there will be a time when the
circle will be complete only when I go back to
the theatre. Movies are shot sporadically, so you
can shoot the third last scene of the film on the
day one of shooting. How do you graph that? It is
very difficult but if you are a theatre actor, you
will understand that graph. 'Do you know what
you are feeling at that moment?' Theatre will
teach you that. Theatre will teach you how to
graph a role, it will teach you how to live in a
moment, and to understand that there is a
technique to it. While in cinema, it becomes that
much more difficult because it is shot
sporadically. Theatre has played a huge part in
my life, it made me a little more fearless. I never
ever hide behind the fact that there is a
possibility of a retake. I always go on to a set
thinking that there is only one take and there is
an audience sitting over there. If I think that
there is always an option to retake, I will not give
my hundred per cent. If somebody I know wants
five retakes, then I use that again as a rehearsal
process but if you don't do it like the final shot,
there will always be a lack. The momentum of
doing something is different when you think that

Mr. Boman IraniINTERVIEW
YOUTHINK l 2022 l Vol. XVI 58
you have another shot at it. You don't have
another shot of it, that is the attitude you should
have. If you think that you are going to work
every morning knowing that you are going to get
your salary at the end of the month, you do relax
a bit. But if you think that everyday if I don't do
this my salary won't come today then you will
always have your sleeves on. It is the famous
scene from the movie Dark Knight where
Batman is in the well and he can escape from the
well if he wants to, and there are prisoners down
there in the caves below the well. There are a lot
of prisoners that are stuck there for life because
there is one big leap that you have got to take to
grab the top of the well. And he broke his back
and then he did another attempt but every time
you know he would fall there would be a rope
that would stop him from crashing to death. He
spoke to an old man over there about why he
can't make that final jump; the other man tells
him that it is because you know you have a life
line, you know that you are not going to die. If
you remove that life line and you jump that final
jump that you are missing, you will make it. He
then goes up, climbs and makes that final jump
and he grabs it. Similarly, when one does act, if
one says that 'I have got a second take', it is
exactly like that rope in the movie which was
meant to help the character survive.
YT: People often fail to notice the hard work and
perseverance which is involved in the journey
of a self-made star like you. Given that the
nature of the industry is such that there is no
well-defined path to get a break, how difficult
is it for an actor to make a mark in the industry
without any prior connections?
BI: Nobody is supposed to know how much hard
work you have put in, that is not their problem.
Are you displaying hard work or are you
displaying a character? You are portraying your
character that people should love. You are not
supposed to say that look at the hard work that I
did behind it, you will love it even more when
you just focus on portraying the character. You
are not doing anyone any favours by doing just
that. If you say that nobody realizes the hard
work, it is absolutely alright. The audience is not
supposed to judge your character for the hard
work you have put in but for what they see on-
screen.
I think that this whole idea of connections is a
little overblown between us. What connections
did Shahrukh Khan have? What connections did
Akshay Kumar have? What connections did
Irrfan Khan or Anupam Kher have? What
connections did I have? There are as many
people who are so unconnected with the
industry and are making it out there. For that
matter, even Deepika or Priyanka, and you
name it, where is the connection? It is just that
the ones that are connected do get a shot, but
even from that lot, only the best ones survive.
There is a point where even your father will not
be able to produce films for you because it is
eventually about money and return on
investments. If I am going to take someone for
the sake of taking someone who is connected, I
can do it once, twice, or even the third time but
eventually I will forget about it even if it were for
my own son. Only the ones that have a spark
would survive, who have got something in them.
Of course, there are so many people even in the
unconnected, who don't have a spark and are
surviving, good luck to them. But to say that you
will only succeed through connections, is a lazy
way of thinking for the unconnected ones. In
whatever you do, whether you are in the
industry, whether you are in an airline business
or whether you are in any business, you will be
connected to a point to someone. All the names
that I mentioned of Mithun Chakraborty,
Naseeruddin Shah, Anupam Kher, Paresh
Rawal, Akshay Kumar, Shahrukh Khan, Ranveer
Singh, what connection did they have and the
ones who are connected will get work because
they are working hard and they are good. So,
don't be lazy and hide behind the fact that I am
not connected and I have already lost the battle.
You lose the battle the moment you accept that it
is a reality, it is not a reality, which is something I
would say. People are looking for talented
people, it is a business at the end of the day and
in that business the connected ones do not fuel

INTERVIEW
YOUTHINK l 2022 l Vol. XVI59
Mr. Boman Irani
the business. How am I connected to the
industry? Tell me. I am a Parsi from South
Bombay and everybody thought that he doesn't
know how to speak in Hindi. My Hindi has got a
little Parsi tone but I decided to work towards it. I
played a Punjabi in the third film and tell me how
that works and where the connection is? You
want to make it work; you have to deal with your
own problems. The biggest problem will be that
you will not get a chance because the other
person has got a chance, there will always be
another person getting a chance in whatever you
do, whether it is a job in a small organization or
otherwise. The other guy is getting a chance but
if he doesn't do well, he will be thrown out. If you
are good, they will come hunting for you in
Siberia, Al Pacino said.
YT: In the Indian movie industry, the investors
have a significant say in how any project is
executed, and they sometimes make the
directors and actors do things differently
which in turn restricts their creative ability.
Being a producer yourself, how do you
maintain this balance between giving the
creators adequate freedom, and at the same
time, tweaking a few bits to ensure
commercial success as well?
BI: Everybody has an opinion, actors will have an
opinion, producers will have an opinion,
financiers will have an opinion, the editor will
have an opinion but you need a good director to
turn around and say, 'I like that opinion' or 'I don't
like that opinion'. There will be this constant fight
between the person who has got the courage to
stick by what he wants to do, and develop a
name through which his word will be law. It
takes time in creative decision making but I will
tell you this, that a good director will listen to
everybody’s ideas. The stupidest guy on the
planet may come up with the best idea on that
given day. You will listen to it and might consider
it but creativity, eventually, is a money-making
enterprise. If it is an art film then it is a different
thing but if somebody is putting in so much
money, they will think that if they go down this
route, they will lose money. You will have to
value that producer's input, fight it out. Either
convince him or get convinced, there are just
two ways to do that and there are people who
have survived with the courage of their
conviction. Nobody knows anything, so you
might as well listen to other people and make a
decision yourself. People who don't know much
should try to be silent. However, the fact still
stands that sometimes a good idea can come
along when they speak.
YT: You have been associated with various non-
profit organizations and are involved in
dif ferent social work programmes.
Considering that you hold an important
position in the society, how crucial do you
think is your role in uplifting the socially
downtrodden and spreading awareness about
the same in the society?
BI: I think when I became an actor, I thought being
an actor was about acting but I was wrong. It is
about lots of other things as well. It gives you a
voice. It gives you the power to spread
awareness. It also gives you the ability to find
resources for people who are not self-sufficient. I
know there are so many industrialists who do
many things but they may not be in a position to
stand up against something wrong and say why
don't you do this instead? However, when an
actor takes a stand, people listen to him/her a
little harder. So, one must use that influence, one
must leverage that power and voice. I think
being an actor, this should be a part of your job
profile. As far as I am concerned, I am not sure
how much I do but I do as much as I can.
I think that once you have a voice and influence,
it becomes your responsibility to use it well in
order to bring about the desired change. I don’t
know how much one can promote oneself, but if
you promote yourself then make sure that the
promotion of yourself in turn has a promotion of
a cause. Whatever it may be, it could be a blood
donation or an organ donation camp, it could be
related child labour, whatever be it, but the
more you are known the more you should use it
for other things as well. Your movies are going to

Mr. Boman IraniINTERVIEW
YOUTHINK l 2022 l Vol. XVI 60
be made, your people are going to come and
watch, how much will you fuel the fame? You
have to fuel awareness and I think we are in a
good position to fuel awareness, to spread it and
work for a cause.
YT: Your enthusiasm towards excelling in
numerous fields and making a name in the
industry, despite all odds, has inspired a lot of
people; the students of St. Xavier’s College
(Autonomous), Kolkata are no different. What
message would you like to give to them?
BI: Every person must have two kinds of wants in
his/her life. If you do not want anything out of
life, then I have nothing to say. There is a cosmic
want. One says that I need to do this in life and I
will feel, not successful but fulfilled if I have
satisfied that want of myself. I want to go on
stage, I want to represent India in cricket, I want
to be a doctor, I want to climb Mount Everest. It
can be anything. So, there are two kinds of
wants. One is external want, which relates to a
clear-cut goal which is in front of me, which
would define the life that I will have from this
moment onwards. Someone who does not have
a want is a person who has not much to look
forward to. If you do not have something to look
forward to, then why should I look forward to
you? So, you are alienating yourself the moment
you turn around and say that ‘I do not have a
want which is external’. Then, on the other
hand, there is an internal want which comes
little later in life, when you realize that in the
process of achieving my want, I have
comprehended a lot about myself as a human
being and I have got certain feelings inside me
that I need to fix. This probably is more
important than the external want. This is your
real need. If you fix your need, which is your
internal want then there is a good chance that
your external want will also get satisfied. If you
only achieve your external want, suppose you
become an actor and you go on-stage but you
are not a nice guy, you have stabbed over a lot of
people, you neglected your family, you
neglected your parents, you turned to being a
compulsive liar and money became more
important than the art itself, then you have got to
fix that all first because only then can you find
what is called ‘the pursuit of true happiness’.
Coming back to the two wants that I have
already mentioned, one is an external want
which is a goal that you can see. It could be in the
form of a trophy; it could be in the form of any
kind of achievement which everybody can see.
The internal want, on the other hand, is
something what we call a need. You need to do
that or you need to be so and so to be a
successful person. Suppose, you want to make
$50 million and you have done it. Now what?
What happens to your internal want? What
happens to your soul? You have got to fix that
also and it can be something that is very simple. I
think you really need to pay attention to your
internal want at a certain point of time. If you
only pay attention to your external want then it is
going to be a very facile and hollow life, and a
hollow victory. So, all young people who say ‘I
am interested and I want to do this’, but at this
point in your careers and life, the internal want
will not serve this purpose of yours. You will
realize at a certain point in your lives, my young
friends, that there is an internal want which is
called the need. Eventually, you need to change
and that change will give you true happiness. It is
a little philosophical and it is not career-
oriented, whatever I told you.
In order to be successful, you just need to have a
desire and a fire to succeed. With that, will come
the passion. With that, will come the hard work.
With that, will come people who turn around
and say, support that person. You will definitely
succeed, no questions about it. Mike Tyson said
that ‘I do not believe in talent. Some people,
they have talent, it is good, it helps when you
have talent. As long as you have a lot of
determination and willpower, that is all you
need. You have to have the will to win’.
However, I have another philosophy, which is,
pay attention to your internal need because that
is more important. It is the best advice that I can
give to you all.

INTERVIEW
YOUTHINK l 2022 l Vol. XVI61
YT: Children from rural areas are often afraid to
dream big due to the heavy burden of poverty
weighing them down. What inspired your
dream to become an athlete and represent the
nation all around the world?
DC: My elder sister, Saraswati Chand, was also an
athlete who was passionate about sprinting.
Because of our financial position, she was the one
who encouraged me to pursue the same sport. We
come from a family that could not even afford
covering the cost of our schooling. The reason I
started running was so that I could get a job under
sports quota and could help my family monetarily.
I devoted myself to working hard in the sport so
that I could earn medals on various national and
international platforms. I was fortunate enough to
receive tremendous support from my sister and
my family, who were truly confident of my
potential.
However, my journey has been fraught with
hurdles. I could not afford a pair of running shoes,
could not get the proper nutrition, and could not
find any trainer to guide me because our village
did not even have a field. I began practicing in the
streets and adjacent water bodies. People in our
immediate vicinity attempted to stop me in the
guise of 'traditions’, claiming that a girl jogging in
the streets is to be despised. As a result, I had to go
to practice at 4 A.M., when no one could see me,
so that I could continue improving. Obviously,
poverty has been a significant disadvantage.
Moreover, people's judgement has become
something I have become used to, by now. I have
faced a lot in my life, but I am convinced that if
one has the pure determination to succeed, they
can overcome any obstacle that comes in their
path.
YT: Your sister, Saraswati Chand, has been a source
of inspiration for you, who herself was a state
level runner but went on to take up a
government job. What made you pursue
athletics further and not go on the same tracks
as your sister did?
DC: When I was young and a novice at the sport, my
elder sister, having considerable experience as an
athlete, instructed me about the basic exercises
that are required to keep one going. She
MS. DUTEE CHANDOlympic Athlete and National Champion
Taken by the Editorial Board

Ms. Dutee ChandINTERVIEW
YOUTHINK l 2022 l Vol. XVI 62
explained to me the sport's requirements as well
as what should and should not be done. These
helped me perform exceptionally well, and as a
result, I was admitted to the Sports Hostel of
Odisha in 2006. I was offered a complimentary
diet and free coaching, which was funded by the
government and helped me improve my game
even more. I won my first medal in 2007, and I
was recognized as the National Champion every
year after that until 2010. Not long after that, I was
recognized by the National Camp and had to
move to Patiala. My college, KIIT University, was
extremely supportive and assisted me financially
as well. Eventually, I was able to represent my
country in the Asian Games, Olympics, and other
tournaments, returning home with more than 15
medals. Hence, my sister has played a crucial role
in my initial development and has been an
inspiration throughout.
YT: You stated that you started doing track events in
the hope of getting a job under Sports Quota in
the future. What importance do you think such
reservations play in the country where children,
especially from rural areas do not have the
access to education as other children do?
DC: Before 2016, athletes were not adequately
supported and sports was not even regarded as an
adequate and relevant profession by our society.
However, currently, we have a wide range of
facilities in every district and village to help every
player. Parents are usually hesitant about
encouraging their children to pursue athletics,
because they want their children to continue with
academics and obtain a respectable job in order
to support themselves. Families that cannot afford
education, on the other hand, want their children
to participate in sports. Sports quotas, reservations
as well as other amenities are, in my opinion, a
true source of motivation and incentives. This is
because the parents believe that if their children
perform well, they will be able to find a job via
sports quota and become financially self-
sufficient.
YT: At a very tender age of seven, you started to
help with the earnings of your family and took
up responsibilities that no child is mentally
capable of. Talking about it now, do you think
that your career could have gone a different
direction if you did not face these challenges in
your journey to become an athlete?
DC: My family consists of six sisters and a brother,
along with my parents. Our father, because of his
low monthly income, could not sustain all of us on
his own. He worked in a clothing industry and was
paid `200 per month. These circumstances led
our mother to often send us to work with our
father. We were given simple chores in the
workplace that could have been done by
children. To help and support my family, I
practiced running, while working part-time in the
workplace. I could have spent more time on my
game if I had the advantage of financial security.
However, I am grateful to sprinting because if I
had not enrolled in it, I would not have moved on
to represent my country in a foreign land, and
would have continued working in the same
factory.
YT: When you began running, you did not have any
equipment or even a pair of shoes to run
through the streets of your village, which
caused you to suffer a lot of injuries in your
childhood. Did this ever make you consider
slowing down? How did you not let it reduce
your will to become an athlete?
DC: Yes, I did not have any equipment or a pair of
shoes. I did not even own a pair of slippers at that
time, so the idea of having shoes seemed far-
fetched. People generally have several sets of
indoor and outdoor slippers, but I had to walk
barefoot. As a result, I suffered from severe injuries
and cuts. But these were ineffective in halting me,
and I continued to sprint through the streets.
When I was in the sixth standard, I was given the
opportunity to own a pair of shoes. However, up
until that moment, I had become accustomed to
running barefoot. It took me a year to figure out

INTERVIEW
YOUTHINK l 2022 l Vol. XVI63
Ms. Dutee Chand
how to put them on and run with them. We
always had competitions on the grounds, and
racing barefoot did not bother me because I was
used to sand. Although it was tough for me to
acclimatize when I had to compete in
tournaments that had rubber flooring, I became
acquainted with how it functioned over time by
spending time on a lot of practice sessions wearing
them.
YT: You have mentioned that as you were running
in the sand in your childhood, people would
often demotivate you and try to bring you down
by saying that there is no future in athletics and
you will gain nothing by it. Do you think that
this backward mindset of the nation still exists
even after various athletes have won on the
international stage, and what do you think can
be done to destroy this stereotype?
DC: I believe that the dynamics changed after the
2016 Olympic Games in Rio de Janeiro, Brazil.
Back when I was a child, there was no media or
press. As a result, many lacked knowledge about
sports and were unwilling to participate.
However, the media today is covering the impact
of sports in one's life. A lot of conferences that are
held for the Commonwealth Games are
broadcasted on television, along with information
regarding the same being printed in newspapers.
People have begun understanding how the
government rewards players with prize money,
jobs, and sponsorships.
The Indian government has implemented a
number of initiatives, including the Khelo India
Scheme, the Reliance Foundation, and the Target
Olympic Podium Scheme (TOPS). These
programmes help athletes with their nourishment
and training. To state an example of the same,
rubber grounds were once only found in major
cities such as Bangalore and Delhi, but they are
now found in practically every state, including
places like Bhubaneswar and Punjab. Several
colleges are also building these grounds,
indicating that there has been significant progress.
YT: You were brought up in a family of six sisters
and one brother and were given the
responsibility of contributing to the family
income through athletics. People often
complain about having a less pay structure in
this field and that the government should be
giving more support to athletes. Do you think
that is the reason that the government cannot
support as many Olympians and athletes as
other nations? What steps can the government
take to ensure future athletes do not have to
face all the hardships you did?
DC: As an athlete, I can attest to the fact that the Indian
government goes to great lengths to encourage
athletes. The Indian government, in fact, supports
athletes and sportspersons more than foreign
governments. Athletes elsewhere have to cover
their own expenses for training and club
membership. On the contrary, here, children are
provided free training along with other
fundamental necessities. Many players, such as
Mary Kom, have received training in foreign
countries, with the costs being borne by the
government. Players having won an international
medal are guaranteed a Class 1 post and the
government assigns them to respectable and well-
known positions. Hence, the government has
been truly supportive of the holistic development
of the players in our nation.
YT: In 2013, you enrolled in the KIIT University to
study law. Even after becoming a national
champion at a very young age, your motivation
to learn and grow did not stop. What
importance do you think education holds in the
life of an athlete and what made you want to
pursue law even after having become a
successful athlete?
DC: The agenda behind educating myself is to get
information regarding the happenings in the
world. On the other hand, sports helps me in
staying fit, as well as making a name for myself.
This is why I have ensured that these two things go
hand-in-hand. There are people who study with

Ms. Dutee ChandINTERVIEW
YOUTHINK l 2022 l Vol. XVI 64
the aim of getting a job, getting admission in a
renowned institution such as IIT, becoming an
architect, or any other reason for that matter. I, on
the other hand, studied law so that I could remain
updated on whatever is happening in the society.
Moreover, I pursued sports because of my talent in
this field and because of the support that my
college provided for the same.
Education, without a doubt, is important in every
athlete’s life, because when they go to different
nations to represent their country, they will have
to meet and interact with new people and discuss
different matters, for which adequate knowledge
is required and can be only fulfilled by education.
YT: You have broken the 36 years of silence of a
woman’s participation in the Olympics sprint.
As a person who had to go through and
overcome so many obstacles, what do you think
is the foremost thing that got you where you are
now? In this regard, what message would you
like to give to the women of the country?
DC: There are a lot of events in the Olympics like
tennis, wrestling, boxing, shooting, and various
others. Even for athletes, there are different events
like discus throw and shot put, along with different
types of running, like 100-meter, 200-meter,
1500-meter, et al. When it comes to 100-
meterand 200-meter sprints, qualifying is, in itself,
extremely difficult. When I participated in the
Olympic sprint as the first woman in 36 years, the
qualifying mark was 11.30. It is only when I
qualified by beating this mark that I could
participate.
There was a time when, whoever used to stand
first or second in the country, could participate in
this sport. It does not happen like that now and
participation has become immensely tough. I am
privileged to have got the opportunity of
representing my country in the Olympics two
times, which has only happened due to my
hardwork and the support I have received from a
lot of people. I would like to tell everyone that if
they perform and play well, they will receive
support, whether it be from the Government or
any other private entity. However, if one is lazy
and refuses to work hard, they will not be able to
attain success no matter how much support they
receive.
YT: Every runner is determined, hardworking and
trains to the core of their bodies to come out as
an extraordinary athlete. Yet there are many
instances where people do not make it to the
top of the ladder. What do you think separates a
top athlete like yourself from the thousands of
others who have the same pursuit?
DC: Firstly, sports cannot be a career option for every
child. Those who have the required talent or
receive the adequate support are the ones who do
well in this field. One’s performance in any sport
varies, depending on these factors. Everyone who
wants to pursue sports should work hard for it, but
should also give importance to education at the
same time. It is when one feels that their
performance in sports has been consistently good
that they can gradually start giving more
importance to sports as a career. At the same time,
if one is not able to do well in sports, they need to
give more importance to education and studying.
But these two things need to go hand-in-hand so
that one can have both the options to choose a
career in. Through education, one can gain
knowledge and get the opportunity to work for
the society by getting a job in a particular sector.
On the other hand, sports can help one make a
name for themselves, receive financial support,
and get a job. Thus, a career can be made in either
and one should give importance to both of these
things.
YT: In the 2019 Summer Universiade in Naples, you
became the first Indian to win a 100m gold
medal in a global event. How does it feel to be
the torchbearer for millions of Indians who
have the same dream and what importance
does this feat hold to you?

INTERVIEW
YOUTHINK l 2022 l Vol. XVI65
Ms. Dutee Chand
DC: I felt extremely proud when I achieved this feat as
at that point of time, I was representing millions of
Indians. When I stood at the first position on the
podium and listened to the Indian national
anthem play, it was a great moment for me. On
that day, I felt that I had done something in sports
and that I had received the fruit of all the
dedication and hard work put in by me. Not only
was I feeling immensely happy, but I was also very
proud of myself.
YT: In one of your interviews, you stated that you
want to join politics after retiring from your
track career. What is it that motivates you to
join politics and what changes do you want to
introduce to the system once you have joined?
DC: According to me, ‘politics’ is just a term. Politicians
are those who work for the betterment of the
nation. If you look at my life, I have been working
for myself, my family, my village and my nation
since my very childhood. Considering that I have
been working for the country for such a long time,
I will definitely take up the opportunity of doing
more for the society if I get such a chance in the
future. This is why I want to join politics, so that I
get the power that is required to help people in
the society and bring about a significant change. I
am focused on sports right now, but I want to join
politics after retirement so that I can help the poor
people who want to join sports by providing them
with the required support. I will focus on
identifying talent in local and rural areas across the
country and provide them with proper training by
setting up institutes in such places. Although this is
what I want to do, I am still playing now and I
haven’t planned everything properly in this
regard.
YT: The zeal inside you to always achieve
something better is commendable and your
passion has been a source of inspiration for
millions around the country; the students of St.
Xavier’s College (Autonomous), Kolkata are no
exception. What message would you like to give
to them and all the young athletes taking their
first steps on the track?
DC: I would advise everyone to study hard and
participate in sports at the same time. Education is
important so that one becomes knowledgeable
and sports is important for one’s fitness.
Nowadays, people don’t focus on fitness, and all
they do is study. They solely focus on studying for
many years and later worry about the fact that
they have become unfit. This is why I would
advise all the athletes and players in the college to
study as well, and all the other students to focus on
sports as well. It is not necessary for someone to
take part in sports to represent the country. They
can also do so to maintain fitness and will
gradually see an increase in their stamina and
power. When this happens, they can win medals
in competitions that they participate in, making
themselves and the country proud.

INTERVIEW
YOUTHINK l 2022 l Vol. XVI 66
YT: You were the president of the Cambridge
Union, which is a society focusing towards
debating and free speech. In contemporary
times, where importance is being given to
discussion of different opinions, how vital are
such institutions in upholding these values?
KT: The Cambridge Union is over 200 years old.
Obviously, debating societies are ipso-facto
dedicated and predicated upon free speech and
freethinking, but at the end, it is a debating
society, and that is its main function. It is about at
least 15 years older than its Oxford junior
equivalent, and what it does is invite people to
discuss subjects so that young college students,
who have an interest in debating are able to do so.
Often when you're debating, you are asked to
propose or oppose a motion, it is not necessarily
your personal belief and your personal opinion.
You're simply arguing a case. It is the fun of
debating that draws people to the Union, and you
debate regardless of whether you personally
believe it or not. You're not actually pronouncing
to the world your personal beliefs. It may be, and
they may well on some occasions be the case, but
that is not always the case in any debating society
anywhere in the world.
YT: When you had been offered a job at the Times,
you decided to discontinue D.Phil at Oxford
University. Having studied an array of subjects
at graduate and undergraduate level, what
drew you to take up journalism, when you could
have easily pursued more lucrative careers?
KT: I stopped my D. Phil at Oxford because I was
offered a job by the Times, and I knew if I didn't
take up the job that the Times was offering, they
wouldn't keep it open for me. At the time I
thought, wrongly as it turned out, that I would be
able to finish writing up my D. Phil thesis but
obviously that was wrong. My job took over my
time, and as months turned into years, my
distancing from the D. Phil thesis also meant that
my interest in finishing it had begun to diminish.
Then you get so taken up in your career that you
no longer think of yourself as a D. Phil student or
an academic. You become more journalistic in
your thinking, attitude and aptitude and less
scholarly. Then, you suddenly discover one day,
three-four years down the road, that you have
changed and become a different person. The
importance of finishing a thesis that was so
prominent and predominant in your life four years
earlier, no longer is and that is what really
MR. KARAN THAPARIndian Journalist, News Presenter and Interviewer
Taken by the Editorial Board
INTERVIEW
YOUTHINK l 2022 l Vol. XVI67
Mr. Karan Thapar
happens. I suppose the truth is that events and
opportunities overtook me.
YT: Journalism, as a profession, has been facing
criticism as a section of the population believes
that it has begun enforcing its opinion on the
general public. Is there any truth in this
perception? If there is, what do you think is the
reason behind it and how can constructive
change be brought about?
KT: This depends upon which journalist you're talking
about, or which paper you're talking about. I don't
think a single broad sweeping statement is true for
every paper and every journalist, so that is the first
point to make. Secondly, by and large, news
reports tend to be objective in the sense that the
facts they're citing are truthful and not made up.
But the facts they cite may be selective and that is
another matter because sometimes, the full
compendium of facts make a different impression
to the one that you choose to pick upon. So,
selectivity can also introduce bias, but that is not
necessarily the same as being untruthful or making
things up; that is a second sort of problem.
But if opinions come through in op-ed pages, then
that is perfectly understandable because that is
what op-ed pages are meant for. By and large, I
would be reluctant to come up with a general
sweeping statement to brush all journalism aside
because that would be wrong, it would be
mistaken and fully misleading.
YT: You returned to India in 1991 and have since
interviewed a host of politicians and continue
to do so even today. Over these 20 years, have
you noticed any particular change in the nature
of politicians towards the press and media?
KT: Well, over the years that I have been interviewing
politicians, I think they've become savvier. They're
more aware, and they're also better instructed by
their colleagues on how to handle interviews and
perhaps specifically, how to handle difficult and
aggressive interviews. Therefore, no longer do you
have politicians like one did in the 80s, who
would say, time and time again, 'Don't say
anything about Rajiv Gandhi!', which is a very silly
and shallow way of handling questions about the
Prime Minister. Today, they're infinitely more
thoughtful about their response.
However, and this is very important, they've
acquired a new bad habit, which wasn't so
prevalent in the 80s and 90s or even the early
2000s. That bad habit is to refuse to give
interviews to people who you think will give you a
tough time. The challenge of handling that
interview is altogether done away with, because
you've already decided that you won't give them
an interview and that is a terrible practice because
this is just contempt for people trying to hold you
to account; it suggests also, subliminally, that you
don't know how to respond to the questions they
ask. It also shows that you're not willing to be
made accountable, which politicians should and
must be.
YT: You interview people from many different
domains and fields of expertise which range
from economics to biology and in order to
question them, you have to be as adept at the
subject as them. How do you prepare for the
interviews, particularly those which do not fall
within your area of knowledge?
KT: 90 per cent, if not all of the interviews I do, do not
fall within my area of knowledge; that would be
the case with any interviewer on any television
channel, and what you have to do is to research,
reasonably comprehensively and widely. What
you need to do after that is discuss the structural
strategy of the interview with your colleagues, and
then devise questions that ensure that you get in
that direction. A lot is learnt through experience
and understanding of the task that you're doing.
But I would say, the most important thing for any
interviewer is to know the subject fairly well and to
have read reasonably comprehensively around it.
You are an interviewer and you can never know as
much as the people you're interviewing. They're
experts, you're not, and you must bear that in
mind. You must've done a certain amount of
strategic structured reading, so that you're aware
of what they're likely to say, and if there's a need to
counter, you know how to counter it. That is a part
of the process of research, and, more importantly,

Mr. Karan ThaparINTERVIEW
YOUTHINK l 2022 l Vol. XVI 68
part of the process of structuring and discussing
with your colleague about the interview.
YT: Your book, Devil’s Advocate, reveals many
riveting incidents of your professional life
which were previously unknown to the public.
While writing such accounts, how do you
decide what can be revealed while still being
within the bounds of professional ethics,
particularly when a few of the instances might
not cast your guest in a good light?
KT: I simply chose those which I thought were
interesting, both to me as an author, as well as to
what I presumed would be the case for the
audience or the readership, and wrote about
them. The fact that, sometimes, people that I am
writing about may not emerge in a good light was
not a major concern because as long as I was
telling the truth, it didn't matter too much to me.
Obviously, I was not asked to malign or hurt
people, and I ensured that didn't happen. But, if
telling the truth meant that sometimes they were
depicted in a light that was not as favourable as
they would want, well, that is just a fact of life.
YT: At a time when everybody is using social media
to increase their reach and interaction with the
audience, you are not on any social media
platform at all. Does this aversion to social
media entail a conscious rationale or, is it
merely a personal choice?
KT: It is definitely a personal choice. The reason being
I don't see the need to broadcast my views on
every subject to everyone, and I don't understand
why people would be interested in them.
Secondly, Twitter only gives you 290 odd
characters, and there are many subjects on which
abbreviating your views to 290 characters is not
just to simplify it, but makes it rather simplistic and
distorted. So, for both those reasons, I see no need
to be on social media.
I wrote columns for papers, and if people want to
know what I think of certain matters, they can
read the columns. I sit for interviews, so you can
get a sense of my thoughts about these subjects
from the questions asked, but not a lot, because
remember, my questions don't reflect my
viewpoint - they reflect the job I'm doing, which is
to often play the devil's advocate to someone else.
YT: The creation and propagation of fake news is
becoming a serious problem for India as a
society, leading to several rumours and
misconceptions. As one of the senior
journalists in the country, what steps do you
and the media fraternity at large take to keep
the emergence and propagation of fake news in
check?
KT: Basically, when it’s a matter of fact you try your
best to clarify and make accurately sure that those
are the correct facts. There is very little that I take
from WhatsApp because I'm not on social media,
so I don't go to people's Twitter accounts to find
out what happened. I tend to rely on newspapers,
television channels and on first-hand accounts of
what has happened and, as often as possible, give
source material so that I can say where I have got it
from. I do not get my facts from Twitter or social
media.
YT: Over the years, your words have had a
considerable influence on society; the students
of St. Xavier's College (Autonomous), Kolkata
are no different. What message would you like
to give to them?
KT: I would say to all the students in any country, at
any time, be yourself. Never be shy or scared
about expressing an opinion. If it’s wrong - fine, so
what? It's not the end of the world. One learns
through one’s mistakes but have the confidence to
say what you believe. At the same time, have the
willingness to keep your eyes and ears open and
adjust your thinking as the surrounding
circumstance changes. Be open to new ideas and
stand up for your beliefs. If you believe that
someone else is being wronged, stand up for
them. There is no point in believing someone has
been wronged and keeping quiet about it because
that’s the easy way of seeking cheap popularity for
yourself. That is a coward's position. So, be true to
yourself and be proud of it and be confident about
it. Thus, when the world changes, you must
change as well.

INTERVIEW
YOUTHINK l 2022 l Vol. XVI69
YT: As someone who started his journey in the
fashion designing industry with minimal
knowledge and training, you have emerged as
one of the most accomplished fashion
designers in India. Having worked in this
dynamic industry for such a long period of time,
how did you manage to develop your skills
while applying your creativity in different
projects?
KT: Browse and observe, interact with the young
generation about their needs and aspirations. It
can be challenging to keep up, but what keeps me
going is my curiosity towards this ever-changing
world of trends and still infusing my bit of
individuality to their taste.
YT: You have, from a very young age, been
passionate about fashion designing, because of
which you chose a career in the fashion industry
over your established family business. Given
the uncertainty of success in pursuing an art,
how did you gather the courage to pursue
fashion designing when you had a well-planned
future already laid out for you?
KT: Well, art can help alleviate uncertainty. Of course,
there is no guaranteed solution to overcome
obstacles, so I chose to take as much advice from
artists and designers as I deemed fit. I learnt on the
go. I took every opportunity to observe and learn
from it, and my passion took me forward. We all
have different circumstances and ways of
approaching artistic practice, and in the end, only
you can decide what is best for you.
YT: As the world grows smaller because of social
media, our lifestyles are being influenced by
the best of all cultures. When it comes to bridal
couture and wedding collections, how do you
think the fusion of Indian and western
silhouettes is influencing fashion designing
today?
KT: Today, both men and women want contemporary
styles and vintage charm to blend. I believe fusion
wear leaves ample room for getting as creative as
one can be with their choice of clothes. It allows
the person to break away from the norms. Our
designs cater to such demands and need to have a
heavy western and Indian influence in one outfit.
MR. MANISH MALHOTRAIndian Fashion Designer, Entrepreneur and Filmmaker
Taken by the Editorial Board

Mr. Manish MalhotraINTERVIEW
YOUTHINK l 2022 l Vol. XVI 70
But then, when it comes to traditional as well, I
have always believed that we should keep the
tradition intact where we celebrate our age-old
crafts and embroideries and give a modern twist
with our cuts.
YT: You played a key role in the 'Behind the Mask'
campaign which aims to assist the artisans and
craftsmen who lost their livelihood during the
pandemic. As a member of both the Bollywood
and the fashion industry, do you think that
these artisans and craftsmen do not get the
deserved recognition? What can be done to
supplement their craft by the government and
the society alike?
KT: We have been working with local artisans for
decades now. Mijwan Welfare Society is an NGO
which is very close to my heart, where I work with
Shabana Azmi and Namrata Goel to empower
women who produce some of the most beautiful
chikankari work for the Manish Malhotra brand. I
believe that we are in a position where we should
listen to their voices, build on their strengths and
think out of the box. They preserve our age-old
crafts and hone their skills for years. Therefore, we
should collectively address that and help them in
every possible way to encourage and support
them.
YT: Your work involves dealing with several high-
profile clients and understanding what they
exactly want. After almost 15 years of the
launch of your label, which now has an
established brand name, do you think that
interpersonal skills are a necessity in the
fashion industry so that one's craft can be used
effectively to meet the needs of the client?
KT: In absolutely any industry, confidence is important
even when you lack validation. Optimism works
even when you feel low and defeated and most
importantly, love and passion for what you do will
always show in your work which people will
recognize and appreciate. All of this helps you to
strike the right conversations where you will find
yourself talking about subjects that will flow
naturally, hence enhancing your interpersonal
skills. Of course, when that happens, it
automatically helps you develop this skill further,
gradually understanding the needs of your
audience.
YT: Fashion is always evolving, morphing, and
transforming and thus, it is very important to
keep up with the trends and be mindful of the
changing environment. In instances wherein
your personal views are contrary to the existing
trends, how do you maintain objectivity and
take initiatives against your intuition for the
benefit of the organization?
KT: Every day comes with a new trend, something
more fun and exciting than yesterday, and it is so
natural to go where everyone else is going. But I
am very well aware of my traits, goals and
prioritize them over everything else. Also, I have
been known to work with my intuition, so no
matter what the trend is, if I am not feeling it, I am
not succumbing to it just because everyone is. For
me, I choose to create my own.
YT: When you design costumes for a movie, the
work has to be done keeping in mind the
demand of the script. In such instances, are the
costumes designed solely based on the
storyline or do you try to incorporate the
current trends in those designs too? In the latter
scenario, how do you ensure that these trends
blend perfectly with the storyline?
KT: The script is very important when it comes to
movies. You cannot have someone look
glamorous if the character they are playing is a
simple one. The style of the character helps the
audience understand the story better because not
only do they see them act the character but they
also see them look the part which makes it
convincing. So, I have always stuck to the
character, no matter what the on-going trends are.

INTERVIEW
YOUTHINK l 2022 l Vol. XVI71
Mr. Manish Malhotra
YT: For an already established brand in the fashion
industry, creating trends is more important
than catering to the existing ones. Having
already established a brand name for your
label, do Bollywood movies play a significant
role in helping market the brand and its new
collections or are these projects merely a
source of generating revenue?
KT: The fashion in movies has always influenced our
real life. All of the looks that I created on screen,
turned into some of the most iconic looks for the
audience. Whether it is Kareena Kapoor in ‘Kabhi
Khushi Kabhie Gham’ and ‘Jab We Met’ or be it
Priyanka Chopra and Deepika Padukone’s sarees
in ‘Dostana’ and ‘Yeh Jawaani Hai Deewani’, and
many more. Till date, we have requests from
clients to replicate the look for them which is a big
compliment and for which, I am grateful.
YT: You have become more than a destination for
timeless Indian fashion and your creation spans
across broad spheres of Bollywood, styling,
diffusion and everlasting bridal and
customized designs. What message would you
like to give to the students of St. Xavier's College
(Autonomous), Kolkata to motivate them to
pursue their dreams?
KT: Work hard, stay focused and learn to love
whatever you do. I truly believe that if you love
what you do, you will never feel like it is work. Be
passionate and driven and at the end of it all,
never give up.

INTERVIEW
YOUTHINK l 2022 l Vol. XVI 72
YT: At the age of 28, you took charge of the Income
Distribution Division in the World Bank's
Development Research Centre. Having been
the youngest Division Chief in the World
Bank's bureaucracy, how important do you
think is the role of youth in bureaucratic jobs?
MSA: All bureaucracies have younger people. The real
issue is - do younger people get promoted
rapidly to management positions? I think there is
a huge benefit of having a sprinkling of younger
people at higher levels. However, for this to
happen, you have to get away from seniority as a
dominant factor in promotions. That's not easy in
the government sector though it is easier in the
private sector.
YT: You were the first Director of the Independent
Evaluation Office at the IMF. What, according
to you, were the major flaws in the IMF which
led to the establishment of such an office?
MSA: The Independent Evaluation Office (IEO) was
created in the aftermath of the East Asian crisis of
1997 where the IMF was perceived to have
failed to identify the buildup of vulnerability
preceding the crisis and also made the wrong
recommendations for solving the problem when
it arose. The IMF's remedies worked quite well in
Korea but not in Indonesia. In some ways,
Malaysia, which departed from the IMF mantra
by introducing capital controls did quite well.
The IMF's failures were analyzed in a report
produced by the IEO when I was the Director.
YT: You resigned from your role at the IMF to take
up responsibilities as the Deputy Chairman of
the Planning Commission. What motivated
you to take up this new challenge and make a
switch from the international platform to
serve the country?
MSA: In 2004, it was too good an offer to take up the
role of the Deputy Chairman of the Planning
Commission as a part of the government in New
Delhi and I had no hesitation resigning from the
IMF position. I had always wanted to contribute
to policy-making in India. This is the reason why I
returned from the World Bank in 1979 as well.
The invitation to return as the Deputy Chairman
was a godsend, and I had no hesitation in
accepting it.
MR. MONTEK SINGH AHLUWALIAIndian Economist and Civil Servant
Taken by the Editorial Board

INTERVIEW
YOUTHINK l 2022 l Vol. XVI73
Mr. Montek Singh Ahluwalia
YT: You were the Commerce Secretary when the
1991 reforms were undertaken which opened
up India to the entire world. Recently, there
has been a wave of Deglobalization which has
been driven by the European nations and
persisting trade wars. Retrospectively, is there
anything that India could have done
differently in going about these reforms and
what do you think is the reason behind the
emergence of the diminishing inter-
dependence?
MSA: I do not think that the deglobalization we have
seen in recent years is the result of anything we
did. We were absolutely right to open up in
1991. In fact, we should have done it much
earlier. We got a lot of benefit from what we did
in 1991. However, we have not gone far enough.
We still have very high rates of import duties as
compared to other countries and we have raised
these in the past four years. I personally think this
is a mistake. The current deglobalization reflects
the nervousness of developed countries facing
competition from developing countries, most of
all from China. Since China is also seen as a
threat to their global supremacy, this is an added
factor underlying the retreat from globalization
in the West. However, we should not conclude
that the days of open trade are over and go back
to protectionism ourselves. In fact, the
nervousness about China creates opportunities
for India because in the search for non-Chinese
dominated supply lines, we could play a major
role. But for this, we need to have a more open
approach.
YT: There have been several arguments as to
whether the Indian economy is doing well in
the current scenario. Having served as an
Advisor to the Ministry of Finance and having
been a part of the Planning Commission, what
are your views when you look at the state of
the economy right now?
MSA: According to me, we face three problems. First,
we were hit by the pandemic in 2020 and we are
still battling it. This was bound to depress growth
in 2020-21 though it is arguable whether we
could have done better. Other countries did not
have as sharp a slow down as we did. Second,
the pandemic is not the only problem. Our
growth rate had begun to slow down even before
we entered the pandemic. India witnessed a
very high growth averaging about eight percent
upto 2011. The economy then slowed down in
the last three years. There were many reasons for
this and I refer you to ‘Backstage: The Story
Behind India’s High Growth Years’ for a detailed
analysis but it was undoubtedly a slowdown and
inflation was also high. Then, there was a new
promise of a return to double digit growth and
for the first three years until 2017-18, growth did
improve but thereafter, it slowed down. In the
last year, before the pandemic, growth was only
four percent. This raises the third issue. Once we
recover from the pandemic, will we go back to
the high growth experience or simply get back to
the tepid growth of four to five percent which we
saw before the pandemic? The answer to this
question depends in part on what we do and in
part also on how the world economy performs. I
think we can assume that by the end of the
current year we will be back to the pre-
pandemic situation. We need to think about the
policies and economic reforms needed to
stimulate high growth.
YT: The Prime Minister of India laid down the
target of making India a $5 trillion economy by
2024-25. What, in your opinion, is the
roadmap to achieving this optimistic
economic goal?
MSA: The 2024-25 target is obviously not feasible now
in the light of the pandemic. Our objective
should be to get back to seven plus per cent
growth from 2022-23 onwards. I cannot go into
all the policy issues we have to address in this
interview but you will get an idea of the main
issues from Backstage, as I mentioned before,
which provides some indication of the agenda
ahead. To that, we must now add, combating
climate change. It is a big agenda.

Mr. Montek Singh AhluwaliaINTERVIEW
YOUTHINK l 2022 l Vol. XVI 74
YT: Your book takes the reader on a journey
through India's reforms while also advocating
for the dire need for new economic reforms.
You have also mentioned how corruption is
emerging as a barrier to growth. What are the
necessary actions that can be taken to
eradicate the same?
MSA: Corruption is a problem in all countries. There
are many international indices of corruption and
India is not among the worst. It comes out
somewhere in the middle. The usual
characterization of corruption is that of a process
in which government action is subverted to the
benefit of individuals either outside the
government or inside. In other words, bribes are
paid by individuals to get government officials to
act in their favour, or are simply extracted by
government officials for their own benefit by
raiding individuals and denying them what is
otherwise their due. This type of corruption has
to be handled by action on many fronts. The laws
and rules under which people must operate
should be clear and processes of the government
decision-making should be as transparent as
possible. Enforcement of laws should be strong
and the legal machinery once started should also
take its course quickly. The judiciary should be
independent and should command the trust and
respect of the general public. These are general
requirements valid for all countries. They do not
guarantee that there will be no corruption.
However, a system that is strong on all these
fronts will have less corruption.
A second aspect of corruption is the link to
election funding. It is no secret that elections in
India typically involve huge expenses much
beyond the levels specified by the Election
Commission. The need to collect such resources
also encourages corruption. This, again, is not
just a problem in India. It is there even in
developed countries. Much of the debate about
rising inequality in the U.S. is fueled by the belief
that the growing concentration of wealth enables
'money power' to manipulate government
decisions in its favour. Business is seen to be
closely linked to election funding. Here again,
the only solution one can think of is more
transparency in the mode of election funding
and an electorate that is aware and
knowledgeable.
YT: You have worked in the highest echelons of the
World Bank, the IMF and the Indian
government. Which of these roles did you find
the most challenging and what is the reason
behind it?
MSA: I have absolutely no doubt that it was my stint in
government from 1985 onwards which has been
the most challenging. I learnt a lot from my
international assignments but if you are
interested in policy-making, you can only do it in
your own country.
YT: As a person with considerable experience and
one who has made the best use of education to
achieve great things in life, what message
would you like to give to the students of St.
Xavier's College (Autonomous), Kolkata?
MSA: This is the most difficult question you have
posed. I would only say that you should look
inwards and decide what you really want to do
and then do it with all dedication. Whatever you
do, you should be ready to work hard towards it
and not look for quick rewards. Also, remember
that your life will be full of greater uncertainty.
So, do invest in yourself constantly and be ready
to be flexible in adjusting to changing
circumstances. I fear replication of older success
stories is not helpful because the world is
changing rapidly. Most of the jobs which you
think are attractive today, may not be there
twenty years from now. But the general advice is
that one must do what one wants to do and work
hard at it; that is good advice in my view.

INTERVIEW
YOUTHINK l 2022 l Vol. XVI75
YT: During your childhood, you had been
surrounded with the thought that your voice
was not fit for music and now you have
emerged as a singing sensation in the country,
without any formal training. Considering that
you decided to enter the music industry in the
1970s, at a time when pop wasn't looked upon
much as a music genre in India, what has your
journey been like?
UU: My journey of 51 years has been a wonderful
one and I really don’t make sensational copies or
have any hard luck story. The reason why it has
been so, is that I was lucky to come on at the time
when it was the prerogative and the privilege of
the so-called Anglo-Indians to sing at the
nightclub. When you say pop culture, as far as I
am concerned, this whole misconception is
there about what pop is. It is just the short form of
popular. So, whatever is popular is pop music. So
popular music is what I was singing and what I
am singing now is also popular music. All the
people in the films also were singing only pop
music and people didn’t want to call it that
because they felt, or the misconception was that
only English music could be pop and only fast
music could be pop.
I think I came on at a time when people really
thought of a nightclub as a bad place to go to. I
wouldn’t say bad, not such a nice place to go to
as it was only frequented by men. But, by the
time I came onto the scene, people started
feeling that it was okay to do so, because of the
kind of image that I had, wearing a saree, ‘bindi’
and flowers in my hair, totally ‘gharelu' (homely),
girl next door kind of image that I had, the people
just accepted me. The women in the audience
were and still continue to be my biggest support
because they have always felt that they could
relate with me. Soon the nightclub became a
place or, wherever I was singing became a place
where everybody was coming in. Not just the
men in the family but the wives, the children,
everybody. It became a family kind of thing and it
was considered okay. But I don’t agree with the
fact that pop music was ever looked down upon.
It was not considered, that is true. Good girls,
coming from good families didn’t really go into a
nightclub and sing. So, considering all that
change brought on, my journey has been really
fantastic.
There have been lots of ups and downs and highs
and lows, like there are in anybody's life.
MS. USHA UTHUPIndian Playback Singer
Taken by the Editorial Board
Ms. Usha UthupINTERVIEW
YOUTHINK l 2022 l Vol. XVI 76
Sometimes the highs were more, sometimes the
lows were more, but it has been a great journey
and the reason for my journey being so good, is
to be Indian. My audience and my family were a
really good infrastructure of support. The family,
the audience, the musicians, and, of course, God
above made my journey really fantastic and all
the people that I met during my journey, have
really made it good and exciting. But, let me also
tell you that I never decided, never thought, that
I would become a singer, leave alone pop or a
nightclub singer. I never ever thought it would
happen, but it did.
YT: When you entered the music industry you had
no in t e rna l connec t i ons o r p r io r
acquaintances. Lack of social media back then
implied even fewer means to gain popularity
at that time as compared to the present
scenario. How difficult was it for you to make a
name for yourself on such a scale and what
inspired you to keep going throughout?
UU: As I mentioned before, I do not have any hard
luck stories to give of struggles and things like
that. And yes, considering that I had no godfather
or godmother in the film industry or any industry,
how difficult was it for me you ask? How have I
stuck it out so long? I stuck it out for so long
because I think one thing led to another. I come
from a time when there was no electronic media
and there was only the print media. So, in the
print media, whoever caught me at shows, wrote
about me and people read about me. They
wrote about me in the newspapers and the
magazines. Word of mouth and the print media
have always been the strongest element. And so,
slowly the word started going around about a girl
who is really good and different, so let’s go and
listen to her. The reason why I have lasted so
long, is because I have really not made
compromises on the way I look, or on the fact
that I am 100 per cent who I am. What you see is
what you get and it has always been like that.
YT: You made your acting debut back in 2006 and
later on made appearances in many
Bollywood and Tollywood movies, like ‘Pothan
Vava’. What inspired you to opt for acting in
the industry where you had already
established yourself as a renowned singer?
UU: What inspired me was the fact that I realized very
early in my life, the intoxication or the
appreciation that I get from the audience is what
really makes me tick. My whole world revolves
around music and love and which is why I say I
believe in music and love. And when I started
getting that from the audience, it really spurred
me on and that has been my biggest inspiration.
But if you say what has been my inspiration to
sing, I would definitely say I come from a very
musical family. My two elder sisters, Indira and
Uma, were musically inclined, they were the
original Singing Sami Sisters and so there was
music all around me. My influences have been
great, but my singular inspiration has been the
radio. Radio salons and channels like Voice of
America, BBC, Vivid Bharti - wherever I got good
music, I listened to it as a child. So, in school also,
even though I was not given a place in the choir,
it didn't stop me from enjoying music or listening
to music. So, I think the inspiration has really
been my audience and as I always say music is
cyclic. What you give to them always has to
come back to you and with no expectations,
unashamedly I sing and give my everything
because for me love and music makes the world
go round. And as far as I'm concerned, music is
not my business, communication is. So, I'm
always trying to see how better I can
communicate with all of you and so with that, I
keep practicing how to communicate with you.
For me, a song is a song. I don't believe that there
is anything bigger than that. I do believe that the
song is always bigger than the singer. So, all these
things inspired me when I realized how
important it was to communicate my song or,
communicate the lyrics of my song or, the tune of
the song or just communicate with my audience
and once I achieved that communique, every
day I’m practicing that, every moment of my life I

INTERVIEW
YOUTHINK l 2022 l Vol. XVI77
Ms. Usha Uthup
am practicing how to communicate better with
you. That has been my inspiration, how to keep
on going at it and how to reinvent myself, reboot,
rediscover, revisit and try to do things better than
I did the previous moment. That is my
inspiration.
For me music and acting, really are not
something very different. My acting is really an
extension of my music, everything that I feel in
my music. So, I got the opportunity, first of all,
when I acted with Amitabh Bachchan in
'Bombay to Goa', then I did a part with Shashi
Kapoor and Aparna Sen in 'Bombay Talkies' and
also appeared with Kamal Hassan. But, of
course, 'PothanVava' was really the icing on the
cake. I have done a lot of Bengali work also, like
Bengali films and serials, and I feel that music and
acting are not so distinct. However, it is different
because you have to do so many takes, but for
me acting is very important.
YT: In recent years, we have seen a trend of
remakes of old retro music in Bollywood.
What are your views on this recent shift in
trend and do you think that these remakes are
faithful to the ideas and melody of its original
form?
UU: In my time nobody called it a remix. Nobody has
an original song to sing when you start your
singing, or at any time. If you want to sing a song,
surely it is not going to be your own unless you
make the song originally, and I have always made
every song my own. Whatever you sing,
whatever is out in the universe is yours, it’s for
you to sing. We never called it a remix, we just
called it our own version, or as it was called in the
western world, an interpretation of a song. So, I
am not saying that all remixes or all
interpretations are very good but, I will never say
that all remixes are bad. I think it is very good
because the old tunes are preserved and brought
in front of the youth today, which they would
have otherwise missed. There are a lot of songs
which they would have never heard because
they were extinct.
There are so many beautiful tunes, Rabindra
Sangeet and music in the universe. Music is
cyclic, so the old songs are called retros, because
everything old keeps coming back. It has to come
back. Hence, everything can’t be called a
remake, it is a version. If I sing a version of a
particular song, it doesn’t have to be a remake. I
am not on the same page as the people who call
it a remake. Nobody changes the tune, only the
treatment is changed and if the treatment is
changed, but you are faithful to the original
melody and lyrics, it is a good thing. I think it is
fantastic. It is one way of preserving the old
tunes.
YT: Over the years, you have judged several
Indian music reality shows. On many
occasions, we have seen very young children
being forced into stardom by their parents, or
the toll of popularity and fame falling upon an
individual who is not ready for it, eventually
leading to their failure. In your opinion, what
role do music reality shows play in the careers
of budding musicians?
UU: This is a matter that often comes into discussion. I
think reality shows are, if you have to grade them
on a scale 1 to 10 according to what is good and
what is bad, I would definitely say that reality
shows have been great in exposing the talent that
India has and bringing it to the forefront since
there was no other exposure. Now with reality
shows, everybody who has got some talent has
come on to the scene and I think that is
wonderful. Reality shows are great, otherwise we
would’ve missed the talent that we have in our
country, and they wouldn’t have gotten the
exposure. This is on the upside and I think I
would say 9 out of 10 for the upside.
However, on the downside, people are saying
that it isn’t as good as there is a lot of politics, and
there are a lot of things which are scripted.
People are so negative in thinking all sorts of
things about reality shows but as I said on that
scale, I would probably put it down to maybe 4
out of 10. It’s not good for one reason and that is
the pressure put on the children, especially by

Ms. Usha UthupINTERVIEW
YOUTHINK l 2022 l Vol. XVI 78
the parents, that they have to win and be better
than somebody else. This is not a healthy
competitive spirit. However, it doesn’t matter
because the good outweighs the bad. It also
shows children how to practice well and gives
them all a chance to really look into their mind
and see if they really want to do this or not.
YT: You have worked with great music directors of
different eras like Late R.D. Burman, A.R.
Rahman, Salim-Sulaiman and many others.
How do their ideologies to music and
production differ? Is there any particular
incident that you recall which has left a long-
lasting impact on your life and career?
UU: Everybody has their own ideas of how to present
certain music and how to sing a particular song.
The kind of impact that people have had on me
has been immense and I think that I'm not here to
judge their ideologies but I would definitely say
that it has been great working with some of the
legends of the industry like for example - R.D.
Burman, Shankar Jaikishan Ji, Laxmikant-
Pyarelal Ji. I have worked with Anu Malik and
Anand-Milind, as well as with their father
Chitragupt Ji. I have also worked with A.R.
Rahman and Vishal Bhardwaj and Bappi Lahiri
and of course the King of Music- Ilaiyaraaja Sir
from the south. It is fantastic that one gets an
opportunity to work with them and all of these
people have had a great impact on me. The
impact is that each song that has been a hit has
given me 365 or 755 shows. I am still doing the
shows with the songs Shaan, Hari Om Hari and
Ramba Ho and I’m still getting by because of
that. I think I am nobody to talk about their
ideologies because I never knew all of them
personally. Yes, R.D. Burman I know very well, I
know most of them very personally but never got
into the ideology that they follow. But the thing
that is definitely there is that music brings people
and the world together and has shrunk the
world. So, I would definitely say that the impact
they have had on me, especially the people I
have worked with, more than the others, would
be the fact that I am always open to learning from
them and I am happy to learn.
I have done a whole series of children’s work like
country rhymes and working with the Pilot
brothers has been a learning experience for me. I
see everything I do as a learning experience and
musically, it has been a great impact on my life.
Ilaiyaraaja Sir and R.D. Burman have been huge
impacts in my life.
Everytime you work with the smallest, or the
youngest of music directors, anybody who gives
you a song to sing, there is so much to learn. So,
for me, my greatest ideology has been to keep
your ears and your hearts open all the time
because there is so much to learn. Whether the
person is a young person, or an elderly person, it
really doesn’t matter. The point is that you must
be open to different methods, different
approaches for the same goal and the goal is, of
course, to make music so that people would love
it. I think for me the most important thing is that
you must allow somebody to make an impact on
you and they have all been very impactful. You
learn different methods of saying certain words,
certain notations, everything put together. They
have all had an impact on me because I have
always been open to learning.
YT: You have been in the industry for more than 50
years and have witnessed the evolution of
music over time with the introduction of
countless genres in the Indian music industry.
What is your opinion of the modern trend of
music in India, with the takeover of hip hop
and the large-scale use of auto-tune
software’s?
UU: As far as I am concerned, technology has brought
about precision into our music. Technology has
brought about improvement of being able to
separate music and the different instruments. It
has helped us a lot, and it is unrecognizable.
When I say unrecognizable, I am saying you
cannot really pinpoint that this is good because it
has been done through technology. There are so
many ways you can sample great sounds of big
artists, like the drum samples of somebody and
the guitar samples of somebody else and then
compose a tune based on that. That is wonderful

INTERVIEW
YOUTHINK l 2022 l Vol. XVI79
Ms. Usha Uthup
and I don’t think there is anything wrong with
that. I am also not totally against autotune. Yes,
there are people who are not serious about it and
that is not nice. When they sing the song and
they leave it to the sound engineer and ask them
to fix it or do the autotuning, then that is
something I am not for; I am totally against it. But
nobody is perfect. So, if there is a little mistake
and you have the facility of an auto tuner then it
is good. It is good for the people who depend on
that, good for the sound engineer to know that
he has a facility for doing this. Thus, autotuning is
good where the whole song is fantastic and
maybe just half a note somewhere or half a word
has gone a little flat or sharp, then at that time,
autotuning is good. I don’t think everything
about it is bad.
However, what is bad about autotuning is that
nowadays everybody seems to think that they
are good at music and sing whatever they want to
and get it auto-tuned. I think if it is used carefully
and used sparingly, it can be of aid to the final
production. But, when someone is singing
completely out of pitch and out of scale, and
then fixes everything in production with
autotune, then it is bad.
As far as hip-hop goes, if someone tries to say that
it is a western type of music or, it has been there
for time immemorial, don’t forget that there are
only eight notes and every song is a combination-
permutation of that. So, as we become more and
more a part of the world, slowly there will be
influences coming in from everywhere and that
is natural and there is nothing wrong with that. If
you take all the good things from outside, that is
all right.
YT: The mass consumption of music implies that
its production involves multiple actors, whose
sole motive is to ensure its commercial
success. As an artist, how does one balance
creative freedom with the temptation of fame
and popularity?
UU: You know this has been an age-old discussion
and, as I have said before, to discuss this question
you will definitely need more than just one
column in the journal. But as far as I’m
concerned, these two are connected. If you’re in
the entertainment business, isn’t it a fact that you
are a creative person and you create so that
maybe, at the back of your mind, although that's
not your priority, you gain popularity and fame?
Somewhere in your subconscious, isn’t it that
you create something for people to appreciate?
You create, but the temptation, as you say, the
temptation to get fame and popularity makes
you compromise on the quality then that, of
course, is not good. If one forgets about the
creativity, sensitivity and the sensibilities of a
good composition just because they want to get
famous and popular, that’s not true. But, if there
is a point where you are so bothered about being
popular and famous that you make compromises
on creativity, then that is bad, which I don’t agree
with. There should be absolutely no compromise
on your creativity, but definitely, creativity, fame
and popularity are all linked.
YT: Historically, pop culture in India has always
been related and restricted to Bollywood
music. However, recent times have seen a
rapid growth in independent music, with local
bands and artists thriving and releasing
multiple albums. With their rapid rise and
popularity amongst the youth, do you think
that it has risen to become a competition to
the Bollywood music industry? What impact
do you think this will have on Bollywood?
UU: I believe that this view, that the pop culture of
India has been based on Bollywood music, is
false. India has always had independent music. It
was called private music in those days and it’s
only in India where you have movie music and
non-movie music. In the western world, it’s just
music. Any film that had more than one or two
songs was called a musical but in India, every film
is a musical because you have so many songs.
This was especially true in the olden days, where
there were a minimum of five to six songs. But
parallelly, there existed independent music, as
you call it now. These days, everything is coming
to light and people know about it. There was a
time when it was just categorized as Bollywood

Ms. Usha UthupINTERVIEW
YOUTHINK l 2022 l Vol. XVI 80
and Private. So, anything that was non-
Bollywood would be considered independent
and there was, even previously, a big industry of
independent music. But I think that as long as
people are pumping in unreal amounts of money
into the music of Bollywood, independent, or
so-called private music, will never stand a
chance. But it should never stop people from
creating. You cannot create with the sole thought
that you want to get into a movie. Why? Why
does the benchmark have to be a film song or
getting into Bollywood, that’s not the benchmark
at all? You could be doing wonderful
independent or private music. However, it does
not mean for one minute that it can ever
overthrow Bollywood music because Bollywood
music is there to stay and so is independent
music. Hopefully, it’ll run parallelly and both will
be successful. It was successful, and it will still be
successful. But, if you are thinking of the money
that can come out of it, as long as there are
people to pump in a lot of money into
Bollywood, independent music doesn’t stand a
chance, in terms of the kind of money that can be
made out of a Bollywood film.
YT: Throughout your career, you have taken up
projects in seventeen Indian languages and
eight foreign ones. In a country where regional
and religious diversity is prominent, what role
does music and language play in uniting the
people?
UU: I have always said this and I firmly believe that
music is the one medium which binds the people
all around the world together and specifically the
people of India. I definitely belong to this aspect
because a Punjabi song of mine might be as
popular in Kashmir and in Punjab, and Gujarat
and Assam as it is in the South of India. They
don’t understand the language but bond with it
and that is the true essence of unity in diversity
because music knows no barriers of caste,
colour, creed, language, gender, sex, age. It is
admirable how music can bond people, and I
truly believe in it and that is why I am, from
inside, a happy person because I believe and I
have the courage to face my conviction, that
unity in diversity is hundred per cent proven
through music. The people of India have proved
way beyond doubt that a song is a song, it doesn't
matter who has sung it before. It also proves
beyond doubt that music goes beyond
everything else, beyond every language and I
think language really has bound people together
and music is the greatest binder.
YT: Your dedication and contribution towards the
Indian music industry has been a great source
of inspiration for the country, and the students
of St. Xavier’s College (Autonomous), Kolkata
are no different. What message would you like
to pass on to them?
UU: I have been a part of St. Xavier’s ever since I can
remember. My whole family has been from St
Xavier’s College in Mumbai and here as well. So,
the one message I can give is that the song is
always bigger than the singer. Music binds and
music brings people together. In times of the
pandemic, we have gone through a lot, lost so
many loved ones, the one thing that has really
seen me through all this, besides love, is the fact
that I have music. Without music it would have
been impossible for me. Infact, I have done more
recordings during the pandemic than ever
before. And for this I have to say thank God. If
you knew who was walking with you, you would
never be afraid.
My message would definitely be, believe in
yourself, have the courage to face your own
convictions. and dream. Dream big because if
you don’t dream big you won’t be able to
achieve anything. I think it’s wonderful to be
able to dream so big that at least, if you shoot for
the moon, you will get to the stars or even the
treetops. If you don’t have a dream then how will
you make a dream come true? Keep dreaming
and be true to yourself. And remember, no
matter what happens, never give up. Hang in
there and things are going to be okay. In the
meantime, stay safe, stay well, alert, strong,
cheery and happy and spread a smile around
everywhere because that’s what we need, really
optimistic people. God Bless!

GUEST ARTICLE
What Critics of Insolvency and Bankruptcy Code Get Wrong about the Recovery Model?Dr. Hemant Kumar ManujAssociate Professor in Finance AreaS. P. Jain Institute of Management & Research (SPJIMR)MumbaiThe IBC has
provided us with
a framework that
allows a market
determined
process for
distribution of the
firm value
between creditors
and shareholders.
ABSTRACT
The banking sector is one of the prime sectors of the Indian economy. The
poor performance of financial institutions, increase in the value of non-
performing loans over the years, and delay in the debt resolution process
have become great concerns for these institutions, especially in India. To
combat these issues Insolvency and Bankruptcy Code was introduced in
2016. The purpose of the bankruptcy law was to do away with the existing
complex and fragmented legislation and offer an economically viable
solution by consolidating existing laws to create a single code for bankruptcy
and insolvency. However, the adoption of the code was met with a barrage of
criticism. It was susceptible to a wide range of interpretations, with critics
focusing on two central concerns. These include large write-offs of loans by
the banks and unjustified losses to the stakeholders. Any such belief or
statement, however, was not supported by facts. The article aims to capture
the true essence of the code and to dispel common misconceptions about
the same.
KEYWORDS: Insolvency Code, Banks, Creditor, Interest, Debt.
YOUTHINK l 2022 l Vol. XVI81

What Critics of Insolvency and Bankruptcy Code Get Wrong about the Recovery Model?GUEST ARTICLE
YOUTHINK l 2022 l Vol. XVI 82
INTRODUCTION
The Insolvency and Bankruptcy Code (IBC) has
completed five years. Critics of the IBC have focussed
mainly on two issues: a) large write-offs of loans by the
banks; and b) undue losses to stakeholders like
employees and minority shareholders. On both these
issues, fears and allegations that the IBC has been a
failure, are not supported by facts or rationale. Let us
see why these are misplaced beliefs.
LARGE WRITE-OFFS OF LOANS BY BANKS
The job of creditors is to generate a return in exchange
for the risk arising from the disbursement of loans. So,
unless it is too high, loss on loans is not an unusual
incident. There are two dimensions of analyzing if the
magnitude of loan loss is too high. One is to measure the
amount of loss in proportion to the amount of
investment, often known as credit cost. This helps us
understand whether the creditor is undertaking a
profitable lending business vis-à-vis alternative uses of
capital. The other dimension is to check if the creditor’s
particular approach for recovery of dues helps in a
lower loan loss.
Most critics focus on the second dimension, that is,
whether the IBC is a better recovery mechanism
compared to others like Debt Recovery Tribunal (DRT)
or Securitization and Reconstruction of Financial Assets
and Enforcement of Security Interest (SARFAESI) Act,
2002. This is a fair question to ask.
Before answering this, however, one should note that
the role of IBC begins with the admission of a corporate
debtor into the IBC process. The efficiency of recovery
should be measured by the value recovered post the
insolvency resolution process as a proportion of the
enterprise or liquidation value of the corporate debtor
at the time of admission into IBC. Often, analysts use
book value of debt as the denominator, which is
misleading. The real value of debt is usually significantly
lower than its book value by the time the IBC process
begins.
Now, let us look at some data. As per the Reserve Bank
of India (RBI)’s Report on Trend and Progress of Banking
in India 2019-20, as a percentage of claims, scheduled
commercial banks have recovered 45.5 per cent of the
amount through the IBC for the financial year 2019-20.
This is higher than the recovery under other modes and
legislations such as the Lok Adalats, DRTs, and the
SARFAESI Act, 2002.
Here is another metric. As cited in the March 2021
report of the Insolvency and Bankruptcy Board of India
(IBBI), the final realization by the claimants, as a
proportion of the liquidation value (at the time of
admission to the IBC process), ranged from 115 per
cent to 387 per cent for nine out of 12 large accounts in
the first set of insolvent corporate debtors. While the
comparative figures for the other modes of recovery are
not available with the author, it is reasonable to infer
that recoveries under the IBC would be higher than
under other modes.
Thus, any belief that the IBC has not performed better
than the erstwhile mechanisms of recovery is not
supported by facts. It is also not a surprising conclusion
since the process followed under the IBC is more
market-driven and faster than others.
This does not mean that the recovery process through
the IBC is perfect. The code needs refinement on
multiple aspects. Just like other mechanisms, the IBC
too operates in a corporate and legal system, which
suffers from major systemic deficiencies. Our legal
processes are slow, and many of our corporate laws and
policies promote adverse behaviour. It is worth
pondering how the value of the assets of a defaulting
corporate debtor deteriorates so fast as to leave little
value for the creditors, by the time any recovery
mechanism begins. Unless these issues are corrected,
the IBC, in itself, cannot lead to dramatic results.
UNDUE LOSSES TO OTHER STAKEHOLDERS
The stated objective of the IBC is maximization of value
of assets of corporations (under insolvency), to promote
entrepreneurship, availability of credit, and balance the
interests of all the stakeholders.
In the case of solvent firms, the maximization of the
value of assets benefits the shareholders, and in
insolvent firms, it benefits the creditors. This means that
at any given point of time, the objective benefits only

GUEST ARTICLEWhat Critics of Insolvency and Bankruptcy Code Get Wrong about the Recovery Model?
YOUTHINK l 2022 l Vol. XVI83
one class of financiers. So, balancing the interests would
mean one class sacrificing its rightful interests for the
benefit of the other. Why would any stakeholder
voluntarily suffer a loss in a commercial and free market
scenario?
The framework of corporate finance is well understood
and adopted by the stakeholders when a firm is clearly
solvent or insolvent. However, a firm is definitively
solvent or insolvent only in legal terms. In the opinion of
the capital markets, there is also a grey area. Capital
market participants assign a probability to every legally
solvent firm becoming insolvent and every legally
insolvent firm becoming solvent again.
Let us say that a firm, D, has just been admitted as being
insolvent by the National Company Law Tribunal
(NCLT). For the markets, there is still some hope for D’s
recovery and it becoming ‘more’ solvent. This is evident
from the fact that the shares of legally insolvent firms
also quote at non-zero values. However, this also often
leads to irrational expectations in the minds of certain
stakeholders, partly out of ignorance on the difference
between hope and legal right. Legally, a shareholder
should expect zero value till the creditor is fully repaid.
But markets survive on hopes and hence, the
shareholder expects some value for their shares. This
divergence leads to anomalies that are, at times,
exploited.
Suppose company D has assets worth `120 going into
the resolution process. The claims to the assets stand at
`100 for the creditors (including all classes) and ̀ 20 for
the shareholders. The creditors receive multiple
proposals to recover their outstanding dues of `100
from D and finally choose the best one. The proposer, P,
offers to bring in cash, ̀ 50, out of which it pays off ̀ 40
to the creditors, who accept a loss of `60 on their
investment. The remaining ̀ 10 is used by P to buy fresh
shares issued by D at an issue price, as per the proposal.
After resolution, the market price of the shares settles at
a level such that the value of all outstanding shares is
`15. The old shareholders hold shares worth `5,
thereby suffering a loss of `15 on their existing
investment. The new shareholders holding `10 worth
of shares just bought the company. The new value of
debt, after write-off of `60, is `40. The value of the
firm is therefore `55 -- divided between the creditors
(`40), the old shareholders (`5) and the new
shareholders (`10). Any gain to any one stakeholder
must mean a loss to one or more of the other
stakeholders.
As we observe in this case, the older shareholders suffer
a loss in the value of their shares, if the market price of
the shares fall during the process of resolution. This is
often raised as an issue affecting the interests of minority
shareholders. However, two facts must be kept in mind:
1. Shareholders have no residual claim in an insolvent
company, which is unable to pay its creditors in full.
If the firm D had actually become fully insolvent,
the shareholders would have lost their money
completely, and not partially. So, whatever value
the shareholders own is only on account of hope
that the new promoter will take the company away
from insolvency.
2. Shareholders were, ex-ante, aware of the dues
owed by their company D to the creditors. They
also knew of the poor state of business. Yet, they
stayed with their stake in the company and
therefore it has been a conscious decision to hold
the shares, which led them to take the risk of
insolvency, and potentially lose money.
A BALANCING ACT
The lack of awareness of the retail, or small,
shareholders is cited as a reason for offering them a
better deal in the resolution process. This is a weak
argument in many ways.
First, there is little data to show that retail shareholders
are irrational or have been duped by some party against
their wishes. The latter is simply a case of cheating and
the accused party should be charged to compensate the
losing shareholders.
Second, if the retail shareholders are being
compensated, they should also be willing to share their
profits in case of any gains. But that does not happen.
Third, as shown in the above example, gains to one
party can come only at the cost of another. Typically,

What Critics of Insolvency and Bankruptcy Code Get Wrong about the Recovery Model?GUEST ARTICLE
YOUTHINK l 2022 l Vol. XVI 84
creditors are expected to cede some of their share to
other stakeholders. But that is neither fair nor justifiable.
Creditors have, ex-ante, been promised a fixed amount
of repayment. Any use of pressure, post resolution, to
reduce creditors’ share would amount to a dilution of
the primacy of contract.
Fourth, any artificial interference to influence the
market-based process of determining the values of the
firm, the debt, and the equity would lead to issues of
moral hazard. If any class of market participants begin to
believe that their returns have a significant upside but
the risks are limited through support systems, they will
participate beyond their risk appetite and game the
system. We have seen such examples of losses to retail
shareholders, including the default by the Unit Trust of
India (UTI) on its flagship US-64 bond units and recently
in the case of AT-1 bonds of Yes Bank.
Fifth, we should recognize the creditors as well as
shareholders as the rightful providers of capital. If any
one set of financiers is treated against the fundamental
principles of markets and financing, that set of
financiers will lose some incentive to provide finance to
the firms. Unless it is desired as a macro-objective to
reset the balance between the financiers, we should
make our markets even more efficient and let them
determine the expected returns and the risk levels for
each set of the former.
Let us also evaluate the case of the employees who
operate under employment contracts. In this case,
changing the distribution norms under the waterfall
mechanism under Section 38 of the IBC is an option
worth examining. However, this should be preceded by
a consideration as to whether employees are to be
treated as superior to the creditors with regard to
settlement of dues. There are trade-offs involved in
such a decision. However, once it is decided either way,
any temptation by the policy makers or courts to award
ad-hoc benefits to either party should be resisted.
To sum it up, the IBC has provided us with a framework
that allows a market determined process for distribution
of the firm value between creditors and shareholders.
The market process should be understood by all parties,
and not be disturbed for the benefit of a limited set of
stakeholders. It has further provided a waterfall
mechani sm for d i s t r ibut ion between the
creditors/shareholders and other stakeholders. This
should be open for deliberations in view of the larger
objectives, but not disturbed in an ad-hoc manner.
Article Credits: The Print
REFERENCES
1. https://rbidocs.rbi.org .in/rdocs/Publications/PDFs/
0RTP2020_F3D078985540A4179B62B7734C7B445C9.P
DF
2. https://www.ibbi.gov.in/uploads/publication/2021-05-29-
204331-atxcy-3363461de858b06bfa1afdbf13151b90.pdf

GUEST ARTICLE
YOUTHINK l 2022 l Vol. XVI85
Investing in a Win-Win Association: Family Businesses and the Start-Up Ecosystem
Dr. Tulsi JayakumarProfessor, Economics and Chairperson, Centre for Family Business & EntrepreneurshipS. P. Jain Institute of Management and Research (SPJIMR), Mumbai
Where there is a
decline in
entrepreneurial
zeal across
generations,
investing in start-
ups could help
keep the
enthusiasm alive
in the next
generation.
ABSTRACT
India has been witnessing an emerging start-up ecosystem along with an
already existing and established trend of family businesses. Amidst an
unprecedented funding spree for Indian start-ups across sectors, it is
important that these two ecosystems go beyond merely co-existing and find
ways to come together and blend their operations. As these start-ups seek to
grow and diversify, they look for various alternative sources of raising capital
to sustain in the long run. With strong foundational and huge invested
capital, family businesses can look forward to investing in such start-ups, so as
to induce financial gain and give rise to innovation, at the same time fulfilling
their social objectives. This article seeks to analyze the intricacies of such an
interaction that can serve as an impetus for the growth of the Indian
economy.
KEYWORDS: Start-Ups, Funding, Family Businesses, Investment,
Ecosystem.
India has emerged as the third largest start-up ecosystem in the world after
the United States and China, with 50 start-ups achieving unicorn status by

Investing in a Win-Win AssociationGUEST ARTICLE
YOUTHINK l 2022 l Vol. XVI 86
2021. While the start-up ecosystem in India looks
exciting, one of the key crunches that the system
continues to be facing is that of access to free-flowing,
stable funding. Start-ups have access to at least seven
types of funding. These include Personal Investment,
‘Love’ money, Venture Capital, Angels, Business
Incubators and Accelerators, Government grants and
subsidies and Bank Loans. While each of these has its
own role in funding start-ups, they may not have the
ability or the willingness to provide start-ups the kind of
support required to prevent the latter from burning out.
This is where the family business ecosystem, together
with family offices associated with such businesses play
a role.
While all family businesses would have been start-ups at
some point of time in the literal sense of the word, the
two are far from being similar. Other than the
ownership structure, family businesses differ from start-
ups in terms of age (with start-ups typically being 5-7
years old), size (with start-ups being worth hundreds of
millions of dollars or very little) or even the sectors in
which they are present (with start-ups being the early-
stage companies in the tech and innovation sector).
However, the critical difference between the two is in
terms of the mindsets governing the two, which define
certain aspirations and approach. Thus, family
businesses represent patient capital- a mindset which
seeks to sustain families in business across generations,
with organic growth over a long period of time. Start-
ups, on the other hand, represent disruptive innovation
capital; they are set up with the aspiration to do
something different, disruptive and grow large quickly.
India, with its third largest number of family-owned
businesses in the world comprising 85 per cent of all
Indian companies, 111 family business companies of
$839 billion total market capitalization and its third
largest start-up ecosystem, can take the lead in
providing valuable lessons to the world from the coming
together of the two ecosystems. The externalities
resulting from such interactions go beyond the more
obvious availability of funds to one participant and
financial returns to the other participant in this
interaction.
The family business ecosystem and family offices offer a
potentially rich source of support for the start-up eco-
system, including, but going beyond mere funding.
Typically, such investments are led by the younger
generation who wish to partake in the hustle of a start-
up, but without losing themselves in the nitty-gritties of
running a new venture. Members of the family business
ecosystem may either invest in their individual
capacities as angel investors, join with other like-
minded individuals from family businesses as co-
investors through Special Purpose Vehicles, form
venture capital funds or use their family offices for such
investments. Family offices represent the investment
vehicles for family businesses, especially for families
which have sold their businesses. Instead of distributing
the wealth among the family members, these may be
held in a family office, which invests these funds on
behalf of families.
I found that family offices and family businesses
currently look at the start-up ecosystem as comprising a
very small proportion of their overall investment
portfolio, typically not more than 10-15 per cent of
overall investments other than in the family business.
The volume of investment in individual start-ups,
usually, is a well-planned strategy, as testified by Ankit
Kedia, former promoter of Manjushree Technopack, a
family business which was divested to Advent
International in 2018. Any investment between
`500,000 and ̀ 2,500,000, according to Ankit, is done
by him in his personal capacity as an angel investor,
investment between `2,500,000 and `35,000,000 is
handled by the family-promoted Venture Capital Fund,
Capital A, and all investments in the start-up ecosystem
beyond this amount are handled by the family office
comprising analysts and experts to deploy the family
wealth.
I found that family business investments in the start-up
system are governed by a host of complex factors. One
critical factor, however, is the family vision and values,
which determines areas into which family wealth would
or would not be invested. For instance, many family
businesses, which find it inappropriate to enter
businesses involving liquor or meat, would not fund
start-ups involving these taboo areas either. Again,
family businesses may not invest in areas where high
valuations prevent them from gaining and retaining a
stake in the business.

GUEST ARTICLEInvesting in a Win-Win Association
YOUTHINK l 2022 l Vol. XVI87
The patient financial capital which family businesses are
associated with provides three additional types of
capital to the start-up ecosystem. Research in the family
business domain has documented the family business
pursuit of non-financial socio-emotional wealth goals,
besides financial goals. Family members, in their role as
angels or backing family offices, can then be expected
to bring significant Emotional Quotient (EQ) Capital to
the start-ups, besides the Intelligence Quotient (IQ)
Capital. They could work together with founders of
start-ups- help keep them on track with both their
rational and emotional needs.
Family businesses also provide Network Capital to start-
ups, introducing to them their own domestic and global
networks and opening doors to the start-ups’ multiple
needs in various stages. Another important form of
capital is Engagement Capital. Vineet Mittal, a family
business scion from Surat and an entrepreneur himself,
cites an instance of such engagement capital. A start-up
funded and supported by his family business required
access to factories to come up with their innovative
offering aimed at disrupting the skilling industry. Such
access was made possible through his family business
investors who were already into manufacturing. It
would have been impossible for other forms of start-up
funding to guarantee such engagements.
Family businesses too, gain from investing in start-ups.
Besides high financial returns, start-ups provide family
businesses the window to the latest innovations and
technology in industry. Family businesses may not have
the time and acumen to come up with such innovations
themselves. Where there is a decline in entrepreneurial
zeal across generations, investing in start-ups could help
keep the enthusiasm alive in the next generation. Start-
ups also represent a growth mindset, which may benefit
certain fixed mindset family businesses. Next
generation members may also learn from the grit,
creativity, and culture of innovation that start-ups
represent. They too gain network capital from such
interactions.
Family business investment in the start-up ecosystem
then promises a win-win to both parties. More than
anything else it comes with a promise of ‘Nation First,
Always First’.
Article Credits: Entrepreneur (India) magazine

GUEST ARTICLE
YOUTHINK l 2022 l Vol. XVI 88
Growing Inequality and Why is it of Concern?
Dr. Nisigandha BhuyanAssociate Professor, Business Ethics GroupIndian Institute of Management Calcutta (IIMC)
The expansion of
inequality on
various levels of
society has led to
the creation of
unjust social
composition
which is
unfeasible in the
long run.
ABSTRACT
The expansion of inequality on various levels of society has led to the creation
of unjust social composition which is unfeasible in the long run. The views of
different scholars throw light upon the varied aspects and factors which affect
the attainment of basic human rights. Through the price gouging of
indispensable goods and services, succeeding the aftermath of Hurricane
Charley, the idea of ‘free choice in a free market’ has been summarized to be
a liberal myth. Actualization of real egalitarianism materializes on confluence
of possibilities, privileges and resources. Subsequently, reasons behind
liberty turning into a condition of unfreedom in a free-market economy have
been elucidated. This article delves into understanding the origin and
implications of increasing inequality.
KEYWORDS: Justice, Individual Freedom, Inequality, Unfreedom.
WHAT IS INEQUALITY?
Going by the moral standards every human being is of equal worth in at least
some basic sense. This equality of worth of human beings is emphasized in
the seminal works of almost all the philosophers from Hobbes, John Locke,
Jean-Jacques Rousseau, Immanuel Kant, to John Rawls. Inequality is more of
a socio-economic phenomenon and is based on a social order of hierarchy of
human beings ranked according to tangible worth (e.g., rich or poor) and
contingent features (e.g., fair or dark complexion). Inequality is referred not
so much to distribution of goods as to relations of superior and inferior
persons. Often, inequality becomes the basis of inflicting violence on
inferiors, excluding them from social life, treating them with contempt, and
forcing them to obey and remain loyal and docile without questioning the
authority of their so-called superiors. This sort of social arrangement

GUEST ARTICLEGrowing Inequality and Why is it of Concern?
YOUTHINK l 2022 l Vol. XVI89
eventually leads to not only inequalities in the
distribution of freedoms, resources, and welfare but is
also unsustainable.
WHY EQUALITY MATTERS?
Egalitarianism ought to reflect a generous, humane,
cosmopolitan vision of a society that recognizes
individuals as equals in all their diversity. Diversity
should never be utilized as a means of discrimination
and subjugation. Therefore, egalitarianism emphasizes
on institutional arrangements that enable the diversity
of people's talents, aspirations, roles, and cultures to
benefit everyone and to be recognized as mutually
beneficial.
In Nicomachean Ethics, Aristotle states that justice is the
highest of all virtues because it is concerned with not
just the good life or happiness of the self but also of the
other. The ethical principle of justice allows another to
seek what one seeks for oneself. In other words, justice
aims at eliminating inequalities, social, cultural and
arguably, economic. It is interesting that Aristotle while
extolling justice, justifies slavery (in the form that it
existed in ancient Greece) on the grounds that slavery is
justified if someone is servile by inclination but slavery
can be overturned by this very justification since the
institution has always been characterized by
widespread dissatisfaction.
IDEOLOGICAL NUANCES
Libertarians, in the likes of Friedrich Hayek, assert that
freedom (individual freedom) is the highest human
value and it can be ensured under two conditions: of
free market, and institution of private property.
However, Michael Sandel, in the opening paragraph of
his book, ‘Justice: What’s the right thing to do?’
broaches two controversies that rocked America in the
first decade of the 21st century and that points to the
greatest follies of free market capitalism. One example
is of price gouging of essential goods and services
following the destruction wrought by the Hurricane
Charley in Florida, in 2004. In the wake of the
devastations to life and property and infrastructure
caused by the Hurricane Charley, the residents of
Florida were shocked to discover that they were being
forced to exorbitant sums for basic commodities such as
fuel, and drinking water; and for services like clearing of
uprooted trees from their roofs, and motel-rooms. This
sudden, steep hike in the prices of basic goods and
services created a public outrage against what they
viewed as ‘greed’ of the service providers, who were
trying to profit on public misery, following a natural
disaster. The defenders of price gouging, on the other
hand, insisted that the hike of prices is a part of the free-
market mechanism as it serves as an ‘incentive’ for
goods and service providers to ensure the availability of
services in areas hit by the hurricane. Besides, in a free
market, they argued, the price of a good reflects the
level of its demand, and thus, there was nothing
unnatural about price gouging. Sandel wonders at this
juncture how can people who have been deprived of
access to basic necessities of life by a natural calamity be
considered as making free choices in a free market
when they have to pay up huge sums for daily
necessities? He opines that price gouging is something
akin to ‘extortion’, and hardly does it reflect ‘free
choices’ made by the buyer and the seller in a free
market. Thus, through this attempt to illustrate that the
idea of ‘free choice in free market’ is a libertarian myth,
Sandel begins his critique in ‘Justice: What’s the right
thing to do?’ of libertarianism, which attempts to
minimize the significance of the communitarian
‘common good’, and replace it with ‘individual
freedom’.
Amartya Sen, in his book ‘Development as Freedom’,
however, does not contest that individual freedom is
inviolable rather argues that for the attainment of that
freedom, the individual needs ‘primary goods’ (John
Rawls) i.e., the means for pursuit and attainment of the
goals of the individual accompanied by capabilities.
The problem with the concept of primary goods is,
according to Sen, its insufficiency to explain the role of
additional factors for effective utilization of the basket
of primary goods. Those factors primarily include
‘capabilities’ which are necessary for the utilization of
the goods. For instance, if two young girls, one in
France, and another in rural Assam, aspire to be
astrophysicists, then the Rawlsian notion of primary
goods would only state the importance of access to

Growing Inequality and Why is it of Concern?GUEST ARTICLE
YOUTHINK l 2022 l Vol. XVI 90
good science education for the girls; the science
education is the primary good here. But it fails to take
into account the lack of capability in rural Assam in the
form of gender discriminations. Primary goods must be,
therefore, accompanied and supplemented by
capabilities.
Sen airs the view that freedom is both the end and the
means of development. This observation calls for
critical examination of the concepts of freedom and
development, and for their re-conceptualization. Two
crucial concepts in Sen’s theory are ‘functionings’ and
‘capability’. He defines capability as ‘alternative
combinations of functionings that are feasible for her to
achieve’, and the notion of functioning, in turn, stands
for, ‘the various things a person may value doing or
being’. It is but natural that Sen defines capability ‘as a
kind of freedom: the substantive freedom to achieve
alternative functioning combinations.’
Sen, thus, defines capability as freedom, or more
specifically, as a substantive freedom. The difference
between formal and substantive freedom is that the
former is far more extant in most democratic societies
but the latter is not something that most people enjoy.
To illustrate the distinction between formal and
substantive rights or freedom, Sen brings forth two
terms of Marx: formal freedom (of workers in capitalist
system of production), and the substantive unfreedom
(of the serf under feudalism). Sen assumes that Marx
was an admirer of the ‘formal freedom’ granted to the
worker under capitalism to sell his labour, and states
that formal freedom is necessary but not a sufficient
condition for substantive freedom.
ARGUMENTS FOR EQUALITY
If equality is to be the governing principle in this
distribution/allocation, then the question arises, what is
the principle of equality aimed at? Barry points out that
one school of thought – the libertarian, who are
sometimes called liberal as well – emphasizes that
equality should aim at equality of rights alone. Barry –
along with thinkers like Amartya Sen, Rawls and
Michael Sandel – on the other hand, maintain the
inefficacy of equality of rights, unless accompanied with
equality of opportunity and of resources. At this
juncture, Barry brings attention to the conceptual
differences between the notions of rights,
opportunities, and resources. Rights signify the lack of a
prohibition. For instance, if I have a right to education, it
simply means that I cannot be prohibited or hindered
from attending a school. Rights are therefore very
significant and yet they are not sufficient in ensuring
that the individual can exercise the right. For that to
happen, rights need to be accompanied by
opportunities. Equality of opportunities can be said to
exist if the individual subject has the choice of
alternatives; for instance, I had the choice of going to a
private, elite school or to a government school but I
chose the latter. But if I had no option but to attend the
government-run school despite my awareness that it
has very poor infrastructure, then the right to education
would do little to empower me in the absence of the
opportunities. Finally, rights and opportunities both
need to be supplemented with resources, which ought
to be, according to Barry, equitably distributed. True
social justice, therefore, in the schemata of Barry, is
attained only when there is a convergence of rights,
opportunities and resources.
CASE IN POINT
A formal right to freedom in a free-market economy
cannot actually guarantee any freedom to the
individual participants; rather it leads to a condition of
unfreedom for the majority. There are basically two
disparate reasons as to why this formal right/freedom
turns into a condition of unfreedom in a free market
economy. First one is the flaw in the notion of free
market which is like what Michael Sandel pointed out.
Second one is the flaw in the design of the institutions of
free market like what Joseph Stiglitz pointed out.
To establish the first reason let us discuss a case. Driven
by the extreme poverty in her country, Noie sold a
kidney for $3,000. This sum far exceeded her local
monthly pay as a cocoa farm worker and provided
essential financial support for herself and her family.
The question then is: is this a condition of freedom? If a
priority value is placed on free choice, Noie should be
free to choose to sell her own kidney. However, is such a

GUEST ARTICLEGrowing Inequality and Why is it of Concern?
YOUTHINK l 2022 l Vol. XVI91
choice really ‘free’ when her life circumstances are so
desperate that she appears to have no other viable
alternative (and thus, no real ‘choice’)? If Noie must
provide for herself and has the ability to do so by selling
her kidney, does the market process serve as an efficient
(and ethical) intermediary? The kidney case in example
or the womb of a surrogate mother are examples to
draw our attention to the actual condition of
unfreedom and the deficiencies of formal
rights/freedom. The formal freedom to bear any result
for the individuals must get translated into substantive
freedom by converging with opportunities and
resources. This would never be possible under the
condition of a free market unless it is supplemented
with widespread welfare measures of the state.
For the second reason of unfreedom, let us turn to
Joseph Stiglitz. Stiglitz, in his book ‘Globalization and its
Discontent’, pointed out that that the global institutions
like the IMF and World Bank which was originally
instituted with a purpose to establish equality and parity
between developed and developing country and
eradicating poverty and inequality are actually working
only for the benefit of the richest 1 per cent of corporate
owners of every country (where liberalization is
adopted as an economic policy). He argues that these
global institutions actually facilitate the following:
1. Outsourcing of industries to poor countries where
labour is cheap and environmental and safety
regulations are low thereby, making huge profit
but at a huge cost to the environment and people.
2. The corporations get intellectual property
protections making it impossible for people in the
bottom of the pyramid to access even basics like
health care and medicines.
3. These multinationals get state sponsored subsidies
while global regulations prohibit such facilities to
people/labour in poor countries. Stiglitz gives the
example of how the United States cotton
subsidies have driven down the global prices of
cotton which in turn lead to starvation of cotton
farmers in India and Africa.
4. These MNEs pay low taxes and often get tax cuts.
Stiglitz asks, who should pay more tax? And the
answer is obviously those who earn more or make
huge profits. But that is not the case and
corporates always get tax cuts as a policy measure
to encourage entrepreneurship.
5. Rising income inequality and huge concentration
of wealth and monopolization of the market.
6. In spite of all the benefits that the large
corporations take, they cause recession and
economic downturn even when their CEOs are
paid exorbitant amounts in the name of efficiency
and talent.
Essentially, the growth is not sustainable and the price of
development is too high to be repaid. Stiglitz argues that
the global institutions must work to the benefit of all and
not just for the accumulation of wealth by the richest
billionaires who are now planning space travel where
the resources are already exhausted and human species
are moving towards a possible extinction due to
extreme climatic conditions and more regular
pandemics.
REFERENCES
1. Aristotle, Ross, W. D., & Brown, L. (2009). The Nicomachean
ethics. Oxford: Oxford University Press.
2. Barry, Brian (2005) Why Social Justice Matters, Cambridge,
MA: Polity.
3. Fukuyama, Francis (1992). The End of History and the Last
Man. New York: Macmillan, Inc.
4. Hayek, F. A. (1994). The road to serfdom. Chicago: University
of Chicago Press.
5. Sandel, Micheal (2010). Justice: What's the Right Thing to
Do? London: Penguin Books Ltd.
6. Sen, Amartya, 1933-. (2000). Development as freedom. New
York: Anchor Books.
7. Stiglitz, J. E. (2018). Globalization and its discontents
revisited: anti-globalization in the era of Trump. New York:
W.W. Norton & Company.

YOUTHINK l 2022 l Vol. XVI 92
BEYOND
A Study on Behavioural Finance in Investment Decisions of Investors and Financial Markets
Prof. Soumi BhattacharyaAssistant ProfessorDepartment of Commerce (Evening)
Varnika LohiaDepartment of Commerce (Evening)
Behavioural
finance is a very
important subfield
of finance which
combines
psychology and
economics to
explain why and
how investors act
and how they
take investment
decisions in the
market.

BEYONDA Study on Behavioural Finance in Investment Decisions of Investors and Financial Markets
YOUTHINK l 2022 l Vol. XVI93
ABSTRACT
This paper focuses on the study of behavioural finance
in investment decisions of investors and how they make
choices and what drives their decision making in the
financial market. The crux of this study tries to
understand the effects of psychology of investors and
financial markets. It focuses on explaining why investors
often lose their self-control while making decisions or
they act against their own interest and make decisions
based on bias or dependency on someone rather than
facts or statistics. The aim of this study is to determine
the presence of certain fundamental issues in the
investment decision-making process, which are guided
by various psychological biases. Further, this paper
informs us about the various types of heuristics and
concepts which are used within behavioural finance
which is tested against a set of data collected in
Ahmedabad and sees whether behavioural bias is
present in decision making of individuals across various
types (sex/age/occupation).
KEYWORDS: Behavioural Finance, Heuristics,
Behavioural Biases, Investors, Decision Making,
Financial Market, Psychology of Investors, Investment
Bias, Hypotheses, Over-Confidence.
INTRODUCTION
The field of finance is more or less related to making
investment decisions, working capital decisions,
dividend decisions and fund allocation decisions,
whereas, the field of economics relates to the basic
problems of what a person should produce, how much
they should produce and for whom they should
produce. In the same way, the field of behavioural
finance deals with problem-solving activities as well as
decision-making.
Although for years and years, economics and finance
have been used for decision-making and investment
decision activities and they always take into account the
rationality of the investor and the buyer. However, with
the help of behavioural finance, we get a deeper
knowledge about how investors make their decisions
and sometimes, how they take these decisions
irrationally. Mark Twain once divided the world into two
categories: those who have seen the Taj Mahal, the
famous Indian monument, and those who have not.
Investors may be seen to be in the same boat. There are
two types of investors: those who are aware of India's
investment opportunities and those who are not.
There are many studies and proofs which show how the
market works and how it operates to take investment
decisions. They explain the dynamics of investment
decisions and the rules to apply while making these
decisions. The rules are very plain, but investors find it
difficult to apply these because sometimes, they tend to
focus more on returns than the application and
adherence to protocols. Due to the inefficiency of the
investors in applying the rules, they sometimes
overtrade, buy and sell at the wrong time, leading to
arbitrage in the market, that is, riskless profit, allowing
their emotions to overrule their consciousness and logic
along with misjudging and miscalculating the
probability of making a gain from that investment.
Getting psychology into the picture, we regard this as
heuristics. As the evidence of psychology coming to
play in decision-making and emotions playing a vital
role in determining the validity of the project kept on
increasing, behavioural finance received a greater
acceptance in the upcoming world. Despite them
having disagreements and rivalry regarding the timing,
place and the reason psychology influences investment
decisions, Daniel Kahneman, the 2002 Nobel Prize
winner in Economic Sciences, and experimental
economist Vernon Smith are considered pioneers in the
field of behavioural finance. Adam Smith, who is
considered the father of modern economics, stated that
there was an insight into human psychology that
developed into behavioural finance today.
The economic and financial theories generally say that
individuals act rationally and the process in which the
individuals make their decisions involves them taking
into account all the information available in the market.
Not only do they take the past trends and history into
account but also their peer reviews and resort to
research work in order to make informed decisions. But
this is, in fact, not the most important obstacle that an
investor faces in making investment choices. A majority
of an investor's profits or losses can be traced to his/her

A Study on Behavioural Finance in Investment Decisions of Investors and Financial MarketsBEYOND
YOUTHINK l 2022 l Vol. XVI 94
decision-making ability. Even the most influential and
well-educated investors were affected by the 2008
subprime crisis, when the speculative bubble had burst,
demonstrating that something was profoundly wrong
with the system and in the traditional models of rational
market behaviour.
In order to compare the old and new methods,
traditional finance assumes that people process data
approximately and correctly and that they are guided
by reason, logic and independent judgement.
Behavioural finance recognizes that people use an
imperfect rule of thumb to determine the process. Also,
people’s emotions and herd instincts play a very
important role in influencing decisions. Prices are
generally pushed by investors to unattainable levels in
upward and downward directions.
The aim of this study is to determine the presence of
certain fundamental issues in the investment decision-
making process, which are guided by various
psychological biases. Psychological variables, according
to behavioural economists, affect investment decisions.
They argue that a greater understanding of individual
investors' behavioural biases is essential for today's
investment decisions. Many economists, on the other
hand, conclude that conventional models can be
applied to decision-making and therefore dismiss the
idea of irrational behaviour. In this context, it seems
important to investigate whether behavioural factors
affect a portfolio investor’s decision-making process or
not.
After understanding what behavioural finance means,
we will, in brief, learn about behavioural finance
concepts and the factors that are involved in it.
BEHAVIOURAL FINANCE AND INDIA
1. Behavioural economists have recently discovered
the effectiveness of a new class of policies known as
‘nudge’ policies. Nudge policies subtly encourage
people to engage in desired behaviours while
maintaining their freedom of choice.
2. According to Nudge theory, people need reminders
and constructive reinforcements to maintain
socially acceptable behaviour.
3. According to the Organization for Economic
Cooperation and Development, behavioural
perspectives are used by more than 202
government agencies around the world.
4. Nudge policies are exemplified by the following
examples:
?To improve tax enforcement in India, citizens may
receive a variety of text messages explaining how
their taxes affect public services.
?To reduce the number of children who drop out of
school in underprivileged communities, parents
may be informed about the average income gains
from their children staying in school for an extra
year.
?To encourage people to save more, they may be
given specially built savings accounts.
LITERATURE REVIEW
1. (Nichlas Barberis, 2002): It is claimed in this
research paper that some financial phenomenon
can be plausibly explained using models in which
some agents are not completely logical. This limits
to arbitrage, which contends that it is impossible
for rational traders to reverse the dislocations
induced by less rational traders; and psychology,
which catalogues the various types of deviations
from rationality.
2. (BIRAU): This article introduces behavioural
finance as a modern approach to capital market
research. The study of the impact of psychological
influences on the evolution of financial markets is
known as behavioural finance.
3. (Andrea Masini, 2012): Renewable energy (RE)
technology investments are becoming increasingly
popular as a way to boost growth and speed up
recovery from the recent financial crisis.
4. (Mangee, 2017): The relevance of psychological
factors for aggregate stock price volatility is
examined using econometric evidence in this
paper. To that end, the Net Psychology Index (NPI),
a new indicator of stock market sentiment based

BEYONDA Study on Behavioural Finance in Investment Decisions of Investors and Financial Markets
YOUTHINK l 2022 l Vol. XVI95
on information from Bloomberg News' end-of-day
stock market surveys, is subjected to a battery of
multivariate empirical analyses.
5. (Kevin Brady, 2018): A majority of big stock price
swings aren't followed by publicly accessible data.
What other data do investors use to determine the
price? Investors depend on reference points and
private information signals, according to the
authors.
6. (Kahneman and Tversky, 1979): They presented a
paper on the criticism of expected utility theory, in
which they empirically discovered that people
undervalue the results that are only probable in
contrast to those that are definite. They threw the
prospect theory out of the window, assigning value
to gains and losses rather than final properties, and
replacing probabilities with decision weights. In
1981, they introduced the concept of framing,
wherein the psychological principles that govern
perception of decision problems and evaluation of
the probabilities and outcomes produces
predictable shifts of preference when the same
problem is framed in different ways.
7. (Bovi, 2009): It simply states that a person's risk-
taking attitude in any given situation is determined
by the individual's precise economic analysis, and
that if the event is viewed favourably, the individual
would be more risk-averse, and vice versa.
8. (Sahni, 2012): The historical performance of the
stock market has a major impact on investor
expectations. After obtaining knowledge or
financial advice from experts, two personality traits
known as openness and neuroticism increase
financial trading frequency.
OBJECTIVES
Primary Objectives
?To study the impact and relevance of behavioural
financing in investment decisions of investors.
?To know the effect of cognitive bias on deciding
upon types of stocks.
Secondary Objectives
?To study various factors influencing the investors
while taking investment decisions.
?To throw light on the limitations of traditional
finance theories and the significance of the growth
of behavioural finance discipline while studying the
investors’ behaviour about financial markets.
?To analyze the behaviour and psychology of
investors in the financial market and their choice of
different securities in the market.
?To know the mindset of investors while making
investments.
?Understanding the loss-averse nature of an
investor.
RESEARCH METHODOLOGY
The project is built on secondary data and involves
various statistical tools and tests. The data attained is for
the year 2019-2020 in the area of Ahmedabad. The
sampling frame consists of people who invest and are
active investors. The sampling method is convenience
sampling and the sample size is 181 people. This is a
descriptive type research paper, and the data is
procured from the International Journal of Novel
Research and Development’s website.
The research also differentiates between investment by
investors in Gujarat and Delhi using a single
characteristic of whether the investors are risk-averse or
risk-loving.
LIMITATIONS
The research gives us a lot of insight into how the
investors’ minds work and how they are likely to make
decisions, but there are a few loopholes and areas
where work is required. The key points are:
?The area of study is based in Ahmedabad because
there is no conclusive evidence for investors in
West Bengal.
?The size of the study is 181, which is a sample and
cannot be fully and completely approximated for
the population.

A Study on Behavioural Finance in Investment Decisions of Investors and Financial MarketsBEYOND
YOUTHINK l 2022 l Vol. XVI 96
?Each investor’s mindset works in a different way.
The cognitive bias of a risk-averse investor will be
different than that of a risk-neutral one; however, it
is difficult to differentiate between them.
The study's key flaw stems from the fact that it uses
questionnaires to investigate investor behaviour trends.
Making financial decisions may be difficult for a variety
of reasons, which can lead to many people making
unreasonable decisions at some stage. However, when
answering a questionnaire, the same individuals are
likely to be comfortable and in a better frame of mind,
and therefore choose to offer answers that might
portray them in a different light, especially in the
context of hypothetical questions. Many questions tried
to get participants to confess past errors, which helped
to alleviate the issue to some degree. The fact that India
is such a large country means that this study cannot be
considered an assessment of the average Indian
investor. Also, one very important point is that actual
investors sometimes focus on trends, past analysis of
share prices or they read about the company before
investing. Therefore, investing does not only depend on
emotions and instincts, but research and past
performances also matter a lot. Also, the position of
one’s economy depends on one’s investment
decisions.
CONCEPTUAL FRAMEWORK
Before heading to the analysis of how investors base
their investment decisions, we need to know a few of
the concepts and have a basic understanding of these so
that we can make informed decisions with our analysis
and key findings.
Heuristic Driven Biases
?Overconf idence: People are genera l ly
overconfident and tend to overestimate their
forecasts about their returns. The perception of
information contributes to overconfidence. The
human mind may be designed to derive as much
knowledge as possible from what is available, but it
may be unaware that the information available is
insufficient to develop an accurate forecast in
unpredictable times.
?Anchoring: People are unable to change their
minds after forming an opinion, even though new
knowledge becomes available. For example,
sometimes investors believe that a company's long-
term earnings prospects are better than average,
but the company unexpectedly records lower
earnings than predicted.
?Familiarity: People are at ease with items they are
already acquainted with. When it comes to
investing, the human brain often uses the
familiarity shortcut. Familiarity does, in reality,
breed investment. As a result, people are more
likely to invest in the stocks of their employer, local
firms, and domestic companies.
?Confirmation Bias: People tend to overlook
information that is contrary to their views and are in
favour of information that confirms their views.
Investors often only hear what they want to hear.
They spend more time searching for reasons
supporting their views and less time searching for
reasons opposing their views.
?Innumeracy: People have a hard time dealing with
numbers. The difference between nominal and
actual changes is often misunderstood. This is
referred to as the ‘capital illusion’ by economists.
People have a hard time calculating real probability.
To put it in another way, chances are that they have
no idea what the odds are. People are more likely to
pay attention to large numbers and give less
importance to smaller figures.
Frame Dependence
?Prospect Theory: This was the theory proposed by
Kahneman and Tversky. This tells us how people
frame and value a decision involving uncertainty.
Generally, utility depends on wealth level in
traditional theory but here, it is based on the
change of wealth from the current level. The utility
function is concave for gain.
?Mental Accounting: Traditional finance holds that
wealth, in general, and money, in particular, must
be viewed as fungible, and that any financial
decision should be based on a fair assessment of its
impact on the overall wealth status. People, on the

BEYONDA Study on Behavioural Finance in Investment Decisions of Investors and Financial Markets
YOUTHINK l 2022 l Vol. XVI97
other hand, lack the computational skills and
willpower to assess decisions in terms of their
overall wealth effect.
?Narrow Framing: Investors should, in theory, pay
attention to shifts in their overall income. In a cross-
sectional context, narrow framing implies that
investors choose to look at each investment
individually rather than the portfolio as a whole. As
a result, they are more concerned about market
fluctuations in individual stocks and less concerned
about the overall portfolio's results.
Emotional and Social Influences
?Emotional Effect: Risk tolerance is influenced by
emotions, and risk tolerance affects portfolio
selection. As investors weigh options, determine
how much risk to take, watch their decisions play
out, evaluate whether the original plan needs to be
modified, and eventually discover how far they
have succeeded in achieving their financial goals,
investors experience a large range of emotions.
?Herd Instincts/Information Cascade: Human
beings have a natural tendency to belong to a
community. As a result, people prefer to
congregate. Moving with the herd, in fact, amplifies
psychological prejudices. It encourages people to
make decisions based on herd instincts rather than
objective independent research. This propensity is
amplified when they make a decision with a high
level of uncertainty.
ANALYSIS
Respondents were asked several questions which
focused on each of the different concepts of
behavioural finance like anchoring, overconfidence
bias, et al.
Given below is the table that represents combined
values for each of the theories and checks if there is an
influence of behavioural finance on investment
decisions. A hypothesis testing was carried out to prove
the same. In order to carry out the test, the level of
significance was taken as 5 per cent.
OVERALL HYPOTHESIS TESTING
H0: There is no influence of behavioural finance on
investment decisions.
H1: There is an influence of behavioural finance on
investment decisions.
These are values calculated from the data which was
given above.
According to the level of percentage, and considering a
5 per cent level of significance, it can be said that we can
reject H0 and that there is an influence of behavioural
finance on investment decisions.
Table 1
(Source: Primary Data)
Theory Level of Percentage
1. Overconfidence 64
2. Innumeracy Bias 38
3. Narrow Framing 57
4. Confidence Bias 90
5. Prospect Theory 70
6. Anchoring Theory 48
7. Familiarity with Investment 67
8. Herd Instinct 57
9. Trying to Break Even 69
10. Emotional Effect 57

A Study on Behavioural Finance in Investment Decisions of Investors and Financial MarketsBEYOND
YOUTHINK l 2022 l Vol. XVI 98
FINDINGS
The mean of ‘Overconfidence’ implies that people
have chosen to answer positively and that they face
overconfidence bias.
In ‘Confirmation Bias’, the mean is 1.1, indicating that
frequencies are equally distributed.
According to ‘Trying to Break Even’, the mean tells us
that people are highly affected by the bias and they try
to always reach the break-even point.
‘Emotional Bias’ tells us that emotions and instincts are a
big part of investors while making investment decisions.
The overall study suggests that there is an influence of
behavioural finance on investment decisions.
CONCLUSION
Behavioural finance is a very important subfield of
finance which combines psychology and economics to
explain why and how investors act and how they take
investment decisions in the market.
A few things that can be
highlighted are that
investors generally want
smooth and stable
returns even if those are
low. Investors wil l
choose to sell a winning
s t o c k b e f o r e i t s
maturity, which shows
that investors are risk-
averse and they will
always prefer gains,
being non-satiated.
The motive of this study
was to check the
r e l e v a n c e o f
behavioural finance
theories, and to check
whether investors are
rational or not while
making decisions about f inancing through
investments.The study and the data led to the
conclusion that investors are not always rational while
making decisions. The assumption of investors always
being rational is not true. This is because they always
want to satisfy their own greed and want to fulfil their
own needs, which leads to them undertaking methods
that cannot be considered rational.
The focus of the biases has been, overconfidence bias,
anchoring, break-even takers, loss aversion and
hindsight bias. One fallout of this theory is that, in
reference to the efficient market hypothesis, markets
are not always efficient and an investor will sometimes
base his/her decisions on references from the past
rather than taking his/her own informed decisions.
Also, behavioural finance is still a concept that is
stringent to few of the classes. The need for emphasis on
this matter is extremely important because the investors
need to know the loopholes that they need to fill while
making investment decisions.
Table 2
(Source: Primary Data)
THEORY QUESTION MEANSTD.
DEVIATION
Overconfidence Do you think that you have sufficient knowledge about it?
1.3591 .48107
Confirmation BiasSuppose you have shares of XYZ Ltd., then will you react to positive news about XYZ Ltd.?
1.1050 .30737
AnchoringDo you prefer to hold on to the investment even if past performance is not good?
1.5193 .50101
Trying to Break
Even
If your investment is showing losses, will you hold on to it torecover the loss?
1.3149 .46577
Emotional BiasWhen it comes to decisions related to investments, will you base it on gut feeling and intuition?
1.4254 .49478
MEAN AND STANDARD DEVIATION TABLE

BEYONDA Study on Behavioural Finance in Investment Decisions of Investors and Financial Markets
YOUTHINK l 2022 l Vol. XVI99
REFERENCES
1. https://www.ijnrd.org/viewpaperforall.php?paper=
IJNRD1907016
2. Analysis.<http://www.uk.sagepub.com/burns/website%
20mater ia l /Chapter%2025%20-%20Discr iminant
%20Analysis.pdf>. UK: SAGE Retrieved: January 2012
3. Thaler, Richard H.2005. Advances in Behavioural Finance,
Volume II. USA: Princeton University Press.
4. https://www.behavioralfinance.com/
5. https://blog .finology.in/behavioral-finance/what-is-
behavioral-finance
6. https://www.accaglobal.com/vn/en/student/exam-support-
resources / fundamenta l s - exams - s tudy- resources /
f9/technical-articles/behavioural-finance.html
7. https://www.emerald.com/insight/content/doi/10.1108/
19405971211284862/full/html
8. https://www.ii.co.uk/analysis-commentary/mind-money-
understanding-ourselves-and-our-attitudes-risk-ii515227
9. https://f inancefeeds.com/oxford-risk-warns-peri ls -
emotional-investing-addressing-swiss-portfolio-managers/
10. Behavioural Finance, Author William Forbes.
11. https://books.google.co.in/books?id=U6V-DwAAQBAJ&
printsec=frontcover&dq=behavioural+finance&hl=en&n
ewbks=1&newbks_redir=1&sa=X&ved=2ahUKEwjhlf6e4
Y7vAhXUILcAHayYAE4Q6AEwBXoECAUQAg

BEYOND
YOUTHINK l 2022 l Vol. XVI 100
Effects of Branding and Sales Promotion on Indian Consumer Buying Behaviour: An Explorative StudyDr. Sumana GuhaAssistant ProfessorDepartment of Commerce (Morning)
Kabir Raj AroraDepartment of Commerce (Morning)
It is the consumer
who creates the
brand image of a
company and
thereafter, the
company uses its
brand image as a
tool for the
success of its
business.
ABSTRACT
Under the present domestic and global competitive markets, existing
companies depend mostly on two key factors: branding and sales
promotional techniques, to achieve or maintain their competitive
advantage. This study tries to explore the impact of branding and

BEYONDEffects of Branding and Sales Promotion on Indian Consumer Buying Behaviour
YOUTHINK l 2022 l Vol. XVI101
contemporary techniques of sales promotion on the
Indian Consumer Buying Behaviour. This study is based
on primary and secondary data. The primary data has
been collected by canvassing a questionnaire,
containing both open and closed-ended questions,
among 123 respondents across genders and age groups.
This study reveals that most Indian consumers are brand
conscious and brand loyal. Brand image also represents
the quality of the product to the consumer. The study
also reveals that irrespective of gender and age, ‘Catchy
Advertisements’ govern the buying behaviour of about
70 per cent of Indian consumers. Irrespective of gender,
‘Catchy Advertisement’ appears to be a significantly
effective tool of sales promotion among consumers
belonging to the age group of 20 to 30 years.
KEYWORDS: Branding, Sales Promotion, Brand
Loyalty, Offers, Coupons.
INTRODUCTION
Since the initiation of economic globalization, both
domestic and global markets have become very
competitive. Though companies have always been
struggling to achieve or maintain a competitive
advantage, the COVID-19 pandemic has severely
affected the entire business community throughout the
world. Therefore, it becomes imperative to study how
the companies can regain their competitive edge.
The Indian domestic market is very lucrative, both to
the domestic and the global business community.
Scholars of different disciplines have studied the various
aspects of business, including the two prime factors i.e.,
branding and sales promotional techniques. It becomes
apparent that no serious attempt has been made to
study the impact of branding and sales promotional
techniques on Indian consumers. Consumers are
considered to be the ultimate decisive factor for the
success of a business and consumer behaviour, in
general, is very complex. Indian consumers are very
much influenced by socio-economic as well as religious
norms and taboos. Despite that, innumerable business
centers like Big Bazaar, City Mall and Shopping
Complex create a craze for shopping among people in
India. Hence, the dynamics of business are deemed
necessary to study. Companies have to utilize the
opportunity of the craze-shopping behaviour of the
people by updating their brand value and taking into
account consumer’s demands and choices. This may be
one of the ways to survive in this cut-throat
competition.
This study is an attempt to assess the effects of branding
and sales promotion on Indian Consumer Buying
Behaviour. This study also examines the respondents’
priority of choosing a product along with the factors
responsible for brand image building and finding
effective sales promotion tools.
LITERATURE REVIEW
Various studies have been carried out on sales
promotion till date. Cotton and Babb (1978) observed
that there is a trend of sales promotion, known as in-
store promotion, which is used to increase consumer
purchases. This is more effective during the time when a
sale is going on. A few researchers, however, have a
contrary view and feel that sales promotion is an
expensive tool and it may affect profits negatively.
Walters and Mackenzie (1988) and Martinez and
Montaner (2006) mentioned that some factors can
induce a customer to buy more or less of a product, and
those depend on the customer’s economic and social
situation as well as his/her characteristics. D. B. Tse
(1989) mentioned that brands create a feeling of status
consciousness in most consumers which leads to a
sense of recognition and that using different branded
products is a new trend of fashion. People feel good
when they are recognized in the society and among
friends and family, regarding a specific brand that is
mostly used by them. Now, people want to have almost
everything to be branded from the food they eat and
clothes they wear to the clothes they decorate their
homes with. Status and conspicuous consumption are
other important factors that affect consumer behaviour
to a great extent.
OBJECTIVES OF THE STUDY
The objectives of the study are:
1. To examine the impact of branding on Indian
consumer buying behaviour.

Effects of Branding and Sales Promotion on Indian Consumer Buying BehaviourBEYOND
YOUTHINK l 2022 l Vol. XVI 102
2. To examine the impact of
contemporary techniques of sales
p romot ion on the buy ing
behaviour of Indian consumers.
3. To study the brand responses of the
Indian consumers in different
sectors.
DATA AND RESEARCH
METHODOLOGY
Both primary and secondary data have
been used in this study. The secondary
data was collected from newspapers,
magazines and the internet. Primary
data was collected by canvassing a
questionnaire containing both closed-
ended and open-ended (allowing the
respondents to have flexibility in their
responses) questions among 123
respondents of various age groups
(namely: ‘below 20 years’, ‘20 to 30
years’ and ‘above 30 years’) and gender.
The entire PAN India region was undertaken for the
research as the area of study. Simple Random Sampling
method was used for selecting the respondents. For the
sake of simplicity, the analysis has been presented using
tabular and graphical methods.
DATA ANALYSIS
Among 123 respondents, there are 64 male and 59
female respondents (see Table 1; Part A). Out of these,
68 per cent (consisting of 73 per cent of the total male
respondents and 63 per cent of the total female
respondents) belong to the age group of 20 to 30 years.
The remaining 20 per cent and 12 per cent belong to
the age groups of ‘below 20 years’ and ‘above 30 years’
respectively. This implies that the majority of the
respondents are young.
It is apparent that irrespective of age groups and gender
division, the respondents’ first priority of choosing a
product is ‘Brand’ (48 per cent), second priority is
‘Price’ (36 per cent), third priority is ‘Product Quality’
(13 per cent) and the last priority is ‘Packaging’ (3 per
cent) (see Table 1; part B). This priority of choosing a
product becomes more evident when we observe that
about 85 per cent of the respondents purchase
products of popular brands. It is also observed that the
purchase of branded products is most popular among
the young respondents, i.e., in the age group of 20 to 30
years, irrespective of gender (see Table 2).
A. Characteristics of Respondents
Gender Age Group (in Years) Total
Below 20 20 – 30 Above 30
Male 15 47 2 64
Female 9 37 13 59
Total 24 84 15 123
B. Respondents’ First Priority of Choosing a Product by Gender
and Age Group
Gender Age GroupPriority
Brand
Price
Quality
Packaging
Male
Below 20
6
7
1
1
20 –
30
24
19
4
0
Above 30
1
0
1
0
Female
Below 20
5
3
1
0
20 –
30
16
12
7
2
Above 30
7
3
2
1
Total
59
44
16
4
Table 1: Characteristics of Respondent and their First Priority of Choosing a Product(Source: Primary Data)

BEYONDEffects of Branding and Sales Promotion on Indian Consumer Buying Behaviour
YOUTHINK l 2022 l Vol. XVI103
The survey also aims to find out the perception of the
respondents regarding how the companies can build up
or enhance their brand image. The responses in this
regard are summarized in Table 3. It is evident that the
most important criterion for a company to build or
enhance its brand image is producing quality products.
About 66 per cent of the respondents believe that
quality products are the most important criteria for
establishing a brand image. Around 19 per cent and 13
per cent of the respondents argued in favour of product
uniqueness and sales promotion techniques
respectively for the creation of a brand image (see Table
3).
Respondents were asked to reveal their opinion
regarding the most effective tool of sales promotion
among tools like ‘Discount Offer’, ‘Catchy
Advertisement’, ‘Personal Selling’ and ‘Quality
Product.’ It is interesting to note that irrespective of
gender, about 70 per cent of the respondents were in
favour of ‘Catchy Advertisement’ being the most
important tool for sales
promotion. Out of 70 per
cent of the respondents in
f a v o u r o f ‘ C a t c h y
Adver t i sements ’ , 54
percent of the total
respondents, irrespective
of gender, belong to the
age group of 20 to 30
years. Following ‘Catchy
Advertisement’, ‘Personal
Selling’ and ‘Discount
Offers’ are important sales
promotion tools (see
Table 4). This finding
clearly reveals that there is
a craze among young boys
and girls to imitate
fashions displayed in a
‘Catchy Advertisement.’ It
is also evident that the
most important criterion
for building or enhancing
the brand image is
p r o d u c i n g q u a l i t y
products.
Gender Age Group Purchase Products of Popular Brand
Yes Neutral No
Male
Below 20 13 2 0
20 –
30
39 7 1
Above
30
1
1
0
Female
Below 20
8
1
0
20 –
30
32
5
0
Above 30
12
1
0
Total
105
17
1
Table 2: Purchase Products of Popular Brand by the Respondents
(Source: Primary Data)
Gender Age Group
Factors Responsible for Image Building
Product Quality
Product Uniqueness
Sales Promotion Techniques
All
Male
Below 20
9 2 3 1
20 – 30 26 11 9 1
Above 30 1 0 1 0
Female
Below 20 7 2 0 0
20 – 30 29 6 1 1
Above 30 9 2 2 0
Total 81 23 16 3
Table 3: Factors Responsible for Brand Image Building as Assessed by Respondents(Source: Primary Data)

Effects of Branding and Sales Promotion on Indian Consumer Buying BehaviourBEYOND
YOUTHINK l 2022 l Vol. XVI 104
Gender Age Group
Sales Promotion Tools
Discount Offers
Catchy Advertisement
Personal Selling
Quality Product
Male
Below 20
5
9 1 0
20 – 30 3 35 9 0
Above 30 1 0 1 0
Female
Below 20 0 7 2 0
20 – 30 3 31 3 0
Above 30 5 4 4 0
Total 17 86 20 0
Table 4: Sales Promotion Tools as Considered by Respondents(Source: Primary Data)
(Source: Primary Data)
Interpretation: The automobile sector received the highest number of mixed responses. Honda, Maruti Suzuki,
Hyundai and Toyota received a significant number of votes as compared to others.

BEYONDEffects of Branding and Sales Promotion on Indian Consumer Buying Behaviour
YOUTHINK l 2022 l Vol. XVI105
Interpretation: Lastly, in the fast-food sector, Domino’s and McDonald’s received the highest number of votes,
followed by KFC and Subway. No distinction could be made when the various age groups were analyzed in terms of
their preferences and their buying behaviour as there was almost an equal effect of branding and sales promotion on
all age groups. Responses were heterogeneous in nature.
Interpretation: In the electronic goods sector, Sony was clearly the most preferred, followed by Samsung and Philips.
These three brands have been household names for a long time and have retained their positions in the minds of the
consumers.
(Source: Primary Data)
(Source: Primary Data)
Indian domestic market has become very attractive and
foreign companies have entered our domestic markets
with branded products. Consumerism has increased
manifold and Indian consumers have now become very
sensitive to brand image. The present study reveals that
the purchase of branded products is the most popular
among the young respondents, i.e., in the age group of
MAJOR FINDINGS
In India, consumer behaviour, other than in cities and
towns, is mostly guided by socio-economic as well as
religious norms and taboos. Due to it being a market
economy, as well as improvement in infrastructure and
communication facilities, the act of consumerism has
increased manifold. After economic liberalization, the

Effects of Branding and Sales Promotion on Indian Consumer Buying BehaviourBEYOND
YOUTHINK l 2022 l Vol. XVI 106
20 to 30 years, irrespective of gender. It is found that
product quality is the most important factor responsible
for brand image. Thus, it seems that the young
generation has assumed that brand image ensures
products quality. This study clearly identifies that
‘Catchy Advertisement’ is the most effective tool for
sales promotion. Hence, we can say that Indian
consumers have become quality conscious and prefer
purchasing goods of standard quality even if it costs
comparatively higher.
LIMITATION OF THE STUDY
The major limitation of this study is that it is mainly
restricted to urban areas. Therefore, generalization is
not possible. This study fails to relate the greater acts of
consumerism to the fulfilment of one’s desires or to a
change in choices and values. It also fails to explain the
psychological changes behind the attraction of the
young generation towards ‘Catchy Advertisement’.
CONCLUDING REMARKS AND POLICY
RECOMMENDATION
The brand image of a company is enhanced when
consumers accept and recognize its product or
products as satisfactory. So, it is the consumer who
creates the brand image of a company and thereafter,
the company uses its brand image as a tool for the
success of its business. Product quality is highly related
to brand image creation. Here, brand image and
product quality are intertwined with each other. The
present young generation in urban areas is very much
conscious about product quality which has, in turn,
shifted their preference towards branded products. This
picture is clearly revealed in this study.
Sales promotion is another tool as well as technique to
enhance businesses. There are various techniques of
sales promotion like ‘Discount Offers’, ‘Catchy
Advertisement’, ‘Personal Selling’, ‘Quality Product’,
‘After Sale Services’, ‘Home Delivery’ et al. All these
sales promotion techniques are not equally effective in
all time and space. The effectiveness of these sales
promotional techniques also differs in accordance with
the product differentiations. However, ‘Catchy
Advertisement’ happens to be one of the most effective
techniques in all time and space. This phenomenon is
clearly revealed in our study.
Again, branding and sales promotion are interlinked
because when new brands enter the market, the
competition becomes more intense. These companies
may not involve themselves in a price war, instead, they
opt for a smart way of luring customers by ensuring
brand equity as well as opting for sales promotion
activities hand in hand. We can conclude that people
living in urban cities, especially in metro cities, are
much more informed and alert about their shopping
and act as smart buyers to attain full utility out of their
hard-earned money.
Indian urban consumers accept reasonable prices of
b r anded goods . The re fo re , a s a po l i c y
recommendation, we can say that a company should
take care of their pricing strategy while planning its
products. Various factors like age, income and gender
are the determining factors behind the choices of
consumers, so the company should devise its marketing
strategies accordingly to suit the needs of different
categories of customers.
REFERENCES
1. Chandon, P., Laurent, G. and Wan sink, B. (2000) ‘A benefit
congruency framework of sales promotion effectiveness’
Journal of Marketing. Vol. 64, No. 4, pp. 65-81.
2. Kopalle, P. K., and Mela, C. F. (1999) ‘The dynamic effect of
discounting of sales: Empirical analysis and normative
pricing implications.’ Marketing Science, Vol. 18, No. 3, pp.
317-332.
3. Kotler P. (2003), Marketing Management. Delhi: Pearson
Education. Kumar SR (2007). Marketing and Branding, The
Indian Scenario. Dorling Kindersley, Delhi.
4. Ndubisi O.N. (2005), Customers Behavioural Responses to
sales promotion: The Role of Fear of Losing Face, Vol. 17,
No.1, pp.32-49.
5. Peter, J.P. and Olson, J.C. (1996). Consumer Behaviour and
Marketing Strategy, (4th Edition). New York.: Irwin. Philip
Kotler, Gary Armstrong. (2006), Principles of marketing,
edition 11.
6. Schiffman LG, Kanuk LL. (2004), Consumer Behaviour. 8th
Ed. Pearson Education, New Delhi.
7. Zallocco, Perreult and Kincaid (2008), Promotion,
Persuasive Communication in Marketing (Irwin-Dorsey
Limited, White, Senecal, Morgan, Blackwell and Miniard).
BEYOND
YOUTHINK l 2022 l Vol. XVI107
Actualizing a Relationship Model between Anthropomorphic Communication and Product Evaluation
The forms and
characteristics of a
particular product
can directly have an
impact on the
evaluation or the
degree of
anthropomorphism,
and can play a
moderating role in
the same.
ABSTRACT
It has been observed that marketers devote a substantial amount of their
precious time in the designing of products and marketing communications,
which involves mulling over technologies, ergonomics, and even human
touch. Launching products by embedding human characteristics within the
products or packaging, or even the marketing of a product through a human
spokesperson is actually a deliberate ploy by the marketers to fine-tune the
acceptance of their products and improvise on total product evaluation. The
reason behind such uncanny marketing efforts is ingrained in the perception
of consumers towards products as human beings, and thus, products are
designed keeping this in mind. This is the essence of anthropomorphism,
where objects are perceived as human beings or having human features and
behaviour. The objective of the present study is to throw light on a systematic
understanding of anthropomorphism and propose a conceptual framework
highlighting the relationship.
KEYWORDS: Marketing, Anthropomorphism, Products, Consumers.
INTRODUCTORY STATEMENTS
Human beings tend to look for human-like traits or characteristics in mere
objects. They see faces in clouds or feel that their cell phone is their true
Samuel S MitraResearch Scholar,Department of Commerce

Actualizing a Relationship Model between Anthropomorphic Communication and Product EvaluationBEYOND
YOUTHINK l 2022 l Vol. XVI 108
friend, and it has emotions, or
even that their laptop is
conspiring against them, when
it gives trouble before or during
an important task. It is almost as
if humans are in their own
world of fancy imaginations
with ineluctable frenzies and
j i t t e r y t h o u g h t s . T h i s
phenomenon of perceiving
objects as humans is known as
anthropomorphism. In the
definition of Epley et al. (2007),
an th ropomorph i sm i s a
psychological process in which
humans perceive the actual or imagined behaviour of
objects, also known as non-human agents, with
characteristics similar to humans, including
motivations, intentions, or emotions. Previous
r e s e a r c h e r s o p i n e t h a t h u m a n b e i n g s
anthropomorphize to make sense of an object which
fine-tunes a manly logic of effectiveness and
predictability (Epley et al., 2008). Beyond the general
psychological concepts and theories, there exists
limited research on priming products with human
characteristics and their overall impact on the
anthropomorphism of products of different types,
based on complexity. The following notion has
potential implications in the domain of marketing;
however, very few studies have addressed the act of
perceiving products as humans.
Guthr ie (1995) proposed three forms of
anthropomorphism, namely, partial, literal, and
accidental. In the first form of anthropomorphism,
people perceive objects to be humans or possess
human-like traits because of the presence of limited
human features. In the second case, perception is due
to the presence of complete human-like features, and
the third form happens as a result of a mistake.
Epley et al. (2008) theoretically highlighted the curious
concept of anthropomorphism and its psychological
nature. They proposed a three-factor theory termed
‘SEEK’ viz. Sociality, Effectance, and Elicited Agent
Knowledge, which are actually the determinants of
anthropomorphism that def ined the very
phenomenon.
REVIEW OF BACKGROUND LITERATURE
Existent literature recommends that products are
blended with human characteristics in various
methods, which include human intentions, human
motivations, human physical features, and human
emotions (Epley et al., 2007). Studies hint that the
messages that are delivered in advertisements have an
impact on consumer attitude towards the brand
(Labroo et al., 2008; Arias-Bolzmann et al., 2000),
consumer purchase intentions (Putrevu and Lord,
1994; Susianto and Afiff, 2017), and consumer
evaluation of the product (McQuarrie and Phillips,
2005). Guthrie (1993, 1995), in his study, proposed
different forms of anthropomorphism based on their
levels and strengths, namely, partial, literal and
accidental. Aggarwal and McGill (2012) conducted a
study on products and brands that were
anthropomorphized as partners and servants. Delbaere
et al. (2011) opined that the tendency of humans to
attribute human features such as intelligence and
emotions to products considerably improves product
evaluation. Hart et al. (2013) pioneered an ‘un-primed
approach’ to blend anthropomorphism in products on
the basis of its complexity. In fact, anthropomorphism is
an inherent trait, as suggested by Neave N. et al., 2015.
Zaichkowsky, 1986; Bloch and Richins, 1983, viewed
involvement as having three major components.
Anthropomorphism can also be explained from the
perspective of marketing (Aggarwal et al., 2007), art and
craft, as well as religion (Guthrie 1993; 1995). Aggarwal
and McGill (2007) and Landwehr et al. (2011), in their
respective studies, tried to emphasize on product
Figure 1: Definition of the Three Determinants of ‘SEEK’
(Source: Author’s Compilation)

BEYONDActualizing a Relationship Model between Anthropomorphic Communication and Product Evaluation
YOUTHINK l 2022 l Vol. XVI109
anthropomorphism and its impact on liking, sales and
evaluation of products.
ANTHROPOMORPHISM IN PRODUCTS AND
BRANDS
Marketers immensely value the significance of
anthropomorphism and seek the introduction of
products with ‘emotionally pleasing’ shapes and
features attuned with brands or products. A good
example would be the famous clown of McDonald’s. It
is testimony to the fact that anthropomorphism extends
beyond just seeing faces in entities, and covers the
perception of facial expressions and emotions in
products. Partial and literal forms of anthropomorphism
are embedded in products by the marketers during
promotional campaigns. For example, in the case of
partial anthropomorphism, an advertisement was
launched by Bajaj Pulsar motorcycle in the year 2005,
which showed the motorcycle with a tagline,
‘#DefinitelyMale’, with masculine characteristics. It
was a harbinger that the motorcycle was directed
towards men. In the case of literal anthropomorphism,
a good example of an eye-twitching advertisement
would be the Pillsbury advertisement campaign
showing human-shaped dough. It is noteworthy to
mention that both partial anthropomorphism and literal
anthropomorphism are relevant in the context of
products, unlike accidental anthropomorphism.
ANTHROPOMORPHISM IN MARKETING AND
BRANDING STRATEGIES
There was limited attention given to the concept of
anthropomorphism by marketing researchers in the
initial years of its emergence. With the passage of time,
the concept started gathering steam because of heavy
advertisements of products, which were given the
shape of humans or had human-like attributes. This was
first noticed in the film industry by Disney, in the year
1928, with several animated animals having human
features. Currently, this is being applied by marketers in
myriad campaigns or branding activities like Crest
Toothpaste and M&M Candies.
Aggarwal and McGill (2012) conducted a study on
products and brands which were anthropomorphized
as ‘Partners’ and ‘Servants’, with defined brand roles.
Partner brands were referred to as ‘products or services
which required human involvement to derive its
usefulness’, while ‘products or services which provided
utility on its own’ were defined as servant brands.
Renowned international brands like Kellogg’s,
Discovery Channel, and Volvo were embedded with
human characteristics in the sector of Fast Moving
Consumer Goods (FMCG), knowledge channel, and
the automobile industry, respectively, in the quest to
find their impact on anthropomorphism. The findings
revealed that partner brands had a higher
anthropomorphism scale than servant brands. The
Figure 2: Example of Anthropomorphism in Products/Brands
(Source: alchetron.com)
Figure 3: Disney Was the First to Practice the Concept of
Anthropomorphism
(Source: julian-leha.blogspot.com)

Actualizing a Relationship Model between Anthropomorphic Communication and Product EvaluationBEYOND
YOUTHINK l 2022 l Vol. XVI 110
tendency of anthropomorphizing and evaluation of
products varied depending on the perception of the
products or brands as partner brands and servant
brands. When humans anthropomorphize non-
humans or products, it acts as a catalyst to ultimately
develop an emotional bonding and a sense of rapport
between the customer and the product or brand. This
further brings out the relevance of human traits in the
development of a bond between the consumers and
the products.
PRODUCT COMPLEXITY
Attribution of human features such as intelligence and
emotions to products has an immense potential to
improve the evaluation of products, ably supported by
empirical researches (Chandler and Schwarz, 2010;
Landwehr et al., 2011). An un-primed approach to
induce anthropomorphism in products, on the basis of
their complexity, is a much-needed tonic to measure
naturally occurring anthropomorphism in products,
without priming them with human characteristics,
where the essence would lie in the examination of the
underlying relationship between perception of objects
as humans and personal value of the object.
INVOLVEMENT AND INHERENT TENDENCIES
AFFECTING ANTHROPOMORPHISM
However, the tendency of consumers to
anthropomorphize a product is related to its
complexity. Anthropomorphizing a simple product like
toothpaste also requires a considerable level of human
characteristics to make a significant impact and gain the
attention of the customers. Individuals have the
tendency to be effective in the prediction of the
behaviour towards an object, or in their interaction with
an entity, ultimately, bolstering anthropomorphism.
Involvement is said to have three major determinants,
namely, characteristics of the person, characteristics of
the stimulus, and characteristics of the situation. Any of
these, or the combined force of such determinants, may
have a significant impact on the level of involvement.
PROPOSED THEORETICAL FRAMEWORK
The present study proposes a conceptual
understanding of the term ‘Anthropomorphism’, which
is used extensively by marketers as an effective tool by
leveraging a balanced infusion of human forms and
traits to ameliorate the extent of anthropomorphizing
and product evaluation. The following relationship
Figure 4: Proposed Conceptual Framework
(Source: Author’s Compilation)

BEYONDActualizing a Relationship Model between Anthropomorphic Communication and Product Evaluation
YOUTHINK l 2022 l Vol. XVI111
model seeks to establish a relationship between forms
and features of anthropomorphism to the extent to
anthropomorphize simple, as well as, complex
products and product evaluation, in the presence of
inherent anthropomorphic tendency and involvement.
This theoretical model bridges the gap between the
different varieties of products, both simple and
complex, when blended with human characteristics,
impact the extent of anthropomorphizing and the
evaluation of the product. The following phenomenon
is conducted under two moderating factors which are,
‘inherent tendencies of anthropomorphism’ and
‘involvement with the proposed product.’ Hence, the
forms and characteristics of a particular product can
directly have an impact on the evaluation or the degree
of anthropomorphism, and can play a moderating role
in the same.
The following conceptual framework has been
proposed, which has been illustrated in Figure 4. The
model has been developed on the basis of Aggarwal
and McGill, 2007; Landwehr et al., 2011 and Hart et
al., 2013.
CONCLUSIVE REMARKS
The various concepts, theories, and understandings of
anthropomorphism and its implication have been
explained by previous literature, which stems from the
backdrop of human psychology, marketing, art and
craft and religion. The current study was an endeavour
attempted at examining the relationship between the
role of anthropomorphic forms and features in simple
as well as complex products. Their evaluation has been
instrumental in throwing valuable light on the large
looming question about the availability of the type of
human features or forms for use. The convenience of
summing up the whole theoretical relationship
between anthropomorphism and products has been
highlighted in this study, which shall help to bridge the
gap of systematic and precise examination of product
anthropomorphism considering the inherent
anthropomorphic tendencies in human beings and
their preference of products with the right form of
human characteristics.
IMPLICATIONS
Further study may be conducted to examine the impact
of human forms and characteristics on purchase
intention and sale of products in the market. The
market comprises consumers with varying tendencies
for anthropomorphizing products. The present study
pinpoints a very valuable suggestion for the marketers
for designing their products with human features, based
on varying inherent anthropomorphic tendencies in
consumers. Under the radar of getting a better picture
of product anthropomorphism categorized into simple
products and complex products, the present study has
made a pioneering effort in offering a focused area of
research on priming products with suitable human
characteristics, which will lead to further research on
available products in the market with the scope of
renewed implications in product anthropomorphism.
REFERENCES
1. Aggarwal, P. and McGill, L.M. (2007). Is that car smiling at
me? Schema Congruity as a basis for Evaluating
Anthropomorphized Products. Journal of Consumer
Research, Vol. 34, pp. 468-479.
2. Arias-Bolzmann, L., Chakraborty, G. and Mowen, J.C.
(2000). Effects of absurdity in advertising: The moderating
role of product category attitude and the mediating role of
cognitive responses. Journal of Advertising, Vol. 29,
pp. 35-49.
3. Bloch, P.H. and Marsha, L. R. (1983). A Theoretical Model of
the Study of Product Importance Perceptions. Journal of
Marketing, Vol. 47, pp. 69-81.
4. Chandler, J. and Norbet, S. (2010). Use does not wear ragged
the fabric of friendship: Thinking of objects to replace them.
Journal of Consumer Psychology, Vol. 20, No. 2, pp. 138-
145.
5. Delbaere, M., McQuarrie, F. E. and Philips, J. B. (2011).
Personification in Advertising – Using a visual metaphor to
trigger Anthropomorphism. Journal of Advertising, Vol. 40,
pp. 121-130.
6. Epley, N., Waytz, A. and Cacioppo, T. J. (2007). On Seeing
Human: A Three-Factor Theory of Anthropomorphism.
American Psychological Association, Vol. 114, pp. 864-886.
7. Epley, N., Waytz, A., Alkalis, S. and Cacioppo, T. J. (2008).
When we need a Human: Motivational Determinants of
Anthropomorphism. Social Cognition, Vol. 26, pp. 143-155.

Actualizing a Relationship Model between Anthropomorphic Communication and Product EvaluationBEYOND
YOUTHINK l 2022 l Vol. XVI 112
8. Hart, M.P., Jones, R.S. and Royne, B. M. (2013). The human
lens: How anthropomorphism reasoning varies by product
complexity and enhances personal value. Journal of
Marketing Management, Vol. 29, pp. 105-121.
9. Labroo, A.A., Dhar, R., and Schwarz, N. (2008). Of frog
wines and frowning watches: Semantic priming, perceptual
fluency, and brand evaluation. Journal of Consumer
Research, Vol. 34, pp. 819–831.
10. Lakshmidewi, D., Susianto, H. and Afiff, A. Z. (2017).
Anthropomorphism in Advertising: The effect of
anthropomorphic product demonstration on consumer
purchase intention. Asian Academy of Management Journal,
Vol. 22, No. 1, pp. 1-25.
11. Landwehr, R. J., McGill, A. L. and Herrmann, A. (2011). Its
got the look: The effect of friendly and aggressive facial
expressions on product liking and sales. Journal of
Marketing, Vol. 75, No. 3, pp. 132-146.
12. McQuarrie, Barbara J. Phillips (2005). Indirect Persuasion in
Advertising: How consumers process metaphors presented
in Pictures and Words. Journal of Advertising, 34, No. 2, pp.
7-21.
13. Neave N., Jackson R., Saxton T and Honekopp J (2015), The
influence of Anthropomorphic tendencies on human
hoarding behaviours, Personality and Individual Differences,
72, pp. 214-219.
14. Patsiaouras G., Fitchett, J. and Saren, M. (2014), Boris
Artzybasheff and the art of anthropomorphic marketing in
early American consumer culture. Journal of Marketing
Management, Vol. 30, Nos.1-2, pp. 117- 137.
15. Putrevu, S., and Lord, K.R. (1994). Comparative and non-
comparative advertising: Attitudinal effects under cognitive
and affective involvement conditions. Journal of Advertising,
23, No. 2, pp. 77–90.
16. Spears, N. E., Mowen, J. C. and Chakraborty, G. (1996).
Symbolic role of animals in print advertising: Content
analysis and conceptual development. Journal of Business
Research, Vol. 37, pp. 87–95.
17. Zaichkowsky, J. L. (1994). The personal involvement
inventory: Reduction, Revision and Application to
Advertising, Journal of Advertising, Vol. 23, No. 4, pp. 59-70.

BEYOND
YOUTHINK l 2022 l Vol. XVI113
‘Do Not Mind That You Are Taken’ - A Case Study on the Hostile Takeover of Mindtree by Larsen & ToubroProf. Saptarshi RayAssistant ProfessorDepartment of Commerce (Evening)
Sumedha BanerjeeDepartment of Commerce (Evening)
Consortium
between
Mindtree and
L&T is benefitting
both companies
because they
have different
strengths to
contribute.ABSTRACT
This research deals with hostile takeover through the case study of the
forceful acquisition of Mindtree by conglomerate giant, Larsen and Toubro. A
hostile takeover can be defined as the purchase of one company which is
termed as ‘the target’ by another company which is termed as – ‘the acquirer
or bidder’. The objective of the study is to find why the deal became hostile
and understand the various concepts related to the hostile takeover and the
business environment which leads to a hostile takeover. We will analyze
various methods employed by corporates to carry out a takeover and study

'Do Not Mind That You Are Taken'BEYOND
YOUTHINK l 2022 l Vol. XVI 114
the advantages of a takeover on shareholders’ wealth.
The analysis will also throw light on the advantages and
disadvantages of a takeover, the defensive strategies
that the target company can use to avoid a hostile
takeover, and the various legal provisions to combat a
hostile takeover.
KEYWORDS: Hostile Takeover, Mindtree, Larsen and
Toubro, Defence Strategies.
INTRODUCTION
Mergers and acquisitions are unavoidable in the
business world. A merger is when two entities are
coming together to share their synergy. It is like a
marriage between two companies in the corporate
haven. Acquisitions can be cordial as well as
incongruous. A cordial acquisition is one in which the
controlling group of the target company sells its stake to
a bidder voluntarily. However, if the management of the
target company is not willing to reach an agreement, the
bidder can directly approach the shareholders of the
company by making an unconditional public offer.
Quoting the Institute for Mergers, Acquisitions and
Alliances, (IMAA) the total value of mergers and
acquisitions globally in the year 2019 was
approximately $3.7 trillion across 49,500 deals.
VARIOUS TYPES OF MERGERS
1. Horizontal Mergers: Horizontal mergers take
place when two companies are in the same sector
and stage. Companies choose these types of
mergers because they want to consolidate their
activities, reduce costs, survive fierce competition
and increase market share.
2. Vertical Mergers: It can be termed as forward or
backward integration along the same value chain.
3. Reverse Merger: A reverse merger takes place
when a large private entity acquires a public entity
to access the IPO market or when the brand value
of the small entity is so big that the large company
goes and acquires it.
4. Congeneric Merger: When two firms are in the
same industrial sector but a different line of
production, and they merge together to extend
their activities, market advantages, and strategic
extension, it can be termed as a congeneric merger.
5. Conglomerate Merger: When two firms who are
unrelated in their business come together to avoid
saturation, diversify their business, and leverage
from new business, it can be termed as a
conglomerate merger.
6. Forward Integration: When a company is being
merged with a company along the same value chain
but it is an upward integration closer to the
consumer, it is termed as forward integration.
ADVANTAGES AND DISADVANTAGES OF
MERGERS AND ACQUISITIONS
The advantages of merger and acquisition include
sharing of synergy, reduced cost, competitive
advantage, increased scope, economies of scale,
diversification, strategic and financial benefits.
The disadvantages include creation of chaos in the
management due to differences in the corporate
culture, leaving the employees in distress as many of
them tend to lose their jobs, increase in debt burden,
may lead to monopoly, hinder innovation and growth
sometimes.
FEW STRATEGIES USED BY CORPORATES TO CARRY
OUT MERGER AND ACQUISITIONS
?Negotiation: It is a friendly merger where one
company amicably decides to merge with another
company.
?Hostile: It is not a merger by choice but by
compulsion, against the consent of the target
company.
?Reverse Bidding: When a target company counter
offers to the bidder company, it is termed reverse
bidding.
LITERATURE REVIEW
‘Significance of Mergers and Acquisition in India’
explores the concept of mergers and acquisition in
detail. It tries to find out the trend and scenarios that
eventually lead to the merger. According to the findings,
mergers and acquisitions and business restructuring has
gained importance in today’s world and are often
practised by corporates to sustain the market and
combat the increased competition.

BEYOND'Do Not Mind That You Are Taken'
YOUTHINK l 2022 l Vol. XVI115
The paper titled ‘The Importance of Mergers and
Acquisition in Today ’s Economy ’ by Rima
Tamosiuniene and EgleDuksaite (2009) throws light on
the significance, benefits, and disadvantages of mergers
and acquisition activities in today’s world and the
factors that trigger them. According to the findings,
mergers and acquisitions in today’s world are very
beneficial as it leads to sharing of synergies, cost
reduction, increased flow of revenue. This conscious
restricting of companies is very necessary as it yields
good returns to both corporate owners as well as
investors.
The paper titled ‘L&T’s Hostile Takeover of Mindtree’
by Nishith Desai and Associates (2020) studies India’s
first hostile takeover and finds out the major red ocean
strategies used by the big opportunistic company to
target the weak company and how the target company
should rethink their strategies to combat the hostile
takeover.
In the paper ‘Larsen and Toubro Infotech’s Hostile Bid
for Mindtree Ltd.: Much Ado About Nothing! A
Teaching Case’ by Janki Mistry (2020), she investigated
and analyzed the recent acquisition, anti-takeover
tactics, nature of the deal, and the funding. The findings
suggest how both the company’s balance sheet was
showing a positive result and how the share prices of
both the companies went up and how both the
companies benefitted from this deal.
RESEARCH GAP
The majority of the research related to merger and
acquisitions suggest that the related activities lead to
ubiquitous outcomes for companies as well as for
individuals and throws light on how the company fails
to meet the financial expectations post-merger.
However, this study contextualizes how hostile
takeover, which is a type of merger and acquisition
activity, actually impacted Larsen and Toubro and
Mindtree in a positive way.
RATIONALE
This study will include an explanation as to the concept
of hostile takeover and will throw light on various pros
and cons of a hostile takeover on shareholders’ wealth
and what are the defensive strategies that a target
company can sort in order to ward off a hostile takeover.
OBJECTIVES
1. To understand why the L&T Infotech (LTI) – a part of
the Larsen and Toubro group (construction and
engineering company) acquired Mindtree
(Information Technology and Outsourcing
Company) using hostile takeover methods.
2. To analyze the benefits of a hostile takeover on
shareholders’ wealth and study the share price
volatility, defensive strategies used, and legal
provisions to combat hostile takeover.
RESEARCH METHODOLOGY
Research methodology is an approach to systematically
solve issues. It is essential for us to know not just the
research strategies but also the procedure. It must be
noted that the centrality of research lies in its equality
and not quantity. Researchers should realize how to
apply specific research procedures and should know
which of these strategies or methods are important and
which are not. It is used to identify, select, process, and
analyze information about a topic. A research paper
helps the reader to critically evaluate a study’s overall
validity and reliability. Analytical and descriptive
research methods have been used to determine the
success of the hostile takeover carried out by Larsen and
Toubro.
SECONDARY RESEARCH
The data used is based on secondary data that has been
taken from various research journals, news articles and
reports.
TIME FRAME
We have tried to focus on the year of 2019 in which the
hostile takeover took place.
STATISTICAL TOOLS USED
Various bar charts and graphs have been used to
represent the various data and findings.

'Do Not Mind That You Are Taken'BEYOND
YOUTHINK l 2022 l Vol. XVI 116
BACKGROUND STUDY
Hostile Takeover: Hostile takeover can be defined as
the purchase of one company which is termed as ‘the
target’ by another company which is termed as - ‘the
acquirer or bidder’. It is a merger against the will or wish
of the target company through an open public offering.
The Hostile Takeover Started as: The hostile takeover
bid was given by Larsen and Toubro Infotech, a
subsidiary of the Larsen and Toubro conglomerate
group in 2019. Initially, V.G. Siddhartha, a non-
executive director of Mindtree decided to resign on 9th
March, 2018 and sell off his 21 per cent stake in the
company to recover his debt. He approached Larsen
and Toubro Infotech Ltd. one of the largest global
information technology services and solutions
company. Larsen and Tourbo in 2019 had a lot of excess
cash reserves amounting to more than $2 billion. The
company wanted to channel this cash to create higher
returns and the software industry in India provides one
of the highest rates of return. This was the reason why
LTI decided to make an acquisition in the software
space. Earlier also in 2016-17, Larsen and Toubro
Infotech acquired:
?Augment IQ Data Sciences which specialized in big
data.
?Ruletronics for making a big entry in the Pega
implementation space.
The Seller: V.G. Siddhartha, the owner of Café Coffee
Day Enterprise, invested in Mindtree in 1999 when it
was struggling as an Information Technology start up.
A Brief Description about the Target Company:
Mindtree was founded by ten Information Technology
professionals who were from renowned organizations
like ‘Cambridge Technology Partners’, ‘Lucent
Technologies’, ‘Wipro’ and had the same passion for
creating something revolutionary in the field of IT, e-
commerce, and entrepreneurship. Mindtree was the
brainchild of Krishnakumar Natarajan and Subroto
Bagchi. It had performed excellently over the years and
had captured a huge market worldwide and expanded
its business to Europe, the Asia-Pacific region, and the
Middle East nations. The global expansion made a huge
impact in building a strong company with a diversified
customer portfolio.
A Brief Description about the Acquiring Company:
Larsen and Toubro Infotech limited started operating in
1997 and currently has its operations in 33 countries. It
offers services in various fields like cloud computing,
cloud-based information services, assurance, cyber
defence resiliency services, and application
management. Larsen and Toubro Infotech aim to
improve business outcomes through the use of artificial
intelligence, automation, and data analytics.Discussed in Table 1 is the snapshot of the deal.
Name of the Target Company
Name of Acquiring Company
Sellers who Instigated the Hostile Takeover
Modes of Acquisition used by Larsen and Toubro Infotech
Mindtree Limited
Larsen and Toubro Infotech Ltd.
V.G. Siddhartha - Café Coffee Day Enterprises Founder and Promoter
Through direct acquisition: LTI purchased 33,360,229 equity shares
that is 20.15 per cent of Mindtree (target company) from the seller
through a special purchase agreement @ 980/share.
Through open market purchase order: The bidding company
purchased 15,564,579 equity shares that are 9.4 per cent shares with
the help of its stock broker that is Axis Capital at prices varying from
967.05 to 980/share.
Open offer was made by the acquirer to acquire 51,325,371 equity
shares that is 31 per cent of the emerging voting capital.
`
` `
Table 1: Snapshot of the Deal

BEYOND'Do Not Mind That You Are Taken'
YOUTHINK l 2022 l Vol. XVI117
DATA ANALYSIS AND FINDINGS
Table 2: Equity Shareholding Pattern in Mindtree Ltd. Pre- and Post-Acquisition
Equity Shares Holding Pre-Acquisition Post-Acquisition
Promoters 21,877,717 21,877,717
Sellers (VG Siddhartha and
CDEL AND CDTL) 32,760,229 ------------
Public Shareholders 109,576,095 42,927,620
Acquirer -------------- 99,650,179
Figure 1: Graph Showing the Shareholding Pattern Pre- and Post-Acquisition
Standalone Profit and Loss Statement and Share Price Volatility in Mindtree Post-Acquisition:
Figure 2: Profit and Loss Statement of Mindtree Post-Acquisition(Source: Dion Global Solutions Limited)

'Do Not Mind That You Are Taken'BEYOND
YOUTHINK l 2022 l Vol. XVI 118
Post being acquired we can see:
1. There has been a constant increase in the earnings per share.
2. Book value of share is also increasing which is a very positive sign.
3. Net profit is also increasing.
4. Revenue is increasing on a year-to-year basis.
Figure 3: Graph Showing Five-Year Trend of Shares of Mindtree Limited
The share price of Mindtree initially slumped to 730 range post the takeover but after that the share prices gained momentum and bounced back to the 900-1,000 range and currently being traded at 2,225 range which means that the share prices has increased over 2 to 2.5 times since the acquisition. (Source: Moneycontrol)
`
`
`

BEYOND'Do Not Mind That You Are Taken'
YOUTHINK l 2022 l Vol. XVI119
Standalone Profit and Loss Statement and Share Price Volatility in the Larsen and Toubro Infotech Post-Acquisition:
Figure 4: Profit and Loss Statement of Larsen and Toubro Post-Acquisition(Source: Dion Global Solutions Limited)

'Do Not Mind That You Are Taken'BEYOND
YOUTHINK l 2022 l Vol. XVI 120
The share price increased over three times post-
acquiring Mindtree. In 2019, the LTI Shares were being
traded at 1,500 approximately. Currently, the shares
are being traded at 4,381.
Thus, we can see an increase in the share price post the
takeover of Mindtree. (Source: Moneycontrol)
`
`
DEFENCE MECHANISM AVAILABLE IN CASE OF A
HOSTILE TAKEOVER
1. White Knight: Where a hostile takeover appears
unavoidable, the target might seek out a friendly
investor to whom it can sell the company or some
substantial stake of the company and buy back from
them later in future.
2. Pac-Man Defence: It is a very bold move taken by
the target company to buy shares in the acquiring
company in order to gain control over them in
defence of the hostile takeover bid.
3. Poison Pills: It is a very smart way to deter hostile
takeover in which shareholders’ rights are specially
designed to combat hostile takeover. When the
acquirer acquires a large percentage of shares in the
t a r g e t c o m p a n y, t h e
sha reho lde r s become
entitled to new shares at a
huge discount which in turn
increases the share price in
the open market offer for the
bidder.
4. Shark Repellents: When the
target company makes
amendments to its legal
charter, which reinforces the
directors of the company to
remain in control of the
management, in case the
company is taken over, it is
known as shark repellents. It
is usually done to deter the
hostile takeover and is also
k n o w n a s p o r c u p i n e
provisions.
Defence Strategy Used by Mindtree: Buyback of
Shares
In accordance with – ‘Regulation 29(1) (b) and 29(2) of
SEBI (Listing Obligations and Disclosure Requirements)
Regulations, 2015’, Mindtree did provide a notice for
considering share buyback. However, the board
decided to drop the buyback plan since they realized
that it might not have the desired impact to defend and
combat the hostile takeover.
LAWS GOVERNING HOSTILE TAKEOVERS IN INDIA
1. The Companies Act of 2013: Section 261 of
Companies Act, 2013 deals with the takeover of
assets and administration of a weak company by a
bidding company only after it has been authorized
by National Company Law Tribunal.
Post-Acquiring Mindtree we can see that there has
been:
1. Constant increase in the earning per share.
2. Increase in the book value of Larsen and Toubro
Infotech shares is a very positive sign.
3. The net profit is increasing on a year-to-year basis.
4. Revenue is also increasing on a yearly basis.
Figure 5: Graph Showing Five-Year Trend of Shares of Larsen and Toubro Infotech Limited

BEYOND'Do Not Mind That You Are Taken'
YOUTHINK l 2022 l Vol. XVI121
2. The Competition Act of 2002: This act regulates
any unfair transactions which will have a bad
impact on the competition.
The above laws are applicable only when the criteria
mentioned below is met:
The ‘acquiring company’ and the ‘target company’
need to be listed on the Indian stock exchange. These
laws would not be applicable if both or either of them
are listed in some other foreign exchange.
THE EMPLOYEE’S STANCE
After getting the news of the takeover the employees
feared that there might be retrenchment and job loss
and thus, they obviously did not support the hostile
takeover and were in support of the promoters.
Although Mindtree was given a separate entity status
the employees thought that there might be differences
in the work culture and environment and thus, they
were against the takeover.
Analyzing the Aftermath: The information technology
industry in India is very lucrative and earned revenue of
$181 billion in March 2019 and it is expected to grow at
7 per cent to 8 per cent in the next few years. Out of the
total revenue, 80 per cent comes from exporting
information technology services and it amounts to $137
billion. The IT Industry is expected to reach $350 billion
by 2025.
There are various government policies to support the IT
sector industries:
‘National Policy on Software Products, 2019’ was
passed by the government of India with the aim to make
India a software producing hub. The government of
India announced the launch of ‘National Programme
on Artificial Intelligence’ and set up a ‘National Artificial
Intelligence Portal’ in the interim budget of 2019-2020.
The government of India included information
technology in the 12 Champion Services Sector for
which an action plan has been developed and 50
billion has been allocated for realizing the potential of
those champion service sectors.
`
For the development of India through the use of
artificial intelligence, the government of India think
tank has introduced the National Level Programme. As
per the data of Department for Promotion of Industry
and Internal Trade (DPIIT), Foreign Direct Investment
(FDI) in the IT sector was $37 billion cumulatively
between the years 2000-2019.
All these resulted in ease of doing business in the IT
Sector. This encouraged Larsen and Toubro Infotech to
expand through acquisition.
Post-Acquisition Challenges: Larsen and Toubro
Infotech work on the philosophy of traditional
hierarchical form of management and have a very
formal business environment. In contrast to LTI’s
business environment, Mindtree works on the
principles of modern, informal business culture.
Whereas Mindtree’s existing workforce and confidence
in key clients will be crucial for LTI to function smoothly.
This difference might hamper the integration of human
resources in the business environment.
Acquisitions are measured and evaluated based on
various factors like synergies, cost reduction,
innovation, new technology, market etc. It can fail due
to cultural differences. Top management of Mindtree
like Krishnakumar Natarajan, Mr. Parthasarathy, and
Mr. Rostow Ravanan resigned after the hostile bid. If LTI
fails to handle and integrate things rightly, then it could
impact the business in a negative way.
FINDINGS
1. This hostile takeover significantly helped both the
companies to boost their synergies, reduce cost,
and make new innovation and development in the
field of technology and artificial intelligence.
2. Mindtree’s presence in media and e-commerce
will be a new potential area of growth, expansion
and development for Larsen and Toubro Infotech.
3. LTI is spread over 33 countries and Mindtree
spreads over 17 countries worldwide which will
benefit both the companies by giving them
economies of scale.

'Do Not Mind That You Are Taken'BEYOND
YOUTHINK l 2022 l Vol. XVI 122
4. Mindtree provides service in customized IT
solutions to various industries across various sectors
such as banking, insurance, retail, consumer
technology, education, travel, et al. This will benefit
Larsen and Toubro to diversify their products and
services as well.
RECOMMENDATIONS
1. Due to the resignation of the key managerial
personnel of Mindtree, the employees might find it
difficult to work under the new superiors. So,
Larsen and Toubro Infotech must prudently assign
the supervisors from among Mindtree itself which
would give them incentive and confidence to carry
on their work, innovation and development in the
field of technology-based services smoothly.
2. Larsen and Toubro Infotech can improve
Mindtree’s performance by increasing cash flows in
the company and by reducing their costs.
3. Mindtree is running independently as a subsidiary
of Larsen and Toubro so they can use their synergies
together and build on creating new products and
services and import or acquire new technologies
worldwide.
4. They can consolidate and reduce the number of
physical offices worldwide and cut down on
expenditures spent on hiring manpower.
5. They can together exploit the IT sector across the
world by using economies of scale.
6. They can target the IT companies using red ocean
strategy and cut down on unnecessary
competitions.
CONCLUSION
Consortium between Mindtree and L&T is benefiting
both companies because they have different strengths
to contribute- L&T has solid manufacturing
infrastructure while Mindtree has the latest
technological advancements. Mindtree is to run as an
independent company, in line with its original
leadership’s vision. Thus, this is not hampering its
individuality. L&T and Mindtree are Indian
multinational companies, currently sharing synergy
which is giving them a competitive advantage,
diversification, cost reduction, economies of scale,
increasing scope and strategic and financial benefits.
Collaboration of IT resources and technology will
support India to become a software producing hub.
Considering the increasing momentum in the share
prices, book value of share, EPS, net profit and revenues
of both the companies, we can also conclude that retail
investors can also make a lot of profits in the long-term.
REFERENCES
1. Diva Rai (2020). Takeover Regulations in India. h t tp s : / / b log . ip l eade r s . i n / t akeove r - r egu l a t i on s -india/#Other_laws_governing_takeover_code_in_India
2. Tim Jenkinson (1994). Hostile Takeovers: Defence, Attack and Corporate Governance. McGraw-Hill.
3. Marc Goedhart, Tim Koller, and David Wessels (2017). The Six Types of Successful Acquisitions.
4. Nishith Desai and Associates (2020). L&T's Hostile Takeover of Mindtree.
5. Rima Tamosiuniene, Egle Duksaite (2009). The Importance of Mergers and Acquisition in Today's Economy.
6. Rita Ricardo-Campbell (1997). Resisting Hostile Takeovers: The Case of Gillette. Praeger Publishers Inc.

BEYOND
YOUTHINK l 2022 l Vol. XVI123
An Analytical Study of Investments: With an Emphasis on IPOsProf. Ruby Mary NottsAssistant ProfessorDepartment of Commerce (Evening)
Garima Khanna Department of Commerce (Evening)
One of the
biggest reasons
behind this
manifold increase
in the IPO size is
the euphoric
optimism among
the investors as
the world
recovers from the
COVID
pandemic.ABSTRACT
Initial Public Offering (hereafter IPO) is the process through which a
company, for the first time, rolls out its shares to the public for subscription.
Thus, when a private company, for the first time, releases its shares to the
public (individuals other than the promoters of the company), then it is called
an IPO. In recent years, there has been an exponential growth in the number
of IPOs offered by various companies and these numbers are bound to
increase.

An Analytical Study of Investments: With an Emphasis on IPOsBEYOND
YOUTHINK l 2022 l Vol. XVI 124
The current COVID-19 pandemic forced the world to
shut down and companies to postpone their IPOs as
market expectations across the globe became
pessimistic. However, the post-COVID era has
witnessed a stream of IPOs from companies like Burger
King, Gland Pharma, Indigo Paints, Zomato and Stove
Kraft Ltd. in India. Studies have shown that June 2020
has recorded the highest number of IPOs in the world in
15 years. So, why are so many companies suddenly
rolling out IPOs? Is there any correlation between
market corrections post-COVID and IPOs?
KEYWORDS: IPO, Public Issue, Book Building, Fixed
Price, Under-Pricing, IPO Market, IPO Bubble.
INTRODUCTION
What does it mean when a company opts for an IPO?
The first and the direct implication of an IPO is that the
shares of the company get listed on a recognized stock
exchange. A company may float new shares for
subscription, allowing fresh capital to be introduced.
On the other hand, the existing shareholders may sell
their stake in the company, which would then be
offered to the public. In both the cases, the percentage
holding of the existing shareholders comes down. For
example, if a company having 200 shares offers 100
shares to the public, the percentage holding of the
existing shareholders will come down from 100 per
cent to 50 per cent. On the other hand, the company
may also issue a sum total of 100 new equity shares. In
this case, the percentage shareholding will come down
to 67 per cent.
Usually an underwriter– generally an investment bank,
is hired for the whole process. The board of directors of
the company, along with the team representing the
bank, plan out the issuance process and comply with all
the regulations before rolling out the IPO. In India, the
Securities and Exchange Board of India (SEBI) is
entrusted with the responsibility of regulating and
monitoring the entire process of investment through an
IPO. Only when approved by SEBI, can a company go
forward with its plan of allotting shares and getting itself
listed.
Thus, the whole IPO process involves huge costs and
managerial efforts, which might be challenging for new
and loss-making companies. Thus, it is often perceived
that an IPO is an exercise only for well-established
profit-making companies. This was true until now. In
recent times, considering the IPO of Zomato and the
expected IPO of Paytm, the landscape of the Indian IPO
market is changing. As put forward by Amarjeet Singh,
the Executive Director of SEBI, ‘entities with
unconventional business model listing bodes well for
the start-up ecosystem’.
LITERATURE REVIEW
Haldea (2011), the Chairman and Managing Director
(CMD) of Prime Database, concluded that ‘IPOs are
increasingly becoming a tool used for trading and short-
term gains rather than investment for long-term
horizon. These investors opt for making fast money at
the time of issue and not for holding the stock for a long-
term period as assumed while valuing the company’.
Studying the change in the performance of firms during
and after an IPO, Jain and Kini (1994) mentioned that a
significant decline in operating performance is noticed
subsequent to an IPO. They concluded that there exists
a positive correlation between the operating
performance of a company post-IPO and the extent of
equity retention by the promoters of the company;
whereas, according to their study, there was no
correlation between the operating performance of the
company and initial under-pricing of the IPO. Ranjan
and Madhusoodanan (2004) concluded that IPOs in
India have always yielded returns abnormally in the
short run. This may be due to the fact that IPOs have
been mispriced during the issue process. They also
found a negative correlation between the mispricing of
IPOs and the issue size. This means that small
companies are more prone to mispricing and the extent
of pricing errors can be huge in them.
RESEARCH OBJECTIVES
1. To analyze the pricing strategy in IPOs.
2. To study the trends of IPOs in Indian markets pre-
and post-COVID-19.

BEYONDAn Analytical Study of Investments: With an Emphasis on IPOs
YOUTHINK l 2022 l Vol. XVI125
RESEARCH METHODOLOGY
Research Type: Descriptive and Analytical research
method has been used for this project.
Data Collection: The project is mostly based on
secondary data which has been collected from various
websites and publications. The data sample for this
research consists of all the companies that have got
listed in India via NSE, BSE, NSE Emerge and BSE SME
Exchanges. Thus, the data of 726 companies going
public from the year 2012 to 2020 was collected and
analyzed. Information regarding the number of IPO
issues each year, the type of issue and its listing platform,
the pricing method used for each issue, the total
amount raised by each IPO, the listing day gain/loss for
each listing company and the information of successful
and unsuccessful issues was collected from various
sources, which have been duly acknowledged. The
date range of 2012 to 2020 was selected because SME
companies began listing and trading in India from the
year 2012.
Research Tools and Methods: To analyze the pricing
strategy, IPOs have been classified, firstly on the basis of
the type of company and then, on the basis of the
pricing method used by them. This was presented and
analyzed with the help of tables and charts.
To study the trends of IPOs in Indian markets, the IPO
volume of each year has been compared with respect to
their issue size and listing day gains. For interpretation,
presentation and analysis, descriptive statistics, trend
lines, graphs and charts were drawn up.
THEORETICAL FRAMEWORK
Based on the type of company, their IPO is classified as:
1. Mainline IPO: These are the IPOs of companies
other than Small and Medium Enterprises (SME). A
company whose capital, after an IPO, is at least
`100 million, is classified as a Mainline IPO.
Moreover, these companies raise their capital by
getting listed on the NSE-BSE exchanges.
2. SME IPO: As the name suggests, SME IPO is the IPO
of Small and Medium Enterprises, that is, companies
whose capital, after an IPO, may range between a
minimum of `10 million and a maximum of `25
million. These IPOs are not traded on the NSE-BSE
exchange platforms; however, both NSE and BSE
allow the trading of these IPOs through their SME
exchange platform. These separate platforms for the
trading of SME IPOs are ‘NSE Emerge’ and ‘BSE
SME’.
This brings us to the question of how a company
determines the pricing of its issue. Generally, any one of
the following methods is taken up to arrive at the price.
1. Fixed Pricing: Earlier, IPOs used to be issued at a
fixed price; i.e., the issuer, the company and the
merchant bank used to agree upon a price. The
investors were only allowed to bid on that
particular price and had no other option available
at the time of bidding. Fixed price issue is generally
not considered suitable as:
a. Dubious issues get overpriced and
b. Genuine issues get under-priced
2. Book Building: As per the guidelines of SEBI, the
term `book building' is defined as ‘a process
undertaken by which a demand for the securities
proposed to be issued by a body corporate is
elicited and built-up and the price for such
securities is assessed for determination of the
quantum of such securities to be issued by means of
a notice, circular, advertisement, document or
information memoranda or offer document’.
In other words, book building is a mechanism where
bids are collected from the interested investors, within a
given price band and for a specific duration of time. The
investors are given an option to bid for the same at
various price ranges that are equal to or greater than the
floor price of the share. The final bids are evaluated on
the basis of the evaluation criteria after the bids are
closed.
ANALYSIS AND FINDINGS
Keeping in mind the objectives, different samples have
been chosen for each objective to facilitate better
analysis and understanding.

An Analytical Study of Investments: With an Emphasis on IPOsBEYOND
YOUTHINK l 2022 l Vol. XVI 126
Objective 1: To Understand the Pricing Strategy of an
IPO
Data Sample
?Total number of IPOs studied: 726
?Number of Mainline IPOs: 168
?Number of SME IPOs: 558
?Time period (years) considered in the study: 2012 to
2020
?The data of the method of pricing, that is, whether
these IPOs followed book building or fixed price
method, for these 726 IPOs was collected.
YEARSME IPOs MAINSTREAM IPOs
FP * BB ** FP BB
2012 12 2 0 13
2013 33 1 0 5
2014 38 2 0 7
2015 43 0 0 21
2016 62 5 0 27
2017 116 19 1 37
2018 117 27 0 25
2019 45 9 0 16
2020 27 0 0 16
TOTAL 493 65 1 167
Per cent 88.35 per cent 11.65 percent 0.60 per cent 99.40 per cent
Table 1: Total Number of IPOs Issued from 2012 to 2020
(Source: www.chittorgarh.com)
ANALYSIS
*FP = Fixed Price Method of Issue Pricing
**BB = Book Building Method of Issue Pricing
Figure 1: Total Number of IPOs Issued from 2012 to 2020
(Source: www.chittorgarh.com)
FINDINGS
In the SME IPO segment, Fixed Price issue is more
common, which is evident from the fact that 88.35 per
cent of the SME issues are using the Fixed Price method.
Book Building method is prevalent but not as common
as the Fixed Price method of issue for SME Companies.
In the Mainline IPO segment, only the Book Building
method of pricing is present and dominant because,
over the period of 2012 to 2020, only one company
(out of 168) opted for using the Fixed Price method of
pricing.
Objective 2: To Study the Trends of IPOs in Indian
Market Pre- and Post- COVID-19
Data Sample
?Mainline IPO issues over the preceding ten years
(2012 to 2020).
?Data Collected: Number of IPO issues during a year,
the total amount raised through the IPO, the listing
day gain/loss suffered by the IPO, successful IPOs of
the year and failed IPOs of the year (i.e., IPOs that
were drawn out and never got listed).

BEYONDAn Analytical Study of Investments: With an Emphasis on IPOs
YOUTHINK l 2022 l Vol. XVI127
ANALYSIS
YearNo. of
IPOs
Amount
Raised
Issue
Succeeded
Issue
Failed
Average Listing Day
Gain Per cent
2012 13 68,341.70 11 2 4.23 per cent
2013 5 12,839.50 3 2 2.21 per cent
2014 7 12,009.40 5 2 26.08 per cent
2015 21 135,131.70 21 0 10.00 per cent
2016 27 265,008.20 26 1 13.30 per cent
2017 38 752,785.70 38 0 22.25 per cent
2018 25 317,312.80 24 1 7.53 per cent
2019 16 126,873.20 16 0 19.59 per cent
2020 16 266,280.60 15 1 43.82 per cent
Table 2: Summary Table of IPOs Issued from 2012 to 2020
(Source: www.chittorgarh.com)
Figure 2: Total Number of IPO Issued between 2012 and 2020
(Source: www.chittorgarh.com)
Figure 3: Total Amount Raised by Companies
(Source: www.chittorgarh.com)
Figure 4: Average Listing Day Gain Percent from 2012 to 2020
(Source: www.chittorgarh.com)

An Analytical Study of Investments: With an Emphasis on IPOsBEYOND
YOUTHINK l 2022 l Vol. XVI 128
Table 3 indicates the descriptive statistics drawn up on
the basis of the amount raised by each company
through an IPO during a given year.
Figure 5: Representation of the Mean Issue Size and the
Number of IPOs on a Year-on-Year Basis
(Source: www.chittorgarh.com)
FINDINGS
It is seen that over the years, there has been a rise in the
number of IPOs offered.
2020 has seen a tremendous increase in the average
percentage of listing day gains.
The year 2020, when compared with other years (pre-
COVID years), shows a peculiar trend as it has one of
the highest mean issue sizes with a comparatively lower
number of IPOs.
Figure 5 points to the
statistic that over the
years, companies have
been able to acquire
better prices for their
share capital as the
mean issue size has
b e e n i n c r e a s i n g ,
especially after the
COVID era. There is a
manifold increase in the
amount raised via these
IPOs.
CONCLUSION
From the above findings, it is
evident that both the methods of
issue pricing are popular among
companies. However, it is noticed
that SME IPOs prefer Fixed Price
issue whereas Mainline IPOs prefer
Book Building issue. An investment
in an SME IPO is riskier than one in
a regular IPO. Hence, SME
companies prefer Fixed Price issue
over Book Building as the fixed
price set by the company is
generally lower than the market
price of the equity instrument,
which results in under-pricing and thus, higher listing
day gains. This makes the investment attractive to the
investors. Mainline IPOs of big companies generally opt
for Book Building as it helps them get better prices for
their shares, considering that high bids are placed due
to the goodwill of the company.
Over the years, IPO markets have developed
considerably. Companies can now, through an IPO,
DESCRIPTIVE STATISTICS FOR ISSUE SIZE
(Excluding the IPOs which were withdrawn)
(`in millions)
Year MeanNumber of IPOs
consideredMedian Minimum Maximum Sum
2012 6,212.90 11 1,834.90 250.00 41,558.00 68,341.70
2013 4,279.80 3 2,703.90 944.20 9,191.40 12,839.50
2014 2,401.90 5 1,974.00 1,200.00 3,518.60 12,009.40
2015 6,434.80 21 4,916.60 661.10 30,182.40 135,131.80
2016 10,192.60 26 6,518.10 700.00 60,567.90 265,008.30
2017 19,810.20 38 7,526.30 358.70 111,758.40 752,785.80
2018 13,221.40 24 9,490.20 774.00 44,730.20 317,312.80
2019 7,929.60 16 4,907.90 230.00 31,451.60 126,873.20
2020 17,752.00 15 6,000.00 612.00 103,547.70 266,280.70
Table 3: Descriptive Statistics on the Basis of Issue Size
(Source: www.chittorgarh.com)

BEYONDAn Analytical Study of Investments: With an Emphasis on IPOs
YOUTHINK l 2022 l Vol. XVI129
raise more money and can get much better and fair
prices as compared to ten years ago. However, what has
caught the attention of many is the post-COVID ‘boom’
in the IPO market, where many big companies and
start-ups have already got listed or are in the process of
getting listed. One of the biggest reasons behind this
manifold increase in the IPO size is the euphoric
optimism among the investors as the world recovers
from the COVID pandemic. The inflow of liquidity in
the economy, in the form of government-induced
financial assistance, is finding its way back into the
economy via stock markets. Also, due to increased
awareness and liquidity, a lot of new investors have
started investing, especially in IPOs as these are
perceived as a source of gaining quick returns. IPOs
have been earning listing day gains of up to 100 per
cent, resulting in Price-Earnings Ratios that are
unsustainable. Thus, there is a need to be cautious as
experts around the world believe that Indian markets
are experiencing an ‘IPO Bubble.’ Many have even
started comparing the current market situation to the
‘Dotcom Bubble’ of the 2000s.
REFERENCES
Articles
1. Jain, B. A., and Kini, O. (1994). The Post Issue Operating
Performance of IPO Firms. Journal of Finance, 49, 1699-
1726.
2. Prithvi Haldea, (2011). ‘IPOs: More Misses Than Hits.’ Dalal
Street Investment Journal, Vol. 26.No. 9, Page 67.
3. Ranjan, N. and Madhusoodanan, T.P. (2004). ‘IPO under-
pricing, issue mechanism and size.’ Social Science Research
Network E-Library, SSRN ID 520744.
Websites
1. https://www.bloombergquint.com/ipos/how-indian-ipos-
fared-in-2020
2. https://www.businesstoday.in/markets/ipo-corner/market-
b o o m - 1 0 0 - j u m p - i n - n u m b e r - o f - i p o s - i n - q 4 -
2020/story/429176.html
3. https://www.chittorgarh.com/ipo/ipo_reports.asp
4. https://www.chittorgarh.com/faq/difference_between_
mainline_ipo_sme_ipo/184/
5. https://m.economictimes.com/markets/stocks/news/india-
sees-19-ipos-worth-1-84-billion-in-2020-december-
quarter/articleshow/80434486.cms
6. https://journals.sagepub.com/doi/abs/10.1177/22786
8211200100107?journalCode=brja
7. https://www.researchgate.net/publication/266396491_
Initial_Public_Offers_In_India_Trend_And_Market_Develo
pments
8. http://www.smelisting.net/modes_of_listing.php
9. https://upstox.com/learning-center/ipo/types-of-ipos/
10. https://techcrunch.com/2020/11/21/how-the-pandemic-
drove-the-ipo-wave-we-see-today/
11. https://yourstory.com/2021/07/profit-loss-making-ipo-sebi-
officials/amp

BEYOND
YOUTHINK l 2022 l Vol. XVI 130
Paradox of Indian Financial MechanismRev. Fr. Joseph Kulandai, SJVice PrincipalDepartment of Commerce (Morning)
Suraj Dhanawat Department of Commerce (Morning)
The Indian
economy has
always been a
paradox, shifting
from a socialistic
approach to
privatization. ABSTRACT
The Indian economy has always been a paradox. It is shifting from its
socialistic approach where the entire reigns of running, competing, and
regulating the economy were in the hands of the government, to the
‘Minimum Government and Maximum Governance’ approach that focuses
on privatization. Financial markets in India are experiencing a huge boom
with tremendous foreign capital inflows; on the contrary, there is a low
financial literacy rate, adverse government policies, loss of confidence in
banks, and increasing Non-Performing Assets (NPAs). Digital transactions and
financial instruments are being encouraged, contrary to India being top on
the list of ransomware attacks. Multinational Corporations (MNCs) have

BEYONDParadox of Indian Financial Mechanism
YOUTHINK l 2022 l Vol. XVI131
become such huge players in the Indian market that
they often end up regulating the fintech space, where
they actually compete. India needs a proper balance
between its public sector and private sector banks as
there is an ever-expanding economic divide, which is
quite evident from the ‘K-shaped’ recovery of the
Indian economy post lockdowns.
KEYWORDS: Financial Literacy, Economy, Banking,
Privatization, Governance.
INTRODUCTION
The Indian economy has always been a paradox,
shifting from a socialistic approach to privatization. The
Indian tertiary sector is booming, experiencing the
largest expansion among all the sectors and
contributing the most towards the growth of the Gross
Domestic Product (GDP), yet the least towards
employment.
The Indian financial sector has undergone a huge
change in the past few decades. Earlier, the backbone of
our economy was the government; with the
government running, competing, as well as regulating
the economy. The government’s new campaign
‘Minimum Government and Maximum Governance’
focuses on the government utilizing its machinery and
resources more towards governance, rather than in
competing with the private sector, yet, India has one of
the highest numbers of scamsters and fraudsters.
The banking sector in India holds more than 60 per cent
of the total financial assets of the country. At present,
India is, without any doubt, one of the world’s most
vibrant capital markets, yet its financial institutions and
watchdogs continue to fail their investors, time and
again, sometimes making them helpless; unable to
utilize their own money. Financial markets in India are
experiencing a huge boom with tremendous foreign
capital inflow, but our own financial literacy remains a
concern; with only a fraction of the population
investing, or even having knowledge about the options
available. With globalization, the multinational
companies have grown so significantly that they
sometimes have the power to control/regulate, leave
alone influence their competitors.
RESEARCH METHODOLOGY
This is an exploratory and descriptive research paper.
The main purpose of the project is to explore, describe,
explain, and validate the findings. This also involves
obtaining qualitative as well as quantitative data. Data
that is obtained is interpreted with the help of various
tools such as three-dimensional models, bar graphs,
and histograms.
Sampling Technique
A Convenience Sampling Method was adopted to draw
the sample respondents for the research. Convenience
sampling is a non-probability sampling technique,
where subjects are selected because of their
accessibility and proximity to the researcher.
Sample Size
Around 90 responses were received through the
questionnaire that was floated among the masses.
Source of Data Collection
Primary data was obtained by floating a survey. Primary
data is the first-hand information that is gathered for a
specific research purpose. A questionnaire was
designed and floated with various questions to
understand people’s perspectives.
Secondary data, on the other hand, was obtained
through existing literature and research conducted by
different authors. Using such secondary data is
beneficial as sometimes primary data, on its own, gives
insufficient results for the research.
Method of Analysis
The data gathered was analyzed using descriptive
statistics. Wherever necessary, variables in a question
have been presented as a percentage of total responses
using charts and graphs, and conclusions have been
drawn from them.
LITERATURE REVIEW
This consists of various literature, reviews, and research
conducted earlier, which relate to various aspects and
realities of the Indian economy in general and the
financial sector in particular. These reviews have been

Paradox of Indian Financial MechanismBEYOND
YOUTHINK l 2022 l Vol. XVI 132
done to have an idea about the related aspects of the
research project. An analysis has been done to
understand the viewpoints of the authors and their
respective objectives; the subsequent findings have
been duly noted.
Figure 1
Source: Author's Compilation

BEYONDParadox of Indian Financial Mechanism
YOUTHINK l 2022 l Vol. XVI133
OBJECTIVES
At present, India is, without any doubt, one of the
world’s most vibrant capital markets with the banking
sector alone having more than 60 per cent of its
financial assets. The objectives to undertake the project
are as follows:
?To find out how, despite stringent rules, norms, and
guidelines laid down by financial sector watchdogs
to regulate it, some people have developed ways to
circumvent it and expose the loopholes surrounding
it.
?To evaluate how badly it affects a person’s
confidence in the financial sector when every year
at least one bank is put under moratorium or
merged with a nationalized bank, thereby
suffocating the depositors who deposit their savings
in the bank but also the investors who have invested
in it.
?To check whether the push by the government
towards digitization is being accompanied by
providing adequate infrastructure to the public,
thereby allowing them to use it.
?To test the sustainability of the model where the
government is trying to regulate and limit cash
transactions in businesses, and encourage digital
transactions and financial instruments despite the
fact that India ranks amongst the top in ransomware
attacks.
?To find out whether the new entrants in the stock
markets are actually trading and learning or merely
speculating.
?Financial literacy in our country is yet to be
developed but the rules around it demands
complete compliance.
PRIMARY DATA ANALYSIS
This survey was conducted in a population of financially
literate and educated people using convenience
sampling. Most of the people participating in this survey
are in the age group 18- 25 years, but we have opinions
of people belonging to other age groups as well.
Only 24 per cent of the total population of the country
is financially literate, which is lowest among all the
developing nations. This impacts the health of our
financial sector and makes it vulnerable to high foreign
influence. According to the survey, a sweeping majority
of people believe that providing financial literacy at the
very basic level would help move our economy
forward, and would provide a holistic growth rather
than a superfluous one. On the other hand, a lot of
people believe that we need better laws to replace the
outdated ones and ensure their proper execution along
with financial literacy to move forward. There are a lot
of other opinions as well that could address the root
cause of all the problems.
Figure 2
(Source: Primary Data)

Paradox of Indian Financial MechanismBEYOND
YOUTHINK l 2022 l Vol. XVI 134
People Investment Preference
Financially literate people were given various
investment options to determine their most preferred
option, and determine where they actually invest their
money. Two out of every three people consider keeping
money in the bank account as the best and the safest
investment option. Out of all the options available, only
around 50 per cent of the people are willing to invest in
stock markets over and above investing their money in
banks.
Knowledge Required for Investment
Figure 4 shows various sources through which people
acquired the knowledge necessary for their investing.
Surprisingly, despite a population of highly educated
units, only 50 per cent of the population acquired the
knowledge necessary for investment through formal
learning. It is also noted that some of the people who
had chosen stock markets as their preferred investment
option only speculate. Others have learned through
experience and have adapted themselves through hit
and trial, analysis and research.
Figure 3
(Source: Primary Data)
Figure 4
(Source: Primary Data)

BEYONDParadox of Indian Financial Mechanism
YOUTHINK l 2022 l Vol. XVI135
Most of the people believe that there’s an increasing
concentration of power following capitalism. The
Indian financial sector, in particular, following
globalization, is so dependent on foreign funds that any
movement in it causes chaos in the Indian markets. It is
also believed that few big players in the Indian market
have quite control over the prices of certain stocks.
People tend to follow them and ultimately lose in the
bigger game. This is quite evident from the K-shaped
recovery of the Indian stock markets and the outright
disconnect of the Indian Stock Market with the
economy.
?The age group which opted for ‘No’ is generally
30+.
?The people that have opted for ‘Yes’ are generally
engaged in profession.
?The rest of the people are between the age group of
18-30.
Cash is the bloodline of many industrial sectors such as
the FMCG sector, where 90 per cent of the retail
transactions are undertaken in cash. The government’s
policies to limit cash transactions push the businessman
to either not disclose a part of their business or face
heavy penalties. Digitalization is the way forward, but
not at a time where the economy is not developed
enough to sustain it. There are regular conflicts with
banks regarding illegally
debiting charges to a
b u s i n e s s a c c o u n t .
Furthermore, recent
cyber-attacks on their
servers have, many-a-
time, rendered these
banks use le s s and
businessmen helpless;
these are very disruptive
for trade as the scope of
most cash transactions is
limited. The increased
risk of cyber-attacks
The Reality of Indian Stock Markets
1- Strongly Disagree 5- Strongly Agree
Figure 5
(Source: Primary Data)
Governmental Actions Affecting the Health of
Our Financial Sector and Our Business Finance
Figure 6
(Source: Primary Data)

Paradox of Indian Financial MechanismBEYOND
YOUTHINK l 2022 l Vol. XVI 136
could expose all business secrets to such hackers, which
could be disastrous for any business.
The Role of Public Sector Banks
Public Sector Banks (PSBs) play a vital role in our
economy. There are a number of social security
schemes, poverty alleviation programmes, and other
benefits that the government wants to pass on to the
people who are living below the poverty line or are
situated in backward areas. In this respect, the
contribution of public sector banks is substantial and
monumental, which if given to the private sector would
fail.
A country needs to decide on a proper balance
between its public sector and private sector. India is at a
stage where there’s an economic divide; public sector
banks are very crucial in bridging this gap, providing
social development, and economic growth. In spite of
this, the government is continuously moving towards
privatization and disinvestment, contrary to what the
situation demands.
Politicization of Financial Policies
Indian Politicians have used, and are continuously
using, financial policies as a part of their political
manifesto with utter disregard towards their impact on
the financial health of our country. One such example is
the farm loan waiver schemes, where political parties
promise to waive off farm loans on coming to power,
further adding to the already stressed banking sector in
general and the public sector banks in particular.
1- Strongly Agree 5 – Strongly Disagree
Figure 7
(Source: Primary Data)
Figure 8
Figure 9

BEYONDParadox of Indian Financial Mechanism
YOUTHINK l 2022 l Vol. XVI137
Declining Public Confidence in Banks
With the recent increase in the number of bank frauds,
moratoriums, and mergers, the regulatory authorities
are being questioned on their inefficiency to act and
having a reactive approach rather than a proactive one.
ANALYSIS AND FINDINGS
There are certain points about the Indian economy as
well as the financial sector which are observed and are
stated as below:
?India is one of the fastest and the most lucrative
investment destinations, yet, its financial literacy is
the lowest among all other developing nations, and
its viable investment options remain limited or less
attractive.
?India has one of the highest savings to income ratios
of households in the world (with one of the highest
propensity to save ratio). However, most of its
savings never finds its way into the circular flow of
income.
?There are a variety of investment options available,
but most of them are not lucrative enough, lack
active participation, and thereby, awareness or
knowledge; people lack the confidence to invest in
such instruments.
?Some government policies have been criticized for
doing more harm than good, examples being deficit
financing and crowding-out effect. In the former,
the government focuses on increasing the
purchasing power of the people, leaving the supply
side unattended, which again leads to inflationary
conditions. In the latter, the government provides
freebies, which are mostly a part of their political
agenda; these goods, mostly, have a crowding-out
effect whereby the private investment is replaced by
government investment. This will not only reduce
the prospects of economic growth, but also push the
interest rates up, and the private investments being
sensitive to interest rates would react accordingly.
Financial Policies: A Political Weapon
Political parties are increasingly using financial policies,
in their poll manifestos and promises, in order to lure
the public, with utter disregard to what could be its
financial impact on the health of the economy,
especially the public sector banks.
One such thing is the promise of farm loan waiver.
Banks in India are already exposed to agricultural loans
and are stressed with rising Non-Performing Assets
(NPAs), yet sometimes, the political parties promise to
completely write off the loans. This exerts a huge
burden on these banks; the government has to keep on
infusing capital into such banks in order to keep them
afloat. This all is done with the help of taxpayer’s
money. Deadweight loss of these kinds of financial
decisions is huge; it not only reduces the prospective
investment expenditure but also reduces the welfare of
the public at large. In fact, honest taxpayers and the
rising middle class are particularly dissatisfied with such
decisions, which, to them, are discriminating. These
decisions not only discourage the honest taxpayer but
also utilize their funds to finance either the wealthy or
the poor.
Many states like Maharashtra, Karnataka, Madhya
Pradesh, Uttar Pradesh, et al. have gone for such farm
loan waivers. If such things continue, then farmers
would be the ones ultimately losing, as it would be
difficult to obtain farm loans. However, the direct brunt
of these waiver schemes would be the public sector
banks. There is an increased exposure to Kisan Credit
Cards, which are supposed to be used for farm
equipment but are rather being used for consumption
purposes. Such accounts can be kept standard by
making small repayments, but with time these advances
are getting accumulated, increasing the risk and
exposure. As experts have suggested, we seriously need
to reconsider such types of schemes.
Figure 10: Consumer Confidence in Banks
(Source: The Financial Brand)

Paradox of Indian Financial MechanismBEYOND
YOUTHINK l 2022 l Vol. XVI 138
Stock Markets: A Deep Hollow
India is a country with a population of more than a
billion people, but only a fraction of the population
invests its money. Out of the
7,800 scripts that are listed on
d i f f e r e n t n a t i o n a l s t o c k
exchanges, only 3,000 of them
are actively traded. According to
the data by Securities and
Exchange Board of India (SEBI),
10 cities contributed over 80 per
cent of the entire trading volume
of the exchanges. These figures
s h o w h o w h o l l o w o r
concentrated is the overall
investment in our economy.
Developing economies like India
need financial resources and
capital wealth to fuel the needs of
the companies.
The coronav i rus induced
lockdowns saw a sea change in retail participation in the
stock markets. People, who earlier neglected or lacked
funds for such investments, saw this as a scope to mint
money, at a time when they were sitting idle in their
homes. Such growth in participation in the markets was
superfluous, as most of the trader’s lacked knowledge,
some lacked experience, and others simply
wanted to speculate.
This led to the coining of the term ‘Robinhood
Traders’. These are traders usually focused on
overvalued companies or poor-quality
companies for trading. Initially, they were
rewarded handsomely, but later they started
suffering losses in the Indian context, and as the
data suggests, they started withdrawing their
funds from the market.
It is believed that the Indian economy is
headed to a K-shaped recovery post COVID-
19, with the rich getting richer and the poor
getting poorer.
Banking System: Conflict of Confidence
The Indian banking sector, which holds around
60 per cent of the country’s financial assets, is
suffering from a crisis of confidence. Banking
scams that have taken place and the
subsequent moratorium that followed in cases
such as Punjab National Bank have pained depositors,
and questions have been raised on the effectiveness of
banks. However, all these banks were backed by the
government in times of uncertainty and, therefore, the
safety of investment was assured. Now, with the recent
scams of quid pro quo in Industrial Credit and
Investment Corporation of India bank, and the Yes Bank
debacle, people are afraid that they would not only not
Figure 11: State-Wise Quantum of Farm Loans Waived
(Sources: Reserve Bank of India; CMO Rajasthan; Bloomberg Quint; NDTV)
Figure 12: Net Inflows in Equity Mutual Fund
(Source: Amfi)

BEYONDParadox of Indian Financial Mechanism
YOUTHINK l 2022 l Vol. XVI139
be able to withdraw their own funds but might
ultimately even lose their investment/wealth, which is
their hard-earned money.
?People want better services that are only provided
by the private banks, yet they run towards public
sector banks in the moment of crisis.
?These public sector banks, with their motive being
social development, have agriculture as their
priority sector, and this is the sector which has the
highest share of NPAs.
?An appropriate balance is needed between the
public sector banks and that of the private sector.
Increasing evidence suggests that the public sector
has been able to deliver the results of social
development relative to the private sector; the
government is continuing its policy of privatization
and increasing the limits of foreign funding.
Fintech: Who Regulates Whom?
The Indian fintech sector is bubbling with new start-ups,
foreign entries, and even foreign collaborations. Digital
payments have grown substantially owing to the
government restrictions on cash in business transactions
and incentives/benefits to consumers. Due to this being
a new platform and a space not completely explored,
the market leaders are able to exert monopoly powers.
?Some companies have grown so huge that they not
only compete but even regulate such sectors, having
their own rules and regulations. Every other
company has to follow two sets of guidelines, one
made by Reserve Bank of India (RBI) and the other
by such MNCs. One such case was that of Paytm’s,
when the app was removed from the Play Store
because it was allegedly violating Google’s policies.
An Indian fintech giant, which houses millions or
even billions of Indian Rupees and a host of
depositors, was removed instantly from access by a
company that’s not even Indian, without prior
approval from RBI.
?Cryptocurrency is still not very popular in India, yet
India has invested a handsome amount in it. The first
thing the government tried to do is to completely
ban it, repeating the mistakes from the time of
License Raj. At a time when companies have started
accepting such cryptocurrencies, the Indian
government’s move would just push India backward
in terms of global competition. This would
ultimately lead to black marketing.
?A huge amount of data is generated from such a
platform, which requires being stored safely.
However, in the past few years, there have been
numerous ransomware attacks on such companies.
It is believed that the hackers have the data of more
than 10 million people up for sale on the dark web.
Ransomware attacks are also dangerous as
companies have to pay to access their own data.
Privacy is a myth in such sectors.
CONCLUSION
The loss of confidence of people in the organized
Indian financial sector has been the reason for the
development of the Indian unorganized financial
sector. We see a parallel unorganized financial sector
growing, not only in rural India but also in urban India.
People are unaware of the investment options that are
available, or they lack the necessary knowledge
required to invest in them. Indian household savings
rarely become a part of the circular flow of income and
are often termed as leakages.
Government policies have been a disaster for small
businesses. At a time when the entire bloodline of the
economy was cash, the government moved forward
with demonetization leaving hundreds of traders with
piles of cash. Some Industries, especially the Fast-
Moving Consumer Goods (FMCG) sector, runs only on
cash. Governmental restrictions limiting cash
transactions are the reason people keep a part of the
business that’s off their books or undisclosed. This has
created a shadow economy. Most of the businesses
transacting through banks have often faced the brunt of
their policies, starting from illegal debt freeze to
unnecessary charges being debited to their account in
the name of policy change. One such case is SBI
deducting substantial charges from zero balance
accounts or debiting accounts for every transaction.
The government is formulating laws to limit cash
transactions but, at the same time, is unable to provide
adequate infrastructure to ensure data integrity and
privacy. The fintech industry is a space that is yet to be
explored to its full potential. Hence, the government
should ensure that no single organization tries to

Paradox of Indian Financial MechanismBEYOND
YOUTHINK l 2022 l Vol. XVI 140
subdue their competition or starts regulating that sector
on their own.
Loan waivers don't just impact the finances of state-run
banks; they have a prolonged effect on the credit
culture of borrowers. This was evident during the 2010
microfinance crisis when politicians exhorted people
not to repay loans. Once a loan waiver is promised,
even honest borrowers typically stop repayments of
loans adding to the woes of banks. This starts a vicious
cycle that harms the credit culture across the country.
Financial literacy is the basic step required in India to
educate people about various investment options, and
retain their confidence in the Indian financial sector.
Indian stock markets, at this point, are highly vulnerable
to influence, be it from the big Indian players or foreign
capital inflow, which is running at an all-time high this
year.
RECOMMENDATIONS
Imparting financial literacy at the very basic level is the
first step towards improving the quality of investors. This
should not be limited to some people pursuing a career
in it but should begin at the basic level of schooling.
Financially aware people will be better able to manage
and handle their cash and the money which is usually
kept as savings; these savings would ultimately find a
way back into the flow of income, thereby having a
multiplier effect on income and expenses.
The Election Commission of India should prohibit
political parties from making any promises which could
enhance the fiscal deficit of India or could stress the
already distressed financial sector. All such decisions or
promises should be made only after a thorough
discussion with the RBI. The government should stop
the privatization of all of its undertakings because there
needs to be a balance in the economy. The Indian
economy is not at the stage whereby private sector
banks would be able to execute all government
schemes for the backward areas because of their profit
motive. This crisis of confidence of the public in the
Indian banking sector provides a good opportunity to
unleash reforms, and the government must refrain from
temporary fixes like throwing more money at lenders.
Such solutions only amount to kicking the can down the
road. The government of India should take a cue from
the United States of America, which has a separate
regulatory authority to check the behaviour of these
financial entities in the country.
PSBs have adopted liberal and loose credit policy, and
have loans concentrated among certain borrowers and
specific sectors, i.e., huge credit exposures to a few
large corporate borrowers and to a few sectors such as
infrastructures, powers, steels, mining, and telecoms.
The government should introduce f lexible
compensation packages and incentives for the top and
senior management of PSBs. This will improve the
profitability of the PSBs and curtail the NPAs. The RBI’s
regulations must be ownership neutral. All banking
regulatory powers of the RBI and its approaches in
regulatory policies should be neutral to bank
ownership.
REFERENCES
The report has been prepared with the help of works, articles and
research of various bloggers, economists, industrialists, and news
outlets.
Some of them are as follows:
1. An article was published by Forbes India (https://www.
forbesindia.com/news/business/companies/banks -staring-at-
fresh-npa- whammy-on-farm-loan-waivers-faulty-kisan-
credit-card-model-4792651.html) on the rising NPAs due
farm loan waivers and Kisan Credit Card Models.
2. Online publication by IANS in the Financial Express
(https://www.financialexpress.com/industry/banking-
finance/crisis-of-confidence-in- banking-system-provides-
an-opportunity-to-unleash-reforms/1214719/) was
published to address the crisis of confidence in the Public
Sector banks.
3. An article published by the Reserve Bank of India
(https://www.scirp.org/reference/referencespapers.aspx?refe
renceid=2444944) of the trend and progress in Banking.
4. An article by Tehelka Bureu on the topic Paradox called
Indian Economy (http://tehelka.com/paradox-called-indian-
economy/) is published by their team.

BEYOND
YOUTHINK l 2022 l Vol. XVI141
The Progression and Integration of Genome Sequencing in IndiaProf. Arpita DeyAssistant ProfessorDepartment of Commerce (Evening)
Ishika GuptaDepartment of Commerce (Evening)
Genome mapping
stands as a less
explored arena
that has high
potential to be
exploited as more
than just a
biological topic.
ABSTRACT
Genome Sequencing was primarily a research tool to study the origin of
viruses, diseases, and antibodies. Lately, 2014 onwards, it has been used as a
medicinal revolution. It has personalized medicine and the understanding of
it. Genome sequencing can possibly build the capacity to act preemptively
preceding infection improvement or initiate treatment for a sickness that has
not yet been diagnosed. It also has the potential to become a vital instrument

The Progression and Integration of Genome Sequencing in IndiaBEYOND
YOUTHINK l 2022 l Vol. XVI 142
for identifying, concentrating, and predicting diseases
in our food particles. Some of the developed countries
like the United States of America (USA), the United
Kingdom (UK), et al., have also incorporated it into their
food safety campaigns in order to detect food-borne
diseases and to prevent and control the same.
In India, genomic information holds the extraordinary
potential to improve medical care procedures across
different dimensions, such as detecting diseases,
preventing end-stage diseases, information with
medical/genetic/non-medical implications, drug
response, and an over efficiency in the healthcare
sector. Since 2019, India has gained some momentum
in this field by launching its project IndiGen (discussed
later on).
KEYWORDS: Financial Implications, Healthcare
Industry, Ethical, Legal Considerations.
INTRODUCTION
Genome sequencing is a developing tool of the
healthcare industry. It provides answers to questions
like why some people catch certain diseases while
others do not. It has been proved to be laying the
foundation for predicting disease susceptibility and
drug response. It can give data on hereditary variations
that can prompt sickness, or expand the danger of
infection advancement, even in asymptomatic
individuals. Not only does it explore the human body to
personalize medicines, it also looks into food security
and food control.
Genome mapping stands as a less explored arena that
has high potential to be exploited as more than just a
biological topic. Genome mapping attracts the eyes of
venture capitalists, budding entrepreneurs, and big
pharmaceutical companies. It opens the possibility of
knowing what our genes entail for us thereby, not only
treating it ahead of time but also preventing it.
From an entirely financial standpoint, genome
sequencing can build a new sector in the country. As a
budding industry, it needs physicians, researchers,
participants, capital, financiers, and managers. When
presented with something so technical, we often fail to
estimate its commercial, legal and ethical facades.
However, despite the growing advantages and
possibilities of enhancing our current lives, there are
vast limitations of genome sequencing, such as
technical and financial issues, and legal and ethical
considerations.
LITERATURE REVIEW
Bonah et al. (2019) established that Genome mapping
had not been commercialized in developing countries;
it is mainly a developing research tool. They established
that food safety is not prioritized in developing
countries, and hence its practical usage for this purpose
is negligible.
Brown, Dessai et al. (2019) found out that genome
sequencing could be effectively used in the detection of
diseases in food items, therefore providing precaution,
detection, and investigation of food-borne viruses and
bacteria. They recommended that the same can be
applied by regulatory bodies and the government for
providing safe food facilities.
Ellwanger et al. (2019) proposed that governmental
agencies should appropriately invest into the medicinal
use of sequencing genomic data, taking into account
the available resources and the most urgent needs of
their communities and countries, and sooner or later
implement genome mapping for infectious diseases at a
global level.
Schwarze et al. (2018) conducted an economic
evaluation of the future of genome sequencing. They
concluded that current practices apply limited to rare
use of genomic data and evaluation of cost data,
effectiveness all hint towards urgent translation of this
science into practice.
E. Niemiec, H.C. Howard (2016) found out the
plausibility of scientists in using and exploiting
consumer genomic data. They found that there was no
regulation controlling such misuse, and companies are
rarely held accountable.
Sachdeva et al. (2014) concluded that genome
mapping requires significant investment and personal,
institutional, and governmental buy-in, along with a
high gestational period.

BEYONDThe Progression and Integration of Genome Sequencing in India
YOUTHINK l 2022 l Vol. XVI143
OBJECTIVES OF THE STUDY
?To study and map the progression of genome
sequencing.
?To understand the ethical and legal considerations of
genome mapping.
?To investigate the impact of genome sequencing on
the Indian economy.
DATA COLLECTION
The study is primarily based on secondary data which
has been compiled from various sources like –
?Published Research Papers
?Newspapers and Editorials
?Internet Websites
The study has been done taking into consideration data
pertaining from 2000 till date.
In relevant areas, primary data has also been collected.
The data was collected during the months of March and
April, 2021, from 175 subjects who were mainly peers,
relatives and neighbours belonging to the middle and
upper middle socio-economic classes, from the ages of
19 to 45.
APPLICATION AND ADVANTAGES
?Obtaining Information that has Potential Medical
Implications: This is the primary purpose of
o b t a i n i n g g e n o m i c d a t a a b o u t o n e ’ s
Deoxyribonucleic acid (DNA). It can provide a great
deal of information on genetic variants that can lead
to a disease or can increase susceptibility to a
disease.
Figure 1: Target Groups for Genome Mapping
(Source: Australian Academy of Science)
?Pharmacogenomics: It provides information about
potential drug response and drug efficacy for all
those DNAs which are under review.
?Non-medical Information: Information about
one’s heritage, non-health information, trait
information, or indirect medical information like
predisposition to obesity or depression can also be
obtained.
?Lifetime Use: As cellular data does not change with
progressing age and is specific to each individual,
genomic data obtained once is as accurate as
possible with current standards of science and need
not be ever re-sequenced.
?Psychological Benefit: Family history of diseases
can provide anxiety, in context to the uncertainty of
disease to oneself and future generations; a study of
disease predisposition and susceptibility can clear
out such air and even help in taking preventive and
precautionary steps.
?Cost Saving: A decoded genome data acts as a
repository for information, valid till perpetuity. It
reduces the trial and error of clinical tests and the
need for frequent diagnostic testing.
GLOBAL COST TIMELINE
?One of the early-stage human genome mappings
generated a draft sequence in the early 2000s. This
took 15 months (April 1999 – June 2000) and about
a total cost of $300 million, funded by the American
Institute, National Institute of Health.
?Further refining of this ‘draft’ by 2003 resulted in
greater efficiency and a reduction of
50 per cent in the total costs. The
entire project, taken up by the
government of the USA, took 13 years
and billed to a total cost of $2.7 billion.
The team further estimated that, in the
future, the cost of sequencing a human
genome would be around $150
million.
?Three years since the first successful
sequence was generated, new

The Progression and Integration of Genome Sequencing in IndiaBEYOND
YOUTHINK l 2022 l Vol. XVI 144
technologies, knowledge, and experience resulted
in a revision of costs. In 2006, the cost to sequence a
human genome was around $14 million.
Figure 2: Timeline of the Cost of Sequencing One Human Genome
(Source: Data from National Human Genome Research Institute [U.S.A.])
?By 2016, the landscape of genome sequencing had
turned around, which led to around a 97 per cent
reduction in costs. In 2015, the cost to develop a
human genome sequence turned out to be only
$4,000, and in 2016, this cost was further reduced
to $1,500.
Today, commercially, companies now price one human
genome sequencing at around $150 - $1,000.
INDIAN CONTEXT
Genetic testing in India has advanced by a wide margin
in the previous decade. Right now, there exist
Deoxyribonucleic acids (DNA)-based tests that address
various issues in medical services, from disease
counteraction to cellular analysis.
Under ‘IndiGen,’ the Council for Scientific and
Industrial Research (CSIR) chose about 1,000 youths
from across India by organizing camps in various
universities and instructing participants on genomics
and the job of DNA in diseases. A few understudies and
members donated blood samples from where their
DNA groupings were gathered.
This was the first occasion when an enormous
sample of Indians was enlisted for a detailed
examination for the field of genomics.
Limitations Faced by Indian Scientists:
?Wrong / Ine f fec t i ve / Inconc lus ive
Interpretation: Genome mapping tests
are considered accurate based on the
comparative data present with scientists
and the correct interpretation of results. If
such data or experience is absent, results
might be clouded or erroneous.
?Lack of Participants and Information:
Genome testing has only been developing
in our country over the past 15-20 years.
As a result, public awareness about the
same is very low. Consequently, there is a
lack of collection of genomic data for
referencing new DNAs, which ultimately
results in inconclusive or ineffective interpretation.
?Lack of Indigenous Raw Materials: A proper
sequencing test needs specialized plastic containers
and reagents that go into sequencing machines. In
India, such raw materials are not easily available.
?Bureaucratic Distractions: In order to boost local
production, the Government has recently
restrained government laboratories from importing
raw materials below `200 million. This has been a
hurdle for researchers, as they have to prove first
that Indian alternatives are not available. Such an
assessment is a needless bureaucratic distraction at
a time when labs desperately need to sequence
more genomes.
?Funding: To date, private equity investment in
genome sequencing in India has been below
satisfactory. Majority funding comes from the
Government, foreign companies like Eurofins, and
the issue of depository receipts.

BEYONDThe Progression and Integration of Genome Sequencing in India
YOUTHINK l 2022 l Vol. XVI145
Survey on Public Awareness:
Despite 15-20 years of extensive research by scientists,
genome sequencing is a foreign topic to the majority of
Indians. The field lacks substantive participation
because of low awareness, which leads up to one of the
major limitations of sequencing in India; it results in a
restricted repository of genomic data that hinders
further testing.
Figure 3: Awareness about Genome Sequencing
(Source: Primary Data)
It was found that only around 33.14
per cent respondents (58 out of 175)
are aware of genome sequencing
and its benefits.
LEGAL AND ETHICAL
CONSIDERATIONS
India, today, has loose to no
guidelines for this growing field. The
Indian Council of Medical Research,
the top body that manages clinical
trials in India, has no particular rules
to administer hereditary testing labs.
Organizations have access to
delicate individual data, which could
be hacked or offered to outsiders
without the owner's assent.
Figure 4: Legal and Ethical Concerns
(Source: The National Academies Press: Integrating Large Scale
Genomic Information into Clinical Practice (2012))
Insurance companies may abuse this information for
minimization and victimization of individuals based on
their hereditary profiles. In India, where rank, sex,
religion, and skin colour-based separation are so
normal, genetic segregation can be another ticking
bomb.
Concern over Data Privacy:
It was found that about 80 per cent respondents (140
out of 175) have concerns about their data being
misused if they get their genome sequenced.
Figure 5: Concern over Data Privacy
(Source: Primary Data)

The Progression and Integration of Genome Sequencing in IndiaBEYOND
YOUTHINK l 2022 l Vol. XVI 146
INVESTMENT SCOPE FOR GENOME SEQUENCING
‘The global Genome Sequencing Services market is
expected to reach $13.1 billion by 2025 supported by a
CAGR of 20.5 per cent during the forecast period of
2019 to 2025’, says Meticulous Research.
In India, currently, foreign investment reigns over
commercial genome sequencing , while the
government has only funded the academic portion.
Private equity firms or venture capitalists from domestic
markets have not seeded into this industry. This
showcases the imbalance in the funding structure of
these entities, with great scope for Indian investors to
throw their money at.
?The analysis from Table 1 is as follows:
i. Large global capacity to generate profit and
wealth.
ii. Potential in the Indian market. (All foreign
companies are planning to or have ventured into
the Indian markets).
iii. Small-cap Indian companies are failing due to
limitations; unable to perform despite global
growth.
?This goes to show that the Indian companies in this
sector are under-performing due to the limitations
faced in India.
?There is a need for a funding revolution in this sector
by way of larger investments which will be providing
promising returns, like the foreign companies.
?However, companies experimenting and
performing genome sequencing are bound to give
positive returns in a horizon of 5-10 years due to
favourable developments in science. Stock market
analysts and researchers predict a manifold growth
in this sector.
?Another way to invest in genome sequencing can be
by investment in these foreign companies, which
are already providing excellent returns.
SCOPE TO SET UP A NEW INDUSTRY
The commercialization of the academic knowledge of
genome sequencing can develop an unexplored
industry in India. The Genome Sequencing Services
market in India lags behind tremendously. It needs
factors to grow up to its potential. Genome Sequencing
COMPANY REVENUE
(2019) PROFIT (2019)
PERCENTAGE GROWTH IN THE
PAST5 YEARS PRESENCE IN INDIA
Illumina Inc. $354.8 million $1.002 billion 26 Subsidiary Incorporated
Eurofins Scientific Group
EUR 4562.8 million
EUR 833 million
29 Subsidiary Incorporated
Genewiz, Inc $134 million $24 million 19 Plans for Incorporation
Genotypic Technology (P) Ltd
?200 million ?3.58 million Not Available Indian Company
Table 1: Comparative Analysis of Companies in the Sector
(Source: Data from Annual Reports)

BEYONDThe Progression and Integration of Genome Sequencing in India
YOUTHINK l 2022 l Vol. XVI147
Services industry is a capital-intensive industry,
requiring a lot of physical, financial and human capital.
AVAILABILITY OF A MARKET TO CATER TO
The Indian Genome Sequencing market size was
valued at $23.67 million in 2019 and is expected to
expand at a compounded rate of 14.6 per cent per
annum from 2020 to 2027. Efforts taken to develop
genomic databases for the Indian population are
expected to drive the market.
Figure 7: Expected Growth of GS Market in India
(Source: Grandview)
Around two-thirds of the consumers have no idea about
genome sequencing and its benefits. A survey
conducted after educating the subjects about genome
mapping, in order to explore potential customer base,
gave the following results:
Figure 6: Requirements for Setting up a New Industry
(Source: Gentice Education)
It was found that about 69 per
cent respondents (120 out of 175)
would be interested in getting
their genome sequenced. Further,
around 15 per cent (27 out of
175) of the respondents were
unsure, which can be classified as
a potential target market.
Figure 8 shows the incidence of a
huge untapped market in India
for genome sequencing, which
market players hope to exploit in
the coming decade. In India, the
cost of tests is going down as
volumes rise; and there are about
half a dozen major companies in
the sector, led by MedGenome,
Strand Life Sciences, and leading
diagnostics chains like Metropolis,
SRL, and Dr. Lal PathLabs.
Cost Benefit Analysis:
COST: The cost of the first genome
sequenced in 2009, was about `5
million while the cost of each
sample under the IndiGen Project
(2019) was `0.1 million. The director of CSIR, Sridhar
Sivasubbu, estimates that in the next 2-3 years, the
revenue costs of each sample will fall below ̀ 50,000.
Figure 8: Whether People Want to Get
Their Genome Sequenced
(Source: Primary Data)

The Progression and Integration of Genome Sequencing in IndiaBEYOND
YOUTHINK l 2022 l Vol. XVI 148
PRICING: Earlier, commercial tests were priced at
around `0.2-0.25 million, when the companies
operated at a maximum capacity of 600 tests. Today,
such tests range from `3,000 to `70,000, with a
production capacity of over 150,000 tests.
PERCEIVED VALUE: Educated and aware consumers
assume the high value of sequencing tests, taking into
consideration the various benefits. The new strata of
value-oriented consumers accord high importance to
genome sequence testing and therefore, would accept
the current pricing levels.
A survey conducted in this regard shows that the
majority of consumers place a value of around
`25,000-50,000 on genome sequence testing.
(Figure 9)
Figure 9: The Distribution of Value Perceived by the Public
(Source: Primary Data)
Figure 10: Timeline of Cost, Price and Value of Genome Sequencing
(Source: National Human Genome Research Institute)
Figure 10 shows how the cost and price of sequencing
have declined over the years, with an increase in
perceived value, hinting at a market ready to
commercialize genome sequencing.
Reasons of manifold reduction in costs:
?Innovation in technology
?Reduction in capital expenditure requirements
?Economies of scale brought on by experience and
learning curve effects
?Application of cost management techniques
?Easy access grants by the Government
C O N S E Q U E N T I A L E C O N O M I C
GROWTH
?Employment Generation: Setting up
of a new industry brings numerous job
opportunities for all sectors of the
workforce.
?Reduction in Pathological Costs:
Implementation at a nation-wide level
will lead to disease detection at the
earliest point in time, thereby,
reducing the costs incurred by
patients for diagnosing diseases.
?Increased Revenue: Brings cash
inflows for testing centres and
increases revenues of the healthcare
sector.
?Increased Life Expectancy: Disease
detection, prevention and cure, at the
earliest, will increase the life
expectancy rates, foetal survival rates,
child-birth rates and safe pregnancy
rates.
?Food Security: Genome testing can
also be used in ensuring food safety
and disease prevention from food-
borne pathogens.
?Capital Inflow in the Economy: New
investment avenues in the form of

BEYONDThe Progression and Integration of Genome Sequencing in India
YOUTHINK l 2022 l Vol. XVI149
genome sequencing services market will bring in
new capital in the country from venture capitalists,
hedge funds, private equity investors, Foreign
Portfolio Investors (FPIs), Foreign Institutional
Investors (FIIs), and high-net-worth individuals.
?Growth and Development: The cumulative impact
of all the above benefits is an increase in the Gross
Domestic Product (GDP) and also brings about
sustainable development in the economy.
CONCLUSION
Genome sequencing is an unexplored yet promising
new arena. This study is aimed to find out the
plausibility of the science, the feasibility of its
commercialization, and concerns of genome mapping
in India at a large scale.
The future entails building an indigenous genomic
database, learning and developing the infrastructural
and technological requirements, and inviting the
requisite financial baseline it needs for developing
genome sequencing in India. This study proves that the
same is possible and preposterously acknowledges the
ability of our country as a whole to do so.
Reports also point out to silent investment from Tata
Consultancy Services and Wipro in equipment and
infrastructure for genome sequencing, suggesting the
entry of big players in this market in the future.
RECOMMENDATIONS
1. Comprehensive and effective policy regarding the
use of genomic data while ensuring significant
privacy levels for participants.
2. Assembling such huge scope data must be solid,
private, and precise. A viable and doable answer
for constructing a particularly dependable and safe
data set is the use of blockchain technology.
3. An authority set up for the protection of such data,
with periodically monitoring of usage to make users
accountable, gain important consent from owners,
gain public trust, and ensure that the data-sharing
benefits exceed its limitations.
4. Framing well-defined rules for investment and
reliefs for companies that set up business in this
industry.
5. Government subsidies, import relief for getting raw
materials, tax holidays, and grants to boost
research.
6. Reduction in bureaucratic burdens over
researchers and companies to enable seamless
workflow without any external disturbances.
7. Awareness programmes at national level and
incorporation in education of this science.
REFERENCES
1. Apruzzese et al. (2019). Investing in food safety for
developing countries: opportunities and challenges in
applying whole-genome sequencing for food safety
management. Foodborne pathogens and disease, 16(7),
463-473.
2. Brown, E., Dessai, U., McGarry, S., and Gerner-Smidt, P.
(2019). Use of whole-genome sequencing for food safety
and public health in the United States. Foodborne pathogens
and disease, 16(7), 441-450.
3. Ellwanger, J. H., de Lima Kaminski, V., and Chies, J. A. (2019).
Emerging infectious disease prevention: Where should we
invest our resources and efforts? Journal of infection and
public health, 12(3), 313-316.
4. Khromykh, A., and Solomon, B. D. (2015). The benefits of
whole-genome sequencing now and in the future. Molecular
syndromology, 6(3), 108.
5. Maan, S., Maan, N. S., Belaganahalli, M. N., Rao, P. P., Singh,
K. P., Hemadri, D and Mertens, P. P. (2015). Full-genome
sequencing as a basis for molecular epidemiology studies of
bluetongue virus in India. PLoS One, 10(6), e0131257.
6. Raizada, et al. (2014). Feasibility of decentralised
deployment of Xpert MTB/RIF test at lower level of health
system in India. PLoS One, 9(2), e89301.
7. Schwarze, K., Buchanan, J., Taylor, J. C., and Wordsworth, S.
(2018). Are whole-exome and whole-genome sequencing
approaches cost-effective? A systematic review of the
literature. Genetics in Medicine, 20(10), 1122-1130.
8. Wang, et al. (2020). Initial whole-genome sequencing and
analysis of the host genetic contribution to COVID-19
severity and susceptibility. Cell discovery, 6(1), 1-16.

BEYOND
YOUTHINK l 2022 l Vol. XVI 150
A Study on the Application of Behavioural Finance in Analyzing Investor BehaviourProf. Saptarshi RayAssistant ProfessorDepartment of Commerce (Evening)
Ruchika ChandakDepartment of Commerce (Evening)
Behavioural
finance
demonstrates
how emotions
and cognitive
errors influence
investors in the
decision-making
process.
ABSTRACT
Traditional finance portrays humans to be ‘homo economicus’ i.e., beings
that are rational and focus on maximizing their wealth and returns. Contrary
to such theories that advocate how investors take decisions backed by logic
and reason, the field of behavioural finance argues that individuals are
susceptible to various emotional and cognitive biases that make their
financial decisions diverge from rationality. This paper examines the meaning

BEYONDA Study on the Application of Behavioural Finance in Analyzing Investor Behaviour
YOUTHINK l 2022 l Vol. XVI151
of behavioural finance, the various theories associated
with it, and its application in investment decisions. It
proposes the idea that investing is not simply a game of
number crunching to arrive at buying or selling
decisions, but is, in fact, guided heavily by an
individual’s personality and behaviour.
KEYWORDS: Behavioural Finance, Loss Aversion,
Overconfidence, Investment Decision.
INTRODUCTION
Behavioural finance tries to decode ‘actual’ investor
behaviour in contrast to ‘theories’ on investor
behaviour. By combining psychology with traditional
economics and finance, it aims to explain stock market
anomalies and identify why people make specific
financial decisions. Recent episodes of extreme price
volatility, like that of GameStop, have made
behavioural finance's insights into market behaviour
even more difficult to dismiss and prompted investors
to have a deeper understanding of the impact of human
behaviour and psychology on market inefficiencies and
mispricing. Such an insight would enable investors to
become aware of their own biases, thereby allowing
them to make better financial decisions.
Behavioural biases have been categorized into two
types: cognitive biases and emotional biases. Within
each category, four biases and their impact on
investment decisions have been identified and studied.
LITERATURE REVIEW
Daniel Kahneman and Amos Tversky (1979) in their
paper titled ‘Prospect Theory: An Analysis of Decision
Under Risk’ found that people assigned different
weights to gains and losses, contrary to the predicted
utility theory. People were found to be much more
dissatisfied with potential losses than they were with
comparable gains.
Hersh Shefrin (1999) defined behavioural finance as ‘a
rapidly growing area that deals with the influence of
psychology on the behaviour of financial practitioners.’
Nicholas Barberis and Ming Huang (2001) suggested
through their paper titled ‘Mental Accounting, Loss
Aversion, and Individual Stock Returns’, that loss
aversion and narrow framing plays an important role in
determining how people evaluate risky gambles.
According to M. Sewell (2007), behavioural finance
questions the theory of market efficiency by explaining
why and how markets may be inefficient due to human
irrationality.
In his paper ‘Decision Making in the Stock Market:
Incorporating Psychology with Finance’, Abhijeet
Chandra (2008) investigated the effect of behavioural
influences and investor psychology on decision-
making. According to the findings, retail investors often
make unreasonable decisions. Many behavioural
factors affect investment decisions, including greed and
fear, mental accounting, heuristics, and anchoring et
al., which must be considered while making these
decisions.
Chaudhary (2013) investigated how behavioural
finance can help investors understand why they make
irrational financial decisions. Investor's decision-making
is influenced by feelings and cognitive mistakes,
according to the report. Anchoring, overconfidence,
herd behaviour, over and under-reaction, and loss
aversion were all found to be factors in behavioural
finance.
OBJECTIVES OF THE STUDY
The primary objective of this study is to study the
applicability of the different theories of Behavioural
Finance in the decision-making process of individual
investors on the Indian bourses. To meet this objective,
the research aims to:
?Understand the concept of behavioural finance and
the theories associated with it.
?Identify the prevalence of various emotional and
cognitive biases in the decision-making process of
investors belonging to different generations.
?Suggest methods and techniques to overcome and
limit the detrimental impact of such behavioural
biases.
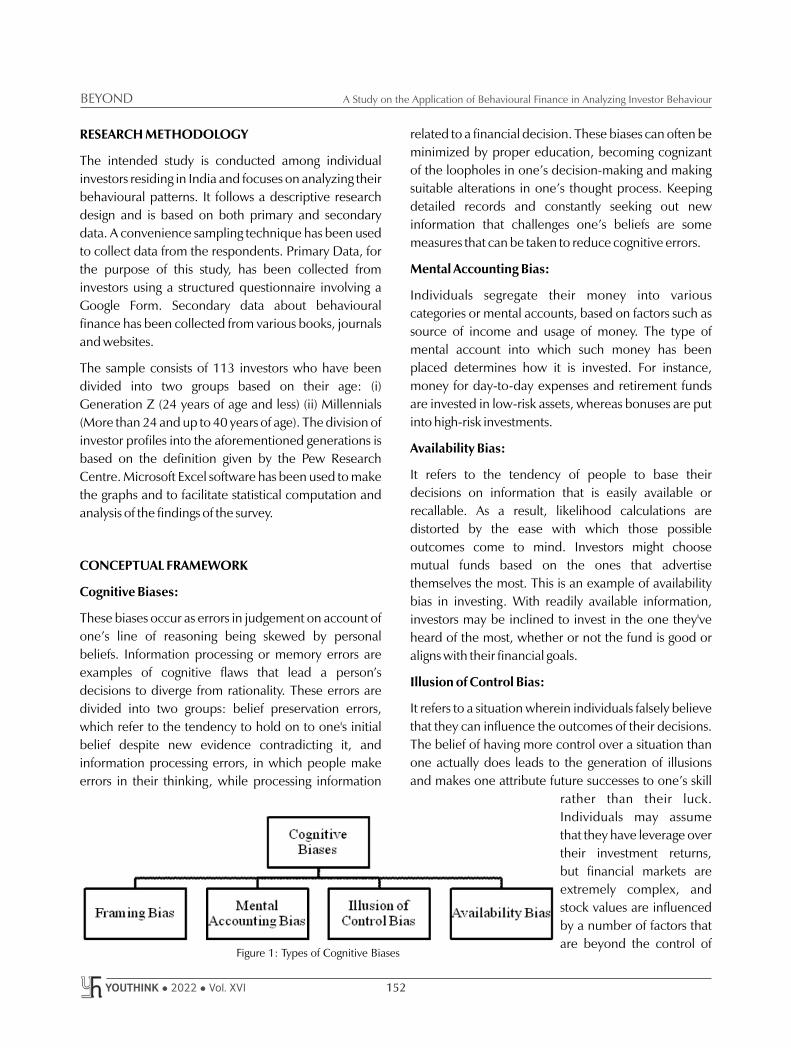
A Study on the Application of Behavioural Finance in Analyzing Investor BehaviourBEYOND
YOUTHINK l 2022 l Vol. XVI 152
RESEARCH METHODOLOGY
The intended study is conducted among individual
investors residing in India and focuses on analyzing their
behavioural patterns. It follows a descriptive research
design and is based on both primary and secondary
data. A convenience sampling technique has been used
to collect data from the respondents. Primary Data, for
the purpose of this study, has been collected from
investors using a structured questionnaire involving a
Google Form. Secondary data about behavioural
finance has been collected from various books, journals
and websites.
The sample consists of 113 investors who have been
divided into two groups based on their age: (i)
Generation Z (24 years of age and less) (ii) Millennials
(More than 24 and up to 40 years of age). The division of
investor profiles into the aforementioned generations is
based on the definition given by the Pew Research
Centre. Microsoft Excel software has been used to make
the graphs and to facilitate statistical computation and
analysis of the findings of the survey.
CONCEPTUAL FRAMEWORK
Cognitive Biases:
These biases occur as errors in judgement on account of
one’s line of reasoning being skewed by personal
beliefs. Information processing or memory errors are
examples of cognitive flaws that lead a person’s
decisions to diverge from rationality. These errors are
divided into two groups: belief preservation errors,
which refer to the tendency to hold on to one's initial
belief despite new evidence contradicting it, and
information processing errors, in which people make
errors in their thinking, while processing information
related to a financial decision. These biases can often be
minimized by proper education, becoming cognizant
of the loopholes in one’s decision-making and making
suitable alterations in one’s thought process. Keeping
detailed records and constantly seeking out new
information that challenges one’s beliefs are some
measures that can be taken to reduce cognitive errors.
Mental Accounting Bias:
Individuals segregate their money into various
categories or mental accounts, based on factors such as
source of income and usage of money. The type of
mental account into which such money has been
placed determines how it is invested. For instance,
money for day-to-day expenses and retirement funds
are invested in low-risk assets, whereas bonuses are put
into high-risk investments.
Availability Bias:
It refers to the tendency of people to base their
decisions on information that is easily available or
recallable. As a result, likelihood calculations are
distorted by the ease with which those possible
outcomes come to mind. Investors might choose
mutual funds based on the ones that advertise
themselves the most. This is an example of availability
bias in investing. With readily available information,
investors may be inclined to invest in the one they've
heard of the most, whether or not the fund is good or
aligns with their financial goals.
Illusion of Control Bias:
It refers to a situation wherein individuals falsely believe
that they can influence the outcomes of their decisions.
The belief of having more control over a situation than
one actually does leads to the generation of illusions
and makes one attribute future successes to one’s skill
rather than their luck.
Individuals may assume
that they have leverage over
their investment returns,
but financial markets are
extremely complex, and
stock values are influenced
by a number of factors that
are beyond the control of Figure 1: Types of Cognitive Biases

BEYONDA Study on the Application of Behavioural Finance in Analyzing Investor Behaviour
YOUTHINK l 2022 l Vol. XVI153
Overconfidence Bias:
‘It’s frightening to think that you might not know
something, but more frightening to think that, by and
large, the world is run by people who have faith that
they know exactly what is going on.’ - Amos Tversky
While having confidence in one's ability to earn
supernormal profits is beneficial, being overconfident
about the same can lead to detrimental outcomes.
When investors overestimate their ability to evaluate a
particular stock, company, or industry as a potential
investment, they may disregard any warning signs and
engage in excessive trading in the same.
Regret Aversion Bias:
When investors refuse to make decisions out of the fear
that those decisions might turn out to be wrong and may
cause them to regret in the future, they are said to be
suffering from regret aversion bias. They tend to hold
onto an underperforming investment for too long out of
the fear that the investment value will go up in the
future, which may cause them to regret having sold it.
The bias can also manifest itself in the form of ‘herding’
among investors, causing them to seek validation in the
decisions made by others. When their decision matches
that of the crowd, they
feel that the potential
for future regret has
been minimized.
Self-Control Bias:
It refers to a situation
wherein people act
against their financial
interests due to a lack
of self-discipline. In the
world of investing, self-control bias manifests itself in
the form of people suffering from the inability to delay
current consumption in order to save for the future. This
bias is often linked to a behavioural flaw called
hyperbolic discounting, which describes how skewed
an investor’s perception of gain is. Due to a larger
appetite for short-term gains, investors often tend to
sacrifice greater long-term gains, which in turn,
adversely impact their decision-making.
any single person. Analysts who use complex models to
make forecasts often fall prey to this bias leading them
to make more frequent trades incurring excessive
turnover costs.
Framing Bias:
It happens when individuals make decisions based on
the framework in which information is presented
through various wordings, settings and scenarios, rather
than on facts. For example, whether a cup of yoghurt is
described as being ‘95 per cent fat-free’ or containing ‘5
per cent fat’, it would refer to the same basic fact.
However, surveys reveal that consumers are more likely
to buy the yoghurt with the first description. In the
world of investments, individuals influenced by framing
bias often misidentify their risk tolerance depending on
how the information is presented.
Emotional Biases:
These biases usually arise spontaneously as a result of an
individual's feelings, emotions or personal experiences
at the time when a decision is made. Emotional biases
are more difficult to overcome than cognitive errors
since they are rooted in the personality of the investors.
Loss Aversion Bias:
It refers to the fact that individuals dislike losses more
than they like gains of an equal amount i.e., the value
that people assign to similar gains and losses are
asymmetric. It can be demonstrated through the
tendency of investors to hold on to investments trading
below their purchase price to avoid realizing the loss
while selling off ‘winning’ investments too early in order
to lock in the gains.
Figure 2: Types of Emotional Biases

Figure 3
(Source: Primary Data)
A Study on the Application of Behavioural Finance in Analyzing Investor BehaviourBEYOND
YOUTHINK l 2022 l Vol. XVI 154
DATA ANALYSIS AND FINDINGS
To check for the prevalence of the aforementioned
cognitive and emotional biases among investors, a
generation-wise breakup of the summary of the
responses received has been presented.
Framing Bias:
‘Based on the chart below, which investment portfolio fits your risk
tolerance and desire for long-term return?’
Portfolio 95 per cent Probability Return Range 10-Year Average Return
XYZ 0.5 per cent to 6.5 per cent 3.5 per cent
DEF -18 per cent to 30 per cent 6.0 per cent
ABC -22 per cent to 42 per cent 10.0 per cent
o Portfolio XYZ
o Portfolio DEF
o Portfolio ABC
Question 1:
‘Based on the chart below, which investment portfolio fits your risk
tolerance and desire for long-term return?’
Portfolio 10-Year Average Return Standard Deviation of Returns
XYZ 3.5 per cent 1.5 per cent
DEF 6.0 per cent 12 per cent
ABC 10.0 per cent 16 per cent
o Portfolio XYZ
o Portfolio DEF
o Portfolio ABC
Question 2:
The respondents were asked to choose among three
portfolios which were essentially the same across two
questions. However, one question was framed with the
risk involved being described first and the other was
framed with the returns being described first.
Generation Z:
Risk-averse Riskier Riskiest
XYZ DEF ABC Total
SD before return as a range 16 8 6 30
SD after return as percentage 3 6 21 30
Table 1
(Source: Primary Data)
First Selection XYZ DEF ABC Total
XYZ 2 4 10 16
DEF 1 1 6 8
ABC 0 1 5 6
Table 2
(Source: Primary Data)
The respondents in ‘Generation Z’
initially showed an inclination
towards being risk-averse with 53
per cent of the people choosing the
least risky portfolio. However, upon
a change in the framing of the
question, a shift was seen towards
the portfolio accruing the highest
return, despite having a high-risk
profile, as evidenced by 70 per cent
of the people choosing the riskiest
portfolio. 73 per cent of the
respondents showed inconsistency
in the choice of their portfolio upon
a change in the framing of the
question.

BEYONDA Study on the Application of Behavioural Finance in Analyzing Investor Behaviour
YOUTHINK l 2022 l Vol. XVI155
Risk-averse Riskier Riskiest
XYZ DEF ABC Total
SD before return as a range 21 47 15 83
SD after return as percentage 13 18 52 83
Table 3
(Source: Primary Data)
Millennials:
First Selection XYZ DEF ABC Total
XYZ 4 4 13 21
DEF 10 6 31 47
ABC 2 5 8 15
Table 4
(Source: Primary Data)
Initially, 57 per cent of the respondents in the
‘Millennial’ generation chose the riskier portfolio and
25 per cent of them chose the least risky portfolio.
However, upon the change in the framing of the
question, a shift was seen towards the portfolio accruing
the highest return, despite having a high-risk profile, as
evidenced by 63 per cent of the people choosing the
riskiest portfolio. 78 per cent of the respondents
showed inconsistency in the choice of their portfolio
upon a change in the framing of the question.
‘Do you segregate your money based on
its source or intended use? For example
- Classifying money received from salary
and bonus into different accounts.’o Yeso Noo Maybe
Mental Accounting Bias:
Figure 4
(Source: Primary Data)
Generation Z:
Figure 5
(Source: Primary Data)
Millennials:
Figure 6
(Source: Primary Data)
Among the respondents belonging to ‘Generation Z’,
53 per cent of them agreed to classify their money
based on its intended use, and among the ‘Millennials’,
59 per cent of them agreed to the same, signifying that
investors belonging to both the generations maintain
mental accounts for their investments.

A Study on the Application of Behavioural Finance in Analyzing Investor BehaviourBEYOND
YOUTHINK l 2022 l Vol. XVI 156
‘You are offered two free lottery tickets. Which of
the following things would you do?’o Select your own ticketo Have a machine generate the ticket number for
you
Illusion of Control Bias:
Generation Z:
Figure 7
(Source: Primary Data)
Millennials:
Figure 8
(Source: Primary Data)
60 per cent of the respondents in ‘Generation Z’
showed an inclination towards selecting their own
ticket, indicating the presence of the Illusion of Control
bias. 58 per cent of the respondents who were
'Millennials' opted for a machine-generated ticket,
indicating that the Illusion of Control bias was not
prevalent among them.
Millennials:
Figure 10
(Source: Primary Data)
Availability Bias:
‘You make investment decisions (such as selecting a
mutual fund or online broker) based on word-of-
mouth or name recognition.’o Agreeo Disagree
Figure 9
(Source: Primary Data)
Generation Z:
Among the respondents, 70 per cent belonging to
‘Generation Z’and 57 per cent belonging to the
‘Millennial’ generation disagreed with them, making
investment decisions based on word of mouth or name
recognition. This might indicate that the younger
investors are taking more informed decisions as
compared to their older counterparts.

BEYONDA Study on the Application of Behavioural Finance in Analyzing Investor Behaviour
YOUTHINK l 2022 l Vol. XVI157
Loss Aversion Bias:
‘Which of these two options would you choose?’
o An assured gain of ̀ 400
o A 25 per cent chance of gaining ̀ 2,000 and a 75
per cent chance of gaining nothing
Question 2:
Generation Z:
Assured Calculated Total
Gain 9 21 30
Loss 6 24 30
Table 5
(Source: Primary Data)
Question 1:
‘Which of these two options would you choose?’
o An assured loss of ̀ 400
o A 50 per cent chance of losing ̀ 1,000 and a 50
per cent chance of losing nothing
The respondents were asked to choose between an
expected gain and an assured gain along with an
expected loss and an assured loss across two different
questions. The figure of the expected gain was higher
than that of the assured gain in question one and the
figure of the expected loss was higher than the assured
loss in question two.
Assured Loss Calculated Loss Total
Assured Gain 2 7 9
Calculated Gain 3 18 21
Table 6
(Source: Primary Data)
Respondents in ‘Generation Z’ showed an inclination
towards making a higher calculated gain with 70 per
cent of the respondents choosing the same. However,
80 per cent of the respondents ended up choosing a
higher calculated loss of `500 despite a lesser assured
loss of `400, triggered by their emotion to avoid loss
instead of letting it be assured.
Figure 11
(Source: Primary Data)
Millennials:
Assured Calculated Total
Gain 16 67 83
Loss 20 63 83
Table 7
(Source: Primary Data)
Assured Loss Calculated Loss Total
Assured Gain 5 11 16
Calculated Gain 15 52 67
Table 8
(Source: Primary Data)
Figure 12
(Source: Primary Data)

A Study on the Application of Behavioural Finance in Analyzing Investor BehaviourBEYOND
YOUTHINK l 2022 l Vol. XVI 158
Respondents in the ‘Millennial’ generation showed an
inclination towards making a higher calculated gain
with 81 per cent of the respondents choosing the same.
However, 76 per cent of the respondents ended up
choosing a higher calculated loss of `500 despite a
lesser assured loss of `400, triggered by their emotion
to avoid loss instead of letting it be assured.
‘You are confident of your ability to choose stocks
that outperform Nifty 50 and BSE Sensex.’
o Agree
o Disagree
Overconfidence Bias:
Generation Z:
Millennials:
Figure 13
(Source: Primary Data)
Figure 14
(Source: Primary Data)
Among the respondents, 63 per cent of those belonging
to ‘Generation Z’ and 76 per cent of those who were
‘Millennials’ agreed that they were confident about
their ability to choose stocks that outperform NIFTY50
and BSE Sensex, indicating that the bias is more
prevalent among older investors.
Regret Aversion Bias:
Generation Z:
Figure 15
(Source: Primary Data)
‘Suppose you make an investment in Stock ABC,
and over the next six months, ABC appreciates by
your target of 15 percent. You decide to sell, but
then come across a news piece in a leading
business daily that restates the company’s recent
successes and sparks new optimism. You wonder
whether ABC could climb even higher. Which
answer describes your likeliest response now?’
o I think I’ll hold off and wait to see what
happens. I'd really regret it if I sold now and
ABC went up further.
o I’ll probably sell because ABC has hit the
target I set, and I try to stick to the targets set.

BEYONDA Study on the Application of Behavioural Finance in Analyzing Investor Behaviour
YOUTHINK l 2022 l Vol. XVI159
Millennials:
Figure 16
(Source: Primary Data)
77 per cent of the respondents belonging to
‘Generation Z’ and 52 per cent of the ‘Millennials’ said
that they would hold on to an investment even after it
met the target only to avoid regret if it went up further.
The lower likelihood of exhibiting this bias among
‘Millennials’ might indicate that their fear of regretting
their financial decisions on account of a better
understanding of their risk appetite is lesser.
Self-Control Bias:
Generation Z:
Figure 17
(Source: Primary Data)
‘You spend a greater percentage of your income
than what you save.’
o Agree
o Disagree
Millennials:
Figure 18
(Source: Primary Data)
The respondents were asked whether they spend more
than they save. 63 per cent of those in ‘GenerationZ’
and 73 per cent of the ‘Millennials’ disagreed with the
same indicating that there is a strong savings habit
among the respondents. Thus, it can be concluded that
the sample respondents do not suffer from self-control
bias. A greater majority of the ‘Millennials’ disagreeing
to spending more might indicate that one’s saving
behaviour increases as one approaches old age.
RECOMMENDATIONS
‘People who miss opportunities to learn from past
miscalculations are likely to miscalculate again -
renewing a cycle of anxiety, discomfort, dissonance,
and denial.’
Since behavioural biases can impair sound decision-
making, investors can adopt the following strategies to
immunize themselves against the same:
1. Understanding the biases: Awareness and
recognition of biases and one’s susceptibility to
them can be the first step in eliminating them.
2. Becoming mindful of one's investment rationale:
Long-term investment goals that are vague, such as
‘I want to retire wealthy,’ offer little investment
guidance. Goals should be specific and
quantifiable, such as ‘I want to retire in 10 years’. A

A Study on the Application of Behavioural Finance in Analyzing Investor BehaviourBEYOND
YOUTHINK l 2022 l Vol. XVI 160
minimum of 500,000 per year in retirement
income will allow one to live comfortably and will
help reduce investor myopia and assist in making
more informed decisions.
3. Diversification of investments: The principle of
diversification helps one in managing risks.
Diversification across different industries and
investment vehicles such as gold, stocks, bonds,
real estate, et al. can be a suitable hedge against the
volatility of markets.
4. Recognize that earning a market rate of return is
acceptable: Typically, methods for making
supernormal profits worsen cognitive prejudices,
resulting in lower returns. Indexing-based portfolio
strategies reduce the negative impact of prejudices
and take emotion out of investing. Moreover, they
are also the most effective in the long run.
` 5. Fundamental Analysis should be supplemented by
Technical Analysis: At the time of investment
decision-making, fundamental as well as technical
analysis should be considered because
fundamental analysis often fails to justify short-term
fluctuations in the price of securities which are
sometimes based more on psychological factors
than on economic factors. Technical analysis helps
investors where fundamental analysis proves
inadequate, so both the methods should be
considered in conjunction with each other.
The following recommendations are suggested to curb
the adverse impact of the eight behavioural biases
identified:
COGNITIVE BIASES EMOTIONAL BIASES
Framing Bias:To overcome this bias, investors should make a
thorough analysis of the information at hand and
consider rephrasing it to check if it changes the
conclusion they had arrived at earlier.
Mental Accounting Bias:To eliminate this bias, individual investments need to
be viewed from the ‘portfolio perspective’, considering
the overall asset allocation and factoring in the
correlation among investments.
Illusion of Control Bias:To overcome this bias, investors should understand the
probabilistic nature of investing. They should try to
analyze the possible factors which could influence the
price of a stock to realise that they do not have control
over the outcome of their investment.
Availability Bias:In order to overcome this bias, investors should
diligently research and contemplate on investment
decisions along with setting personal trading rules so
that they do not execute regrettable orders.
Loss Aversion Bias:To eliminate this bias, entry and exit from
investments should be justified by the fundamentals
of the underlying assets and should be consistent with
the risk and return objectives of an investor.
Overconfidence Bias:In order to reduce this bias, investors should keep a
proper record and justification for each investment
that they make and they should do an ex-post
analysis of the same.
Regret Aversion Bias:In order to correct this bias, investors should take
decisions keeping the long-term outcomes of their
portfolio in mind and not try to simply follow the
current trend.
Self-Control Bias:To tackle this bias, individuals should make realistic
financial plans and goals and always rationalize their
spending.
Table 9

BEYONDA Study on the Application of Behavioural Finance in Analyzing Investor Behaviour
YOUTHINK l 2022 l Vol. XVI161
CONCLUSION
‘The investor’s chief problem - and even his worst
enemy - is likely to be himself.’- Benjamin Graham
Behavioural finance provides explanations as to why
investors make irrational financial decisions. It
demonstrates how emotions and cognitive errors
influence investors in the decision-making process. In
essence, it looks at investor behaviour trends and tries to
figure out how these patterns influence investment
decisions.
Individual investors, contrary to what classical finance
theory implies, do not always behave rationally while
making investment decisions. In this study, the
respondents were found to exhibit both cognitive and
emotional biases. The study concluded that three
cognitive biases, namely, Framing, Mental Accounting
bias, and Availability bias were exhibited by the
respondents from both the generations. The Illusion of
Control bias was exhibited by the respondents
belonging to ‘Generation Z’ but was not exhibited by
those respondents who were ‘Millennials’. Three
emotional biases , namely, Loss Avers ion,
Overconfidence and Regret Aversion bias affected
decision-making among respondents from both the
generations. However, respondents from either of the
generations did not exhibit Self-Control bias.
REFERENCES
1. Baker, H. K., Filbeck, G., and Ricciardi, V. (2017). How
Behavioural Biases Affect Finance Professionals.
2. Hsu, Y. and Shiu, C. Y. (2010), The Overconfidence of
Investors in the Primary Market, Pacific-Basin Finance
Journal, 18(2), 217-239.
3. Kahneman, D., and Tversky, A. (1979). Prospect theory: An
Analysis of Decision Under Risk. Econometrica: Journal of
the Econometric Society, 263-291.
4. Parikh, Parag. 2011. Value Investing and Behavioural
Finance. New Delhi: Tata Mcgraw Hill.
5. Thaler, Richard H. (1985) Mental Accounting and Consumer
Choice, Marketing Science, 4, 199-214.

BEYOND
YOUTHINK l 2022 l Vol. XVI 162
Investigating the Determinants of Stress among Teachers of Christian SchoolsRev. Fr. Joseph Kulandai, SJVice PrincipalDepartment of Commerce (Morning)
The mercurial
transitions in the
academic sphere
have increased
the complexities
of modern-day
teachers.
ABSTRACT
In the backdrop of the current hyper-competitive academic milieu, the
modus operandi of teachers has become extremely arduous which has
posed stiff challenges for them. The travails encountered by the teachers,
especially during these challenging times of the COVID-19 pandemic, have
been gargantuan. Along with such challenges, there is always an added
demand of constantly adapting oneself to the changing academic and
workplace environment, which is likely to take a toll on the mental health of
the teachers. The present research study purports to examine and analyze
the key factors that cause stress among teachers of selected Christian schools
in the metropolitan setting of Kolkata.
KEYWORDS: Education, Christian Schools, Teachers, Stress.
INTRODUCTION
The mercurial transitions in the academic sphere have increased the
complexities of modern-day teachers. Moreover, the malaise of the current
ongoing Coronavirus pandemic has further escalated the concerns of mental
health, especially among teachers. Truth be told, stress has become a
universal conundrum and has received considerable attention since the
COVID-19 lockdowns were imposed. Since then, there has been a plethora
of changes witnessed in the everyday life of teachers, which has impacted
their lives severely, contributing to immense levels of stress. As a result, it

BEYONDInvestigating the Determinants of Stress among Teachers of Christian Schools
YOUTHINK l 2022 l Vol. XVI163
becomes extremely crucial to explore the various
antecedents of stress. The essence of the current
research endeavour is very much aimed at this, where
the most dominant factors of stress among teachers
would be probed into.
STRESS - A BRIEF OVERVIEW
Every person experiences stress in their daily lives.
Undoubtedly, stress is a global phenomenon
experienced in every profession and the teaching
profession is no exception. Different authors have
defined the term ‘stress’ in different ways. In simple
words, stress may be defined as ‘the adaptive response
of an individual as a result of the interaction with the
environment characterized by certain changes within
those individuals causing them to deviate from their
normal functioning’. Stress is actually a person’s
response to a situation rather than the situation itself.
More often than not, stress is perceived in a negative
manner. There is also a positive side of stress called
‘Eustress’ which is caused by good things as well as a
neutral side of stress called ‘Neustress’ where an
individual is said to have ‘no positive as well as negative
stress’. While positive stress is good for an individual,
negative stress has an adverse impact on an individual in
the form of emotional fatigue, depersonalization,
reduced personal accomplishment, et al.
LITERATURE REVIEW
The term ‘stress’ is borrowed from the discipline of
physics. Stress actually means pressure (Cox 1978, cited
in Furnham 2005, p 354). According to Bernik (1997),
stress designates the aggression itself leading to
discomfort, or the consequences of it. It is an organism’s
response to a challenge, be it right or wrong. Moorhead,
G., and Griffin, R. W. (2001) said that stress is caused by
a stimulus that can be either physical or psychological,
and that each individual responds to the stimulus in
some way. Stephen P. Robbins, et al. (2007) defined the
term ‘stress’ as a dynamic condition in which an
individual is confronted with an opportunity, constraint
or demand related to what he/she desires and for which
the outcome is perceived to be both uncertain and
important. Salami O. S. (2010) defined occupational
stress as the experience of unpleasant negative
emotions such as tension, anxiety, frustration, anger and
depression, resulting from aspects of work. Yan, H., and
Xie, S. (2016) defined work stress as a series of
physiological, psychological and behavioural responses
due to the continuing effects of one or more stressors on
individuals in an organization. According to Kyriacou
(2001), ‘teacher stress may be defined as the
experience by a teacher of unpleasant, negative
emotions, such as anger, anxiety, tension, frustration or
depression, resulting from some aspect of their work as
a teacher’. Quite a few researchers in the past have
blended quintessential factors of teacher stress like
student behaviour, role ambiguity, task stress,
curriculum changes, workload, et al. A closer
introspection of literature review would reveal that it is
extremely arduous to come across researches focusing
on teacher stress of Jesuit institutions. Hence, in this
present study, we shall focus on many of these factors
falling under different categories of the sources of stress
from the innate viewpoint of Jesuit institutions.
RESEARCH OBJECTIVE
To identify the dominant factors of stress among
teachers of Christian schools.
RESEARCH METHODOLOGY
An anonymous survey had been conducted on a
sample of 138 respondents, both male and female,
employed in teaching in various Christian schools in the
city of Kolkata. A structured questionnaire had been
developed for conducting the survey where all such
questionnaires were mailed to the teachers, as physical
interaction was not possible due to the current
pandemic situation. A total of four schools located in
Kolkata were selected, namely, St. Anthony’s High
School, St. John Berchman’s School, Loyola High
School and St. Xavier’s Collegiate School. A 5-Point
Likert scale was used to measure the concepts (1=
Strongly Agree, 2= Agree, 3= Neutral, 4= Disagree
and 5= Strongly Disagree). The data collected has been
meticulously processed by the use of IBMs SPSS.

Investigating the Determinants of Stress among Teachers of Christian SchoolsBEYOND
YOUTHINK l 2022 l Vol. XVI 164
DATA ANALYSIS AND PRESENTATION
Demographic Profiling
The following demographic data of the teachers has
been captured in pie diagrams which are distributed
across gender, age and income. Pie diagrams have been
used instead of a table to enhance visibility among the
readers.
Figure 1: Representation of Gender among Respondents
(Source: Primary Data)
Figure 2: Representation of Age among Respondents
(Source: Primary Data)
Figure 3: Representation of Income among Respondents
(Source: Primary Data)
KMO Bartlett’s Test of Sphericity
Since the objective of the study is to prune out the
dominant factors of stress among teachers of Christian
schools by the usage of Factor Analysis through Principal
Component Analysis, it is necessary to conduct KMO
and Bartlett’s Test of Sphericity to measure the sample
adequacy as well as to explain whether it is feasible to
conduct Factor Analysis. The results of the Factor
Analysis have been presented below. As evidenced, the
KMO value is 0.789, which is greater than the ideal limit
of 0.6. The p-value is also significant at 0.000 (p is less
than 0.05), hence, it is worthwhile to run a Factor
Analysis test on the different variables contributing to
stress among teachers of Christian schools.
Kaiser-Meyer-Olkin Measure of
Sampling Adequacy 0.789
Bartlett’s Test of Sphericity Approx.
Chi-Square 810.456
df 31
Sig. .000
Table 1: KMO and Bartlett’s Test of Sphericity
(Source: Primary Data)
The KMO and Bartlett’s Test is succeeded by Total
Variance Explained (TVE). According to TVE, the result
will indicate the number of factors derived on the
condition that the Eigenvalues are greater than one. We
observe five factors of stress which have Eigenvalues
greater than one, so only those factors have been taken
into consideration, which explains 86 per cent of stress
levels experienced by the teachers of Christian schools.

BEYONDInvestigating the Determinants of Stress among Teachers of Christian Schools
YOUTHINK l 2022 l Vol. XVI165
Component
Initial Eigenvalues Extraction Sums of Squared Loadings
TotalPer cent of Variance
Cumulative Per cent Total
Per cent of Variance
Cumulative Per cent
1 2.138 23.102 23.102 2.138 23.102 23.102
2 1.705 20.938 44.040 1.705 20.938 44.040
3 1.587 18.898 62.938
1.587
18.898 62.938
4 1.126 12.240 75.178
1.126
12.240 75.178
5 1.014 10.822 86.000
1.014
10.822 86.000
6 0.616 6.224 92.224
7 0.474 3.903 96.127
8 0.235 2.610 98.737
9 0.105 1.263 100.00
Table 2: Factor Analysis (Total Variance Explained)
(Source: Primary Data)
Extraction Method: Principal Component Analysis
Below is the Table 3 showing the Rotated Component Matrix, according to which the variables would
get accommodated in the factor loadings, thereby showing the final results. The component may be
arranged in the following manner:

Investigating the Determinants of Stress among Teachers of Christian SchoolsBEYOND
YOUTHINK l 2022 l Vol. XVI 166
The nine variables are disintegrated into five factors
which we have renamed as Component I, Component
II, Component III, Component IV and Component V.
The following components have been renamed as
Academic Stress, Personal/Individual Stress, Student-
related Stress, Home-Workplace Stress and
Interpersonal Stress.
RESEARCH FINDINGS AND DISCUSSIONS
A total of nine factors contributing to stress among
teachers of Christian schools have been identified.
However, there are five most dominant factors amongst
t h o s e n i n e , n a m e l y, A c a d e m i c S t r e s s ,
Personal/Individual Stress, Student-related Stress,
Home-Workplace Stress and Interpersonal Stress. The
other four factors of stress, according to the strength of
independence on the basis of Factor Analysis were
Working Condition Stress, Group Stress, Social Stress
and External Stress. A significant proportion of
respondents agreed to the fact that they were more
stressed due to their academic-related work, that is,
their workload in institutions. Another significant
proportion of respondents completely agreed
that a major source of stress in their daily lives
stemmed out of their own personal problems.
We also had a significant number of respondents
who were said to experience stress because of
student-related factors l ike improper
communication, poor feedback, countering
challenging and intelligent students, et al.
Home-Workplace Stress also played a significant
part in causing stress to teachers of Christian
schools as many of such teachers have a tough
time coping up with the gruelling task of
travelling from home to institutions and vice
versa during these challenging times of COVID-
19. Last but not least, Interpersonal Stress in the
form of competition with peers, conflict with peers, et
al., also was a menacing source of stress, as the
ramifications ensuing out of this kind of stress is said to
have a detrimental effect on the teachers. We also
discovered factors like Working Condition Stress,
Group Stress, Social Stress and External Stress, which in
accordance with our study did not prove to be so
important. But this does not undermine their role in
contributing to stress among teachers of any institution,
let alone Christian schools. Coming to Working
Condition Stress, as pointed out by the American
psychologist Frederick Herzberg in his Two-Factor
Theory, working conditions/hygiene factors are
absolutely pivotal as the absence of such good hygiene
factors or working conditions will lead to dissatisfaction
and hence result in stress. In this context, factors like
poor classroom ambience, poor infrastructure, lack of
good technological facilities inside institutions, et al.,
contribute to a prodigious amount of stress among
teachers. Group Stress in the form of group conflicts,
group politics, competitions with other groups, et al.,
also contributes to stress among teachers. Social Stress
stemming from lack of social support, culture, ethics,
religion, et al., are also significant influencers of stress.
However, this was not ably supported by our study. Last
of all, External Stress in the form of climate, political
parties, pollution, et al. had a negligible impact on
teachers according to our study.
Component
1 2 3 4 5
F1
0.363 -0.062 0.124 0.697 0.412
F2
0.219 0.155 0.352 0.815 0.224
F3
0.638 0.403 0.013 -0.028 0.387
F4 0.123 0.077 -0.032 -0.166 0.168
F5 0.089 0.352 0.237 0.061 -0.056
F6 -0.079 -0.533 0.158 -0.189 0.213
F7 -0.008 0.061 -0.098 -0.091 0.512
F8 0.688 0.257 -0.197 0.175 -0.192
F9 0.705 0.398 0.221 -0.092 0.749
Table 3: Rotated Component Matrix
(Source: Primary Data)
Extraction Method: Principal Component Analysis
Rotation Method: Varimax with Kaiser Normalization
a. Rotation Converged in Six Iterations

BEYONDInvestigating the Determinants of Stress among Teachers of Christian Schools
YOUTHINK l 2022 l Vol. XVI167
CONCLUSION
The rapidly changing world and the emerging
ramifications are having an adverse impact on the lives
of everyone, especially working professionals. They are
witnessing stress every now and then. However, the
level of stress varies among individuals. There are
myriad sources of stress. It is to be noted that what may
be a source of stress to one, may not be a source of stress
to another. The teachers of Christian schools have been
experiencing a prodigious amount of stress with each
passing day. It has become incumbent to provide
teachers with appropriate training and counselling
programs to fight and overcome stress efficiently.
Christian schools have started implementing various
kinds of teacher training programs for the teachers in
the form of FDP, counselling sessions, special seminars
on stress management, et al., in order to provide the
much-needed balm to this menacing problem. Truth be
told, stress is simply inevitable but simultaneously could
be managed properly, keeping in mind the demands of
the fast-paced world and one’s ability to fulfil the
demands as well as cope up with the challenges, be it
with the universal phenomenon called ‘stress’.
REFERENCES
1. Burman Richa and Goswami TulseeGiri. (2018). A Systematic
Literature Review of Work Stress. International Journal of
Management Studies, Volume 5, Issue No. 3 (9).
2. Jain Geetika, Tyagi Harish Kumar and Kumar Anil. (2015).
Psycho-Social Factors Causing Stress: A Study of Teacher
Educators. Journal of Education and Practice, Volume 6,
Issue No. 4.
3. Jenitta J.N and Mangaleswaran T. (2016). Factors Affecting
the Stress of Teachers; A Special Reference to Trincomalee
District, International Journal of Engineering Science and
Computing, September 2016 Volume 6, Issue No. 9.
4. Kaur Navneet. (2016). Evaluation of Factors causing Stress
among School Teachers of North India (Unpublished MBA
Dissertation). Dublin Business School, Dublin, Ireland.
5. Fisher, M. H. (2011). Factors Influencing Stress, Burnout, and
Retention of Secondary Teachers. Current Issues in
Education, Volume 14, Issue No. 1.

BEYOND
YOUTHINK l 2022 l Vol. XVI 168
Exploring the Determinants of Workplace Spirituality among Teachers at Jesuit Schools: Insights from Kolkata
Rev. Fr. Peter Arockiam, SJVice PrincipalDepartment of Commerce (Evening)
Educational
institutions are
posed with a stiff
challenge of not
only educating its
students with the
latest approaches
in pedagogy, but
also enhancing
the skills and
competencies of
the teachers and
students.
ABSTRACT
Teachers in educational institutions are entrusted with the responsibility of
shaping the future citizens of a nation, which necessitates their involvement
and commitment to their profession. This is further dependent on the
teachers' mindset and spirit for finding true meaning and strong purpose in
their work, as well as their desire to engage with other teachers and be a part
of the community. This is the essence of workplace spirituality, thus, it is
pivotal to explore the key factors that influence it, particularly among
teachers in Jesuit schools, where high-quality education is pillared on
spiritual values rooted in the Ignatian charism. Therefore, the aim of the
present research study is to examine and analyze the most dominant factors
of workplace spirituality. A survey has been conducted on 114 school
teachers belonging to Jesuit schools in Kolkata. The data collected has been
analyzed by IBM’s SPSS. The findings of the study reveal some key factors of

BEYONDExploring the Determinants of Workplace Spirituality among Teachers at Jesuit Schools
YOUTHINK l 2022 l Vol. XVI169
workplace spirituality like altruistic love, faith, vision,
calling, meaning, membership, organizational
commitment, productivity and spiritual leadership.
KEYWORDS: Workplace Spirituality, School Teachers,
Jesuit Schools, Kolkata.
BACKGROUND OF THE STUDY
The landscape of education is undergoing a stunning
metamorphosis with each passing day. As a result,
educational institutions are posed with a stiff challenge
of not only educating its students with the latest
approaches in pedagogy but also enhancing the skills
and competencies of the teachers and students.
Teachers play an instrumental role in disseminating
knowledge and learning among the students of any
institution. The roles they play in Jesuit schools are all
the more challenging because the approach focuses on
not only providing academic lessons to students, but
also on their overall development in terms of character,
moral behaviour, good ethics, and most importantly,
acting as agents of change in society and being men and
women for others. This calls for a huge challenge on the
part of the teachers of Jesuit schools for finding a true
meaning and strong purpose in their work and the
desire to engage themselves with their colleagues at
their workplace and be deep rooted in the community.
However, it is important to intricately probe on the very
concept of ‘workplace spirituality’, in the sense, to
prune out the various factors of the same, so as to gain a
robust understanding of the key elements from which
the sacrosanct values flow. This in fact, is the prime
objective of the purported research study.
INTRODUCTION TO THE STUDY
Before beginning with the process of scouting the
various factors of workplace spirituality, it becomes
essential to throw valuable light on keywords like
‘Workplace Spirituality’ and ‘Jesuit’.
?Workplace Spirituality
Spirituality at the workplace should not be confused
with religious spirituality as the two concepts are
different from each other. Workplace Spirituality is a
‘framework of organizational values evidenced in the
culture that promotes employees’ experience of
transcendence through the work process, facilitating
their sense of being connected to others in a way that
provides a feeling of completeness and joy’. In simple
words, workplace spirituality can be defined as having a
sense of connection between one-self and the
workplace, thereby, helping the employees be more
engaged in their work.
?Jesuit
The term ‘Jesuit’ is used to address the religious priest of
the ‘Society of Jesus’ (S.J.), the largest religious order of
the Catholic Church. It was founded by St. Ignatius of
Loyola, one of the most hallowed and revered religious
figureheads in the Roman Catholic Church. Although
the Society of Jesus was founded in August of 1534, it
was not officially established until 1540, when Pope
Paul III passed it as a religious order. Since its inception,
Jesuits all around the world have been a force to reckon
with, especially in the field of education but they
actually undertake all forms of work in any part of the
world. Jesuit education came to India through St.
Francis Xavier, a fellow companion of St. Ignatius, who
came to India as a missionary and established the first
Jesuit institution in Goa, in the year 1542. There are
seven values of the Jesuit education which are cura
personalis (care for the individual), unity of heart, mind
and soul, magis (More), finding God in all things, ad
majorem dei gloriam (for the greater glory of God),
forming and educating agents of change and the last but
not the least, creating men and women for others. All
the Jesuit values are rooted in the Ignatian spirit and
flawlessly practiced in Jesuit institutions.
REVIEW OF LITERATURE
There hardly exists any literature that emphasizes on a
proper examination and analysis of the factors that
influence workplace spirituality. Furthermore, it is
gruelling to come across any research study which
blends the keywords of ‘Workplace Spirituality’ and
‘Jesuit’. As a result, conducting such a study is a
gargantuan challenge for any researcher. Truth to be
told, the elements of workplace spirituality in any

Exploring the Determinants of Workplace Spirituality among Teachers at Jesuit SchoolsBEYOND
YOUTHINK l 2022 l Vol. XVI 170
institution can be applied to Jesuit schools because the
factors are nearly identical. To this end, it is instrumental
to conduct a robust survey of literature to determine the
various aspects of workplace spirituality.
Spiritual leadership is a type of leadership that uses
values and a sense of calling for motivating followers
(Northouse, 2016). The development of such
leadership depends on various sources and the factors
like spiritual meanings and programmes, past
experiences, family influence, beliefs and life at
institution (Banke et al., 2012). An organizational
culture based on the values of altruistic love, inner life of
employees and spiritual practices are of great help to
the employees to make them aware and conscious (Fry
& Nisieiwcz, 2013).
A study done by Misbah et al. (2016) revealed that there
existed a positive relationship between workplace
spirituality and job satisfaction. Similarly, Yusof (2011)
found that certain dimensions of spiritual leadership
like altruistic love, hope/faith, vision, meaning and
membership were associated with job satisfaction.
Gupta et al. (2013), Hassan et al. (2016) and Mahipalan
(2018), found a positive relationship amongst the
dimensions of workplace spirituality and job
satisfaction. As Swanepoel (2015) and Pio (2017), in
their study explored the positive roles of workplace
spirituality on job satisfaction. Panes et al. (2017) found
that spiritual leadership and school culture were key
drivers of job satisfaction among the school teachers.
Furthermore, Musta’in et al. (2014), in their study,
revealed that implementing a model of spiritual
leadership enhances the motivation of employees and
increases their satisfaction which leads to improved
work performance.
The benefits of spiritual leadership go beyond job
satisfaction, as it is knitted with high worker
commitment (Ahiauzu, 2009). Spiritual leadership is
also said to decrease job stress (Yaghoubi et al., 2010).
In a study done by Karadag (2009), it was also observed
that the behaviour of school administrators who were
oriented towards peace and performance enabled the
teachers to perceive the administrative efforts in a
positive manner. Dayler and Fry (2012), further opined
that spiritual leadership is impeccable in Catholic
schools and is used to preserve Catholic values and the
vision of service and as a result, improves the overall
level of employee engagement (Devendhiran and
Wesley, 2017).
DATA AND METHODOLOGY
Simple random technique has been used where
questionnaires were mailed to various teachers of Jesuit
schools. The questionnaire is a small one, where the
concept of responses has been measured by a 5-Point
Likert scale, where (1= Strongly Disagree, 2= Disagree,
3= Neutral, 4= Agree and 5= Strongly Agree). The
responses of 114 teachers of Jesuit schools have been
collected which has been meticulously put into
processing by the use of IBM’s SPSS version 23.
ANALYSIS AND PRESENTATION OF DATA
Since the current research study is attempted at finding
the most dominant factors of workplace spirituality, it is
ineluctable to conduct an Exploratory Factor Analysis to
prune out the most dominant factors. But, before that, it
is important to conduct a KMO Bartlett’s Test of
Sphericity to check for the adequacy of the sample
which would hint whether it would be worthwhile to go
for a Factor Analysis.
Kaiser-Meyer-Olkin Measure of
Sampling Adequacy 0.789
Bartlett’s Test of Sphericity Approx.
Chi-Square 810.456
df 31
Sig. .000
Table 1: KMO and Bartlett’s Test of Sphericity
(Source: Primary Data)

BEYONDExploring the Determinants of Workplace Spirituality among Teachers at Jesuit Schools
YOUTHINK l 2022 l Vol. XVI171
Component
Initial Eigenvalues Extraction Sums of Squared Loadings
TotalPercentage of variance
Cumulative Percentage
Total
Percentage of variance
Cumulative Percentage
1 4.214 46.820 46.820
3.105 34.500
34.500
2 1.100 12.220 59.040 2.319 25.766 60.026
3 0.876 9.733 68.733
4 0.749 8.322 77.095
5 0.610 6.777 83.872
6 0.531 5.900 89.772
7 0.407 4.522 94.324
8 0.321 3.566 97.890
9 0.192 2.110 100.00
Table 2: Factor Analysis (Total Variance Explained)
(Source: Primary Data)
Table 2 shows us the Factor Analysis conducted
obtaining a TVE (Total Variance Explained). According
to the TVE, results highlight the number of factors
obtained with the condition that their Eigenvalues are
greater than 1 (Eigenvalue > 1). It is proved by the
Component 1 and Component 2 accounting for and of
the total variance explained respectively. Principal
Component Analysis helped to extract the variables
according to the requisite of the Eigenvalues are greater
than 1 (Eigenvalue > 1).
Rotated Component Matrixa
Component
1 2
Altruistic Love 0.728 0.156
Faith 0.749 0.178
Vision 0.547 0.319
Calling 0.595 0.371
Meaning 0.497 0.492
Membership 0.593 0.47
Organizational Commitment 0.272 0.735
Productivity 0.432 0.618
Spiritual Leadership 0.816 0.168
Table 3: Rotated Component Matrix
(Source: Primary Data)
Extraction Method: Principal Component Analysis
Rotation Method: Varimax with Kaiser Normalization
a. Rotation Converged in three Iterations.
Table 3 shows the Rotated Component Matrix,
according to which the variables would get
accommodated in the factor loadings, thereby showing
the final results. The component may be arranged in the
following manner:
Component I Component II
Altruistic Love Membership
Faith Organizational Commitment
Vision Productivity
Calling Spiritual Leadership
Meaning
Table 4: Arrangements of Components
The nine variables are disintegrated into two factors,
which have been renamed as Component I and
Component II, where Component I can be renamed as
Individual Factors and Component II can be renamed
as Organizational Factors.
There was an aggregate of nine factors explored, which
are altruistic love, faith, vision, calling, meaning,
membersh ip , organ iza t iona l commitment ,
productivity, and spiritual leadership.
FINDINGS AND DISCUSSIONS
The aim of the study was to probe into the various
factors of workplace spirituality in the selected Jesuit

Exploring the Determinants of Workplace Spirituality among Teachers at Jesuit SchoolsBEYOND
YOUTHINK l 2022 l Vol. XVI 172
schools of Kolkata. The findings reveal a total of nine
factors which determine workplace spirituality, viz.
altruistic love, faith, vision, calling, meaning,
membersh ip , organ iza t iona l commitment ,
productivity, and spiritual leadership. All the nine
factors are pivotal antecedents of workplace spirituality
with altruistic love, being perched as the most powerful
component. The nine factors which have been
obtained have been divided into two segments, viz.
Individual Factors and Organizational Factors. The
rationale behind this division lies in the component’s
belongingness to each of those categories. It can be
safely asserted that altruistic love, faith, vision, calling
and meaning, all stem mostly from within an individual,
whereas the organizational factors like organizational
commitment, productivity and spiritual leadership are
actually forces of an individual’s interaction with the
organization.
CONCLUSION
The current research study was a pioneering effort
towards examining the relationship between workplace
spirituality and job satisfaction. Albeit, research in the
present issue is not a new one, but the uniqueness of the
present research endeavour exists in the study being
conducted in metropolitan Kolkata, where previous
researches in this domain have never been conducted.
The study takes into consideration only a few selected
schools of Kolkata, whose teachers were surveyed by
the author. But, in the long haul, the study can also be
extended to include employees of any organization or
even professionals of any body. It is noteworthy to
mention that the various factors of workplace
spirituality have universal applicability which further
makes the topic an exciting area of research.
REFERENCES
1. Ahiauzu, A. (2009). Altruistic Love Culture and Workers’
Commitment in the Nigerian Manufacturing Industry: A
Study in Workplace Spirituality. Retrieved from How do
organizational culture and organizational learning capacity
jointly affect it? Journal of Industrial Engineering and
Management, Vol. 1, No. 2.
2. Banke, S., Maldonado, N., and Lacey, C. H. (2012). Christian
School Leaders and Spirituality. Journal of Research on
Christian Education, Vol. 21, No. 3, pp. 235-264.
3. Dayler, L. T., and Fry, L. W. (2012). Impact of Spiritual
Leadership on Catholic Organizational Identity. Academy of
Management Proceedings, Vol. 1.
4. Devendhiran, S., and Wesley, J. (2017). Spirituality at work:
Enhancing levels of employee engagement. Development
and Learning Organization, Vol. 31, No. 5.
5. Fry, L. W., and Nisiewicz, M. S. (2013). Maximizing the triple
bottom line through spiritual leadership. Stanford, CA:
Stanford Business Books, an imprint Stanford University
Press.
6. Gupta, M., Kumar, V., and Singh, M. (2013). Creating
Satisfied Employees Through Workplace Spirituality: A Study
of the Private Insurance Sector in Punjab (India). Journal of
Business Ethics, Vol. 122, No. 1, pp. 79-88.
7. Hassan, M., and Ali Bin, A. (2016). Impact of Workplace
spirituality on job satisfaction: Mediating Effect of true.
Cogent Business and Management.
8. Karadag, E. (2009). Spiritual Leadership and Organizational
Culture: A Case Study of Structural Equation Modelling.
Educational Sciences: Theory and Practice, Vol. 9.
9. Mahipalan, S. S. (2018). Mediating Effect of Engagement on
Workplace Spirituality - Job Involvement Relationship: A
Study among Generation Y Professionals.
10. Misbah, H., Nadeem, A., and Akhter, A. (2016). Impact of
Workplace Spirituality on Job satisfaction: Mediating Effect of
Trust. Cogent Business and Management, Vol. 3, Edition 1.
11. Musta'in, M., Sanusi, A., and Manan, A. (2014). A Study on
Employees Performance: Spiritual Leadership and Work
Motivation with Mediation Work Satisfaction at the
University of DarulUlum, Indonesia. European Journal of
Business and Management, Vol. 6, No. 39.
12. Northouse, P. G. (2016). Leadership: Theory and Practice.
California: Sage Publication.
13. Panes, R. T., Gempes, G. P., &Genuba, R. L. (2017). A causal
model on job satisfaction among the teachers force of
selected private schools in Region XI. International Journal of
Scientific and Technology Research, Vol. 6, No. 9.
14. Pio, R. J., & Tampi, J. R. (2018). The influence of spiritual
leadership on quality of work life, job satisfaction and
organizational citizenship behaviour. International Journal of
Law and Management, Vol. 60, No. 2, pp. 757-767.
15. Swanepoel, H. (2015). The relationship between workplace
spirituality and work-related attitudes.
16. Yaghoubi, N., Moloudi, J., & Banihashemi, S. (2010). The
Relationship between Spirituality Leadership and
Empowerment: A Case Study. American Journal of Scientific
Research, Vol. 10, No.
17. Yusof, J. M. (2011). Spiritual Leadership and Job Satisfaction:
A Proposed Conceptual Framework. Information
Management and Business Review, Vol. 2, No. 6.

ASCENT
YOUTHINK l 2022 l Vol. XVI173
An Exploration of the Copious Factors Affecting Investment Decisions among Indian Individual InvestorsProf. Joyita BanerjiAssistant ProfessorDepartment of Commerce (Morning)
Tanay GoelDepartment of Commerce (Morning)
ABSTRACT
This paper gives the reader an idea about the various types of individual
investors and the various traits of behavioural theory in finance. Behavioural
Favourable
economic policies
augmented by
increasing
investments in the
public and private
sector have
transformed the
economy.

An Exploration of the Copious Factors Affecting Investment DecisionsASCENT
YOUTHINK l 2022 l Vol. XVI 174
finance talks about the theories that take into account
an investor to be an emotional being rather than a
rational one. Retail investors exhibit various
characteristics such as risk capabilities, capacities, and
much more. It is important to understand their
psychological, emotional and financial needs and
provide them with personalized portfolios to maximize
the investor’s utility.
KEYWORDS: Behavioural Finance, Individual
Investors, Behavioural Biases, Investment Behaviour.
INTRODUCTION
India is one of the world’s fastest-growing economies.
Favourable economic policies augmented by increasing
investments in the public and private sector have
transformed the economy. This has led to an increase in
the average income of the residents, which translates to
greater disposable income and savings. Domestic
saving in India contributes substantially towards the
growth of the economy (Nayak, 2019). The savings are
invested in various types of financial assets available and
there has been an increase in the total amount of
investments made within the country. The Indian
markets have experienced innovation, transparency,
coordination, and international integration. This has
had a direct impact on the market in terms of the greater
participation of individual investors. An investor is a
person who selects a mode of allocating their money to
earn a certain rate of return over time.
The process of investment involves allocating sums of
money to assets with the expectation of building returns
over time. Investors undertake the activity of investing
to ensure that they grow their investment amount and
make full use of the power of compounding. Investors
come from all walks of life. They sacrifice today’s
consumption to enjoy returns in the future. The main
criteria for investment are the surety of return, the risk
involved, the knowledge of investment products and
the liquidity of investments. Investors keep these
criteria in mind because of their desire to maximize
wealth. (Schweser Notes, 2020)
Investors choose the investment alternatives that
provide them with psychological satisfaction rather
than those that maximize their economic benefits.
Psychological factors cause an investor to behave
irrationally. These factors cause them to invest in
financial products based on their emotions, passions,
enthusiasm and inclinations.
LITERATURE REVIEW
Hersh Shefrin (Shefrin, 1994) concluded that
behavioural biases are cognitive errors and are caused
by noise traders. The article also incorporates the effects
of noise investors on the price efficiency in the capital
market.
According to Kabra, et al., (Kabra, 2010), the investing
behaviour of an individual is dependent on a number of
factors, such as age and gender. The paper concluded
that demographics are no longer a suitable explanation
for the differences in the behaviour of investors.
National Council of Applied Economic Research
(Maynes, 1963), noticed that irrespective of the
occupation, educational level and age, households in
each group felt that saving for the future was desirable.
Also, Dr. Subhadeep Chakraborty, in his paper
(Chakraborty, 2017), had researched and concluded
that there was, indeed, a correlation between the
income of a household and investments undertaken by
a household, based on the risk and return involved.
Tsuji (Tsuji, 2006) realized that traders made trading
decisions based on both cognitive and emotional
reasons. Trading brings pride when decisions made are
profitable, but it brings regret when they are not.
Investors try not to suffer losses to avoid the pain of
regret.
The paper aims to identify the key factors that are
considered by individuals before taking a particular
investment decision. The paper tries to conduct an
analysis of whether the risk appetite of an individual
varies as per one’s income level. This has been done by
identifying the individuals who invest in different asset
classes, ranging from those carrying low to high risk, and
comparing the proportion of such individuals across
different income levels.
RESEARCH GAP
The topic for this study was chosen considering the
absence of research on the behaviour of Indian

ASCENTAn Exploration of the Copious Factors Affecting Investment Decisions
YOUTHINK l 2022 l Vol. XVI175
investors, based on the various biases listed in the
conceptual framework, taking into account the
difference in their income levels, occupation, gender
and investment horizon. For this purpose, the study has,
through a literature survey, first identified the biases that
influence decisions among individual investors. Further,
to prove that these biases truly influence the decisions
of individual investors, a quantitative approach was
taken. Based on these quantitative results, the real
behaviour of Indian investors can be explained. This
will lead to a reduction in the noise that exists in a
developing financial market such as India, and may
reduce the probability of the occurrence of asset price
bubbles. A clearer understanding of the heretofore
ignored individual investors will also improve the
strength of the Indian stock markets.
OBJECTIVES OF THE STUDY
The paper was undertaken with the aim of attaining the
following objectives:
?To study investment and wealth management as
psychological functions concerning the impact of
specific biases listed in the conceptual framework.
?To study how individuals arrive at financial
decisions, and how such decisions are influenced by
demographic traits.
RESEARCH METHODOLOGY
The paper utilized a survey as a primary research
method to examine the behaviour of Indian investors.
The sample size of the survey is 71. A questionnaire
consisting of ten elements was created. Each of these
elements was presented in the form of a statement,
wherein statements one and two were in reference to
the demographic profile, that is, the occupation,
income and gender of the respondents, and statements
three to six were in reference to the motives and
preferred forms of investment. The rest of the
statements were aimed at confirming the presence and
impact of selected biases in investment behaviour.
These statements, based on the identification of the
main features of the biases of loss aversion,
overconfidence and herding, have been developed
and discovered through a literature survey. The
information sought from respondents was related to the
respondents’ gender, income level, occupation,
preferred mode of investment, income level, and other
factors influencing the respondents’ investing decisions.
The results of the survey were observed and analyzed so
that an understanding of investment choices across
various levels of risk and loss aversion could be
developed. This is aimed at assessing whether the most
popular investment choices are the same or varied
across different investor biases. Similarly, the reasons for
choosing a particular investment avenue are studied
and the most popular reasons are determined across
different income levels.
CONCEPTUAL FRAMEWORK
Investors are the backbone of the capital market since
they not only determine the level of activity in the
securities market but also in the economy. Unlike
institutional investors, who possess greater knowledge,
retail investors do not possess such financial
capabilities. There are universally observed investing
biases leading to poor decisions by such investors.
These include, but are not limited to (Ricciardi, 2014)
(Schwese Notes, 2020):
1. Regret Theory
Investors become emotionally affected by the price at
which they purchased the stock and avoid selling it as a
way to avoid the regret of having made a bad
investment and so that they don’t have to report a loss.
Regret theory can also hold for investors who discover
that a stock they had considered buying but had not,
has gone up in value. (Quiggin, 1994)
2. Risk Aversion Theory
A risk-averse investor is an investor who chooses the
preservation of capital over the potential for a higher-
than-average return. Such an investment demands a
risk premium for taking greater risks. (Schmidt, 2005)
3. Over/Under Reacting Theory
Investors get extremely optimistic if the market swings
upwards and extremely pessimistic in case the market
swings downwards. (Callegaro, 2017)
4. Theory of Overconfidence
It refers to an average investor’s ability to overestimate
and overvalue his/her knowledge as compared to

An Exploration of the Copious Factors Affecting Investment DecisionsASCENT
YOUTHINK l 2022 l Vol. XVI 176
others. Overconfidence leads to excess trades, excess
trading costs, and denting profits. (Kent, 2004)
5. Loss Aversion
This theory tells us that an investor prefers losing profit
over incurring a loss. This theory explains that people
experience a different degree of emotion towards gains
as compared to the emotion they experience towards
losses. Such investors are called loss-averse investors.
(Schmidt, 2005)
6. Bandwagon/Herding Bias
It implies that investing is primarily based on
groupthink, maybe because there already exists a large
number of people who are already doing the same
thing. (Lin, 2007)
7. Neglect of Probability
Investors only focus on the outcome and not on the
probability of occurrence. This is especially true in the
case of equity in India. Investors overestimate the loss,
given that a default has occurred, but do not take into
calculation the probability of such an event taking place
and therefore wrongly estimate the expected loss.
(Sunstein, 2002)
8. Anchoring Bias
Anchoring bias is the tendency of an individual to rely
too heavily on, or anchor to, a past reference or a piece
of information while making a decision. This is also true
for investors fearing equity investments as they are
anchored to the thought that equity has uncalculated
risks involved with it. (Bunn, 1975)
DATA AND ANALYSIS
The survey undertaken had received 71 responses in
total. An in-depth analysis of the behaviour of an Indian
investor based on various factors has been stated
below:
1. Occupation and Income:
On comparing the sample outcomes, it is found out that
students prefer a form of equity investment. On
considering self-employed and working professionals, it
is found that they just have a fixed income or a
combination of fixed income and equity. These types of
investors prefer the diversification of their portfolios
through various asset classes.
Figure 1: What is the Income ( ) of the Respondents? (Source: Primary Data)
`
A majority (54.9 per cent) of the respondents were
students, 29.6 percent were professionals and the
remaining were self-employed. In this survey, a majority
of the respondents had an income below `250,000
and 24 per cent of the respondents had an income
ranging from ̀ 250,000 to ̀ 500,000.
Figure 2: What is the Occupation of the Respondents?
(Source: Primary Data)
2. Gender:
56 per cent of the respondents, that is, 40 respondents
were male whereas 44 per cent of the respondents, that
is, 31 respondents were female. A further study based
on gender is concluded under various headings.
Figure 3: What is the Gender of the Respondents?
(Source: Primary Data)
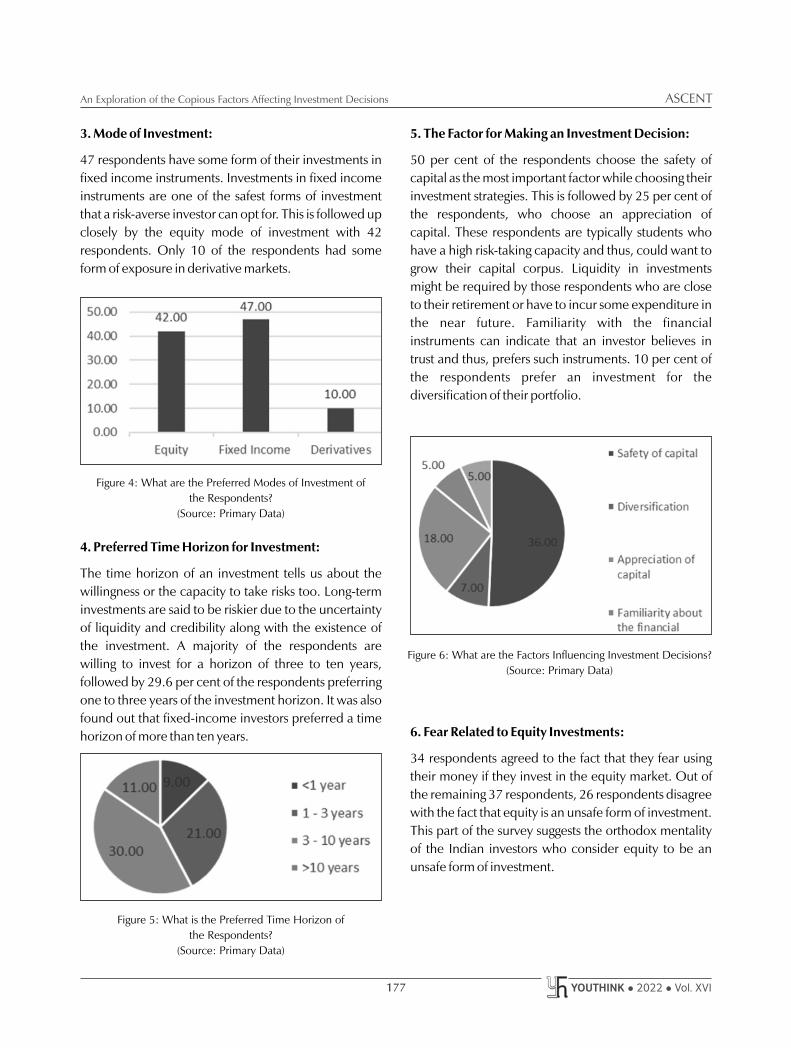
ASCENTAn Exploration of the Copious Factors Affecting Investment Decisions
YOUTHINK l 2022 l Vol. XVI177
3. Mode of Investment:
47 respondents have some form of their investments in
fixed income instruments. Investments in fixed income
instruments are one of the safest forms of investment
that a risk-averse investor can opt for. This is followed up
closely by the equity mode of investment with 42
respondents. Only 10 of the respondents had some
form of exposure in derivative markets.
Figure 4: What are the Preferred Modes of Investment of
the Respondents?
(Source: Primary Data)
4. Preferred Time Horizon for Investment:
The time horizon of an investment tells us about the
willingness or the capacity to take risks too. Long-term
investments are said to be riskier due to the uncertainty
of liquidity and credibility along with the existence of
the investment. A majority of the respondents are
willing to invest for a horizon of three to ten years,
followed by 29.6 per cent of the respondents preferring
one to three years of the investment horizon. It was also
found out that fixed-income investors preferred a time
horizon of more than ten years.
Figure 5: What is the Preferred Time Horizon of
the Respondents?
(Source: Primary Data)
5. The Factor for Making an Investment Decision:
50 per cent of the respondents choose the safety of
capital as the most important factor while choosing their
investment strategies. This is followed by 25 per cent of
the respondents, who choose an appreciation of
capital. These respondents are typically students who
have a high risk-taking capacity and thus, could want to
grow their capital corpus. Liquidity in investments
might be required by those respondents who are close
to their retirement or have to incur some expenditure in
the near future. Familiarity with the financial
instruments can indicate that an investor believes in
trust and thus, prefers such instruments. 10 per cent of
the respondents prefer an investment for the
diversification of their portfolio.
Figure 6: What are the Factors Influencing Investment Decisions?
(Source: Primary Data)
6. Fear Related to Equity Investments:
34 respondents agreed to the fact that they fear using
their money if they invest in the equity market. Out of
the remaining 37 respondents, 26 respondents disagree
with the fact that equity is an unsafe form of investment.
This part of the survey suggests the orthodox mentality
of the Indian investors who consider equity to be an
unsafe form of investment.

An Exploration of the Copious Factors Affecting Investment DecisionsASCENT
YOUTHINK l 2022 l Vol. XVI 178
Figure 7: Do the Respondents Have a Fear of
Losing Money in Equity?
(Source: Primary Data)
7. Loss Aversion:
65 per cent of the respondents show forms of loss
aversion. This is a very prominent trait of any investor.
Only a small portion (21 per cent) of the sample shows
that they are not averse to loss. It is found that women
are more loss averse than men since 22 female
respondents out of 31 agree that they are loss averse
whereas only 24 out of 40 male respondents agree that
they are loss averse. 13 per cent of the respondents,
who have opted for the ‘No comments’ option, are loss
neutral investors.
Figure 8: I Prefer Losing Profit over Incurring a Loss
(Source: Primary Data)
8. Herding Behaviour:
80 per cent of the respondents agree that they are not a
part of herding while making financial decisions. The
remaining 20 per cent agree to some form of herding
behaviour exhibited by them.
Figure 9: I Rely on My Own Judgement Even
When Others Do Not Agree
(Source: Primary Data)
9. Overconfidence Bias:
Indian investors exhibit the theory of overconfidence.
This can be concluded as 79 per cent of the
respondents agreed to rely on their judgment even
when others do not agree with it. This bias is like a
double-edged sword. This is because relying on one’s
judgment is good only to a certain extent. If the investor
displays signs of overconfidence, it is detrimental for the
investment strategies as this increases the possibility of
incorrect estimations, models, assumptions, or
valuations. A very small part of the sample does not
exhibit this trait.
Figure 10: I Rely on My Own Judgement Even
When Others Do Not Agree with It
(Source: Primary Data)
CONCLUSION
From the data collected through the survey, it is
observed that the most important factor that is
considered by individuals before arriving at investment
decisions is the safety of capital. This could be justified

ASCENTAn Exploration of the Copious Factors Affecting Investment Decisions
YOUTHINK l 2022 l Vol. XVI179
by the large number of risk-averse investors in India.
This has also resulted in fixed deposits being the most
popular form of investment in India. Most respondents
prefer an investment horizon of three to ten years,
which can also be supported by the fact that the most
popular form of investment is fixed deposits, which are
comparatively longer-term investment options.
Fixed income is a popular choice among investors from
all income groups. Investors with low income (less than
`250,000) invest in bonds to ensure the safety of
capital, while investors with higher income see it as a tax
saving option. The second most popular form of
investment is the one made through equity, which is in
line with the macroeconomic trend wherein the
number of retail individual investors is increasing. This
is a surprising fact as Indians are averse to losses and
risks. They also consider equity to be an unsafe form of
investment.
The investors are not impacted by the investment
decisions made by others; therefore, they do not
exhibit herding bias. But they tend to make decisions
without taking into account the analysis of others. Thus,
they exhibit an overconfidence bias. This can lead to
unforeseen losses in the future.
RECOMMENDATIONS
A few recommendations based on the above study are
listed below:
Investors who have exhibited herding bias should avoid
it and understand what they are investing in instead of
following someone blindly. This is extremely
detrimental to one's financial planning as it results in a
buy trap for the individuals.
Indian investors tend to exhibit overconfidence bias.
They should keep in mind that there is a probability that
their analysis may not be accurate at all points in time. It
is also necessary to maintain a thin line between
overconfidence and herding.
Indian investors also need to change their mindset
regarding equity investments. When equity investments
are undertaken with full research and analysis, there is a
very small margin for error. They should not exhibit
anchoring bias and should not neglect the probability of
an adverse event taking place.
As discussed above, a large segment of Indian investors
have very little financial knowledge and understanding
of financial instruments. Understanding finance is as
basic and necessary as understanding other subjects.
Thus, the government should take up the initiative and
build a basis of finance for every student from the school
level. It is crucial to have financial literacy in today's time
to grow one’s savings exponentially.
Every individual investor has different capacities and
capabilities of taking risks and thus, cannot be classified
into one category. Thus, all investors cannot opt for the
same form of investment and therefore should have a
personalized mode of investment.
SCOPE FOR FUTURE RESEARCH
There is a huge scope for future research since there are
only a limited number of researches that have been
conducted on this topic. Future research can be
conducted on the other biases listed in the paper which
are not covered till now due to the limited time frame
for its preparation.
As the population of India is growing, more and more
percentage of the population is becoming financially
aware. Therefore, it is becoming extremely crucial to
analyze the behaviour of an Indian investor to predict
the movements and gain an upper hand in the
investment journey.
REFERENCES
1. Bunn (1975). Anchoring Bias in the Assessment of Subjective
Probability. Operational Research Quarterly, 449-454.
2. Callegaro, G. S. (2017). Optimal investment in markets with
over and under-reaction to information. Mathematics and
Financial Economics, 299–322.
3. Chakraborty, D. S. (2017). Investment Behaviour of Urban
Population – a Case Study of Households in Tinsukia Town.
Indian Journal of Applied Research, 342-344.
4. Kabra, G. (2010). Decision of Generations in India: An
Econometric Study. India: Asian Journal of Management
Research.

An Exploration of the Copious Factors Affecting Investment DecisionsASCENT
YOUTHINK l 2022 l Vol. XVI 180
5. Kent, D. D. (2004). A Theory of Overconfidence, Self-
Attribution, and Security Market Under- and Over-
Reactions. Munich, Germany: University Library of Munich.
6. Lin, H.-W. (2007). How Herding Bias Could be Derived from
Individual Investor Types and Risk Tolerance? International
Journal of Economics and Management Engineering, 1395-
1401.
7. Maynes, E. S. (1963). Urban savings survey. Journal of the
American Statistical Association, 569-572.
8. Nayak, S. (2019). Stochastic differential equations with
imprecisely defined parameters in the market. A Fusion of
Foundations, Methodologies and Applications, 7715-7724.
9. Quiggin (1994). Regret theory with general choice sets. Risk
Uncertainty, 153–165.
10. Ricciardi, H. K. (2014). How Biases Affect Investor
Behaviour. The European Financial Review, 7-10.
11. Roley, B. M. (2001). Aspects of Investor Behaviour Under
Risk. Arrow and the Ascent of Modern Economic Theory,
626-653.
12. Sar, G. A. (1990). Individual expectations, risk perception
and preferences in relation to investment decision making.
Journal of Economic Psychology, Volume 11, Issue 2, 227-
245.
13. Schmidt, U. (2005). What is Loss Aversion? Journal of Risk
and Uncertainty, 157-167.
14. Schwese Notes (2020). 2021 Level III CFA Book3: Portfolio
Management. United States of America: Kalpan, Inc.
15. Schweser Notes (2020). Level 1: Book 5: Portfolio
management. United States of America: Kaplan, Inc.
16. Shefrin, M. S. (1994, September). Behavioural Capital Asset
Pricing Theory. Journal of Financial and Quantitative
Analysis, pp. 323-349.
17. Sunstein, C. R. (2002). Probability Neglect: Emotions, Worst
Cases, and Law. The Yale Law Journal, 61-107.
18. Thaler, R. et al. (2001). Anomalies: Risk Aversion. JOURNAL
OF ECONOMIC PERSPECTIVES, 219-232.
19. Tsuji, C. (2006). Does investors’ sentiment predict stock
price changes? Applied Financial Economics Letters, 353-
359.

ASCENT
YOUTHINK l 2022 l Vol. XVI181
Growth Prospects of Electric Vehicles in IndiaProf. Sourav DasAssistant ProfessorDepartment of Commerce (Evening)
Jahnvi BayanwalaDepartment of Commerce (Evening)
There is a need to
understand
electric vehicles
and factors that
would increase
their adoption, all
of which are
necessary for the
long haul in our
fight for the
environment.
ABSTRACT
Automobiles have been there for quite some time. The impact of gasoline
vehicles on the environment such as harmful emissions, fewer fossil fuels and
pollution is well-known. We have an alternative in the form of electric cars
but the electric vehicles (EVs) market, even with its advantages, has not been
able to disrupt the automobile sector. Consumer preference for these has
been absent. There is a need to understand electric vehicles and factors that
would increase their adoption, all of which are necessary for the long haul in
our fight for the environment. Thus, it is necessary to understand the growth
prospects of EVs in India and how they will impact the Indian automobile
industry in the upcoming years. This study mainly focuses on electric four-
wheelers like cars and light commercial vehicles. It also looks into the

Growth Prospects of Electric Vehicles in IndiaASCENT
YOUTHINK l 2022 l Vol. XVI 182
measures taken by the Government of India to help
facilitate the EV sector and things that are yet to be
done. The study uses secondary data for analysis and
findings. The findings show that the Indian market has a
long way to go in the complete adoption of EVs.
Through this research, the growth prospects of electric
vehicles are inferred.
KEYWORDS: Electric Vehicles, Automobile, Gasoline,
Emission, Pollution, Growth, Initiatives, Manufacturing,
Future.
INTRODUCTION
India's automobile industry is the fourth largest on the
planet and records for 49 percent of the nation's
complete manufacturing yield and today’s quick
economic advancement. This in turn is causing an
increase in the consumer class and the formulation of
supportive regulations and policies, both of which
imply an increase in demand for vehicles. Thus, the
urban traffic blockage and the air quality get influenced
in the all-significant metropolitan urban areas and
towns. In India, the vehicle sector had contributed
around 18 per cent of carbon discharge. The Indian
government is attempting to move to electric fuel-based
vehicle innovation as these vehicles can significantly
decrease harmful polluting gases and emissions in the
transportation sector. Despite a growing automobile
sector and the need for electric vehicles, the Indian
electric vehicle industry has not covered itself in
greatness, as there is low awareness among the masses,
a few unseen and non-advertised product launches,
and policies that are not steady at all.
Electric vehicles (EVs) are defined as vehicles that use
electric motors for propulsion. They might be battery-
operated or electricity-driven, which can be done
through transmission wires. The first electric car was
introduced in the German market in the 1880s and
since then, the technologies used in EVs have evolved
immensely. Tesla, in 2008, was the first company to
produce an entirely electric car, Tesla Roadster, which
could meet the consumer’s needs. Kyoto electric
scooters have been in the markets for a very long time
now. Different Indian companies like Mahindra and
Tata have also introduced their own electric cars into
the Indian market and have been performing quite well.
NATURE OF THE PROBLEM
The Indian government is attempting to move to
electric fuel-based vehicle innovation. EVs are the most
efficient way to have the benefit of sustainable power
sources, other than power sources like wind and solar
energy, that would be squandered or wasted
unnecessarily. Internal combustion motor vehicles have
technologies that are not only proven but accepted by
the public, along with solid infrastructure, worldwide
distribution chains, and already set government policies
and standards. EVs regularly require drastic changes,
not only in technology, but also in political guidelines,
taxes and value systems, and the conduct of consumers
which explains why the numbers of EV vehicles keep on
being somewhat disappointing in comparison with
gasoline vehicles. The major drawbacks are premium
cost, limited range and recharging time of EVs in
contrast to regular vehicles. It is well-established that
even with many advantages over regular vehicles, EVs
are unable to gather sales. Hence, this study is being
conducted to determine the growth prospects of
electric vehicles in India. There does not exist a study
that determines this growth in the Indian scenario using
the existing sales figures. The research findings would
enable changes that would make a positive difference
to individuals, groups, organizations, and society as a
whole. This study will also help government agencies in
making policies and strategies regarding the adoption in
the sector for EVs.
OBJECTIVES
1. To study the growth prospects of Electric Vehicles
(EVs) in India.
2. To study how the Indian automobile industry is
adapting to the shift towards EVs.
3. To study the measures adopted by the Government
of India to support the growth of EVs.

ASCENTGrowth Prospects of Electric Vehicles in India
YOUTHINK l 2022 l Vol. XVI183
RESEARCH METHODOLOGY
This study uses both quantitative and qualitative
methods of research to analyze the existing data and
findings. The quantitative methods are used to analyze
the financial and other statistical data present in the
study. The qualitative methods are used to analyze the
textual material found in existing literature, such as
research papers, annual reports, relevant articles,
journals, et al. The study is based on secondary data to
determine the existing growth in the sales figures.
Financials have been obtained through company
websites and other financial websites. The premise of
the study is such that primary data collection is not
possible, as it will be very difficult to collect. The
primary source of data, is thus, secondary data obtained
through different companies official websites, existing
journals, research papers and articles, et al.
GOVERNMENT SCHEMES
The Government of India plans to eliminate petrol and
diesel cars by 2030.
1. N a t i o n a l E l e c t r i c
Mobility Mission Plan
(NEMMP), 2020: The
Union Cabinet outlined a
five-staged manufacturing
programme till 2024 for a
couple of enormous,
integrated batteries and
battery-manufacturing
Giga plants, along with
the National Electric
Mobility Mission Plan
2020, in 2013. Under
this, a huge number of
electric vehicles charging
stations were installed in
numerous states, with no tax on building these
stations being charged. It was even decided to use
electric vehicles, in stages, for public transport.
2. Tax Benefits: The Goods and Services Tax (GST)
rates on EVs have been reduced to 5 per cent from
12 per cent. As for the electric chargers and charging
stations, the rates have been reduced to 5 per cent
from 18 per cent.
3. Faster Adoption and Manufacture of (Hybrid and)
Electric Vehicles (FAME): Faster Adoption and
Manufacture of (Hybrid and) Electric Vehicles,
commonly known as FAME, is a scheme that was
launched by the Ministry of Heavy Industries and
Public Enterprises in the year 2015. It aims to
promote the adoption of hybrid and electric
vehicles and to provide an incentive for the
production and purchase of the same. The scheme
consists of two phases – Phase I, which was
launched in the year 2015 and concluded on 31st
March, 2019 and Phase II, which began on 1st April,
2019 is expected to be completed by 31st March,
2022. FAME- II aims for a more comprehensive
growth of this industry, which requires better
infrastructure and manufacturing capabilities. The
FAME scheme aims to boost the sales of hybrid and
electric vehicles by offering incentives on their
purchase, establishing essential charging stations
and addressing fuel security and the matters
regarding environmental pollution.
MARKET PLAYERS
Tata Motors is the leading automobile manufacturer in
India and has played a significant role over the years, in
contributing to economic growth through its
commercial and passenger vehicles that transport
people and goods. Tata plans to win proactively in the
EV sector. It has launched an EV ecosystem, the Tata
UniEVerse, to closely leverage the strengths and
Table 1: FAME India Scheme - Fund Allocation (in INR million)
(Source: bridgetoindia.com)
FAME-I FAME-II
2015-19 2019-20 2020-21 2021-22 Total
Technology Platform 1,900 3,660 0 0 3,660
Demand Incentives 4,950 8,220 45,870 31,870 85,960
Charging Infrastructure 300 3,000 4,000 3,000 10,000
Pilot Projects 700 0 0 0 0
Operations 100 120 130 130 380
Total 7,950 15,000 50,000 35,000 100,000

Growth Prospects of Electric Vehicles in IndiaASCENT
YOUTHINK l 2022 l Vol. XVI 184
knowledge of other Tata Group corporations, making a
viable environment and driving the adoption of EVs in
India. Key components of the ecosystem include
charging solutions, supplier base for EV parts, vehicle
finance and quality service providers.
Mahindra & Mahindra: Amazon India partnered with
Mahindra Electric to fulfil its commitments towards EVs
in the country. Amazon India had announced in 2020
that they plan to include 10,000 electric vehicles in
their delivery fleet by 2025. Tech Mahindra partnered
with Mahindra Logistics in 2019 to introduce a fleet of
300 electric vehicles for employee transportation by
2020. Mahindra Electric partnered with Bhagirathi
Group in Karnataka to facilitate an e-Mobility
Awareness Campaign by the Government of Karnataka.
Tesla Motors has planned to enter India as Tesla India
Motors and Energy Private Limited, bringing in its
electric cars into the Indian market. In the short run,
Tesla’s entry into the country will not change the EV
dynamics as it plans to import CBUs (completely built
units) in its initial stage. This, in turn, will increase the
price of the vehicles because of India’s high import
levies. However, in the long run, Tesla’s entry might
kick-start the next-level innovation of EVs in India. With
the entry of its premium cars, the competition among
the Indian manufacturers will drastically increase and
will force them to diversify into the mass market
segment. The prices of the EVs might have to be slashed
down, which can only be done by cutting battery costs
and local manufacturing rather than imports.
ANALYSIS
Electric Vehicles in the Indian Automobile Industry
Figure 1: Figure Representing the Market Share of
Electric Vehicles in the Indian Market in FY20
(Source: statista.com)
Inference: In Figure 1, it is seen that the share of electric
vehicles (EVs) in the Indian market during the FY20 was
merely 11.42 per cent, which is very less in comparison
to vehicles running on conventional fuels, the share of
which was 88.58 per cent. This shows that the EV
market in India has not advanced much.
Market Scenario of Electric Vehicles in India
Type Sales in FY 19-20
Two-wheelers 152,000
Three-wheelers 90,000
Public four-wheelers 600
Passenger four-wheelers 3,400
Total 246,000
Table 2: Table Representing the Sales of Electric Vehicles
for FY 2019-20
(Source: livemint.com)
Inference: In Table 2, it is seen that the market sales of
electric four-wheelers is 1.63 per cent, comprising both
public and passenger vehicles, which is very less in
comparison to electric two-wheelers and three-
wheelers, which have the majority share of 61.79 per
cent and 36.59 per cent respectively. This shows that
the market for electric four-wheelers is very low and
needs improvement, so that the Government can reach
its goals.
Growth of Electric Vehicles Over the Past Five Years
Figure 2: Figure Representing Sales and Growth of
Electric Vehicles over the Past Five Years
(Source: smev.in)
Inference: Electric vehicles in India have seen
significant growth over the past five years. The
percentage increase in sales has gone up and down over

ASCENTGrowth Prospects of Electric Vehicles in India
YOUTHINK l 2022 l Vol. XVI185
the years, that is, there is inconsistency in the
percentage increase, but the sales figures have always
risen. The average annual growth has been 57.8 per
cent over the past five years. The trend line shows a
linear growth in the percentage increase. This depicts
that the sales of EVs will further grow in the forthcoming
years as shown in Figure 2.
Comparative Study of Electric Two-wheelers and
Four-wheelers in the Indian Market
Figure 3: Figure Showing Comparison Between Electric
Two-Wheelers and Four-Wheelers in the Indian Market
Over the Past Five Years
(Source: smev.in)
Inference: The electric two-wheeler market has seen
significant growth over the years but the four-wheeler
market is still lagging behind and has a long way to go, as
seen in Figure 3.
Market Share of Electric Passenger Vehicle
Players in India
Figure 4: Figure Showing Market Share of Electric Passenger
Vehicle Players in India
(Source: autocarpro.in)
Inference: In Figure 4, the main player in the electric
passenger vehicle market is Tata Motors Ltd., with 71
per cent market share. The MG ZS stands at the second
position and Hyundai Kona at third.
Existing Electric Vehicle Charging Stations (EVCSs)
in India
Figure 5: Figure Showing the Existing Electric Vehicle Charging
Stations (EVCSs) in India
(Source: The Central Electricity Authority under the Ministry of
Power of the GOI)
Inference: Charging infrastructure is minuscule in
various states across the country, with Andhra Pradesh
and Telangana leading, as shown in Figure 5.
Comparison between India and the United States
of America
Figure 6: Figure Showing Comparison between Sale of Electric
Cars Over Five Years in India and USA
(Source: smev.in, wikipedia.org)
Inference: India is lagging behind in the electric vehicle
market when compared to other big economies like the
United States of America (USA). Sales of EVs in India
and the USA are very different, with India having very
low sales as compared to the USA on a per year basis, as
seen in Figure 6.

Growth Prospects of Electric Vehicles in IndiaASCENT
YOUTHINK l 2022 l Vol. XVI 186
FINDINGS
1. The existing companies are working more on two-
wheelers and four-wheeler models are less,with
low sales, but at the same time, there are many
plans for the advancement of four-wheelers by
different companies.
2. The number of electric buses running on the Indian
roads is very less. The current sales of electric buses
show that public transport can grow with good
government influence, which will help in the
overall growth of EVs in the country. India is a
country where public means of transport are
preferred over private means, so government
intervention in the public transport sector will help
in the growth of the EV sector.
3. Tata is the main player and there are very few
companies operating in the market. Furthermore,
Tata’s recent model TATA Nexon EV is the only
selling vehicle, which shows that there is a lack of
models to choose from along with the lack of
awareness among the consumers.
4. There is a lack of charging infrastructure in most of
the states and union territories in India, which
hinders the growth of EVs. In rural states, there is no
government initiative. Hence, the charging
infrastructure is backward. Charging facilities are
non-existent, though charging station installations
have recently started because of recent efforts by
entities like Tata Power and National Thermal
Corporation Ltd. (NTPC).
5. The USA has adopted the EV segment, which is now
booming. India, on the other hand, needs to work
on this segment as there should not be a drastic
difference between two big capitalistic economies
that urge to fight against climate change.
6. The benefits offered by the government are not
enough and it needs to scale up infrastructural
development and increase public transport. The
government has given benefits and subsidies to the
consumers, but there are no policies to increase
awareness about these.
7. There are fewer models of passenger vehicles in
India, hence the shift towards EVs has been a slow
process. Due to this, EVs are priced higher, as there
are no better alternatives and there is low
infrastructure. Also, there is no major shift or wave
for real expansion of the EV segment, but
companies like Tata Motors Ltd. are getting ready
with various new models, better technology and
better alternatives. This will lead to a wave of
growth in the segment in the near future, but much
more needs to be done.
RECOMMENDATIONS
The market share of EVs has to increase exponentially in
order for the Government to reach its goals by 2030.
This can be done by:
1. Laying focus on incentives and lowering prices to
attract customers, and building infrastructure for
removal of barriers.
2. Manufacturers need to increase range and reduce
battery charging time. They should focus on
motorcycles, e-rickshaws, buses, and not only on
cars. Advertisements should highlight the green
efficiency of such cars rather than style and design.
3. The Government should concentrate on the
development of charging infrastructure as it will set
up the root for the development of EVs in India.
4. The main focus should be electrifying public
transport like buses, as most of the population in
India prefers to do their day-to-day travelling by
public buses. This will drastically help in reducing
the carbon emissions from these buses.
5. The Government should work on bringing
awareness about EVs among the people. It has given
benefits and subsidies to the people but did not
make them aware of it.
6. The Government may give incentives and benefits
to manufacturers for developing better models and
better technology in the long run.
CONCLUSION
Due to the prevalence of fewer models of passenger
vehicles in India, the shift towards EVs has been a slow

ASCENTGrowth Prospects of Electric Vehicles in India
YOUTHINK l 2022 l Vol. XVI187
process. EVs are priced higher and there are no better
alternatives. The existing companies are working on
two-wheelers more and the four-wheeler models are
less with low sales. However, there are several plans for
the advancement of four-wheelers by many
companies. There is a scarcity of charging infrastructure
in most of the states and union territories in India, which
hinders the expansion of EVs. The Government has
given benefits and subsidies to the consumers but there
are no policies to extend awareness about the same.
The fact that there are very few companies operating in
the market shows that there is a lack of models to
choose from and a lack of awareness among the
shoppers. To tackle these hindrances, the government
ought to focus on the development of charging
infrastructure as it will set up the foundation for the
development of EVs in India. Electrifying public
transport like buses should be the main focus, as most of
the population in India prefers to do their day-to-day
commute by public buses. This will lead to a reduction
in the carbon emissions from these buses. In order to
develop greater models and better technology in the
long run, the Government may give incentives and
benefits to manufacturers. Electrification is the path that
the automobile industry is going to take soon. A slow
transition can be seen but there is still a lot of work to be
done before EVs can actually form a significant part of
the Indian automobile industry.
REFERENCES
1. Annual Reports of Tata group.
2. Kesari, J. P., Sharma, Y., & Goel, C. (2019). Opportunities and
Scope for Electric Vehicles in India. International Journal of
Mechanical Engineering.
3. Kumar, R., Jha, A., Damodaran, A., Bangwal, D., & Dwivedi,
A. (2020). Addressing the Challenges to Electric Vehicle
Adoption via Sharing Economy: An Indian Perspective.
4. National Electric Mobility Mission Plan (NEMMP), 2020,
Faster Adoption and Manufacture of (Hybrid and) Electric
Vehicles (FAME).
5. NITI Aayog & World Energy Council. Zero Emission Vehicles
(ZEVs): Towards a Policy Framework (2018).
6. Press Releases from Mahindra.
7. https://blog.ipleaders.in/future-of-electric-vehicles-in-
india/
8. https://www.autocarpro.in/news-national/electric-bus-
makers-in-india-could-seesales-boom-with-government-
buying-78600
9. https://www.autocarpro.in/news-national/electric-pv-sales-
to-hit-record-high-infy2021--esuvs-lead-the-charge-78374
10. https://www.autocarpro.in/news-national/tata-nexon-ev-
turns-a-year-old--racestowards-3-000-unit-sales-78348
11. https://www.google.com/amp/s/www.livemint.com/
companies/news/electricvehicle-sales-in-india-up-20-in-
2019-20/amp-11587370389230.html
12. https://www.news18.com/news/auto/growth-of-ev-sales-
in-indiaconsistent-since-past-three-years-167041-units-
sold-in-2019-20-3543386.html
13. https://www.smev.in/ev-sales
14. https://www.statista.com/statistics/608392/automobile-
industrydomestic-sales-trends-india/
ASCENT
YOUTHINK l 2022 l Vol. XVI 188
A Study on the EdTech Industry: The Future of Education
Prof. Hanzala AwaisAssistant ProfessorDepartment of Commerce (Evening)
Aarushi SarafDepartment of Commerce (Evening)
The digitization
of learning,
government
support via policy
reforms and the
National
Education Policy
(NEP) 2020 have
optimized the
development of
EdTech in India.
ABSTRACT
Technology has impacted every aspect of human life, including education.
Education is no longer confined to a traditional classroom setup. EdTech
companies offer multiple courses, which are economical and student-
friendly. With high internet penetration and access to smartphone devices,
students are leveraging the tools and content provided by EdTech platforms.
COVID-19 has given the EdTech industry an additional push, which is just a

ASCENTA Study on the EdTech Industry: The Future of Education
YOUTHINK l 2022 l Vol. XVI189
start to the paradigm shift in the way one views learning.
The rapid adoption and penetration of EdTech tools by
schools, teachers, parents and students has cleared the
path for the industry’s enormous growth and
expansion.
KEYWORDS: EdTech, Venture Capitalists, Investments,
Byju’s.
INTRODUCTION
Industry Profile: EdTech Industry
Education includes learning and gaining new skills and
knowledge. Education Technology (EdTech) is the
incorporation of technology and education theory to
encourage learning. It is the combined use of personal
computers, laptops or cell phones, and study material
to support learning and help improve students'
academic performance. EdTech companies are offering
an entire host of applications for students of all age
groups.
Coronavirus, being a pandemic, essentially made
individuals stay inside and practice social distancing.
Most governments around the globe immediately shut
schools and universities to check the spread of the
infection. This influenced a large number of students
across the globe. The more the students and educators
embrace distance and online learning, the better it is for
companies in the EdTech space.
The National Education Policy (NEP), 2020 recognized
the need to use innovation and technology while
acknowledging its challenges. It was set to give a
stimulus to technology in learning, evaluation,
administration and personalization. The current
platforms were upgraded and challenges were
addressed with the aim of providing quality education
to all. Attention was given to the Digital India
Campaign, to prepare and equip teachers to be more
efficient while using the online mode.
With a market size of $2.8 billion in 2020, this industry
is set to grow at a Compound Annual Growth Rate
(CAGR) of 39 per cent and reach $10.4 billion by 2025.
The number of users is expected to grow from 1.6
million in 2016 to 9.6 million by 2021.
Figure 1: The Market Size of the EdTech Sector in India is Expected to Grow at a CAGR of 39 per cent by 2025
(Source: Inc42Plus)

A Study on the EdTech Industry: The Future of EducationASCENT
YOUTHINK l 2022 l Vol. XVI 190
RESEARCH OBJECTIVES
?To identify the different market players in the
EdTech industry.
?To analyze why venture capitalists are investing in
the EdTech industry.
?To examine the EdTech market leader’s financial
statements.
RESEARCH METHODOLOGY
In-depth research was conducted on the information
already available. An attempt was made to evaluate and
analyze the financial performance of the market leader
in the EdTech industry and make a critical evaluation of
the same. This study was based on secondary data
collected from various websites, records, reports and
profiles of the companies.
MARKET PLAYERS IN THE EDTECH INDUSTRY IN
INDIA
The EdTech industry is taking learning in India a step
ahead, and is developing at a fast pace. Figure 2 shows a
few Indian EdTech companies.
Figure 2: Logos of Indian EdTech Companies
1. BYJU’S
Think and Learn Private Ltd., established in 2011 by
Byju Raveendran and Divya Gokulnath, developed
Byju's application. Byju’s, with a valuation of $16.5
billion, is a dominant player in India's developing
EdTech space. The Bengaluru - based firm has support
from venture capitalists like Mary Meeker, Yuri Milner
and investment firms like Black Rock, Silver Lake, Tiger
Global, MC Global EdTech Investment Holdings LP, Tiga
Investments and Baron Capital, to name a few.
Byju's has raised $2.3 billion from investors in over 18
funding rounds. They have, most recently, raised a
funding of $460 million in March 2021 from a Series F
round and $1 billion from new investors like B Capital
Group, Baron Funds and XN. Byju’s recent acquisitions
include Epic, Great Learning and Toppr in June 2021.
Byju’s has plans to expand internationally. Moving
forward, the company plans to launch Byju’s Future
School. Byju’s has the necessary funds for expansion
and investment in the research and development of
new methods of augmented learning, through artificial
intelligence and machine learning.

ASCENTA Study on the EdTech Industry: The Future of Education
YOUTHINK l 2022 l Vol. XVI191
2. UNACADEMY
Started as a YouTube channel by Gaurav Munjal in
2010, Unacademy has become a well-known name in
the EdTech industry in India. It has tied up with
experienced educators to guide its students. A majority
of the courses are free on this platform; however, one
may need to pay for the certificates. Unacademy’s
acquisitions include Kreatryx, Tap Chief and Prep
Ladder, to name a few. Its financial backers include
Blume Ventures, Tracxn, Sequoia Capital, Tiger Global
Management and Dragoneer Investment Group.
3. VEDANTU
Vedantu is an Indian EdTech platform offering live
courses for school students. Multiple of these meetings
are free; however, one may need to pay for certain
courses. Vedantu raised $100 million in its Series D
funding in July 2020. Its existing financial backers are
GGV Capital, Omidyar and Westbridge Capital. Accel
and Tiger Global are among the latest financial backers
of Vedantu. Vedantu has acquired platforms like
Instasolv and Pedagogy.
REVENUE MODEL OF EDTECH COMPANIES
?Content Sharing: Students are provided with
learning material and content on EdTech platforms.
Tools on these platforms encourage teachers and
students to share assignments and ideas along with
them giving feedback, if necessary.
?Free Content and Material: To keep students
engaged, a lot of free modules and content are
provided at first and later charged for, with the total
course.
?Course Subscription: Students are asked to pay a
one-time course fee to purchase and access the
course.
?Pay Per Module: Students are charged on the basis
of the number of modules utilized.
?Advertising Commission: Teachers, who wish to be
highlighted on these platforms, may be charged a
commission.
INVESTMENTS IN EDTECH COMPANIES BY
VENTURE CAPITALISTS
Venture Capitalists (VC) are private equity investors
who invest in organizations displaying high
development and growth potential, in return for an
equity stake. With COVID-19 changing how education
is conferred, this industry has got the most elevated
yearly investment in 2020. Amidst the lockdown, the
education sector continued being one of the huge
wagers for financial backers and venture capitalists. The
EdTech industry, in particular, has recorded noteworthy
investments. From January to August 2020, venture
capitalists pumped in $1.19 billion, spread across
thirty-six deals, against $409 million across forty-three
arrangements, during a similar period a year ago.
Indian EdTech start-ups have seen an investment of
$2.22 billion in 2020, when contrasted with $553
million in 2019, as per the Indian Private Equity and
Capital Association (IVCA) and Praxis Global Alliance
Labs data. The report surveys that the education sector
is a $117 billion market in India, which had around 360
million students in the year 2019-20. The report
additionally stated that $49 billion is spent on school
training, 66 per cent of which is spent on essential
instructions and 27 per cent on optional schooling.
Moreover, it stated that $42 billion is spent on
supplementary learning, which principally involves
private training and test readiness.
REASONS FOR INVESTMENTS BY VENTURE
CAPITALISTS
?High Growth: The adoption of EdTech across the
country, due to the high internet penetration and
increasing use of laptops and smartphones, has
driven the demand for online education. COVID-19
proved to be a catalyst because of which it became
imperative for teachers and students to adopt
EdTech.
Key Drivers for Growth:
o Increasing Awareness and Demand for EdTech
Platforms: Individuals, who are anxious to expand
their knowledge but cannot do so with the existing
system, opt for EdTech platforms. The EdTech

A Study on the EdTech Industry: The Future of EducationASCENT
YOUTHINK l 2022 l Vol. XVI 192
industry has overcome issues of the individuals who
wish to learn, by providing economical and
detailed courses for all age groups. It focuses on
empowering students to
learn and master any
subject, whenever and
whichever they wish to,
according to their own
pace. This process of
learning is acknowledged
by various stakeholders,
including teachers and
students.
o Innovative Features on
EdTech Platforms: To
make a user experience more
effective and long-lasting, EdTech
platforms provide personalized
learning features as well as
simplified learning material in a
variety of languages. Many EdTech
platforms are rich in innovation and
implement interesting features using
the latest technologies. EdTech
platforms provide users with a
variety of features. For example,
Byju’s worked with an organization
like Disney to make learning and
understanding fun and effective.
?Premium Profit Business Model:
The EdTech industry is being
accepted widely. Research shows
that individuals are willing to pay for
these serv ices . The EdTech
companies work on a premium profit
business model, where users have to
pay a membership fee on the content
they choose to consume. By
providing interesting educational
content, EdTech is combining the
best of technology with education.
?Higher ROI: The EdTech industry is
developing significantly and is being
accepted widely. Both of these
elements unmistakably demonstrate that the Return
on Investment (ROI) is significantly higher on
account of online learning.
Figure 3: Top Venture Capitalist Investing in EdTech Companies in India
(Source: Created by the Author)
Figure 4: The Graph Shows the Amount Invested by Venture Capitalists across
Various Deals in EdTech Companies from 2017 to September 2020
(Source: Venture Intelligence)
Figure 5: The Graph Shows the Funds Raised and the Valuation of Byju’s from
January 2020 to March 2021
(Source: Venture Intelligence)

ASCENTA Study on the EdTech Industry: The Future of Education
YOUTHINK l 2022 l Vol. XVI193
FINANCIAL ANALYSIS OF THINK AND LEARN
PRIVATE LIMITED (BYJU’S)
Rationale Behind the Analysis of Byju’s Financial
Reports:
Byju’s, with a valuation of $16.5 billion, has become
one of the most valued start-ups in India. The company
has captured the Indian EdTech market, gaining a
massive user base. The company is financially backed
by top venture capitalists and has adopted an aggressive
acquisition strategy. The rationale for financial analysis
of Byju’s is to give key insights into the company’s
fundamentals and financial performance.
Highlights of Financial
Statements of Think and Learn
Pvt. Ltd. (Byju’s)
An in-depth study of the financial
statements of Think and Learn Pvt
Ltd. (Byju’s) highlights that the
company incurred a loss of `88
million during the financial year
(FY) 2019. Its revenue from
operations rose to `13,060
million in FY 2019. In FY 2019, its
sales added up to 90.5 per cent of
the total revenue, that is, ̀ 11,810
million increasing 2.8 times from FY 2018. Total
expenses rose from `5,374 million in FY 2018 to
`13,765 million in FY 2019 and expenditure on
development was accomplished by raising `24,550
million through the issue of shares in FY 2019. In FY
2019, losses were controlled by 76.3 per cent to ` 88
million.
Part 1: Financial Analysis Using Ratios
A. Liquidity Ratios:
Comments:
?The Current Ratio of the company was above 2:1,
which means the company was capable of funding
its current liabilities and managing its day-to-day
activities.
?The Liquid Ratio of the company is maintained well
above the standard 1:1, which has enabled the
company to run smoothly and allowed it to have a
high safety margin to meet its current liabilities.
Hence, the company is doing well in terms of
liquidity.
B. Turnover Ratios:
Figure 7: Turnover Ratios
(Source: Calculated by the Author from the Annual Reports of
Byju’s (2017-18 and 2018-19))
Figure 6: Liquidity Ratios
(Source: Calculated by the Author from the Annual Reports of
Byju’s (2017-18 and 2018-19))
Comments:
?Inventory Turnover Ratio is elevated, which shows
that every finished product is quickly turned over
and neither are there obsolete stocks, nor is there
over-stocking.
?The Accounts Receivable Turnover Ratio is
sufficient, which shows that the company is efficient
in collecting its receivables.
?The Accounts Payable Turnover
Ratio is low, which suggests that
the business is not taking the
complete edge of the credit
terms allowed by the creditors.
?Lower Work ing Cap i t a l
Turnover Ratio indicates that the
company is not generating
enough revenues with its
working capital.

A Study on the EdTech Industry: The Future of EducationASCENT
YOUTHINK l 2022 l Vol. XVI 194
Comments:
?The Debt Equity Ratio is low, which means that the
company has a very low financial leverage and has
low financing via debt in comparison to equity.
?The Proprietary Ratio is satisfactory, which indicates
its good financial condition and throws light on the
fact that the larger portion of its capital comes
through equity.
?The Debt to Total Assets Ratio is less than one, which
means that Byju’s has more assets and could meet its
obligation by selling these assets.
?The Interest Coverage Ratio is very low due to the
high-interest payment, which has led to an increase
in losses.
Comments:
?The Gross Profit Ratio indicates that the company is
financially healthy and is making a reasonable profit
on sales. It is more than satisfactory.
?The Net Profit Ratio was extremely poor previously,
which indicates that the expenses are greater than
revenue from sales, with the situation having
improved considerably but the company has yet to
reach the ideal margin.
?As the Return on Investment (ROI) is negative, the
company is in financial distress. Since ROI is the
profitability indicator, it comprises the aspects of
performance. However, in this case, the ROI does
not meet the standards and has a negative return.
?The Operating Ratio was high previously and has
decreased significantly, but it
indicates that the cost of
revenue from operations is
higher than the revenue from
operations.
?There is an increasing trend in
the Operating Profit Ratio of the
firm which is an improvement
and a positive indication. This
represents the correctness of the
company’s financial standing
and its ability to pay off its debt
obligations.
Figure 9: Profitability Ratios
(Source: Calculated by the Author from the Annual Reports of Byju’s (2017-18 and 2018-19))
D. Profitability Ratios:
C. Solvency Ratios:
Figure 8: Solvency Ratios
(Source: Calculated by the Author from the Annual Reports of Byju’s (2017-18 and 2018-19))

ASCENTA Study on the EdTech Industry: The Future of Education
YOUTHINK l 2022 l Vol. XVI195
Part 2: Financial Analysis Using Common-Size Statement
Figure 10: Common-Size Profit and Loss Account of Byju’s
(Source: Calculated by the Author from the Annual Reports of Byju’s (2017-18 and 2018-19))
Figure 11: Common-Size Balance Sheet of Byju’s
(Source: Calculated by the Author from the Annual Reports of Byju’s (2017-18 and 2018-19))

A Study on the EdTech Industry: The Future of EducationASCENT
YOUTHINK l 2022 l Vol. XVI 196
Comments:
In the Common-Size Income Statement, we see that
the Operating Costs are expanding, yet the percentage
increase in the level of Revenue from Operations is
more prominent than the Cost of Revenue from
Operations. Consequently, the loss percentage has
diminished significantly.
Figure 12: Comparative Profit and Loss Account of Byju’s
(Source: Calculated by the Author from the Annual Reports of Byju’s (2017-18 and 2018-19))
Part 3: Financial Analysis Using Comparative Statement
In the Common-Size Balance Sheet, we can
unmistakably call attention to the Intangible Assets and
Non-Current resources, which have expanded
strikingly. Long Term Borrowings have decreased.
Moreover, Proprietor's Equity has expanded, which is a
positive sign.

ASCENTA Study on the EdTech Industry: The Future of Education
YOUTHINK l 2022 l Vol. XVI197
Figure 13: Comparative Balance Sheet of Byju’s
(Source: Calculated by the Author from the Annual Reports of Byju’s (2017-18 and 2018-19))
Comments:
In the Comparative Income Statement, it can be seen
that the rate of expansion in Revenue from Operations
and Other Income is extensively high; however, the
Direct and Indirect Expenses surpass that rate, which
shows why the company is incurring a loss. This further
indicates that the company is expanding its business
activities. In 2018, the organization made a loss, which
was significantly reduced in 2019.
In the Comparative Balance Sheet, we see an expansion
in current investments. The Long-Term Borrowings have
decreased from 2018, while the Current Liabilities have
increased. The company's liquidity has decreased and
the solvency has increased.
RECOMMENDATIONS
?Byju’s is one of the most valued EdTech start-ups. It
has maintained a good financial position in terms of

A Study on the EdTech Industry: The Future of EducationASCENT
YOUTHINK l 2022 l Vol. XVI 198
liquidity and solvency, but the total expenses are
very high.
?Consequently, the company is incurring a loss and
shall take steps to curb the expenses. The direct and
indirect costs along with the marketing costs should
be controlled.
?There is a need for proper utilization of the working
capital, assets and equity fund, to overcome the loss.
?The company can focus on increasing its managerial
efficiency with respect to the Accounts Payable
Turnover Ratio. Therefore, the management should
work towards lowering its costs and increasing its
revenue, so that Byju’s can emerge profitable in the
future.
The financial performance of the company is good,
which attracts investors for further investments. It also
gives confidence to lenders and ensures that they
extend financial support. The rapid growth which the
EdTech industry is witnessing gives Byju’s an
opportunity to expand its user base and turn into a
profitable business in the future.
CONCLUSION
With all the institutions gradually adopting hybrid
learning, the EdTech industry is currently thriving.
COVID-19 has given the EdTech industry extra
momentum, making way for industry expansion. The
digitization of learning, government support via policy
reforms and the National Education Policy (NEP) 2020
have optimized the development of EdTech in India.
EdTech in India will continue to attract global
investments and large sums of capital even when
schools and universities reopen. EdTech has the power
to transform the education sector in India because these
platforms deliver the same content to the urban as well
as rural populace of the country. Companies like Byju’s
and Unacademy are leading the market by providing
personalized and cost-efficient modules, giving equal
learning opportunities to millions of students.
The challenge EdTech faces is the retention of students
in the long run. The companies would have to focus on
remaining relevant and engaging. EdTech companies
would have to innovate to address issues faced by
students as well as teachers.
Post-pandemic, EdTech could complement the
schooling education in India. The idea that EdTech
promotes is self-paced learning. Students with
differential learning capabilities or professionals seeking
to acquire a certain skill set could benefit from the
tailor-made modules that EdTech offers. What one
knows for sure is that EdTech is here to stay in the long
run due to the high acceptance of technology and
hybrid formats of teaching.
LIMITATIONS OF THE STUDY
?This research has been conducted over a time frame
of approximately three months only. Due to time
restrictions, there were challenges in terms of
coverage of data for the topics covered.
?The approach may differ in terms of the calculation
of certain items, hence, there might be a difference
in the interpretation of certain statements.
?Ratio analysis deals only with the quantitative aspect
and completely ignores the qualitative aspect of the
data.
REFERENCES
1. Dubey, P., and Pandey, D. (2020). Distance Learning in
Higher Education During Pandemic: Challenges and
Opportunities. Int. J. Indian Psychol, 8(2), 43-46.
2. Jena, P. K. (2020). Impact of Pandemic COVID-19 on
Education in India. International Journal of Current Research
(IJCR), 12.
3. Miglani, N., and Burch, P. (2019). Educational Technology in
India: The Field and Teacher’s Sense Making. Contemporary
Education Dialogue, 16(1), 26-53.
4. Teräs, M., Suoranta, J., Teräs, H., and Curcher, M. (2020).
Post-COVID-19 Education and Education Technology
‘Solutionism’: A Seller’s Market. Post-digital Science and
Education, 2(3), 863-878.

ASCENTA Study on the EdTech Industry: The Future of Education
YOUTHINK l 2022 l Vol. XVI199
ANNEXURES
Presentation of Main Data
Figure 14: Statement of Profit and Loss
(Source: Company Filings with Ministry of Corporate Affairs)

A Study on the EdTech Industry: The Future of EducationASCENT
YOUTHINK l 2022 l Vol. XVI 200
Figure 15: Balance Sheet
(Source: Company Filings with Ministry of Corporate Affairs)

ASCENT
YOUTHINK l 2022 l Vol. XVI201
Unified Payments Interface (UPI): The Game Changer
Dr. Sreemoyee Guha RoyAssistant ProfessorDepartment of Commerce (Morning)
Murli AgarwalDepartment of Commerce (Morning)
In order to
maximize the
benefits of
smartphones and
technology while
also developing a
forum for cashless
and open financial
transactions, the
Indian
government
created one
significant device,
the ‘UPI’.
ABSTRACT
India is rapidly becoming a cashless economy. Digital payment has emerged
as a result of the rise in internet use. Payments moved from conventional
payments to electronic payments via debit and credit cards, e-payments via
e-banking, and then to mobile payment via m-payment technologies. The
year 2016-17 was a watershed moment in India's payments environment,
with drastic policy decisions. NPCI launched UPI in August 2016, a payment

Unified Payments Interface (UPI): The Game ChangerASCENT
YOUTHINK l 2022 l Vol. XVI 202
system app which would solve the problem of carrying
bank account numbers and cards in mind. UPI took
advantage of India's high tele-density as it further
helped it to reach millions of people. Since NPCI's
establishment in 2009, UPI has been the result of a
number of innovations by the organization. In this
paper, we have tried to show a small study on consumer
satisfaction using UPI and analyze the security aspect of
digital payments.
KEYWORDS: UPI, Digital Payment, Customer
Satisfaction.
INTRODUCTION
National Payment Corporation of India (NPCI), an
organization of RBI has developed low-cost retail digital
payment systems known as UPI. The acceptance of one
touch payment is influenced by the availability of an
internet connection, one touch access, and safe
financial transactions. As a result, in order to maximize
the benefits of smartphones and technology while also
developing a forum for cashless and open financial
transactions, the Indian Government created one
significant device, the ‘UPI’ (Unified Payment
Interface).
In India, technological advancements have altered the
payment system. The post-demonetization era (after
8th November, 2016) has been an important phase in
the growth and development of the Indian payment
system. In India, there are a lot of digital payments.
Cashless transactions have also become more common.
Smartphones, a smart tool that has become a key
component of people's personal, professional, and
financial lives, have had a significant impact on the
digital payment industry.
Consequently, NPCI launched the UPI in August 2016
in order to solve all the previous problems which were
unavoidable. On 11th April 2016, RBI Governor
formally inaugurated the UPI, which was then made
available to the public on 25th August, 2016. UPI is a
digital payment system that allows users to send and
receive money by using a Virtual Payment Address
(VPA). It is a system that combines many banking
functions, smooth fund routing, and merchant
payments into one mobile application which can be
easily downloaded online.
LITERATURE REVIEW
A research on the effect of UPI on customer satisfaction
was conducted by Bijin Philip. The aim of the study was
to determine customer preferences for unified payment
interfaces and to assess the effect of UPI services on
customer satisfaction. Customers have a positive
attitude toward unified payment interface services and
functions, according to the findings, and there is a
positive connection between respondents' education
and their use of UPI services. People with a higher level
of education are more likely to use UPI programmes,
and they inspire others to do so as well. (Bijin Philip,
2019)
The performance of UPI demonstrates that India is
making strides toward a cashless economy. However,
the scope of Bharat Interface for Money (BHIM) needs
to be expanded. For user interaction, BHIM could add
more categories to the payment app. UPI is IMPS's
refined and finished product, and it is expected to be
integrated with the NEFT framework, which is governed
by the RBI guidelines, at some stage. (Salil Panchal and
Manu Balchandran, 2018)
OBJECTIVES OF THE STUDY
This research is based on two major objectives. They are
as follows -
?A Study on Consumer Satisfaction of UPI: This has
been taken up to know whether the customers are
satisfied or not after the emergence of Unified
Payment Interface as a new payment system.
?Security Analysis of UPI as Compared to Other
Digital Payments: This has been taken up to ensure
that UPI as a payment system is safe and secure as
millions of transactions take place on a daily basis.
RESEARCH METHODOLOGY
Questionnaires: Questionnaires are used to gather
information. They are a good way to gather data

ASCENTUnified Payments Interface (UPI): The Game Changer
YOUTHINK l 2022 l Vol. XVI203
because they allow people to take their own time, think
about the questions properly, and return to it later.
MCQs, closed questions, and open-ended questions
are common in the questionnaires. I have prepared
different questionnaires and circulated it with the help
of Google forms to my colleagues for gathering the
required information.
Surveys: The act of analyzing a process or interviewing
a selected sample of individuals to collect data about a
programme, product, or process is referred to as a
survey.
Data collection surveys are used to gather information
about a certain group of people's thoughts, behaviour,
or expertise.
Getting Started with UPI
Step 1 - Download the UPI app from the internet.
Step 2 - Install the app on your device.
Step 3 - Now set a unique passcode for the app for
safety. This may be your lock screen or any
other pattern.
Step 4 - Now create a virtual address.
Step 5 - Add your bank account by providing the
registered mobile number linked with your
bank account.
Step 6 - Set the UPI PIN. This is the most important
step and the customer must set a unique PIN
which can be remembered easily.
Step 7 - Now start transacting.
Sample Size
I have collected data from 80 respondents of Rourkela
to know the satisfaction level of them. They have filled
the questionnaires circulated to them in Google forms
via a link.
Target Respondents
The target respondents were my colleagues, corporate
employees and businessmen who were using UPI
services on a regular basis.
Demographic Statistics
i) Gender of the Respondents
Figure 1: Gender of the Respondents
(Source: Primary Data)
Data Interpretation:
28 per cent of the respondents were female and the rest
72 per cent were male.
ii) Age group of Respondents
Figure 2: Age Group of Respondents
(Source: Primary Data)
Data Interpretation:
We can find that eight people were below the age of 18,
forty-four were between 18-25 years as most of them
were students, twenty-two of them between 25-40
years and six of them were above the age of 40.
iii) Occupational Status
Figure 3: Occupational Status
(Source: Primary Data)
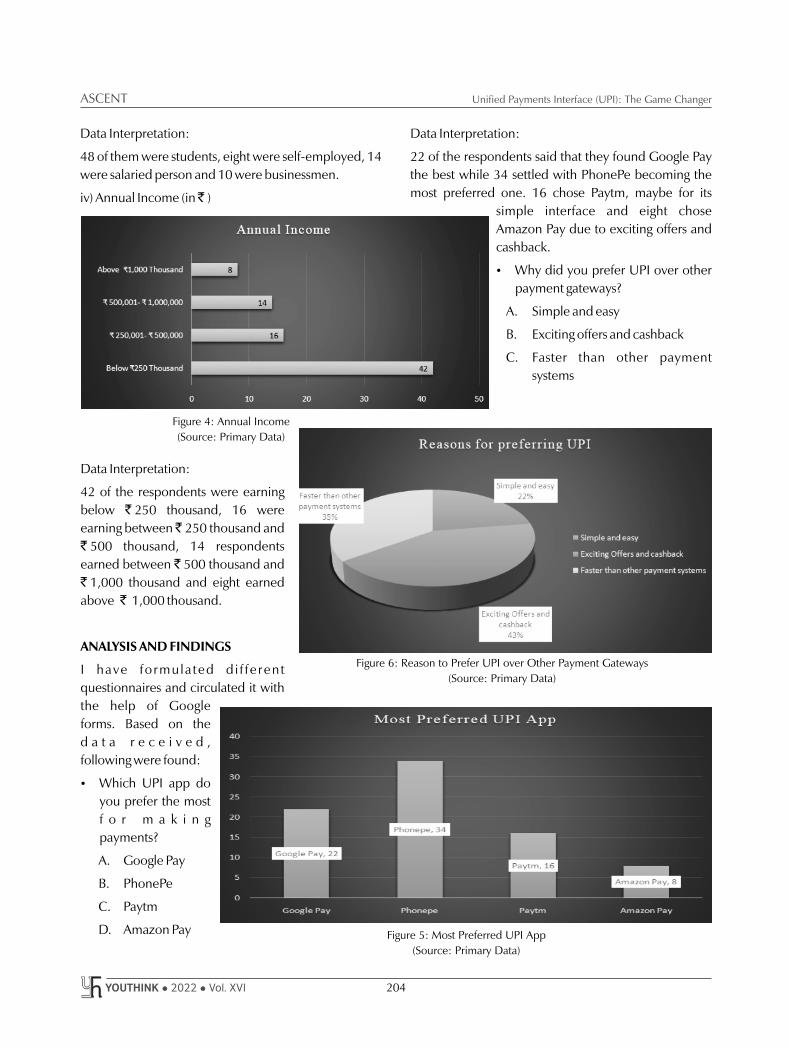
Unified Payments Interface (UPI): The Game ChangerASCENT
YOUTHINK l 2022 l Vol. XVI 204
Data Interpretation:
48 of them were students, eight were self-employed, 14
were salaried person and 10 were businessmen.
iv) Annual Income (in ̀ )
Figure 4: Annual Income
(Source: Primary Data)
Data Interpretation:
42 of the respondents were earning
below `250 thousand, 16 were
earning between ̀ 250 thousand and
`500 thousand, 14 respondents
earned between `500 thousand and
`1,000 thousand and eight earned
above ̀ 1,000 thousand.
ANALYSIS AND FINDINGS
I have formulated di f ferent
questionnaires and circulated it with
the help of Google
forms. Based on the
d a t a r e c e i v e d ,
following were found:
?Which UPI app do
you prefer the most
f o r m a k i n g
payments?
A. Google Pay
B. PhonePe
C. Paytm
D. Amazon Pay Figure 5: Most Preferred UPI App
(Source: Primary Data)
Data Interpretation:
22 of the respondents said that they found Google Pay
the best while 34 settled with PhonePe becoming the
most preferred one. 16 chose Paytm, maybe for its
simple interface and eight chose
Amazon Pay due to exciting offers and
cashback.
?Why did you prefer UPI over other
payment gateways?
A. Simple and easy
B. Exciting offers and cashback
C. Faster than other payment
systems
Figure 6: Reason to Prefer UPI over Other Payment Gateways
(Source: Primary Data)

ASCENTUnified Payments Interface (UPI): The Game Changer
YOUTHINK l 2022 l Vol. XVI205
Data Interpretation:
18 of the respondents said that they
preferred UPI over other payment systems
because it was simple and fast. 34 of them
used UPI because of the exciting offers
and cashback provided by the UPI apps.
28 of them said that they used UPI
because it was faster than any other
payment gateway.
?Since how long are you using the UPI
services?
A. Last six months
B. Last one year
C. Last three years
D. More than three years
Data Interpretation:
20 respondents have been using the UPI services for
more than three years. This shows that UPI has been
successful to retain the customers by constantly hearing
and addressing the grievances of its customers. 42 of
them said that they had been using it for three years. 14
of them said that they were introduced to UPI a year
ago and four of them started to use it six months back.
?Are you satisfied with the speed of the transactions
while making payments through UPI?
A. Very much Satisfied
B. Satisfied
C. Dissatisfied
D. Very much Dissatisfied
Figure 8: Satisfaction on the Speed of Transaction
(Source: Primary Data)
Data Interpretation:
40 respondents were very
much satisfied with the speed
of transactions made by them,
while 26 of them were only
satisfied. Six of them said that
they were dissatisfied and
eight of them were very much
dissatisfied because their
transactions got stuck in the
middle and the amount got
debited too. What happens is,
the amount gets debited and
the payment is stuck in the
middle. It does not get credited to the receiver’s bank
and asks to wait for a certain time. This is the reason why
some of the respondents may have opted for
dissatisfaction. However, I think that the UPI service
providers are constantly working on this and may
provide a solution to such cases which hardly take
place.
?UPI app provides customer service for grievance
redressal, are you satisfied with the service?
A. Very much Satisfied
B. Satisfied
C. Dissatisfied
D. Very much Dissatisfied
Figure 7: How Long Have You Been Using the UPI?
(Source: Primary Data)

Unified Payments Interface (UPI): The Game ChangerASCENT
YOUTHINK l 2022 l Vol. XVI 206
Data Interpretation:
We found that 30 respondents were very much satisfied
while 18 of them were only satisfied. Chat support, call
centres, FAQs answered, et al., are some of the ways by
which the UPI service
providers have managed to
win the hearts of the
customers. However, the
problem still persists as we
can see that 14 of them
were dissatisfied and 18
were very dissatisfied,
maybe due to the delayed
service and long wait.
However, UPI services
providers, with the help of
SWOT analysis, take note of
everything and will soon
address this issue to make it
more easy, convenient and
fast.
?How frequently do you
use UPI apps and make
payments?
A. Daily
B. Occasionally
C. Once in a week
D. Once in a month
Data Interpretation:
36 respondents said that they were
using UPI on a daily basis. Cashless
economy has arrived where people
today do not want to carry cash and
prefer to pay online. It has brought a
huge surge in the daily transactions. 22
of them said that they used UPI
occasionally. However, 16 of them said
that they used UPI once a week and to a
surprise some even admitted that they
use UPI once a month.
?Which of the payment systems do
you f ind sa fe whi le doing
transactions?
A. Credit card and Debit card
B. UPI
C. Net Banking
D. Wallets
Figure 9: Satisfaction on Customer Services
(Source: Primary Data)
Figure 10: Frequency of Transactions
(Source: Primary Data)
Figure 11: Which Payment System is Safer?
(Source: Primary Data)
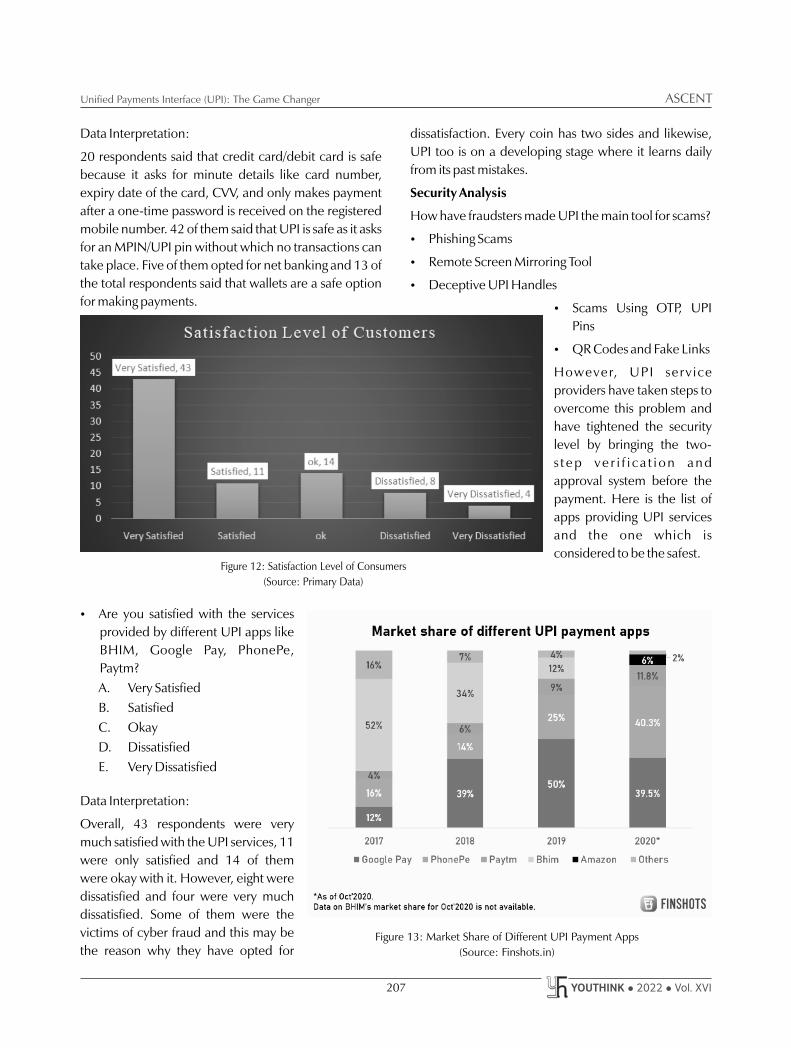
ASCENTUnified Payments Interface (UPI): The Game Changer
YOUTHINK l 2022 l Vol. XVI207
Data Interpretation:
20 respondents said that credit card/debit card is safe
because it asks for minute details like card number,
expiry date of the card, CVV, and only makes payment
after a one-time password is received on the registered
mobile number. 42 of them said that UPI is safe as it asks
for an MPIN/UPI pin without which no transactions can
take place. Five of them opted for net banking and 13 of
the total respondents said that wallets are a safe option
for making payments.
?Are you satisfied with the services
provided by different UPI apps like
BHIM, Google Pay, PhonePe,
Paytm?
A. Very Satisfied
B. Satisfied
C. Okay
D. Dissatisfied
E. Very Dissatisfied
Data Interpretation:
Overall, 43 respondents were very
much satisfied with the UPI services, 11
were only satisfied and 14 of them
were okay with it. However, eight were
dissatisfied and four were very much
dissatisfied. Some of them were the
victims of cyber fraud and this may be
the reason why they have opted for
dissatisfaction. Every coin has two sides and likewise,
UPI too is on a developing stage where it learns daily
from its past mistakes.
Security Analysis
How have fraudsters made UPI the main tool for scams?
?Phishing Scams
?Remote Screen Mirroring Tool
?Deceptive UPI Handles
?Scams Using OTP, UPI
Pins
?QR Codes and Fake Links
However, UPI serv ice
providers have taken steps to
overcome this problem and
have tightened the security
level by bringing the two-
s t ep ve r i f i c a t i on and
approval system before the
payment. Here is the list of
apps providing UPI services
and the one which is
considered to be the safest.Figure 12: Satisfaction Level of Consumers
(Source: Primary Data)
Figure 13: Market Share of Different UPI Payment Apps
(Source: Finshots.in)

Unified Payments Interface (UPI): The Game ChangerASCENT
YOUTHINK l 2022 l Vol. XVI 208
There are different UPI apps providing the services,
however, some of them like PhonePe, Google Pay,
Paytm, Amazon Pay, have been able to make their own
mark. PhonePe is considered to be the safest of all and
the graph reveals that it has the largest market share
among the UPI apps.
NPCI is the central switch routing all the transactions.
That is why it is safe and secure. At first, the customer
initiates a transaction through the UPI app and the
customer’s bank sends the transaction details to NPCI.
NPCI serves as a control switch. Now, they send the
transaction details to the receiving bank and after the
approval, the recipient is informed by the receiver’s
bank that the transaction has been completed
successfully and that the receiver has received the
money. As UPI is working hard and making itself better
day by day, it is predicted that it will make a `115.4
trillion value by the end of
FY 2025-26.
CONCLUSION
UPI is the most significant
innovation in India's digital
payments market till date. It has
created a platform where
people can invest their trust and
transact safely and easily.
Millions of transactions take
place through UPI daily, all over
the world. Its simple interface
and strong security are some of
the key features which have led
to its success.
It is excelling at a high speed and it is expected that by
the year 2025, it shall have tripled its business. People,
nowadays, are going cashless and prefer to pay online
through UPI. It has made the payment system stronger
Figure 15: Growth of UPI in Upcoming Years
(Source: Axisbankingandfinance.net)
Figure 14: NPCI - The Central Switch
(Source: NPCI)

ASCENTUnified Payments Interface (UPI): The Game Changer
YOUTHINK l 2022 l Vol. XVI209
than ever. It has completely changed the scenario of the
payment system. NPCI is the control switch and it
ensures that all transactions are safely carried on. Every
coin has two sides and I believe that UPI will soon
emerge as the best payment option available.
On the security analysis part, UPI may have become a
source of emptying people’s bank accounts at first, but
UPI 2.0 has significantly developed itself and has
increased the security more than ever. Now it works on
double step verification and approval of payment
which is extremely good. Overall, it is a good payment
system and people, including me, are satisfied. This
research has provided me with a good opportunity to
increase my knowledge and I have completed my
research here with the help of my colleagues, guide and
parents.
REFERENCES
1. https://www.npci.org.in/what-we-do/upi/product-overview
2. https://en.wikipedia.org/wiki/Unified_Payments_Interface
3. https://www.digit.in/features/general/the-origins-of-upi-
road-to-a-cashless-society-50210.html
4. https://business.paytm.com/blog/common-challenges-in-
online-payments-how-to-overcome-them/
5. ht tps : / /economic t imes . ind ia t imes .com/what - i s -
upi/tomorrowmakersshow/70241683.cms

ASCENT
YOUTHINK l 2022 l Vol. XVI 210
Escalation of Non-Performing Assets in the Banking Sector Impedes Growth and Prosperity of that Sector and the Overall Economy: An Analytical StudyDr. Sumana Guha Assistant ProfessorDepartment of Commerce (Morning)
Anirudh ShahDepartment of Commerce (Morning)
The banks should
take necessary
actions and steps
to neutralize the
effects of NPAs on
their profitability,
performance and
improve the
situation to
induce an inflow
of investments.
ABSTRACT
The banking industry plays a significant role in the fundamental growth and
development of the overall Indian economy. A strong banking sector is a

ASCENTEscalation of Non-Performing Assets in the Banking Sector Impedes Growth
YOUTHINK l 2022 l Vol. XVI211
symbol for flourishing opportunities. The soundness of
the asset quality is of utmost importance for prosperity.
However, with time the asset quality has deteriorated
and has affected the industry adversely. In the present
study, an effort has been made to understand the non-
performing asset levels in different bank groups and to
analyze the effects on profitability and return on assets,
with the help of regression and correlation analysis. The
study applies descriptive and causal research
approaches and utilizes secondary data. It is observed
that the Non-Performing Asset (NPA) levels have shown
an increasing trend throughout the decade and have a
significant inverse impact on the profitability and return
on assets of public sector and private sector banks.
KEYWORDS: Non-Performing Asset (NPA),
Substandard Assets, Doubtful Assets, Loss Assets,
Return on Assets (ROA).
INTRODUCTION
The banking industry plays a scathing role in the Indian
economy. A good banking system ensures healthy
economic growth which in turn ensures easy flow of
credit as well as credit creation. The banking industry
has grown manifold and so has the complexity
associated with it over time. Non-Performing Assets
(NPAs), to name one, is a critical factor that has
adversely affected the growth and development of the
banking industry and the economy as a whole. Lending
is generally encouraged but it also carries the ‘credit
risk’ along with it, which arises from default in
repayment of loans, thereby creating NPAs. Non-
performing assets are the loans or advances provided by
the banks and financial institutions in which borrowers
default in repayment of principal and interest amount.
The entire NPA conundrum not only affects the banks
but also the entire wealth of the country. As a matter of
fact, the level of NPA also reflects the health of the
industry and trade. The Indian banking system has
primarily suffered because of a large number of
accumulated stressed assets. These stressed assets
consist of both gross non-performing assets as well as
restructured standard advances resulting from a default
in repayment of loans, largely, by corporate borrowers.
Although complete eradication of such losses is not
possible, banks can always aim to minimize the losses.
In the post-pandemic period, special purpose vehicles
and bad banks as a solution for the accumulation of
these bad loans have been making headlines in India.
The concept of bad banks, viewed as a special
responsive measure primarily, has attracted huge
significant support lately to relieve banks of their stress
temporarily; keeping in mind the on-going market
situation particularly exacerbated by the COVID-19
pandemic and is now extensively viewed as a major
constituent in rescuing and bolstering the banking
system.
Although the Gross Non-Performing Assets (GNPAs)
and Net Non-Performing Assets (NNPAs) ratios
continued to decline and stood at 9.7 per cent and 2.9
per cent respectively for Public Sector Banks (PSBs), 4.6
per cent and 1.0 per cent respectively for Private Sector
Banks (PVBs), 2.5 per cent and 0.4 per cent respectively
for Foreign Banks (FBs) and 7.5 per cent and 2.1 per
cent respectively for all Scheduled Commercial Banks
(SCBs), in September 2020, the Financial Stability
Report by Reserve Bank of India suggests that the GNPA
ratio of all SCBs may increase from 7.5 per cent in
September 2020 to 13.5 per cent by September 2021.
The banks involve public money and require huge
investments to operate. Therefore, studying the impact
of NPA on profitability and return on assets of different
bank groups is of utmost importance as minimizing the
impact to maximize profit will help attract investment in
the future.
LITERATURE REVIEW
Arasu et al., (2019) observed that GNPA and NNPA of
both PSBs and PVBs gradually increased year-on-year
from 2014 to 2018. Wadhwa and Ramaswamy, (2020)
addressed the fact that the problem is more deep-
rooted for PSBs than PVBs, in respect of NPA levels.
Vikram and Gayathri, (2018) showed that the root
causes for rising NPAs and higher levels of NPAs in PSB
are derived from the nature of overseeing credit
chances by the banks and its wilful defaulters. Wadhwa
and Ramaswamy, (2020) argued that NPA is negatively
correlated with net profits, except in the case of HDFC
Bank where it is positively correlated, however, it is

Escalation of Non-Performing Assets in the Banking Sector Impedes GrowthASCENT
YOUTHINK l 2022 l Vol. XVI 212
ascertained that a rise in NPA does not lead to higher
profits.
Kandela, (2019) observed that these enlisted factors are
adding to the accumulation of NPAs in PSBs. Bittu and
Dwivedi, (2012) opined that the variations in NPAs are
negatively related to the efficiency of bank
performance, as seen in the study by Wadhwa, (2020)
as well and positively related to capital-adequacy ratio,
as opposed by Kandela, (2019) in his study. Aisac et al.,
(2018) observed that there is a significant relationship
between NPAs and Gross Domestic Product (GDP).
Chavan and Gambacorta, (2016) observed that NPAs
ratios are sensitive to the interest rate environment in
the form that there is a procyclical risk-taking response
to loan growth of both PSBs and PVBs with the latter
being more reactive to changes in business cycle
conditions and interest rates. Navaneethakrishnasamy
et al., (2017) argued that the negative trade cycles are
not the basis of rising NPAs but are a result of faulty
credit delivery systems and promotion of impractical
operational techniques.
Tejashwini and Ramani, (2019) described that despite
determinants demonstrating increasing trends in both
public and private sectors, PVBs performed better than
PSBs. They concluded that PVBs had more lending
appeals and easy procedures to avail loans. Kamra and
Samir, (2013) stated that the problem of NPAs is
significantly higher in the non-priority sector than the
priority sector. Moreover, the largest share of NPA in the
priority sector belongs to the small-scale industries.
OBJECTIVE OF THE STUDY
The objectives of the study are:
?To study the levels of NPAs in different bank groups,
namely scheduled commercial banks, public sector
banks, private sector banks and foreign sector banks.
?To examine the impact of NPAs on the profitability of
banks. Therefore, testing the following hypothesis:
H : There is no significant impact of NPA on 0
the profitability of banks.
H : There is significant impact of NPA on the 1
profitability of banks.
?To study the relationship between NPAs and return
on assets.
DATA AND RESEARCH METHODOLOGY
The research is conducted on secondary data collected
from RBI annual reports, publications, and press
releases; real-time handbook of statistics on the Indian
economy available on RBI’s website; Basic Statistical
Returns (BSR)-one (Annual) - Credit by SCBs; Basic
Statistical Returns (BSR)-two - Deposits by SCBs;
Annual reports of PSBs and PVBs. The research aims to
study the NPA levels over the years through graphical
representation and examine the relationship between
NPA and profitability of banks by considering five public
sector banks and five private sector banks, selected
based on the highest NPAs. The study applies the tools
and techniques for analysis like descriptive graphs;
Pearson’s cross-correlation; linear regression. The
above-mentioned analysis will be applied using MS-
Excel and R-Programming.
The study tried to explore the Indian banking sector and
the profitability aspect of the major banks in order to
assess the impact of non-performing assets and their
adverse effects that impede the overall growth of the
sector and the Indian economy. The research applies
the descriptive and causal research approaches. The
inference is observed through correlation analysis and
linear regression on data from 2010-11 to 2019-20. In
this study, 18 public sector banks, 22 private sector
banks and, 46 foreign sector banks in comparison to
consolidated 96 scheduled commercial banks, are
considered to analyze the levels of NPAs and growth in
NPA ratio over a period of 10 years from 2011-2020.
DATA ANALYSIS
Analysis of Gross Non-Performing Assets (GNPA) in
Different Bank Groups:
Figure 1 shows GNPA levels of different bank groups
over a period of 10 years. It demonstrates the steady
growth of GNPA in Scheduled Commercial Banks
(SCBs), Public Sector Banks (PSBs), Private Sector Banks
(PVBs), and Foreign Sector Banks (FSBs). PSBs record

ASCENTEscalation of Non-Performing Assets in the Banking Sector Impedes Growth
YOUTHINK l 2022 l Vol. XVI213
higher NPAs year-over-
year as compared to PVBs
and FSBs. After a rising
trend with 30.8 per cent
growth in 2017-18 itself,
PSBs decreased steadily
by 17 .4 pe r cen t .
However, PVBs set a
rising trend throughout
with around 14.1 per
cent increment in 2019-
20.
Figure 1: Comparison of GNPA in SCBs, PSBs, PVBs and FSBs
(Source: https://www.rbi.org.in/Scripts/Publications/)
Figure 2: Comparison of NNPA in SCBs, PSBs, PVBs and FSBs
(Source: https://www.rbi.org.in/Scripts/Publications/)
Figure 2 exhibits NNPA levels of the same sample of
bank groups as above. However, NNPA reflects the
actual losses of the bank groups and therefore, a clearer
picture can be illustrated from it. A similar movement
can be seen in both GNPA and NNPA throughout the
Analysis of Net Non-Performing Assets (NNPA) in Different Bank Groups:
decade with identical relationships between inter-bank
groups. Moreover, a 100 per cent growth is observed in
NNPAs of PSBs in the year 2015-16 and a
Compounded Annual Growth Rate (CAGR) of 20.4 per
cent over the period.

Escalation of Non-Performing Assets in the Banking Sector Impedes GrowthASCENT
YOUTHINK l 2022 l Vol. XVI 214
Analysis of GNPA Ratio in Different Bank Groups:
Figure 3: Comparison of GNPA Ratio of SCBs, PSBs, PVBs AND FSBs
(Source: https://www.rbi.org.in/Scripts/Publications/)
Figure 3 shows the GNPA ratio as a percentage of gross
advances of different bank groups for comparison. PSBs
demonstrate an increasing trend with the record high of
14.6 per cent in 2017-18 but fall significantly after
Analysis of NNPA Ratio in Different Bank Groups:
2017-18 with a CAGR of 15.7 per cent over the 10 year
time period. PVBs, on the other hand, exhibit a slightly
rising trend after 2016-17 overtaking FSBs thereafter,
with a CAGR of 8.2 per cent.
Figure 4: Comparison of NNPA Ratio of SCBs, PSBs, PVBs and FSBs
(Source: https://www.rbi.org.in/Scripts/Publications/)
Figure 4 exhibits the NNPA ratio as a percentage of net
advances of different bank groups. However, the NNPA
ratio reflects the actual losses of the bank groups and
therefore, a clearer picture can be demonstrated from
it. As compared to the GNPA ratio, a similar trend can
be seen in the NNPA ratio in the case of all bank groups.
PSBs set a record high of 8 per cent in the year 2017-18
with a CAGR of 12.9 per cent throughout.

ASCENTEscalation of Non-Performing Assets in the Banking Sector Impedes Growth
YOUTHINK l 2022 l Vol. XVI215
Relationship between NPA and Profitability of Public Sector Banks:
Figure 5: Relationship between NPA and Profitability of PSBs [Net Profit and Net NPA of PSBs from 2010- 11 to 2019-20]
(Source: https://www.rbi.org.in/Scripts/Publications/)
Figure 5 exhibits the correlation of NNPA and Net Profit
of five Public Sector Banks (PSBs) selected on the basis
of the highest NPA over the 10 year time period. All the
five PSBs taken into consideration show a high negative
correlation indicating an inverse relationship between
NPA and profitability of PSBs. Hence, an increase in
NPA would result in a decrease in profitability of banks.
Figure 5 also shows the p-value which is calculated by
applying linear regression with net profit as the
dependent variable. The null hypothesis H that there is 0
no significant impact of NPA on the profitability of
banks is rejected for all the PSBs since the p-value is less
than the 5 per cent significance level. Therefore, we
have sufficient evidence to conclude that there is a
significant impact of NPA on the profitability of PSBs.
Figure 6: Relationship between NPA and Profitability of PVBs [Net Profit and Net NPA of PVBs from 2010-11 to 2019-20]
(Source: https://www.rbi.org.in/Scripts/Publications/)
Figure 6 exhibits the correlation of NNPA and Net Profit
of PVBs. Axis Bank (-0.6589), IDBI Bank (-0.5078), and
Yes Bank (-0.8398) show a high negative correlation
indicating an inverse relationship between NPA and
profitability of these PVBs. However, ICICI Bank (0.015)
and HDFC Bank (0.9868) exhibit a positive correlation
value, indicating a direct relationship. However, we
cannot conclude that an increase in NPA would lead to
an increase in profitability of ICICI Bank and HDFC
Bank.
Relationship between NPA and Profitability of Private Sector Banks:

Escalation of Non-Performing Assets in the Banking Sector Impedes GrowthASCENT
YOUTHINK l 2022 l Vol. XVI 216
Figure 6 also shows the p-value which was calculated by
applying linear regression with net profit as the
dependent variable. The null hypothesis H that there is 0
no significant impact of NPA on the profitability of
Cross-Correlation between NPA and Return on Assets:
banks is rejected for Axis Bank, Yes Bank, and HDFC
Bank, since the p-value is less than the 5 per cent
significance level.
Figure 7: NPA and Return on Assets of Public Sector Banks and Private Sector Banks
(Source: https://www.rbi.org.in/Scripts/Publications/)
Figure 8: Cross-Correlation Analysis between NPA and Return on Assets
(Source: https://www.rbi.org.in/Scripts/Publications/)
The Data Table shows the Gross Non-Performing Assets
(GNPAs), Net Non-Performing Assets (NNPAs) and
Return on Assets (ROA) of Public Sector Banks (PSBs),
and Private Sector Banks (PVBs).
Figure 8 shows the cross-correlation analysis between
NPA and Return on Assets of PSBs and PVBs, derived
from the above data table. It demonstrates a high
positive correlation between GNPA and NNPA of both
PSBs and PVBs with each other.
MAJOR FINDINGS
The level of GNPA and NNPA of Public Sector Banks
increases steadily year-over-year from 2010-11 to
2017-18 and thereafter declines. However, GNPA and
NNPA for Private Sector Banks increase steadily
throughout. Public Sector Banks record higher NPAs
than Private Sector Banks and Foreign Sector Banks.
They dominate the overall calculation of NPA in the
banking sector. A linear increasing trend is observed in
the overall NPA levels over the 10-year period from
2010-11 to 2019-20. It is observed that there is an
inverse relationship between NPA and the profitability
of Public Sector Banks. There is an inverse relationship
between NPA and the profitability of Private Sector
Banks except, in the case of ICICI Bank and HDFC
Bank. However, a positive correlation does not signify
that an increase in NPA would lead to an increase in
profitability of these two banks. There is a significant
impact of NPA on Axis Bank, Yes Bank, and HDFC
Bank, but an insignificant impact on ICICI Bank and
IDBI Bank. Certainly, the problem of NPA is more in
Public Sector Banks than Private Sector Banks. It is
observed that GNPA has a positive relationship with
NNPA, whereas, it has a negative relationship with

ASCENTEscalation of Non-Performing Assets in the Banking Sector Impedes Growth
YOUTHINK l 2022 l Vol. XVI217
return on assets of Public and Private Sector Banks,
indicating that an increase in GNPA or NNPA will result
in decrease in return on assets.
LIMITATION OF THE STUDY
The research is conducted for a period of 10 years from
2011-2020. The research considers only selected
public and private sector banks based on the highest
NPAs, neglecting co-operative banks, NBFCs, and other
types of banks for avoiding complexity. This might
present a skewed picture.
RECOMMENDATIONS
A more stringent policy should be formulated for credit
appraisal and monitoring and for following the due
process before giving credit. The loan accounts should
be reviewed and followed up at regular intervals. Banks
may resort to one-time settlement offers or
compromises to minimize bad debts. The Insolvency
and Bankruptcy Code, 2016 and SARFAESI Act, 2002
should be applied for managing NPAs. Banks may resort
to transferring NPAs at a discount to Bad Banks/Asset
Reconstruction Companies/Asset Management
Companies. This will, in turn, improve banks’
profitability and clear off bad debts. The books with
reduced stressed assets will look more attractive to
investors and help the banks bring in more investment
in the future.
CONCLUDING REMARKS
Gradually, the banking industry has flourished manifold
along with the complications associated with it. Non-
Performing Assets (NPAs), to name one, have hindered
growth and development for a long time. The banks
need to be proactive and move forward in recovering
the NPAs efficiently. The banks should take necessary
actions and steps to neutralize the effects of NPAs on
their profitability, performance and improve the
situation to induce an inflow of investments. For an in-
depth study and analysis of how deep-rooted the entire
NPA conundrum is, macroeconomic factors can also be
taken into consideration.
REFERENCES
1. Aisac, N.M., Mathew, H.E., Cherian, S. and Thangjam, R.
(2018). The rising Level of NPAs and its impact on GDP of
India, Journal of Emerging Technologies and Innovative
Research, Vol. 5, Issue No. 11, ISSN: 2349- 5162.
2. Arasu, B., Sridevi, P., Nageswari, P., and Ramya, R. (2019). A
Study on Analysis of Non - Performing Assets and its Impact
on Profitability, International Journal of Scientific Research in
Multidisciplinary Studies, Vol. 5, Issue No. 6, pp. 01-10.
3. Bittu, S., and Dwivedi, A. (2012). Determinants of credit risk
in Indian banking sector: some panel results, Int. J. Business
Continuity and Risk Management, Vol. 3, No. 2, pp. 178-
184.
4. Chavan, P., and Gambacorta, L., (2016). Bank Lending and
Loan Quality: The Case of India, Department of Economic
and Policy Research.
5. Kamra, S., and Kamra, D. (2013). A Comparative Analysis of
Non-Performing Assets (NPAs) of Selected Commercial
Banks in India.,Opinion: International Journal of
Management, Vol. 3, Issue No. 1, pp: 68-80.
6. Kandela, R. (2019). Bad Loans of Public Sector Banks in
India: A Panel Data Study, Emerging Economy Studies,
International Management Institute, Vol. 5, Issue No. 1, pp.
22– 30.
7. Navaneethakrishnasamy, R., Sharmila Devi, M.,
Mathivannan, S., (2017). Position of Non- Performing Assets
in IDBI Bank, International Conference on Recent Trends in
Engineering Science, ISBN: 978-93-86171-18-4, pp. 466-
472.
8. Tejashwini. C. and Ramani. (2019). A comparative study on
NPAs and its effect on financial performance of Public and
Private Sector Banks, International Journal of Research in
Engineering, Science and Management, Vol. 2, Issue No. 12,
ISSN: 2581-5792.
9. Vikram, SK., Gayathri, G. (2018). Analysis of Non-
Performing Assets, International Journal of Pure and Applied
Mathematics, Vol. 118, Issue No. 20, pp. 4537-4540.
10. Wadhwa, R., Ramaswamy, K. (2020). Impact of NPA on
Profitability of Banks, International Journal of Engineering
Technology and Management Science, Vol. 7, Issue No. 3,
pp. 01-07.

ASCENT
YOUTHINK l 2022 l Vol. XVI 218
Tea Industry in India - Study on Goodricke, Gillanders Arbuthnot and Company Limited, McLeod Russel, Jayshree Tea and Industries Limited and Bengal Tea and Fabrics Limited
Dr. Tuhina MannaAssistant ProfessorDepartment of Commerce (Morning)
Yashish DoshiDepartment of Commerce (Morning)
The tea industry
plays a key role in
earning foreign
exchange and
contributes a
significant share
to India’s Gross
Domestic
Product.
ABSTRACT
The tea industry plays a very important role in the national economy. India is
one of the largest producers of tea in the world. Tea is indigenous to the
northern and eastern parts of India, but the tea industry has grown and
expanded over the past few years, making India one of the largest producers
and growers of tea in the world. China is the biggest competitor of India
followed by Sri Lanka, Indonesia, and Kenya. There is an overall decline in
the profitability of the tea industry in India due to the constant increase in
employee cost in the last few years, making it a loss-making industry or a non-

ASCENTTea Industry in India
YOUTHINK l 2022 l Vol. XVI219
profitable industry. There is no motivation for new
entrants to enter into the tea industry because of the low
profitability. The tea industry is under intense pressure
and needs all sorts of support from the Government of
India.
KEYWORDS: Largest Producer, Non-Profitable
Industry, Intense Pressure.
INTRODUCTION
Tea is a staple beverage in India. The Indian tea industry
is about 172 years old. Tea is indigenous to the northern
and eastern parts of India, but the tea industry has
developed and flourished over the previous few years,
making India one of the largest producers and growers
of tea in the world. The tea industry plays a very crucial
role in the national economy. In 1823, tea plants were
discovered by Robert Bruce, growing wild in upper
Brahmaputra Valley. India has been one of the largest
growers and producers of tea in the world, but
currently, China is the largest producer of tea due to
increased land availability.
Tea-producing states in India are as follows: West
Bengal, Assam, Kerala, Tamil Nadu, Tripura, Arunachal
Pradesh, Himachal Pradesh, Karnataka, Nagaland,
Mizoram, and Manipur (see Figure 1).
A wide variety of tea is produced in India; from CTC tea
and green tea to the aromatic Darjeeling tea and the
strong Assamese tea. The tea industry plays a key role in
earning foreign exchange and contributes a significant
share to India’s Gross Domestic Product (GDP). People
of India take a lot of pride in their tea industry. Some of
the leaders of the tea industry in India are
as follows: -
1. Gillanders Arbuthnot and Company
Limited
2. Goodricke Group Limited
3. Jayshree Tea and Industries Limited
4. McLeod Russel India Limited
5. Bengal Tea and Fabric Limited
6. Warren Tea
7. James Warren Tea Limited
8. Joonktollee Tea and Industries Limited
9. Dhunseri Tea
The objectives of this study are as follows:
1. Understanding the reasons behind the decline in
the profitability of the tea industry in India in the
past few years.
2. Understanding the reason behind increasing
interest in the sale of tea estates.
3. Studying the future prospects of the new entrants
in the tea industry of India and the position of the
existing players in the market.
4. Understanding the issues faced by the different
stakeholders of the tea industry in India.
WHAT IS THE BOARD OF INDIA?
The Tea Board of India is a state
a g e n c y o p e r a t e d b y t h e
Government of India (see Figure 2).
It has been established for the
p r o m o t i o n o f h a r v e s t i n g ,
processing, and facilitation of
domestic trade as well as the export
of tea from India to other countries. It is headquartered
in Kolkata. The Tea Board of India is headed by Deputy
Chairman Mr. Arun Ray, Indian Police Service. The
different committees which constitute the above are
known as the Executive Committee, the Development
Committee, the Labour Welfare Committee and the
Export Promotion Committee, and many more.
It is responsible for assigning
certificate numbers to the tea
exporters. This certification verifies
the tea’s origins and the quality of tea,
which in turn reduces the number of
frauds relating to labelling on rare
teas like the ones grown in
Darjeeling. This helps the exporter to
fetch a reasonable price for their tea.
Its work is to endorse the diverse
production and productivity of tea. It
also provides financial support to Figure 1: Tea Producing States of India
Figure 2

Tea Industry in IndiaASCENT
YOUTHINK l 2022 l Vol. XVI 220
research institutes. The Tea Board of India coordinates
with research institutes of tea, tea trade unions, and
government bodies, to ensure that technical support is
available to tea traders in the global tea industry. Tea
Board of India has its offices located in Kolkata (see
Figure 3), London, Moscow and Dubai.
DETAILS OF THE COMPANIES UNDER STUDY
I. Goodricke Group Limited
Goodricke Limited (see
Figure 4) has its headquarters
in West Bengal. It is one of the
l a r g e s t t e a - p r o d u c i n g
companies which is based in
India. It is associated with
Camellia PLC UK - world's leading tea producer in the
private sector. Goodricke Group Limited, Stewart Holl
Limited, and Koomber Tea Company Private Limited
are a few companies in its fold.
II. Gillanders Arbuthnot and Company Limited
Gillanders Arbuthnot
and Co. Ltd. (GACL) (see
F i g u r e 5 ) w a s a
partnership firm formed
in the 19th century. It
was started by Mr. F. M.
Gillanders and Mr. G. C. Arbuthnot. On 1st February,
1935, it was incorporated as a limited company. It later
became a part of Kothari Group of Companies, a highly
reputed group of companies in the 1960s. Assam and
Dooars quality tea is produced by Gillanders in bulk.
They have a garden which is located in the foothills of
the Himalayas and stretches along the banks of the
Brahmaputra producing that magic brew tea.
III. McLeod Russel
McLeod Russel India Ltd. is an
India-based tea company, which
was the world’s leading tea-
growing company. This company
was started in 1869 by two
Calcutta-based Englishmen,
Captain J.H. Williamson and
Richard Boycott Magor. They named the partnership
firm as- Williamson Magor and Company. To serve the
requirements of the British Empire from the tea estates
in Assam was the main objective of the company.
IV. Jayshree Tea and Industries Limited
Jayshree Tea and Industries
Limited is a conglomerate of the
Birla Empire. It was formed on
27th October, 1945. For seven
decades they had enticed the
wholesale market of tea with
their premium quality tea.
Jayshree Tea not only provides a variety of flavours but
also entices the palate and introduces it to a different
world of taste and cravings. Their objective is to cater to
the needs of the customer and keep them satisfied.
V. Bengal Tea and
Fabrics Limited
Bengal Tea &
Fabrics Limited
(BTFL) is an India-
based company that was incorporated on 16th July,
1983. The company comprises different divisions, one
of which is the tea division. It also has a textile division. It
has three tea estates. The company is listed on BSE
Limited having a paid-up share capital of ̀ 90,059,850
which is divided into shares of `10/- each. The
company’s turnover is around `1.215 billion, which
includes the turnover of the textile division as well.
Figure 3: Tea Board of India's Head Office at Kolkata
Figure 4
Figure 5
Figure 7
Figure 8
Figure 6

ASCENTTea Industry in India
YOUTHINK l 2022 l Vol. XVI221
RESEARCH METHODOLOGY
The analysis is wholly based on the primary and
secondary data collected.
1. Questionnaire was prepared for two levels of
respondents: -
(a) Managing director, vice presidents, and
managers of the companies.
(b) Audit experts who have been associated with the
tea industry for years.
2. Performance evaluation statement of various tea
industry leaders was prepared and analysis was
done.
3. Interviews of managing directors of various
companies were conducted to discuss and
understand the various problems that the tea
industry is going through.
4. Analysis of the questionnaire was done using tools
of graphical presentation like pie charts and bar
graphs.
5. Analysis of both primary data and secondary data
was conducted. Primary data was collected through
questionnaires and by interviewing the industry
experts. The sources of secondary data are annual
reports of the companies under study.
6. Also plotted are the profit figures for the last five
years to understand the downward trend in the
profits of the tea industry.
RESULTS AND INTERPRETATIONS
From our analysis in Figures 9 and 10, we can see that
most of the respondents have upto five years of
experience in the tea industry of India. From Figures 11
and 12, we can see that the responses have been
received from respondents holding different positions
in the industry, from partners, chief executive officers,
and chief financial officers to audit executives, article
assistants, and assistant managers.
Figure 9
(Source: Primary Data)
Figure 10
(Source: Primary Data)

Tea Industry in IndiaASCENT
YOUTHINK l 2022 l Vol. XVI 222
Figure 11
(Source: Primary Data)
Figure 12
(Source: Primary Data)
Figure 13
(Source: Primary Data)
ANALYSIS OF PRIMARY
DATA
(A) How is the overall
performance of the tea
industry in India?
According to Investment
Information and Credit
Rating Agency of India, the
marginal improvement in
f inancia l per formance
wi tnessed dur ing the
f i n a n c i a l y e a r 2 0 2 0
notwithstanding , profit
margins for bulk tea players
are expected to remain
under pressure during the
f i n a n c i a l y e a r 2 0 2 0
primarily owing to tepid
price movement in the
current fiscal.
In Figure 13, the responses
of the audit experts are
shown. Figure 13 shows that
out of the 56 responses,
62.5 per cent (more than 50
per cent) of the population
t h i n k s , a s p e r t h e i r
experience, that the overall
performance of the tea
industry is bad.
In Figure 14, the responses
of the management of the
tea industry are shown. Out
of 32 responses, 46.9 per
cent of the population
t h i n k s , a s p e r t h e i r
expe r i ence , t ha t t he
performance of the overall
tea industry is bad, and 28.1
per cent of the population
thinks that the performance
is poor. We can see that the
overall performance is bad
and poor, not up to the

ASCENTTea Industry in India
YOUTHINK l 2022 l Vol. XVI223
expectations of the stakeholders. This will not only have
an adverse impact on the GDP of the country but also
cast a wrong impression on the minds of the new
entrants in the industry. It also affects the morale of the
employees working in this industry.
Figure 14
(Source: Primary Data)
(B) Recently, the profitability
of the tea industry in India
has declined drastically.
The profitability of the tea
industry in India has declined
drastically in the past few
years, to be specific, since the
p a s t t w o y e a r s . F e w
companies like McLeod
Russell, which was once the
l a r g e s t t e a - p r o d u c i n g
company in India, are facing
difficulties to continue their
business due to the low profits.
Profitability analysis for the last
five years of the following
c o m p a n i e s h a s b e e n
performed: -
a) Goodricke Limited
b) Gillanders Arbuthnot &
Company Limited
c) McLeod Russel
d) Bengal Tea and Fabric
Limited
Figure 15
(Source: Primary Data)
Figure 16
(Source: Primary Data)
In Figure 15, we can see that out of 56 responses,
almost 82.1 per cent of the population agrees
that the profitability of the tea industry has
declined.
From Figure 16, we can observe that almost 96.9
per cent of the population
among the management
level agrees that the profit
of the companies have
gone down rapidly in the
past few years, making it a
non-profitable or a loss-
making industry.
(C) What is the reason for
the decline in profit in
recent years?
There can be various
reasons for the decline in
profit of the companies in the tea industry.

Tea Industry in IndiaASCENT
YOUTHINK l 2022 l Vol. XVI 224
1. Higher Cost of
Production/Sale:
One of the simplest factors that has
led to a decline in profit is
increasing labour cost. There has
been a huge increase in the labour
cost because the plantation owner
is responsible for the workers as
well as family members of the
workers who stay with them.
2. Lower/Constant Selling Price:
Reduction in selling price results in
increased sales but also reduces
gross profit margins. Companies continuously offer
discounts coupons and promotions to attract buyers
and hence increase sales, but it is not the case in this
industry. There is huge competition from countries like
China, Kenya, Sri Lanka, and many more. Hence, they
cannot increase the selling price to compensate for the
increasing cost of labour.
3. Intense Competition: Competition from new
entrants or, increase in competition or rivalry, leads to a
decrease in profit margin of the companies.
Figure 17
(Source: Primary Data)
In Figure 17, we can observe that out of 56 responses,
37.5 per cent think that reason for the decline in profits
in recent years is due to increase in labour cost, 25 per
cent think that it is due to constant selling prices, and
21.4 per cent of the population thinks that it is due to
increase in competition from other countries.
From Figure 18, it is clear that 50 per cent of the
respondents think that the reduction in profits of the
company is due to the increase in labour cost. This
would have an adverse impact as plantation owners will
start selling off their tea estates, which will lead to
unemployment for many workers.
(D) Which countries are India’s competitors in the
tea industry?
India’s tea industry is struggling to move upwards in the
value chain. It has to face stiff competition from
countries like Kenya, Sri Lanka, China and many more.
Green tea is mainly produced by
China, while other varieties of
tea (orthodox) are mainly
produced by Indonesia and Sri
Lanka. Due to this fact, a higher
volume of export is made by Sri
Lanka and Kenya as compared
to India.
From Figure 19, it is evident that
China is one the biggest
competitors of India in the tea
industry, followed by Sri Lanka.
Out of the entire population of 56, 62.5 per cent (more
than 50 per cent of the population) voted in favour of
China being India’s biggest competitor.
In Figure 20, the management and most experienced in
the tea industry also state that China is the biggest
competitor of India followed by Sri Lanka and Kenya.
Figure 18
(Source: Primary Data)

ASCENTTea Industry in India
YOUTHINK l 2022 l Vol. XVI225
Figure 19
(Source: Primary Data)
Figure 20
(Source: Primary Data)
(E) What are the future prospects for new
entrants in the tea industry?
There is no motivation for new entrants to
invest in an industry that is already making
huge losses and with no growth. The tea
industry has declined in the recent years
making it a non-profitable industry.
From Figures 21 and 22, we can observe
that both the audit-experts and
management do not feel that it will be
feasible for new entrants to enter the
industry.
(F) Recently, it has been observed that
plantation owners are selling off their tea
estates.
Plantation owners are selling off their tea
estates because they have not been able to
make profits as per their expectations and
are incurring huge losses due to workmen’s
cost of living. It will lead to unemployment
and hence will have an impact on the
economy. In Figure 23, we can see that
62.5 per cent (more than 50 per cent) of
the population agrees that they have an
intention of selling or disposing off their tea
estates.
Figure 21
(Source: Primary Data)
Figure 22
(Source: Primary Data)

Tea Industry in IndiaASCENT
YOUTHINK l 2022 l Vol. XVI 226
Figure 23
(Source: Primary Data)
Extract of Minutes of McLeod Russel: -
‘Approval for sale of Specified Assets of certain tea
estates has been received from the shareholders of the
company on 9th August, 2018. As per the approval
given by the shareholders:
a) During the year ended 31st March, 2019, the
company has sold specified assets of 16 tea estates
for `6.1491 billion. Profit on sale of such assets
amounted to `1.8041 billion is shown in the
Statement of Profit and Loss.
b) During the year, the Committee formed by the
Board of the Directors of the Company for the
purposes of disposal of assets of tea estates, further
identified the assets of four tea estates which were
approved to be sold.
The company has
e n t e r e d i n t o
M e m o r a n d u m o f
Understanding (MoU)
with the proposed
buyers to sell certain
assets of those four
t e a - e s t a t e s f o r
`1 .7815 b i l l i on ,
s u b j e c t t o d u e
d i l i gence by the
proposed buyers and
necessary approvals.
P e n d i n g s u c h
approvals et al. the
f i n a l b i n d i n g
agreements with
proposed buyers
a r e a s p e r
negotiation. The
carrying value of
those spec i f i ed
assets of the tea
estates as on 31st
March, 2019 has
been reclassified
from PPE (Property,
Plant and Equipment) to assets held for sale and the
sale consideration agreed is higher than their
carrying value.’
(Source: McLeod Russel - Annual Report, 2019)
(G) Recently, after discussing with tea plantation
workers and head office staff, it was observed that
the management was terminating employees from
their service.
In Figure 24, 53.1 per cent of the respondents agree that
the companies are terminating their employees from
the service due to insufficient profits. There will be
unemployment in the economy, which will lead to the
downfall of the economy as a whole.
Figure 24
(Source: Primary Data)

ASCENTTea Industry in India
YOUTHINK l 2022 l Vol. XVI227
(H) What is the future of
the tea industry in
India?
Through Figures 25 and
26, we can see that in
both cases 75 per cent of
the respondents have a
notion that the tea
industry of India will
further decline. The
Government of India
s h o u l d t a k e s o m e
immediate steps because
this will have a huge
impact on the GDP of the
Indian economy.
ANALYSIS ON
SECONDARY DATA
Secondary data i s
collected from the
annua l r epor t s o f
var ious companies
under study. This data is
easily available on the
w e b s i t e o f t h e
companies, National
Stock Exchange of India
Ltd. and BSE Ltd. These reports are unbiased and reflect
the true and fair picture of the company.
Profitability Analysis
Company's Name
Year Ended (?In millions)
31st March, 2020
31st March, 2019
31st March, 2018
31st March,
2017
31st March, 2016
Goodricke 126.93 256.60 488.55 488.99 28.45
Gillanders Arbuthnot And Company Limited
(220.62) 67.41 56.81 40.24 145.42
McLeod Russel (279.88) 0.02 832.34 49.95 1.88
Bengal Tea And Fabric Limited
(21.68) (17.74) 43.31 94.29 23.80
Table 1
(Source: Annual Report of the Various Companies under Study)
Figure 25
(Source: Primary Data)
Figure 26
(Source: Primary Data)

Tea Industry in IndiaASCENT
YOUTHINK l 2022 l Vol. XVI 228
Figure 27
We can see from Figure 27, the upward and downward
movement in the profitability of the companies.
Goodricke’s profit figures are better than the other
companies but there is an overall decline in the profit of
the company.
CONCLUSION
The tea industry in India was once the largest producer
of different varieties of tea. However, recently, we can
see that China has taken over the market share of India.
China is the biggest competitor of India followed by Sri
Lanka, Indonesia, and Kenya. Green tea is mainly
produced by China, while other orthodox varieties of
tea are produced by Sri Lanka and Indonesia.
We can conclude that the tea industry’s performance in
the past few years has declined drastically. There has
been a fall in the profits of the companies in the tea
industry due to an increase in labour cost, making it a
loss-making industry or a non-profitable industry. There
is no motivation for new entrants to enter into the tea
industry because of low profit.
The main reasons for the decline in the profit of the
companies as observed from the responses are as
follows:
?Increase in labour cost.
?Constant selling price.
?Increase in competition from
neighbouring countries.
?Low demand for tea.
?High dependence on the
weather conditions.
The Government of India should
take immediate steps because a
decline in tea industry would have a
great impact on the Indian economy.
There will be unemployment in the
economy. It was also observed that
employees were getting terminated
from their service due to insufficient
profits, indicating job insecurity
among the workers and employees
of the tea industry of India. It is recommended that the
Government should provide tax benefits and other
forms of benefit so that the industry can grow.
Hence, we conclude that the tea industry is under
intense pressure and needs all sorts of support from the
Government of India.
REFERENCES
The following information has been collected from the following
sources: -
1. https://en.wikipedia.org/wiki/History_of_tea_in_India#
History
2. https://www.indianmirror.com/indian-industries/tea.html
Note: -
(i) The figures have been taken from the annual
reports of the respective companies.
(ii) The profit of Goodricke Limited as on 31st March,
2016 i.e., `28.45 million is the profit for the
fifteenth period i.e., from 1st January, 2015, to 31st
March, 2016. It is also to be noted that before that
the financial year for the company was from 1st of
January to 31st of December.
(iii) The profit of McLeod Russel as on 31st March,
2019 i.e., `0.021 million is after deducting
extraordinary income from sale of land.

ASCENT
YOUTHINK l 2022 l Vol. XVI229
Examining the Relation between Productivity and Working Hours in the Education SectorProf. Aparajita HembromAssistant ProfessorDepartment of Commerce (Evening)
Marissa Anne SumDepartment of Commerce (Evening)
It is safe to say
that when
working hours
stretch long
enough to disrupt
the work-life
balance,
productivity is
affected
negatively.
ABSTRACT
This paper attempts to study the relation between productivity and working
hours in the education sector using information collected from teachers
related to their working hours and health status. The study focuses on the

Examining the Relation between Productivity and Working Hours in the Education SectorASCENT
YOUTHINK l 2022 l Vol. XVI 230
nature and behaviour of input, as stated by teachers,
and measures productivity through attributes that are
universally accepted to be pre-requirements of a
productive mindset. The results indicate that
productivity and working hours are related and an
integral cause is the satisfaction teachers experience
from their work-life balance.
KEYWORDS: Productivity, Working Hours, Work-Life
Balance.
CONCEPTUAL FRAMEWORK
In the education sector, there is a great disconnect
between input and output (Hanushek and Ettema,
2017). Thus, many cause-effect relationships are yet
unclear. If we define output for a teacher as the service
they provide to students and other teachers,
productivity for a teacher would be the quality and
efficiency with which they deliver such services. It is not
possible to measure and compare their performance as
it is largely subjective. Thus, I intend to study certain
attributes that are related to or essential in order to be
productive, namely, attentiveness, physical and mental
wellbeing, and good work-life balance.
BACKGROUND
It is a common notion that input is directly proportional
to output. That is, as input increases, output shall
increase. Though this statement holds well in many
circumstances, the heterogeneous nature of input
makes it infeasible to call it a universal truth. Labour as
input is responsible for the complexity in the seemingly
simple relation between input and output.
For long, this phenomenon was seen through purely
economic lenses and was commonly credited to the
concept of diminishing marginal returns. But as thinkers
and leaders worldwide got a better understanding of
these concepts, it emerged as a subject of psychosocial
analysis. However, even after so many decades, we are
still on the journey to completely unravel the secrets
and anomalies of labour as a factor of production.
RESEARCH GAP
It is clear to see that a diverse subject like this can be
approached in many ways. Yet most work done on this
topic has only contributed or in most part solely
considered, the economic aspect of the relation. At
times, the results have been tainted with the flaws of the
research method adopted.
LITERATURE REVIEW
Fredrick Taylor (1857) had explained that division of
work is a useful tactic to improve production because
when a worker keeps repeating the same activity, he
masters it and is able to do it better with time. In other
words, by repeating a job, labourers acquire ‘practice-
efficiency’, a term coined by Vernon (1921). This is why
productivity can be expected to increase with the
increase in working hours. However, increasing
working hours also creates the factor of fatigue which
can adversely affect productivity.
Fatigue is a psychophysiological phenomenon (Van Dijk
and Swaen, 2003) and previous studies on the link
between productivity and working hours in the
manufacturing industry have outlined the role of
worker fatigue. (Goldmark, 1912; Vernon, 1921).
A study conducted by Ng Chi Man et al., (2014) found
that there is no statistically significant correlation
between working hours and productivity in the food
services and information communication industries in
Hong Kong. Another study concluded that though the
quantity of output suffered, the quality could
potentially improve due to an increase in working hours
(Collewet and Sauermann, 2017).
As a majority of the studies on the relation between
productivity and working hours report that increase in
working hours yield diminishing returns (Crocker and
Horst, 1981; Brachet et al., 2012; Pencavel, 2015,
Dolton et al., 2016; Collewet and Sauermann, 2017), it
seems that fatigue, and factors of the like, outweigh the
merits of practice-efficiency.

ASCENTExamining the Relation between Productivity and Working Hours in the Education Sector
YOUTHINK l 2022 l Vol. XVI231
OBJECTIVES OF STUDY
The primary purpose of this study is to ascertain if there
exists any relation between productivity and working
hours in the education sector. If any relation exists
between them, the study aims to determine the nature
of it. Additionally, attempting to define the role of work-
life balance in the scenario is the secondary objective of
conducting this study.
RESEARCH METHODOLOGY
21 candidates from different social backgrounds
working in diverse conditions were chosen by
purposive sampling. They were given to fill a
questionnaire. As attention is an essential attribute of
productivity that cannot be effectively measured via a
questionnaire, an attempt was made to measure the
attention of candidates before and after a normal
working day. The Sustained Attention to Response Task
(SART 2, which is a widely used continuous
performance task that measures sustained attention.
The original study was conducted by Robertson et al.
(1997) in Neuropsychologia) was selected as the tool.
DATA ANALYSIS AND FINDINGS
M o s t c a n d i d a t e s
answered that at times
t h e y f a c e d h e a l t h
problems (physical) that
restricted them from
doing the kind or amount
of work they could do.
These responses when
studied with the actual
hours worked and days
r e g u l a r l y w o r k e d ,
showed that as actual
hours worked increased,
the frequency of physical
health problems faced
also increased.
The majority of the
candidates reported
considerable stress levels. When studied with the actual
hours worked and days regularly worked, it showed that
as actual hours worked increased, the incidence of
work-related-stress also increased sharply.
A large chunk of the sample admitted to experiencing
mental health problems, such as emotional fatigue,
either rarely or sometimes. However, calculations
showed a weak yet negative correlation (-0.1) between
actual hours worked and this index. Analysis showed
that the level of sustained attention of 37.5 per cent of
the people decreased after work. This implies that
constant working hours tend to cause a fall in the level
of attention of people in over of one-third cases. As
attention falls with hours worked, productivity is also
adversely affected. In the entire sample, only 56 per
cent of the candidates feel they have time to participate
in skill-enriching activities while all others either don’t,
or they must compromise on work to make time.
WORK-LIFE BALANCE IN THE SCENARIO
It was observed that as working hours increased, work-
life satisfaction first increased then decreased with the
maximum number of people satisfied with the balance
belonging to the 30 to 35 working hours a week
category.
Figure 1: Number of People Who Reported Fair Satisfaction
with Work-Life Balance Grouped by the Actual Hours Worked
(Source: Primary Data)

Examining the Relation between Productivity and Working Hours in the Education SectorASCENT
YOUTHINK l 2022 l Vol. XVI 232
A l t h o u g h m o s t
candidates expressed
fair satisfaction with
the work-life balance,
the same candidates
also said that given the
option, they would
choose a 10 per cent
increase in salary
implying that though
they are happy with
t h e i r w o r k i n g
c o n d i t i o n s , t h e y
believe the salary they
receive does not do
justice to the amount
of work they put in.
To get a closer look,
par t ic ipants were
categorized into two
groups according to
their satisfaction with the work-life balance.
The first group consisted of participants who
reported that they were fairly satisfied (four
on five) with the work-life balance their work
offered. The other group was of people who
gave a rating of two or three. The actual hours
worked in each group were compared with
the frequency of physical health issues faced.
It was found that as working hours increased,
people who were considerably satisfied with
their work-life balance faced fewer physical
health issues, whereas it was the opposite for
people who reported dissatisfaction with
their work-life balance. This goes to show the
impact of satisfaction with work-life balance
on physical health.
Figure 2: Difference in the Frequency of Physical Health Issues Faced by Persons Who are Fairly Satisfied
with Their Work-Life Balance and Persons Who are Dissatisfied with the Same
(Source: Primary Data)
When the rates of error in tests before and
after these two groups were studied, it was
found that people who were more satisfied
with their work had a very slight fall in the
level of attention before and after work.
Group 1 (Fairly satisfied with work-life balance)
Group 2 (Not satisfied with work-life balance)
Name
Increase or decreasein mistake percentage
frombefore to after
Name
Increase or decrease in mistake
percentage frombefore to after
A +16 per cent I -24.50 per cent
B -16.50 per cent J +5 per cent
C +19.50 per cent K +19.50 per cent
D -30.50 per cent L -1.50 per cent
E -17 per cent M +43 per cent
F -0.50 per cent
G +24 per cent
H +29 per cent
Mean = 3 per cent Mean = 8.30 per cent
(Implying that on average, people
(Implying that on an average, people
tended to make 3 per cent more mistakes after work)
tended to make 8.3 per cent more mistakes after work)
Table 1: Level of Change in Mistake Percentage of Group 1 and Group 2
(Source: Primary Data)

ASCENTExamining the Relation between Productivity and Working Hours in the Education Sector
YOUTHINK l 2022 l Vol. XVI233
Moreover, the correlation coefficient between the
increase in mistake percentage from before to after and
satisfaction with work-life balance was calculated as -
0.17054, indicating that as satisfaction with work
increased, fall in attention level after work decreased.
Thus, people who are more satisfied with their work
tend to have a better attention level even after work.
At a 10 per cent level of significance, it was found that
figures in both tests suggested acceptance of the null
hypothesis. Thus, statistically proving that irrespective
of the number of hours, participants were more
attentive before work compared to after work.
However, it should be noted that the difference in the
mean of rates of error between the first and second test
in Group 1 (13.10 per cent) was larger than the 1 per
cent increase in the mean of rates of error from the first
test to the second test in Group 2. This means that
though the attention level of participants from both
groups fell with hours worked, the magnitude of fall was
much lower in participants who worked for more than
30 hours a week. Higher working hours have a lesser
negative impact on attention level.
CONCLUSION AND RECOMMENDATIONS
The journey undertaken by this study has yielded many
results - some expected while others quite not.
Nevertheless, they all point to the fact that there exists a
relation between productivity and working hours in the
education sector, albeit a complicated one.
The majority of the people in the sample who expressed
fair satisfaction with the work-life balance offered by
their job worked 30 to 35 hours per week in the
education sector. A lesser number of people who
worked below or above this level reported such
satisfaction.
The hypothesis conducted as part of the study revealed
that the level of attention after work is poorer compared
to the level before work. However, the same hypothesis
testing revealed that higher working hours had a lesser
negative impact on attention level. Liberty may be
taken to sketch an extension from these results that
though attention level falls with hours worked, at some
point it starts to improve to a noticeable extent.
However, the author is of the view that attention level
varying with different levels of working hours has more
to do with the satisfaction people experience from their
work-life balance than the actual hours worked by
them. This was proven by the data analyzed in Table 1.
People who were more satisfied with their work-life
balance not only showed a lesser fall in the level of
attention but also in the frequency of physical health
issues faced. Figure 2 represents the difference in the
relation between physical health issues and working
hours for people who were satisfied with their work-life
balance and the people who were not. As people who
are dissatisfied with their work-life balance work more
and more hours, the frequency of physical health issues
faced by them rises steeply. But the opposite is noticed
in people who are quite satisfied with their work-life
balance; they show a slight and steady fall in the
frequency of physical health issues. Therefore, it is clear
to see that work-life balance and people’s satisfaction
with it play an integral role in the relation between
productivity and working hours. It is safe to say that
when working hours stretch long enough to disrupt the
work-life balance, productivity is affected negatively.
Those eager to test the validity of results yielded by this
study in areas lying outside the universe of this study are
encouraged to enlarge and diversify the sample size and
possibly incorporate more comprehensive tests, not
only to obtain more in-depth and holistic information
but also to verify the information so obtained.
LIMITATIONS OF THE STUDY
This study and its findings largely depend on the results
of productivity measured. The definition, method of
measuring, and interpretation thereupon of such
productivity is highly subjective which makes the
validity and success of the study stand on the needle-tip
of the reader’s perspective. Many would disagree with
this study’s definition of a teacher’s productivity as it
substantially reduces the importance of time that
productivity in other sectors is accustomed to.
Measurement of productivity is another aspect where
this study has chosen an uncommon path. Productivity
has been divided into essential attributes and these

Examining the Relation between Productivity and Working Hours in the Education SectorASCENT
YOUTHINK l 2022 l Vol. XVI 234
attributes have been measured. Satisfaction with work-
life balance, physical and mental wellbeing,
motivation, and level of stress experienced have been
recorded by questioning the subjects which means
there are no set standards to hold the answers to. The
tool used to measure attention is a well-known,
designed, and tested tool but it brings with itself an
element of digital complexity.
Another limitation is the considerably small sample size
which means the sample distribution is not normal (as it
is less than 30). Lastly, lack of direct contact with the
participants has left room for misinterpretation of
instructions and therefore, there is a possibility of
collection of incorrect data that cannot be completely
relied upon.
REFERENCES
1. Collewet M. and Sauermann J. (2017). Working Hours and
Productivity. IZA Discussion Paper No. 10722.
Available at SSRN: https://ssrn.com/abstract=2960531
2. Cui D., Cui N., Nijkamp P., Wei X., Wu D. (2019). Leisure
time and labour productivity: a new economic view rooted
from a sociological perspective. Economics: The Open
Access, Open-Assessment E-Journal, 13 (2019-36): 1–24.
http://dx.doi.org/10.5018/economics-ejournal.ja.2019-36.
3. Eric A., Hanushek E.E. (2017). Defining Productivity in
Education: Issues and Illustrations.
4. The American Economist.
5. Gelade G., Treisman A. (1980). A feature integration theory
of attention, Cognitive Psychology, 12, 97-136.
6. Li X., Prescott D. (2009) Measuring Productivity in the
Service Sector.
7. https://www.researchgate.net/publication/268440342_
Measuring_Productivity_in_the_ Service_Sector#pf3.
8. Man N.C., Ling T.W. (2014). Relationships between Working
Hours and Productivity.
9. The Case of Food Services and Information Communication
Industries in Hong Kong, Advances in Economics and
Business 2(7): 281-292, 2014 http://www.hrpub.org DOI:
10.13189/aeb.2014.020704.
10. Solow R.M. (1957). Technical change and Aggregate
Production Function. The Review of Economics and
Statistics, Vol. 39, No. 3. (August, 1957), pp. 312-320.
11. Stoet G. (2010). PsyToolkit - A software package for
programming psychological experiments using Linux.
Behaviour Research Methods, 42(4), 1096-1104.
12. Stoet G. (2017). PsyToolkit: A novel web-based method for
running online questionnaires and reaction-time
experiments. Teaching of Psychology, 44(1), 24-31.
13. Treisman A. (1977). Focused attention in the perception and
retrieval of multidimensional stimuli. Perception and
Psychophysics, 9, 40-50.
14. Employment Market Analysis and Research, Department of
Trade and Industry, (2003) www.dti.gov.uk/er/emar

ASCENT
YOUTHINK l 2022 l Vol. XVI235
An Empirical Approach to the Potential Valuation of LIC
Dr. Joyita BanerjiAssistant ProfessorDepartment of Commerce (Morning)
Ashutosh JaiswalDepartment of Commerce (Morning)
The insurance
sector in India is
suffering from
problems like low
penetration rate,
low policy
renewal rates, et
al. as of now, but
on the bright side,
it has the
potential to grow
in the future. ABSTRACT
The research paper ‘An Empirical Approach to the Potential Valuation of LIC’
has explored the overall existence, purpose, and other aspects of the
insurance sector in India. It tries to explain the background of the Indian
insurance sector, how it has evolved post-independence and how the various
new regulations have brought a change in this sector post 2000. The
performance of this sector depends on the various recent developments and
the initiatives taken by the Government. In this study, both these things are

An Empirical Approach to the Potential Valuation of LICASCENT
YOUTHINK l 2022 l Vol. XVI 236
discussed properly. Life Insurance Corporation of India
(LIC) is considered as the backbone of the Indian
insurance sector, and it is expected that the upcoming
Initial Public Offer (IPO) of LIC is going to be a big event
for this sector. LIC has been valued using the top-down
approach in this study. The study concludes with
recommendations for the insurance sector of India.
KEYWORDS: Valuation, IPO, Investment.
INTRODUCTION
In recent times, the development of the insurance
sector and various insurance instruments has impacted
the performance of an economy to a great extent.
Insurance sectors of various countries across the globe
are growing tremendously after the year 1990. India is
no exception; the insurance sector of India is growing
dynamically (Statista Research Department, 2020).
There are a variety of insurance companies operating in
the Indian insurance sector. Be it public or private,
listed, or unlisted, life insurance or non-life insurance
company, India has it all. Insurance instruments provide
us with a lot of benefits like protection against the
contingent event, financial security, debt coverage, and
tax benefits.
On 1st September, 1956 more than 245 companies
(both Indian and foreign) were merged and
nationalized to form the Life Insurance Corporation of
India (LIC). This was done under the LIC Act, 1956. All
the 55 companies relating to General Insurance were
nationalized to form General Insurance Corporation of
India (GIC), in the year 1972, under the General
Insurance Business (Nationalization) Act, 1972
(popularly known as the GIBNA Act).
In the year 1999, under the Insurance Regulatory and
Development Authority of India (IRDAI) Act, the
Insurance Regulatory and Development Authority of
India was established to bring about proper supervision
of the insurance sector in India. Prior to 2000, the
Indian sector was not open to private and foreign
players. It only had five companies in 2000. Post these
regulations, many new insurance companies were set
up in India. As of today, there are 57 insurance
companies in India.
In the year 2015, the Government increased the foreign
investment limit from 26 per cent to 49 per cent. This
was a blessing for the insurance industry as more
investments (from developed nations) were made in
various insurance companies in India.
The importance of LIC has only increased over time
since its formation in 1956. It is now considered to be
the torchbearer of the Indian insurance sector. The
budget has sparked the talks of it being listed on the
stock exchange soon which makes conducting the pre-
IPO valuation of LIC an important thing to do. Valuation
of LIC has been shown using different methods.
Valuation requires many inputs, the required rate of
return being the most important one. The Capital Asset
Pricing Model has been used to find the required rate of
return.
OBJECTIVES OF THE STUDY
This paper aims to propose a valuation of LIC (the
juggernaut of the Insurance sector) by using the CAPM
approach. In this year’s budget, the Government has
hinted that LIC will come out with its IPO. It is expected
that this will be one of the biggest IPOs that the Indian
market has ever seen. IPO pricing is still a controversial
area of valuation; there are numerous methods, but the
perfect valuation is yet to be empirically proved. In this
paper, the CAPM approach has been used to provide a
base value of how LIC’s IPO may be appraised. This is in
no way a conclusive study; its aim is to allow the readers
to prospectively evaluate the insurance sector as an
investment avenue. LIC has a market share of about 70
per cent in India so conducting its valuation will give the
readers an insight into how the insurance sector of India
is expected to perform in the financial markets of the
near future.
LITERATURE REVIEW
?Madan Mohan Dutta in his study conducted in
2020, ‘Insurance Sector in India: An Analysis of its
Performance’ has discussed how health insurance
has primarily contributed to the growth of the
insurance sector in India. He has also discussed

ASCENTAn Empirical Approach to the Potential Valuation of LIC
YOUTHINK l 2022 l Vol. XVI237
briefly about the increasing penetration rates and
the increasing amount of premium received. (Dutta,
2020)
?Drishti IAS in their study conducted in 2020,
‘Insurance Sector in India’ has discussed the
challenges faced by the insurance sector in India. In
their study they have explained the concept of ‘Saral
Jeevan Bima’ and how it can be used to increase the
penetration in India. (Dristi IAS, 2020)
?Ashwin Manikandan and MC Govardhan Rangan in
their article ‘Staying Contrarian has Worked for LIC;
IPO Process is the Fast Lane’ in 2021, have discussed
about LIC touching lives in India when it comes to
financial security. They have also discussed how a
contrarian approach has helped LIC over the years.
(Manikandan and Rangan, 2021)
?Disha Sanghvi in her work ‘COVID-19: How has it
Impacted Insurance Industry in India’, conducted in
2020, has discussed how the uncertainty brought by
COVID-19 has pushed people to buy Health
Insurance and Term Life Insurance. She has also
talked about how the renewal rates of insurance
contacts have risen significantly during the
pandemic. (Sanghvi, 2020)
RECENT DEVELOPMENTS IN THE INSURANCE
SECTOR
As of now, the insurance companies are entering into
strategic partnerships to provide various services. In
December 2020, SBI and RailYatri partnered together
to offer better travel insurance to domestic bus
travelers. ICICI Lombard partnered with Plum to co-
create technologically backed health insurance
products for the first time in India. Bajaj Allianz and
Muthoot Finance came together to provide insurance
on gold jewellery.
In November 2020, The ANANDA or AtmaNirbhar
Agents New Business Digital App was launched by LIC.
It aimed to aid the agent and brokers to provide
insurance policy through a paperless module. HDFC
ERGO General Insurance tied up with NSDL Payment
Bank Services so that the former can use the latter's
wide distribution network to provide its customers with
different general insurance products. (IBEF
Organization, 2020)
IMPACT OF COVID-19 ON THE INDIAN
INSURANCE SECTOR
COVID-19 has brought both positive and negative
impacts on the Indian insurance sector. The positive
impact is that due to the outbreak of the pandemic
people are now realizing the importance of health and
life insurance and thus people are applying for the
same. The negative impact is that due to the pandemic
people have lost their livelihood and meeting their day-
to-day expenses is a tough task these days. In such a
scenario, people are refraining from buying health
insurance contracts as they have to pay regular
premiums for the same. Life insurance primarily focuses
on protecting the livelihoods of the people and their
future financial security. As a result, life insurance has a
direct correlation with the earnings of people, their
business performance, and net worth. Since the onset
of the pandemic, there has been a rush to increase
one’s cover. While long-term guarantees will look
attractive, insurers will still face constraints as the
interest rates plummet; with consumers becoming
more cautious about their investments, leading to an
unstable stock market. (Chandrashekharan, 2020)
BRIEF PROFILE OF LIC
LIC is considered as the backbone of the Indian
insurance sector. LIC has approximately 280 million
policies in force, with a total premium collection of
45,000 billion. Since its inception, it has been
completely under the ownership and control of the
Government of India. In the budget session of FY 2020-
21, the Finance Minister of India announced the
proposal of minority shares selling of LIC through IPO
launch. Given the great size and importance of the
corporation, it is expected to be the biggest IPO launch
in India yet. Thus, this IPO is expected to change the
dynamics of the insurance sector. And because of all
this, the valuation of LIC has been included while
analyzing the insurance sector.

An Empirical Approach to the Potential Valuation of LICASCENT
YOUTHINK l 2022 l Vol. XVI 238
ANALYSIS
For the sake of predicting the IPO value of LIC, the
CAPM approach has been used in the study. The Capital
Asset Pricing Model or CAPM is a model that describes
the relationship between systematic risk and the
expected return for assets (particularly stocks). CAPM is
a very popular model in the field of finance. It is widely
used throughout finance for pricing risky securities and
generating the expected returns for various assets, given
the risk of those assets and the cost of capital. (French,
2003)
WHY CAPM?
The CAPM has been used in this study because it is
based on the concept of systematic risk and
diversification of portfolios. Since other models based
on the Dividend Discount Model (DDM) fail to capture
the systematic risk, CAPM is a better choice (ACCA,
2018). Systematic risk is an unpredictable risk that
cannot be completely obliterated, and the insurance
sector, which is based on the probability of risk, is
perhaps more vulnerable to such volatility. The entry of
private competitors in the background of the COVID-
19 crisis is perhaps a change that can affect the standing
of LIC. For this reason, the CAPM best serves the
purpose of stock valuation, with its incorporation of
market risk. In this study, comparable competitors have
been used to estimate the market risk, both similar in
terms of market size or administration or a combination
of both. This leads to a reasonable estimate of ß, which
is based on the previous five years information since the
Foreign Direct Investment (FDI) limit in insurance was
raised to 49 per cent in 2015. The information thus
reflects the change in the market already caused due to
FDI regulatory changes.
Eri = RF+ßi(ERm- RF)
Where RF= Risk-free rate
ERi = Expected return of investment
(Erm- RF) = Market risk premium
Bi = Beta of the investment
Use: CAPM is used to find a discount rate and then the
expected future cash flows of the company are
discounted back (from their value when they are
expected to be earned to today's value).
Assumptions:
?Investors face no unsystematic risk, which means
that they have their investments properly
diversified.
?Investors are rational and risk averse.
?Unlimited borrowing and lending at a risk-free rate
of interest is allowed.
?No transaction costs or taxation costs.
Calculation of Required Rate of Return (using CAPM):
1. R :10 years Long Term Government Bond’s Yield = f
6.180 per cent or 6.2 per cent (approx.)
(As of 16th March, 2021 Source: Investing.com)
2. R : Return on the Indian equity (Taking Return of m
Nifty50 as proxy) = 8.22 per cent
(As of 16th March, 2021 Source: Investing.com)
3. Calculation of Beta:
Company’s Name
Similarity with LIC Beta*
GICBoth are government
owned.
0
(Since no debt)
HDFC LIFEBoth are Life
Insurance companies.0.81
LIC Housing Finance
Both are government
owned and the same type of management.
0.95
LIC
=(0+0.81+0.95)/3
=0.588867
=0.60(approx.)
Table 1
*The Time Frame of Beta is Five Years, Monthly Calculated
(As on 16th March, 2021, Source: MoneyControl.com)
So, Re = [6.2 + (8.2 – 6.2) x0.60] per cent = 7.4 per
cent
Adding 4.1 per cent and 3 per cent, which is Liquidity
Risk Premium and Credit Risk premium respectively.
These are based on the consensus estimates of the
market.
So, Adjusted Required Rate of Return is 14.5 per cent.

ASCENTAn Empirical Approach to the Potential Valuation of LIC
YOUTHINK l 2022 l Vol. XVI239
VALUATION OF LIC USING TOP-DOWN
APPROACH
In the top-down approach, the expected turnover of
the overall insurance sector is estimated using inputs
like current size and expected CAGR. Then from that,
Serial Number
ParticularsAmount
(In INR)
A Insurance Sector Turnover in FY20 7,310 million
BCAGR of Insurance Sector
(Refer to CAPM results of author above)
14 per cent per annum
CProjected Turnover in FY21
(A X B)8,334 million
D
Market Share of LIC
(Source: Motilal Oswal Financial Services Ltd.and Livemint)
40 per cent
EProjected Turnover of LIC
(C X D)3,333.4 million
F
Net Profit Margin of LIC
(Based On Average Net Profit Margin of The Insurance Sector
Source: Business Standard)
8.4 per cent
GNet Profit of LIC
(E X F)280 million
H
Dividend Payout
(Based on the average payout of listed insurance companies)
25 per cent
IProjected Dividend for Next Year
(G x H)70 million
JPresent Value of Dividend Using Single
Stage DDM
70/(0.145 – 0.14)
=1,400 million
KNumber of Shares
(Based on reports of Money Control)100 million shares
L Issue Price Per Share 14 per share
the turnover of LIC is calculated. From turnover, profit is
estimated and from that dividend is estimated. After
getting the dividend we apply a single-stage DDM to get
the equity value of LIC. (Kotzin, 2005)
Advantage of this approach is that it helps investors to
determine an ideal allocation for
a portfolio.
CONCLUSION
LIC is the foremost company that
comes to mind when there is
mention of the Indian insurance
sector. It is the most important
insurance company of India,
given its history and market size.
It was LIC who laid the
foundation of the Indian service
sector. In 2021, we are about to
see the much-awaited IPO of LIC
which is going to change the
dynamics of the sector.
The IPO of LIC will be an event of
great importance. It will help the
company get a huge amount of
funds which will be used for
b e t t e r w o r k i n g c a p i t a l
management and for expanding
its business overseas. The
insurance sector helps the
economy as it promotes capital
formation in a very efficient
manner. When the IPO of LIC
rolls out, the capital formation
will take place on a greater and
more efficient scale as both retail
investors and institutional
investors will try to invest in the
company. The insurance sector
in India is suffering from
problems like low penetration
rate, low policy renewal rates, et
al. as of now, but on the bright
side, it has the potential to grow
Table 2

An Empirical Approach to the Potential Valuation of LICASCENT
YOUTHINK l 2022 l Vol. XVI 240
in the future. Post IPO we can expect tougher
competition between the top insurance companies of
India and this competition will benefit the masses as
they will get better insurance services. Ex-ante the
privatization decision of the Government seems correct
as LIC is in need of funds and over the years we have
seen that the performance of government-owned
entities is deteriorating. Post the IPO, the privatization
decision will be proved right if the IPO is
oversubscribed.
RECOMMENDATIONS
It is expected that only 10 per cent of the stake will be
sold in the IPO and thus the actual control will still lie in
the hands of the Government. This can discourage
many investors from investing in LIC as the performance
of government-controlled entities is not that good in
recent years. Under-pricing of LIC IPO will be a great
blow to its brand image. The IPO price of LIC can be
overpriced due to its strong financials as well as the
hype created about it.
LIC may face some problems with its upcoming IPO
when it comes to meeting the new norms issued by the
Securities Exchange Board of India (SEBI).
REFERENCES
1. ACCA, (2018). Financial Management Study Guide. London:
ACCA.
2. Chandrashekharan, (2020). The impact of Covid 19 on the
Indian Insurance and Reinsurance sector. (P. P. Ltd.,
Interviewer) Bengaluru: PwC.
3. Dristi IAS, (2020, October 26th). Insurance Sector in India.
Indian Economy.
4. Dutta, M. M. (2020). Health Insurance Sector In India: An
analysis of its performance. Vilakshan: XIMB Journal of
Management, 97-109.
5. French, C. W. (2003). The Treynor Capital Asset Pricing
Model. Journal of Investment Management, pp. 60-72.
6. IBEF Organization. (2020, July 2021). Indian Insurance
Industry: Overview and Market Development Analysis.
Retrieved August 30, 2021, from IBEF: https://www.ibef.org/
industry/insurance-sector-india.aspx
7. Kotzin. (2005, 20 April). Top-Down Process; Understanding
Business Valuation. Retrieved April 21, 2021, from Kotzin
Valuation Partners: https://www.kotzinvaluation.com/
articles/understanding-business-valuation
8. Rangan, A. M. (2021, January 11). Staying contrarian has
worked for LIC; IPO process is the fast lane. Economic Times.
9. Sanghvi, D. (2020, June 17). Covid-19: How has it impacted
Insurance industry in India. Mint.
10. Statista Research Department. (2020, July 2021). Life and
Non-Life Insurance penetration in selected countries globally
2020. Retrieved August 30, 2021, from Statista:
https://www.statista.com/statistics/381174/insurance-
penetration-in-selected-countries-worldwide/
ASCENT
YOUTHINK l 2022 l Vol. XVI241
India under Pandemic: A Study on Factors Influencing Purchasing Decisions of BicyclesDr. Arijit GhoshAssistant ProfessorDepartment of Commerce (Morning)
Harsh Prakash NahataDepartment of Commerce (Morning)
If customized and
widely used,
bicycles can solve
a majority of
small-distance
travel problems.
ABSTRACT
In today’s world, people widely use vehicles requiring petrol, diesel or
electricity. At present, bicycles are largely used for recreation, sport and
transportation. In places where there are few automobiles, bicycle acts as an
important mode for moving people and goods. Amidst pandemic COVID-
19, maintaining social distancing and a healthy lifestyle is very essential.
Bicycle fits in satisfying these requirements. In this research study, we aim to
find out the various factors that have an impact on the purchasing decisions
of bicycle during the pandemic. It explores the responses to understand the

India under PandemicASCENT
YOUTHINK l 2022 l Vol. XVI 242
behavioural pattern and their outlook towards this eco-
friendly mode of transport. The study is a cross-
sectional study to identify which factors influence
bicycle purchase decision during the pandemic. A pilot
study was conducted and subsequently a final
purposive sampling of 400 respondents was done
through a structured questionnaire within India and the
respondents were mainly who have purchased and
used a bicycle. Reliability analysis and subsequently
factor analysis has been applied. Four factors ‘Health
and Entertainment’,‘Convenience, Environment and
Pocket friendliness’, ‘Inconvenience and Security’ and
‘Infrastructure and Safety’ have been identified. It is
observed that the present pandemic-stricken
environment is favourable for promoting bicycle as it
ensures social distancing and healthy lifestyles. The
bicycle market is expected to grow at a faster rate in
coming years.
KEYWORDS: Pandemic, Purchase Decision, Eco-
Friendly, Reliability Analysis, Factor Analysis.
INTRODUCTION
In the current scenario, vehicles requiring petrol and
diesel are widely used by people. However, in the
present times, the demand for electric vehicles is also
increasing. A majority of today’s cars and bikes operate
with the help of fossil fuels and cause huge damage to
the environment. Gases emitted by these vehicles are
also a threat to the environment. Moreover, the prices
of petrol and diesel keep on fluctuating, which causes
problems to the middle-class people. Besides, the
repairing cost of these vehicles is also high.
Electric vehicles, have fewer disadvantages as
compared to those which require diesel or petrol.
However, despite these vehicles using electricity to run,
it is leading to people becoming less physically active.
Bicycles, if customized and widely used, can solve a
majority of small-distance travel problems. Presently,
bicycles are widely used for recreation, transportation
and as a sport. Bicycles act as an important mode of
transport for both people and commodities, in places
where there are few automobiles. Moreover,
maintaining social distance and leading a healthy
lifestyle, amidst the COVID-19 pandemic, is very
necessary. Bicycle fits in fulfilling these conditions. It
does not require petrol, diesel or electricity to operate.
No one can deny that a bicycle, as compared to other
vehicles, has certain advantages. It acts as a mode of
transport that helps us in combating traffic-related
hurdles. Cycling is environment-friendly as it does not
emit harmful and toxic gases into the atmosphere.
Moreover, one does not need a license to operate it. It
can be used at any time of the day and the maintenance
costs, parking-related costs and repairing costs are
negligible. One can park a lot of bicycles in the same
area one requires to park a car. In many developed
cities, there is a good cycling infrastructure with
separate cycleways. In the long run, purchasing a
bicycle is better than getting a car, as it is a cost-effective
mode of transportation. Studies have shown that
bicycle commuters are more active, healthy, fit,
productive and can do more work in less time. Cycling
helps reduce stress and anxiety as it helps us inhale
more oxygen, making us breathe deeper. Bicycles do
not damage the roads as most other vehicles do.
Moreover, cycling is animal-friendly. Cycling is also a
good source of enjoyment with friends and family.
Though it has many advantages, we cannot ignore that
it has disadvantages too. People argue that it is an
uncomfortable mode of transport because it has a small
seat which sometimes causes back pain. Considerably,
more labour is required to ride a bicycle and bad
weather may demotivate cycling. Bicycles are not good
for long-distance travel and it is also argued that cycling
is not safe in hilly regions.
Nowadays, these vehicles are being improved and
modified with more rider-friendly features being added
in the modern bicycle, which helps in minimizing the
disadvantages and hurdles people face while cycling.
Inspired by bikes and cars, today’s cycles also have
gears in them. A geared bicycle allows one to make
multiple combinations of gears. So, if one wishes to use
a bicycle in a hilly region, one can apply lower gears to
pedal faster, which gives comfort to the legs. Geared
cycles help maintain the rate at one pedal per minute.
One more advantage of using a geared cycle is that one
can go for long-distance, adventurous rides without
feeling tired and exhausted.

ASCENTIndia under Pandemic
YOUTHINK l 2022 l Vol. XVI243
Another modification made in cycles is the availability
of a variety of frames. Earlier, frames made only of steel
were available, but now, carbon, aluminium and
titanium frames are also available. Steel frames are
comparatively heavier and make it uncomfortable for
the rider to ride. Aluminium frames, however, are
relatively light, stiff and affordable. These frames absorb
road buzz better and make the rider feel comfortable.
Carbon frames do the same job but are slightly costlier
than the aluminium ones. The feature of disc brakes is
also included in cycles to make them more attractive
and to motivate people to use them. Disc brakes give
better braking power to cycles so that even wet roads, in
rainy seasons, do not act as a hurdle to braking properly.
Disc brakes reduce the load on muscles and give faster,
speedier and longer rides.
SCOPE OF THE STUDY
In this research study, we aim to find out the various
factors that have an impact on the purchasing decisions
regarding bicycles, during the pandemic. This study
analyzes the responses to apprehend the behavioural
pattern of people and their views towards this
sustainable mode of transport.
OBJECTIVE OF THE STUDY
?To identify the factors influencing purchasing
decisions regarding bicycles.
?To identify the usage pattern of bicycles among
different age groups of consumers.
LITERATURE REVIEW
Wang et al. (2014) conducted a survey at the University
of Auckland to understand the factors influencing the
students’ usage of bicycles. This led to the identification
of five constructs:
1. Security
2. Lack of separate pathways
3. Policies restricting usage of cars
4. Planned Public Transportation System
5. Adequate facilities for cycling
Ling et al. (2017), in their survey of 806 respondents,
compared bicycle users with e-bike users and
concluded that conventional bicycle owners use
bicycles for exercise and enjoyment. It was also found
that e-bike respondents use e-bikes for long-distance
trips and that the number of trips per week is higher.
One thing common among both e-bike owner
respondents and conventional bicycle respondents was
that improved health was a vital factor for both forms of
cycling.
Scheper (2014) compared the chances of crashes and
injuries in e-bicycles with classic bicycles in the
Netherlands. It was found that e-bikes are more
vulnerable to crashes than classic bikes.
Sausa (2014) found that lack of good cycling
infrastructure in Brazil is the strongest barrier in that
country and that there is a direct relationship between
the city size and barrier strength. The larger the city, the
stronger the barrier.
Lindsay and Woodward (2011) conducted a survey, the
objective of which was to identify the impact on health
and air quality if short trips (lesser than 7 km) are done
on bicycles rather than cars. The results of the survey
showed that shifting 5 per cent of vehicle kilometres to
cycling would decrease vehicle travel by 223 million km
each year and would result in the saving of 22 million
litres of fuel and a decrease in the emission of
greenhouse gases by transport cars by 0.4 per cent.
Campbell and Ryerson (2016) conducted a survey with
the objective of exploring the factors that influence the
choice of bicycles and e-bikes in China. Survey results
showed that a trip on a bicycle is negatively impacted by
trip distance, temperature and air quality, whereas e-
bikes are positively impacted by these factors.
Lungu et al. (2011) conducted research in the Nsanje
district of Malawi, regarding whether bicycles can be
used as ambulances. It was concluded that important
cultural beliefs deterred pregnant women from using
bicycles as ambulances. It is believed that the usage of
bicycle ambulance attracts evil forces if used for
obstetric cases. This is why general medicinal cases use
bicycles as ambulances more often as compared to
obstetric cases.

India under PandemicASCENT
YOUTHINK l 2022 l Vol. XVI 244
Schleinitz et al. (2017) compared the speed of three
bicycles, namely, Conventional, Pedelecs and S-
Pedelecs. Ninety participants took part in this survey. It
was revealed that riders using Pedelec bikes are 2 km/hr
faster than conventional cyclists. It was also found that
conventional bicyclists are 9 km/hr slower than the ones
using S-Pedelec. Therefore, the speed of e-bicycles is
faster than that of conventional cycles.
Hong et al. (2015) conducted a survey in the United
States of America (USA) with the objective of finding out
whether safe cycling infrastructure inspires and
motivates the usage of bicycles when it rains. This
research concluded that high levels of precipitation
negatively influences bicycle usage.
Sirosis and Geneidy (2014) concluded that women
cycle less to go for work, as compared to men.
Though many researches were conducted on this topic
in foreign countries like the USA, China, Netherlands,
et al., but any research on bicycles was hardly
conducted in India.
RESEARCH METHODOLOGY
The study is a cross-sectional study to identify the
factors that influence bicycle purchase decisions during
the pandemic. A pilot study was organized and
consequently, a final purposive sampling of 400
respondents was done through a structured
questionnaire from 2nd March, 2021 to 15th April,
2021 in India. The respondents were mainly those who
have purchased and used a bicycle. The data was then
processed through Microsoft Excel and IBM Statistical
Package for Social Sciences (SPSS) statistics software.
ANALYSIS AND INTERPRETATION OF DATA
Cronbach’s Alpha is a measure of internal consistency.
Sixteen variables related to the purchase of bicycles
were given to the respondents, who were requested to
submit their degree of agreement or disagreement with
the statements on a 5-point Likert scale. On the basis of
the responses, reliability analysis was conducted for
checking the overall consistency of the data.
Reliability Statistics
Cronbach's Alpha Number of Items
.780 16
Table 1: Reliability Statistics
(Source: Primary Data)
A value of 0.7 is considered ‘acceptable.’ In this
research study, the alpha coefficient depicted in Table 1
for sixteen items is 0.780, which means that the items
are internally consistent and are acceptable.
In this survey, 48 per cent of the respondents belong to
the age group of 21 to 35 years. There were only two
respondents who were of the age group of 60 and
above. Among 400 respondents, 262 belong to urban
areas while the others belong to rural areas. Moreover,
64.8 per cent of the respondents were male and 34 per
cent were female. Four respondents belonged to the
‘other’ category. 42.5 per cent of the respondents were
college graduates. Maximum respondents had a
monthly income below ̀ 30,000. Only 8 per cent of the
respondents had a monthly income above `100,000.
69.3 per cent of the respondents stated that cycling has
a positive impact on their health. 75 per cent of the
respondents answered that they prefer the offline mode
while purchasing bicycles. Out of 400 respondents, 212
strongly agree that cycling makes us healthy, fit and
strong, whereas 15 respondents are neutral in this
regard. 34 per cent of the respondents strongly agree
that there is no cycleway that is separated from traffic
for the entire route. 47 per cent of the respondents
agree that good-quality roads encourage cycling. 110
respondents strongly recommend purchasing a bicycle,
whereas 179 of them recommend purchasing it.
Figure 1: Pie Chart Depicting the Age Distribution of
the Respondents
(Source: Primary Data)
The majority of the respondents, as depicted in Figure
1, belong to the age group 21-35 yrs.
Age400 responses

ASCENTIndia under Pandemic
YOUTHINK l 2022 l Vol. XVI245
Figure 2: Pie chart Depicting the Education Level of the Respondents
(Source: Primary Data)
Among 400 respondents, the maximum number of
respondents were college graduates, followed by
the respondents who have completed high school.
Only a very few respondents are those who have
only completed primary school.
Figure 3: Pie Chart Depicting the Time Spent by the Respondents on Cycling
(Source: Primary Data)
Maximum (54 per cent) respondents spend a time
period of 0-30 minutes cycling in a day. Very few
respondents spend more than two hours a day
cycling.
Figure 4: Pie Chart Depicting the Frequency of Bicycle Usage
of the Respondents
(Source: Primary Data)
30.3 per cent of the respondents sometimes use
bicycles, whereas 19.5 per cent of the respondents
have never used a bicycle. 15.2 per cent of the
respondents often use bicycles. This usage pattern
shows that there is a scope for enhancing the usage
of bicycles through incentives and promotion.
Figure 5: Pie Chart Depicting the Recommendation of the Respondents
Regarding the Purchase of a Bicycle
(Source: Primary Data)
44.8 per cent of the respondents recommend others
to purchase and use bicycles. 27.5 per cent of the
respondents strongly recommend others to
purchase bicycles. 19 per cent of the respondents
have a neutral view, whereas the rest do not
recommend purchasing a bicycle. This clearly shows
that the majority of respondents are recommending
others to purchase and use a bicycle.

India under PandemicASCENT
YOUTHINK l 2022 l Vol. XVI 246
Factor analysis is a dimension-reduction technique
used to reduce a large number of variables into fewer
number of factors. Prior to factor analysis, it is essential
to test the adequacy of the sample, for which the Kaiser-
Meyer-Olkin (KMO) and Bartlett's test was used.
KMO and Bartlett's Test
Table 2: KMO and Bartlett's Test
(Source: Primary Data)
Kaiser-Meyer-Olkin Measure of Sampling Adequacy.
.825
Bartlett's Test of Sphericity
Approx. Chi -Square
1806.057
df 120
Sig. .000
A significant Bartlett's Test of Sphericity and KMO
measure of 0.825 depicted in Table 2 implies that factor
analysis can be considered appropriate for this data.
Factor analysis was conducted to identify the core
factors that influence the purchasing decisions
regarding bicycles. Table 3 depicts that 57.521 per cent
of variability can be explained with the help of the four
factors identified through this analysis.
Component
Rotation Sums of Squared Loadings
TotalPer Cent of Variance
Cumulative Per Cent
1 3.343 20.894 20.894
2 2.634 16.465 37.359
3 1.880 11.749 49.108
4 1.346 8.413 57.521
Table 3: Total Variance Explained
(Source: Primary Data)
Pattern Matrix Reflecting
Factor Loading Component
1 2 3 4
Cycling makes us healthy,
fit and strong .799
Cycling is a good method
of enjoyment and recreation
with friends and family .704
Cycling is environment-
friendly .765
Cycling is cost-effective as
compared to bikes,
cars et al. .688
Parking is easier in case of
cycles as compared to bikes,
cars et al. .729
Good-quality roads
encourage cycling .661
Cycling is good for short-
distance trips .718
No license being required
for bicycle favours its usage .648
Increasing cycling will
reduce road accidents .606
There will be an increased
demand for bicycles
in future .802
There is no cycleway that is
separated from the traffic
for the entire route .489
Cycling is not safe for girls .648
There is a fear of cycles
being stolen very easily .733
Cycling is not as
comfortable as other modes
of transport .821
Cycling is not safe in hilly
regions .820
There is a fear of accidents
or falls in case of cycling .790
Table 4: Pattern Matrix
(Source: Primary Data)

ASCENTIndia under Pandemic
YOUTHINK l 2022 l Vol. XVI247
After analyzing the pattern matrix depicted in Table 4
and the loading of each variable, four factors have been
identified.
Component one has ‘Cycling makes us healthy, fit and
strong’ with a factor loading of 0.799 and ‘Cycling is a
good method of enjoyment and recreation with friends
and family’ with a factor loading of 0.704. All these
variables relate to health and entertainment; hence this
factor has been named, ‘Health and Entertainment.’
Component two has ‘Cycling is environment-friendly’
with a factor loading of 0.765, ‘Cycling is cost-effective
as compared to bikes, cars et al.’ with a factor loading of
0.688, ‘Parking is easier in case of cycles as compared to
bikes, cars et al.’ with factor loading 0.729, ‘Good-
quality roads encourage cycling’ with a factor loading of
0.661, ‘Cycling is good for short-distance trips’ with a
factor loading of 0.718 and ‘No license being required
for bicycle favours its usage’ with a factor loading of
0.648. This factor has been named, ‘Convenience,
Environment and Pocket friendliness.’
Component three has ‘Increasing cycling will reduce
road accidents’ with a factor loading of 0.606, ‘There
will be an increased demand for bicycles in future’ with
a factor loading of 0.802, ‘There is no cycleway that is
separated from traffic for the entire route’ with a factor
loading of 0.489 and ‘Cycling is not safe for girls’ with a
factor loading of 0.648. All these variables relate to
infrastructure and safety; hence this factor has been
named, ‘Infrastructure and Safety’.
Component four has ‘There is a fear of cycles being
stolen very easily’ with a factor loading of 0.733,
‘Cycling is not as comfortable as other modes of
transport’ with a factor loading of 0.821, ‘Cycling is not
safe in hilly regions’ with a factor loading of 0.820 and
‘There is a fear of accidents or falls in case of cycling’
with a factor loading of 0.790. All these variables relate
to inconvenience and security; hence this factor has
been named, ‘Inconvenience and Security.’ Thus, the
objective of identifying the factors that influence
purchasing decisions regarding bicycles has been
successfully taken care of.
CONCLUSIONS AND RECOMMENDATIONS
The present pandemic-stricken environment is
favourable for promoting bicycles as these ensure social
distancing and healthy lifestyles. The bicycle market is
expected to grow at an extremely fast rate in the coming
years. It can be said that the benefits of using a bicycle
outweigh the costs. A lot of people are, however,
unaware of bicycles and their benefits. People should
be aware of it and should use it. There must be bicycle
education programmes that promote the use of
bicycles. The government must come forward to
motivate and encourage people to use these vehicles.
Provisions should be made for adequate bicycle parking
facilities. Infrastructure should be improved to motivate
more people to use bicycles. The government should
formulate and implement policies that encourage the
use of bicycles.
REFERENCES
1. Campbell, A.A., Cherry, C.R., Ryerson, M.S., and Yang,X.
(2016). Factors influencing the choice of shared bicycles and
shared electricbikes in Beijing. Transportation research part
C: emerging technologies, 67, 399-414.
2. Damant-Sirois, G., Grimsrud, M., and El-Geneidy, A.M.
(2014). What’s your type: A multidimensional cyclist
typology. Transportation, 41(6), 1153-1169.
3. De Sousa, A.A., Sanches, S.P., and Ferreira, M.A. (2014).
Perception of barriers for the use of bicycles. Procedia-Social
and Behavioural Sciences, 160, 304-313.
4. Lindsay, G., Macmillan, A., and Woodward, A. (2011).
Moving urban trips from cars to bicycles: impact on health
and emissions. Australian and New Zealand journal of public
health, 35(1), 54-60.
5. Ling, Z., Cherry, C.R., MacArthur, J.H., and Weinert, J.X.
(2017). Differences of cycling experiences and perceptions
between e-bike and bicycle users in the United States.
Sustainability, 9(9), 1662.
6. Lungu, K., Kafosa, V. M., Hussein, J., and Ashwood-Smith, H.
(2001). Are bicycles ambulances and community transport
plan effective? Malawi Medical Journal, 13(2), 16-18.
7. Schepers, J.P., Fishman, E., den Hertog, P., Wolt, K.K., and
Schwab, A.L. (2014). The safety of electrically assisted
bicycles as compared to classic bicycles. Accident Analysis &
Prevention, 73, 174-180.
8. Schleinitz, K., Petzoldt, T., Franke-Bartholdt,L., Krems, J., and
Gehlert, T. (2017). The German Naturalistic Cycling Study–
Comparing the cycling speed of riders of different e-bikes
and conventional bicycles. Safety Science, 92, 290-297.
9. Wang, J.Y., Mirza, L., Cheung, A.K., and Moradi, S. (2014).
Understanding factors influencing choices of cyclists and
potential cyclists: A case study at the University of Auckland.
Road and Transport Research: a journal of Australian and New
Zealand research and practice, 23(4), 37-51.

ASCENT
YOUTHINK l 2022 l Vol. XVI 248
Performance of Banks in Disbursement and Recovery of Agricultural Credit: A Comparative Analysis
Prof. Shirsendu RoychowdhuryAssistant ProfessorDepartment of Commerce (Morning)
Dattatreya DuttaDepartment of Commerce (Morning)
The
nationalization of
major commercial
banks in 1969 and
the occurrence of
the Green
Revolution in
1970 acted as a
catalyst towards
leveraging the
commercial
banking system
towards extending
agricultural credit.

ASCENTPerformance of Banks in Disbursement and Recovery of Agricultural Credit
YOUTHINK l 2022 l Vol. XVI249
ABSTRACT
Agricultural credit is the backbone of prosperity and
development of the agricultural sector in India. Initially,
it was dominated by the informal sector with the
Mahajans and Zamindars, but with the passing of the
Reserve Bank of India (RBI) Act 1934, the system was
slowly institutionalized and dominated by banks. Our
paper aims to analyze the performance and consistency
of commercial banks, cooperative banks, and Regional
Rural Banks (RRBs) in the disbursement and recovery of
agricultural credit. We also analyzed the performance
of the banks in undertaking the Kisan Credit Card
scheme. Finally, the study is concluded by finding out
the Real Gross Value Added in agriculture and allied
activities from 2012-13 to 2020-21, and suggesting
measures to reduce Non-Performing Assets (NPAs) in
the agricultural sector.
KEYWORDS: Agricultural Credit, Kisan Credit Card
Scheme, Real Gross Value Added, Non-Performing
Assets, Regional Rural Banks.
INTRODUCTION TO THE STUDY
Historical Background
Agriculture has been the bread and butter of the rural
economy for decades. The prominence of agriculture in
India as a means of livelihood emerged during the
9,000 BCE in the Indus Valley Civilization. However,
over the decades, the accessibility of agricultural credit
for the population involved in agriculture has been a
nightmare. In the pre-independence era, agricultural
credit was granted by moneylenders who used to
charge high interests from the farmers at the time of
repayment. They employed exploitative practices if the
farmers were unable to repay, forcing them to fall into a
vicious circle of debt. The farmers have to sell their
entire produce, at times, to the moneylenders as
distress sale to repay the loan. The need for agricultural
credit has been eminent for ages due to the seasonal
nature of agriculture, lack of developed warehouses for
storage, et al. However, a major development in India’s
agriculture credit delivery mechanism took place in
1934 with the passing of the RBI Act. The RBI Act
empowered the cooperative banks and land
development banks to provide credit to agriculture at
reasonable rates of interest.
There are two main provisions of the RBI Act looking
into the aspect of agriculture credit delivery:
Section 54: Enables the RBI to set up an Agricultural
Credit Department having an expert staff to advise the
Government at different levels regarding agricultural
credit delivery by coordinating the functions of the RBI.
Section 17: Enables the RBI to empower the
cooperative banks and other banks to provide
agricultural credit.
Efforts After Independence
The need for agricultural development and creation of
buffer stock of major agricultural grains was felt during
1966, at the time of Indo-China and Indo-Pakistan war,
when the country faced acute deficiency of food grains
as majority finances were utilized towards the defense
expenditure of the country. During this period, the RBI
continued to engage the attention of the Government
towards the development of agricultural credit. This
was evident from the fact that the Agriculture Refinance
Commissionwas set up in the year 1963 to provide
funds by way of refinancing.
Era of Nationalization of Banks and Green
Revolution
The nationalization of major commercial banks in 1969
and the occurrence of the Green Revolution in 1970
acted as a catalyst towards leveraging the commercial
banking system towards extending agricultural credit.
The Green Revolution stimulated the growth of the
agricultural credit system as the farmers needed funds
to purchase High Yielding Variety (HYV) seeds, tractors,
and other mechanized machines for tilling of the soil,
pumps for irrigation facilities, and many more. The
emergence of agriculture as a priority sector in 1969
introduced the concept of decentralized credit
planning, where a lead bank was given the
responsibility to focus on credit allocation for
agricultural lending. In this regard, the lead bank is
required to ensure that the credit allocation process gets
completed on particular dates. Agriculture Refinance
and Development Corporation (ARDC) was set up in
the year 1975, which focuses more on the development

Performance of Banks in Disbursement and Recovery of Agricultural CreditASCENT
YOUTHINK l 2022 l Vol. XVI 250
and promotional role of delivery and allocation of
agricultural credit. In addition to ARDC, Regional Rural
Banks (RRBs) were constituted in 1976 under the
recommendation of the Narasimham Committee to
provide financial services to the rural areas of the
country.
Formation of NABARD
National Bank for Agricultural and Rural Development
(NABARD) was formed in the year 1982 as the apex
Development Financial Institution (DFI). From the
beginning, NABARD has played an important role in
the delivery of agricultural credit to rural households
and, its success is attributed to robust policy planning in
the area of agricultural credit.
Rural Infrastructure Development Fund (RIDF) was set
up in 1995-96, which provided loans at various levels of
the Government to continue with the projects that can
enhance development in rural areas. Any shortfall in
RIDF is to be funded by the commercial banks.
NABARD has been playing a catalyst role in micro-
credit through the conduit of Self-Help Groups (SHGs).
Kisan Credit Card Scheme
On the basis of recommendations of the RV Gupta
Committee in 1998, Kisan Credit Card (KCC) scheme
was introduced, which provided loans to farmers for
purchasing agricultural inputs. From 2012, the banks
started issuing Electronic Kisan Credit Card (EKCC), and
also simplified the scheme, ensuring its wide
accessibility by the agricultural community. The interest
rate for the Kisan Credit Card scheme is as low as 2 per
cent which extends up to an average of 4 per cent.
Following are the salient features of the Kisan Credit
Card Scheme:
?Loans up to `0.3 million were available to the
farmers on hypothecation of crops (on the basis of
card limit), marketing loans are also available.
?Insurance coverage up to `50 million for KCC
holders in case of death or permanent disability,
`25 million as coverage for other risks.
?For marginal and landless farmers, a credit limit of
10 to 50 million is given for purposes relating to post
harvested crops, farm expenses, storage expenses,
et al.
OBJECTIVES OF THE STUDY
To review the period wise progress of banks towards
delivery and recovery of agricultural credit.
To compare the performance and consistency of banks
towards facilitating the availability of Kisan Credit Cards
(KCC) to the agricultural sector.
LITERATURE REVIEW
For the purpose of the study the following literatures
and research papers were referred to:
Kaur and Dhaliwal (2018)
The study was conducted to find out the progress of the
Kisan Credit Card (KCC) scheme in India for the period
1998-2013 across Commercial Banks, Cooperative
Banks, and Regional Rural Banks (RRBs).
Ahangar, Ganie and Padder (2013)
The research aimed to find out the outreach of financial
institutions towards delivery of credit for the people
engaged in the agricultural sector which was conducted
between for the period 2000-2012 across commercial
banks, cooperative banks, and regional rural banks
(RRBs).
Narayanan (2015)
The study aims to establish a relationship between
formal agricultural credit and the agricultural Gross
Domestic Product (GDP) in India with the help of state-
level panel data from 1995-96 to 2011-12. The study
shows that in spite of the increased credit flow, GDP
growth in agriculture is not positive due to low technical
efficiency and productivity.
Mohan (2004)
The paper studies the success of the agricultural credit
mechanism in India along with contentious issues that
have crept into the system that have affected its
functioning in recent years.

ASCENTPerformance of Banks in Disbursement and Recovery of Agricultural Credit
YOUTHINK l 2022 l Vol. XVI251
RESEARCH METHODOLOGY
Research Tools
The following tools were used to analyze the data in accordance with the objectives of the study:
Compounded Annual Growth Rate (CAGR) (Average)
It can be calculated using the following steps:
Compounded Annual Growth Rate (CAGR) helps to
analyze the actual returns arising from a project over a
number of years. Here, compound interest law is used
for calculating the average growth rate because the
increase in the growth rate is based on the agricultural
credit disbursed in the previous year and not on any
fixed agricultural credit disbursement.
In this way the growth of agricultural credit by various
banks can be compared to arrive at a meaningful
conclusion.
Coefficient of Variation
Coefficient of variation (CV) is a relative measure of
dispersion which is calculated as
If CV is high the data is said to be less consistent and
more variable, whereas, if the CV is low data is more
consistent and less variable.

Performance of Banks in Disbursement and Recovery of Agricultural CreditASCENT
YOUTHINK l 2022 l Vol. XVI 252
Sample and Data
?Direct institutional credit for agriculture and allied
activities (total short-term and long-term): The data
is collected from the RBI’s ‘Handbook of statistics on
Indian Economy’ and report on ‘Credit Delivery and
Financial Inclusion’ from 1995-96 to 2019-20.
?Kisan Credit Card Scheme (state-wise progress): The
data is collected from RBI’s reports on ‘Trend and
Progress of Banking in India’ and ‘Annual Reports’ of
NABARD published from
1998-99 to 2019-20. For
the purpose of this study,
state wise totals have been
cumulated to arrive at
national totals.
For both the tables, data is
col lected for scheduled
c o m m e r c i a l b a n k s ,
coopera t i ve banks and
regional rural banks.
According to the results obtained, Regional Rural Banks
(21.99 per cent) are ahead of Commercial Banks (21.84
per cent), and Cooperative Banks (10.91 per cent) in
terms of growth in the disbursement of short and long-
term agricultural credit. The reason behind the
enhanced flow of credit by Regional Rural Banks is
because of the following reasons:
Dr. Vyas Committee recommended the amalgamation
of RRBs in 2001, and the process was initiated in 2005.
Amalgamation and consolidation of RRBs was focused
on providing better customer service to needy people
by integrating the capacity of many RRBs.
Due to the consolidation process, RRBs were reduced
from a peak of 196 as of 31st March, 2004 to 43 as of 1st
April, 2020.
However, for loans outstanding also, regional rural
banks (23.11 per cent) are ahead of
commercial banks (17.70 per cent) and
cooperative banks (9 per cent). This
highlights the need for the RRBs to develop a
robust mechanism for the recovery of
agricultural credit.
From the point of view of consistency in the
disbursement of agricultural credit, which is
captured by the Coefficient of Variation (CV),
cooperative banks (70.167) are ahead of
commercial banks (116.79) and regional
rural banks (483.167). Similarly, from the
point of view of consistency in the recovery
of agricultural credit, cooperative banks (63.322) are
ahead of commercial banks (100.919) and regional
rural banks (147.75).
Figure 1: Representation of Compounded Annual Growth Rate (Average) for Loans Issued
and Loans Outstanding (1995-96 to 2019-20)
(Source: Values Calculated from RBI’s ‘Handbook of Statistics on Indian Economy’)
Table 1: Compounded Growth Rate of Loans Issued and Loans Outstanding
Across Various Categories of Banks (1995-96 to 2019-20)
(Source: Values Calculated from RBI’s ‘Handbook of Statistics on Indian Economy’)
Type of Banks
Compounded Growth Rate (Average)
Loans Issued Loans Outstanding
Scheduled
Commercial Banks21.84 per cent 17.70 per cent
Cooperative Banks 10.91 per cent 9.00 per cent
Regional Rural Banks 21.99 per cent 23.11 per cent
DATA ANALYSIS AND
OBSERVATIONS
Short-Term and Long-Term Credit

ASCENTPerformance of Banks in Disbursement and Recovery of Agricultural Credit
YOUTHINK l 2022 l Vol. XVI253
Table 2: Coefficient of Variation (CV) of Loans Issued and Loans Outstanding
Across Various Categories of Banks (1995-96 to 2019-20)
(Source: Values Calculated from RBI’s ‘Handbook of Statistics on
Indian Economy’)
Type of BanksCoefficient of Variation (CV)
Loans Issued Loans Outstanding
Scheduled Commercial Banks 116.79 100.919
Cooperative Banks 70.167 63.322
Regional Rural Banks 483.167 147.75
Consistency in the disbursement and recovery of
agricultural credit by cooperative banks shows that their
performance is not subject to
seasonal fluctuations. Lower
consistency in the disbursement
and recovery of agricultural
credit by scheduled commercial
banks and regional rural banks is
attributed to the ‘Loan Waiver’
schemes of the Government.
Nationally, a loan waiver scheme
was announced by the Finance
Minister in 2008 after which, the
r e c o v e r y a n d
d i s b u r s e m e n t o f
agricultural credit was
s e v e r e l y a f f e c t e d .
However, the loan waiver
scheme is also applicable
for cooperative banks in
spite of which their
consistency is high. The
reason for such an
exception is unknown.
In this regard, a study was
conducted by the Reserve
Bank of India in a few
districts of Tamil Nadu, in
2016, after which the
Reserve Bank of India
came to the conclusion
that officials of various co-
operative banks made the
farmers aware of the
Figure 2: Representation of Coefficient of Variation of Loans Issued and Loans Outstanding
(Source: Values Calculated from the RBI’s ‘Handbook of Statistics on Indian Economy’)
Type of BanksCompounded Annual Growth Rate (Average)
Cards Issued Amount Sanctioned
Scheduled Commercial Banks 22.54 per cent 36.96 per cent
Cooperative Bank 33.67 per cent 32.82 per cent
Regional Rural Banks 52.68 per cent 68.84 per cent
Kisan Credit Card Scheme
Table 3: Compounded Annual Growth Rate of Cards Issued and Amounts Sanctioned under
the KCC Scheme (1998-99 to 2019-20)
(Source: Values Calculated from RBI’s Report on ‘Trend and Progress of Banking in India’)
disadvantages of loan waiver schemes and
assured them that, in case of prompt
repayment on maturity date, the interest on
loan amount will be waived off, and the
amount of interest will be credited to their
bank accounts. This initiative by the
cooperative banks encouraged the farmers to
repay their loans on time.
In terms of growth in the delivery of Kisan
Credit Cards (KCC), regional rural banks (52.68
per cent) are ahead of cooperative banks
(33.67 per cent) and commercial banks (27.76

Performance of Banks in Disbursement and Recovery of Agricultural CreditASCENT
YOUTHINK l 2022 l Vol. XVI 254
per cent). Higher share of RRBs indicates wider
coverage of the KCC scheme in rural areas.
Similarly, in terms of the growth of amount sanctioned
to Kisan Credit Cards, regional rural banks (68.84 per
Figure 3: Representation Growth Rate in Cards Issued and
Amounts Sanctioned across Various Categories of Bank
(Source: Values Calculated from RBI’s report on ‘Trend and Progress of Banking in India’)
Type of BanksCoefficient of Variation (CV)
Cards Issued Amount Sanctioned
Scheduled Commercial Banks 100.63 154.13
Cooperative Banks 133.74 134.05
Regional Rural Banks 128.85 160.27
Table 4: Coefficient of Variation in Cards Issued and
Amounts Sanctioned under the KCC Scheme (1998-99 to 2019-20)
(Source: Values Calculated from RBI’s Report on ‘Trend and Progress of Banking in India’)
From the point of view of consistency in the number of
cards issued, scheduled commercial banks (100.63) are
ahead of regional rural banks (128.85) and cooperative
banks (133.74). It shows that Kisan Credit Cards are
cent) are ahead of commercial banks (36.96 per cent)
and cooperative banks (32.82 per cent). Increased
share of loans by RRBs indicates availability of loans to
agriculturists at a concessional interest rate.
issued by commercial banks uniformly throughout the
years and is not dependent upon the seasonal nature of
agriculture in India.

ASCENTPerformance of Banks in Disbursement and Recovery of Agricultural Credit
YOUTHINK l 2022 l Vol. XVI255
Figure 4: Representation of Coefficient of Variation (CV) of Cards Issued and
Amounts Sanctioned under KCC Scheme
(Source: Values Calculated from RBI’s Report on ‘Trend and Progress of Banking in India’)
Other Descriptive Statistics for the Study Short-Term and Long-Term Credit
Type of Bank
Mean Standard Deviation
Loans Issued Loans Outstanding Loans IssuedLoans
Outstanding
Scheduled Commercial Bank 2918376 3097822 3408382.93 3126297.44
Cooperative Banks 733074 907871 514379.72 574887.47
Regional Rural Banks 483220 729568 2334763.28 1078002.30
Table 5: Mean and Standard Deviation of Loans Issued and Loans Outstanding by
Various Categories of Banks (1995-96 to 2019-20)
(Source: Values Calculated from RBI’s ‘Handbook of Statistics on Indian Economy’)
Kisan Credit Card Scheme
Type of Banks
Mean Standard Deviation
Cards IssuedAmount
SanctionedCards Issued
Amount Sanctioned
Scheduled Commercial
Banks8.295 1127264.74 8.348 1737427.63
Cooperative Banks 9.216 357327.89 12.326 478987.83
Regional Rural Banks 3.586 300746.84 4.620 482011.15
Table 6: Mean and Standard Deviation of Cards Issued and Amounts Sanctioned under KCC Scheme (1998-99 to 2017-18)
(Source: Values Calculated from RBI Reports on ‘Trend and Progress of Banking in India’)
Similarly, for consistency in the amounts sanctioned to
Kisan Credit Cards, cooperative banks (134.05) are
ahead of commercial banks (154.13) and RRBs
(160.27). Higher consistency by cooperative banks
shows that the amount disbursed under the scheme is
uniform over a number of years.
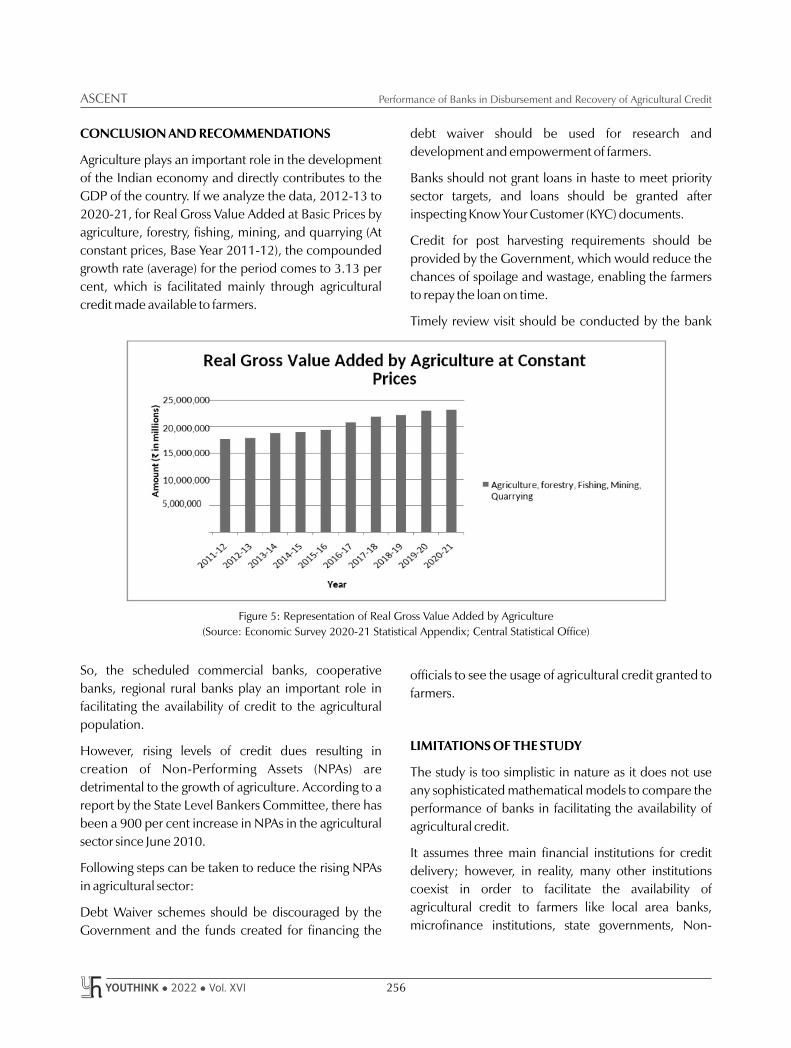
Performance of Banks in Disbursement and Recovery of Agricultural CreditASCENT
YOUTHINK l 2022 l Vol. XVI 256
CONCLUSION AND RECOMMENDATIONS
Agriculture plays an important role in the development
of the Indian economy and directly contributes to the
GDP of the country. If we analyze the data, 2012-13 to
2020-21, for Real Gross Value Added at Basic Prices by
agriculture, forestry, fishing, mining, and quarrying (At
constant prices, Base Year 2011-12), the compounded
growth rate (average) for the period comes to 3.13 per
cent, which is facilitated mainly through agricultural
credit made available to farmers.
So, the scheduled commercial banks, cooperative
banks, regional rural banks play an important role in
facilitating the availability of credit to the agricultural
population.
However, rising levels of credit dues resulting in
creation of Non-Performing Assets (NPAs) are
detrimental to the growth of agriculture. According to a
report by the State Level Bankers Committee, there has
been a 900 per cent increase in NPAs in the agricultural
sector since June 2010.
Following steps can be taken to reduce the rising NPAs
in agricultural sector:
Debt Waiver schemes should be discouraged by the
Government and the funds created for financing the
debt waiver should be used for research and
development and empowerment of farmers.
Banks should not grant loans in haste to meet priority
sector targets, and loans should be granted after
inspecting Know Your Customer (KYC) documents.
Credit for post harvesting requirements should be
provided by the Government, which would reduce the
chances of spoilage and wastage, enabling the farmers
to repay the loan on time.
Timely review visit should be conducted by the bank
officials to see the usage of agricultural credit granted to
farmers.
LIMITATIONS OF THE STUDY
The study is too simplistic in nature as it does not use
any sophisticated mathematical models to compare the
performance of banks in facilitating the availability of
agricultural credit.
It assumes three main financial institutions for credit
delivery; however, in reality, many other institutions
coexist in order to facilitate the availability of
agricultural credit to farmers like local area banks,
microfinance institutions, state governments, Non-
Figure 5: Representation of Real Gross Value Added by Agriculture
(Source: Economic Survey 2020-21 Statistical Appendix; Central Statistical Office)

ASCENTPerformance of Banks in Disbursement and Recovery of Agricultural Credit
YOUTHINK l 2022 l Vol. XVI257
Banking Financial Companies (NBFCs), et al., who play
an important role in credit delivery mechanism.
The scope of the paper does not consider any new
schemes which were recently introduced for welfare of
farmers, like Pradhan Mantri Kisan Samman Nidhi and
Pradhan Mantri Kisan SAMPADA Yojana.
The paper does not make any detailed analysis of Non-
Performing Assets (NPAs) and recovery mechanism of
agricultural credit given to the agricultural population
for their daily needs.
REFERENCES
Research Papers and Journals
1. Ahangar, B.G., Ganie, H.A. & Padder, J.U.P. A study on the
institutional credit to agriculture in India, Volume (1)
Number 4 (2013) pp. 72-80.
2. Kaur, H., Dhaliwal, K., N. Progress of Kisan Credit Card
Scheme in India. Amity Journal of Agribusiness (2018) 3(1),
(26-36).
3. Mohan, R. (2004). Agricultural Credit in India, Status, Issues
and Future Agenda. Reserve Bank of India Bulletin.
4. Narayanan, S. The Productivity of Agricultural Credit in
India, Indira Gandhi Institute of Development Research
2015. Indira Gandhi Institute of Development Research.
5. Raj, D.S., Prabhu, E.A. Agricultural Loan Waiver: A Case
Study of Tamil Nadu’s Scheme, Vol. 39, No. 1&2, 2018.
Reserve Bank of India Occasional Papers.
6. Tankha, A. Regional Rural Banks and Financial Inclusions:
Policy Imperatives (2015). Small Industries Development
Bank of India.
Reports
1. Report on ‘Credit Delivery and Financial Inclusion’
published by Reserve Bank of India, 1995-96 to 2019-20.
2. Report on ‘Handbook of Statistics on Indian Economy’
published by Reserve Bank of India, 1995-96 to 2019-20.
3. Report on ‘Trend and Progress of Banking in India’ Reserve
Bank of India,1998-99 to 2019-20.
4. Annual Reports, National Bank of Agricultural and Rural
Development, 1995-96 to 2019-20.
5. Economic Survey 2020-21 Statistical Appendix.
Websites
1. https://www.nabard.org
2. https://rbi.org.in

YOUTHINK l 2022 l Vol. XVI 258
PROJECTS
Cognitive Analysis of the Elusive Retail Investment: An Empirical Study Based in IndiaDr. Soma NathAssistant ProfessorDepartment of Commerce (Evening)
Aditi PareekDepartment of Commerce (Evening)
Retail investors
are extremely
important facets
of the participants
of the financial
market, but they
require attention
too.
ABSTRACT
In this study, there has been an identification of the factors influencing the
cognitive behaviour of retail investors in the Indian financial market. To
identify the factors, the study has used raw data from retail investors

PROJECTSCognitive Analysis of the Elusive Retail Investment
YOUTHINK l 2022 l Vol. XVI259
provided to the ones with greater resources as well as a
lead over the subordinating counterparts.
Retail investors have been observed to lose, especially
over the years, even when markets have performed
well. They tend to rely heavily on the empty advice of
seemingly professional people or were side-tracked by
market charades. Interestingly, due to the fact that there
is an interrelationship between the economy and the
financial market, it is certainly noted that the marginal
growth of retail investors depends on their investment
plan and their response to activities of the securities
market. The connection linking cognitive behaviour
and individual investment is the epitome of
determining the factors that lead to investment success.
Investing, for the individual Indian investor, has been
nothing short of a puzzle. The causes of it could be
related to the lack of expertise and knowledge about
finance in the common Indian man. Whereas, there are
several new regulations passed to protect the retail
investor, doors for him to invest in a larger finance
universe are still very restricted.
COVID-19 Induced Pandemic
With the world hitting a sudden break, it became
important, almost necessary, for the governments and
central banks to take charge of the economy and calm
the capital markets. Several regulatory measures were
introduced to provide relief to the panic-stricken
population. Even though the virus does not seem to
disappear any time in the recent future, the
Government, Reserve Bank of India (RBI), and
Securities and Exchange Board of India (SEBI) strive to
make a continuous effort to maintain stability in the
market.
NATURE OF THE PROBLEM
The scope of the current study is not limited to only the
behavioural aspects of an investor’s portfolio decision.
It also focuses on the main grounds, due to which the
small retail investors have to perpetually work with
sentiments rather than professional analysis and
modelled portfolios. The scope of behavioural finance
is limited to the question of the absence of rationality
and the presence of psychological factors in an
belonging to different demographical, social and
income groups from India. The outcome of the study
suggests that factors such as a personal analysis, market
conditions due to ongoing pandemic and
recommendations from financial analysts have a
considerable effect on the investors. Investor
confidence in the advice of their financial advisor plays
an important role in the behaviour of small investors.
The result of the study provides companies offering
financial services in developing countries such as India
with information to take these factors into account
when offering products/services or targeting private
investors in the Indian stock market through their
m a r k e t i n g c a m p a i g n s . I t a l s o p r o v i d e s
recommendations to the investors and exchanges
which would lead to a better market experience. Lastly,
the study has gathered inputs from sample and made
findings of investor behaviour during the pandemic.
The findings state that investors have started to have
more discussions and through these very discussions,
the retail investor community is stronger in knowledge
and moving towards better investment practices.
KEYWORDS: Retail Investors, Behaviour, Markets,
Financial Knowledge.
INTRODUCTION
Conceptual Framework
Capital markets have significantly changed the face of
savings worldwide. It has facilitated investments by
providing savings with a platform to earn generous
returns. These markets have also led to the introduction
of psychology, when it came to monetary matters.
Humans, being unique social creatures, have different
fundamentals concerning investment logic. Logically, it
cannot be expected for a brain to reach a decision
without incorporating factors of needs, fear, greed and
emotion.
In the financial markets, there are two distinct
individual groups, namely the retail investor and the
institutional investor. The distinction is not only on the
basis of the generic opportunities based on the
availability of one's resources but also alluding to a
dynamic, where greater opportunities of investment are

Cognitive Analysis of the Elusive Retail InvestmentPROJECTS
YOUTHINK l 2022 l Vol. XVI 260
investment decision. The world of finance has evolved
significantly since the introduction of behavioural
finance. The main question that arises now is why
individual investors are far from the modern portfolio
theories and concepts of allocative efficiency, when the
finance world has come so far in its route.
The real scenario present here is that the financial
analysis industry mainly targets the wealthy and
influential institutional investors. Although, in the
developed markets of western countries, retail investors
are supplemented with trading recommendations, the
same is not very common in the developing markets of
Asia. In the Indian context, the market has publicly
available trading data, provided by market analysis
companies, but it is almost impossible for a retail
investor to make use of this information because of the
thorough knowledge the task requires. The simple way
out for the retail investor is: ‘go by the gut’.
With the advent of the COVID-19 pandemic in 2020,
the financial markets opened new investment horizons
for every participant in the market. Funds were flown
into the market and it has evidently become a crucial
time to learn about finance and money. In this era of the
pandemic, political tension, and deaths, the world
seemed to understand that investments are not cups of
tea of just the sophisticated investors; rather everyone
should be involved in it.
LITERATURE REVIEW
?Malcolm Baker and Jeffrey Wurgler (2007) studied
the investment sentiment and the challenges it
faces, when it comes to two different kinds of stocks;
safe and easy to arbitrage stocks, and speculative
and difficult to arbitrage stocks. They found that
major influence of investor sentiments is on
speculative stocks. The most important finding of
the study states the possibility of measuring
investment sentiments and throws light on the role
sentiments play on firms and the stock market.
?Dimitrios I. Maditinos, et al. (2007) in their
empirical study, argued that individual investors
mainly get influenced by mainstream media noise,
and seldom base their investment decisions on
techniques of technical and fundamental analysis,
contrary to the practices of seasoned professional
investors. They also found that investment horizons
play a crucial role in determining the techniques to
be used for stock analysis. The study is based on
Greek investors but forms an essential part of the
literature because of its holistic nature.
?Aregbeyen and Mbadiugha (2011) studied the
Nigerian investors encompassing the external
circumstances which include social, economic,
psychological and cultural factors. The study applies
a ranking method through which factors are ranked
according to their influence on investor behavior.
The study found that social factors ranked over other
factors of cultural, economic, and psychological
influences.
?A. Dutta et al. (2020) argues the presence of
behavioural biases in the Indian stock market. The
study, factors in the cognitive theories of
psychological behaviour of an individual investor.
An interesting observation that came out of the
study was that deep regret forms a part of the retail
investor behaviour due to herding and panic.
Despite this, the retail investors indulge into
practices of heuristics and anchoring.
OBJECTIVES OF THE STUDY
Primary Objectives of the Study are:
?To determine the sentiments which drive the retail
investors.
?To analyze the investment opportunities accessible
to retail investors.
?To study the impact of COVID-19 on the investment
pattern of these investors.
Secondary Objectives:
?To study the reforms brought in to protect the retail
investor.
?To analyze the impact of ‘dumb money’ retail
investors on the financial market.

PROJECTSCognitive Analysis of the Elusive Retail Investment
YOUTHINK l 2022 l Vol. XVI261
ANALYSIS
Descriptive Analysis
Demographic Details of the Respondents
Gender Frequency Percentage
Male 206 68.67
Female 94 31.33
Total 300 100
Age Frequency Percentage
18-25 140 46.67
51 and above 86 28.67
36-50 45 15
26-35 29 9.67
Total 300 100
Occupation Frequency Percentage
Student 114 38
Business 88 29.33
Salaried 85 28.33
Retired 8 2.67
Homemaker 5 1.67
Total 300 100
Annual Income (Family) Frequency Percentage
`500,001 to `1,500,000 112 37.33
Above `2,500,000 68 22.67
`1,500,001 to `2,500,000 62 20.67
Up to `500,000 58 19.33
Total 300 100
Table 1: Demographic Details (Source: Primary Data)

Cognitive Analysis of the Elusive Retail InvestmentPROJECTS
YOUTHINK l 2022 l Vol. XVI 262
Figure 1: Research Question 1 [Describe Your Knowledge of Investment](Source: Primary Data)
You Would Describe Your Knowledge of Investments as
Mean 2.86
Minimum (No Knowledge) 1
Maximum (Expert) 5
Table 2: Metric of Knowledge of Investments(Source: Primary Data)
From Figure 1, it is ascertained that most of the
individual investors have an average level of
knowledge. The mean of 2.86 ~ 3, authenticates the
findings, indicating an average (3) level of knowledge.
Figure 2: Research Question 2 [Given an Option, Why Would You Not Invest in the Market?](Source: Primary Data)
In Figure 2, it is found that the retail investors of India
are conscious of their lack of financial knowledge,
which is required to make successful investments (34
per cent responded ‘very likely’, followed by 29 per
cent ‘extremely likely’). Secondly, the investors are
aware of the risk involved and
are afraid of it too (34.3 per
cent responded ‘very likely’,
followed by 20 per cent
‘extremely likely’). The factor
of limited trust was also
observed to be a significant
factor in building a perspective
towards the securities market
(35.33 per cent responded
‘very likely ’). Lastly, the
remaining factor of lost money
in earlier investments is noted
to be as an inconsequential
factor (28.33 per cent responded ‘not at all’).
Interpretation of Research Questions

PROJECTSCognitive Analysis of the Elusive Retail Investment
YOUTHINK l 2022 l Vol. XVI263
Figure 3: Research Question 3 [What is Your Investment Sentiment?]
(Source: Primary Data)
From Figure 3, an interesting observation that comes
out is that the retail investors, despite being
unprofessional individuals, place their own research
and analysis significantly important while taking an
investing decision (67.33 per cent responded ‘very
Figure 4: Research Question 4 [What Kind of Securities Constitutes Your Portfolio?]
(Source: Primary Data)
The most important finding that comes out of this chart
is the popularity of mutual funds as an investing
instrument (65.33 per cent have mutual funds in their
investing portfolio). Followed by direct equity (52.33
per cent) and gold investments (38 per cent). Retail
investors move around the extremely mainstream
investing instruments and lack participation in other
complex securities like derivatives (19.33 per cent),
cryptocurrency (10 per cent) and international
securities (8.33 per cent).
important’). Market opinion (45 per cent responded
‘neutral’) and information from investment websites
(48 per cent responded ‘neutral’) were observed to be
indifferent factors for building an investment sentiment
for the investors.

Cognitive Analysis of the Elusive Retail InvestmentPROJECTS
YOUTHINK l 2022 l Vol. XVI 264
Figure 5: Research Question 5 [Are You Satisfied with the Indian Market Scenario?]
(Source: Primary Data)
Table 3: Metric of Satisfaction Index
(Source: Primary Data)
Satisfaction
Index
Mean 3.15
Minimum (Not Satisfied) 1
Maximum (Absolutely Satisfied) 5
From Figure 5, it is understood
that the respondents are neutral
towards the market. The mean
of 3.15 ~ 3 signifies that the
investors share a neutral level of
satisfaction from the markets.
Figure 6: Research Question 6 [Possible Changes in the Market]
(Source: Primary Data)
Figure 6 shows the most
significant factors for the study:
the wants of the individual
investors. Retail investors want
to know more about the market
(60 per cent) , t ry new
instruments of investing (73.67
per cent) and want to have the
support of the financial advisory
industry (40 per cent).

PROJECTSCognitive Analysis of the Elusive Retail Investment
YOUTHINK l 2022 l Vol. XVI265
Figure 7: Research Question 7 [How Often Do You Check the Market since the Pandemic?]
(Source: Primary Data)
The pandemic has made
investors aware of the
volatility of the market,
hence the majority of
respondents show that they
check the markets daily
(30.33 per cent) or weekly
(27 per cent).
Figure 8: Research Question 8 [Scale of Financial Responsibility since Pandemic]
(Source: Primary Data)
Table 4: Metric of Responsibility Index
(Source: Primary Data)
Responsibility Index
Mean
3.62
Minimum 1
Maximum 5
The pandemic has done an excellent job at making every generation
financially responsible. From the graph, it is evident that a majority
of the respondents are observed to be more responsible since the
pandemic. The mean of 3.62 ~ 4 signifies the very responsible
measure to be the common characteristic among the respondents.

Cognitive Analysis of the Elusive Retail InvestmentPROJECTS
YOUTHINK l 2022 l Vol. XVI 266
Inferential Analysis
Factor Analysis
Kaiser-Meyer-Olkin Measure of Sampling Adequacy 0.69
Bartlett's Test of Sphericity
Df 6
Significance According Bartlett 0
Table 5: Bartlett’s Test and KMO Results
(Source: Primary Data)
The factors are identified by the
corresponding total percentage of the
variance. The findings are obtained by
scrutinizing the factors listed to the
respondent and finding out their
dimension and extent to which it
becomes an essential part of the
investor psychology.
Factors Percentage of Variance
Accumulated Percentage
Lack of knowledge 32.4 32.4
Fear of risk involved 25.6 58
Lost money in earlier investments 22.82 80.82
Limited trust on market performance
19.18 100
Table 6: Given an Option, Why Would You Not Invest in the Market?
(Source: Primary Data)
In Table 6, the relevant
factors that are brought out
by the analysis are namely,
lack of knowledge and fear
of the risk involved.
Table 7: What Drives Your Investment?
(Source: Primary Data)
Factors Percentage of Variance
Accumulated Percentage
Fear of missing out on a limelight security
28.54 28.54
Majority investing 21.96 50.5
Gut feeling towards a particular security 20.55 71.05
Trust in market 16.86 87.91
Fundamental analysis 12.09 100
In Table 7, the relevant
factors that come out from
the analysis are fear of
missing out with 28.54 per
cent of variance, majority
investing with 21.96 per
cent of variance and gut
feeling towards a particular
security with 20.55 per cent
of variance. The factor of
fear of missing out on a
limelight security forms a
part of the availability bias,
whereas majority investing
indicates herding behaviour
and gut feeling suggests
overconfidence bias.

PROJECTSCognitive Analysis of the Elusive Retail Investment
YOUTHINK l 2022 l Vol. XVI267
Factors Percentage of
Variance
Accumulated Percentage
Put money into safer investments 26.97 26.97
Cryptocurrency is the new deal 25.5 52.47
Short-term trading is important 19.23 71.71
Investments help in financial stability
14.37 86.08
No outlook 13.92 100
Table 8: What Has Been Your Outlook after the Pandemic?
(Source: Primary Data)
From Table 8, the important and
relevant factors for the study on COVID-
19 can be ascertained. The pandemic
has built the mindset of safe investing
among the investors (26.97 per cent of
total variance) and it has also brought
attention to new instruments of
cryptocurrency (25.5 per cent of total
variance).
Correlation
Have you ever traded on a security in absence of any professional analysis or research backing it?
On a scale, how accurate havethe investments in the absence of a research been?
Have you ever traded on a security in absence of any professional analysis or research backing it?
1 0.27
On a scale, how accurate have the investments in the absence of a research been?
0.27 1
Table 9: Correlation Matrix of ‘Have You Traded on a Security in the Absence of Any Research?’
and ‘On a Scale, How Accurate Have the Investments in the Absence of a Research been?’
(Source: Primary Data)
The matrix shows positive correlation between the two
variables, indicating that there were investments made
in the absence of any research and they turned out to be
somewhat accurate.
FINDINGS AND OBSERVATIONS
The Indian financial market has evolved over the years
after going through several scams, crashes and not to
mention, an ongoing pandemic. Anywhere in the
world, the regulatory body has been an important
anchor in the growth of retail investors, and it is no
exception even in the Indian securities market.
Retail investors are extremely important facets of the
participants of the financial market, but they require
attention too. Their exposure is although limited to a
few direct investments and intermediate investments
through funds, their influence and the protection of
interests is something to always look after. Whereas,
there is a great income disparity between income
groups, retail investments are giving stage to the middle-
and lower-income group to have a stage on their own.
However, the accessible opportunities for generating
greater return and having professional assistance
remain questionable even today (Anita Krug, 2018).
The current study has found that retail investors have

Cognitive Analysis of the Elusive Retail InvestmentPROJECTS
YOUTHINK l 2022 l Vol. XVI 268
matured overtime and also because of the sudden hit
due to the pandemic. The COVID-19 surprise made
commodities market crash in the initial months of its
introduction. The Indian financial markets saw a huge
volatility in prices of gold because it is one of the safest
investments available. People rushed to make
investments for stability and income, and were
supported in the endeavour by the Reserve Bank of
India. RBI made bonds available and made banks
facilitate the process of investing. In the due course,
even as the retail investor participation increased, the
process of making an investment got easier because the
pandemic had sparked discussions around financial
investments and its implications.
Nevertheless, the coronavirus is here to stay and the
pandemic is definitely not over but with the pandemic,
the question has shifted from psychological biases and
investor behaviour in financial markets, to how each
investor in his/her capacity is doing things differently
from a financial perspective so that another pandemic
could do little harm as compared to the current one.
Finally, it can be said that the retail investors, even
though called ‘dumb money ’ due to their
unprofessional behaviour, are doing extremely well in
the market. The credit for this cannot go to any
institution, other than the regulator SEBI. Further,
measures to ensure that the market is not dominated by
big players who can influence or manipulate prices in a
way that negatively affects retail investing is a
prerequisite. Especially, there appears to be few cases
where SEBI has properly and adequately punished
those who indulged in illegal and/or unethical practices.
The number has increased in recent years, but the
situation is getting better too.
CONCLUSION
Indian retail investors have a choice of quite a few
investing instruments, yet their favourite instrument
have been mutual funds. This makes us go back to their
characteristic of being ‘small’ and ‘unprofessional’,
because mutual funds make them free from the hassle
of maintaining a portfolio of a particular security (say
stocks or bonds), which is beneficial to them due to
their lack of financial knowledge. Secondly, these funds
give them exposure to various expensive and well
performing stocks at considerably less cost. This brings
us to our conclusion that these investors are aware of
their lack of financial knowledge and leave out those
investments which require some financial
understanding. It follows that the retail investors do
make investments other than mutual funds, that are not
managed by any professional but themselves, hence
their cognitive biases play a major role in their
investment sentiment.
These biases were identified and lead to the implication
of herding, overconfidence and anchoring behaviour
present in the retail investment sentiment. Retail
investors often chase a particular security, sometimes
having a lesser idea of how this could lead to distortion
in the price of the security. Herding behaviour is not
contemporary but has been a threat since its
foundation. Furthermore, overconfidence leads the
investor to regret when investments fail or there is a loss,
which makes them shy away from great investing
opportunities. Lastly, the anchoring behaviour ties the
hands of investors and makes them hover around the
few, extremely popular investing instruments like
foreign equity or derivative options because
information on these investments is not readily covered
by the media, but have to be explored into.
Subsequently, it has become necessary to discuss the
intricacies with regards to the COVID-19 pandemic.
The pandemic was an eye-opener for the masses, in
every sense. It has proven to be a catalyst for people to
indulge further into the financial markets. A large
number of youth have flocked the market, despite it
being a time of volatility and uncertainty. The most
interesting finding led us to conclude that since the
pandemic, a greater population has started to worry
about finance and has been involving themselves into
discussions which help them understand the
psychology of finances and money.
Finally, the pandemic has been successful at making
investors financially responsible, which is great for them
and is a step in the process of the economy healing from
the impact of the harsh pandemic. Prudent approaches
to investing will be the saving resorts for the retail

PROJECTSCognitive Analysis of the Elusive Retail Investment
YOUTHINK l 2022 l Vol. XVI269
investors, and as they follow on to become mature, the
exchanges and regulators must keep a check on their
activity.
REFERENCES
1. Ameet Pandit and Ken Yeoh. The Journal of Developing
Areas, Summer 2014, Vol. 48, No. 3 (Summer 2014), pp.
129-148.
2. Anita Krug (2018). Investor’s Paradox. The Journal of
Corporation Law [Vol. 43:2].
3. Aregbeyen, Omo, and Stanley Ogochukwu Mbadiugha.
‘Factors influencing investors decisions in shares of quoted
companies in Nigeria.’ The Social Sciences 6.3 (2011): 205-
212.
4. Baker, Malcolm, and Jeffrey Wurgler. ‘Investor sentiment
and the cross-section of stock returns.’ The Journal of Finance
61.4 (2006): 1645-1680.
5. Barber, B., Lee, Y., Liu, Y., Odean, T., 2009. Just how much
do individual investors lose by trading? Review of Financial
Studies 22, 609–632.
6. Dutta, Abhijit, Madhabendra Sinha, and Padmabati Gahan.
‘Perspective of the Behaviour of Retail Investors: An Analysis
with Indian Stock Market Data.’ Computational Intelligence
in Data Mining. Springer, Singapore, 2020. 605-616.
7. Julijana Angelovska, Zagreb. Review of International
Economics and Business, Vol 18 No. 1, pp.51-60 (2015).
8. Maditinos, D., Zeljkosevic, S., Theriaous, N.G.: Decision
making process by investors and heuristic methods in the
study of retail investors in Russian context. J.Behav. Financ.
9. Ramiah, V., Xu, X., and Moosa, I. A. (2015). Neoclassical
finance, behavioural finance and noise traders: Are view and
assessment of the literature. International Review of
Financial Analysis, 41, 89-100.
10. Sewell, M. (2007). Behavioural finance. University of
Cambridge.
11. Sultana, Syed Tabassum (2010). An Empirical Study of Indian
Individual Investors’ Behaviour. Global Journal of Finance,
vol 2.
12. Vieru, M., Perttunen, J. and Schadewitz, H. (2006). ‘How
investors trade around interim earnings announcements.’
Journal of Business Finance and Accounting.
13. Zhu, Ning, 2002. The Local Bias of Individual Investors,
Working Paper.

PROJECTS
YOUTHINK l 2022 l Vol. XVI 270
Consumer Behaviour Towards a Cashless Economy in India - Special Reference to KolkataDr. Madhu AgnihotriAssistant ProfessorDepartment of Commerce (Morning)
Rohit PatwariDepartment of Commerce (Morning)
Cashless strategy has
the ability to find all
significant
development of
cash including
terrorism financing,
bribery and all
endeavours to
bargain monetary
straightforwardness.
ABSTRACT
A proficient payment framework is essential for the improvement of a
country's economy. One of the greatest yet less talked about changes that the
Information Technology transformation has achieved in India and the world
is the move towards a cashless economy. This study aims to analyze how
cashless transactions have caused changes in the behaviour of consumers,
the level of awareness and faith in the electronic system, and the problems

PROJECTSConsumer Behaviour Towards a Cashless Economy in India
YOUTHINK l 2022 l Vol. XVI271
faced by consumers while using such modes of
payment.
KEYWORDS: Economy, UPI, Virtual Payment Address,
Consumer Behaviour, Cashless, E- Wallet.
INTRODUCTION
A 'cashless economy' alludes to an economy where
exchanges are completed without the utilization of
physical money. In a credit-only economy, buyers can
make installments over the web, at automated
distributing machines, monitored retail locations Point
of Sale (POS) utilizing portable telephone gadgets,
individual computerized aides Personal Digital
Assistants (PDAs), smart cards, and other electronic
installment frameworks including debit and credit
cards.
MODES OF CASHLESS TRANSACTIONS
A plethora of cashless payment methods have cropped
up and newer technologies are coming up every day
such as:
1. Payment cards (Credit card, Debit card, Smart card)
2. Electronic payment networks (EFT/NEFT, RTGS,
ECS)
3. Net banking
4. Mobile banking
5. Mobile payments (Quick Response (QR) Codes,
Near Field Communication (NFC), Wireless
Application Protocol (WAP))
6. Electronic money (e-cash, e-cheque)
7. Cryptocurrencies
8. Biometric payments
Given that the cost of handling cash is high, it is in the
interest of the government, banks, and businesses to
push for the change towards a cashless economy. Cash is
expensive to print and move about from one location to
another. In 2012-2015, RBI incurred an annual cost of
28 billion to just print the currency notes, which was 0.4
per cent of the total currency in circulation. As per the
Mastercard Advisors’ report (2016), India is at its
inception stage in the move towards a cashless economy.
NATURE OF THE PROBLEM
Digitalization of the Indian economy is a challenging
task. The first and the most basic issue is the lack of
proper infrastructure. Cashless modes of transactions
have to dramatically expand to touch at least 40 per
cent of the whole economy before any meaningful
effect can be achieved. Quality and availability of
networks at any given time is also a huge prerequisite
for the success of digitalization. Communication exists
as a major handicap when it comes to semi-urban and
rural areas. Another major concern is the risk involved
in executing these cashless transactions due to the
prevalence of e-fraud. With a low literacy rate, India
lags as a developing nation.
OBJECTIVES
1. To examine consumer awareness and usage of
cashless transactions.
2. To assess the opinion of consumers regarding the
benefits and challenges of using cashless
transactions.
3. To make a comparative study about the comfort
level of various groups of people in using cashless
modes of payment as opposed to using cash.
4. To review the current usage of the various modes of
cashless transactions and their suitability in the
Indian context.
LITERATURE REVIEW
Basel Committee (1998) communicated the trouble in
appropriately characterizing the electronic cash yet
concurred that it mixes innovative and financial
attributes.
Jain (2006) thought that e-installments will actually
want to check black cash. Exploiting innovation, quick
installments, and settlements will guarantee ideal
utilization of accessible assets for banks, monetary
organizations, business houses, and normal residents of
India.
Ajay (2014) thought that electronic installments have
major electronic advantages separated from their

Consumer Behaviour Towards a Cashless Economy in India PROJECTS
YOUTHINK l 2022 l Vol. XVI 272
accommodation and security. Robotized electronic
installments help develop bank stores, in this manner,
expanding assets for financial action.
Das (2010) in his article ‘Cashless Payment System in
India - A Roadmap’ contended that cash as a method of
an installment is a costly recommendation for the public
authority. The country needs to die from a cash-based
installment framework towards a credit-only
(electronic) framework.
Vincent (2005) in the article ‘Credit cards - Modern
payment system’ provided data about Mastercard
working in India and inferred that it is a gift to both the
merchants and clients.
Omotunde, Sunday, and John-Dewole (2013) think
that a credit-only economy is an economy where
exchanges should be possible without essentially
conveying cash as a method for the trade of exchange,
but instead with the utilization of credit or check card
installment for products.
RESEARCH METHODOLOGY
In this research project, both analytical and descriptive
research has been used. Primary data has been
collected with the help of a questionnaire comprising
15 questions for the consumers. An online survey was
carried out using a convenient sampling method with
respondents from Kolkata who came from all walks of
life and answered a self-constructed questionnaire on
demographics, awareness, benefits, and the comfort of
using cashless transactions in India.
Sample size: The total number of respondents is 180.
Secondary data collected include those from the
Reserve Bank of India on the usage of various modes of
cashless transactions, extracts from the Economic
Survey of 2014-2015, RBI’s vision 2018 document,
various other journals, and newspaper articles. The data
collected was shown graphically using Figures and
interpreted accordingly.
ANALYSIS
Hypothesis
A total sample of 180 people was collected from
Kolkata and their socio-economic variables were
compared with their opinions and comfort with respect
Figure 1: Relationship between the Comfort of Using New Technologies for Everyday Payments and the Socio-economic Variables
(Source: Primary Data)

PROJECTSConsumer Behaviour Towards a Cashless Economy in India
YOUTHINK l 2022 l Vol. XVI273
to shifting towards a cashless economy at five per cent
significance level.
Analysis 1:
H0: There is no significant difference in comfort of using
new technologies for everyday payments and the socio-
economic variables.
H1: Comfort of using new technologies for everyday
payments depends on the socio-economic variables.
It is clear that the critical values of chi-square at a five
per cent level of significance are less than the calculated
values, so the null hypothesis is rejected. There exists a
significant association between age, educational
qualification, and annual income of the respondents
and their comfort in using cashless transactions for
everyday payments. It can also be observed that people
in the higher income groups, higher educational
qualifications, and the youth are more acceptable to
change.
Figure 2: Relationship between the Comfort in Shifting of the Spending Pattern from Cash to Cashless and the Socio-economic Variables
(Source: Primary Data)
Analysis 2:
H0: There is no significant difference of comfort in
shifting of spending pattern from cash to cashless and
the socio-economic variables.
H1: Comfort in shifting the spending pattern from cash
to cashless depends on the socio-economic variables.
It is clear that the critical value of chi-square at five per
cent level of significance is less than the calculated
values, so the null hypothesis is rejected. There exists a
significant association between age, occupation, and
annual income of the respondents and their comfort in
shifting the spending pattern from cash to cashless
modes of transaction. However, majority of the people
had a problem in adopting cashless modes of payments
and completely giving up cash in a move towards a
cashless economy. However, compared to the 21 per
cent who were averse to using new technologies, 32 per
cent were in favour of giving up cash. This suggests that
some people were willing to move towards a cashless

Consumer Behaviour Towards a Cashless Economy in India PROJECTS
YOUTHINK l 2022 l Vol. XVI 274
economy but by using common and known cashless
modes of payments rather than embracing cutting-edge
technology presently.
Note: Figure 3 to Figure 16 contain responses from the
respondents.
Figure 3: Gender of the Respondents
(Source: Primary Data)
INTERPRETATION
Figure 3 depicts that 55.9 per cent of the respondents
are male, 41.2 per cent are female and 2.9 per cent are
other. This data will help us further in the study.
Figure 4: Age Group of the Respondents
(Source: Primary Data)
INTERPRETATION
Figure 4 shows that there are 30.4 per cent respondents
of the age group below 20 and 52 per cent respondents
belonging to the age group of 21-40 and 17.6 per cent
respondents are above 40.
Figure 5: Occupation Group of the Respondents
(Source: Primary Data)
INTERPRETATION
Figure 5 shows that there are 51 per cent students, 14.7
per cent homemakers, 21.6 per cent businessmen and
12.7 per cent service holders.
Figure 6: Annual Income of the Respondents
(Source: Primary Data)
Note: Figures used in the above analysis are in Rupees
(`).
INTERPRETATION
?Figure 6 shows that there are 43.1 per cent
respondents having no income, 23.5 per cent having
an income below `300,000, 11.8 per cent having
income between `300,000 to `500,000, 10.8 per
cent having income between `500,000 to
`1,000,000 and 10.8 per cent having income more
than ̀ 1,000,000.
?This shows that the maximum number of
respondents were students having no income.

PROJECTSConsumer Behaviour Towards a Cashless Economy in India
YOUTHINK l 2022 l Vol. XVI275
Figure 7: Amount of Cash in Hand Preferred by the Respondents
(Source: Primary Data)
Note: Figures used in the above analysis are in Rupees
(`).
INTERPRETATION
?Figure 7 shows that there are 36.3 per cent
respondents prefer to have less than ̀ 1,000 cash in
hand, 42.2 per cent prefer `1,000 to `5,000 in
hand, 9.8 per cent prefer `5,000 to `10,000 in
hand and 11.8 percent prefer to have above
`10,000 in hand.
?This shows that the maximum number of people
want to hold less cash which means that they prefer
cashless payments.
Figure 8: Respondents Preference for Payment of their Monthly Bills
(Source: Primary Data)
INTERPRETATION
?Figure 8 shows that there are 18.6 per cent of people
who pay their monthly bills using cash, 28.4 per cent
pay using debit/credit card, 27.5 per cent pay using
mobile banking, 23.5 per cent using mobile wallet,
and the remaining use other methods.
?This figure shows that fewer people want to pay
using cash as they preferred cashless mode of
transactions more.
Figure 9: Frequency of Using Online Payment by Respondents
(Source: Primary Data)
INTERPRETATION
?Figure 9 shows that 16.7 per cent people use online
payment techniques only once a week, 35.3 per
cent people use it more than once a week, 30.4 per
cent make less than four transactions in a month and
17.6 per cent are not using online payment
techniques.
?The above data shows that very few people want to
pay without using online techniques and maximum
people pay using it more than once a week, which
means more than four transactions in a month.
Figure 10: Average Payment made by Respondents using
Cashless Techniques
(Source: Primary Data)
Note: Figures used in the above analysis are in Rupees
(`).
INTERPRETATION
?Figure 10 shows that 39.2 per cent respondents
spend between `1,000 to 5,000 rupees through
cashless methods, 29.4 per cent spend less than
`1,000, 26.5 per cent spend ̀ 5,000 to 10,000 and
the rest spend more than ̀ 10,000 monthly.

Consumer Behaviour Towards a Cashless Economy in India PROJECTS
YOUTHINK l 2022 l Vol. XVI 276
?This data shows that people spend a reasonable
amount of their total spending through cashless
mediums, but very few people spend more than
`10,000 monthly via such means implying that
people are still conservative regarding online
payment.
Figure 11: Percentage of Amount Spent through Cash
by Respondents
(Source: Primary Data)
INTERPRETATION
?Figure 11 shows that 32.4 per cent people spend less
than 20 per cent of the total expense through cash,
47.1 per cent spend between 20 per cent to 50 per
cent through cash and 20.6 per cent people spend
more than 50 per cent through cash.
?The above data indicates that people tend to spend
less cash and more of their expenses are paid via
cashless modes.
Figure 12: Respondents’ Beliefs Regarding Convenience of
Cashless Transactions
(Source: Primary Data)
INTERPRETATION
?Figure 12 shows that 84.3 per cent finds cashless
payment more convenient than cash transactions.
?We can conclude from this that maximum people
find cashless transactions as a better option for
payment.
Figure 13: Respondents’ Willingness to Switch
to Cashless Mode of Payment
(Source: Primary Data)
INTERPRETATION
?Figure 13 shows that 82.4 per cent of respondents
are willing to switch to cashless transactions.
?From the data, we can conclude that most people
are wanting to go cashless in the near future. They
are liking cashless transactions more than cash
payment.
Figure 14: Reasons for not Opting Cashless Mode of Payment
(Source: Primary Data)
INTERPRETATION
?Figure 14 shows that 26.5 per cent respondents are
worried about security of application, 8.8 per cent
for lack of technical knowledge, 40.2 per cent for
hacker activity, 10 per cent for loss of card/mobiles,
16.7 per cent for internet connection, and
remaining for other reasons.
?This shows that there are very few people who are
not opting for cashless transaction due to lack of
knowledge.
?Most people are worried about loss of their data and
other fraudulent activities.

PROJECTSConsumer Behaviour Towards a Cashless Economy in India
YOUTHINK l 2022 l Vol. XVI277
Figure 15: Impact of COVID-19 Pandemic on Cashless Payments
(Source: Primary Data)
INTERPRETATION
?Figure 15 shows that 92.2 per cent people think that
due to COVID-19 the use of cashless mode of
payment has increased in India.
?This concludes that the pandemic has induced
cashless payments, as all of us were inside our
homes. Thus, online payment was the only way to
make payments.
Figure 16: Effect of Cashless Transaction on Monthly Expenses
(Source: Primary Data)
INTERPRETATION
?Figure 16 shows that 23.5 per cent believe that their
monthly expenses have increased drastically due to
online transactions, 40.2 per cent have accepted
that expenses have increased but not much, 17.6
per cent have no idea whether their expenses have
increased or not and 18.6 per cent believe that
expenses did not increase.
?This shows the negative impact of cashless
transactions indicating that it increases the expenses
of consumers due to various reasons.
FINDINGS
1. Awareness of credit/debit cards was maximum
among the respondents. Online payment services
(for example, PayPal) and virtual wallets (for
example, Google Wallet), mobile money transfers
and mobile banking had substantial awareness, but
a trend in the fall of actual use as compared to
knowledge of such services was seen.
Cryptocurrencies, QR code payments and Near-
field communication (NFC) payments are new
technologies that were relatively unknown to most
people.
2. The initiatives taken by the Government have
forced people to use such transactions and some
have realized its benefits. ‘I used to be only dealing
in cash till date but after Prime Minister Modi’s
announcement two weeks back my customers did
not have cash in hand to pay me for essential items.
Instead of going for credit, I thought if I switch over
to Paytm it will be a far better option for me as well
as for my customers,’ said a vegetable vendor in
Kolkata.
3. Summarizing the data from the RBI, it can be seen
that the retail electronic installment space in India is
overwhelmed by modes like NEFT, Immediate
Payment Service (IMPS), and credit and debit cards
which registered a growth of 21.3 per cent in 2017
as compared to 2016. Card based transactions
occupy more than half the share of cashless
payments. Number of transactions using credit
cards grew 47 per cent year-on-year, while it rose
100 per cent for debit cards for the 12-month
period ending May 2017. In May, the transactions
through credit cards were 115.3 million while the
amount for debit cards was 267.5 million. Online
shopping and related discounts have increased the
use of card-based payments significantly. Paper-
based transactions have come down to 6.5 per cent
in 2017 of all non-cash transactions from 13.3 per
cent in 2016. In the past five years, the number of
transactions using mobile banking has gradually
increased by four times to 106 million while the
money transacted has increased by more than 10
times to 1,612 billion.

Consumer Behaviour Towards a Cashless Economy in India PROJECTS
YOUTHINK l 2022 l Vol. XVI 278
RECOMMENDATIONS
1. Adequate and well-working infrastructural offices
should be set up. Constant and regular power
should be accessible even in the remotest territories
of India to guarantee steady network connection.
2. It is suggested that a more noteworthy push should
be given to portable installments in provincial
regions. RuPay, with its versatility can acquire an
upheaval in rustic India as M-Pesa has done in
helpless African countries like Kenya.
3. While government activities have done a lot to
guarantee that an ever-increasing number of
Indians approach e-installment instruments, there
is no motivation for them to utilize these
instruments in lieu of cash.
4. Regular mindfulness missions to instruct people in
general on the credit-only exchange channels and
safety efforts that shield the clients from electronic
burglary should be embraced.
The investigation shows that not many individuals
accept that a cashless economy can, as of now, be
carried out. Many people would not like to surrender
money. Consequently, the execution of cashless
arrangements would be completed in distinct stages.
India ought to gradually move towards a cashless
economy rather than radically executing new strategic
changes.
CONCLUSION
The advancement of cashless exchange can possibly
change monetary movement and accomplish formative
objectives. Cashless strategy has the ability to find all
significant development of cash including terrorism
financing, bribery and all endeavours to bargain
monetary straightforwardness. The dread of being
ransacked of an enormous amount of cash would not
be there again, since individuals wouldn't convey
money. Throughout the following decade, there would
be progress towards a cashless economy both in India
and different nations.
REFERENCES
1. Batra, S. K. & Kazmi, S. (2008). Consumer Behaviour (second
edition). Thrissur: Excel Books.
2. Das, A. (2010). Cashless Payment System in India: A
Roadmap.
Retrieved from http://dspace.library.iitb/
3. Humphrey, D. B. & Berger, A. N. (1990). Market Failure and
Resource Use: Economic Incentives to Use Different
Payment Instruments.
4. Swartz, D. D. G., Hahn, R. W. & Layne-Farrar, A. (2004).
Economics of a Cashless Society: An Analysis of Costs and
Benefits of Payment Instruments.
5. India Development Fund (IDF). Internet and Mobile
Association of India (IAMAI), (2016). Road to Less Cash. s.l.:
s.n.
6. Reserve Bank of India, Database [Online] available at:
http://rbi.org.in/scripts/statistics.aspx
7. http://cashlessindia.gov.in/, India Moving Towards Cashless
Economy.
8. ht tp: / /n i t i .gov. in/wr i tereaddata/ f i les /Dig i ta l per
cent20Payments per cent20- per cent20Progress per
cent20Report-April per cent202017.pdf
9. https://www.financialexpress.com/economy/rbi-report-
ondemonetisation-digital-transaction-up-initially-but-
delines-to-5-monthlow-here-is-why/833970/

PROJECTS
YOUTHINK l 2022 l Vol. XVI279
The Sensory Customer - A Study on the General Awareness of Sensory Marketing in Cafes and Restaurants in Kolkata
Dr. Tridib SenguptaAssistant ProfessorDepartment of Commerce (Morning)
Krish MadhogariaDepartment of Commerce (Morning)
Since marketing
involves the
capitalization of
every area and
opportunity, the
senses prove to be
one of the most
exploitable ones.
ABSTRACT
Sensory marketing is used prevalently in the hospitality industry in Kolkata,
precisely in cafes and restaurants. Taste, vision, smell, and sound are the
senses that they try to exploit to create the required atmosphere to attract
customers and make them stay longer. We found that many owners are yet to
realize the potential of sensory marketing and still haven’t used it adequately.

The Sensory Customer PROJECTS
YOUTHINK l 2022 l Vol. XVI 280
So, we look into how it can be implemented effectively.
We try to study the current situation of the sensory
techniques used by cafes and restaurants to attract
customers and analyze their usage patterns. This would
help us find the connection between the awareness and
opinion of both the customers and the owners. There is
a significant impact on the buying choices of the
customer when the senses are manipulated differently.
From customers’ point of view, sensory activities form a
major part of the product they are paying for. It has
become an ineradicable part of the service industry.
Sensory marketing is a relatively underrated and
unexplored form of promotional activity that
entrepreneurs should look to use to their advantage,
especially in industries that have a direct impact on the
customer’s senses.
KEYWORDS: Senses, Cafes and Restaurants, Taste,
Scent, Colour, Music, Sensory Marketing ,
Subconscious, Atmosphere, Service.
INTRODUCTION
Senses are features that make us feel alive and
differentiate us from other species. Since marketing
involves the capitalization of every area and
opportunity, the senses prove to be one of the most
exploitable ones. Cafes and restaurants in Kolkata have
used sensory marketing to attract more customers. The
senses of sight, smell, taste, and sound create a unique
environment in cafes and restaurants. As far as
customers are concerned, they accept that sensory
marketing is fundamental for hospitality because of the
explanation that it is one of the most significant
components of the experience of visiting a restaurant.
Sensory marketing is the activity that emphasizes on
understanding the views of the buyer. The cycle begins
from the stimuli that influence the feelings of the
purchasers to how the customer understands,
comprehends, and reacts to them. These could be the
fundamental factors that impact the customer’s actions
if used properly, and consequently affect the propensity
to spend.
SCOPE OF STUDY
The study is conducted to test sensory marketing’s
awareness among marketeers and its effectiveness on
the modern customer. The research explores the extent
to which the senses are exploited through marketing
and emphasizes how different customers have varied
levels of responsiveness to their activated senses. The
study is based on the cafe and restaurant industry in
Kolkata. The majority of the respondents are millennials
who are regular cafe-goers and casual diners.
LIMITATIONS OF THE STUDY
The collection of primary data is based on 65
respondents, which leads to a very small sample. Thus,
the data collected may be inadequate. Only two
restaurateurs could be interviewed, which might again
lead to inadequate information. The collection of
further information required effort, time, and money.
The instrument used to analyze data was descriptive
and not inferential. Thus, an in-depth statistical analysis
could not be conducted due to the lack of knowledge.
Secondary data collected was based on the findings of
other researchers. Even though proper referencing has
been done, its relevance cannot be justified.
LITERATURE REVIEW
1. Touching, tasting, hearing, smelling, and seeing a
product plays an important role in our
understanding. Recently, behavioural economists
have started addressing these needs through
sensory marketing, which is usually associated with
a favourable emotional response to bring a change
in the shopping behaviour (Yoon & Park, 2012).
2. Sensory marketing, as a marketing-oriented
experience, is one of the innovative solutions that
give the consumer opportunities to percept and
experience the product and services (Heitzler,
Asbury, &Kusner, 2008).
3. An effect on restaurants and cafes is also relevant to
this research - KFC (Monishan, Randhir, Tooraiven,

PROJECTSThe Sensory Customer
YOUTHINK l 2022 l Vol. XVI281
& Latasha, 2016). However, despite the focus on
sensory perceptions within consumer behaviour,
there lacked cohesiveness within this research
stream.
4. In addition, Lindstrom (Lindstrom, 2005)
mentioned that if the consumer’s senses are more
involved, it connects more strongly with the brand,
which means that it can increase the willingness to
pay more.
RESEARCH METHODOLOGY
The research design is partly exploratory and partly
descriptive. Our source of data is primary. It has been
collected through surveys and personal interviews of
owners and regular visitors of cafes and restaurants. The
data has been presented through descriptive statistics
including, graphs, charts, and averages.
Primary Data
Qualitative and quantitative strategies are utilized in
this study, which are: interviews and questionnaires.
The questionnaire addressed the consumer habits on
the preference of its senses. Also, the primary
respondents are individuals who are regular visitors of
restaurants and cafes. The interview approach is often
considered as the viable data collection method. A
handful of restaurateurs were interviewed personally
and asked questions which were categorized into four
parts:
1. General Questions
2. Questions on Sight
3. Questions on Sound
4. Questions on Smell
Secondary Data
Scientific articles, research
papers, and books found on
the internet, which are
important to the topic and
purpose of the paper, are
collected as secondary data to
support the primary data.
Additionally, to stress the dependability of the data, our
sources have been objectively thought through.
EMPIRICAL DATA AND ANALYTICAL FINDINGS
Process of how sensory marketing activities have an
impact on consumers’ decisions - Secondary Data
?Olfactory Senses (Fragrance): Smell is considered
as a strong sense on account of its capacity to induce
feelings; it permits customers to get submerged in
the experience and urges them to linger. Fragrance
seems to be the most reaction-prone because it is
connected directly with the memory of the
customer. Aroma can induce the customer to visit
and return.
?Visual Senses: Colour can impact the mental state
and feelings of customers. Colours give an instant
feeling to the viewer. For example, pink is used for
depicting romance, green for representing the
environment, purple for royalty, et al. In cafes, red is
used because it induces hunger.
?Aural Senses (Sound): Music works beneath the
awareness of the customer. Consumer
consciousness of music is moderately low. In a study
on the impact of music in a restaurant’s
environment, it was concluded that the music
tempo can affect the duration of completion of the
customer’s meal and amount of money they spend
on liquor.
Impact of Sensory Marketing on General Consumer
Behaviour - Questionnaire Part
Part 1: Demographic Information
Demographic Characteristics
Majority of
RespondentsFrequency
Percentage
(100 per cent)
Gender Male 35 53.85
Age 21-25 years 34 52.31
Occupation Student 36 55.38
Income ?5,000 or less 43 66.15
Table 1: Demographic Information
(Source: Primary Data)

The Sensory Customer PROJECTS
YOUTHINK l 2022 l Vol. XVI 282
Part 2: Background of Consumption Pattern of Target
Group Regarding Restaurants and Cafes
Figure 1: Number of Times You Visit a Restaurant or Cafe Per Week?
(Source: Primary Data)
Figure 2: How Much Do You Spend on
Every Visit to a Restaurant or Cafe?
(Source: Primary Data)
Table 2: What is the Most Significant Component of Ambience in a Restaurant or Cafe?
(Source: Primary Data)
ElementPercentage of
AgreementMinimum Maximum Mean
Colour (Both interior and exterior)
32.7 1 5 3.64146
Fragrance 39.7 1 5 3.6753
Music 36.9 1 5 3.5351
Layout of restaurant 38.7 1 5 3.7195
Part 3: Responsiveness to Sensory Marketing in General
Figure 3: What is the Most Suitable Colour for a Restaurant or Cafe?
(Source: Primary Data)
Figure 4: If You Are Passing by a Restaurant,
Can the Smell of Food Influence You to Visit it?
(Source: Primary Data)
The Interview
The owners of two restaurants - ‘Kaidi Kitchen’ and
‘Hammer’ were interviewed. The inferences from the
interviews were:
?Customers are significantly affected by fragrances.
Both interviewees agreed on the use of aromatic oil
at the entrance to create a welcoming and
pleasurable feeling.
?The design of the place creates a first impression for
the customer. The
in te r io r de s i gn
should match the
concept of the
restaurant . The
importance of the
p r o p e r u s e o f
c o l o u r s w a s
emphas ized by
both interviewees.
?Customers are kept
engaged through
music. It is used to induce a relaxed and carefree
environment.
?Furthermore, taste and feel are enhanced by
consistent food quality and hospitable service. All
things apart, for a restaurant/cafe, no sensory
marketing can substitute for taste. Taste has kept
these widely known places going.
Summary of Findings
The effect of sensory marketing on consumer
behaviour:

PROJECTSThe Sensory Customer
YOUTHINK l 2022 l Vol. XVI283
Kolkata customers responded to the seller’s activities
through three ways - Cognitive reaction, Emotional
reaction, and Behavioural reaction.
Cognitive Reaction: We found that customers aware of
sensory activities like fragrance, music and colours in
restaurants/cafe have a response towards the
cognitive thought process. They have the assumption
that cafes will apply sensory marketing, and thus, if
they are missing, the experience becomes
substandard for modern day customers.
Emotional Reaction: Emotions, moods, and feelings
of the customer are directly affected. Fragrance
marketing is one of the most influential as people
react instantly to smell. Tasting and smelling are
almost equally effective. The customer is first
attracted by the smell and then retained through
taste. Cafes use colour to give a soothing feeling to
the customer.
Behavioural Reaction: The seller uses sensory
marketing to enhance service and this response is
essential for the restaurant. The customer responds
by revisiting, spending more, staying longer, and
recommending others.
Tale of the Tape - Objective Findings
Vision: We found that using colour alone does not have
an impact on customer behaviour. In restaurants and
cafes, blue colour lightens the mood and brings about
relaxation. To create the ambience, a warm-coloured
atmosphere is more efficient for the consumer to feel
soothed. It can cause behavioural reactions of staying
longer and spending more money.
Music: Classical and soft music in restaurants passively
cause the customers to spend more money on
expensive dishes. We often see live music on the violin
or piano in high-end restaurants. It gives a feeling of
being elite and classy. Speed tempo music generally
hastens customers, and soft music increases the
propensity to spend.
Scents: Aroma is used to form an ambience. It gives a
sense of relief and happiness to the customers.
Fragrance doubled with music has a very strong impact
on the customer’s experience.
Heinrich Frieling, a colour psychologist showed that the
colour of the food can connect with the scent and can
link with the perception of the customer about the
odour.
Figure 5: Colour-Odour Associations - Henrich Frieling
(Source: www.semanticscholar.org)
CONCLUSION
First and most importantly, we broke down how the
restaurant and cafe industry in Kolkata uses sensory
marketing. Taste, colour, aroma, and music are widely
exploited to motivate customers to buy more and
establish loyalty. In restaurants, white is the most
luxurious colour as per our respondents because it
makes them feel calm and relaxed. Smell of the food is
equally important to attract customers. Music too gives
a relaxing atmosphere in the restaurant.
Secondly, the chain of how senses influence customer
behaviour is depicted through sensory marketing
activities. These activities work through the
subconscious of the customer that changes the thought
process passively. Kolkata’s customers are readily
reactionary to sensory activities. Also, other dimensions
like experience, age, gender, et al., also have an

The Sensory Customer PROJECTS
YOUTHINK l 2022 l Vol. XVI 284
influence on the behaviour and feelings of the
customer.
PRACTICAL IMPLICATION
Once the target group is exposed to the sensory
activities, they are willing to react positively by making
changes to their buying patterns, visiting frequently,
being ready to pay, and increasing loyalty. Moreover,
sensory marketing alone is not adequate to induce
reaction. The fundamental still remains to be quality
and service. If the service or taste of the food is not
good, no amount of sensory marketing can help the
entrepreneur run a profitable cafe/restaurant.
Customer will always be the king, what changes is the
sellers’ approach to please him.
REFERENCES
1. Bagdare, R. J. (2010). Music and Brand Experience in Retail
Stores.
2. Gardener, M. (1985). Mood states and consumer behaviour:
A critical review. The Journal of Consumer Research, 281-
300.
3. Lindstrom, M. (2005). Brand Sense: How to Build Powerful
Brands Through Touch, Taste, Smell, Sight & Sound. Kogan
Page Publishers.
4. Milliman, R. E. (1982). Using Background Music to Affect the
Behaviour of Supermarket. Journal of Marketing, 86-91.
5. Shankar, M., Levitan, C. A., Prescott, J., & Spence, C. (June
2009). The influence of color and label information on flavor
perception. Chemosensory Perception, 53–58.
6. Soars, B. (2009). Driving sales through shoppers’ sense of
sound, sight, smell and touch. Journal of Retail and
Distribution Management, 286 -289.
7. Unnava, H., & Agarwal, S. (1996). Interactive effects of
presentation modality and message-generated imagery on
recall of advertising information. The Journal of Consumer
Research, 81-88.
8. Vicky. (2014, March 3). Sensory Marketing: Using the Senses
for Brand Building. Retrieved from Marketing FAQ:
http://marketingfaq.net/branding/sensory-marketing-and-
branding/
9. Wirtz, M. a. (2001). Congruency of Scent and Music as a
driver of in-store evaluations and behaviour.
10. Yoon, S., & Park, J. (2012). Do sensory ad appeals influence
brand attitude? Journal of Business Research, 1534-1542.
11. Zaltman, G. (2003). How Customers Think.
12. h t tp s : / /www. seman t i c s cho la r.o r g /pape r / Scen t -
Market ing%3A-Subl iminal-Advert is ing-Messages -
Emsenhuber/b74403ce7a8d3870c9a54317750fe2d0abff5
063

PROJECTS
YOUTHINK l 2022 l Vol. XVI285
Impact of Minimalistic Advertising on Consumer Behaviour and Brand PerceptionProf. Aparajita HembromAssistant ProfessorDepartment of Commerce (Evening)
Avani MohtaDepartment of Commerce (Evening)
Minimalist
marketing and
advertising is a
relatively newer
concept and, as
with all emerging
trends in the realm
of marketing and
advertising, it is
essential that
marketers conduct
significant research
to understand the
performance of
these marketing
techniques.ABSTRACT
With the advent of the concept of ‘Less is More’, marketing strategies are
noticing a gradual shift from delivering a message through overcrowded
visual elements to a growing focus on simple, clean, yet meaningful messages

Impact of Minimalistic Advertising on Consumer Behaviour and Brand PerceptionPROJECTS
YOUTHINK l 2022 l Vol. XVI 286
through minimalistic marketing. This study aims to
interpret the influence of minimalistic advertising on
consumer behaviour and brand perception, to
determine the market segment to target these
advertisements to reap higher profits, and to find the
optimal combination of elemental characteristics that
make an attractive minimalist advertisement design.
Descriptive research using snowball sampling is carried
out by disseminating a carefully crafted questionnaire
across various platforms. After careful analysis, it can be
concluded that marketers should target the Indian
millennials with minimalist advertisements and try
incorporating simple font styles, limited texts, and more
negative spaces in them.
KEYWORDS: Advertisement (ad), Minimalistic
Advertising, Minimalist Advertisement Design,
Minimalist Pool of Respondents, Consumer Preference,
Brand Perception.
INTRODUCTION
Minimalist marketing and advertising is a relatively
newer concept and, as with all emerging trends in the
realm of marketing and advertising, it is essential that
marketers conduct significant research to understand
the performance of these marketing techniques-
whether it is creating a positive impact in the minds of
the viewers, whether it is resulting in actual conversions,
which segments of the market, if any, are generating a
favourable response, what features in these
advertisements and promotional efforts are most
appealing, et al. Thus, conducting this research will
help provide powerful insights into the changing
consumer responses and buying behaviour and many of
the questions posed above.
REVIEW OF LITERATURE
According to Suttle (2016), there are many ways by
which one can measure how effective an advertisement
is. Not only do advertisements need to have a greater
reach but also be attractive for the viewers to remember
them. It is important to target the right audience and
appeal to them. The minimalist lifestyle is a new trend
that is emerging worldwide, says Weinswig (2016). We
can see that more and more millennials are taking to the
‘Less is More’ lifestyle. Thus, marketers can better target
these segments by using minimalist themes in their
advertising activities. By limiting the non-significant
elements, minimalism can push key messages to the
audience by being concise, according to Shakeri
(2013). Minimalism is about using colours in
monochromatic themes, simple/classic fonts, leaving
negative spaces, and making ideas pop. This is because
design choices define what culture guides a particular
person – Sinder (2016). Today, minimalism has become
one of the most effective tools to advertise with –
Rasqiyah (2016). Keeping the designs clean and to the
point helps to remove the clutter and focus on what is
important.
To sum it up, the pieces of literature reviewed have
shown that minimalism is becoming more acceptable
and trendier with passing time. The findings of these
studies have indirectly shown a positive correlation
between minimalist advertising and consumer
perception.
OBJECTIVES
?To determine the preferences of customers between
regular adver t i sements and minimal i s t
advertisements.
?To determine the influence of gender and age on
their preferences.
?To determine which target segment to focus
minimalist advertising efforts on and which
elements to include in advertising design to appeal
to them more.
?To interpret the change in consumer buying
behaviour and brand perception due to
minimalistic advertising.
CONCEPTUAL FRAMEWORK
In order to conduct statistical analysis, four variable
factors were considered, and the participants of the
survey were asked to rate each advertisement based on

PROJECTSImpact of Minimalistic Advertising on Consumer Behaviour and Brand Perception
YOUTHINK l 2022 l Vol. XVI287
these factors on a scale of one to five. The factors were:
Likeability: This refers to the ability of an advertisement
to be appealing, attractive, and pleasant to the eye.
Memorability: This denotes the quality of an
advertisement to be worth remembering.
Creativity: This helps evaluate the ability of an
advertisement to be out-of-the-box and impactful.
Brand Retention: This refers to the ability of an
advertisement to create a positive image of the brand in
the viewer's mind.
An advertisement with a higher score in the
aforementioned factors is more likely to be preferred
over one with a lower score. Furthermore, additional
tests were conducted to determine whether gender and
age plays a role in impacting the scores given by the
respondents for each of these factors and thus,
indirectly impacting their preferences (see Figure 1).
Figure 1: Factors Affecting Consumer Preference
This study also aims to denote whether minimalistic
advertisements were preferred over regular
advertisements due to their elemental characteristics
and if yes, then which characteristics would constitute
an attractive minimalist advertisement design (see
Figure 2).
Hypotheses Formulation
Colour Scheme: The colour palette used in an
advertisement design is chosen very carefully as it
possesses the ability to change the mood of the viewers
and how they perceive the product. The hypothesis for
this construct is:
H1 = Minimalist advertisement design is not associated
with colour scheme.
Font Style: The style of typography is another important
element capable of affecting the visual appeal of an
advertisement. The hypothesis for this construct is:
H2 = Minimalist advertisement design is not associated
with font style.
Text Length: Text is an important element of any
advertisement design. It enables the marketer to convey
the brand’s message in words. The hypothesis for this
construct is:
H3 = Minimalist advertisement design is not associated
with text length.
Space: This refers to the quantity of air or space that is
used up by the elements of an advertisement design.
This affects the ability of an advertisement to be visually
soothing. The hypothesis for this construct is:
H4 = Minimalist advertisement design is not associated
with space.
Figure 2: Elements Constituting Minimalistic Advertisement Design
RESEARCH METHODOLOGY
A questionnaire for online distribution was formulated.
The snowball (convenience) sampling technique was
used for the purpose of this research. The respondents
of the survey had been reached out to personally via
acquaintances. A total of 142 individuals participated in
this survey, with the data being collected from March
2021 to April 2021 across India. The chi-square test of
independence (chi- squared tes t and chi-

Impact of Minimalistic Advertising on Consumer Behaviour and Brand PerceptionPROJECTS
YOUTHINK l 2022 l Vol. XVI 288
squared/degrees of freedom, and
p-values) test was conducted to
test the formulated hypotheses
(H1 through H4). The t-test was
conducted to analyze the effects
of gender and age on the
respondents’ choices. Other
measures of central tendency
have also been incorporated
through the study.
DATA ANALYSIS AND INTERPRETATION
Demographic Variables:
Figure 3: Respondents’ Demography
(Source: Primary Data)
Determining the Impact of Advertising Efforts by
Brands on Consumer Perception and Behaviour:
The respondents were asked to rank the various
attributes they seek before arriving at a purchase
decision. Figure 4 summarizes the same.
The results indicate that although advertising and
packaging design play a significant role, the brand
name, and the product quality, features and price play a
greater role in influencing consumer behaviour and
brand perception. However, it is inconclusive due to
biases.
To gain a better understanding of the influence of
marketing activities on the minds of the consumers, the
respondents were asked to choose among ‘Yes’, ‘No’,
and ‘Neutral’ for the following set of statements–
Statement 1: When I come across appealing
advertising or packaging design, my perception of the
concerned brand enhances.
Statement 2: I am more likely to remember a brand
engaged in excellent marketing activities than a generic
brand.
Statement 3: While evaluating product alternatives,
brand marketing plays an important role.
The responses to these statements could indicate that if
not directly, marketing activities undertaken by brands
and their advertising design and packaging design do
play an indirect yet significant role in influencing
consumers’ brand perception eventually and thus,
impacting their buying behaviour.
Figure 4: Respondents’ Respective Priority During First Purchase
(Source: Primary Data)

PROJECTSImpact of Minimalistic Advertising on Consumer Behaviour and Brand Perception
YOUTHINK l 2022 l Vol. XVI289
Understanding
Consumer
Preferences between
Regular
Advertisements and
Minimalist
Advertisements:
A set of six advertisements were displayed, three being
minimalist advertisements and three being regular
advertisements, and the participants of the survey
(respondents) were supposed to rate each
advertisement on the basis of four variable factors –
namely, Likeability, Memorability, Creativity, and Brand
Retention - on a scale ranging from ‘Poor ’to ‘Excellent’.
Figure 5: Representation of responses to Q3 of the survey
(Source: Primary Data)
Figure 7: Measuring Central Tendencies for this Advertisement
(Source: Primary Data)
Here, a 5-point Likert Scale was used to
measure the scores given to each
advertisement by each respondent. Five
points were assigned to ‘Excellent’; four
points to ‘Very Good’ and so on.
Figures 6-19 illustrate the findings for each
advertisement.
Figure 6: Advertisement Name and Type- Heinz
Tomato Ketchup; Minimalist
Advertisement 1:
Advertisement 2:
Figure 8: Advertisement Name and Type- Nike Shoes; Minimalist

Impact of Minimalistic Advertising on Consumer Behaviour and Brand PerceptionPROJECTS
YOUTHINK l 2022 l Vol. XVI 290
Figure 9: Measuring Central Tendencies for this Advertisement
(Source: Primary Data)
Advertisement 3:
Figure 10: Advertisement Name and Type-
Nivea Night Cream; Minimalist
Figure 11: Measuring Central Tendencies for this Advertisement
(Source: Primary Data)
Advertisement 4:
Figure 12: Advertisement Name
and Type - Old Spice Shower
Gels; Regular
Figure 13: Measuring Central Tendencies for this Advertisement
(Source: Primary Data)
Advertisement 5:
Figure 14: Advertisement Name and
Type - Subway Wraps; Regular
Figure 15: Measuring Central Tendencies for this Advertisement
(Source: Primary Data)
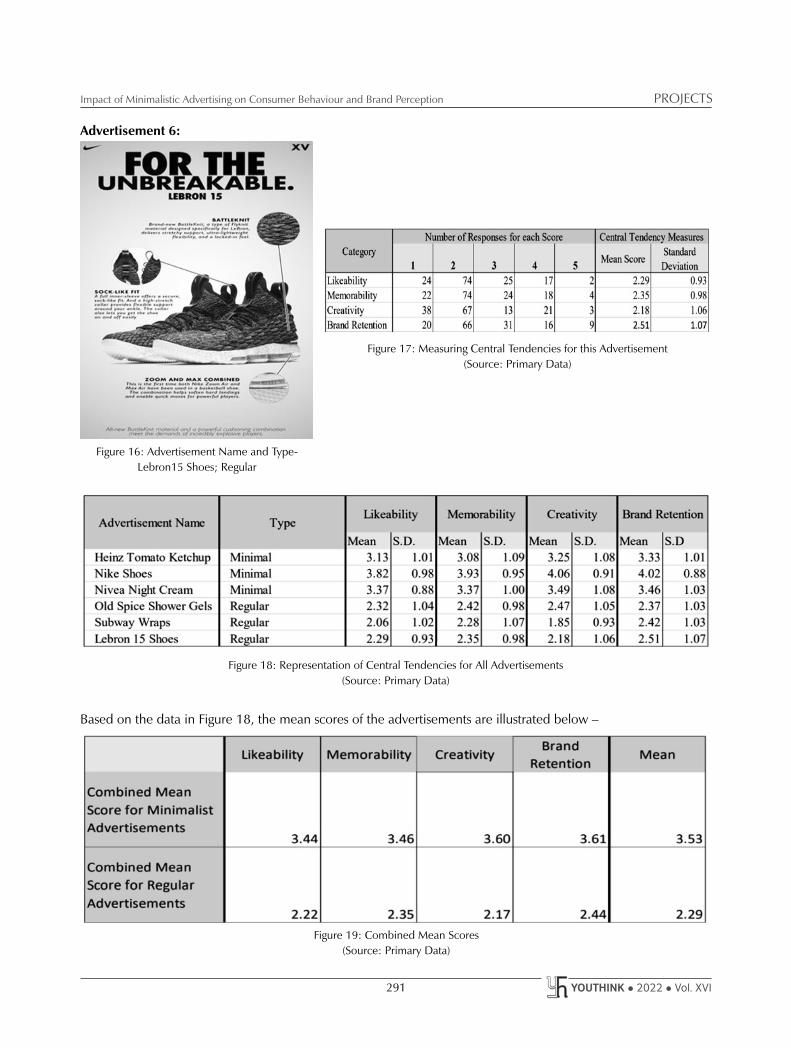
PROJECTSImpact of Minimalistic Advertising on Consumer Behaviour and Brand Perception
YOUTHINK l 2022 l Vol. XVI291
Advertisement 6:
Figure 16: Advertisement Name and Type-
Lebron15 Shoes; Regular
Figure 17: Measuring Central Tendencies for this Advertisement
(Source: Primary Data)
Figure 18: Representation of Central Tendencies for All Advertisements
(Source: Primary Data)
Based on the data in Figure 18, the mean scores of the advertisements are illustrated below –
Figure 19: Combined Mean Scores
(Source: Primary Data)

Impact of Minimalistic Advertising on Consumer Behaviour and Brand PerceptionPROJECTS
YOUTHINK l 2022 l Vol. XVI 292
The combined mean score for minimalist
advertisements is higher than the combined mean score
for regular advertisements. Hence, it can be concluded
that minimalist advertisements were preferred over
regular advertisements by a majority of the population.
This answers the first objective of this research.
Understanding the Influence of Gender and Age on
Preference of Minimalist Advertisements:
Out of the 142 respondents, 124 respondents'
individual minimalist advertisement score was higher
than the regular advertisement score. This implies that
these individuals have a greater liking towards
minimalist advertisements than the other respondents.
The respondents were asked to rate the six
advertisements, three minimalist and three regulars,
under four categories, with the lowest score being one
and the highest being five. For each advertisement, an
average score out of five was calculated. To find the
overall minimalist advertisement score for each
respondent, their average scores for each minimalist
advertisement were added - thus, giving us a combined
score out of 15, similarly for regular advertisements.
Those respondents whose individual minimalist ad
scores were higher than that of the regular ad scores
have been considered for the next set of analyses. For
simplicity in understanding, this pool of respondents
will be referred to as the ‘minimalist pool of
respondents.’
Process 1:
A Two-Sample Assuming Equal Variances t-test was
conducted to determine the effect of gender on the
preferences of the minimalist pool of respondents
under each category – likeability, memorability,
creativity and brand retention.
Of the minimalist pool of respondents, 62 were males,
61 were females, and one respondent did not prefer to
reveal its gender. Hence, the t-test will be performed on
this pool of respondents minus the one respondent
whose gender remains unidentified.
The Hypotheses for each construct:
H0 (Null Hypothesis): There is no mean difference
between the choices of males and females
Ha (Alternate Hypothesis): There is a mean difference
the choices of males and females.
Likeability –
Figure 20: t-test Results for Likeability
(Source: Primary Data)
This implies that no significant difference existed
between the group of females (M=10.55738;
SD=2.029159) and the group of males (M=10.83871;
SD=3.285034); t (121) =-0.81125, p=0.418814 in
the given sample.
?Since the t-Stat value lies in the non-rejection region
owing to the t-Critical two-tail value, 0 is not
rejected.
?However, since p > a (where a =0.05), the result
arrived at is not significant.
Hence, it can be concluded that gender does not play a
role in affecting the respondents’ preferences here.
Memorability –
Figure 21: t-test Results for Memorability
(Source: Primary Data)

PROJECTSImpact of Minimalistic Advertising on Consumer Behaviour and Brand Perception
YOUTHINK l 2022 l Vol. XVI293
This implies that no significant difference existed
between the group of females (M=10.67213;
SD=2.111251) and the group of males (M=10.85484;
SD=2.296446); t (121) =-0.45914, p=0.646954 in
the given sample.
?Since the t-Stat value lies in the non-rejection region
owing to the t-Critical two-tail value, 0 is not
rejected.
?However, since p > a (where a = 0.05), the result
arrived at is not significant. Hence, gender does not
affect the respondents’ preferences in this category
here.
Creativity –
Figure 22: t-test Results for Creativity
(Source: Primary Data)
This implies that no significant difference existed
between the group of females (M=10.98361;
SD=2.045253) and the group of males (M=11.46774;
SD=1.939391); t (121) =-1.34728,
p=0.180408 in the given sample.
?Since the t-Stat value lies in the non-rejection region
owing to the t-Critical two-tail value, 0 is not
rejected.
?However, since p > a (where a = 0.05), the result
arrived at is not significant. Hence, it can be inferred
that gender does not affect the respondents’
preferences here.
Brand Retention –
Figure 23: t-test Results for Brand Retention
(Source: Primary Data)
This implies that no significant difference existed
between the group of females (M=11.21311; SD
=1.958867) and the group of males (M =11.27419;
SD =1.848077); t (121) = -0.1779, p = 0.8591 in the
given sample.
?Since the t-Stat value lies in the non-rejection region
owing to the t-Critical two-tail value, 0 is not
rejected.
?However, since p > a (where a = 0.05), the result
arrived at is not significant. Hence, it can be
concluded that gender does not affect the
respondents’ preferences here.
Therefore, it can be inferred that gender played no role
in influencing the decisions of the minimalist pool of
respondents.
Process 2:
A Two-Sample Assuming Equal Variances t-test was
conducted to determine the effect of age on the
preferences of the minimalist pool of respondents
under each category – likeability, memorability,
creativity, and brand retention.
Of the minimalist pool of respondents, the majority of
the respondents belonged to either of the two age
groups: 18-25 or 26-35. 87 respondents belonged to
the 18-25 age group while 27 respondents belonged to
the 26-35 age group. Hence, the t-test was be
performed on these individuals only.
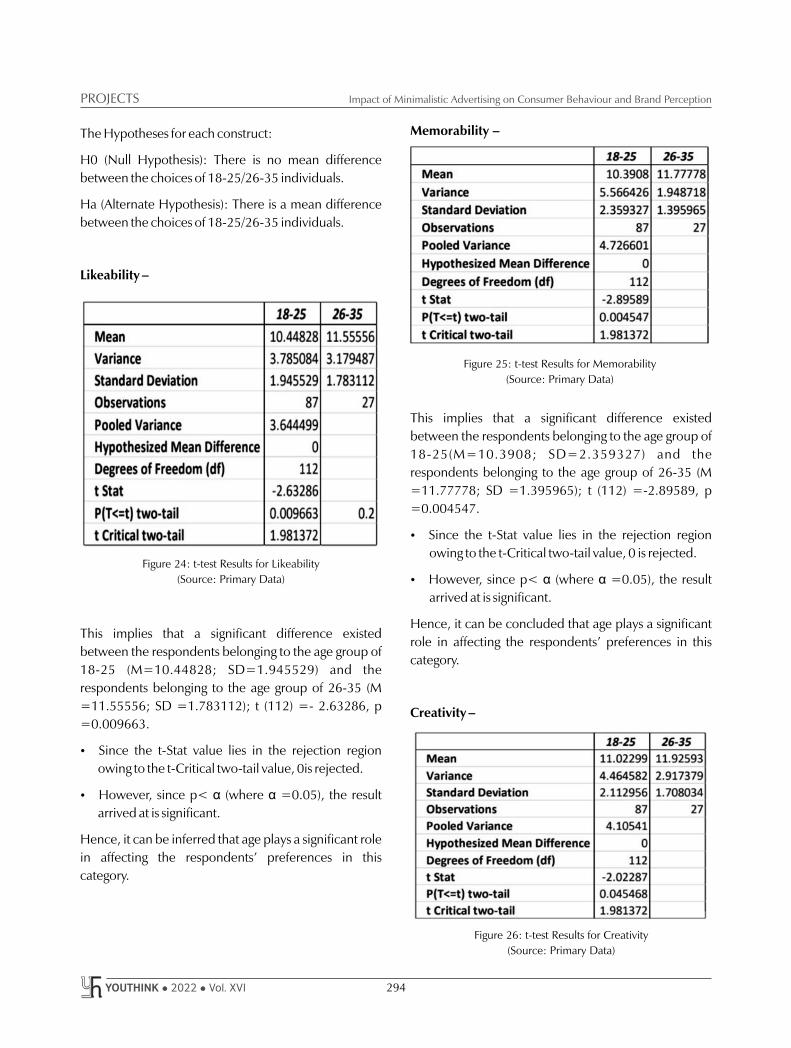
Impact of Minimalistic Advertising on Consumer Behaviour and Brand PerceptionPROJECTS
YOUTHINK l 2022 l Vol. XVI 294
The Hypotheses for each construct:
H0 (Null Hypothesis): There is no mean difference
between the choices of 18-25/26-35 individuals.
Ha (Alternate Hypothesis): There is a mean difference
between the choices of 18-25/26-35 individuals.
Likeability –
Figure 24: t-test Results for Likeability
(Source: Primary Data)
This implies that a significant difference existed
between the respondents belonging to the age group of
18-25 (M=10.44828; SD=1.945529) and the
respondents belonging to the age group of 26-35 (M
=11.55556; SD =1.783112); t (112) =- 2.63286, p
=0.009663.
?Since the t-Stat value lies in the rejection region
owing to the t-Critical two-tail value, 0is rejected.
?However, since p< a (where a =0.05), the result
arrived at is significant.
Hence, it can be inferred that age plays a significant role
in affecting the respondents’ preferences in this
category.
Memorability –
Figure 25: t-test Results for Memorability
(Source: Primary Data)
This implies that a significant difference existed
between the respondents belonging to the age group of
18-25(M=10.3908; SD=2.359327) and the
respondents belonging to the age group of 26-35 (M
=11.77778; SD =1.395965); t (112) =-2.89589, p
=0.004547.
?Since the t-Stat value lies in the rejection region
owing to the t-Critical two-tail value, 0 is rejected.
?However, since p< a (where a =0.05), the result
arrived at is significant.
Hence, it can be concluded that age plays a significant
role in affecting the respondents’ preferences in this
category.
Creativity –
Figure 26: t-test Results for Creativity
(Source: Primary Data)

PROJECTSImpact of Minimalistic Advertising on Consumer Behaviour and Brand Perception
YOUTHINK l 2022 l Vol. XVI295
This implies that a significant difference existed
between the respondents belonging to the age group of
18-25(M=11.02299; SD=2.112956) and the
respondents belonging to the age group of 26-35 (M
=11.92593; SD =1.708034); t (112) =-2.02287, p
=0.045468.
?Since the t-Stat value lies in the rejection region
owing to the t -Critical two-tail value, 0 is rejected.
?However, since p< a (where a =0.05), the result
arrived at is significant.
Hence, it can be concluded that age plays a significant
role in affecting the respondents’ preferences in this
category.
Brand Retention –
Figure 27: t-test Results for Brand Retention
(Source: Primary Data)
This implies that a significant difference existed
between the respondents belonging to the age
group of 18-25 (M=10.95402; SD=2.04546)
and the respondents belonging to the age group
of 26-35 (M =12.11111; SD =1.281025); t
(112) =-2.77071, p =0.00655.
?Since the t-Stat value lies in the rejection
region owing to the t Critical two-tail value, 0
is rejected.
?However, since p< a (where a =0.05), the
result arrived at is significant.
Hence, it can be concluded that age plays a significant
role in affecting the respondents’ preferences in this
category.
Therefore, from the tests conducted above, it can be
inferred that age had a significant role to play in
influencing the decisions of this subset of the minimalist
pool of respondents, with the age group 26-35 (due to
the higher mean) being more positively impacted by
minimalist advertisements as compared to the age
group 18-25.
Determining the Descriptive Characteristics of
Minimalist Advertisement Design:
The following analysis has been performed to denote
whether minimalistic advertisements were preferred
over regular advertisements due to their elemental or
descriptive characteristics and if yes, then which
characteristics would make the minimalist
advertisement design the most attractive and appealing
to the target audience.
Chi–squared tests of independence have been
conducted to understand whether the choices made by
the minimalist pool of respondents were impacted by
the following characteristics.
The Hypotheses for each construct:
H0 (Null Hypothesis): Minimalist advertisement design
is not associated with descriptive characteristics.
Ha (Alternate Hypothesis): Minimalist advertisement
design is associated with descriptive characteristics.
Colour Scheme –
Figure 28: Chi Square Test Results for Colour Scheme
(Source: Primary Data)
We can see that there was not a significant association
between minimalist advertisement design and colour
scheme, ?2 (1, N=124) = 3.23, p =0.07.

Impact of Minimalistic Advertising on Consumer Behaviour and Brand PerceptionPROJECTS
YOUTHINK l 2022 l Vol. XVI 296
?The Test-Statistics value is lesser than the critical
value, hence, the null hypothesis cannot be
rejected.
?However, since the p-value > a, the result arrived at
is not significant.
Font Style –
Figure 29: Chi Square Test Results for Font Style
(Source: Primary Data)
Space –
We can see that there was a
significant association between
minimalist advertisement design
and colour scheme, ?2 (1, N =124)
= 44.16, p=3.02403 E-11.
?The Test-Statistics value is greater
than the critical value, hence, the
null hypothesis can be rejected.
?However, since the p-value < a, the result arrived at
is significant.
Text Length–
Figure 30: Chi Square Test Results for Text Length
(Source: Primary Data)
We can see that there was a significant association
between minimalist advertisement design and colour
scheme, ?2 (1, N =124) =67.40, p=1.43439 E-16.
The Test-Statistics value is greater than the critical value,
hence, the null hypothesis can be rejected.
However, since the p-value < a, the result arrived at is
significant.
Figure 31: Chi Square Test Results for Space
(Source: Primary Data)
We can see that there was a significant association
between minimalist advertisement design and colour
scheme, ?2 (1, N =124) = 51.61, p = 6.75959 E-13.
?The Test-Statistics value is greater than the critical
value, hence, the nul l
hypothesis can be rejected.
?However, since the p-value <
a, the result arrived at is
significant.
Therefore, it can be concluded
that the respondents were
unaffected by the colour scheme
of the advertisement design, even
if monochromes are associated
more with minimalism in general.

PROJECTSImpact of Minimalistic Advertising on Consumer Behaviour and Brand Perception
YOUTHINK l 2022 l Vol. XVI297
Simple font, limited text, and greater negative (empty)
space are preferable. This answers the second part of
the third objective of the study.
CONCLUSION
The responses of the participants in the survey to the
factors that affect their purchase decisions indicate that
the marketing and branding efforts of companies play
an indirect yet significant role in influencing their
perception of the brand and long-term purchase
decisions. Statistical analysis was conducted to interpret
the impact of minimalistic marketing and advertising on
their behaviour and perception. The results showed
that all minimalist advertisements received a higher
combined mean score, on Likert scales than the
combined mean scores of the regular advertisements.
Based on the demography, a major part of the
minimalist pool of respondents consisted of individuals
belonging to age groups 18-25 and 26-35 (millennials).
T-test results (on the minimalist pool of respondents)
indicated that while gender [male (51 per cent) and
female (49 per cent)] did not play a significant role in
affecting the responses of the participants, age [18-25
(65 per cent) and 26-35 (27 per cent)] played a
significant role in impacting the preferences of the
participants – with the age group of 26-35 being more
positively impacted by minimalist advertisements. Chi-
square tests of independence indicated that apart from
colour scheme, all the other elemental characteristics
played a significant role in appealing to the minimalist
pool of respondents and an attractive minimalist ad
design would constitute simple font styles, limited texts,
and greater negative space.
Hence, marketers should focus their minimalistic
marketing efforts on Indian millennials, particularly the
age group of 26-35. Their advertisement designs should
have more negative or empty space, with a greater
focus on the message of the brand, and classy visual
appearance – using simple fonts, limited texts and
making their advertisements less crowded.
REFERENCES
1. Advertising. In: Zabkar V., Eisend M. (eds) Advances in
A d v e r t i s i n g R e s e a r c h V I I I .
EuropeanAdvertisingAcademy.SpringerGabler,Wiesbaden.R
etrievedfrom:https://doi.org/10.1007/978-3-658-18731-
6_1.
2. Amitava Chattopadhyay and Prakash Nedungadi (1990). Ad
Affect, Brand Attitude, and Choice: The Moderating Roles of
Delay and Involvement, Journal of Consumer Research,
Vol.19. Retrieved from: https://www.jstor.org/stable/
2489185.
3. Garaszczuk, Michael, ‘Attentional-Capture Efficacy and
Brand Qualities of Minimalist Packaging Design’.
4. Impressions. Journal of Marketing, 72(3), 64–81. Retrieved
from: https://doi.org/10.1509/JMKG.72.3.064.
5. Margariti K., Boutsouki C., Hatzithomas L., Zotos Y. (2017) A
?ypology of Minimalism.
6. Mitchell, A. A., and Olson, J. C. (1981). Are product attribute
beliefs the only mediator of advertising effects on brand
attitude? Journal of Marketing Research, 18(3),
318–332.https://doi.org/10.2307/3.
7. Niazi, Ghulam Shabbir Khan and Siddiqui, Javaria and Shah,
Burhan Ali and Hunjra, Ahmed Imran, 2011. ‘Effective
advertising and its influence on consumer buying behavior’,
‘MPRA Paper’ 40689, University Library of Munich,
Germany.
8. Orth,U.R., and Malkewitz,K.(2008).Holistic Package Design
and Consumer Brand.
9. Rick Suttle (2016). ‘The Disadvantages of Target Marketing’.
Retrieved from: smallbusiness.chron.com,https://
smallbusiness.chron.com/disadvantages-target-marketing-
36131.html.
10. Wren, C.R., Reynolds, C.J. Minimalism in ubiquitous
interface design. Pers UbiquitComput8,370–373(2004).
Retrieved from: https://doi.org/10.1007/s00779-004-0299-
2.
11. (2015). Undergraduate Honors Theses.21. Retrieved from:
https://ir.lib.uwo.ca/psychK_uht/21.

PROJECTS
YOUTHINK l 2022 l Vol. XVI 298
Electronic Overload: Is Your Screen Time Affecting Your Mental Health?Prof. Arpita DeyAssistant ProfessorDepartment of Commerce (Evening)
Ansu BagriDepartment of Commerce (Evening)
Although words
like anxiety,
depression, and
mental instability
had come into
existence in the
14th century,
their prevalence
and knowledge
among the
people has
spread in recent
years.
‘The biggest challenge currently is the rodomontade and boastful showcasing
of an individual’s lifestyle on social media which induces a feeling of jealousy
and reduces one’s self-esteem.’

PROJECTSElectronic Overload: Is Your Screen Time Affecting Your Mental Health?
YOUTHINK l 2022 l Vol. XVI299
ABSTRACT
The word ‘digitalization’ brings to our mind a pictorial
representation of everything being operated with a
single tap on the screen and with ease. At the outset, the
growing digital world seems like the biggest progress
towards development, but on looking closer, it has
somewhat destroyed the inner emotions and made
people hollow both from their mind and body. The
growing exposure towards digital screens has a direct ill
effect on both the physical and mental health of the
younger generation. Starting from reduced physical
activities to creating inner battles within humans like
depression, screen time has been playing its part very
effectively.
Although the evolution of digitalization has made our
task easier, it has given birth to three R’s of emotions:
Restlessness, Rebellious and Resentment. Out of these
three emotions, restlessness has taught the world a new
phenomenon – ‘The 30-Second Effect’. The COVID-19
pandemic has further infused the usage of screens in
our daily lives. Currently, different varieties of people,
differentiated by age, profession and other parameters,
record different screen time usage. Given the current
scenario, the future of the human race, with increasing
screen time, seems blurry and scary. This digital
solution, created to solve other problems, seems like a
problem in itself. Yet, the hope that we will find some
way around must not subside.
KEYWORDS: Digitalization, Screen Time, Mental
Health, Restless.
INTRODUCTION
Humans, the evolving bodies of knowledge and
curiosity, are getting engaged in an immense and
addictive use of digital products for performing their
everyday activities. Screen time, in general, is an
umbrella term for the time that an individual spends in
front of the screens of their electronic devices. ‘The
Blue Screen of Death’, a term coined for the big
television and digital screens, is affecting the mental
health and ability of the people. Given the
revolutionary digitalization of every activity possible,
the need and want of using these devices has increased
incessantly. On comparing the current and the past
generations, we have seen that mental sanity and health
have diminished universally. According to a general
survey, an average individual currently spends more
than five to six hours of the day in front of a screen. The
mental well-being of individuals is not given due
attention. Although words like anxiety, depression, and
mental instability had come into existence in the 14th
century, their prevalence and knowledge among the
people has spread in recent years.
Mental health is starting to get serious as the years pass
by, and is correlated to the concurrent increase in
screen time. The lives of those in the current young
generation revolve around screens. Right from playing
video games to attending online classes, they use
mobile devices excessively and are constantly in
contact with screens, which are affecting them mentally
and physically.
Good mental health means a mind free of problems like
anxiety, depression, overthinking and other
psychopathological symptoms. Currently, excessive
screen time has inculcated a feeling of restlessness and
impatience among users. The growing existence of
social media usage is not only emerging as an addiction,
but also as a barrier to a healthy mind. The
rodomontade and boastful showcasing of an
individual’s lifestyle on social media induces a feeling of
jealousy and reduces one’s self-esteem. Not having the
means to acquire something does not only frustrate an
individual, but also makes them gloomy. Keeping in
mind that a good mind is a good life, the world needs to
start keeping a check on their screen time.
LITERATURE REVIEW
?Jean M. Twenge (2020) observed in his work, how
digitalization has led to an increase in the
prevalence of diseases like anxiety, depression and
suicidal thoughts among adolescents residing in the
United States. He brought forward a comparison on
how the mental health of the young generation has
been diminishing from the 2000s to the 2010s, due
to the excessive use of digital sources.
?Xiaoyan Wu et al. (2016) in their study, assessed the

Electronic Overload: Is Your Screen Time Affecting Your Mental Health?PROJECTS
YOUTHINK l 2022 l Vol. XVI 300
impact of the increase in screen time on college
students residing in China. They brought to light a
striking analysis, that an increase in the screen time
by two hours per day led to a concurrent increase in
the index for anxiety, depress ion and
psychopathological symptoms from 1.12 to 2.83,
1.25 to 1.93 and 1.22 to 1.83 respectively. Although
the degree of impact was not found, they deduced
that it had some impact on mental health.
?Amber Berthope et al. (2016) observed that the time
spent on social media had a great impact on the
increasing risk of depression and self-harm. They
surveyed through questionnaires and deduced that
by a 30-minute increase in social media screen time,
the risk of self-harm would increase approximately
by 15 per cent. They also found that excessive use of
social media could lead to a reduction the self-
esteem in females by 12 per cent.
?TS Piola et al. (2015) studied that due to increasing
digitalization and easy access to the internet and
social media, the level of physical activity performed
by the youth has decreased severely. It was observed
that the screen time among females was high and
that there was a decreasing trend in the physical
activities undertaken by them.
OBJECTIVES
In this project, I would like to frame inferences on the
following parameters:
?To observe the impact of the increase in screen time
on the health of the younger generation.
?To understand the three R’s of emotions, developing
due to increased screen time.
?To discuss the new age phenomenon: ‘The 30-
Second Effect’.
?To confer various mediums that account for their
daily screen time of people of different generations.
?To discuss how screen time would have a lasting
impact on the present and the future generations,
with the future significantly differing from the
current scenario.
RESEARCH METHODOLOGY
The research was conducted to collect information on
the digital usage and well-being of people. The research
made to shape this paper was exploratory, descriptive
and analytical.
Research Data
Data Type
The methodology adopted for procuring information is
based on primary data as well as secondary data.
Primary data has been collected through a survey using
questionnaires, on the basis of which analytical
inferences have been drawn. Journals, research papers,
columns and other articles have been used to collect
secondary data for the research paper. Secondary data
has been used along with primary data to draw final
conclusions.
Sampling Procedure
Primary data has been obtained using a questionnaire,
prepared and shared using Google Forms.
Sample Size
The primary data used in shaping the project was based
on the responses of 178 respondents.
Area of Study
The study is primarily based on the residents of Kolkata,
West Bengal, India. The residual response was received
sporadically from other cities in India and abroad.
Tools and Techniques Used
Various analytical techniques like Data Mining and
What-If Analysis have been used to bring out a few
findings. Other analytical tools like pie charts and
histograms have been used to show various ratios and
inferences.
Impact of Screen Time on the Health of the Young
Generation
1. Reduced Physical Activities
The current companion of each and everyone is their
mobile phone. The excessive and addictive use of
mobile devices, for any purpose, has shifted people’s
need and will to do any physical activity. Outdoor

PROJECTSElectronic Overload: Is Your Screen Time Affecting Your Mental Health?
YOUTHINK l 2022 l Vol. XVI301
football has been replaced with FIFA PlayStation games
and body workouts have been replaced with being lazy
and scrolling through social media platforms.
On comparing with the previous generations, the time
invested to play outdoor sports has clearly shown a
downtrend. This subtraction of physical activities from
daily life has not only made people lazy, but has also led
to them suffering from
health problems like acute
back pain and other
muscle pains at a very early
age.
According to the survey
conducted, 50.3 per cent
of the respondents stated
that their physical activities
have died down, with the
same being replaced by
their screen time.
Figure 1: Representing the Reduction in Physical
Activities Due to Increase in Screen Time
(Source: Primary Data)
2. Academic Problems
The excessive use of electronic devices is making
people, and in particular students, have a laid-back
attitude towards their work and studies. The prevalence
of ‘phone addiction’ has led students to deviate their
focus from studies. The once undivided attention is
now hampered because people have started directing
their time towards unwanted content consumption.
On being asked what activity an individual would prefer
after having spent hours in front of a screen, only five
people per 100 respondents replied that they would be
in the mental space to study anything post the long
screen view.
3. Violence
Gaming is one of the most addictive aspects
relating to screen time. There have been
instances when young adults dwelling in the
world of gaming, were trapped in its whirlpool
and ultimately lost their lives. Moreover, there
have been cases of individuals committing
suicide because of their defeat in a game.
Games like ‘Pokemon Go’ and ‘PubG’ have
been banned because of their addictive and
negative nature.
4. Behavioural Change
Humans become what they see, watch, observe, and
surround themselves with. This human tendency of
adapting and changing according to what they see, is
one of the prime factors of any behavioural change that
takes place because of an increase in screen time. In the
survey conducted, it was seen that more than 50 per
cent of the respondents, who spend more than one
hour per day on social media platforms, reported that
they get angry and agitated easily.
Figure 2: Collective Response Depicting How Post-Excessive Screen Time Hampers Concentration
(Source: Primary Data)

Electronic Overload: Is Your Screen Time Affecting Your Mental Health?PROJECTS
YOUTHINK l 2022 l Vol. XVI 302
Exposure to social media, where anyone and everyone
tries to put a better picture of the reality, makes the users
viewing it feel low, due to which their self-esteem gets
hampered. The regular view of people living their best
lives fills the mind of the viewer with indirect frustration
and jealousy. The same is vented by them through the
behavioural change of being mean and rude to other
people.
Figure 3: Response on Whether the Respondents
Get Easily Angry
(Source: Primary Data)
5. Depression
Since the advent of digitalization, there has been a spike
in the cases of people suffering from depression. This is
one of the alarming side effects of excessive screen time
usage. The constant use of social media, where people
generally tend to portray the better part of their lives,
makes the viewers feel low about themselves.
Cyberbullying is one of the causes of depression among
renowned individuals. The comments and opinions
posted online often lead to individuals questioning their
existence. According to the survey conducted, 95 of the
respondents stated that they often feel detached from
their families.
The Three R’s of Emotion
The booming screen time usage has planted the seeds
of three R’s of emotion: Restlessness, Rebellious and
Resentment.
Restlessness
The growth of the social media industry
and the influence it has had on people has
been immense. The constant use of social
media by different age groups has led to
the growth of varied emotions in them.
The new age updates in social media in the
form of short videos, such as ‘Reels from
Instagram’, ‘TikTok videos’ and ‘Facebook
stories’ have trained the minds of the
viewers to consume something new every
30 seconds or less. This habitual quick shift in focus and
attention has resulted in the users becoming more and
more restless. The urge to consume new content with
every passing second makes their mind fickle. The same
users who consume such social media content every
day, when denied access to it, get restless. This affects
their normal working behaviour too. From not being
able to wait for an extra second, to skipping the content
if it’s too long, the users become restless with time.
Rebellious
Studies have proved that excessive usage of digital
screens can make a mind frustrated and
agitated. The same frustration gets
directed in one’s normal life. People using
mobile phones excessively, tend to
remain frustrated and start to rebel against
everything that comes their way. This
rebellious nature is merely the result of
the agitation that gets bottled up while
they look at their screen. This particular
nature is developed quickly in kids of
tender age. Through the survey, it was
observed that kids, who tend to have a
higher screen time in their tender age, Figure 4: Response on Feeling Disconnected from Family or Friends
(Source: Primary Data)

PROJECTSElectronic Overload: Is Your Screen Time Affecting Your Mental Health?
YOUTHINK l 2022 l Vol. XVI303
become more rebellious and ill-mannered. Their mind
becomes fickle and they become less attentive.
Resentment
The growing attachment with the virtual world has
made physical contacts less welcomed. People have
started to indulge in the virtual world to such an extent
that any physical presence seems bothersome,
uncomfortable and unwanted. This has made people
start feeling less connected, with a feeling of resent
coming into the picture. The hollow world of social
media showcases the best of all people, which makes
the viewers jealous, and causes them to question their
self-esteem. This feeling of jealousy makes people
resent each other and feel detached from their friends
and family.
The 30-Second Effect
Scrolling through social media platforms causes one
striking problem - frustration. The 30-second videos
created by the people, when consumed on a regular
basis, can force our minds to feel frustrated more often.
The reason behind this, even though simple, is either
ignored or often goes untraced by people.
The reason for this frustration is that this consumption
trains the mind to expect new content every 30
seconds. In life, it is not humanly possible to get
something new every 30 seconds or less. This lack of
new content creates a feeling of vagueness within the
individual and thus, forces indirect frustration and
emptiness. The same has been majorly seen in young
adults and kids.
According to the analysis, around 40 per cent of the
people had, at some time or the other, fought with their
loved ones because of mental frustration. On digging
deeper, it was deduced that two age groups that had
contributed significantly to the total percentage, ranged
from 20 to 40 years. Further, it was observed that more
than 80 per cent of the above category uses social
media for approximately two to five hours a day.
This effect is more visible and harmful for kids. Through
observation, it was seen that kids who watch videos
available on online platforms like YouTube and others,
tend to get frustrated even in a split second of low
network connectivity. The choice available to them to
watch something new by pressing a button every 30
seconds, makes them addictive and develops in them
the thirst of consuming ‘new content’ every other
moment. Thus, it affects their time away from the
screen too.
What can be Considered as Healthy Screen Time?
The answer to this particular question is quite subjective
as, due to digitalization, the want to use an electronic
device has been replaced by a need to use these
devices.
When the same question was asked to the respondents,
the replies received were quite varied and differed
among different groups.
Thus, the following screen time has been considered as
an average screen time:
Based on the Age:
1. Below 20 years: The average ideal screen time
perceived by this group is two to five hours per day.
2. 20 to 30 years: The average ideal screen time
perceived by this age group is zero to three hours
per day.
3. 30 to 40 years: The average ideal screen time
perceived by this age group is two to five hours per
day.
4. 40 and above: The average ideal screen time
perceived by this age group is zero to three hours
per day.
Figure 5: Perception of Healthy Screen Time Based on
Different Age Groups
(Source: Primary Data)

Electronic Overload: Is Your Screen Time Affecting Your Mental Health?PROJECTS
YOUTHINK l 2022 l Vol. XVI 304
Based on Activity
1. Online Classes: Those who regularly attend online
classes responded that four to six hours per day can
be considered as the average ideal screen time.
2. Working from Home: Those who work from home
responded that five to seven hours per day can be
considered as the average ideal screen time. The
reason behind the extra hours is simple - working
from home solely depends on one’s electronic
devices which are linked to servers or clouds.
3. Watching Videos: Those who spend more than an
hour watching online videos on a daily basis
reverted that two to five hours could be considered
as appropriate screen time, on average.
Figure 6: Perception of Healthy Screen Time Based
on Different Activities
(Source: Primary Data)
Where Are We Spending Our Screen Time?
This poses as one of the prime objectives of the study. A
comprehensive analysis has been made using the
primary data to draw an outline of how people spend
their time on screen.
1. Working: Approximately five to seven hours are
spent by individuals who work from home, in front
of their laptops. Since the respondents primarily
belong to the age group of 10 to 20 years, limited or
negligible working hours were reported by them,
still recording high screen time. On the other hand,
20 per cent of the working-class group, who work
from home on a daily basis, reported a daily
average of eight to ten hours in front of the screen.
2. Due to paperless working and e-commerce, the
need of using electronic devices has become
indispensable.
3. Online Classes: In the current scenario, a student
spends approximately two to five hours per day
attending online classes. This medium has found
prevalence since the birth of the COVID-19
pandemic. The hours spent for e-learning are used
for regular schooling, university learning and
private tuition.
4. Online Engagements: Platforms like YouTube and
TikTok are quite addictive. It has been observed
that the majority of the individuals between the age
of 15 to 30 years, spend at least one hour on such
platforms every day.
5. OTT Platforms: This is the most trending and
emerging industry. It caters to all age groups in
general, along with young adults and adults in
particular. People tend to binge-watch on these
platforms excessively.
6. Gaming: This is an industry where the impact of the
games available and accessed is huge. There have
been cases of attempted suicide merely due to
facing defeat in a game. Such games are quite
addictive and affect the mental health of an
individual. The age group of 10 to 20 years is most
sensitive to such mediums, where every game has
control and power over the mind of the gamer.
What Does Our Future Hold?
On comparing different generations, it is quite evident
that the use of electronic devices is increasing
incessantly, along with a simultaneous increase in the
screen time per individual. If individuals continue to
increase their screen time for every new task
performed, there will come a time when people will
stop connecting personally and everyone will have to
find solace in their own virtual bubble.

PROJECTSElectronic Overload: Is Your Screen Time Affecting Your Mental Health?
YOUTHINK l 2022 l Vol. XVI305
If things move on at this pace, the mental space of our
future generation will be disrupted. When the
respondents were asked about their opinion on
whether screen time affects the youth’s creativity, more
than 50 per cent of them agreed. The ignorance of not
regularly checking and regulating one’s screen time can
pose harm to people in the long run, both physically
and mentally.
According to the survey conducted, 58.4 per cent of the
respondents do not check their screen time, and only
24 per cent of them keep a check on their daily screen
time. The remaining respondents check and regulate
their screen time a few times a year.
Figure 7: General Opinion on Whether
Digital Usage Would Affect the Youth
(Source: Primary Data)
Figure 8: Response on Asking Whether
They Regularly Check Their Screen Time
(Source: Primary Data)
CASE STUDY
The future of mankind can be dark due to excessive
screen time, and this can be elucidated through a case
study observed during the project. During the research,
a peculiar case of a three-year-old kid was brought to
notice. The background of the case is that the kid,
before the age of one, was given full-day access to a
tablet phone. This led to excessive use of electronic
gadgets, with no boundaries. The tactic of keeping the
child engaged with a device has now proven to be the
biggest curse in her life. The kid, although belonging to a
joint family, hardly interacts with anyone else other than
her parents, even so for everyday essential purposes.
The life of the kid has been contained in a 16-by 23-
inch screen.
The conditions observed are:
The only communication made and
initiated by her is with her parents, with no
one else around. There is almost negligible
interaction with her peers and other
members of the family.
Due to lack of interaction, the vocals and
speech of the kid have not fully developed
with her age. This has limited her capacity
to speak, resulting in her speaking less in
comparison to the other children of her age.
Since the kid's life revolves around a rectangular screen,
the ignorant behaviour of others’ existence was seen in
full force. Distant from reality, the kid lives
her life in a virtual space, where there is no
two-way communication.
A fall back in day-to-day working and other
habits has been seen as compared to other
children of her age group. It is not possible
to provide proper nutrition to her due to
the child’s adamant and stubborn
behaviour. The willingness to eat food is
missing and other inedible mediums are
being used by the kid to eat.
Thus, it can be concluded that this
unregulated screen engagement of the kid, harmed and
violated her mind. This basic fault of not giving due
attention to the screen time of the child, which is

Electronic Overload: Is Your Screen Time Affecting Your Mental Health?PROJECTS
YOUTHINK l 2022 l Vol. XVI 306
common among young parents these days, has resulted
in such a case. Such instances prove that due to
excessive engagement to the reel world, the children
forget the real world, which is an extremely alarming
fact.
Inferences
To sum up, it can be deduced that although converting
everything into an online platform has helped reduce
cost and redundancy, along with improving the quality
of work, the effect of the concurrent increase in screen
time of individuals is immense.
The mental health of the individuals is being
compromised without them even knowing about it.
Cases of depression, anxiety, panic attacks and low self-
esteem are the by-products of the increase in screen
time. The feeling of worthlessness and unwantedness
has increased due to immense exposure to social
media.
It can be deduced that even though screen time affects
our mental health, its presence cannot be omitted
completely. Although digital presence is close to being
indispensable in people’s lives, it is also advisable to
regularly check the screen time. Currently, fewer
people are seen to be regulating their screen time, but
one must always strive to improve these figures.
RECOMMENDATIONS
1. It is advisable to regularly check and regulate one’s
screen time. This would not only increase self-
awareness, but would also alert the person through
self-realization regarding the immense screen time.
2. The average screen time varies; depending upon
the activity one performs using devices. It would be
better to cut down the screen time to three to four
hours per day, for the younger generation.
3. Those who are working from home should take
some time off from the screen to give rest to both
their eyes and their mind.
4. Parents and adults of the family should regularly
keep their wards’ digital exposure in check. Rules
and boundaries must be set to give space to the
children while at the same time not letting them
hinder their mental sanity.
REFERENCES
Research Papers:
1. Martin, K. (2011). Electronic overload: The impact of
excessive screen use on child and adolescent health and
wellbeing. Perth, Western Australia: Department of Sport
and Recreation.
2. Twenge, J. M. (2020). Increases in Depression, Self-Harm,
and Suicide Among US Adolescents After 2012 and Links to
Technology Use: Possible.
3. Mechanisms. Psychiatric Research and Clinical Practice,
2(1), 19-25.
4. Wu, X., Tao, S., Zhang, S., Zhang, Y., Chen, K., Yang, Y.,... &
Tao, F. (2016). Impact of screen time on mental health
problems progression in youth: a 1-year follow-up study.
BMJ Open, 6 (11) Amber Berthope, Tela Dolson, … & Jaren
Wilson Impact of Screen Time and wellbeing. Berlin,
Germany: Berlin University of Psychology.

PROJECTS
YOUTHINK l 2022 l Vol. XVI307
A Study on How Social Media Affects the Behaviour of the Consumers
Dr. Sourav TarafderAssistant ProfessorDepartment of Commerce (Morning)
Dewans GopalkaDepartment of Commerce (Morning)
As buyers are
increasingly
performing
exercises recently
controlled by
organizations, the
whole promoting
scene is evolving.
ABSTRACT
Social media has modified the game for many industries and disciplines, such
as consumer behaviour. It examines how emotions, attitudes, and choices
influence the buying conduct of consumers. It is hard to achieve brand
loyalty these days, no matter how positive the response for a product or

A Study on How Social Media Affects the Behaviour of the ConsumersPROJECTS
YOUTHINK l 2022 l Vol. XVI 308
service. There is an ongoing publicity to gain advantage
over the competitor’s products and services and a
consistent conflict for the consumer’s interests. This
results in a new trigger, and it gets more difficult to close
the loyalty loop. Owing to the strength granted by using
the internet, purchasers nowadays easily hop among
unique levels and between multiple businesses.
KEYWORDS: Social Media, Consumer Behaviour, EBM
Model, Consumer Decision Process, Marketing.
INTRODUCTION
‘Traditional Marketing is not dying – it’s dead!’ (Zynman
1999)
Social media is a dynamic wonder. All through the
recent years, the World Wide Web has seen an
extension of customer-driven web developments like
web diaries, interpersonal organizations, and media
sharing stages. Everything, when considered, is called
web-based media and these advancements have
enabled the improvement of customer-made
substance, overall neighbourhood, and the circulating
of client appraisals (Smith, 2009). This advancement,
that is taking place right now, governs the way we utilize
the web and has offered stages to popular platforms like
Facebook, YouTube, Instagram, and Twitter, where
people interact, create and offer substance (Darley et
al., 2010).
The online media change has provoked better
methodologies for searching and securing information
on the enormous number of items and administrations
on the lookout. It has allowed customers to partner and
discuss brands with each other quickly and successfully
(Powers et al., 2012). Buyer notions on items and
administrations are continuously overwhelmed by
pariahs in online spaces, which consequently sway
assessments in the disconnected space. Online media
has empowered customers, as promoters have no
power over the substance, timing, or frequency of
online conversations among purchasers (Mangold and
Faulds, 2009). The usage of web-based media by
purchasers is anxiously followed by promoters, yet very
little is thought about what it means for the customers’
dynamics.
The Traditional EBM Model (Engel et al., 1990) is picked
to consider the clients’ decision because of its straight
imposition and adaptability. The model involves five
stages: need recognition, data search, evaluation of
choices, purchase decision and post-buy conduct. The
investigation attempts to find the meaning of the model
in the setting of online media use.
Stage 1 – Need Recognition
Need recognition is the principal phase of the
purchaser choice interaction. Inner improvements or
outer improvements (for example, commercials) cause
the customer to understand that there is a contrast
between their present status and their ideal state. This is
largely viewed as a trigger that starts a buy choice cycle
and is also the forerunner of all resulting customer
started exercises like data search, assessment, and buy.
Stage 2 – Data Search
Following needs affirmation - a buyer accepts a search
into memory to choose, if enough is known to make a
choice. If inward data is not sufficient, an external
pursuit is expected to upgrade the existing data.
Outside search is consistently embraced through up
close and personal sources (for example, partners and
family), business sources (for example, advancements
and sales representatives), and public media sources
(for example, papers, magazines, television, and web).
Customer reviews on websites like Amazon.com or
TripAdvisor are seen as giving a more complete and
stronger thinking examination.
Stage 3 – Evaluation of Choices
At whatever point information has been assembled, the
purchaser uses it to evaluate and reach a purchase
decision. The elective appraisal and information search
stages are presented autonomously and are unusually
entwined during a dynamic. The customers routinely
move to and from between the two. Elective appraisal
incorporates the decision of choice alternatives and
evaluative guidelines.Once determined, the
performance of the decisions is analyzed along the
remarkable models. Lastly, choice principles are
applied to limit the choices and make a last
determination. This stage prompts the development of

PROJECTSA Study on How Social Media Affects the Behaviour of the Consumers
YOUTHINK l 2022 l Vol. XVI309
convictions, perspectives, and aims, prompting the
resulting phase of procurement.
Stage 4 – Purchase Decision
Purchase decision identifies with the last choice or
assurance made regarding which product or service to
buy. The show of acquisition is the last stage, with the
customer choosing what to buy, where to buy, and how
to pay. Purchase is a component of assumptions,
biological effects, and individual conditions.
Stage 5 – Post-Buy Conduct
In the post-buy stage, customers assess the item’s
exhibition depending on their assumptions, and arrive
at a condition of fulfilment or disappointment. Results
are thought about against assumptions in an abstract
assessment, which takes one of the three main
structures: positive confirmation or fulfilment,
straightforward affirmation or unbiased reaction, and
negative disconfirmation or disappointment.
Customers who contribute a ton of time, exertion, and
cash into a purchase may experience intellectual
discord on whether a correct choice was made.
Most Well-Known Social Media Stages
1. Facebook
Facebook remains the best online media stage (with
basically 1.7 billion customers), even though it has had
shocks and disputes lately. Edison’s research’s infinite
dial concentrate from mid-2019 showed that 62 per
cent of U.S. long haul olds are Facebook customers,
down from 67 per cent in 2018 and 79 per cent in
2017.
2. Instagram
Instagram is an astounding stage for brands since it
provides them with endless opportunities to parade
their content: photos, stories, showcases, and channels.
73 per cent of the youth say that Instagram is the best
course for brands to reach them with new things or
progressions.
3. Twitter
Twitter is a wellspring of exposure for certain people.
Fledgling Social shows that 53 per cent of purchasers
propose associations in tweets, while a further 48 per
cent go ahead with completion of purchase of those
things or organizations.
4. YouTube
There is a conversation on whether YouTube is a social
media stage or positively a streaming stage or substance
stage. Considering everything, it is conceivably the most
acclaimed arranger out there. A steadily expanding
number of people are engaging on the stage.
‘Marketing is not the art of finding clever ways to
dispose of what you make. It is the art of creating value’
- Philip Kotler (2011)
Ways Social Media Influences Consumer Behaviour
1. Builds Product Awareness
Online media has a gigantic effect on buyers when they
are endeavouring to construct mindfulness about a
specific item. At the point when individuals deal with an
issue, they begin to look for an answer. In any case, a
large portion of the individuals do not know which item
or administration will tackle their issue. A huge part of
the crowd becomes more acquainted with the image of
the substance that is circulated via online media.
2. Social Proof as a Greater Force for Buying
Decisions
Online media has brought about the advancement of
social confirmation as a more prominent power for
purchasing choices. A social confirmation has arisen
because of the propensity of individuals to copy the
conduct of individuals around them, or individuals
impersonating those who have an impact on them.
Social advertisers hoping to sell their items ought to
have a strong social confirmation in terms of contextual
analyzes, pictures, video, case cast meetings, and
influencers as a component of their selling procedure.
3. Promotions, Discounts and Deals on Social Media
When customers see advancements, limits, and
arrangements on social media, it impacts their
purchasing conduct. 64 per cent of online shoppers
hold on to purchase things until they go available to be
purchased. Social media is an inexpensive stage that
gives brands moment reach to billions of dynamic
online media clients.

A Study on How Social Media Affects the Behaviour of the ConsumersPROJECTS
YOUTHINK l 2022 l Vol. XVI 310
4. Social Media Influencers
Purchasers are bound to purchase when they get
suggestions from an individual they trust. The facts
confirm that 49 per cent of customers look for direction
from social media influencers prior to settling on a
purchasing choice. A positive impact will urge the
purchaser to purchase the item. Influencer advertising
can do some incredible things for your image by pulling
in more clients. Numerous advertisers are supplanting
big names with YouTube, Instagram, and Snapchat
influencers.
RESEARCH PREMISES
Objective
The objective of this research is to investigate the job of
online media in purchasers’ dynamic cycle for dynamic
purchases – those portrayed by basic brand contrasts,
high customer incorporation and hazard, and which are
costly and uncommon. The model uses the information
search, elective assessment, and buy choice stages from
the conventional EBM model. The objective of the
investigation is to explain why, when, and what online
media has meant for the purchaser choice interaction.
The speculative construction lays on the writing of client
decision-making measures, web-based media and past
examinations related to online media publicizing.
A quantitative survey is used as the end goal of this
research. This examination gives clarification on how
people are joining in, handling, and choosing the data
via social media before a purchase.
Literature Review
Dr. Sourabh Chaturvedi et al., (2014) indicates how
online media locales turned into a significant
mechanism for firms and buyers to meet people for the
trading of data about items. It additionally proposes that
the impact of online media on client purchasing
conduct is colossal. The purchasing conduct in informal
organizations is impacted by sexual orientation,
schooling, pay, age, and so on. According to Aindrila
Biswas, et al., (2014) innovation acceptance model was
received to track down the online media use insights.
The workers of the multinational organizations in India
are examples of the examination. A condition
demonstration was utilized to test the qualification of
the model. The outcomes express that the clients of
social media have more buy expectations than a
periodic client.
Ethel Lee (2013) indicated how shoppers are associated
with the way of getting together required data through
social media prior to acquiring an item. The discoveries
reveal that shoppers effectively partake in the pursuit of
data for an item via social media; when contrasted with
broad communications, the pursuit is more abstract,
specific and emotional.
Kotler and Armstrong (2014) characterized purchasing
conduct along with two tomahawks: high or low
shopper contribution, and huge or barely any brand
differences. Complex purchasing implies high danger,
and consequently, data social affairs and assessment of
item decisions expect more noteworthy significance. It
contrasts from cacophony decreasing conduct, likewise
high danger, in that there are critical brand contrasts,
and would have the shopper going through all phases of
the choice interaction. Subsequently, this examination
revolves around complex purchasing circumstances
where the impact of web-based media is attempted to
be generally apparent.
There are numerous approaches to demonstrate
customer conduct, contingent upon the objective of the
research, yet a helpful strategy is the choice interaction
approach which examines the occasions that go before
and follow a buy, and that clarifies the way choices are
made (Karimi, 2013).
The idea of verbal Word of Mouth (WOM), presented
during the 1950s, has been rejuvenated by the web. As
per Arndt (1967), WOM is an ‘individual to individual
correspondence between a recipient and a
communicator whom the beneficiary sees as non-
business as to brand, item, or administration.’ WOM is
an essential wellspring of data for purchaser purchasing
choices, moulding mentalities, insights, and
assumptions for brands, items, and administrations
(Kimmel and Kitchen, 2014), and affecting all periods of
purchaser dynamic: from item attention to choice and
post-buy assessment. Content produced by web clients,
who are shoppers, is for the most part seen to be free of

PROJECTSA Study on How Social Media Affects the Behaviour of the Consumers
YOUTHINK l 2022 l Vol. XVI311
business impacts (Bronner and Hoog, 2010). This trust
makes shoppers go to discussions, websites and other
fair online media sources to accumulate data for
purchase choices (Powers et al., 2012).
As indicated by Alsubagh (2015), clients are continually
presented with these various commercials that attempt
to get people’s consideration. Kumar (2004-2005)
clarified that search devices are currently used to
investigate pre-buy item data, like value, style, audits
and so on. Web will, in general, be the essential
wellspring of data for most clients on customary
premise and informal organizations permit clients to
assess items, make proposals and make status refreshes.
These clients can undoubtedly share their thoughts,
sentiments, and encounters while associating with
others on the web peers (Nolcheska, 2017). Online life
is an organizational framework and correspondence
stage. Making a voice for your association through these
stages is critical in assimilating your association.
Customer’s esteem understanding that when they post
comments on your pages, they will get a redone
response rather than a robotized message. Having the
choice to perceive each comment shows that you are
aware of your visitors’ necessities and intend to give the
best agreement.
Riegner (2007) clarified that ordinary clients are
expanding their job in the business commercial center,
while utilizing the web as an instrument for relational
correspondence and business suggestions. Alsubagh
(2015) clarified that the web is important for the regular
day-to-day existence of the total populace influencing
another type of correspondence through friendly
organizing destinations. The web offers openings for
getting pre- and post-buy data. Its principal advantage is
the measure of data accessibility and independence
from actual contact (Jepsen, 2007).
As indicated by Hajli (2014), the accessibility of the web
has furnished people with the chance to utilize
interpersonal organizations, like Twitter and Facebook,
to cooperate without the requirement for actual
gatherings. Through informal channels, organizations
can build brand mindfulness, positive verbal deals, and
create more noteworthy help. As per Nolcheska (2017)
these social media stages have empowered a two-way
stream of data that permits organizations to impact the
buying choice of designated gatherings. With extended
porousness, your business obtains open entryways for
change. Each blog, passage, picture, video, or comment
might lead watchers to your association’s site and
augment traffic. Online social organization publicizing,
licenses your business, to give a positive impression
through a variation factor.
Jackson (2009) said that one more space of displaying
network communication concerns what organization
means for conduct. Moreover, as indicated by
Nolcheska (2017), a client’s social cooperation affects
purchase choice, beginning from the issue of
acknowledgment, looking at pertinent data, assessment
of choices, last buy choice, and post buy fulfilment. As
per Dellarocas (2002), digital marketing has permitted
people to make their own idea available to other local
areas of internet clients. Individuals from a specific local
area can, with no expense, present their viewpoints
with respect to certain items, themes or local areas and
these online surveys significantly affect clients’
purchase aims (Zhang et al., 2014).
Research Methodology
The current research lies in the perspective of
consumers’ buying behaviour and their satisfaction in
the Indian market. Sources of collecting primary and
secondary data are discussed here. The questionnaire is
utilized for the purpose of gathering primary data. The
secondary data have been gathered from the
companies’ releases, business magazines, business
dailies, textbooks, and websites.
The present study includes the utilization of the ‘survey
method’. For quantitative data collection, the personal
cum online survey methods are used. The sample size
was 156, their nationality being Indian, mainly residents
of West Bengal. The age group of the samples was
divided in three categories, i.e., below 20, then 21-40,
and above 41 years.
Limitations
1. Test size was small which shows restricted
generalizability of the examination led.
2. Individuals who took an interest in the overview
were essentially from West Bengal and the

A Study on How Social Media Affects the Behaviour of the ConsumersPROJECTS
YOUTHINK l 2022 l Vol. XVI 312
investigation can be led on a
more extensive scale.
3. As the investigation is restricted to
a particular time, it cannot be
utilized to investigate conduct
over a period.
4. Information was gathered from
individuals from the populace
who were accessible and took an
interest in the investigation.
DATA ANALYSIS AND FINDINGS
The accompanying area presents an investigation made
on the information gathered from the poll. Three
diverse age groups are covered, under 20 years of age,
21 – 40 years of age, and over 41 years of age. Of the
respondents, 39.1 per cent were female and 60.9 per
cent were male. Since the gathered information covers
individuals from various age gatherings, inclinations,
and sex, the accompanying examination is completed
in evaluating the overall customer conduct in West
Bengal.
The tables and charts being presented here have been
taken from the personal survey conducted for this
research using Google forms and based on the
responses, the charts are depicted accordingly.
Figure 1: Time People are Spending on Social Media Per Week
(Source: Primary Data)
From Figure 1, it is evident that 31.4 per cent of
individuals went through one to three hours/week of
their experience via online media. Moreover, 24.4 per
cent of them went through over 10 hours/week via
web-based media, 23.7 per cent individuals went
through seven to nine hours/week via web-based
media, 19.9 per cent of individuals went through four to
six hours/week via web-based media, with 0.6 per cent
going through zero hour/week via online media. The
development of online media has made it simple for a
person to impart progressively with various individuals.
Thus, one can expand their float of online allies to any
degree with the usage of web-based life.
Figure 2: Most Used Social Media Websites
(Source: Primary Data)

PROJECTSA Study on How Social Media Affects the Behaviour of the Consumers
YOUTHINK l 2022 l Vol. XVI313
It is understood from Figure 2 that among the three age
groups, social networking sites are being utilized
generally (80.8 per cent), and social book-marking
locales are being utilized the least (10.9 per cent); the
rest were online journals and discussions (14.7 per
cent), micro-blogging (26.3 per cent), and photographs
and recordings (71.8 per cent). It shows that the
examples of utilizing a few web-based media stages
among various age groups are comparable to that of
informal communication locales are generally utilized
on standard premise.
From Figure 3 we can see that 38.5 per cent of the
populace agrees that data looking is simpler through
online media, while 29.5 per cent strongly agree, 21.8
per cent are impartial in such a manner, 5.8 per cent
differ and 4.5 per cent firmly oppose this idea. Web-
based media gives all the applicable data about an item
like about its determinations, quality, individual audit,
and so on. It has made another scene in supporting the
socialization of data.Among the rundown of variables, Figure 4 determines
that 57.1 per cent of respondents communicate that
data from their companions
and relatives are one of the
reasons for their prejudgment,
in which the believability of
wellspring of data is high. In
opposition to the wellspring of
d a t a f r o m b r o a d
communications, 58.3 per cent
of the respondents asserted that
data from the web, (for
example, client surveys, blog
posts, discussions, et al.) are
one of different components
t h a t i m p a c t e d t h e i r
perspectives towards an item or
administration.
Figure 4: Why People Prefer Social Media Over Mass Media
(Source: Primary Data)
Figure 3: Ease of Using Social Media Over Mass
(Source: Primary Data)

A Study on How Social Media Affects the Behaviour of the ConsumersPROJECTS
YOUTHINK l 2022 l Vol. XVI 314
Figure 5: Influence of Social Media on Consumer’s Original Purchase Preference
(Source: Primary Data)
From Figure 5, we can see that data accessible via online
media impacts purchaser conduct; an adjustment of
mentality (positive or negative) can be made before
buying. In like manner, organizations can use the stages
via web-based media to
interface with clients to
make progress towards
developing a superior and
m o r e g r o u n d e d
relationship. In addition,
46.8 per cent of the
r e s p o n d e n t s h a v e
c o n c u r r e d t h a t
o c c a s i o n a l l y t h e i r
underlying inclination
changes after looking
t h r o u g h a d d i t i o n a l
information about an item.
The discovery in Figure 6
has shown that online
media has given an
incredible stage where
new items, benefits, or
even new brands can be
seen in the commercial
center. This does not imply
that online media impacts
shoppers to attempt these
items and administrations.
I n t h e g a t h e r e d
information, it mirrors that
43.6 per cent of the
populace and 9 per cent of
populace are in fact affected to
a t t e m p t n e w i t e m s ,
administrations, or brands due to
the client produced substance
accessible on the online media.
In Figure 7, the study shows that
48.7 per cent of the respondents
agree and 9.6 per cent strongly
agree that their choice was
affected by social media. It is on
the grounds that numerous
individuals have the propensity to
see online audits and remarks about that item to pick
the ideal brand and cost. 26.3 per cent of the
respondents had an unbiased assessment in such a
manner.
Figure 6: Influence of Others Reviews to Try New Products or Brands
(Source: Primary Data)
Figure 7: Whether Feedbacks on Social Media Affect Consumer Purchases
(Source: Primary Data)

PROJECTSA Study on How Social Media Affects the Behaviour of the Consumers
YOUTHINK l 2022 l Vol. XVI315
Figure 8: Credibility of Information on Social Media Over Mass Media
(Source: Primary Data)
Figure 8 shows responses
w h e r e t h e y w e r e
approached to refer to their
convictions in how tenable
the data via web-based
media is contrasting with
t h o s e o n b r o a d
communications. 44.2 per
cent of respondents concur
a n d 5 . 8 p e r c e n t
emphatically concur that
data accessible via web-
based media have a higher
validity than those on broad
c o m m u n i c a t i o n s . I t
c o m m u n i c a t e s t h e i r
perspect ive that data
accessible via web-based
media are accepted to be
‘impartial, more basic, trust-
c o m m e n d a b l e , g e n u i n e
experience, and with less business
premise.’
Figure 9 shows how much a
buyer’s choice is influenced by
online media advertising. 46.8
per cent individuals concur that
web-based media impacts the
buy, while 19.2 per cent
individuals are impartial in this
and 34 per cent of individuals
Figure 9: Influence of Social Media on Consumer’s Purchase Decision
(Source: Primary Data)
differ to this reality. The
information from the review
shows practically 55.8 per
cent of the respondents follow
brands on social media. The
information from the study
shows that social media
page/site influenced their
vision of the brand. As the
greater part of the shoppers
who shop online read audits
about the brands of the items,
they are purchasing which may influence their vision of
that brand. The information from the review shows that
social media assumes a significant part in advancing a
Figure 10: Influence of Social Media on Consumer’s Purchase Decision
(Source: Primary Data)

A Study on How Social Media Affects the Behaviour of the ConsumersPROJECTS
YOUTHINK l 2022 l Vol. XVI 316
brand as it helps increment the measure of openness
which empowers the brand to create leads and
increment deals.
Results in Figure 10 shows that web-based media
utilization impacts purchaser satisfaction in the periods
of information search and elective assessment with
satisfaction getting upgraded as the buyer moves along
the cycle towards definite buy choice and post-buy
assessment. The revelations showed that individuals
seek a unique part in information search by means of
online media, diverging from wide interchanges; yet,
information receptiveness is specific and dynamic all
through information search.
RECOMMENDATION
Based on research it is recommended that if the
customers are making purchase choices, they must
precisely look at what a business is as compared to its
contenders. In specific classifications, loved ones have a
major impact on purchasing choices. The impact of
assessment pioneers has been around for quite a while.
Furthermore, presently, assessment pioneers from
different nations would now be able to have an impact
on Indian clients. This can happen on long range
informal communication destinations, examination
shopping locales and audits, for instance.
Social elements fundamentally affect client conduct.
Culture is the most fundamental reason for an
individual’s needs and conduct. While growing up,
youngsters learn essential qualities, discernment, and
needs from their families and other significant
gatherings. A client’s purchasing conduct is additionally
affected by friendly factors, for example, the gatherings
in which the client has a place and societal position.
CONCLUSION
As buyers are increasingly performing exercises recently
controlled by organizations, the whole promoting
scene is evolving. In this way, organizations need to
better comprehend the changing behaviour of
purchasers, in request to make common advantages
from the utilization of social media.
Moreover, they should attempt to enhance their image
considerably in front of clients, by posting frequently
and reliably. The advertisers should try and make a
compelling passionate bond with their customers,
thereby strengthening the relationship with them. They
should also react rapidly and appropriately, as each
client issue is unique and hence, should be dealt with in
a like manner. Clients these days depend immensely on
social media networks for client assistance and
administration; hence, organizations should make
themselves noticeable in advanced media platforms so
that such assistance can be provided to the customers.
This would help them ensure that their brand image
remains in the eyes of the public. Lastly, the advertisers
should build an exhaustive and attainable arrangement
of objectives, which they should try to measure, at the
same time examining how far they have been effective
in their image building.
Considering the limited time and scope of this research,
many theories related to the topic are covered, but from
a general point of view, to provide readers with an
overview on the topic. So, if further investigation is
possible, it should be understood in depth for the
purposes of tackling the objective of the research. It is
undoubtedly useful and interesting to use the case of a
company as a reference for research. By studying the
company’s case, we can provide a comparison
between the problem that the company thinks it is
solving and its perception of the consumer. Will the
results reflect different views on social media and the
decision-making process in two different ways? The
results can help the company gain clear insights and
determine the real strategy to solve this situation.
Nonetheless, if further research could be conducted for
companies, theories can be implied more accurately
because some of the theories are proposed and
developed to help companies improve their position in
the transition from the traditional marketing methods to
the new market thinking. In that case, findings and
conclusions could be drawn unambiguously.

PROJECTSA Study on How Social Media Affects the Behaviour of the Consumers
YOUTHINK l 2022 l Vol. XVI317
REFERENCES
1. Arndt, J. ‘Role of Product-Related Conversations in the
Diffuse on of a New Product’, Journal of Marketing
Research, Vol. 4, No. 3, pp.291–295 (1967).
2. Ashman, R., Solomon, M.R. and Wolny, J. ‘An Old Model for
a New Age: Consumer Decision-Making in Participatory
Digital Culture’, Journal of Customer Behaviour, Vol. 14, No.
2, pp.127–146 (2015).
3. Bronner, F. and Hoog, R. ‘Consumer-Generated Versus
Marketer-Generated Websites in Consumer Decision
Making’, International Journal of Market Research, Vol. 52,
No.2, pp.231–248 (2010).
4. Darley, W.K., Blankson, C. and Luethge, D.J.: ‘Toward an
Integrated Framework for Online Consumer Behaviour and
Decision-Making Process: A Review’, Psychology and
Marketing, Vol. 27, No. 2, pp.94–116 (2010).
5. Engel, J.F.: Blackwell, R.D. and Miniard, P.W. Consumer
Behaviour, 6th ed., The Dryden Press, Chicago (1990).
6. Karimi, S., Papamichail, K.N. and Holland, C.P. ‘The Effect of
Prior Knowledge and Decision-Making Style on the Online
Purchase Decision-Making Process: A Typology of
Consumer Shopping Behaviour’, Decision Support Systems,
Vol. 77, pp.137–147 (2015).
7. Keller, K.L. Strategic Brand Management: Best Practice
Cases in Branding: Lessons from the World’s Strongest
Brand. Pretice Hall, USA. Vol. 28, pp.24–78 (2001).
8. Kotler, P. and Armstrong, G.: Principles of Marketing, 15th
ed., Pearson Education, London. Vol. 7, pp.10–14 (2011).
9. Lee, E.: Impact _ Of _Social _Media _On _Consumer
_Behaviour– Decision Making Process, Vol. 2, pp. 6-23
(2013).
10. Mangold, W.G. and Faulds, D.J.: ‘Social Media: The New
Hybrid Element of the Promotion Mix’, Business Horizons,
Vol. 52, No. 4, pp.357–365 (2009).
11. Powers, T., Ad vincula, D., Austin, M.S., Graiko, S. and
Snyder, J.: ‘Digital and Social Media in the Purchase
Decision Process’, Journal of Advertising Research, Vol. 52,
No. 4, pp.479–489 (2012).
12. Punj, G. ‘Consumer Decision Making on the Web: A
Theoretical Analysis and Research Guidelines’, Psychology
and Marketing, Vol. 29, No. 10, pp.791–803 (2012).
13. Schwartz, B., Ward, A., Monterosso, J., Lyubomirsky, S.,
White, K. and Lehman, D.R. ‘Maximizing Versus Satisficing:
Happiness Is a Matter of Choice’, Journal of Personality and
Social Psychology, Vol. 83, No. 5, pp.1178–1197 (2002).
14. Smith, T.: ‘The Social Media Revolution’, International
Journal of Market Research, Vol. 51, No. 4, pp.559–561
(2009).
15. Voramontri, D. and Klieb, L.: ‘Impact of Social Media on
Consumer Behaviour’, Int. J.Information and Decision
Sciences, Vol. X, No. Y, pp.2-7 (2018).

PROJECTS
YOUTHINK l 2022 l Vol. XVI 318
Changing Nature of Consumer Behaviour Reshapes Retail Garment Shops - A Study Based in BiharProf. Santa GhosalAssistant ProfessorDepartment of Commerce (Evening)
Mahima KumariDepartment of Commerce (Evening)
With the current
pandemic
scenario, rising
consumer
awareness, and
availability of
internet
connectivity in
smartphones,
there have been
several changes in
consumer
behaviour.
ABSTRACT
‘A customer is the most important visitor on our premises. He is not
dependent on us. We are dependent on him. He is not an interruption in our

PROJECTSChanging Nature of Consumer Behaviour Reshapes Retail Garment Shops
YOUTHINK l 2022 l Vol. XVI319
retailers). Post liberalization, the Indian offline retail
sector has been facing numerous challenges, earlier
from MNCs, and now, from the online platforms too.
Therefore, the study of alterations in consumer buying
behaviour becomes necessary to ensure consumer
satisfaction.
Amidst the pandemic, in the present scenario, the
consumers’ way of purchasing clothes has shifted.
Although the customer-oriented approach is applicable
to all kinds of businesses, from MNCs to accounting
firms, our research study will focus upon local apparel
shops, commonly known in local dialect as ‘kapda
dukaans’, in Bihar. The district is full of showrooms of
Raymond, Manyavar, Vmart, as well as shops of street
vendors involved in the retailing of garments. The
prolonged closure of stores and postponement of
various marriage events due to the pandemic affected
their revenue. However, with the relaxation of the
pandemic-induced restrictions, things are getting
normal. Customers are often purchasing cautiously as
well as trying to ensure safety first. They are also
focusing on time-saving services and there is a surge in
the online mode of purchases.
The state of Bihar has confronted a new challenge
recently with rising urban to rural migration, where
labourers, students and many working professionals
with their family, are returning back to their native
villages and suburban districts. With the current
pandemic scenario, rising consumer awareness, and
availability of internet connectivity in smart phones,
there have been several changes in consumer
behaviour. To tackle these changes, local shopkeepers
came up with listing products on Amazon, Meesho,
Facebook, et al.
However, in fragmented pieces, there is a lack of
definite suggestions as to how to provide better services
and survive, especially in districts like Nawada, in Bihar.
RESEARCH GAP
It is observed that most of the work related to altering
buying behaviour in terms of retail garment shops of
India has been done in the past, not catering to the
current situation and the environment i.e., the
work. He is the purpose of it. He is not an outsider in our
business. He is part of it. We are not doing him a favour
by serving him. He is doing us a favour by giving us an
opportunity to do so.’ - Mahatma Gandhi
Consumer Behaviour is the study of how individuals,
groups, and organizations select, buy, use, and dispose
of goods, services, ideas, or experiences to satisfy their
needs and wants (Kotler and Keller, 2006). Although the
customer-oriented approach is applicable in all kinds of
businesses, from Multinational Corporations (MNCs) to
accounting firms, our research study will focus on local
apparel shops, commonly known in the local dialect as
‘kapda dukaans’, in Bihar. Amidst the pandemic, in the
present scenario, the consumers’ way of purchasing
clothes has shifted. Customers are purchasing
cautiously, as well as trying to ensure safety first. There is
a rising shift towards online buying and ‘trust shopping’.
This study tries to look into the alterations in the buying
behaviour of consumers in the state of Bihar when it
comes to purchasing garments. It provides
recommendations based on this so that the local
garment shops situated there can benefit from the
same, adjusting themselves to recent requirements.
KEYWORDS: Consumer Behaviour, Pandemic, Digital
Payments, Online Shopping.
INTRODUCTION
From fibre to fashionable garments, the textile industry
is like the backbone of the modern world economy,
with millions earning bread from it. As per Grand View
Research’s recent report, the global textile market size
was valued at $961.5 billion in 2019, and is estimated
to exhibit a Compound Annual Growth Rate of 4.3 per
cent from 2020 to 2027, owing to increased demand
for apparel, especially in developing countries such as
China, India, Vietnam, and Bangladesh. Presently too,
as per India Brand Equity Foundation’s report, the
Indian textile industry contributed 13 per cent to the
industrial production in the Financial Year (FY) 2020.
Moreover, it contributed 2.3 per cent to India’s GDP.
Coming to the retail sector, it was projected that the
revenue would rise by `1-1.2 billion in FY20 in the
offline retail sector (also known as brick-and-mortar

Changing Nature of Consumer Behaviour Reshapes Retail Garment Shops PROJECTS
YOUTHINK l 2022 l Vol. XVI 320
pandemic. Moreover, very limited research on this
subject has been conducted in locations like the
suburban districts of Bihar. There are limited studies
catering to the recent changes in the behaviour of
consumers and a list of recommendations to tackle the
same.
Hence, in this study, an attempt has been made to study
the alterations in the pattern of shopping garments
among the consumers in Bihar and come up with a list
of recommendations. These recommendations, if
executed by the shops, would help them to thrive in the
future, which is ever-changing and dynamic.
LITERATURE REVIEW
1. Bloemer José and Ruyter (1998), ‘On the
relationship between store image, store
satisfaction, and store loyalty’, European Journal of
Marketing.
The study explored the relationship between store
satisfaction, store loyalty, and store image. The
study was conducted in a major Swiss city; in a
German-speaking part of Switzerland. The study
found that store loyalty is built by store satisfaction,
while store satisfaction is built by store image. Store
image is a term, first coined by Martineau (1958),
which means the image, impression or idea of the
store in the mind of customers.
2. Aaker and D.J. Joachimsthaler (2000), ‘Brand-
leadership’, The Free Press – New York.
The study showed that the visual appeal of retail
stores could influence a customer’s decision to buy.
It also concluded that consumers prefer buying
brands that help define their personality, showcase
their status and satisfy their psychological needs, in
addition to the functional benefits.
3. Newman and Cullen (Eds) (2002). Retailing:
Environment and Operations: Thompson
Learning.
The Book studied the effective mantras for
retailing, especially in the United Kingdom. It
observed that retailers needed to understand their
market well. They needed to formulate clear
objectives and ensure proper execution.
4. Mittal Amit and Mittal Ruchi (2008), ‘Store Choice
in the Emerging Indian Retail market: An Empirical
Analysis’, IBSU Scientific Journal.
The paper studied the store choice criteria in the
context of apparel retailing in India. It investigated
how various attributes of apparel stores impact and
are evaluated by the customers before buying. The
study was based in Delhi and nearby areas of
Faridabad and Gurgaon.
5. Dr. K Balanaga Gurunathan (2013), ‘Factors
Influencing Apparel Buying Behaviour in India: A
Measurement Model’, Paripex Indian Journal of
Research.
The study examined buying behaviour through five
dimensions viz. consumer characteristics,
reference groups, store attributes, promotion, and
product attributes. The study was conducted in
Coimbatore City Corporation, Tamil Nadu. Its
findings recommend those factors, which are
extremely actionable for Indian retailers to
formulate a better strategy.
6. Renuka P.M. and Kuloli Sadhana (2016), ‘A Study
on Consumer Buying Behaviour in Retail
Readymade Garment Shops’, J. Farm Sci, 29(1)
(149-150).
The study examined the behaviour of consumers
and investigated changes concerning retail
readymade garment shops. The study was
conducted in the Hubli-Dharwar Corporation area
among 150 respondents. It found women as key
influencers and festivals as major periods when
purchase is at its peak.
OBJECTIVES OF THE STUDY
1. To study the channels used by customers for placing
orders while purchasing garments.
2. To analyze the pattern followed while shopping for
garments.
3. To examine which incentives are more effective.
4. To understand factors that are considered by the
customers before buying from a particular shop.
5. To understand which payment mode is preferred
more by the customers.

PROJECTSChanging Nature of Consumer Behaviour Reshapes Retail Garment Shops
YOUTHINK l 2022 l Vol. XVI321
RESEARCH METHODOLOGY
In order to study the alterations in the behaviour and
expectations, a questionnaire was circulated containing
ten questions which were randomly distributed. It
included multiple-choice questions to check the way
respondents purchase clothes and what their
preferences are while purchasing garments from local
retail shops. Following is a brief overview:
Primary Data:
?Sample Frame: It primarily focuses upon individuals
of the age-group 18-30, i.e., young population
comprising the employed, unemployed, students,
as well as homemakers.
?Sample Size: It consists of 125 respondents
consisting of individuals from different educational
and employment backgrounds.
?Location of Research: Locations of research are
various suburban districts of Bihar.
?Method of Sampling: The sampling technique used
is non-probability convenience sampling and
snowball sampling.
?Research Instrument: The survey has been
conducted using online surveys, telephonic
interviews, and emails, due to time and cost
constraints.
?Data Collection Techniques: The primary data was
collected by distributing questionnaires to
respondents online, over various social media
platforms like Telegram, WhatsApp, Facebook, and
so on.
Secondary Data:
1. Various reports, articles and journals.
2. Research papers related to similar topics.
3. Books and case studies of various authors.
ANALYSIS
Over here, analysis is based on the data collection taken
place via the questionnaire circulated, and through
various electronic means. The responses were collected
from 125 respondents constituting the sample
population.
Figure 1: Pie chart Showing Preferred Mode of Payment(Source: Primary Data)
Interpretation
43.8 per cent of the respondents use UPI Apps such as
Google Pay as a mode of payment. 37.5 per cent of the
respondents have cards as the preferred mode of
payment. The least preferred payment mode is cash.
Figure 2: Pie chart Showing Preferred Choice of Purchase(Source: Primary Data)
Interpretation
50.4 per cent of the respondents preferred visiting
garment shops, followed by 28.3 per cent of them
preferring showrooms, and 20.5 per cent preferring
online websites. Brand-specific websites are the least
preferred choice of purchase at 0.8 per cent.

Changing Nature of Consumer Behaviour Reshapes Retail Garment Shops PROJECTS
YOUTHINK l 2022 l Vol. XVI 322
Figure 3: Pie chart Showing Importance of Price as a Determinant While Making Purchase Decisions(Source: Primary Data)
Interpretation
70 respondents considered price as a very important
factor while making the purchase decision. 40 people
remained neutral, while 15 respondents considered it
as a less important factor compared to the quality of the
garment they buy.
Figure 4: Pie chart Showing Incentives that Play a Key Role while Making Purchase Decisions
(Source: Primary Data)
Interpretation
57.5 per cent of the respondents agreed that offers and
discounts play a key role in their buying decision,
followed15.7 per cent of them agreeing that the display
of the shop would play a key role. The Ambience of the
shop influenced 11.8 per cent of the respondents, and
for 11 per cent of the respondents, word-of-mouth
advertisements acted as an incentive. Billboards
affected the least, only 3.9 per cent.
Figure 5: Pie chart Showing the Preferred Mode of Placing Order(Source: Primary Data)
Interpretation
Majority of the respondents, i.e., 80.3 per cent
preferred visiting the shops to place their order.
Recently, there has been a rise in placing orders via
phone calls and social media apps, such as WhatsApp
(by a virtual display of garments). 5.5 per cent of the
respondents preferred placing orders via the shop’s
website, which is quite new.
Figure 6: Pie chart Showing Importance of Goodwill(Source: Primary Data)

PROJECTSChanging Nature of Consumer Behaviour Reshapes Retail Garment Shops
YOUTHINK l 2022 l Vol. XVI323
Interpretation
Goodwill is important, as can be inferred from the
above chart, for only 30.6 per cent of the respondents
are neutral, and 4.8 per cent of the respondents have
Figure 7: Statistics Showing Whether Shop Owners Should Have Their Own Website in the Current Situation(Source: Primary Data)
Interpretation
With the influx of
young students and
salaried employees
‘working from home’
i n t h e s u b u r b a n
districts of Bihar, we
see a recent trend
where people are
expecting even local
shops to have a digital
presence. 47 people
strongly agreed to local
shops having an online
presence, whereas 37
agreed to the proposal, out of 125 respondents. 34
respondents remained neutral while only seven
respondents denied its importance.
Figure 8: Statistics Showing Importance of Online Ads and Display(Source: Primary Data)
Interpretation
Out of the 125 respondents, 40 respondents agreed,
and 41 strongly agreed that the online ads were
important for retail garment shops. 36 respondents
remained neutral, while seven respondents denied it.
denied its importance. This shows that people make
repeat purchases from a shop for which they consider
goodwill as very necessary. Goodwill enhances faith
and ensures consumers are loyal and go for word-of-
mouth advertisements as well as repeat purchases.

Changing Nature of Consumer Behaviour Reshapes Retail Garment Shops PROJECTS
YOUTHINK l 2022 l Vol. XVI 324
FINDINGS AND OBSERVATIONS
The results from the survey show that the majority of the
respondents preferred visiting shops for buying their
garments. The survey shows that the majority of the
respondents felt that offers and discounts are key
incentives while making purchase decisions in a
garment shop. This is followed by the display of the
shop. It is also inferred that the majority of respondents
prefer to pay for their clothes using digital modes of
payment i.e., UPI apps and cards. Salaried employees
and students majorly comprised the population which
opted for the above-mentioned modes of payment.
Cash was the least preferred mode of payment. This will
require the small firms to train themselves to be
technologically aware and embrace the new modes of
payment, as the young population is fast moving
towards cashless modes of payment. The results of the
study show that with rapid digitalization respondents
consider it important for the local shop-owners to have
a shop-specific website for presenting their clothes, and
also displaying advertisements of offers and other
information. However, a significant percentage of the
respondents remained neutral towards online ads but
they agreed over the importance of display of the
products and their prices online.
It was interesting to find that though customers
preferred ordering online over visiting the shop, trust
and goodwill are still vital for a local shopkeeper, as
claimed by the majority of respondents. With the influx
of students, work-from-home employees and migrants
returning to suburban districts of Bihar, there is an
opportunity for the shopkeepers to expand their
customer base.
RECOMMENDATIONS
Post the analysis of the data, the following are certain
recommendations to help retail sellers survive and grow
in the current scenario:
?Increase emphasis on enhancing presence on social
media platforms and shop-specific websites.
For this, various apps are available, which provide
free as well as paid premium services, like Shopify.
Making a formal shop-specific website, which the
consumers can visit and use to place their orders,
will give them a sense of excitement, especially to
the young population who are ‘trysumers.’ It will
also build the reputation of the shop.
?Invest in time-saving shopping methods and quality
after-sales services.
Use social media platforms to display offers, and
new brands and products. This will help customers
make their purchase decisions even before they
reach the shop, and therefore, they will have a
satisfactory and time-saving buying experience.
Provide decent tailoring services along with the
garments. Moreover, the provision of after-sale
services to customers in the price range of ̀ 500 and
above will also act as an incentive for repeat-
purchase and create goodwill.
?Personal mass messaging to inform about festive
offers and coupons.
Have well-designed offers other than the festive
offers, like giving beautiful gift hampers along with
an emotional message against an annual purchase of
a particular amount.
?Ensure a unique display of the shop.
Improve the display as well as the ambience of the
shop, and alter the look as per changing festive
seasons or some local events. This will portray a
unique image, and customers will retain the image
of the shop as they pass by.
?Provide other benefits apart from selling quality
garments.
Shop owners can tie up with local tailors and
designers to provide better customization and
unique designs. Constantly updating with changing
trends can help gain the first-mover advantage.
Ensure higher employee retention, and hire
customer-friendly and well-mannered employees.
This will not only create value for the customers but
also add to the goodwill. Also, personalized
messaging should be used to greet people and
update them on any important or new information
to be the first option in the mind of customers,
whenever they think of buying garments.

PROJECTSChanging Nature of Consumer Behaviour Reshapes Retail Garment Shops
YOUTHINK l 2022 l Vol. XVI325
CONCLUSION
The present study has analyzed various dimensions,
starting from the role of brand, price range, and
frequency of purchase, to various changes consumers
would like the shop owners to adapt.
In the primary survey which was conducted, we
observed that there is a shift among the consumers as
they are choosing innovative ways of buying based on
reviews and the collection which they evaluate before
buying. Therefore, shops need to push their sales by
better displaying not only offline, but also online, by
using a user-friendly interface. This will give them an
edge over their competitors by allowing consumers to
shop conveniently.
When interrogated for additional suggestions, people
pressed upon the importance of good behaviour and
time-saving purchase experience. They responded
positively towards surprises and greetings, which they
received as add-ons to the product they bought.
Reasonable prices can be ascertained by going through
the market rates and the average price people intend to
spend, thereby matching the aspirations of both sides
and satisfying the demand. In the current emergency
and lockdowns, making all regular and festival items
available at reasonable prices and quality, and
displaying them online will add to the satisfaction of the
people, who will, in turn, find it easy and comfortable to
shop.
Due to the current pace of digitalization and the
pandemic, consumer behaviour has modified.
Therefore, shop owners need to be vigilant and
cooperative to provide the best possible service,
imparting maximum satisfaction.
There is a need to come up with the best possible
product, price, distribution, and promotion policies to
handle the stiff competition, not only from other shops
but also from e-commerce giants like Amazon, Myntra,
Meesho, et al.
Therefore, if a retail garment shop wants to prosper and
increase its profitability, it needs to go beyond the
boundaries of ‘brick and mortar shop’, and it needs to
ensure that:
?The Pricing strategy is flexible to suit the
expectations of majority buyers and potential
customers, over and above the cost.
?The Product strategy is based on the location and on
basic regular demands of local people, within 2-5
km range of the potential target customers.
?The Place strategy is accommodative and accepts
orders online and provides the facility of home
delivery service. Where necessary, the additional
cost can be included in the product.
?The Promotion strategy is a mix of unique offers,
which ensures repeat purchase and unique display
of the shop, and other necessary promotion mixes.
Therefore, shop owners should be ready for the new
changes and user-friendly techniques to attract
customers and give them the best buying experience,
thereby ensuring repeat purchase.
LIMITATIONS OF THE STUDY
1. This primary survey conducted is mainly restricted
within certain suburban districts of Bihar,
comprising Rajgir, Arrah, Nawada, Hisua, Rajauli,
Begusarai, and a few more. Thus, in this case,
findings, analysis, and results of one area may be
different from another area of the Indian
subcontinent. (But using a similar survey, one can
get relevant information of other locations.)
2. The sample size of the primary survey is 125 only.
As compared to the population, it is very small.
3. Limitations of snowball sampling and non-
probability convenience sampling: This is an
inherent limitation, as due to paucity of time and
lack of sophisticated tools and software, a simple
and suitable survey, based upon convenience, was
undertaken.
4. Limited to the garment retail sector only: Since it
catered to the garment retail shops only, the study
cannot recommend other retail stores dealing in
grocery, medical, books, et al.
However, efforts have been made, and all possible and
adequate measures have been undertaken to eliminate

Changing Nature of Consumer Behaviour Reshapes Retail Garment Shops PROJECTS
YOUTHINK l 2022 l Vol. XVI 326
as well as avoid the above-mentioned limitations and
derive accurate results on the altering buying behaviour,
obligating reforms in garment retail shops.
REFERENCES
1. Amrita Pani, M. S. (2012), ‘Emerging Trends in Fashion
Marketing: A Case Study of Apparel Retailing in India’,
IJBMT, 1-8.
2. Binoy Mathew ‘A Study on Changing Trends in Online
Shopping of Indian Consumers in Apparel Segment’
International Journal of Applied Research 2015; 1(9): 207-
214.
3. Churchill, Gilbert A. and Carol Suprenant, ‘An Investigation
into the Determinants of Customer Satisfaction’, Journal of
Marketing Research.
4. Dr. Anita Rani, I. T. (2015), ‘Apparel Retailing in India’,
Journal of Marketing and Consumer Research, 1-6.
5. Kotler P. ‘Marketing Management’, Grada, Praha, 10th
edition; ISBN 80-247-0016-6, 2001.
6. Pick D. and Muller D. (2010), ‘Retailing in India -
Background, Challenges, Prospects.’ Berlin, Germany.
European Retail Research.
7. Sinha and P.K. Banerjee (2002), ‘Deciding Where to Buy:
Store Choice Behaviour of Indian Shoppers’, Vikalpa, 27(2),
April-June, pp.13-28.
8. Solomon Mr. Consumer behaviour, Buying, Having and
Being. Pearson Prentice, 2004.
9. Zimmer, M. and Golden, L. (1998), ‘Impressions of Retail
Stores: A Content Analysis of Consumer Images’, Journal of
Retailing, 64(3), pp. 265-293.
10. Websites Used:
www.ibef.com
www.mainstreethost.com
www.grandviewresearch.com
www.nawada.nic.in
www.coursehero.com
www.libellulamedia.co.za
www.studymode.com

PROJECTS
YOUTHINK l 2022 l Vol. XVI327
A Study on the Nature of Environmental Kuznets Curve in the Context of Four East Indian States for the Period 2013-2019
Prof. Shirsendu RoychowdhuryAssistant ProfessorDepartment of Commerce (Morning)
Avinaba Sarkar Department of Commerce (Morning)
While an
individual
country’s rational
effort to advance
the standard of
living of their
people is
palpable, various
awry situations
may crop up in
the trajectory of
capturing
economic growth.
ABSTRACT
In economic literature, the Environmental Kuznets Curve (EKC) depicts the
relationship between environmental quality and economic growth. The

A Study on the Nature of Environmental Kuznets Curve for the Period 2013-2019PROJECTS
YOUTHINK l 2022 l Vol. XVI 328
theory refers to the increase in pollution levels with the
rise in Gross Domestic Product (GDP) initially, and after
it reaches a turning point, it falls as income rises. Named
after Nobel laureate Simon Kuznets, this hypothesis
predicts the existence of an inverted U-shaped curve,
which we have investigated in our study in the context
of four East Indian states - West Bengal, Bihar,
Jharkhand and Odisha, for a period of seven years from
2013 to 2019. In an attempt to empirically verify the
EKC hypothesis, we have presented an econometric
framework to be tested using state-wise panel data. We
have taken sulphur dioxide (SO ) concentration as a 2
measure of environmental quality or dependent
variable and expressed it as a polynomial function of
per capita Net State Domestic Product (NSDP). Results
presented in this study suggest that growth in per capita
NSDP is accompanied by rising levels of emissions to a
certain extent, and then it falls.
KEYWORDS: Environmental Kuznets Curve, Turning
Point, Panel Data, Per Capita Net State Domestic
Product.
INTRODUCTION
While an individual country’s rational effort to advance
the standard of living of their people is palpable, various
awry situations may crop up in the trajectory of
capturing economic growth. Environmental
degradation can be such a dreaded by-product of
development that a critical issue for several decades
was recognizing the appropriate form of relationship
between environmental quality and economic growth.
Simon Kuznets (1955), in his breakthrough work titled
‘Economic Growth and Income Inequality ’,
propounded that with a rise in Per Capita Income (PCI),
income inequality also increases initially, but then, after
attaining a threshold level, begins declining.
Grossman and Krueger (1991), provided an optimistic
understanding that environmental degradation can be
unravelled through economic growth. This opinion is in
conformity with the ‘Environmental Kuznets Curve
hypothesis’, which purports that with continuing
growth in GDP, pollution at first upsurges, attains a
ceiling, and then declines.
Our study looks at whether the ‘EKC hypothesis’ is at all
applicable to the eastern regions of India, specifically
the four states – West Bengal, Bihar, Jharkhand, and
Odisha. The Indian states are putting more and more
emphasis on accomplishing high economic growth,
urbanization, developing infrastructural facilities, and
so on. But this study quests after the question of
whether these development initiatives have
u n f a v o u r a b l y a f f e c t e d t h e
environmental quality.
REVIEW OF LITERATURE
This section presents a broad-spectrum
survey of the total domain of the
economics of environment-growth
relationship.
Figure 1: Environmental Kuznets Curve

PROJECTSA Study on the Nature of Environmental Kuznets Curve for the Period 2013-2019
YOUTHINK l 2022 l Vol. XVI329
1. Grossman and Krueger (1991) The analysis of the EKC relationship was done in the context of the
much-debated North American Free Trade Agreement, as many
people feared that environmentally intensive factories will try to
escape the stricter environmental standards of Canada and the
United States of America (USA) by shifting such industries in countries
with low environmental standards such as Mexico. However, the
researchers came up with a different hypothesis, and they proposed
that free trade would protect the environment. In order to explain this
phenomenon, they developed a cross-country panel of various
measures of air pollution, which they took from the Global
Environmental Monitoring System (GEMS) dataset, and explored the
relationship between economic growth and air quality. Their sample
consisted of SO for 42 countries, smoke or dark matter for 19 2
countries, and suspended particulates for 29 countries. They held
constant identifiable geographic characteristics of different cities, a
common global time trend in the levels of pollution, and the location
and type of the pollution measurement device. They found that
ambient levels of both SO and dark matter suspended in the air, 2
increase with per capita GDP initially, at low levels of national
income, but decrease with per capita GDP at higher levels of income.
These findings provided statistical evidence and formed the
background for the existence of an EKC relationship for these two
indicators of environmental quality.
2. Shafik and Bandyopadhyay (1992) Their study was produced as a background paper for the World
Development Report (1992). The objective of their study was to
explore the basic relationship between environmental quality and
income controlling for country-specific ‘fixed effects', such as
endowment. Indicators of environmental quality were used as
dependent variables in panel regressions, using data from up to 149
countries, for the period 1960-90. Environmental quality indicators
used were the lack of clean water, lack of urban sanitation, ambient
levels of Suspended Particulate Matter (SPM), ambient SO , change in 2
forest area between 1961-1986, the annual rate of deforestation,
dissolved O in rivers, fecal coliforms in rivers, municipal waste per 2
capita, and carbon emissions per capita. Three basic models were
tested - log-linear, quadratic and cubic, to explore the shape of the
relationship between income and each environmental indicator.
Some very clear patterns of environmental degradation emerged
from their analysis. Some environmental indicators improve with
rising incomes (water and sanitation), others worsen and then
improve (particulates and sulphur oxides), and the remaining worsen
steadily (dissolved oxygen in rivers, municipal solid wastes, and
carbon emissions).

A Study on the Nature of Environmental Kuznets Curve for the Period 2013-2019PROJECTS
YOUTHINK l 2022 l Vol. XVI 330
Panayotou (1993) first coined the term ‘Environmental Kuznets
Curve’ (EKC) because of its resemblance to the Kuznets hypothesis. In
his study, he investigated the Environmental Kuznets Curve
relationship for deforestation, SO , oxides of nitrogen, and SPM. He 2
found that the turning-point income for deforestation occurs at
around $800 per capita; the turning point is $3,000 for SO , $4,500 2
for suspended particulates and $5,500 for oxides of nitrogen. He
argued that environmental degradation overall is worse at levels
under $1,000 as both the economy and environmental degradation
undergo a dramatic structural change from rural to urban, and from
the agricultural sector to industrial sector, between $1,000 and
$3,000, and as countries surpass a per capita income of $10,000 and
begin to shift from industry to service sector.
4. Stern (2004) In his paper, Stern presents a critical history of the Environmental
Kuznets Curve (EKC). He concluded that recent evidence shows that
developing countries are addressing environmental issues, sometimes
adopting developed country standards with a short time lag, and
sometimes performing better than some wealthy countries, and that
the EKC results have a very flimsy statistical foundation.
5. Dinda (2004) According to Dinda, the possible explanations for the EKC are: (i) the
progress of economic development from a clean agrarian economy to
a polluting industrial economy to a clean service economy; (ii) the
tendency of people with higher income to have a higher preference
for environmental quality, et al. The evidence of the existence of the
EKC has been questioned from several corners. He further concluded
that only some air quality indicators, especially local pollutants, show
evidence of an EKC.
3. Panayotou (1995)
Table 1

PROJECTSA Study on the Nature of Environmental Kuznets Curve for the Period 2013-2019
YOUTHINK l 2022 l Vol. XVI331
'sulphur dioxide'.

A Study on the Nature of Environmental Kuznets Curve for the Period 2013-2019PROJECTS
YOUTHINK l 2022 l Vol. XVI 332
DATA ANALYSIS AND FINDINGS
Nature of the data: ‘Secondary’.
Panel Data for four East-Indian states (West Bengal,
Bihar, Jharkhand, and Odisha), for the period 2013-
2019, is analyzed for the purpose of this study (refer to
Table 1).
?The annual data for ‘sulphur dioxide’ emission,
which is an indicator for environmental quality, is
collected from the Central Pollution Control Board.
The SO concentration data is available from the 2
‘Manual Monitoring under National Ambient Air
Quality Monitoring Programme’, conducted over a
period of seven years in various zones, districts,
cities, towns, and localities of all the states in India.
The number of days for which monitoring took
place is different for each place and time. So, in an
attempt to unify this data for each state, a weighted
average has been taken for ‘the annual average SO 2
concentrations’ for all the places within a state
where monitoring has been done (considering the
‘number of days of monitoring’ as weights).
It is worth mentioning that these data have been
used in this study as an indicator of environmental
degradation, or a dependent variable in the model.
?The data of net state domestic product at factor cost
(at constant prices) (Base: 2011-2012) is taken from
the Reserve Bank of India’s 'Handbook of Statistics
on Indian Economy'.
Figure 2: Data Summary(Source: Author’s Compilation)
Since we have to investigate the variations in each economic and environmental indicator within the cross-section
unit in the same time series, the whole sample data is essentially panel data. Generally, the processing of the panel
data is done by establishing the Fixed Effects model (F.E) and Random Effects model (R.E). In order to determine
which model to apply for the analysis, a Hausman Test needs to be performed.
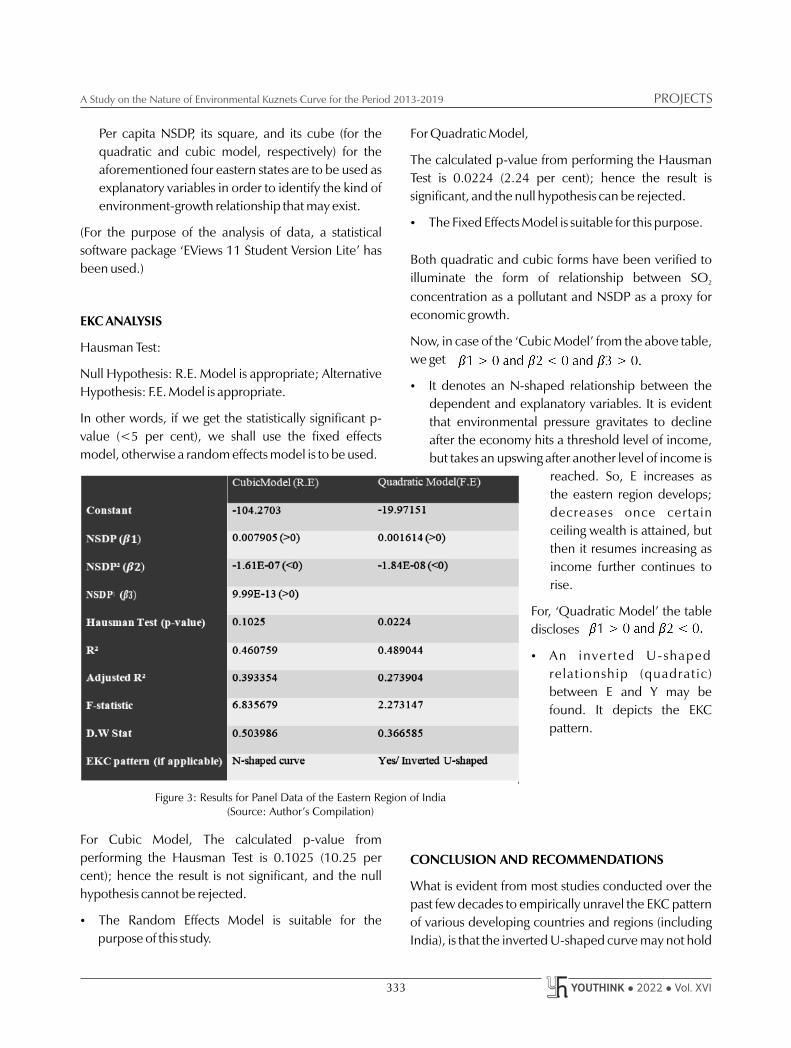
PROJECTSA Study on the Nature of Environmental Kuznets Curve for the Period 2013-2019
YOUTHINK l 2022 l Vol. XVI333
Per capita NSDP, its square, and its cube (for the
quadratic and cubic model, respectively) for the
aforementioned four eastern states are to be used as
explanatory variables in order to identify the kind of
environment-growth relationship that may exist.
(For the purpose of the analysis of data, a statistical
software package ‘EViews 11 Student Version Lite’ has
been used.)
EKC ANALYSIS
Hausman Test:
Null Hypothesis: R.E. Model is appropriate; Alternative
Hypothesis: F.E. Model is appropriate.
In other words, if we get the statistically significant p-
value (<5 per cent), we shall use the fixed effects
model, otherwise a random effects model is to be used.
For Cubic Model, The calculated p-value from
performing the Hausman Test is 0.1025 (10.25 per
cent); hence the result is not significant, and the null
hypothesis cannot be rejected.
?The Random Effects Model is suitable for the
purpose of this study.
Figure 3: Results for Panel Data of the Eastern Region of India(Source: Author’s Compilation)
For Quadratic Model,
The calculated p-value from performing the Hausman
Test is 0.0224 (2.24 per cent); hence the result is
significant, and the null hypothesis can be rejected.
?The Fixed Effects Model is suitable for this purpose.
Both quadratic and cubic forms have been verified to
illuminate the form of relationship between SO 2
concentration as a pollutant and NSDP as a proxy for
economic growth.
Now, in case of the ‘Cubic Model’ from the above table,
we get
?It denotes an N-shaped relationship between the
dependent and explanatory variables. It is evident
that environmental pressure gravitates to decline
after the economy hits a threshold level of income,
but takes an upswing after another level of income is
reached. So, E increases as
the eastern region develops;
decreases once certain
ceiling wealth is attained, but
then it resumes increasing as
income further continues to
rise.
For, ‘Quadratic Model’ the table
discloses
?An inverted U- shaped
relat ionship (quadratic)
between E and Y may be
found. It depicts the EKC
pattern.
CONCLUSION AND RECOMMENDATIONS
What is evident from most studies conducted over the
past few decades to empirically unravel the EKC pattern
of various developing countries and regions (including
India), is that the inverted U-shaped curve may not hold

A Study on the Nature of Environmental Kuznets Curve for the Period 2013-2019PROJECTS
YOUTHINK l 2022 l Vol. XVI 334
for specific nations and provinces. A specific focus on
East India in the context of our study of EKC analysis for
local pollutants like SO is seldom found in the existing 2
studies.
Over the years, along with a rise in per capita income,
the environmental quality in Eastern India has also
changed, evidenced by the analysis of the quadratic
model. The inverted U-shape in the eastern region is
seemingly revealed from the data on SO concentration 2
and per capita NSDP.
Now, in the case of the cubic model, we have observed
an N-shaped curve, which suggests that the declination
of the environmental quality is bound to happen post-
threshold, along with the income rise. The observed
results appear to corroborate the theoretical aspect of
the topic under discussion, i.e., the hypothesized
Environmental Kuznets Curve. Due to the small period
of time (only seven years) that has been taken into
consideration for the purpose of this study, we might
have come across a transitional phase where a turning
point is found.
The EKC hypothesis, in spite of being controversial in
nature, happens to affect the environmental policy
design for any country or regime to a great deal. Results
presented in this study suggest that growth in per capita
NSDP is accompanied by decreasing levels of emissions
to a certain extent, and for a better environment, the
Central Government and the State Governments in the
eastern region should adhere to the EKC pattern
predicted to formulate policies regarding environment
and industry. Lastly, it can be said that in the light of this
study, a cleaner growth trajectory is the correct way to
go ahead.
LIMITATIONS OF THE STUDY
One of the major issues in the context of this study is
that in developing nations such as India, data on
pollutants (e.g., SO ) is scarce and insufficient. 2
Inadequate monitoring of information pertaining to air
quality data is a huge concern for empirical researchers
who can barely agree that the EKC provides a good fit
for the prevailing data, even for conventional pollutants
like SO Also, the available data sometimes exists in 2
such a form that is not amenable to treatment in studies.
The time period for which the data is taken is also not
sufficient. Additionally, had the focus of our inquiry
been the whole of India, considering all the states, our
findings would be more transparent and wholesome.
The panel data set under consideration (for this study)
faced an issue worth mentioning. Following the
footsteps of our predecessors, when we went for a
logarithmic transformation of our data set, it evidently
exhibited multicollinearity, due to which the statistical
application ‘E-views’ was unable to provide an analysis
(as least square techniques failed).
REFERENCES
1. Beckerman W., 1992. ‘Economic growth and the
environment: Whose growth? Whose environment?’ World
Dev., 20, pp. 481–496.
2. Dinda S. et.al, (2000), ‘Air Quality and Economic Growth: An
Empirical Study’, Ecological Economics. Vol 34: pp. 409-423.
3. Dinda S., 2004. ‘Environmental Kuznets Curve Hypothesis: A
Survey’, Ecological Economics, Vol 49 (4): pp. 431-455.
4. Grossman G.M., Krueger A.B., 1995. ‘Economic growth and
the environment.’ Quarterly Journal of Economics 110, pp.
353– 378.
5. Grossman G.M., 1995. ‘Pollution and growth: what do we
know?’ In: Goldin I., Winters, L.A. (Eds.), The Economics of
Sustainable Development, Cambridge University Press.
6. Kuznets S., 1955. ‘Economic growth and income inequality.’
American Economic Review 45, pp. 1–28.
7. Panayotou T., 1995. ‘Environmental degradation at different
stages of economic development.’ In: Ahmed I., Doeleman
J.A. (Eds.), Beyond Rio. The Environment Crisis and
Sustainable Livelihoods in the Third World. MacMillan Press
Ltd.
8. Pandey S., 2018. ‘Economic Growth and Environmental
Quality – A study in the context of Indian States.’
9. Shafik N. and Bandyopadhyay S. 1992, ‘Economic Growth
and Environmental Quality: Time Series and Cross-country
Evidence’, Background Paper for the World Development
Report 1992. Washington, DC: The World Bank.
.

PROJECTS
YOUTHINK l 2022 l Vol. XVI335
Deglobalization and its Impact on Indian Economy
Prof. Anirban GhosalAssistant ProfessorDepartment of Commerce (Evening)
Ankit Kumar SinghDepartment of Commerce (Evening)
It's high time that
India, as a
country, known
for its potential
and promise,
starts achieving
all these
objectives to
become a
dominant
economic force
on the global
stage.
ABSTRACT
This research paper studies the impact on deglobalization trend in the after
effect of the current pandemic. Disruptions in supply chains, restrictions on
travel among other reasons saw countries focusing more on local resources to
meet their demands in absence of any other option. The topic is not only
relevant in the recent times but also an area which is not known to many. The
aim through the research along with the included questionnaire is to inform
people and make them aware about the recent developments in the global
economy among which deglobalization is a prominent one. The main

Deglobalization and its Impact on Indian EconomyPROJECTS
YOUTHINK l 2022 l Vol. XVI 336
objective behind the research study is to find answers to
some prominent questions with respect to the
deglobalization trend such as the reasons behind
decreasing pace of globalization in the world economy,
countries favouring deglobalization, its implications,
and the measures undertaken by India, as a country to
reduce dependency on other nations.
KEYWORDS: Deglobalization, World Trade, Exchange,
Resources.
INTRODUCTION
Deglobalization, a reverse trend gaining momentum in
recent times has attracted a lot of attention in a global
perspective. Global trade and exchange of resources
among nations has taken a downward trend. Countries
have become more and more wary of the threats arising
from global imports and their potential lasting impacts
on the local markets. The countries are shifting their
focus more and more on the local manufacturers and
their cause to serve the general public, rather than
depending on foreign goods. This focus has facilitated
increasing production-linked incentives to the
manufacturers along with increased subsidies and tax
reliefs. The infrastructure expenditures of the nations
have also increased over the years to attract foreign
investors in the form of Foreign Portfolio Investments
(FPIs) as well as Foreign Direct Investments (FDIs) to
allow manufacturing firms to set up factories which will
have a direct positive impact on country’s employment,
Gross Domestic Product (GDP), and the self-reliance
aspect. Thus, the concept of globalization, which once
was the dream and aim for many across the world, does
not anymore enjoy the same level of popularity and
fame. This uncanny situation has been fuelled even
more by the current COVID-19 pandemic and the
rumoured role that China played in the same.
The term deglobalization was first used in a paper called
'Deglobalization - Ideas for a New World Economy',
published in the year 2005 by Walden Bello. The writer
is of the opinion that deglobalization would bring about
a huge modification in the current model of economic
governance.
The advent of deglobalization has sparked off
numerous debates. Most of the economists around the
world refer to this concept as ‘impractical’, ‘absurd’,
‘superficial’ and ‘anachronistic’. The two diverging
processes have given rise to lot of curiosity in the global
market - on one side, there is globalization with so
much happening around it while on the other hand,
deglobalization which has just begun to make its
presence not only in the economy as a process, but also
in literature as a concept. However, the attempt should
not be to address these two concepts with opposite
school of thoughts, rather to study the relationship that
exists between them. What really should be the prime
objective of such study, or a discussion is whether
deglobalization is actually a long-lasting phenomenon
or just a phase before the countries put their differences
aside and carry forward with trade openness and free
exchange of resources.
DEGLOBALIZATION TRENDS AND THEIR CAUSES
The world economy is very dynamic in nature with new
trade policies (with respect to individual countries or
the world as a whole), new tax and duty regimes,
currency value fluctuations taking place frequently. In
such a volatile environment, the reasons of
deglobalization are not only recent but can also be
considered to be triggered by a host of factors which
have happened in the past. Some of the prominent such
factors (both recent and past) are as follows:
Unequal Distribution of Globalization Benefits:
The benefits (mostly financial) arising from globalization
are received primarily by the developed and
developing economic markets of countries like India,
the United States of America (USA), China etc. leaving
the underdeveloped economies collectively sharing a
very small portion of these benefits. This inequality is
contributing to the reducing popularity and efforts
towards globalization.
Global Slowdown:
A decrease in the pace of economic activities over the
years has led to countries adopting more protectionist
measures against trade and other activities and focusing
more on local manufacturing and infrastructure.
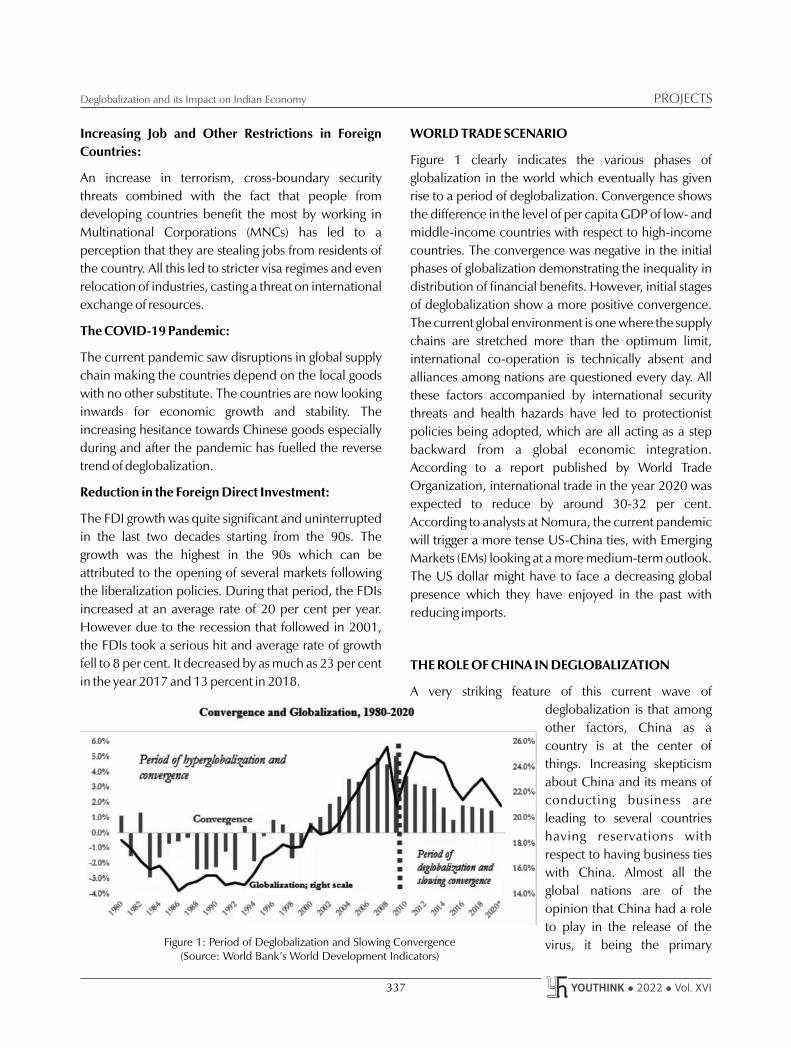
PROJECTSDeglobalization and its Impact on Indian Economy
YOUTHINK l 2022 l Vol. XVI337
Increasing Job and Other Restrictions in Foreign
Countries:
An increase in terrorism, cross-boundary security
threats combined with the fact that people from
developing countries benefit the most by working in
Multinational Corporations (MNCs) has led to a
perception that they are stealing jobs from residents of
the country. All this led to stricter visa regimes and even
relocation of industries, casting a threat on international
exchange of resources.
The COVID-19 Pandemic:
The current pandemic saw disruptions in global supply
chain making the countries depend on the local goods
with no other substitute. The countries are now looking
inwards for economic growth and stability. The
increasing hesitance towards Chinese goods especially
during and after the pandemic has fuelled the reverse
trend of deglobalization.
Reduction in the Foreign Direct Investment:
The FDI growth was quite significant and uninterrupted
in the last two decades starting from the 90s. The
growth was the highest in the 90s which can be
attributed to the opening of several markets following
the liberalization policies. During that period, the FDIs
increased at an average rate of 20 per cent per year.
However due to the recession that followed in 2001,
the FDIs took a serious hit and average rate of growth
fell to 8 per cent. It decreased by as much as 23 per cent
in the year 2017 and 13 percent in 2018.
Figure 1: Period of Deglobalization and Slowing Convergence(Source: World Bank’s World Development Indicators)
WORLD TRADE SCENARIO
Figure 1 clearly indicates the various phases of
globalization in the world which eventually has given
rise to a period of deglobalization. Convergence shows
the difference in the level of per capita GDP of low- and
middle-income countries with respect to high-income
countries. The convergence was negative in the initial
phases of globalization demonstrating the inequality in
distribution of financial benefits. However, initial stages
of deglobalization show a more positive convergence.
The current global environment is one where the supply
chains are stretched more than the optimum limit,
international co-operation is technically absent and
alliances among nations are questioned every day. All
these factors accompanied by international security
threats and health hazards have led to protectionist
policies being adopted, which are all acting as a step
backward from a global economic integration.
According to a report published by World Trade
Organization, international trade in the year 2020 was
expected to reduce by around 30-32 per cent.
According to analysts at Nomura, the current pandemic
will trigger a more tense US-China ties, with Emerging
Markets (EMs) looking at a more medium-term outlook.
The US dollar might have to face a decreasing global
presence which they have enjoyed in the past with
reducing imports.
THE ROLE OF CHINA IN DEGLOBALIZATION
A very striking feature of this current wave of
deglobalization is that among
other factors, China as a
country is at the center of
things. Increasing skepticism
about China and its means of
conducting business are
leading to several countries
having reservations with
respect to having business ties
with China. Almost all the
global nations are of the
opinion that China had a role
to play in the release of the
virus, it being the primary

Deglobalization and its Impact on Indian EconomyPROJECTS
YOUTHINK l 2022 l Vol. XVI 338
center of release of the novel coronavirus. Businesses
across countries are reassessing the role being played by
China in global supply chains, with most of them
focusing on shifting their business transactions from the
country to some other option. In some ways, China
itself is responsible for putting itself in such a
c o m p l i c a t e d
situation. The way
China cancelled the
delivery of rare earth
s u p p l i e s t o t h e
electronic industry of
Japan in 2010 due to a
dispute over certain
islands is fresh in
everyone’s mind. In
other words, China
have attempted to
weapon ize t rade
since a long time.
Figure 2 shows the declining scenario of China’s exports
over the years which have shown further signs of
decrease in the recent times. Few countries (including
India) have imposed complete bans on Chinese
products, services, and even mobile apps.
Figure 2: Foreign Value Added in China’s Export(Source: United Nations Conference on Trade And
Development (UNCTAD) Eora Data Basis)
INDIA AND DEGLOBALIZATION
India as we know is one of the EMs in the world
economy. US-China stand-off and the probable role
played by China in spreading the virus might see the
MNCs diversify their investments and shift their focus to
the EMs such as India, Brazil, Argentina et al. This will
also be due to the availability of cheap labour in these
countries. As we know, due to the large population,
India may be the only country which can equal China in
terms of the labour force that too at a cheaper rate.
As evident from the Figure 3, India’s current account
balance showed a surplus of $19.8 billion which is
approximately 3.9 per cent of the country’s GDP in the
first quarter (April - June) of 2020-21. The surplus for the
same quarter in the previous year (2019-2020) was only
$ 0.6 billion, being approximately
0.1 per cent of country’s GDP.
According to a statement passed by
Reserve Bank of India (RBI), this
surplus was brought about by a
marked decrease in the country’s
trade deficit to an amount of
approximately $10 billion. This
significant decline was the result of
the country’s reduction in imports
in comparison to the previous fiscal
year with respect to exports on a
year-on-year basis. The Govern-
ment of India is leaving no stones
unturned for making India a
manufacturing hub, and their
efforts have indeed shown bright
results in the initial phases. Campaigns like Atmanirbhar
Abhiyaan, Make in India have contributed to the cause
as well and have made the countrymen aware of the
benefits of a self-sustaining and self-reliant economy.
The budget for fiscal year 2021-22 saw the Finance
Figure 3: Depiction of Major Items of India’s BOP(Source: Reserve Bank of India)

PROJECTSDeglobalization and its Impact on Indian Economy
YOUTHINK l 2022 l Vol. XVI339
Minister, Nirmala Sitharaman increasing the fiscal
deficit to support infrastructure expenditures. The
prominent component of such expenditure included
setting up a DFI (Development Financial Institution)
with a capital outlay of $200 billion. The NIIF (National
Investment and Infrastructure Fund) was also allotted
$50 billion to enable it to acquire infrastructure assets.
The Government is also incorporating favourable policy
regimes to make the country an attractive destination
for foreign investments in the form of both FPIs and
FDIs. These measures can further strengthen the
infrastructure sector and finally help India to compete
with economies like the USA and China in terms of
exports. According to recent estimates by
Confederation of Indian Industry (CII) and Ernst &
Young (EY), India is expected to attract FDIs worth
$120-160 billion by the end of year 2025.The past 10
years has seen an increase in GDP of around 6.8 per
cent, while the FDI to GDP ratio has increased by 1.8
per cent. According to many prominent authorities
such as United Bank of
Switzerland (UBS), India
might be the only economy
that can match with respect to
abundance o f l abou r.
However, India has to go a
long way before it can be
considered as a perfect
replacement of China, but
this will be as good a chance
as any country will get to
assert its global presence.
CONCLUSION
The benefits that are reaped from the globalization
phenomenon in comparison to its cost is a matter of
contention not only among the governments,
academics, and scholars but also among the general
public. On the basis of the research, it can be concluded
that the global economy is on the brink of a major
change from an economical perspective. It is however
important to realize that a study on deglobalization
would be difficult since the phenomenon being a new
one, there aren’t any tools available for conducting sch
a study. Although, the ‘globalization index’ can come in
handy for the initial stages of the study until the
researchers are able to establish enough groundwork
for a more appropriate measure for deglobalization.
Such a measure is important to predict the phases of
economic reversal which might result in the
deglobalization symptoms and understand the
potential impacts that it can have on world trade. The
negative implications of the deglobalization will include
a reduced co-operation among countries, increasing
conflicts. The absence of cheap labour from countries
such as China, India will increase the cost of production
and the era of cheap globalized goods might be over.
Most of the countries (including India) are not ready for
this shift in the world economy owing to their limited
infrastructure, low level of manufacturing, high
dependence on exports et al. This change might leave
the under-developed countries crippled as they do not
have the means to carry themselves by their own as of
now and depend on the developed countries for goods,
borrowings etc.
RECOMMENDATIONS
The major reason why countries like India have to
depend on foreign imports is because we as a country
are focused more on assembly of raw materials being
imported rather than manufacturing the same in first
place. More than 32 per cent of goods imported by
countries across the globe are used as a value addition
for final goods being produced which are then again
exported. Hence, India should focus on manufacturing
of the raw material required by its various industries. If it
Figure 4: Top 10 Economies’ Nominal GDP(Source: UBS)

Deglobalization and its Impact on Indian EconomyPROJECTS
YOUTHINK l 2022 l Vol. XVI 340
is able to bridge the gap between the raw
materials and final goods, it can reduce its
trade deficit and stand as a major
contender to economies like the USA,
China, Saudi Arabia, Singapore et al. For
achieving this milestone, India should aim
at better returns and higher flow of
capital. The U.S.-China trade tensions
and the global pandemic have opened a
window for India which it must capitalize
on.
What can work for India in comparison to other non-
China competing countries is its ever growing and large
domestic market which has the potential to consume a
large portion of the goods manufactured hence the
industries don’t have to worry much for the wastage of
its outputs. According to estimates, by the year 2030
more than one-fifth of the world’s working-age
population comprising of 15- to 64-year-olds will
belong to India. Despite having huge land resources,
cheap labour India has failed to fulfill its manufacturing
potential in the past. Hence, its high time that India, as a
country known for its potential and promise, starts
achieving all these objectives to become a dominant
economic force at the global stage.
QUESTIONNAIRE
In this section, I have made an analysis on the basis of
the questionnaire I circulated among the working
professionals and business owners to seek their opinion
on the deglobalization trend and the potential impact.
The analysis is based on 40 respondents.
Figure 5(Source: Primary Data)
Figure 5 represents the profile of the respondents with
majority of them being employees.
Figure 6(Source: Primary Data)
Figure 6 represents the response on how much their
organizations will be affected if India stops
import/export activities with one being fully affected
and five being not at all.
Figure 7(Source: Primary Data)
57.5 per cent of the organizations surveyed are engaged
in import/export activities
Figure 8(Source: Primary Data)
65 per cent of the people think that Atmanirbhar
Abhiyaan Campaign is feasible for a country like India.

PROJECTSDeglobalization and its Impact on Indian Economy
YOUTHINK l 2022 l Vol. XVI341
Figure 9(Source: Primary Data)
52.5 per cent of the people think that India should cut
all trading ties with China.
Figure 10(Source: Primary Data)
Figure 10 shows the response on how much they favour
deglobalization with one being fully against and five
being fully supportive.
Figure 11(Source: Primary Data)
Figure 11 indicates the response on the quality of Indian products with comparison to foreign
ones across different criteria.
REFERENCES
1 An article on deglobalization on www.business-
standard.com.
2 An article on how the pandemic triggered deglobalization on
www.piie.com.
3 An article on why is deglobalization gaining momentum on
www.bloomberg.com.
4 An article on deglobalization on www.business-
standard.com.
5 An article on deglobalization on www.wikipedia.org.
6 An ar t ic le on impact o f deg lobal izat ion on
www.moneycontrol.com.
7 A research paper named 'Two Waves of Globalization'
written by R Baldwin and P Martin.
8 A research paper named
'China and Deglobalization of
World Economy' written by
Natasa Stanojevic and Katarina
Zaic.
9 A research paper named
'Deglobalization - Ideas for a
New World Economy' written
by Walden Bello.
10 A press release on India’s BOP
Account for the year 2020-
2021 published on the official
website of RBI.

PROFESSOR’S DESK
YOUTHINK l 2022 l Vol. XVI 342
Talent Analytics: A Game Changer for Organizations
Dr. Tapalina BhattasaliAssistant ProfessorDepartment of Commerce
Nowadays due to
globalization and
increased cross-
cultural trends,
every organization
tries to find out
talents who are
versatile enough to
fit and blend in
with the existing
work culture.
ABSTRACT
Our young generation wants to achieve everything like money, fame,
position within the shortest possible time. If it is not achieved, it may lead to
impatience, frustration, demotivation, intolerance, and stress. This mentality
of the younger minds forces them to continuously search for result-oriented
jobs. They are reluctant to stay at their jobs when there is no possibility of
improvement. This may lead to incidents of frequent job change, which in
turn gives rise to less employee engagement, demotivation, and job
dissatisfaction. This instability is very alarming in the job market and
challenging for organizations. It becomes very difficult for the organization to
meet its objective without having the right person at the right place, at the
right time. Deadlines may not be fulfilled either because of a lack of talented
employees or due to the shortage of employees. Consequently, organizations
suffer as these scenarios affect the overall performance. If the financial
benefits of the organizations are less, it results in increased employee
turnover. Unsatisfied talents cannot see any hope of getting benefits from the
organizations or any scope for career development. This type of situation can
be easily handled by the organizations by incorporating proper selection,
recruitment, employee engagement, career development opportunity and
performance management of the employees. Here, talent analytics plays a
major role. The main concept of talent analytics is considered on the basics of
predictive analytics, which is very helpful to get an insight of what the
employee is thinking, whether he/she is planning to quit or he/she is
demotivated or he/she is satisfied or whether his/her promotion is due and so
on. The main aim of this research is to throw light on the fact that talent
analytics is a game changer for organizations. It is so powerful that with its
help, the entire organization can be transformed into a better and happy
place to work by taking better employee-friendly decisions in terms of

PROFESSOR’S DESKTalent Analytics: A Game Changer for Organizations
YOUTHINK l 2022 l Vol. XVI343
recruitment, employee engagement, performance
management, career development, and less employee
turnover. Talent analytics leads to job satisfaction. Here,
the right decision can be taken based on systematic
analysis rather than intuition.
KEYWORDS: Talent Analytics, Predictive Analytics,
Game Changer, Organization.
INTRODUCTION
Talent analytics is the analysis of a
huge set of employee data,
facilitated by the use of statistics
and technology, with the purpose
of making better organizational
and operational decisions. It can
select the best talent on the basis of
collected information without
applying any biasness (Nocker et
al., 2019). It considers the
following major components.
Hiring analytics can provide
insights into the hiring process by
analyzing skills. Consequently,
organizations can make impartial decisions based on
the facts. Feedback analytics can consider the existing
workforce to determine whether employees in the
organizations are performing well or not; whether they
have the right skills or not; whether they have the right
talent in the right place or not. Optimization analytics
includes data and predictions to ensure organizations
can make internal processes as robust as possible.
Decision-making is equipped with predictive analytics
that describes the method of using current and
historical data for future prediction of human
behaviour. Predictive analytics studies the pattern of the
data and tries to find out if there is a chance of
occurrence of the same pattern in human behaviour.
In today’s modern world, everything is data-driven.
Here, more and more HR managers with the help of
machines are analyzing big data and are trying to
predict and overcome future problems in terms of
human behaviour. Talent analytics is the need of the
hour. Human being has been considered as the most
challenging and complicated entity to be handled by
anyone because it has the most intelligent brain which
can think about several things at the same time.
Humans are also blessed with emotions. Consequently,
it is the most difficult work for anyone to understand
them completely. In this scenario, it becomes very
difficult for an organization to fully understand its
employees.
It is very challenging for the organization to make every
employee happy. Organizations need to tackle
innumerable resistances from the employees when
authorities try to implement any new policy or want to
take any kind of decision regarding any issue. People
may also try to leave the organization. These types of
scenarios create a lot of pressure on the organization to
get a substitute for the existing employee. It may affect
the objective of the organizations, which may push it
towards less productivity as it is not possible for the
organizations to fulfill deadlines. Through talent
analytics, these kinds of problems can be tackled by
analyzing the large data available, systematically. It is
possible to generate a feasible solution regarding talent
acquisition, employee engagement, employee
retention, and performance management. Necessary
decisions can be taken based on a statistical analysis of
data so that organizations become a much better place
to work, talents are not deprived, and responsibilities
are given to the employees based on their skills without
any biasness or assumptions.
Figure 1: Talent Analytics Value-Chain for Organizational Effectiveness

Talent Analytics: A Game Changer for OrganizationsPROFESSOR’S DESK
YOUTHINK l 2022 l Vol. XVI 344
IMPORTANCE OF TALENT ANALYTICS
Best Talent Acquisition
Any organization can grow and stand apart in the crowd
by hiring the best talent available in the market.
Nowadays due to globalization and increased cross-
cultural trends, every organization tries to find out
talents who are versatile enough to fit and blend in with
the existing work culture. This trend can easily be taken
care of with the help of talent analytics (Saputra, 2021).
The traditional process of scanning through a huge
amount of data to find out the right cultural fit can be
done easily using analytics, that can do this job and do
the background checking of the deserving candidates in
the shortest possible time. Organizations can hire the
best talent in the organization within a very short
duration.
Increased Productivity
Once the right talent is hired, it is the responsibility of
the organization to maximally help the talent in
realizing its potential and utilize it in the productivity
boost of the organization. Talent analytics can easily
determine which employee is suitable for which type of
work in the organization and keep a watch on the
performance and progress of employees, which in turn
increases the productivity of the organization. As
collected data can help to select the right person for the
right job, organizations can keep a track of the
performance of the newly recruited employees and can
increase employee productivity. It can also improve the
overall efficiency of the group.
Deeper Employee Engagement
Deeper employee engagement can only take place if
employees are satisfied. Employee satisfaction is an
intangible aspect that is very hard to measure.
Traditional solutions like surveys and feedbacks are not
so efficient in finding out the extent of employee
satisfaction. In this case, predictive analytics is of great
help. If employees are satisfied with their designations
and jobs, they will be more engaged. If authorities have
a clear idea about the problems among the employees
or limitations in the selection procedure, they can try to
sort out the problems. Talent analytics along with
predictive analytics, the reasons behind the problems
among employees can be determined within the
shortest possible time, which is beneficial for the
employees as well as the organization.
Targeted Retention
One of the most challenging jobs for the organizations is
the retention of topmost employees for a longer period.
The reasons behind this situation include lack of proper
recognition, low motivation, lack of career
development facilities, et al. Analytics based on
available historical data can precisely predict the
mentality of employees. With the help of attrition and
data related to performance, employee loyalty can be
predicted and employee beneficial programmes can be
made so that those employees who are achievers can
be retained in the organization for a longer period.
Talent Forecasting
Talent analytics can help in predicting the required
characteristics of those hired and deciding which
recruitment would be an asset for the company in terms
of knowledge, experience, efficiency, skills et al.
(Sivathanu, 2020). Once the best fit is found, further
steps of recruiting these employees for a particular post
are made and the right talent is recruited. The right
talent would help in further progress and profit
generation for the organization.
Decreased Employee Turnover
Talent analytics can help organizations in future
predictions regarding employee turnover. The reasons
behind the mentality of employees for leaving the job or
sticking to the job in terms of resignations, terminations,
performance appraisal, career development, et al. can
be easily determined. Improvement of these causes can
lead to increased satisfaction and in turn, lead to
decreased employee turnover. Decreased employee
turnover can save money and time of the organization
as it is not spent in the recruitment process repeatedly.
HYPOTHESES
1. H0 = Talent analytics is not actually a game changer
for an organization.
H1 = Talent analytics is actually a game changer for
an organization.

PROFESSOR’S DESKTalent Analytics: A Game Changer for Organizations
YOUTHINK l 2022 l Vol. XVI345
2. H0 = Talent analytics has no role in effective
recruitment and decreased employee turnover in
an organization.
H1 = Talent analytics plays an important role in
effective recruitment and decreased employee
turnover in an organization.
3. H0 = Talent analytics has no contribution in
employee retention in an organization.
H1 = Talent analytics has a contribution in
employee retention in an organization.
RESEARCH METHODOLOGY
Here, a descriptive research design has been
considered to test the hypotheses. Exploratory research
is considered to formulate the hypothesis and variables
of this research. This research is basically considered as
a mixed research approach. 54 respondents from
various organizations were selected across India using
the purposive sampling technique. This survey was
conducted using Google Forms with close-ended
Nominal and Likert scale questions. The questionnaire
was based on three elements - talent acquisition,
employee retention, and employee turnover. Statistical
package for the Social Sciences is used for data analysis
and statistical hypothesis testing. The following
questions were included in the questionnaire:
Q1: Talent analytics plays an important role in
effective talent acquisition.
Q2: Talent analytics can decrease employee turnover
in the organization.
Q3: Talent analytics effectively helps in employee
retention in the organization.
Q4: Talent analytics can be used for talent forecasting
in the organization.
Q5: Talent analytics is helpful in employee
engagement.
Q6: Talent analytics helps in employee performance
management.
Q7: Talent analytics is useful in increasing productivity.
DESCRIPTIVE DATA ANALYSIS
Mean analysis is done to find out the logical outcome to
justify this study. Opinions of the authorities of various
organizations were collected on a 5-point Likert scale to
understand the role of talent analytics and its impact on
the organizations. The agreement level for all
measurement variables is considered as follows:
1 = Strongly Disagree, 2 = Disagree, 3 = Neutral, 4 =
Agree, and 5 = Strongly Agree.
Mean more than three and close to five indicates the
agreement of respondents for the parameter and mean
less than three and close to one indicates their
disagreement.
Observations:
?Mean more than three for all parameters of talent
analytics indicates that talent analytics plays an
important role for organizations.
?The role of talent analytics in effective recruitment
and increased employee turnover in an organization
is proved, as the observed mean is 3.80.
?Contribution of talent analytics in employee
retention in an organization is very significant, as the
observed mean is 4.02.
?The role of talent analytics along with predictive
analytics in talent forecasting is proved, as the
observed mean is 3.85.
N MeanStd. Dev
Variance
Q1 54 3.80 1.155 1.335
Q2 54 3.74 0.994 0.988
Q3 54 4.02 0.789 0.622
Q4 54 3.85 0.856 0.732
Q5 54 3.93 0.866 0.749
Q6 54 3.96 0.931 0.867
Q7 54 3.93 0.929 0.862
Table 1: Descriptive Statistics(Source: Primary Data)

Talent Analytics: A Game Changer for OrganizationsPROFESSOR’S DESK
YOUTHINK l 2022 l Vol. XVI 346
?Mean of 3.93 proves that talent analytics is helpful in
employee engagement.
?Importance of talent analytics in employee
performance management in the organization is
proved, as the observed mean is 3.96.
?Contribution of talent analytics in increasing
productivity is proved, as the
observed mean is 3.93.
HYPOTHESIS TESTING
One sample t-test statistics is used to
test the hypotheses of this research.
Mean analysis is done to find out the
logical outcome to justify the
objectives of this research study.
Opinions of respondents were
collected on a 5-point Likert scale to
understand the role of talent analytics
and its impact on the organizations.
The agreement level for al l
measurement variables was taken
measuring 1= Strongly Disagree, 2=
Disagree, 3= Neutral, 4= Agree, and
5 = Strongly Agree. Mean more than
three and close to five indicates the
agreement of respondents for the parameter and mean
less than three and close to one indicates their
disagreement. T-distribution of the responses was
estimated as depicted in Table 2:
The agreement level of respondents for all
measurement variables was taken measuring 1=
Strongly Disagree, 2= Disagree, 3= Neutral, 4= Agree,
and 5 = Strongly Agree. Mean more than three and
close to five indicates agreement of the respondents for
the particular parameter and mean less than three and
close to one indicates their disagreement.
Observations:
All the significant values of t-distribution and mean
more than three for the parameters measuring the
respondents' opinion indicate the rejection of null
hypotheses mentioned below:
1. H0 = Talent analytics is not actually a game
changer in HR in an organization.
2. H0 = Talent analytics has no role in effective
recruitment and decreased employee turnover in
an organization.
3. H0 = Talent analytics has no contribution in
employee retention in an organization.
Findings:
?It is found that talent analytics plays a significant role
in an organization.
N Mean Std. DevStd. Error
Mean
Q1 54 3.80 1.155 0.157
Q2 54 3.74 0.994 0.135
Q3 54 4.02 0.789 0.107
Q4 54 3.85 0.856 0.116
Q5 54 3.93 0.866 0.118
Q6 54 3.96 0.931 0.127
Q7 54 3.93 0.929 0.126
Table 2: One-Sample Statistics(Source: Primary Data)
Test Value = 3
T df Sig.(two-tailed)Mean
Difference
95 per cent Confidence Level of Difference
Lower Upper
Q1 5.064 53 0.000 0.796 0.48 1.11
Q2 5.476 53 0.000 0.741 0.47 1.01
Q3 9.488 53 0.000 1.019 0.80 1.23
Q4 7.315 53 0.000 0.852 0.62 1.09
Q5 7.861 53 0.000 0.926 0.69 1.16
Q6 7.602 53 0.000 0.963 0.71 1.22
Q7 7.327 53 0.000 0.926 0.67 1.18
Table 3: One-Sample Test(Source: Primary Data)

PROFESSOR’S DESKTalent Analytics: A Game Changer for Organizations
YOUTHINK l 2022 l Vol. XVI347
?Talent analytics can play an important role in
effective talent acquisition.
?Talent analytics can play an important role in
decreasing employee turnover in the organization.
?Talent analytics can be used for talent forecasting in
the organization.
?It is found that talent analytics is helpful in employee
engagement.
?Talent analytics helps in employee performance
management in the organization.
?Talent analytics plays an important role in increasing
productivity.
?Talent analytics has an impact on employee
retention in an organization.
?Talent analytics is actually a game changer for an
organization.
CONCLUSION
This research work proves that talent analytics is an
effective tool to solve most of the disturbing problems of
the organization in terms of employees, with respect to
talent acquisition, motivation, retention, performance
management, employee engagement, et al. Talent
analytics along with predictive analytics can forecast the
sentiments and emotions of employees and can
effectively predict which employee is not happy and is
planning to leave the organization. With the help of
analytics, organizations can easily find out those
employees who are planning for a job change and the
reason behind the same. Through timely actions,
authorities can stop those employees from leaving an
organization and can inculcate a sense of engagement
and loyalty towards the organization; so that employees
will not leave and become motivated and start giving
their hundred per cent so that it is beneficial for both the
employee and the organization. This aspect proves the
fact that talent analytics is truly a game changer in
organizations.
REFERENCES
1. Nocker, Manuela, and Vania Sena. (2019), ‘Big Data and
Human Resources Management: The Rise of Talent Analytics’
Social Sciences 8, no. 10: 273. https://doi.org/10.3390/
socsci8100273
2. Saputra, A., Wang, G., Zhang, J.Z. and Behl, A. (2021), ‘The
framework of talent analytics using big data’, The TQM
Journal, Vol. ahead-of-print No. ahead-of-print.
https://doi.org/10.1108/TQM-03-2021-0089
3. Sivathanu, B. and Pillai, R. (2020), ‘Technology and talent
analytics for talent management – a game changer for
organizational performance’, International Journal of
Organizational Analysis, Vol. 28 No. 2, pp. 457-473.
https://doi.org/10.1108/IJOA-01-2019-1634

PROFESSOR’S DESK
YOUTHINK l 2022 l Vol. XVI 348
Whether CompetitorCollaboration During Pandemic Amounts to Anti-Competitive Conduct under the Indian Competition Law
Prof. Oyndrila GangulyAssistant ProfessorDepartment of Commerce
The coordinated
industry responses
have been deemed
necessary to deal
with the issues
such as demand or
supply chain
disruptions and
shortages of
essential products
and services.
ABSTRACT
The article aims to address the question of whether collaboration between
different corporate entities making identical products (horizontal
arrangement) for fulfilling their supply and demand requirement would
amount to an anti-competitive arrangement within the legal framework of
the competition law in India. The article has further analyzed the legal
framework of the competition law within India and tried to apply the said
provisions of law to fictitious case study situations which are prevalent within
the industry at large, in India, especially during the COVID-19 pandemic
crisis. The directive of Competition Commission of India (CCI) pertaining to
collaborations of corporate entities during COVID-19 crisis has also been
discussed and analytically applied to the case study situations. In order to
gauge the international response to the said subject, the article has further
tried to analyze the legal framework of the European Union (EU) and various
initiative it has taken, whereby certain relaxations have been provided for the
said collaboration or exercises, specifically taking into account the COVID-
19 pandemic situation and the constraints faced by businesses thereafter.
KEYWORDS: Competitor, Collaboration, Products, Anti-Competitive.

PROFESSOR’S DESKWhether Competitor Collaboration During Pandemic Amounts to Anti-Competitive Conduct
YOUTHINK l 2022 l Vol. XVI349
INTRODUCTION
The COVID-19 pandemic has created a unique
situation wherein there have been severe business and
commercial disruptions, affecting all sectors. The
coordinated industry responses have been deemed
necessary to deal with the issues such as demand or
supply chain disruptions and shortages of essential
products and services. The authorities are, in turn, also
faced with the challenging task of determining and
ensuring that the businesses in the implementation of
collaborative projects to tackle the crisis do not take
advantage of the situation by engaging in anti-
competitive conduct.
‘It has been acknowledged by authorities and industry
experts in general that next to Government
interventions, co-operation between private firms may
be one of the easiest and fastest way to address one
major short-run market failure characterizing this
particular crisis: the sudden and severe disconnect
between demand and supply. The mutual agreements
between private competitive parties has been deemed
to effectively overcome shortages of essential products
and fix disruptions of supply or logistics chains, without
any need for State intervention or other costly 1remedy’. The competition authorities of various
countries throughout the world have acknowledged
that certain conduct that may, under normal
circumstances, be anti-competitive could be allowed at 2least on a temporary basis. Such tailoring and softening
of existing anti-trust principles may allow for a more
flexible response to the crisis. The basis of competition
law is to promote fairness and transparency in a market
economy so that each entity (market player) can
compete with another player in a fair and judicious
manner. The framework for each country regarding
anti-trust laws (competition laws) have been drafted
accordingly and the author has tried, as a sample, to
analyze two of such jurisdiction namely, India and the
European Union.
Analytical Framework of the Risks that are Posed by
Cooperation between Competitors
In real-time, business models that are followed by
various commercial entities, the restrictive horizontal
practices may reduce actual or potential competition,
firms’ ability and incentives to compete and thus
increase the likelihood of collusive outcomes and lastly,
put the parties’ actual or potential competitors at a
disadvantage leading to market foreclosure. For
example, in times of a severe crisis such as the one
provoked by COVID-19, co-operation between
competing firms may benefit consumers in many ways,
such as, by assuring an essential service (e.g., transport)
or by distributing scarce but essential goods (e.g.,
maintaining the food chain). Co-operation may be
necessary in research and development projects related
to the development of vaccines and medicines,
activities which can entail substantial investments and
risks for a single firm. For these reasons, such practices
are often subject to close scrutiny by competition
authorities. Competition authorities consider
horizontal practices as by object or per se infringement
or as restriction by effect depending on their nature. For
the most serious infringements the authorities apply an
object approach, which makes it easier to prove the
anti-competitive nature of the conduct but, at the same
time, makes it more difficult or unavailable for firms to 3argue that the conduct creates efficiency gains. Such
efficiencies are more easily considered for other (non-
hardcore) forms of co-operation between competitors.
This framework remains valid throughout the Covid-19
crisis.
Legal Framework of the Competition Law in India
The legal framework in India regulates a free and fair
market and controls anti-competitive practices as under
Competition Act, 2002. (Hereinafter, ‘the Act’)
‘The objective of the Act can be further gathered from
its preamble which states as follows - ‘An act to provide,
keeping in view of the economic development of the
country, for the establishment of a Commission to
1. Co-operation between competitors in the time of COVID-19. available at: www.oecd.org/daf/competition/
Co-operation-between-competitors-in-the-time-of-COVID-19.pdf
2. OECD Competition Policy Responses to Covid-19 (2020), available at:https://read.oecdilibrary.org/
view/?ref=130_130807-eqxgniyo7u&title=OECD-competition-policy-responses-to-COVID-19.
3. ‘Co-operation between competitors in the time of COVID-19’, OECD(2020), Available at:
https://www.oecd.org/competition/Co-operation-between-competitors-in-the-time-of-COVID-19.pdf

Whether Competitor Collaboration During Pandemic Amounts to Anti-Competitive ConductPROFESSOR’S DESK
YOUTHINK l 2022 l Vol. XVI 350
prevent practices having adverse effect on competition,
to promote and sustain competition in markets, to
protect the interests of consumers and to ensure
freedom of trade carried on by other participants in 4markets, in India...’’
Section 3 of the Act states that any agreement which
causes or is likely to cause an Appreciable Adverse
Effect on Competition (AAEC) in India is deemed anti-
competitive. Section 3(1) of the Act prohibits any
agreement with respect to ‘production, supply,
distribution, storage, and acquisition or control of goods
or services which causes or is likely to cause an
appreciable adverse effect on competition within 5India’ .
In light of the above understanding in law, let us now
analyze the fact that if due to a pandemic situation or
any other unforeseen situation, if multiple competitors
manufacturing identical or similar products enter in an
arrangement whereby, they would mutually collaborate
for better logistics and storage support owing to the
limited resources.
CASE STUDY 1
‘A’, a public limited company manufacturing Fast
Moving Consumer Goods (FMCG) products situated
mainly in North India enters into an arrangement with
‘B’ and ‘C’ which are other public limited companies,
who are manufacturing identical or similar products
situated mainly in West India. Due to the coronavirus
pandemic, they agree to help each other in logistics and
storage support for proper distribution and carrying the
contractual obligations to its customers within the
allotted time lines. The question arises that whether
such arrangement between the parties would amount
to anti-competitive agreement/practice.
The author is of the view that in the above case study,
the said arrangements are not falling under the scope of
anti-competitive agreement, as given in the definition
of Section 3 of the Competition Act, 2002 and
correspondingly not falling within the purview Section
4(2)(c), which states that a dominant enterprise is
abusing its dominant position, if it: ‘indulges in practice
or practices resulting in denial of market access in any
manner’, because as per the case study there is no use
of dominant position by any of the enterprises. It has
already been explained that Section 3(1) of the Act
prohibits any agreement with respect to ‘production,
supply, distribution, storage, and acquisition or control
of goods or services’, which causes or is likely to cause
an appreciable adverse effect on competition within
India. The essentials for the above provisions therefore
are following:
A. any agreement with respect to ‘production, supply,
distribution, storage, and acquisition or control of
goods or services’
B. The same ought to cause appreciable adverse effect
on competition within India.
In the above case study, the essential no. (A) is being
satisfied but the essential of clause (B) i.e., the
arrangement causing appreciable adverse effect on
competition (hereinafter referred as ‘AAEC’) within
India is not satisfied. It is to be appreciated that although
the Act does not define AAEC and nor is there any
thumb rule to determine when an agreement causes or
is likely to cause AAEC, Section 19(3) of the
Competition Act, 2002 specifies certain factors for
determining AAEC under Section 3 namely:
a. creation of barriers to new entrants in the market;
b. driving existing competitors out of the market;
c. foreclosure of competition by hindering entry into
the market;
d. accrual of benefits to consumers;
e. improvements in production or distribution of
goods or provision of services;
f. promotion of technical, scientific and economic
development by means of production or
distribution of goods or provision of services.
The language in section 19(3) states that the
Competition Commission of India (CCI) shall have ‘due 6regard to all or any’ of the aforementioned factors. In
general, it can be analyzed that the collaboration would
be mostly between players producing identical items
entering into horizontal agreements. Therefore, as per
4. Competition Law in India.A report on Jurisprudential Trends. available at: http://www.nishithdesai.com/
fileadmin/user_upload/pdfs/Research%20Papers/Competition_Law_in_India.pdf
5. The Competition Act. 2002. Available at: https://www.cci.gov.in/sites/default/files/cci_pdf/
competitionact2012.pdf

PROFESSOR’S DESKWhether Competitor Collaboration During Pandemic Amounts to Anti-Competitive Conduct
YOUTHINK l 2022 l Vol. XVI351
Case Study 1, since there is a genuine need for
collaboration to carry on its business obligation using
each other’s organizational logistics, machinery and
other means among themselves and as such none of the
above indicators seem to be attracted. Therefore, such
collaboration among competitors, taking into effect
such exceptional circumstances, is not amounting to
AAEC as per Section 3 of the Competition Act, 2002.
Once we have analyzed the above case study, let us also
examine a second case study.
CASE STUDY 2
‘A’, a public limited company manufacturing FMCG
products situated mainly in North India enters into an
arrangement with only one of its competitors namely‘B’
which is another company (who is manufacturing
identical or similar products situated mainly in West
India) whereby, they agree to help each other in logistics
and storage support for proper distribution and carrying
the contractual obligations to its customers, within the
allotted timelines due to the disruptions caused in
corona pandemic. On the other hand, when ‘C’
another smaller company manufacturing identical
products approaches both these companies for similar
arrangement for its own logistical support and they
refuse and ensure that this company does not get any
such support from others in the same industry thereby,
causing disruption in the business of company ‘C’. In
this also, again the question arises that whether such
arrangement between the parties would amount to
anti-competitive agreement/practice.
The author is of the view, that Case Study 2 is a case of
anti-competitive agreement as per Section 3 of the
Competition Act, 2002, since the above would have
AAEC and it attracts Section 4(2)(c), which states that a
dominant enterprise is abusing its dominant position, if
it: ‘indulges in practice or practices resulting in denial of
market access in any manner’, which is conducted by
company A and B against company C. It is to be noted
that horizontal agreements relating to activities referred
to under Section 3(3) of the Competition Act, 2002‘, are
presumed to have an AAEC within India. Section 3(3) of
the Act provides that agreements or a ‘practice carried’
on by enterprises or persons (including cartels) engaged
in trade of identical or similar products are presumed to
have AAEC in India if they-
?Directly or indirectly fix purchase or sale prices;
?Limit or control production, supply, markets,
technical development, investments or provision of
services;
?Result in sharing markets or sources of production or
provision of services; 7
?Indulge in bid-rigging or collusive bidding.’
‘The first three types of conducts may include all firms in
a market, or a majority of them, coordinating their
business, whether vis-à-vis price, geographic market, or
output, to effectively act like a monopoly and share the 8monopoly profits accrued from their collusion.’ In Case
Study 2, the said arrangement aims to limit and control
the supply of goods from its competitor by two major
players of a geographical region in India. Therefore, the
refusal to treat all its competitors similarly and providing
a level playing field to all similar players within identical
product industry would amount to an anti-competitive
agreement.
It is therefore to be appreciated that even though the
two case studies are having pretty similar facts but the
observation for case study 1 is that there is no anti-
competitive arrangement or competitor and abuse of
dominant position but for Case Study 2, where the
benefit of collaboration is being denied to one player,
with an aim to restrict his operations and market reach
then that would amount to anti-competitive agreement
and abuse of dominant position within the legal
framework of competition law.
Advisory of Competition Commission of India (CCI)
Acknowledging the Disruption in Supply Chains
Caused by COVID-19
Once we have analyzed the practical case studies, the
author would also like to point out and it ought to be
counted that the Competition Commission of India
(CCI) has issued an advisory dated 19th April, 2020
acknowledging the disruption in supply chains caused
by COVID-19 and recognises that businesses may need
to coordinate certain activities to deal with the adverse
effects of COVID-19 and ensure fair and continuous
distribution of products. The CCI advisory mentions
6. ibid
7. ibid

Whether Competitor Collaboration During Pandemic Amounts to Anti-Competitive ConductPROFESSOR’S DESK
YOUTHINK l 2022 l Vol. XVI 352
that the Competition Act has in-built safeguards to
protect businesses from sanctions i.e., coordinated
arrangements which result in increase in efficiencies. It
mentions that Section 19(3) of the Competition Act
enables the CCI to have due regard, amongst others, to
the accrual of benefits to consumers, improvement in
production or distribution of goods or provision of
services and promotion of technical, scientific and
economic development by means of production or
distribution of goods or provision of services. The CCI
has in its advisory also cautioned companies to not take
advantage of COVID-19 crisis and indicated that only
such coordinated conduct of businesses, which is
necessary and proportionate to address the COVID-19
crisis, would be considered. In other words, the CCI has
cautioned against opportunistic collaborations by
enterprises seeking to take advantage of the crisis as
against collaborating to overcome the effects of the
crisis in the larger public interest.
Therefore, the above advisory also points out that
coordinated effort to counter COVID-19 disruptions is
not breach of the provisions of Competition Act, 2002,
but opportunistic collaborations by enterprises seeking
to take advantage of the crisis as against collaborating to
overcome the effects of the crisis, in the larger public
interest, is barred by law and would be taken note of by
the CCI. (As given in Case Study 2)
Impact of Fair Collaboration: A Template for
Sustainable Future
It is an established fact that the in the European Union
(EU), the European Commission and national
competition authorities have been highly suspicious of
any activity that brings competitors or even potential
competitor into contact with each other. The main
principle under EU law that we need to analyze while
investigating prohibition of anti-competitive practices is
Article 101(1) of the Treaty on the Functioning of the EU
(hereinafter referred as ‘TFEU’), which prohibits
agreements and practices between competitors that 9could do harm to competition.
It is to be noted that Article 101(3) of the TFEU has
recognized that there are certain restrictive agreements
or practices which may be permissible if they lead to
improvements or efficiencies in the market, or promote
technical or economic progress. The said article
provides that they allow consumers a fair share of the
resulting benefit, and do not impose restrictions that are
not indispensable or that eliminate competition for a
substantial part of the products involved. It is to be
considered that the anti-trust law in the EU framework
has changed in almost 20 years since self-assessment of
companies' compliance with the agreements and
practices in Article 101(1) were introduced. It has
become, intentionally, far more economics focussed
and legal authorities have taken into account the
additional flexibility for business corporations. In
addition to the above restriction, it is also to be pointed
out that Article 101(1) includes an 'ancillary restraints'
doctrine, which recognizes that certain restraints do not
restrict competition, if they are required to protect
parties' legitimate interests. During the recent global
pandemic, there were disruptions caused in the supply
chain mechanisms of every corporate entity, the
European Commission has also allowed certain
relaxations to such entities and has published a
Communication, setting out a temporary framework for
assessing anti-trust issues related to business co-
8. Compet i t i on Law in Ind ia . A repor t on Ju r i sp ruden t i a l Trends . Ava i l ab le a t :
http://www.nishithdesai.com/fileadmin/user_upload/pdfs/Research%20P apers/Competition_Law_in_India.
9. Refer to Article 101 reads as - ‘(1) The following shall be seen as incompatible with the internal market: all
agreements between undertakings, decisions by associations of undertakings and concerted practices which
may affect trade between Member States and which have as their object or effect the prevention, restriction or
distortion of competition within the internal market, and in particular those which:
(a) directly or indirectly fix purchase or selling prices or any other trading conditions;
(b) limit or control production, markets, technical development, or investment;
(c) share markets or sources of supply;
(d) apply dissimilar conditions to equivalent transactions with other trading parties, thereby placing them at
a competitive disadvantage;
(e) Make the conclusion of contracts subject to acceptance by the other parties of supplementary
obligations which, by their nature or according to commercial usage, have no connection with the
subject of such contracts.

PROFESSOR’S DESKWhether Competitor Collaboration During Pandemic Amounts to Anti-Competitive Conduct
YOUTHINK l 2022 l Vol. XVI353
operation, in response to situations of urgency
stemming from the current COVID-19 outbreak.
Usually, business co-operation which aims at allocating
production or exchanging sensitive information is
considered as anti-competitive.
On one hand, COVID-19 EU framework sets out the
main criteria that European Commission will follow to
assess crisis cooperation by taking into consideration
the actual degree of interaction between companies.
The European Commission points out that business
cooperation through trade associations should not raise
any difficulties under EU competition law, if it is subject
to sufficient safeguards as set out in the Commission's
guidelines on the applicability of Article 101 of TFEU to
horizontal cooperation agreements. However, if
companies wish to go further in their co-operation, it
should be:
?objectively necessary to increase the production of
essential products in the most efficient way;
?limited in time, i.e., to be applied only as long as
there is a risk of shortage or in any case during
COVID-19;
?proportionate to achieve the objective of addressing 10or avoiding the shortage of supply.
In near future beyond this pandemic, ‘it is evident that
competitor collaboration is one of the major weapons
in a great arsenal of options that will be needed to face a
threat as pervasive and systemic as the climate crisis,
and to realise the United Nations (UN) Sustainable
Development Goals (SDGs) that are needed to address 11this and other fundamental global issues.’
It is to be considered that ‘co-operation between
companies has the potential to effect real change.
Systemic risk requires a systemic response and
companies' understandable reluctance to engage in
collaborative efforts for fear of first-mover disadvantage
will inevitably hinder innovation. The coronavirus
outbreak has demonstrated that competitor
collaborations can be beneficial, and also that
competition regulators can be flexible and show both
dynamism and common sense, when faced with a
sufficiently serious threat. The reaction to COVID-19
could well provide a template for an approach to
sustainability justified competitor cooperation, and the
flexibility shown by anti-trust regulators is encouraging.
The European Commission, for example, has
demonstrated an implicit recognition that the approach
to assessing the effects of potentially restrictive
agreements and their benefits for technical and
economic progress and for consumers can evolve
beyond pure economic welfare considerations to
include environmental, social and societal objectives.
That is not to say that the pandemic has provided a pre-
packaged solution that can be perfectly transposed to
help achieve sustainability goals. Regulators' efforts so
far were necessarily reactive to the particular nature of
the COVID-19 crisis, and nominally temporary. The
immense challenge of climate change and the
commitment made by many companies to work
meaningfully to achieve the UN SDGs requires a pre-
emptive, more permanent solution.
In Europe, the Commission has now at least recognized
in the corona virus context that self-assessment does not
provide sufficient legal certainty for companies seeking
to develop and implement novel ideas requiring
cooperation and cost-sharing with other competitors.
The return to a comfort letter procedure is not a
panacea, as there is unlikely to be sufficient
administrative capacity to handle the number of
requests the Commission could expect to receive.
However, it is at least a starting point, and could be
(2) Any agreements or decisions prohibited pursuant to this article shall be automatically void.
(3). The provisions of paragraph 1 may, however, be declared inapplicable in the case of: any agreement or
category of agreements between undertakings, any decision or category of decisions by associations of
undertakings, any concerted practice or category of concerted practices, which contributes to improving
the production or distribution of goods or to promoting technical or economic progress, while allowing
consumers a fair share of the resulting benefit, and which does not:
(a) impose on the undertakings concerned restrictions which are not indispensable to the attainment of
these objectives;
(b) afford such undertakings the possibility of eliminating competition in respect of a substantial part of the
products in question
10. Paragraph 15 of the COVID-19 EU Framework
11. Covid-19 and Antitrust Competition. Available at: https://www.whitecase.com/.i

Whether Competitor Collaboration During Pandemic Amounts to Anti-Competitive ConductPROFESSOR’S DESK
YOUTHINK l 2022 l Vol. XVI 354
extended to provide a way for companies to protect
themselves, particularly for novel or far-reaching
initiatives.
At the very least, concrete guidance is needed from the
Commission and other competition authorities on how
they will treat agreements and practices, which are put
in place for environmental or sustainability purposes.
Agreements among competitors to develop and adhere
to high environmental or welfare standards, or
information sharing mechanisms to reduce
environmental impacts should not fall at the hurdle of
competition law: nor should companies be able to
point to the competition law risk as a justification for
failure to move on to sustainability initiatives. Explicit
direction on how the wider societal benefits of
cooperation agreements will be assessed is necessary,
including detail on the kind of evidence that will be
required to demonstrate the benefits of an initiative for
it to be permitted under Article 101(3). This involves a
movement away from a strictly economic review of
consumer welfare towards a more holistic
understanding of the concept. The Commission
recently began a review of its horizontal cooperation
guidelines and the two exemptions currently in place
are for certain research and development and
specialization agreements. This is an ideal opportunity
for a full-scale review of the current landscape. A block
exemption covering certain sustainability focussed
agreements would provide companies with the kind of
practical, legal certainty on collaborative initiatives they
need, while also leaving scope for self-assessment and
the possibility for comfort letters to be sought in
exceptional circumstances for something falling outside 12the block exemption guardrails.’
CONCLUSION
The author concludes that in a pandemic situation or in
case of any other global emergency situation where
mutual cooperation among market players are anything
but logical then such cooperation/ collaboration ought
to be promoted, as is evident from the advisory of the
CCI, provided the main principles of competition law
are maintained, i.e., adverse effect on competition, to
promote and sustain competition in markets, to protect
the interests of consumers and to ensure freedom of
trade. The main test to consider an arrangement as anti-
competitive is whether the same is having any adverse
effect on competition of the particular relevant market
of goods or services. If the same is not evident by any
substantial data or proof then such an arrangement is
perfectly alright and may not, in general, raise any
preliminary investigation also from the CCI as is evident
from its said advisory. Further, in analyzing the EU legal
framework and the relaxations given under the same
law, it can be seen that the general trend is that the
regulators have understood that mutual collaboration
among corporations of similar businesses in the time of
pandemic is a feasible option and therefore, with
certain restrictions, has allowed such collaboration
irrespective of the business sector of the said
corporation.
REFERENCES
1. CAMPBELL, BLACK HENRY, ‘BLACK'S LAW DICTIONARY
Definitions of the Terms and Phrases of American and English
Jurisprudence, Ancient and Modern’;4th edition.
2. ‘Co-operation between competitors in the time of COVID-
19’, OECD(2020), Available at: https://www.oecd.org/
competition/Co-operation-between-competitors-in-the-
time-of-COVID-19.pdf
3. Competition Law in India. A report on Jurisprudential
Trends. Available at: http://www.nishithdesai.com/
fileadmin/user_upload/pdfs/Research%20P apers/Competiti
on_Law_in_India.pdf
4. Competitor/Collaborator Analysis Service Grant. Available
at: https://taprootfoundation.org/sites/default/files/whatis
_CCA.pdf
5. COVID-19 and antitrust competition. Available at:
https://www.whitecase.com/
6. Kapoor, N.D., ‘Elements of Mercantile Law’; 29th Edition,
2008.
7. OECD Competition Policy Responses to Covid-19 (2020),
Available at https://read.oecdilibrary.org/view/?ref=
130_130807-eqxgniyo7u&title=OECD-competition-
policy-responses-to-COVID-19.
8. Singh, Avtar, ‘Contract and specific relief’; 12th Edition,
2017.
9. THE COMPETITION ACT, 2002 Avai lable at:
https://www.cci.gov.in/sites/default/files/cci_pdf/competitio
nact2012.pdf.
10. WSG Article: COVID-19: Impact of Force Majeure in Indian
Commercial Contracts - Kochhar & Co. Advocates & Legal
Consultants.
12. bid

PROFESSOR’S DESK
YOUTHINK l 2022 l Vol. XVI355
Role of Communication Language in BusinessDr. Madhu Agarwal AgnihotriAssistant ProfessorDepartment of Commerce
Business
communication
must be a balance
between regional
languages and
English, as this is
how
communication
will foster both
operational
efficiency as well as
global expansion.
ABSTRACT
Communication, as an aspect of business, has been established as an
inevitable factor. At the heart of communication lies language, its most widely
used medium. However, when it comes to the Indian business scenario with
its wide range of linguistic diversity, the role of regional language in business
communication has not been properly articulated. The retail market of India
is valued at $1.1 trillion and boasts of having 40 million participants coming
from diverse linguistic backgrounds (Joshi, 2019). It is very natural that in a
country like India, where linguistic diversity is noted every 15 to 20
Prof. Arkajyoti PanditAssistant ProfessorDepartment of Commerce

Role of Communication Language in BusinessPROFESSOR’S DESK
YOUTHINK l 2022 l Vol. XVI 356
kilometers, there are bound to be market participants
having a wide range of mother tongues (Saba, 2011).
However, in contrast to this scenario, most of the
business processes, transactions, and financial
statements are produced in English; a language that
forms the mother tongue of only 10 per cent of the
entire population (Joshi, 2019). Besides, according to
the National Census Report of 2011, only 28 per cent of
the total population of the country receive their
education in English (Census Report of India, 2011).
Under such a scenario, the need for regional language
as a medium of business communication and
transaction needs to be determined. The use of regional
languages in accounting work has its own benefits.
English is the operational language and is considered a
standard for business communication. However, it has
also been seen that many businesses are running
successfully despite them conducting operations in
their regional language. There are many factors such as
educational qualifications, medium of education and
work experience that affect the language preferred by a
business practitioner. Against this backdrop, the current
research paper tries to assess whether regional
languages used in business communication and general
business transactions like purchase, sale et al., have any
significant role to play. It also analyzes how the use of
regional language facilities helps in customer
satisfaction.
KEYWORDS: Regional Language, Business,
Communication, Linguistic Diversity, Retail Market.
INTRODUCTION
The retail market of India consists of 40 million
participants coming from largely diversified linguistic
backgrounds. This scenario can be said to be an evident
conclusion of variations in the mother tongues present
throughout the country. Moreover, India as a country
portrays linguistic diversity every 15 to 20 kilometers.
However, contrary to the multifariousness of language,
the Indian business scenario has the practice of
producing financial statements and information mostly
in English, a language only 10 per cent of the population
is well versed with (Joshi, 2019).
It is quite obvious that business information must be
communicated with adequate clarity to the market
participants. There must be a thorough understanding
of the same. However, the dominance of English as the
prima facie language of business communication often
leads to ambiguous doubts in the interpretation of
financial statements, particularly by non-English
speakers (Kuiper, 2007). In the background of such
linguistic heterogeneity, if business communication and
preparation of business statements are facilitated
through regional language, then it not only becomes
convenient for the users of accounting information to
interpret but also makes the preparation of accounting
statements easier. It is certain that facts shared through
an unknown language will always be more relevant
when shared through a known vernacular. Accounting
facts, figures and disclosures, being very pertinent to the
stakeholders of trade and business, cannot be an
exception.
The clarity of business communication, no doubt, plays
a significant role in decisions regarding investment,
portfolio management as well as corporate
management. Nevertheless, if such communication
becomes indecisive owing to language barriers, then
this will lead to faulty investments, which will result in
lesser cash flow in the economy. As Indians are better
versed in their regional languages, there is a dire need
for analyzing the utility of regional languages in business
communication, both from the point of view of makers
and users of business statements. In this background,
the current research papers assesses the relevance of
regional language in business communication both at
the intra-and inter-level. The research also tries to
highlight how the presence of regional language helps
in better customer satisfaction through more clarified
communication with them.
LITERATURE REVIEW
A substantial amount of research has been conducted
on the role of communication in business; however,
research on the relevance of regional languages as the
medium of communication in business is rare. Among
the few established pieces of research, mention can be
made of the works of Adair and Okumura (2001), who

PROFESSOR’S DESKRole of Communication Language in Business
YOUTHINK l 2022 l Vol. XVI357
have very vividly pointed out the role of language in
business negotiations, when parties from different
cultures are involved (Wendi L Adair, 2001). The role of
language skills in corporate communication has been
very lucidly explained in the work of Andersen and
Rasmussen (Helle Andersen, 2004). The research work
of Danet B and Herring S highlights the efficiency of the
multi-language facility in e-commerce transactions (B
Danet, 2007). The pros and cons of using English as the
sole language of international transactions have been
provided by Alison Kuiper
in her research paper
published in 2007 (Kuiper,
2007). The role of language
in informal communication
in the business scenario has
been highlighted by the
study of Chien Wen Yuan
(Yuan, 2013). A clear
understanding of the multi-
faceted role of language in
global business transactions has been clearly defined in
the research work of Mary Yoko Brannen and Rebecca
Piekkari (Brannen, 2014). The role of language in
making accounting information lucid enough to be
understood by all can be found in the works of Ximo
Garnell’s ‘Multilingual Information Management’
(Garnell, 2015). A mention must be made of the
laudable study on the impact of accounting software on
business performance by Wickramasinghe M.
(Wickramasinghe, 2017). The role of language in
international business has been vividly stated in the
research paper of Tenzer and Terjesen (Helene Tenzer,
2017). The research on Public Utility Accounting by
Farber B. and McDonnell highlights the need for
accounting to be lucid enough to be understood by
laymen (Farber, 2018). The utility of the multi-language
facilities in government sector business transactions has
been highlighted in the report on ‘Multilingual
Computing and Heritage Computing’ by the Center for
Development and Advanced Computing (Centre for
Development and Advanced Computing, 2019).
The progression of literature review shows an
interesting trend, whereby it can be said that research
on the relevance of language in business
communication started gaining momentum in 2001.
The scenario received further impetus from 2007 to
2015, when research regarding the utility of
multilanguage facilities in corporate communication
was conducted. It was only after 2015 that research
works were conducted to determine the utility of
language in making business communication more
lucid and available to a greater span of population. The
same trend in research can be shown with the timeline
shown in Figure 1.
Figure 1: Relevance of Language in Business Communication Research(Source: Author’s Compilation)
RESEARCH GAP
The role of communication as an effective tool of
business has been very vividly pointed out by many
researchers. It must be remembered that effective
communication takes place only when the process gets
adequate clarity and thorough understanding. In this
regard, the utility of language, which is by far the most
widely used medium for communication, is immense.
However, in India, the tools of business communication
like financial statements, profitability analysis charts et
al., are mostly produced in English, a language in which
only 10 per cent of the population is well versed (Joshi,
2019). Added to this, the massive diversity of language
spread across the entire subcontinent makes it complex
for non-English speakers to interpret business
communication in English. The backdrop calls for a
thorough analysis, which will help realize the
significance of regional language in diminishing the gap
in business communication. If business communication
is facilitated through regional languages, then
communication will be more lucid and widely spread.
Though studies have proclaimed the role of language in
business communication as well as the importance of
communication in the business scenario, a theoretical
relationship regarding the effect of the use of regional
languages in business communication is rare. This very

Role of Communication Language in BusinessPROFESSOR’S DESK
YOUTHINK l 2022 l Vol. XVI 358
aspect forms the agenda for determining the utility of
regional language in business communication.
The second research gap lies in the fact that
accounting practitioners in India have mostly
received their education in vernacular languages
(Saba, 2011). Such groups of practitioners will be
more fluent in business communication using a
language they have been taught. This very reason
also calls for assessing the utility of regional
languages in business communication.
RESEARCH OBJECTIVE
?To assess the utility of regional languages in
facilitating business communication.
?To understand the role of business communication
in regional languages to meet customer satisfaction.
RESEARCH METHODOLOGY
The paper uses primary data collected from 112
respondents who have been associated with business or
accounting professions for at least six months in the
state of West Bengal. As financial statements of business
enterprises are the main source of communication
regarding the enterprise’s financial health, the opinions
of accounting professionals, who are well-versed in the
preparation of these statements have been taken into
account. The selection of the respondents was done
using the Snowball sampling technique. For the
convenience of the research, the respondents were
classified into three categories based on their work
experience, as shown in Table 1. All the respondents
were asked 20 questions, divided into two sets. In the
first set, ten questions regarding their personal
information like the medium of education, educational
qualification et al., were asked. In the next set, nine
questions were asked to the respondents, where they
had to use Likert’s 5-Point scale to express the degree to
which they agree to a particular question. These nine
questions subsequently formed the variables for the
research. The analysis was conducted using the method
of descriptive statistics, whereby the mean score for
each variable of each category of respondents was
studied to determine the degree of agreeability of that
category of respondents towards that concerned
variable. The findings are shown numerically in Table 2
and graphically in Figure 2.
Category Work ExperienceNo. of
Respondents
Category I Six months to five years 48
Category IIMore than five years and
up to ten years38
Category III More than ten years 26
Total 112
Table 1: Categories of Respondents(Source: Primary Data)
ANALYSIS
The mean score for each category of respondents,
pertaining to each variable, as well as the overall mean
score for each variable are shown in Table 2. A category
having a greater mean for a particular variable
symbolizes a greater degree of agreeability towards that
variable.
The mean score of each of the respondent categories as
well as the overall mean score is graphically represented
in Figure 2.
INFERENCE
A primary study of Table 2 and Figure 2 proves that
almost all the categories of respondents are in favor of
using a regional language as a mode of business
communication. The high overall mean score of each
variable (in most cases, is four or above on a scale of one
to five) proclaims the respondents’ high degree of
agreeability for using a regional language over English,
when it comes to business communication and
transactions. However, a deeper insight into and
analysis of each category of respondents is necessary for
the concluding remarks.
Inference from Respondent Category I:
The youngest set of respondents agree that regional
languages are relevant in business communication.
Their high score of more than 3.5 in almost all the cases
has proved this beyond doubt. However, it must be
understood that the degree of agreeability of this
category, for all of the variables, is less than that of the

PROFESSOR’S DESKRole of Communication Language in Business
YOUTHINK l 2022 l Vol. XVI359
Sr. No.
Variables
Mean Score of Each Category of Respondents
Overall Mean
Score for Each Variable
Six Months to Five Years
Above Five
Years and up to
Ten Years
Above Ten
Years
Vr.1For internal communication,
a regional language is preferred over English.
3.43 4.54 4.20 4.06
Vr.2For external communication,
a regional language is preferred over English.
4.06 4.19 3.90 4.05
Vr.3
Accounting statements prepared in a regional
language help in retrieving classified information by the
Auditor.
4.10 4.31 4.05 4.15
Vr.4
Preparation of business documents in a regional language helps in better communication with the
supplier.
4.12 4.45 4.2 4.25
Vr.5
Invoices in a regional language are more preferred
by customers than those prepared in English.
3.23 4.34 4.03 3.87
Vr.6
Quotations in a regional language are more
convenient over quotations prepared in English.
4.30 4.37 4.3 4.32
Vr.7
Payback terms, customer reward or any incentive
given in a regional language is more appealing to
customers than the same conveyed in English.
3.75 4.75 4.2 4.23
Table 2: Mean Score Obtained by Each Category of Respondents for Each Variable(Source: Primary Data)
other categories, as well as less than the overall average,
in most of the cases. It is only when it comes to the
preparation of quotations in regional languages that
respondents in this category agree, being at par with all
the others. The mean score of 4.3, in this case,
proclaims the same.
Inference from Respondent Category II:
This group is the one that has favoured the utility of
regional language in business communication to the
greatest extent. In almost all the cases, their mean score
is greater than the overall
average mean score, which
very clearly signifies their
affinity towards using a
regional language over
English as the mode of
business communication.
Inference from Respondent
Category III:
The third category of
r e s p o n d e n t s i s a b i t
indifferent regarding the use
of regional language as the
m e d i u m o f b u s i n e s s
communication. They are
the most experienced of the
lot and strongly believe that
when it comes to internal
communication, regional
languages do help. However,
their scores of agreeability
dramatically reduced when it
came to the question of using
regional languages for
external communication.
FINDINGS
The inferences obtained
from the responses of all the
categories of respondents
have confirmed beyond
doubt that all of them favour
regional language as a mode
of business communication.
However, there has been a
fair amount of diversity in the
responses, which instigates the need for finding the
reason for the same along with the need for a detailed
discussion on the responses of each category of
respondents.
Findings Pertaining to Category I:
The respondents of Category I have agreed that it is
convenient to use regional languages as a mode of
business communication, but their degree of
agreeability is a little less as compared to the other

Role of Communication Language in BusinessPROFESSOR’S DESK
YOUTHINK l 2022 l Vol. XVI 360
categories. On exploring the reason, it was found that
most of the respondents in this category have received
their education in English and are more comfortable
with accounting and business terms in English. The very
fact that they disregard the preparation of financial
statements in regional languages is because they believe
that their entire education, having been in English, and
which makes it difficult for them to decipher accounting
terms in a regional language. However, this category
strongly believes that regional languages are preferred
when it comes to external communication. They
believe that all the readers of the financial information
may not be well versed with accounting terms in English
and this language may pose a problem for them.
Findings Pertaining to
Category II:
This group has favored the
use of regional language in
business communication to a
greatest extent. This category
is more experienced than
Category I and has dealt with
a g r e a t e r n u m b e r o f
customers. As a result, their
opinions are more customer-
centric. The group opined
that customers are better off
if accounting information is
explained to them in a
regional language rather than
in English. They believe that
t h i s w o u l d h e l p t h e
customers to be at ease with
the company and assist the
company in brand value
creation. Moreover, most of
the respondents in this
category have received their
education in a vernacular
language and were less
a c q u a i n t e d w i t h t h e
accounting software in which
the language of operation is
mostly English. They firmly
believe that the presence of a
regional language facility in
accounting software would be more convenient for the
progress of any business.
Findings Pertaining to Category III:
Category III comprises of the most experienced
respondents who have handled more clients than
anyone else. According to these candidates, a regional
language is, indeed, necessary for business
communication, but when it comes to international
business, there must be a common language for
communication and English serves the purpose. This
group concludes that there must be a balance between
English and regional languages when it comes to
business communication. The reason for such a
perspective is that this group of respondents has
Figure 2: Graph Showing the Mean Score of Each Category of Respondents and the Overall Mean Score(Source: Primary Data)

PROFESSOR’S DESKRole of Communication Language in Business
YOUTHINK l 2022 l Vol. XVI361
become well versed in English during their tenure of
work. Moreover, these respondents possess the
knowledge of regional languages as well. This group’s
client and colleague base have more diversity than the
previous two groups. To them, business communication
and customer satisfaction can be ensured both by
regional languages and English, depending on the
sphere of accounting concerned.
CONCLUSION
The utility of regional languages in business
communication has been proven, without doubt, after
taking into account the opinions of the respondents.
But the utility and practicality of the use of a regional
language alone as a medium of communication is
debatable. Operational efficiency does require clarity
among the members of the internal environment of a
business, but when the question of global expansion
arises, the importance of English, the most widely used
language for business communication, crops up.
For the users of financial data, clarity is a must.
However, as most of the financial statements are
produced in English, a language in which only 10 per
cent of the population is well versed (Joshi, 2019), the
need for preparing statements in regional languages is
extremely essential to bridge the gap of business
communication.
Accounting information, being highly relevant for
decision making, the need for clarity of such
information is extremely essential for investors. It is
evident that for the non-English speaking investors,
information produced in regional languages will have
more clarity than the same produced in English. This
very aspect highlights the utility of regional languages in
business communication. However, when it comes to
the translation of accounting terms in regional
languages, the information becomes complex. This is
because professional accounting terms are better
conceived in English rather than in a regional language.
This phenomenon proclaims that business
communication in a regional language is very
important. However, it does not eliminate the
requirement of English as a mode of communication.
Business communication must be a balance between
regional languages and English, as this is how
communication will foster both operational efficiency
as well as global expansion.
REFERENCES
1. B Danet, H. S. (2007). The Multilingual Internet: Language,
Culture, and Communication Online. Oxford Scholarship
Online.
2. Brannen, M. P. (2014). The Multifaceted Role of Language in
International Business: Unpacking the Forms, Functions and
Features of a Critical Challenge to MNC Theory and
Performance. Journal of International Business Studies.
3. (2011), Census Report of India.
4. Centre for Development and Advanced Computing. (2019).
Multilingual Computing and Heritage Computing.
5. Farber, B. (2018). Public Utility Accounting. American Public
Power Association.
6. Garnell, X. (2015). Multilingual Information Management.
Chandos Publishing.
7. Helene Tenzer, S. T. (2017). Language in International
Business: A Review and Agenda for Future Research.
Management International Review.
8. Helle Andersen, E. R. (2004, September). The Role of
Language Skills in Corporate Communications. Corporate
Communications: An International Journal, 231-242.
9. Joshi, S. K. (2019). Linguistic History and Language Diversity
in India: Views and Counterviews. Journal of Biosciences,
44.
10. Kuiper, A. (2007). English as the Language of International
Business Communication. Business Communication
Quarterly.
11. Saba, N. (2011). Linguistic Heterogeneity and Multilinguality
in India: A Linguistic Assessment of Indian Language Policies.
12. Wendi L Adair, T. O. (2001). Negotiation behaviour when
cultures collide: The United States and Japan. Journal of
Applied Psychology, 86.
13. Wickramasinghi, M. (2017). Impact of Accounting Software
for Business Performance. International Journal of
Information System and Engineering, 6 (1), 1-26.
14. Yuan, C. W. (2013). Understanding Informal
Communication in Multilingual Contexts. ACM Conference
on Computer Supported Cooperative Work.

LOOKING BACK
YOUTHINK l 2022 l Vol. XVI 362
Living through the Timeless TreasuresMegh Gupta and Yash HaralalkaJoint SecretariesXavier’s Commerce Society
A place where
dreams thrive,
development
bolsters and
destiny is
moulded, this is
where we find
peace and where
our hearts reside -
this is our home,
the Xavier’s
Commerce
Society.
We walked through the doors of St. Xavier's as complete strangers, unaware
of what was lying ahead of us, filled with doubts and anxiety. However within
a few months, we depart as individuals embodied with a feeling of conviction
and perseverance. We never thought that what started off as only attending
early morning classes and seminars would eventually finish like this, leaving
us with countless memories and experiences to cherish forever.
We still recall seeing a group of passionate individuals wearing black t-shirts
with Xavier's Commerce Society (XCS) imprinted boldly on them, standing
out from the multitude and working tirelessly near the green benches. They
drew our attention right away, and as subsequent events unfolded, the name
XCS continued to arouse an inherent desire to be one of these individuals.
The desire to wear the black t-shirt was not only to flaunt it on our backs, but
also to ignite in us the sense of determination and responsibility that the black
t-shirt evokes.

LOOKING BACKLiving through the Timeless Treasures
YOUTHINK l 2022 l Vol. XVI363
Every person has a strong suit and XCS provides
multifarious opportunities for people to discover their
strengths and fulfill their potential. To be able to
multitask, to advocate for insightful thinking on a
regular basis, to comprehend how to make the right
decisions, and work with utmost focus and zeal, an
XCSer is someone who not only values others but also
embraces constructive criticism. An XCSer is someone
who strives to attain perfection and the epitome of
professionalism in all his endeavours. An XCSer is
someone who is ready to step out of their comfort zone
and prepared to take on unprecedented challenges and
every action taken by an XCSer is for the holistic growth
of the college's students and advancement of the
society. Thereby, it is integrity, discipline, and
dedication that actually constitutes an XCSer.
Our journey as XCSers had its own shares of ups and
downs, with innumerable memories to cherish, and
countless experiences to learn from. Whatever mistakes
we made and what we learnt, we did it as a team; a
team full of countless ideas, willing to transcend the
boundaries of knowledge and striving to accomplish
significant feats. Today, when we reflect back on the
three most incredible years of our lives, we view
ourselves as people who have been instilled with a
sense of professionalism, precision, and passion.
In the first year, our transition from mere students of St.
Xavier’s College to the Working Committee Members
of Insignia 2020, made us realize that our college life
had much more in store for us than we had ever
expected. From being one among the hundreds to
being a part of the society that represented those
hundreds, nothing had ever felt better than to don the
black t-shirt that we had been looking up to for so long.
It is often that our seniors used to tell us, ‘You never
forget your first Insignia.’ At that time, we used to think
that this had everything to do with the scale at which
this business fest was conducted, or with it being the
flagship event of the society. But later, we went on to
realize that the reason one can never forget their first
Insignia is that it is the beginning of a bond shared
between a remarkable group of people, who later go on
to forge friendships that last forever.
As our second-year journey embarked, there were new
responsibilities on our shoulders altogether. With an
increase in the expectations people had from us, we
had now become individuals who represented one of
the most renowned societies of the college. Despite the
many challenges we faced in conducting events
virtually, we left no stone unturned in carrying forward
the 15-year old legacy and in living up to the ideals of
the Xavier’s Commerce Society. Although not being
able to experience what it was like to traverse the
corridors of the college wearing the black t-shirt came as
a disappointment, we never let our enthusiasm and
passion towards the society waver.
The entire shift to the online mode was difficult for all of
us, but we also realized that if we could capitalize on the
advantages that came with this shift, we could continue
our legacy of always staying ahead of others. One can
overcome any adversity as long as the right people are
around to support them. With a team of confident
individuals who always have each other’s back, we
continued to devise innovative ways of overcoming any
hardship that came our way. It is said that one should
never let go of those who stand by them during tough
times, and with everything all of us have gone through
together, we are fairly certain that there is no other
group of people we would have wished for spending
this journey with.
Today, not only do we lead a group of 43 individuals,
but we also represent thousands of those belonging to
the Department of Commerce. It is a matter of great
pride to have so many people look up to you and
respect you, and to have yourself associated with
innumerable events that students look forward to. This
is what the Xavier's Commerce Society has given us, a
sense of belonging and a sense of recognition. The
responsibility we hold does not allow us to give way to
the slightest of errors and has enabled us to keep striving
for excellence in everything, living up to the ideals the
society was based upon, which is something we will
always be grateful for. It seems like yesterday when we
walked into college with a dream, met a group of
wonderful people who continuously strived towards
development, and took a step closer to our destiny by
actually becoming a part of the family we were once
inspired by. With the most inspiring seniors, we could
learn immensely from, an incredible group of
teammates we have shared our memories with, and the

Living through the Timeless TreasuresLOOKING BACK
YOUTHINK l 2022 l Vol. XVI 364
most diligent set of juniors whom we have had the
privilege of mentoring, the entire experience that we
have had with the XCS family will remain etched in our
hearts forever.
For any organization to achieve success, it needs
individuals whose guidance and support helps it
overcome all impediments which it may face in its
journey to be successful. We would like to thank the
President of the Xavier’s Commerce Society, Rev. Dr.
Dominic Savio, SJ, under whose mentorship XCS has
strived to reach the pinnacle of perfection. We are
grateful to Rev. Fr. Joseph Kulandai, SJ, and Rev. Fr. Peter
Arockiam, SJ, for believing in us and encouraging us in
all our endeavours. None of our activities would have
been successful without the support of Dr. Amitava Roy
and Dr. Soheli Ghose who have guided us and
motivated us to perform better. None of our events
would be successful without the support of our
professor-in-charge, Prof. Shaunak Roy, and our
mentor, Dr. Sumona Ghosh. They have been our
constant pillar of support and the backbone of the
society. We are also grateful for the support that XCS
continues to draw from its alumni members. Our
gratitude goes out to the entire faculty of the B.Com
Department and the support staff who have helped us
in all our endeavours. Lastly, we would like to thank the
entire student body of St. Xavier’s College
(Autonomous), Kolkata for their active participation in
all our events and for providing their valuable feedback
which ensures we deliver our best every time.
From an outsider's perspective, we thought XCS would
seem like just any other society and an addition to one’s
resume. But on the inside, to us, XCS is more than just
that, it is a family - a family of 43 individuals having
different ideas, multiple talents, diverse skills, unique
perspectives, and distinct personalities; but each of
them having one common goal - the love and
attachment towards the society and the strive to keep
the flag of XCS flying high.
It would be difficult for any member to define this
society merely through words, because XCS provides
people with an exhilarating journey that they never
seem to forget. XCS cannot just be defined by the events
it conducts or the corporate exposure it provides, it can
be defined by the friendships it nurtures, the adventure
it bestows, and the wisdom it instills. It is said that,
‘There is no other comfort that can be compared to the
comfort of being home.’ A place where dreams thrive,
development bolsters and destiny is moulded, this is
where we find peace and where our hearts reside - this
is our home, the Xavier’s Commerce Society.
Yash HaralalkaMegh Gupta

YOUTHINK l 2022 l Vol. XVI365
TRIBUTE

366
TRIBUTE
YOUTHINK l 2022 l Vol. XVI

YOUTHINK l 2022 l Vol. XVI367
FUN SECTION


Copyright © 2022 FDOKUMEN