OTITIS MEDIA WITH EFFUSION: CURRENT TREATMENT ...
191
III The University of 1t- Nottingham OTITIS MEDIA WITH EFFUSION: CURRENT TREATMENT, NEW UNDERSTANDING OF ITS AETIOPATHOGENESIS, AND A NOVEL THERAPEUTIC APPROACH Matija Daniel BMedSc(Hons) MBChB(Hons) CertMgmt(Open) PGDlpUedEd FHEA FRCS FRCSEd(ORL.HNS) C A ! 1 I f:'iDARY MED I i,·.:j \ QUEENS C[:NTRE Thesis submitted to the University of Nottingham for the Degree of Doctor of Philosophy JULY 2013
-
Upload
khangminh22 -
Category
Documents
-
view
2 -
download
0
Transcript of OTITIS MEDIA WITH EFFUSION: CURRENT TREATMENT ...
III The University of 1t- Nottingham
OTITIS MEDIA WITH EFFUSION:
CURRENT TREATMENT, NEW UNDERSTANDING OF
ITS AETIOPATHOGENESIS, AND A NOVEL
THERAPEUTIC APPROACH
Matija Daniel BMedSc(Hons) MBChB(Hons) CertMgmt(Open) PGDlpUedEd FHEA FRCS FRCSEd(ORL.HNS)
CA ! 1 I f:'iDARY MED I f,"\~,. i,·.:j \
QUEENS ~;EJ.);C!\L C[:NTRE
Thesis submitted to the University of Nottingham
for the Degree of Doctor of Philosophy
JULY 2013
ABSTRACT
Otitis Media with Effusion (OM E) is a common childhood condition leading to
hearing loss, and its treatment with ventilation tubes (VTs) is one of the
commonest surgical procedures. However, aetiology of OME is poorly
understood, and its current treatment requires improvement as OME
frequently recurs once VTs extrude.
The first, clinical part of this thesis showed that 63.6% of children randomised
to VT insertion in a clinical trial will require VTs again, and even with additional
adenoidectomy the need for repeat surgery remains high. Although published
national guidelines set out criteria for surgery, the multicentre study presented
here showed that only 32.2% of children that had VTs met these criteria, and
guidelines' publication had limited impact on clinical practice.
The second, laboratory part of this thesis demonstrated the importance that
bacteria and biofilms play in aetiology of OME, as live bacteria were
demonstrated in 91.9% of middle ear effusions (using culture and confocal
microscopy). Following from this, a Staphylococcus aureus biofilm model was
developed, and used to show that biofilm eradication requires antibiotic
(rifampicin and clindamycin) levels 1,000 times higher than those required to
inhibit planktonic bacteria, over a period of 2-3 weeks. To achieve this in the
middle ear, a local delivery strategy using biodegradable poly (Iactic-co
glycolic acid) antibiotic pellets was proposed. Drug release from these pellets
11

was investigated with High Performance Liquid Chromatography and Serial
Plate Transfer Testing, which demonstrated that antibiotics can be released
for up to 3 weeks. Importantly, the pellets were able to eradicate biofilms in
the in vitro model.
This thesis has shown that current OME treatment has significant deficiencies,
but better understanding of OME pathogenesis raises the possibility of rational
new therapeutic strategies. Biodegradable antibiotic pellets designed to
eradicate OME biofilms may be a better future treatment that could improve
the lives of countless children.
111
ACKNOWLEDGEMENTS
My most grateful thanks go to the following people, whose support,
encouragement, supervision and help during this work were invaluable:
Supervisors: Roger Bayston, John Birchall, Kevin Shakesheff
Internal Assessor: Brigitte Scammell
Project collaborators: Saif AI-Zahid, Neil Fergie, Heather Fortnum, Mark
Haggard
Supportive colleagues
Orthopaedic & Accident Surgery: Waheed Ashraf, Rosemary Brace, Rob
Chessman, Paul Dhillon, Leanne Fisher, Shehla Imtiaz-Umer, Jane McLaren,
Richard Pearson, Brian Richards, Oxana Stevenson.
School of Pharmacy: Dave Barrett, Abdennour Bouhroum, Paul Cooling,
Helen Cox, Christine Grainger-Boultby, Omar Qutachi, Cheryl Rahman
Multicentre NICE OME guidelines team: Sam Cho, Suli EI-Shunnar, Anna
Harrison, Laura Harrison, Marie-Claire Jaberoo, Tawakir Kamani, Seema
Yalamanchili
TARGET team: Mary Gannon, Mark Haggard, Josie Higson, Carl Philpott,
Helen Spencer, Stephen Thomas, Herbie Vaghela
University of Nottingham Advanced Microscopy: Susan Anderson, Emma
King, Marie Smith, Ian Ward, Nicola Weston
Nottingham University Hospital Microbiology Department: Steve Holden
IV
Serial plate transfer testing of antibiotic pellets was performed in conjunction
with Husnah Hussein (doctoral student) and Rob Chessman (BMedSci I
medical student), whose laboratory work was directed and supervised by
myself. Shehla Imtiaz-Umer performed majority of the routine microbiology
identification work on the middle ear effusion clinical samples; I performed
some laboratory work on clinical samples, and then analysed the images,
collated the data, and performed statistical analysis. The original TARGET
data was collected by the TARGET multi-centre team, with my involvement
dealing purely with the supplemental, long-term study in this thesis. With the
exception of above acknowledgements, the thesis represents my own work.
I would also like to express my thanks to the following funders that made this
research possible:
Deafness Research UK
Medical Research Council (Discipline Hopping Grant)
Midland Institute of Otolaryngology
National Biomedical Research Unit in Hearing
Nottingham ENT Foundation
Royal Society of Medicine Otology Section (Norman Gamble Research Grant)
Sir Samuel Scott of Yews Trust
Lastly, I am forever indebted to Vesna, Sam and Peter.
v
TABLE OF CONTENTS
Page Abstract ii Acknowledgements iv Table of contents vi Abbreviations xii 1 PRECIS 1 2 INTRODUCTION 3
2.1 OTITIS MEDIA WITH EFFUSION 3 2.2 CURRENT MANAGEMENT OF OME 9
2.2.1 Ventilation Tubes and NICE guidelines 9 2.2.2 Adenoidectomy 12 2.2.3 Evaluating OME treatment: which children to study and for 15
how long? 2.3 AETIOLOGY OF OTITIS MEDIA WITH EFFUSION 19
2.3.1 Bacteria in OME 20 2.3.2 Other theories of OME aetiology 22
2.4 BACTERIAL BIOFILMS AND THEIR TREATMENT 26 2.4.1 Pathogenesis of biofilm infections 26 2.4.2 Criteria for biofilm infection 29 2.4.3 Studying bacterial biofilms in vitro 30 2.4.4 Treatment of biofilm infections 32 2.4.5 Rifampicin and clindamycin 36
2.5 MODIFIED RELEASE DRUG DELIVERY SYSTEMS 40 2.5.1 Modified drug delivery systems 41 2.5.2 Biodegradable drug delivery systems 45 2.5.3 Novel drug delivery to eradicate biofilms 49
2.6 SUMMARY 53 3AIMS 55
4 THESIS OUTLINE 57
VI
Page
5 CURRENT OME TREATMENT: VENTILATION TUBES AND THE 59 BENEFITS OF ADENOIDECTOMY 5.1 INTRODUCTION 59 5.2 METHODS 63 5.3 RESULTS 68
5.4 DISCUSSION 75
5.4.1 Summary of results 75
5.4.2 Choice of study population 75 5.4.3 Choice of outcome measure 77 5.4.4 Treatment with VTs 78 5.4.5 Adding adenoidectomy to VTs 80 5.4.6 How long should any future OME trial last? 82
5.5 TARGET LONG-TERM STUDY: CONCLUSION 86 6 ARE WE FOLLOWING NICE GUIDELINES ON THE 87
MANAGEMENT OF OTITIS MEDIA WITH EFFUSION?
6.1 INTRODUCTION 87
6.2 METHODS 89
6.3 RESULTS 92 6.4 DISCUSSION 96
6.4.1 Summary of findings 96 6.4.2 Practice in accordance with guidelines 96 6.4.3 Duration of OME 98 6.4.4 Extenuating circumstances justifying surgery 99 6.4.5 Adenoidectomy 100 6.4.6 Limitations 102
6.5 NICE OME GUIDELINES: CONCLUSION 103
VIl
Page 7 BACTERIA IN OME 104
7.1 INTRODUCTION 104 7.2 METHODS 106
7.2.1 Clinical details 106 7.2.2 Bacterial culture 106 7.2.3 Bacterial identification 107 7.2.4 LiveDead stain 107 7.2.5 Confocal microscopy 108 7.2.6 Statistical analysis 108
7.3 RESULTS 110 7.3.1 Verification of canal disinfection 110 7.3.2 Effusion culture and confocal microscopy 110
7.4 DISCUSSION 119 7.4.1 Summary of findings 119 7.4.2 Biofilms in OME 119
7.4.3 Techniques and alternatives 125 7.4.4 Bacterial types in OME 128 7.4.5 OME biofilms in relation to OME natural resolution 129 7.4.6 Implications for glue ear management 132
7.5 BACTERIA AND BIOFILMS IN OME: CONCLUSION 134
viii
Page
8 AN IN VITRO BIOFILM MODEL 135 8.1 INTRODUCTION 135 8.2 METHODS 137
8.2.1 An in vitro biofilm model 137 8.2.2 Scanning electron microscopy 140
8.2.3 Alcian blue stain 140
8.2.4 Confocal microscopy 141
8.3 RESULTS 142 8.3.1 Demonstrating biofilm structure 142 8.3.2 Demonstrating reduced susceptibility to antibiotics 152
8.3.3 Processing of silicone discs for analysis 154
8.3.4 Antibiotics 161 8.3.5 Culture results and the LiveDead stain 162
8.4 DISCUSSION 164 8.4.1 Summary of findings 164
8.4.2 Biofilm structure and reduced susceptibility to antibiotics 164
8.4.3 Processing of biofilm discs 169
8.4.4 Other biofilm models 172 8.4.5 Culture results and the Live Dead stain 176
8.5 BIOFILM MODEL: CONCLUSION 178
9 ERADICATION OF BIOFILMS WITH ANTIBIOTICS 179
9.1 INTRODUCTION 179
9.2 METHODS 181
9.3 RESULTS 183 9.3.1 Eradication of one day old biofilms 184 9.3.2 Eradication of five day old biofilms (5 aureus F 2387) 192 9.3.3 Eradication offive day old biofilms (5 aureus F 2315) 197
9.3.4 Eradication of 14 day old biofilms 201 9.3.5 Eradication of 21 day old biofilms 202 9.3.6 Can one use rifampicin or clindamycin alone rather than 204
both in combination?
9.4 DISCUSSION 205
9.4.1 Summary of findings 205
9.4.2 Confirming biofilm eradication 205
9.4.3 Biofilm eradication and the influence of biofilm age 206
9.4.4 Choice of antibiotics 210 9.4.5 The use of two antibiotics to minimise emergence of 212
resistance 9.4.6 Achieving high antibiotic concentrations in the middle ear 213 9.4.7 Other anti-biofilm strategies 216
9.5 BIOFILM ERADICATION WITH ANTIBIOTICS: CONCLUSION 221
IX
Page
10 BIODEGRADABLE MODIFIED RELEASE ANTIBIOTIC PELLETS 222 10.1 INTRODUCTION 222 10.2 MATERIALS AND METHODS 224
10.2.1 Production of microparticles using the milling method 224 10.2.2 Production of microparticles using the emulsion method 224 10.2.3 Determining the size of the microparticles 225 10.2.4 Production of antibiotic pellets 225 10.2.5 Scanning electron microscopy 227 10.2.6 Measuring density and porosity 227 10.2.7 Sterility assessment 228
10.3 RESULTS 229 10.3.1 Production of microparticles 229 10.3.2 Antibiotic pellets 236 10.3.3 Sterilisation 239
10.4 DISCUSSION 240
10.4.1 Surgical considerations 240
10.4.2 Production of microparticles 244 10.4.3 Sizing of microparticles 249 10.4.4 Production of pellets 252 10.4.5 Choice of modified release device 253 10.4.6 Sterilisation 263
10.5 ANTIBIOTIC PELLETS: CONCLUSION 267
x
Page
11 ANTIBIOTIC PELLETS: DRUG RELEASE AND ANTI-BIOFILM 268 ACTIVITY
11.1 INTRODUCTION 268 11.2 METHODS 271
11.2.1 High-performance liquid chromatography 271
11.2.2 Serial plate transfer test 272
11.2.3 Statistical analysis 273
11.3 RESUL TS 274 11.3.1 High performance liquid chromatography method 274 11.3.2 Drug release from pellets measured with HPLC 286 11.3.3 Antibiotic release measured using serial plate transfer test 309 11.3.4 Pellet weight and diameter 314 11.3.5 Biofilms on pellets 320 11.3.6 Effectiveness of antibiotic pellets in the in vitro biofilm 321
model 11.4 DISCUSSION 322
11.4.1 Summary of results 322 11.4.2 High performance liquid chromatography 322 11.4.3 Choice of modified-release device 325 11.4.4 Antibiotic release 330 11.4.5 Biofilm eradication 333 11.4.6 Further investigations 335 11.4.7 Clinical applications 338
11.5 EFFECTIVENESS OF ANTIBIOTIC PELLETS: 339 CONCLUSION
12 SUMMARY 340
13 PUBLICATIONS AND PRESENTATIONS 343
14 REFERENCES 349
Xl
ABBREVIA liONS
+ad plus adenoidectomy
AOM acute otitis media
CLSM confocal laser scanning microscopy
CSOM chronic suppurative otitis media
dB NHL decibel Normal Hearing Level
OCM dichloromethane
ESZ electrical sensing zone
FAO further active observation
FISH fluorescence In-Situ Hybridisation
HPLC high-performance liquid chromatography
ISA Iso-Sensitest Agar
MBC minimum bactericidal concentration
MBEC minimum biofilm eradication concentration
ME middle ear
MIC minimum inhibitory concentration
MR modified release
NAC N acetyl cysteine
NICE Nice Institute of Clinical excellence
OME otitis media with effusion
OTT obliged to treat
PEG polyethylene glycol
PLG poly(OL-lactide-co-glycolide)
Xli
PLGA
PYA
PV7
RAOM
ReT
RPC
so
SPTT
TARGET
TLT
TM
TSB
VT
poly(lactic-co-glycolic acid)
polyvinyl alcohol
post-visit 7 study
recurrent acute otitis media
randomised controlled trial
reverse phase chromatography
standard deviation
serial plate transfer test
trial of alternative regimens in glue ear treatment
TARGET long term study
tympanic membrane
Tryptone soya broth
ventilation tube (tympanostomy tube, grommet)
xiii
1 PRECIS
Otitis media with effusion (OME, glue ear) is a common cause of hearing loss
in childhood, affecting up to 80% of children at some stage at least for a
limited time period. Treatment with grommets (ventilation tube, VT) insertion is
one of the commonest surgical procedures in children in the developed world,
and over 30,000 VTs are inserted in England each year. However, this
treatment is far from ideal, as up to 25% of treated children have to have
surgery more than once.
Despite its common nature many questions surround OME, and this thesis
aims to address some of the current deficiencies in our knowledge of this
condition and its treatment. In addition to laboratory-based research, the
project also investigates a number of clinical aspects.
The clinical part of the thesis assesses recurrence after grommet extrusion,
and details why further OME research is required. The role of adjuvant
adenoidectomy in reducing need for revision surgery is examined. Current
treatment is guided by the National Institute for Health and Clinical Excellence,
and therefore actual clinical practice is compared with the guidelines, and the
impact of guideline introduction assessed in a multi-centre project.
The main, laboratory-based, part of the thesis starts by consolidating the
existing microbiology data obtained by our group, demonstrating a crucial role

for bacteria and biofilm in OME. Given the new understanding of OME
pathogenesis and the limitations of current treatments, a novel therapeutic
strategy is then explored. This centres on the use of high dose modified
release antibiotics, and this strategy is explored in a newly-developed in vitro
model. A biodegradable antibiotic modified-release pellet is examined,
assessing drug release with High Performance Liquid Chromatography and
with Serial Plate Transfer Testing, and the effectiveness of the pellet against
biofilms is tested in the in vitro model.
2
2 INTRODUCTION
2.1 OTITIS MEDIA WITH EFFUSION
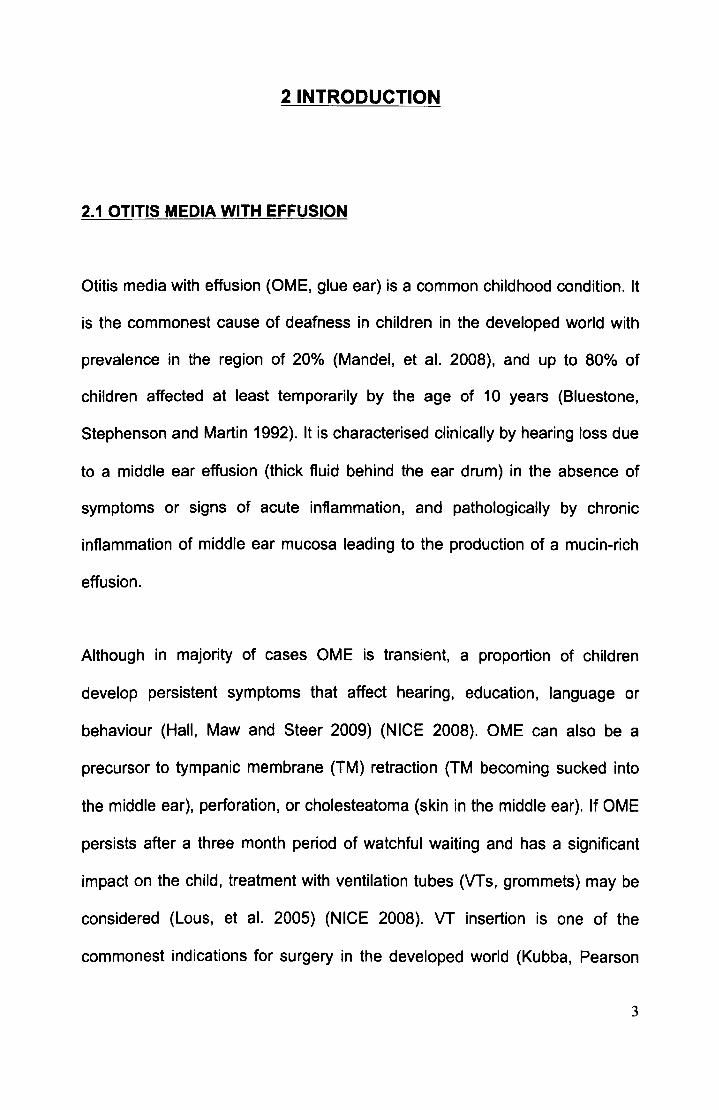
Otitis media with effusion (OME, glue ear) is a common childhood condition. It
is the commonest cause of deafness in children in the developed world with
prevalence in the region of 20% (Mandel, et al. 2008), and up to 80% of
children affected at least temporarily by the age of 10 years (Bluestone,
Stephenson and Martin 1992). It is characterised clinically by hearing loss due
to a middle ear effusion (thick fluid behind the ear drum) in the absence of
symptoms or signs of acute inflammation, and pathologically by chronic
inflammation of middle ear mucosa leading to the production of a mucin-rich
effusion.
Although in majority of cases OME is transient, a proportion of children
develop persistent symptoms that affect hearing, education, language or
behaviour (Hall, Maw and Steer 2009) (NICE 2008). OME can also be a
precursor to tympanic membrane (TM) retraction (TM becoming sucked into
the middle ear), perforation, or cholesteatoma (skin in the middle ear). If OME
persists after a three month period of watchful waiting and has a Significant
impact on the child, treatment with ventilation tubes (VTs, grommets) may be
considered (Lous, et al. 2005) (NICE 2008). VT insertion is one of the
commonest indications for surgery in the developed world (Kubba, Pearson
3
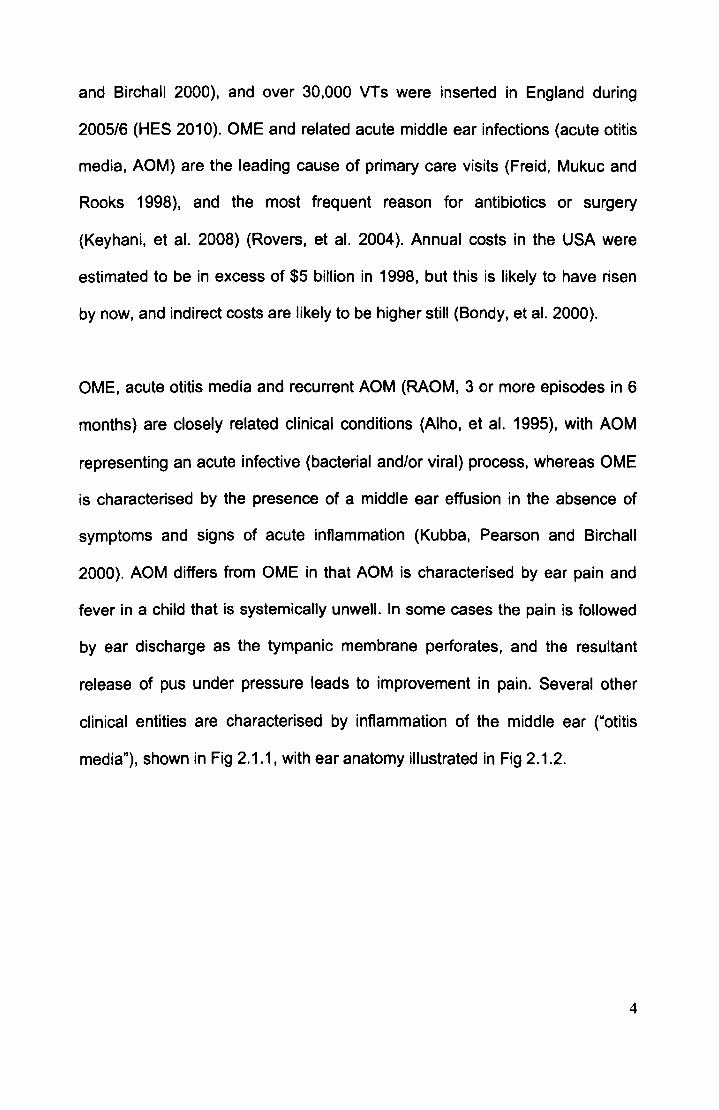
and Birchall 2000), and over 30,000 VTs were inserted in England during
2005/6 (HES 2010). OME and related acute middle ear infections (acute otitis
media, AOM) are the leading cause of primary care visits (Freid, Mukuc and
Rooks 1998), and the most frequent reason for antibiotics or surgery
(Keyhani, et al. 2008) (Rovers, et al. 2004). Annual costs in the USA were
estimated to be in excess of $5 billion in 1998, but this is likely to have risen
by now, and indirect costs are likely to be higher still (Bondy, et al. 2000).
OME, acute otitis media and recurrent AOM (RAOM, 3 or more episodes in 6
months) are closely related clinical conditions (Alho, et al. 1995), with AOM
representing an acute infective (bacterial and/or viral) process, whereas OME
is characterised by the presence of a middle ear effusion in the absence of
symptoms and signs of acute inflammation (Kubba, Pearson and Birchall
2000). AOM differs from OME in that AOM is characterised by ear pain and
fever in a child that is systemically unwell. In some cases the pain is followed
by ear discharge as the tympanic membrane perforates, and the resultant
release of pus under pressure leads to improvement in pain. Several other
clinical entities are characterised by inflammation of the middle ear ("otitis
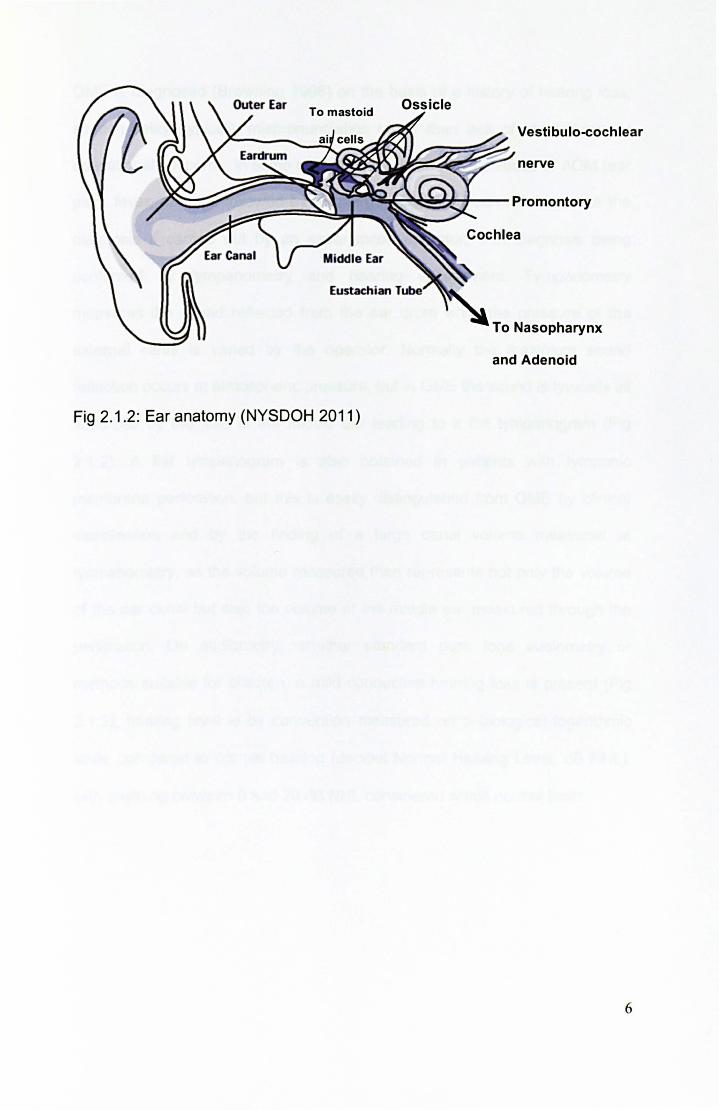
media"), shown in Fig 2.1.1, with ear anatomy illustrated in Fig 2.1.2.
4
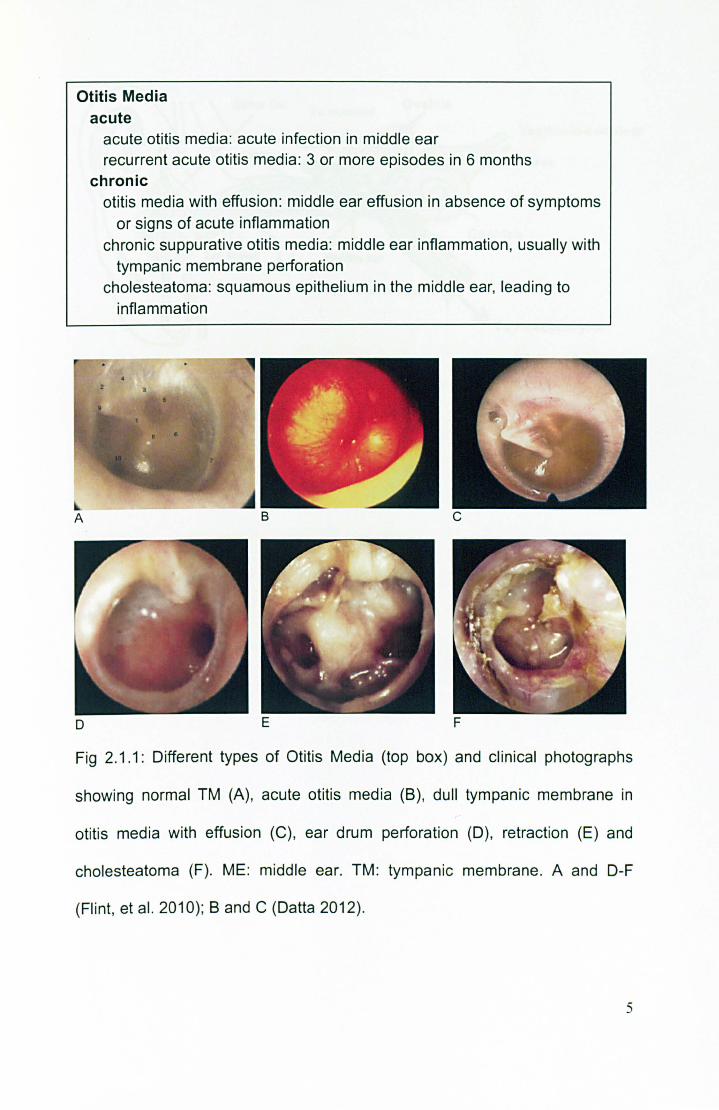
Otitis Media acute
o
acute otitis media: acute infection in middle ear recurrent acute otitis media : 3 or more episodes in 6 months
chronic otitis media with effusion: middle ear effusion in absence of symptoms
or signs of acute inflammation chronic suppurative otitis media: middle ear inflammation, usually with
tympanic membrane perforation cholesteatoma: squamous epithelium in the middle ear, leading to
inflammation
c
E F
Fig 2.1 .1: Different types of Otitis Media (top box) and clinical photographs
showing normal TM (A), acute otitis media (B) , dull tympanic membrane in
otitis media with effusion (C), ear drum perforation (D), retraction (E) and
cholesteatoma (F). ME: middle ear. TM: tympanic membrane. A and D-F
(Flint, et al. 2010); Band C (Datta 2012).
5
To mastoid
Vestibulo-cochlear
nerve
~~~~p~~~,-- Promontory
I---==~~-
Fig 2.1.2: Ear anatomy (NYSDOH 2011)
To Nasopharynx
and Adenoid
6
OME is diagnosed (Browning 1998) on the basis of a history of hearing loss.
speech delay (typically mispronunciation rather than lack of vocabulary). or
educational concerns. in some children associated with episodes of AOM (ear
pain, fever, perhaps followed by discharge). Otoscopy can reliably make the
diagnosis if carried out by an experienced operator. with diagnosis being
confirmed by tympanometry and hearing assessment. Tympanometry
measures the sound reflected from the ear drum while the pressure of the
external canal is varied by the operator. Normally the maximum sound
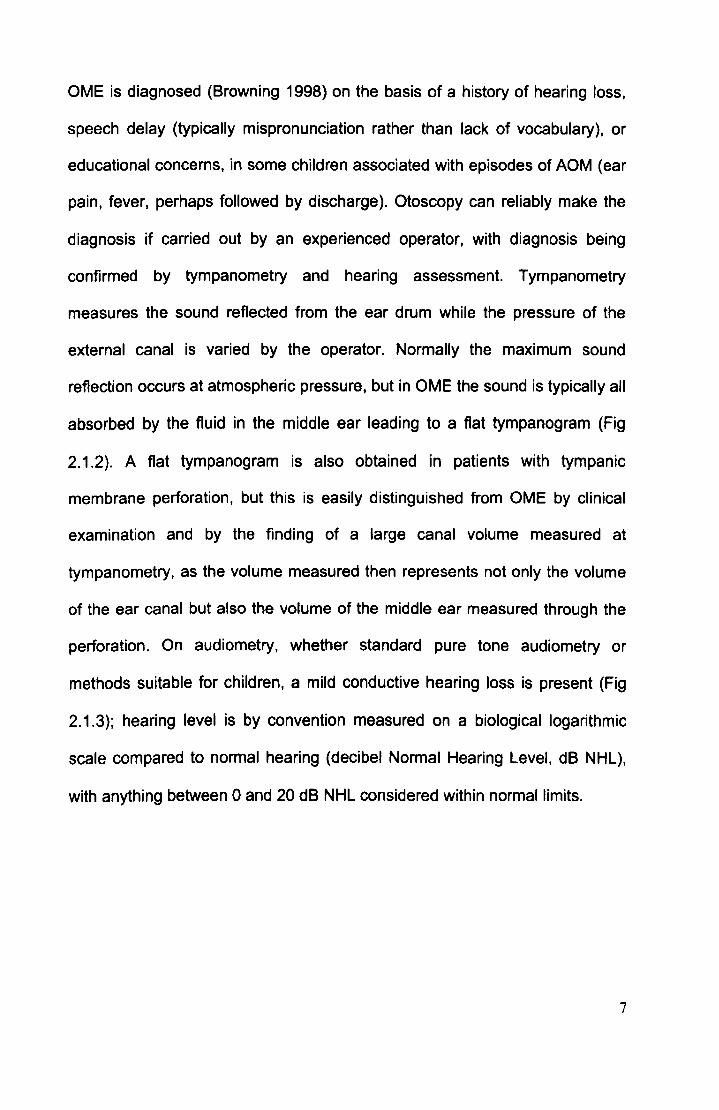
reflection occurs at atmospheric pressure. but in OME the sound is typically all
absorbed by the fluid in the middle ear leading to a flat tympanogram (Fig
2.1.2). A flat tympanogram is also obtained in patients with tympanic
membrane perforation. but this is easily distinguished from OME by clinical
examination and by the finding of a large canal volume measured at
tympanometry. as the volume measured then represents not only the volume
of the ear canal but also the volume of the middle ear measured through the
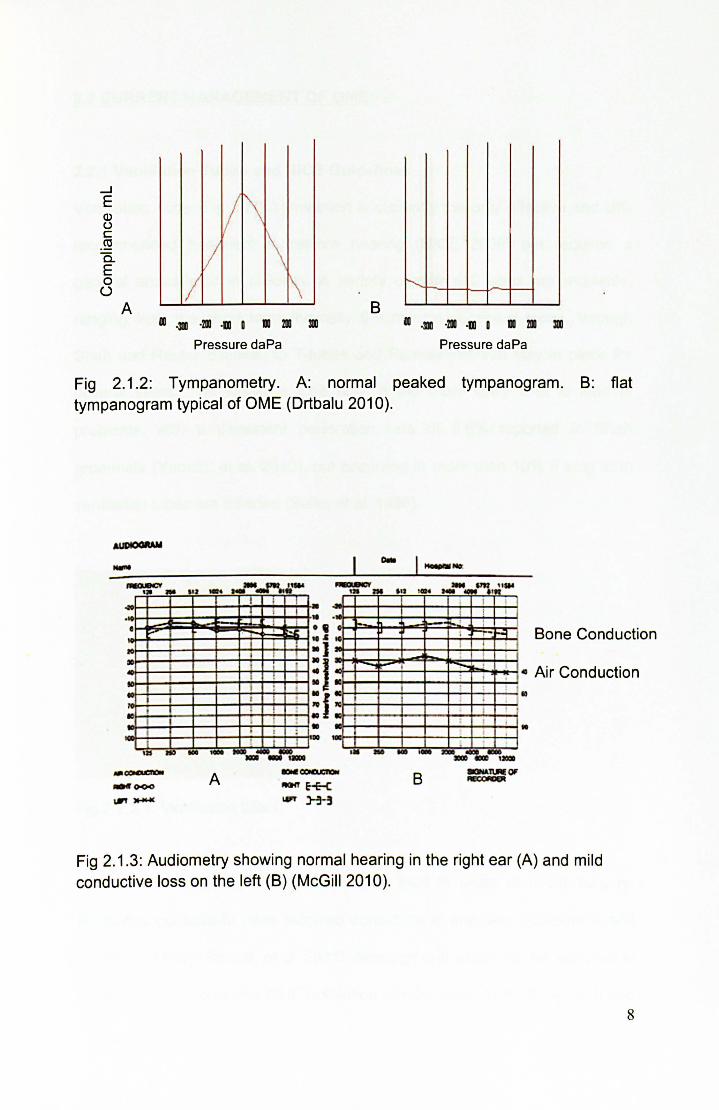
perforation. On audiometry. whether standard pure tone audiometry or
methods suitable for children, a mild conductive hearing loss is present (Fig
2.1.3); hearing level is by convention measured on a biological logarithmic
scale compared to normal hearing (decibel Normal Hearing Level. dB NHL),
with anything between 0 and 20 dB NHL considered within normal limits.
7
....J E Q) () c ro a. E 0 ()
A
II 1\ 1\ V
II f\ B
II .DI ·211 ·111 D III 211 DI II .DI ·211 ·111 D III 211 B
Pressure daPa Pressure daPa
Fig 2.1.2: Tympanometry. A: normal peaked tympanogram. B: flat tympanogram typical of OME (Drtbalu 2010).
-,'l ...
t ! .
• .... ,
10 i lID I 'j i
I I
I I : I
10 I
I : I
I . :
I ! 1JS I ... _ II lID. ~IID __ ' ._
A
I 1 . , • : : j
I ........ ... "" " ... -_ .... · , "nm51~ ., .. .I .. ! .) ~~+-~-+~~~4-~
Bone Conduction
: I 00f-+-~-'f-1!"'--i-+--+----.~"'~! ..... r-l " Air Cond uction • K:~--+-~~--~~~~
: f ~+--+---l~+--+---l~+.....J 10
• lID .. - ... __ ..... __ 1I01ID
B
Fig 2.1 .3: Audiometry showing normal hearing in the right ear (A) and mild conductive loss on the left (B) (McGill 2010).
8
2.2 CURRENT MANAGEMENT OF OME
2.2.1 Ventilation Tubes and NICE Guidelines
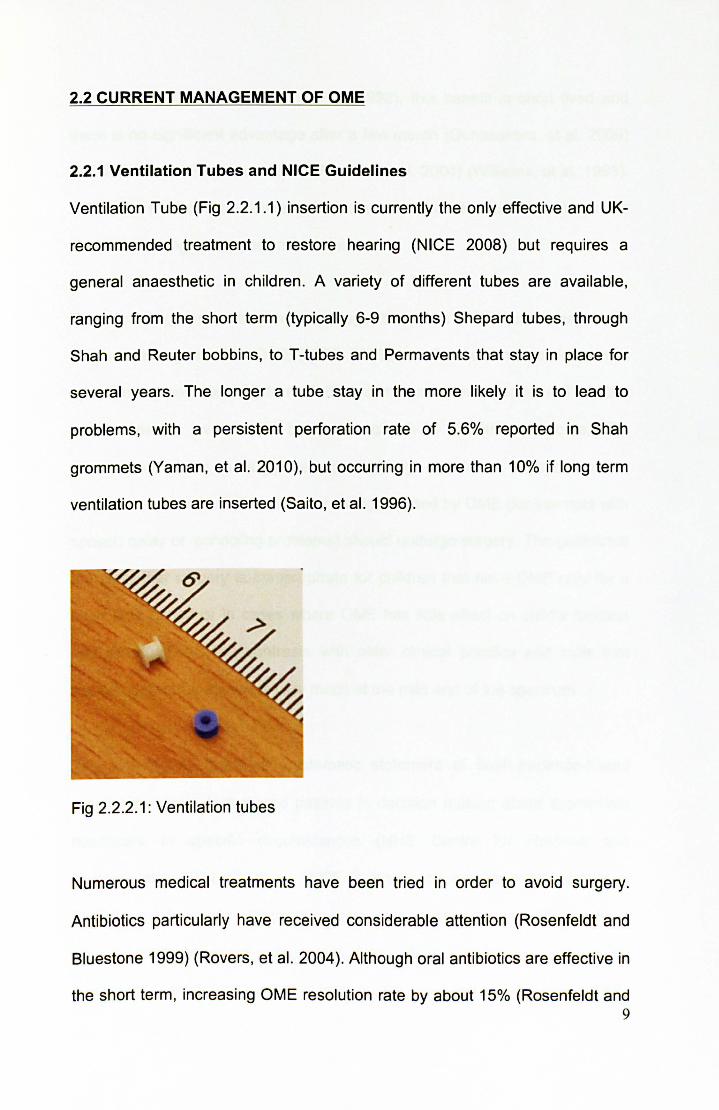
Ventilation Tube (Fig 2.2.1.1) insertion is currently the only effective and UK-
recommended treatment to restore hearing (NICE 2008) but requires a
general anaesthetic in children. A variety of different tubes are available,
ranging from the short term (typically 6-9 months) Shepard tubes, through
Shah and Reuter bobbins, to T-tubes and Permavents that stay in place for
several years. The longer a tube stay in the more likely it is to lead to
problems, with a persistent perforation rate of 5.6% reported in Shah
grommets (Vaman, et al. 2010), but occurring in more than 10% if long term
ventilation tubes are inserted (Saito, et al. 1996).
Fig 2.2.2.1: Ventilation tubes
Numerous medical treatments have been tried in order to avoid surgery.
Antibiotics particularly have received considerable attention (Rosenfeldt and
Bluestone 1999) (Rovers, et al. 2004). Although oral antibiotics are effective in
the short term, increasing OME resolution rate by about 15% (Rosenfeldt and 9
Bluestone 1999) (Rosenfeld and Post 1992), this benefit is short lived and
there is no significant advantage after a few month (Gunasekera, et al. 2009)
(Rosenfeldt and Bluestone 1999) (Rovers, et al. 2004) (Williams, et al. 1993).
Antibiotics are not a recommended treatment in the UK (NICE 2008), nor are
steroids, decongestants, or antihistamines.
The prevailing current treatment strategy, based on NICE guidelines on the
surgical management of OME (NICE 2008), is VT insertion in children with
symptomatic persistent bilateral OME documented over a period of 3 months
with a hearing level in the better ear of 25-30 dB NHL or worse. The
observation period is suggested due to high incidence of spontaneous
resolution, and only children that are being affected by OME (for example with
speech delay or schooling problems) should undergo surgery. The guidelines
are clear that surgery is inappropriate for children that have OME only for a
short time period or in cases where OME has little effect on child's function
and development; this contrasts with older clinical practice and trials that
assessed children that were very much at the mild end of the spectrum.
The aim of any guideline (systematic statement of best evidence-based
practice to assist doctors and patients in decision making about appropriate
healthcare in specific circumstances (NHS Centre for Reviews and
Dissemination 1994» such as NICE Guidance on surgical management of
OME is to inform and standardise best practice. However, whilst guidelines
should lead to improved patient care, this is by no means seen universally
(Freemantle, et al. 2000) (NHS Centre for Reviews and Dissemination 1994)
10
(Oxman, et al. 1995). Much OME literature pOints to great variations in surgery
rates and frequent non-compliance with guidelines.
The odds of surgery for OME/AOM were noted to vary 4 fold across different
regions of Norway in 2002 (Karevold, et al. 2007), and up to 10 fold for AOM
across different countries (UK lowest) (Schilder, Lok and Rovers 2004). There
was also a 10 fold variation in VT rates within Ontario in Canada in the late
1990s (Coyte, et al. 2001), this variation being larger than that seen in almost
any other procedure. Higher socio-economic status and the enthusiasm of the
primary care doctor for VTs were associated with increased VT rates. An
American study in 2002 found that >90% of VTs were not inserted in
accordance with guidelines in place at the time, and 80% were not appropriate
according to criteria developed by an expert panel for the study (Keyhani, et
al. 2008). Even after excluding children with other conditions predisposing to a
poor developmental outcome, those requiring other surgery, or those that
have had VTs before, the number of appropriate VTs was still less than 40%.
Going back several decades, the number of VTs in the UK was considered
excessive, and guidelines published in 1992 (NHS Centre for Reviews and
Dissemination 1992) emphasised the fact that for many children OME was a
temporary phenomenon due to spontaneous resolution and watchful waiting
should be the norm for most. The rates of OME surgery in England halved
during the 1990s, and although the guidelines undoubtedly contributed, there
was already an existing downwards trend in surgery rates (Black and
Hutchings 2002).
11

Several possible explanations exist for the variation in surgery rates, ranging
from differences in clinical opinion on diagnosis and effectiveness of
treatment, to parental preferences, and perhaps even financial factors. Of
course the problem may not be that surgeons are ignoring the guidelines, it
may be that the guidelines are over-restrictive and do not allow
personalisation of care to each individual child.
Whilst the recent NICE guidelines on the surgical management of OME have
clarified best practice, it is not yet known whether they have had an impact on
OME treatment, nor whether there is a variation in compliance across different
hospitals.
2.2.2 Adenoidectomy
Despite VT insertion, about a quarter of children will require further surgical
treatment within 2 years (Gates, Avery and Prihoda 1987). In order to reduce
recurrence, adenoidectomy as an adjunct to VT insertion has been
investigated by several studies (Rosenfeldt and Bluestone 1999).
Gates et al (Gates, Avery and Prihoda 1987) followed up 254 children aged 4-
8 years for 2 years. VTs+ad reduced time with effusion (26% of visits vs. 35%)
and halved the need for further surgery (14% vs. 28%). Maw (Maw and
Bawden 1994) followed up 222 children aged 3-9 years for up to 10 years. At
5 years, VTs+ad had half the re-treatment rate of VTs alone: 34 vs. 68%. At
10 years mean numbers of VTs needed were 1.5 and 2.5, respectively; +ad
also appeared to benefit hearing, the probable chief basis for the reduced
12

further treatment, for up to 4 years. A trial comparing VTs+ad with
myringotomy +ad in 3-7 year old children concluded that hearing in both
groups improved, but using VTs instead of a myringotomy conferred no
additional advantage, the implication being that it is the adenoidectomy that
gets children better (Popova, Varbanova and Popov 2011). A RCT looking at
adjuvant adenoidectomy in 4-9 year-old children found that while VTs were
responsible for most of the initial benefit (better than myringotomy), adjuvant
adenoidectomy increases the likelihood of restoration of normal middle ear
function at least up to 2 years after surgery (Black, et al. 1990). In contrast, a
study in children aged 2-3 years found that adenoidectomy conferred no
advantage in terms of time with effusion over VTs alone (Casselbrant, et al.
2009), and another (small - 72 patients) trial found that neither VTs nor
VTs+ad influenced OME resolution compared with no surgery at 12 months
(Dempster, Browning and Gatehouse 1993). Importantly, a large study of
>50,000 children aged under 10 years found that adenoidectomy in addition to
VTs reduced the need for subsequent surgery from 36% to 20% (Kadhim, et
al. 2007).
A 1992 review in Effective Health Care concluded that adding adenOidectomy
to VTs only had a small effect up to 12 months post op (NHS Centre for
Reviews and Dissemination 1992). A Cochrane review in 2010 concluded that
adenoidectomy has a Significantly beneficial effect on OME resolution,
although only a small benefit to hearing (van den Aardweg, et al. 2010).
13
In the UK adjuvant adenoidectomy is not recommended in the absence of
persistent and/or frequent upper respiratory tract symptoms (NICE 2008).
Whilst American guidelines agree with UK stance in the case of primary
surgery, they recommend that adenoidectomy is undertaken in conjunction
with any revision surgery (Rosenfeld, et al. 2004). This is because the role of
adjuvant adenoidectomy is set in part by issues of risk (chiefly bleeding) rather
than purely (cost-) effectiveness. There is not an evidence-based consensus
about exactly who should receive adenoidectomy or when. The fact that many
children do not require a second set of tubes is used to argue against
adenoidectomy. There is a great variation in the number of children receiving
adenoidectomy in different countries, but on the whole the number of children
having adenoidectomy appears to be reducing (Haapkyla, et al. 2008). The
NICE guidelines on surgical management of OME commented on the
generally poor quality of adenoidectomy trials, calling for better quality
research to evaluate any benefits of adenoidectomy (NICE 2008).
A great degree of controversy surrounds adjuvant adenoidectomy in
conjunction with VTs to try and reduce high rate of further surgery after VT
extrusion, leading to the setting up of a multicentre UK study on glue ear
treatment. The MRC Trial of Alternative Regimens on Glue ear Treatment
(TARGET) examined children up to 2 years after randomisation to VTs,
VTs+ad or watchful waiting, and found that adjuvant adenoidectomy benefits
hearing for the 2 year duration of the trial (Browning 2012) (MRC Multicentre
Otitis Media Study Group 2001a) (MRC Multi-Centre Otitis Media Study Group
2001b). However, the follow-up period was only 2 years, but OME often lasts
14
much longer. Therefore, longer-term data is also of value, warranting
supplementary studies beyond the TARGET 2 years (TARGET and the long
term supplementary study presented in this thesis is described in more detail
later).
2.2.3 Evaluating OME treatment: which children to study and for how
long?
OME is a temporary phenomenon in most children. When discovered on
screening of asymptomatic children, it resolves in 63% by three months and in
88% by one year (Rosenfeldt and Bluestone 1999). The NICE guidelines have
taken this into account as treatment is inappropriate for most children with
incidentally discovered, short-term, unilateral or asymptomatic OME.
The group of children where surgery may be considered are those with
bilateral OME persisting at least three months. This group has a much lower
spontaneous resolution rate (Maw and Bawden 1994) (Rosenfeldt and
Bluestone 1999) (Table 2.2.3.1), with the median duration of OME being 7.8
years (Maw and Bawden 1993). The surgical candidates, therefore, are a
select group of children in whom untreated OME often follows a protracted
relapsing and remitting course.
15

TIME OF FOLLOW UP (after OME PERCENTAGE OF CHILDREN IN
has already been present 3 months) WHOM OME HAS RESOLVED
6 months 27%
1 year 32%
2 years 31%
3 years 49%
4 years 59%
5 years 69%
7 years 85%
10 years 95%
Table 2.2.3.1: Spontaneous resolution rate In children with bilateral OME that
has already persisted for 3 months at the start of the trial (Maw and Bawden
1994) (Rosenfeldt and Bluestone 1999).
This complex evolution of the natural history of OME raises difficulties for the
evaluation of treatments, as some patients may improve without treatment,
whereas others suffer recurrence after VT extrusion. Any ReT therefore faces
the issue of appropriate time scale through which to evaluate a treatment.
The natural efficacy of most VTs is in the region of 6-9 months, the time that
VTs stay in place before being spontaneously ejected. Therefore, evaluating
VTs over 12 months is a sensible initial trial duration that takes in the VT stay
period. However there is no such clearly defined evaluation period for
treatments other than VTs, for example adjuvant adenoidectomy or any new
16
techniques. Most trials evaluate outcomes over at least 2 years to take
account not only of VT stay time but also of the recurrence after VT extrusion,
but longer term data is rare (Rosenfeldt and Bluestone 1999).
The two year follow up was also adopted by TARGET, the Trial of Alternative
Regimens in Glue Ear Treatment (Browning 2012) (MRC Multi-Centre Otitis
Media Study Group 2001 b) (MRC Multicentre Otitis Media Study Group
2001a), a major UK multi-centre RCT designed to evaluate OME treatment
over a 2 year period on children aged 3.5 to 7 years. TARGET's main entry
criterion was 20 dB NHL or worse in the better-hearing ear on initial visit, and
the same again after 3 months. Those qualifying and accepting randomisation
(376 children) were then randomised to VTs, VTs+ad, or further active
observation (FAO). A further adjunct cohort of 56 children, with hearing worse
than 40dB NHL that were thought to have an overriding need for treatment,
were also treated and given discretionary adenoidectomy. Subject to
reservations about non-randomised analysis, this group, known as "obliged to
treat" (On), boosts the numbers for comparing VTs+ad with VTs alone or
FAO.
Children were followed up for 2 yrs. There was spontaneous remission in
about a third of FAO children; however, overall 62% of children allocated to
FAO switched to a surgical treatment arm within 1 year, emphasising the
clinical need of this OME population as a whole. VTs led to better hearing
outcomes initially, but after 1 year there was no advantage of VTs over FAO.
17
TARGET entry criteria ensured that only the severe spectrum of OME was
captured, as evidenced by the high switching from FAO to surgery. Studies
that adopt less stringent entry criteria have questioned the benefits of VTs. For
example, the widely quoted Paradise study (Paradise, et al. 2007) included
children purely on the basis of the presence of effusion even if unilateral,
accepted 15dBHL as the audiometric criterion, and analysed largely children
under 2 years old. Their findings of limited benefits of VTs are not surprising
as they studied a group of children that likely did not have much of a problem
in the first place. A benefit of VTs in terms of language, writing and behaviour,
both while VTs are in-situ and after extrusion, has been demonstrated by UK
based studies on the more severely affected children (Hall, Maw and Steer
2009) (Wilks, et al. 2000).
Although most OME trials look at a two year period that encompasses VT stay
time and the period immediately after extrusion, the chronic nature of OME
should ideally also be taken into account, although exactly how long any trial
should last is unclear.
18
2.3 AETIOLOGY OF OTITIS MEDIA WITH EFFUSION
Despite its major socio-economic and health care importance, the aetiology of
OME is only now being elucidated (Rovers, et al. 2004). It is a chronic
inflammatory condition affecting the middle ear mucosa resulting in mucus
secretion that accumulates in the middle ear cleft (Kubba, Pearson and
Birchall 2000). The middle ear mucosa constantly secretes mucus, which is
then moved down the Eustachian tube. The mucus has a protective function,
as it provides a physical barrier and prevents adhesion of bacteria to mucosa.
Upon irritation, the mucosa responds by increasing the production of mucus
and secretion of altered mucus types (Kubba, Pearson and Birchall 2000),
goblet cells proliferate, and new mucous glands form (Bak-Pedersen and Tos
1976) (Tos 1980) (Tos and Caye-Thomasen 2002).
In addition to mucins, middle ear effusions also contain water, cells, cell
debris, electrolytes and various other high molecular weight compounds such
as proteins, lipids, and DNA. Bacteria and their product have also been
identified, as have immunoglobulins, lysozyme, lactoferrin, complement,
leukotrienes and cytokines. While many of these may be present as a result of
bacterial inflammation, mucins are actively secreted into the effusion
(Smirnova, et al. 2003); OME is an exudate, not a transudate.
Whilst it is clear that OME develops as a result of mucosal irritation, the cause
of the initial inflammatory stimuli has been difficult to establish (Kubba,
Pearson and Birchall 2000).
19
2.3.1 Bacteria in OME
Whilst OME is a chronic inflammatory condition on histology, the cause of the
inflammatory stimulus that leads to production of mucins and an effusion has
been difficult to identify. Some of the risk factors for OME (young children,
association with AOM, day-care, many siblings, lack of breastfeeding) suggest
an infective aetiology, but OME is not characterised by symptoms and signs of
acute inflammation that would be expected in a typical acute bacterial
infection with a bulging red tympanic membrane, pain and fever.
The role of bacteria in OME has therefore been controversial. In most studies
bacteria could be cultured in fewer than half of samples, ranging from 21 to
70% (Bluestone, Stephenson and Martin 1992) (Gok, et al. 2001) (Hall
Stoodley, Hu, et al. 2006) (Hendolin, et al. 1997) (Matar, et al. 1998) (Poetker,
et al. 2005) (Schousboe, et al. 2001). Although this may suggest that bacteria
are not important in OME, it contrasts with studies examining effusions for the
presence of bacterial nucleic acids by polymerase chain reaction (peR),
which have demonstrated bacterial DNA typically in excess of 80% of
effusions (Hendolin, et al. 1997) (Kubba, Pearson and Birchall 2000) (Post,
Preston, et al. 1995) (Rayner, et al. 1998). However the presence of bacterial
nucleic acids does not equate to the presence of viable bacteria, and
components of effusion samples have been shown to inhibit nuclease activity,
perhaps leading to persistence of RNA and DNA even if bacteria are no longer
viable (Peizhong, et al. 2000).
20
A possible explanation for the discrepancy between high PCR-positive rate
and low culture-positive rate in OME is involvement of biofilms (Fergie, et al.
2004), as these may give culture-negative results in the laboratory (biofilms
are described later). Indeed, biofilms have been identified on human middle
ear mucosa in children with OME and/or recurrent AOM in 65 - 92% of cases,
but not in any control samples studied (Thornton, et al. 2011 )(Hall-Stoodley et
al 2006). Biofilms have also been identified in animal models of OME (Ehrlich,
Veeh, et al. 2002) (Post 2001). However, a study of middle ear mucosal
biopsy at time of cochlear implant showed biofilms in 2 out of 45 cases without
evidence of previous otologic problems or abnormalities, suggesting that
biofilms may exist in the asymptomatic middle ear (Tonnaer, Mylanus, et al.
2009). Biofilms have also been found in patients with cholesteatoma (Chole
and Faddis 2002) and chronic suppurative otitis media (Hom0e, et al. 2009).
In addition to biofilms, bacterial persistence may also occur due to intracellular
infection (Coates, et al. 2008), perhaphs co-existing with biofilm (Thornton, et
al. 2011).
A wide range of bacteria have been implicated in OME. The commonest
bacterial isolates are Streptococcus pneumoniae, Moraxella catarrhalis and
Haemophilus influenzae, with Staphylococcus aureus and many others also
frequently reported (Bluestone, Stephenson and Martin 1992) (Hyden,
Akerlind and Peebo 2006).
In addition to suggestions that OME is a biofilm disease, it is also thought that
the benefits of adenoidectomy are linked to removal of nasopharynx biofilms.
21
Adenoid tissue acts as a reservoir of bacteria: bacteria in the middle ear get
there by ascending via the Eustachian tube from the nasopharynx and
adenoid tissue (Tonnaer, Rijkers, et al. 2005). Adenoidectomy alters the
nasopharyngeal bacteria, reducing the incidence of carriage of Haemophilus
influenzae and Streptococcus pneumoniae (Aarts, et al. 2010), and adenoid
tissue of children with OME has been shown to contain bacterial biofilms
(Hoa, et al. 2010) (Kania, et al. 2008) (Nistico, et al. 2011) (Winther, et al.
2009). However, adenoid tissue contains bacteria even in absence of OME
(Nistico, et al. 2011), and the adenoid bacteria may be no different in those
children with OME from those without (AI mac, et al. 2009).
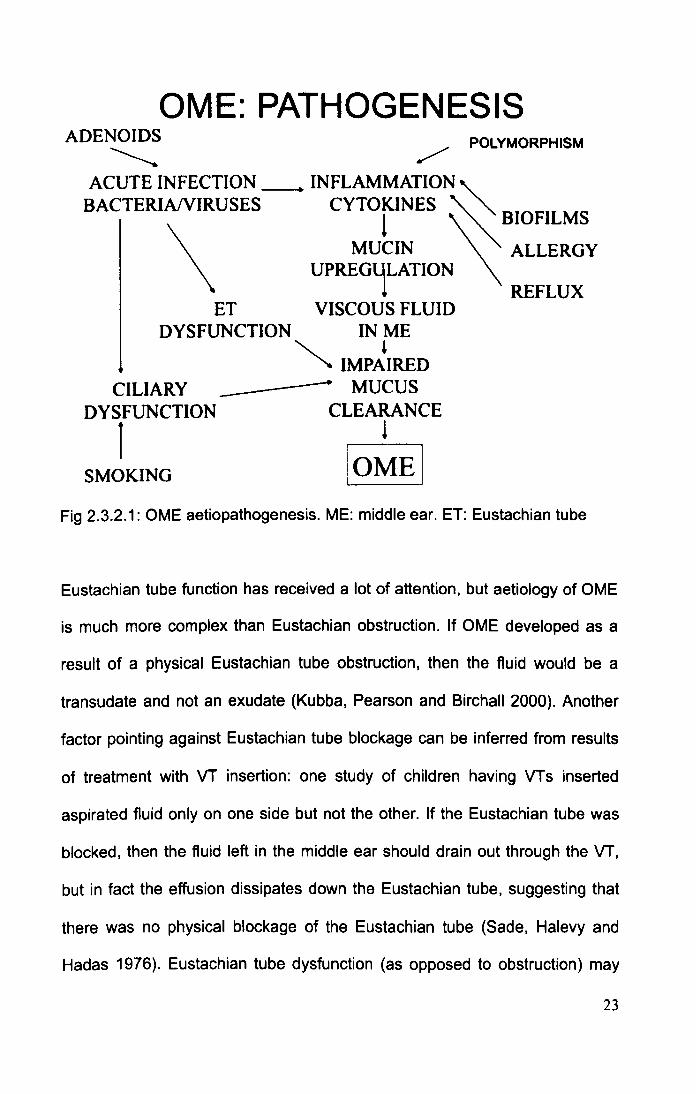
2.3.2 Other theories of OME aetiology
Several other theories of OME aetiology have been investigated in the past
(Kubba, Pearson and Birchall 2000). The unifying pathway is inflammation
leading to production of more and thicker mucus which accumulates in the
middle ear, in conjunction with impaired mucociliary clearance due to the
increased mucus viscosity. Figure 2.3.2.1 presents an integrated model of
OME aetiopathogenesis.
22
OME: PATHOGENESIS ADENOIDS ~
/ POLYMORPHISM
ACUTE INFECTION __ • INFLAMMATION" BACTERIANIRUSES CYTOKlNES ~ '" 1 ~BIOFILMS
\
MUCIN ALLERGY UPREG~LATION
! REFLUX ET VISCOUS FLUID
DYSFUNCTION IN ME
CILIARY DYSFUNCTION
1 SMOKING
~ IMP~IRED ------ MUCUS
CLEARANCE !
IOMEI Fig 2.3.2.1: OME aetiopathogenesis. ME: middle ear. ET: Eustachian tube
Eustachian tube function has received a lot of attention, but aetiology of OME
is much more complex than Eustachian obstruction. If OME developed as a
result of a physical Eustachian tube obstruction, then the fluid would be a
transudate and not an exudate (Kubba, Pearson and Birchall 2000). Another
factor pointing against Eustachian tube blockage can be inferred from results
of treatment with VT insertion: one study of children having VTs inserted
aspirated fluid only on one side but not the other. If the Eustachian tube was
blocked, then the fluid left in the middle ear should drain out through the VT,
but in fact the effusion dissipates down the Eustachian tube, suggesting that
there was no physical blockage of the Eustachian tube (Sade, Halevy and
Hadas 1976). Eustachian tube dysfunction (as opposed to obstruction) may
23

be involved as the tube is the likely source of bacteria in the middle ear
ascending from the adenoids I nasopharynx, and its function may be affected
by acute bacterial or viral infections (Rosenfeldt and Bluestone 1999).
Smoking causes impaired ciliary action, but is in itself unlikely to be the
predominant cause of OME as children not exposed to passive smoking still
get OME (Sophia, et al. 2010). Ciliary beat frequency in children with effusion
is no different from those without (-11 Hz) (Wake and Smallman 1992). Viral
DNA has also been identified in the middle ear, but a causal relationship to
OME has not been established (Pitkaranta, et al. 1998). Atopy is a weak risk
factor at the most (Caffarelli, et al. 1998) (Sophia, et al. 2010). Diesel exhaust
fumes have been shown to decrease cell viability, induce inflammation, and
increase mucin expression in middle ear epithelial cell cultures (Song, et al.
2012).
Genetic aetiology has been investigated in mouse models (Hardisty-Hughes,
et al. 2006) (Parkinson, et al. 2006). However, there is no good animal model
of OME, and at least some of the animal mutants with OME have associated
craniofacial abnormalities. Also, the effusion composition has not been studied
to demonstrate comparability with humans, and the observation of different
effusion components between the right and the left ear (Johnson, et al. 1997)
suggests that genetic influences alone are unlikely to be responsible for OME,
although they may influence the host interaction with pathogens or the
inflammatory response.
24
The aetiology of OME is unclear, but the role of bacteria and biofilms warrants
further investigation using new methods that can demonstrate bacteria in the
middle ear effusion.
25
2.4 BACTERIAL BIOFILMS AND THEIR TREATMENT
2.4.1 Pathogenesis of biofilm infections
Bacteria exists in two forms, planktonic and biofilms. Planktonic bacteria are
free-floating unicellular organisms, allow rapid dissemination over a large
area, and have been successfully targeted by antibiotics. On the other hand,
bacterial biofilms, now known to be present in virtually all natural and
pathological environments, are emerging as major causes of human disease
(Vlastarakos, et al. 2007), being focused on persistence and characterised by
their recalcitrance to antibiotics and clearance by host defence mechanisms
(Donlan and Costerton 2002). It has been estimated that >60% of infections
are caused by biofilms (Lewis, Riddle of Biofilm Resistance 2001). Although
probably first described in the seventeenth century by Anton van
Leeuwenhoek's examination of his own dental plaque, universal acceptance
of biofilms in human pathogenesis has only occurred in the last few decades
(Schinabeck and Ghannoum 2006). Bacteria grown as colonies on an agar
plate are thought to be most similar to planktonic bacteria (Mikkelsen, et al.
2007), so the study of biofilms requires new, different methods.
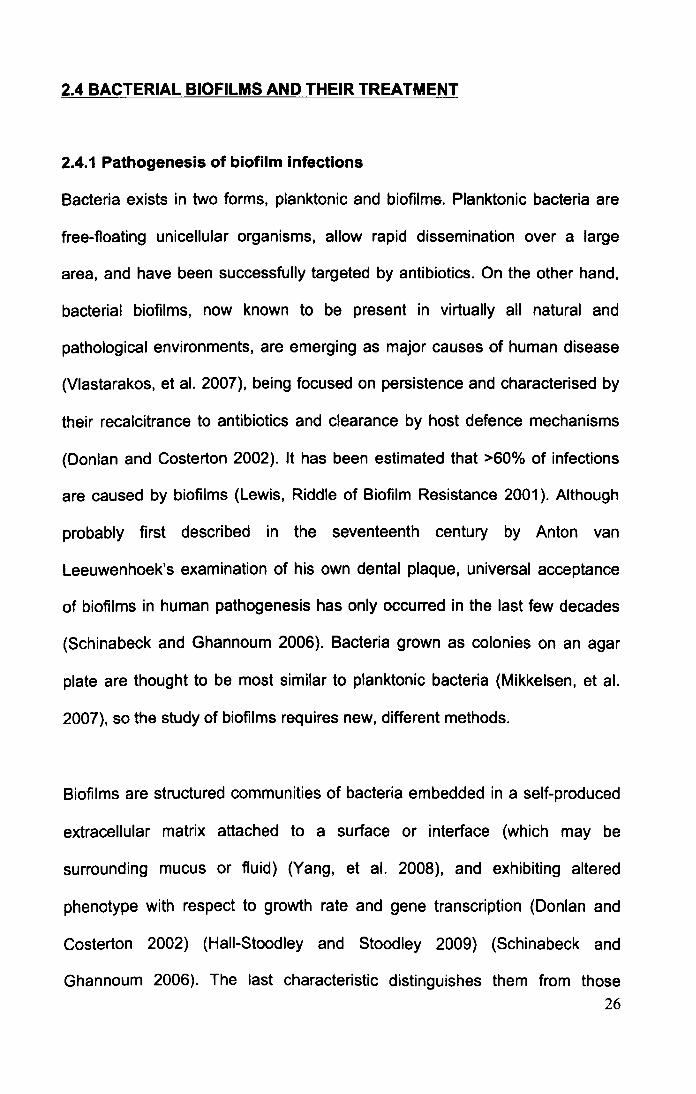
Biofilms are structured communities of bacteria embedded in a self-produced
extracellular matrix attached to a surface or interface (which may be
surrounding mucus or fluid) (Yang, et al. 2008), and exhibiting altered
phenotype with respect to growth rate and gene transcription (Donlan and
Costerton 2002) (Hall-Stoodley and Stood ley 2009) (Schinabeck and
Ghannoum 2006). The last characteristic distinguishes them from those
26
bacteria attached to surfaces but not exhibiting the altered phenotype, for
example bacteria growing on agar. Biofilms can be composed of single or
multiple species. They are not homogeneous monolayers of bacteria on a
surface, but are composed of bacterial micro-colonies (accounting for -15% of
the biofilm volume) encased in matrix (-85%) (Fig 2.4.1.1) (Donlan and
Costerton 2002) (Lawrence, et al. 1991) (Rasmussen and Lewandowski
1998).
BIOFILM
o resistant to abx
0 2 gradient pH gradient nutrients
Figure 2.4.1.1: Schematic biofilm structure
high growth rate
medium growth rate
slow growth rate
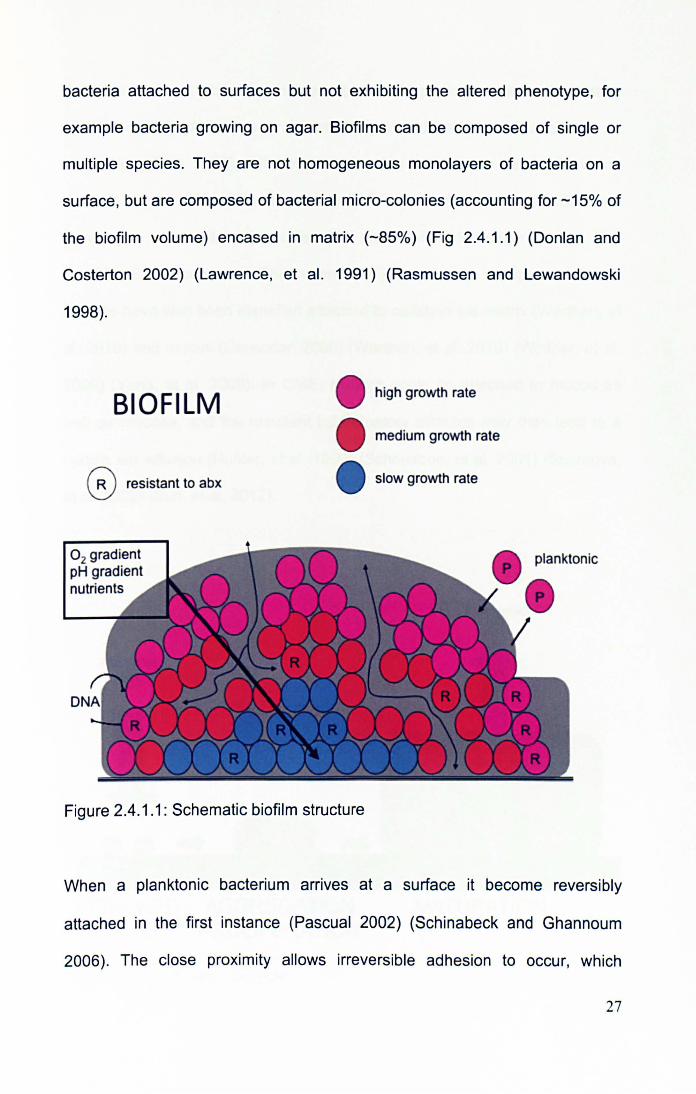
When a planktonic bacterium arrives at a surface it become reversibly
attached in the first instance (Pascual 2002) (Schinabeck and Ghannoum
2006). The close proximity allows irreversible adhesion to occur, which
27
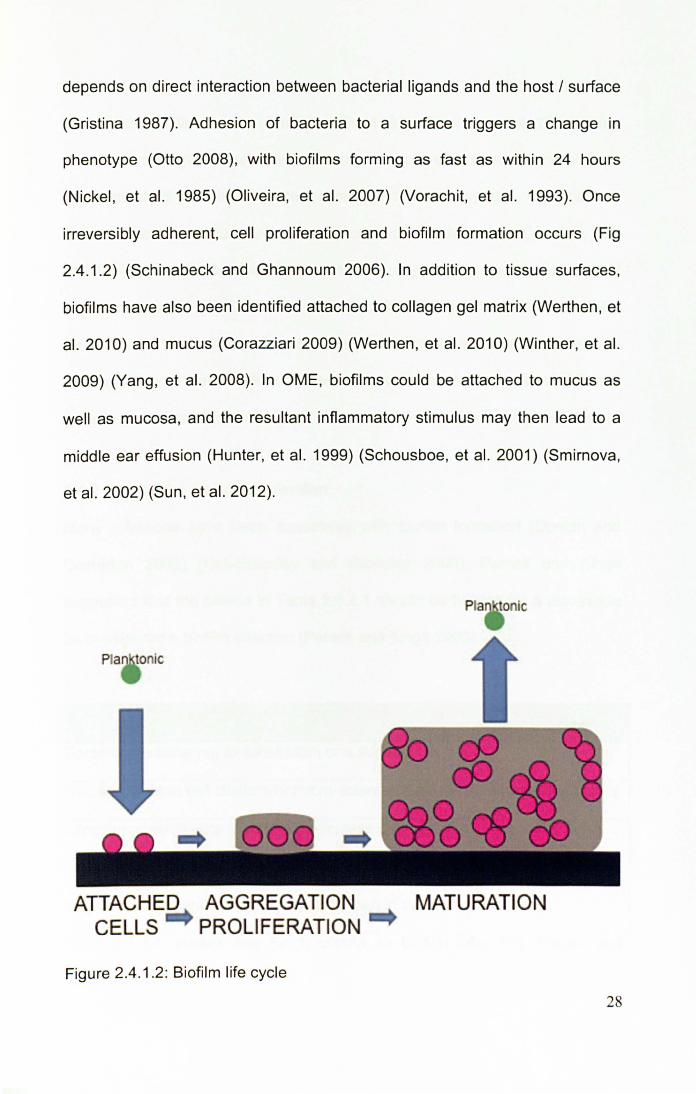
depends on direct interaction between bacterial ligands and the host / surface
(Gristina 1987). Adhesion of bacteria to a surface triggers a change in
phenotype (Otto 2008), with biofilms forming as fast as within 24 hours
(Nickel , et al. 1985) (Oliveira, et al. 2007) (Vorachit, et al. 1993). Once
irreversibly adherent, cell proliferation and biofilm formation occurs (Fig
2.4.1.2) (Schinabeck and Ghannoum 2006). In addition to tissue surfaces,
biofilms have also been identified attached to collagen gel matrix (Werthen , et
al. 2010) and mucus (Corazziari 2009) (Werthen, et al. 2010) (Winther, et al.
2009) (Yang, et al. 2008). In OME, biofilms could be attached to mucus as
well as mucosa, and the resultant inflammatory stimulus may then lead to a
middle ear effusion (Hunter, et al. 1999) (Schousboe, et al. 2001) (Smirnova,
et al. 2002) (Sun, et al. 2012).
Pia tonic
ATTACHED CELLS
AGGREGATION PROLIFERATION
Figure 2.4.1.2: Biofilm life cycle
MATURATION
28

Biofilms cause disease in a number of ways (Donlan and Costerton 2002).
Parts of the biofilm can break off (Gristina 1987) (Stoodley, et al. 2001) when
the tensile strength is exceeded, resulting in septic embolisation, and biofilms
can also shed planktonic bacteria leading to distant spread. Bacteria can
induce a host response through the production of endotoxins (Vincent, Tibi
and Darbord 1989), but biofilms themselves may be less susceptible to host
immune response (Hall-Stoodley and Stoodley 2009) (Shiau and Wu 1998)
(Ward, et al. 1992) (Yasuda, et al. 1994), and the close proximity of bacteria
may encourage the transfer of plasm ids even between bacteria of different
genera (Ehlers and Bouwer 1999).
2.4.2 Criteria for a biofilm infection
Many infections have been associated with biofilm formation (Donlan and
Costerton 2002) (Hall-Stoodley and Stoodley 2009). Parsek and Singh
suggested that the criteria in Table 2.4.2.1 should be fulfilled for a disease to
be considered a biofilm infection (Parsek and Singh 2003).
Parsek and Singh criteria for biofilm infections
Bacteria are adherent to substratum or a surface
Bacteria living in cell clusters or micro-colonies encased in extracellular matrix
Infection generally confined to a particular location
Infection difficult or impossible to eradicate with antibiotics, despite the
responsible bacteria being susceptible when in the planktonic state
Table 2.4.2.1: Parsek and Singh criteria for biofilm infections (Parsek and
Singh 2003) 29
2.4.3 Studying bacterial biofilms in vitro
A number of different ways of studying biofilms in vitro have been described,
with several important parameters to consider (Donlan and Costerton 2002):
Medium: composition, temperature, presence of antimicrobials
Inoculum: Identity of organism, number of cells
Hydrodynamics: flow rate, presence of shear
Substratum: roughness, chemistry, conditioning film
The in vitro biofilm models are broadly similar in that they all rely on the
provision of a surface for bacterial attachment and a nutrient environment.
Some surfaces are more conducive to biofilm formation than others, with latex
and silicone being most supportive of bacterial attachment, followed by
Poly(vinyl chloride), Teflon (poly(tetra fluoro ethylene)), polyurethane,
stainless steel and titanium (Darouiche 2001) (Pascual 2002) (Schinabeck
and Ghannoum 2006), although not all studies agree (Bayston, Ashraf and
Barker-Davies, et al. 2007). Surfaces that are rough or irregular have
enhanced bacterial attachment, as do those that are hydrophobic or positively
charged as they attract bacteria that are predominantly hydrophobic and
negatively charged in their planktonic state (Darouiche 2001) (Schinabeck and
Ghannoum 2006). However, the characteristics of any implanted material can
be altered by the presence of a "conditioning film" composed of several host
components (fibronectin, fibrinogen, fibrin, albumin, collagen, elastin, von
Willebrand factor), which may in some circumstances increase bacterial
adherence (Pascual 2002) (Schinabeck and Ghannoum 2006). Rather counter
30
intuitively, bacterial adhesion is promoted by shear forces, with biofilms
formed in high shear environments being stronger (Donlan and Costerton
2002).
In order to study OME biofilms and their eradication in the laboratory setting, a
new in vitro model is required. Demonstration of biofilm structure as well as its
functional characteristics, reduced susceptibility to antibiotics, will have to be
shown. Because high dose antibiotics delivered locally over several weeks are
likely to be required for biofilm eradication, the new model must be able to
incorporate the addition of antibiotics or a modified release device sized for
use in the middle ear. Although a number of well known biofilm systems have
been used by other researchers, including the commercially available Calgary
Biofilm Device (Minimum Biofilm Eradication Concentration (MBEC) assay
system) (Ceri, Olson and Stremick, et al. 1999) and the CDC biofilm reactor
(Goeres, et al. 2005), as well as the modified Robbins device (Lewis, Riddle of
Biofilm Resistance 2001), the dimensions of these are not suitable for
examining the effects of an added modified release device intended for use in
the middle ear. Therefore a new in vitro biofilm model will have to be
developed.
In order to measure bacteria in biofilms on a surface, the biofilm can be
removed from the surface using sonication or enzymes, and the resulting
bacterial suspension plated to count the number of colony forming units (Ceri,
Olson and Stremick, et al. 1999). Other methods assess biofilms in-situ by
measuring the turbidity of nutrient broth (Ceri, Olson and Stremick, et al. 1999)
31
or the intensity of staining with crystal violet (Djordjevic, Wiedmann and
McLandsborough 2002), but this does not allow the counting of colony forming
units. An important step in the study of biofilms is the use of resuscitation tests
where biofilms previously exposed to a treatment agent are then placed into
fresh nutrient broth to determine whether any bacteria have persisted, and are
capable of re-growing once the inhibitory effect of antibiotics is withdrawn.
2.4.4 Treatment of biofilm infections
Biofilms show inherently low susceptibility to treatment with antibiotics,
typically requiring from 10 to 1000 times higher antibiotic levels than those
required to inhibit planktonic bacteria (Ceri, Olson and Stremick, et al. 1999)
(Donlan and Costerton 2002) (Nickel, et al. 1985) (Olson, et al. 2002)
(Vorachit, et al. 1993). This reduced susceptibility to antibiotics, termed
recalcitrance, is distinct from antibiotic resistance occurring as a result of
genetic alterations. Resistance (Lewis 2001) is the ability of an organism to
grow in the presence of elevated levels of an antimicrobial, yet biofilms do not
show this as the bacteria in their planktonic state are as sensitive to
antibacterials as expected; only when grown in a biofilm is the reduced
susceptibility, the recalcitrance, evident. This recalcitrance arises as a result of
several possible factors (Hall-Stoodley and Stood ley 2009) (Lewis, Riddle of
Biofilm Resistance 2001) (Sihorkar and Vyas 2001).
• Bacteria in biofilms are slow growing, rendering them relatively less
susceptible to antibiotics (DuGuid, et al. 1990) (Evans, et al. 1990).
• Adhesion to a surface and change to the biofilm phenotype influences the
expression of a number of genes and phYSiologic parameters that may 32
affect susceptibility to antibiotics (Dagostino, Goodman and Marshall
1994).
• Within the biofilm structure a gradient of oxygen, pH, or nutrient levels
exists (Rasmussen and Lewandowski 1998), and this gradient may affect
antibiotics directly or change the growth of bacteria in the anaerobic micro
niche at the centre of the biofilm (Hall-Stoodley and Stoodley 2009)
(Proctor and von Humboldt 1998) (Sihorkar and Vyas 2001).
• Biofilms contain "persister cells" that are not affected by antibiotics even
when other biofilm bacteria are killed, perhaps due to expression of
specific genes capable of shutting down antibiotic targets to create a
dormant tolerant cell (Lewis 2001). This temporary state is distinct from the
permanent and heritable resistance characterised by prevention of
antibiotic binding to target in a cell that continues to be metabolically
active. It is also not due to bacteria being at a specific point in the cell cycle
and, although related to growth phase, is not identical with simply non
growing cells (Lewis, Spoering, et al. 2006) (Shapiro, Nguyen and
Chamberlain 2011).
• Antibiotics have to penetrate the biofilm matrix to get to the bacteria, but
the matrix may affect the diffusion of antibiotics so that their effectiveness
is reduced. Not all antibiotics are thought to be affected equally, with
rifampicin, clindamycin and macrolides thought to be relatively uninhibited
(Souli and Giamarellou 1998).
• These recalcitrance factors can act singly or in combination (Donlan and
Costerton 2002).
33
As biofilms do not behave the same as planktonic bacteria, the use of
planktonic bacteria-based Minimum Inhibitory Concentration (MIC) and
Minimum Bactericidal Concentration (MBC) when discussing effects of
antibiotics is inappropriate, leading to the use of Minimum Biofilm Eradicating
Concentration (MBEC) instead (Ceri, Olson and Morck, et al. 2006). MBEC is
typically in the region of 10 to 1000 times higher than MIC (Ceri, Olson and
Stremick, et al. 1999) (Donlan and Costerton 2002) (Nickel, et al. 1985)
(Olson, et al. 2002) (Vorachit, et al. 1993), and treatment over several weeks
is typically required (R. Donlan 2008). However, whether that high antibiotic
level is required for the full duration of treatment is not known, and it may be
that an initial high level followed by a lower antibiotic level is satisfactory.
Several broad approaches may be used against biofilm infection (Aslam 2008)
(Donlan and Costerton 2002) (Sihorkar and Vyas 2001):
• Prevention of initial contamination, e.g. by adhering to strict aseptic
techniques.
• Prevention of initial microbial attachment and biofilm development e.g. with
antibiotic impregnated devices (Bayston, Ashraf and Bhundia 2004)
(Bayston, Fisher and Weber 2009) or other device modification
(Biedlingmaier, Samaranayaki and Whelan 1998) (Furno, et al. 2004).
• Eradication of established biofilms with antibacterial agents (R. Donlan
2008) (Sihorkar and Vyas 2001), delivered either systemically or locally:
antibiotic bone cement, catheter antibiotic-lock therapy (R. Donlan 2008)
(Fernandez-Hidalgo, et al. 2010), or novel drug delivery systems such as 34
liposomes or biodegradable polymers (Sihorkar and Vyas 2001) (Smith
2005). Additionally, novel techniques may be used such as ultrasound
(Ensing, et al. 2006) (Huang, et al. 1996), low-strength electrical fields
(Blenkinsopp, Khoury and Costerton 1992), degradation of extracellular
matrix (Johansen, Falholt and Gram 1997), inhibition of quorum sensing
(Bassler and Losick 2006) (Diggle, Crusz and Camara 2007) (P. Williams
2007), disruption of biofilm-related genes, or indeed a combination of the
above in a smart system that detects and treats colonising infection
(Ehrlich, Stoodley, et al. 2005).
• Removal of infected surface.
Eradication of established biofilm infections is notoriously difficult (Donlan and
Costerton 2002) (Lewis 2001), but it is likely that high antibiotic concentrations
with extended exposure periods will be required, with certain antibiotics (e.g.
rifampicin and clindamycin) appearing to be better against biofilms than others
(Lee, et al. 2006) (Souli and Giamarellou 1998). Those two antibiotics were
therefore chosen for the study of biofilm eradication in this thesis. Additionally,
the combination of two antibiotics minimises emergence of resistance
(D'Agata, et al. 2008).
2.4.5 Rifampicin and clindamycin
The interaction between antibiotics and planktonic bacteria is described by
MIC and MBC, and that between antibiotics and biofilms by the MBEC as
explained above. Although these describe in vitro activity of antibiotics, they
do not describe the time course. Antibiotics are divided into two broad 35
categories, time-dependent and concentration-dependent (Finch and Gander
2006). Concentration-dependent antibiotics (aminoglycosides, quinolones)
show an increase in the rate and the extent of bactericidal activity with
increased concentration. With time-dependent antibiotics (beta-Iactams,
linezolid, tetracyclines) the rate and extent of killing is dependent of time
above a minimum concentration, but further increases in antibiotic
concentration do not increase the cidal activity. Some time-dependent
antibiotics also exhibit post-antibiotic effects. Antibiotics that are bacteriostatic
inhibit the growth and reproduction of bacteria without killing them (relying on
the immune system to kill bacteria), whereas bactericidal antibiotics kill
bacteria.
For the study of biofilm eradication, rifampicin and clindamycin were chosen.
They appear to be better than other antibiotics at eradicating biofilms (Lee, et
al. 2006) (Souli and Giamarellou 1998), the combination of two antibiotics
minimises emergence of resistance (D'Agata, et al. 2008), and between them
they cover common OME pathogens.
In terms of their pharmacodynamic activity, the stratification of rifampicin and
clindamycin into different types of antibiotics is not clear-cut. Rifampicin can
be bacteriostatic or bactericidal depending on dose and exposure time, and
exhibits time-dependent and also concentration-dependent killing (Bakker
Woudenberg, et al. 2005) (Gumbo, et al. 2007). Similarly, clindamycin can be
bacteriostatic or bactericidal depending on dose and exposure time, and
36

exhibits time-dependent (Klepser, et al. 1996) and also concentration-
dependent killing (Aldridge and Stratton 1991).
Clindamycin, C1sH33CIN205S (Fig 2.4.5.1), molecular weight 425.0, is a
lincosamide antibiotic that binds to the 50s subunit of the ribosome and
interferes with protein synthesis. It is active against aerobic Gram-positive
cocci including staphylococci and streptococci, and against anaerobic Gram-
negative rods, but most aerobic Gram-negative bacteria (Haemophilus,
Moraxella) are resistant.
Fig 2.4.5.1: Clindamycin (Sigma 2012)
Rifampicin, C43H5SN4012 (Fig 2.4.5.2), molecular weight 823.0, inhibits DNA-
dependent RNA polymerase. It is active against most Gram positive cocci
including Streptococci and Staphylococci, Haemophilus influenzae, as well as
mycobacteria (Thornsberry, Hill, et al. 1983) (Thornsberry, Ogilvie, et al.
1999).
37
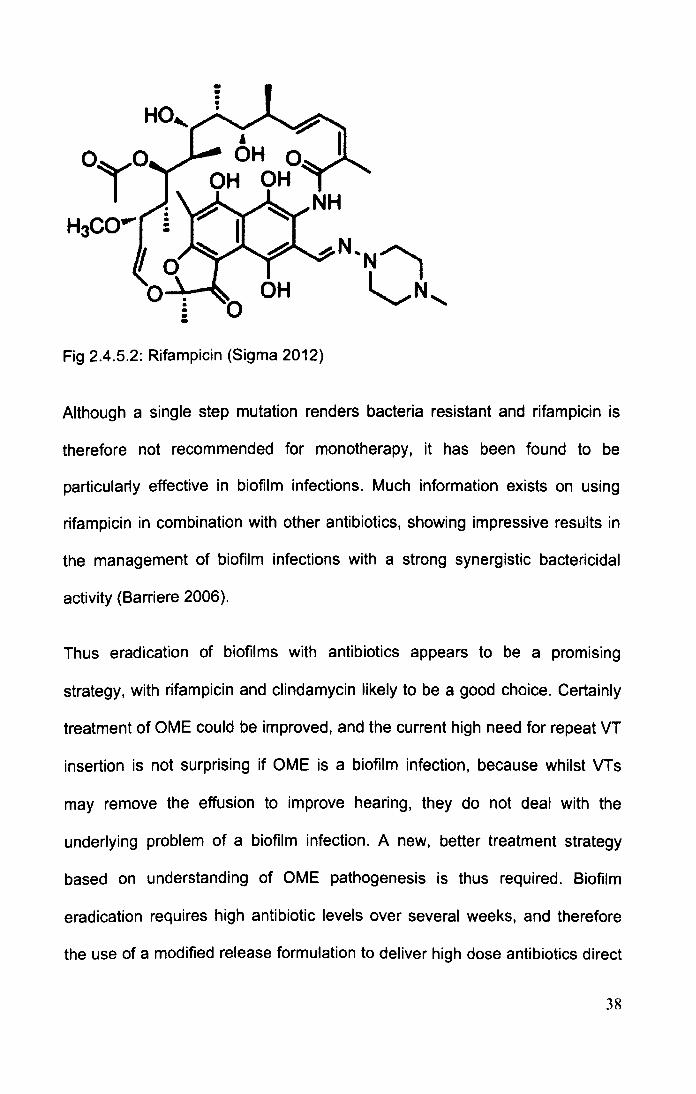
Fig 2.4.5.2: Rifampicin (Sigma 2012)
Although a single step mutation renders bacteria resistant and rifampicin is
therefore not recommended for monotherapy, it has been found to be
particularly effective in biofilm infections. Much information exists on using
rifampicin in combination with other antibiotics, showing impressive results in
the management of biofilm infections with a strong synergistic bactericidal
activity (Barriere 2006).
Thus eradication of biofilms with antibiotics appears to be a promising
strategy, with rifampicin and clindamycin likely to be a good choice. Certainly
treatment of OME could be improved, and the current high need for repeat VT
insertion is not surprising if OME is a biofilm infection, because whilst VTs
may remove the effusion to improve hearing, they do not deal with the
underlying problem of a biofilm infection. A new, better treatment strategy
based on understanding of OME pathogenesis is thus required. Biofilm
eradication requires high antibiotic levels over several weeks, and therefore
the use of a modified release formulation to deliver high dose antibiotics direct
38
to the middle ear is a potentially useful future strategy. Local delivery achieves
high enough antibiotic levels. and the use of a modified-release formulation
ensures treatment over a sufficiently long period. An understanding of
modified-release drug delivery systems is therefore important when
developing such novel treatments for OME and biofilms.
39
2.5 MODIFIED RELEASE DRUG DELIVERY SYSTEMS
As eradication of biofilms is likely to require high-dose locally-delivered
antibiotics over a prolonged time period, the use of a modified-release drug
delivery system may be one way of achieving that aim. Although modified
release drug delivery systems have only been developed over the last few
decades, they have resulted in great improvements in patient care. The
increase in the use of modified-release drug delivery systems can be
attributed to the major advantages they offer over conventional drug delivery
(Anelli 2008) (Bajpai, et al. 2010) (Rosoff 1989) (Siepmann and Siepmann
2008a), including:
• Regulation of drug concentrations over a specific time period
• Reduced administration frequency
• Accessing sites of therapeutic interest that cannot be practically accessed
using standard delivery (e.g. inside the blood brain barrier)
• Drug targeting, with drugs being delivered only to the site where it is most
needed
• Pulsatile drug delivery, where drug is delivered at set time points, or
pulsatile dosing with several drugs released at different lag periods
(chronotherapeutics)
• Potential for development of intelligent drug delivery systems that release
drugs in response to a pre-defined biological event I parameter
40
2.5.1 Modified drug delivery systems
To control the rate at which drugs are released (Siepmann and Siepmann
2008a), the active ingredient may be embedded in a matrix of some type.
Biodegradable polymers (large molecules composed of repeating structural
units) are often used for this purpose. Three broad types of drug delivery
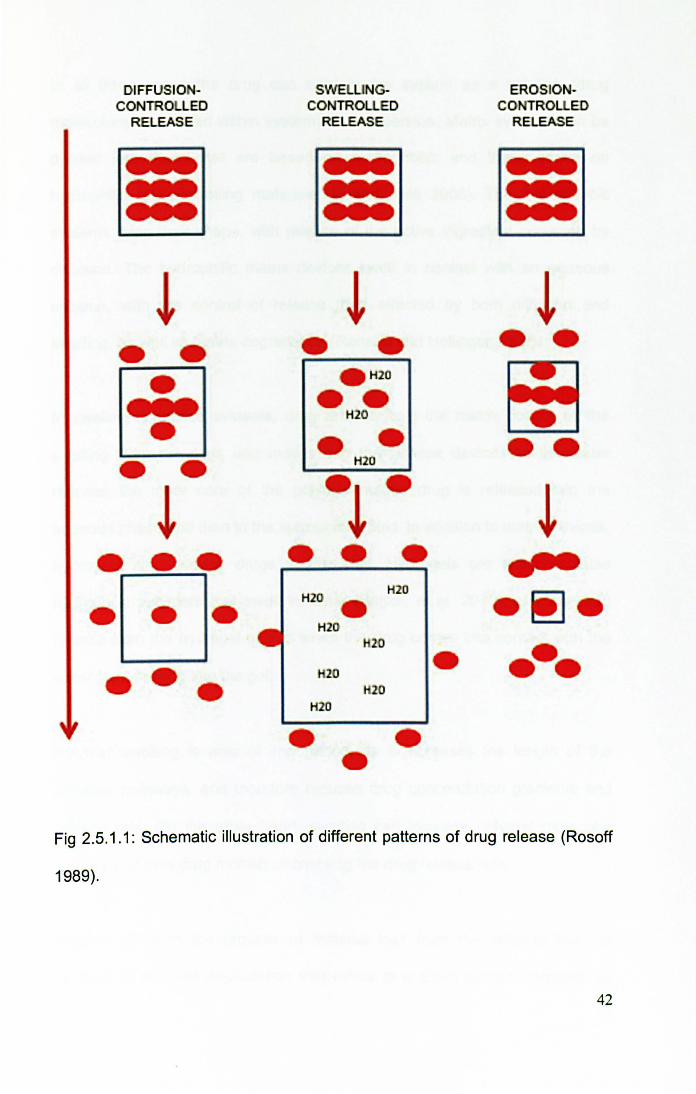
systems are associated with biodegradable devices, shown in Fig 2.5.1.1,
although in reality many devices' drug release is governed by a combination of
factors.
In diffusion-controlled systems the drug diffuses down a concentration
gradient from the delivery device into the surrounding area. Different types of
diffusion can be distinguished (Morishita and Park 2010):
• Reservoir devices with a core-shell structure: Drug is at the centre of a
shell, and diffuses through shell at a controlled rate (either with constant or
non-constant activity)
• Matrix or monolithic devices: Drug is distributed homogenously throughout
the system
• Laminated matrix devices contain a mix of matrix and reservoir devices
with characteristics of both.
41
DIFFUSIO -CONTRO LEO
RELEASE
~
• • ~
• • • • • • •
SWELUNGCONTROLLED
RElEASE
~ • •
• H20
•• H2O
• H2O
.~ . •
H2O H2O • H2O
20
20 20
H2O
•
EROSIONCONTROUED
RELEASE
~ • •
•• ~
- -.-.
Fig 2.5.1.1: Schematic illustration of different patterns of drug release (Rosoff
1989).
42
In all three cases the drug can exist in the system as a solution (drug
molecularly distributed within system) or a dispersion. Matrix systems can be
divided into those that are based on hydrophobic and those based on
hydrophilic rate-controlling materials (Li and Jasti 2006). The hydrophobic
systems keep their shape, with release of the active ingredient occurring by
diffusion. The hydrophilic matrix devices swell in contact with an aqueous
solution, with the control of release then affected by both diffusion and
swelling, as well as matrix degradation (Ranade and Hollinger 2003).
In swelling-controlled systems, drug release from the matrix occurs as the
swelling front develops and moves into the release device. As the water
reaches the inner core of the polymer matrix, drug is released into the
aqueous phase and then to the surrounding fluid. In addition to matrix devices,
hydrogels also release drugs in this way. Hydrogels are water-insoluble
hydrophilic polymers that swell in water (Bajpai, et al. 2010), and the drug
release from the hydrogel occurs when the drug comes into contact with the
water front moving into the gel.
Polymer swelling is also of importance, as it increases the length of the
diffusion pathways, and therefore reduces drug concentration gradients and
release rate. On the other hand, swelling can increase polymer molecular
mobility and thus drug mobility, increasing the drug release rate.
Erosion refers to the process of material loss from the polymer bulk, in
contrast to polymer degradation that refers to a chain scission process by
43
which polymers are cleaved into oligomers and finally monomers. Erosion is
classified into surface and bulk erosion. In surface erosion degradation occurs
primarily in the outermost layers, so that as the surface polymer degrades the
drug is freed; this results in a gradual shrinkage of the device and leads to
erosion-controlled drug release. This surface erosion is distinct from bulk
erosion, where the entire device is rapidly penetrated by water and thus
polymer chains are cleaved throughout the system. Thus in bulk erosion the
porosity increases, embedded molecules become more mobile and diffuse out
of the system, the device outer dimensions stay the same until eventually the
device disintegrates into smaller polymer fragments (Hausberger and Deluca
1995). Polymers with very reactive functional groups degrade fast with surface
erosion, whereas polymers with less reactive groups (such as PLGA) undergo
bulk erosion. Thus surface erosion is like a bar of soap that gradually reduces
in size, and erosion controls drug release, but bulk erosion is like a biscuit that
crumbles when wet and drug release is governed by diffusion. Despite this
classification, in reality the exact mode of erosion is affected by the balance
between system wetting rate and polymer cleavage rate, the former also being
affected by the dimensions of device (smaller devices are more readily wetted
than larger ones) (von Burkersroda, Schedl and Gopferich 2002).
In practice, several different mass transport phenomena concurrently affect
drug release from modified-release systems (Siepmann and Siepmann 2008a)
(Siepmann and Siepmann 2008b). In the case of PlGA systems, water
penetration into the device is faster than polymer chain cleavage by ester
hydrolysis and the system undergoes bulk erosion. This generates short chain
44
acids within the device, which diffuse out of the device into the surrounding
fluid. Although bases can diffuse from the surrounding into the system to
neutralise the short chain acids within the device, their diffusion can be
relatively slow leading to a pH drop in the core of the device (Brunner, Mader
and Gopferich 1999). This can accelerate polymer degradation and drug
release, and may lead to undesirably rapid release of a dose of drug that was
meant to be released over a slower time period (dose dumping) (Anelli 2008).
Other factors affecting drug release (Li and Jasti 2006) (Morishita and Park
2010) include solubility of drug in the device and surrounding medium,
concentration gradient, drug loading, morphological characteristics such as
porosity and surface area, hydrophilicity and hydrophobicity of the system,
chemical interaction between drug and polymer, polymer characteristics such
as molecular weight and glass transition temperature. For example, a high
molecular weight drug will diffuse more slowly, binding effects will slow down
the diffusion, a large molecular weight polymer will degrade more slowly, a
hydrophobic polymer will absorb less water leading to less bulk degradation,
and smaller more porous particles will have a greater total surface area with
consequent faster diffusion of solvent into the particles and faster matrix
degradation rate (Morishita and Park 2010).
2.5.2 Biodegradable drug delivery systems
Although drugs can be delivered in a controlled manner using non-
biodegradable vessels, biodegradable systems have significant advantages
as the need for vessel removal is avoided (Bossy, et al. 2008) (Li and Jasti
45
2006). A variety of polymers can be used, including poly(amides),
poly(esters), poly(orthoesters), poly(anhydrides) and others (Rosoff 1989).
Poly(esters) particularly have been widely used, as they break down to
naturally occurring substances, degradation only requires water, a wide
variety of different properties can be obtained depending on monomers
chosen, and early experience with suture materials means that a wealth of
safety data already exists (Saltzman 2001).
PLGA (Fig 2.5.2.1), a poly(ester) polymer has been the most widely studied
biodegradable system (Bossy, et al. 2008) (Lu, et al. 2009), and has a long
history of safe clinical use in sutures, implants, prosthetic devices, and depot
drug delivery systems (e.g. Zoladex). It is biodegradable and biocompatible
and approved by the US Food and Drug Administration. PLGA is synthesized
by ring opening and co-polymerisation of two different monomers, lactic acid
(C3HS03) and glycolic acid (C2H403), linked by an ester linkage. The result is a
polymer, a large molecule composed of repeating structural units. The precise
form is poly(DL-lactic acid-eo-glycolic acid), the DL showing that it is the
racemic mixture of lactic acid (containing both stereoisomers). The polymer
forms amorphous structures, glass-like with tangled chains (as opposed to
ordered crystalline structures), and application of heat turns brittle solid
material to a viscous liquid. Degradation involves hydrolysis in the presence of
water, into monomers of lactic and glycolic acids, which are metabolised
without any adverse reactions. Different forms of PLGA are characterised by
different ratios of lactic to glycolic acids.
46
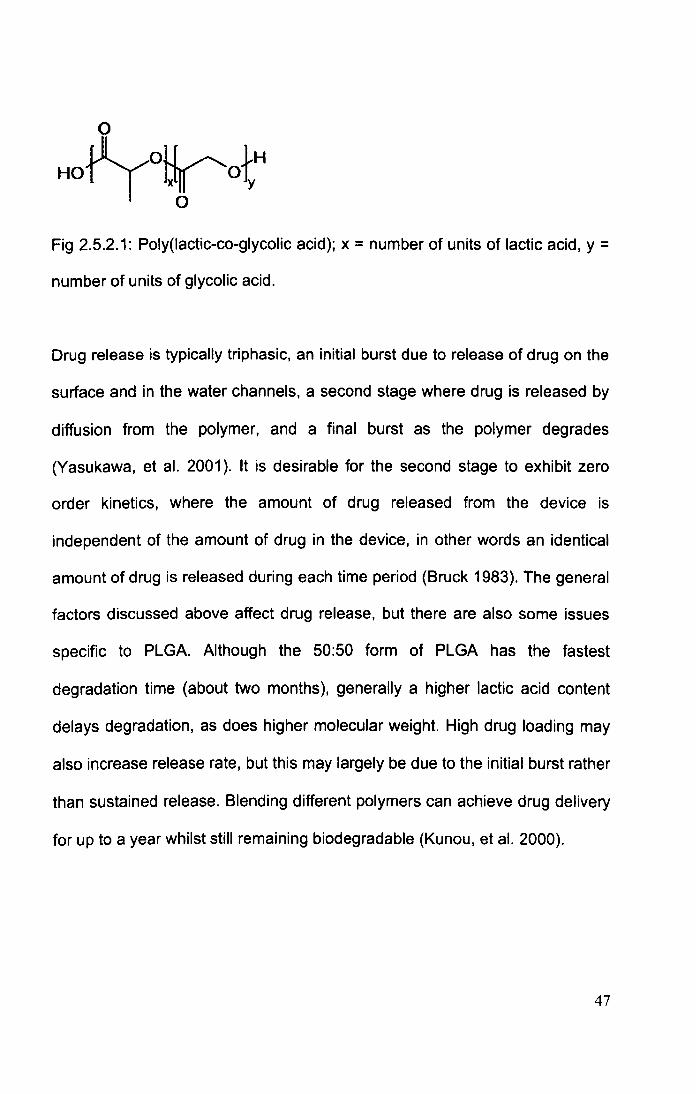
Fig 2.5.2.1: Poly(lactic-co-glycolic acid); x = number of units of lactic acid, y =
number of units of glycolic acid.
Drug release is typically triphasic, an initial burst due to release of drug on the
surface and in the water channels, a second stage where drug is released by
diffusion from the polymer, and a final burst as the polymer degrades
(Yasukawa, et al. 2001). It is desirable for the second stage to exhibit zero
order kinetics, where the amount of drug released from the device is
independent of the amount of drug in the device, in other words an identical
amount of drug is released during each time period (Bruck 1983). The general
factors discussed above affect drug release, but there are also some issues
specific to PLGA. Although the 50:50 form of PLGA has the fastest
degradation time (about two months), generally a higher lactic acid content
delays degradation, as does higher molecular weight. High drug loading may
also increase release rate, but this may largely be due to the initial burst rather
than sustained release. Blending different polymers can achieve drug delivery
for up to a year whilst still remaining biodegradable (Kunou, et al. 2000).
47
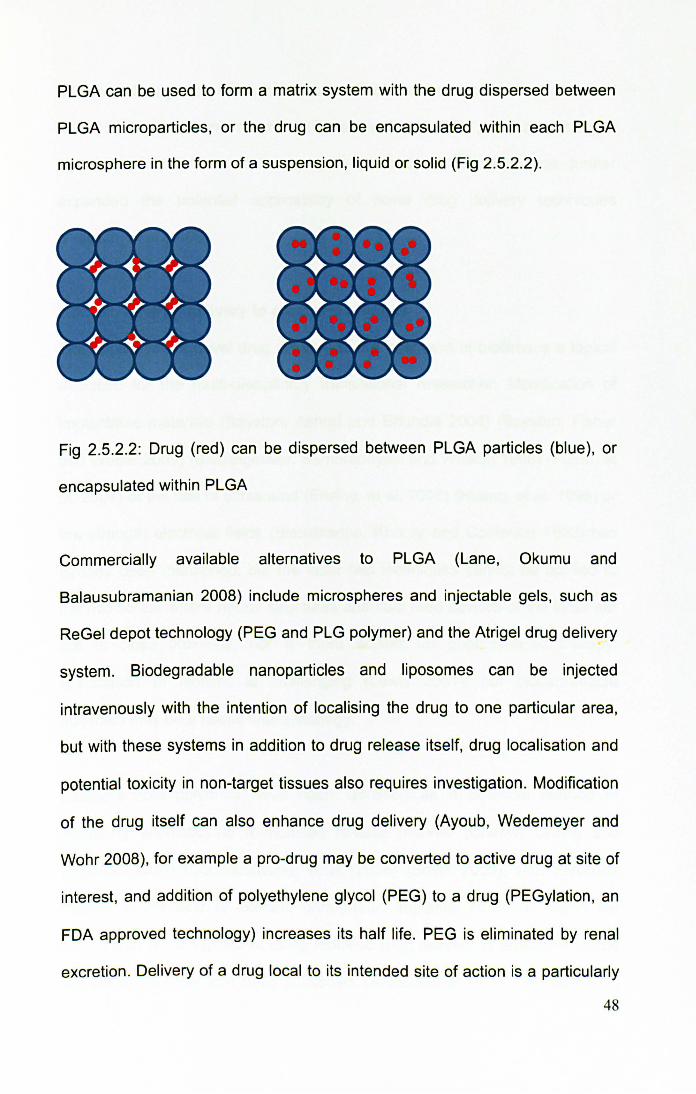
PLGA can be used to form a matrix system with the drug dispersed between
PLGA microparticles, or the drug can be encapsulated within each PLGA
microsphere in the form of a suspension, liquid or solid (Fig 2.5.2.2).
+++ +++ +++
Fig 2.5.2.2: Drug (red) can be dispersed between PLGA particles (blue), or
encapsulated within PLGA
Commercially available alternatives to PLGA (Lane, Okumu and
Balausubramanian 2008) include microspheres and injectable gels, such as
ReGel depot technology (PEG and PLG polymer) and the Atrigel drug delivery
system. Biodegradable nanoparticles and liposomes can be injected
intravenously with the intention of localising the drug to one particular area,
but with these systems in addition to drug release itself, drug localisation and
potential toxicity in non-target tissues also requires investigation. Modification
of the drug itself can also enhance drug delivery (Ayoub, Wedemeyer and
Wohr 2008), for example a pro-drug may be converted to active drug at site of
interest, and addition of polyethylene glycol (PEG) to a drug (PEGylation, an
FDA approved technology) increases its half life. PEG is eliminated by renal
excretion . Delivery of a drug local to its intended site of action is a particularly
48
effective strategy, as often therapeutic effect can be achieved with minimal
risk of systemic adverse reactions (Costantino, et al. 2007). The availability of
injectable formulations that aggregate at body temperature has further
expanded the potential applicability of novel drug delivery techniques
(Fraylich, et al. 2008).
2.5.3 Novel drug delivery to eradicate blofilms
The application of novel drug delivery to the treatment of biofilms is a logical
evolution for the multi-disciplinary translational researcher. Modification of
implantable materials (Bayston, Ashraf and Bhundia 2004) (Bayston, Fisher
and Weber 2009) (Biedlingmaier, Samaranayaki and Whelan 1998) (Furno, et
al. 2004) or the use of ultrasound (Ensing, et al. 2006) (Huang, et al. 1996) or
low-strength electrical fields (Blenkinsopp, Khoury and Costerton 1992) has
already been mentioned, but the latter two techniques cannot be applied to
the middle ear where neural structures and fluid filled cavities of the inner ear
are in close proximity, nor is there access for photodynamic therapy.
Eradication of biofilms is challenging (Lewis 2001 ), but biodegradable
polymers may be a useful future strategy.
Biodegradable polymers have been identified as a potential method of
delivering antibiotics in a modified release manner (Cheow, Chang and
Hadinoto 2010) (Coowanitwong, et al. 2008) (Smith 2005), with particular
interest in the field of infected orthopaedic implants. However, within the
middle ear, some studies of using modified drug delivery to eradicate middle
ear infections have also been published. Goycoolea et al (M. Goycoolea, D. 49
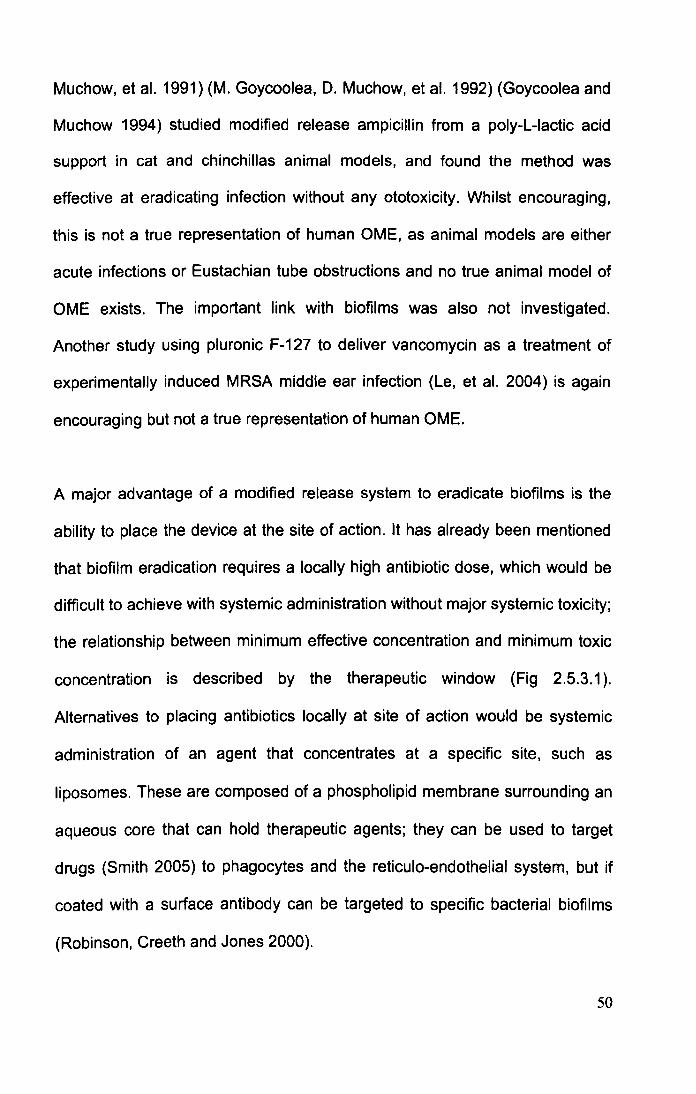
Muchow, et al. 1991) (M. Goycoolea, D. Muchow, et al. 1992) (Goycoolea and
Muchow 1994) studied modified release ampicillin from a poly-L-Iactic acid
support in cat and chinchillas animal models, and found the method was
effective at eradicating infection without any ototoxicity. Whilst encouraging,
this is not a true representation of human OME, as animal models are either
acute infections or Eustachian tube obstructions and no true animal model of
OME exists. The important link with biofilms was also not investigated.
Another study using pluronic F-127 to deliver vancomycin as a treatment of
experimentally induced MRSA middle ear infection (Le, et al. 2004) is again
encouraging but not a true representation of human OME.
A major advantage of a modified release system to eradicate biofilms is the
ability to place the device at the site of action. It has already been mentioned
that biofilm eradication requires a locally high antibiotic dose, which would be
difficult to achieve with systemic administration without major systemic toxiCity;
the relationship between minimum effective concentration and minimum toxic
concentration is described by the therapeutic window (Fig 2.5.3.1 ).
Alternatives to placing antibiotics locally at site of action would be systemic
administration of an agent that concentrates at a specific site, such as
liposomes. These are composed of a phospholipid membrane surrounding an
aqueous core that can hold therapeutic agents; they can be used to target
drugs (Smith 2005) to phagocytes and the reticulo-endothelial system, but if
coated with a surface antibody can be targeted to specific bacterial biofilms
(Robinson, Creeth and Jones 2000).
50
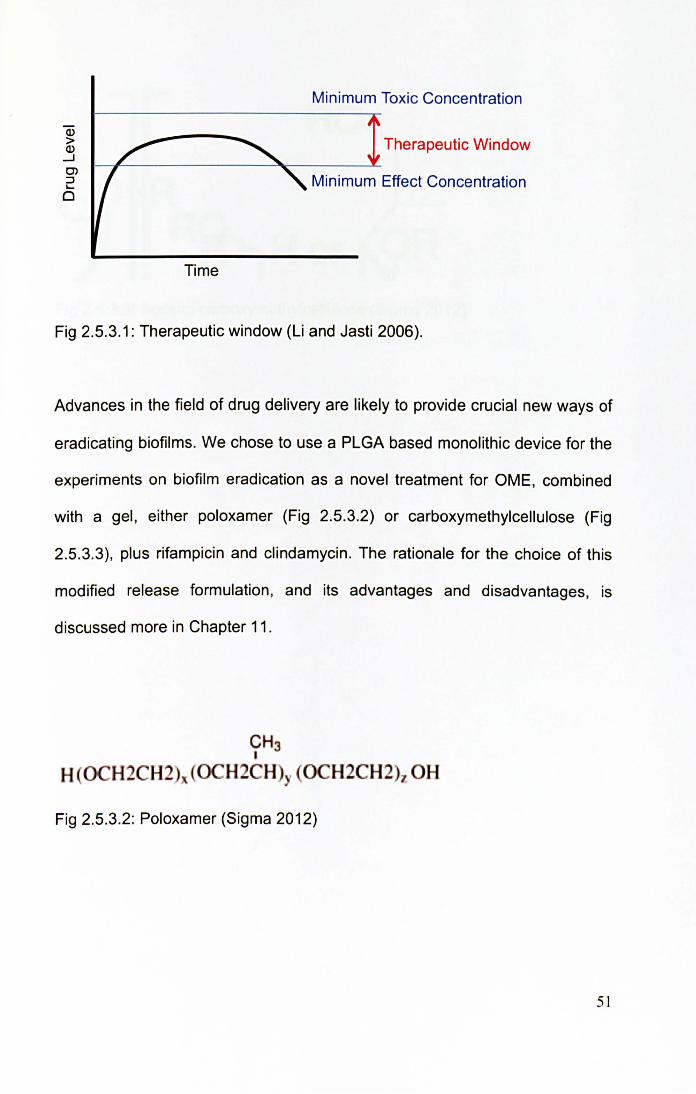
Minimum Toxic Concentration
Therapeutic Window
Time
Fig 2.5.3.1: Therapeutic window (Li and Jasti 2006).
Advances in the field of drug delivery are likely to provide crucial new ways of
eradicating biofilms. We chose to use a PLGA based monolithic device for the
experiments on biofilm eradication as a novel treatment for OME, combined
with a gel, either poloxamer (Fig 2.5.3.2) or carboxymethylcellulose (Fig
2.5.3.3), plus rifampicin and clindamycin. The rationale for the choice of this
modified release formulation, and its advantages and disadvantages, is
discussed more in Chapter 11.
CH3 I
H H2CH2 0 H2 H 'I 0 H2 H2 l OH
Fig 2.5.3.2: Poloxamer (Sigma 2012)
51
---- -::::=:.:.:
'~~.~.:.._~_~.~~~~.~l. 1 __ ::::_::..J . . ::~'1{~.~"~ . - - ~ ~ ~: ~.i
-... ..
-_. ---- ----.. - --- -- -_. -
~~1i~/'''-"*-"'1_
_. -- -.-.-. - . ,. .... _ .. .. -... - , .... ... -~-,. ~!. 1:~~ ' E ~~-:-:~:'g'- -.' -,,:
Fig 2.5.3.3: Sodium carboxymethylcellulose (Sigma 2012).
52

2.6 SUMMARY
Glue ear is an extremely common condition, with VTs insertion being one of
the commonest surgical procedures. Whilst the recent NICE guidelines on the
surgical management of OME have clarified best practice, it is not yet known
whether they have had an impact on OME treatment, nor whether there is a
variation in compliance across different hospitals. A great degree of
controversy surrounds adjuvant adenoidectomy in conjunction with VTs to try
and reduce the high rate of further surgery after VT extrusion, leading to the
setting up of a multicentre UK study on glue ear treatment. The MRC Trial of
Alternative Regimens on Glue ear Treatment (TARGET) examined children up
to 2 years after randomisation to VTs, VTs+ad or watchful waiting, finding in
favour of adjuvant adenoidectomy. However, with OME's chronic course,
longer-term data is also of value, warranting supplementary studies beyond
the TARGET 2 years.
The aetiology of OME is unclear, but the role of bacteria and biofilms warrants
further investigation using new methods that can demonstrate bacteria in the
middle ear effusion. If OME is a biofilm infection, it is not surprising that VT
insertion has such a high need for further surgery; VTs only remove the
effusion, but do not deal with the underlying problem of a biofilm infection. A
new treatment strategy based on better understanding of OME pathogenesis
is therefore required.
53
In order to study OME biofilms and their eradication in the laboratory setting, a
new in vitro model is required. Demonstration of biofilm structure as well as its
functional characteristics, reduced susceptibility to antibiotics, will have to be
demonstrated. High dose antibiotics delivered locally over several weeks are
likely to be required for biofilm eradication, and the new model must be able to
incorporate the addition of antibiotics or a modified release device. Advances
in the field of drug delivery are likely to provide crucial new ways of eradicating
biofilms.
54
3 AIMS
The thesis has two distinct parts: a collection of clinical studies, and series of
laboratory experiments. The aims are as follows.
CLINICAL STUDIES
• Assess need for further surgery for OME after VT extrusion (TARGET trial
long-term data)
• Assess the impact of adjuvant adenoidectomy on need for repeat surgery
(TARGET trial long-term data)
• Assess practice in accordance with NICE guidelines on OME
management, including whether they have changed our practice
LABORATORY STUDIES
• Consolidate existing microbiology data obtained by our group and
establish presence of bacteria and biofilms in middle ear effusions
• Develop an in vitro model to represent S aureus biofilm infection
• Assess whether antibiotics (rifampicin and clindamycin) can be used to
eradicate S aureus biofilms using the model
55

• Produce a biodegradable modified-release antibiotic pellet based on a
PLGA matrix with rifampicin and clindamycin, and with either pluronic F127
or carboxymethyl cellulose gels
• Assess antibiotic release from the pellets with High Performance Liquid
Chromatography (necessitating a new method) and Serial Plate Transfer
Testing
• Test the antibiotic pellets against biofilms in the in vitro model
56
4 THESIS OUTLINE
The thesis is split into chapters that address specific questions. Each chapter
contains a brief introduction summarising the important issues discussed in
the main introduction (Chapter 2), a description of methods, followed by
results and comprehensive discussion.
The clinical chapters demonstrate that guidelines on OME treatment are not
always followed, and that current OME treatments have major shortcomings,
with many children requiring VT surgery more than once. Additional
adenoidectomy may improve on this, but the rate of recurrence remains high.
Thus there is a clear need to develop better treatments, and better
understanding of OME aetiology is key to developing new therapeutic
strategies. Therefore, the role of bacteria and biofilms in OME is investigated
next, demonstrating the important role that these play in the
aetiopathogenesis of OME.
In order to study the treatment of biofilms, an in vitro S aureus biofilm model is
developed next, and used to test whether rifampicin and clindamycin can be
used to eradicate biofilms. Demonstrating that they can, a modified-release
antibiotic PLGA-based formulation is then developed. Drug release from these
antibiotic pellets is investigated with High Performance Liquid
57

Chromatography and Serial Plate Transfer Testing, and the pellets tested in
the in vitro biofilm model showing that they are capable of eradicating biofilms.
Overall, the thesis shows that current treatment has significant shortcomings,
but better understanding of OME aetiopathogenesis opens up the possibility of
improved treatment. Although further development is required, antibiotic
pellets may be a useful, better future treatment for OME.
58

5 CURRENT OME TREATMENT: VENTILATIONS TUBES AND
THE BENEFITS OF ADENOIDECTOMY
5.1 INTRODUCTION
Examination of the effectiveness of current OME treatment is the starting point
for this thesis, underpinning the need for further investigation into OME
aetiology and the development of improved treatment based on better
understanding of OME pathogenesis. As described in the introduction, current
treatment guided by NICE is Ventilation Tube (VT) insertion. However, about a
quarter of children are thought to require further surgical treatment, although
adenoidectomy may reduce this (Gates, Avery and Prihoda 1987) (Kadhim, et
al. 2007) (Maw and Bawden 1994) (Popova, Varbanova and Popov 2011)
(Rosenfeldt and Bluestone 1999).
The UK Trial of Alternative Regimens in Glue Ear Treatment (TARGET) set
out to determine how effective VTs were and what was the role of adjuvant
adenoidectomy. TARGET was a multicentre trial, examining children up to 2
years after randomisation to VTs, VTs and adenoidectomy (VTs+ad) or further
watchful waiting (the term further was used because all children had already
undergone a three month observation period prior to randomisation). There
were also some children in whom symptoms were deemed so severe that
withholding surgery would be unethical (termed obliged to treat, OTT), and
these were listed straight for surgery, with the type of surgery allocated being
59

chosen by the clinician on the basis of need; these children were included in
the final analysis together with the randomised ones to boost patient numbers.
VTs were shown to benefit hearing, but only for as long as they stay in place
(Browning 2012) (MRC Multicentre Otitis Media Study Group 2001a) (MRC
Multicentre Otitis Media Study Group 2001 b). Once VTs extruded, those
children treated with VTs had hearing that was the same as the children
receiving no surgery; a variety of reasons was responsible for this lack of a
benefit of VTs at 2 years, including the fact that in the VT group hearing again
deteriorated after VT extrusion, in the further watchful waiting group hearing
improves over time in keeping with natural history of OME, and also because
62% of the group randomised to further watchful waiting actually switched to
receive surgery within a year (thus diminishing benefits of surgery if analysis
on intention to treat basis is performed; further watchful waiting was
incorporated into TARGET to determine if surgery could be avoided
altogether, but the high switching rate from observation to surgery confirms
parental and clinician beliefs that surgery is required and effective).
In contrast, adjuvant adenoidectomy benefits hearing for the full 2 year
duration of the trial, so that even after VTs have extruded the children that had
VTs+ad still have better hearing than those receiving no surgery (Fig 5.1.1).
60
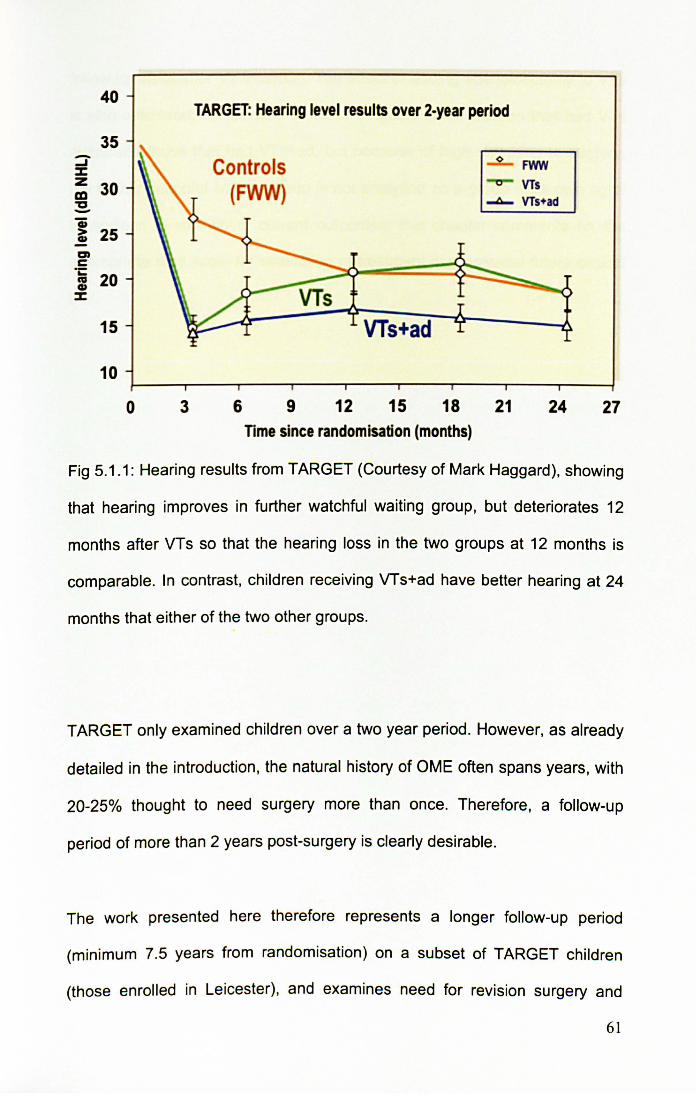
40
35 -...J % Z 30 CD ~ -a; > 25 CD
en c -.:
20 IV CD
%
15
10
0 3
TARGET: Hearing level results over 2-year period
Controls (FWW)
6 9 12
VTs+ad
15 18 TIme since randomisation (months)
-2.... FWN
-0- VTs ~ VTs+ad
21 24 27
Fig 5.1 .1: Hearing results from TARGET (Courtesy of Mark Haggard). showing
that hearing improves in further watchful waiting group, but deteriorates 12
months after VTs so that the hearing loss in the two groups at 12 months is
comparable. In contrast, children receiving VTs+ad have better hearing at 24
months that either of the two other groups.
TARGET only examined children over a two year period. However, as already
detailed in the introduction, the natural history of OME often spans years, with
20-25% thought to need surgery more than once. Therefore, a follow-up
period of more than 2 years post-surgery is clearly desirable.
The work presented here therefore represents a longer follow-up period
(minimum 7.5 years from randomisation) on a subset of TARGET children
(those enrolled in Leicester), and examines need for revision surgery and
61
follow-up visits after VT insertion. The effect of adding adenoidectomy to VTs
is also assessed; comparison is made between those children that had VTs
alone and those that had VTs+ad, but because of high switching to surgery,
the further watchful waiting group is not analysed as a group in its own right.
In addition to examining current outcomes, this chapter comments on the
appropriate time scale for evaluation of treatment in a potential future clinical
trial.
62
5.2 METHODS
TARGET, the Trial of Alternative Regimens in Glue Ear Treatment has been
described above, and its structure and patient flow are shown in Fig 5.2.1 and
5.2.2, respectively. Children aged 3.5 to 7 years, with a hearing level of 20 dB
NHL or worse, and tympanometry indicative of middle ear fluid (B on both
sides, or B on one side and C2 on the other), were included. The "obliged to
treat" children were included with the randomised ones to boost numbers for
analysis, with work by TARGET team confirming validity of this strategy
instead of analysis by intention to treat, because both analysis strategies yield
very similar results; the combined analysis was termed "as allocated" as it was
performed on the basis of a treatment that the child was allocated rather than
randomised to.
In addition to short (2 years) scheduled trial follow-up, TARGET obtained
outcomes in an adjunct study after visit 7 (post visit 7, PV7, study) that
examined the need for further treatment after the scheduled two years of the
initial trial. However, the PV7 length of follow-up was 1.2-5.5 years after trial
exit, meaning that the follow-up in some cases was as short as 3 years and 3
months from randomisation. Therefore, an additional way of assessing long
term outcomes was required. The original TARGET data was collected by the
TARGET multi-centre team, with my involvement dealing purely with this
supplemental, long-term study shown in this thesis.
63
The data presented in this chapter encompass a further adjunct study,
TARGET long term, which analysed consultations even beyond PV7 study,
although only on a subset of patients. The minimum follow-up period was 7.5
years from randomisation to the time of notes review taking place. TARGET
long term study assessed effectiveness of VTs and VTs+ad by analysing the
number of follow-up visits required and any need for further surgery. The
notes of Leicester TARGET children were examined, and data on clinic visits
and further surgery collated with existing information from the original two-year
trial and the subsequent PV7 study. The TARGET team confirmed that
Leicester children were representative of the whole TARGET group.
Two different types of analysis were performed to compare VTs with VTs+ad.
The first analysed children on the basis of what treatment they were allocated
(encompassing the randomised children, as well as the obliged to treat ones).
The second analysed children on the basis of what treatment they actually
received, and thus contains a large number of children that were initially
allocated further watchful waiting but switched to a surgical arm. Overall
patient numbers are relatively small; for example, if one were to look for rates
of repeat surgery to fall from 30 to 15%, a total of 124 patients in each group
would be required to have 80% power to detect a significant difference at the
0.05 level (using Lehr's formula). Statistical analysis was performed using
SPSS PASW 18.
64
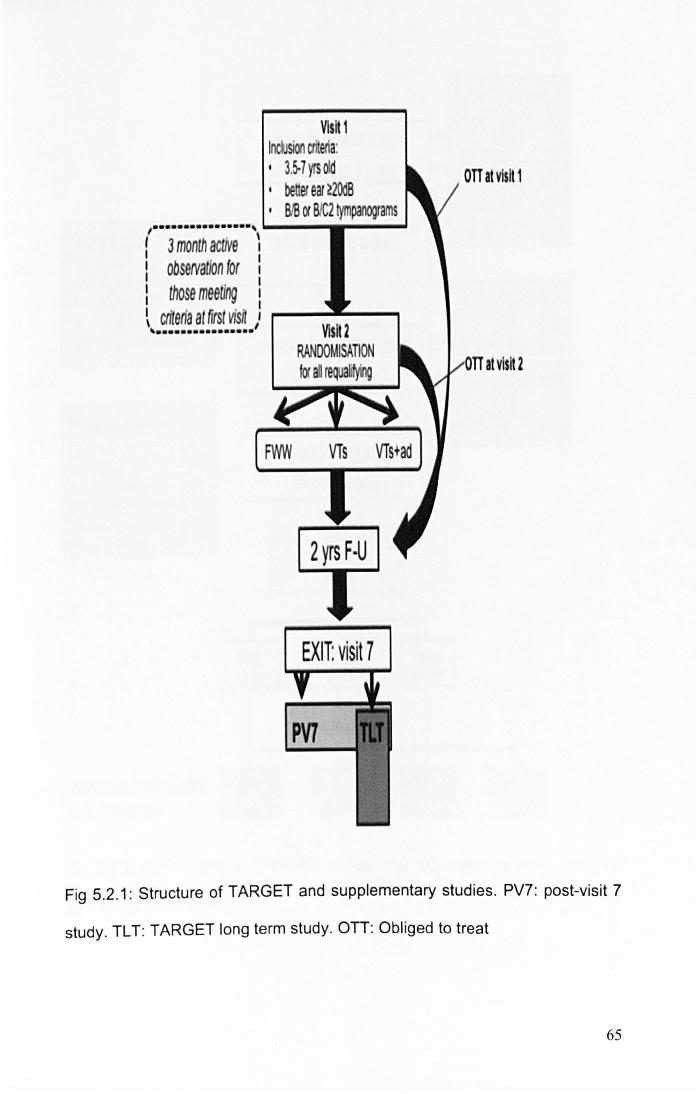
, ...•.•.•........ , I 3 month actiVe ~ I obseNaUon for :
I
V1sH 1 Inclusion . eria: I 3.5-7 yrs od I be er ear ~2OdB I BIB or BlC2 tympanograms
I those meeting I
~ criteria at first visft ,: .--.... _....., , .•.•..••...•..••
FWW VTs VTs+ad
2 yrs F·U
EXIT: visit 7
PV7
OTT at visit 1
at visit 2
Fig 5.2.1: Structure of TARGET and supplementary studies. PV7: post-visit 7
study. TL T: TARGET long term study. on: Obliged to treat
65

Assessed for eligibility at mJ11 ~
3828 referrals from 11 cenlres ~
Exclusions at vlsH 1 ~
Children qualifying at riJI11 (totJl:53~:
1546 , 0vtrriIIni COIUIII W , P .. III rtfuHd I 53 • NppropriiJ "'tmlllO , Other I"g. ~tieIl) I Assessed for eI~lblllty at mJ1l ~ m
Exclusions at vlsH 2 (total=19~: Did not 6nd 112 0vtrrIding concern I ,. RtfuItd prior to rIIIdomiutIon I 25 Otherl •. g. mIWp"'~ 120 RtfuItd rnIomIution ''1
It-
F'IM n;112
Ftnallreatments a~er transfers FYtW
from a/Joca ed ps . " 5)
1011 rom 1/ cen res ~
Children qualifying at m1tl 1 11 cen s
Random/sed n: 376
VTI n= 12&
I 2 years of trial follow-up
Yr.
/I '"
VTs+Ad n;12t
In~ I n t.,
F ... crIIII
12242
0bIIgtd to frII' (OTT. V1)
n= 40
F .. _.
*'T 1424
0bIftd to frIIt (OTT. VZJ
n= 6
Fig 5.2.2: Patient flow in TARGET clinical trial. (Courtesy of Mark Haggard
and Josephine Higson)
66

The following variables were examined:
• Number of clinic visits at any time from randomisation
• Number of clinic visits after the final planned trial visit at 2 years after
randomisation
• Number of OME-related surgical procedures at any time from
randomisation
• Number of OME-related surgical procedures after the final planned trial
visit at 2 years after randomisation
• Number of patients having OME-related surgery in addition to the
treatment that they were allocated (in case of "as-allocated" analysis),
• Number of patients having more than one procedure (in case of "as-
treated" analysis)
• Length of clinical care, from randomisation to last clinical encounter
• The percentage of patients visiting clinic after the trial end date
• The percentage of patients having OME-related surgery after the trial 2
years
• The percentage of patients visiting clinic or having OME-related surgery
after the trial 2 years
Only OME-related additional procedures (VTs or other middle ear surgery,
adenoidectomies) were counted.
To assess how long any future trial should last, the number of visits made in
each subsequent year after the end of the trial 2 years was examined.
67

5.3 RESULTS
Of the 432 randomised plus obliged to treat children in TARGET, 102 were
enrolled in Leicester (almost one quarter of the total): 93 randomised and 9
obliged to treat. Medical records of 98 children were available for analysis.
The minimum follow-up period from randomisation was 7.5 years, ranging up
to 11.6 years.
Table 5.3.1 shows the outcomes when patients were analysed on the basis of
what treatment they were allocated (encompassing those that were
randomised plus obliged to treat children). Table 5.3.2 compares outcomes
when analysis was performed on the basis of what the patient actually
received (and thus contains additional switchers from further watchful waiting
to surgery).
68

ANALYSIS: AS-ALLOCATED VTs VTs+ad p
(N=33) (N=35)
CLINIC VISITS
Mean N of visits at any time (SO) 9.58(5.62) 8.46(4.84) 0.381
Mean N of visits after last trial visit (SO) 3.79(5.22) 2.57(4.05) 0.285
SURGICAL PROCEOURES
Mean N of procedures per patient at any time (SO) 2.27(1 .35) 1.66(1 .06) 0.040
Mean N of procedures after last trial visit (SO) 0.85(1.09) 0.49(0.85) 0.131
N (%) pts having procedures additional to allocation 21 (63.6) 16(45.7) 0.138
LENGTH OF CARE
Years (SO) 4.25(2.73) 3.62(2.69) 0.334
NEEO FOR CARE AFTER LAST TRIAL VISIT
N (%) of patients attending clinic 24(72.7) 18(51.4) 0.071
N (%) of patients having surgery 18(54.5) 11(31.4) 0.054
N (%) of patients attending clinic or surgery 24(72.7) 19(54.3) 0.115
Table 5.3.1: TARGET Long Term outcomes, analysing patients on the basIs of
allocated treatment. N: number. SO: standard deviation. P: p-value obtained
using Chi squared test (comparing proportions) or t-test (comparing means)
69
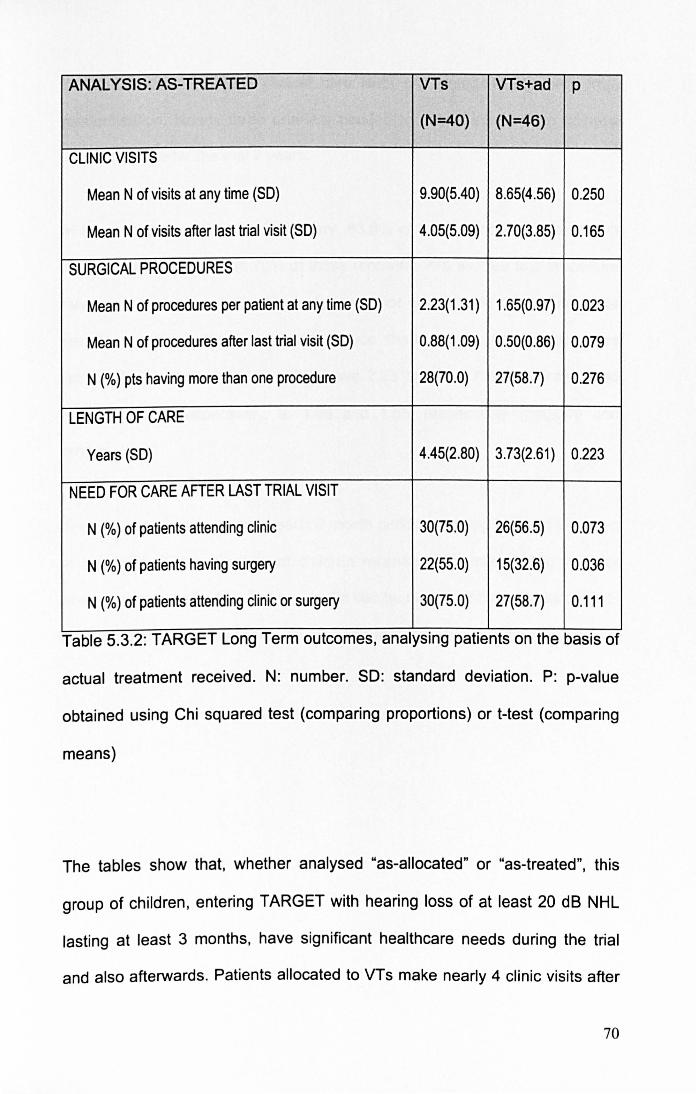
ANAL YSIS: AS-TREATED VTs VTs+ad p
(N=40) (N=46)
CLINIC VISITS
Mean N of visits at any time (SD) 9.90(5.40) 8.65(4.56) 0.250
Mean N of visits after last trial visit (SD) 4.05(5.09) 2.70(3.85) 0.165
SURGICAL PROCEDURES
Mean N of procedures per patient at any time (SD) 2.23(1.31 ) 1.65(0.97) 0.023
Mean N of procedures after last trial visit (SO) 0.88(1.09) 0.50(0.86) 0.079
N (%) pts having more than one procedure 28(70.0) 27(58.7) 0.276
LENGTH OF CARE
Years (SD) 4.45(2.80) 3.73(2.61) 0.223
NEED FOR CARE AFTER LAST TRIAL VISIT
N (%) of patients attending clinic 30(75.0) 26(56.5) 0.073
N (%) of patients having surgery 22(55.0) 15(32.6) 0.036
N (%) of patients attending clinic or surgery 30(75.0) 27(58.7) 0.111
Table 5.3.2: TARGET Long Term outcomes, analysing patients on the basIs of
actual treatment received. N: number. SD: standard deviation. P: p-value
obtained using Chi squared test (comparing proportions) or t-test (comparing
means)
The tables show that, whether analysed "as-allocated" or "as-treated", this
group of children , entering TARGET with hearing loss of at least 20 dB NHL
lasting at least 3 months, have significant healthcare needs during the trial
and also afterwards. Patients allocated to VTs make nearly 4 clinic visits after
70
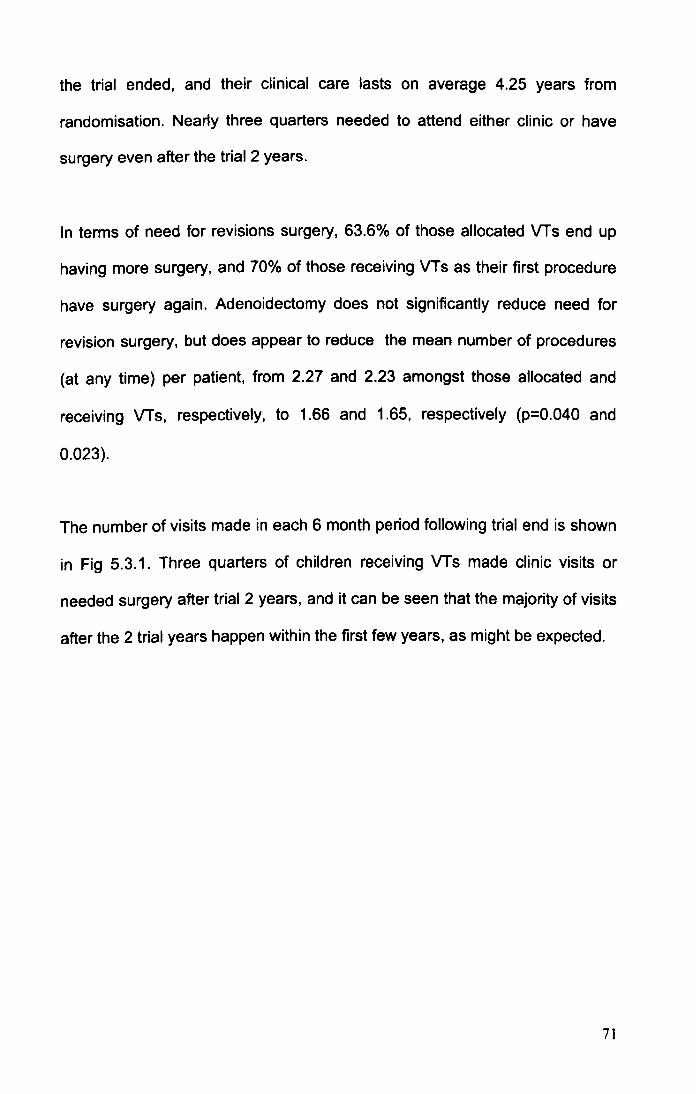
the trial ended, and their clinical care lasts on average 4.25 years from
randomisation. Nearly three quarters needed to attend either clinic or have
surgery even after the trial 2 years.
In terms of need for revisions surgery, 63.6% of those allocated VTs end up
having more surgery, and 70% of those receiving VTs as their first procedure
have surgery again. Adenoidectomy does not significantly reduce need for
revision surgery, but does appear to reduce the mean number of procedures
(at any time) per patient, from 2.27 and 2.23 amongst those allocated and
receiving VTs, respectively, to 1.66 and 1.65, respectively (p=0.040 and
0.023).
The number of visits made in each 6 month period following trial end is shown
in Fig 5.3.1. Three quarters of children receiving VTs made clinic visits or
needed surgery after trial 2 years, and it can be seen that the majority of visits
after the 2 trial years happen within the first few years, as might be expected.
71

50
45
40
13 35 'iii .:: 30 ... ~ 25 ~
J:)
e 20 = z 15
10
5
o ~~~=-=--=--=--=--=:...=~=-~!:::j!!:=jl!=~~~~~~ Lfl .... ~ N ~ M ~ ~ Lfl Lfl Lfl \D Lfl t-. Lfl co Lfl 0- Lfl
0 , , , ,
~ ,
vi J, '" , r..: , o::i
, 0' Lfl ....
~ N ~ M Lfl Lfl Lfl Lfl Lfl , 0
, N
, M
, ~
, vi
,
'" ,
r..: 00 o::i ,
0 .... .... N M ~ Lfl \D t-. 0-
Years after end of trial 2 years
Fig 5.3.1: Total number of visits taking place during each 6 month period
following TARGET 2 years.
The number of visits (following the end of the 2 year trial) made by children of
different ages is shown in Fig 5.3.2. The mean age of children making visits
after trial ended was 9.4 years, range 6.0 to 17.0, with mode 7.0 and median
9.0. After 11 years of age, the number of visits falls off, and more than 95% of
visits have happened before 14 years of age. Fig 5.3.3 details the age at
which last visit was made by each of the patients. The mean age at the last
visit was 8.8 years, ranging from 4.4 to 17.1, with a mode of 13.0 years and
median on 8 years. Majority of patients were aged 7-9 when they last made
their ENT visit, and a further steep fall can be seen after 13 years. Taking
these two last measures together, it would appear that by the time a child
reaches 14 years , majority of OME-related disease appears to have resolved
72
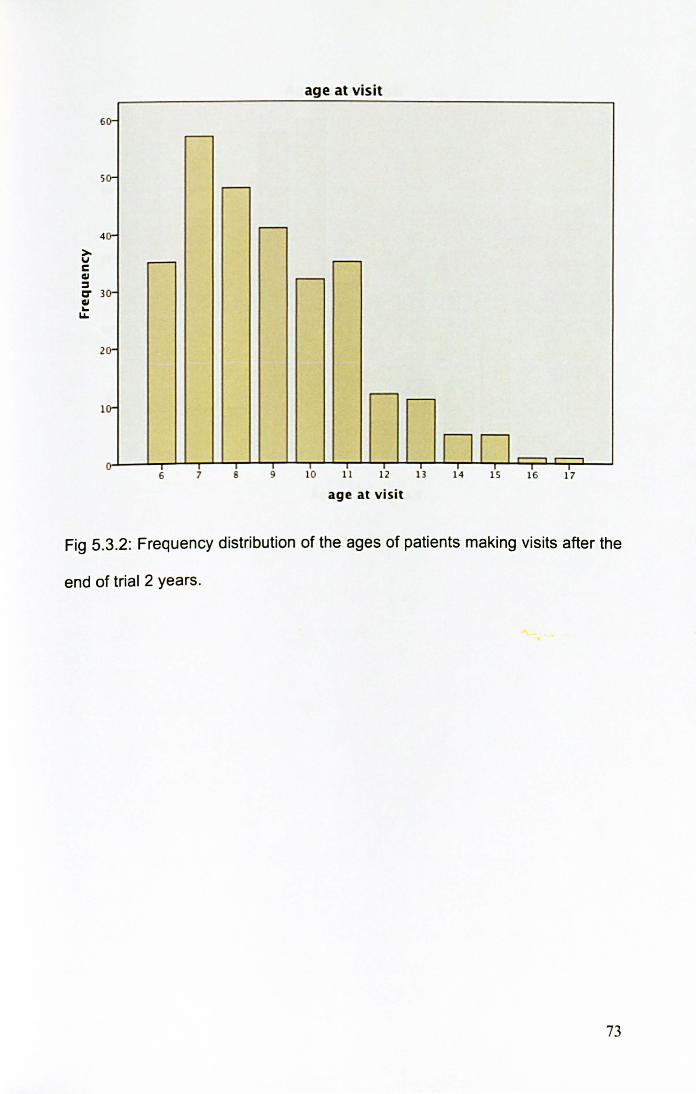
>v C QI ::::I
6
5
4
C' 3 QI ~ u..
2
0-
0-
0-
0-
0-
0-
u
~
~
r--
r--
6 7 9
age at vis it
.---r--
r-- .---
nn~~ T
10 11 12 13 14 15 16 17
age at visit
Fig 5.3.2: Frequency distribution of the ages of patients making visits after the
end of trial 2 years.
73

- - -Age at last visit
2 s .---
,.......-
2 0-
S
r--
0-.---
..-- ..--
5 .--- ,.......-
.---
II nil v T T
4 s 6 7 8 9 10 11 12 13 16 17
Fig 5.3.3: Frequency distribution showing the patients' ages at last clinic visit.
74

5.4 DISCUSSION
5.4.1 Summary of results
The research presented here examined long term (> 7.5 years from
randomisation) outcomes of VTs and VTs+ad, on a subset of children enrolled
in the 2-year TARGET randomised controlled study of children with OME
lasting at least 3 months and with a hearing loss of at least 20 dB NHL.
Children allocated to VTs make on average nearly 4 clinic visits after the trial
ended, their clinical care lasts on average 4.25 years from randomisation (and
the time waiting for randomisation, initial ENT visit, and GP care on top) and
nearly three quarters still needed to either attend clinic or have surgery even
after the trial 2 years. Repeat surgery is necessary in 63.6% of those allocated
VTs, and 70% of those that received VTs as their first treatment.
Adenoidectomy did not significantly reduce need for revision surgery, but did
reduce the mean number of procedures per patient from 2.27 to 1.66 (as
allocated) and from 2.23 to 1.65 (as-treated).
5.4.2 Choice of study population
A major advantage of the TARGET clinical trial was that it studied the severely
affected children that are being considered for surgery in modern UK practice;
in fact, the TARGET entry criteria have now been broadly adopted by the
NICE guidelines as the criteria defining eligibility for surgical treatment (NICE
2008). Therefore, the TARGET children are the ones that have severe
disease, and are representative of the kind of children that are treated in UK
today.
75
The TARGET children also represent a much more severe population than
has been studied by some other trials that may have included children with
unilateral OME or OME of short duration, therefore representing a population
of children in whom OME is likely to resolve soon anyway; for example, the
Paradise trial that is often quoted as saying that VTs are "ineffective" included
children with unilateral effusions or OME that is not continuously present for a
minimum of 3 months, and in fact only 20% of the children studied had
bilateral OME continuously for a minimum of 3 months (Paradise, et al. 2007).
The fact that over half of those allocated in TARGET to a non-surgical arm
switched to surgery supports the severity of OME in the population studied, as
does the very high need for repeat surgery (63.6% in VTs and 45.7% in
VTs+ad), and the high number of mean procedures per patient (2.27 and
1.66, respectively). The use of short term ventilation tubes (Shepard tubes) in
the trial is likely to be partly responsible for the high revision surgery rate; in
addition, the longer one follows patients the more one sees need for repeat
surgery, so that studies with> 2 years follow-up typically report much higher
revision surgery rates (68% (Maw and Bawden 1994) and 36% (Kadhim, et al.
2007» that are also seen in TARGET Long Term study. The fact that usual
figures quoted for repeat surgery are 20-25% (Gates, Avery and Prihoda
1987) again illustrates that TARGET studied a severely affected population
and that long follow-up is imperative.
76

5.4.3 Choice of outcome measure
Defining "success" of OME treatment is difficult. Hearing levels are easy to
measure, but in themselves do not necessarily reflect the complex interaction
between hearing, child's personality and abilities, environment, and adult
input, all of which together influence a child's performance in their day to day
activities, schooling and speech. Much research has looked at hearing levels
because this is a quantitative variable that surgeons understand, but the
"softer" outcomes have been less well studied.
Looking at need for surgery or clinic visits as an outcome measure has distinct
advantages. Both are determined by a composite that includes all the different
variables that interact to affect how a child and parents deal with hearing loss,
from the actual hearing level through fluctuation, intellect and social
environment. However, such outcome measures are not objective like hearing
levels or tympanograms, because they are influenced by parental and
surgeon preferences; nevertheless, they are useful because they represent
what happens in the real world. They are also very practical when exploring
long term outcomes, as they simply record standard practice, and no
additional investigations are required. For example, a child that is well is
unlikely to wish to return for a hearing test 5 years after surgery because of
trial requirements, but if they are no longer being seen in clinic it is reasonable
to assume that they are having no or minimal problems.
77

However, a strategy based on hospital records follow-up does not take
account of any care given in the community for example by the General
Practitioners, and it also relies on people not visiting other hospitals or moving
away. These concerns cannot be answered by our study, but it is unlikely that
children randomised to one treatment are more likely to move away than
those randomised to another arm, and only one hospital in Leicester provides
ENT services. So, subject to reservations outlined above, looking at clinic
visits and need for further surgery is a reasonable and practical way of
examining long-term outcomes of OME treatment.
5.4.4 Treatment with VTs
TARGET showed that during the 2 years of the trial, VTs conferred a hearing
benefit compared with no surgery. However, this was short lived, likely
because hearing deteriorates once tubes extrude, those in no surgery group
may spontaneously improve, and also the switching from further watchful
waiting into surgery diminishes the benefits seen with VTs. In terms of
hearing, at 2 years there is little difference between children randomised to
VTs or no surgery.
TARGET long term study assessed clinic visits and need for further surgery.
In terms of clinic visits, any that occurred after the trial 2 years are more
informative than those within 2 years, because the trial itself called for regular
scheduled visits, but any attendances after 2 years represent genuine clinical
need.
78
The results demonstrate that the clinical needs of children receiving VTs are
substantial and stretch well beyond two years post randomisation. Analysing
children as-treated shows that the mean number of visits was 9.9 (this also
encompasses the 5 visits routinely planned as part of TARGET), but 75.0% of
children still made clinic visits after trial ended, with the mean number of visits
following trial end being 4.1. Also, 70.0% had to have surgery again, the mean
number of procedures per patient was 2.2, and the mean length of care from
randomisation to last recorded visit was 4.5 years.
The need for further surgery in TARGET long term study appeared to be
higher than the 20-25% rate reported in other studies (Gates, Avery and
Prihoda 1987). As discussed above, a longer follow-up period picks up more
children with on going problems, so that other studies looking at long term
outcomes do typically report higher need for revision surgery, for example 36 -
68% (Kadhim, et al. 2007) (Maw and Bawden 1994). Additionally, the
TARGET children represent a severely affected population and as such would
be expected to have worse outcomes that the mildly affected children studied
elsewhere (Paradise, et al. 2007). TARGET also used short term ventilation
tubes (Shepard tubes), and although such tubes are less likely to lead to
persistent perforation once tube extrudes, the fact that they only stay in for 6-9
months or so means that many children remain troubled by OME once tubes
extrude.
The data on VT outcomes presented here is also in keeping with studies
examining spontaneous OME resolution without surgery, which demonstrated
79
that, in children with bilateral OME that has already persisted for 3 months at
the start of the study, OME has resolved in only a third of children 1-2 years
later (Introduction Table 2.2.3.1) (Rosenfeldt and Bluestone 1999) (Maw and
Bawden 1994). This is in keeping with TARGET's findings and the suggestion
that VTs are a temporary management solution while waiting for OME to
spontaneously resolve.
Given the high need for repeat surgery following VTs, a treatment that would
provide a more long-term or permanent solution for OME would be welcome.
5.4.5 Adding adenoidectomy to VTs
The TARGET 2 years had already shown that adenoidectomy in addition to
VTs benefits hearing during and at the end of the trial 2 years. Adenoidectomy
also appears beneficial later on as shown here, in terms of a reduction in the
mean number of procedures per patient, although the magnitude of benefit
(approximately 0.6 procedures per patient less with adenoidectomy) may not
be large. Small patient numbers make meaningful statistical interpretation
difficult when examining recurrence rates, and a larger patient group would be
required to show a definitive benefit (or lack thereof). Adenoidectomy may
also confer other benefits, for example less nasal obstruction, snoring and
sleep apnoea, and sinusitis (Lieser and Derkay 2005) (Helfaer, et al. 1996),
but these have not been studied here.
One could argue that the reason that children allocated VTs alone end up
having more procedures is simply because they still have the adenoid that
80
may end up being removed for non-OME reasons. However, all but one
adenoidectomy in this study was performed in conjunction with ear surgery;
one child had adenoidectomy together with tonsillectomy as a second
procedure, but then ended up having revision adenoidectomy and VTs as a
third procedure. Therefore, it cannot be said that adenoidectomies for non
OME reasons form a significant number of cases. Additionally, because the
study allowed the treatment of children on an "obliged to treat basis", any child
with adenoid-related symptoms right at the start would not have been included
in randomisation but instead would be in the obliged to treat group that ends
up being analysed in the VTs+ad group. Whilst children may of course
develop adenoid-related symptoms after randomisation, at least the ones with
adenoid symptoms at the start are likely to have ended up with
adenoidectomy as their primary treatment.
Other research has also found adenoidectomy to be beneficial, as discussed
in the main introduction, finding reduced time with effusion, reducing the mean
number of tubes per patient, and a halving of the need for further surgery
(Black, Sanderson, et al. 1990) (Gates, Avery and Prihoda 1987) (Kadhim, et
al. 2007) (Maw and Bawden 1994) (NHS Centre for Reviews and
Dissemination 1992) (Popova, Varbanova and Popov 2011) (van den
Aardweg, Schilder, et al. 2010), although this has not been found universally
(Casselbrant, Mandel, et al. 2009) (Dempster, Browning and Gatehouse
1993). As discussed in main introduction, the likely reasons for
adenoidectomy being beneficial to OME is the removal of nasopharyngeal
biofilms that can act as a persistent focus for infection ascending the
81

Eustachian tube to the middle ear (Hoa, et al. 2010) (Kania, et al. 2008)
(Nistico, et al. 2011) (Tonnaer, et al. 2005) (Winther, et al. 2009).
Despite strong evidence in favour of adding adenoidectomy to VTs, this is not
the recommended practice. UK guidelines (NICE 2008) advise that
adenoidectomy should be performed if there are other, non-OME indications,
whereas the US guidelines (R. Rosenfeld, et al. 2004) recommend it together
with the second set of VTs. Because many children only have one set of
tubes, subjecting all to adenoidectomy will expose many to unjustifiable
additional surgical risks, and adenOidectomy itself does not prevent OME
recurrence even if all children receive it.
Thus, even with adjuvant adenoidectomy, the outcomes of OME treatment
remain unsatisfactory, and 58.7% of those treated with VTs+ad still require
further surgery according to this long term study in severely affected children.
Any new strategy that may improve the high need for further surgery would be
welcome.
5.4.6 How long should any future OME trial last?
Any randomised controlled trial faces the issue of appropriate time scale
through which to evaluate a treatment, but in OME the timing issues are
particularly challenging, because OME is a variably manifesting, fluctuating
and eventually resolving condition. For most types of VTs an initial duration of
up to 12 months is reasonable, as it is likely that tubes will have extruded by
then. However, any trial needs to be sufficiently long to capture events after
82
VT extrusion and determine all benefits or risks. On the other hand, having too
long a time-frame could be counterproductive, creating practical and resource
problems in realising the trial, and setting up an unrealistic scale of lasting and
large benefit against which an actual modest and short-term (though possibly
worthwhile) result will appear insignificant.
TARGET itself ran for 2 years, but the data presented here indicate that,
although much important information can be obtained during 2 years, a
significant number of children require care beyond 2 years. Differences
beyond 7.5 years from randomisation (the minimum follow-up period in
TARGET long term study) are less likely to be of interest, because by that
stage children will be at least 11 years old (7.5 years from randomisation +
minimum age 3.5 years at randomisation), beyond the age when OME
resolves in many of children. However, longer follow up still could add more
useful information, particularly as published data suggest that it takes 10 years
before OME has resolved in 95% of children (Maw and Bawden 1994)
(Rosenfeldt and Bluestone 1999).
The current treatment of OME requires improvement to try and reduce the
high recurrence rate. The data presented in subsequent chapters in this thesis
suggests that using a modified release antibiotic formulation in the middle ear
to treat biofilms associated with OME is a promising future therapeutic
strategy. As such, at some stage a clinical trial will be planned to determine
the effectiveness of this strategy. So what would be an appropriate time for
trial duration? To some extent this is a subjective decision, but 2 years is
83
clearly not enough, and the trial should also extend beyond the 4.5 years that
was the mean duration of care in children receiving VTs. A follow-up time of
7.5 years from randomisation seems a sensible trial duration based on data
presented here, although extending this to 10 years would be better still.
Following up until a certain age is perhaps a better strategy (as it is known
that OME does eventually resolve), and the data here support the notion of
follow-up until a child is 14 years old. The trial duration recommendations
made here seem sensible on the basis of presented data, but it has to be
remembered that if one followed up children longer than in this study,
additional visits at a later age could still become apparent.
The duration of future trials may also be in part determined by the outcomes
studied, and the ease with which the necessary data can be obtained. If one
examines need for repeat surgery then a long term view if necessary, but
insisting that all children irrespective of on going problems attend clinic is not.
To study hearing, repeat attendances for audiometry would be necessary. If
one studies the benefits that adenoidectomy has on nasal obstruction, then a
2 month follow-up period is sufficient, at least initially, because surgery can be
expected to have almost immediate benefit. If one studies acute otitis media,
follow-up beyond 2 years of age can be limited, because most children grow
out of the disease by that age. Medical records follow-up as in TARGET long
term study appears to have been a successful, achievable, and affordable
way of studying the outcomes of clinic visits and need for further surgery,
whilst asking people to return to clinic or fill in questionnaires may have
84
received little uptake. A future clinical trial could therefore adopt a similar
structure as TARGET and its long term follow-up studies.
85
5.5 TARGET LONG·TERM STUDY: CONCLUSION
The recommended treatment for persistent OME, Ventilation Tube insertion,
has significant shortcomings. Examining the long term (>7.5 years from
randomisation) outcomes of VTs and VTs+ad, on a subset of children enrolled
in the 2-year TARGET randomised controlled study of children with OME
lasting at least 3 months and with a hearing loss of at least 20 dB NHL,
demonstrates that the clinical care of children having VTs lasts on average
4.25 years from randomisation, repeat surgery is necessary in 63.6% of those
allocated VTs, and the average number of procedures per child is 2.27.
Although adenoidectomy can reduce the mean number of procedures, the
need for repeat surgery remains very high. The research presented here also
demonstrates the importance of sufficiently long follow-up of children with
OME to ensure that all their clinical care is captured.
Current OME treatment therefore has significant shortcoming, and any new
treatments based on thorough understanding of OME aetiopathogenesis could
improve the care of countless children. Irrespective of their shortcomings, VTs
are currently the only treatment recommended by NICE. But are clinicians
actually following these recommendations? The next chapter examines
whether children are being listed for surgery in accordance with NICE
guidelines, and whether their recent introduction has changed practice.
86
6 ARE WE FOLLOWING NICE GUIDELINES ON THE
MANAGEMENT OF OTITIS MEDIA WITH EFFUSION?
6.1 INTRODUCTION
Although OME is transient in the majority of children, a proportion develop
persistent symptoms that may affect hearing, education, language or
behaviour (Hall, Maw and Steer 2009) (NICE 2008). If OME persists after a
three month period of watchful waiting, treatment with ventilation tubes (VTs,
grommets) or hearing aids may be considered (NICE 2008) (Lous, et al.
2005). With most UK parents opting for surgery, VT insertion is one of the
commonest surgical procedures in children (Kubba, Pearson and Birchall
2000), with over 30,000 inserted in England each year (HES 2010).
The UK National Institute of Clinical Excellence (NICE) guidelines on surgical
management of OME (NICE 2008) provide detailed guidance on the
management of children younger than 12 years with suspected OME,
covering history-taking, examination, and audiometric testing, and offering a
review of the different management options. The guidelines, applied to "newly
diagnosed OME of unknown duration", call for an initial 3 month period of
observation, with repeat audiological assessment at the end of the three
month period. At that stage, VT insertion should be considered for children
with persistent bilateral OME with a hearing level in better ear of 25-30 dB
NHL or worse (termed core criteria in this thesis), or for children not meeting
87

those audiometric criteria but when OME has significant impact on
developmental, social or educational status (termed exceptional
circumstances in this text). The guidelines state that surgery is not appropriate
for children that have OME only for a short time period or in cases where OME
has little effect on child's function and development. Adenoidectomy is not
recommended in the absence of co-present history of frequent upper
respiratory tract infection.
We carried out a multi-centre comparison to establish whether children are
being listed for surgery in accordance with NICE guidelines, and whether the
guidelines have changed clinical practice.
88
6.2 METHODS
A multi-centre retrospective case-notes review was undertaken, including all
children aged 12 years or under having VT insertion before (Jul-Dec 06) and
after (Jul-Dec 08) guideline publication in Feb 08. The units involved were
Kings Mill Hospital Mansfield (Daniel, L Harrison), Queen's Medical Centre
Nottingham (Daniel, Cho), Royal Derby Hospital (Daniel, Kamani, A Harrison),
Royal Free Hospital London (Jaberoo, Yalamanchili) and Lincoln County
Hospitals (EI-Shunnar).
The guidelines were published in February 2008, and the study time period
chosen therefore allowed over 4 months for guidelines' implementation, and
all patients included would have been listed for surgery since guidelines
publication. To establish whether guidelines had changed clinical practice, a
six month period (keeping the time of year the same) prior to the introduction
of the guidelines was also studied (1 st July to 31 st December 2006), applying
the same NICE criteria retrospectively.
All children aged less than 12 years having VT insertion were identified using
the Hospital Information Support System data, and their medical records
reviewed to identify those that had first VT insertion. Children with Down's
syndrome or cleft lip I palate were excluded (NICE guidelines specify a
different management pathway), as were those having surgery other than VTs
alone or VTs with adenoidectomy, or those with major comorbidities, special
89
educational needs or other sensory impairment that may affect the decision to
list for surgery.
The medical records of the included children were studied to determine
whether they were listed for surgery in accordance with NICE guidelines. The
following variables were studied:
• Did the child have two audiograms at least three months apart?
• Did the child meet the audiological criteria of a hearing level of 25 dB NHl
or worse (averaged at 0.5, 1, 2 and 4 kHz) in the better ear, at time of
listing or at the pre-operative audiogram closest to surgery?
• If both above criteria were met the child was deemed to have fulfilled
guideline's core criteria.
• Did the child have OME duration of at least 3 months on the basis of
history, irrespective of whether the child had two audiograms or not?
• When core criteria were not met, the clinical notes were reviewed to
establish whether there was an extenuating reason for surgery, typically
concerns over speech or schooling, or recurrent acute otitis media (AOM).
The group of children that either met core criteria or had extenuating
circumstances leading to surgery were deemed to have complied
guideline's broad criteria.
• What proportion of children complying with the broad criteria achieved this
status due to extenuating circumstances?
• Number of children having adenoidectomy was also examined, and we
sought to establish whether adenoidectomy was performed purely for OME
90

or whether there was another reason in the notes that justified
adenoidectomy.
Statistical analysis was performed using SPSS Statistics 19. Differences in
proportions were analysed using the Pearson Chi squared test or the Fisher's
exact test if numbers were small. The Student's t test was used to assess
differences in means.
91
6.3 RESULTS
A total of 319 patients were included in the study. Notes of a further 41
(11.4%) patients could not be obtained despite multiple searches at different
times. The five different hospitals contributed 41, 90, 107, 30, and 51 patients,
respectively.
Pooled data from all 5 units were used to compare practice in accordance with
the set criteria before and after guidelines were introduced. During the pre
guidelines period there were 173 cases, and post-guidelines 146. In three
units the number of VTs reduced, and in two increased after guidelines'
introduction. The percentage of boys was 61.4% overall with no significant
differences between the two time periods, and the mean age during both time
periods was 4.7 years.
Table 6.3.1 compares the two time periods. Practice in accordance with the
core criteria has deteriorated by a significant amount (Chi squared p=0.032).
However, there has been no deterioration in practice in accordance with
guidelines if those children listed for extenuating circumstances were included,
but this was achieved by a Significant rise in the number of such extenuating
cases. A variety of extenuating reasons were noted, these are detailed in Fig
6.3.2.
92
Variation between the five centres was also noted, for example the proportion
meeting core criteria after guidelines publication ranged from 21.1 % to 39.5%,
and the proportion meeting extenuating criteria from 84.2% to 91.3%, but this
variation was not statistically significant. Additionally the centre that was least
likely to meet core criteria had the most children with recurrent ADM (31.6%)
and the centre most likely to meet core criteria had the smallest number of
children with ADM (7.9%), so it is likely that variation in ADM rates in the local
population may be responsible for at least some variation in listing practice.
93
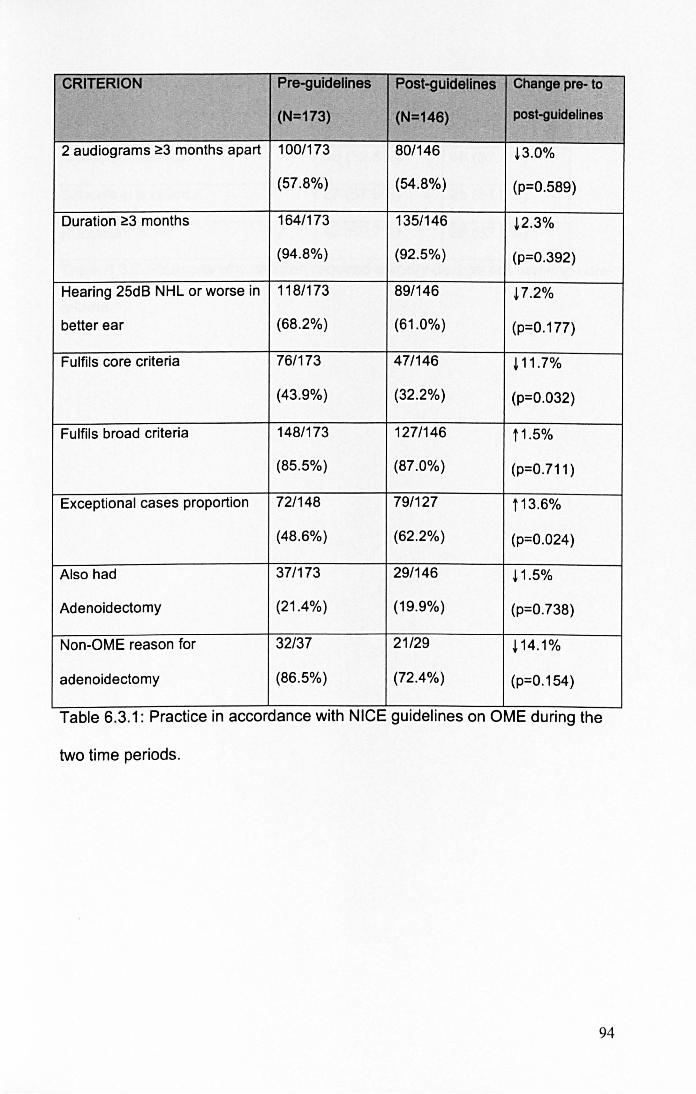
CRITERION Pre-guldellnes Post-guldellnes Change pre- to
(N=173) (N=146) post-guldelines
2 audiograms ~3 months apart 100/173 80/146 !3.0%
(57.8%) (54.8%) (p=0.589)
Duration ~3 months 164/173 135/146 !2.3%
(94.8%) (92.5%) (p=0.392)
Hearing 25dB NHL or worse in 118/173 891146 ~7.2%
better ear (68.2%) (61.0%) (p=0.177)
Fulfils core criteria 76/173 47/146 ~ 11 .7%
(43.9%) (32.2%) (p=0.032)
Fulfils broad criteria 148/173 127/146 11 .5%
(85.5%) (87.0%) (p=0.711)
Exceptional cases proportion 72/148 79/127 t13.6%
(48.6%) (62.2%) (p=0.024)
Also had 37/173 29/146 ! 1.5%
Adenoidectomy (21.4%) (19.9%) (p=0.738)
Non-OME reason for 32/37 21/29 ~14.1%
adenoidectomy (86.5%) (72.4%) (p=0.154)
Table 6.3.1: Practice In accordance with NICE gUidelines on OME dUring the
two time periods.
94
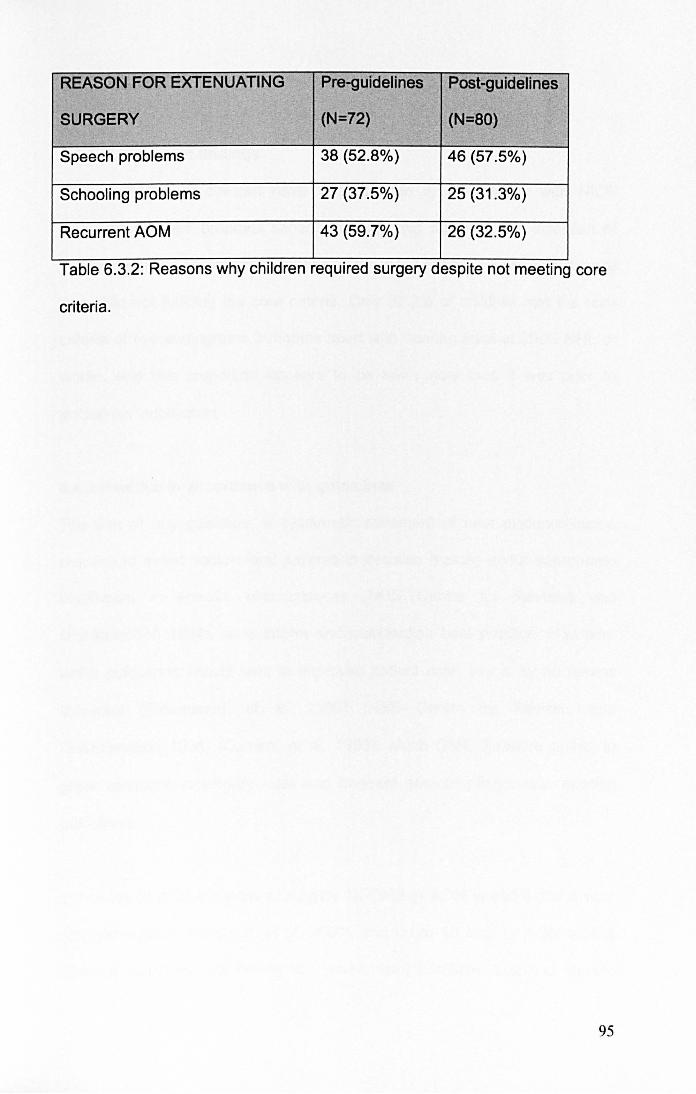
REASON FOR EXTENUATING Pre-guidelines Post-guidelines
SURGERY (N=72) (N=80)
Speech problems 38 (52.8%) 46 (57.5%)
Schooling problems 27 (37.5%) 25 (31.3%)
Recurrent ADM 43 (59.7%) 26 (32.5%)
Table 6.3.2: Reasons why children required surgery despite not meeting core
criteria.
95
6.4 DISCUSSION
6.4.1 Summary of findings
Overall, 87.0% of children have VTs inserted in accordance with NICE
guidelines in their broadest sense, although this relies on the inclusion of
children meeting extenuating circumstances that justified VT insertion despite
that child not fulfilling the core criteria. Only 32.2% of children met the core
criteria of two audiograms 3 months apart with hearing level at 25dB NHL or
worse, and this proportion appears to be lower now than it was prior to
guidelines' publication.
6.4.2 Practice in accordance with guidelines
The aim of any guideline, a systematic statement of best evidence-based
practice to assist doctors and patients in decision making about appropriate
healthcare in specific circumstances (NHS Centre for Reviews and
Dissemination 1994), is to inform and standardise best practice. However,
whilst guidelines should lead to improved patient care, this is by no means
universal (Freemantle, et al. 2000) (NHS Centre for Reviews and
Dissemination 1994) (Oxman, et al. 1995). Much OME literature points to
great variations in surgery rates and frequent non-compliance with existing
guidelines.
In Norway in 2002 the odds of surgery for OME or AOM varied 4 fold across
different regions (Karevold, et al. 2007), and up to 10 fold for AOM across
different countries (UK having the lowest rate) (Schilder, Lok and Rovers
96

2004). Within England, the number of VTs inserted (2007-2010) ranged from
62.1 to 495.1 per 100,000 population (Child and Maternal Health Observatory
2012), which does not seem to be any better than the seven fold variation
between different districts reported in the 1980s (N. Black 1985). There was
also a 10 fold variation in VT rates within Ontario in Canada in the late 1990s
(Coyte, et al. 2001), this variation being larger than that seen in almost any
other procedure.
A US study in 2002 found that >90% of VTs were not inserted in accordance
with guidelines in place at the time, and 81 % were not appropriate according
to criteria developed by an expert panel for the study (Keyhani, et al. 2008).
Even if children with other conditions that predispose to a poor developmental
outcome, those requiring other surgery, or those that had previous VTs were
excluded, the number of appropriate VTs was still less than 40%. The number
of VTs in the UK was in the past considered excessive, and guidelines
published in 1992 (NHS Centre for Reviews and Dissemination 1992)
emphasised the fact that for many children OME was a temporary
phenomenon and watchful waiting should be the norm for most. The rates of
OME surgery in England halved during the 1990s, and although the guidelines
undoubtedly contributed, there was already an existing downwards trend in
surgery rates (Black and Hutchings 2002). The recent publication of NICE
guidelines on the surgical management of OME does not appear to have
affected rates of VT surgery in England and Wales (AI-Hussaini, Owens and
Tomkinson 2011).
97
Several possible explanations exist for the variation in surgery rates, ranging
from differences in clinical opinion on diagnosis and effectiveness of
treatment, to parental preferences, and perhaps financial factors. Of course
the problem may not be that surgeons are ignoring the guidelines, it may be
that parents and health professionals feel that the guidelines are over
restrictive and do not allow personalisation of care to each individual child.
NICE guidelines do make provision for individualised care in those children
that do not meet core criteria but in whom extenuating circumstances (such as
schooling, speech problems or frequent infections) justify surgery.
6.4.3 Duration of OME
OME is a temporary phenomenon in most children. When discovered on
screening of asymptomatic children, it resolves in 63% by three months and in
88% by one year (Rosenfeldt and Bluestone 1999). The NICE guidelines have
taken this into account, as treatment is inappropriate for most children with
incidentally discovered, short-term, unilateral or asymptomatic OME.
The group of children where surgery may be considered are those with
bilateral OME persisting at least three months. This group has a much lower
spontaneous resolution rate, only 32% by one year and 49% by three years
(Rosenfeldt and Bluestone 1999) (Maw and Bawden 1994), with the median
duration of OME being as long as 7.8 years (Maw and Bawden 1993).
Although in this study only just over half of children had two audiograms three
months apart, the proportion of children that had OME for three months or
98
more was in excess of 90%. This apparent discrepancy likely arises through a
variety of reasons: in some younger children it may be difficult to obtain two
audiograms, further waiting may be inappropriate for someone that has
already had hearing loss for a year according to parents, and if a child has
already developed speech or schooling problems at first presentation then
delays for repeat audiometry may be inappropriate.
6.4.4 Extenuating circumstances justifying surgery
When faced with a child with OME and speech delay, schOOling problems, or
recurrent infections, it is difficult to justify further delays for repeat audiometry
in 3 months, or to not list a child for surgery if audiometric criteria are not met.
Provision is therefore made for this in the NICE guidelines. Hence, when
these extenuating cases are included with those meeting core criteria, the
proportion of children having surgery in accordance with the guidelines in their
broad sense rises to 87.0% in the post-NICE period, compared with only
32.2% meeting the core criteria of 2 audiograms three months apart with
hearing level of 25 dB NHL or worse in the better ear.
Nevertheless, the high number of children having VTs due to extenuating
reasons is surprising. As these cases should, by definition, be exceptional, the
observation that they form 62.2% of all children meeting the broad NICE
criteria suggests that they are almost the norm, rather than an exception. The
proportion of children, amongst those meeting broadest listing criteria, that are
having surgery due to extenuating reasons has also risen following guidelines
introduction. This may suggest that surgeons are working within the
99
guidelines, following the suggested listing criteria, and documenting any
reasons why surgery was recommended in a child that does not fulfil the core
criteria themselves.
6.4.5 Adenoidectomy
As about 20-25% of children having VTs will require re-insertion of tubes
within 2 years (Gates, Avery and Prihoda 1987), adenoidectomy as an adjunct
to VT insertion has been investigated by several studies (Black, Sanderson, et
al. 1990) (Browning 2012) (Casselbrant, Mandel, et al. 2009) (Dempster,
Browning and Gatehouse 1993) (Gates, Avery and Prihoda 1987) (Maw and
Bawden 1994) (MRC Multicentre Otitis Media Study Group 2001a) (MRC
Multicentre Otitis Media Study Group 2001b) (Popova, Varbanova and Popov
2010) (Rosenfeldt and Bluestone 1999). A 1992 review in Effective Health
Care concluded that adding adenoidectomy to VTs had a small effect up to 12
months post op (NHS Centre for Reviews and Dissemination 1992), whilst a
Cochrane review in 2010 concluded that adenoidectomy has a significantly
beneficial effect on OME resolution, although only a small benefit to hearing
(van den Aardweg, Schilder, et al. 2010).
In the UK adjuvant adenOidectomy is not recommended in the absence of
persistent and/or frequent upper respiratory tract symptoms (NICE 2008).
Whilst American guidelines agree with UK stance in the case of primary
surgery, they recommend that adenoidectomy is undertaken in conjunction
with any revision surgery (R. Rosenfeld, et al. 2004). The fact that most
children do not require a second set of VTs is used to argue against
100

adenoidectomy at the first procedure. There is a great variation in the number
of children receiving adenoidectomy in different countries, but on the whole
the number of children having adenoidectomy appears to be reducing
(Haapkyla, et al. 2008).
This study examined adenoidectomy rates during two time periods, to
establish if there has been a reduction in the number having adenoidectomy
as a result of the guidelines advising against routine adenoidectomy in new
cases of OME. There was no significant difference, suggesting that either
most surgeons were either not performing adenoidectomy at the first
procedure even before the guidelines, or that they are continuing to perform
adenoidectomy despite the guidelines. The number of cases where
adenoidectomy was justified for non-OME reasons fell after guidelines
introduction (86.5 to 72.4%), but by a non significant amount. Thus, since the
guidelines were introduced, in over a quarter of cases this study failed to find
justification (within OME guidelines) for adenoidectomy taking place. As this
was a retrospective case-notes review, it may well be that adenoidectomy was
required, but the reasons why just not documented in the notes. Better
documentation could be achieved in a prospective study, but this would not be
appropriate when one is examining compliance with guidelines because
clinicians' practice would likely be affected by the knowledge that they are
being audited.
101
6.4.6 Limitations
This study is limited by its retrospective nature. The documentation in patient's
notes was used for the database, but at the time of the clinic visit there may
have been other issues influencing a decision but not being documented.
There were also a number of missing case notes, although there are no
reasons to suspect that those children would be in any way systematically
different.
The study comprised 5 different units, ranging from small district general
hospitals to large teaching hospitals. Although the results are representative of
the overall practice in the five units studied, individual hospitals should
undertake their own audits to assess local practice, as this study may not be
representative of other individual units.
The data here analysed only those children receiving surgery, and no
comment can therefore be made on practice according to guidelines in those
children that were never listed for surgery. Thus, it would be interesting to also
examine whether surgery was being denied to children that may in fact have
benefited from VTs. It would also be useful to examine if a longer time period
for guidelines' implementation affected the results obtained here. and such a
study is planned for the future.
102
6.5 NICE OME GUIDELINES: CONCLUSION
This study shows that 87.0% of children have VTs inserted in accordance with
NICE guidelines provided those children having extenuating reasons for
surgery are included. However, only 32.2% meet the core criteria of 2
audiograms three months apart with hearing level of 25 dB NHL or worse in
the better ear, a significant number of children are having surgery due to the
invoking of the exceptional circumstances criteria, and practice appears not to
have changed. Individual hospitals should ensure continued practice within
guidelines and improvements by means of regular departmental audit.
This chapter is the final clinical one, as the remainder (and main part) of the
thesis explores laboratory aspects of OME, biofilms, and potential new
treatments. The clinical chapters, showing that current treatment with VTs
carries a high need for revision surgery that is only partially improved by
adenoidectomy, and that clinical guidelines on OME management are
frequently ignored, provide clear supporting evidence for the need to better
elucidate the aetiology of OME and develop improved treatments based on
better understanding of OME aetiopathogenesis.
103
7 BACTERIA IN OME
7.1 INTRODUCTION
Although OME is an extremely common condition, much discussion has taken
place regarding its aetiology (Rovers, et al. 2004). OME is a chronic
inflammatory condition, with the inflamed mucosa producing mucus that
accumulates in the middle ear cleft (Kubba, Pearson and Birchall 2000).
However, the cause of this inflammatory response has been controversial.
Much attention has focussed on bacteria in OME, but standard culture
techniques typically grow bacteria in less than half of effusion samples (Matar,
et al. 1998) (Hall-Stoodley, Hu, et al. 2006) (Schousboe, et al. 2001) (Gok, et
al. 2001) (Poetker, et al. 2005) (Bluestone, Stephenson and Martin 1992)
(Hendolin, et al. 1997). On the other hand, PCR can detect bacteria typically
in more than 80% of effusions (Kubba, Pearson and Birchall 2000) (Hendolin,
et al. 1997) (Post, et al. 1995) (Rayner, et al. 1998). The problem with peR is
that detection of bacterial DNA does not imply the presence of live bacteria,
and it has also been shown that components of the middle ear effusion
actually inhibit nuclease activity and thus nucleic acid degradation (Peizhong,
et al. 2000).
The investigations of biofilms as causative agents OME has arisen from the
PCR / culture discrepancy, because biofilm bacteria may be slow-growing and
104
difficult to culture in the laboratory, and the localised nature of biofilm
communities may make effusion sampling prone to errors and false negative
results. Further, the chronic nature of OME, its inflammatory histology in the
absence of symptoms and signs of acute infection, and failure of oral
antibiotics to confer a lasting benefit would be considered typical of a biofilm
infection.
The aim of this section therefore is to investigate the role of bacteria and
biofilms in OME. Effusion samples were cultured for a prolonged period of
time on a wide range of media, with the intention of capturing all possible
bacteria involved in OME. The effusion samples were also analysed using the
Live Dead stain with the intention of identifying live bacteria without the need to
grow them in the laboratory, and also to determine whether those bacteria
existed in biofilm morphology.
105
7.2 METHODS
7.2.1 Clinical details
The study was approved by Nottingham Research Ethics Committee, and
informed consent obtained from participants and parents/carers. Patients were
recruited in a large teaching hospital (Nottingham University Queen's Medical
Centre), with samples collected between May 2006 and January 2008, and
analysed during that time and over the subsequent 2.5 years. Patients were
listed for ventilation tube insertion according to standard clinical practice, due
to symptomatic OME perSisting for at least 3 months. The deliberately wide
inclusion criteria were chosen to maximise the applicability of study results to
clinical practice.
The ear canal was disinfected by instilling 70% isopropanol for 2 minutes, with
external ear canal swabs performed before and after alcohol disinfection.
Myringotomy was performed using standard aseptic technique, and effusion
aspirated into a sterile collection tube and transported for immediate
processing.
7.2.2 Bacterial culture
To identify bacteria in effusion samples, the samples were analysed in a
dedicated microbiology laboratory routinely involved in the processing of
clinical samples. Effusion samples were cultured on six different media with
the intention to capture as many different bacteria as possible. Sheep blood
and MacConkey agar plates (Oxoid, Basingstoke, UK) were incubated
106
aerobically for up to three weeks at 37°C. The remaining four media
(Helicobacter pylori, chocolatised blood for Haemophilus influenzae, and
Mycoplasma selective agars incubated in 5% CO2, and sheep blood agar
incubated anaerobically), were incubated for up to ten weeks.
7.2.3 Bacterial identification
Bacteria were identified using conventional tests including Gram stain,
catalase, oxidase and DNase production, optochin susceptibility, response to
growth factors X (hemin) and V (nicotinamide adenine dinucleotide), and
growth in anaerobic conditions. Analytical Profile Index (API) strips
(bioMerieux, Marcy l'Etoile, France) were used to aid identification and
speciate the isolates.
7.2.4 LiveDead stain
The Live Dead stain (Molecular Probes, Oregon, USA) was used according to
the product literature protocol, by combining an equal amount of sample with
the stain solution, mixing thoroughly, and incubating in the dark prior to
examination with appropriate fluorescence filters. The Live Dead stain employs
differential membrane permeability to stain intact and uncompromised
bacterial cell membranes (Le. live bacteria) green with SYTO 9, whereas
nuclei of dead bacteria stain red with propidium iodide. Eukaryotic-derived
material also has a tendency to stain red.
107
7.2.5 Confocal microscopy
Combining the Live Dead stain with Confocal Laser Scanning Microscopy
(CLSM) allows the determination of the three dimensional structure typical of
biofilms. CLSM was performed using a Leica SP2 microscope (Leica, Milton
Keynes UK), on samples stained with the LiveDead stain. Biofilms were
diagnosed on the basis of well-established morphologic criteria (Parsek and
Singh 2003) that have been applied to OME in the past (Hall-Stoodley, Hu, et
al. 2006), i.e. the presence of three-dimensional bacterial clusters within an
amorphous matrix and associated with a surface such as eukaryotic cells or
strands.
Two assessors (myself and Roger Bayston) determined bacterial morphology,
and both were blinded to the culture result; in case of discrepancies, John
Birchall also reviewed the images and a consensus between the three
reviewers reached.
7.2.6 Statistical analysisStatistical analysis was performed using PASW
Statistics 18. Differences in proportions were analysed with Chi squared test,
or the Fisher's exact test if numbers were small. The Student's t test was used
to assess differences in means. Cohen's Kappa coefficient was used to
measure agreement between different variables attached to the same sample.
John Birchall and his theatre team collected the clinical samples. Shehla
Imtiaz-Umer performed majority of routine microbiology work, with myself
108

performing the remainder, in addition to collating and analysing data, and
performing statistical analysis.
109
7.3 RESULTS
A total of 62 samples from 42 different patients (27 male, 15 female) were
analysed. Most patients (35, 83.3%) were aged under 18 years, the median
age being 4.5 years and age ranging from 1 to 75.
7.3.1 Verification of canal disinfection
A random subset of 14 ears was analysed to assess effectiveness of alcohol
disinfection, by comparing culture results in external ear canal swabs taken
before and after disinfection. Four swabs were culture positive prior to
disinfection (one containing Streptococcus constelatus, one Bacillus spp, and
two coagulase negative staphylococci). All swab cultures were negative after
d isi nfection.
7.3.2 Effusion culture and confocal microscopy
Twenty-eight of the 62 effusions were culture-positive (45.2%), but CLSM
demonstrated live bacteria in 51 (82.3%) samples. Table 7.3.2.1 illustrates the
relationship between culture and CLSM results, showing that only 8.1 % of
samples were negative on both examinations. In other words, combining the
two techniques identified the presence of live bacteria in 57 effusions or
91.9%.
110

CLSM-positlve CLSM-negatlve Total
Culture-positive 22 (35.5%) 6 (9.7%) 28 (45.2%)
Culture-negatlve 29 (85.3%) 5 (8.1%) 34 (54.8%)
Total 51 (82.3%) 11 (17.7%) 62
Table 7.3.2.1: Comparison of culture and confocal microscopy results;
percentages refer to the per cent out of all 62 samples.
Among the CLSM-positive samples, 25 (49.0%) contained biofilms and 26
(51.0%) planktonic bacteria. Culture positivity appeared not to influence
bacterial morphology at CLSM, as the proportion of samples exhibiting biofilm
morphology was similar in the culture-positive and culture-negative groups
(11/22, 50.0% and 14/29,48.3%, respectively).
Differences between adults and children were explored on a per-patient
(rather than per-ear) basis; where data existed for two ears, the per-patient
analysis was carried out using the criteria of at least one ear being culture /
confocal positive and at least one ear containing biofilms. Children appeared
to have a greater number of culture-positive, confocal-positive, and biofilm
results than adults (54.3 v 14.3%, 82.9 versus 57.1 %, and 67.9 v 0%,
respectively). However, only the presence of biofilms reached statistical
significance (Fisher's exact test p=0.02).
In the 20 patients (all children) in whom data from both ears were available the
correlation between the findings in the two ears was assessed. The
agreement rate was 70.0% (14/20) in the case of culture positivity rate
(kappa=0.381, fair agreement), 90.0% (18/20) in the case of confocal positivity
I I I
rate (kappa=0.444, moderate agreement), and 58.8% (1 0/17 confocal positive
samples) in the case of confocal morphology type (kappa=0.168, poor
agreement). The same bacteria were identified in both ears in 7 children
(35.0%)
Table 7.3.2.2 shows the range of different bacterial isolates, including the
relationship of bacterial isolates to CLSM findings. The mean number of
different bacterial isolates was 1.8 per culture-positive sample, with no
significant difference between confocal-positive and confocal-negative
samples. Biofilm samples contained an average of 1.7 and planktonic samples
2.0 different bacterial isolates, but this was not statistically significant on Hest
(p=0.51). Only one adult patient's effusion was culture positive, growing S
capitis and Acinetobacter radioresistens, with most bacteria identified thus
coming from children's effusions.
Figure 7.3.2.1 shows representative images obtained with CLSM.
112
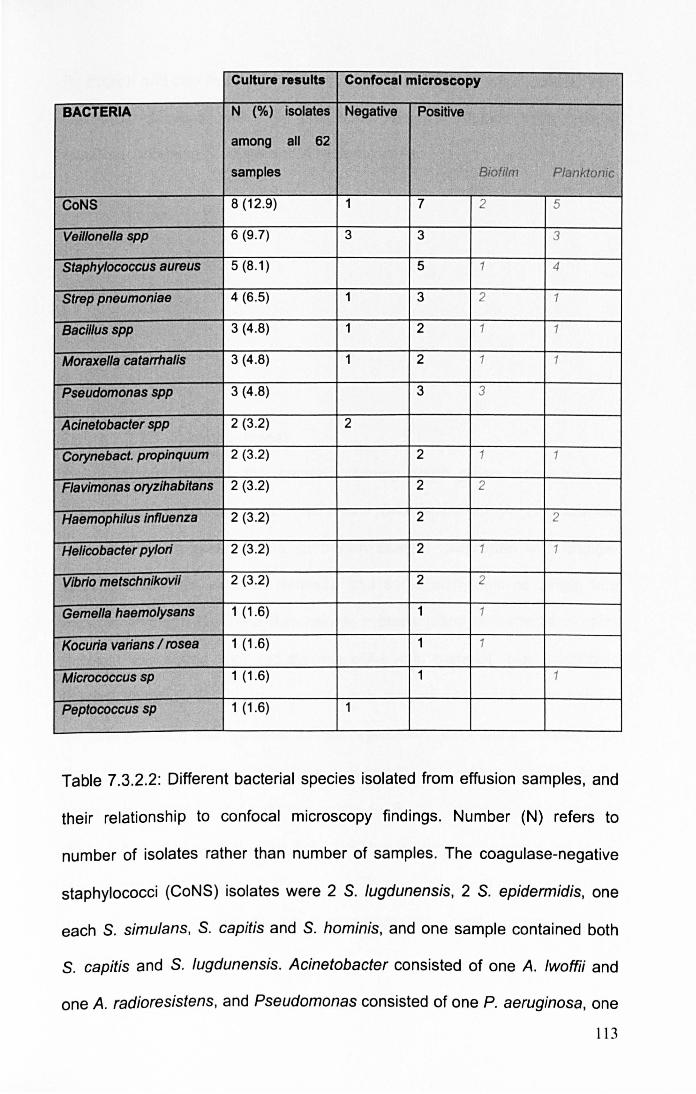
Culture results Confocal microscopy
BACTERIA N (%) isolates Negative Positive
among all 62 I· II
samples Biofilm Planktonic
CoNS 8 (12.9) 1 7 2 5
Veillonella spp 6 (9.7) 3 3 3
Staphylococcus aureus 5 (8.1) 5 1 4
Strap pneumonlae 4 (6.5) 1 3 2 1
Bacillus spp 3 (4.8) 1 2 1 1
Moraxella catarrhalls 3 (4.8) 1 2 1 1
Pseudomonas spp 3 (4.8) 3 3
Aclnetobacter spp 2 (3.2) 2
Corynebact. propinquum 2 (3.2) 2 1 1
Flav/monas oryzihabltans 2 (3.2) 2 2
Haemophllus Influenza 2 (3 .2) 2 2
Hel/cobacter pylori 2 (3.2) 2 1 1
Vibrio metschnikovii 2 (3.2) 2 2
Gemella haemolysans 1 (1 .6) 1 1
Kocuria varians / rosea 1 (1 .6) 1 1
Micrococcus sp 1 (1.6) 1 1
Peptococcus sp 1 (1.6) 1
Table 7.3.2.2: Different bacterial species isolated from effusion samples, and
their relationship to confocal microscopy findings. Number (N) refers to
number of isolates rather than number of samples. The coagulase-negative
staphylococci (CoNS) isolates were 2 S. fugdunensis, 2 S. epidermidis, one
each S. simulans, S. capitis and S. hominis, and one sample contained both
s. capitis and S. lugdunensis. Acinetobacter consisted of one A. fwoftii and
one A. radioresistens, and Pseudomonas consisted of one P. aeruginosa, one
113
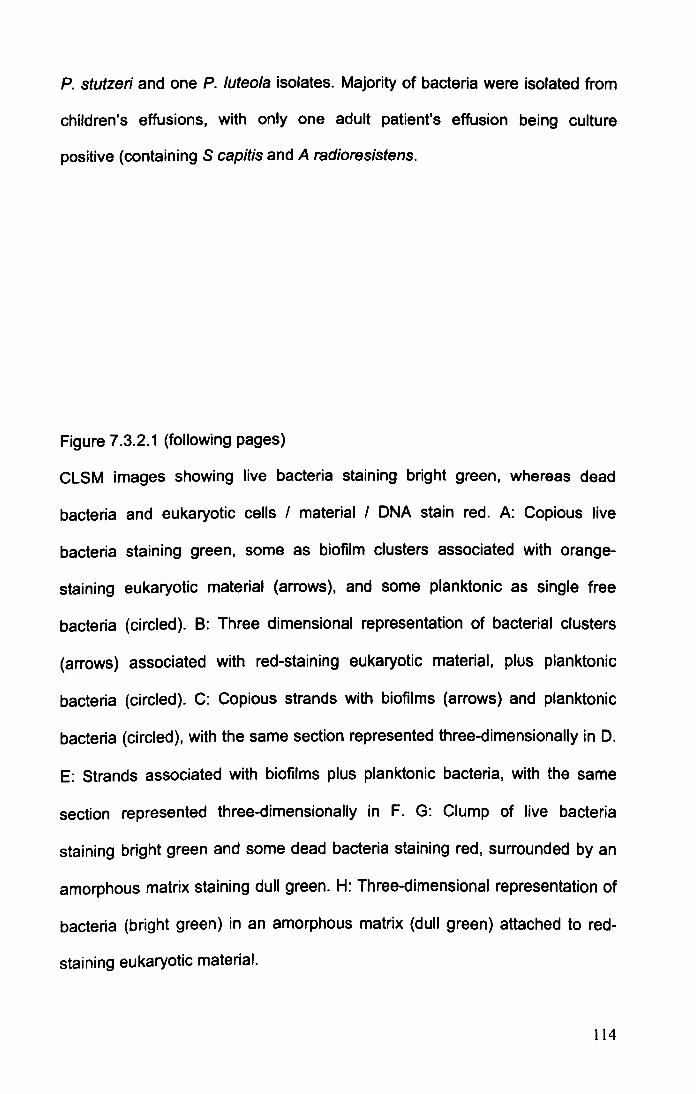
P. stutzeri and one P. luteola isolates. Majority of bacteria were isolated from
children's effusions, with only one adult patient's effusion being culture
positive (containing S capitis and A radioresistens.
Figure 7.3.2.1 (following pages)
CLSM images showing live bacteria staining bright green, whereas dead
bacteria and eukaryotic cells I material I DNA stain red. A: Copious live
bacteria staining green, some as biofilm clusters associated with orange
staining eukaryotic material (arrows), and some planktonic as single free
bacteria (circled). B: Three dimensional representation of bacterial clusters
(arrows) associated with red-staining eukaryotic material, plus planktonic
bacteria (circled). C: Copious strands with biofilms (arrows) and planktonic
bacteria (circled), with the same section represented three-dimensionally in D.
E: Strands associated with biofilms plus planktonic bacteria, with the same
section represented three-dimensionally in F. G: Clump of live bacteria
staining bright green and some dead bacteria staining red, surrounded by an
amorphous matrix staining dull green. H: Three-dimensional representation of
bacteria (bright green) in an amorphous matrix (dull green) attached to red
staining eukaryotic material.
114

11 5
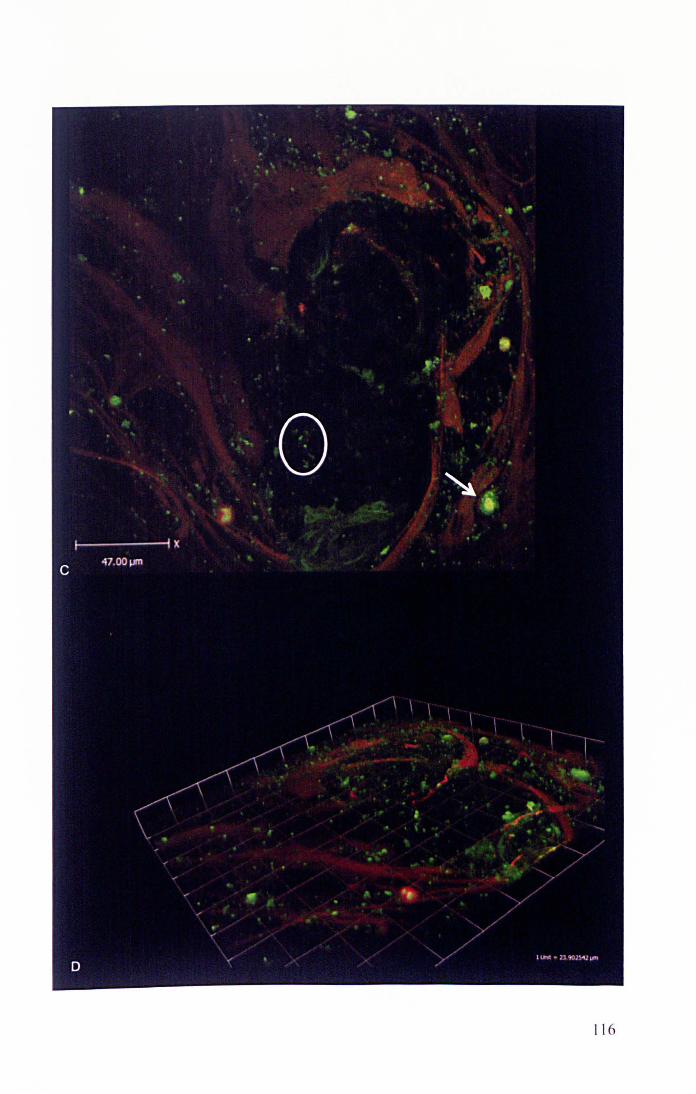
11 6
11 7
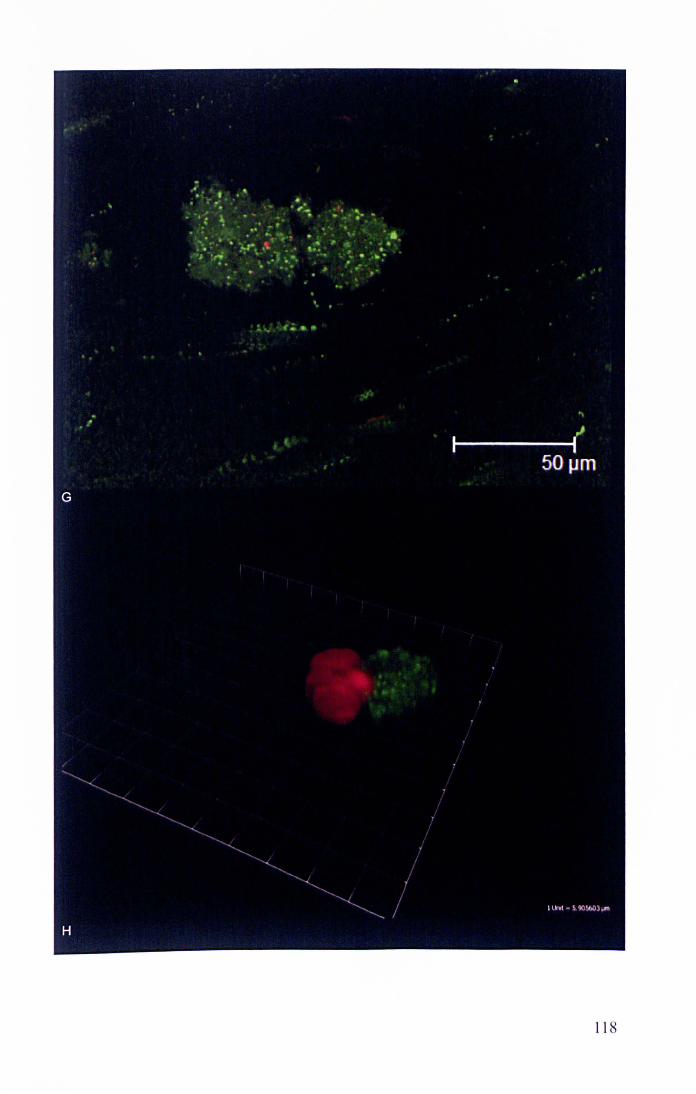
11 8
7.4 DISCUSSION
7.4.1 Summary of findings
The results show that combining culture and confocal microscopy
demonstrates live bacteria in more than 90% of OME samples, strongly
suggesting a role for bacteria in the aetiopathogenesis of OME. Extended
cultures alone were positive in 45.2%. However, CLSM was positive in 82.3%,
and in these samples biofilms were demonstrated in 49.0%. A wide variety of
different bacteria were also identified, rather than just the traditional three
studied in the past (Streptococcus pneumoniae, Haemophilus influenza,
Moraxella catarrhalis).
7.4.2 Biofilms in OME
The microbiology of OME has been studied for many decades, yet
controversy still exists as to the role of bacteria in the aetiology of OME
(Kubba, Pearson and Birchall 2000) (Parkinson, et al. 2006). A high proportion
of effusions (typically more than half) are culture-negative (Matar, et al. 1998)
(Gok, et al. 2001) (Schousboe, et al. 2001) (Poetker, et al. 2005) (Bluestone,
Stephenson and Martin 1992). However, while PCR has demonstrated
bacterial nucleic acids in a much greater number of patients (Hendolin, et al.
1997) (Post, et al. 1995), nucleic acids identified at PCR may not represent
viable bacteria. An alternative view of bacteria in OME is that they might be
viable but not culturable by conventional means, a state that is commonly
seen in biofilms (Proctor and von Humboldt 1998) (Proctor, et al. 2006).
119

Using CLSM we were able to detect biofilms in just under half of CLSM
positive samples. However, CLSM identified live bacteria in 85.3% of the
culture-negative samples. Among culture-negative samples 14.7% were also
confocal-negative, but of the culture-positive samples 21.4% were confocal
negative. This suggests that CLSM may under-estimate the presence of
bacteria, perhaps due to sampling differences, as small samples of effusion
must be further divided for each examination and bacteria may be very
localised. There appeared to be no great difference between planktonic and
biofilm bacteria identified on LCMS-positive samples, with similar numbers
being culture-positive. Although one might expect all planktonic samples to be
culture-positive, 16 planktonic effusions were culture-negative. It is possible
that these bacteria did exist as biofilms (which may make them difficult to
culture), but that original morphology was disturbed by the process of surgical
aspiration or laboratory preparation/mixing. The fact that some effusions
containing biofilms on confocal microscopy were culture positive is not
surprising as bacteria from biofilms frequently leave the biofilm to enter the
planktoniC state (and would therefore be culturable), and processing of
samples for analysis may also disrupt the biofilm thus rendering the bacteria
planktonic and then culture positive.
Adults were included in this study to boost patient numbers. However,
children's effusions appear to be more likely to contain biofilms than adults, in
keeping with the expected infectious aetiology of OME in children but possibly
a different aetiology in adults (Kubba, Pearson and Birchall 2000). In addition,
120

only one adult effusion was culture positive, again supporting the notion that
paediatric OME aetiology is likely to be different to adult OME.
No great correlation between findings in the opposite ears has been
demonstrated, suggesting that individual ears may be subject to different local
aetiopathogenic mechanisms. This is also in keeping with clinical findings that
the two ears in a child often behave differently, and it is not uncommon to
have unilateral OME.
The question of whether OME is a biofilm infection has been addressed by
Fergie et al (Fergie, et al. 2004). Parsek and Singh suggested that the
following criteria should be fulfilled for a disease to be considered a biofilm
infection (Parsek and Singh 2003):
• Bacteria are adherent to substratum or a surface
• Bacteria are living in cell clusters or micro-colonies encased in an
extracellular matrix
• Infection is generally confined to a particular location.
• Infection is difficult or impossible to eradicate with antibiotics, despite the
responsible bacteria being susceptible to the antibiotic when in the
planktonic state.
This study clearly demonstrated that the bacteria were alive (something that
peR or DNA-based methods cannot do) in more than 90% of samples,
biofilms were found in just under half of effusions. However, studies of middle
ear mucosa (not effusions) have shown biofilms more frequently, perhaps in
121
65 - 92% of samples (Thornton, et al. 2011) (Hall-Stoodley, Hu, et al. 2006),
whilst non-invasive in vivo optical techniques have demonstrated biofilms in all
adults with OME but in none of the controls (Nguyen, Jung, et al. 2012). The
seemingly higher biofilm presence in published literature does not necessarily
contradict our findings as there are several reasons why a difference between
mucosa and mucus may exist. It is possible that biofilms exist on the mucosa
in most people with OME but exist within the effusion associated with mucins
in only just under half of cases, or that biofilms on mucosa act as reservoirs of
bacteria that then enter the effusion, or that there is an issue with which part of
the effusion is sampled for analysis. The presence of an intact mucus layer
appears to be important in controlling bacteria within the human gastro
intestinal tract, as most bacteria reside on the luminal side of the mucus layer
(van der Waaij, et al. 2005), with no direct contact with the epithelium unless
inflammation is present (Swidsinski, et al. 2007) (Macfarlane and Dillon 2007).
To the best of our knowledge we were the first group to assess middle ear
effusions with Live Dead staining and confocal microscopy. A paper has been
published since our work, but this analysed 4 children's effusions finding no
biofilms (Hom0e, et al. 2009); with such a small number it is difficult to draw
conclusions, especially as according to our data only half effusions contain
biofilms. Another recent paper used fluorescence in-situ hybridisation, with
species-specific probes, to look for biofilms in the effusion of children with
OME of less than 3 months' duration, finding biofilms in 4 of 13 (30.8%)
effusions (Chen, et al. 2012); effusions were centrifuged prior to analysis,
which may have affected biofilm morphology.
122
But could biofilms be a part of the normal middle ear flora rather than the
pathogenic cause of OME? While two studies did not find biofilms in mucosal
biopsies of their healthy controls (Hall-Stoodley, Hu, et al. 2006) (Thornton, et
al. 2011), another study (Tonnaer, et al. 2009) of middle ear mucosal biopsy
at time of cochlear implant showed biofilms in 2 out of 45 cases without
evidence of previous otologic problems or abnormalities, suggesting that
biofilms may exist in the asymptomatic middle ear. The difficulty when
researching biofilms in OME is choice of control group. Entirely normal
patients do not require ear surgery, and all the control groups chosen are
patients having surgery for another (ostensibly non-related) reason, but they
cannot be considered to be normal. When studying effusions as in this study,
the problem is compounded by the fact that the normal ear does not have an
effusion, therefore no suitable negative control exists. An alternative might
have been to study the mucus produced by normal middle ear mucosa, but
this is produced in only minute quantities. It would be difficult to sample with
anything other than a swab, and whilst culture would be possible, confocal
microscopy of strands of actual mucus would not. Further, it also raises the
ethical issues of taking samples from healthy people, as surgical access to the
middle ear would be required. Even if one included patients having surgery for
non-OME reasons, it is still an additional procedure not related to the
treatment of that (control) patient, and the assumption that the patient having
middle ear surgery is truly healthy and free from OME may be false. A further
problem relates to the common phenomenon of temporary OME, so it possible
that children considered "normal" may have biofilms in their middle ear
123
because they have a temporary problem that would never come to medical
attention otherwise.
Despite difficulty studying biofilms in OME, it is recognised that the presence
of a biofilm (bacteria or bacterial products such as lipopolysaccharide) may
lead to an inflammatory stimulus (Bemthal, et al. 2010) (Mittal, et al. 2009)
(Foreman, Jervis-Bardy and Wormwald 2011), which may then result in
middle ear mucosal inflammation via cytokine release, mucous cell
hyperplasia, and ultimately clinical OME (Lin, et al. 2012) (Smirnova, et al.
2002) (Schousboe, et al. 2001) (Stamer, et al. 2006). In chronic rhinosinusitis
(Foreman, Jervis-Bardy and Wormwald 2011), another mucosal biofilm
condition, the presence of biofilms was shown to be associated with alteration
in host immune responses including those involving interferon gamma,
granulocyte-colony stimulating factor, and macrophage inflammatory protein
1-beta, with a local (not systemic) inflammatory response (Hekiert, et al.
2009); biofilm presence has also been associated with marked destruction of
the epithelial layer with complete absence of cilia, whereas those patients
without biofilms either had normal mucosa or only partial mucosal damage
(Galli, et al. 2008).
It is also possible that different biofilms, perhaps at different times, in different
positions, or when affected by different immune systems, lead to different
pathological problems, in some cases contributing to disease and in others
not; in the same way that different bacteria may give different diseases,
different biofilms may give different pathology (Foreman, Jervis-Bardy and
124
Wormwald 2011). Biofilms may also act as a reservoir of bacteria, with some
bacteria leaving the biofilm to become planktonic and disseminate. The
observation of biofilms on ventilation tubes of children with chronic ear
discharge suggests that the middle ear bacterial biofilms have at least the
potential to be pathological (Barakate, et al. 2007), whilst the reduction in
post-ventilation tube surgery ear discharge achieved through application of
antibiotic drops at the time of surgery suggests that treatment directed against
biofilms in middle ear disease may be possible (Thomas, Ojano-Dirain and
Antonelli 2011) (Shinkwin, et al. 1996).
7.4.3 Techniques and alternatives
Biofilms were diagnosed on the basis of well-established morphologic criteria
(Parsek and Singh 2003) that have been applied to OME in the past (Hall
Stoodley, Hu, et al. 2006): three-dimensional bacterial clusters within an
amorphous matrix and associated with a surface such as eukaryotic cells or
mucus strands were classified as biofilms. In contrast, bacteria that appeared
as individual bacteria rather than a grouping were considered planktonic, as
were any bacterial groups that were not associated with a surface. Typical
examples are shown in Fig 7.3.2.1.
Although the BacLight stain enables differentiation only between bacteria with
intact and damaged cytoplasmic membranes it is often used to differentiate
between active and dead cells (Sachidanandham, Gin and Poh 2005) (O'Neill,
et al. 2004), and while it appears to be accurate to consider membrane
compromised bacterial cells as dead, the reverse (Le. intact membrane
125
signifies live cells) may not be true in a small number of cases (Berney, et al.
2007). However, given that 82.3% of the samples in this study stained live on
confocal microscopy, a small false-live rate will still leave the majority of
samples as containing live bacteria. Combining the LiveDead stain with
confocal microscopy was felt to be the best way of identifying any live but non
culturable bacteria, and of determining the bacterial morphology to establish
whether biofilms were present.
peR has been used in the past (Kubba, Pearson and Birchall 2000)
(Hendolin, et al. 1997) (Post, et al. 1995) (Rayner, et al. 1998), but it cannot
differentiate between DNA from live and dead bacteria, even when the
quantitative technique of real time PCR is used (Saukkoriipi, et al. 2002).
Interestingly, a novel technique of differentiating whether DNA comes from live
or dead bacteria has recently been developed (Kobayashi, et al. 2009). This
uses the DNA-binding agent propidium monoazide to help identify DNA from
live bacteria at PCR, and could be usefully applied to OME.
Live Dead staining and confocal microscopy does not identify bacterial
species. Therefore, Hall-Stoodley et al (Hall-Stoodley, Hu, et al. 2006) in their
study on mucosal biopsies used Fluorescence In-Situ Hybridisation (FISH) to
identify bacterial species. However, FISH identifies only those bacteria that
are looked for with a species-specific probe, and would miss any that are not
speCifically sought (unless one uses a pan-bacterial probe, but the
identification then again becomes an issue). The adoption of a broad
microbiological approach in this work, i.e. to aim to find any bacteria, rather
126
than designing experiments to find S pneumoniae, H influenzae and M
cata"halis because that is what everyone else has found, is in fact a strength
of this work. In relation to FISH, one could find only those bacteria that one
looked for, and as our culture results identified 17 different bacteria that would
mean running 17 different FISH experiments, and one would still miss
identification of bacteria that we found in samples that were positive only by
confocal microscopy and negative on culture. Interestingly, recent
technological advances have combined PCR with mass spectrometry into
automated technology that can detect a wide range of pathogens (Ibis T5000
Universal Biosensor): although based on PCR with its associated limitations,
this could be a useful technique in identification of bacteria in OME (Ecker,
Drader and Gutierrez 2006). The future may also bring instruments that could
visualise bacterial biofilms in situ in the middle ear, as new optical methods
capable of detecting them are already being developed (Nguyen, et at. 2010)
(Nguyen, Jung, et at. 2012).
SEM has also often been used to identify biofilm. However, whilst biofilm
identification on inert surfaces is usually straightforward, its usefulness on
mucosal surfaces remains debatable due to difficulty differentiating biofilms
from mucus. Therefore, confocal microscopy combined with the non-specific
Live Dead stain or species-specific FISH is currently thought to be the gold
standard method of identification of biofilms on mucosal surfaces (Foreman,
Jervis-Bardy and Wormwald 2011 ).
127
7.4.4 Bacterial types in OME
S. pneumoniae, M. catarrhalis and H. influenzae are the most common
pathogens implicated in OME, and all are capable of forming biofilms (Starner,
et al. 2006) (Hall-Stoodley and Stoodley 2009). However, rather than focusing
just on those three bacteria, this study cultured effusions on a wide range of
different media for prolonged time periods in order to capture as many isolates
as possible. Interestingly, coagulase negative staphylococci (CoNS),
Veillonella spp and S. aureus were the three commonest pathogens isolated
in this study. CoNS were long thought to be non-pathogenic commensals, but
with the recognition of their biofilm-forming capacity have emerged as the
leading cause of biomaterials-related infection (McCann, Gilmore and Gorman
2008) (Lyte, et al. 2003). They have also been previously implicated in otitis
media (Bunse, et al. 1987), with one study finding CoNS in a third of effusions
and a third of these isolates were of the slime-producing phenotype (Paluch-
01e5a, et a!. 2011). Veillonella is a Gram-negative anaerobe that inhabits the
mouth and upper respiratory tract, forms biofilms (Palmer, Diaz and
Kolenbrander 2006) and has previously been found in middle ear disease
(Brook 1996). S. aureus also forms biofilms (Otto 2008) and has been
identified in middle ear disease (Hyden, Akerlind and Peebo 2006). Although
most of the bacteria in Table 2 have previously been isolated in middle ear
disease, to the best of our knowledge Flavimonas oryzihabitans, Vibrio
metschnikovii and Gemella haemolysans have not been implicated previously.
This study found two effusions containing Helicobacter pylori. Some studies
have suggested that H pylori is implicated in the aetiology of OME (Yilmaz, et
128
al. 2006), although others have not confirmed this (Ozcan, et al. 2009).
Interestingly, bile acids and pepsin have also been found in the middle ear
(Klokkenburg, et al. 2009) (He. et al. 2007), but whether they are important in
the pathogenesis of OME is not clear.
It is unclear why the present study identified the three traditional OME bacteria
in a lower proportion of samples than other studies. Variation in prevalence of
OME over time has been previously documented (Bluestone, Stephenson and
Martin 1992), and may be due to patterns of antibiotic use or vaccination,
particularly with the introduction of vaccines against H. influenzae type band
s. pneumoniae. The adoption of a broad microbiological approach in this
study with the aim of identification of all bacteria may also have detected
species missed by studies adopting a narrower culturing approach.
Although numbers of isolates of anyone bacterial species are small, it is
interesting to note that majority of CoNS and S. aureus appeared in planktonic
form, despite both being recognised as biofilm-forming pathogens (McCann,
Gilmore and Gorman 2008) (Lyte, et al. 2003) (Otto 2008). Pseudomonas
aeruginosa, which is well known to produce biofilms (Hall-Stoodley and
Stoodley 2009). was also identified in biofilm morphology in this study, but
Acinetobacter appeared difficult to identify on CLSM.
7.4.5 OME biofllms in relation to OME natural resolution
If biofilms cause OME. then why does OME resolve spontaneously in most
children by the age of 10 years or so? And if biofilms cause OME. it may be
129
easy to understand why OME often recurs after VTs have extruded (VTs only
masked the effusion but didn't treat the underiying biofilm), but why then does
OME not always recur after VT extrusion? Why is every AOM episode not
followed by OME?
The last question is perhaps easiest to answer, as establishment of a biofilm
will depend on the pathogenicity of the bacteria involved, and their interaction
with the host immune response (Mittal, et a!. 2009). The host response may
also be the reason why biofilm infections resolve. Younger children have more
infections, perhaps due to relatively immature immune system, but perhaps
also due to higher exposure to bacteria in communal areas such as school or
nurseries. or exposure to bacteria encountered for the first time. However. the
major immune maturations occur during the first two years of life (West 2002).
hence it is difficult to see how immune maturation would cure glue ear in 3-7
year olds. Environmental and behavioural changes can explain reduced
infections in older children, but not the eradication of an established biofilm.
Changes in the Eustachian tube may explain resolution of OME and biofilms.
In children, the Eustachian tube is shorter, with the muscular attachments that
normally open it being less favourable (Doyle and Swarts 2010). Hence. the
mature tube will be less likely to allow reflux of nasopharyngeal contents into
the middle ear, preventing infection in the first place, but the tube in an older
child will also be opening and aerating the middle ear better.
130
The aeration of the middle ear may lead to drying of the biofilm and therefore
its eradication. Certainly drying may be important as an adjunct to biofilm
eradication for example following disinfection of a surface (Kovaleva, Degener
and van der Mei 2010), but it appears not to be effective on its own (Wu, et al.
2010) (Mordhorst, et al. 2009). However, aeration and drying may also have
an effect on the middle ear mucosa itself. In the presence of inflammation,
deficient ventilation, and high C02, the middle ear mucosa metaplases into
numerous mucus-producing cells (Sade and Weissman 1977); the reverse
may also be true, so that restoration of normal ventilation (either with VTs or
by age-related improvements in Eustachian tube function) could reduce the
number of mucus-producing cells and therefore lead to resolution of effusion.
When discussing OME as a biofilm infection, the question that then arises is
whether it really is the biofilms that caused the inflammation leading to the
effusion in the first place, or did the effusion develop as a result of middle ear
hypoventilation and the biofilms simply moved into the abundant mucus? It
has already been stated in the introduction that OME cannot be caused simply
by Eustachian obstruction (the effusion would then be a transudate, not an
exudate), and the fact that effusions drain down the Eustachian tube almost
immediately after VT insertion again suggests that the Eustachian tube was
never blocked (Kubba, Pearson and Birchall 2000). Therefore, it seems
unlikely that negative pressure as a result of Eustachian blockage is the
initiating event; rather, the biofilms are likely to be responsible for the initial
inflammatory insult leading to OME. Of course it may be possible that biofilms
develop only in the presence of middle ear hypoventilation, or conversely that
131

Eustachian tube dysfunction arises because of the biofilm itself. It is
interesting to note that in the case of the gastritis-causing Helicobacter pylori
the presence of mucin actually inhibits biofilm production (Cole, et al. 2004),
and in the case of lactobacilli the type of mucus affects the degree of adhesion
(Li, et al. 2008).
Although it seems likely that biofilms are responsible for initiating OME,
improvements in aeration with age or VTs may be responsible for OME
resolution. Hypoxia is known to have a potent pro-inflammatory effect on the
respiratory epithelium (Steinke, Woodard and Borish 2008), whilst healthy
middle ear mucosa permits bidirectional gas exchange between capillaries
and the middle ear cavity (Ikarashi, Takahashi and Yamamoto 1999). It may
be that better aeration improves the "health" of the mucosa and tips the
balance away from biofilms and in favour of production of a smaller amount of
less viscous mucous, which in tum may lead to biofilm clearance.
7.4.6 Implications for glue ear management
This study clearly implicates bacteria in the aetiopathogenesis of OME.
Biofilms are likely to be important, as our study found them in 49.0% of
confocal-positive effusions, and previous research has demonstrated them on
more than 90% of mucosal biopsies in children with OME or recurrent AOM
(Hall-Stoodley, Hu, et al. 2006). This new understanding of OME aetiology
also leads to potential novel therapeutic possibilities that may improve the
current management options.
132
At present, treatment of persistent symptomatic OME involves drainage of the
effusion and VT insertion, but this does not address any persistent bacterial
infection, and serves to merely remove the effusion that is the result of a
middle ear inflammation. If the biofilm hypothesis is true, it is perhaps not
surprising that more than a quarter of cases will require further surgical
treatment (Chapter 5) (Gates, Avery and Prihoda 1987). A good way of
confirming this would be to study microbiology of OME in children both at their
first and also any subsequent treatment, for if biofilms persist then one may
expect to find the same bacteria at second treatment. A literature search failed
to find any papers comparing bacteriology at first and subsequent VT
insertions, and at any rate the bacteria may be different simply because
different bacteria have been acquired and replaced the original biofilm, or the
same bacteria may be found at the second time not because they persisted in
the middle ear but simply because they re-ascended from a colonised
adenoid.
133
7.5 BACTERIA AND BIOFILMS IN OME: CONCLUSION
The role of bacteria in OME has been controversial, with a long-held debate
fuelled by the low number of effusions that are culture-positive and the
controversy over whether PeR-positive samples indicate live bacteria.
However, this study, using extended cultures and confocal microscopy,
demonstrates live bacteria in more than 90% of middle ear effusions in
children with glue ear, strongly suggesting that bacteria and biofilms are
important in the pathogenesis of the condition.
This understanding also opens avenues for potential new, better treatments
for OME. Unlike planktonic bacteria, which would be expected to respond to
conventional antibiotic treatment, bacteria in biofilms adopt a distinct
phenotype with a slow growth rate that makes them recalcitrant to standard
antibacterial therapy (Lewis 2001) (Hall-Stoodley and Stoodley 2009)
(Sihorkar and Vyas 2001). Delivering high dose antibiotics directly to the
middle ear is an interesting new strategy, and this thesis therefore moves on
to look at biofilm eradication in the context of OME biofilms.
134
8 AN IN VITRO BIOFILM MODEL
8.1 INTRODUCTION
The observation that biofilms are implicated in the aetiology of OME opens an
exciting avenue for potential novel treatments. As at present about 25% of
children require grommet (ventilation tube, VT) insertion for a second time
(Gates, Avery and Prihoda 1987) (Maw and Bawden 1994), and VTs
themselves have been associated with problems such as tympanic membrane
perforation and scarring (Daly, et al. 2003) (Le, Freeman and Fireman 1991)
(Brown, Richards and Ambegaokar 1978) (Bonding and Tos 1985) (Maw and
Bawden 1994), better treatment based on new understanding of the aetiology
of OME is clearly required. Treatments aimed specifically at biofilms were
therefore explored.
We set out to develop an in vitro biofilm model that could be used to study
biofilms and treatments directed against them. The test organism chosen for
these experiments was Staphylococcus aureus. S aureus is a typical biofilm
forming organism, it is robust, grows well as a biofilm, and is difficult to
eradicate (Ojano-Dirain and Antonelli 2012). Although other bacteria (S
pneumoniae, M catarrhalis and H influenzae) may be more frequently
encountered in OME in published literature, they may also be more fragile in
the laboratory setting than S aureus, and thus their absence at the end of an
experiment may simply be a reflection of their fragility rather than an indication
135
of treatment success. Thus, S aureus was deemed a suitable starting point for
investigating biofilm eradication with antibiotics.
Whilst several in vitro biofilm models are available, an important consideration
in our work on OME was to use a model with dimensions that are similar to
the middle ear. Ultimately, we planned to test an antibiotic pellet for use in the
middle ear, and thus the in vitro model would have to have dimensions that
are comparable to the human middle ear.
136
8.2 METHODS
The S aureus biofilms were established as detailed below. To use the models
described as a model of biofilms, both physical and functional characteristics
of biofilm need to be shown, with demonstration of reduced susceptibility to
antibiotics essential (Donlan and Costerton 2002). Therefore the silicone discs
were imaged using Scanning Electron Microscopy (SEM) and Confocal Laser
Scanning Microscopy (CLSM), and the sensitivity to antibiotics of biofilm
bacteria was compared with planktonic bacteria.
To assess effect of treatment on biofilms grown on discs, the biofilms had to
be removed from the substratum, and the bacteria re-suspended prior to
plating onto agar. In order to ensure that only biofilm bacteria are counted,
and not non-attached planktonic bacteria, the discs had to be rinsed carefully
on removal. The model was therefore investigated with respect to the number
of rinses required to remove non-attached bacteria, duration of sonication
required to remove attached bacteria and whether sonication affected
bacterial viability, effect of trypsin on bacterial detachment, and whether
antibiotic solutions added to the models were effective for the duration of
experiment.
8.2.1 An in vitro biofilm model
To study biofilm eradication an in vitro model was required, and set up as
follows. Overnight cultures of Staphylococcus aureus (laboratory strains
derived from OME) were sampled with an inoculation loop and suspended in
137
Tryptone Soya Broth (TSB) (Fig 8.2.1.1 and 8.2.1.2), to an optical density of
0.08-0.13 (McFarland 0.5 equivalent) at 490nm measured using a Jenway
Multicell Changer Spectrophotometer (Bibby Scientific Limited, Stone UK).
The rifampicin and clindamycin MICs of the inoculum were established using
the Etest strip (AB Biodisk, Solna, Sweden) on Iso-Sensitest agar (Oxoid,
Cambridge UK). Silicone discs (Silicone elastomer, Goodfellow, Cambridge
UK, 6.0mm diameter and 1.0mm thick) were placed into the solution, and
incubated at 37°C, initially on an orbital shaker (Stuart orbital incubator S150,
Jencons-PlS, lutterworth UK) for one hour and then static for one hour. The
discs were rinsed three times in PBS prior to use. Clean control discs were
prepared in an identical manner except that the TSB was not inoculated with
bacteria (these controls were used so that any contamination of the models
can be identified easily). The discs were then aseptically placed into a sterile
bijoux bottle containing 2 ml TSB. The bijoux bottles were incubated at 37°C
(Firlabo Incubator HPE, Firlabo, Meyzieu France). Planktonic bacteria were
also investigated, by inoculating 20 ~l of bacterial suspension into the TSB in
a bijoux bottle.
138

Silicone discs (6mm diameter
1mm thick)
S aureus from OME ovemight cultures ,
TSB
Minimum Inhibitory Concentration test
3r c 1 hr rotatory shaker
1 hr stil l
Tryptone Soya Broth
"""-__ Non-inoculated
clean control discs
Fig 8.2.1.1: Establish ing biofi lms for in vitro experiments
Fig 8.2 .1.2: Silicone disc in TSB in a bijoux bottle.
139

8.2.2 Scanning electron microscopy
For scanning electron microscopy (SEM), bacterial groupings were fixed in
cold acetone for 1 hour and air-dried from tetramethylsilane, sputter coated
with gold for 4 minutes, and examined with Jeol 6060LV variable pressure
SEM (Jeol UK Ltd, Welwyn Garden City UK). Coating with a heavy metal
ensures that the surface of the disc is electro conductive and does not
accumulate electrostatic charge when bombarded by electrons, and it also
enhances signal and surface resolution.
As SEM requires sample dehydration (the SEM chamber is a vacuum as any
gas would spread and attenuate the electron beam), it may result in significant
distortion of the biofilm structure, and therefore some biofilm discs were also
examined with Environmental Scanning Electron Microscopy (ESEM) which
allows examination of whole hydrated biofilms, although with reduced
resolution and visualisation of individual bacteria. Silicone discs were
examined with Phillips XL30 ESEM-FED (FEI, Eindhoven Netherlands).
8.2.3 Alcian blue stain
The presence of extracellular matrix was examined using Alcian Blue (AB)
stain. Biofilms were stained in situ on Phosphate buffered saline-rinsed discs,
using Alcian Blue kit (HD Supplies, Aylesbury, UK) for 30 minutes, rinsed and
examined using light microscopy (Nikon Eclipse TE200, Nikon Instruments
Europe, Kingston UK).
140
8.2.4 Confocal microscopy
Combining the Live Dead stain with Confocal Laser Scanning Microscopy
(CLSM) allows the determination of the three dimensional structure typical of
biofilms. CLSM was performed using a Leica SP2 microscope (Leica, Milton
Keynes UK), on samples stained with the Live Dead stain. The Live Dead stain
(Molecular Probes, Oregon, USA) was used according to the product literature
protocol, by combining an equal amount of sample with the stain solution,
mixing, and incubating in the dark prior to examination with appropriate
fluorescence filters.
The usefulness of the Live/Dead stain was also examined, by comparing
results from the Live/Dead stain with culture results. As they both measure live
bacteria, the results of the two tests may be expected to be very similar. A
comparison between LiveDead stain and culture results was therefore
undertaken, using pooled data from biofilm discs that were analysed during
the study of the eradication of 1 and 5 day old S aureus (F2318) biofilms with
antibiotic solution. Cohen's Kappa coefficient was used to measure agreement
between different variables attached to the same biofilm grown in vitro,
analysed using PASW Statistics 18.
141
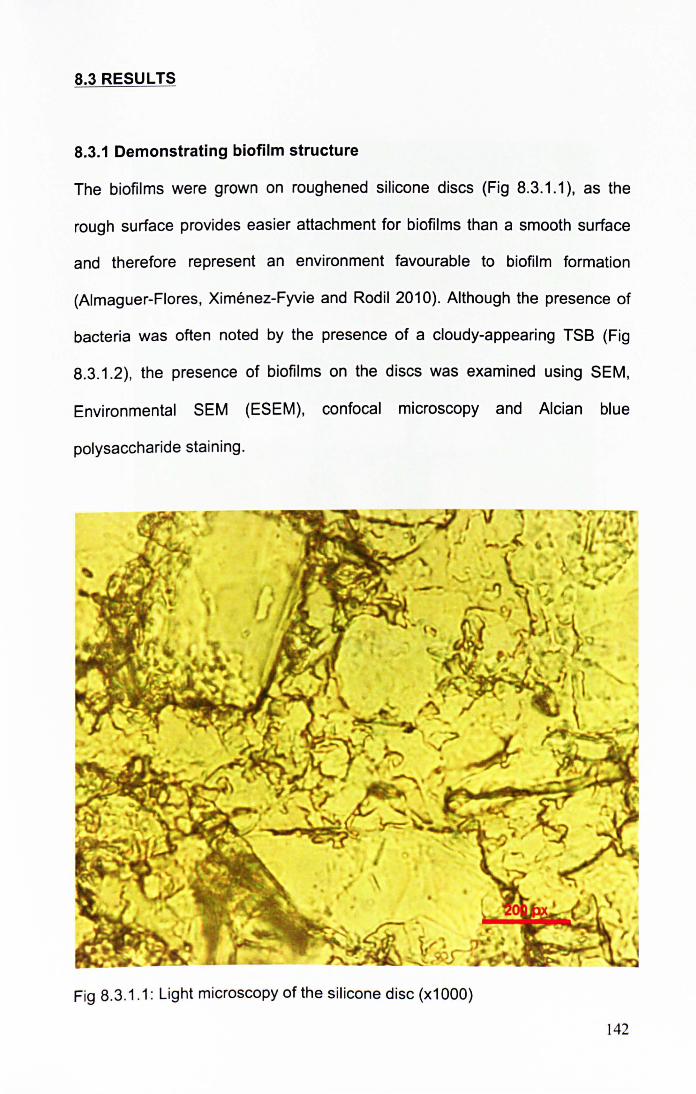
8.3 RESULTS
8.3.1 Demonstrating biofilm structure
The biofilms were grown on roughened silicone discs (Fig 8.3.1 .1), as the
rough surface provides easier attachment for biofilms than a smooth surface
and therefore represent an environment favourable to biofilm formation
(Almaguer-Flores, Ximenez-Fyvie and Rodil 2010). Although the presence of
bacteria was often noted by the presence of a cloudy-appearing TSS (Fig
8.3.1 .2), the presence of biofilms on the discs was examined using SEM,
Environmental SEM (ESEM), confocal microscopy and Alcian blue
polysaccharide staining .
Fig 8.3.1.1: Light microscopy of the silicone disc (x1 000)
142
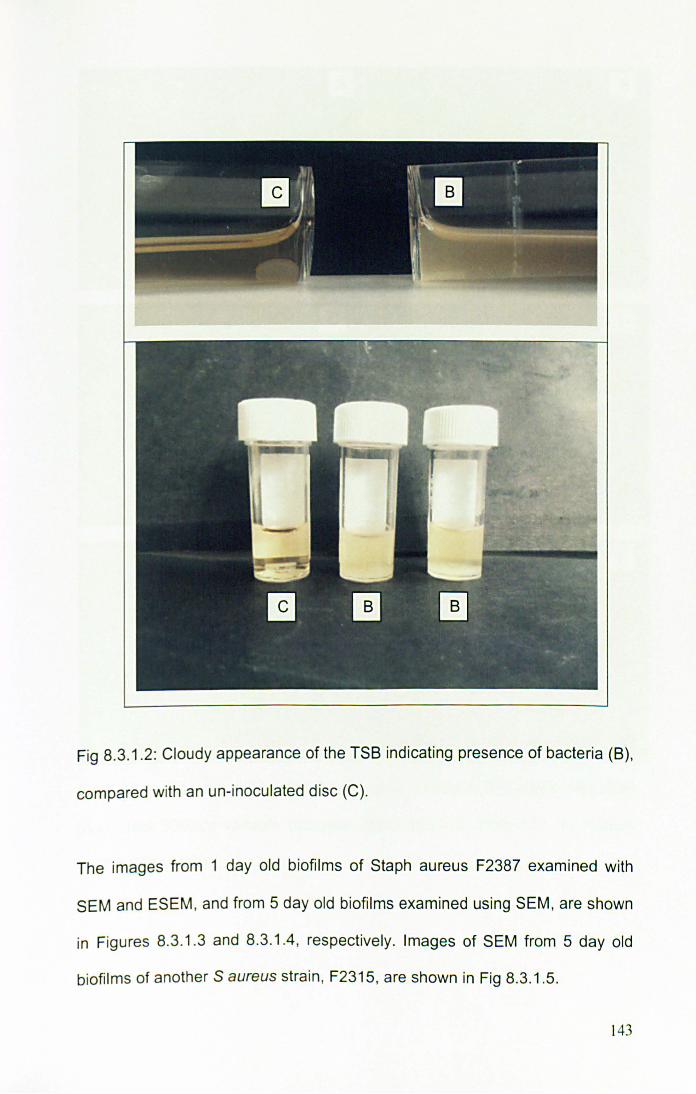
Fig 8.3.1.2: Cloudy appearance of the TSB indicating presence of bacteria (B),
compared with an un-inoculated disc (C).
The images from 1 day old biofilms of Staph aureus F2387 examined with
SEM and ESEM , and from 5 day old biofilms examined using SEM, are shown
in Figures 8.3.1 .3 and 8.3.1.4, respectively. Images of SEM from 5 day old
biofilms of another S aureus strain , F2315, are shown in Fig 8.3.1.5.
143
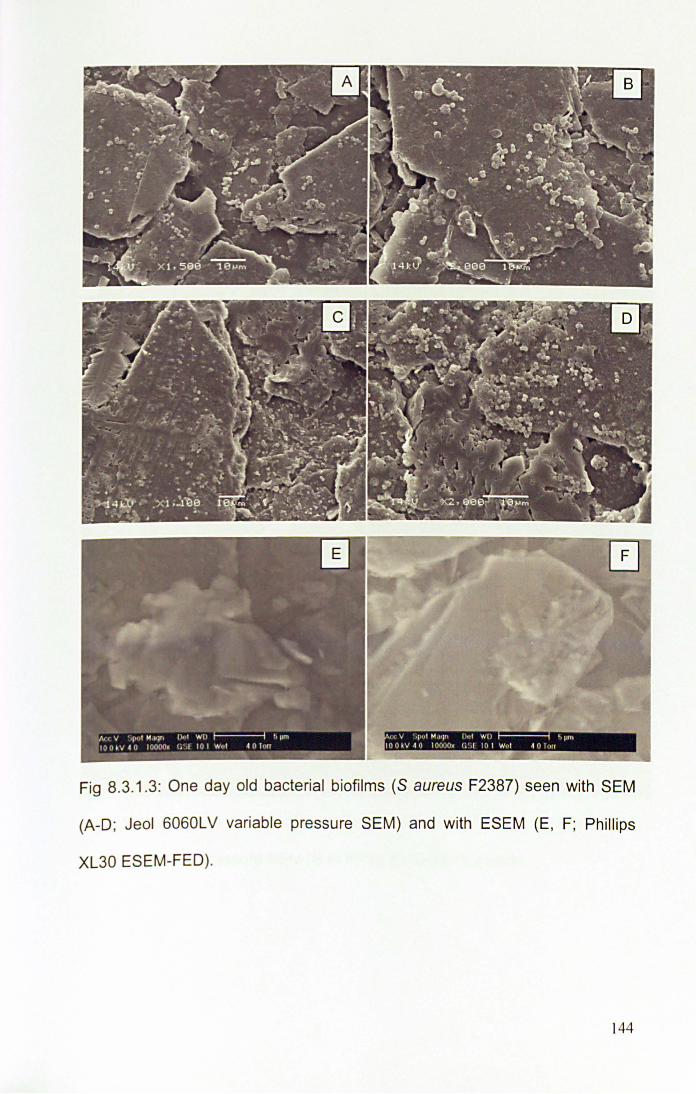
it V r,u t M"' lr, 1),,1 WI> I , pm I OO . V 4 0 I nooo)!' ( j ,1 l O t Wi" 4 0 lull
Fig 8.3.1.3: One day old bacterial biofilms (S aureus F2387) seen with SEM
(A-D; Jeol 6060LV variable pressure SEM) and with ESEM (E , F; Phillips
XL30 ESEM-FED).
144
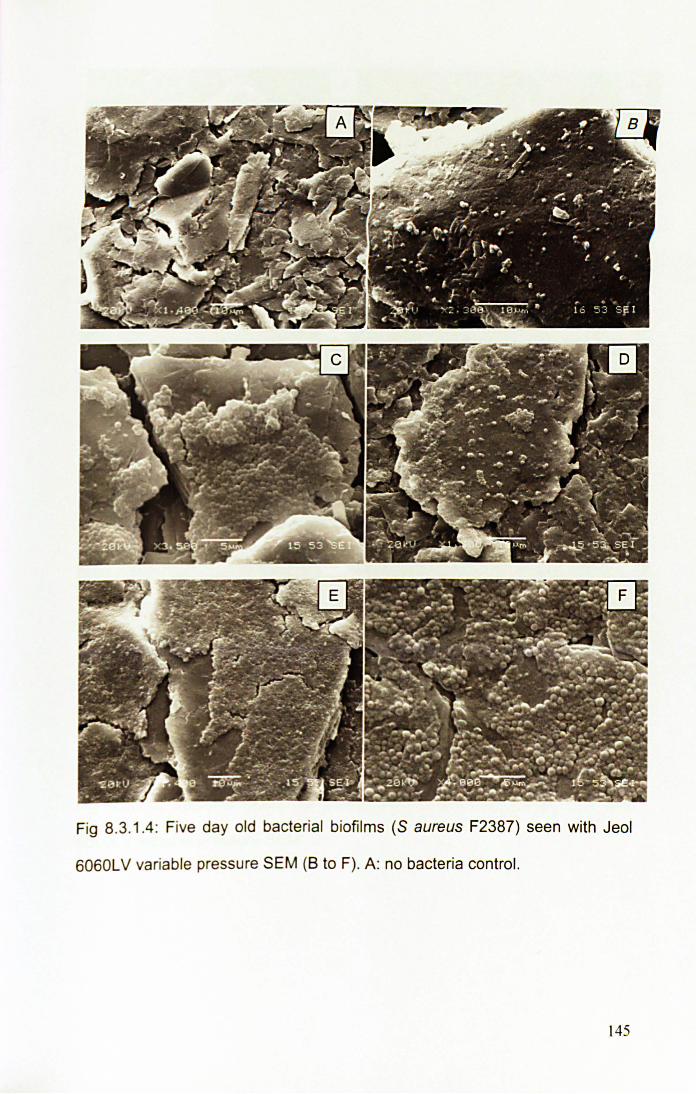
Fig 8.3.1.4: Five day old bacterial biofilms (S aureus F2387) seen with Jeol
6060L V variable pressure SEM (8 to F). A: no bacteria control.
145
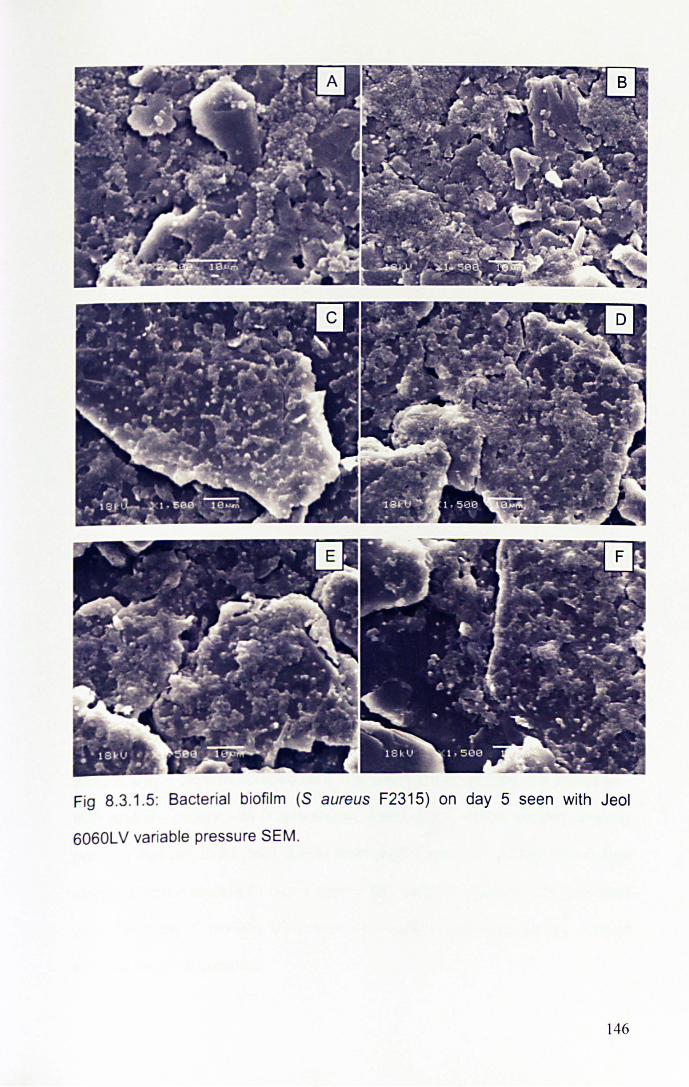
Fig 8.3.1.5: Bacterial biofilm (S aureus F2315) on day 5 seen with Jeol
6060LV variable pressure SEM.
146
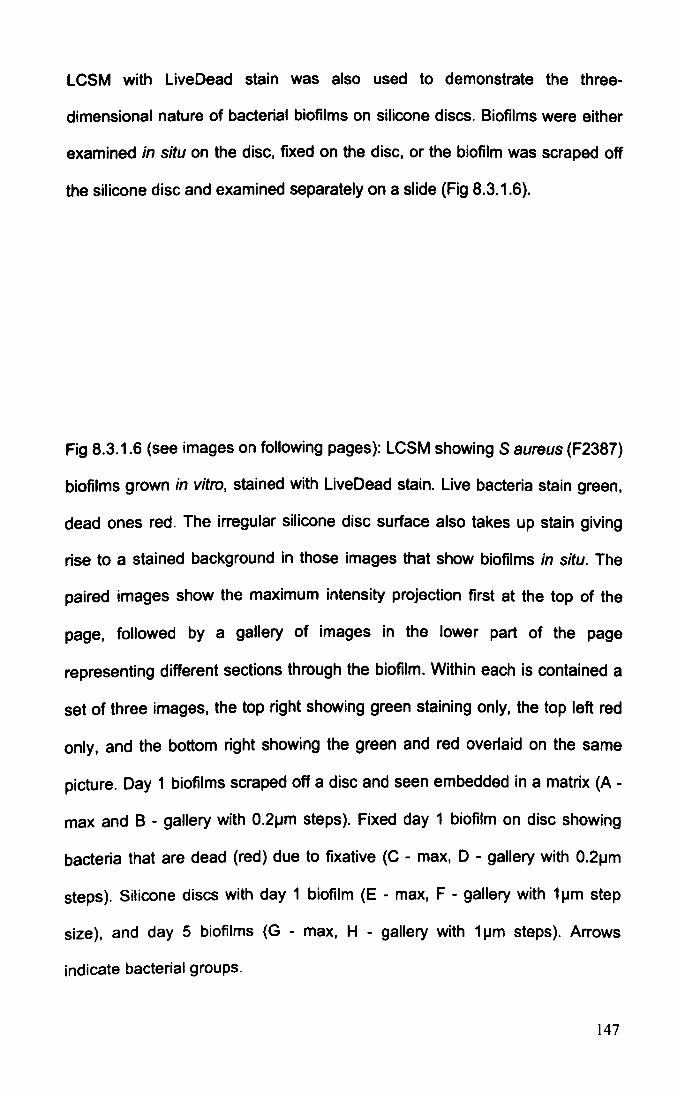
LCSM with Live Dead stain was also used to demonstrate the three
dimensional nature of bacterial biofilms on silicone discs. Biofilms were either
examined in situ on the disc, fixed on the disc, or the biofilm was scraped off
the silicone disc and examined separately on a slide (Fig 8.3.1.6).
Fig 8.3.1.6 (see images on following pages): LCSM showing S aureus (F2387)
biofilms grown in vitro, stained with LiveDead stain. Live bacteria stain green,
dead ones red. The irregular silicone disc surface also takes up stain giving
rise to a stained background in those images that show biofilms in situ. The
paired images show the maximum intensity projection first at the top of the
page, followed by a gallery of images in the lower part of the page
representing different sections through the biofilm. Within each is contained a
set of three images, the top right showing green staining only, the top left red
only, and the bottom right showing the green and red overlaid on the same
picture. Day 1 biofilms scraped off a disc and seen embedded in a matrix (A -
max and B - gallery with O.2~m steps). Fixed day 1 biofilm on disc showing
bacteria that are dead (red) due to fixative (C - max, 0 - gallery with O.2~m
steps). Silicone discs with day 1 biofilm (E - max, F - gallery with 1 ~m step
size), and day 5 biofilms (G - max, H - gallery with 1 ~m steps). Arrows
indicate bacterial groups.
147
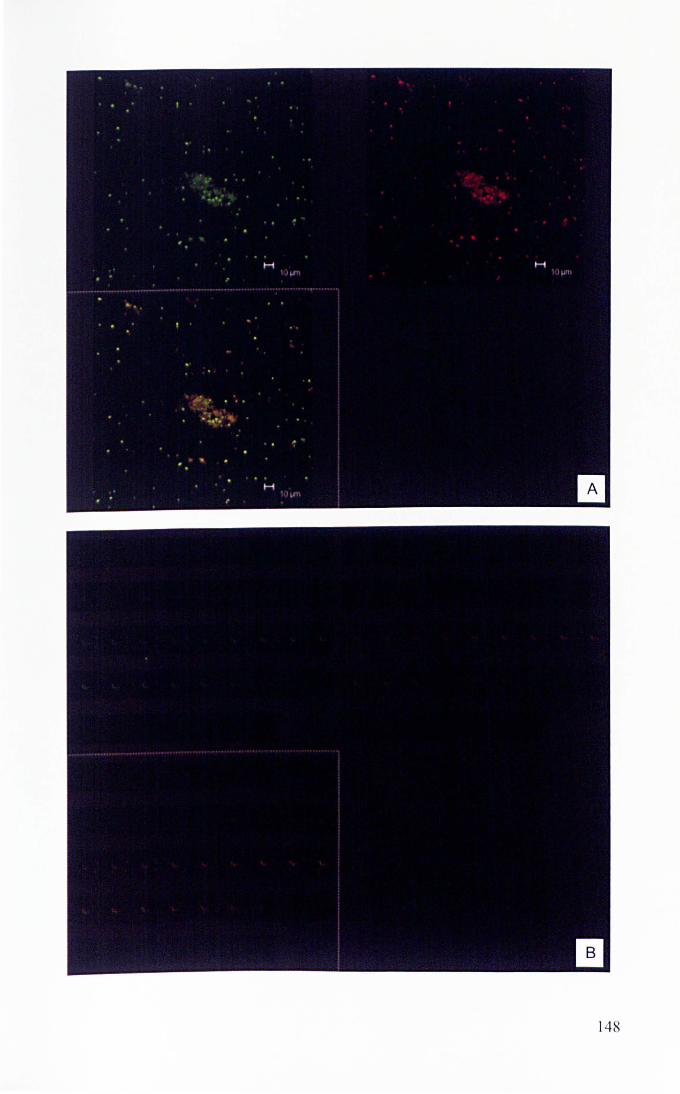
148
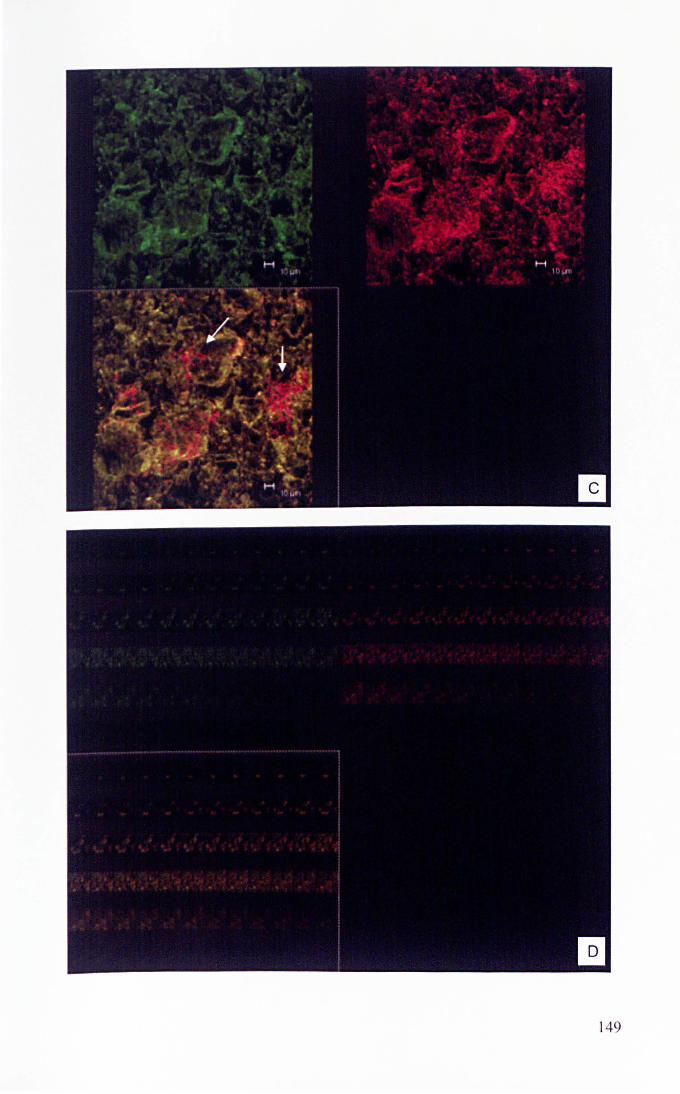
149
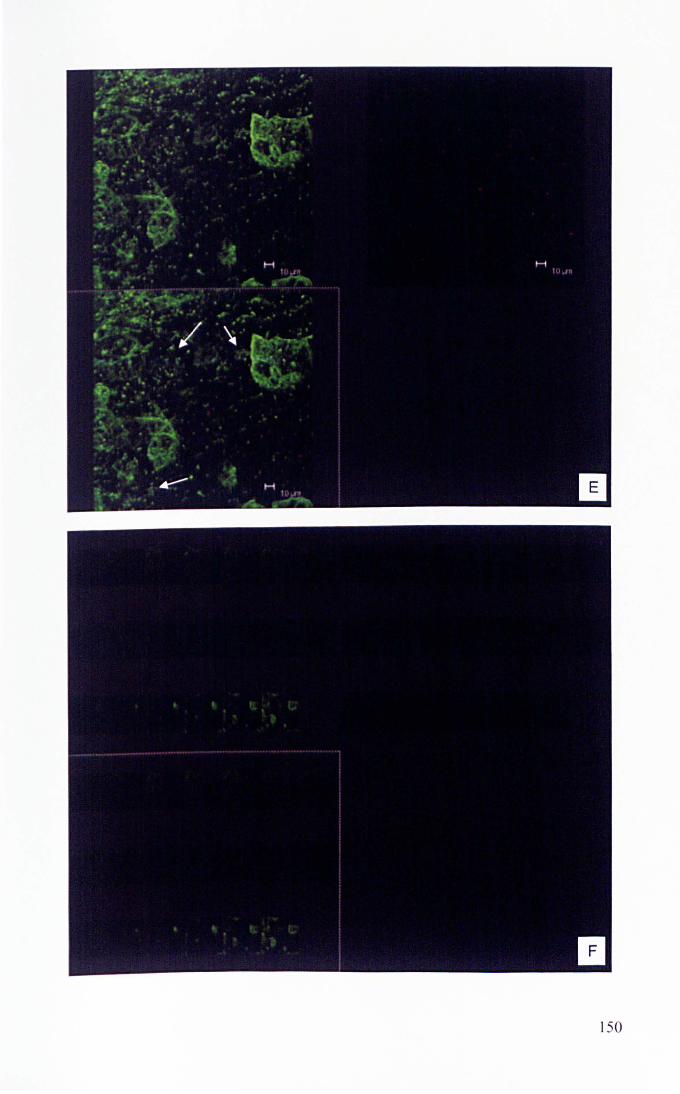
150
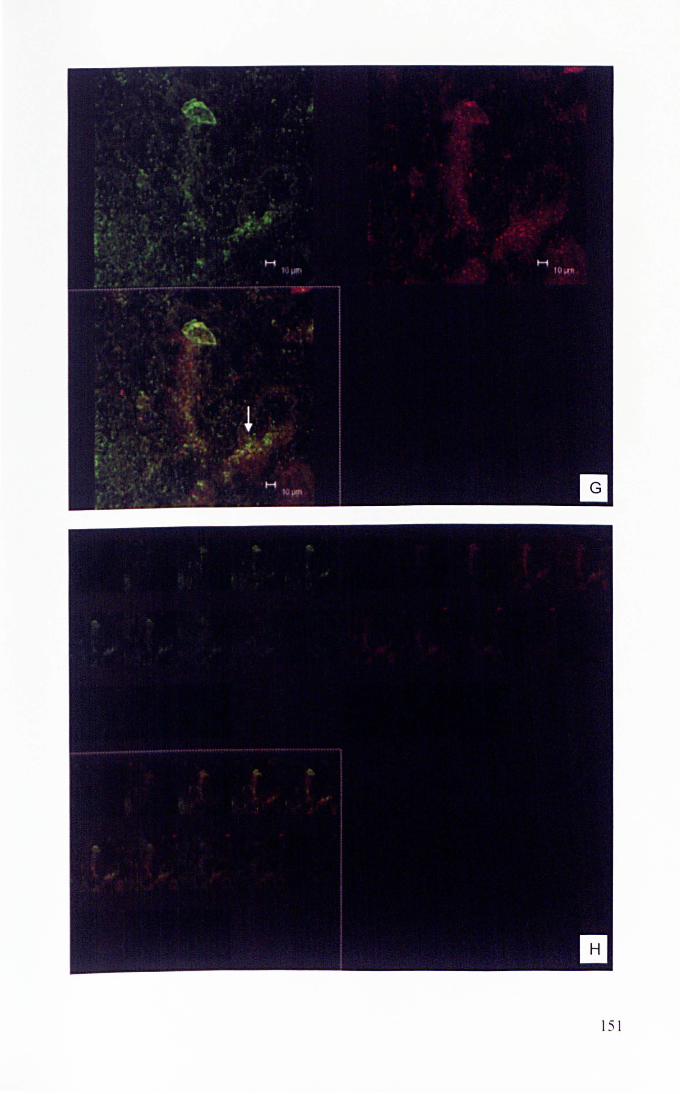
151
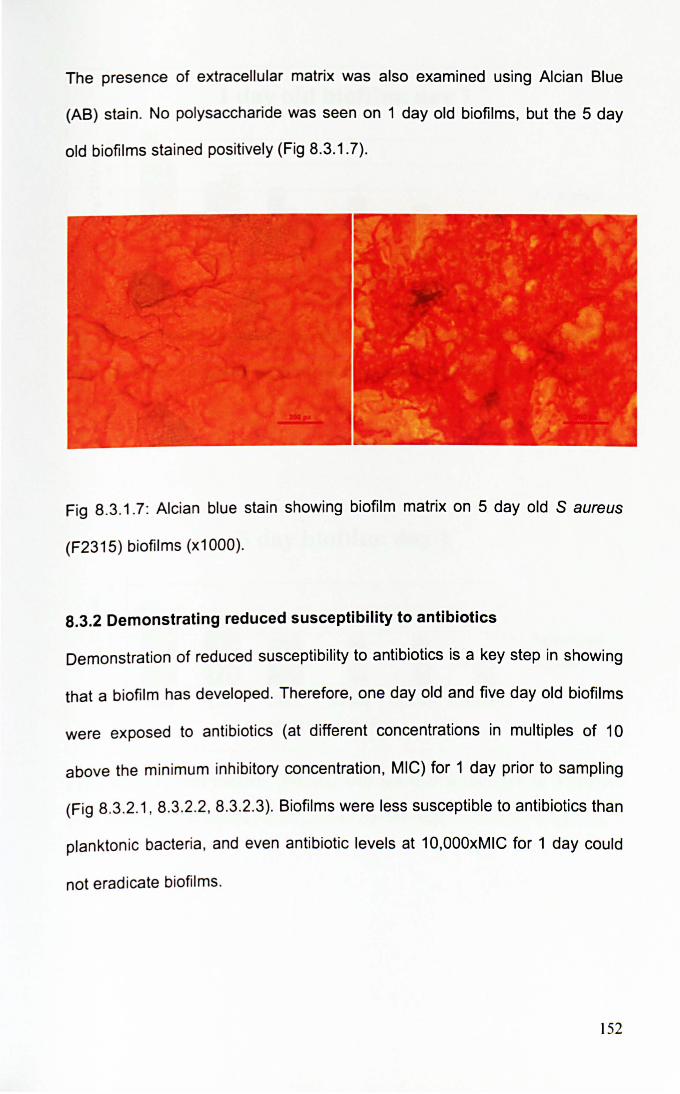
The presence of extracellular matrix was also examined using Alcian Blue
(AS) stain. No polysaccharide was seen on 1 day old biofilms, but the 5 day
old biofilms stained positively (Fig 8.3.1.7).
Fig 8.3.1.7: Alcian blue stain showing biofilm matrix on 5 day old S aureus
(F2315) biofi lms (x1000).
8.3.2 Demonstrating reduced susceptibility to antibiotics
Demonstration of reduced susceptibility to antibiotics is a key step in showing
that a biofilm has developed. Therefore, one day old and five day old biofilms
were exposed to antibiotics (at different concentrations in multiples of 10
above the minimum inhibitory concentration, MIC) for 1 day prior to sampling
(Fig 8.3.2.1, 8.3.2.2, 8.3.2.3). Biofilms were less susceptible to antibiotics than
planktoniC bacteria, and even antibiotic levels at 10,OOOxMIC for 1 day could
not eradicate biofilms.
152
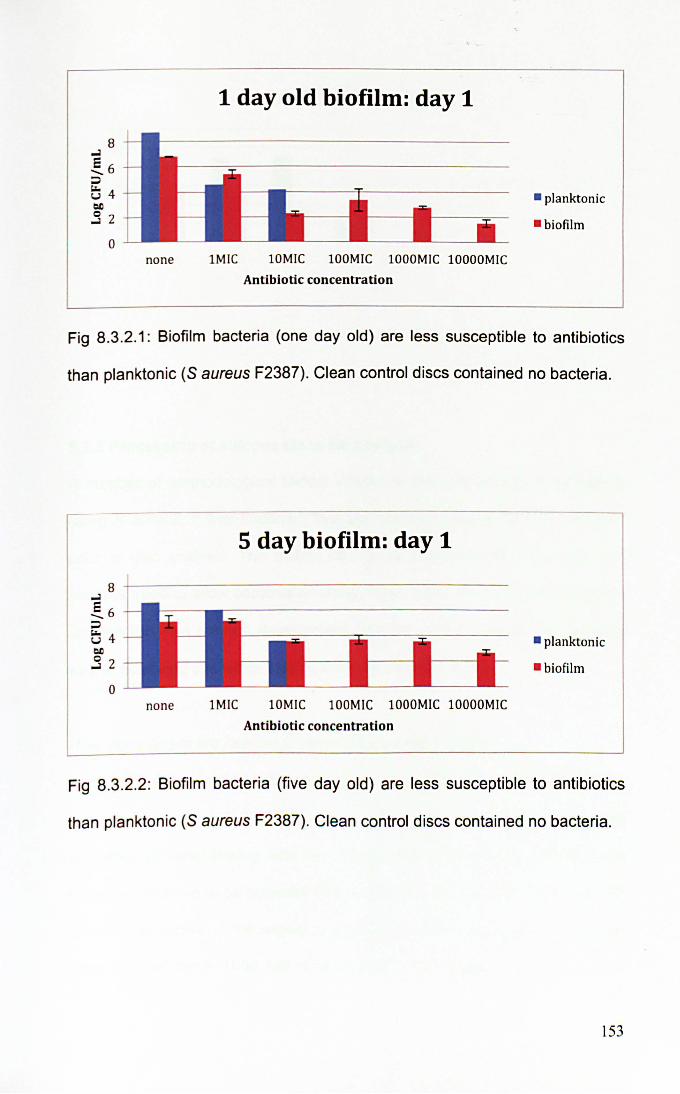
1 day old biofilm: day 1
• planktonic
• biofilm
none IMIC lOM IC lOOMIC lOOOMIC lOOOOMIC
Antibiotic concentration
Fig 8.3.2.1: Biofilm bacteria (one day old) are less susceptible to antibiotics
than planktonic (S aureus F2387). Clean control discs contained no bacteria.
5 day biofilm: day 1
8 +---------------------------------------
o none IMIC lOMIC l OOMlC lOOOMlC lOOOOMIC
Antibiotic concentration
• planktonic
- biofilm
Fig 8.3.2.2: Biofi lm bacteria (five day old) are less susceptible to antibiotics
than planktonic (S aureus F2387). Clean control discs contained no bacteria.
153
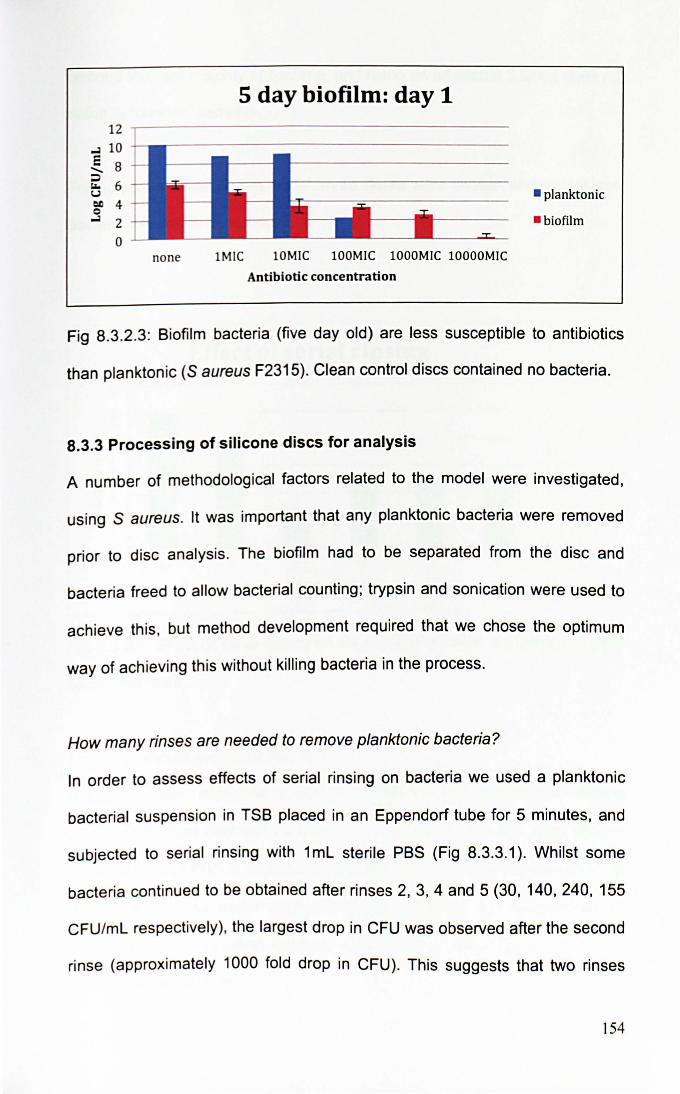
5 day biofilm: day 1 12 ,-------------------------------------
~ 10
~ 8 ~ 6 I.J
~ 4 ~ 2
o none IMIC 10MIC 100MIC 1000MIC 10000MIC
Antibiotic concentration
• planktonic
· biofilm
Fig 8.3.2.3: Biofilm bacteria (five day old) are less susceptible to antibiotics
than planktonic (S aureus F2315). Clean control discs contained no bacteria.
8.3.3 Processing of silicone discs for analysis
A number of methodological factors related to the model were investigated,
using S aureus. It was important that any planktonic bacteria were removed
prior to disc analysis. The biofilm had to be separated from the disc and
bacteria freed to allow bacterial counting; trypsin and sonication were used to
achieve th is, but method development required that we chose the optimum
way of achieving th is without killing bacteria in the process.
How many rinses are needed to remove planktonic bacteria?
In order to assess effects of serial rinsing on bacteria we used a planktonic
bacterial suspension in TSB placed in an Eppendorf tube for 5 minutes, and
subjected to serial rinsing with 1 mL sterile PBS (Fig 8.3.3.1). Whilst some
bacteria continued to be obtained after rinses 2, 3, 4 and 5 (30, 140,240, 155
CFU/mL respectively). the largest drop in CFU was observed after the second
rinse (approximately 1000 fold drop in CFU). This suggests that two rinses
154
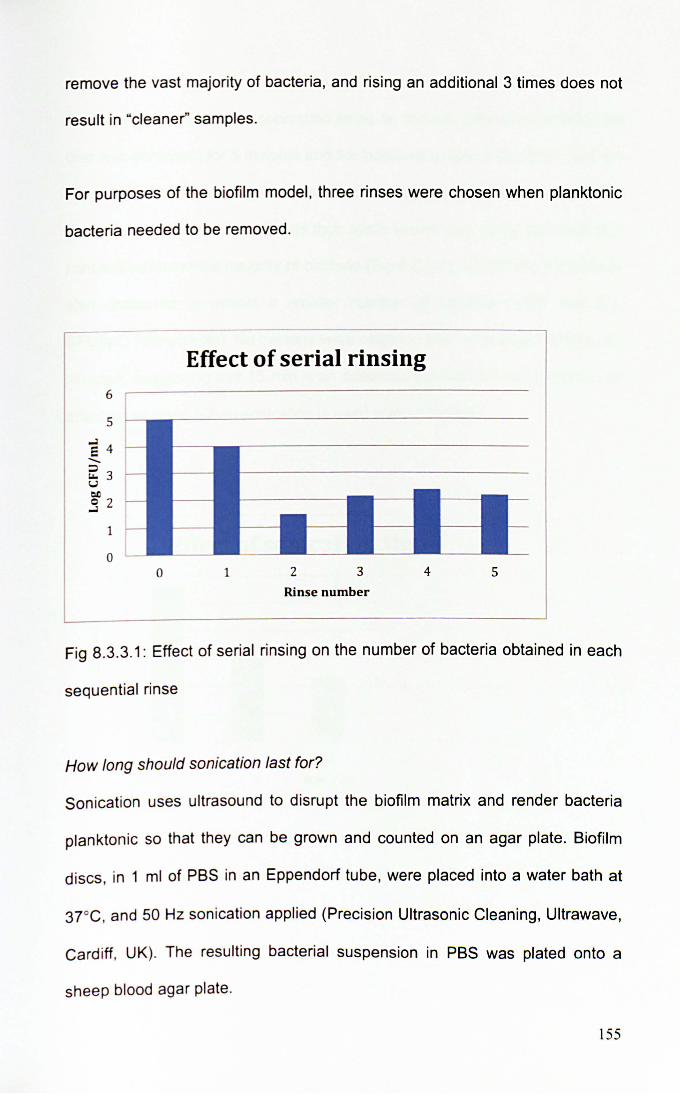
remove the vast majority of bacteria, and rising an additional 3 times does not
result in "cleaner" samples.
For purposes of the biofilm model, three rinses were chosen when planktonic
bacteria needed to be removed.
Effect of serial rinsing 6
5
E 4 ....... ~ 3 u 01)
S 2
1
0 0 1 2 3 4 5
Rinse number
Fig 8.3.3.1: Effect of serial ri nsing on the number of bacteria obtained in each
sequential rinse
How long should sonication last for?
Sonication uses ultrasound to disrupt the biofilm matrix and render bacteria
plankton ic so that they can be grown and counted on an agar plate. Biofilm
discs, in 1 ml of PBS in an Eppendorf tube, were placed into a water bath at
3r c, and 50 Hz sonication applied (Precision Ultrasonic Cleaning, Ultrawave,
Card iff, UK). The resulting bacteria l suspension in PBS was plated onto a
sheep blood agar plate.
155
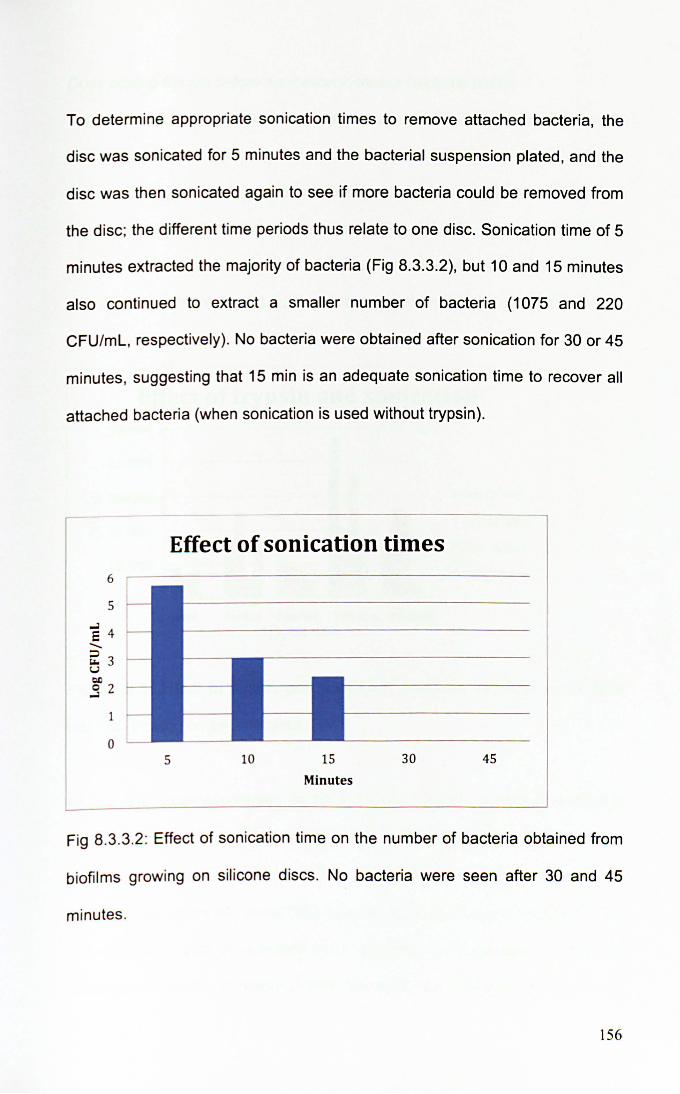
To determine appropriate sonication times to remove attached bacteria, the
disc was sonicated for 5 minutes and the bacterial suspension plated, and the
disc was then sonicated again to see if more bacteria could be removed from
the disc; the different time periods thus relate to one disc. Sonication time of 5
minutes extracted the majority of bacteria (Fig 8.3.3.2), but 10 and 15 minutes
also continued to extract a smaller number of bacteria (1075 and 220
CFU/mL, respectively). No bacteria were obtained after sonication for 30 or 45
minutes, suggesting that 15 min is an adequate sonication time to recover all
attached bacteria (when sonication is used without trypsin).
Effect of sonication times
5
E 4 -~ 3 u tI.!)
S 2
1
0 5 10 15 30 45
Minutes
Fig 8.3.3.2: Effect of sonication time on the number of bacteria obtained from
biofilms growing on silicone discs. No bacteria were seen after 30 and 45
minutes.
156

Does adding trypsin before sonication increase bacterial yield?
Trypsin is a proteolytic enzyme that disrupts biofilm attachment to render
bacteria planktonic. A range of trypsin (trypsin 0.25% with EDT A 0.02%,
Sigma, Gill ingham UK) incubation times prior to sonication was trialled and
combined with different sonication times (Fig 8.3.3.3). In this experiment,
rather than repeated sonication of a disc for increasing time periods (as in
previous experiment Fig 8.3.3.2), each time period represents a different disc.
Effect of trypsin and sonication 500000 ~-------------
400000 -+----------1._----
E 300000 --------_ H J-----~ ~ 200000 -------111------
100000
o none Smins 10mins lSmins 30mins
Trypsin time
• soni5mins
• sonilOmins
• sonilSmins
• soni30mins
Fig 8.3.3.3: Effect of trypsin and sonication times on bacterial yields from
biofi lms growing on silicone discs.
As in the previous experiment, in the absence of trypsin, 15 min sonication is
most effective. However, combining trypsin with sonication shows that the
highest yield is obtained with a 15 minute incubation in trypsin and sonication
for 5 minutes (1.1 x 10⁵ more CFU obtained than the nearest rival, and 3.5 x
105 more CFU than the greatest yield obtained with sonication alone in the
absence of trypsin). Although overall the yield has changed by less than a
157
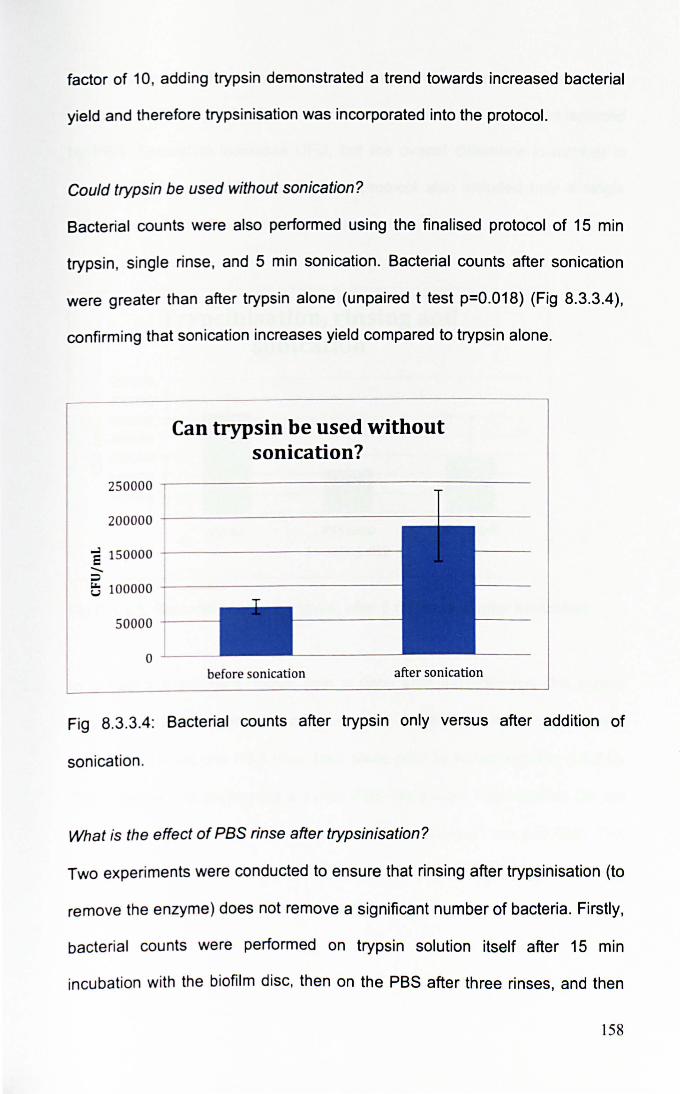
factor of 10, adding trypsin demonstrated a trend towards increased bacterial
yield and therefore trypsinisation was incorporated into the protocol.
Could trypsin be used without sonication?
Bacterial counts were also performed using the finalised protocol of 15 min
trypsin, single rinse, and 5 min sonication. Bacterial counts after sonication
were greater than after trypsin alone (unpaired t test p=O.018) (Fig 8.3.3.4),
confi rming that sonication increases yield compared to trypsin alone.
Can trypsin be used without sonication?
250000 ...-------------------
200000 ---------------+-----
e 150000 -+---------------;:) e; 100000 ---------------<
50000 -"---
before sonication after sonication
Fig 8.3.3.4: Bacterial counts after trypsin only versus after addition of
sonication .
What is the effect of PBS rinse after trypsinisation?
Two experiments were conducted to ensure that rinsing after trypsinisation (to
remove the enzyme) does not remove a significant number of bacteria. Firstly,
bacterial counts were performed on trypsin solution itself after 15 min
incubation with the biofilm disc, then on the PBS after three rinses, and then
158
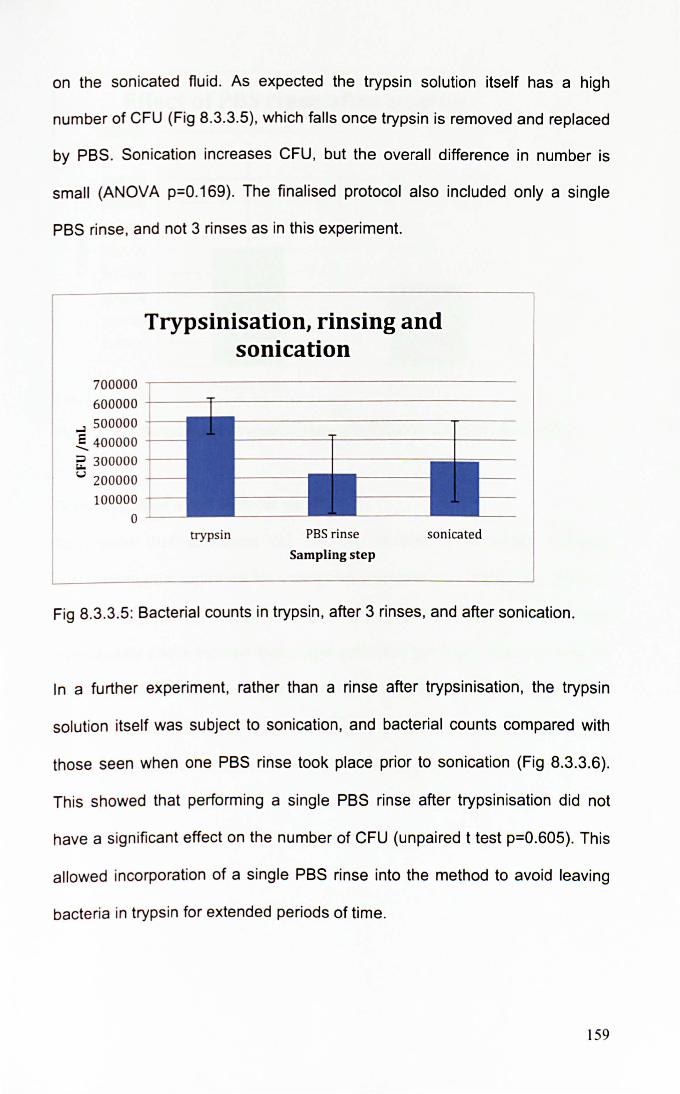
on the sonicated fluid . As expected the trypsin solution itself has a high
number of CFU (Fig 8.3.3.5) , which falls once trypsin is removed and replaced
by PBS. Sonication increases CFU, but the overall difference in number is
small (ANOVA p=O.169). The finalised protocol also included only a single
PBS rinse, and not 3 rinses as in this experiment.
Trypsinisation, rinsing and sonication
700000 -,--------------------
600000 +---.:r----------------....l 500000 ~ 400000 -+--
~ 300000 -r-
<.J 200000 -r--
100000 -t--
o ~-
trypsin PBS rinse
Sampling step
sonicated
Fig 8.3.3.5: Bacterial counts in trypsin , after 3 rinses, and after sonication.
In a further experiment, rather than a rinse after trypsinisation, the trypsin
solution itself was subject to sonication, and bacterial counts compared with
those seen when one PBS rinse took place prior to sonication (Fig 8.3.3.6).
This showed that performing a single PBS rinse after trypsinisation did not
have a significant effect on the number of CFU (unpaired t test p=O.605). This
allowed incorporation of a single PBS rinse into the method to avoid leaving
bacteria in trypsin for extended periods of time.
159
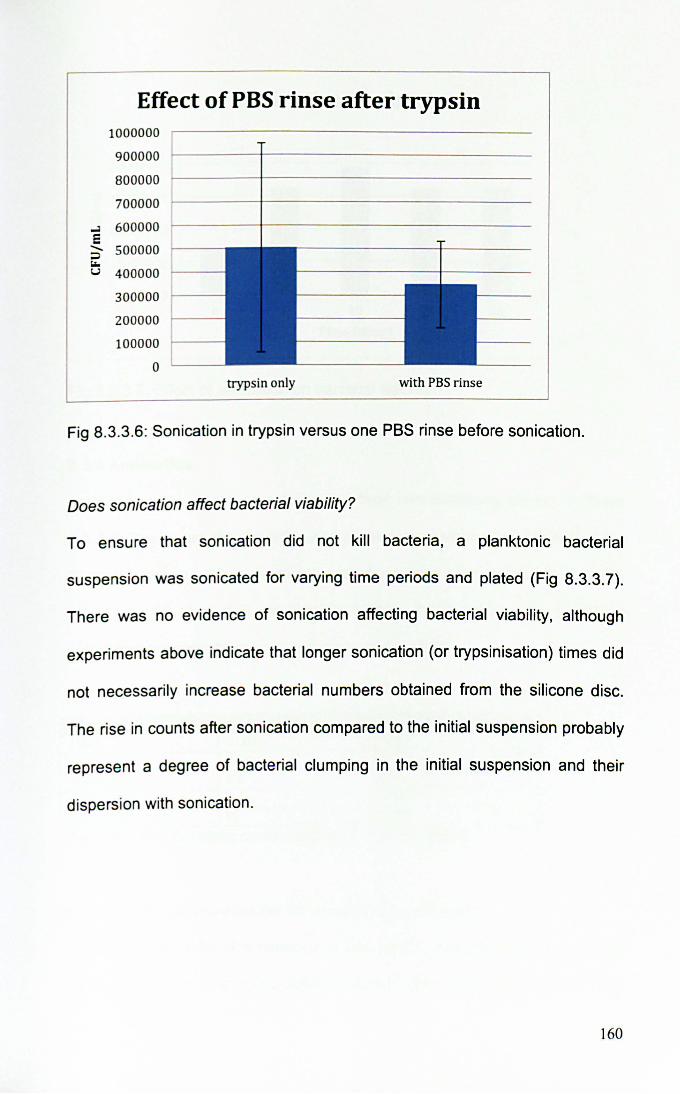
Effect of PBS rinse after trypsin 1000000
900000
800000
700000
..J 600000 e - 500000 ~
"" u 400000
300000
200000
100000
0 trypsin only with PBS rinse
Fig 8.3.3.6: Sonication in trypsin versus one PBS rinse before sonication.
Does sonication affect bacterial viability?
To ensure that sonication did not kill bacteria, a planktonic bacterial
suspension was sonicated for varying time periods and plated (Fig 8.3.3.7).
There was no evidence of sonication affecting bacterial viability, although
experiments above indicate that longer sonication (or trypsinisation) times did
not necessarily increase bacterial numbers obtained from the silicone disc.
The rise in counts after sonication compared to the initial suspension probably
represent a degree of bacterial clumping in the initial suspension and their
dispersion with sonication.
160
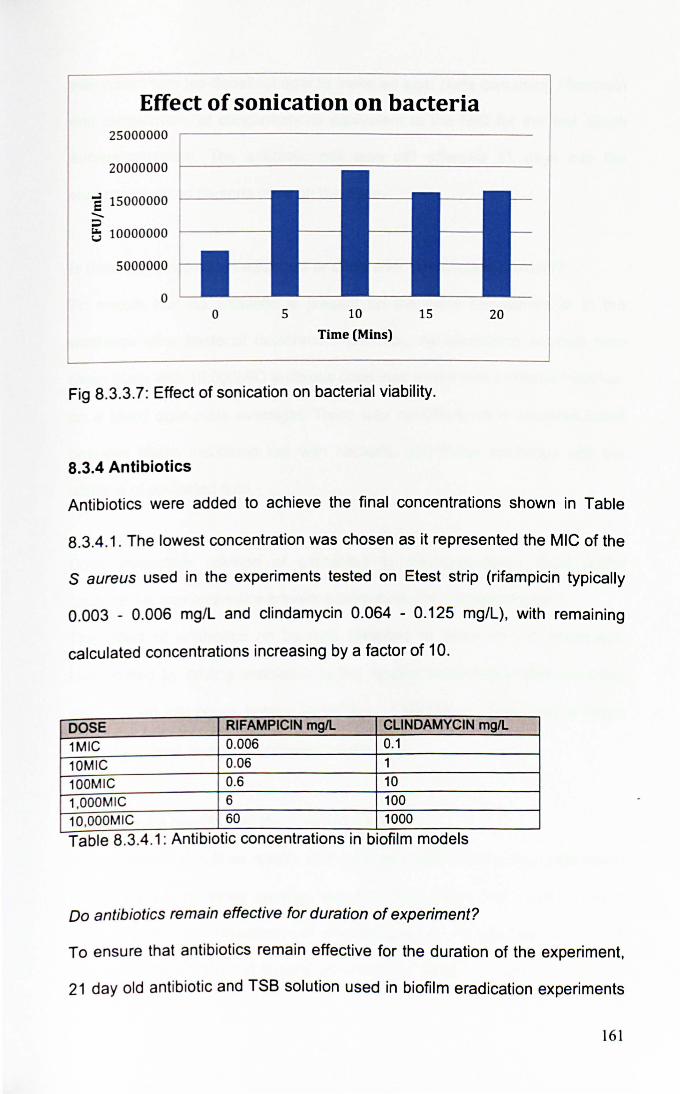
Effect of sonication on bacteria 25000000
20000000
E 15000000 -:::l ~ 10000000
5000000
o o 5 10
Time (Mins)
15
Fig 8.3.3.7: Effect of sonication on bacterial viability.
8.3.4 Antibiotics
20
Antibiotics were added to achieve the final concentrations shown in Table
8.3.4 .1 . The lowest concentration was chosen as it represented the MIC of the
S aureus used in the experiments tested on Etest strip (rifampicin typically
0.003 - 0.006 mg/L and clindamycin 0.064 - 0.125 mg/L), with remaining
calculated concentrations increasing by a factor of 10.
DOSE RIFAMPICIN mgIL CLiNDAMYCIN mgIL
1MIC 0.006 0.1
10MIC 0.06 1
100MIC 0.6 10
1,OOOM IC 6 100
10,OOOM IC 60 1000 . .
Table 8.3.4.1: AntibiotiC concentrations In blofilm models
Do antibiotics remain effective for duration of experiment?
To ensure that antibiotics remain effective for the duration of the experiment,
21 day old antibiotic and TSB solution used in biofilm eradication experiments
161
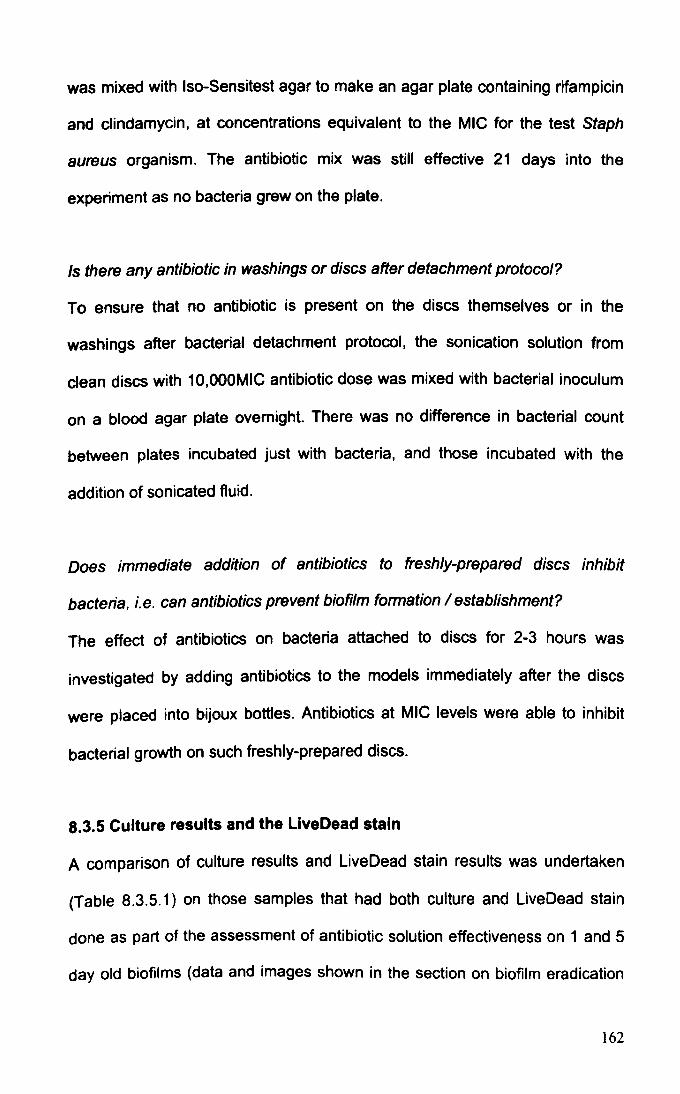
was mixed with Iso-Sensitest agar to make an agar plate containing rifampicin
and dindamycin, at concentrations equivalent to the MIC for the test Staph
aureus organism. The antibiotic mix was still effective 21 days into the
experiment as no bacteria grew on the plate.
Is there any antibiotic in washings or discs after detachment protocol?
To ensure that no antibiotic is present on the discs themselves or in the
washings after bacterial detachment protocol, the sonication solution from
dean discs with 10,OOOMIC antibiotic dose was mixed with bacterial inoculum
on a blood agar plate overnight. There was no difference in bacterial count
between plates incubated just with bacteria, and those incubated with the
addition of sonicated fluid.
Does immediate addition of antibiotics to freshly-prepared discs inhibit
bacteria, i.e. can antibiotics prevent biofilm formation / establishment?
The effect of antibiotics on bacteria attached to discs for 2-3 hours was
investigated by adding antibiotics to the models immediately after the discs
were placed into bijoux bottles. Antibiotics at MIC levels were able to inhibit
bacterial growth on such freshly-prepared discs.
8.3.5 Culture results and the LiveDead stain
A comparison of culture results and LiveDead stain results was undertaken
(Table 8.3.5.1) on those samples that had both culture and Live Dead stain
done as part of the assessment of antibiotic solution effectiveness on 1 and 5
day old biofilms (data and images shown in the section on biofilm eradication
162
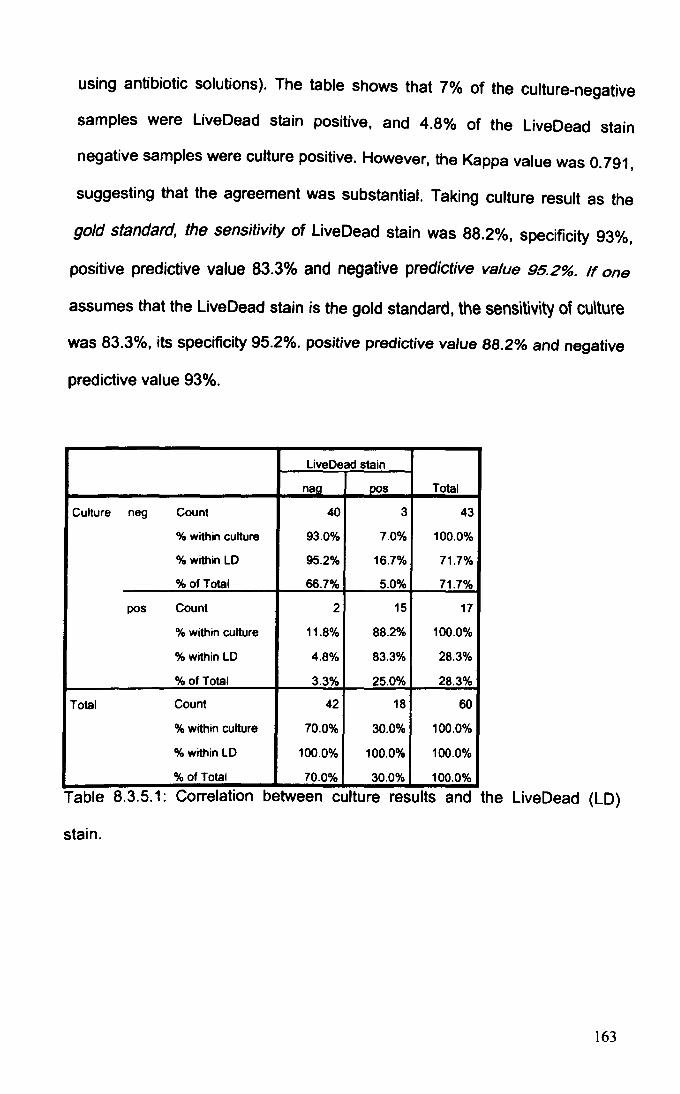
using antibiotic solutions). The table shows that 7% of the culture-negative
samples were LiveDead stain positive, and 4.8% of the LiveDead stain
negative samples were culture positive. However, the Kappa value was 0.791,
suggesting that the agreement was substantial. Taking culture result as the
gold standard, the sensitivity of Live Dead stain was 88.2%, specificity 93%,
positive predictive value 83.3% and negative predictive value 95.2%. If one
assumes that the Live Dead stain is the gold standard, the sensitivity of cu\ture
was 83.3%, its specificity 95.2%. positive predictive value 88.2% and negative
predictive value 93%.
Live Dead stain
naa DOS Total
Culture neg Count 40 3 43
% within culture 93.0% 7.0% 100.0%
% within LD 95.2% 16.7% 71.7%
% of Total 66.7% 5.0% 71.7%
POs Count 2 15 17
% within culture 11.8% 88.2% 100.0%
% within LD 4.8% 83.3% 28.3%
% ofTotal 3.3% 25.0% 28.3%
Total Count 42 18 60
% within culture 70.0% 30.0% 100.0%
% within LD 100.0% 100.0% 100.0%
% of Total 70.0% 30.0% 100.0%
Table 8.3.5.1: Correlation between culture results and the Live Dead (LD)
stain.
163
8.4 DISCUSSION
8.4.1 Summary of findings
Biofilms are defined as structured communities of bacteria attached to a
surface and encased in self-produced extracellular matrix, and exhibiting
reduced susceptibility to antibiotics compared to the planktonic bacteria from
which the biofilm originates from (Parsek and Singh 2003). Any in vitro biofilm
model, as a representation of a biofilm infection, therefore should contain both
the physical and functional characteristics, with demonstration of reduced
susceptibility to antibiotics essential (Donlan and Costerton 2002).
The data presented in this chapter show that biofilms can be established on
silicone discs, and their presence confirmed by demonstrating both their
structure and reduced susceptibility to antibiotics that typifies biofilms
functionally. Five day old biofilms were chosen for further study. The optimum
processing strategy to remove attached biofilms to render bacteria planktoniC
and thus allow their counting was also determined, with a final protocol of
three PBS rinses, 15 minutes in trypsin, changing trypsin for PBS and then
sonication for 5 minutes chosen.
8.4.2 Biofilm structure and reduced susceptibility to antibiotics
Rough silicone was chosen as the surface for biofilm attachment. Different
surfaces vary in their biofilm susceptibility, but silicone has been found in most
studies to be very conducive to biofilm development (Schinabeck and
Ghannoum 2006) (Darouiche 2001) (Pascual 2002), whilst a rough surface
164
also enhances bacterial attachment (Schinabeck and Ghannoum 2006)
(Darouiche 2001). Although biofilms formed in high shear environments may
be stronger (Donlan and Costerton 2002), we used only a rotatory shaker for
one hour, as the middle ear itself is unlikely to be exposed to significant shear
forces.
Biofilm structure
The biofilm structure was demonstrated using a combination of SEM, confocal
microscopy and A1cian blue polysaccharide stain. Environmental Scanning
Electron Microscopy (ESEM) was also used, although the degree of hydration
made the identification of individual bacteria in such images more difficult.
Both SEM and ESEM image a sample by scanning it with a high energy
electron beam in a raster pattern, with electrons interacting with the atoms in
the sample to produce signals that give information about the surface of the
sample, its composition and also electrical conductivity. However, in SEM the
entire process is conducted in a vacuum, thus requiring the sample to be
dehydrated. In the case of biofilms, this dehydration affects the matrix that
contains a large amount of water, and the final images largely do not show
much matrix. This does give rise to good photographs, as individual bacteria
are easily seen. In the case of ESEM, technological modifications allow
examination of hydrated structures by placing the specimen in a hydrated
chamber rather than a vacuum; by these means the biofilm matrix can be
preserved, but this means that individual bacteria are not seen as well
because they are surrounded by matrix.
165
SEM gives surface characteristics of the bacteria, but LCSM is better at
showing the three-dimensional nature of biofilms. LCSM works on the
principle of optical sectioning, where images are collected point by point at
selected depths and reconstructed using dedicated software (in conventional
microscopy images from different depths are superimposed but in LCSM
images from different depths can be portrayed separately). Thus LCSM allows
one to determine the three-dimensional nature of biofilms by collecting images
from different depths of a biofilm. A superimposed composite image showing
maximum staining is also generated by the software. Using LCSM in
conjunction with the LiveDead stain also allows the confirmation that bacteria
in biofilms are alive.
Alcian blue has previously been used to stain biofilms and can also be used to
quantify extracellular matrix production (Bayston and Rodgers 1990) (Bober
2005); it is a copper dye that reacts with polysaccharides to form an insoluble
precipitate (Ramus 1977). The advantage of Alcian blue staining is that,
because polysaccharide is an essential component of biofilm matrix (Lasa
2006), the stain should at least in theory detect the matrix of all biofilms.
Various other stains for biofilm matrix can also be used, including a number of
commercially available stains that can detect a variety of different matrix
components (Invitrogen 2011).
Reduced susceptibility to antibiotics
In terms of reduced susceptibility to antibiotics, a difference could be seen
between planktonic and biofilm bacteria after 24 hours of antibiotic treatment,
166
with biofilm bacteria not inhibited by any antibiotic concentration tested, but
planktonic ones inhibited by antibiotics at a concentration of 100 times higher
than the MIC of the inoculum. The reason for planktonic bacteria requiring
100MIC (rather than actual MIC level) probably lies in the fact that antibiotic
treatment was carried out only for 24 hours. Rifampicin can be bacteriostatic
or bactericidal depending on dose and exposure time, and exhibit time -
dependent and also concentration - dependent killing (Gumbo, et al. 2007)
(Bakker-Woudenberg, et al. 2005). Similarly, clindamycin can be bacteriostatic
or bactericidal depending on dose and exposure time, and exhibit time -
dependent (Klepser, et al. 1996) and also concentration - dependent killing
(Aldridge and Stratton 1991). This is thought to explain the fact that a higher
antibiotic concentration than MIC is required to inhibit planktonic bacteria at 24
hours. At longer incubation periods, even in the planktonic samples biofilm
"slime" could be seen to develop at the bottom of a bijoux tube in the
planktonic samples; thus data seen at longer time intervals are unlikely to
represent pure planktonic bacteria.
Effect of biofilm age
Although communities of attached bacteria could be seen with SEM both in 1
and 5 day old biofilms, polysaccharide could be shown only on 5 day old
biofilms. The observation that attached bacteria on both 1 and 5 day old discs
exhibited greatly reduced susceptibility to antibiotics compared to planktonic
bacteria suggests that attached bacteria develop recalcitrance to antibiotics
before they start producing a significant amount of polysaccharide matrix, in
keeping with previous literature (Otto 2008) (Dagostino, Goodman and
167
Marshall 1994). Later experiments on biofilm eradication (data shown in next
chapter) showed that no great difference was seen when 5 day old biofilms
were compared with 14 and 21 day old ones, suggesting that the S 8ureus
biofilm seen at 5 days was a mature one and therefore suitable for further
studies involving a modified release antibiotic implant.
Our findings of the early development of reduced antibiotic susceptibility are
comparable to other studies that have found biofilms forming as soon as at 24
hours (Vorachit, et al. 1993) (Nickel, et al. 1985) (Oliveira, et al. 2007), and
that biofilm age is not necessarily a major factor influencing susceptibility to
antibiotics (Wong, et al. 2010). This poses a potential problem when trying to
eradicate biofilms, for if bacteria develop reduced susceptibility very early
upon contacting a surface, then the higher antibiotic doses will be needed
right from an early biofilm age. In the context of infections on prosthetic
implants, this then becomes a major issue emphasising the importance of
prevention of infection in the first place (for example with the use of antibiotic
impregnated biomaterials (Bayston, Fisher and Weber 2009) (Bayston, Vera
and Ashraf 2010), although our findings that almost immediate addition of
antibiotics to "infected" silicone discs (within a few hours and presumably
before biofilms form) can prevent bacterial growth is consistent with the
concept of peri-operative antibiotics as a way of minimising prosthesis
infection.
In the context of OME though, the fact that biofilm age may be relatively
unimportant could be an advantage. By the time children are treated biofilms
168
will probably have been present for months (at least 3 months if the NICE
guidelines recommended 3 month waiting period is followed, and probably
much longer as disease is likely to have been present months before clinical
advice is sought). If biofilm age was a major stumbling block in biofilm
eradication, then trying to eradicate biofilms that are months old would be
difficult. However, if biofilms can be eradicated with biofilm age having a small
role only, then the strategy of trying to eradicate OME biofilms could be a
successful one. Certainly our results show that there is no significant
difference in recalcitrance between biofilms aged between 5 and 21 days (also
see Chapter 9), suggesting that eradication of biofilms several weeks old may
be possible (providing appropriately high antibiotic levels are used for a long
time period). We have not studied biofilms that are "months" old, but if
reduced susceptibility develops on the first day, and there is not much
difference in antibiotic susceptibility of biofilms within the first few weeks
(Wong, et al. 2010), it may be tempting to speculate that eradication of
"months" old biofilms may also be possible. However, the influence of biofilm
age on its susceptibility to eradication remains an important issue.
8.4.3 Processing of biofilm discs
Biofilm bacteria attached to surfaces may be difficult to culture using standard
laboratory techniques, but if the biofilm matrix is disrupted and bacteria
rendered planktonic, then they should grow under standard laboratory
conditions. This study therefore investigated different sonication times and
trypsinisation times as a means of detaching bacteria from the silicone disc.
On the whole, the differences between groups are smaller than a factor of 10.
169
Prolonged sonication and trypsin exposure (30 minutes) did appear to reduce
bacterial yield, although tests on planktonic bacteria did not show any
evidence of bacterial killing by sonication; previous work also suggests that
ultrasound has little effect on Gram positive bacteria, but it inhibits many Gram
negative ones (Monsen, et al. 2009). As trypsin is a proteolytic enzyme,
prolonged exposure may affect bacterial viability, therefore a decision was
made to remove trypsin after 15 min and replace with PBS before sonication
(alternatives would have been to use a trypsin inhibitor, or to change pH or
temperature to reduce trypsin activity). On the basis that the combination of 15
min trypsin and 5 min sonication yielded the highest count, that combination
was chosen for future experiments. A number of methodological factors in the
model were also investigated, so that we were able to establish that rinsing
the discs three times removes majority of non-attached bacteria, that
antibiotics remain effective for the duration of the experiments, and that no
antibiotic remains on the discs after rinsing.
Although other studies have used broth turbidity (Ceri, et al. 1999) or in situ
staining of bacterial biofilms with stains such as crystal violet (Djordjevic,
Wiedmann and McLandsborough 2002) as a means of identifying bacteria, we
chose to count colony forming units (CFU) as we felt that this represented a
more accurate analysis of biofilm growth, particularly when one is looking at
small numbers of CFU in resuscitation experiments. Therefore, bacteria had to
be detached from the surface and rendered planktonic to allow CFU counting.
Trypsin, used to aid detachment, is a proteolytic enzyme that has previously
been utilised to remove biofilms from surfaces (Rocha, et al. 2008) (Chaignon,
170
et al. 2007). and is widely used in tissue culture to detach cells from a surface.
It has also been used in an attempt to produce a biofilm-resistant surface by
attaching trypsin enzyme to a stainless steel surface (Caro. et al. 2010).
Sonication has also been widely used in biofilm detachment (Monsen, et al.
2009). and may also have future clinical applications as a possible diagnostic
tool (Bonkat. et al. 2010) or an in vivo biofilm removal aid. We used an
ultrasonic bath, where the generated ultrasound waves travel through water to
create compression waves and local cavitation in contact with surfaces,
leading to disruption of the biofilm's attachment to the silicone disc. Although
we chose trypsinisation and sonication in our method, the processing of
biofilms for analysis does vary in different methods I models, for example the
well known Calgary biofilm device typically recommends only sonication to
remove attached bacteria (Innovotech MBEC 2011 ).
We used rinsing to remove the antibiotic, as residual antibiotic could interfere
with bacterial growth on agar plates following processing. This would be a
particular problem if planktonic bacteria were plated with a solution containing
antibiotics: although the antibiotic level may be too low to inhibit biofilms, it
may be high enough to affect the planktonic bacteria newly-released from the
biofilm. Our experiments indicated that the solution did not inhibit bacterial
growth. An altemative to the rinsing would have been to incorporate an
antibiotic neutral ising step. as solutions that inhibit specific antibiotics are
available, as is a universal neutralising solution (Innovotech MBEC 2011).
171
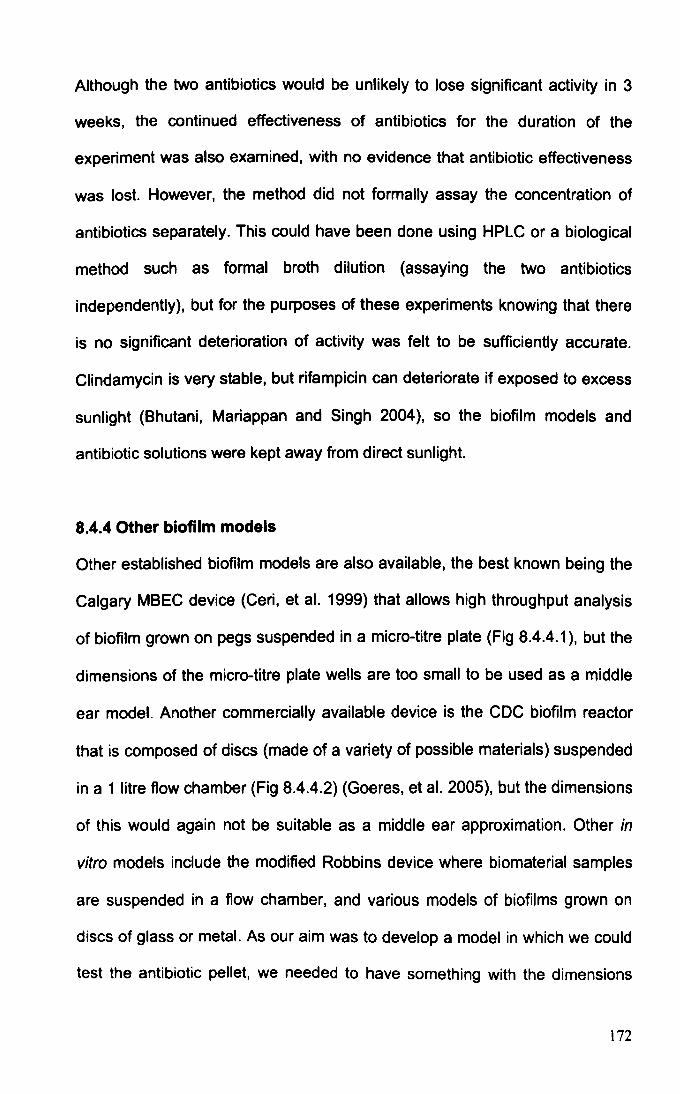
Although the two antibiotics would be unlikely to lose significant activity in 3
weeks, the continued effectiveness of antibiotics for the duration of the
experiment was also examined, with no evidence that antibiotic effectiveness
was lost. However, the method did not formally assay the concentration of
antibiotics separately. This could have been done using HPLC or a biological
method such as formal broth dilution (assaying the two antibiotics
independently), but for the purposes of these experiments knowing that there
is no significant deterioration of activity was felt to be sufficiently accurate.
Clindamycin is very stable, but rifampiCin can deteriorate if exposed to excess
sunlight (Bhutani, Mariappan and Singh 2004), so the biofilm models and
antibiotic solutions were kept away from direct sunlight.
8.4.4 Other biofilm models
Other established biofilm models are also available, the best known being the
Calgary MBEC device (Ceri, et al. 1999) that allows high throughput analysis
of biofilm grown on pegs suspended in a micro-titre plate (Fig 8.4.4.1), but the
dimensions of the micro-titre plate wells are too small to be used as a middle
ear model. Another commercially available device is the CDC biofilm reactor
that is composed of discs (made of a variety of possible materials) suspended
in a 1 litre flow chamber (Fig 8.4.4.2) (Goeres, et al. 2005), but the dimensions
of this would again not be suitable as a middle ear approximation. Other in
vitro models include the modified Robbins device where biomaterial samples
are suspended in a flow chamber, and various models of biofilms grown on
discs of glass or metal. As our aim was to develop a model in which we could
test the antibiotic pellet, we needed to have something with the dimensions
172
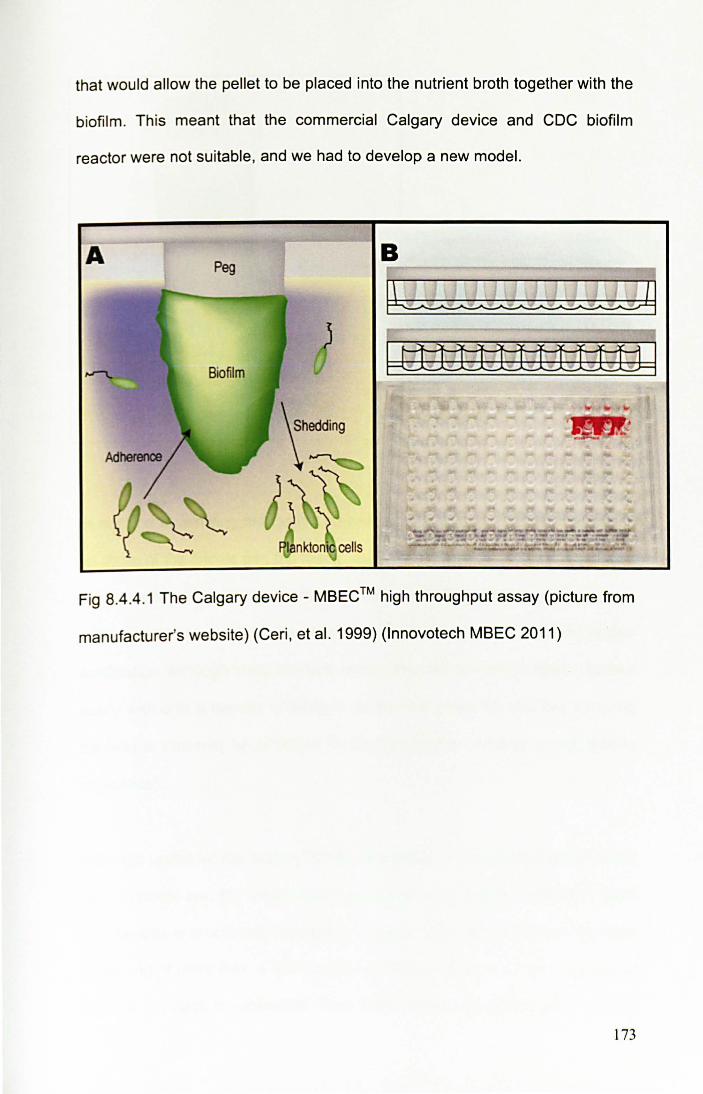
that would allow the pellet to be placed into the nutrient broth together with the
biofilm. Th is meant that the commercial Calgary device and CDC biofilm
reactor were not suitable , and we had to develop a new model.
A Peg
Fig 8.4.4.1 The Calgary device - MBEC ™ high throughput assay (picture from
manufacturer's website) (Ceri, et al. 1999) (Innovotech MBEC 2011)
173
Fig 8.4.4.2 The CDC Biofilm Reactor
(picture from manufacturer's website)
(BiosurfaceTechnologies 2011). Discs
of various materials are held within
holders, suspended in a large
chamber of fluid .
In addition to allowing the testing on antibiotic pellets with dimensions based
on those of the middle ear, the model developed above is also useful because
determination of bacterial counts is possible with the ability to detect only a
small number of surviving bacteria. This is important when studying biofilm
eradication, although in life one may expect the body's immune system to deal
easily with only a handful of bacteria so that the presence of a few surviving
bacteria in vitro may be of limited clinical importance (although it may lead to
res istance ).
Although useful for the study of biofilm eradication with antibiotic pellets sized
for the middle ear, the model described above is very labour-intensive. Each
silicone disc is processed individually by hand, and with experiments typically
consisting of more than a 100 discs at a time the amount of time required to
process the discs is substantial. Thus the model does not lend itself to mass
174
study of biofilms, where the Calgary device has distinct advantages. A
possible modification of our system would be to use multi-well plates with
larger wells, for example the 24 well plates would accommodate just under 2
mL of fluid, although the addition of the disc and pellet would reduce the
volume of nutrient broth. If multi-well plates were used, there would also be
concern about contamination from well to well during rinsing and sonication, or
even during incubation as the wells are not individually sealed like the bijoux
bottles in our model (the amount of handling required in our model is also a
risk for contamination, although after initial trials contamination did not appear
to be a major issue). The Calgary device gets around this issue by having
pegs in each well, but as at present it is available only with the small wells of a
96 well plate (typically less than a third of a millilitre) it could not accommodate
antibiotic pellets. As an alternative to the silicone discs, one could have
developed a Calgary "well and peg" type device but sized it for a larger well. It
may also have been possible to "scale" up or down and use a bigger pellet in
a bigger model or a smaller pellet in the Calgary device, but due to concerns
about the effect that scaling might have this was not felt appropriate.
In terms of the in vitro model and processing of the silicone discs, an
important consideration is applicability to other situations. Apart from the
limitations of this model compared to others detailed above, the establishment
of biofilms, timing, and processing that were developed in our laboratory for S
aureus on a specific scale can be considered relevant only to this situation.
Investigations in other laboratories, with different scales and different bacteria
175
would necessitate validation and optimisation of the in vitro model in the same
way.
An interesting aspect of in vitro biofilm study is the use of conditioning films
composed of a variety of components (fibronectin, fibrinogen, fibrin, albumin,
collagen, elastin, von Willebrand factor) (Schinabeck and Ghannoum 2006)
(Pascual 2002). Some biofilm models use this as a means of coating an
artificial surface to make it more conducive to biofilm attachment (Frade and
Arthington-Skaggs 2010), but the presence of a conditioning film is not
thought to be crucial for biofilm formation by other studies (Bayston, Ashraf, et
al. 2007); it may be that its importance (or not) depends on the bacterial
species, the surface, stress forces and nutritional provision. It is also
interesting that the conditioning film may have clinical relevance, with a study
of ureteric stents finding that the presence of certain proteins is highly
associated with subsequent stent encrustation and biofilm colonisation
(Canales, et al. 2009), and a study of dental caries finding that saliva as a
conditioning film promotes biofilm formation (Shimotoyodome, et al. 2007). In
the model described in this thesis the biofilms formed without the need for a
conditioning film, therefore its use was not examined.
8.4.5 Culture results and the LiveDead stain
When assessing the presence of live bacteria, the samples can be analysed
by microbial culture, but the LiveDead stain may also have a role, for example
if biofilm bacteria will not grow on an agar plate they can at least be identified
as live by the Live Dead stain. As culture and LiveDead stain theoretically test
176
the same thing, i.e. the presence of live bacteria, they could be expected to
give very similar if not identical results. In fact 7% of the culture-negative
samples were Live Dead positive, and 4.8% of the LiveDead-negative samples
were culture-positive. The Kappa value was 0.791, suggesting the agreement
was substantial (Kappa range of 0.61-0.80 is considered as substantial
agreement, and values of 0.81 or more as almost perfect agreement) (Landis
and Koch 1977). Further, there was no evidence that culture systematically
under-estimated the number of bacteria detected by the Live Dead stain. The
Live Dead stain does have a small rate of falsely labelling bacteria as live, as
described in the discussion of OME aetiology section.
Early experiments analysed biofilms both with culture and the Live Dead stain,
but as the data above indicates both can be considered to measure the same
thing. The advantage of culture was of course that it gave a quantitative result
(although the Live Dead stain could also have been adapted to be quantitative
e.g. by counting the number of bacteria per microscope field). Due to
concerns about a small risk of falsely labelling bacteria as live using Live Dead
stain it was felt better to rely only on culture results rather than using Live Dead
or indeed both culture and LiveDead staining when determining biofilm
eradication.
177

8.5 BIOFILM MODEL: CONCLUSION
Although many biofilm models have been described, and commercially
available kits exist, the specific plans to test biofilm eradication using an
antibiotic pellet sized for the middle ear required the development of a new
biofilm model. The model consists of biofilms grown on a silicone discs, with
biofilm presence confirmed by showing the structure of biofilms as well as
their reduced susceptibility to antibiotics. The best way of assessing biofilm
eradication is to look for and count any remaining bacteria, therefore a
strategy to detach biofilm bacteria and render them planktonic prior to
counting had to be developed. A number of methodological parameters were
therefore investigated, with the final method of biofilm detachment chosen to
consist of trypsinisation for 15 minutes, change of trypsin to PBS and then
sonication for 5 minutes, with plating of the resultant suspension.
178


![[Clinical and laboratory features of patients with pericardial effusion]](https://static.fdokumen.com/doc/165x107/6325f6805547884b71068814/clinical-and-laboratory-features-of-patients-with-pericardial-effusion.jpg)