Ørsted Annual report 2018 - CVR
193
Ørsted Annual report 2018
-
Upload
khangminh22 -
Category
Documents
-
view
1 -
download
0
Transcript of Ørsted Annual report 2018 - CVR

Ørsted Annual report 2018
Our visionLet’s create a world that runs entirely on green energy
Ørsted Annual report 2018 Contents

Content Management’s review
Overview 4
Chairman’s statement 5CEO’s review 6Performance highlights 10Outlook 2019 12Financial estimates and policies 14
Our business 15
The green transformation 16Our strategic playing field 18Our markets 19Our strategy 22Our business model 25Strategic targets 26Our geographic footprints 28
Results 30
Results 31Five-year summary 35Fourth quarter 36Quarterly summary, 2017-18 38
Business units 39
Our business units 40Offshore 41Onshore 46Bioenergy 49Customer Solutions 52
Governance 55
Board of Directors 56Group Executive Management 58Corporate governance 59Remuneration report 63Risk and risk management 66Shareholder information 70
Financial statements
Consolidated financial statements 72
Income statement 73Statement of comprehensive income 74Balance sheet 75Statement of changes in equity 76Statement of cash flows 77Note summary 78Notes 79
Consolidated ESG statements (additional information) 167
Basis of reporting 168Environment 169Social 171Governance 172
Parent company financial statements 175
Income statement 176Balance sheet 176Statement of changes in equity 177Notes 178
Management statement, auditor’s reports and glossary 185
Statement by the Executive Board and the Board of Directors 186Independent Auditors’ report 187Limited assurance report of the independent auditor 191 Glossary 192
Ørsted Annual report 2018
3 / 193
Contents
Overview
Chairman’s statement 5CEO’s review 6Performance highlights 10Outlook 2019 12Financial estimates and policies 14
Ørsted Annual report 2018 ContentsØrsted Annual report 2018

Green light ahead
The UN’s 2030 Agenda for Sustainable Devel-opment calls for making significant progress on some of the world’s greatest challenges. Global climate change caused by man-made carbon emissions is one of the key threats to human societies and the planet, and urgent action is needed. Human activity has already caused an increase of approx 1.1°C above pre-industrial levels. If emissions continue at the current rate, global warming is likely to reach 1.5°C above pre-industrial levels at the earliest in 2030, crossing a key threshold set by climate science to avoid irreversible climate change.
The challenge of global warming requires a profound transformation of our global energy systems – from black to green energy. At Ørsted, our vision is a world that runs entirely on green energy. As one of the global leaders
in green energy, we are committed to providing tangible and scalable solutions to transform global energy systems from black to green.
In 2018, we continued our successful deploy-ment of green energy, reaching 8.3GW of re-newable energy capacity built by Ørsted. Over the past decade, Ørsted and our partners have invested approx DKK 165 billion in de-ploying green energy. For the next seven years, we plan to further accelerate our build-out. By 2025, more than 99% of our energy genera-tion will come from renewable sources, and by 2030, our ambition is to reach more than 30GW of green energy deployed, allowing more than 50 million people to be powered by green energy built by Ørsted. The ambi-tious decarbonisation of our power and heat generation puts the carbon reduction from our own operations 27 years ahead of the decar-bonisation trajectory for the energy industry
Chairman’s statement
“As one of the global leaders in green energy, we are committed to providing tangible and scalable solutions to transform global energy systems from black to green.
that is recommended by climate scientists to stay below the 2°C-threshold defined in the Paris Agreement. We further commit ourselves to reduce our carbon emissions in line with the recent scientific recommendation to limit global temperature increases to no more than 1.5°C above pre-industrial levels.
In 2018, we took important steps in shaping our portfolio towards becoming one of the world’s leading renewable energy companies. We announced our intention to exit our power distribution and residential customer busi-nesses, which will allow us to focus entirely on renewable energy generation and market access. We also announced the acquisition of Lincoln Clean Energy, which will serve as our platform for creating a leading North Amer-ican onshore renewables business, spanning onshore wind, solar energy and storage. Finally, we announced the acquisition of Deep-water Wind, creating a leading offshore wind platform in the US together with our existing US organisation.
Our commitment to people remain strong. Particularly, safety is a focus area for us, and in 2018, we once again improved workplace safe-ty with a total recordable injury rate per million working hours (TRIR) at a record low level of 4.7. Furthermore, we reaffirmed our commitment to being an inclusive workplace for all employ-ees regardless of personal characteristics by joining the UN LGBTI Standards of Conduct for Business. To further support gender diversity
in management, we implemented the ‘Female Spotlight’ programme that prepares talented women for senior leadership positions.
Profit for the year amounted to DKK 19.5 billion, Ørsted’s best result ever. The Board of Directors recommends paying a dividend of DKK 9.75 per share.
On behalf of the Board of Directors, I would like to thank the employees and management of Ørsted for their spirited commitment to turning the vision of green energy into reality, and for bringing green solutions to existing and new markets that share our vision of a world that runs entirely on green energy.
Thomas Thune AndersenChairman
Ørsted Annual report 2018 Management’s review Overview
5 / 193
Contents

Strong operational and financial results and strategic acquisitions have strengthened our position as a world leader in green energy:
— Operating profit (EBITDA) increased by 33% and totalled DKK 30.0 billion.
— Operating profit from offshore wind farms in operation increased by 29% to DKK 11.0 billion.
— Farm-down of 50% of Hornsea 1 was one of the largest renewable energy M&A transactions ever and contributed DKK 15.1 billion to EBITDA.
— Green share of generation increased from 64% to 75%.
— Strong progress in the construction of our new wind projects.
— New offshore wind projects awarded in the US, Germany and Taiwan.
— Acquisition of the US-based onshore wind developer Lincoln Clean Energy.
— Acquisition of the leading US-based off-shore wind developer Deepwater Wind.
— Decision to exit our Danish power distribu-tion and residential customer businesses.
— New ambitious targets for the Group’s long-term strategic and financial development.
Financial resultsIn 2018, we achieved a strong operating profit (EBITDA) which significantly exceeded our expectations at the beginning of the year.
EBITDA (excluding new partnerships) increased by 18% to DKK 15.0 billion. The good results were driven by an increase in generation from our offshore wind farms in operation, which led to an increase of 29% in EBITDA from these activities. Including new partnerships, EBITDA increased by 33% to DKK 30.0 billion, of which DKK 15.1 billion came from the 50% farm-down of Hornsea 1.
Return on capital employed (ROCE) was 32% compared to 25% in 2017.
Net profit amounted to DKK 19.5 billion, which was DKK 6.2 billion higher than last year.
Following the bioconversions of our CHP plants and the continued ramp-up of our offshore wind capacity, the green share of our heat and power generation increased from 64% to 75% in 2018.
Strategic developmentOur vision is to create a world that runs entirely on green energy. We expect the global mar-ket for renewable energy to more than triple towards 2030. As one of the leading companies within renewable energy, Ørsted has a strong platform to take part in this build-out. In Novem-ber, we launched new, ambitious targets for our long-term strategic and financial development.
CEO’s review
“Towards 2030, it is our strategic ambition to reach an installed capacity of more than 30GW renewable energy, provided that the build-out creates value for our shareholders.
By the end of 2018, our portfolio consisted of 12GW of offshore and onshore wind farms and biomass-fired combined heat and power plants that are either in production, under construc-tion or have obtained final investment decision (FID). We also have projects with a capacity of 4.8GW for which we have been awarded the construction concessions or entered into offtake agreements, but are yet to make FID. In addition, we have a strong pipeline of projects under development. Towards 2030, it is our strategic ambition to reach an installed ca-pacity of more than 30GW renewable energy, provided that the build-out creates value for our shareholders. Contributing to this ambition, we raised our 2025 ambition for offshore wind from 11-12GW to 15GW.
Our strategic ambition will be supported by an extensive investment programme. From 2019 to 2025, we currently expect total gross invest-ments of approx DKK 200 billion. Investments in offshore wind farms are expected to consti-tute 75-85% of this programme. Onshore invest-ments are expected to constitute 15-20%, while our investments in Bioenergy and Customer Solutions combined are expected to constitute 0-5%. The allocation reflects the changes we made to our asset portfolio in 2018, including the two acquisitions in the US and the decision to exit our power distribution and residential customer businesses.
Ørsted Annual report 2018 Management’s review Overview
6 / 193
Contents

The strategic plan is subject to our four capital allocation priorities. Firstly, we maintain our strong commitment to our credit rating target (BBB+/Baa1). Secondly, we intend to increase our annual dividends by a high single-digit per-centage. The horizon of this dividend commit-ment is extended from 2020 to 2025. Thirdly, we will invest in value-creating growth. Finally, potential excess capital will be returned to our shareholders in the form of additional dividends and/or share buy-backs.
OffshoreIn 2018, we reached significant milestones in our ambitious green strategy. In the UK, we commissioned Race Bank in January and Wal-ney Extension, the world’s largest wind farm, in May, and in Germany, we commissioned Borkum Riffgrund 2 in December. All were
commissioned ahead of schedule, underpin-ning our experience and efficiency within the construction of offshore wind farms. Together with the rest of the portfolio, the three com-missioned offshore wind farms contributed to the continued growth in earnings.
In addition, our current offshore wind construc-tion projects continue to progress according to plan. We have installed most of the founda-tions at Hornsea 1 in the UK, which will be the world’s largest wind farm when completed, expectedly in the second half of this year. The build-out of our portfolio also includes Borssele 1 & 2 in the Netherlands and Hornsea 2 in the UK. In February, we selected Siemens Gamesa Renewable Energy’s 8MW wind tur-bines with a 167-metre rotor for Hornsea 2.
We continued our partnership model in 2018 with the 50% farm-down of Hornsea 1 to Global Infrastructure Partners. As part of the agreement, we will provide long-term opera-tions and maintenance services (O&M) as well as a route to market for the power generated through our Customer Solutions business. The farm-down was one of the largest renewable energy M&A transactions ever and included the largest single-project renewable energy financ-ing scheme to date. The valuation underpins the attractiveness of our offshore wind assets.
In April, we were awarded 900MW capacity in the first Taiwanese grid allocation as Greater Changhua 1 & 2a were awarded 605MW and 295MW, respectively. In the price auction in June, we were awarded an additional 920MW. With a total capacity of 1,820MW, we are as such able to fully utilise our Greater Changhua 1, 2 and 4 sites.
On 30 January 2019, the 2019 feed-in tariff was announced. We take note of the 6% tariff reduction compared to the 2018 tariff as well as the introduction of a cap on annual full-load hours, and we will now collaborate closely with the supply chain to mitigate the adverse impact of these PPA changes with the objective of making the projects investable.
Greater Changhua 1 & 2a are facing extraor-dinarily high costs related to creating a local supply chain at scale, reinforcing the onshore grid infrastructure and building, operating and maintaining offshore wind farms in challenging site and weather conditions.
We continue to work with the Taiwanese authorities and local stakeholders to reach
key outstanding project milestones, such as obtaining the establishment permit, com-pleting the supply chain plan and signing the power purchase agreement.
Once we have clarity on the outcome of supply contract renegotiations and have achieved all key project milestones, Ørsted’s Board of Directors will review and decide on the final investment case.
In Germany, we were awarded the right to build Borkum Riffgrund West 1 and Gode Wind 4 with a capacity of 420MW and 132MW, respectively. Combined with the awards from the auction in 2017, we have secured the full capacity of 900MW in the Borkum Riffgrund cluster (Cluster 1) without subsidies. In addition, we have secured a total capacity of 242MW for Gode Wind 3 and 4 at a weighted average feed-in tariff of EUR 81 per MWh. Subject to FID, the wind farms are expected to be opera-tional in 2024/25, respectively.
In October, The Crown Estate in the UK con-firmed that we have satisfied the application criteria for the development of our Race Bank Extension offshore wind farm, which expected-ly will now be subject to a plan-level Habitats Regulations Assessment (HRA). Subject to all necessary consents being granted, Race Bank Extension will be able to participate in future auctions under the contracts for difference (CfD) scheme.
Early October, we entered into an agreement to acquire Deepwater Wind. The acquisition was completed in November at an enterprise value of DKK 4.7 billion. Deepwater Wind is the leading US-based offshore wind developer
Entering Ørsted portfolio
Lincoln Clean Energy
– Transaction closed
DeepwaterWind
– Transaction closed
Power distribution, residential customer (B2C) and city light businesses
– Expected in 2019
Portfolio changes support focus on renewable generation
Exiting Ørsted portfolio
Offshore
Bioenergy Customer Solutions
Onshore
Ørsted
Ørsted Annual report 2018 Management’s review Overview
7 / 193
Contents
with an attractive and geographically diverse portfolio of projects along the US East Coast.
In the US, we were awarded an additional 104MW in December in the clean energy auction in Connecticut. Our Revolution Wind project has now secured a total capacity of 704MW connecting into New England, including previously awarded capacity in Rhode Island and Connecticut, which we will construct as one joint project, and thus unlock significant procurement, construction and operational synergies.
By end 2018, the Deepwater Wind portfolio to-tals a capacity of approx 2.6GW, consisting of 30MW in operation, 954MW of development projects with long-term revenue contracts in place or under negotiation and approx 1.6GW which potentially may be developed in three awarded lease areas.
In October, we bid into Rhode Island’s auction for up to 400MW of renewable energy. Further, in December 2018, we bid into the 1,100MW New Jersey auction with our Ocean Wind pro-ject, and we expect to bid into the announced 800MW auction in New York in February 2019.
In January 2019, we furthermore announced that we have signed a memorandum of understanding to work jointly with Tokyo Elec-tric Power Company (TEPCO) on the Choshi offshore wind project near Tokyo, and towards a broader strategic partnership.
We look forward to expanding our footprint in both Europe, the US and Asia-Pacific and working together with our new partners.
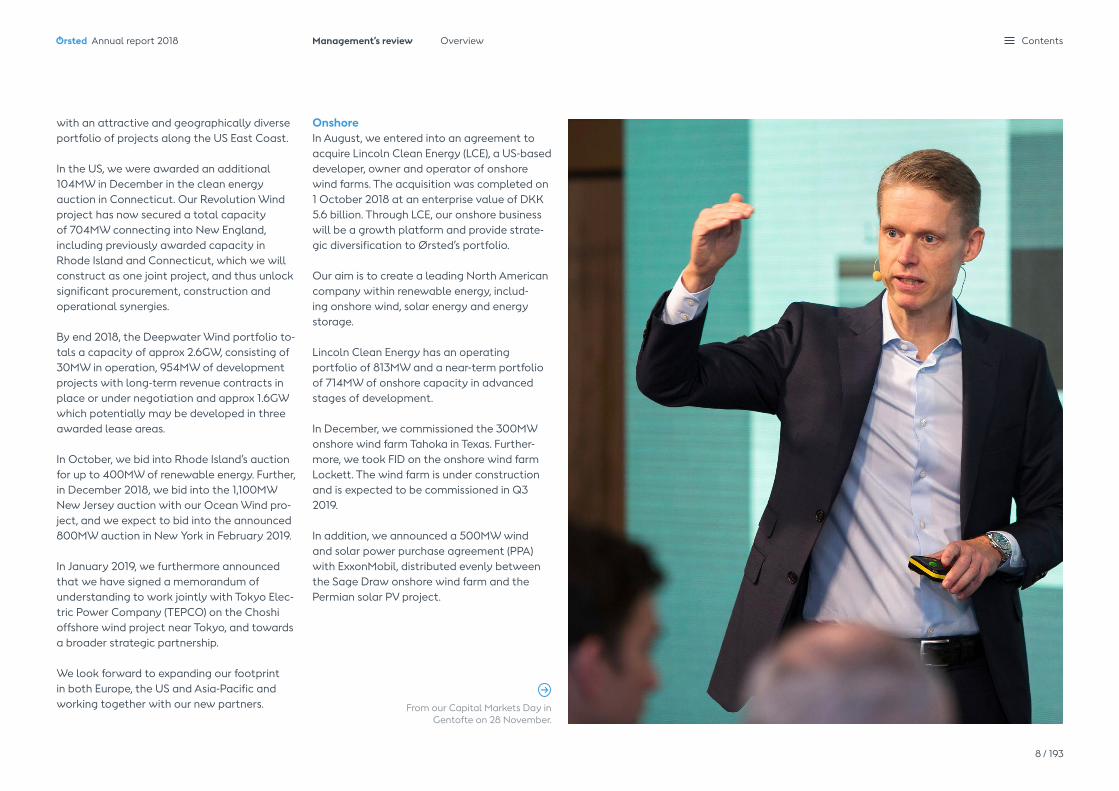
Onshore In August, we entered into an agreement to acquire Lincoln Clean Energy (LCE), a US-based developer, owner and operator of onshore wind farms. The acquisition was completed on 1 October 2018 at an enterprise value of DKK 5.6 billion. Through LCE, our onshore business will be a growth platform and provide strate-gic diversification to Ørsted’s portfolio.
Our aim is to create a leading North American company within renewable energy, includ-ing onshore wind, solar energy and energy storage.
Lincoln Clean Energy has an operating portfolio of 813MW and a near-term portfolio of 714MW of onshore capacity in advanced stages of development.
In December, we commissioned the 300MW onshore wind farm Tahoka in Texas. Further-more, we took FID on the onshore wind farm Lockett. The wind farm is under construction and is expected to be commissioned in Q3 2019.
In addition, we announced a 500MW wind and solar power purchase agreement (PPA) with ExxonMobil, distributed evenly between the Sage Draw onshore wind farm and the Permian solar PV project.
From our Capital Markets Day in Gentofte on 28 November.
Ørsted Annual report 2018 Management’s review Overview
8 / 193
Contents

market position in 2005 and the first half of 2006. In October, the Danish Appeals Per-mission Board ruled in favour of Ørsted and decided that the Danish competition author-ities would not be given permission to try the ruling before the Supreme Court. Consequent-ly, the ruling of the High Court stands. We are pleased that we can put this court case behind us and move forward. However, we are still awaiting the development in the Elsam competition case for the period 2003 to 2004 and the related compensation case.
At the end of December, 679,000 smart meters installed by Radius and Kamstrup had been taken into use by our power distribution cus-tomers. This is a significant milestone, marking that we are well on our way to replacing meters for all our 1 million customers by the end of this year.
Finally, our Customer Solutions business has signed a 15-year agreement with Innogy to balance the power generation from their 860MW offshore wind farm Triton Knoll in the UK. Under the agreement, Ørsted will sell the expected generation from the wind farm on the power market on a day-ahead basis, thus handling deviations from the expected generation the following day.
EmployeesWe have a strong focus on the safety and well-being of our employees. In 2018, we achieved a positive development in the total recordable injury rate (TRIR) and saw yet another year with no life-changing accidents. The 2018 employee survey showed a contin-ued high score on satisfaction and motivation – in line with the 2017 results. It positions
Henrik Poulsen CEO and President
Ørsted in the top 10% compared to external benchmarks in all major markets.
Once again, 2018 was a year with many changes, and with the acquisitions of Lincoln Clean Energy and Deepwater Wind, we welcome more highly skilled employees to our company. The integration of the organisations is already well under way. All our employees deserve credit and acknowledgement for their dedicated performance during the past year. Their strong competences and entrepreneurial spirit – fuelled by the passion for what Ørsted stands for and the work we do – constitute the very foundation of our company.
Utility businessIn June, we announced our plans to divest our Danish power distribution, residential custom-er and city light businesses. The process came to a stop in January when our majority share-holder, the Danish State, informed us that there was no longer the necessary political support. It is still the Board of Directors assess-ment that Ørsted is not the best long-term owner of these businesses. Consequently, we have classified the businesses as assets held for sale and continue to investigate the differ-ent options for exiting them. We expect an exit from all of these businesses during 2019.
In June, we divested our 50% ownership share in the gas-fired power plant Enecogen in the Netherlands. The divestment reinforces our focus on green energy.
In June, we commissioned our new biogas plant in Kalundborg, Denmark, together with our partner Bigadan. The plant will recycle
waste from the local production facilities of our corporate customers Novozymes and Novo Nordisk and convert it into biogas. We are looking to expand our portfolio of biogas plants in the future. The development of our first Renescience plant in the UK is still in progress. By means of enzymes, the technology efficiently converts household waste into biogas and recyclable materials. While the enzymatic process is working satisfactory, we have experienced mechanical challenges in the sorting process and have had to undertake a programme to enhance flexibility and redundancy in the sorting hall. We are currently finalising this optimisation. Final commissioning is expected during the first half of this year.
In May, the High Court of Western Denmark ruled that Elsam, one of the six companies that merged into DONG Energy, now Ørsted, back in 2006, had not abused its dominant
“2018 was a year with many changes, and with the acquisitions of Lincoln Clean Energy and Deepwater Wind, we welcome more highly skilled employees to our company.
Ørsted Annual report 2018 Management’s review Overview
9 / 193
Contents

30.0 19.5
24.5
32.1
69-2.2
2016 2017 2018
19.122.5
30.0
2016 2017 2018
24.4 25.2
32.1
2016 2017 2018
15.017.7
24.564
50
69
2016 2017 2018
2016 2017 2018
12.2 13.3
19.5
75
4.7
50
6475
2016 2017 2018
6.8 6.4
4.7
2016 2017 20182016 2017
-1.5 -2.2
3.5
2018
Performance highlights
Operating profit (EBITDA) DKKbn
Net profit (continuing operations) DKKbn
Gross investments DKKbn
Interest-bearing net debt DKKbn
Profits and returns
Cash flow and balance sheet
In 2018, we achieved a strong EBITDA which significant-ly exceeded our expectations at the beginning of the year. It was the highest to date and was driven by an increase in generation from our offshore wind farms and profit from the 50% farm-down of Hornsea 1. The amount above the dotted lines represent profits from new partnerships.
Profit for the year amounted to DKK 19.5 billion, Ørsted’s best result ever driven by the strong operating profit.
The gross investment level was high in 2018 due to the acquisitions of Deepwater Wind (DKK 4.0 billion) and Lincoln Clean Energy (DKK 5.6 billion) in addition to high construction activity in our project portfolio.
ROCE was also significantly impacted by the Hornsea 1 farm-down gain in 2018. Our target is an average ROCE of around 10% for the Group in the 2019-2025 period.
The credit metric ‘funds from operations’ (FFO) relative to adjusted net debt amounted to 69% in 2018, positively affected by our strong operating profit and low adjusted net debt.
We had a net cash position of DKK 2.2 billion at the end of 2018.
Return on capital employed (ROCE)%
Credit metric (FFO/adjusted net debt1)%
Sustainability
Green share of generation %
Safety TRIR
The green share of heat and power generation continued to increase to a new high of 75%, following continued ramp-up of our offshore wind capacity, and full-year effect from our most recent biomass-converted CHP plants.
We have a strong focus on the safety and well-being of our employees. In 2018, we achieved a record- low total recordable injury rate (TRIR).
1) Interest-bearing net debt, including 50% of hybrid capital and securities not availabile for use (with the exception of repo transactions), present value of lease obligations, and decommissioning obligations less deferred tax.
Ørsted Annual report 2018 Management’s review Overview
10 / 193
Contents
12-13 16-18
12.5-13.5
23-2513-14
24.515.0
2018 realised
1 February 1 February
9 August
8 October1 November
2018 realised
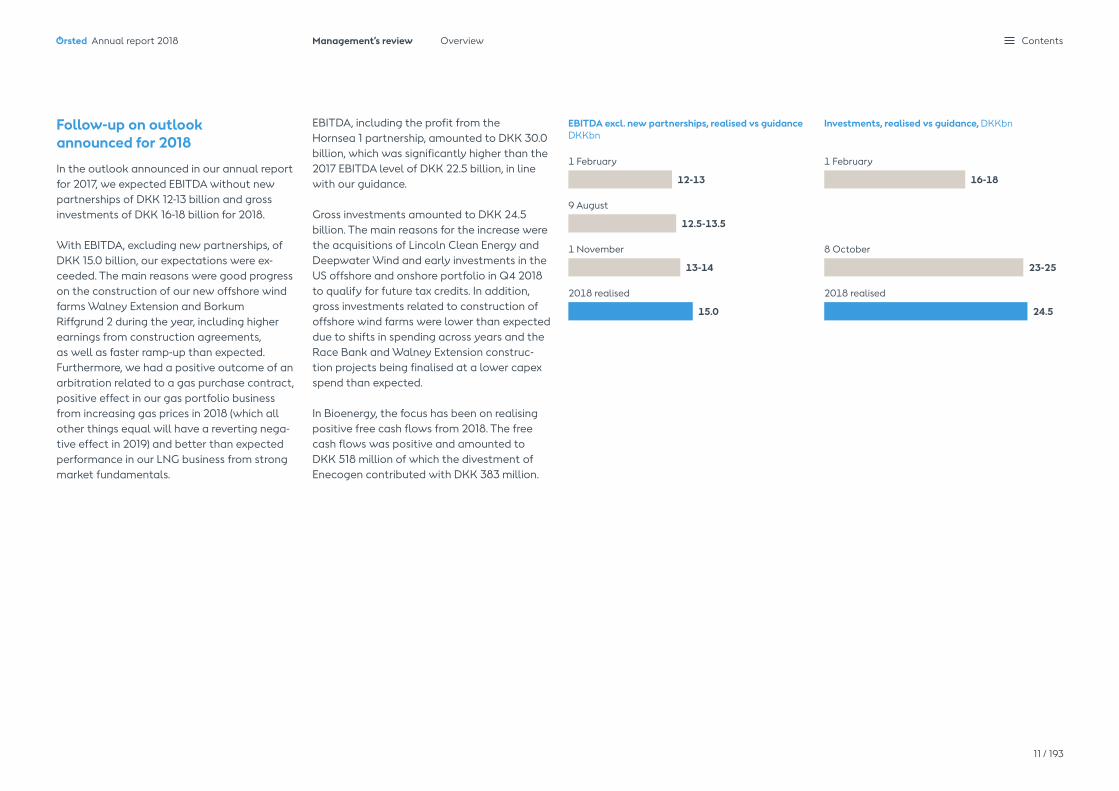
Follow-up on outlook announced for 2018
In the outlook announced in our annual report for 2017, we expected EBITDA without new partnerships of DKK 12-13 billion and gross investments of DKK 16-18 billion for 2018.
With EBITDA, excluding new partnerships, of DKK 15.0 billion, our expectations were ex-ceeded. The main reasons were good progress on the construction of our new offshore wind farms Walney Extension and Borkum Riffgrund 2 during the year, including higher earnings from construction agreements, as well as faster ramp-up than expected. Furthermore, we had a positive outcome of an arbitration related to a gas purchase contract, positive effect in our gas portfolio business from increasing gas prices in 2018 (which all other things equal will have a reverting nega-tive effect in 2019) and better than expected performance in our LNG business from strong market fundamentals.
EBITDA, including the profit from the Hornsea 1 partnership, amounted to DKK 30.0 billion, which was significantly higher than the 2017 EBITDA level of DKK 22.5 billion, in line with our guidance.
Gross investments amounted to DKK 24.5 billion. The main reasons for the increase were the acquisitions of Lincoln Clean Energy and Deepwater Wind and early investments in the US offshore and onshore portfolio in Q4 2018 to qualify for future tax credits. In addition, gross investments related to construction of offshore wind farms were lower than expected due to shifts in spending across years and the Race Bank and Walney Extension construc-tion projects being finalised at a lower capex spend than expected.
In Bioenergy, the focus has been on realising positive free cash flows from 2018. The free cash flows was positive and amounted to DKK 518 million of which the divestment of Enecogen contributed with DKK 383 million.
EBITDA excl. new partnerships, realised vs guidance DKKbn
Investments, realised vs guidance, DKKbn
Ørsted Annual report 2018 Management’s review Overview
11 / 193
Contents
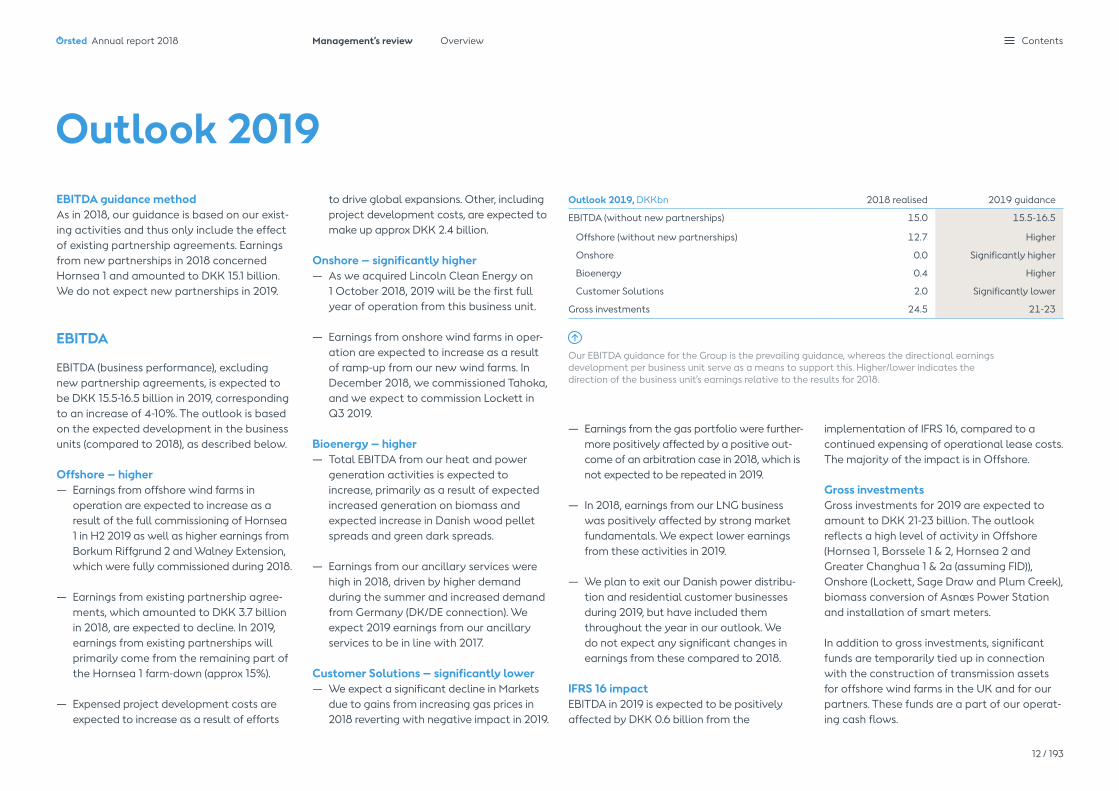
EBITDA guidance methodAs in 2018, our guidance is based on our exist-ing activities and thus only include the effect of existing partnership agreements. Earnings from new partnerships in 2018 concerned Hornsea 1 and amounted to DKK 15.1 billion. We do not expect new partnerships in 2019.
EBITDA
EBITDA (business performance), excluding new partnership agreements, is expected to be DKK 15.5-16.5 billion in 2019, corresponding to an increase of 4-10%. The outlook is based on the expected development in the business units (compared to 2018), as described below.
Offshore – higher — Earnings from offshore wind farms in
operation are expected to increase as a result of the full commissioning of Hornsea 1 in H2 2019 as well as higher earnings from Borkum Riffgrund 2 and Walney Extension, which were fully commissioned during 2018.
— Earnings from existing partnership agree-ments, which amounted to DKK 3.7 billion in 2018, are expected to decline. In 2019, earnings from existing partnerships will primarily come from the remaining part of the Hornsea 1 farm-down (approx 15%).
— Expensed project development costs are expected to increase as a result of efforts
to drive global expansions. Other, including project development costs, are expected to make up approx DKK 2.4 billion.
Onshore – significantly higher— As we acquired Lincoln Clean Energy on 1 October 2018, 2019 will be the first full year of operation from this business unit.
— Earnings from onshore wind farms in oper-ation are expected to increase as a result of ramp-up from our new wind farms. In December 2018, we commissioned Tahoka, and we expect to commission Lockett in Q3 2019.
Bioenergy – higher— Total EBITDA from our heat and power
generation activities is expected to increase, primarily as a result of expected increased generation on biomass and expected increase in Danish wood pellet spreads and green dark spreads.
— Earnings from our ancillary services were high in 2018, driven by higher demand during the summer and increased demand from Germany (DK/DE connection). We expect 2019 earnings from our ancillary services to be in line with 2017.
Customer Solutions – significantly lower— We expect a significant decline in Markets
due to gains from increasing gas prices in 2018 reverting with negative impact in 2019.
Outlook 2019
— Earnings from the gas portfolio were further-more positively affected by a positive out-come of an arbitration case in 2018, which is not expected to be repeated in 2019.
— In 2018, earnings from our LNG business was positively affected by strong market fundamentals. We expect lower earnings from these activities in 2019.
— We plan to exit our Danish power distribu-tion and residential customer businesses during 2019, but have included them throughout the year in our outlook. We do not expect any significant changes in earnings from these compared to 2018.
IFRS 16 impactEBITDA in 2019 is expected to be positively affected by DKK 0.6 billion from the
Outlook 2019, DKKbn 2018 realised 2019 guidance
EBITDA (without new partnerships) 15.0 15.5-16.5
Offshore (without new partnerships) 12.7 Higher
Onshore 0.0 Significantly higher
Bioenergy 0.4 Higher
Customer Solutions 2.0 Significantly lower
Gross investments 24.5 21-23
implementation of IFRS 16, compared to a continued expensing of operational lease costs. The majority of the impact is in Offshore.
Gross investmentsGross investments for 2019 are expected to amount to DKK 21-23 billion. The outlook reflects a high level of activity in Offshore (Hornsea 1, Borssele 1 & 2, Hornsea 2 and Greater Changhua 1 & 2a (assuming FID)), Onshore (Lockett, Sage Draw and Plum Creek), biomass conversion of Asnæs Power Station and installation of smart meters.
In addition to gross investments, significant funds are temporarily tied up in connection with the construction of transmission assets for offshore wind farms in the UK and for our partners. These funds are a part of our operat-ing cash flows.
Our EBITDA guidance for the Group is the prevailing guidance, whereas the directional earnings development per business unit serve as a means to support this. Higher/lower indicates the direction of the business unit’s earnings relative to the results for 2018.
Ørsted Annual report 2018 Management’s review Overview
12 / 193
Contents
Forward-looking statements
The annual report contains forward-looking state-ments which include projections of our short and long-term financial performance and targets as well as our financial policies. These statements are by nature uncertain and associated with risk. Many factors may cause the actual development to differ materially from our expectations.
These factors include, but are not limited to, changes in temperature, wind conditions and precipitation levels, the development in power, coal, carbon, gas, oil, cur-rency and interest rate markets, changes in legislation, regulation or standards, the renegotiation of contracts, changes in the competitive environment in our markets and reliability of supply. Read more about the risks in the chapter ‘Risk and risk management’ and in note 7.
At the end of 2018, funds tied up in work in progress totalled DKK 9.7 billion. During 2019, we expect to divest the Walney Extension and Race Bank offshore transmission assets, but we still expect to see high level of funds tied up in work in progress in 2019 as a result of the construction of transmission assets at Hornsea 1 and 2. The construction of Hornsea 1 for partners is expected to be operating cash flow neutral, as we will receive milestone payments continously from our partner during the construction phase.
Uncertainties, prices and hedgesOur offshore wind farms are largely subject to publicly regulated prices, implying a high degree of certainty about the income. This means that we know the price per generated MWh for most wind farms in Denmark and Germany as well as the CfD wind farms in the UK. For our British ROC wind farms, we also know the subsidy per generated MWh whichwe will receive in addition to the market price. In 2019, the ROCs are expected to account for 62% of the total income from these wind farms. In 2019, the total publicly regulated prices and subsidies are expected to account for 78% of the income from our offshore wind farms in operation.
The part of our generation from offshore wind farms and power stations which is exposed to market prices has to a large extent been hedged for 2019. The same applies to our currency risks. The market value of financial hedging instruments and US power purchase agreements relating to our operations and divestment of assets deferred for recognition in business performance EBITDA in 2019 amounted to DKK -1.5 billion at the end of
2018. This effect is included in the outlook for 2019 (see note 1.6).
The most significant uncertainty surrounding the operating profit from existing activities in 2019 relates to the size of our power genera-tion, which depends on wind conditions, the ramp-up of new wind farms and potential break-downs, and to a lesser extent our earn-ings from existing partnership agreements, timing in value adjustments related to gas at storages, heat and market trading activities. In addition, we are subject to litigation cases that potentially are concluded in 2019.
If a financially viable way forward is not found for our Greater Changhua projects, and we consequently decide not to progress with the projects during 2019, we have made certain commitments, which we will need to provide for.
Ørsted Annual report 2018 Management’s review Overview
13 / 193
Contents

Financial estimates In connection with our Capital Markets Day in November 2018, we introduced new strategic estimates towards 2025.
From 2019-2025, we expect total gross invest-ments of approx DKK 200 billion. Investments in offshore wind farms are expected to con-stitute 75-85% of the investment programme. Onshore investments are expected to consti-tute 15-20%, while our combined investments in Bioenergy and Customer Solutions are expected to constitute 0-5%.
Towards 2023, we expect an average increase in operating profit (EBITDA) from offshore and onshore wind farms in operation (including O&M agreements and power purchase con-tracts) of 20% a year, reaching an estimated level of DKK 25-26 billion in 2023.
The largest share of Ørsted’s operating profit (EBITDA) will still be generated by contract-based or regulated activities. We expect an average of around 90% of EBITDA in 2019-2025 to come from contract-based or regulated activities.
Our target is an average return on capital em-ployed (ROCE) of around 10% for the Group in the 2019-2025 period. The reduction compared to our earlier target of 12-14% for 2018-2023 is a result of earnings from the partial divest-ment of Hornsea 1 in 2018 being outside the new period and the acquisitions of Lincoln
Financial estimates Target Year
Total CAPEX spend DKK 200bn 2019-2025
Average return on capital employed (ROCE) ~10% 2019-2025
Average share of EBITDA from regulated and contracted activities ~90% 2019-2025
Average yearly increase in EBITDA from offshore and onshore wind farms in operation ~20% 2017-2023
Financial policies
Rating Min. Baa1/BBB+/BBB+ (Moody’s/S&P/Fitch)
Capital structure ~30% (FFO/adjusted net debt)
Dividend policy
Ambition to increase the dividend paid by a high single-digit rate compared to the
dividends for the previous year up until 2025
Clean Energy and Deepwater Wind, which will increase the capital expenditure in these years, but contribute to earnings with some delay.
Financial policiesThe Board of Directors recommends to the annual general meeting that dividends of DKK 9.75 per share be paid for 2018, equating an increase of 8% and a total of DKK 4.1 billion.
Supported by the expected increased cash flows from future offshore and onshore wind farms, we still intend to increase annual dividends by a high single-digit percentage compared to the previous year’s dividends. This policy has been extended to cover the period until 2025 (previously 2020).
Our dividend policy and other expected capi-tal allocations are subject to our commitment to our BBB+/Baa1 rating profile.
Financial estimates and policies
We have a ROCE target of 10% on average for the period 2019-2025. Read more about our key metrics, financial targets and policies in the presentation from our Capital Markets Day in November 2018 on orsted.com/en/capital-markets-day
Our current rating is in accordance with the policy.
Ørsted Annual report 2018 Management’s review Overview
14 / 193
Contents

Our business
The green transformation 16Our strategic playing field 18Our markets 19Our strategy and capital allocation 22Our business model 25Strategic targets 26Our geographic footprints 28
Ørsted Annual report 2018 Contents
The green transformationOne third of all global carbon emissions come from the production of energy. To avoid an irreversible change in the global climate and ensure a habitable planet for future genera-tions, we need to transform the world’s energy systems from black to green.
The Sustainable Development Goals (SDGs) were adopted by all United Nations’ member states in 2015. The goals cover the world’s greatest challenges that must be addressed towards 2030 to improve conditions for people and the planet. The defining challenge of our generation, impacting all other SDGs, is to decelerate climate change – addressed in SDG 13.
The latest report by the UN’s IPCC confirms that human activity has already caused tem-peratures on our planet to increase by approx 1.1°C above pre-industrial levels. Staying below 1.5°C warming necessitates a 45% reduction of emissions by 2030 (from 2010-levels) and ‘net-zero’ emissions by 2050. This requires an almost completely decarbonised power sector.
Carbon emissions originate from a range of sectors that all need to be decarbonised to effectively avoid severe climate change: electricity and heat generation (25%), other energy generation (10%), industry (21%), transportation (14%), land use (24%) and buildings (6%).
So far, global decarbonisation has mainly taken place in power generation, driven by the deployment of renewable energy at scale, reducing cost to a level which is now competitive to fossil fuels and nuclear power in many markets. This is good news for the continued decarbonisation of global energy production and for other sectors benefitting from increased electrification.
The continued deployment of renewable energy systems will create significant business opportunities for green energy solutions. From 2018 to 2030, Bloomberg New Energy Finance (BNEF) expects global investments in renewable energy to amount to approx USD 3.5 trillion.
Living up to the Paris AgreementThe Paris Agreement, signed by 195 countries in 2016, is the most ambitious and compre-hensive global political framework advancing SDG 13 on climate action. The agreement demonstrates the global commitment among a vast majority of the world’s countries to combat climate change. According to the Paris Agreement, the countries commit to keeping the global temperature increase well below 2°C and to pursue efforts to limit the temperature increase even further to 1.5°C.
However, actions and decisions taken so far by the countries under the Paris Agreement currently put the world on a path towards
a global warming of more than 3°C. Hence, there is a need for more ambitious national action plans to channel investments towards a greener and more climate-resilient economy.
Climate-related financial disclosuresCapital allocation decisions are one of the key levers for decarbonising the global econo-my. In 2017, the industry-led Task Force on Climate-Related Financial Disclosures (TCFD) launched its recommendations on how to improve the way climate-related risks and opportunities are factored into investment decisions. The initiative was launched by the G20 and illustrates how political and private sector leaders can unite in facilitating progress towards the climate-related SDGs.
The TCFD recommendations aim to improve understanding and disclosure of companies’ climate-related risks and opportunities. These include physical factors, such as the sea level rising or storms that can affect assets, and transitional factors, such as carbon prices or technology shifts that can affect business strategies. By adopting the recommendations, companies signal that they are considering and acting on the impacts of climate change on their business. Ultimately, this will help fight climate change and drive the transition towards a sustainable, low-carbon economy.
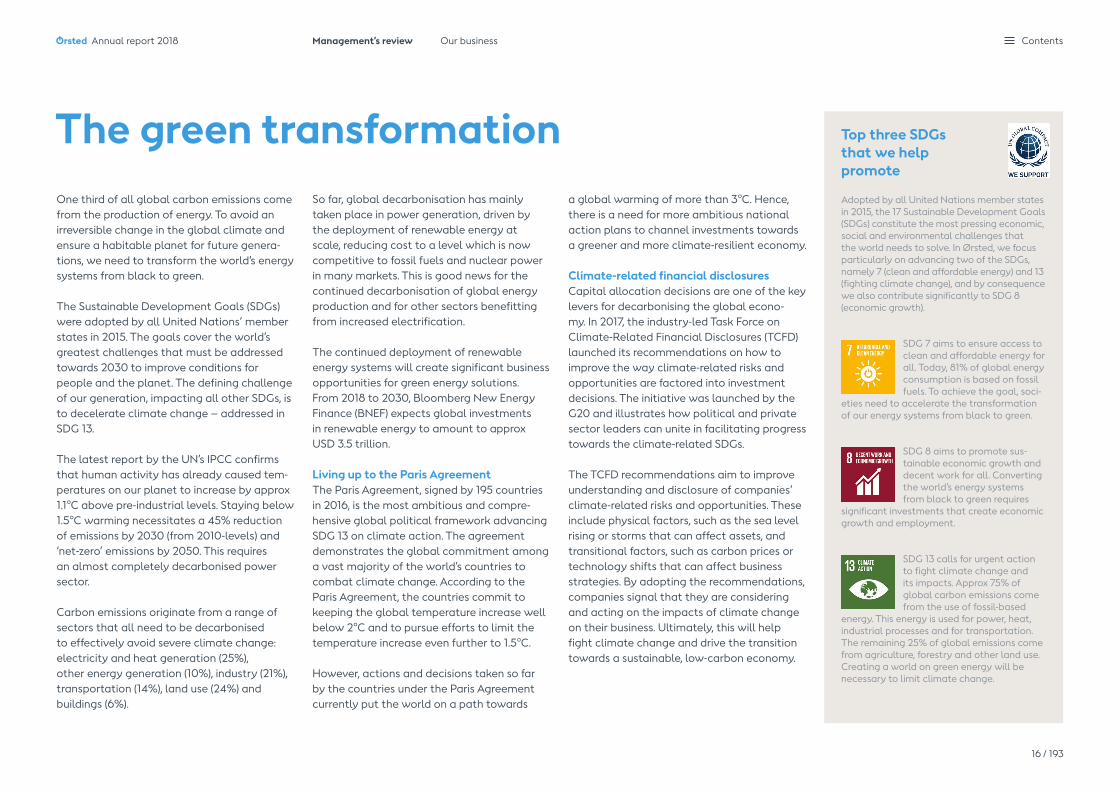
Top three SDGs that we help promote
Adopted by all United Nations member states in 2015, the 17 Sustainable Development Goals (SDGs) constitute the most pressing economic, social and environmental challenges that the world needs to solve. In Ørsted, we focus particularly on advancing two of the SDGs, namely 7 (clean and affordable energy) and 13 (fighting climate change), and by consequence we also contribute significantly to SDG 8 (economic growth).
SDG 7 aims to ensure access to clean and affordable energy for all. Today, 81% of global energy consumption is based on fossil fuels. To achieve the goal, soci-
eties need to accelerate the transformation of our energy systems from black to green.
SDG 8 aims to promote sus-tainable economic growth and decent work for all. Converting the world’s energy systems from black to green requires
significant investments that create economic growth and employment.
SDG 13 calls for urgent action to fight climate change and its impacts. Approx 75% of global carbon emissions come from the use of fossil-based
energy. This energy is used for power, heat, industrial processes and for transportation. The remaining 25% of global emissions come from agriculture, forestry and other land use. Creating a world on green energy will be necessary to limit climate change.
Ørsted Annual report 2018 Management’s review Our business
16 / 193
Contents

Ørsted’s response to the global climate challengeSociety’s need to phase out fossil fuels and deploy renewable energy at scale has been the key driver in Ørsted’s decade-long strategic transformation from black to green energy. From being one of the most coal-inten-sive utilities in Europe a decade ago, we are today among the global leaders in renewable energy, driven by a vision of creating a world that runs entirely on green energy.
We are keenly committed to being among the leading companies that help make societies progress towards the SDGs.
We contribute to the achievement of SDG 7 by deploying renewable energy at scale. Our strategic target is to increase the green energy share of our heat and power generation to 99% by 2025. By 2025, our installed offshore wind capacity alone will be able to power more than 30 million people.
Through our green energy investments, we also contribute to SDG 8. We have invested DKK 120 billion in deploying green energy in the past 10 years. Including our partners’ share of Ørsted-led offshore wind build-outs, investments amount to DKK 165 billion in this period. In a lifecycle perspective, our and our partners’ investments in deploying green offshore energy have created approx 180,000 jobs from the installed capacity and FID projects. Towards 2025, we plan to invest DKK 200 billion within renewables, adding signifi-cantly to further local economic growth and job creation, not least in our new markets.
The decarbonisation of our heat and power generation also helps contribute significantly to SDG 13. So far, we have reduced our carbon intensity by 72% from 462g CO2e/kWh in 2006 to 131g CO2e/kWh in 2018. In absolute terms, we have reduced our carbon emissions from 18 million tonnes in 2006 to 3.4 million tonnes in 2018. This has been realised by reducing our coal consumption by 81%, replacing it with sustainable biomass. Adding to this, we have contributed to avoiding more than 31 million tonnes of carbon emissions by deploying offshore wind farms.
As we deploy green energy and plan to phase out coal entirely by 2023, our carbon intensity will be reduced by 96% in 2023 compared to 2006. Our target puts us 27 years ahead of the 2°C trajectory projected by the Interna-tional Energy Agency. This places our strategy well ahead of the Paris Agreement.
By pursuing our green vision and strategy, we are aligned with the TCFD recommendations to a large extent, and we decided to endorse the recommendations in 2018. The Board of Directors is directly or indirectly addressing climate-related risks and opportunities when assessing and deciding on new investments in assets or activities or on discontinuation of activities. In addition, climate-related risks are assessed as an integral part of our risk management processes. Still, however, the TCFD recommendations help us improve our understanding of climate-related financial risks and opportunities and disclose it in a use-ful way to our investors and other stakehold-ers. Our vision is aligned with investors who
Corporate social responsibility reporting
Our sustainability strategy and results arereported on in our sustainability and ESG perfor-mance reports which constitute our annual Commu-nication on Progress to the UN Global Compact. The reports highlight areas in which our expertise can make a real difference when it comes to promoting the UN’s global goals for sustainable development.With these reports, we live up to the requirementsfor corporate social responsibility reportingset out in section 99a of the Danish FinancialStatements Act as well as section 99b on thegender balance at management levels, etc.
See and download the reports here:orsted.com/sustainability2018orsted.com/ESGperformance2018
are still more observant of climate-related risks as well as business opportunities offered to companies positioned to benefit from the important transformation from black to green.
Ørsted’s response to the global climate challenge and our full range of sustainability programmes and SDG contributions are docu-mented in our sustainability report.
Ørsted Annual report 2018 Management’s review Our business
17 / 193
Contents

Invest to grow Explore potential Exit No presence
Offshore wind
Renewables generation Storage T&D Consumption
Wholesale
Electricity storage Electricity
transmission and
distribution
Power to gas
Onshore wind
Corporate customers
Solar PV
Residential customers
Bioenergy
Electric heating
Electric vehicles
Our strategic playing fieldThe renewable energy value chain is made up of various components. These range from generation of green power, through storage, transmission and distribution to the consump-tion side. Within this energy system, we have taken the following strategic positions.
Offshore wind is our core focus and has been since we decided to transform Ørsted to a green energy company. It is a rapidly growing market in the global energy system with at-tractive value-creating opportunities. We have been successful in leveraging our capabilities to become the leading global player in the offshore wind market, representing a 30% share of the total capacity in operation or under construction.
Onshore wind is our second growth platform where we now have a strong regional position, with the acquisition of Lincoln Clean Energy in the US. The US onshore market offers attrac-tive value-creating opportunities and has significant long-term growth potential. The transaction provides technology and market di-versification and enables us to serve the future energy demand through a multi-technology business platform. In addition, the US market will add to our scale and critical mass.
To secure market access, our strategic focus is on wholesale and corporate customers which account for the largest share of energy consumption. This position enables a route to market for our green energy generation.
Besides existing market positions, we explore the strategic and financial potential of addi-tional green growth opportunities. Both solar PV, bioenergy and storage offer significant growth opportunities on the back of signifi-cant cost reductions. Considering our rapidly growing global portfo-lio of renewable energy assets, we decided to initiate a structured divestment process of our Danish power distribution, residential custom-er and city light businesses in June 2018. Al-though the political support for continuing this structured process ceased on 13 January this year, we are continuing to investigate different options for exiting the businesses during 2019. In addition, following the political agreement in support of our IPO, we are conducting a structured divestment process of our offshore gas pipeline (including the Nybro Gas Treat-ment Plant) and oil pipeline (including the Frederica stabilisation plant). The transactions are expected to be signed in 2019.
Although we acknowledge electric heating and electric vehicles as key components in the renewable energy value chain, we have no actual plans to enter these markets.
Ørsted Annual report 2018 Management’s review Our business
18 / 193
Contents
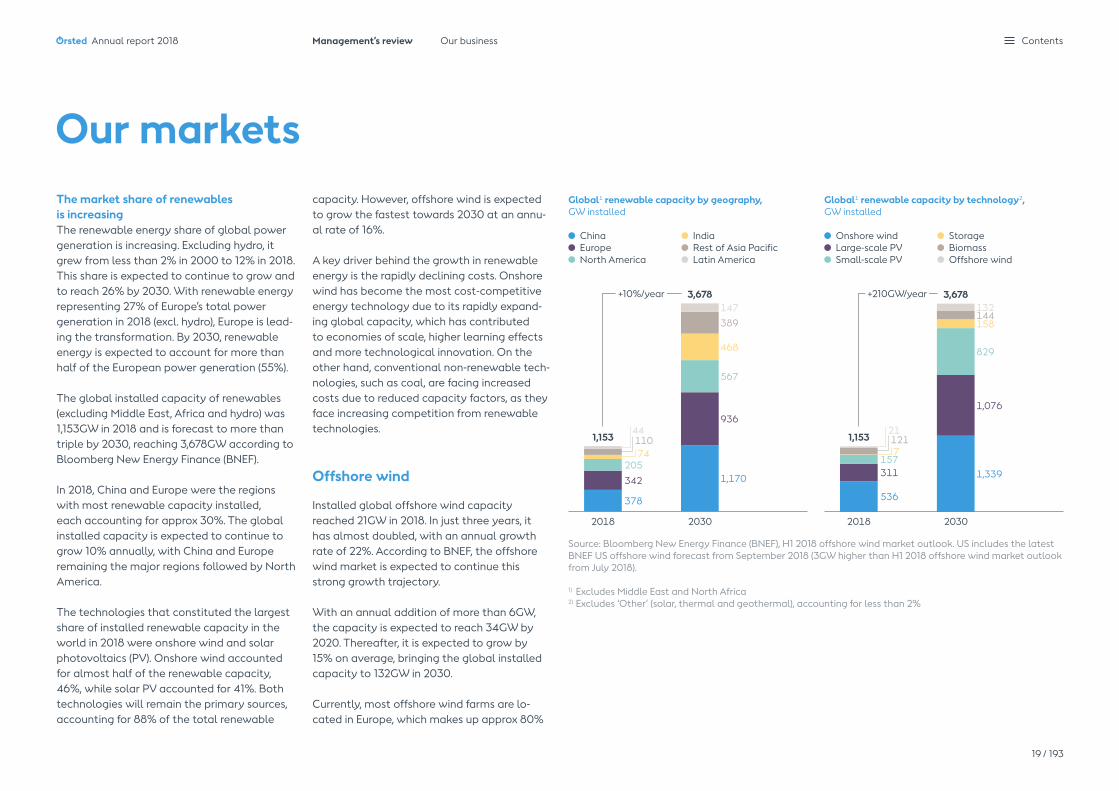
Global1 renewable capacity by geography, GW installed
China India Europe Rest of Asia Pacific North America Latin America
Global1 renewable capacity by technology2, GW installed
Onshore wind Storage Large-scale PV Biomass Small-scale PV Offshore wind
1,170 1,339
378 536
9361,076
342311
567
829
205 157
468
158
74 7
389144
110 121
147 132
44 21
3,678 3,678
1,153 1,153
2030 20302018 2018
+10%/year +210GW/year
Our marketsThe market share of renewables is increasingThe renewable energy share of global power generation is increasing. Excluding hydro, it grew from less than 2% in 2000 to 12% in 2018. This share is expected to continue to grow and to reach 26% by 2030. With renewable energy representing 27% of Europe’s total power generation in 2018 (excl. hydro), Europe is lead-ing the transformation. By 2030, renewable energy is expected to account for more than half of the European power generation (55%).
The global installed capacity of renewables (excluding Middle East, Africa and hydro) was 1,153GW in 2018 and is forecast to more than triple by 2030, reaching 3,678GW according to Bloomberg New Energy Finance (BNEF).
In 2018, China and Europe were the regions with most renewable capacity installed, each accounting for approx 30%. The global installed capacity is expected to continue to grow 10% annually, with China and Europe remaining the major regions followed by North America.
The technologies that constituted the largest share of installed renewable capacity in the world in 2018 were onshore wind and solar photovoltaics (PV). Onshore wind accounted for almost half of the renewable capacity, 46%, while solar PV accounted for 41%. Both technologies will remain the primary sources, accounting for 88% of the total renewable
capacity. However, offshore wind is expected to grow the fastest towards 2030 at an annu-al rate of 16%.
A key driver behind the growth in renewable energy is the rapidly declining costs. Onshore wind has become the most cost-competitive energy technology due to its rapidly expand-ing global capacity, which has contributed to economies of scale, higher learning effects and more technological innovation. On the other hand, conventional non-renewable tech-nologies, such as coal, are facing increased costs due to reduced capacity factors, as they face increasing competition from renewable technologies.
Offshore wind
Installed global offshore wind capacity reached 21GW in 2018. In just three years, it has almost doubled, with an annual growth rate of 22%. According to BNEF, the offshore wind market is expected to continue this strong growth trajectory. With an annual addition of more than 6GW, the capacity is expected to reach 34GW by 2020. Thereafter, it is expected to grow by 15% on average, bringing the global installed capacity to 132GW in 2030.
Currently, most offshore wind farms are lo-cated in Europe, which makes up approx 80%
Source: Bloomberg New Energy Finance (BNEF), H1 2018 offshore wind market outlook. US includes the latest BNEF US offshore wind forecast from September 2018 (3GW higher than H1 2018 offshore wind market outlook from July 2018).
1) Excludes Middle East and North Africa2) Excludes ‘Other’ (solar, thermal and geothermal), accounting for less than 2%
Ørsted Annual report 2018 Management’s review Our business
19 / 193
Contents

11 17 2443
68
14
8
21
36
1
9
18
4
10
2015
1221
2018
33
2020
77
2025
132
2030
2015
93121
2018
148
2020
208
2025
247
2030
CAGR +(16.4%/9.3GW)/year1
CAGR +(6.1%/10.5GW)/year
of the total market. Europe is expected to continue growing at strong double-digit rates towards 2030, thus upholding the position as the largest offshore wind market in the world with an expected share of the global installed capacity of 50% in 2030.
However, new markets in Asia Pacific (APAC)and North America are expected to follow with booming growth. Asia Pacific, excluding China, is expected to grow at an average an-nual growth rate of 58% towards 2030. North America is also expected to grow significantly after 2020, with installed capacity expected to increase from 30MW in 2018 to 10GW by 2030 according to BNEF. This expectation does not fully take the recent 9GW by 2035 ambition from the New York Governour into account.
The strong growth in offshore wind can be attributed to the significant reduction in costs. In 2018, the levelised cost of electricity for newly commissioned generation capacity in North-western Europe was reduced by approx 45% compared to the level four years earlier, and it is expected to decrease further.
Newly built offshore wind has become more competitive than conventional generation technologies using gas and coal. The contin-uous reductions in offshore wind costs are evident in recent auctions in Germany and the Netherlands where some developers bid for zero subsidy projects.
Onshore renewables
Onshore windThe global onshore wind market, excluding Middle East and Africa, shows strong growth as the installed capacity reached 536GW in 2018, up from 395GW in 2015, growing at 11% annually. The global market is forecasted to almost triple by 2030.
Among key markets, Asia Pacific represents 43% of the global onshore capacity, driven by China. Europe reached 164GW installed capacity in 2018, representing 31% of the market. Another key market is North America with 121GW, representing 23% of the global capacity.
Onshore wind is the most cost-competitive renewable energy resource, with the lowest lev-elised cost of electricity in the US in 2018. North America is expected to continue installing onshore wind with an annual average growth rate of 11% towards 2020 and to double its capacity by 2030. In the short term, the market will continue to be driven by projects that have secured production tax credits (PTCs), but once all PTC-backed projects have been built in 2024, the low cost of onshore wind will be the main driver for further capacity build-outs.
Solar photovoltaic (PV)Among the new renewable technologies, solar PV witnessed the fastest growth, as the global capacity grew by 31% from 2015 to 2018. The global capacity, excluding Middle East and Africa, reached 468GW in 2018. This strong growth is expected to continue towards 2030, reaching 1,905GW installed capacity at an annual growth rate of 12%. Large-scale PV, with a power capacity greater than 1MW, represented 66% of the total capacity in 2018, while small-scale PV, typically for residential use with a 5kW power capacity, is expected to catch up towards 2030, reaching a share of 43% of cumulative solar PV installations.
North America reached 65GW in 2018 and was one of the fastest growing regions. It is expect-ed to continue this growth trajectory with an
Installed offshore wind capacity, GW
Europe China Rest of Asia Pacific North America
Installed onshore wind capacity, GW
North America
Source: Bloomberg New Energy Finance (BNEF), New Energy outlook 2018
Source: Bloomberg New Energy Finance (BNEF), 1H 2018 offshore wind market outlook. US includes the latest BNEF US offshore wind forecast from Sep-tember 2018 (3GW higher than the H1 2018 offshore wind market outlook from July 2018
1) Global CAGR
annual growth rate of 23% towards 2020 and is to quadruple its installed capacity, reaching 261GW by 2030.
Towards 2023, the levelised cost of electricity for solar PV is expected to be cheapest in North America, barely overtaking onshore wind. Key drivers supporting cost reduc-tions are scale, material savings due to less waste, and more incentives for technological innovations.
Energy storageAs the share of intermittent renewable sources is increasing in the global energy mix, the need for more dynamic dispatchable units to store energy and support rapid load-shifting
Ørsted Annual report 2018 Management’s review Our business
20 / 193
Contents

is also growing. Battery storage solutions can balance electricity supply and demand and may also provide ancillary services.
Global energy storage, excluding Middle East and Africa, is expected to rise significantly over the next decade. In 2018, it had grown by 58% from 2015, reaching 6GW, and it is expected to continue this strong growth path to reach 158GW by 2030.
Today, most of the capacity (73%) is devel-oped for large-scale and only 27% for small-scale storage. Large-scale storage systems (+1MW) primarily provide services directly to the grid, while small-scale storage systems typically provide end-customer services.
A key driver for the strong outlook is the decreasing cost of lithium-ion battery packs. Between 2010 and 2017, prices fell by 80% and going forward, BNEF forecasts further cost reductions, supported by economies of scale from increasing battery manufacturing capacity.
Bioenergy
Global waste volumes are rapidly increasing. In 2004, the municipal solid waste (MSW) generated globally amounted to 680 million tonnes per year. By 2016, volume had tripled to 2.0 billion tonnes per year, and it is expect-ed to continue growing. In 2016, only 17% of MSW was recycled, while the majority was sent to landfilling, which can potentially have significant negative effects on the environ-ment. Regulation is attempting to boost the recycling share. The EU has set targets to
increase the recycling share of MSW to 65% by 2030 and reduce landfilling to less than 10%.
Alternatives to landfilling, such as incineration and full-source separation, contribute to high carbon emission levels and only marginally to recycling. Hence, it is increasingly important to find alternative solutions.
In addition to MSW, industries produce waste from their production activities, e.g. organic residues and by-products, that need to be han-dled. In 2014, bio-based waste from industrial processes and agriculture, forestry, fishing and water treatment in the EU accounted for 157 million tonnes per year. For companies that depend on natural gas and are looking for greener processes, the conversion of organic waste into bio-methane is an appealing solution.
Customer Solutions
In 2018, the downstream electricity market size in Europe was 3.3PWh. Of this, the busi-ness segment accounted for the largest share with 60-70%, while residential customers accounted for 30-40%.
In 2018, 42% of the European power demand was met by renewable energy (incl. hydro), and the share is forecasted to reach 69% by 2030. Considering the growth in renewables, the consequent increase in intermittent power generation will lead to continuous discrepan-cies between forecasted and actual produc-tion. There is value in efficiently managing this gap for wholesale customers by providing balancing services.
With subsidies for renewable power genera-tion trending lower and eventually reaching zero, it becomes increasingly important to find ways to manage the increasing merchant power price exposure. This entails develop-ment of new products and solutions for the wholesale and retail markets.
In the business segment, many corporate cus-tomers demand greener and more innovative energy solutions that are also sustainable and cost efficient. To address this demand, the market for corporate power purchase agreements (cPPA) has experienced considera-ble growth. Despite remaining a smaller share of the total downstream power market, the global market size for cPPAs is expected to reach 28GW in 2018, up from only 9GW in 2015. As customers pursue sustainable and greener solutions, 74% of the cPPAs are sourced from wind and 24% from solar energy.
Ørsted Annual report 2018 Management’s review Our business
21 / 193
Contents

Our strategy and capital allocationStrategic direction and growthOur strategic shift from black to green energy is reflected in our capital base. In 2007, only 16% of our total capital employed was invested in renewables. In 2018, the share of renewables had increased to 87%.
In addition, our strategic transformation to become a green energy company has posi-tioned Ørsted as one of the largest commercial renewable energy companies in the world, measured by the capacity of renewable energy that is installed and under construction. By the end of 2018, we had 12GW of renewable energy capacity installed, under construction, or where a FID has been taken, with the vast majority being in offshore wind. In addition, we have been awarded or contracted projects with a capacity of 4.8GW where investment decisions are yet to be taken. Furthermore, we have a strong pipeline of projects under development.
Towards 2030, we expect that the global market for renewable energy will more than triple to 3,600GW. As one of the leading com-panies in renewable energy, Ørsted is strongly positioned to take part in this growth.
We have increased our ambition for offshore wind from a capacity of 11-12GW to a capaci- ty of 15GW by 2025. By 2030, our strategic ambition is to achieve an installed renewa-ble capacity of more than 30GW, provided that the development creates value for our shareholders.
We have a strong growth platform to support our strategic ambition, comprising our four business units: Offshore, Onshore, Bioenergy and Customer Solutions.
Our Offshore business unit includes offshore wind, transmission and storage. We strive to maintain our global market leadership in offshore wind and will continue to expand
in Europe, North America, and Asia. We will keep pioneering and innovating the industry. Offshore wind will remain the strategic core of our company.
The second growth avenue is our Onshore business unit, where the aim is to create a leading North American company within renewable energy, with a main emphasis on
onshore wind, but also including solar energy and energy storage.
Bioenergy includes our biomass-converted combined heat and power plants in Denmark and our waste-to-energy and biogas technolo- gies. We will continue to explore the growth and value creation potential within bioenergy.
Offshore— Wind— Transmission— Storage
Global leader in offshore wind— Strategic core— Growth and value creation— Scale— Keep pioneering and innovating
— Explore growth and value creation potential of Bioenergy
— Route to market for Ørsted’s product portfolio
— Risk management— Incremental value creation
Leading US renewable company— Strategic diversification— Scale— Technology integration— New value-creating growth platform
Europe Americas Asia
Onshore— Wind— Solar PV— Storage
Bioenergy— Biomass— Renescience— Biogas
Customer Solutions
Strategic growth platform
Ørsted Annual report 2018 Management’s review Our business
22 / 193
Contents
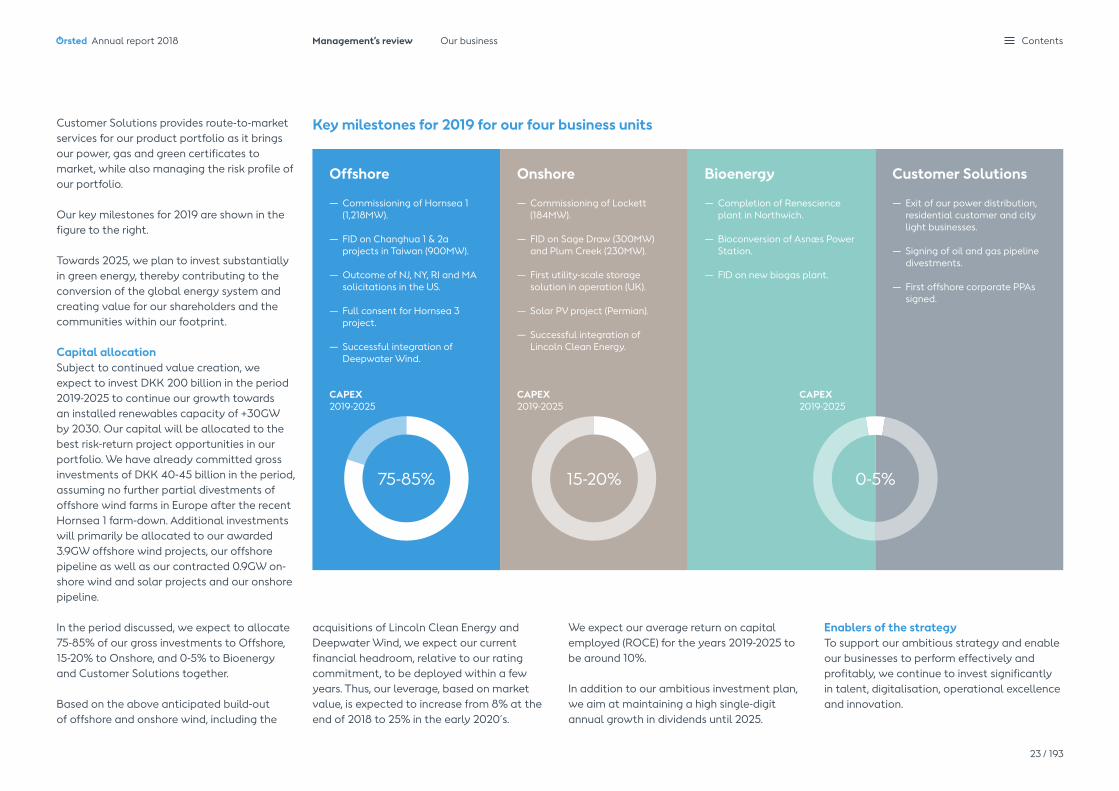
Customer Solutions provides route-to-market services for our product portfolio as it brings our power, gas and green certificates to market, while also managing the risk profile of our portfolio.
Our key milestones for 2019 are shown in the figure to the right.
Towards 2025, we plan to invest substantially in green energy, thereby contributing to the conversion of the global energy system and creating value for our shareholders and the communities within our footprint.
Capital allocationSubject to continued value creation, we expect to invest DKK 200 billion in the period 2019-2025 to continue our growth towards an installed renewables capacity of +30GW by 2030. Our capital will be allocated to the best risk-return project opportunities in our portfolio. We have already committed gross investments of DKK 40-45 billion in the period, assuming no further partial divestments of offshore wind farms in Europe after the recent Hornsea 1 farm-down. Additional investments will primarily be allocated to our awarded 3.9GW offshore wind projects, our offshore pipeline as well as our contracted 0.9GW on-shore wind and solar projects and our onshore pipeline.
In the period discussed, we expect to allocate 75-85% of our gross investments to Offshore, 15-20% to Onshore, and 0-5% to Bioenergy and Customer Solutions together.
Based on the above anticipated build-out of offshore and onshore wind, including the
acquisitions of Lincoln Clean Energy and Deepwater Wind, we expect our current financial headroom, relative to our rating commitment, to be deployed within a few years. Thus, our leverage, based on market value, is expected to increase from 8% at the end of 2018 to 25% in the early 2020´s.
We expect our average return on capital employed (ROCE) for the years 2019-2025 to be around 10%. In addition to our ambitious investment plan, we aim at maintaining a high single-digit annual growth in dividends until 2025.
Enablers of the strategy To support our ambitious strategy and enable our businesses to perform effectively and profitably, we continue to invest significantly in talent, digitalisation, operational excellence and innovation.
Offshore
— Commissioning of Hornsea 1 (1,218MW).
— FID on Changhua 1 & 2a projects in Taiwan (900MW).
— Outcome of NJ, NY, RI and MA solicitations in the US.
— Full consent for Hornsea 3 project.
— Successful integration of Deepwater Wind.
Onshore
— Commissioning of Lockett (184MW).
— FID on Sage Draw (300MW) and Plum Creek (230MW).
— First utility-scale storage solution in operation (UK).
— Solar PV project (Permian).
— Successful integration of Lincoln Clean Energy.
Bioenergy
— Completion of Renescience plant in Northwich.
— Bioconversion of Asnæs Power Station.
— FID on new biogas plant.
Customer Solutions
— Exit of our power distribution, residential customer and city light businesses.
— Signing of oil and gas pipeline divestments.
— First offshore corporate PPAs signed.
Key milestones for 2019 for our four business units
75-85% 15-20%
CAPEX2019-2025
CAPEX2019-2025
CAPEX2019-2025
0-5%
Ørsted Annual report 2018 Management’s review Our business
23 / 193
Contents

TalentAs one of the global leaders in renewable energy, Ørsted offers a strong environment for professional growth and career development. With our global growth ambition, we will need gifted, ambitious and world-class talent to drive our business forward. Our aim is to hire the best people and to offer unparalleled opportunities for professional development through attractive learning opportunities for all employees and through dynamic and mobile careers. To support our ambition, we are strengthening our employer branding and talent acquisition efforts, our people development and performance management approaches and our talent development activities. As we expand our global business, we will also increase workforce diversity to create a truly international culture. To drive more structured talent acquisition, develop-ment and deployment of high potentials, we are establishing cross-business ‘talent pipeline forums’ led by senior business executives.
DigitalisationOur digital strategy focuses on keeping us at the forefront of our industry. The key focus areas lie within offshore wind power opera- tions, customer solutions, market trading and risk management, combined heat and power plant operations and shared services. Across these areas, we have defined financial targets and established rigorous processes for delivering and tracking value. The key drivers for increased digital value creation are increasing deployment of advanced analyt-ics and artificial intelligence, strengthening interfaces and mobility by augmenting our employees´ or customers´ experiences through human-machine interfaces, as well as a raised
level of automation. In 2018, we significantly scaled up our digitalisation efforts, increasing external recruitment and further leveraging our in-house capabilities.
Operational effectivenessWe continuously drive asset productivity, cost efficiency and quality across all major opera-tional areas. In particular, we run operational excellence programmes within O&M and EPC in offshore wind, our CHP plants, shared services and our sales operations. Across our businesses, all operational excellence programmes are driven rigorously, based on clear target setting, well-defined initiatives and clear follow-up processes for delivering and tracking value creation.
InnovationTo maintain our competitive edge and stay at the forefront of a rapidly evolving renewable energy industry, innovation is a key priority. Across our business units, we invest significantly in innovating and strengthening our existing product offerings and in bringing new solutions into our portfolio. To reinforce our strategic radar for emerging technologies and business models, we established Ørsted Ventures in Silicon Valley, California, in 2017. In 2018, we expanded our venture engagements to also in-clude our European markets. To nurture internal innovation, we run cross-organisational Innova-tion Games, where internal teams from across the company present innovative business ideas aimed at promoting growth and strengthening our competitive edge.
Ørsted Annual report 2018 Management’s review Our business
24 / 193
Contents

Key resources Core activities Value created
Our business model
Bioenergy
Offshore
Onshore
Customer Solutions
— Develop, build, own and operate offshore wind farms (three wind farms are under construction).
— Own 26 offshore wind farms of which we operate 22.
— Development projects in progress in the UK, Germany, Taiwan and the US.
— Additional new markets being devel-oped in Asia and Europe.Capital employed 79%
Capital employed 6%
Capital employed 2%Capital employed 13% of which assets we plan to exit 10%
— Route-to-market services for our own and partners’ power, gas and certificates.
— Manage the Group’s energy portfolio risks.
— Convert our CHP plants to biomass.
— Own and operate ten CHP plants in Denmark.
— Enter into long-term contracts with our heat customers and sell power to the market.
— Explore opportunities within biogas and waste recycling.
— Develop, build, own and operate onshore wind farms.
— Three wind farms are in operation, one wind farm is under construc-tion, and two wind farms are under development.
— Explore opportunities within solar PV and storage.
Financial capitalWe finance our investments through cash flows from opera- tions, debt and divestment of ownership interests.
Energy assetsWe invest in scalable, innovative green technologies and solutions.
Natural resourcesWe rely on natural resources, such as construction materials, biomass, as well as locations with attractive wind speeds and seabed conditions.
Human resourcesWe rely on a highly skilled work-force to operate our business.
Innovative cultureWe continuously innovate our energy solutions to drive competitiveness.
Stakeholder engagementWe depend on constructive rela-tions with our key stakeholders to ensure supportive framework conditions for our business.
Society We address profound societal challenges by developing green, independent and economically viable energy systems that reduce greenhouse gas emissions and stimulate local growth and job creation.
CustomersWe fulfil our customers’ energy needs through green, innovative and efficient energy solutions.
EmployeesWe are committed to a sustain-able working life and keep a constant focus on being a great and safe place to work with moti-vated and satisfied employees.
Shareholder returnWe create value for our shareholders in the form of competitive total returns.
Ørsted Annual report 2018 Management’s review Our business
25 / 193
Contents

17
50
6475
10%
>95 99
30.0bn32%
2006 2018
2018
2016
24%
19.1bn
2016
2023
2019-2025
2017
22.5bn25%
2017
2025
462
2006
131
2018
151
2017
100
2020
20 10
2023 2025
8.510.5
~25-26
2018 20232017
CAGR +20%/year
Strategic targets
2. ROCE, %Our target is an average return on capital employed (ROCE) of around 10% for the Group in the 2019-2025 period. EBITDA in 2016-2018 has been positively impacted by significant profits from new partnership agreements, particularly divestment gains, which are not expected to be repeated going forward.
ROCE EBITDA of which EBITDA from new partnerships
In 2018, we increased the green share of generation by 11%-points compared to the previous year. We are on track to meet our objective of exceeding 95% by 2023 and reaching 99% by 2025.
3. Green share of generation, %
The conversion of our heat and power stations to sustainable biomass, together with our build-out of offshore wind, has reduced our carbon emissions intensity by 72% since 2006. We are well on track to meet our target of an emission intensity of no more than 20g CO2e per kWh in 2023 and 10g CO2e in 2025.
4. Carbon emissions, g CO2e/kWh
1. EBITDA from operating wind farms, %EBITDA from our wind farms in operation is on average expected to increase by 20% per year from 2017 to 2023.
Ørsted Annual report 2018 Management’s review Our business
26 / 193
Contents
6.8
75
2016
4.7
3.3
2018 2025
6.4
77
82
76
83
76
74
76
6967
70
76 7677
75
81
80
20172016 20182017
2016 20182017 2020
2
2010
30
2020 2030
8.310
15
2018 2025
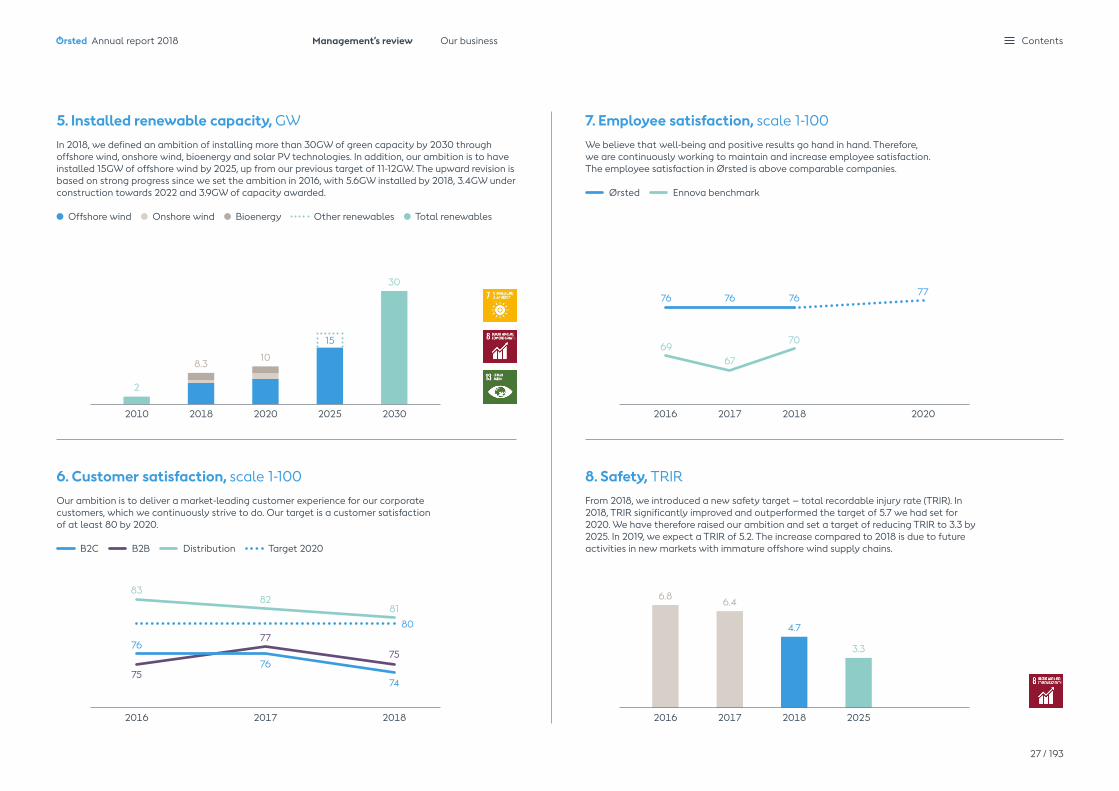
7. Employee satisfaction, scale 1-100
8. Safety, TRIR6. Customer satisfaction, scale 1-100
We believe that well-being and positive results go hand in hand. Therefore, we are continuously working to maintain and increase employee satisfaction. The employee satisfaction in Ørsted is above comparable companies.
Ørsted Ennova benchmark
From 2018, we introduced a new safety target – total recordable injury rate (TRIR). In 2018, TRIR significantly improved and outperformed the target of 5.7 we had set for 2020. We have therefore raised our ambition and set a target of reducing TRIR to 3.3 by 2025. In 2019, we expect a TRIR of 5.2. The increase compared to 2018 is due to future activities in new markets with immature offshore wind supply chains.
Our ambition is to deliver a market-leading customer experience for our corporate customers, which we continuously strive to do. Our target is a customer satisfaction of at least 80 by 2020.
B2C B2B Distribution Target 2020
In 2018, we defined an ambition of installing more than 30GW of green capacity by 2030 through offshore wind, onshore wind, bioenergy and solar PV technologies. In addition, our ambition is to have installed 15GW of offshore wind by 2025, up from our previous target of 11-12GW. The upward revision is based on strong progress since we set the ambition in 2016, with 5.6GW installed by 2018, 3.4GW under construction towards 2022 and 3.9GW of capacity awarded.
Offshore wind Onshore wind Bioenergy Other renewables Total renewables
5. Installed renewable capacity, GW
Ørsted Annual report 2018 Management’s review Our business
27 / 193
Contents

Sweden
(MW)
Symbols
In operation
Under construction
Awarded
Under development
Total gross wind farm capacity
Sale of power and/or gas
Our globalfootprint
Denmark
Anholt (400MW) Horns Rev 1 (160MW)Horns Rev 2 (209MW)Nysted (166MW)
AsnæsAvedøre 1 & 2EsbjergH.C. ØrstedHerningKalundborg BioenergiKyndbySkærbækStudstrupSvanemølle
Germany and the Netherlands
Gode Wind 1 (345MW)Gode Wind 2 (263MW)Borkum Riffgrund 1 (312MW)Borkum Riffgrund 2 (465MW)
Borssele 1 & 2 (752MW)
Borkum Riffgrund West 1 (420MW)Borkum Riffgrund West 2 (240MW)Gode Wind 3 (110MW)Gode Wind 4 (132MW)OWP West (240MW)
UK
Barrow (90MW) Burbo Bank (90MW)Burbo Bank Extension (258MW)Gunfleet Sands 1 & 2 (173MW)Lincs (270MW)London Array 1 (630MW)Race Bank (573MW)Walney 1 & 2 (367MW)Walney Extension (659MW)Westermost Rough (210MW)West of Duddon Sands (389MW)
Hornsea 1 (1,218MW)Hornsea 2 (1,386MW)
Hornsea 3 (up to 2,400MW)Hornsea 4 (up to 1,200MW)Race Bank Extension (573MW)
Renescience Northwich
USA
Amazon (253MW)Tahoka (300MW)Willow Springs (250MW)
Lockett (184MW)
Plum Creek (230MW)Sage Draw (300MW)
Block Island (30MW)
Coastal Virginia Offshore Wind (12MW) (EPC contract)
South Fork (130MW)Skipjack (120MW)Revolution Wind (704MW)
Bay State Wind (up to 2,000MW)Garden State (up to 800MW)Ocean Wind (up to 3,500MW)Revolution Wind (up to 1,200MW)
Oak solar
Permian solar
Taiwan
Formosa 1 (128MW)
Greater Changhua Projects (1,820MW)
Ørsted Annual report 2018 Management’s review Our business
28 / 193
Contents

Symbols
In operation
Under construction
Awarded
Under development
Total gross wind farm capacity
Sale of power and/or gas
UK The NetherlandsGermany
Sweden
Denmark
Kyndby
AsnæsKalundborg Bioenergi
Esbjerg
Horns Rev 1 (160MW) Horns Rev 2 (209MW)
Borssele 1 & 2 (752MW)
Gunfleet Sands 1 & 2 (173MW)
Lincs (270MW) Race Bank (573MW)Race Bank Extension (573MW)
Hornsea 1 (1,218MW)Hornsea 2 (1,386MW)Hornsea 3 (up to 2,400MW)Hornsea 4 (up to 1,200MW)
Westermost Rough (210MW)
London Array 1 (630MW)
Gode Wind 1 (345MW)Gode Wind 2 (263MW)Gode Wind 3 (110MW)Gode Wind 4 (132MW)
Barrow (90MW)
Renescience Northwich
Burbo Bank Extension (258MW) Burbo Bank (90MW)
Skærbæk
Nysted (166MW)
Studstrup
Walney Extension (659MW) Walney 1 & 2 (367MW)
West of Duddon Sands (389MW)
Borkum Riffgrund 1 (312MW)Borkum Riffgrund 2 (465MW)
OWP West (240MW)Borkum Riffgrund West 1 (420MW)Borkum Riffgrund West 2 (240MW)
Herning
Anholt (400MW)
SvanemøllenH.C. ØrstedAvedøre 1 & 2
(MW)
Our Northern Europeanfootprint
Ørsted Annual report 2018 Management’s review Our business
29 / 193
Contents
Results
Results 31Five-year summary 35Fourth quarter 36Quarterly summary, 2017-18 38
Ørsted Annual report 2018 Contents

Results
Business performance vs. IFRS, DKKm 2018 2017
EBITDA – business performance 30,029 22,519
Market value adjustments for the year of financial and physical hedging contracts relating to a future period (1,734) (138)
Reversal of deferred gains (losses) relating to hedging contracts from previous periods, where the hedged production or trade is recognised in business performance EBITDA in this period 196 193
EBITDA – IFRS 28,491 22,574
Business performance vs. IFRS
Ørsted uses business performance as an alternative to the results prepared in accordance with IFRS. Business performance represents the underlying financial performance of the Group in the reporting period as results are adjusted for tem-porary fluctuations in the market value of contracts (including hedging transac-tions) relating to other periods. The difference between the two principles will be eliminated as the contracts expire. Apart from this, there is no difference between business performance and the IFRS results. EBITDA calculated in accordance with IFRS amounted to DKK 28.5 billion in 2018 against DKK 22.6 billion in 2017. Calculated in accordance with the business performance principle, EBITDA was DKK 30.0 billion and DKK 22.5 billion, respec-tively. The difference between the two principles was thus DKK 1.5 billion in 2018 compared with DKK 0.1 billion in 2017 and is specified below.
In the presentation of the results according to IFRS, Ørsted does not apply the provisions on hedge accounting of commodities and related currency exposures. The market value adjustments of these are continuously recognised in the income statement, which means that the IFRS results for the individual years are not comparable. IFRS results do not reflect the commercial risk hedging, according to which the business units and the Group are managed and evaluated. In the man-agement’s review, comments are based on the business performance principles only, unless otherwise specified. Reference is also made to note 1.6.
Financial results
RevenuePower generation from offshore wind farms increased by 18% to 10.0TWh in 2018 due to the ramp-up of generation from Race Bank, Walney Extension and Borkum Riffgrund 2. Power generation from onshore wind farms amounted to 0.6TWh in 2018. Thermal power generation was 18% lower than in 2017, driven by the divestment of our Dutch power plant in June, and amounted to 6.7TWh. Power gen-eration from our Danish CHP plants increased by 4%, while heat generation decreased by 2% to 8.8TWh in 2018. Offshore and onshore wind farms accounted for 62% of our total power generation, an increase of 11 percentage points compared to last year. The renewable energy share of our total heat and power generation accounted for 75% of total generation in 2018 compared with 64% in 2017.
Revenue amounted to DKK 76.9 billion. The increase of 29% relative to 2017 was primarily due to higher revenue from construction agree-ments due to high activity on construction of offshore wind farms for partners and divest-ment of transmission assets, higher revenue from wind farms in operation and higher gas and power prices in 2018.
EBITDAOperating profit (EBITDA) totalled DKK 30.0 billion compared with DKK 22.5 billion in 2017. Earnings from Offshore increased by 35% to
Assets held for sale
We have classified our power distribution, residential customer and city light businesses as assets held for sale at the end of 2018, as we expect to exit these activities within the next 12 months. Contrary to the classification of our upstream oil and gas activities as assets held for sale in 2016, these activities are not presented as discontinued operations due to their more limited relative size for the Group. This means that the results and cash flows are still presented together with the rest of the Group. EBITDA from the power distribution, residential customer and city light businesses amounted to DKK 1.1 billion in 2018 (4% of total EBITDA), while capital employed amounted to DKK 8.3 billion (10% of total capital employed).
Ørsted Annual report 2018 Management’s review Results
31 / 193
Contents

EBITDA
Offshore Onshore Bioenergy Customer Solutions
1%>1%
7%
92%
DKK 30.0bn
DKK 27.8 billion, of which the farm-down of Hornsea 1 represented more than half (DKK 15.1 billion). Higher power generation due to ramp-up and commissioning of new offshore wind farms contributed to a 29% increase in earnings from offshore wind farms in operation.
Earnings from Onshore contributed marginally, while Bioenergy earnings more than doubled and amounted to DKK 0.4 billion due to higher spreads as well as full-year impact from the bioconversion of Skærbæk Power Station, which was inaugurated in Q4 2017.
Earnings from Customer Solutions were almost flat year-on-year and amounted to DKK 2.0 billion.
EBITDA, excluding new partnerships increased by 18%.
EBITDA, DKKbn
EBITDA, excl. new partnerships EBITDA, new partnerships
22.5
30.0
2017 2018
9.8
12.7
Financial results, DKKm 2018 2017 %
Revenue 76,946 59,504 29%
EBITDA 30,029 22,519 33%
Depreciation (5,978) (5,739) 4%
Impairment reversals (losses) 603 (545) n.a.
Operating profit (loss) (EBIT) 24,654 16,235 52%
Gain (loss) on divestment of enterprises 127 (139) n.a.
Profit (loss) from associates and JVs 1 (10) n.a.
Net financial income and expenses (1,278) (1,042) 23%
Tax (4,018) (1,765) 128%
Tax rate 17% 12% 5%p
Profit for the year from continuing operations 19,486 13,279 47%
Profit for the year from discontinued operations 10 6,920 (100%)
Profit (loss) for the year 19,496 20,199 (3%)
In 2018, regulated and quasi-regulated activities and contract-ed activities accounted for 31% and 64% of our EBITDA, respec-tively, whereas market exposed activities accounted for 5%.
Read more about profit for the year from discontinued operations in note 3.7.
EBITEBIT increased by DKK 8.4 billion to DKK 24.7 billion in 2018, primarily as a result of the higher EBITDA.
Depreciation increased by DKK 0.2 billion to DKK 6.0 billion in 2018. The increase was due to a higher number of wind farms in operation.
In connection with the classification of the power distribution activities as assets held for sale, we have reversed a previous impairment loss of DKK 0.6 billion.
Gain (loss) on divestment of enterprises Gain (loss) on divestment of enterprises primarily concerned the divestment of our 50% share of the Dutch gas-fired power plant Enecogen in 2018.
Financial income and expensesNet financial income and expenses amounted to DKK -1.3 billion and were DKK 0.2 billion higher than last year. The increase was mainly due to a lower level of capitalised interests, mainly related to Walney Extension and Race Bank, due to the progress of the projects.
Tax and tax rate Tax on profit for the year amounted to DKK 4.0 billion, which was DKK 2.3 billion higher than in 2017. The effective tax rate was 17% against 12% in 2017. In both years, the tax rate was affected by non-taxable divestment gains. Gain on the 50% farm-down of Hornsea 1 impacted the effective tax rate in 2018, while gains on the farm-downs of Wal-ney Extension, Borkum Riffgrund 2 and Race Bank impacted the tax rate in 2017.
Profit for the year from continuing operationsProfit for the year from continuing operations totalled DKK 19.5 billion, DKK 6.2 billion higher than in 2017. The increase was primarily due to the higher EBIT, partly offset by higher net finance costs and higher taxes.
15.0
15.1
Ørsted Annual report 2018 Management’s review Results
32 / 193
Contents
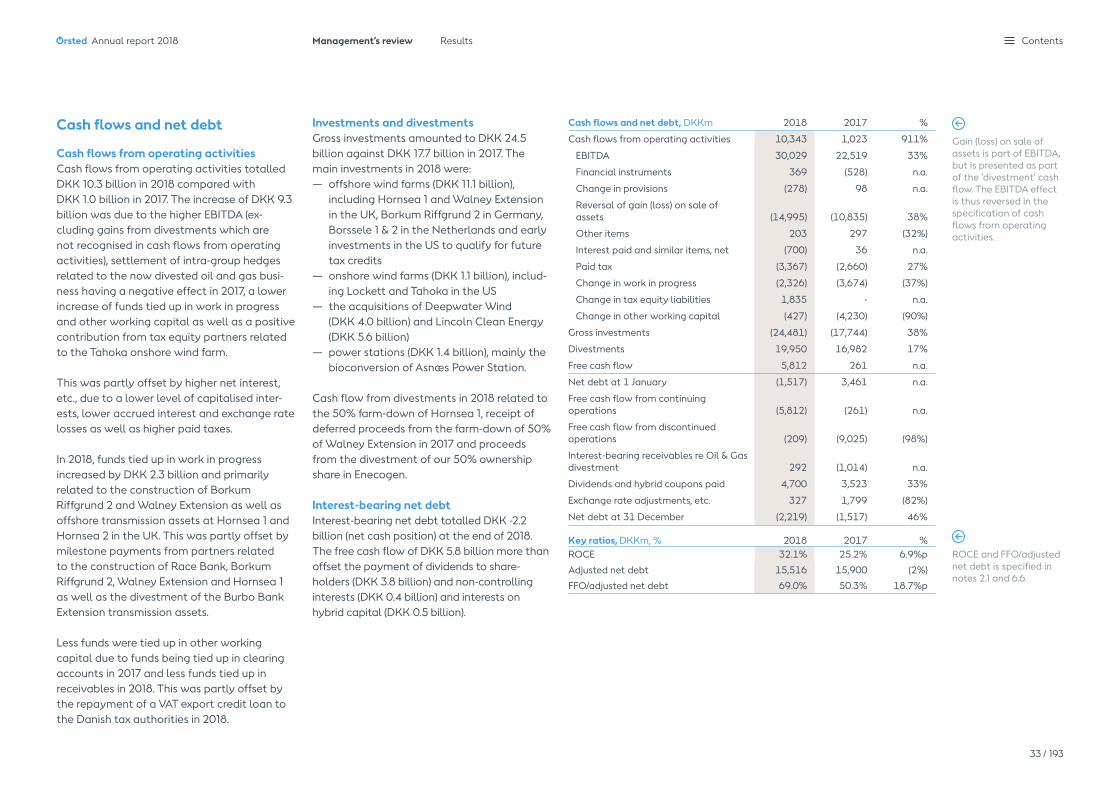
Gain (loss) on sale of assets is part of EBITDA, but is presented as part of the ’divestment’ cash flow. The EBITDA effect is thus reversed in the specification of cash flows from operating activities.
ROCE and FFO/adjustednet debt is specified innotes 2.1 and 6.6.
Cash flows and net debt
Cash flows from operating activitiesCash flows from operating activities totalled DKK 10.3 billion in 2018 compared with DKK 1.0 billion in 2017. The increase of DKK 9.3 billion was due to the higher EBITDA (ex-cluding gains from divestments which are not recognised in cash flows from operating activities), settlement of intra-group hedges related to the now divested oil and gas busi-ness having a negative effect in 2017, a lower increase of funds tied up in work in progress and other working capital as well as a positive contribution from tax equity partners related to the Tahoka onshore wind farm.
This was partly offset by higher net interest, etc., due to a lower level of capitalised inter-ests, lower accrued interest and exchange rate losses as well as higher paid taxes.
In 2018, funds tied up in work in progress increased by DKK 2.3 billion and primarily related to the construction of Borkum Riffgrund 2 and Walney Extension as well as offshore transmission assets at Hornsea 1 and Hornsea 2 in the UK. This was partly offset by milestone payments from partners related to the construction of Race Bank, Borkum Riffgrund 2, Walney Extension and Hornsea 1 as well as the divestment of the Burbo Bank Extension transmission assets.
Less funds were tied up in other working capital due to funds being tied up in clearing accounts in 2017 and less funds tied up in receivables in 2018. This was partly offset by the repayment of a VAT export credit loan to the Danish tax authorities in 2018.
Investments and divestmentsGross investments amounted to DKK 24.5 billion against DKK 17.7 billion in 2017. The main investments in 2018 were:— offshore wind farms (DKK 11.1 billion),
including Hornsea 1 and Walney Extension in the UK, Borkum Riffgrund 2 in Germany, Borssele 1 & 2 in the Netherlands and early investments in the US to qualify for future tax credits
— onshore wind farms (DKK 1.1 billion), includ-ing Lockett and Tahoka in the US
— the acquisitions of Deepwater Wind (DKK 4.0 billion) and Lincoln Clean Energy (DKK 5.6 billion)— power stations (DKK 1.4 billion), mainly the
bioconversion of Asnæs Power Station.
Cash flow from divestments in 2018 related to the 50% farm-down of Hornsea 1, receipt of deferred proceeds from the farm-down of 50% of Walney Extension in 2017 and proceeds from the divestment of our 50% ownership share in Enecogen.
Interest-bearing net debtInterest-bearing net debt totalled DKK -2.2 billion (net cash position) at the end of 2018. The free cash flow of DKK 5.8 billion more than offset the payment of dividends to share-holders (DKK 3.8 billion) and non-controlling interests (DKK 0.4 billion) and interests on hybrid capital (DKK 0.5 billion).
Key ratios, DKKm, % 2018 2017 %ROCE 32.1% 25.2% 6.9%p
Adjusted net debt 15,516 15,900 (2%)
FFO/adjusted net debt 69.0% 50.3% 18.7%p
Cash flows and net debt, DKKm 2018 2017 %
Cash flows from operating activities 10,343 1,023 911%
EBITDA 30,029 22,519 33%
Financial instruments 369 (528) n.a.
Change in provisions (278) 98 n.a.
Reversal of gain (loss) on sale of assets (14,995) (10,835) 38%
Other items 203 297 (32%)
Interest paid and similar items, net (700) 36 n.a.
Paid tax (3,367) (2,660) 27%
Change in work in progress (2,326) (3,674) (37%)
Change in tax equity liabilities 1,835 - n.a.
Change in other working capital (427) (4,230) (90%)
Gross investments (24,481) (17,744) 38%
Divestments 19,950 16,982 17%
Free cash flow 5,812 261 n.a.
Net debt at 1 January (1,517) 3,461 n.a.
Free cash flow from continuing operations (5,812) (261) n.a.
Free cash flow from discontinued operations (209) (9,025) (98%)
Interest-bearing receivables re Oil & Gas divestment 292 (1,014) n.a.
Dividends and hybrid coupons paid 4,700 3,523 33%
Exchange rate adjustments, etc. 327 1,799 (82%)
Net debt at 31 December (2,219) (1,517) 46%
Ørsted Annual report 2018 Management’s review Results
33 / 193
Contents

Capital employed, %
Offshore Onshore
Bioenergy Customer Solutions
2%
6%
13%
79%
Equity and capital employed
EquityEquity was DKK 85.1 billion at the end of 2018 against DKK 71.8 billion at the end of 2017. The increase was primarily due to the positive result for the year less dividends paid.
Capital employedCapital employed was DKK 82.9 billion at the end of 2018 against DKK 70.3 billion at the end of 2017. Offshore’s share of capital employed was 79% at the end of 2018.
Financial ratios
Return on capital employed (ROCE)Return on capital employed was 32% in 2018, up 7 percentage points compared to 2017. The increase was mainly attributable to the higher EBIT. Both years were significantly positively impacted by farm-downs – Hornsea 1 in 2018 and Walney Extension and Borkum Riffgrund 2 in 2017.
Credit metric (FFO/adjusted net debt)The credit metric ‘funds from operations’ (FFO) relative to adjusted net debt was 69% in 2018 relative to 50% in 2017. The increase was due to a higher FFO together with lower adjusted net debt in 2018.
Non-financial results
Green share of heat and power generationThe green share of our heat and power gener-ation amounted to 75% in 2018, up 11 per-centage points relative to 2017. The increase was due to higher generation from offshore wind farms, a larger share of biomass-based generation as a result of the bioconversion of Skærbæk Power Station as well as a decrease in the use of gas following the divestment of the Enecogen power plant.
Carbon emissionsCarbon emissions from our heat and power generation decreased by 13% to 131g CO2e/kWh in 2018 against 151g CO2e/kWh in 2017. Carbon emissions per kWh decreased for the same reasons as mentioned above.
SafetyIn 2018, we registered 98 total recordable injuries (TRIs), 61 of which involved employees working for our suppliers. Over the past 12 months, our total recordable injury rate (TRIR) has declined from 6.4 in 2017 to 4.7 in 2018.
Ørsted Annual report 2018 Management’s review Results
34 / 193
Contents

Income statement (business performance), DKKm 2018 2017 2016 2015 2014
Revenue 76,946 59,504 61,201 65,444 61,280EBITDA 30,029 22,519 19,109 8,730 7,798
Offshore 27,809 20,595 11,867 6,151 6,057Onshore 44 - - - -Bioenergy 367 152 100 283 422Customer Solutions 1,970 2,082 7,108 2,173 1,404Other activities (161) (310) 34 123 (85)
Depreciation and amortisation (5,978) (5,739) (5,232) (5,673) (5,319)Impairment losses 603 (545) - (1,184) (216)Operating profit (loss) (EBIT) 24,654 16,235 13,877 1,873 2,263Gain (loss) on divestment of enterprises 127 (139) 1,250 56 1,258Net financial income and expenses (1,278) (1,042) (767) (1,409) (838)Profit (loss) from associates and joint ventures 1 (10) (8) (8) (484)Profit (loss) before tax 23,504 15,044 14,352 512 2,199Tax (4,018) (1,765) (2,191) 455 (298)Profit (loss) for the year from continuing operations 19,486 13,279 12,161 967 1,901Profit (loss) for the year from discontinued operations 10 6,920 1,052 (13,051) (7,185)Profit (loss) for the year 19,496 20,199 13,213 (12,084) (5,284)
Balance sheetAssets 174,575 146,521 136,489 147,457 149,914Total equity 85,115 71,837 57,500 51,736 61,533
Shareholders of Ørsted A/S 68,488 54,791 39,106 32,090 41,736Non-controlling interests 3,388 3,807 5,146 6,398 6,561Hybrid capital 13,239 13,239 13,248 13,248 13,236
Interest bearing net debt (2,219) (1,517) 3,461 9,193 3,978Capital employed 82,896 70,320 60,961 60,930 65,511Additions to property, plant and equipment 14,436 20,022 17,750 19,843 15,350
Cash flowsCash flows from operating activities 10,343 1,023 11,272 7,521 9,568Gross investments (24,481) (17,744) (14,960) (12,709) (10,327)Divestments 19,950 16,982 9,055 1,982 10,559Free cash flow 5,812 261 5,367 (3,206) 9,800
Financial ratiosReturn on capital employed (ROCE)1, % 32.1 25.2 24.4 3.6 4.3FFO/adjusted net debt2, % 69.0 50.3 64.2 28.8 31.6Number of outstanding shares, 31 December, '000 420,045 420,155 420,155 417,726 417,726Share price, 31 December, DKK 435.7 338.7 267.6 - -Market capitalisation, 31 December, DKKbn 183.0 142.3 112.5 - -Earnings per share (EPS) (BP), DKK 45.3 46.4 30.6 (30.7) (14.9)Dividend yield, % 2.2 2.7 2.2 - -
Income statement (IFRS)Revenue 75,520 59,709 57,393 66,708 61,866EBITDA 28,491 22,574 16,939 9,888 7,546Profit (loss) for the year from continuing operations 18,266 13,321 10,467 1,854 1,708
Business drivers 2018 2017 2016 2015 2014
OffshoreDecided (FID) and installed capacity3, offshore wind, GW 9.0 8.9 7.4 5.1 3.8Installed capacity, offshore wind3, GW 5.6 3.9 3.6 3.0 2.5Generation capacity, offshore wind3, GW 3.0 2.5 2.0 1.7 1.4Wind speed3, m/s 9.1 9.3 8.9 9.7 9.2Load factor3, % 42 44 41 45 44Availability3, % 93 93 92 93 94Power generation, TWh 10.0 8.5 6.0 5.8 5.0OnshoreInstalled capacity, GW 0.8 - - - -Wind speed, m/s 7.3 - - - -Load factor, % 41 - - - -Availability3, % 92 - - - -Power generation, TWh 0.6 - - - -BioenergyDegree days3, number 2,526 2,705 2,715 2,621 2,462Heat generation, TWh 8.8 9.0 9.2 9.3 8.7Power generation, TWh 6.7 8.2 8.4 7.1 8.7Customer SolutionsRegulatory value of power distribution assets4 10,957 10,623 10,648 10,778 10,373Power distribution, TWh 8.4 8.4 8.5 8.4 8.4Power sales, TWh 35.3 37.7 36.7 35.5 34.5Gas sales, TWh 134.1 136.1 150.4 159.1 151.3
People and environmentEmployees (FTE), end of year, number 6,080 5,638 5,775 5,947 5,751 Total recordable injury rate (TRIR) 4.7 6.4 6.8 9.7 10.9Fatalities, number 0 0 0 0 0Green share of heat and power generation, % 75 64 50 49 44Carbon emissions, g CO2e/kWh 131 151 224 220 280
Business performance vs. IFRSBusiness performance represents the underlying financial performance of the Group in the reporting period as results are adjusted for temporary fluctuations in the market value of contracts (including hedging transac-tions) relating to other periods. Apart from this, there is no difference between business performance and IFRS results. Read more in note 1.6. ROCE is calculated for continuing operations.
1) EBIT/average capital employed. 2) Net debt, including 50% of hybrid capital, cash and
securities not available for use (with the exception of repo transactions), present value of lease obligations, and decommissioning obligations less deferred tax.
3) See definition on page 192 and in the ESG statements. 4) The figures indicate values from the latest regulatory
financial statements (updated in June).
Five-year summary
Ørsted Annual report 2018 Management’s review Results
35 / 193
Contents

Financial performance – Group
RevenueRevenue in Q4 2018 increased by 51% relative to Q4 2017 and amounted to DKK 23.5 billion. The increase was mainly driven by construc-tion agreements where revenue increased by DKK 4.6 billion to DKK 6.3 billion due to the partial divestment of the Hornsea 1 transmis-sion assets as part of the 50% farm-down of Hornsea 1. In addition, revenue increased due to higher gas and UK power prices and higher generation from offshore wind farms.
EBITDAOperating profit (EBITDA) totalled DKK 19.2 billion in Q4 2018 compared with DKK 13.0 billion in Q4 2017. The 47% increase was mainly due to the 50% farm-down of Hornsea 1 in Q4 2018, which was only partly offset by the 50% farm down gains from Walney Extension and Borkum Riffgrund 2 in Q4 2017. Earnings from offshore wind farms in operation increased by 26% as a result of ramp-up at Walney Extension, Race Bank and Borkum Riffgrund 2.
Earnings from our Bioenergy and Customer Solutions businesses were in line with Q4 2017. Earnings from Onshore had a limited impact.
Profit from continuing operationsProfit for the period from continuing opera-tions increased by DKK 5.8 billion to DKK 15.2 billion. The increase was mainly due to the higher EBITDA.
Cash flows from operating activitiesCash flows from operating activities totalled DKK 7.6 billion in Q4 2018 compared with DKK 3.1 billion in Q4 2017.
The increase of DKK 4.5 billion was due to lower paid Danish taxes (taxes were paid on account in March in 2018 and in November in 2017), a tax equity contribution received from our partner at the Tahoka onshore wind farm and lower receivables.
This was partly offset by a lower release of funds tied up in work in progress, mainly due to prepayments and milestone payments received from partners in Q4 2017 at Walney Extension and Borkum Riffgrund 2 and high construction activity at Hornsea 1 in Q4 2018.
Gross investments and divestmentsGross investments amounted to DKK 14.9 billion in Q4 2018, of which DKK 9.6 billion related to the acquisitions of Deepwater Wind and Lincoln Clean Energy. The other main investments related to Hornsea 1, Borssele 1 & 2, Lockett and early investments in the US to qualify for future tax credits.
Divestments amounted to DKK 18.7 billion in Q4 2018 and related mainly to the 50% farm-down of Hornsea 1.
Financial performance, DKKm Q4 2018 Q4 2017 %
Revenue 23,527 15,598 51%
EBITDA 19,206 13,032 47%
EBIT 18,112 10,970 65%
Profit (loss) before tax 18,038 10,349 74%
Tax (2,878) (999) 188%
Profit (loss) for the period from continuing operations 15,160 9,350 62%
Profit (loss) for the period from discontinued operations 34 79 (57%)
Profit (loss) for the period 15,194 9,429 61%
Cash flows and net debt, DKKm Q4 2018 Q4 2017 %
Cash flows from operating activites 7,565 3,078 146%
EBITDA 19,206 13,032 47%
Financial instruments (658) 470 n.a.
Change in provisions (122) 461 n.a.
Reversal of gain (loss) on sale of assets (15,085) (9,468) 59%
Other items 209 333 (37%)
Interest expenses, net 244 (136) n.a.
Paid tax (264) (2,652) (90%)
Change in work in progress 723 2,262 (68%)
Change in tax equity liabilities 1,835 - n.a.
Change in other working capital 1,477 (1,224) n.a.
Gross investments (14,916) (5,805) 157%
Divestments 18,749 14,875 26%
Free cash flow 11,398 12,148 (6%)
Net debt, beginning of period 8,957 10,260 (13%)
Free cash flow from continuing operations (11,398) (12,148) (6%)
Free cash flow from discontinued operations (337) (289) 17%
Interest-bearing receivables re Oil & Gas divestment 316 (1,014) n.a.
Dividends and hybrid coupon paid 238 211 13%
Exchange rate adjustments, etc. 5 1,463 (100%)
Net debt, end of period (2,219) (1,517) 46%
Fourth quarter
Ørsted Annual report 2018 Management’s review Results
36 / 193
Contents

Financial performance – business units
OffshorePower generation was up 14% in Q4 2017 due to ramp-up of generation at Walney Extension and Borkum Riffgrund 2.
Revenue totalled DKK 10.7 billion in Q4 2018 against DKK 5.6 billion in Q4 2017. The increase was driven by revenue from wind farms in opera- tion, which was up 15% as a result of increased power generation, and an increase in revenue from construction agreements due to the partial divestment of the Hornsea 1 transmission assets.
EBITDA was up 49%, totalling DKK 18.8 billion in Q4 2018 compared with DKK 12.6 billion in Q4 2017.
Earnings from offshore wind farms in operation increased by 26% as a result of the commis-sioning of new offshore wind farms. Earnings from partnership agreements increased by DKK 5.4 billion and related primarily to the farm-down of Hornsea 1 in Q4 2018 compared to the farm-downs of 50% of Walney Extension and Borkum Riffgrund 2 in Q4 2017.
EBITDA from other activities totalled DKK -0.7 billion in Q4 2018, which was in line with the same period last year, and related primarily to project development costs.
Cash flows from operating activities totalled DKK 3.6 billion in Q4 2018 in line with Q4 2017. Release of funds tied up in work in progress contributed more positively in Q4 2017, where prepayments and milestone payments were received from partners at Walney Extension and Borkum Riffgrund 2. This was partially offset by lower paid taxes in Q4 2018.
OnshoreFor Onshore, the quarterly and full-year results are identical. See page 46.
BioenergyRevenue was DKK 1.9 billion in Q4 2018 against DKK 1.8 billion in Q4 2017. The increase was due to higher power prices which led to higher income despite lower power generation in Q4 2018. Revenue from heat generation remained unchanged.
EBITDA was at the same level as the year before and amounted to DKK 0.2 billion.
Customer SolutionsRevenue amounted to DKK 12.9 billion in Q4 2018 compared with 10.4 billion in Q4 2017. The increase was mainly due to higher gas and UK power prices.
EBITDA was at the same level as Q4 2017 and amounted to DKK 0.2 billion.
EBITDA from Markets decreased by DKK 0.5 billion, primarily due to an increase in the value of gas at storages in Q4 2017 compared to a loss in Q4 2018, where the gas prices decreased during December.
EBITDA from our LNG activities increased by DKK 0.5 billion, mainly as a result of provisions in Q4 2017 related to the onerous contract at the Gate terminal in Rotterdam as well as provisions regarding purchase contracts.
Cash flows from operating activities totalled DKK 0.7 billion in Q4 2018, DKK 0.5 billion higher than in Q4 2017. The positive effect was mainly due to lower receivables in Q4 2018 and lower paid taxes.
Offshore’s results, DKKm Q4 2018 Q4 2017 %
Revenue 10,716 5,558 93%
Sites, O&M and PPA 4,415 3,848 15%
Construction agreements 6,271 1,678 274%
Other 30 32 (6%)
EBITDA 18,791 12,591 49%
Sites, O&M and PPA 4,053 3,226 26%
Construction agreements and divestment gains 15,413 10,033 54%
Other, incl. project development (675) (668) 1%
Cash flows from operating activities 3,572 3,590 (1%)
Free cash flow 15,253 13,417 14%
Bioenergy’s results, DKKm Q4 2018 Q4 2017 %
Revenue 1,926 1,788 8%
Heat 892 850 5%
Power incl. ancillary services 1,034 938 10%
EBITDA 203 240 (15%)
Heat 245 235 4%
Ancillary services 133 122 9%
Power (175) (117) 50%
Cash flows from operating activities 982 600 64%
Free cash flow 579 147 294%
Customer Solutions’ results, DKKm Q4 2018 Q4 2017 %
Revenue 12,917 10,396 24%
EBITDA 156 179 (13%)
Distribution 299 172 74%
Sales (72) 21 n.a.
Markets 57 575 (90%)
LNG (128) (589) (78%)
Cash flows from operating activities 745 214 248%
Free cash flow 146 (71) n.a.
For more details on quarterly figures for our
business units, please go to orsted.com/
financial-reports
Ørsted Annual report 2018 Management’s review Results
37 / 193
Contents

Quarterly summary, 2017-2018Income statement (business performance), DKKm Q4 2018 Q3 2018 Q2 2018 Q1 2018 Q4 2017 Q3 2017 Q2 2017 Q1 2017Revenue 23,527 15,018 18,593 19,808 15,598 11,869 15,540 16,497EBITDA 19,206 2,225 3,079 5,519 13,032 1,757 4,442 3,288
Offshore 18,791 1,972 3,090 3,956 12,591 1,674 4,191 2,139Onshore 44 - - - - - - -Bioenergy 203 (204) (71) 439 240 (142) (153) 207Customer Solutions 156 478 122 1,214 179 202 516 1,185Other activities 12 (21) (62) (90) 22 23 (112) (243)
Depreciation and amortisation (1,697) (1,437) (1,462) (1,382) (1,517) (1,385) (1,541) (1,296)Impairment losses 603 - - - (545) - - -Operating profit (loss) (EBIT) 18,112 788 1,617 4,137 10,970 372 2,901 1,992Gain (loss) on divestment of enterprises (28) 181 (16) (10) (14) (108) (6) (11)Net financial income and expenses (43) (436) (504) (295) (649) 22 (81) (334)Profit (loss) from associates and joint ventures (3) 2 4 (2) 42 (7) (2) (43)Profit (loss) before tax 18,038 535 1,101 3,830 10,349 279 2,812 1,604Tax (2,878) (117) (225) (798) (999) (70) (306) (390)Profit (loss) for the period from continuing operations 15,160 418 876 3,032 9,350 209 2,506 1,214Profit (loss) for the period from discontinued operations 34 (13) (19) 8 79 2,931 2,484 1,426Profit (loss) for the period 15,194 405 857 3,040 9,429 3,140 4,990 2,640Balance sheetAssets 174,575 150,909 149,149 147,739 146,521 126,190 133,550 132,030Total equity 85,115 68,701 69,744 70,823 71,837 64,203 62,160 58,112
Shareholders of Ørsted A/S 68,488 52,029 52,884 53,861 54,791 47,050 43,990 39,828Non-controlling interests 3,388 3,433 3,621 3,723 3,807 3,905 4,922 5,036Hybrid capital 13,239 13,239 13,239 13,239 13,239 13,248 13,248 13,248
Interest-bearing net debt (2,219) 8,957 4,603 4,331 (1,517) 10,260 10,332 6,523Capital employed 82,896 77,658 74,347 75,154 70,320 74,462 72,491 64,635Additions to property, plant and equipment 4,575 2,942 3,137 3,782 7,137 4,795 5,475 2,615Cash flowsCash flows from operating activities 7,565 (117) 3,293 (398) 3,078 (1,095) (1,848) 888Gross investments (14,916) (4,385) (3,109) (2,071) (5,805) (5,150) (4,287) (2,502)Divestments 18,749 380 (14) 835 14,875 1,882 160 65Free cash flow 11,398 (4,122) 170 (1,634) 12,148 (4,363) (5,975) (1,549)Financial ratiosReturn on capital employed (ROCE)1,5, % 32.1 23.0 23.5 26.7 25.2 15.0 18.4 17.4FFO/Adjusted net debt2,5, % 69.0 41.7 44.3 45.6 50.3 26.5 32.0 34.2Number of outstanding shares, end of period, ’000 420,045 420,155 420,155 420,155 420,155 420,155 420,155 420,155Share price, end of period, DKK 435.7 436.3 386.0 392.0 338.7 360.4 293.9 268.9Market capitalisation, end of period, DKKbn 183.0 183.3 162.3 164.7 142.3 151.5 123.5 113.0Earnings per share (EPS) (BP), DKK 35.6 1.1 1.4 7.2 21.7 7.1 11.2 6.4Income statement (IFRS)Revenue 26,165 12,798 16,859 19,698 14,711 11,647 15,925 17,426EBITDA 20,914 567 1,725 5,285 12,311 1,643 4,777 3,843Profit (loss) for the period from continuing operations 16,472 (875) (180) 2,849 8,787 120 2,765 1,649
Business performance vs. IFRSBusiness performance represents the underlying financial performance of the Group in the reporting period as results are adjusted for temporary fluctuations in the market value of contracts (including hedging transac-tions) relating to other periods. Apart from this, there is no difference between business performance and IFRS results. Read more in note 1.6.
ROCE is calculated for continuing operations.
1) EBIT/average capital employed. 2) Net debt, including 50% of hybrid capital, cash and
securities not available for use (with the exception of repo transactions), present value of lease obligations, and decommissioning obligations less deferred tax.
3) See definition on page 192 and in the ESG statements. 4) The figures indicate values from the latest regulatory
financial statements (updated in June). 5) Last 12 months.
Business drivers Q4 2018 Q3 2018 Q2 2018 Q1 2018 Q4 2017 Q3 2017 Q2 2017 Q1 2017OffshoreDecided (FID) and installed capacity3, GW 9.0 8.9 8.9 8.9 8.9 8.9 7.5 7.4Installed capacity3, GW 5.6 5.1 5.1 4.4 3.9 3.8 3.8 3.6Generation capacity3, GW 3.0 2.9 2.8 2.7 2.5 2.3 2.2 2.1Wind speed3, m/s 10.3 7.7 7.9 10.3 11.0 7.9 8.5 9.9Load factor3, % 53 32 31 55 54 34 38 50Availibility3, % 93 92 93 94 92 92 93 93Power generation, TWh 3.3 1.9 1.8 3.0 2.9 1.7 1.8 2.1OnshoreInstalled capacity, onshore wind, GW 0.8 - - - - - - -Wind speed3, m/s 7.3 - - - - - - -Load factor3, % 41 - - - - - - -Availibility3, % 92 - - - - - - -Power generation, TWh 0.6 - - - - - - -BioenergyDegree days3, number 884 76 149 1,417 895 115 451 1,244Heat generation, TWh 2.8 0.3 0.9 4.8 2.8 0.7 1.3 4.2Power generation, TWh 1.8 0.7 0.9 3.3 2.3 1.2 1.5 3.2Customer SolutionsRegulatory value of power distribution assets4 10,957 10,957 10,957 10,623 10,623 10,623 10,623 10,648Power distribution, TWh 2.3 1.8 1.9 2.4 2.2 1.9 2.0 2.3Power sales, TWh 10.4 6.6 6.8 11.5 10.6 8.2 8.8 10.1Gas sales, TWh 26.0 31.5 34.1 42.5 36.9 29.4 28.3 41.5People and environmentEmployees, end of period, number 6,080 5,882 5,741 5,662 5,638 5,641 5,802 5,787Total recordable injury rate (TRIR)5 4.7 5.0 6.2 6.7 6.4 6.7 6.5 6.4Fatalities, number 0 0 0 0 0 0 0 0Green share of heat and power generation, % 83 71 80 68 76 60 64 56Carbon emissions, g CO2e/kWh 87 212 123 147 106 203 150 170
Ørsted Annual report 2018 Management’s review Results
38 / 193
Contents

Business units
Our business units 40Offshore 41Onshore 46Bioenergy 49Customer Solutions 52
Ørsted Annual report 2018 Contents
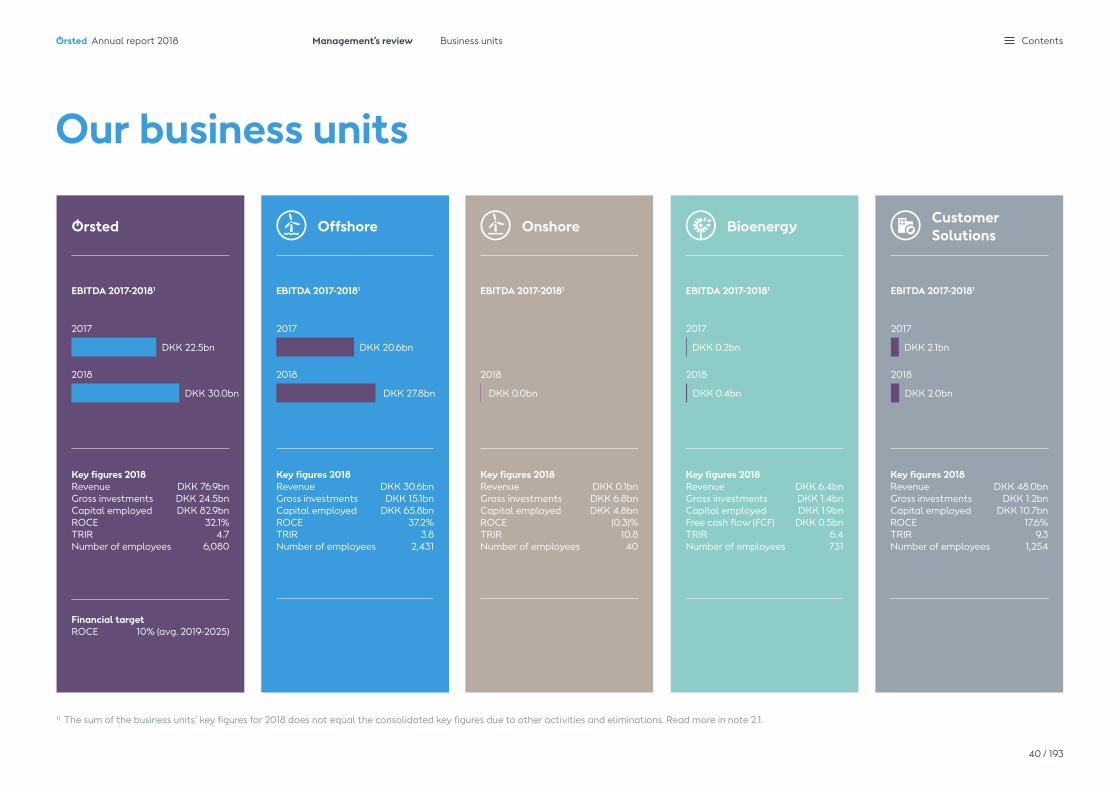
Our business units
Key figures 2018Revenue DKK 30.6bnGross investments DKK 15.1bnCapital employed DKK 65.8bnROCE 37.2%TRIR 3.8Number of employees 2,431
Key figures 2018Revenue DKK 0.1bnGross investments DKK 6.8bnCapital employed DKK 4.8bnROCE (0.3)%TRIR 10.8Number of employees 40
1) The sum of the business units’ key figures for 2018 does not equal the consolidated key figures due to other activities and eliminations. Read more in note 2.1.
Key figures 2018Revenue DKK 6.4bnGross investments DKK 1.4bnCapital employed DKK 1.9bnFree cash flow (FCF) DKK 0.5bnTRIR 6.4Number of employees 731
Key figures 2018Revenue DKK 48.0bnGross investments DKK 1.2bnCapital employed DKK 10.7bnROCE 17.6%TRIR 9.3Number of employees 1,254
BioenergyOffshore Onshore Customer Solutions
EBITDA 2017-20181 EBITDA 2017-20181 EBITDA 2017-20181 EBITDA 2017-20181
DKK 20.6bn DKK 0.2bn DKK 2.1bn
DKK 27.8bn DKK 0.0bn DKK 0.4bn DKK 2.0bn
2017 2017 2017
2018 2018 2018 2018
Ørsted
EBITDA 2017-20181
Key figures 2018Revenue DKK 76.9bnGross investments DKK 24.5bnCapital employed DKK 82.9bnROCE 32.1%TRIR 4.7Number of employees 6,080
Financial targetROCE 10% (avg. 2019-2025)
DKK 22.5bn
DKK 30.0bn
2017
2018
Ørsted Annual report 2018 Management’s review Business units
40 / 193
Contents

Highlights 2018
— We inaugurated the Race Bank and Walney Extension offshore wind farms.
— Borkum Riffgrund 2 was commissioned by the end of 2018, ahead of schedule.
— We divested 50% of the 1,218MW Hornsea 1 offshore wind farm in the UK to Global Infrastructure Partners.
— We were awarded two offshore wind farm projects in Germany with a total capacity of 552MW, one of which was won with a zero-subsidy bid.
— We were awarded 900MW grid capacity in Taiwan’s first offshore wind grid alloca-tion process and an additional 920MW in the country’s first offshore wind auction, resulting in a total build-out pipeline in Changhua of 1,820MW.
— We acquired Deepwater Wind and created a leading US offshore wind platform.
— In the US, we were awarded an additional 104MW in December in the clean energy auction in Connecticut.
— Application criteria were fulfilled for further development of the Race Bank Extension offshore wind farm.
Financial performancePower generation increased by 20% relative to 2017, primarily due to the ramp-up of gener-ation from Race Bank, Walney Extension and Borkum Riffgrund 2. We commissioned Race Bank in January, Walney Extension in May and Borkum Riffgrund 2 in December 2018.
Wind speeds were 2% lower than in 2017 and amounted to a portfolio average of 9.1m/s,which was in line with a normal wind year. The availability of 93% was at the same level as the year before.
Revenue increased by 50% to DKK 30.6 billion. Revenue from offshore wind farms in opera-tion increased by 23% due to the above- mentioned ramp-up from new offshore wind farms. Revenue from construction agreements increased by DKK 7.8 billion due to high activity on construction of the Borkum Riff-grund 2 and Walney Extension offshore wind farms for partners as well as the divestment of the Burbo Bank Extension transmission asset and a partial divestment of the Hornsea 1 transmission assets as part of the 50% farm-down of Hornsea 1. Following the implemen-tation of IFRS 15, revenue from construction of transmission assets are recognised at the time of divestment.
Offshore
EBITDA increased by 35%.
Performance highlights 2018 2017 %Business driversDecided (FID) and installed capacity GW 9.0 8.9 1%Installed capacity GW 5.6 3.9 44%Generation capacity GW 3.0 2.5 20%Wind speed m/s 9.1 9.3 (2%)Load factor % 42 44 (2%p)Availability % 93 93 0%pPower generation TWh 10.0 8.5 18%
Denmark 2.2 2.5 (12%)United Kingdom 6.1 4.5 36%Germany 1.7 1.5 13%
Power price, LEBA UK GBP/MWh 57.9 46.0 26%British pounds DKK/GBP 8.4 8.5 (1%)Financial performanceRevenue DKKm 30,566 20,352 50%
Sites, O&M and PPA 13,918 11,319 23%Construction agreements 16,560 8,734 90%Other 88 299 (71%)
EBITDA DKKm 27,809 20,595 35%Sites, O&M and PPA 11,042 8,529 29%Construction agreements and divestment gains 18,765 13,667 37%Other, incl. project development (1,998) (1,601) 25%
Depreciation DKKm (4,456) (4,080) 9%Impairment losses DKKm 0 (545) n.a.EBIT DKKm 23,353 15,970 46%
Cash flows from operating activities DKKm 5,814 3,353 73%
Gross investments DKKm (15,081) (15,462) (2%)
Divestments DKKm 19,676 16,737 18%
Free cash flow DKKm 10,409 4,628 125%
Capital employed DKKm 65,846 59,652 10%
ROCE % 37.2 28.4 8.8%p
Ørsted Annual report 2018 Management’s review Business units
41 / 193
Contents

10.39.9
Quarterly and annual wind speed for our offshore wind farms, m/s
2015 2016 2017 2018 Normal wind year
Q2
7.98.5
Q3
7.77.9
FYQ1 Q4
10.311.0
8.99.7 9.3 9.1
EBITDA increased by 35% relative to 2017.
EBITDA from sites, O&Ms and PPAs amounted to DKK 11.0 billion, up DKK 2.5 billion com-pared to 2017. The increase was driven by the factors mentioned above.
EBITDA from construction agreements was DKK 5.1 billion higher than in 2017, amounting to DKK 18.8 billion in 2018. The total gain from the farm-down of Hornsea 1 (DKK 15.1 billion) as well as a high level of activity related to the construction of Walney Extension and Borkum Riffgrund 2 for partners contributed positively in 2018. In 2017, EBITDA was positively affected
The wind speed indicates how many
metres per second the wind has blown in the areas where we have
offshore wind farms. The weighting is based on
our generation capacity.
by the farm-down of Walney Extension (DKK 7.5 billion) and Borkum Riff grund 2 (DKK 2.2 billion), construction progress on Race Bank and completion of Burbo Bank Extension and Gode Wind 1 & 2 as well as the recognition of a deferred farm-down gain on Race Bank.
EBITDA from other activities amounted to DKK -2.0 billion against DKK -1.6 billion in 2017. The decrease of DKK 0.4 billion was mainly due to higher project development costs.
Depreciation increased by 9% due to the commissioning of new offshore wind farms in the UK and Germany.
Introduction to Offshore
— We are active in all parts of the value chain and develop, construct, own and operate offshore wind farms in Denmark, the UK, Germany, the Netherlands, the US and Taiwan.
— We have been pioneers in the industry since we built the world’s first offshore wind farm in 1991, and we have established ourselves as the market leader within global offshore wind power generation with 25+ years of experi-ence, 26 offshore wind farms in operation and presently three offshore wind farms under construction.
— Worldwide, we are the company that has constructed most offshore wind farms with a total installed capacity of 5.6GW, which has provided us with an unparalleled experience. Our integrated EPC organisation has a strong
track record of delivering projects on time and on budget and can construct multiple large-scale wind farms in parallel across regions.
— With 3.4GW currently under construction, we have the largest market share with approx 30% of the total global capacity.
— Our total installed capacity of 5.6GW covers more than 12 million people’s annual power consumption with carbon-free electricity.
— By 2020, we will have expanded our installed offshore wind capacity to 7.6GW, and we aim for a capacity of 15GW in 2025.
Cash flows from operating activities amount-ed to DKK 5.8 billion in 2018 compared to DKK 3.4 billion in 2017. The increase was due to the higher EBITDA (adjusted for farm-down gains), a lower increase in funds tied up in construction of offshore wind farms for partners and a VAT refund. This was partly offset by higher paid taxes. Paid taxes in 2018 were significantly higher than in 2017, mainly due to taxation of construction agreement gains in the year of commissioning (Race Bank, Walney Extension and Borkum Riffgrund 2 in 2018 compared to Burbo Bank Extension in 2017) as well as higher earnings from offshore wind farms in operation.
In 2018, funds tied up in work in progress increased by DKK 2.3 billion and primarily related to the construction of Borkum Riffgrund 2 and Walney Extension as well as the offshore transmission assets at Hornsea 1 and Hornsea 2. This was partly offset by milestone payments from partners related to the construction of Race Bank, Walney Extension, Borkum Riffgrund 2 and Hornsea 1 and the divestment of the Burbo Bank Extension transmission asset.
Ørsted Annual report 2018 Management’s review Business units
42 / 193
Contents

Gross investments amounted to DKK 15.1 billion in 2018, of which the acquisition of Deepwater Wind amounted to DKK 4.0 billion (including acquired debt and excluding DKK 0.7 to be paid in 2019). The largest invest-ments related to the construction of Hornsea 1, Borkum Riffgrund 2, Borssele 1 & 2, Walney Extension and early investments in the US to qualify for future tax credits.
Cash flows from divestments in 2018 related to the 50% farm-down of Hornsea 1 and receipt of deferred proceeds from the farm-down of 50% of Walney Extension in 2017.
ROCE increased by 9 percentage points to 37% and was in both periods impacted by gains from farm-downs – Hornsea 1 in 2018 and Walney Extension and Borkum Riffgrund 2 in 2017.
Strategy follow-up
Offshore wind is our core business, and we will continue pioneering and innovating the industry. It is a rapidly growing market in the global energy system with attractive value creation opportunities, and we will maintain our global market leadership in offshore wind and continue the expansion in Europe, North America and Asia Pacific.
Offshore’s strategic focus is to:— maintain our market leadership in
offshore wind with a targeted capacity of 15GW in 2025
— continue to pioneer new markets and develop a global business
— continue to reduce the cost of electricity— implement operational excellence and
innovation and digitalisation initiatives across the business
— leverage our market-leading partnership model.
Maintain our market leadership in offshore wind with a targeted capacity of 15GW in 2025In 2018, we commissioned Race Bank and Walney Extension in the UK and Borkum Riff-grund 2 in Germany. Walney Extension is cur-rently the world’s largest offshore wind farm and was delivered well ahead of schedule and below budget before summer. Together, the three wind farms added approx 1.7GW to our installed capacity, and we have now installed 5.6GW of offshore wind capacity.
All of our current construction projects are progressing according to plan. In January 2018, offshore construction began at Hornsea 1, and
we expect commissioning in late 2019. At Borssele 1 & 2, the procurement phase is com-pleted with main contracts well within budget, and construction work for the O&M building started in December 2018. For the Hornsea 2 project, we have selected Siemens Gamesa Renewable Energy as exclusive supplier of wind turbines, and recently we passed the first 12-month milestone delivery requirement un-der the contracts for difference (CfD) scheme. When Hornsea 2 is commissioned in 2022, we will have 9.0GW of capacity installed.
In addition to these three wind farms, we are also constructing the 12MW Coastal Virginia demonstration project in the US on behalf of our partner Dominion Energy. Further, a final investment decision has been taken on phase 2 of the Formosa 1 project in Taiwan, in which we have a 35% ownership share. After receiving the construction permit in Septem-ber, manufacturing and preparation for the construction phase of the 120MW wind farm have commenced.
In April, the results of the second German transitional auction for offshore wind were announced, and we were awarded the right to build Borkum Riffgrund West 1 and Gode Wind 4 in the German North Sea. Borkum Riffgrund West 1 was won with a zero-subsidy bid, while Gode Wind 4 was won at a price of EUR 98.3 per MWh. The two offshore wind farms have a total capacity of 552MW, which, together with the three projects awarded in April 2017, gives us an option of 1,142MW new offshore wind capacity in Germany for com-missioning in 2024/2025, subject to us taking final investment decision, expectedly in 2021.
Also in April, following a thorough and com-prehensive grid allocation process, Taiwan’s Ministry of Economic Affairs awarded us 900MW grid capacity for our Greater Changhua offshore wind farms. In June, following Taiwan’s first and highly competitive auction process, we were awarded an addi-tional 920MW of grid capacity for our Greater Changhua projects. Overall, we now have a total offshore wind pipeline in Changhua of 1,820MW.
On 30 January 2019, the 2019 feed-in tariff was announced. We take note of the 6% tariff reduction compared to the 2018 tariff as well as the introduction of a cap on annual full-load hours, and we will now collaborate closely with the supply chain to mitigate the adverse impact of these PPA changes with the objective of making the projects investable.
Greater Changhua 1 & 2a are facing extraor-dinarily high costs related to creating a local supply chain at scale, reinforcing the onshore grid infrastructure and building, operating and maintaining offshore wind farms in challenging site and weather conditions.
We continue to work with the Taiwanese authorities and local stakeholders to reach key outstanding project milestones, such as obtaining the establishment permit, com-pleting the supply chain plan and signing the power purchase agreement.
Once we have clarity on the outcome of supply contract renegotiations and have achieved all key project milestones, Ørsted’s Board of Directors will review and decide on the final investment case.
Ørsted Annual report 2018 Management’s review Business units
43 / 193
Contents
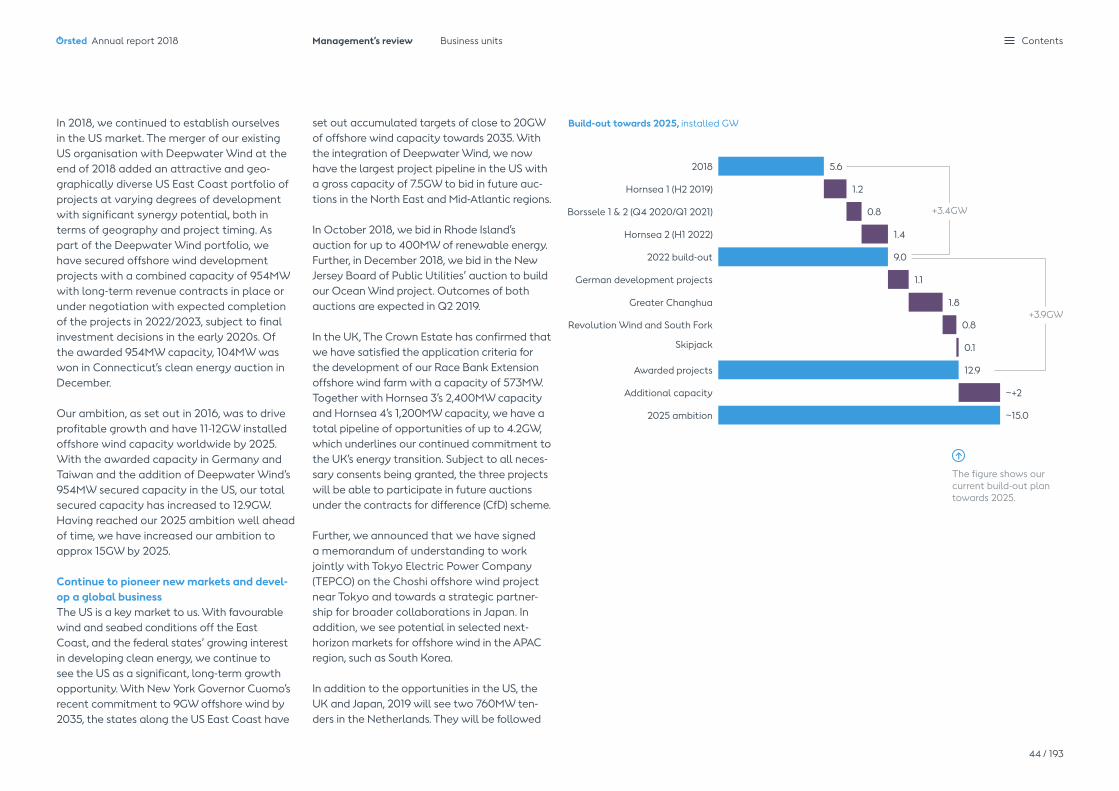
Build-out towards 2025, installed GW
9.0
1.1
1.8
0.8
~+2
12.9
0.1
~15.0
Revolution Wind and South Fork
Skipjack
Additional capacity
Awarded projects
2025 ambition
Greater Changhua
German development projects
2022 build-out
+3.9GW
5.6
1.2
0.8
1.4Hornsea 2 (H1 2022)
Borssele 1 & 2 (Q4 2020/Q1 2021)
Hornsea 1 (H2 2019)
2018
+3.4GW
In 2018, we continued to establish ourselves in the US market. The merger of our existing US organisation with Deepwater Wind at the end of 2018 added an attractive and geo-graphically diverse US East Coast portfolio of projects at varying degrees of development with significant synergy potential, both in terms of geography and project timing. As part of the Deepwater Wind portfolio, we have secured offshore wind development projects with a combined capacity of 954MW with long-term revenue contracts in place or under negotiation with expected completion of the projects in 2022/2023, subject to final investment decisions in the early 2020s. Of the awarded 954MW capacity, 104MW was won in Connecticut’s clean energy auction in December.
Our ambition, as set out in 2016, was to drive profitable growth and have 11-12GW installed offshore wind capacity worldwide by 2025. With the awarded capacity in Germany and Taiwan and the addition of Deepwater Wind’s 954MW secured capacity in the US, our total secured capacity has increased to 12.9GW. Having reached our 2025 ambition well ahead of time, we have increased our ambition to approx 15GW by 2025.
Continue to pioneer new markets and devel-op a global businessThe US is a key market to us. With favourable wind and seabed conditions off the East Coast, and the federal states’ growing interest in developing clean energy, we continue to see the US as a significant, long-term growth opportunity. With New York Governor Cuomo’s recent commitment to 9GW offshore wind by 2035, the states along the US East Coast have
set out accumulated targets of close to 20GW of offshore wind capacity towards 2035. With the integration of Deepwater Wind, we now have the largest project pipeline in the US with a gross capacity of 7.5GW to bid in future auc-tions in the North East and Mid-Atlantic regions.
In October 2018, we bid in Rhode Island’s auction for up to 400MW of renewable energy. Further, in December 2018, we bid in the New Jersey Board of Public Utilities’ auction to build our Ocean Wind project. Outcomes of both auctions are expected in Q2 2019.
In the UK, The Crown Estate has confirmed that we have satisfied the application criteria for the development of our Race Bank Extension offshore wind farm with a capacity of 573MW. Together with Hornsea 3’s 2,400MW capacity and Hornsea 4’s 1,200MW capacity, we have a total pipeline of opportunities of up to 4.2GW, which underlines our continued commitment to the UK’s energy transition. Subject to all neces-sary consents being granted, the three projects will be able to participate in future auctions under the contracts for difference (CfD) scheme.
Further, we announced that we have signed a memorandum of understanding to work jointly with Tokyo Electric Power Company (TEPCO) on the Choshi offshore wind project near Tokyo and towards a strategic partner-ship for broader collaborations in Japan. In addition, we see potential in selected next-horizon markets for offshore wind in the APAC region, such as South Korea.
In addition to the opportunities in the US, the UK and Japan, 2019 will see two 760MW ten-ders in the Netherlands. They will be followed
The figure shows our current build-out plan towards 2025.
Ørsted Annual report 2018 Management’s review Business units
44 / 193
Contents
by additional 760MW tenders in 2020 and 2021, respectively. In 2020-2021, we will see the first of three 800MW tenders in Denmark, and in 2021, we expect a tender of approx 700MW in Belgium and the first central tender in Germany.
Continue to reduce the cost of electricityLevelised cost of electricity (LCoE) has de-creased substantially since the first large-scale wind farms were constructed, and costs are continuously being reduced across the indus-try by means of increasing levels of industri-alisation, economies of scale and innovation. At Ørsted, we strive to deliver continuous reductions in LCoE through a systematic, institutionalised approach.
Implement operational excellence and innovation and digitalisation initiatives across the businessSince its infancy, we have played a key role in developing offshore wind energy into a fully matured industry and globally, we are the company that has constructed most offshore wind farms. Our integrated EPC organisation possesses a complete set of strong inhouse engineering, procurement and construction capabilities which set us apart from our peers. An example of our approach to innovation is how we continue to work with turbine suppliers to be first movers in bringing new technology to the offshore wind market. Another example is foundations, where we continue to optimise steel design and design tools. At Borkum Riffgrund 2 and Hornsea 1, grouted connections between the monopile and the transition piece were replaced by bolted connections, leading to large cost reductions on supply and the possibility for all-year installation.
We are the largest offshore wind operator globally with approx 1,100 wind turbines in op-eration. Our operational portfolio is growing which provides substantial scale benefits, but at the same time fleet complexity remains low, currently with five different turbine plat-forms from two original equipment manufac-turers only, which allows for deep technical insights.
The share of turbines we operate ourselves is increasing, improving our ability to drive stan- dardisation and performance improvements as well as implement digital solutions, reduce service hours and increase power generation from turbines. An example of our approach to innovation and digitalisation is how we utilise the vast amounts of data captured from each turbine we have in operation. Through state-of-the-art data analytics, we are able to continuously improve processes leading to an uplift in power generation and reduced lifetime maintenance costs.
In terms of operational excellence, we have implemented regional hub structures across the portfolio to reap full-scale and synergy benefits from clusters. Today, we operate two hubs in the UK and one hub in Germany, each with a capacity of 1-2GW. An example of hub benefits includes having a regional support organisation, allowing for standardisation of processes and activities leading to perfor-mance optimisation across a region instead of a single-site focus.
Also, a growing cluster capacity allows for investment in better logistics, e.g. in the form of joint facilities and vessel operations.
Leverage our market-leading partnership modelIn 2018, our market-leading partnership model yet again proved its value through the 50% farm-down of the 1,218MW offshore wind farm Hornsea 1 to Global Infrastructure Partners (GIP). This is our third partnership with GIP, which also owns 50% of our German offshore wind farms Gode Wind 1 and Borkum Riff-grund 2. Hornsea 1 is under construction and will by far be the world’s largest offshore wind farm when commissioned by the end of 2019.
In the Taiwanese market, which is still new to the offshore wind industry, we see an advan-tage in establishing partnerships, particularly with local investor involvement, to combine our international experience with local expertise. Subject to a FID, we will look into the possibility of farming down a 50% interest in the 605MW Greater Changhua 1 project to local and international partners.
In the US, we will also consider diversifying risks by either partnering with domestic utili-ties or potentially farming down on projects to reduce single-asset exposure.
Ørsted Annual report 2018 Management’s review Business units
45 / 193
Contents

OnshoreHighlights 2018
— We acquired Lincoln Clean Energy (LCE) in October.
— We commissioned the 300MW Tahoka wind farm in Texas in December.
— We took FID on the 184MW Lockett wind farm.
— We secured PPAs for our near-term onshore portfolio projects Sage Draw (250MW) and Plum Creek (additional 104MW) and our first large-scale solar PV project Permian Solar (250MW).
— Our first 20MW battery storage project, Carnegie Road, in the UK is now in operation.
Financial performance This sections covers Q4 2018, as we acquired LCE and established the Onshore business unit on 1 October.
Power generation amounted to 552GWh in 2018, of which our Amazon and Willow Springs wind farms accounted for most of the generation. Power generation from newly commissioned Tahoka had a limited impact in 2018. Wind speed averaged 7.3m/s, which was slightly lower than in a normal wind year in Texas.
Revenue from wind farms in operation amounted to DKK 80 million, of which the ma-jority came from Amazon and Willow Springs.
Introduction to Onshore
— The acquisition of Lincoln Clean Energy has provided a strong onshore renewables growth platform in the US, which is one of our strate-gic growth markets.
— We are active in the value chain as a develop-er, owner and operator, with a lean execution and asset management business model.
— We are able to deliver wind, solar PV and battery solutions and thereby shape the generation profile to customer demand.
— Our total installed capacity of 813MW com-prises three operating wind farms in Texas and a small solar project in New Jersey. In addition, our near-term portfolio includes three onshore wind farms with a total capacity of 714MW to be constructed by 2020.
— It is our ambition to realise an additional 1GW through 2022 in the US onshore renewable market. We are pursuing a portfolio of region-ally diversified projects across the ERCOT, SPP and MISO markets.
Performance highlights 2018
Business drivers
Decided (FID) and installed capacity MW 997
Installed capacity MW 813
Wind speed m/s 7.3
Load factor % 41
Availability % 92
Power generation GWh 552
Net realised price USD/MWh 17.4
US dollars DKK/USD 6.5
Financial performance
Revenue DKKm 80
EBITDA DKKm 44
Sites 40
Production tax credits and tax attributes 85
Other, including project development (81)
Depreciation DKKm (51)
EBIT DKKm (7)
Cash flows from operating activities DKKm 1,868
Gross investments DKKm (1,143)
Acquisitions DKKm (5,636)
Divestments DKKm 1
Free cash flow DKKm (4,910)
Capital employed DKKm 4,779
ROCE % (0.3)
There are no compa-rable figures as the
Onshore business unit was established in 2018.
Ørsted Annual report 2018 Management’s review Business units
46 / 193
Contents

EBITDA from onshore wind farms in operation amounted to DKK 40 million, and production tax credits (PTCs) contributed with DKK 85 million.
Project development and other costs amount-ed to DKK -81 million.
Cash flows from operating activities amounted to DKK 1.9 billion, which primarily comprised a tax equity contribution from our partner at the Tahoka wind farm in Texas in December.
Gross investments amounted to DKK 6.8 billion, of which DKK 5.6 billion was the acquisition price paid for Lincoln Clean Energy (including acquired debt). The largest invest-ments related to the Tahoka and Lockett wind farms.
Strategy follow-up
By acquiring Lincoln Clean Energy (LCE) in October 2018, we established a strong and scalable platform for the US onshore market, which is expected to grow significantly in the coming years. Our aim is to create a leading North American company within renewable energy, including onshore wind, solar energy, and energy storage. Onshore wind is expected to be the key growth platform and provide strategic diversification to Ørsted’s portfolio.
As Onshore is a new business unit, an overall introduction is provided in the following sections:
— onshore wind farms, from development to owning and operating
— operational and near-term portfolio — pipeline, ambition and strategy — tax credits and tax equity partnerships.
Onshore wind farms, from development to owning and operating Large-scale onshore wind projects have certain similarities with the offshore wind development business, especially within EPC (e.g. turbine supply agreements and park lay-out) and O&M (e.g. performance analytics and predictive maintenance), however, the project risk profile is different. The development of an onshore wind farm takes two to three years and construction another 9 to 12 months compared to offshore wind projects which typically have significantly longer develop-ment and construction cycles.
We are present in the value chain as a devel-oper, owner and operator. As the US onshore
market has matured, industry standardisation has developed. We act as facilitator between project functions and select experienced industry partners with proven track records to perform construction activities. This model provides the ability to scale quickly and efficiently.
Typical development activities include preliminary site selection, assessment of wind resources and environmental impact, secur-ing real estate, transmission and congestion analyses, securing interconnection rights as well as local, state and federal permissions, offtake, etc.
Turbine selection is based on project-specific levelised cost of electricity (LCoE) analysis, taking into account installation cost, power generation and long-term O&M costs.
We seek to capitalise on continued technolog-ical advancement and increasing size of swept wind area.
Operational and near-term portfolio The geographic focus has been Texas, where all of our onshore wind farms in operation are situated. A small operational solar project is located in New Jersey.
Our current portfolio comprises three operat-ing wind farms, Willow Springs (250MW), Amazon (253MW) and Tahoka (300MW) as well as a solar PV asset (Oak, 10MW) with a to-tal capacity of 813MW. The operational wind portfolio is recently commissioned, supported by power offtake agreements for more than 650MW through long-term contracts with solid corporate and blue-chip partners.
Onshore wind overview
NORTHWEST
SOUTHWEST SOUTHEAST
In operation Under construction Under development
FRCC
PJM
NYISOISO-NEMISO
SPP
Sage Draw Willow SpringsAmazon
Lockett
Plum Creek
CAISO
Our near-term pipeline (2020 projects) includes three onshore wind farms (Lockett, Sage Draw and Plum Creek) with a total capacity of 714MW. We made final investment decision (FID) on Lockett in late 2018, and we expect it to reach commercial operation date (COD) in Q3 2019. At Plum Creek, we have secured more than 70% offtake and expect COD in 2020.
In November, we announced 500MW of wind and solar PPAs with ExxonMobil, equally divided between Sage Draw and the solar PV project Permian Solar, with expected COD dates of 2020 and 2021, respectively.
ERCOTTahoka
Ørsted Annual report 2018 Management’s review Business units
47 / 193
Contents

Build-out plan, installed MW
250
253
300
10
813
184
300
230
1,527
~1,000
~2,500
Operational by 2018
Oak (2011)
Tahoka (2018)
Amazon Wind Farm (2017)
Willow Springs (2017)
Total by 2020
Total by 2022
Plum Creek (2020)
Pipeline
Sage Draw (2020)
Lockett (2019)
Pipeline, ambition and strategy We expect to build on our solid operational and near-term portfolio and add up to 1GW of additional capacity by 2022, taking our total US capacity to 2.5GW. We are pursuing a port-folio of regionally diversified projects across the ERCOT, SPP and MISO markets, including:
— Greenfield onshore wind projects with an average size of 250-300MW and eligible for at least 60% PTC
— Greenfield solar PV opportunities (including Permian Solar), where opportunities arise via corporate and utility PPA partnerships.
Beyond the production tax credit (PTC) era, we are in a favourable position to meet demands for onshore wind power in the US by leveraging our value chain experience. Our growth will thus be driven by our ability to remain a significant market developer, pro-viding competitive LCoE levels. Our onshore development activities are focused on areas where large-scale opportunities with a high likelihood of success have been available, and where onshore wind LCoE is competitive with the alternatives on a pure LCoE basis.
Tax credits and tax equity partnerships Federal support for renewable energy is provided in the form of tax incentives, of which production tax credits (PTCs) dominate within onshore wind. PTCs are inflation-adjusted per kilowatt-hour (kWh) tax credits for power generated by eligible energy resources for the first ten years of operation. Projects eligible for 100% PTCs must have started construction by the end of 2016 and must be completed before the end of 2020, four years from qualifying.
Federal tax attributes constitute a significant component of overall project economics and have led to projects being able to offer long-term offtake prices to customers (e.g. PPAs with utilities or C&I customers) at a discount to merchant power price projections.
PTCs are currently being phased out with a linear decline by 20% per year until 2019, after which it expires. However, competitive LCoE projections of new built onshore wind and consumer demand drive significant growth expectations from the mid-2020s onward.
Our three operational wind farms and three near-term development projects are all eligi-ble for 100% PTCs, and they are expected to be commissioned before the end of 2019 and 2020, respectively. In addition, our pipeline of 1GW by 2022 is eligible for 60% PTCs.
Solar investment tax credits (ITCs) provide a direct credit based on a percentage of the eligible capital expenditures. Projects start-ing construction in 2019 receive the full ITC of 30%. During the next few years, the ITC percentage will gradually decline and end at 10% from 2021.
The tax attributes can only be utilised by a tax-paying entity. Since we are currently not in a tax-paying position in the US due to sig-nificant investments, we partner with investors who contribute capital to efficiently monetise the tax attributes. Upon achievement of com-mercial operations, these tax equity investors contribute a substantial portion of the total project investment.
Ørsted Annual report 2018 Management’s review Business units
48 / 193
Contents

Highlights 2018
— The High Court of Western Denmark and the Danish Appeals Permission Board ruled in favour of Ørsted in the case concerning the former Elsam.
— We commissioned the green gas facility ‘Kalundborg Bioenergi’, which transforms the organic waste of long-time corporate customers Novo Nordisk and Novozymes into green gas that is utilised in Novo Nordisk’s production.
— We divested our 50% ownership share in the Dutch gas-fired power plant Enecogen.
Financial performanceRevenue increased by DKK 0.5 billion to DKK 6.4 billion in 2018.
Power generation was 18% lower than in 2017, driven by the divestment of our Dutch power plant, and amounted to 6.7TWh. Power gener-ation from our Danish plants increased by 4% driven by higher spreads, while heat gener-ation decreased slightly by 2% to 8.8TWh in 2018 due to warmer weather.
Revenue from heat sales increased by 11% despite a decrease in heat generation. This was due to the bioconversion of the Skærbæk Power Station as well as higher revenue from the Avedøre Power Station due to ramp-up in Q1 2017 following the bioconversion in December 2016. Revenue from power and ancillary services increased by 6% to DKK 3.5 billion, driven by an increase of 45% in power prices compared to last year. This more than offset the 18% decrease in generation due to the divestment of the Enecogen power plant.
EBITDA increased by DKK 0.2 billion and amounted to DKK 0.4 billion in 2018. The increase was due to higher spreads in 2018 as well as the bioconversion of Skærbæk Power Station, partly offset by higher project devel-opment costs related to new activities.
BioenergyPerformance highlights 2018 2017 %
Business drivers
Degree days number 2,526 2,705 (7%)
Heat generation TWh 8.8 9.0 (2%)
Power generation TWh 6.7 8.2 (18%)
Power price, DK EUR/MWh 45.1 31.0 45%
Green dark spread, DK EUR/MWh 2.5 (1.6) n.a.
Green spark spread, DK EUR/MWh (6.3) (6.2) 2%
Financial results
Revenue DKKm 6,353 5,864 8%
Heat 2,903 2,607 11%
Power, incl. ancillary services 3,450 3,257 6%
EBITDA DKKm 367 152 141%
Heat 765 695 10%
Ancillary services 404 321 26%
Power (802) (864) (7%)
Depreciation DKKm (657) (690) (5%)
EBIT DKKm (290) (538) (46%)
Cash flows from operating activities DKKm 1,491 592 152%
Gross investments DKKm (1,356) (1,390) (2%)
Divestments DKKm 383 2 n.a.
Free cash flow DKKm 518 (796) n.a.
Capital employed DKKm 1,943 2,554 (24%)
ROCE % (12.9) (22.2) 9.3%p
Introduction to Bioenergy
Bioenergy consists of our combined heat and power generation business (CHP) in Denmark and our growth platform within green biogas and waste, Green Waste Solutions (GWS).
— Our CHP business is a leading generator of district heating in Denmark through our large combined heat and power plants and dedicated heat plants. We provide around one quarter of Denmark’s district heating and around one third of Denmark’s thermal power.
— GWS offers innovative green waste solu-tions in Denmark and the UK through our patented enzyme technology, Renescience, and our biogas production and upgrading facilities.
Ørsted Annual report 2018 Management’s review Business units
49 / 193
Contents

Share of fuels in the thermal heat and power generation, %
Coal Oil Natural gas Biomass Waste
Certified biomass, %
Uncertified biomass Certified biomass
61% 72%83%
28% 17%
100%
39%
2016 2017 2018 2020
66%
46%30%
38%
1%
1%1%
26%
27% 12%
27%42%
49%6%
18%
7%3%
2006 2016 2017 20232018~5%
~95%
EBITDA from ancillary services was DKK 0.1 billion higher than in 2017 driven by higher demand during the summer and increased demand from Germany (DK1/DE connection).
Cash flows from operating activities amount-ed to DKK 1.5 billion and was thus DKK 0.9 billion higher than in 2017. The increase was due to the higher EBITDA, prepayments related to the bioconversion of Asnæs Power Station, and lower receivables.
Gross investments amounted to DKK 1.4 billion in 2018. The largest investments related to the bioconversion of Asnæs Power Station.
Bioenergy achieved positive free cash flows of DKK 0.5 billion, of which the divestment of Enecogen contributed with DKK 0.4 billion.
Strategy follow-up
In Bioenergy, we are completing the conver-sions of our Danish combined heat and power (CHP) plants to sustainable biomass, and we continue to explore the potential for growth and value creation within waste-to-energy and biogas technologies.
Bioenergy’s strategic focus is to:— complete the conversion of our Danish CHP
plants to sustainable biomass and phase out coal by 2023
— operate our plants smartly and safely and prepare for a transition towards a more electrified green district heating system
— establish a leading growth platform within biogas and waste recycling.
Complete the conversion to sustainable biomass and phase out coal by 2023For several years, we have been committed to converting our heat and power plants to using sustainable wood pellets and wood chips instead of fossil fuels. We will phase out coal entirely towards 2023, thereby reducing our annual carbon emissions in Denmark signif-icantly. In just over ten years, we will have gone from being one of the most coal-inten-sive utilities in Europe to having a completely coal-free generation by 2023.
Along with other European energy companies, we remain committed to the Sustainable Biomass Programme (SBP) which promotes a robust and independent system for the certification of sustainable biomass. In 2018, all our biomass came from sustainable sources, mostly in the form of residues from timber production such as sawdust, branches
and thinnings, and 83% was certified by third parties. We expect that 100% of our biomass will be third party certified by 2020.
In 2018, we experienced an increase in the use of coal, reflecting improved power market conditions and a demand for our power stations to supplement the intermittent gen-eration from wind and solar PV, also at times when no heat generation was required.
In collaboration with our heat customers, we have reached important milestones in 2018. Our conversion of the Asnæs Power Station is progressing on schedule, implying that we will be supplying green district heating to the general Kalundborg area from 2020 onwards, while providing green steam to Novo Nordisk’s and Novozymes’ production facilities. We are also progressing our flue gas condensation project in Herning, enabling us to substantially increase the heat and power output of the biomass used from mid-2019 onwards.
The Esbjerg Power Station is our last remaining unconverted CHP plant. The heat customers in the Esbjerg and Varde areas have been granted an exemption from the regulatory requirement to apply CHP solutions for providing district heating. This means that there is no longer a viable business case for Ørsted for a new CHP plant. We have consequently informed the heat customers that we will cease providing districting heat to the area by the end of 2022.
As part of our green transition, we divested our 50% share in Enecogen, a gas-fired power plant in the Netherlands, to Castleton Commodities International LLC in July 2018.
Biomass conversions will support a continued reduction in the usage of coal in the coming years.
Ørsted Annual report 2018 Management’s review Business units
50 / 193
Contents
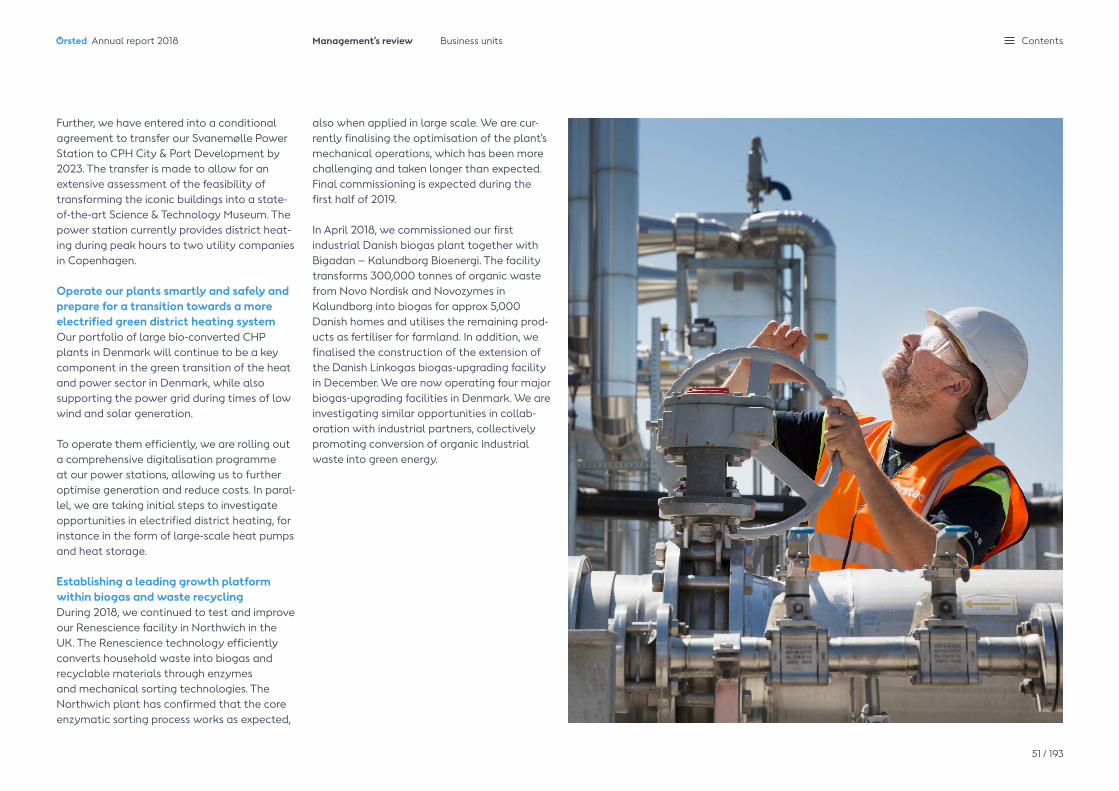
Further, we have entered into a conditional agreement to transfer our Svanemølle Power Station to CPH City & Port Development by 2023. The transfer is made to allow for an extensive assessment of the feasibility of transforming the iconic buildings into a state-of-the-art Science & Technology Museum. The power station currently provides district heat-ing during peak hours to two utility companies in Copenhagen.
Operate our plants smartly and safely and prepare for a transition towards a more electrified green district heating system Our portfolio of large bio-converted CHP plants in Denmark will continue to be a key component in the green transition of the heat and power sector in Denmark, while also supporting the power grid during times of low wind and solar generation.
To operate them efficiently, we are rolling out a comprehensive digitalisation programme at our power stations, allowing us to further optimise generation and reduce costs. In paral-lel, we are taking initial steps to investigate opportunities in electrified district heating, for instance in the form of large-scale heat pumps and heat storage.
Establishing a leading growth platform within biogas and waste recycling During 2018, we continued to test and improve our Renescience facility in Northwich in the UK. The Renescience technology efficiently converts household waste into biogas and recyclable materials through enzymes and mechanical sorting technologies. The Northwich plant has confirmed that the core enzymatic sorting process works as expected,
also when applied in large scale. We are cur-rently finalising the optimisation of the plant’s mechanical operations, which has been more challenging and taken longer than expected. Final commissioning is expected during the first half of 2019.
In April 2018, we commissioned our first industrial Danish biogas plant together with Bigadan – Kalundborg Bioenergi. The facility transforms 300,000 tonnes of organic waste from Novo Nordisk and Novozymes in Kalundborg into biogas for approx 5,000 Danish homes and utilises the remaining prod-ucts as fertiliser for farmland. In addition, we finalised the construction of the extension of the Danish Linkogas biogas-upgrading facility in December. We are now operating four major biogas-upgrading facilities in Denmark. We are investigating similar opportunities in collab-oration with industrial partners, collectively promoting conversion of organic industrial waste into green energy.
Ørsted Annual report 2018 Management’s review Business units
51 / 193
Contents
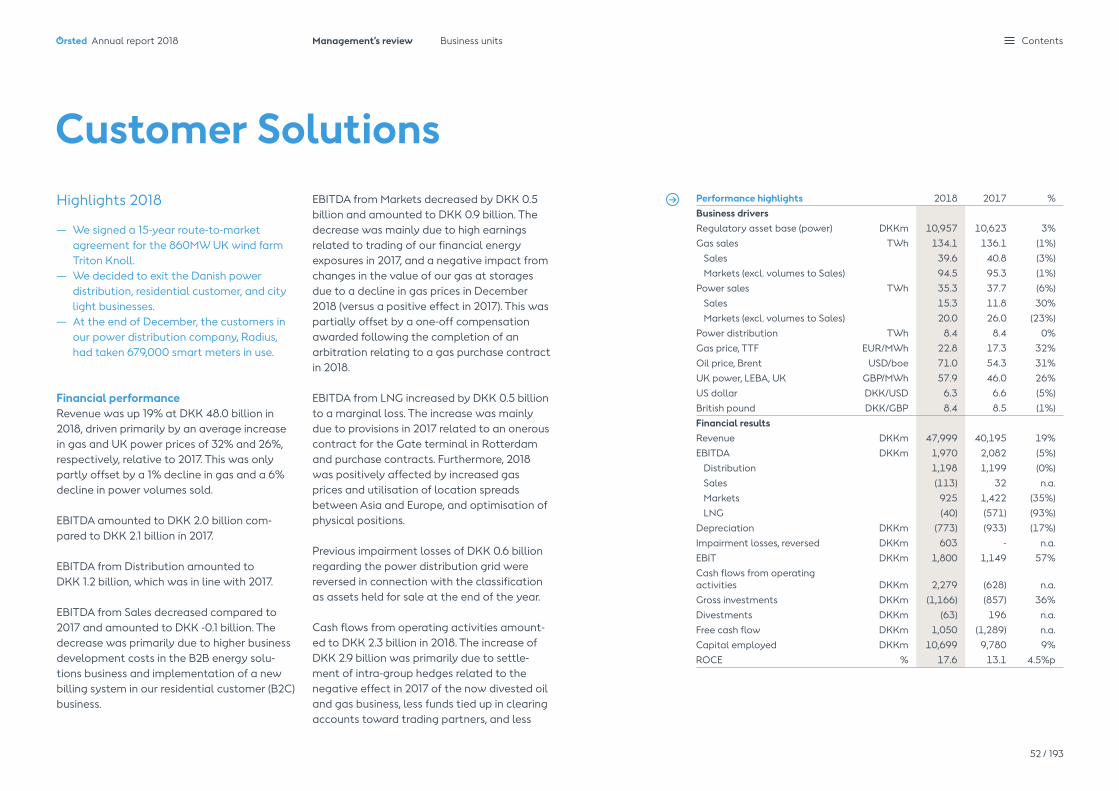
Highlights 2018
— We signed a 15-year route-to-market agreement for the 860MW UK wind farm Triton Knoll.
— We decided to exit the Danish power distribution, residential customer, and city light businesses.
— At the end of December, the customers in our power distribution company, Radius, had taken 679,000 smart meters in use.
Financial performanceRevenue was up 19% at DKK 48.0 billion in 2018, driven primarily by an average increase in gas and UK power prices of 32% and 26%, respectively, relative to 2017. This was only partly offset by a 1% decline in gas and a 6% decline in power volumes sold.
EBITDA amounted to DKK 2.0 billion com-pared to DKK 2.1 billion in 2017.
EBITDA from Distribution amounted to DKK 1.2 billion, which was in line with 2017.
EBITDA from Sales decreased compared to 2017 and amounted to DKK -0.1 billion. The decrease was primarily due to higher business development costs in the B2B energy solu-tions business and implementation of a new billing system in our residential customer (B2C) business.
EBITDA from Markets decreased by DKK 0.5 billion and amounted to DKK 0.9 billion. The decrease was mainly due to high earnings related to trading of our financial energy exposures in 2017, and a negative impact from changes in the value of our gas at storages due to a decline in gas prices in December 2018 (versus a positive effect in 2017). This was partially offset by a one-off compensation awarded following the completion of an arbitration relating to a gas purchase contract in 2018.
EBITDA from LNG increased by DKK 0.5 billion to a marginal loss. The increase was mainly due to provisions in 2017 related to an onerous contract for the Gate terminal in Rotterdam and purchase contracts. Furthermore, 2018 was positively affected by increased gas prices and utilisation of location spreads between Asia and Europe, and optimisation of physical positions.
Previous impairment losses of DKK 0.6 billion regarding the power distribution grid were reversed in connection with the classification as assets held for sale at the end of the year.
Cash flows from operating activities amount-ed to DKK 2.3 billion in 2018. The increase of DKK 2.9 billion was primarily due to settle-ment of intra-group hedges related to the negative effect in 2017 of the now divested oil and gas business, less funds tied up in clearing accounts toward trading partners, and less
Customer SolutionsPerformance highlights 2018 2017 %Business driversRegulatory asset base (power) DKKm 10,957 10,623 3%Gas sales TWh 134.1 136.1 (1%)
Sales 39.6 40.8 (3%)Markets (excl. volumes to Sales) 94.5 95.3 (1%)
Power sales TWh 35.3 37.7 (6%)Sales 15.3 11.8 30%Markets (excl. volumes to Sales) 20.0 26.0 (23%)
Power distribution TWh 8.4 8.4 0%Gas price, TTF EUR/MWh 22.8 17.3 32%Oil price, Brent USD/boe 71.0 54.3 31%UK power, LEBA, UK GBP/MWh 57.9 46.0 26%US dollar DKK/USD 6.3 6.6 (5%)British pound DKK/GBP 8.4 8.5 (1%)Financial resultsRevenue DKKm 47,999 40,195 19%EBITDA DKKm 1,970 2,082 (5%)
Distribution 1,198 1,199 (0%)Sales (113) 32 n.a.Markets 925 1,422 (35%)LNG (40) (571) (93%)
Depreciation DKKm (773) (933) (17%)Impairment losses, reversed DKKm 603 - n.a.EBIT DKKm 1,800 1,149 57%Cash flows from operating activities DKKm 2,279 (628) n.a.Gross investments DKKm (1,166) (857) 36%Divestments DKKm (63) 196 n.a.Free cash flow DKKm 1,050 (1,289) n.a.Capital employed DKKm 10,699 9,780 9%ROCE % 17.6 13.1 4.5%p
Ørsted Annual report 2018 Management’s review Business units
52 / 193
Contents

funds tied up in receivables due to lower gas sales at the end of 2018 compared to 2017. This was partly offset by more funds tied up in ROC inventories due to higher offshore wind power generation.
Gross investments totalled DKK 1.2 billion in 2018, relating mainly to maintenance of the power distribution grid and the installation of new smart meters.
ROCE increased by 5 percentage points to 18%, mainly due to the higher EBIT.
Strategy follow-up
Customer Solutions has assumed a more integrated role in Ørsted as the front-end of the value chain, providing efficient route-to-market services. To develop market access to wholesale, corporate and traded markets, we increasingly focus on developing customer relationships to go beyond commodities and revolve around renewable power generation, waste to energy, and energy efficiency.
We will investigate different options for exiting our power distribution, residential customer and city light businesses.
Customer Solutions’ strategic focus is to:— add further scale to our green power and
gas and green certificates business— mitigate merchant risk through trading and
green energy corporate PPAs — optimise our portfolio of legacy gas- sourcing contracts and LNG positions.
Add further scale to our green power and gas and green certificates businessDuring 2018, the power portfolio grew by 1.4GW to more than 4.5GW, as we added long-term route-to-market contracts for the newly commissioned Walney Extension and Borkum Riffgrund 2 offshore wind farms and extended contracts for existing offshore wind farms. Furthermore, we entered into a contract to balance the British offshore wind farm Triton Knoll (860MW) for a 15-year period, starting from the planned commissioning in 2021. These additions add to the diversification and flexibility of our portfolio of power and green certificates.
Ørsted was granted approx 13% of all renewa-ble obligation certificates (ROCs) presented to the UK’s Office of Gas and Electricity Markets (Ofgem) for the April 2017-March 2018 ROC period. When selling power to UK corporate customers, we present the required number of ROCs to Ofgem. However, our offshore wind generation in the UK significantly outweighs our UK power sales, and once a year, we there-fore auction out parts of our excess ROCs from the latest and the three upcoming ROC periods to UK utilities with ROC imbalances. This ROC
regime will continue until 2037, when the 20-year ROC subsidies will expire for the last renewable assets that were entitled to ROCs. Mitigate merchant risk through trading and green energy corporate PPAsIn 2018, we increased our focus on offering corporate power purchase agreements (cPPAs) with fixed power prices and long tenures to our wholesale and corporate customers. The aim of this is twofold. Our customers achieve certainty about their power price for a long period of time and add to their green profile. For Ørsted, these cPPAs reduce the expo-sure to merchant risk by limiting the power volumes that we will have to sell at prevailing market prices. Today, we have merchant pow-er exposure from our UK wind farms under the ROC regime. Going forward, merchant risk mit-igation will also be needed for existing wind farms as subsidies expire and for potential new wind farms without subsidies. Within our market trading activities, we bene-fitted from proactive trading e.g. by reducing our exposure to the event risk from the UK Government’s changes in the carbon price support scheme, and by successfully manag-ing the price volatility during the cold spell in early spring.
In 2018, our energy efficiency advisory services helped our Danish corporate customers achieve aggregated energy savings of approx 133GWh.
Customer satisfaction among our corporate customers remained high at 75, although down from 77 in 2017 (on a scale from 1-100).
Introduction to Customer Solutions
Customer Solutions provides the Group with ac-cess to wholesale, corporate and traded markets.
— We create incremental value by providing route-to-market services for the Group and our partners by selling power, gas and green certificates to the market. In doing so, we own and operate portfolios of contracts within gas and power, which we optimise by leveraging our origination and trading capabilities and utilising the size of the portfolios.
— We generate access to wholesale and corpo-rate customers to whom we seek to develop strong partnerships beyond conventional commodity supply, including offering corpo-rate power purchase agreements (cPPAs), green waste solutions as well as energy effi-ciency and energy portfolio risk management services.
— We proactively manage the merchant risks arising from our generation assets and
contracts by trading commodities, and we mitigate risks and create value through time-to-market decisions, proxy hedging and netting.
We plan to exit our power distribution, residen-tial customer and city light businesses which comprise:
— Radius, which owns and operates Denmark’s largest power distribution grid measured by number of connection points with approx one million customers.
— Our residential customer business with sale of power to approx 725,000 customers and gas to approx 102,000 customers.
— Our city light business which is the largest Danish street light operator, covering 17 municipalities across Zealand.
Ørsted Annual report 2018 Management’s review Business units
53 / 193
Contents

Optimise our portfolio of legacy gas-sourcing contracts and LNG positions During 2018, we settled additional price re-views of our long-term gas-sourcing contracts, with an outcome that ensures profitability of our portfolio of conventional gas contracts.
However, we expect our LNG activities to continue to be loss-making going forward, although losses in 2018 were limited by our increased global trading activities.
Key focus areas within the businesses held for sale (power distribution, B2C and city light)During 2018, our power distribution customers experienced a decrease in the security of supply as on average they had 0.65 discon-nections, excluding faults in the primary transmission grid owned by the Danish trans-mission system owner, Energinet. This was an increase of 0.23 disconnections compared to 2017 and worse than our target of 0.50. The increase was influenced by a combination of two unintentional incidents on the 50kV grid in early 2018 as well as damage to the 30kV grid during third-party construction works, which led to repeated disconnections of a large number of customers in Central Copenhagen. The roll-out of smart meters to all customers by 2020 is progressing according to plan and reached a significant milestone in September, where the project was half-way through instalment. By the end of 2018, 679,000 smart meters had been taken into use.
Radius’ customer satisfaction remained high at 81, down from 82 in 2017 (on a scale from 1-100) despite the increase in grid disconnec-tions and the replacement of smart meters.
Our residential customer business is pioneer-ing the transition to time-of-day based power prices which have been offered where possible since late 2017. By the end of 2018, 94% of our customers with this option had transitioned. Customer satisfaction among residential customers who had been in contact with us was 74 in 2018, down from 76 in 2017 (on a scale from 1-100). Contrary to this decrease, our loyalty increased to 72 from 71 and our net promotor score turned 0 (on a scale from -100 to +100), following negative scores ranging from -22 to -2 from 2013 to 2017.
Ørsted Annual report 2018 Management’s review Business units
54 / 193
Contents

Governance
Board of Directors 56Group Executive Management 58Corporate governance 59Remuneration report 63Risk and risk management 66Shareholder information 70
Ørsted Annual report 2018 Contents
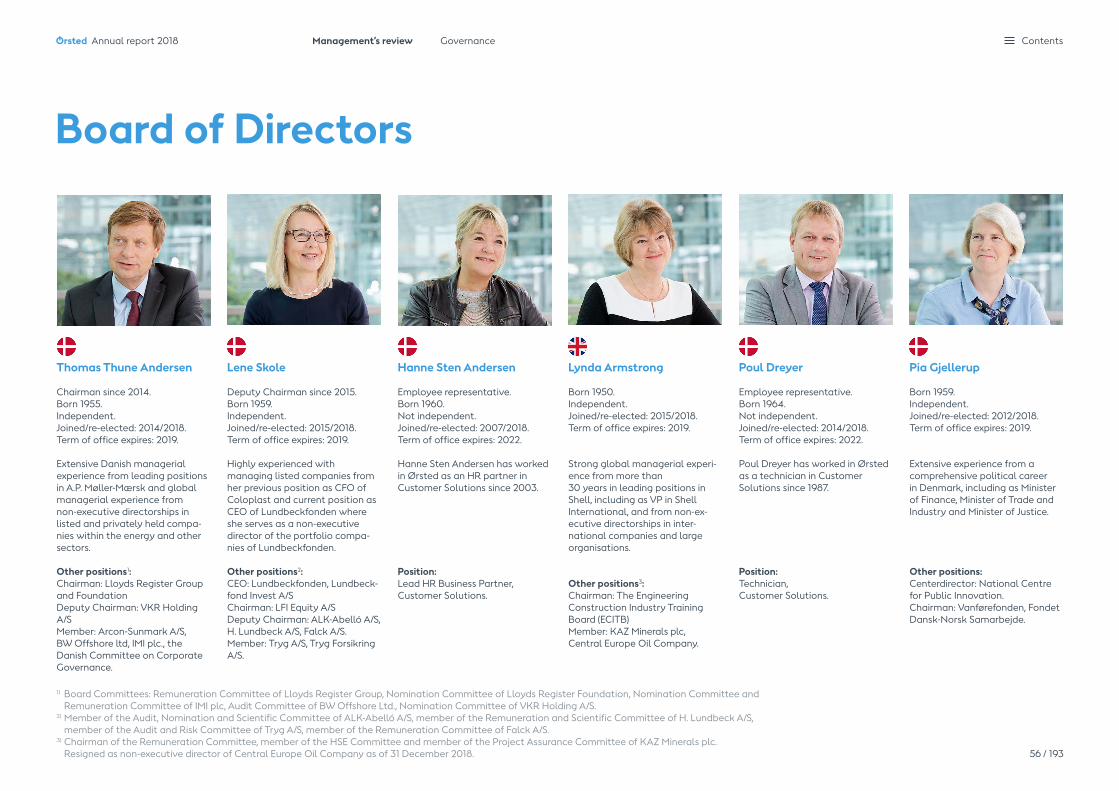
Board of Directors
Thomas Thune Andersen
Chairman since 2014.Born 1955. Independent.Joined/re-elected: 2014/2018. Term of office expires: 2019.
Extensive Danish managerial experience from leading positions in A.P. Møller-Mærsk and global managerial experience from non-executive directorships in listed and privately held compa-nies within the energy and other sectors.
Other positions1:Chairman: Lloyds Register Group and FoundationDeputy Chairman: VKR Holding A/SMember: Arcon-Sunmark A/S,BW Offshore ltd, IMI plc., the Danish Committee on Corporate Governance.
1) Board Committees: Remuneration Committee of Lloyds Register Group, Nomination Committee of Lloyds Register Foundation, Nomination Committee and Remuneration Committee of IMI plc, Audit Committee of BW Offshore Ltd., Nomination Committee of VKR Holding A/S.
2) Member of the Audit, Nomination and Scientific Committee of ALK-Abelló A/S, member of the Remuneration and Scientific Committee of H. Lundbeck A/S, member of the Audit and Risk Committee of Tryg A/S, member of the Remuneration Committee of Falck A/S.
3) Chairman of the Remuneration Committee, member of the HSE Committee and member of the Project Assurance Committee of KAZ Minerals plc. Resigned as non-executive director of Central Europe Oil Company as of 31 December 2018.
Lene Skole
Deputy Chairman since 2015. Born 1959. Independent.Joined/re-elected: 2015/2018. Term of office expires: 2019.
Highly experienced with managing listed companies from her previous position as CFO of Coloplast and current position as CEO of Lundbeckfonden where she serves as a non-executive director of the portfolio compa-nies of Lundbeckfonden.
Other positions2:CEO: Lundbeckfonden, Lundbeck-fond Invest A/SChairman: LFI Equity A/S Deputy Chairman: ALK-Abelló A/S, H. Lundbeck A/S, Falck A/S. Member: Tryg A/S, Tryg Forsikring A/S.
Hanne Sten Andersen
Employee representative. Born 1960. Not independent.Joined/re-elected: 2007/2018. Term of office expires: 2022.
Hanne Sten Andersen has worked in Ørsted as an HR partner in Customer Solutions since 2003.
Position: Lead HR Business Partner, Customer Solutions.
Lynda Armstrong
Born 1950. Independent.Joined/re-elected: 2015/2018. Term of office expires: 2019.
Strong global managerial experi-ence from more than 30 years in leading positions in Shell, including as VP in Shell International, and from non-ex-ecutive directorships in inter-national companies and large organisations.
Other positions3: Chairman: The Engineering Construction Industry Training Board (ECITB)Member: KAZ Minerals plc, Central Europe Oil Company.
Pia Gjellerup
Born 1959. Independent.Joined/re-elected: 2012/2018. Term of office expires: 2019.
Extensive experience from a comprehensive political career in Denmark, including as Minister of Finance, Minister of Trade and Industry and Minister of Justice.
Other positions: Centerdirector: National Centre for Public Innovation. Chairman: Vanførefonden, Fondet Dansk-Norsk Samarbejde.
Poul Dreyer
Employee representative.Born 1964.Not independent.Joined/re-elected: 2014/2018. Term of office expires: 2022.
Poul Dreyer has worked in Ørsted as a technician in Customer Solutions since 1987.
Position:Technician, Customer Solutions.
Ørsted Annual report 2018 Management’s review Governance
56 / 193
Contents

Board of Directors
Benny D. Loft
Born 1965.Independent.Joined/re-elected: 2012/2018. Term of office expires: 2019.
Highly experienced within finan-cial reporting, risk management and capital markets from more than 20 years of operational experience with listed companies, including as CFO and Executive Vice President of Novozymes.
Other positions3:Chairman: EFD Investment A/S and its subsidiaries European Freeze Dry ApS and European Freeze Dry Ltd.Member: New Xellia Group A/S.
Dieter Wemmer
Born 1957.Independent.Joined: 2018. Term of office expires: 2019.
Highly experienced within capital markets, investments and risk management from leading positions within the finance sector. Before focusing solely on non-executive directorships, he was the CFO of Allianz.
Other positions4:Member: UBS Group AG, UBS AG.
Jørgen Kildahl
Born 1963.Independent.Joined: 2018. Term of office expires: 2019.
Strong international background in renewable energy and a profound knowledge of how the energy ecosystems work from po-sitions as Executive Vice President of Statkraft and member of the board of management of E.ON.
Other positions1:Chairman: eSmart Systems, Nysäter Wind AB.Deputy Chairman: Telenor ASA.Member: Hoegh LNG Holding Ltd¹.Other: Senior advisor, Credit Su-isse Energy Infrastructure Partners
Peter Korsholm
Born 1971.Independent.Joined/re-elected: 2017/2018. Term of office expires: 2019.
Extensive M&A experience from his time as Partner and Head of EQT Partners Denmark and from private investments. Also experi-ence with financial reporting, risk management and capital markets from CFO position at AAK AB.
Other positions2:CEO: DSVM Invest A/S, DSV Miljø Group A/S, Day et Invest ApS, Togu ApS.Chairman: ForwardTopCo A/S (FitnessWorld), Nymølle Stenindus-trier A/S, GDL Transport Holding AB, Lion Danmark I ApS.Member: DSVM Invest A/S, A/S United Shipping and Trading Company, DANX Holding I ApS, Day et A/S.
1) Member of the Audit Committee and the Sustainability and Compliance Committee of Telenor ASA, member of Audit Committee of Hoegh LNG Holding Ltd. 2) Chairman of the Investment Committee of Zoscales Partners, Chairman of the Board of Directors of two wholly-owned subsidiaries of Lion Danmark I ApS (Lomax Group). He is also a member of the Board of
Directors of three wholly-owned subsidiaries of A/S United Shipping and Trading Company, three wholly-owned subsidiaries of DANX Holding I ApS, and four wholly-owned subsidiaries of DSVM Invest A/S.3) CEO of Poelhoi Holding ApS, Chairman of the Finance and Audit Committee of New Xellia Group A/S.4) Member of the Audit and Risk Committee of UBS Group AG.
Benny Gøbel
Employee representative.Born 1967.Not independent.Joined/re-elected: 2011/2018. Term of office expires: 2022.
Benny Gøbel has worked in Ørsted as an engineer in Bioener-gy since 2005.
Position:Engineer, Bioenergy.
Ørsted Annual report 2018 Management’s review Governance
57 / 193
Contents
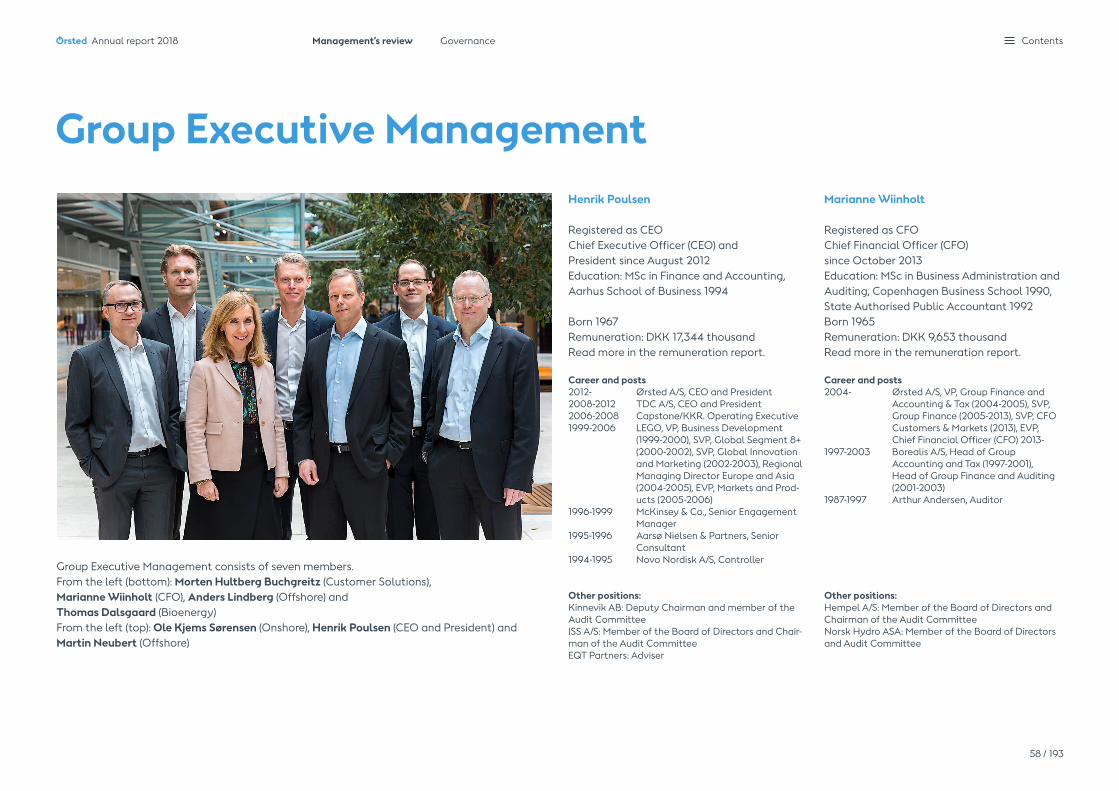
Group Executive ManagementHenrik Poulsen
Registered as CEOChief Executive Officer (CEO) and President since August 2012Education: MSc in Finance and Accounting, Aarhus School of Business 1994
Born 1967Remuneration: DKK 17,344 thousandRead more in the remuneration report.
Career and posts2012- Ørsted A/S, CEO and President2008-2012 TDC A/S, CEO and President2006-2008 Capstone/KKR. Operating Executive1999-2006 LEGO, VP, Business Development
(1999-2000), SVP, Global Segment 8+ (2000-2002), SVP, Global Innovation and Marketing (2002-2003), Regional Managing Director Europe and Asia (2004-2005), EVP, Markets and Prod-ucts (2005-2006)
1996-1999 McKinsey & Co., Senior Engagement Manager 1995-1996 Aarsø Nielsen & Partners, Senior
Consultant1994-1995 Novo Nordisk A/S, Controller
Other positions:Kinnevik AB: Deputy Chairman and member of the Audit CommitteeISS A/S: Member of the Board of Directors and Chair-man of the Audit Committee EQT Partners: Adviser
Marianne Wiinholt
Registered as CFOChief Financial Officer (CFO) since October 2013Education: MSc in Business Administration and Auditing, Copenhagen Business School 1990, State Authorised Public Accountant 1992Born 1965 Remuneration: DKK 9,653 thousandRead more in the remuneration report.
Career and posts2004- Ørsted A/S, VP, Group Finance and
Accounting & Tax (2004-2005), SVP, Group Finance (2005-2013), SVP, CFO Customers & Markets (2013), EVP, Chief Financial Officer (CFO) 2013-
1997-2003 Borealis A/S, Head of Group Accounting and Tax (1997-2001), Head of Group Finance and Auditing (2001-2003)
1987-1997 Arthur Andersen, Auditor
Other positions:Hempel A/S: Member of the Board of Directors and Chairman of the Audit CommitteeNorsk Hydro ASA: Member of the Board of Directors and Audit Committee
Group Executive Management consists of seven members. From the left (bottom): Morten Hultberg Buchgreitz (Customer Solutions), Marianne Wiinholt (CFO), Anders Lindberg (Offshore) and Thomas Dalsgaard (Bioenergy)From the left (top): Ole Kjems Sørensen (Onshore), Henrik Poulsen (CEO and President) and Martin Neubert (Offshore)
Ørsted Annual report 2018 Management’s review Governance
58 / 193
Contents

Our governance model
Corporate governanceOur governance model has its offspring in our Scandinavian roots and our listing on the Nasdaq Copenhagen Stock Exchange.
The overall and strategic management of the company is anchored in a board of non-exec-utive directors appointed by the shareholders. The Board of Directors has appointed an Executive Board for handling the day-to-day management. None of the members of the Executive Board are members of the Board of Directors.
Our governance model is illustrated in the figure to the right and explained below.
Shareholders and general meeting
Our shareholders exercise their rights at the general meeting. The general meeting adopts decisions, such as the appointment of the Board of Directors and the auditor, in accor- dance with the standard Danish rules. Howev-er, the approval of a proposal to amend the Articles of Association or dissolve the compa-ny requires that the Danish State as majority shareholder participate in the general meeting and vote in favour of the proposal.
Board of Directors
Members and duties Each year at the annual general meeting, the shareholders elect six to eight board mem-bers. In addition, our employees may elect members corresponding to half of the board members elected by the general meeting pur-suant to Danish mandatory rules. Employee elections are typically held every four years.
Our Board of Directors currently comprises eleven members, eight members elected by the general meeting and three members elected by the employees.
In 2018, Dieter Wemmer and Jørgen Kildahl joined the Board of Directors as new members elected by the general meeting.
The Board of Directors has prepared an overview of the competences required on the board. The list of required competences can be found on orsted.com/competences-over-view. In the table on the next page, we have illustrated how the current board members compare against the required competences.
The Board of Directors is responsible for the overall management of the company and appoints the Executive Board. The Board of Directors lays down the company’s strategy
Shareholders and general meetingOur shareholders exercise their rights at the general meeting, which for example appoints the Board of Direc-tors and the auditors.
Board of DirectorsConsists of 11 members. The Board of Directors is responsible for the overall management of the com-pany and for appointing a competent Executive Board.
Numbers of meetings in 2018: 11
Nomination and Remuneration CommitteeConsists of 3 members from the Board of Directors.
Number of meetings in 2018: 3
Audit and Risk CommitteeConsists of 3 members from the Board of Directors.
Number of meetings in 2018: 7
Group Executive ManagementThe Executive Board and Group Executive Manage-ment are responsible for the day-to-day management of the company.
Ørsted Annual report 2018 Management’s review Governance
59 / 193
Contents
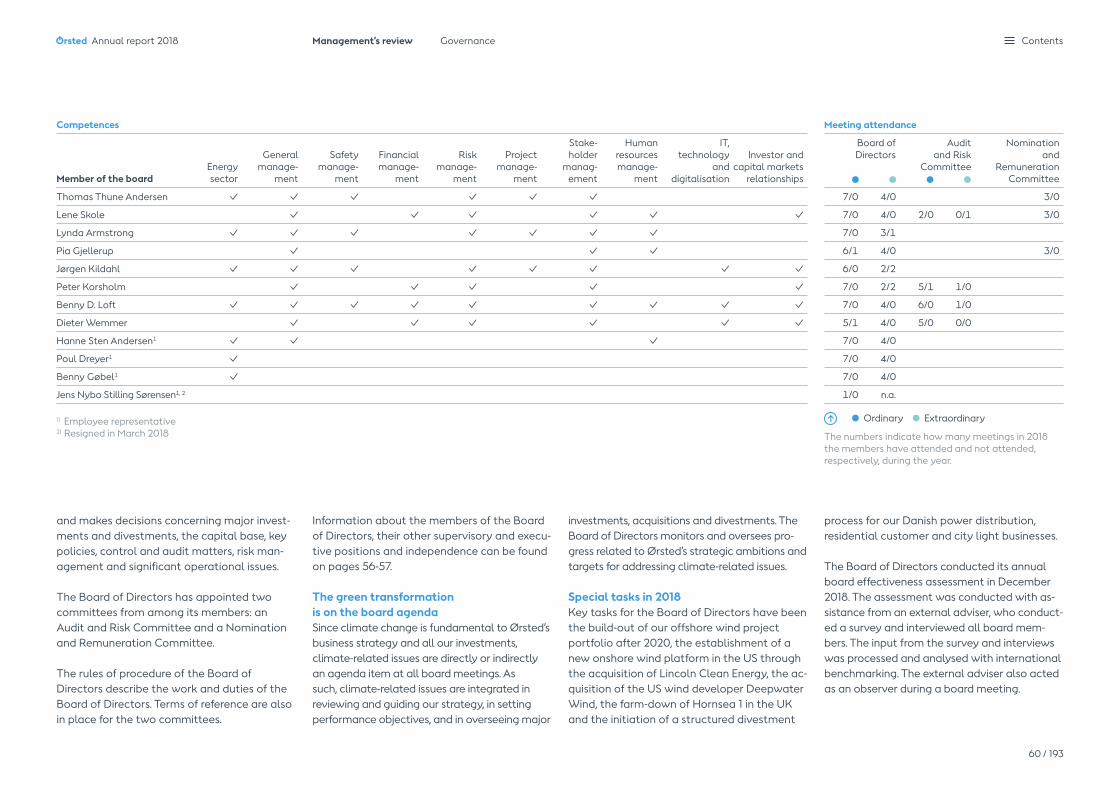
and makes decisions concerning major invest-ments and divestments, the capital base, key policies, control and audit matters, risk man-agement and significant operational issues.
The Board of Directors has appointed two committees from among its members: an Audit and Risk Committee and a Nomination and Remuneration Committee.
The rules of procedure of the Board of Directors describe the work and duties of the Board of Directors. Terms of reference are also in place for the two committees.
Information about the members of the Board of Directors, their other supervisory and execu-tive positions and independence can be found on pages 56-57.
The green transformation is on the board agendaSince climate change is fundamental to Ørsted’s business strategy and all our investments, climate-related issues are directly or indirectly an agenda item at all board meetings. As such, climate-related issues are integrated in reviewing and guiding our strategy, in setting performance objectives, and in overseeing major
investments, acquisitions and divestments. The Board of Directors monitors and oversees pro-gress related to Ørsted’s strategic ambitions and targets for addressing climate-related issues.
Special tasks in 2018 Key tasks for the Board of Directors have been the build-out of our offshore wind project portfolio after 2020, the establishment of a new onshore wind platform in the US through the acquisition of Lincoln Clean Energy, the ac-quisition of the US wind developer Deepwater Wind, the farm-down of Hornsea 1 in the UK and the initiation of a structured divestment
Competences Meeting attendance
Member of the boardEnergy sector
General manage-
ment
Safety manage-
ment
Financial manage-
ment
Risk manage-
ment
Project manage-
ment
Stake- holder
manag- ement
Human resources manage-
ment
IT, technology
and digitalisation
Investor and capital markets
relationships
Board of Directors
Audit and Risk
Committee
Nomination and
Remuneration Committee
Thomas Thune Andersen ✓ ✓ ✓ ✓ ✓ ✓ 7/0 4/0 3/0
Lene Skole ✓ ✓ ✓ ✓ ✓ ✓ 7/0 4/0 2/0 0/1 3/0
Lynda Armstrong ✓ ✓ ✓ ✓ ✓ ✓ ✓ 7/0 3/1
Pia Gjellerup ✓ ✓ ✓ 6/1 4/0 3/0
Jørgen Kildahl ✓ ✓ ✓ ✓ ✓ ✓ ✓ ✓ 6/0 2/2
Peter Korsholm ✓ ✓ ✓ ✓ ✓ 7/0 2/2 5/1 1/0
Benny D. Loft ✓ ✓ ✓ ✓ ✓ ✓ ✓ ✓ ✓ 7/0 4/0 6/0 1/0
Dieter Wemmer ✓ ✓ ✓ ✓ ✓ ✓ 5/1 4/0 5/0 0/0
Hanne Sten Andersen1 ✓ ✓ ✓ 7/0 4/0
Poul Dreyer1 ✓ 7/0 4/0
Benny Gøbel1 ✓ 7/0 4/0
Jens Nybo Stilling Sørensen1, 2 1/0 n.a.
The numbers indicate how many meetings in 2018 the members have attended and not attended, respectively, during the year.
process for our Danish power distribution, residential customer and city light businesses.
The Board of Directors conducted its annual board effectiveness assessment in December 2018. The assessment was conducted with as-sistance from an external adviser, who conduct-ed a survey and interviewed all board mem-bers. The input from the survey and interviews was processed and analysed with international benchmarking. The external adviser also acted as an observer during a board meeting.
1) Employee representative2) Resigned in March 2018
Ordinary Extraordinary
Ørsted Annual report 2018 Management’s review Governance
60 / 193
Contents
The external adviser concluded that the Board of Directors has evolved in many dimen-sions and was in good shape for the challeng-es ahead. The Board of Directors has a strong and relevant composition with a breadth of skills, competences and perspectives and solid financial knowledge. Although many board members are relatively new, the Board of Directors is well aligned in relation to strategic priorities and its modus operandi, which is steered effectively by the Chairmanship.
RemunerationEach year, the general meeting approves the remuneration for the members of the Board of Directors for the coming year. In the section on remuneration on page 65, you can read more about the remuneration of the Board of Directors.
Nomination and Remuneration Committee
Members and duties Thomas Thune Andersen (Chairman), Lene Skole and Pia Gjellerup are the members of the Nomination and Remuneration Committee.
The committee assists the Board of Directors in matters regarding the composition, remu-neration and performance of the Board of Directors and Group Executive Management.
You can read more about the Nomination and Remuneration Committee and the terms of reference for the committee at orsted.com/nomination-remuneration-committee.
Special tasks in 2018In 2018, the committee discussed, among other matters, payment of retention bonus-es granted in connection with the planned divestment of our Danish power distribution, residential customer and city light businesses as well as retention bonuses to individual busi-ness-critical employees in companies acquired during the year.
Additionally, the committee discussed a share-based retention tool which was introduced in 2018 and targeted at a limited number of employees responsible for critical long-term projects.
The committee also reviewed an update of the compensation model and governance for our top 100 employees.
Audit and Risk Committee
Members and duties Benny D. Loft (Chairman), Dieter Wemmer and Peter Korsholm are the members of the Audit and Risk Committee.
The committee assists the Board of Directors in overseeing the financial and ESG reporting process, the capital structure development, financial and business-related risks, compli-ance with statutory and other requirements from public authorities as well as the internal controls.
Moreover, the committee approves the frame-work for the work of the company’s external and internal auditors, evaluates the external auditors’ independence and qualifications as
well as monitors the company’s whistleblower scheme.
Our Internal Audit function reports to the Audit and Risk Committee and is independent of our administrative management structures. Internal Audit enhances and protects the organisational value by providing risk-based and objective assurance, advice and insight. Further, Internal Audit is primarily involved in auditing and advising on our core processes, governance, risk management, control pro-cesses and IT security.
The Chairman of the Audit and Risk Commit-tee is responsible for managing our whistle-blower scheme. Internal Audit receives and handles reports submitted. Our employees and other associates may report serious offences, such as cases of bribery, fraud and other inappropriate or illegal conduct, to our whistleblower scheme or through our man-agement system. In 2018, two substantiated cases of inappropriate or unlawful behaviour were reported through our whistleblower scheme. One case concerned violation of pro-cure-to-pay policies, and one case concerned misappropriation of assets. The cases had consequences for the individuals involved. None of the reported cases were critical to our business or impacted our financial results. Whistleblower cases are taken very seriously, and an awareness campaign was conducted to avoid similar cases.
You can read more about the Audit and Risk Committee and the terms of refer-ence for the committee at orsted.com/audit-risk-committee.
Important tasks for the Board of Directors in 2018
Investments, acquisitions and divestments— Acquisition of the US onshore wind developer
Lincoln Clean Energy.
— Acquisition of the US offshore wind developer Deepwater Wind.
— Farm-down of the offshore wind farm Hornsea 1 in the UK.
— Initiation of divestment of our Danish power distribution and residential customer and city light businesses.
Other tasks— Preparation of new ambitious targets for
our long-term strategic and financial devel-opment with an ambition to lead the green transformation.
— Appointment of new CEO for Offshore.
— Establishment and appointment of CEO for Onshore.
— Development of our offshore wind project portfolio in the UK, Germany, the Netherlands, Taiwan and the US.
— Development of our onshore wind project portfolio in the US.
— Review of overall IT security.
— Preparation of a Global Diversity & Inclusion Policy.
Ørsted Annual report 2018 Management’s review Governance
61 / 193
Contents
Special tasks in 2018 In 2018, the Audit and Risk Committee focused on the two acquisitions of Lincoln Clean Energy and Deepwater Wind in the US, IT/cybersecurity together with the implemen-tation of the new General Data Protection Regulation (GDPR) and the inflation exposure management policy adopted in 2018.
Internal Audit undertook special audit and consultancy tasks within the following areas: prevention of cybercrime, GDPR, compliance, internationalisation, asset management, commodity and currency hedging, compliance monitoring and business conduct.
Executive Board and Group Executive Management
Members and duties Henrik Poulsen (CEO) and Marianne Wiinholt (CFO) are members of the Executive Board of Ørsted A/S.
The Executive Board undertakes the day-to-day management through Group Execu-tive Management, which consists of seven members. In addition to Henrik Poulsen and Marianne Wiinholt, Group Executive Manage-ment comprises the executive vice presidents of our four business units: Martin Neubert (Offshore), Ole Kjems Sørensen (Onshore), Thomas Dalsgaard (Bioenergy) and Morten H. Buchgreitz (Customer Solutions) together with Anders Lindberg, Executive Vice President of Offshore EPC and QHSE.
The Board of Directors has laid down guide-lines for the work of the Executive Board, including the division of work between the Board of Directors and the Executive Board and the Executive Board’s powers to enter into agreements on behalf of the company. The Board of Directors regularly discusses the CEO’s performance, for example by following up on developments seen in relation to our strategy and objectives.
The Chairman of the Board of Directors and the CEO also regularly discuss the coopera-tion between the Board of Directors and the Executive Board.
You can find information about the members of the Executive Board, including their previous employment and other executive functions, on page 58. We describe the remuneration of the Executive Board in the section on remunera-tion on pages 63-65.
Our corporate governance positions
We comply or partly comply with all 47 recommendations prepared by the Danish Committee on Corporate Governance as last updated in November 2017 (please see corporategovernance.dk).
Our only deviation is that the first grant under the share programme for the Executive Board has a slightly shorter vesting period than the recommended three years. Upon vesting of the first grant in May 2019, we will comply with all 47 recommendations.
Our statutory report on corporate governance can be found at orsted.com/statutory-reports. The report describes in more detail whether and how we comply with or deviate from the recommendations.
Important tasks for the Audit and Risk Committee in 2018
Audit and accounting— Review of the accounting policy applied for US
subsidies and tax attributes.
— Review of the principles and disclosures related to the two acquisitions (business combinations) and divestments.
— Review of the implementation of IFRS 15 as well as supervising the preparation for IFRS 16 imple-mentation in 2019.
— Review of expectations for market prices, ex-change rates, discount rates and risk-free interest rates.
— Review of significant provisions and warranties in the Group.
— Monitoring of capital structure development.
— Monitoring of the voluntary limit for non-audit services as well as preliminary approval thereof.
Risk— Monitoring of business and emerging risks.
— Review and assessment of the principles applied for the adopted inflation exposure management policy.
— Review of IT security in operational and adminis-trative areas as well as cybersecurity.
— Assessment of liquidity reserve and capital structure.
— Monitoring of currency and energy hedging mandates.
— Supervision of the work involved in ensuring compliance with the requirements of the General Data Protection Regulation.
Ørsted Annual report 2018 Management’s review Governance
62 / 193
Contents

Remuneration reportRemuneration policyThe overall objective of our remuneration pol-icy is to attract, motivate and retain qualified members of our Board of Directors and our Executive Board.
In addition, the policy aims to strike the right balance between the Executive Board’s fixed and incentive-based remuneration with the target of remunerating the members in rela-tion to the results achieved at company and individual levels. This ensures a tightly aligned interest between the Executive Board and the shareholders.
The remuneration policy is available at orsted.com/Remuneration-policy-2018.
Remuneration of the Executive Board
Remuneration structureIn February 2018, the Board of Directors decided to keep the remuneration structure unchanged for 2018 compared to 2017. The remuneration structure and the remuneration for the Executive Board are shown in the table to the right. The two incentive schemes are described in more detail below.
Cash-based incentive schemes (STI)The cash-based incentive scheme is an annual bonus with a target of 15% of the fixed salary and may not exceed 30%. The Nomination and Remuneration Committee sets the targets
Remuneration structure and remuneration for the Executive Board
Henrik Poulsen Marianne Wiinholt
Element 2018 2017 2016 2018 2017 2016 Objective Remuneration level Performance measure
Fixed salary 10,500 9,700 9,238 5,900 5,061 4,820 Attract and retain qualified managers.
Competitive, but not market leading, compared to the level in similar major listed Danish companies with international activities.
Cash-based incentive schemes (STI)
2,993 2,656 2,135 1,637 1,348 1,239 Ensure shared ownership of the entire company’s performance and a clear link between value creation and pay-out.
Target of 15% of the fixedsalary. The maximum bonus amounts to 30% and will be paid-out in case of full achievement of all performance targets.
The performance reward agreement con-sists of three targets:– specific individual
business targets and leadership (60%)
– financial target (30%)– safety target (10%).
Share-based incentive scheme (LTI)
2,306 1,367 1,427 1,231 713 889 Reward long-term value creation and align the Executive Board’s interests with those of the shareholders.
Target of 20% of the annual fixed salary at the date of grant. After three years, shares will be allocated at 0-200% of the number of PSUs granted, depending on Ørsted’s total shareholder return compared to peers.
The final number ofshares will be determi-ned on the basis of Ør-sted’s total shareholder return benchmarked against ten peers.
IPO Executive Retention Bonus
1,232 1,848 616 643 964 321 Retain the ExecutiveBoard after the IPO.Phasing into a share based long-termincentive scheme.
20% of the fixed annualsalary at 1 July 2016.
Employment at 1 September 2017 and1 September 2018, respectively.
Pension, incl. social security and benefits
313 326 187 242 196 244 The members of the Executive Board are not entitled to pension contribu-tions, only social security.
Severance pay If a member of the Executive Board is terminated by the company, the person is entitled to 24 months’ sa-lary, composed of full remuneration during the 12 month notice period and 12 months of severance pay (fixed salary only).
Total, DKK ’000 17,344 15,897 13,605 9,653 8,282 7,513
STI in % of maximum bonus
95% 91% 91% 93% 88% 94%
Ørsted Annual report 2018 Management’s review Governance
63 / 193
Contents

for and assesses the performance of the CEO. The Chairman of the Board of Directors and the CEO set the targets for and assess the performance of the CFO.
The Executive Board’s specific individual business targets are tied directly to Ørsted’s green growth strategy to build out renewable energy. The specific individual business targets comprise a number of items which are defined at the beginning of the year and updated dur-ing the year if new targets become relevant to ensure continuous alignment with shareholder interests. See table to the right for a more detailed description of the targets.
Share-based incentive scheme (LTI)The Executive Board is covered by a share programme. It is a condition for being grant-ed performance share units (PSUs) that the participant holds a number of Ørsted shares, representing a value equal to a share of each participant’s fixed salary. For the CEO, this share is 75% of the fixed salary, and for the CFO it is 50%.
If the participants fulfil the shareholding re-quirement at the time of the annual grant, they will receive a number of PSUs, representing a value equal to 20% of their fixed salary on the date of granting.
The PSUs granted have a vesting period of three years, after which each PSU entitles the holder to receive a number of shares free of charge, corresponding to 0-200% of the number of PSUs granted. Assuming no share price development since the grant, this would correspond to 0-40% of the fixed salary on the date of grant. The final number of shares
for each participant will be determined on the basis of the total shareholder return delivered by Ørsted, benchmarked against ten compa-rable European energy companies, i.e. 200% if Ørsted ranks first, 100% if sixth, and no shares if we rank last. At the end of 2018, Ørsted ranked first, second and fourth, respectively, in the three outstanding share-programmes against the ten peers.
If a member of the Executive Board leaves Ørsted as a result of his or her own resignation or due to breach of his or her employment, the entitlement to shares vesting after the notice period is lost.
The IPO Executive Retention Programme, which purpose was to phase into a long-term share based incentive scheme, expired in 2018, as the LTI programme will start to vest from 2019.
The table shows that both members of the Executive Board meet the share capital requirement.
The table is a non-exhaustive summary of the individual business targets for our CEO and CFO as
well as shared Group targets. They must deliver fully on all their individual targets in order to achieve the
maximum cash bonus (STI).
The other members of the Group Executive Manage-ment have their own individual business targets and
are remunerated according to the same model as described to the right.
Number of PSUs and shares owned by the Executive Board
Henrik Poulsen Marianne Wiinholt
Share-programme
Maximum number of PSUs at 31 December 2018 41,368 22,062
Maximum fair value of PSUs at 31 December 2018 DKK 18 million DKK 10 million
Current holding of Ørsted shares
Number of Ørsted shares owned 130,500 83,916
Fair value of Ørsted shares at 31 December 2018 in percentage of fixed salary for 2018 542% 620%
Overview of targets and performance in the cash bonus (STI)
Objectives and performance 2018
Henrik Poulsen Marianne Wiinholt
Objectives Score Objectives Score
Safety target (10%) – TRIR compared to target 100% – TRIR compared to target 100%
Financial target (30%) – EBITDA compared to guidance 100% – EBITDA compared to guidance 100%
Specific individual business targets and leadership (60%)
– First-class safety culture and standards
– ROCE in line with plan– Deliver major construction
projects on budget and time– Winning auctions and/or securing
key access rights/permits in Offshore’s existing and new strategic markets, e.g. the US and Taiwan, with a sustained focus on value creation
– Investigate and pursue additional value-creating growth opportunities within renewable energy, incl. potential acquisitions
– Continue to reduce the cost of electricity in offshore wind
– Farm-down of Hornsea 1– Develop potential new markets for offshore wind
92% – First-class safety culture and standards
– ROCE in line with plan– Manage capital structure within
current rating commitments– Support green growth by
providing high-quality decision input related to financial analysis, tax, risk management, funding, etc.
– Proactively manage risks related to currencies, interest rates and inflation
– Increase quality and cost effectiveness in IT and exploit digital opportunities
– Develop plan and implement initiatives to raise IT security level
– Lead the implementation of the GDPR project
– Update the tax strategy
88%
Ørsted Annual report 2018 Management’s review Governance
64 / 193
Contents

Clawback clauseThe Executive Board’s incentive schemes are subject to a clawback clause whereby any paid-out bonus must be repaid if:
— the circumstances and data that the bonus was based on are erroneous
— the Executive Board member knew or should have known about this circumstance.
The Executive Board member must repay any amount of the incentive pay received in excess of the incentive pay calculated, applying the correct data.
Remuneration 2018The remuneration paid to our CEO totalled DKK 17.3 million in 2018, representing an increase of 9.1% compared to 2017. The cash bonus (STI) made up DKK 3.0 million, corre-sponding to 92% of the maximum bonus. The bonus percentage reflects a performance exceeding the targets for the Group’s financial and safety results. The score for the CEO’s spe-cific individual business targets and leadership is also at the high end of the range. See table on page 64 for an overview of the specific individual business targets.
The remuneration paid to our CFO totalled DKK 9.7 million, representing an increase of 16.6% compared to 2017. The cash bonus (STI) made up DKK 1.6 million, corresponding to 88% of the maximum bonus. The bonus percentage reflects a performance exceeding the targets for the Group’s financial and safety results. The score for the CFO’s specific individual business targets and leadership is also at the high end of the range.
Remuneration multiple 2018, Board of Directors and committees
Board of Directors
Audit and Risk Committee
Nomination and Remuneration Committee
Chairman 3.0 0.6 0.4
Deputy Chairman 2.0 n.a. n.a.
Member 1.0 0.3 0.25
Remuneration of the Board of Directors
DKK ’000 Annual fee
Audit and Risk
Committee
Nomination and
Remuneration Committee 2018 2017
Thomas Thune Andersen1 960 - 128 1,088 1,088
Lene Skole1 640 24 80 744 803
Hanne Steen Andersen1 320 - - 320 320
Lynda Armstrong 320 - - 320 320
Poul Dreyer1 320 - - 320 320
Pia Gjellerup 320 - 80 400 400
Benny Gøbel1 320 - - 320 320
Benny D. Loft 320 192 - 512 512
Peter Korsholm (joined in March 2017)1 320 96 - 416 347
Dieter Wemmer (joined in March 2018) 267 80 - 347 -
Jørgen Kildahl (joined in March 2018) 267 - - 267 -
Jens Nybo Stilling Sørensen (resigned in March 2018)
80 - - 80 320
Poul Arne Nielsen (resigned in March 2017)
- - - - 80
Claus Wiinblad (resigned in March 2017) - - - - 104
Total 4,454 392 288 5,134 4,934
The table shows the remuneration paid to the mem-bers of the Board of Directors and committees. The remuneration of the Board of Directors comprises a fixed fee only, and the fee remains unchanged at DKK 320,000 as last year.
The remuneration multiples are unchanged from 2017.
1) At 31 December 2018, the board members own the following number of shares in Ørsted A/S: Thomas Thune Andersen 550 (2017: 0), Lene Skole 1,160 (2017: 0), Peter Korsholm 4,500 (2017: 4,500), Hanne Steen Andersen 2,394 (2017: 3,187), Poul Dreyer 837 (2017: 837), Benny Gøbel 1,087 (2017: 837). No other board members own shares in Ørsted A/S.
In 2018, the remuneration under the share-based incentive programme consisted of the market value of the scheme at the time of granting, distributed over the vesting period. Both members of the Executive Board are covered by the share programmes from Sep-tember 2016, April 2017 and April 2018. The IPO retention bonuses for 2017 and 2018 constitute the phase-in to the vesting of the first share programme in May 2019. The decreases in the IPO retention bonuses in 2018 are attributable to the fact that the scheme covered only eight months of 2018 after which it expired.
Comparison to development in the Group’s average salaryIn 2018, the fixed salary for the CEO and CFO increased by 8.2% and 16.6%, respectively, which was more than the average salary in-crease in the Group of 2.9%1 (2.8% in Denmark). The higher increases for the CEO and CFO were given to narrow the gap in total remuneration compared to the market median levels for similar roles in large Danish peer companies.
Remuneration of the Board of Directors
Remuneration structureThe members of the Board of Directors receive a fixed fee each year. The Chairmanship and the members of the committees also receive a multiple of the fixed fee for their extra work. None of the members receive separate fees for consultancy work for Ørsted. The members’ travel costs are covered by the company. The members are not entitled to severance payments.
1) Calculated based on the salary after the yearly salary adjustment for all employees who remained employed at the time of the yearly salary adjustment.
Ørsted Annual report 2018 Management’s review Governance
65 / 193
Contents

Impact on FFO/adjusted net debt
Impa
ct o
n va
lue
HighLow
High
Risk and risk managementRisks are a natural and integral part of our business activities. Our aim is to mitigate our risks and reduce them to an acceptable level through risk management.
We are exposed to several risks. In addition to operational, business and environmental risks, we are exposed to fluctuations in exchange rates, interest rates, inflation and commodity prices, as well as credit and insurance risks. The purpose of our risk management is to identify all risks we are exposed to and decide how best to manage and mitigate them. We assess the extent to which individual risks are acceptable or perhaps even desirable, as well as the extent to which these risks can be reduced to ensure an optimum balance between risk and return.
To a large extent, our earnings are centred within offshore wind and other green energy technologies. Although, Denmark and the UK are key contributors to our current earnings, our future earnings will increasingly be spread across different geographical regions and technologies. Therefore, political and other macroeconomic factors play an important role in our risk management. When we invest in new assets and activities or divest assets, the risk associated with our portfolio changes. We therefore assess the impact of a given decision on the portfolio in advance.
We work systematically with risks and follow a plan for the year according to which all business units and selected staff functions identify and prioritise business risks. An assessment is made of the potential financial impact of individual risks, and whether they are of a short-term (0-2 years), medium-term (2-5 years), long-term (5+ years) or recurring nature. All of our risks are then consolidated and evaluated at Group level. The ultimate responsibility for all the individual risks rests with a member of the Group Executive Com-mittee. As for business risks, similar processes are in place for identifying and prioritising risks related to sustainability, cybersecurity and legal compliance.
The top five business risks identified during 2018 are shown to the right, where they are illustrated based on their potential impact (post-risk mitigation) on our value and credit metrics over the next years. You can read more about these risks on the following pages.
Brexit is not in itself part of our top five busi-ness risks, as the UK’s decision to leave the EU will not, in our opinion, result in fundamental changes in the UK’s energy policy. Recent announcements by the UK Government show that the UK is committed to a clean, green energy future, and offshore wind can be the backbone of this green vision. We have ana-lysed a number of Brexit scenarios and believe that even if a deal is not reached between the UK and the EU, and there is a disruption to the
Top 5 business risks Effect on our value and credit metric
flow of goods between the UK and the EU, trade and customs facilities will still function in the medium term. Our most significant risk related to Brexit is assessed to be a long-term depreciation of the GBP, which is a part of our top 1 business risks.
The risks related to sustainability, cyberse-curity and legal compliance are assessed using different parameters, which is why we are unable to show a consolidated picture of our combined risks. A description of the most significant sustainability risks can be found in our sustainability report and for each of the other two areas on page 69.
We are also exposed to risks which have a very small probability of occurring, but which could potentially impact our finances and/or reputation substantially. These risks include, but are not limited to:
— 1,000-year storms, hurricanes, typhoons or earthquakes, which may lead to the loss of offshore and onshore wind farms
— broken pipes at the Nybro Gas Treat-ment Plant in Denmark, which may lead to personal injury and damage to the environment
— breakdowns at power stations that may lead to personal injury and loss of assets.
After risk-reducing measures are implemented, the Group Executive Management assesses whether the level of each risk is appropriate or
(#1 2017)
Currency, inflation and interest rates
(#1 2017)
Commodity prices
(#2 2017)
Development and construction of production assets
(#3 2017)
Operation of offshore wind farms
(#4 2017)
Regulatory risks within offshore wind
Quantification of risks is based on a scenario where the risk occurs with 10% probability (P90). Our Internal Audit function has examined the process for identify-ing and measuring the accompanying portfolio risks.
Ørsted Annual report 2018 Management’s review Governance
66 / 193
Contents

slightly or significantly higher than the desired level. If the risk level is still too high, further risk-reducing measures are initiated to the extent possible.
Climate-related risksWe address climate-related risks and opportu-nities as an integral part of our daily business, as these are directly linked to our green vision and strategy. We seek to exploit climate-related opportunities through our develop-ment and construction of renewable heat and power generation capacity and adjacent sus-tainable activities. At the same time, we seek to reduce both our transitional and physical climate-related risks in the short, medium and long term. We do that by, among other things:— influencing regulators and other public
authorities toward ambitious targets for the build-out of renewable capacity and regulatory frameworks that support this
— continuously working to improve the future competitiveness of green technologies, i.e. lowering the levelised cost of electricity
— assessing acute and chronic weather development; in particular wind speeds and patterns, but also the temperature and precipitation levels in general
— taking extreme weather conditions and other relevant factors into account when we design and construct our assets.
In that way, we seek to avoid ending up with stranded assets or assets and activities with a significantly lower value than originally expected, which we potentially need to write down or provide for.
When we prepare business cases for invest-ments in new assets or activities, we take
climate-related risks and opportunities into account by assessing the expected changes in the technology mix that will be delivering heat and power in the future. On this basis, we assess the expected derived impact on input and output prices of energy, including the price development of components and services to be used for the construction of these assets as part of our LCoE analysis.
Our planning scenario until 2040 for the power systems in North Western Europe is in accordance with a carbon emission reduction trajectory for these countries leading to a 2-degree temperature increase.
We track the impact of undertaking these new investments on our carbon footprint to enable us to disclose our own direct green-house gas emissions from heat and power generation and the derived avoided emissions from displacing fossil-based generation. We have also recently started to track and assess the total impact on greenhouse gas emissions across our entire business portfolio as well as across the full value chain from our procure-ment through to the final consumption at our end-users.
Development in risks in 2018The acquisitions of US-based Deepwater Wind and Lincoln Clean Energy in 2018 have significantly increased our exposure to the US market, and the allocation of grid capacity in Taiwan will significantly increase our exposure to this market if we continue with our projects. These developments have had an impact on the ranking of our top five business risks.
Due to our increased international activities, we have divided our market risks into currency, inflation and interest rate risks, and commod-ity price risks. Our exposure to exchange rate fluctuations, primarily GBP, USD and poten-tially New Taiwan dollar (NTD), has increased due to significant investments in offshore wind in these areas. Currency and interest rate risks are deemed to be our most significant business risk, whereas commodity prices are rated our second largest risk.
Our third largest risk now includes the devel-opment and construction of production assets in new markets, where there are higher risks associated with construction, among other things, due to the need for developing the value chain in these immature markets.
Risks associated with the operation of off-shore wind farms is our fourth largest risk.
Regulatory risks within offshore wind is our fifth largest risk and has renewed focus due to the expansion into new markets.
A continued reduction of the levelised cost of electricity (LCoE) remains a key focus area, but has moved out of our top five risks.
Ørsted Annual report 2018 Management’s review Governance
67 / 193
Contents
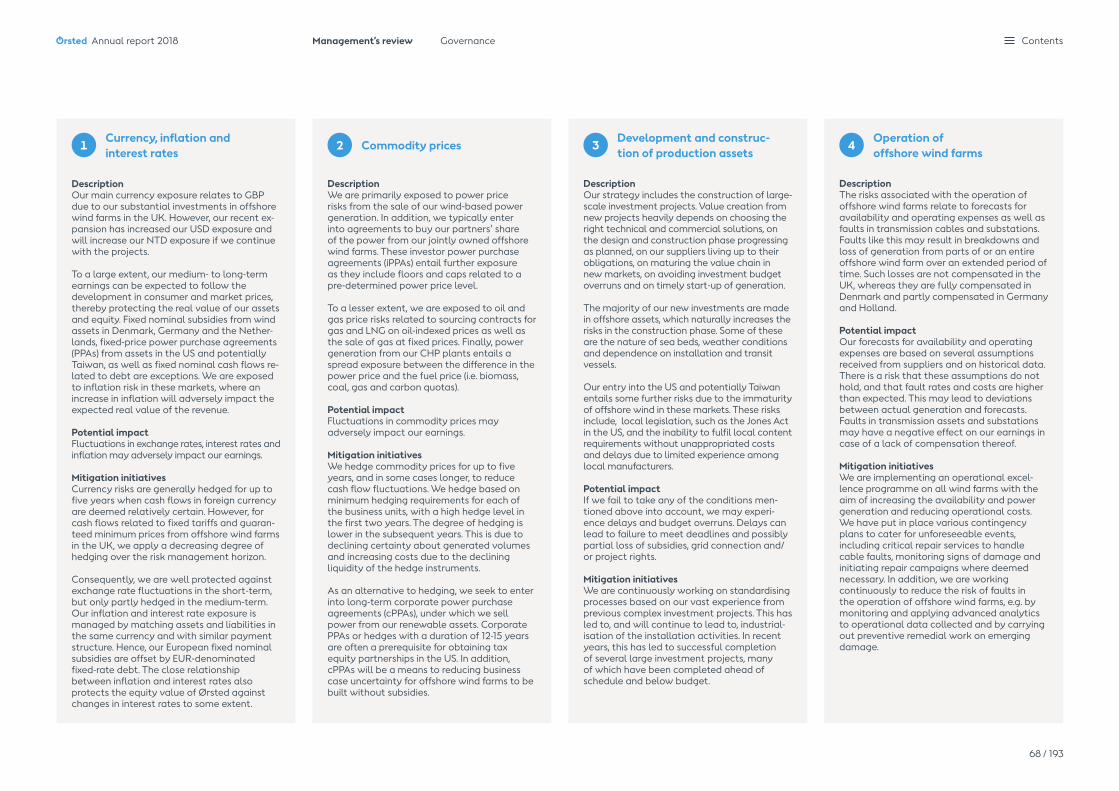
Description Our main currency exposure relates to GBP due to our substantial investments in offshore wind farms in the UK. However, our recent ex-pansion has increased our USD exposure and will increase our NTD exposure if we continue with the projects.
To a large extent, our medium- to long-term earnings can be expected to follow the development in consumer and market prices, thereby protecting the real value of our assets and equity. Fixed nominal subsidies from wind assets in Denmark, Germany and the Nether-lands, fixed-price power purchase agreements (PPAs) from assets in the US and potentially Taiwan, as well as fixed nominal cash flows re-lated to debt are exceptions. We are exposed to inflation risk in these markets, where an increase in inflation will adversely impact the expected real value of the revenue.
Potential impactFluctuations in exchange rates, interest rates and inflation may adversely impact our earnings.
Mitigation initiativesCurrency risks are generally hedged for up to five years when cash flows in foreign currency are deemed relatively certain. However, for cash flows related to fixed tariffs and guaran-teed minimum prices from offshore wind farms in the UK, we apply a decreasing degree of hedging over the risk management horizon.
Consequently, we are well protected against exchange rate fluctuations in the short-term, but only partly hedged in the medium-term. Our inflation and interest rate exposure is managed by matching assets and liabilities in the same currency and with similar payment structure. Hence, our European fixed nominal subsidies are offset by EUR-denominated fixed-rate debt. The close relationship between inflation and interest rates also protects the equity value of Ørsted against changes in interest rates to some extent.
Description We are primarily exposed to power price risks from the sale of our wind-based power generation. In addition, we typically enter into agreements to buy our partners’ share of the power from our jointly owned offshore wind farms. These investor power purchase agreements (iPPAs) entail further exposure as they include floors and caps related to a pre-determined power price level.
To a lesser extent, we are exposed to oil and gas price risks related to sourcing contracts for gas and LNG on oil-indexed prices as well as the sale of gas at fixed prices. Finally, power generation from our CHP plants entails a spread exposure between the difference in the power price and the fuel price (i.e. biomass, coal, gas and carbon quotas).
Potential impactFluctuations in commodity prices may adversely impact our earnings.
Mitigation initiativesWe hedge commodity prices for up to five years, and in some cases longer, to reduce cash flow fluctuations. We hedge based on minimum hedging requirements for each of the business units, with a high hedge level in the first two years. The degree of hedging is lower in the subsequent years. This is due to declining certainty about generated volumes and increasing costs due to the declining liquidity of the hedge instruments.
As an alternative to hedging, we seek to enter into long-term corporate power purchase agreements (cPPAs), under which we sell power from our renewable assets. Corporate PPAs or hedges with a duration of 12-15 years are often a prerequisite for obtaining tax equity partnerships in the US. In addition, cPPAs will be a means to reducing business case uncertainty for offshore wind farms to be built without subsidies.
Description Our strategy includes the construction of large-scale investment projects. Value creation from new projects heavily depends on choosing the right technical and commercial solutions, on the design and construction phase progressing as planned, on our suppliers living up to their obligations, on maturing the value chain in new markets, on avoiding investment budget overruns and on timely start-up of generation.
The majority of our new investments are made in offshore assets, which naturally increases the risks in the construction phase. Some of these are the nature of sea beds, weather conditions and dependence on installation and transit vessels.
Our entry into the US and potentially Taiwan entails some further risks due to the immaturity of offshore wind in these markets. These risks include, local legislation, such as the Jones Act in the US, and the inability to fulfil local content requirements without unappropriated costs and delays due to limited experience among local manufacturers.
Potential impactIf we fail to take any of the conditions men-tioned above into account, we may experi-ence delays and budget overruns. Delays can lead to failure to meet deadlines and possibly partial loss of subsidies, grid connection and/or project rights.
Mitigation initiativesWe are continuously working on standardising processes based on our vast experience from previous complex investment projects. This has led to, and will continue to lead to, industrial-isation of the installation activities. In recent years, this has led to successful completion of several large investment projects, many of which have been completed ahead of schedule and below budget.
Description The risks associated with the operation of offshore wind farms relate to forecasts for availability and operating expenses as well as faults in transmission cables and substations. Faults like this may result in breakdowns and loss of generation from parts of or an entire offshore wind farm over an extended period of time. Such losses are not compensated in the UK, whereas they are fully compensated in Denmark and partly compensated in Germany and Holland.
Potential impactOur forecasts for availability and operating expenses are based on several assumptions received from suppliers and on historical data. There is a risk that these assumptions do not hold, and that fault rates and costs are higher than expected. This may lead to deviations between actual generation and forecasts. Faults in transmission assets and substations may have a negative effect on our earnings in case of a lack of compensation thereof.
Mitigation initiativesWe are implementing an operational excel-lence programme on all wind farms with the aim of increasing the availability and power generation and reducing operational costs. We have put in place various contingency plans to cater for unforeseeable events, including critical repair services to handle cable faults, monitoring signs of damage and initiating repair campaigns where deemed necessary. In addition, we are working continuously to reduce the risk of faults in the operation of offshore wind farms, e.g. by monitoring and applying advanced analytics to operational data collected and by carrying out preventive remedial work on emerging damage.
Currency, inflation and interest rates
Commodity pricesDevelopment and construc-tion of production assets
Operation of offshore wind farms
2 3 41
Ørsted Annual report 2018 Management’s review Governance
68 / 193
Contents
Description The risk associated with regulatory regimes is twofold. First, it is associated with the possibilities for obtaining subsidies or in other ways support for offshore build-out. Secondly, it is associated with the possibilities for obtaining the needed consents, grid connections and relevant approvals from local authorities, including permits or other agreements needed to secure a viable project.
Although the EU countries have increased their 2030 renewable energy targets, the implemen-tation rests with the member states, which means that some uncertainty still prevails. In the US, several East Coast states have committed themselves to offshore build-out, and Taiwan is also expected to continue the build-out of offshore wind towards 2030.
Most markets have tender or auction-based subsidy regimes, where the only or most important factor is the bid price. However, in some countries, a certain level of local content is required.
Potential impactWe do not expect changes to be made to the subsidy schemes with retrospective effect for existing offshore wind projects. The greatest risks are associated with the need to obtain relevant consents and approvals from local authorities and to be connected to the grid. Delays in these areas may lead to total or partial loss of subsidies. This risk is significantly reduced for projects where subsidies and pos-sibly project rights are granted in competitive bidding processes.
Mitigation initiativesWe mitigate the risk by monitoring political and regulatory developments in all relevant countries and by engaging in an active dia-logue with relevant authorities about environ-mental approvals, regulatory milestones and the economic regimes. We also engage in the development of local capabilities to increase local content in the projects.
Description In recent years, several major cyberattacks have been launched against companies around the world, and according to the Danish Centre for Cybersecurity, the risk of cyberat-tacks aimed at Danish companies is high. Thus, we have a strong focus on IT security.
We are responsible for critical infrastructure, and we own various types of intellectual property rights. This means that we are a potential target for cyberattacks or industrial espionage.
Potential impactMinor digital risk events like viruses and attempted break-ins are everyday risks without significant impact. However, major cyberattacks or events may impact all or part of our shared infrastructure for administrative systems or industrial control systems. For the latter, the impact could range from a single asset to potentially all assets and activities in the company. Cyberattacks of a certain size can be costly if it forces us to shut down operations for a period of time.
Mitigation initiativesWe have launched a significant resourced programme with the aim to improve resilience against cyberattacks and other threats across Ørsted. In addition, we are running cyber risk awareness campaigns throughout the organisation in order to decrease threats from phishing campaigns, etc.
Furthermore, we are participating in relevant forums across the energy sector to harvest and contribute with information and experi-ence. One example is the Systems & Cyber Resilience working group organised by the World Economic Forum. We are also part of the Danish Network Security Service under the Danish Ministry of Defence to enhance resilience.
Description Risks associated with legal compliance are assessed based on financial and reputation-al significance and probability. Our most significant risks are financial regulation, the EU General Data Protection Regulation (GDPR) and tender law.
We are subject to several financial regulations, such as REMIT, MAR, EMIR, Dodd Frank, MiFID, SFTR and AML. The financial regulations are relevant for a large part of our activities. In relation to GDPR, we are primarily processing personal data regarding our Danish residential customers and our employees. Most of our contracts for goods, services and works are subject to EU and local tender law rules.
Potential impactFailure to comply with the above-mentioned rules and regulations may result in severe legal sanctions, such as imprisonment, fines and damage claims.
Mitigation initiativesWe have implemented comprehensive policies, procedures, training and controls for relevant parts of our business to ensure compliance with financial regulations.
To ensure that we process personal data in compliance with GDPR, we have mapped and analysed our personal data processing and developed a Group-wide compliance pro-gramme. The compliance programme includes various organisational and technical measures and mandatory training of employees in risk-exposed positions.
To counter the tender law risk, our procure-ment department is involved in almost all pro-curement activities, and our legal department carries out courses on tender law and review of documents for larger tenders.
Regulatory risks within offshore wind
Cybersecurity Legal compliance5
Ørsted Annual report 2018 Management’s review Governance
69 / 193
Contents

Jan Feb Mar Apr May June July Aug Sep Oct Nov Dec
DKK
200
300
400
500
Shareholder informationThe Ørsted share yielded a total return of 32% in 2018, an increase in the share price of 29%, and dividends of DKK 9 per share.
Price development for the Ørsted share in 2018The Ørsted share started the year at a price of DKK 339 and closed the year at DKK 436. Prices of comparable European utility compa-nies decreased by 1%, and the OMX C25 cap decreased by 13% in 2018. The market value
of Ørsted was DKK 183 billion at the end of the year. Since the IPO in June 2016, the Ørsted share has generated an aggregate return from share price appreciation and dividends of 92%.
The year’s highest traded price of 474 was on 28 November. The year’s lowest traded price of 332 was on 3 January.
The average daily turnover on Nasdaq Copenhagen was 447,000 shares. The trading volume showed a decrease of 38% compared to 2017. This was particularly due to several of
Share price development in 2018 Ørsted share price compared to peers.
the original shareholders opting to sell all or some of their shareholdings in 2017 at a total trading value of DKK 17 billion. Share capital Ørsted’s share capital is divided into 420 million shares, enjoying the same voting and dividend rights. The company’s share capi-tal remained unchanged in 2018. At the end of 2018, the company held a total of 335 thousand treasury shares, which will be used to cover incentive schemes.
Composition of shareholdersAt the end of the year, the number of share-holders had increased by 5,175 to 29,727. Although the geographical spread of the share capital was greater, most of it (66%) is still with Danish owners. The figure on the next page shows the composition of our sharehold-ers by country, specifying the three share-holders each holding more than 5% of the share capital. Around 1% of the share capital is owned by private investors.
Annual general meeting and dividendsThe annual general meeting will be held on 5 March 2019 in Copenhagen. Dividends for the year are expected to amount to DKK 9.75 per share, corresponding to DKK 4.1 billion. In 2018, dividends of DKK 9.00 per share were paid for the 2017 financial year, corresponding to a return of 2.2% relative to a share price of DKK 436 at 31 December 2018.
Selected company announcements in 2018
27 Apr. Ørsted wins 552MW in German offshore wind auction
30 Apr. Taiwan awards Ørsted 900MW grid capacity for offshore wind
24 May The High Court of Western Denmark rules in favour of Ørsted in case concerning the former Elsam
22 June Ørsted wins 920MW offshore wind projects in Taiwan
26 June Ørsted initiates a structured divestment process for its Danish power distribution and residential customer businesses
9 Aug. Ørsted agrees to acquire Lincoln Clean Energy, a US onshore wind developer
18 Sep. Ørsted agrees to divest 50% of Hornsea 1 Offshore Wind Farm
8 Oct. Ørsted agrees to acquire Deepwater Wind and creates leading US offshore wind platform
2 Jan.2019
Establishment permit and power pur-chase agreement delayed on Taiwanese offshore wind projects
Financial calendar 2019
31 Jan. Annual report 2018
5 Mar. Annual general meeting
1 May Interim report for the first quarter of 2019
8 Aug. Interim report for the first half-year of 2019
30 Oct. Interim report for the first nine months of 2019
Ørsted MSCI Europe Utilities OMX C25
Ørsted Annual report 2018 Management’s review Governance
70 / 193
Contents

12%
1%
5%
5-10%
10%
50%
6%
7%
Share information
ISIN DK 0060094928220
Share classes 1
Nominal value DKK 10 per share
Average daily volume 447,103
Exchange Nasdaq OMX Copenhagen
Ticker ORSTED
Year high DKK 474 (28 Nov.)
Year low DKK 332 (3 Jan.)
Registered share 99.6%
Number of shares 420,381,080 shares
Number of treasury shares 335,904 shares
Shareholders at 31 December 2018, voting share %*
Danish State (majority shareholder) SEAS-NVE, Denmark The Capital Group North America The UK Danish institutional investors Private investors Others
* See note 16 in the parent company financial statements.
Investor RelationsIn order to achieve a fair pricing of our shares and corporate bonds, we seek to ensure a high level of openness and stability in our financial communication. In addition, our management and Investor Relations function engage in regular dialogue with investors and analysts. The dialogue takes the form of quarterly conference calls, roadshows, conferences, cap-ital markets days and regular meetings with individual or groups of investors and analysts. The dialogue is subject to certain restrictions from three weeks prior to the publication of our financial reporting.
On 28 November 2018, Ørsted hosted a Capital Markets Day in Gentofte with more than 150 participants, mainly equity and institutional investors. CEO Henrik Poulsen presented Ørsted’s new ambitious targets for the Group’s long-term strategy and financial development, followed by breakout sessions hosted by the management team. The full Capital Market Day material is available at orsted.com/en/capital-markets-day.
The Group is covered by 22 equity analysts and 12 bond analysts. Their recommendations and consensus estimates for Ørsted’s future financial performance are available at orsted.com/en/investors. On this site, you can also download our financial reports, investor pre- sentations and a wide range of other data.
Ørsted Annual report 2018 Management’s review Governance
71 / 193
Contents

Financial statements 20181 January – 31 December
Ørsted Annual report 2018

Income statement 1 January - 31 December
2018 2017
Note DKKmBusiness
performance Adjustments IFRSBusiness
performance Adjustments IFRS
2.2, 2.4 Revenue 76,946 (1,426) 75,520 59,504 205 59,709
2.3 Cost of sales (53,906) (112) (54,018) (40,544) (150) (40,694)
Other external expenses (5,865) - (5,865) (4,241) - (4,241)
2.6, 2.7 Employee costs (3,126) - (3,126) (3,197) - (3,197)
Share of profit (loss) in associates and joint ventures (6) - (6) (119) - (119)
2.5 Other operating income 16,275 - 16,275 11,665 - 11,665
2.5 Other operating expenses (289) - (289) (549) - (549)
Operating profit (loss) before depreciation, amortisation and impairment losses (EBITDA) 30,029 (1,538) 28,491 22,519 55 22,574
3.1 Amortisation, depreciation and impairment losses on intangible assets and property, plant and equipment (5,375) - (5,375) (6,284) - (6,284)
Operating profit (loss) (EBIT) 24,654 (1,538) 23,116 16,235 55 16,290
3.4 Gain on divestment of enterprises 127 - 127 (139) - (139)
Share of profit (loss) in associates and joint ventures 1 - 1 (10) - (10)
6.5 Financial income 3,179 - 3,179 4,253 - 4,253
6.5 Financial expenses (4,457) - (4,457) (5,295) - (5,295)
Profit (loss) before tax 23,504 (1,538) 21,966 15,044 55 15,099
5.2 Tax on profit (loss) for the year (4,018) 318 (3,700) (1,765) (13) (1,778)
Profit (loss) for the year from continuing operations 19,486 (1,220) 18,266 13,279 42 13,321
3.7 Profit (loss) for the year from discontinued operations 10 - 10 6,920 (816) 6,104
Profit (loss) for the year 19,496 (1,220) 18,276 20,199 (774) 19,425
Profit (loss) for the year is attributable to:
Shareholders in Ørsted A/S 19,046 (1,220) 17,826 19,493 (774) 18,719
Interests and costs after tax, hybrid capital owners of Ørsted A/S 425 425 716 716
Non-controlling interests 25 25 (10) (10)
6.2 Profit (loss) per share, DKK:
From continuing operations 45.3 42.4 29.9 30.0
From discontinued operations 0.0 0.0 16.5 14.5
Total profit (loss) per share 45.3 42.4 46.4 44.5
Accounting policies
Business performanceThe business performance principle is our alternative performance measure. According to IFRS, market value adjustments of energy contracts and related currency risks (including hedging) are recognised on an ongoing basis in the profit (loss) for the year, whereas under the business performance principle, they are deferred and recognised in the period in which the hedged exposure materialises. The difference between IFRS and business performance is specified in the 'Adjustments' column. Read more about the business performance principle in note 1.6 'Business performance'.
Profit (loss) for the year from our continuing operationsOur former Oil & Gas business, which was divested on 29 September 2017, is presented as discontinued operations.
Profit (loss) per shareDiluted profit (loss) per share corresponds to profit (loss) per share, as the dilutive effect of the share incentive programme is less than 0.1% of the share capital.
Ørsted Annual report 2018 Financial statements Consolidated financial statements
73 / 193
Note summary Contents
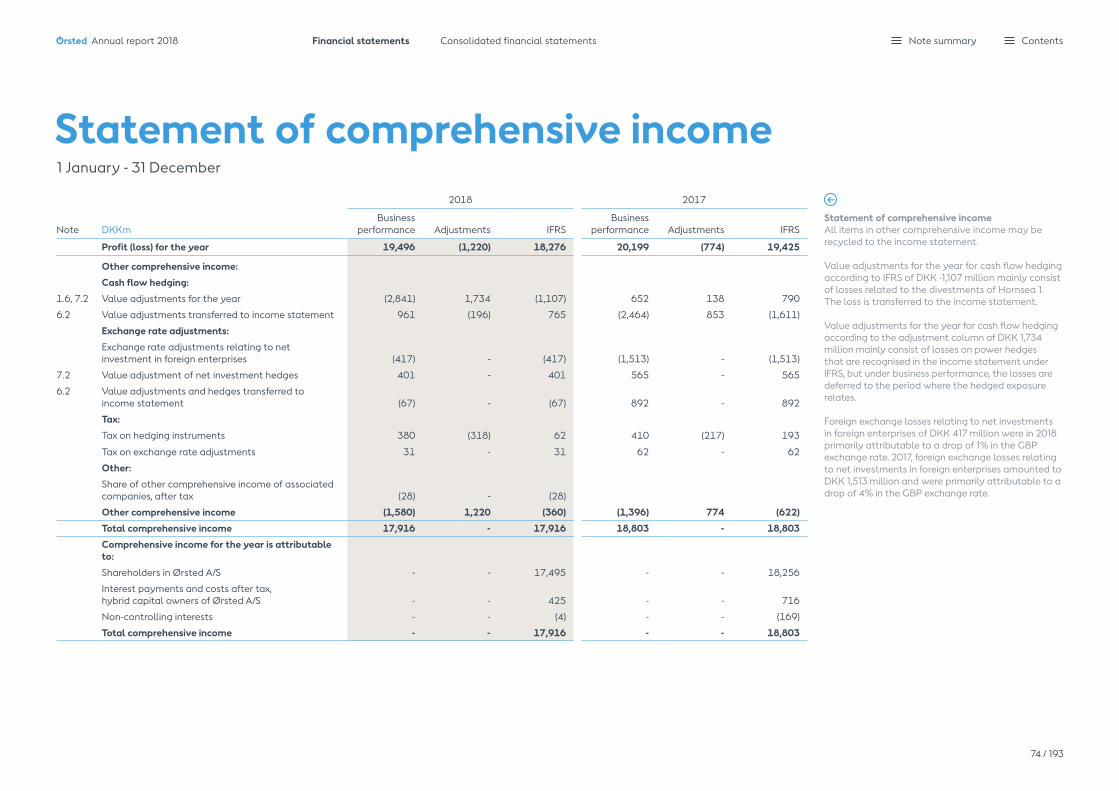
Statement of comprehensive income 1 January - 31 December
2018 2017
Note DKKmBusiness
performance Adjustments IFRSBusiness
performance Adjustments IFRS
Profit (loss) for the year 19,496 (1,220) 18,276 20,199 (774) 19,425
Other comprehensive income:
Cash flow hedging:
1.6, 7.2 Value adjustments for the year (2,841) 1,734 (1,107) 652 138 790
6.2 Value adjustments transferred to income statement 961 (196) 765 (2,464) 853 (1,611)
Exchange rate adjustments:
Exchange rate adjustments relating to net investment in foreign enterprises (417) - (417) (1,513) - (1,513)
7.2 Value adjustment of net investment hedges 401 - 401 565 - 565
6.2 Value adjustments and hedges transferred to income statement (67) - (67) 892 - 892
Tax:
Tax on hedging instruments 380 (318) 62 410 (217) 193
Tax on exchange rate adjustments 31 - 31 62 - 62
Other:
Share of other comprehensive income of associated companies, after tax (28) - (28)
Other comprehensive income (1,580) 1,220 (360) (1,396) 774 (622)
Total comprehensive income 17,916 - 17,916 18,803 - 18,803
Comprehensive income for the year is attributable to:
Shareholders in Ørsted A/S - - 17,495 - - 18,256
Interest payments and costs after tax, hybrid capital owners of Ørsted A/S - - 425 - - 716
Non-controlling interests - - (4) - - (169)
Total comprehensive income - - 17,916 - - 18,803
Statement of comprehensive incomeAll items in other comprehensive income may be recycled to the income statement.
Value adjustments for the year for cash flow hedging according to IFRS of DKK -1,107 million mainly consist of losses related to the divestments of Hornsea 1. The loss is transferred to the income statement.
Value adjustments for the year for cash flow hedging according to the adjustment column af DKK 1,734million mainly consist of losses on power hedges that are recognised in the income statement under IFRS, but under business performance, the losses are deferred to the period where the hedged exposure relates.
Foreign exchange losses relating to net investments in foreign enterprises of DKK 417 million were in 2018 primarily attributable to a drop of 1% in the GBP exchange rate. 2017, foreign exchange losses relating to net investments in foreign enterprises amounted to DKK 1,513 million and were primarily attributable to a drop of 4% in the GBP exchange rate.
Ørsted Annual report 2018 Financial statements Consolidated financial statements
74 / 193
Note summary Contents

Note Equity and liabilities, DKKm 2018 2017
6.2 Share capital 4,204 4,204
6.2 Reserves (1,827) (1,524)
Retained earnings 66,111 52,111
Equity attributable to shareholders in Ørsted A/S 68,488 54,7916.3 Hybrid capital 13,239 13,239
3.8 Non-controlling interests 3,388 3,807
Equity 85,115 71,8375.4 Deferred tax 4,025 2,128
3.2 Provisions 12,774 10,840
6.1 Bond and bank debt 25,095 25,715
4.2 Contract liabilities 3,642 -
4.5 Tax equity liabilities 3,728 -
4.6 Other payables 409 5,714
Non-current liabilities 49,673 44,3973.2 Provisions 680 680
6.1 Bond and bank debt 2,201 3,921
7 Derivatives 8,094 4,374
4.2 Contract liabilities 924 1,317
Trade payables 13,082 11,499
4.5 Tax equity liabilities 445 -
4.6 Other payables 4,793 6,368
Income tax 4,717 1,498
Current liabilities 34,936 29,657Liabilities 84,609 74,054
3.6 Liabilities relating to assets classified as held for sale 4,851 630Equity and liabilities 174,575 146,521
Balance sheet 31 December
Note Assets, DKKm 2018 2017
3.1 Intangible assets 777 6893.1 Land and buildings 969 1,501
3.1 Production assets 66,310 60,603
3.1 Fixtures and fittings, tools and equipment 342 413
3.1 Property, plant and equipment under construction 16,434 13,328
Property, plant and equipment 84,055 75,845Investments in associates and joint ventures 457 339
Receivables from associates and joint ventures 60 48
Other securities and equity investments 211 130
5.4 Deferred tax 4,588 2,865
4.4 Other receivables 2,670 1,955
Other non-current assets 7,986 5,337Non-current assets 92,818 81,871
4.1 Inventories 13,943 3,853
7 Derivatives 5,468 4,870
4.2 Contract assets 1,451 10,817
4.3 Trade receivables 10,741 9,170
4.4 Other receivables 4,390 3,519
Income tax 1,525 296
6.4 Securities 25,501 25,280
6.4 Cash 3,515 4,203
Current assets 66,534 62,0083.6 Assets classified as held for sale 15,223 2,642
Assets 174,575 146,521
Contract assets and contract liabilitiesThe adoption of IFRS 15 has changed our presenta-tion, as we have introduced contract assets and contract liabilities. As we have implemented IFRS 15 after the modified retrospective method, we have not restated comparative figures. The comparative figures we have shown for 'Contract assets' and ' Contract liabilities' were presented as 'Construction contracts' in the 2017 annual report.
The effects of change in accounting policy areidentical for business performance profit (loss). Read more about the impact in note 1.4 ' Implementation of new or changed accounting standards and interpretations'.
Ørsted Annual report 2018 Financial statements Consolidated financial statements
75 / 193
Note summary Contents

2018 2017
DKKmShare
capital Reserves* Retained earnings
Proposed dividends
Share-holders in
Ørsted A/S Hybrid capital
Non-con-trolling
interestsTotal
GroupShare
capital Reserves* Retained earnings
Proposed dividends
Share-holders in
Ørsted A/S Hybridcapital
Non-con-trolling
interestsTotal
Group
Equity at 1 January 4,204 (1,524) 48,328 3,783 54,791 13,239 3,807 71,837 4,204 20,218 12,162 2,522 39,106 13,248 5,146 57,500
Comprehensive income for the year:
Profit (loss) for the year - - 17,826 - 17,826 425 25 18,276 - - 18,719 - 18,719 716 (10) 19,425
Other comprehensive income:
Cash flow hedging - (342) - - (342) - - (342) - (821) - - (821) - - (821)
Exchange rate adjustments - (54) - - (54) - (29) (83) - 103 - - 103 - (159) (56)
Tax on other comprehensive income - 93 - - 93 - - 93 - 255 - - 255 - - 255
Share of other comprehensive income of associated companies, after tax - - (28) - (28) - - (28) - - - - - - - -
Total comprehensive income - (303) 17,798 - 17,495 425 (4) 17,916 - (463) 18,719 - 18,256 716 (169) 18,803
Transactions with owners:
Coupon payments, hybrid capital - - - - - (545) - (545) - - - - - (640) - (640)
Tax on coupon payments, hybrid capital - - - - - 120 - 120 - - - - - 141 - 141
Additions, hybrid capital - - - - - - - - - - - - - 3,668 - 3,668
Disposals, hybrid capital - - - - - - - - - - - - - (3,894) - (3,894)
Share premium reserve transferred to retained earnings - - - - - - - - - (21,279) 21,279 - - - - -
Proposed dividends - - (4,099) 4,099 - - - - - - (3,783) 3,783 - - - -
Dividends paid - - 2 (3,783) (3,781) - (400) (4,181) - - 1 (2,522) (2,521) - (376) (2,897)
Purchases of treasury shares - - (48) (48) - - (48) - - - - - - - -
Share-based payment - - 24 - 24 - - 24 - - 15 - 15 - - 15
Tax on share-based payment - - (5) - (5) - - (5) - - (3) - (3) - - (3)
Disposals, non-controlling interests - - - - - - - - - - - - - - (794) (794)
Other changes - - 12 - 12 - (15) (3) - - (62) - (62) - - (62)
Total transactions with owners - - (4,114) 316 (3,798) (425) (415) (4,638) - (21,279) 17,447 1,261 (2,571) (725) (1,170) (4,466)
Equity at 31 December 4,204 (1,827) 62,012 4,099 68,488 13,239 3,388 85,115 4,204 (1,524) 48,328 3,783 54,791 13,239 3,807 71,837
* See note 6.2 'Equity' for more information about reserves.
Statement of changes in equity 1 January - 31 December
Ørsted Annual report 2018 Financial statements Consolidated financial statements
76 / 193
Note summary Contents

Note DKKm 2018 2017
Operating profit (loss) before depreciation, amortisation and impairment losses (EBITDA), IFRS 28,491 22,574
1.6 Change in derivatives, business performance adjustments 1,538 (55)
Change in derivatives, other adjustments 369 (528)
Change in provisions (278) 98
Reversal of gain (loss) on sale of assets (14,995) (10,835)
Other items 203 297
4.7 Change in work in progress (2,326) (3,674)
4.7 Change in tax equity partner liabilities 1,835 -
4.7 Change in other working capital (427) (4,230)
Interest received and similar items 6,648 3,508
Interest paid and similar items (7,348) (3,472)
5.3 Income tax paid (3,367) (2,660)
Cash flows from operating activities 10,343 1,023
Statement of cash flows 1 January - 31 December
Accounting policies
Cash flows from operating activities are determined using the indirect method as operating profit (loss) before depreciation, amortisation and impairment losses adjusted for changes in operating items without cash flow effect. Trade payables relating to purchases of intangible assets and property, plant and equipment are not recognised in change in net working capital.
Change in work in progress consists of elements in contract assets, contract liabilities, construction management agreements related to construction of offshore wind farms, construction of offshore transmission assets (inventory) and related trade payables.
Change in tax equity partner liabilities relates to cash contributions from tax equity partners and distribu-tions of PTCs and other tax attributes to tax equity partners. See also note 4.5 'Tax equity liabilities'.
Other items primarily comprise reversal of share of profit (loss) of and dividends in associates and joint ventures as well as changes in bad debt provisions.
Cash flows from investing activities comprise payments in connection with the purchase and sale of non-current assets and enterprises as well as the purchase and sale of securities that are not recognised as cash and cash equivalents.
Cash flows from financing activities comprise changes in the size or composition of equity and loans, including net proceeds from and to tax equity partners. Proceeds from raising of short-term repo loans are presented net.
Cash flows in currencies other than the functional currency are translated at the average exchange rates for the month in question, unless these differ significantly from the rates at the transaction date.
Note DKKm 2018 2017
Purchase of intangible assets and property, plant and equipment (14,655) (17,592)
Sale of intangible assets and property, plant and equipment 19,639 16,333
3.3 Acquisition of enterprises (5,602) (83)
3.4 Divestment of enterprises 363 588
Purchase of other equity investments (78) -
Divestment of other equity investments - 28
Purchase of securities (40,444) (21,162)
Sale/maturation of securities 39,849 11,965
Change in other non-current assets (1) (5)
Transactions with associates and joint ventures (122) (139)
Dividends received and capital reduction 25 13
Cash flows from investing activities (1,026) (10,054)Proceeds from raising of loans - 5,468
Instalments on loans (6,429) (4,069)
Coupon payments on hybrid capital (545) (640)
Proceeds from issuance of hybrid capital - 3,668
Dividends paid to shareholders in Ørsted A/S (3,781) (2,521)
Purchase of own shares (48) -
3.8 Transactions with non-controlling interests (391) (431)
Net proceeds from tax equity partners 78 -
Change in other liabilities 422 (11)
Cash flows from financing activities (10,694) 1,464Cash flows from continuing operations (1,377) (7,567)
3.7 Cash flows from discontinued operations 209 9,025
Total net change in cash and cash equivalents (1,168) 1,4586.4 Cash and cash equivalents at 1 January 3,891 2,628
Total net change in cash and cash equivalents (1,168) 1,458
Cash flows for the year from assets classified as held for sale (27) (140)
Exchange rate adjustments of cash and cash equivalents (33) (55)
6.4 Cash and cash equivalents at 31 December 2,663 3,891
Our supplementary statements of gross and net investments appear from note 3.5 'Gross and net investments' and free cash flows (FCF) from note 2.1 'Segment information'.
Ørsted Annual report 2018 Financial statements Consolidated financial statements
77 / 193
Note summary Contents

Note summaryConsolidated financial statements
1. Basis of reporting . . . . . . . . . . . . . . . . . . . . 791.1 Significant changes in the current
reporting period . . . . . . . . . . . . . . . . . . . . . . 801.2 Basis of preparation . . . . . . . . . . . . . . . . . . 811.3 Key accounting estimates
and judgements . . . . . . . . . . . . . . . . . . . . . . . 831.4 Implementation of new or changed
accounting standards and interpretations . . . . . . . . . . . . . . . . . . . . . . . . 84
1.5 Alternative performance measures . . . 871.6 Business performance . . . . . . . . . . . . . . . . . 88
2. Return on capital employed. . . . . . . . . . 912.1 Segment information. . . . . . . . . . . . . . . . . . 932.2 Revenue . . . . . . . . . . . . . . . . . . . . . . . . . . . . . . . 962.3 Cost of sales . . . . . . . . . . . . . . . . . . . . . . . . . . 992.4 Government grants. . . . . . . . . . . . . . . . . . 1002.5 Other operating income
and expenses . . . . . . . . . . . . . . . . . . . . . . . . .1012.6 Employee costs . . . . . . . . . . . . . . . . . . . . . 1022.7 Share-based payment . . . . . . . . . . . . . . . 103
3. Capital employed. . . . . . . . . . . . . . . . . . 1053.1 Intangible assets and property,
plant and equipment . . . . . . . . . . . . . . . . 1073.2 Provisions and contingent assets
and liabilities . . . . . . . . . . . . . . . . . . . . . . . . 1103.3 Acquisition of enterprises . . . . . . . . . . . . .1123.4 Divestment of enterprises . . . . . . . . . . . 1133.5 Gross and net investments . . . . . . . . . . 1133.6 Assets classified as held for sale . . . . . 1143.7 Discontinued operations . . . . . . . . . . . . 1153.8 Non-controlling interests . . . . . . . . . . . . 117
4. Working capital. . . . . . . . . . . . . . . . . . . . 1184.1 Inventories . . . . . . . . . . . . . . . . . . . . . . . . . . 1204.2 Contract assets and liabilities . . . . . . . 1214.3 Trade receivables. . . . . . . . . . . . . . . . . . . . 1224.4 Other receivables . . . . . . . . . . . . . . . . . . . 1224.5 Tax equity liabilities . . . . . . . . . . . . . . . . . 1234.6 Other payables. . . . . . . . . . . . . . . . . . . . . . 1244.7 Changes in net working capital. . . . . . 124
5. Tax . . . . . . . . . . . . . . . . . . . . . . . . . . . . . . . . 1255.1 Tax policy and tax regimes . . . . . . . . . . 1275.2 Tax on profit (loss) for the year . . . . . . 1285.3 Taxes paid . . . . . . . . . . . . . . . . . . . . . . . . . . 1305.4 Deferred tax . . . . . . . . . . . . . . . . . . . . . . . . . 1315.5 Total tax contribution . . . . . . . . . . . . . . . 133
6. Capital structure. . . . . . . . . . . . . . . . . . . 1346.1 Interest-bearing debt . . . . . . . . . . . . . . . . 1366.2 Equity . . . . . . . . . . . . . . . . . . . . . . . . . . . . . . . 1386.3 Hybrid capital . . . . . . . . . . . . . . . . . . . . . . . 1406.4 Financial resources . . . . . . . . . . . . . . . . . . 1416.5 Financial income and expenses . . . . . . 1436.6 Funds from operations (FFO)/
adjusted interest-bearing net debt . . 144
7. Risk management. . . . . . . . . . . . . . . . . . 1457.1 Market risks . . . . . . . . . . . . . . . . . . . . . . . . . 1477.2 Hedge accounting and
economic hedging. . . . . . . . . . . . . . . . . . . 1507.3 Energy trading portfolio . . . . . . . . . . . . . 1527.4 Sensitivity analysis of
financial instruments . . . . . . . . . . . . . . . . 1537.5 Credit risks . . . . . . . . . . . . . . . . . . . . . . . . . . 1547.6 Categories of financial instruments . . 1557.7 Fair value measurement. . . . . . . . . . . . . 156
8. Other notes . . . . . . . . . . . . . . . . . . . . . . . . 1588.1 Related-party transactions. . . . . . . . . . 1598.2 Operating lease obligations . . . . . . . . . 1608.3 Auditor's fees . . . . . . . . . . . . . . . . . . . . . . . . 1618.4 Contractual obligations . . . . . . . . . . . . . 1618.5 Company overview. . . . . . . . . . . . . . . . . . 162
Consolidated ESG statements (additional information) . . . . . . . . . . . . . . . . . . 167
Basis of reporting . . . . . . . . . . . . . . . . . . . . . . . . . 168Environment . . . . . . . . . . . . . . . . . . . . . . . . . . . . . 169Social . . . . . . . . . . . . . . . . . . . . . . . . . . . . . . . . . . . . . 171 Governance . . . . . . . . . . . . . . . . . . . . . . . . . . . . . . 172
Parent company financial statements . . . . 175
Income statement . . . . . . . . . . . . . . . . . . . . . . . . 176Balance sheet . . . . . . . . . . . . . . . . . . . . . . . . . . . . 176Statement of changes in equity. . . . . . . . . . . 177
1. Basis of reporting. . . . . . . . . . . . . . . . . . . . 178 2. Employee costs . . . . . . . . . . . . . . . . . . . . . 179 3. Financial income and expenses . . . . . . 179 4. Tax on profit (loss) for the year
and deferred tax. . . . . . . . . . . . . . . . . . . . . 180 5. Distribution of net profit . . . . . . . . . . . . . 180 6. Investments in subsidiaries . . . . . . . . . . 181 7. Receivables from subsidiaries . . . . . . . 181 8. Derivatives . . . . . . . . . . . . . . . . . . . . . . . . . . 182 9. Securities . . . . . . . . . . . . . . . . . . . . . . . . . . . . 18210. Loans and borrowings . . . . . . . . . . . . . . . 18211. Other provisions . . . . . . . . . . . . . . . . . . . . . 18312. Contingent liabilities . . . . . . . . . . . . . . . . 18313. Related-party transactions. . . . . . . . . . 18414. Operating lease obligations . . . . . . . . . 18415. Auditor's fees . . . . . . . . . . . . . . . . . . . . . . . . 18416. Ownership information . . . . . . . . . . . . . . 184
Ørsted Annual report 2018 Financial statements Consolidated financial statements
78 / 193
Note summary Contents

1. Basis of reporting
Significant changes in the current reporting period 80Basis of preparation 81Key accounting estimates and judgements 83Implementation of new or changed accounting standards and interpretations 84Alternative performance measures 87Business performance 88
Ørsted Annual report 2018 Note summary Contents

IFRSIFRS
201818
IFRSIFRS
201818IFRS
IFRS
201818
IFRSIFRS
201818
The financial position and performance of the Ørsted Group was particularly affected by the following events and transactions during 2018.
1.1 Significant changes in the current reporting periodFor a detailed discussion about the Ørsted Group's performance and financial position, please refer to our management's review on pages 4 to 54.
AcqusitionsLincoln Clean EnergyIn October 2018, we acquired Lincoln Clean Energy, which forms the basis of our new Onshore business unit, see note 3.3 'Acquisition of enterprises'. The transaction has been recognised using the acquisition method whereby all identifiable assets and liabilities have been measured at fair value. The acquisition introduced new accounting concepts, such as tax equity liability, see note 4.5 'Tax equity liabilities', and power purchase agreements (PPAs) (derivatives), classified as financial products with significant elements of non-observable data, see note 7.7 'Fair value measurement'.
With the aquisition, we established a strong and scalable platform for the US onshore market, which will be a key growth platform and provide strategic diversification to our portfolio.
Deepwater WindIn November 2018, we acquired Deepwater Wind, which will be part of our existing Offshore business unit, se note 3.3 'Acquisition of enterprises'. The transaction has been recognised using the acquisition method whereby all identifiable assets and liabilities have been measured at fair value. Similar to Lincoln Clean Energy, the acquisition includes a tax equity liability, see note 4.5 'Tax equity liabilities'.
With this acquisition, we created a leading US offshore wind platform with a geographically diverse US East Coast portfolio of projects at varying degrees of development and with significant synergy potential both in terms of geography and project timing.
Divestments/ assets held for saleHornsea 1 offshore wind farmIn November 2018, we farmed-down 50% of Hornsea 1. The transaction is classified as a divestment of assets, see note 2.5 'Other operating income and expenses' and 3.1 'Intangible assets and property, plant and equipment'.
Danish power distribution, residential customer and city light businessesWe plan to exit our Danish power distribu-tion, residential customers and city light businesses during 2019 and have therefore classified them as assets held for sale, see note 3.6 'Assets classified as held for sale'.
Enecogen gas-fired power plantIn July 2018, we divested our 50% ownership share in the Dutch gas-fired power plant Enecogen. The transaction is classified as a divestment of enterprises, see note 3.4 ' Divestment of enterprises'.
Accounting policyAdoption of IFRS 15We have adopted the new IFRS standard on revenue from contracts with customers. The standard has an insignificant impact on profit (loss) for the year and diluted profit (loss) per share. The equity and the con-solidated statement of cash flows are not affected. The impact on our consolidated financial statements is described in note 1.4 'Implementation of new or changed accounting standards and interpretations'. The disclosure requirements in IFRS 15 is included in note 2.2 'Revenue'.
New operating segment The Onshore business unit was established in connection with the acquisition of Lincoln Clean Energy, see note 2.1 'Segment information' and management's review on pages 46 to 48.
Ørsted Annual report 2018 Financial statements Consolidated financial statements – 1. Basis of reporting
80 / 193
Note summary Contents

This section provides an overall description of the accounting policies applied in our consoli-dated financial statements. We provide a more detailed description of the accounting policies applied in the specific notes. Key estimates and judgements and new and amended IFRS standards and interpretations are discussed in detail in note 1.3 'Key accounting estimates and judgements' and 1.4 'Implementation of new or changed accounting standards and interpretations', respectively.
Basis of preparationThe financial statements for the period 1 January - 31 December 2018 comprise the consolidated financial statements of Ørsted A/S and its subsidiaries (the Group) as well as separate financial statements for the parent company, Ørsted A/S. See page 178 for the parent company's accounting policies.
The consolidated financial statements have been prepared in accordance with the Inter-national Financial Reporting Standards (IFRS) as adopted by the EU and further require-ments in the Danish Financial Statements Act (Årsregnskabsloven).
The financial statements are presented in million Danish kroner (DKK), unless otherwise stated.
All business units in the Ørsted Group apply the Group's accounting policies.
Measurement basisThe consolidated financial statements have been prepared on the historical cost basis except for derivatives, financial instruments in trading portfolio, and carbon emissions allow-ances in trading portfolio that are measured at market value.
The accounting policies have been applied consistently to the financial year and for the comparative figures except for:– the adoption of 'IFRS 15 – Revenue from
Contracts with Customers' – the adoption of IAS 20 ‘Accounting for
Government Grants and Disclosure of Government Assistance' with respect to subsidies received under the Renewable Obligation scheme in the UK and feed-in tariffs in Germany
– the adoption of IFRIC 22 'Foreign Currency Transactions and Advance Consideration'
– the adoption of IFRIC 23 'Uncertainty over Income Tax Treatments' (early adoption).
Principles for consolidationThe consolidated financial statements include the parent company Ørsted A/S and subsidiaries controlled by Ørsted A/S. See more in note 8.5 'Company overview'.
The consolidated financial statements have been prepared as a consolidation of the parent company's and the individual subsidiaries' financial statements which have been prepared in accordance with the Group's
accounting policies. Intra- group income and expenses, shareholdings, balances and divi-dends as well as realised and unrealised gains and losses arising from intra-group transac-tions are eliminated on consolidation.
Unrealised gains resulting from transactions with associates and joint ventures are elimi-nated to the extent of the Group's ownership interest. Unrealised losses are eliminated in the same way as unrealised gains to the extent that there has been no impairment.
The Group's share in joint operations is recognised in the consolidated balance sheet through recognition of the Group's own assets, liabilities, income and expenses. The Group's share of joint income, expense, assets and liabilities is recognised afterwards. The propor-tionate share of realised and unrealised gains and losses arising from intra-group transac-tions between fully consolidated enterprises and joint operations is eliminated.
Investments in associates and joint ventures are measured using the equity method.
If we hold or have the ability to exercise, directly or indirectly, 20%-50% of the voting rights and do not exercise control, such enter-prises are accounted for as associates. How-ever, we carry out a specific assessment of our ability to exercise influence, including our ability to influence financial and operational decisions and thus our return. Enterprises
that satisfy the criteria for joint control are accounted for as investments in joint ventures.
We present the profit (loss) from investments in associates and joint ventures before EBITDA when deemed to pertain to our principal activities. The profit (loss) from investments in associates and joint ventures is presented after EBITDA when not deemed to pertain to the Group's principal activities.
Associates and joint ventures with negative net assets are measured at nil.
If we have a legal or constructive obligation to cover the negative equity of an associate or joint venture, the obligation is recognised as a liability.
Receivables from associates and joint ventures are measured at amortised cost. On initial recognition of our receivables, write-downs are made for bad debts.
The proportionate share of associates' and joint ventures' profit (loss) after tax and non-controlling interests is recognised in profit (loss) for the year. We eliminate the propor-tionate share of internal gains (losses) in the profit (loss) for the year.
On acquisition of investments in associates and joint ventures, the purchase method is applied.
1.2 Basis of preparation
Ørsted Annual report 2018 Financial statements Consolidated financial statements – 1. Basis of reporting
81 / 193
Note summary Contents
Gains (losses) on the divestment of invest-ments in associates and joint ventures are determined as the difference between the selling price and the carrying amount of net assets, including goodwill at the date of divestment and transaction costs.
Gains and losses are recognised in profit (loss) for the year as gain or loss on the divestment of enterprises. The profit (loss) for the year and total comprehensive income from associates and joint ventures are identical.
Key accounting judgements
Assessment of classification of partnershipsOn initial recognition of investments and in connec-tion with any restructuring of joint ventures and joint operations, we assess whether an investment is a joint venture or a joint operation.
In assessing joint operations, we look at: – the corporate form of the operation– whether we are only entitled to the net profit or
income and expenses resulting from the operation.
In addition, the fact that the parties buy or are assigned all output, for example the power generated, will lead to the structure being considered a joint operation.
Foreign currency translationFor each reporting enterprise in the Group, items are determined in the currency of the primary economic environment in which the individual reporting enterprise operates (functional currency). Transactions in curren-cies other than the functional currency of each enterprise are accounted for as trans-actions in foreign currencies and translated on initial recognition at the exchange rate on the transaction date. Exchange differences arising between the exchange rate on the transaction date and on the date of payment are recog-nised in profit (loss) for the year as financial income or expenses.
Receivables, payables and other monetary items in foreign currencies are translated at the exchange rates on the balance sheet date. The difference between the exchange rate on the balance sheet date and on the date at which the receivable or payable arose is recognised in profit (loss) for the year as financial income or expenses.
For foreign subsidiaries, joint operations, associates and joint ventures, the statements of comprehensive income are translated at monthly average exchange rates in so far as these do not deviate materially from the actual exchange rates at the transaction dates. Balance sheet items are translated at the exchange rates on the balance sheet date.
All exchange differences are recognised in profit (loss) for the year, except for exchange differences arising on: – translation of the opening equity of these
entities at the exchange rates on the balance sheet date
– translation of the statements of compre-hensive income of these enterprises from the exchange rates at the transaction date to the exchange rates on the balance sheet date
– translation of balances accounted for as part of the total net investment
– translation of the portion of loans and derivatives that has been entered into to hedge the net investment in these enter-prises, and that provides an effective hedge against corresponding foreign exchange gains (losses) on the net investment in the enterprise.
The above types of exchange differences are recognised in other comprehensive income. Such exchange rate adjustments are divided between the equity of the parent company and the equity of the non-controlling interests.On full or partial divestment of the net investment, the accumulated exchange rate adjustments are recognised as follows:– Disposal results in loss of control:
The accumulated exchange rate adjust-ments, including any associated hedges, are recognised in the profit (loss) for the year if
a foreign exchange gain (loss) is realised by the selling enterprise. Any foreign exchange gain (loss) is transferred to the item in which the gain (loss) from the disposal is recognised. The part of the foreign currency translation reserve that relates to non-con-trolling interests is not transferred to profit (loss) for the year.
– Disposal does not result in loss of control: A proportionate share of the foreign curren-cy translation reserve is transferred from the parent company shareholders' share of equity to the minority shareholders' share of equity.
Repayment of balances that are considered part of the net investment does not constitute a partial disposal of the subsidiary.
Ørsted Annual report 2018 Financial statements Consolidated financial statements – 1. Basis of reporting
82 / 193
Note summary Contents

1.3 Key accounting estimates and judgements
Note Key accounting estimates and judgements Estimate/ judgement
Extent of accounting estimates and judgements
1.2 Basis of preparation Assessment of classification of partnerships Judgement 2.2 Revenue Assessment of assumptions for recognition of revenue from the
construction of offshore wind farms over timeAssumptions for the determination of the expected selling price and expected costs
Judgement
Estimate
2.5 Other operating income Assessment of classification of divestment
Assumptions for the accounting treatment of divestment gains related to the share purchase agreements and construction agreements
Judgement
Estimate
3.2 Provisions and contingent assets
and liabilitiesAssumptions for decommissioning obligationsEstimate of onerous contractsEstimate of litigation outcomes
Estimate Estimate Estimate
3.3 Acquisition of enterprises Purchase price allocation in business combinations Estimate 4.5 Tax equity liabilities Assesment of recognition of tax equity partners Judgement 5.2 Tax on profit (loss) for the year Estimate regarding the recognition of income tax assets and provisions
for uncertain tax positions Estimate
Extent of accounting estimates and judgements relates to objectivity and business practice.
Very objective/market-conforming Objective/partially conforming Partially subjective/partially distinctive Subjective/distinctive for Ørsted
The use of resonable estimates and judge-ments is an essential part of the preparation of the consolidated financial statements.
Given the uncertainties inherent in our business activities, we make a number of estimates regarding valuation and judgements. The esti-mates and judgements are based on assump-tions concerning future developments which affect our application of accounting policies
and reported amounts of our assets, liabilities, sales, costs, cash flows and related disclosures. Actual amounts may differ from the amounts estimated and judgements made as more detailed information becomes available.
We regularly reassess these estimates and judgements, based among other things on historical experience, the current situation in the financial markets and a number of
other relevant factors, ie. the expected effects of Brexit.
Accounting estimates, judgements and assumptions which may entail a risk of mate-rial adjustments in subsequent years are listed in the table below.
In addition, we make judgements when we apply the accounting policies.
Reference is made to the specific notes for further information on the key accounting estimates and judgements as well as the assumptions applied.
Ørsted Annual report 2018 Financial statements Consolidated financial statements – 1. Basis of reporting
83 / 193
Note summary Contents

We regularly assess the impact of new IFRS standards and interpretations. We implement new IFRS standards and interpretations from their mandatory effective dates at the latest.
Effective from 1 January 2018, we have implemented the following new or changed standards (IAS and IFRS) and interpretations: – IFRS 15 'Revenue from Contracts with
Customers' including amendments and clarifications. See separate section below.
– IFRIC 22 'Foreign Currency Transactions and Advance Consideration'.
– IFRIC 23 'Uncertainty over Income Tax Treatments' (early adoption).
Besides the impact from IFRS 15, the adoption of the new and changed standards has not impacted the consolidated financial state-ments for 2018.
In the following section, you can read more about the impact on recognition and measurement from IFRS 15 'Revenue from Contracts with Customers'. The standard has an insignificant impact on profit (loss) for the year and diluted profit (loss) per share. The equity and the consolidated statement of cash flows are not affected.
Implementation of IFRS 15 On 1 January 2018, we implemented IFRS 15, 'Revenue from Contracts with Customers', which replaces IAS 11, IAS 18 and associated interpretations.
We have implemented IFRS 15 with retro-spective effect. However, we use the relief from restating comparative figures (modified retrospective method).
The most important changes resulting from our implementation can be summarised as follows:– The model for recognition of revenue is
changed from having been based on the transfer of the risks and rewards of owner-ship of a product or service to being based on the transfer of control of the goods or services transferred to the customer.
– More detailed guidelines for how elements in a contract of sale are identified, and how the individual components will be recog-nised and measured.
– More detailed guidance for recognition of revenue over time.
Changes in our accounting policies resulting from IFRS 15 In the UK, we offer construction agreements for offshore transmission assets. When con-struction of the offshore transmission assets is completed, they are sold to an offshore transmission owner (OFTO) through a regu-lated sales process. The UK energy regulator 'Office of Gas and Electricity Markets' (Ofgem) manages the sales process, determines the final transfer value and appoints the buyer. Under IFRS 15, a customer relationship does not exist between Ørsted and the final buyer when the construction of the offshore transmission assets commences. Therefore, we have deferred revenue recognition on offshore transmission assets from commencement of construction to the date of entering into a contract with a customer.
In other words, the recognition of revenue begins when we sell a share of the offshore transmission asset under construction to a partner and takes place upon such partner joining the project. We recognise the remain-ing part of the offshore transmission asset when we find that control has passed to the OFTO.
Impact on our consolidated financial statements from IFRS 15In previous reporting periods, offshore trans-mission assets were recognised in step with the construction based on the completion degree of the asset (over time). Under IFRS 15, revenue from offshore transmission assets are recognised at a later point in time.
The change in policy does not affect the Group's cash flows or results, but only the tim-ing of when income and costs are recognised in the consolidated financial statements.
Historically, we have not had, and we do not expect to have, a significant contribu-tion margin relating to the sale of offshore transmission assets to partners and OFTOs. The Group's EBITDA, balance sheet total and equity will therefore remain unchanged in all material respects as a consequence of the changed accounting policies.
The implementation of the terminology in IFRS 15 had the following effects on the presentation of the construction contracts, receivables and other payables in thebalance sheet:
1.4 Implementation of new or changed accounting standards and interpretations
Ørsted Annual report 2018 Financial statements Consolidated financial statements – 1. Basis of reporting
84 / 193
Note summary Contents

– Construction of offshore transmission assets is classified as inventory.
– Construction agreements other than offshore transmission assets are presented as contract assets and liabilities.
– Construction agreements related to off-shore transmission assets are presented as contract assets and liabilities.
– Receivables related to ongoing services or in other ways where the receivables are not unconditional are presented as contract assets.
– Other payables related to prepayments from heat customers are presented as contract liabilities.
– Other payables related to prepayments and deferred revenue as such are presented as contract liabilities.
In summary, the adjustments made to the amounts recognised in the balance sheet on he date of initial application (1 January 2018) are illustrated in the table to the left.
1 January 2018 31 December 2018
ExtractImpact of adoption, DKKm
Previousaccounting
policy
Effect ofchange in
accountingpolicy
Newaccounting
policy
Previousaccounting
policy
Effect ofchange in
accountingpolicy
Newaccounting
policy
Assets
Current assets
Inventories 3,853 10,468 1 14,321 4,058 9,885 13,943
Construction contracts 10,817 (10,817) 1,2 - 11,336 (11,336) -
Contract assets - 1,693 2 1,693 - 1,451 1,451
Trade receivables 9,170 (1,344) 2 7,826 10,741 - 10,741
Assets 146,521 - 146,521 174,575 - 174,575
Equity and liabilities
Share capital 4,204 - 4,204 4,204 - 4,204
Reserves (1,524) - (1,524) (1,827) - (1,827)
Retained earnings 52,111 - 52,111 66,111 - 66,111
Equity attributable to shareholders in Ørsted A/S 54,791 - 54,791 68,488 - 68,488
Liabilities
Non-current liabilities
Contract liabilities - 5,327 2 5,327 - 3,642 3,642
Other payables 5,714 (5,327) 2 387 4,051 (3,642) 409
Current liabilities
Construction contracts 1,317 (1,317) 2 - 460 (460) -
Contract liabilities - 1,455 2 1,455 - 924 924
Other payables 6,368 (138) 2 6,230 5,257 (464) 4,793
Equity and liabilities 146,521 - 146,521 174,575 - 174,575
Income statement, IFRS
Revenue 80,554 (5,034) 75,520
Cost of sales (59,052) 5,034 (54,018)
Operating profit (loss) before depreciation, amortisation and impairment losses (EBITDA) 28,491 - 28,491
Profit (loss) for the year 18,276 - 18,276
1 Effect of change to timing of revenue recognition from transmission assets in profit (loss).2 Effect of changed presentation of certain amounts in the balance sheet to reflect the terminology of IFRS 15.
Comparatives for the 2017 financial year are not restated as we have applied the modified retrospec-tive method. The effects of change in accounting policy are identical for business per formance profit (loss).
Ørsted Annual report 2018 Financial statements Consolidated financial statements – 1. Basis of reporting
85 / 193
Note summary Contents

Standard Expected effect Commencement Transitional provision
IFRS 16 'Leases'
We have completed our analysis of the impact of implementing IFRS 16 in Ørsted. The conclusion is that the implementation will have limited effect on our balance sheet, income statement and key credit ratios.
When applying IFRS 16, our lease obligations amount to DKK 5,224 million on 1 January 2019, which is slightly higher than our operating lease obligations on 31 December 2018. This amounts to DKK 4,819 million at net present value. The difference between the obligations are primarily due to the fact that the weigthed average incremental borrowing rates applied under IFRS 16 are lower than the 3.5%, which we apply for calculation of the net current value of our operating lease obligations in accordance with our present accounting policy for key credit metrics.
IFRS 16 requires that service elements which are incorporated into leases, and which do not entitle us to use an underlying asset, are dealt with separately and treated as current operating expenses. This requirement does not have an effect on our lease obligations as our current accounting policy is to separate the service elements in the leases from the leasing elements. In Ørsted, this matter is partically relevant to leases of office premisses.
IFRS 16 will be implemented on 1 January 2019.
The standard will be implemented with retrospective effect, and the comparative figures will not be restated. The requirements of the standard therefore only apply to ongoing and/or leases commencing on 1 January 2019.
For all leases, we will measure the lease asset at the same amount as the lease debt, adjusted by the amount of prepayments and accrued lease payments on 1 January 2019.
We apply the practical expedient regarding reassessment of whether a contract is, or contains, a lease on 1 January 2019. This means that we do not reassess whether a contract is, or contains, a lease when applying IFRS 16.
We do also make use of the possibility to apply a single rate to a portfolio of leases with reasonable similar charateristics. In accordance with this, we apply incremental borrowing rates per class of underlying asset (nature) in similar economic environments (currency) and remaining lease term.
Change in accounting policyOn 1 January 2018, we changed our account-ing policy with respect to subsidies received under the Renewable Obligation Scheme in the UK, known as green certificates or renewable obligation certificates (ROCs), and feed-in tariffs in Germany under the German Renewable Energy Sources Act (EEG2014).
We apply IAS 20 'Accounting for Government Grants and Disclosure of Government Assis-tance', under which subsidies are recognised when there is a reasonable assurance that the grant will be received.
Prior to this change in policy, we applied IAS 18 'Revenue' to ROCs and feed-in tariffs in Germany, while we applied IAS 20 to feed-in tariffs in Denmark and contracts for difference (CfDs) in the UK.
We believe the new policy is preferable as it provides more relevant information about the received subsidies, aligns our accounting of all subsidies received for our renewable power generation and allows comparability between years.
This voluntary change in accounting policy did not result in any impact on the current year or any years included within these consolidated financial statements. The recognition, meas-urement, timing and presentation of ROCs and feed-in tariffs are unchanged.
The change in accounting policy only impacts the presentation of ROCs and feed-in tariffs in Germany.
Profit (loss), equity and the consolidated state-ment of cash flows are therefore not affected by the change in accounting policy.
New standards and interpretationsIASB has issued a number of new or amended standards and interpretations which have not yet entered into force, and which have consequently not been incorporated into the consolidated financial statements for 2018.
In the tabel below, we have assessed how IFRS 16 'Leases' will be implemented and the consequences thereof. IFRS 16 is deemed to be the most relevant of the new or amended standards and interpretations for Ørsted.
Ørsted Annual report 2018 Financial statements Consolidated financial statements – 1. Basis of reporting
86 / 193
Note summary Contents

Business performance Business performance is a supplement to our financial statements prepared in accordance with IFRS. Under the business performance principle, the value of the hedging transaction is deferred and recognised for the period in which the hedged risk materialises. Reference is made to note 1.6 'Business performance'.
Gross investments Gross investments reflect our total investments in assets and enterprises. It comprises cash flows from investing activities, excluding dividends received from associates, joint ventures and equity investments, purchase and sale of securities, loans to joint ventures and joint operations, and divestments of assets and enterprises. To this is added acquired debt and restricted cash in connection with acquisitions.
Net investments Gross investments less divestments of assets and enterprises, the selling price for non-controlling interests and subsequent capital injections from non-controlling interests. Furthermore, interest-bearing debt transferred in connection with a divestment is deducted.
Funds from operations (FFO)
Supplementary statement for cash flows from operating activities determined as business performance EBITDA less the effect of gains on the divestments of ownership interests in offshore wind farms, interest expenses (net) on interest-bearing net debt and hybrid capital (50%), interest element of decommissioning obligations and current tax. In addition, operating lease obligations have been recognised as if they were finance lease obligations, where operating lease payments have been reversed, and calculated interest expenses of the present value of lease payments have been deducted.
Adjusted interest-bearing net debt
Interest-bearing net debt plus 50% of the hybrid capital, cash and securities not available for use (with the exception of repo transactions), present value of lease payments (operating lease obligations calculated as if they were finance lease obligations), and the present value of decommissioning obligations less deferred tax.
FFO to adjusted interest-bearing net debt
FFOAdjusted interest-bearing net debt
Free cash flow (FCF) Cash flows from operating activities less gross investments and plus divestments.
Capital employed All assets and liabilities except for equity and interest-bearing net debt.
Average capital employed
Capital employed beginning of year + capital employed year-end2
Return on capital employed (ROCE)
EBITAverage capital employed1
Proposed dividend per share (DPS) of DKK 10
Total proposed dividendNumber of shares year-end
Dividend yield Dividend per share (proposed)Share price on the last trading day of the year
Average number of shares
1Number of
days
× Number of days
∑i=1
= X1
Net working capital Inventories, trade receivables and other current operating assets less trade payables, deferred income (net), other current operating liabilities and working capital element of tax equity balances.
Net working capital, excluding trade payables relating to capital expenditure
Net working capital, excluding trade payables relating to purchases of intangible assets and property, plant and equipment.
Profit (loss) per share Shareholders' share of the profit (loss) for the periodAverage number of shares
Diluted profit (loss) per share
Shareholders' share of the profit (loss) for the periodAverage number of shares, including dilutive effect of free shares
1 ROCE (continuing operations) is based on average capital employed for the continuing operations. Capital employed related to the oil and gas activities divested on 29 September 2017 are not included.
Performance measures are calculated in accordance with the business performance principle.
1.5 Alternative performance measures
Ørsted Annual report 2018 Financial statements Consolidated financial statements – 1. Basis of reporting
87 / 193
Note summary Contents
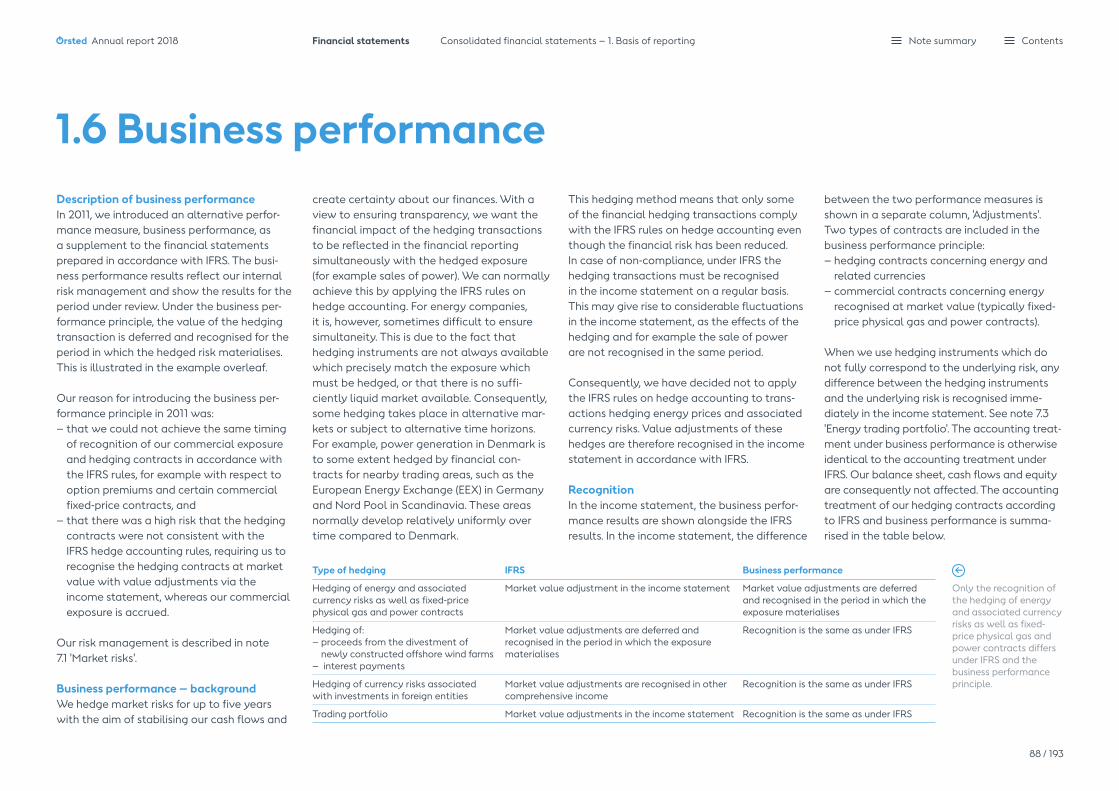
Description of business performanceIn 2011, we introduced an alternative perfor-mance measure, business performance, as a supplement to the financial statements prepared in accordance with IFRS. The busi-ness performance results reflect our internal risk management and show the results for the period under review. Under the business per-formance principle, the value of the hedging transaction is deferred and recognised for the period in which the hedged risk materialises. This is illustrated in the example overleaf.
Our reason for introducing the business per-formance principle in 2011 was:– that we could not achieve the same timing
of recognition of our commercial exposure and hedging contracts in accordance with the IFRS rules, for example with respect to option premiums and certain commercial fixed-price contracts, and
– that there was a high risk that the hedging contracts were not consistent with the IFRS hedge accounting rules, requiring us to recognise the hedging contracts at market value with value adjustments via the income statement, whereas our commercial exposure is accrued.
Our risk management is described in note 7.1 'Market risks'.
Business performance – backgroundWe hedge market risks for up to five years with the aim of stabilising our cash flows and
create certainty about our finances. With a view to ensuring transparency, we want the financial impact of the hedging transactions to be reflected in the financial reporting simultaneously with the hedged exposure (for example sales of power). We can normally achieve this by applying the IFRS rules on hedge accounting. For energy companies, it is, however, sometimes difficult to ensure simultaneity. This is due to the fact that hedging instruments are not always available which precisely match the exposure which must be hedged, or that there is no suffi-ciently liquid market available. Consequently, some hedging takes place in alternative mar-kets or subject to alternative time horizons. For example, power generation in Denmark is to some extent hedged by financial con-tracts for nearby trading areas, such as the European Energy Exchange (EEX) in Germany and Nord Pool in Scandinavia. These areas normally develop relatively uniformly over time compared to Denmark.
This hedging method means that only some of the financial hedging transactions comply with the IFRS rules on hedge accounting even though the financial risk has been reduced. In case of non-compliance, under IFRS the hedging transactions must be recognised in the income statement on a regular basis. This may give rise to considerable fluctuations in the income statement, as the effects of the hedging and for example the sale of power are not recognised in the same period.
Consequently, we have decided not to apply the IFRS rules on hedge accounting to trans-actions hedging energy prices and associated currency risks. Value adjustments of these hedges are therefore recognised in the income statement in accordance with IFRS.
RecognitionIn the income statement, the business perfor-mance results are shown alongside the IFRS results. In the income statement, the difference
between the two performance measures is shown in a separate column, 'Adjustments'.Two types of contracts are included in the business performance principle: – hedging contracts concerning energy and
related currencies – commercial contracts concerning energy
recognised at market value (typically fixed-price physical gas and power contracts).
When we use hedging instruments which do not fully correspond to the underlying risk, any difference between the hedging instruments and the underlying risk is recognised imme-diately in the income statement. See note 7.3 ' Energy trading portfolio'. The accounting treat-ment under business performance is other wise identical to the accounting treatment under IFRS. Our balance sheet, cash flows and equity are consequently not affected. The accounting treatment of our hedging contracts according to IFRS and business performance is summa-rised in the table below.
1.6 Business performance
Type of hedging IFRS Business performance
Hedging of energy and associated currency risks as well as fixed-price physical gas and power contracts
Market value adjustment in the income statement Market value adjustments are deferred and recognised in the period in which the exposure materialises
Hedging of:– proceeds from the divestment of
newly constructed offshore wind farms– interest payments
Market value adjustments are deferred and recognised in the period in which the exposure materialises
Recognition is the same as under IFRS
Hedging of currency risks associated with investments in foreign entities
Market value adjustments are recognised in other comprehensive income
Recognition is the same as under IFRS
Trading portfolio Market value adjustments in the income statement Recognition is the same as under IFRS
Only the recognition of the hedging of energy and associated currency risks as well as fixed-price physical gas and power contracts differs under IFRS and the business performance principle.
Ørsted Annual report 2018 Financial statements Consolidated financial statements – 1. Basis of reporting
88 / 193
Note summary Contents

Recognition in the income statement, GBP million
Recognised in the income statement as follows Total financial impact
Power price (GBP '000 per GWh)
Sale of power,
GBP million Market valueBusiness
performance IFRSBusiness
performance IFRS
Year 1 52 - - - - - -
Year 2 50 - 2 - 2 - 2
Year 3 55 - (3) - (5) - (5)
Year 4 46 - 6 - 9 - 9
Year 5 45 45 7 7 1 52 46
Total 45 7 7 52 52
Example of recognition of the market value of a hedging contract according to the
business performance and IFRS principles in the income statement.
Explanation of the business performance principleIn year 1, we enter into a contract hedging the price risk associated with Offshore's generation of 1,000GWh in year 5 at GBP 52,000 per GWh. This ensures a total revenue of GBP 52 million. In year 5, the cost of power has decreased to GBP 45,000 per GWh, which means that the hedging contract has a positive market value of GBP 7 million (a hedged price of GBP 52,000 per GWh minus the spot price of GBP 45,000 per GWh). This means that we ensure that the total income, including the hedging transaction, is still GBP 52 mil-lion. The income of GBP 52 million consists of a gain from the hedging contract ofGBP 7 million and GBP 45 million from the sale of 1,000GWh at a spot price of
GBP 45,000 per GWh. The financial impact of the hedging transaction in years 1-5 is shown in the table. Under the business performance principle, the hedging trans-action is recognised in the income state-ment in year 5, i.e. at the same time as the hedged contract with a positive market value of GBP 7 million. The value develop-ment is, however, recognised continuously in the income statement according to IFRS. Upon the expiry of the contract in year 5, the total effect on results over the period is the same under the IFRS and the business performance principle. Only the timing differs. The business performance principle ensures simultaneity of recogni-tion of the underlying exposure and the hedging contract.
Expected impact on business performance EBITDA from energy and currency hedgingAt 31 December 2018, a loss of DKK 1,849 mil-lion has been deferred (2017: loss of DKK 812 million), which will affect business performance EBITDA in subsequent years. Of the total deferred loss, a loss of DKK 1,470 million is expected on business performance EBITDA in 2019 (2017: DKK 159 million loss in 2018).
Power prices rose in 2018, which means that the market value of the hedges has fallen as we are selling power. The decrease in the deferred gain on currency hedging is primarily attributable to the transfer of gains to the income statement in 2018 as a consequence of the hedged transactions having occurred.
The table shows when the deferred value ad-justments are expected to be recognised in the business performance EBITDA. The table covers both hedging classified as business performance and IFRS.Gains are shown as '+' and losses are shown as '-'. Deferred reve-nue from US power purchase agreements is explained in more detail in note 7.7 'Fair value measurement'.
Expected impact on business performance EBITDA from energy and currency hedging, DKKm
Deferred for subsequent recognition at 31 December 2018
Deferred for subsequent recognition at 31 December 2017
2019 2020 After 2020 Total 2018 2019 After 2019 Total
Power (1,324) (1,190) (353) (2,867) (650) (385) (519) (1,554)
Gas (294) (118) - (412) (262) (266) (97) (625)
Oil (65) (81) (36) (182) 174 137 63 374
Coal 6 1 - 7 34 6 1 41
Currency (2) 254 239 491 545 139 268 952
Inflation - - (69) (69) - - - -
Total hedges (1,679) (1,134) (219) (3,032) (159) (369) (284) (812)
Deferred revenue from US power purchase agreements 209 183 791 1,183 - - - -
Total (1,470) (951) 572 (1,849) (159) (369) (284) (812)
Ørsted Annual report 2018 Financial statements Consolidated financial statements – 1. Basis of reporting
89 / 193
Note summary Contents

Specification of the difference between EBITDA according to business performance and according to IFRS, DKKm 2018 2017
EBITDA – business performance 30,029 22,519
Business performance adjustments in respect of revenue for the year (1,426) 205
Business performance adjustments in respect of cost of sales for the year (112) (150)
EBITDA – IFRS 28,491 22,574
Total business performance adjustments for the year comprise:
Market value adjustments for the year of financial and physical hedging contracts relating to a furture period (1,734) (138)
Reversal of deferred gains (losses) relating to hedging contracts from previous periods, where the hedged production or trade is recognised in business performance EBITDA in this period 196 193
Total adjustments (1,538) 55
The table shows value adjustments by product. The value adjustments are recognised in IFRS EBITDA, but not in business performance EBITDA, as the value relates to future periods.
The table shows reversal of value adjustments by product. These gains (losses) are recognised in business performance EBITDA. The reversal of value adjustment was recognised in IFRS EBITDA in a previous period.
Market value adjustments for the year of financial and physical hedging contracts relating to a future period, DKKm 2018 2017
Currency 313 150
Power (commercial and hedge) (1,617) (836)
Gas (commercial and hedge) (48) 106
Oil (382) 404
Coal - 38
Total value adjustments (1,734) (138)
Reversal of deferred gains (losses) relating to hedging contracts from previous periods, where the hedged prodution or trade is recognised in business performance EBITDA in this period, DKKm 2018 2017
Currency (165) (12)
Power (commercial and hedge) 307 297
Gas (commercial and hedge) 262 (106)
Oil (174) 46
Coal (34) (32)
Total deferred gains (losses) from previous periods 196 193
Deferred gains (losses) from previous periods In 2018, a loss of DKK 196 million was recog-nised in business performance EBITDA, but as the loss was recognised in IFRS EBITDA in a previous period, the gain was reversed in the 'Adjustments' column in the income statement. The loss was primarily attributable to the hedging of power and gas, partly reduced by gains on hedging of oil and currency.
Difference between IFRS and business performance for the yearThe value adjustment in respect of future periods totalled DKK -1,734 million (2017: DKK -138 million) and reversal of deferred gains (losses) recognised according to business performance in 2018 totalled DKK 196 million (2017: DKK 193 million).
Market value adjustments for the year of hedging contracts2018 was mainly affected by losses on the hedging of power as a result of rising prices, due to a selling position and hedging of oil as a result of lower prices due to a purchase position.
Ørsted Annual report 2018 Financial statements Consolidated financial statements – 1. Basis of reporting
90 / 193
Note summary Contents

2.Return on capital employed
Return on capital employed 92Segment information 93Revenue 96Cost of sales 99Government grants 100Other operating income and expenses 101Employee costs 102Share-based payment 103
Ørsted Annual report 2018 Note summary Contents

2014 2015 2016 20182017
2014 2015 2016 20182017
Return on capital employed is a key ratio showing how profitable our business activities are. Our target is an average ROCE of around 10% for the Group for the 2019-2025 period.
Return on capital employed Return on capital employed was 32.1% in 2018 compared to 25.2% in 2017. The increase was mainly due to higher EBIT, which in both years was significantly positively affected by farm-down gains. Reference is made to note 2.1 'Segment information'.
2. Return on capital employed
EBIT and return on capital employed are stated according to the business performance principle. EBIT of DKK 24,856 million is calculated as EBIT for reportable segments.
EBIT by segment, percentage of DKK 24,856 million in 2018
Offshore Onshore Bioenergy Customer Solutions
Return on capital employed (ROCE) % 2018
Offshore Onshore Bioenergy Customer Solutions
7%
94%
-1%
37.2%
17.6%
-12.9%
0
0
30.0bnEBITDA totalled DKK 30,029 million in 2018 against DKK 22,519 million in 2017.
24.7bnOperating profit totalled DKK 24,654 million in 2018 against DKK 16,235 million in 2017.
32.1%Return on capital employed (ROCE) totalled 32.1% in 2018 against 25.2% in 2017.
3.6
24.4 25.2
Return on capital employed (ROCE) %
Return on capital employed (ROCE) was 32.1% against 25.2% in 2017. The increase was attributable to a higher EBIT.
1.9
13.916.2
EBIT, business performance DKKm
2.3
4.3
24.7
32.1
0%
-0.3%
Ørsted Annual report 2018 Financial statements Consolidated financial statements – 2. Return on capital employed
92 / 193
Note summary Contents

2.1 Segment information
Primary activity
Development, construction, ownership and operation of offshore wind farms in the UK, Germany, Denmark, the Netherlands, the US and Taiwan.
Primary activity
Generation of heat and power from CHP plants in Denmark, operation of a Renescience plant in the UK, a few biogas upgrade facilities, and a biogas plant.
Primary activity
Distribution of power and sales of power and gas in the wholesale and retail markets in Denmark, Sweden, Germany and the UK as well as optimisation and hedging of the Group's total energy portfolio.
Geographical distribution of revenue as well as intangible assets and property, plant and equipmentGeographical revenue is broken down, as far as possible, by the customer's geographical location based on supply point.
A significant part of our sales takes place via power exchanges and gas hubs in Europe, the physical locations of which do not reflect the geographical locations of our customers. When breaking down these sales by geographi cal location, we use the physical locations of the exchange or hub since we do not know the physical location of our customers in all cases.
No single customer accounts for more than 10% of our consolidated revenue.
Non-current assets are broken down geo-graphically based on the physical locations of the assets.
Accounting policies
Our operating segments are consistent with our internal reporting to our top decision-making body, Group Executive Management.
We apply the business performance principle, as described in note 1.6 'Business performance', in connection with our internal management.
The operating segments are managed primarily on the basis of EBITDA and investments. Financial income and expenses as well as tax are allocated to the operating segments, while we manage them at Group level.
Segment income and segment expenses are those items that, in our internal management reporting, are directly attributable to individual segments or can be indirectly allocated to individual segments on a reliable basis.
Offshore, DKKm
Revenue 30,566
EBITDA 27,809
Gross investments 15,081
Number of employees 2,431
Bioenergy, DKKm
Revenue 6,353
EBITDA 367
Gross investments 1,356
Number of employees 731
Customer Solutions, DKKm
Revenue 47,999
EBITDA 1,970
Gross investments 1,166
Number of employees 1,254
Revenue, DKKm 2018 1 (2017)
Denmark (DK) UK Germany (DE) The Netherlands (NL) Other
Intangible assets and property, plant and equipment, DKKm 2018 (2017)
Denmark (DK) UK The US Germany (DE) Other
DK 17,713(19,563)
DE 14,057(12,614)
DK 12,139(23,062)
DE 14,374(8,578)
UK 39,627(40,666)
OTHER 1,283(192)
OTHER 814(506)
DKK 76,946 million
DKK 84,832 million
Revenue, intangible assets as well as property, plant and equipment are presented based on the locations of our customers and assets. 1 Revenue determined according to the business
performance principle.UK 37,962
(26,488)
NL 6,083(4,369)
Primary activity
Development, ownership and operation of onshore wind and solar farms in the US and a minor storage solution in the UK.
Onshore, DKKm
Revenue 80
EBITDA 44
Gross investments 6,779
Number of employees 40
US 17,726(0)
Ørsted Annual report 2018 Financial statements Consolidated financial statements – 2. Return on capital employed
93 / 193
Note summary Contents
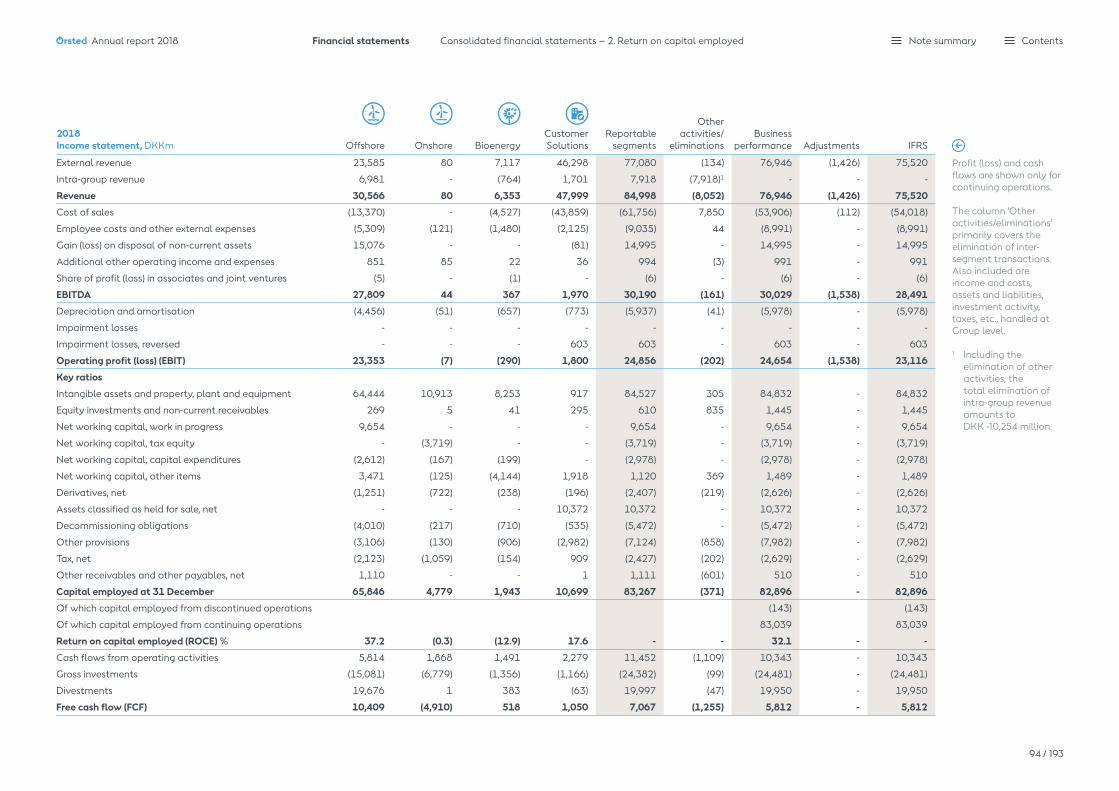
2018 Income statement, DKKm Offshore Onshore Bioenergy
Customer Solutions
Reportablesegments
Other activities/
eliminationsBusiness
performance Adjustments IFRS
External revenue 23,585 80 7,117 46,298 77,080 (134) 76,946 (1,426) 75,520
Intra-group revenue 6,981 - (764) 1,701 7,918 (7,918)1 - - -
Revenue 30,566 80 6,353 47,999 84,998 (8,052) 76,946 (1,426) 75,520
Cost of sales (13,370) - (4,527) (43,859) (61,756) 7,850 (53,906) (112) (54,018)
Employee costs and other external expenses (5,309) (121) (1,480) (2,125) (9,035) 44 (8,991) - (8,991)
Gain (loss) on disposal of non-current assets 15,076 - - (81) 14,995 - 14,995 - 14,995
Additional other operating income and expenses 851 85 22 36 994 (3) 991 - 991
Share of profit (loss) in associates and joint ventures (5) - (1) - (6) - (6) - (6)
EBITDA 27,809 44 367 1,970 30,190 (161) 30,029 (1,538) 28,491
Depreciation and amortisation (4,456) (51) (657) (773) (5,937) (41) (5,978) - (5,978)
Impairment losses - - - - - - - - -
Impairment losses, reversed - - - 603 603 - 603 - 603
Operating profit (loss) (EBIT) 23,353 (7) (290) 1,800 24,856 (202) 24,654 (1,538) 23,116
Key ratios
Intangible assets and property, plant and equipment 64,444 10,913 8,253 917 84,527 305 84,832 - 84,832
Equity investments and non-current receivables 269 5 41 295 610 835 1,445 - 1,445
Net working capital, work in progress 9,654 - - - 9,654 - 9,654 - 9,654
Net working capital, tax equity - (3,719) - - (3,719) - (3,719) - (3,719)
Net working capital, capital expenditures (2,612) (167) (199) - (2,978) - (2,978) - (2,978)
Net working capital, other items 3,471 (125) (4,144) 1,918 1,120 369 1,489 - 1,489
Derivatives, net (1,251) (722) (238) (196) (2,407) (219) (2,626) - (2,626)
Assets classified as held for sale, net - - - 10,372 10,372 - 10,372 - 10,372
Decommissioning obligations (4,010) (217) (710) (535) (5,472) - (5,472) - (5,472)
Other provisions (3,106) (130) (906) (2,982) (7,124) (858) (7,982) - (7,982)
Tax, net (2,123) (1,059) (154) 909 (2,427) (202) (2,629) - (2,629)
Other receivables and other payables, net 1,110 - - 1 1,111 (601) 510 - 510
Capital employed at 31 December 65,846 4,779 1,943 10,699 83,267 (371) 82,896 - 82,896
Of which capital employed from discontinued operations (143) (143)
Of which capital employed from continuing operations 83,039 83,039
Return on capital employed (ROCE) % 37.2 (0.3) (12.9) 17.6 - - 32.1 - -
Cash flows from operating activities 5,814 1,868 1,491 2,279 11,452 (1,109) 10,343 - 10,343
Gross investments (15,081) (6,779) (1,356) (1,166) (24,382) (99) (24,481) - (24,481)
Divestments 19,676 1 383 (63) 19,997 (47) 19,950 - 19,950
Free cash flow (FCF) 10,409 (4,910) 518 1,050 7,067 (1,255) 5,812 - 5,812
Profit (loss) and cash flows are shown only for continuing operations.
The column 'Other activities/eliminations' primarily covers the elimination of inter- segment transactions. Also included are income and costs, assets and liabilities, investment activity, taxes, etc., handled at Group level.
1 Including the elimin ation of other activities, the total elimination of intra-group revenue amounts to DKK -10,254 million.
Ørsted Annual report 2018 Financial statements Consolidated financial statements – 2. Return on capital employed
94 / 193
Note summary Contents
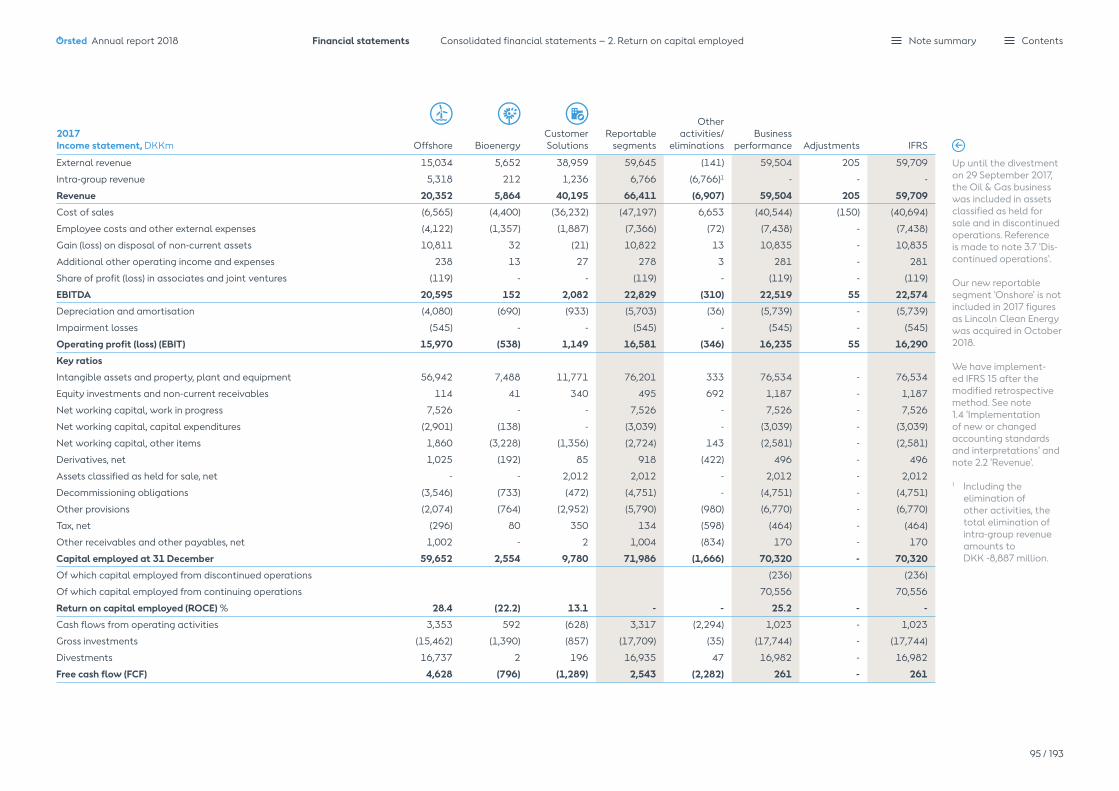
Up until the divestment on 29 September 2017, the Oil & Gas business was included in assets classified as held for sale and in discontinued operations. Reference is made to note 3.7 'Dis-continued operations'.
Our new reportable segment 'Onshore' is not included in 2017 figures as Lincoln Clean Energy was acquired in October 2018.
We have implement-ed IFRS 15 after the modified retrospective method. See note 1.4 'Implementation of new or changed accounting standards and interpretations' and note 2.2 'Revenue'.
1 Including the elimination of other activities, the total elimination of intra-group revenue amounts to DKK -8,887 million.
2017 Income statement, DKKm Offshore Bioenergy
Customer Solutions
Reportablesegments
Other activities/
eliminationsBusiness
performance Adjustments IFRS
External revenue 15,034 5,652 38,959 59,645 (141) 59,504 205 59,709
Intra-group revenue 5,318 212 1,236 6,766 (6,766)1 - - -
Revenue 20,352 5,864 40,195 66,411 (6,907) 59,504 205 59,709
Cost of sales (6,565) (4,400) (36,232) (47,197) 6,653 (40,544) (150) (40,694)
Employee costs and other external expenses (4,122) (1,357) (1,887) (7,366) (72) (7,438) - (7,438)
Gain (loss) on disposal of non-current assets 10,811 32 (21) 10,822 13 10,835 - 10,835
Additional other operating income and expenses 238 13 27 278 3 281 - 281
Share of profit (loss) in associates and joint ventures (119) - - (119) - (119) - (119)
EBITDA 20,595 152 2,082 22,829 (310) 22,519 55 22,574
Depreciation and amortisation (4,080) (690) (933) (5,703) (36) (5,739) - (5,739)
Impairment losses (545) - - (545) - (545) - (545)
Operating profit (loss) (EBIT) 15,970 (538) 1,149 16,581 (346) 16,235 55 16,290
Key ratios
Intangible assets and property, plant and equipment 56,942 7,488 11,771 76,201 333 76,534 - 76,534
Equity investments and non-current receivables 114 41 340 495 692 1,187 - 1,187
Net working capital, work in progress 7,526 - - 7,526 - 7,526 - 7,526
Net working capital, capital expenditures (2,901) (138) - (3,039) - (3,039) - (3,039)
Net working capital, other items 1,860 (3,228) (1,356) (2,724) 143 (2,581) - (2,581)
Derivatives, net 1,025 (192) 85 918 (422) 496 - 496
Assets classified as held for sale, net - - 2,012 2,012 - 2,012 - 2,012
Decommissioning obligations (3,546) (733) (472) (4,751) - (4,751) - (4,751)
Other provisions (2,074) (764) (2,952) (5,790) (980) (6,770) - (6,770)
Tax, net (296) 80 350 134 (598) (464) - (464)
Other receivables and other payables, net 1,002 - 2 1,004 (834) 170 - 170
Capital employed at 31 December 59,652 2,554 9,780 71,986 (1,666) 70,320 - 70,320
Of which capital employed from discontinued operations (236) (236)
Of which capital employed from continuing operations 70,556 70,556
Return on capital employed (ROCE) % 28.4 (22.2) 13.1 - - 25.2 - -
Cash flows from operating activities 3,353 592 (628) 3,317 (2,294) 1,023 - 1,023
Gross investments (15,462) (1,390) (857) (17,709) (35) (17,744) - (17,744)
Divestments 16,737 2 196 16,935 47 16,982 - 16,982
Free cash flow (FCF) 4,628 (796) (1,289) 2,543 (2,282) 261 - 261
Ørsted Annual report 2018 Financial statements Consolidated financial statements – 2. Return on capital employed
95 / 193
Note summary Contents

2.2 Revenue
Revenue 2017, DKKm Offshore Bioenergy Customer Solutions
Other activities/
elimina-tions Total
Sale of gas - - 19,540 (1,556) 17,984
Generation and sale of power 10,052 3,223 17,492 (5,722) 25,045
Revenue from construction of offshore wind farms 8,773 - - - 8,773
Generation and sale of heat and steam - 2,607 - - 2,607
Distribution and transmission - - 2,520 (32) 2,488
Other revenue 1,520 129 534 629 2,812
Total revenue, IFRS 20,345 5,959 40,086 (6,681) 59,709
Adjustments 7 (95) 109 (226) (205)
Total revenue, business performance 20,352 5,864 40,195 (6,907) 59,504
Revenue 2018, DKKm
Offshore
Onshore BioenergyCustomer Solutions
Other activities/
elimina-tions Total
Sale of gas - - 48 23,300 (904) 22,444
Generation and sale of power 4,969 64 3,113 20,743 (7,010) 21,879
Revenue from construction of offshore wind farms 16,560 - - - - 16,560
Generation and sale of heat and steam - - 2,903 - - 2,903
Distribution and transmission - - - 2,777 (32) 2,745
Other revenue 1,529 - 209 584 66 2,388
Total revenue from customers, IFRS 23,058 64 6,273 47,404 (7,880) 68,919
Government grants 7,917 5 560 - (21) 8,461
Economic hedging (2,149) 465 (633) 728 2 (1,587)
Other revenue - 11 272 (805) 249 (273)
Total revenue, IFRS 28,826 545 6,472 47,327 (7,650) 75,520
Adjustments 1,740 (465) (119) 672 (402) 1,426
Total revenue, business performance 30,566 80 6,353 47,999 (8,052) 76,946
Timing of revenue recognition from customers, IFRS
At a point in time 6,282 64 3,216 30,201 (452) 39,311
Over time 16,776 - 3,057 17,203 (7,428) 29,608
Total revenue from customers, IFRS 23,058 64 6,273 47,404 (7,880) 68,919
We have implemented IFRS 15 after the modified retro spective method. Therefore, we have not restated comparative figures.
In 2017, we presented revenue from green certificates, mainly ROCs, as generation and sale of power. In 2018, revenue from green certificates is presented as government grants.
1 The elimination column includes elimination of the internal sale of ROCs between Offshore (included as government grants, see note 2.4 'Government grants') and Customer Solutions. The ROCs are recognised as inventory in Customer Solutions before being sold to external customers, which creates a mismatch in the timing of the internal purchase and the external sale of the ROCs in Customer Solutions. The amount to be eliminated may exceed the amount of ROCs recognised in Offshore for the period.
The timing of transfer of goods or services to customers is categorised as follows:'At a point in time' mainly comprises:– sale of gas or power in the market, e.g.
North Pool, TTF, NBP– transmission assets for offshore wind farms.
'Over time' mainly comprises:– construction agreements of offshore wind farms
and transmission assets– long-term contracts with customers to deliver
gas, power or heat.
Revenue for the year (business performance) increased by 29% to DKK 76,946 million in 2018. The increase was mainly due to a high activity on construction of offshore wind farms for partners, higher revenue from wind farms in operation as well as higher gas and power prices.
Revenue for the year from the construction of offshore wind farms mainly related to the con-struction of the offshore wind farms Walney Extension, Borkum Riffgrund 2 and Hornsea 1 as well as the divestment of the Burbo Bank transmission asset and a partial divestment of the Hornsea 1 transmission asset as part of the 50% farm-down of Hornsea 1. Following the
implementation of IFRS 15, revenue from con-struction of transmission assets are recognised at the time of divestment.
In 2018, revenue totalled DKK 75,520 million according to IFRS, of which DKK 70,736 million was revenue from the sale of goods, andDKK 4,784 million was revenue from the sale of services.
In 2017, revenue totalled DKK 59,709 million according to IFRS, of which DKK 52,347 million was revenue from the sale of goods, and DKK 7,362 million was revenue from the sale of services.
Ørsted Annual report 2018 Financial statements Consolidated financial statements – 2. Return on capital employed
96 / 193
Note summary Contents

Unsatisfied long-term contractsOur remaining performance obligations expected to be recognised in more than one year relate to the construction of wind farms and offshore transmission assets. The con-structions are expected to be finalised within two years.
performance obligation with multiple deliveries to be satisfied over time. For such contracts, we recognise revenue in the amount up to which we have a right to invoice. Some long-term gas sales contracts include clauses which give the right to renegotiate the fixed sales prices. Expectations for the outcomes of renegotia-tions are not included in revenue before we know the outcome of the individual renegotiations. In most cases, the consideration for the gas is due when the gas is injected into the distribution system or delivered to the customer. The delivery of gas is invoiced on a monthly basis, and the payment is due within 10-30 days.
Generation and sale of powerTypes of goods and servicesRevenue from generation and sale of power includes the sale of power produced at own wind farms and power plants, the sale of power sourced from other producers, and the sale of ancillary services. Timing of satisfaction of delivery obligations, and significant estimatesRevenue is recognised when control of the goods is transferred to the buyer. Transfer of control occurs when the actual power is delivered to the customer, which for power generated by us occurs when it is produced.
Sales agreements are divided into individually identi-fiable performance obligations. If a sales agreement includes several performance obligations, the sales agreement's transaction price is allocated to each performance obligation's stand-alone selling price. In the comparative period, revenue was measured at the fair value of the consideration received or receiv-able. Revenue from the sale of goods was recognised when the significant risks and rewards of ownership had been transferred to the customer, recovery of the consideration was probable, the associated costs and possible return of goods could be estimated reliably, there was no continuing management involvement with the goods, and the amount of revenue could be measured reliably. Revenue from rendering of services was recognised in proportion to the stage of completion of the work performed at the reporting date.
Sale of gasTiming of satisfaction of delivery obligations and significant estimatesRevenue is recognised when control of the gas is transferred to the buyer. Transfer of control occurs either when the gas is injected into the distribution system or physically delivered to the customer. Significant terms of payment and associated estimates and judgements Sales contracts for a fixed amount of gas at a variable price, or where we are exclusive suppliers to the customer at a variable price, are considered one
Unsatisfied long-term contracts with customers, DKKm
Expected to be recognised in
31 December 2018 2019 2020 2020+
Aggregate amount of the transaction price allocated to long-term contracts 11,473 91% 9% 0%
The transaction price allocated to the remaining performance obligation (unsatisfied or partially satisfied) as at 31 December 2018.
In accordance with IFRS 15, the overview does not include revenue from contracts with customers to deliver power, gas and heat or our operation and maintenance agreements. For these types of goods and services, we recognise the revenue that correspond directly to the value transferred to the customer.
In our view, our partner assumes control of the offshore wind farm in step with the construction. This is supported by:– the regular approval of part deliveries– approval or rejection of significant variations to
the construction– the partner's take-over of work from subcontrac-
tors, both concerning risk and legal title to the wind farm on an on-going basis
– milestone payments from the partner.
Revenue is therefore recognised over time during the construction of the offshore wind farms.
Accounting policies
Revenue is measured based on the consideration specified in a contract with a customer (transaction price) and excludes amounts collected on behalf of third parties, i.e. VAT. We recognise revenue when we transfer control over a product or service to a customer. If a part of the transaction price is variable, i.e. bonus payments, incentive payments for unmissed dead-lines, etc., the variable consideration is recognised in revenue when it is highly probable that the revenue will not be reversed in subsequent periods. We adjust the transaction price for the time value of money if the payments exceed twelve months.
Key accounting estimates
Assumptions for the determination of the expected selling price and expected costsWe make estimates when determining the expected selling price of individual construction agreements. These estimates are influenced by our assessment of: – the completion degree of the individual offshore
wind farms and offshore transmission assets – total expected costs for the individual contract– the value of incentive agreements under which we
may be paid a bonus for early delivery or have to pay compensation for late delivery
– guarantee commitments undertaken– share of total costs associated with transmission
assets which are expected to be covered upon handover, etc.
Therefore, our determination of profit and the recognition of revenue and related contract assets are subject to significant uncertainty. We believe that our estimates are the most likely outcomes of future events.
Key accounting judgements
Assumptions for the recognition of revenue from the construction of offshore wind farms over timeWe construct offshore wind farms with partners, where we construct our partner's share of the wind farm. We assess each construction agreement at the time of conclusion of the agreement.
Ørsted Annual report 2018 Financial statements Consolidated financial statements – 2. Return on capital employed
97 / 193
Note summary Contents

Significant terms of payment and associated estimates and assessmentsRevenue from ancillary services consist of fees for having power plants on standby in periods with a demand for power generation. Ancillary services are considered one performance obligation which is ful-filled over time when the power plants are on standby. Sales contracts for a fixed amount of power at a variable price, or where we are exclusive suppliers to the customer at a variable price, are considered one performance obligation with multiple deliveries to be satisfied over time. For such contracts and for long-term agreements on selling power at a fixed price, we recognise revenue in the amount up to which we have a right to invoice.
In most cases, the consideration for the power is due when the actual power is delivered to the customer. The delivery of power is invoiced on a monthly basis, and the payment is due within 10-30 days.
Ancillary services are invoiced on a monthly basis, and consideration is payable when invoiced.
Revenue from construction of offshore wind farmsTypes of goods and servicesRevenue from construction of offshore wind farms includes development and construction. The construction agreements cover the construction from design to delivery of an operational asset. The agreement consists of two performance obligations:– Offshore wind farms. – Offshore transmission assets, if applicable.
The construction agreements cover our partners’ shares of the construction of the wind farm and offshore transmission asset, if applicable.
If the contracts include multiple performance obliga-tions, the transaction price will be allocated to each performance obligation based on the stand-alone selling prices. Where these are not directly observ-able, they are estimated based on the expected cost-plus margin. Timing of satisfaction of delivery obligations, and significant estimatesWe recognise revenue from the construction agreements over time, using an input method to measure progress towards complete satisfaction of
the performance obligation because the customer gains control of the offshore wind farm during the construction process. The input method reflects our ongoing transfer of control to the customer. When the outcome of the performance obligation in the contract can be measured reasonably, the con-struction agreement is measured at the transaction price of the work performed less progress billings, based on the percentage of completion of the con-tract at balance sheet date and the total expected revenues from the individual contracts. We estimate the degree of completion on the basis of an assessment of the work performed, normally calculated as the ratio between the costs incurred and the total costs expected related to the contract in question.
The transaction price is based on the total expected income from individual contracts. Estimates of revenues are based on the transaction price and the completion degree of the offshore wind farm or off-shore transmission asset at the balance sheet date.
Estimates of revenues, costs and percentage of completion are revised if circumstances change. Any resulting increases or decreases in estimated revenue or costs are reflected in profit or loss in the period in which the circumstances that give rise to the revision come to our knowledge. An expected loss is recognised when it is deemed probable that the total construction costs will ex-ceed the total revenue from the individual contracts.
Significant terms of payment and associated estimates and assessments The consideration for the construction of an offshore wind farm consists of a fixed fee and a relatively minor variable fee, depending on when the wind farm can be put into operation.
The consideration for an offshore transmission asset is a fixed fee.
After signing of the construction agreement, we carry out an assessment determining when the wind farm is expected to be completed and calculate the size of the variable payment on this basis. We only recognise the variable fee when it is highly probable that a subsequent reversal will not take place.
At each balance sheet date, an assessment is made of the size of the variable payment which can be included in the transaction price. Revenue is adjusted accordingly. The customer pays the fixed consideration based on a payment schedule . The payment schedule is deter-mined and based on the expected progress of the construction and transfer of control to the customer.
If the work which we have performed exceeds invoicing on account, a contract asset is recognised. If the payments exceed the work we have performed, a contract liability is recognised.
Generation and sale of heatTiming of satisfaction of delivery obligations and significant estimatesHeat is sold under long-term heat contracts. Revenue is recognised when control is transferred to the customer. Transfer of control occurs when the heat is physically delivered to the customer. In connection with a biomass conversion of a CHP plant, the heat customer makes a prepayment to finance the majority of our CAPEX associated with the conversion. The prepayment is recognised as a contract liability. The contract liability is recognised as revenue in step with the transfer of heat to the customer.
Significant terms of payment and associated estimates and assessmentsPayment for the sale of heat consists of fixed costs associated with operation and maintenance of a CHP plant plus fuel costs for the generation of heat and a financial return.
The delivery of heat is invoiced on a monthly basis, and the payment is due within 10-30 days.
Distribution and transmissionTiming of satisfaction of delivery obligations, and significant estimatesRevenue from the distribution and transmission of gas and power is recognised when the gas or power is delivered to the buyer, or when the capacity is made available.
Significant terms of payment and associated estimates and assessments Revenue is calculated as the amount we are entitled to when the service is delivered to the customer and invoiced on a monthly basis, and consideration is payable when invoiced.
Other revenueTypes of goods and servicesOther revenue primarily includes operations and maintenance agreements and other services.
Timing of satisfaction of delivery obligations and significant estimatesRevenue from providing services is recognised in the accounting period in which the services are rendered.
For fixed-priced contracts, revenue is recognised based on the actual service rendered at the end of the reporting period as a proportion of the total services to be rendered because the customer receives and uses the benefits simultaneously. This is determined based on the actual labour hours spent relative to the total labour hours expected.
Significant terms of payment and associated estimates and assessmentsThe consideration for operations and maintenance agreements consists of a fixed fee and a minor variable fee, e.g. bonuses or compensation for wind farm availability.
Availability bonuses will be recognised on an ongoing basis when it is highly probable that a subsequent reversal will not take place.
Fixed-price contracts are invoiced on a monthly basis, and consideration is payable when invoiced. Variable fee services are generally due after the services are rendered.
Warranty obligations We typically have a five-year responsibility to remedy defects that exists at the relevant taking-over date when we construct offshore wind farms. These types of warranties are accounted for under IAS 37 'Provisions, Contingent Liabilities and Contingent Assets'. Reference is made to the accounting policy on warranty provisions in note 3.2 'Provisions and contingent assets and liabilities'.
Ørsted Annual report 2018 Financial statements Consolidated financial statements – 2. Return on capital employed
98 / 193
Note summary Contents

2.3 Cost of sales
Cost of sales according to business perform-ance increased from DKK 40,544 million in 2017 to DKK 53,906 million in 2018, up 33%.
The increase was mainly due to higher gas prices, higher sale of ROCs due to higher power generation from offshore wind farms and higher costs in connection with construc-tion of offshore wind farms, including the
divestment of the Burbo Bank transmission asset and a partial divestment of theHornsea 1 transmission asset as part of the 50% farm-down of the Hornsea 1.
Following the implementation of IFRS 15, cost of sales from construction of transmission assets are recognised at the time of divestment.
Cost of sales, DKKm Offshore Onshore Bioenergy Customer
Solutions
Other activities/
eliminations 2018 total Offshore Bioenergy
Customer Solutions
Other activities/
eliminations 2017 total
Gas - - 529 20,428 (558) 20,399 - 976 16,391 (4,477) 12,890
Power 27 - 76 19,580 (7,159) 12,524 188 90 16,520 (5,510) 11,288
Biomass - - 2,468 - - 2,468 - 2,091 - - 2,091
Coal - - 960 2 - 962 - 829 - - 829
Distribution and transmission costs 754 - 191 2,711 (88) 3,568 625 138 2,496 (102) 3,157
Costs for construction of offshore wind farms 12,590 - - 38 - 12,628 5,720 - 14 17 5,751
Other cost of sales (1) - 334 1,013 123 1,469 32 280 975 3,401 4,688
Total, IFRS 13,370 - 4,558 43,772 (7,682) 54,018 6,565 4,404 36,396 (6,671) 40,694
Adjustments - - (31) 87 (168) (112) - (4) (164) 18 (150)
Total, business performance 13,370 - 4,527 43,859 (7,850) 53,906 6,565 4,400 36,232 (6,653) 40,544
Cost of sales relate partly to trading in gas and power, partly to fuel used at CHP plants in
connection with heat and power generation and partly to the construction of offshore wind farms
and offshore transmission assets.
Ørsted Annual report 2018 Financial statements Consolidated financial statements – 2. Return on capital employed
99 / 193
Note summary Contents
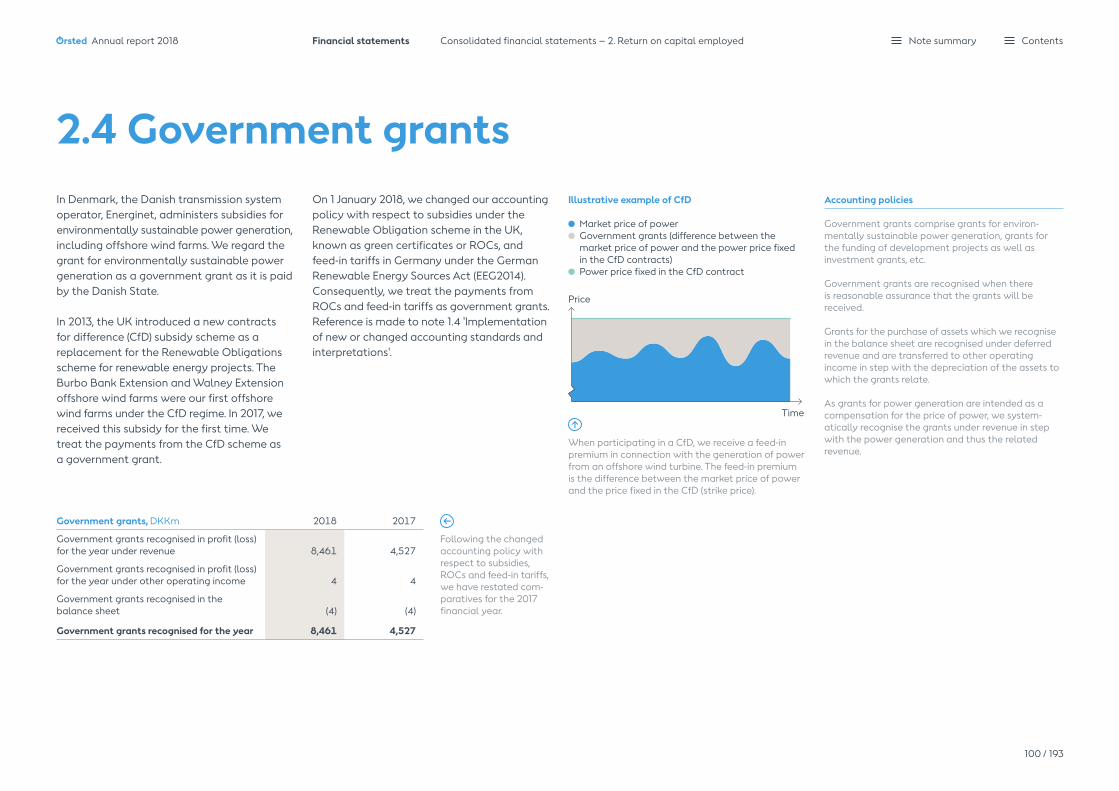
2.4 Government grants
Government grants, DKKm 2018 2017
Government grants recognised in profit (loss) for the year under revenue 8,461 4,527
Government grants recognised in profit (loss) for the year under other operating income 4 4
Government grants recognised in the balance sheet (4) (4)
Government grants recognised for the year 8,461 4,527
In Denmark, the Danish transmission system operator, Energinet, administers subsidies for environmentally sustainable power generation, including offshore wind farms. We regard the grant for environmentally sustainable power generation as a government grant as it is paid by the Danish State.
In 2013, the UK introduced a new contracts for difference (CfD) subsidy scheme as a replacement for the Renewable Obligations scheme for renewable energy projects. The Burbo Bank Extension and Walney Extension offshore wind farms were our first offshore wind farms under the CfD regime. In 2017, we received this subsidy for the first time. We treat the payments from the CfD scheme as a government grant.
Illustrative example of CfD
Market price of power Government grants (difference between the
market price of power and the power price fixed in the CfD contracts)
Power price fixed in the CfD contract
Time
Price
When participating in a CfD, we receive a feed-in premium in connection with the generation of power from an offshore wind turbine. The feed-in premium is the difference between the market price of power and the price fixed in the CfD (strike price).
On 1 January 2018, we changed our accounting policy with respect to subsidies under the Renewable Obligation scheme in the UK, known as green certificates or ROCs, and feed-in tariffs in Germany under the German Renewable Energy Sources Act (EEG2014). Consequently, we treat the payments from ROCs and feed-in tariffs as government grants. Reference is made to note 1.4 'Implementation of new or changed accounting standards and interpretations'.
Accounting policies
Government grants comprise grants for environ-mentally sustainable power generation, grants for the funding of development projects as well as investment grants, etc.
Government grants are recognised when there is reasonable assurance that the grants will be received.
Grants for the purchase of assets which we recognise in the balance sheet are recognised under deferred revenue and are transferred to other operating income in step with the depreciation of the assets to which the grants relate.
As grants for power generation are intended as a compensation for the price of power, we system-atically recognise the grants under revenue in step with the power generation and thus the related revenue.
Following the changed accounting policy with respect to subsidies, ROCs and feed-in tariffs, we have restated com-paratives for the 2017 financial year.
Ørsted Annual report 2018 Financial statements Consolidated financial statements – 2. Return on capital employed
100 / 193
Note summary Contents

Amazon
Impact on Ørsted
July2017
01/10/1801/01/18 31/12/18
Tahoka
Willow Springs
December2018
November2017
2.5 Other operating income and expensesOther operating incomeIn 2018, other operating income amounted to DKK 16,275 million, which was 40% higher than in 2017. In 2018, gain on divestment of assets related to the divestment of 50% of the Hornsea 1 offshore wind farm, whereas the 50% farm down of Walney Extension and Borkum Riffgrund 2 and a contingent consider-ation relating to the divestment of Race Bank in 2016 contributed positively in 2017.
US tax credits and tax equity income originate from our acquisition of Lincoln Clean Energy in October 2018 and correspond to the tax credits and other tax attributes provided to tax equity partners for three months ofgenerated power, as well as our own share.
Other operating income, DKKm 2018 2017
Gain on divestment of assets 15,086 11,142
Other compensation 594 369
US tax credits and tax equity income 85 -
Miscellaneous operating income 510 154
Total other operating income 16,275 11,665
Divestment of ownership interests in our offshore wind farms
When we divest an ownership interest in an offshore wind farm to a partner, we typically also enter into agreements on the future construction and operation of the offshore wind farm.
Contracts in connection with divestment are typically:– Agreements on the sale of shares (divestment
of assets) (SPA).– Agreements on the future construction of the
offshore wind farm (construction agreements).– Agreements on the future operation of the
offshore wind farm (O&M agreements).
Key accounting judgements
Assessment of classification of divestmentWhen we divest ownership interests in an offshore wind farm under development, we carry out an individual assessment of whether the divestment qualifies as a divestment of an enterprise or a divest-ment of assets. We have typically assessed that the offshore wind farms do not constitute an enterprise, as no employees are transferred, and processes are transferred to a limited extent only.
Key accounting estimates
Assumptions for the accounting treatment of divestment gains related to share purchaseagreements and construction agreementsOur accounting recognition of the gains in the divest-ment contracts is based on the individual accounting transaction prices of the relevant contracts.
Our accounting treatment of the gains in thecontracts is therefore not necessarily identical with the prices negotiated in the individual contracts.
Accounting policies
In connection with the divestment of ownership interests in offshore wind farms before or during the construction phase, the gain is recognised on the divestment date under other operating income/expenses in the income statement.
The gain for the future construction of the partner's share of the offshore wind farm is recognised over time in the income statement in step with the con-struction. See notes 2.2 'Revenue' and 4.2 'Contract assets and liabilities'.
The accounting policies for US tax credits and tax equity income is described in note 4.5 'Tax equity liabilities'.
Other operating expenses, DKKm 2018 2017
Loss on divestment of assets 91 307
Miscellaneous operating expenses 198 242
Total other operating expenses 289 549
2018 is the first year of recognising US tax credits and tax equity income originating from our acquisitions and entry in the US market.
US tax credit and tax equity income are earned from the time of commissioning and only in Ørsted's ownership period.
Ørsted Annual report 2018 Financial statements Consolidated financial statements – 2. Return on capital employed
101 / 193
Note summary Contents

Employee costs, DKKm 2018 2017
Wages, salaries and remuneration 3,768 3,650
Share-based payment 24 15
Pensions 317 310
Other social security costs 124 117
Other employee costs 24 61
Employee costs before transfers to assets 4,257 4,153
Transfers to assets (1,131) (956)
Total employee costs 3,126 3,197
2.6 Employee costs Remuneration of Group Executive Management The remuneration of the Executive Board is based on a fixed salary, including personal benefits, such as a company car, free tele-phone, etc., a variable salary, a retention bonus in connection with the IPO, and share-based payment. The other members of Group Execu-tive Management1 also receive a pension. The Group Executive Management was expanded by one member in 2018.
The members of the Board of Directors are paid fixed remuneration only for their work in Ørsted. In addition, Ørsted reimburses any travel expenses.
For further details about the remuneration of the Executive Board and the Board of Directors, reference is made to the remunera-tion report on page 63.
Salaries and remuneration for Group Executive Management and the Board of Directors, DKK '000
Executive BoardOther members of Group Executive Management1 Board of Directors Total
2018 2017 2018 2017 2018 2017 2018 2017
Fixed salary 16,400 14,761 19,611 16,509 5,133 4,934 41,144 36,204
Cash-based incentive scheme 4,630 4,004 5,329 3,917 - - 9,959 7,921
Retention bonus etc. 1,875 2,812 2,860 6,535 - - 4,735 9,347
Share-based payment 3,537 2,080 3,142 949 - - 6,679 3,029
Pension incl. social security and benefits 555 522 5,060 2,923 - - 5,615 3,445
Termination payment - - - 5,3302 - - - 5,330
Total 26,997 24,179 36,002 36,163 5,133 4,934 68,132 65,276
1 Other members of Group Executive Management in 2018 are: Thomas Dalsgaard, Morten Hultberg Buch greitz, Martin Neubert, Ole Kjems Sørensen and Anders Lindberg.
2 The compensation relates primarily to the non-competition clause in connection with Samuel Leupold's notice of termination.
Employee costs Employee costs before transfer to assets were 2.5% higher in 2018 compared with 2017, mainly reflecting salary increases and a higher average number of employees. Employee costs transferred to assets relate to invest-ment projects, which are capitalised in the balance sheet.
Pension plans and number of employees Pension plans are defined-contribution plans that do not commit Ørsted beyond the amounts contributed.
In 2018, our average number of employees was 5,796 (2017: 5,738).
Ørsted Annual report 2018 Financial statements Consolidated financial statements – 2. Return on capital employed
102 / 193
Note summary Contents
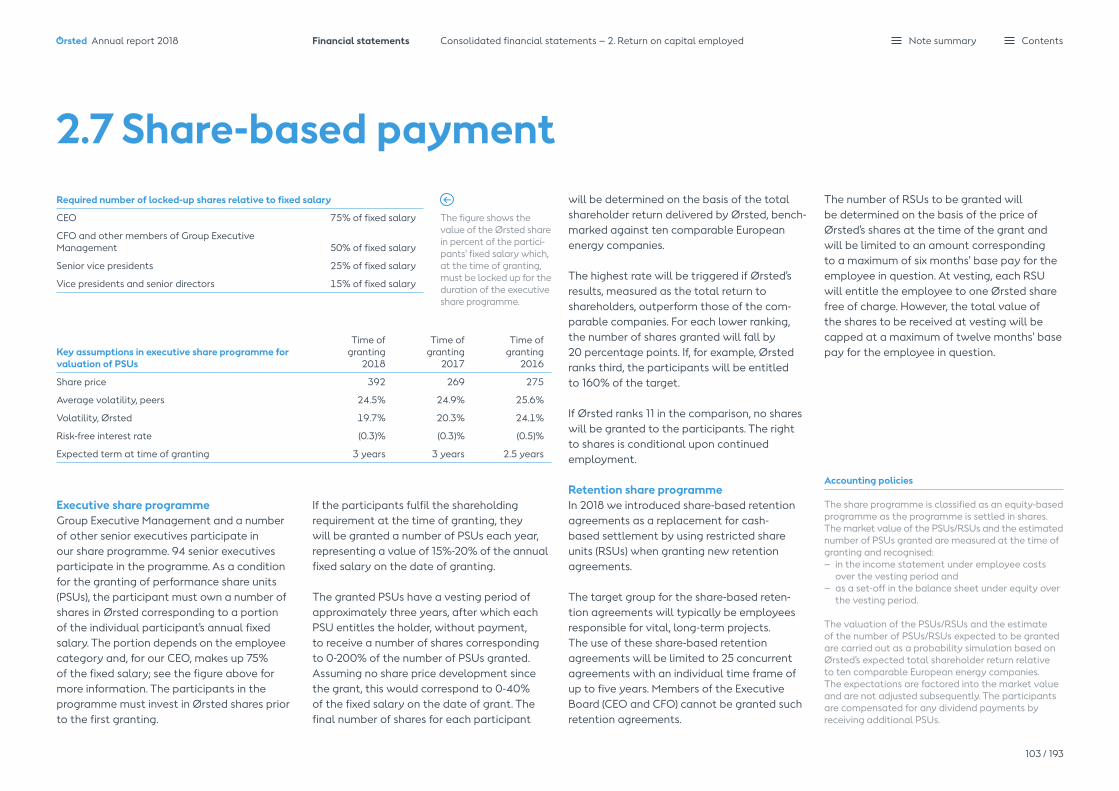
will be determined on the basis of the total shareholder return delivered by Ørsted, bench-marked against ten comparable European energy companies.
The highest rate will be triggered if Ørsted's results, measured as the total return to shareholders, outperform those of the com-parable companies. For each lower ranking, the number of shares granted will fall by20 percentage points. If, for example, Ørsted ranks third, the participants will be entitled to 160% of the target.
If Ørsted ranks 11 in the comparison, no shares will be granted to the participants. The right to shares is conditional upon continued employment.
Retention share programmeIn 2018 we introduced share-based retention agreements as a replacement for cash-based settlement by using restricted share units (RSUs) when granting new retention agreements.
The target group for the share-based reten-tion agreements will typically be employees responsible for vital, long-term projects. The use of these share-based retention agreements will be limited to 25 concurrent agreements with an individual time frame of up to five years. Members of the Executive Board (CEO and CFO) cannot be granted such retention agreements.
2.7 Share-based paymentRequired number of locked-up shares relative to fixed salary
CEO 75% of fixed salary
CFO and other members of Group Executive Management 50% of fixed salary
Senior vice presidents 25% of fixed salary
Vice presidents and senior directors 15% of fixed salary
The number of RSUs to be granted will be determined on the basis of the price of Ørsted's shares at the time of the grant and will be limited to an amount corresponding to a maximum of six months' base pay for the employee in question. At vesting, each RSU will entitle the employee to one Ørsted share free of charge. However, the total value of the shares to be received at vesting will be capped at a maximum of twelve months' base pay for the employee in question.
The figure shows the value of the Ørsted share in percent of the partici-pants' fixed salary which, at the time of granting, must be locked up for the duration of the executive share programme.
Accounting policies
The share programme is classified as an equity-based programme as the programme is settled in shares. The market value of the PSUs/RSUs and the estimated number of PSUs granted are measured at the time of granting and recognised:– in the income statement under employee costs
over the vesting period and – as a set-off in the balance sheet under equity over
the vesting period.
The valuation of the PSUs/RSUs and the estimateof the number of PSUs/RSUs expected to be granted are carried out as a probability simulation based on Ørsted's expected total shareholder return relative to ten comparable European energy companies. The expect ations are factored into the market value and are not adjusted subsequently. The participants are compensated for any dividend payments by receiving additional PSUs.
Key assumptions in executive share programme for valuation of PSUs
Time of granting
2018
Time of granting
2017
Time of granting
2016
Share price 392 269 275
Average volatility, peers 24.5% 24.9% 25.6%
Volatility, Ørsted 19.7% 20.3% 24.1%
Risk-free interest rate (0.3)% (0.3)% (0.5)%
Expected term at time of granting 3 years 3 years 2.5 years
Executive share programmeGroup Executive Management and a number of other senior executives participate in our share programme. 94 senior executives participate in the programme. As a condition for the granting of performance share units (PSUs), the participant must own a number of shares in Ørsted corresponding to a portion of the individual participant's annual fixed salary. The portion depends on the employee category and, for our CEO, makes up 75% of the fixed salary; see the figure above for more information. The participants in the programme must invest in Ørsted shares prior to the first granting.
If the participants fulfil the shareholding requirement at the time of granting, they will be granted a number of PSUs each year, representing a value of 15%-20% of the annual fixed salary on the date of granting.
The granted PSUs have a vesting period of approximately three years, after which each PSU entitles the holder, without payment, to receive a number of shares corresponding to 0-200% of the number of PSUs granted. Assuming no share price development since the grant, this would correspond to 0-40% of the fixed salary on the date of grant. The final number of shares for each participant
Ørsted Annual report 2018 Financial statements Consolidated financial statements – 2. Return on capital employed
103 / 193
Note summary Contents

Development in maximum number of outstanding shares, '000Executive
Board
Other mem-bers of Group
Executive Management
Senior executives
Other employees 2018 2017
2018 in % of share capital
Maximum number of outstanding shares at 1 January 44 34 249 - 327 158 0.08%
Compensation for dividends paid (2016 and 2017 programme) 1 1 5 - 7 3 0.00%
Granted (2018 programme) 19 22 83 - 124 - 0.03%
Granted (2017 programme) - - - - - 179
Cancelled (2017 programme) - - (4) - (4) (6) 0.00%
Cancelled (2016 programme) - - (6) - (6) (7) 0.00%
Share retention program - - - 18 18 - 0.00%
Maximum number of outstanding shares at 31 December 64 57 327 18 466 327 0.11%
(DKKm)
Market value of share programme at the time of granting 12 11 58 4 85 52
Maximum market value of share programme on 31 December 28 25 142 8 203 111
The maximum market value of the share programme at 31 December is based on the assumption that the partici-pants receive the maximum number of shares. This requires that Ørsted delivers the highest shareholder return benchmarked against the ten comparable companies.
Maximum number of outstanding shares at the time of granting, '000
Time of grantingExecutive
Board
Other mem-bers of Group
Executive Management
Senior executives
Other employees Total
% of share capital
Market value (at time of
granting)DKK million
Years until expiry
1 September 2016 21 17 113 - 151 0.04% 24 0.3
1 April 2017 24 18 131 - 173 0.04% 28 1.3
1 April 2018 19 22 83 - 124 0.03% 29 2.3
Share retention programme - - - 18 18 0.00% 4 -
Maximum number of outstanding shares at 31 December 2018 64 57 327 18 466 0.11% 85
Ørsted Annual report 2018 Financial statements Consolidated financial statements – 2. Return on capital employed
104 / 193
Note summary Contents

3.Capital employed
Capital employed 106Intangible assets and property, plant and equipment 107 Provisions and contingent assets and liabilities 110Acquisition of enterprises 112 Divestment of enterprises 113Gross and net investments 113 Assets classified as held for sale 114 Discontinued operations 115 Non-controlling interests 117
Ørsted Annual report 2018 Note summary Contents

Capital employed, DKKm 2018 2017
Intangible assets and property, plant and equipment 84,832 76,534
Equity investments and non-current receivables 1,445 1,187
Net working capital, work in progress 9,654 7,526
Net working capital, tax equity (3,719) -
Net working capital, capital expenditures (2,978) (3,039)
Net working capital, other items 1,489 (2,581)
Derivatives, net (2,626) 496
Assets classified as held for sale, net 10,372 2,012
Decommissioning obligations (5,472) (4,751)
Other provisions (7,982) (6,769)
Tax, net (2,629) (464)
Other receivables and other payables, net 510 169
Total capital employed 82,896 70,320
Of which discontinued operations (143) (236)
Of which continuing operations 83,039 70,556
Capital employed by segment, % 2018
Offshore Onshore
Bioenergy Customer Solutions
Our capital employed primarily relates to production assets, including assets under construction. We monitor investment projects closely, as a large part of our value is created in the development and construction phases.
Investments and divestments in 2018Our gross investments amounted to DKK 24.5 billion in 2018, of which Offshore accounted for 62%. In addition to offshore wind farms, our gross investments were related to the acquisitions of the onshore wind company Lincoln Clean Energy and the offshore wind company Deepwater Wind in the US, bioconversion of Asnæs Power Station and the replacement of smart meters at our residential power customers in Radius.
Divestments amounted to DKK 20.0 billion and was primarily related to the 50% farm-down of Hornsea 1, receipt of deferred proceeds from the farm-down of 50% of Walney Extension in 2017 and proceeds from the divestment of our 50% ownership share of Enecogen.
The most significant asset under construction at the end of 2018 was the offshore wind farm Hornsea 1 in the UK.
3. Capital employed
DKK 82,896 million
79%
6%
13%
82.9bnCapital employed totalled DKK 82,896 million on 31 December 2018 against DKK 70,320 million in 2017.
24.5bnGross investments amounted to DKK 24,481 million in 2018 against DKK 17,744 million in 2017.
20.0bnCash flows from divestments totalled DKK 19,950 million in 2018 against DKK 16,982 million in 2017.
Following the divestment of the oil and gas business on 29 September 2017, capital employed from
discontinued operations includes our receivables and liabilities from the transaction.
79% of the capital employed is tied up in Offshore.
Capital employed by segment is based on capital employed for reportable segmentsof DKK 83,267 million.
2%
Ørsted Annual report 2018 Financial statements Consolidated financial statements – 3. Capital employed
106 / 193
Note summary Contents
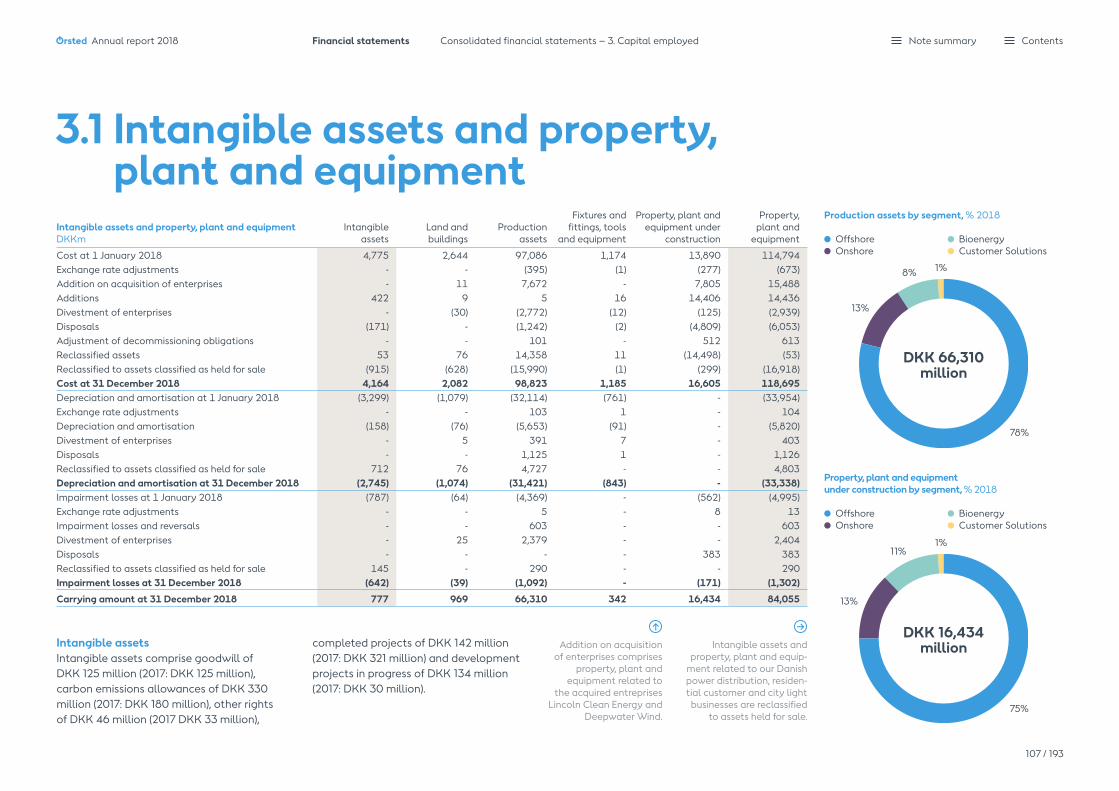
Intangible assets and property, plant and equipment DKKm
Intangible assets
Land and buildings
Productionassets
Fixtures and fittings, tools
and equipment
Property, plant and equipment under
construction
Property, plant and
equipment
Cost at 1 January 2018 4,775 2,644 97,086 1,174 13,890 114,794Exchange rate adjustments - - (395) (1) (277) (673)Addition on acquisition of enterprises - 11 7,672 - 7,805 15,488Additions 422 9 5 16 14,406 14,436Divestment of enterprises - (30) (2,772) (12) (125) (2,939)Disposals (171) - (1,242) (2) (4,809) (6,053)Adjustment of decommissioning obligations - - 101 - 512 613Reclassified assets 53 76 14,358 11 (14,498) (53)Reclassified to assets classified as held for sale (915) (628) (15,990) (1) (299) (16,918)Cost at 31 December 2018 4,164 2,082 98,823 1,185 16,605 118,695Depreciation and amortisation at 1 January 2018 (3,299) (1,079) (32,114) (761) - (33,954)Exchange rate adjustments - - 103 1 - 104Depreciation and amortisation (158) (76) (5,653) (91) - (5,820)Divestment of enterprises - 5 391 7 - 403Disposals - - 1,125 1 - 1,126Reclassified to assets classified as held for sale 712 76 4,727 - - 4,803Depreciation and amortisation at 31 December 2018 (2,745) (1,074) (31,421) (843) - (33,338)Impairment losses at 1 January 2018 (787) (64) (4,369) - (562) (4,995)Exchange rate adjustments - - 5 - 8 13Impairment losses and reversals - - 603 - - 603Divestment of enterprises - 25 2,379 - - 2,404Disposals - - - - 383 383Reclassified to assets classified as held for sale 145 - 290 - - 290Impairment losses at 31 December 2018 (642) (39) (1,092) - (171) (1,302)
Carrying amount at 31 December 2018 777 969 66,310 342 16,434 84,055
3.1 Intangible assets and property, plant and equipment
Intangible assetsIntangible assets comprise goodwill of DKK 125 million (2017: DKK 125 million), carbon emissions allowances of DKK 330 million (2017: DKK 180 million), other rights of DKK 46 million (2017 DKK 33 million),
completed projects of DKK 142 million (2017: DKK 321 million) and development projects in progress of DKK 134 million (2017: DKK 30 million).
Intangible assets and property, plant and equip-
ment related to our Danish power distribution, residen-tial customer and city light
businesses are reclassified to assets held for sale.
Production assets by segment, % 2018
Offshore Onshore
Bioenergy Customer Solutions
Property, plant and equipment under construction by segment, % 2018
Offshore Onshore
Bioenergy Customer Solutions
DKK 66,310 million
DKK 16,434 million
78%
75%
8%
11%
1%
1%
13%
13%
Addition on acquisition of enterprises comprises
property, plant and equipment related to
the acquired entreprises Lincoln Clean Energy and
Deepwater Wind.
Ørsted Annual report 2018 Financial statements Consolidated financial statements – 3. Capital employed
107 / 193
Note summary Contents

Property, plant and equipment under construction by segment, % 2017
Offshore Bioenergy
Customer Solutions
Intangible assets and property, plant and equipment DKKm
Intangible assets
Land and buildings
Productionassets
Fixtures and fittings, tools
and equipment
Property, plant and equipment under
construction
Property, plant and
equipment
Cost at 1 January 2017 4,996 2,625 86,962 1,154 14,531 105,272
Exchange rate adjustments 99 (5) (1,172) (43) (393) (1,613)
Additions 133 - 2,1721 59 17,791 20,022
Divestment of enterprises (243) - (2,218) - - (2,218)
Disposals (210) (64) (1,844) (11) (5,871) (7,790)
Adjustment of decommissioning obligations - - 753 - 368 1,121
Reclassified assets - 88 12,433 15 (12,536) -
Cost at 31 December 2017 4,775 2,644 97,086 1,174 13,890 114,794
Depreciation and amortisation at 1 January 2017 (2,999) (1,056) (28,872) (716) - (30,644)
Exchange rate adjustments (23) 6 356 19 - 381
Additions - - (385)1 - - (385)
Depreciation and amortisation (286) (80) (5,298) (75) - (5,453)
Divestment of enterprises 9 - 467 - - 467
Disposals - 51 1,618 11 - 1,680
Depreciation and amortisation at 31 December 2017 (3,299) (1,079) (32,114) (761) - (33,954)
Impairment losses at 1 January 2017 (1,042) (64) (4,382) - - (4,446)
Exchange rate adjustments 23 - (15) - (17) (32)
Impairment losses and reversals - - - - (545) (545)
Divestment of enterprises 232 - 28 - - 28
Impairment losses at 31 December 2017 (787) (64) (4,369) - (562) (4,995)
Carrying amount at 31 December 2017 689 1,501 60,603 413 13,328 75,845
1 An accounting change in the classification of our share of the Lincs offshore wind farm from an equity investment to a joint operation in 2017 resulted in additions of DKK 2,024 million under costs and DKK -385 million under depreciation and amortisation.
Production assets by segment, % 2017
Offshore Bioenergy
Customer Solutions
DKK 60,603 million
DKK 13,328 million
74%
90%
9%
8%
17%
2%
Ørsted Annual report 2018 Financial statements Consolidated financial statements – 3. Capital employed
108 / 193
Note summary Contents

CGUs in Offshore
The CGUs are made up of individual offshore wind farms, each of which generates cash flows for the segment independently of each other.
Most significant offshore wind farms:Anholt – Borkum Riffgrund 1 – Borkum Riffgrund 2 – Borssele 1&2 – Burbo Bank Extension – Gode Wind 1 – Gode Wind 2 – Gunfleet Sands – Hornsea 1 – London Array – Race Bank – Westermost Rough – Walney – Walney Extention – West of Duddon Sands
CGUs in Bioenergy
The Danish power stations constitute a single CGU as overall production planning is for the entire Danish portfolio of CHP plants. The not yet commissioned waste-to-energy plant Renescience in Northwich in the UK is deemed to constitute an independent CGU.
– Central CHP plants (including goodwill)– Renescience Northwich
CGUs in Customer Solutions
The CGUs are constituted primarily by distribution assets, each of which generates cash flows for the segment independently of each other.
– Power distribution – Oil pipelines – Offshore gas pipelines – City light
Useful lives
Buildings 20-50 years
Offshore wind farms 20-24 years
Onshore wind farms 24-30 years
Production assets, power (thermal) and district heating 20-25 years
Gas transportation system (marine pipelines) 20-40 years
Oil transportation system (marine pipeline) 15 years
Distribution grids, power 20-40 years
Fixtures and fittings, tools and equipment 3-10 years
Accounting policies
Intangible assetsRights are measured at cost less accumulated amort isation and impairment losses. Rights are amortised on a straight-line basis over their estimated future useful lives, which are 5-20 years.
Property, plant and equipmentProperty, plant and equipment is measured at cost less accumulated depreciation and impairment losses. Cost of property, plant and equipment is depreciated on a straight-line basis, using the diminishing-balance method or the reducing-fraction method. The diminishing-balance method and the reducing-fraction method result in decreasing depreci-ation over the useful life of the offshore wind farm.Cost comprises purchase price and any costs directly attributable to the acquisition until the date the asset is available for use. The cost of self-constructed assets comprises direct and indirect costs of materials, components, sub-suppliers and labour. Borrowing costs relating to both specific and general borrowing directly attributable to assets under construction with a lengthy construction period are recognised in cost during the construction period. Cost is increased by the present value of the estimated obligations for demolition and decommissioning of assets to the extent that the obligations are recognised as a provision.
Subsequent costs, for example in connection with replacement of parts of an item of property, plant and equipment, are recognised in the carrying amount of the asset in question when it is probable that future economic benefits will flow to the Group from the expenses incurred. Other repair and maintenance expenses are recognised in profit (loss) for the year as incurred.
Assumptions for impairment testProduction assets are tested for impairment if there is any indication of impairment. For production assets with a limited lifetime, such as offshore wind farms and CHP plants, cash flows are calculated based on forecasts for the entire lifetime of the asset. For power distribution, cash flows are based on 25-year forecasts with the addition of a terminal value. The determination of the recoverable amount of production assets is based on a number of assump-tions where estimates are made for the determin-ation. These assumptions include future market conditions, market prices of power, biofuel, coal, carbon, weighted average cost of capital (WACC), exchange rates, etc. The market prices applied are based on available forward prices for a period of up to five years and our best estimate of long-term prices for the remainder of the period.
When calculating the recoverable amount of property, plant and equipment under construction, the expected completion costs and the commis-sioning dates are also assumptions which are based on estimates.
Impairment lossesImpairment losses relating to goodwillWe have not impaired goodwill or other intangible assets in 2018.
Impairment losses relating to property, plant and equipmentWe have not impaired any property, plant and equipment in 2018.
In connection with reclassification of our power distribution business to assets classified as held for sale, we have reversed an impairment loss from previous years of DKK 603 million as we expect to recover a higher amount than the carrying amounts of the assets after reversal of the impairment loss in previous years.
Certain development projects, which were impaired in previous years, were disposed of in 2018.
In 2017, impairment losses of DKK 545 million were recognised on projects in progress in Offshore.
CGUs in Onshore
The CGUs are made up of individual onshore wind farms, each of which generates cash flows for the segment independently of each other.
– Amazon – Lockett – Tahoka – Willow Springs
Ørsted Annual report 2018 Financial statements Consolidated financial statements – 3. Capital employed
109 / 193
Note summary Contents
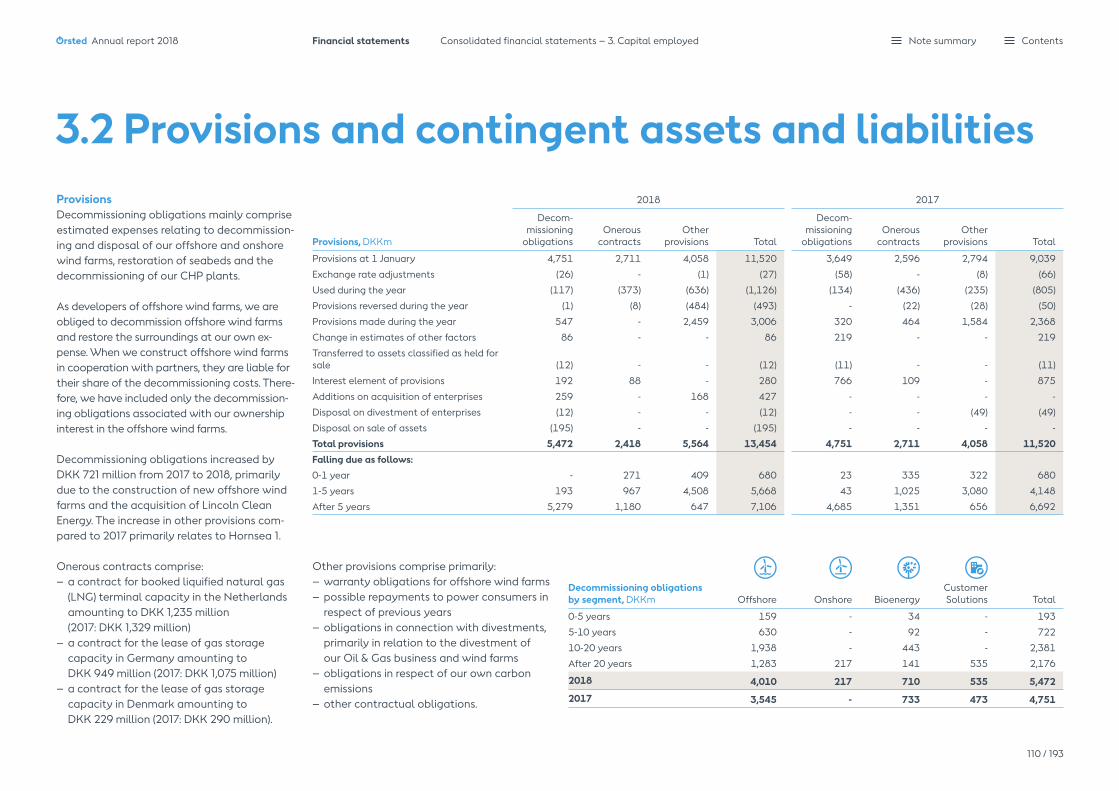
2018 2017
Provisions, DKKm
Decom-missioning
obligationsOnerous
contractsOther
provisions Total
Decom-missioning
obligationsOnerous
contractsOther
provisions Total
Provisions at 1 January 4,751 2,711 4,058 11,520 3,649 2,596 2,794 9,039
Exchange rate adjustments (26) - (1) (27) (58) - (8) (66)
Used during the year (117) (373) (636) (1,126) (134) (436) (235) (805)
Provisions reversed during the year (1) (8) (484) (493) - (22) (28) (50)
Provisions made during the year 547 - 2,459 3,006 320 464 1,584 2,368
Change in estimates of other factors 86 - - 86 219 - - 219
Transferred to assets classified as held for sale (12) - - (12) (11) - - (11)
Interest element of provisions 192 88 - 280 766 109 - 875
Additions on acquisition of enterprises 259 - 168 427 - - - -
Disposal on divestment of enterprises (12) - - (12) - - (49) (49)
Disposal on sale of assets (195) - - (195) - - - -
Total provisions 5,472 2,418 5,564 13,454 4,751 2,711 4,058 11,520Falling due as follows:0-1 year - 271 409 680 23 335 322 680
1-5 years 193 967 4,508 5,668 43 1,025 3,080 4,148
After 5 years 5,279 1,180 647 7,106 4,685 1,351 656 6,692
3.2 Provisions and contingent assets and liabilitiesProvisionsDecommissioning obligations mainly comprise estimated expenses relating to decommission-ing and disposal of our offshore and onshore wind farms, restoration of seabeds and the decommissioning of our CHP plants.
As developers of offshore wind farms, we are obliged to decommission offshore wind farms and restore the surroundings at our own ex-pense. When we construct offshore wind farms in cooperation with partners, they are liable for their share of the decommissioning costs. There-fore, we have included only the decommission-ing obligations associated with our ownership interest in the offshore wind farms.
Decommissioning obligations increased by DKK 721 million from 2017 to 2018, primarily due to the construction of new offshore wind farms and the acquisition of Lincoln Clean Energy. The increase in other provisions com-pared to 2017 primarily relates to Hornsea 1.
Onerous contracts comprise:– a contract for booked liquified natural gas
(LNG) terminal capacity in the Netherlands amounting to DKK 1,235 million
(2017: DKK 1,329 million)– a contract for the lease of gas storage
capacity in Germany amounting to DKK 949 million (2017: DKK 1,075 million)
– a contract for the lease of gas storage capacity in Denmark amounting to DKK 229 million (2017: DKK 290 million).
Other provisions comprise primarily:– warranty obligations for offshore wind farms– possible repayments to power consumers in
respect of previous years– obligations in connection with divestments,
primarily in relation to the divestment of our Oil & Gas business and wind farms
– obligations in respect of our own carbon emissions
– other contractual obligations.
Decommissioning obligations by segment, DKKm Offshore Onshore
Bioenergy
Customer Solutions Total
0-5 years 159 - 34 - 193
5-10 years 630 - 92 - 722
10-20 years 1,938 - 443 - 2,381
After 20 years 1,283 217 141 535 2,176
2018 4,010 217 710 535 5,472
2017 3,545 - 733 473 4,751
Ørsted Annual report 2018 Financial statements Consolidated financial statements – 3. Capital employed
110 / 193
Note summary Contents
Contingent liabilitiesThis note primarily concerns our continuing operations – see also note 3.7 'Discontinued operations'.
Liability to pay compensationIn case of any environmental accidents or other types of damage caused by our oil and gas transport, the companies Ørsted Salg & Service A/S and Danish Oil Pipe A/S are liable to pay compensation according to legisla-tion. This also applies if there is no proof of negligence (strict liability). We have taken out insurance to cover any such claims.
LitigationWe are party to actions relating to the Danish competition authorities' claim that the former Elsam A/S and Elsam Kraft A/S (' Elsam'), now part of Ørsted, charged excessive prices in the Danish wholesale power market in some periods.
In 2006 and 2008, respectively, the Danish Competition Appeals Tribunal concluded that Elsam abused its dominant position in the wholesale power market in Western Denmark to some extent in the periods 1 July 2003 to31 December 2004 and 1 January 2005 to30 June 2006 by charging excessive prices. We disputed the rulings and appealed both rulings to the Copenhagen Maritime and Commercial Court, where the parties agreed to stay the case concerning the period 1 July 2003 to31 December 2004 on the outcome of the case concerning the period 1 January 2005 to 30 June 2006. In the latter case, theCopenhagen Maritime and Commercial Court found Elsam guilty of violating the Danish Competition Act in 2016. Following an appeal,
this judgement was, however, overturned by the High Court of Western Denmark in 2018, and after an unsuccessful attempt from the Danish competition authorities to get permission to appeal the judgement, it also became final in 2018.
In connection with the above-mentioned cases, some energy companies, some of their customers and others have raised claims for damages. In 2007, one group chose to commence legal proceedings before the Copenhagen Maritime and Commercial Court with a claim for damages of approx. DKK 4.4 billion with addition of interest, while suspen-sion agreements have been concluded with others, meaning that the limitation period for these alleged claims has been suspended. In response to the claims for damages, we have made a provision of DKK 298 million plus interest. The provision has been calculated on the basis of the Danish Competition Council's determination of consumer losses.
In addition, we are party to a number of court cases and legal disputes. In our assessment, none of these will significantly impact the company's financial position, neither individu-ally nor collectively.
Change of controlSome of our activities are subject to con-sents, permits and licences granted by public authorities. We may be faced with a claim for acceptance of any transfer, possibly with additional terms and conditions, if the Danish State holds less than 50% of the share capital or voting rights in Ørsted A/S. Read more in note 6.1 'Interest-bearing debt'.
Accounting policies
Provisions are recognised when the following criteria are fulfilled:– We have a legal or constructive obligation as a
result of an earlier event.– The settlement of the obligation is expected to result in an outflow of resources.– The obligation can be measured reliably.
For onerous contracts, a provision is made when the expected income to be derived from a contract is lower than the unavoidable cost of meeting our obligations under the contract.
Provisions concerning carbon emissions are recog-nised when our actual emissions exceed our holding of carbon emissions allowances.
Decommissioning obligations are measured at the present value of the future liability in respect of decommissioning as expected at the balance sheet date. The present value of the provision is recognised as part of the cost of prop erty, plant and equipment and depreciated together with the associated asset. The addition of interest on provisions is recognised in the income statement under financial expenses.
Key accounting estimates
Timing, probabilities, amounts, etc. which have a bearing on our provisions estimates are updated quarterly based on our expectations.
Assumptions for decommissioning obligationsEstimates of decommissioning obligations are based on our expectations of, for example:– timing and scope– future cost level– adopted laws and regulations on remediation.
The timing of our decommissioning obligations depends on the expected useful lives of the assets.
We expect that our CHP plants in Denmark must be removed within 12 years of decommissioning at the latest.
In measuring provisions, the costs required to meet the obligations are discounted. In determining decommissioning obligations at 31 December 2018, a discount rate of 3.5% is applied. The rate has been estimated on the basis of expectations concerning the future, long-term interest rate level, based on historical interest rate levels.
Timing as well as decommissioning requirements are assessed based on current legislation and standards in this area. Future cost levels are based, among other things, on expect ations with regard to:– general price developments or developments in
market prices– demand– development of existing technologies.
Estimates of onerous contractsWe have entered into a number of contracts with fixed terms. Depending on market developments and uncertainty about obligations incurred under the contracts made, these contracts may become onerous. Our estimates concerning these complex contracts and their future effects are subject to significant uncertainties.
Estimates of litigation outcomesWhen exercising a judgement about a potential liability in connection with litigation, we assess:– the nature of the litigation, claim or statement– the development of the case– the judgements and recommendations of legal
or other advisers– experience from similar cases– our decision on how we are going to react to the
litigation, claim or statement.
Ørsted Annual report 2018 Financial statements Consolidated financial statements – 3. Capital employed
111 / 193
Note summary Contents
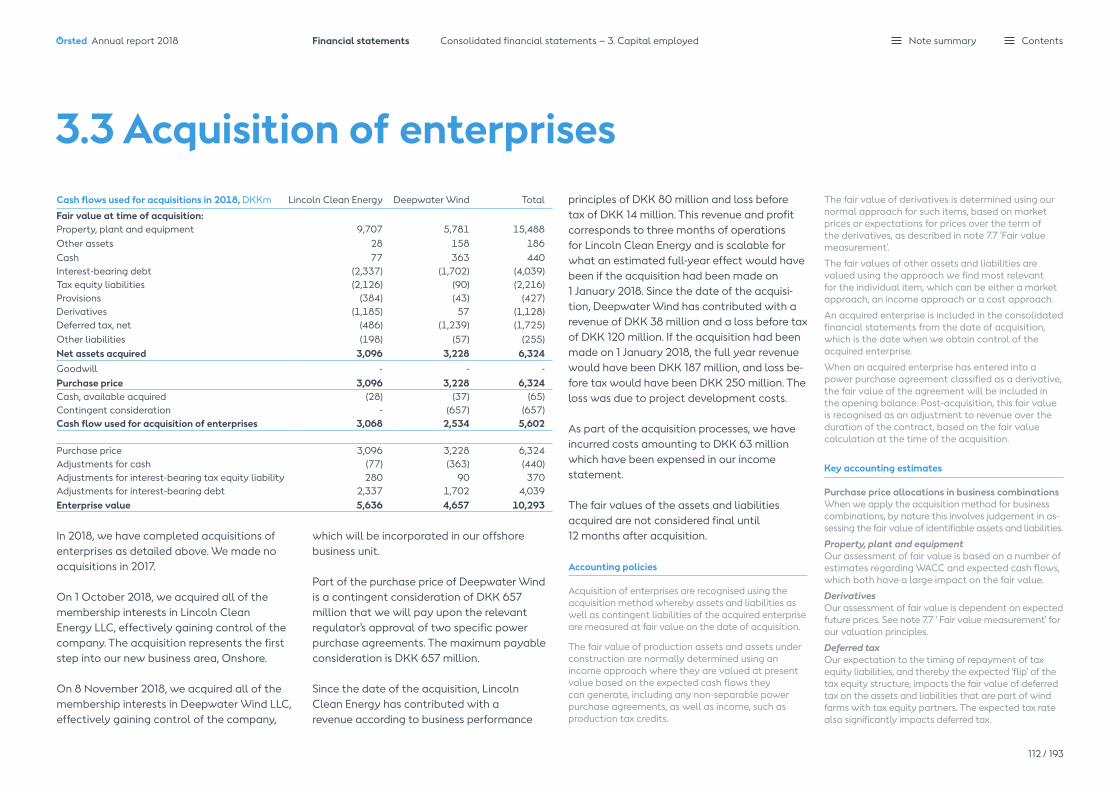
Cash flows used for acquisitions in 2018, DKKm Lincoln Clean Energy Deepwater Wind Total
Fair value at time of acquisition:Property, plant and equipment 9,707 5,781 15,488Other assets 28 158 186Cash 77 363 440Interest-bearing debt (2,337) (1,702) (4,039)Tax equity liabilities (2,126) (90) (2,216)Provisions (384) (43) (427)Derivatives (1,185) 57 (1,128)Deferred tax, net (486) (1,239) (1,725)Other liabilities (198) (57) (255)Net assets acquired 3,096 3,228 6,324Goodwill - - -Purchase price 3,096 3,228 6,324Cash, available acquired (28) (37) (65)Contingent consideration - (657) (657)Cash flow used for acquisition of enterprises 3,068 2,534 5,602
Purchase price 3,096 3,228 6,324Adjustments for cash (77) (363) (440)Adjustments for interest-bearing tax equity liability 280 90 370Adjustments for interest-bearing debt 2,337 1,702 4,039Enterprise value 5,636 4,657 10,293
In 2018, we have completed acquisitions of enterprises as detailed above. We made no acquisitions in 2017.
On 1 October 2018, we acquired all of the membership interests in Lincoln Clean Energy LLC, effectively gaining control of the company. The acquisition represents the first step into our new business area, Onshore.
On 8 November 2018, we acquired all of the membership interests in Deepwater Wind LLC, effectively gaining control of the company,
3.3 Acquisition of enterprises
which will be incorporated in our offshore business unit.
Part of the purchase price of Deepwater Wind is a contingent consideration of DKK 657 million that we will pay upon the relevant regulator's approval of two specific power purchase agreements. The maximum payable consideration is DKK 657 million.
Since the date of the acquisition, Lincoln Clean Energy has contributed with a revenue according to business performance
Accounting policies
Acquisition of enterprises are recognised using the acquisition method whereby assets and liabilities as well as contingent liabilities of the acquired enterprise are measured at fair value on the date of acquisition.
The fair value of production assets and assets under construction are normally determined using an income approach where they are valued at present value based on the expected cash flows they can generate, including any non-separable power purchase agreements, as well as income, such as production tax credits.
The fair value of derivatives is determined using our normal approach for such items, based on market prices or expectations for prices over the term of the derivatives, as described in note 7.7 'Fair value measurement'.
The fair values of other assets and liabilities are valued using the approach we find most relevant for the individual item, which can be either a market approach, an income approach or a cost approach.
An acquired enterprise is included in the consolidated financial statements from the date of acquisition, which is the date when we obtain control of the acquired enterprise.
When an acquired enterprise has entered into a power purchase agreement classified as a derivative, the fair value of the agreement will be included in the opening balance. Post-acquisition, this fair value is recognised as an adjustment to revenue over the duration of the contract, based on the fair value calculation at the time of the acquisition.
Key accounting estimates
Purchase price allocations in business combinations When we apply the acquisition method for business combinations, by nature this involves judgement in as-sessing the fair value of identifiable assets and liabilities.
Property, plant and equipmentOur assessment of fair value is based on a number of estimates regarding WACC and expected cash flows, which both have a large impact on the fair value.
DerivativesOur assessment of fair value is dependent on expected future prices. See note 7.7 ' Fair value measurement' for our valuation principles.
Deferred taxOur expectation to the timing of repayment of tax equity liabilities, and thereby the expected 'flip' of the tax equity structure, impacts the fair value of deferred tax on the assets and liabilities that are part of wind farms with tax equity partners. The expected tax rate also significantly impacts deferred tax.
principles of DKK 80 million and loss before tax of DKK 14 million. This revenue and profit corresponds to three months of operations for Lincoln Clean Energy and is scalable for what an estimated full-year effect would have been if the acquisition had been made on 1 January 2018. Since the date of the acquisi-tion, Deepwater Wind has contributed with a revenue of DKK 38 million and a loss before tax of DKK 120 million. If the acquisition had been made on 1 January 2018, the full year revenue would have been DKK 187 million, and loss be-fore tax would have been DKK 250 million. The loss was due to project development costs.
As part of the acquisition processes, we have incurred costs amounting to DKK 63 million which have been expensed in our income statement.
The fair values of the assets and liabilities acquired are not considered final until12 months after acquisition.
Ørsted Annual report 2018 Financial statements Consolidated financial statements – 3. Capital employed
112 / 193
Note summary Contents

Selling price, DKKm 2018 2017
Payment 497 605Working capital adjustment (68) (1)Selling price on divestment of enterprises 429 604Transaction costs (66) (20)Of which selling price receivable - 4Cash selling price on divestment of enterprises 363 588
3.4 Divestment of enterprises
Gain (loss) on divestment of enterprisesDKKm 2018 2017
Selling price on divestment of enterprises 429 604Net assets sold (240) (725)Provisions as a result of the transaction 4 2Transaction costs (66) (20)Gain (loss) on divestment of enterprises 127 (139)
Gain on divestment of enterprises amounted to DKK 127 million compared to DKK -139 million in 2017. In 2018, gain on divestment of enterprises related to the sale of our 50% ownership interest in Enecogen (Bioenergy). Transferred cash and cash equivalents totalled DKK 6 million. In 2017, gain on divestment of enterprises related to the sale of A2SEA. Transferred cash and cash equivalents totalled DKK 278 million.
Accounting policies
We recognise income from divested enterprises in the income statement up until the date of divestment.
The date of divestment is the date on which we relinquish control of the divested enterprise.
Gains or losses on the divestment or discontinuation of subsidiaries and associates are determined as the difference between the selling price and the carrying amount of the net assets divested.
Moreover, we deduct the fees of advisers, etc., in connection with the divestment, or discontinuation of the enterprise.
The divestment of our Oil & Gas business in 2017 is not included in the figures as it is presented as discon-tinued activities. See note 3.7 'Discontinued operations'.
Gross and net investments, DKKm 2018 2017
Cash flows from investing activities (1,026) (10,054)Dividends received and capital reduction, reversed (25) (13)Purchase and sale of securities, reversed 595 9,197Loans to associates and joint ventures, reversed 12 47Sale of non-current assets, reversed (20,002) (16,921)Interest-bearing debt in acquired enterprises (4,409) -Restricted cash in acquired enterprises 374 -Total gross investments (24,481) (17,744)Transactions with non-controlling interests in connection with divestments (52) 61Sale of non-current assets 20,002 16,921Total cash flows from divestments 19,950 16,982Total net investments (4,531) (762)
Gross investments amounted to DKK 24,481 million in 2018, which was 38% higher than in 2017.
Gross investments in Offshore amounted to DKK 15,081 million and was related to the con-struction of Hornsea 1 and Walney Extension in the UK, Borkum Riffgrund 2 in Germany, Borssele 1 & 2 in the Netherlands, early invest-ments in the US to qualify for future tax credits as well as the acquisition of Deepwater Wind in the US. In 2017, gross investments primarily related to the construction of Walney Exten-sion, Borkum Riffgrund 2 and Race Bank.
3.5 Gross and net investments
In Onshore, gross investments amounted to DKK 6,779 million and related to the acquisi-tion of Lincoln Clean Energy and construction of the Tahoka and Lockett onshore wind farms in the US.
Divestments amounted to DKK 19,950 million in 2018 and related to the 50% farm-down of Hornsea 1, receipt of deferred proceeds from the farm-down of 50% of Walney Extension in 2017 and proceeds related to the divestment of our 50% ownership share in Enecogen.
In 2017, divestments amounted to DKK 16,982 million and were primarily related to the 50% farm-downs of the offshore wind farms Walney Extension and Borkum Riffgrund 2.
Ørsted Annual report 2018 Financial statements Consolidated financial statements – 3. Capital employed
113 / 193
Note summary Contents
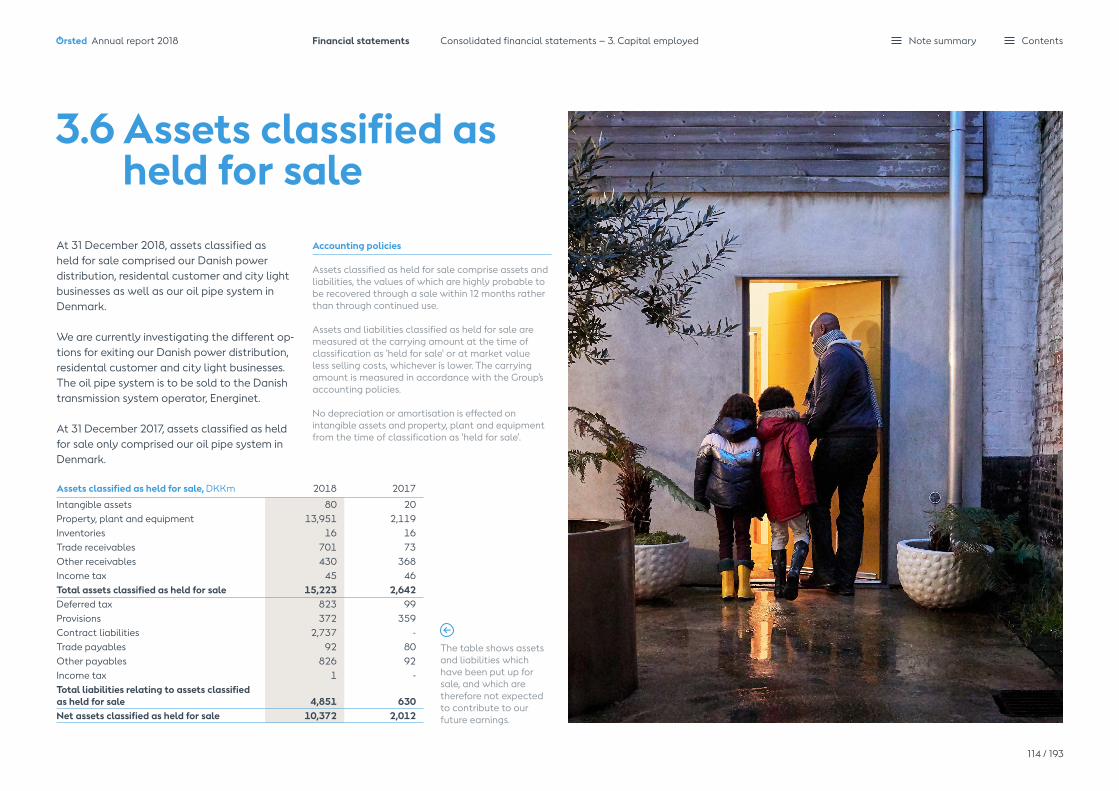
3.6 Assets classified as held for sale
Assets classified as held for sale, DKKm 2018 2017
Intangible assets 80 20Property, plant and equipment 13,951 2,119Inventories 16 16Trade receivables 701 73Other receivables 430 368Income tax 45 46Total assets classified as held for sale 15,223 2,642Deferred tax 823 99Provisions 372 359Contract liabilities 2,737 -Trade payables 92 80Other payables 826 92Income tax 1 -Total liabilities relating to assets classified as held for sale 4,851 630Net assets classified as held for sale 10,372 2,012
At 31 December 2018, assets classified as held for sale comprised our Danish power distribution, residental customer and city light businesses as well as our oil pipe system in Denmark.
We are currently investigating the different op-tions for exiting our Danish power distribution, residental customer and city light businesses. The oil pipe system is to be sold to the Danish transmission system operator, Energinet.
At 31 December 2017, assets classified as held for sale only comprised our oil pipe system in Denmark.
The table shows assets and liabilities which have been put up for sale, and which are therefore not expected to contribute to our future earnings.
Accounting policies
Assets classified as held for sale comprise assets and liabilities, the values of which are highly probable to be recovered through a sale within 12 months rather than through continued use.
Assets and liabilities classified as held for sale are measured at the carrying amount at the time of classification as 'held for sale' or at market value less selling costs, whichever is lower. The carrying amount is measured in accordance with the Group's accounting policies.
No depreciation or amortisation is effected on intangible assets and prop er ty, plant and equipment from the time of classification as 'held for sale'.
Ørsted Annual report 2018 Financial statements Consolidated financial statements – 3. Capital employed
114 / 193
Note summary Contents
Cash flows, DKKm 2018 2017
Cash flows from operating activities (53) 5,545
Proceeds from the divestment of Oil & Gas - 3,677
Cash flows from other investing activities 262 (197)
Cash flows from financing activities - -
Total cash flows 209 9,025
3.7 Discontinued operations
Capital employed, DKKm 2018 2017
Equity investments and non-current receivables 746 691
Derivatives, net (106) -
Other provisions (820) (935)
Tax, net 29 (3)
Other receivables and other payables, net 8 11
Total net assets (143) (236)
The remaining net assets under dis-continued operations consist of the selling price receivable and provisions as a result of the divestment of Oil & Gas.
Discontinued operations comprise our Oil & Gas business, which was sold to INEOS on 29 September 2017.
Financial results Profit (loss) in 2018 amounted to DKK 10 million (2017: DKK 6,920 million, including gain (loss) on disposal of discontinued operations).
Total cash flows in 2018 amounted toDKK 209 million (2017: DKK 9,025 million), of which DKK -53 million was from operatingactivities and mainly concerned the pay-ment of fees for existing Oil & Gas insurance activities. The insurance fee was provided for at the time of the divestment in 2017. Cash flows from investing activities amounted to DKK 262 million and concerned primarily the receipt of a selling price receivable of USD 50 million. The receivable was interest-bearing and therefore had no impact on our interest -bearing net debt.
Capital employedOur capital employed in discontinued opera-tions at 31 December 2018 mainly consisted of provisions relating to the sale (tax indemnifica-tions and payments related to the Fredericia stabilisation plant) as well as a conditional payment (receivable selling price) which does not carry interest.
In addition, we have interest-bearing receiv-ables of USD 100 million (not part of capital employed), which we expect to receive in the period 2019-2020.
Divestment of Oil & Gas in 2017The selling price from the transaction amounted to DKK 5,456 million, of which DKK 3,652 million was received and recog-nised in our free cash flow from discontinued operations in Q3 2017.
All in all, the transaction reduced the Group's net debt by DKK 4,588 million, as USD 150 million of the outstanding selling price was interest-bearing.
Secondary liabilityAs part of the divestment of Oil & Gas, we have assumed a secondary liability regarding the decommissioning of offshore installations. We consider the payment of the liability to be very unlikely. The matter is described in further detail in the interim financial report for the first nine months of 2017.
Employee costs, DKKm 2018 2017
Wages, salaries and remuneration - 365
Pensions - 27
Other social security costs - 11
Other employee costs - 5
Employee costs before transfers to assets - 408
Transfers to assets - (126)
Total employee costs - 282
Ørsted Annual report 2018 Financial statements Consolidated financial statements – 3. Capital employed
115 / 193
Note summary Contents
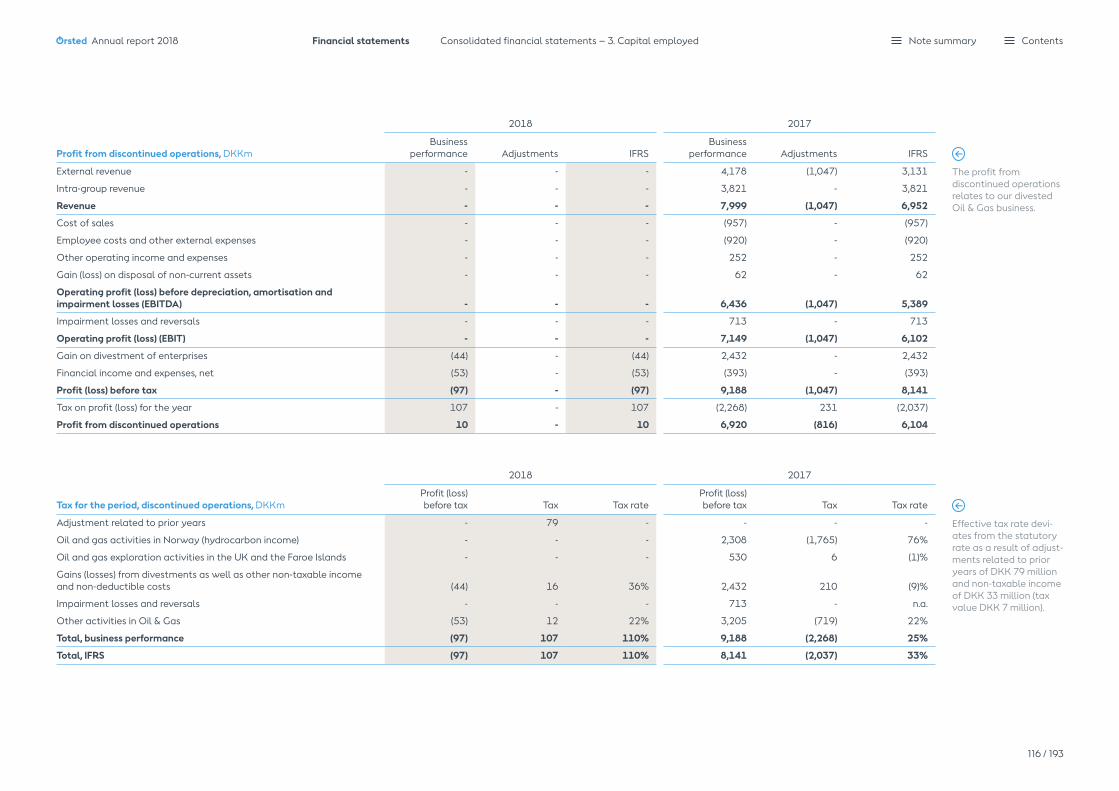
2018 2017
Profit from discontinued operations, DKKmBusiness
performance Adjustments
IFRSBusiness
performance Adjustments
IFRS
External revenue - - - 4,178 (1,047) 3,131
Intra-group revenue - - - 3,821 - 3,821
Revenue - - - 7,999 (1,047) 6,952
Cost of sales - - - (957) - (957)
Employee costs and other external expenses - - - (920) - (920)
Other operating income and expenses - - - 252 - 252
Gain (loss) on disposal of non-current assets - - - 62 - 62
Operating profit (loss) before depreciation, amortisation and impairment losses (EBITDA) - - - 6,436 (1,047) 5,389
Impairment losses and reversals - - - 713 - 713
Operating profit (loss) (EBIT) - - - 7,149 (1,047) 6,102
Gain on divestment of enterprises (44) - (44) 2,432 - 2,432
Financial income and expenses, net (53) - (53) (393) - (393)
Profit (loss) before tax (97) - (97) 9,188 (1,047) 8,141
Tax on profit (loss) for the year 107 - 107 (2,268) 231 (2,037)
Profit from discontinued operations 10 - 10 6,920 (816) 6,104
Tax for the period, discontinued operations, DKKm
2018 2017
Profit (loss) before tax Tax Tax rate
Profit (loss) before tax Tax Tax rate
Adjustment related to prior years - 79 - - - -
Oil and gas activities in Norway (hydrocarbon income) - - - 2,308 (1,765) 76%
Oil and gas exploration activities in the UK and the Faroe Islands - - - 530 6 (1)%
Gains (losses) from divestments as well as other non-taxable income and non-deductible costs (44) 16 36% 2,432 210 (9)%
Impairment losses and reversals - - - 713 - n.a.
Other activities in Oil & Gas (53) 12 22% 3,205 (719) 22%
Total, business performance (97) 107 110% 9,188 (2,268) 25%
Total, IFRS (97) 107 110% 8,141 (2,037) 33%
The profit from discontinued operations relates to our divested Oil & Gas business.
Effective tax rate devi-ates from the statutory rate as a result of adjust-ments related to prior years of DKK 79 million and non-taxable income of DKK 33 million (tax value DKK 7 million).
Ørsted Annual report 2018 Financial statements Consolidated financial statements – 3. Capital employed
116 / 193
Note summary Contents

Subsidiaries with significant non-controlling interests
Non-controlling interest
Registered office
Gunfleet Sands Holding Ltd. 49.9% London, UK
Walney (UK) Offshore Windfarms Ltd. 49.9% London, UK
Transactions with non-controlling interests, DKKm 2018 2017
Transactions with non-controlling interests
Dividends paid to non-controlling interests (400) (376)
Divestment of equity investments to non-controlling interests 13 (108)
Other capital transactions with non-controlling interests (4) 53
Total transactions, see statement of cash flows (391) (431)
Divestment of equity investments to non-controlling interests
Selling price - 8
Of which changes in receivables relating to the acquisition and divestment of non-controlling interests 13 (116)
Cash selling price, total 13 (108)
Gunfleet Sands Holding Ltd. group
Walney (UK) Offshore Windfarms Ltd.
DKKm 2018 2017 2018 2017
Statement of comprehensive income
Revenue 431 419 1,079 1,087
EBITDA 237 263 554 545
Profit (loss) for the year 26 48 66 46
Total comprehensive income 5 (21) 12 (90)
Profit (loss) for the year attributable to non-controlling interests 13 24 33 23
Balance sheet
Non-current assets 2,153 2,371 5,656 6,159
Current assets 139 164 213 225
Non-current liabilities 311 318 795 776
Current liabilities 88 50 223 217
Carrying amount of non-controlling interests 944 1,081 2,433 2,697
Statement of cash flows
Cash flows from operating activities 264 246 563 562
Cash flows from investing activities 0 0 (16) (1)
Cash flows from financing activities (283) (227) (566) (577)
– of which dividends paid to non-controlling interests (144) (113) (256) (263)
3.8 Non-controlling interests
Accounting policies
Transactions with non-controlling interests are accounted for as transactions with the shareholder base.
Gains and losses on the divestment of equity invest-ments to non-controlling interests are recognised in equity when the divestment does not result in a loss of control.
Net assets acquired are not revalued on the acquisi-tion of non-controlling interests. Any difference between the carrying amount and the acquisition or selling price is recognised in equity.
In the table, we provide financial information for subsidiaries with signifi-cant non-controlling interests. The amounts stated are the con-solidated accounting figures of the individual enterprises/groups, determined according to our accounting policies. Amounts are stated before intra-group eliminations.
Ørsted Annual report 2018 Financial statements Consolidated financial statements – 3. Capital employed
117 / 193
Note summary Contents
4.Working capital
Working capital 119Inventories 120 Contract assets and liabilities 121Trade receivables 122 Other receivables 122 Tax equity liabilities 123Other payables 124Changes in net working capital 124
Ørsted Annual report 2018 Note summary Contents

7.4bn Our net working capital, excluding trade payables relating to capital expenditure amounted to DKK 7,424 million in 2018 against DKK 4,945 million in 2017.
2.5bn We had an additional amount of DKK 2,479 million tied up in working capital relative to 2017, of which DKK 2,128 million pertained to work in progress and related trade payables in Offshore.
Working capital, DKKm 2018 2017
Inventories 13,943 3,853
Contract assets, net (3,115) 9,500
Trade receivables 10,741 9,170
Other receivables 2,968 2,082
Trade payables, excluding trade payables relating to capital expenditure (10,099) (8,460)
Tax equity liabilities (3,719) -
Other payables (3,295) (11,200)
Net working capital, excluding trade payables relating to capital expenditure at 31 December 7,424 4,945
Of which work in progress and related trade payables 9,654 7,526
Of which tax equity partner liabilities and other working capital (2,230) (2,581)
Our key working capital items consist of inven-tories, net contract assets, trade receivables and payables, tax equity liabilities and other payables, including prepayments from heat customers. Connection charges in our power distribution business has been classified as assets held for sale at 31 December 2018.
Working capital items vary with the seasonal variations in our generation and sales activities during the year. Our net contract assets relate primarily to construction of offshore wind farms for partners and vary within and across years, depending on the portfolio of offshore construction assets. They also depend on when we reach certain milestones and trigger payments from our partners.
4. Working capitalWorking capital, DKKm 2018
Offshore Onshore Bioenergy Customer Solutions Other
13,125
369
-4,144
1,918
0
The composition of our net working capital has changed relative to last year. In 2017, we recognised offshore transmission assets as construction agree-ments. Following the implementation of IFRS 15, we recognise offshore transmission assets as inventory. Furthermore, the introduction of tax equity elements in our Onshore business has impacted our working capital. Work in progress consists of inventories related to transmission assets, construction agree-ments and construction management agreements in connection with the construction of transmission assets and offshore wind farms for partners as well as related trade payables.
Offshore primarily has funds tied up in inventories, construction agreements and trade receivables. The most significant working capital item in Onshore consists of liabilities regarding tax equity contribu-tions from our partners. Bioenergy has a negative working capital, mainly as a result of prepayments from heat customers. Customer Solutions has funds tied up mainly in inventories, receivables and clearing counterparties in connection with exchange trading.
Contract assets, net also include prepayment from heat customers in connection with our bioconversions and therefore vary depending on the progress of these projects. Construction of offshore transmission assets in the UK, which are recognised as inventories, will continue to tie up cash until they are divested. Tax equity liabilities also vary within and across years. This is due to the fact that we receive cash contributions from tax equity partners at the point in time when a US onshore wind farm enters into operation.
Trade payables relating to capital investments are not included in this section as they are presented as part of the cash flows from investing activities.
-3,844
Ørsted Annual report 2018 Financial statements Consolidated financial statements – 4. Working capital
119 / 193
Note summary Contents

Inventories, DKKm 2018 2017
Offshore transmission assets 9,885 -
Biomass 253 258
Gas 1,620 1,526
Coal 261 396
Oil 119 124
Green certificates 1,555 1,441
Carbon emissions allowances 172 52
Other inventories 78 56
Total inventories 13,943 3,853
Inventories recognised as an expense in 'Cost of sales' during the year 25,262 13,180
Accounting policies
Offshore transmission assets are measured at cost. The cost comprises costs of materials used in construction, site labour costs, costs of renting equipment as well as indirect production costs, such as employee costs. The cost of gas is determined as a weighted average of the previous month's purchase prices, including transportation costs.
Purchased carbon emissions allowances aremeasured at market value.
4.1 Inventories
Green certificates, which we earn by generating power using renewable energy sources, are recog-nised in inventories in step with our generation. We measure green certificates (earned and bought) at cost using the first in, first out (FIFO) principle.
Other inventories are measured at cost determined on a first in, first out basis or a net realisable value, where this is lower.
Inventories are written down to the lower of net realisable value and cost price.
The net realisable value is the sum (discounted) which the inventories are expected to generate through a normal sale.
Following the implementation of IFRS 15, we recognise offshore transmission assets as inventory. In 2017, we recognised offshore transmission assets as construction contracts.
We use biomass, coal, gas and, to a limited extent, oil as fuel at our CHP plants. In 2019, the use of gas will
be very limited as a result of the biomass conversion of the Skærbæk Power Station in Denmark and the divestment of the Enecogen Power Station in the Netherlands. Green certificates are primarily renewable obligation certificates (ROCs) which are issued to power generators sourcing from renewable energy sources in the UK.
Ørsted Annual report 2018 Financial statements Consolidated financial statements – 4. Working capital
120 / 193
Note summary Contents

Accounting policies
We recognise a contract asset when we perform a service or transfer goods in advance of receiving consideration, and the consideration is conditional.
When the consideration is unconditional, and the goods or services are delivered, we recognise a receivable. A right to consideration is unconditional if only the passage of time is required before the payment is due.
Contract assets are measured at the transaction price of the good or services which we have per-formed less invoicing on account.
We recognise a contract liability when the invoicing on account and expected losses exceed the transac-tion price of the goods or services transferred to our customer.
4.2 Contract assets and liabilitiesContract asset and contract liabilities are primarily related to: – the construction of offshore wind farms with
partners, with each party usually owning 50% of the offshore wind farm
– prepayments from heat customers.
At the end of 2018, contracts assets and liabili-ties included our construction of our partners' share of the Hornsea 1, Walney Extension and Borkum Riffgrund 2 offshore wind farms.
Non-current contract liabilities amounted to DKK 3,642 million compared to DKK 5,327 million as of 1 January 2018. The decrease was primarily related to a reclas-sification of grid connection charges and prepayments in our Danish power distribution, residential customer and city light businesses to assets held for sale at the end of 2018. Reference is made to note 3.6 'Assets classified as held for sale'.
Contract balances, DKKm 2018 1 January 2018
Contract assets
Current contract assets 1,451 1,693
Total contract assets 1,451 1,693
Contract liabilities
Non-current contract liabilities 3,642 5,327
Current contract liabilities 924 1,455
Total contract liabilities 4,566 6,782
Revenue from contracts with customers DKKm 2018
Revenue recognised included in contract liabilities at the beginning of the year 228
Revenue recognised from perfomance obligations satisfied in previous years 95
As we have implement-ed IFRS 15 in accordance with the modified retrospective method, we have not restated comparative figures. Read more about the adoption of IFRS 15 and the effect on the changed presentation in note 1.4 'Implementation of new or changed accounting standards and interpretations'.
The tabel shows how much of our revenue recognised in 2018 that relates to contract liabilities carried forward (as prepayments and deferred revenue), and how much that relates to performance obligatons satisfied in a prior year (e.g. renegotiations or constraints on variable considerations that are not recognised until they are highly probable).
Ørsted Annual report 2018 Financial statements Consolidated financial statements – 4. Working capital
121 / 193
Note summary Contents

4.3 Trade receivables
4.4 Other receivables
Trade receivables, DKKm 2018 2017
Trade receivables, not due 10,186 8,644
Trade receivables, 1-30 days overdue 293 303
Trade receivables, more than 30 days overdue 326 305
Trade receivables, write-down (64) (82)
Total trade receivables 10,741 9,170
Accounting policies
We keep our receivables until maturity, and they are therefore measured at amortised cost.
Write-down is carried out from initial recognition of our receivables. The write-down is calculated as the difference between the carrying amount of the receivable and the net present value of expected future cash flows from the receivable. The discount rate used is the effective interest rate for the individual receivable or the individual portfolio. We apply the simplified approach to the write-down of trade receivables, which permits calculating the write-down as the full loss during the entire term of the receivable.
Trade receivables primarily relates to customers in Customer Solutions. The general terms of payment vary according to customer type and product.
We continuously perform credit ratings of our customers, as described in note 7.5 'Credit risks'. For customers with a general credit risk, a write-down of 0-1% is carried out on initial recognition. In 2018, write-downs of receivables amounted to DKK 35 million (2017: DKK 6 million). Losses for the year totalled DKK 36 million (2017: DKK 25 million).
Other receivables, DKKm 2018 2017
Receivables from the divestment of assets and investments 3,218 2,680
Receivables from the divestment of equity investments to non-controlling interests 634 648
VAT and other indirect taxes receivable 427 572
Collateral provided 710 775
Prepayments 330 304
Other account receivables 1,741 495
Other receivables 7,060 5,474
Of which working capital 2,968 2,082
Of which other capital employed 2,628 1,770
Of which interest-bearing net debt 1,464 1,622
In 2018, receivables from the divestment of assets and investments primarily relate to receivables in connection with the divestment of 50% of our ownership interests in the Hornsea 1 wind farm and receivables related to the divestment of our Oil & Gas business. In 2017, receivables from divestment of assets and investments related to the divestment of our Oil & Gas business as well as the divest-ment of 50% of our ownership interests in the Walney Extension wind farm.
Receivables from the divestment of equity investments to non-controlling interests pri-marily relate to the divestment in 2011 of our ownership interests in Gunfleet Sands.
The collateral provided by the Group is receivables from banks in connection with trading on energy exchanges.
The short-term portion of other receivables amounted to DKK 4,390 million (2017: DKK 3,519 million).
Other accounts receivables consist primarily of receivables from adjustments in connection with prior year divestments, including the Oil & Gas business, where it is assessed that there is no material credit risk.
The table shows our other receivables broken down into working capital, interest-bearing net debt and other capital employed.
Ørsted Annual report 2018 Financial statements Consolidated financial statements – 4. Working capital
122 / 193
Note summary Contents

4.5 Tax equity liabilitiesTax equity liabilities, DKKm 2018 2017
Balance at 1 January - -
Contribution received from tax equity partner 1,995 -
Tax equity balances from business acquisitions 2,216 -
Tax attributes and PTCs recognised in other operating income (79) -
Cash paid to tax equity partner (3) -
Tax equity partners' contractual return 44 -
Balance at 31 December 4,173 -
Of which working capital 3,719 -
Of which interest-bearing debt 454 -
2018 is the first year of recognising US tax liabilities originating from our acquisitions and entry into the US market.
This recognition reflects the intention and high likelihood that we will purchase the right, and that this is part of the financial cost of the arrangement.
If we choose not to buy the partner's right to post-flip returns, the tax equity partner will be entitled to part of the company returns in the post-flip period, and they will share in the risks and rewards in the company as a shareholder. This interest will be considered a non-controlling interest.
Key accounting judgements
Assessment of recognition of tax equity partnerOn recognition of a tax equity partner, we assess the appropriate recognition of their contribution as well as the method of recognition for the elements used to repay the partner, such as PTCs and tax attributes.
In assessing recognition of tax equity partners, we look at: – the expected flows of PTCs, tax attributes and
cash payments expected to the partner– the rights and obligations of both us and the tax
equity partner.
The deferral of the income related to tax attributes and the recognition of the contribution as working capital or interest-bearing debt, are affected by our expectation to the size, method and timing of repayments.
We have entered into several tax equity partner agreements in the US. These agree-ments are characterised by a tax equity partner who contributes an upfront payment of a part of the initial project investment. The partner does not have an operational role in the project. The partner receives a contrac-tually agreed return on the contribution. The initial contribution and the return is 'repaid' by receiving almost all of the production tax credits (PTCs) the project generates as well as the majority of other tax attributes (accelerat-ed tax depreciation and other taxable results) from the project in the first part of the pro-ject's lifetime as well as some cash payments. Once the contribution has been repaid, the agreement 'flips', and the partner is typically
entitled to a minor part of the cash distribu-tions from the project unless we purchase this right from them, which is highly likely.
We have three onshore wind farms with tax equity partners. The first two are Amazon (253MW) and Willow Springs (250MW), which were operational at the time of the acquisition of Lincoln Clean Energy. The third is Tahoka (300MW) where we signed a tax equity agreement in Q4 2018, and which was commissioned in December 2018. In addition we have one offshore wind farm with a tax equity partner. This is Block Island (30MW), which was operational at the time of the acquisition of Deepwater Wind.
Accounting policies
When a tax equity partner contributes to a US company, we evaluate our right to variable returns as well as our ability to exercise influence, including our ability to influence financial and operational decisions influencing these returns, to determine if the company should be fully consolidated. Due to the operational and financial nature of the projects, and the influence normally given to tax equity part-ners in such agreements, it is normally possible for us to have the influence to fully consolidate companies that have tax equity partners.
The terms of the tax equity partner's contribution are evaluated to determine the accounting treatment. As the initial contribution of the tax equity partner is repaid, including an agreed return, and as they do not share in the risks of the project in the same way as a shareholder, the contribution has the charac-teristics of a liability, is accounted for as such and is measured at amortised cost. The liability is based on the expected method of repayment and is divided into: – a net working-capital element to be repaid
through PTCs and other tax attributes– an interest-bearing debt element expected to be
repaid through cash distributions.
The partner's agreed return is expensed as a financial expense and is recognised as an increase of the tax equity liability. PTCs and other tax attributes transferred to the tax equity partner are recognised as other operating income. Tax attributes allocated to the tax equity partner are deferred and recog-nised on a straight-line basis over the estimated contractual length of the partner structure, while PTCs are recognised in the periods earned, similary to recognition of our own PTCs.
In addition to the above, we recognise a liability for the expected purchase price for the partners post-flip rights to return. This is recgonised at fair value and adjustments are expensed as a financial item.
Ørsted Annual report 2018 Financial statements Consolidated financial statements – 4. Working capital
123 / 193
Note summary Contents

4.6 Other payables
In 2018, other payables were reduced by DKK 6,880 million. Prepayments from heat customers and the majority of deferred income have been classified as contract liabil-ities from 2018 due to the implementation of IFRS 15. Grid connection charges in the power distribution business have been classified as
Other payables, DKKm 2018 2017
Prepaid VAT on exports - 1,500
Carbon rights 62 42
VAT and other indirect taxes payable 780 1,312
Salary-related items payable 809 762
Accrued interest 687 882
Virtual gas storage 107 83
Prepayments from heat customers - 3,286
Grid connection charges - 1,893
Other deferred income 84 1,114
Collateral received 34 119
Purchase price, acquisition of enterprises 653 -
Other 1,986 1,089
Total other payables 5,202 12,082
Of which working capital 3,295 11,200
Of which other capital employed 1,337 882
Of which interest-bearing net debt 570 -
'Assets classified as held for sale', due to the expected exit during 2019. In addition, the export VAT was repaid in January 2018.
In 2018, the short-term portion of other payables amounted to DKK 4,793 million (2017: DKK 6,368 million).
The table shows our other payables broken down into working capital, interest-bearing net debt and other capital employed.
4.7 Changes in net working capital
The change in funds tied up in work in progress and related trade payables was DKK 2,326 million in 2018 due to high activity related to the construction of offshore wind farms for partners (Walney Extension and BorkumRiffgrund 2) as well as offshore transmission assets in the UK (Hornsea 1 and Hornsea 2), partly offset by receipt of milestone payments from partners and the divestment of the Burbo Bank Extension transmission asset.
In 2017, the change in funds tied up in work in progress and related trade payables was
Change in net working capital, DKKm 2018 2017
Change in inventories 243 (423)
Change in contract assets and liabilities (1,478) (3,318)
Change in trade receivables (2,261) (3,705)
Change in other receivables (31) (563)
Change in trade payables 1,601 1,188
Change in tax equity liabilities 1,835 -
Change in other payables (827) (1,083)
Total change in net working capital (918) (7,904)
Of which changes relating to work in progress (2,326) (3,674)
Of which changes relating to tax equity liabilities and other working capital 1,408 (4,230)
DKK 3,674 million due to the construction of offshore wind farms for partners (mainly Race Bank) as well as offshore transmission assets in the UK (mainly Hornsea 1), partly offset by receipt of milestone payments from partners.
The change in funds tied up in other working capital was a cash inflow of DKK 1,408 million in 2018 and primarily concerned the tax equity contribution from the partner on Tahoka.
Work in progress consists of elements in contract assets and liabilities, construc-tion manage ment agreements related to construction of offshore wind farms, construction of offshore transmission assets (inventory) and related trade payables.
Ørsted Annual report 2018 Financial statements Consolidated financial statements – 4. Working capital
124 / 193
Note summary Contents

5.Tax
Tax 126Tax policy and tax regimes 127Tax on profit (loss) for the year 128Taxes paid 130Deferred tax 131Total tax contribution 133
Ørsted Annual report 2018 Note summary Contents

Tax on profit (loss) for the year The effective tax rate was 17% for the continuing operations. The effective tax rate was primarily affected by the tax-exempt gain on the farm-down of 50% of Hornsea 1.
Corporate income taxes paid We have paid DKK 3,367 million in taxes in 2018, of which DKK 711 million related to residual tax for 2017. We expect to have a residual receivable tax of DKK 245 million regarding 2018 as a higher portion of income related to non-taxable income in 2018 than we expected at the time we paid taxes on account.
5. Tax
3.4bnCorporate income tax paid by the Group in 2018 totalled DKK 3,367 million against DKK 2,660 million in 2017.
3.2bnCurrent corporate income tax in 2018 totalled DKK 3,161 million against DKK 2,698 million in 2017.
Corporate income tax paid by segment, 2018DKKm
Offshore Onshore Bioenergy Customer Solutions Ørsted A/S and other activities
2,994
94
-168
447
0
Development in current and deferred tax asset and liabilities (tax, net), 2018 DKKm
Tax, net liability Tax on profit (loss) for the year Tax on other comprehensive income and hybrid capital
Corporate taxes paid Addition US investment Other effects
464
2,629200
-3,367-4114,018
2017 2018
0
The net tax is highly impacted by the US investments.
Business performance
2018, DKKm Profit (loss) before tax Tax Tax in %
Gain (loss) on divestments 14,886 (1,155) 8%
Tax equity, deferred tax liability, Tahoka - (444) n.a.
Rest of the Group 8,618 (2,419) 28%
Effective tax for the year 23,504 (4,018) 17%
Tax on gain (loss) on divestments related to taxable gains. See more in note 2.5 'Other operating income and expenses'. The tax rate for 'Rest of the Group' is higher than the weighted average tax rate in the countries in which we generate income as a result of adjustments relating to previous years as well as non- deductible expenses and non-taxable income.
1,725
Ørsted Annual report 2018 Financial statements Consolidated financial statements – 5. Tax
126 / 193
Note summary Contents

Our tax policyWe recognise the key role that tax plays in society and the development of the countries where we operate. We also believe that a responsible approach to tax is essential to the long-term sustainability of the societies where we have activities and of our business across the globe.
The world's governments have defined the greatest challenges for our societies towards 2030 through the UN Sustainable Development Goals (SDGs). At Ørsted, we are committed to running our business in a way that contributes to the SDGs. Tax payments contribute both directly and indirectly to most of the SDGs, in particular target #16.6 on the development of effective, accountable and transparent institutions.
Tax is a core part of our corporate responsi-bility and governance and is overseen by the Board of Directors. The Board of Directors is accountable for the tax policy, and the responsibility for tax risk management lies with the CFO and overseen by the Audit and Risk Committee.
Compliance Our ambition is to apply best practices at all times and act in accordance with appli-cable legislation on tax computation and
tax reporting to ensure that we pay the right amount of tax at the right time in the countries where we operate. We continuously evaluate our processes and controls to ensure that we are compliant with local and interna-tional standards relevant to our business.
Our attitude to tax planningWe only use business structures that are driven by commercial considerations, aligned with business activity and which have genuine substance.
We make use of incentives and tax reliefs where they apply in areas where we have commercial substance.
We seek, wherever possible, to develop cooperative relationships with tax authorities, based on mutual respect, transparency and trust.
TransparencyIn line with our belief in transparency, we pro-vide regular information to our stakeholders – including investors, policy makers, employees, civil society and the general public – about our approach to tax and taxes paid.
Read more about our tax policy at https://orsted.com/taxpolicy
Tax regimesAt the end of 2018, our major activities were in Denmark, the UK, Germany, the Netherlands and the US.
US tax equity partnershipsWe have entered into several tax equity partnership agreements in the US. For more information on our tax equity partnership structure, see note 4.5 'Tax equity liabilities'.The expected value of the deferred tax liability related to property, plant and equipment at the 'flip date' in the tax equity partnership agreement is included in our accounts when the tax equity partnership is established.
International joint taxationFor the income year 2017 and going forward, we opted to exit the international jointtaxation scheme. The retaxation liability was transferred to tax payable and has been settled.
Local taxes paidIn terms of taxation, we were affected in Denmark by completed construction agree-ments in connection with the construction of offshore wind farms in the UK and Germany in 2018.
5.1 Tax policy and tax regimes We have made significant investments in offshore wind farms in the UK, Germany and the Netherlands, resulting in the accumulation of large tax assets in recent years. Accordingly, we have not paid significant taxes in these countries. Going forward, this will change as the offshore wind farms are commissioned and will be generating positive results.
We expect to start paying more significant corporate tax in the UK in 2019, in Germany in 2019 and in the Netherlands in 2021.
We are currently making significant invest-ments in the US, and we do therefore not expect to pay any material corporate income tax in the foreseeable future.
Ørsted Annual report 2018 Financial statements Consolidated financial statements – 5. Tax
127 / 193
Note summary Contents
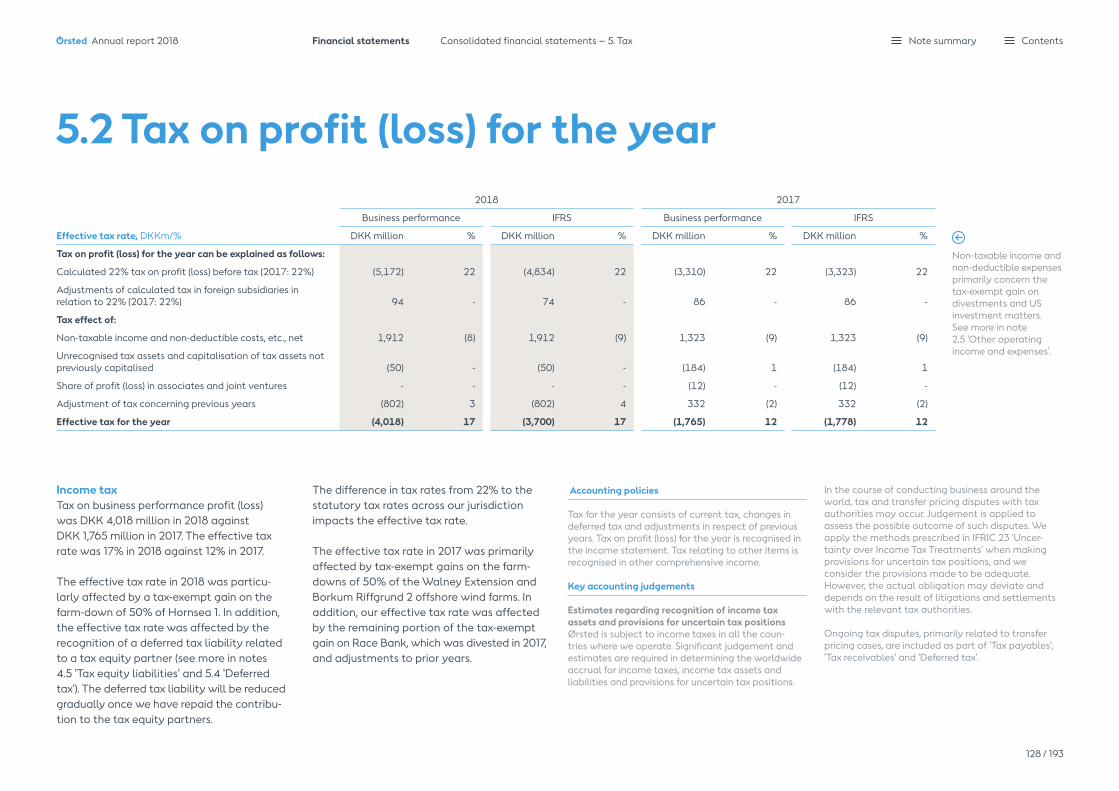
Income tax Tax on business performance profit (loss)was DKK 4,018 million in 2018 againstDKK 1,765 million in 2017. The effective tax rate was 17% in 2018 against 12% in 2017.
The effective tax rate in 2018 was particu-larly affected by a tax-exempt gain on the farm-down of 50% of Hornsea 1. In addition, the effective tax rate was affected by the recognition of a deferred tax liability related to a tax equity partner (see more in notes 4.5 'Tax equity liabilities' and 5.4 'Deferred tax'). The deferred tax liability will be reduced gradually once we have repaid the contribu-tion to the tax equity partners.
Accounting policies
Tax for the year consists of current tax, changes in deferred tax and adjustments in respect of previous years. Tax on profit (loss) for the year is recognised in the income statement. Tax relating to other items is recognised in other comprehensive income.
Key accounting judgements
Estimates regarding recognition of income tax assets and provisions for uncertain tax positionsØrsted is subject to income taxes in all the coun-tries where we operate. Significant judgement and estimates are required in determining the worldwide accrual for income taxes, income tax assets and liabilities and provisions for uncertain tax positions.
5.2 Tax on profit (loss) for the year2018 2017
Business performance IFRS Business performance IFRS
Effective tax rate, DKKm/% DKK million % DKK million % DKK million % DKK million %
Tax on profit (loss) for the year can be explained as follows:
Calculated 22% tax on profit (loss) before tax (2017: 22%) (5,172) 22 (4,834) 22 (3,310) 22 (3,323) 22
Adjustments of calculated tax in foreign subsidiaries in relation to 22% (2017: 22%) 94 - 74 - 86 - 86 -
Tax effect of:
Non-taxable income and non-deductible costs, etc., net 1,912 (8) 1,912 (9) 1,323 (9) 1,323 (9)
Unrecognised tax assets and capitalisation of tax assets not previously capitalised (50) - (50) - (184) 1 (184) 1
Share of profit (loss) in associates and joint ventures - - - - (12) - (12) -
Adjustment of tax concerning previous years (802) 3 (802) 4 332 (2) 332 (2)
Effective tax for the year (4,018) 17 (3,700) 17 (1,765) 12 (1,778) 12
Non-taxable income and non-deductible expenses primarily concern the tax-exempt gain on divestments and US investment matters. See more in note 2.5 'Other operating income and expenses'.
The difference in tax rates from 22% to the statutory tax rates across our jurisdiction impacts the effective tax rate.
The effective tax rate in 2017 was primarily affected by tax-exempt gains on the farm-downs of 50% of the Walney Extension and Borkum Riffgrund 2 offshore wind farms. In addition, our effective tax rate was affected by the remaining portion of the tax-exempt gain on Race Bank, which was divested in 2017, and adjustments to prior years.
In the course of conducting business around the world, tax and transfer pricing disputes with tax authorities may occur. Judgement is applied to assess the possible outcome of such disputes. We apply the methods prescribed in IFRIC 23 'Uncer-tainty over Income Tax Treatments' when making provisions for uncertain tax positions, and weconsider the provisions made to be adequate. However, the actual obligation may deviate and depends on the result of litigations and settlements with the relevant tax authorities.
Ongoing tax disputes, primarily related to transfer pricing cases, are included as part of 'Tax payables', 'Tax receivables' and 'Deferred tax'.
Ørsted Annual report 2018 Financial statements Consolidated financial statements – 5. Tax
128 / 193
Note summary Contents

2018 2017
Income tax, DKKmBusiness
performance IFRSBusiness
performance IFRS
Tax on profit (loss) for the year (4,018) (3,700) (1,765) (1,778)
Tax on other comprehensive income 411 93 238 251
Tax on hybrid capital 120 120 141 141
Total tax for the year (3,487) (3,487) (1,386) (1,386)
Tax on profit (loss) for the year can be broken down as follows:
Current tax (3,161) (3,161) (2,698) (2,698)
Deferred tax (52) 266 586 573
Tax relating to assets classified as held for sale (3) (3) 15 15
Adjustment of tax concerning previous years (802) (802) 332 332
Tax on profit (loss) for the year (4,018) (3,700) (1,765) (1,778)
Tax on other comprehensive income can be broken down as follows:
Current tax 93 93 255 255
Deferred tax 318 - (17) (4)
Tax on other comprehensive income 411 93 238 251
Income tax for the year is calculated on the basis of the profit (loss) before tax from continuing operations.
Tax on profit (loss) for the year and other comprehensive income In 2018, tax on IFRS profit (loss) for the year amounted to DKK 3,700 million, consisting of current tax of DKK 3,161 million, changes in deferred tax of DKK 266 million, tax on assets classified as held for sale of DKK 3 million, and an adjustment of tax in respect of previous years of DKK 802 million. The adjustment primarily relates to amendments of asset values in UK and Germany and reclassification of Danish liabilities.
Current tax Current tax is the tax incurred in Ørsted which is payable within the same year as the profit.
This deviates from taxes paid as a result of payments regarding prior years and residual payments regarding the current year.
Included in the current tax for 2018 is DKK 2,135 million which relate to gains from construction agreements regarding Walney Extension and Borkum Riffgrund 2 and the construction man-agement agreement regarding Race Bank.
Due to the high level of investments and the subsequent deferrals of payable tax as a consequence of tax depreciation, our current tax is generally lower than the statutory corporate tax rates during construction and the initial years after first power.
Current tax (business performance), 2018, DKKbn
Profit before tax Current tax
Current tax rate (business performance), 2018, %
The figure shows the relationship between profit before tax and current tax in the main countries where we do business.
The figure shows the tax rates based on business performance in the maincountries where we do business.
20.3
2.9
Denmark
3.0
0.2
The UK
0.70.0
Germany
0.4 0.0
The Netherlands
-0.7
0.0
The US
-0.2
0.1
Other
14.1
Denmark
7.8
The UK
1.2
Germany
0.0
The Netherlands
0.0
The US
Ørsted Annual report 2018 Financial statements Consolidated financial statements – 5. Tax
129 / 193
Note summary Contents
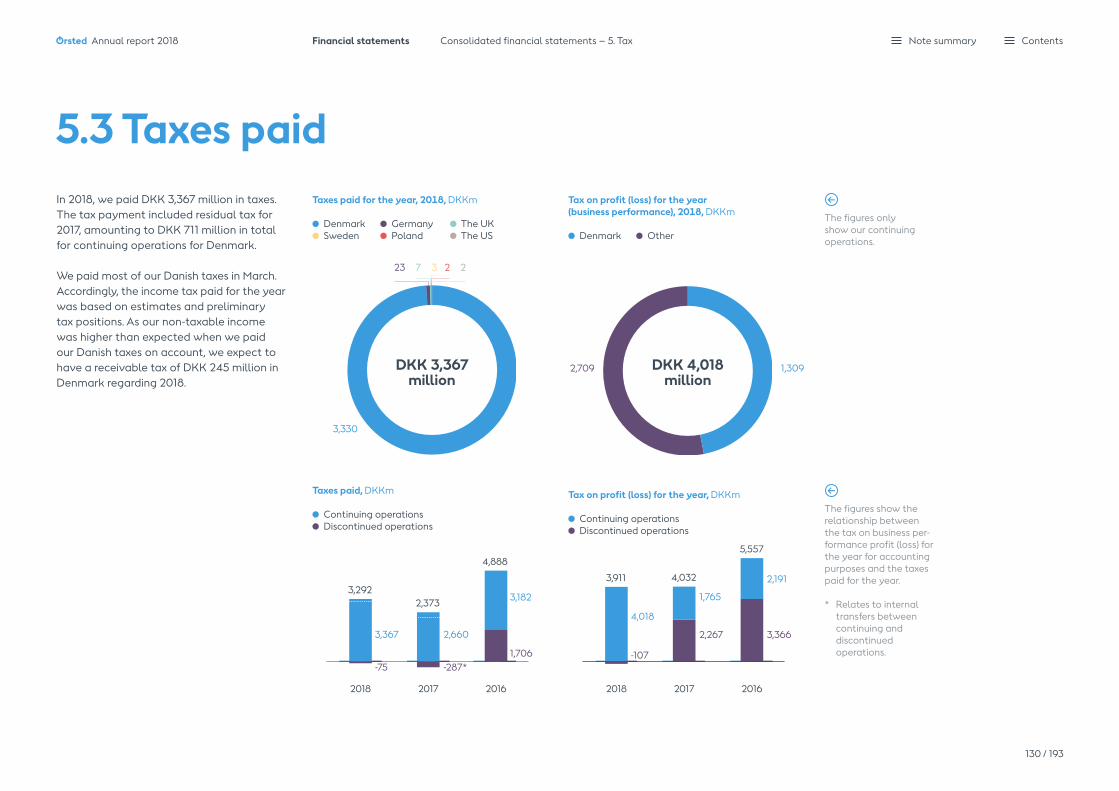
2018 2017 2016 2018 2017 2016
DKK 4,018 million
5.3 Taxes paidIn 2018, we paid DKK 3,367 million in taxes. The tax payment included residual tax for 2017, amounting to DKK 711 million in total for continuing operations for Denmark.
We paid most of our Danish taxes in March. Accordingly, the income tax paid for the year was based on estimates and preliminary tax positions. As our non-taxable income was higher than expected when we paid our Danish taxes on account, we expect to have a receivable tax of DKK 245 million in Denmark regarding 2018.
The figures show the relationship between the tax on business per-formance profit (loss) for the year for accounting purposes and the taxes paid for the year.
* Relates to internal transfers between continuing and discontinued operations.
Tax on profit (loss) for the year (business performance), 2018, DKKm
Denmark Other
1,3092,709
Taxes paid for the year, 2018, DKKm
Denmark Germany The UK Sweden Poland The US
DKK 3,367 million
3,330
Taxes paid, DKKm
Continuing operations Discontinued operations
The figures only show our continuing operations.
Tax on profit (loss) for the year, DKKm
Continuing operations Discontinued operations
3,292
-75-107
3,367
4,018
3,911
4,888
3,182
3,366
1,706
2,191
5,557
2,373
2,660 2,267
-287*
1,765
4,032
23 7 3 2 2
Ørsted Annual report 2018 Financial statements Consolidated financial statements – 5. Tax
130 / 193
Note summary Contents

5.4 Deferred taxDevelopment in deferred taxIn 2018, deferred tax from continuing operations decreased due to the completion of the construction of Borkum Riffgrund 2 and Walney Extension as these taxes were paid and increased due to the ongoing construc-tion of Hornsea 1. Also, our tax equity partner agreements in the US (see note 4.5 'Tax equity liabilities') have resulted in the recognition of the expected deferred tax liability that we will take over once the contribution from the tax equity partner has been repaid.
The adjustment regarding previous years comprised recognition of tax assets relating to offshore wind farms.
In 2017, deferred tax from continuing oper-ations decreased as a result of deferred tax liabilities materialising as tax payable. This included differences in the tax and accounting treatment of profit received on account on work in progress, differences in the tax and accounting recognition of financial instru-ments, retaxation due to the expected exit from the international joint taxation scheme and adjustments to prior years.
Deferred tax 2018, DKKm
Offshore
Onshore Bioenergy Customer Solutions
Other activities/
eliminations
Deferred tax at 31
December
Deferred tax, assets 3,565 235 40 1,112 (364) 4,588
Deferred tax, liabilities 2,838 1,293 177 72 (355) 4,025
Unrecognised tax assets 53 19 - 64 - 136
Deferred tax 2017, DKKm
Deferred tax, assets 1,407 - 444 972 42 2,865
Deferred tax, liabilities 1,227 - 352 617 (68) 2,128
Unrecognised tax assets 123 - - 61 - 184
Deferred tax by segmentDeferred tax (liabilities) in our segments primarily concerned the following:– Offshore: recognised profit received on
account and property, plant and equip-ment, in respect of which depreciation for tax purposes exceeds depreciation for accounting purposes.
– Onshore: recognised deferred tax liability regarding wind farm assets in tax equity structures.
– Bioenergy: property, plant and equip-ment in respect of which depreciation for tax purposes exceeds depreciation for accounting purposes.
– Customer Solutions: financial instruments. – Other activities/eliminations comprised
intra-group eliminations in the joint taxation across segments.
The table shows the reconciliation of deferred tax to the balance sheet by segment. The non-recognised deferred tax assets are not expected to give rise to any material income tax consequence in the event of dividends received.
Accounting policies
Deferred tax is recognised in respect of all temporary differences arising between the tax bases of assets and liabilities and their carrying amounts.
However, deferred tax is not recognised in respect of temporary differences relating to: – the acquisition of joint operations, including
licence interests– other items, where differences arise at the time of
acquisition affecting neither the profit (loss) for the year nor the taxable income. However, this does not include differences arising in connection with company acquisitions.
Deferred tax is measured depending on how we plan to use the assets and settle the liabilities. We set off tax assets and liabilities when the tax assets can be offset against tax liabilities in the year in which the deferred tax assets are expected to be used.
Deferred tax assets are recognised at the value at which they are expected to be used. They may be offset against future earnings or against probable tax losses carried forward. This is done within a joint
taxation scheme. Intra-group gains and losses are eliminated.
Deferred tax is measured based on the tax rules and rates applying when the deferred tax becomes current tax. Changes in deferred tax as a result of changes in tax rates are recognised in profit (loss) for the year.
Deferred tax (net liability) related to the tax equity structures is recognised as tax income in the income statement when we take over the agreements. The liability recognised is the amount that we expect to take over once the contribution from the equity partner is repaid, and the tax equity structure 'flips.'
Liabilities in respect of uncertain tax positions are measured as follows:– The most-likely-outcome method is applied in
cases where there are only two possible outcomes.– The weighted-average method is used in cases
where there are more than two possible outcomes.
The liability is recognised under income tax payable or deferred tax, depending on how the realisation of the tax position will affect the financial statement.
Ørsted Annual report 2018 Financial statements Consolidated financial statements – 5. Tax
131 / 193
Note summary Contents

Development in deferred tax assets and liabilities, 2018, DKKm
Balance sheet 1 January
Transferred to assets and liabilities
classified as assets held for sale
Exchange rate adjustments
Addition of enterprises,
individual assets and activities, net
Recognised in profit (loss)
for the year
Recognised in other
comprehensive income
Adjustments to prior
years, etc.Balance sheet 31 December
Intangible assets 61 (13) - - (28) - 16 36
Property, plant and equipment 2,018 (1,263) (18) 2,252 150 - (108) 3,031
Other non-current assets 140 - (1) 9 132 - 125 405
Current assets (11) - - - (13) - (1) (25)
Decommissioning obligations (797) 3 2 (11) (8) - 54 (757)
Other non-current liabilities (1,106) 436 (2) (312) 88 - (490) (1,386)
Current liabilities (348) 14 (1) (67) (163) - (49) (614)
Tax loss carryforwards (694) - 6 (146) (424) - 5 (1,253)
Deferred tax (737) (823) (14) 1,725 (266) - (448) (563)
Of which recognised in the balance sheet under assets 2,865 4,588
Of which recognised in the balance sheet under equity and liabilities 2,128 4,025
Development in deferred tax assets and liabilities, 2017, DKKm
Intangible assets 109 - - - (48) - - 61
Property, plant and equipment 2,395 2 (94) 57 1,450 (4) (1,788) 2,018
Other non-current assets (1) - - (1) 174 - (32) 140
Current assets (6) 37 - - (36) - (6) (11)
Decommissioning obligations (626) - (6) - (169) - 4 (797)
Other non-current liabilities (950) - (1) - (242) - 87 (1,106)
Current liabilities 644 - - - (50) - (942) (348)
Retaxation 1,730 - - - (1,730) - - -
Tax loss carryforwards (1,198) - 61 329 78 - 36 (694)
Deferred tax 2,097 39 (40) 385 (573) (4) (2,641) (737)
Of which recognised in the balance sheet under assets 88 2,865
Of which recognised in the balance sheet under equity and liabilities 2,185 2,128
The amounts transferred to assets and liabilities classified as assets held for sale concern our Danish power distribu-tion, residental customer and city light businesses.
Addition of enterprises includes the deferred tax liability recognised in relation to our US investments.
Adjustments to prior years primarily relate to movements between deferred tax and tax payable. Also, asset value reassesment in Germany and the UK.
The increase of tax losses carried forward during 2018 is primarily a result of the accel-erated depreciation on fixed assets for tax purposes. The tax loss carryforwards will be set off against realisation of either deferred tax liabilities on the same wind farm or jurisdiction or set off against future profits on that wind farm or jurisdiction.
Ørsted Annual report 2018 Financial statements Consolidated financial statements – 5. Tax
132 / 193
Note summary Contents

TotalCollected taxes
Borne taxes
5.5 Total tax contributionAccording to the OECD classification, tax is a compulsory unrequited payment to general government. This means a payment by Ørsted paid to the government, including amounts paid through an agent. Tax does not result in a return of value to Ørsted for a right or asset used in the business.
Taxes borne by Ørsted are those that represent a direct cost and are reflected in the financial result. Tax borne is charged to the profit and loss account or capitalised as part of an asset's cost.
Taxes collected are those which are generated by Ørsted' operations, but not a tax liability for Ørsted. Ørsted generates the commercial activity that gives rise to the taxes and then collects and administers them on behalf of the tax authorities in the countries in which we operate.
Total global taxes that we paid in 2018
Profit taxes These include taxes on company profits that are borne (such as corporate income tax) and collected (such as withholding tax on payments to third parties). In 2018, Ørsted paid DKK 3,367 million in borne profit taxes and DKK 354 million in collected profit taxes. The collected profit taxes relate to withholding tax on dividends paid to Ørsted's shareholders.
People taxes Taxes on employment, both borne and collected (including income tax and social security tax payments). In 2018, Ørsted paid DKK 134 million in borne people taxes and DKK 1,442 million in collected people taxes.
Product taxes Indirect taxes on the production and consumption of goods and services, including VAT and sales tax, custom duties and insurance premium tax. In 2018, Ørsted paid DKK 13,515 million in collected product taxes. Borne product taxes were insignificant in 2018 for this summary.
Property taxes Taxes on the ownership, sale, transfer or occupancy of property. In 2018, Ørsted paid DKK 5 million in borne property taxes. Collected property taxes were insignificant in 2018 for this summary.
DKK 18,817 million
Total tax contribution, 2018, %
Profit taxes People taxes
Product taxes Property taxes
0%20%
8%
Total tax contribution, 2018, %
Borne taxes Collected taxes
DKK 18,817 million
Total tax contribution is highly impacted by collection of VAT, sales tax, duties as well as profit taxes.
The chart shows the distribution between borne and collected taxes in 2018.
19%
81%
72%
Total tax contribution, 2018, DKKm
Profit taxes People taxes
Product taxes Property taxes
5
13.515 13.515
134 1.442 1.5765
3,367354
3,721
3,506
15,311 18,817
Ørsted Annual report 2018 Financial statements Consolidated financial statements – 5. Tax
133 / 193
Note summary Contents

6.Capital structure
Capital structure 135Interest-bearing debt 136Equity 138Hybrid capital 140Financial resources 141Financial income and expenses 143Funds from operations (FFO)/ adjusted interest-bearing net debt 144
Ørsted Annual report 2018 Note summary Contents

69.0%Funds from operations (FFO) relative to adjusted interest-bearing net debt amounted to 69% at 31 December 2018 against 50.3% at 31 December 2017.
-2.2bnOur interest-bearing net debt totalled DKK -2,219 million at 31 December 2018 against DKK -1.517 million at 31 December 2017.
37.9bnOur financial resources totalled DKK 37,879 million at 31 December 2018 against DKK 39,158 million at 31 December 2017.
6. Capital structureIn 2018, we acquired Lincoln Clean Energy and Deepwater Wind in the US and thereby entered into tax equity partnerships with associated liabilities. The interest-bearing part of our tax equity liability amounts to DKK 454 million as of 31 December 2018.
We have not issued new bonds or raised new loans in 2018. However, we have taken over bank loans in the amount of DKK 4,039 mil-lion in connection with the two acqusitions.
Capital structure To ensure the financial strength to operate in the international energy and capital markets and secure financing on attractive terms, we
have defined credit rating and capital struc-ture targets. The overarching capital structure targets are a credit rating of Baa1/BBB+ and an FFO/adjusted net debt credit metric of around 30%.
Financing policyThe aim of our financing policy is to ensure the best possible loan arrangements, while also minimising financing costs, liquidity and refinancing risks.
The borrowing activities are diversified among various funding sources andmaturities. In addition, we have robustfinancial resources.
Equity and interest-bearing net debt, DKKbn
Interest-bearing assets Interest-bearing debt Hybrid capital Equity attributable to shareholders in Ørsted A/S Non-controlling interests
Our borrowing activities are consolidated in the parent company, where cash resources are available to the Group's companies via an internal bank.
Cash managementWe have decided to maintain robust financial resources to limit the company's sensitivity to unrest in the financial markets.
The financial resources consist of bank deposits and securities as well as non- cancellable credit facilities from a group of robust Nordic and international banks. The financial resources totalled DKK 37,879 million at 31 December 2018 (2017: DKK 39,158 million).
2018
2017
AssetsDKK 31.2 billion
Assets DKK 30.5 billion
DKK 70.3 billion
DKK 82.9 billion
Equity and liabilitiesDKK 101.5 billion
Equity and liabilities DKK 113.4 billion
Ørsted Annual report 2018 Financial statements Consolidated financial statements – 6. Capital structure
135 / 193
Note summary Contents

2019 2020 2021 2022 2023 2024 2025 2026 2027 2028+
The tabel shows the changes in interest-bearing debt.
The graph shows the maturity profile
for our bank loans and bond debt.
Interest-bearing debt and interest-bearing assets, DKKm 2018 2017
Interest-bearing debt comprises:Bank debt 3,582 2,069
Bond debt 23,714 27,567
Total bond and bank debt 27,296 29,636Tax equity liability 454 -
Other interest-bearing debt 570 -
Total interest-bearing debt 28,320 29,636Interest-bearing assets comprise:Securities 25,501 25,280
Cash 3,515 4,203
Receivables from associates and joint ventures 60 48
Other receivables 779 647
Receivables in connection with divestments 684 975
Total interest-bearing assets 30,539 31,153Total interest-bearing net debt (2,219) (1,517)
The tabel shows our interest-bearing net debt split into interest-bearing debt and interest-bearing assets.
6.1 Interest-bearing debt
Maturity profile, DKKbn
Bond debt Bank debt
2.2
16.0
0.00.51.5
0.10.1
4.8
0.2
2.1
Interest-bearing net debtInterest-bearing net debt totalled DKK -2,219 million at the end of 2018, up DKK 702 million relative to 2017. The in-crease in the net cash position comprise of a decrease in interest-bearing assets of DKK 614 million and a decrease in interest -bearing debt of DKK 1,316 million.
In 2018, we have entered the US market where we have entered into tax equity liabilities. The part of the tax equity liability we expect to repay with tax credits (PTCs) and other tax attributes is not considered part of interest- bearing debt. This amounts to DKK 3,719 million (2017: DKK 0 million). The part of the tax equity liability we expect to repay with cash is included in interest-bearing debt.
This amounts to DKK 454 million (2017:DKK 0 million). For more information, see note 4.5 'Tax equity liabilities'.
In July 2018, we redeemed a hybrid bond classified as debt with a notional amount of EUR 500 million, corresponding toDKK 4,208 million.
In October and November 2018, we acquired Lincoln Clean Energy and Deepwater Wind. We took over a bank debt of DKK 4,039 mil-lion and interest-bearing tax equity liabilities of DKK 370 million in connection with the transactions. In October and December, bank debt in Lincoln Clean Energy of DKK 2,406 million was repaid.
Changes in interest-bearing debt, DKKm 2018 2017
Interest-bearing debt 1 January 29,636 24,183
Instalments on loans according to the statement of cash flows (6,429) (4,069)
Proceeds from raising of loans according to the statement of cash flows - 5,468
Debt from acquisition of enterprises 4,409 -
Change in other interest-bearing debt 570 -
Reclassification to bond and bank debt - 4,192
Capital losses on early repayment of debt - 230
Foreign exchange adjustments and amortisation 134 (368)
Interest-bearing debt 31 December 28,320 29,636
Ørsted Annual report 2018 Financial statements Consolidated financial statements – 6. Capital structure
136 / 193
Note summary Contents

Senior bond issued at 31 December 2018
Million Outstanding amount
Currency EUR /GBP DKK Coupon (%) Time of issue Maturing Quoted in
EUR 280 2,091 6.500 6 May 2009 7 May 2019 London
EUR 272 2,033 4.875 16 Dec. 2009 16 Dec. 2021 London
EUR 517 3,860 2.625 19 Sep. 2012 19 Sep. 2022 London
EUR 750 5,597 1.500 24 Nov. 2017 26 Nov. 2029 London
GBP 750 6,235 4.875 12 Jan. 2012 12 Jan. 2032 London
GBP 500 4,157 5.750 9 Apr. 2010 9 Apr. 2040 London
Interest rate riskWe have fixed the interest rate on most of our debt by issuing fixed-rate debt. At the end of 2018, 95% (2017: 95%) of the Group's debt was fixed-rate debt. Interest payments on loans in GBP have been covered with forward exchange contracts over the next five years at an average exchange rate of 8.9. See note 7.2 'Hedge accounting and economic hedging' for further information.
At 31 December 2018, the loan portfolio had an average time to maturity of 9.9 years (2017: 9.8 years). Interest-bearing assets consist primarily of short-term bonds with limited risk.
Our interest rate risk is described further in note 7.1 'Market risks'.
Accounting policies
Bond debt, bank debt and other payables are recognised at inception at market value (typically proceeds received) net of transaction costs incurred. In subsequent periods, the liabilities are measured at amortised cost, so that the difference between the cost (proceeds) and the nominal value is recognised in profit (loss) for the year as interest expenses over the term of the loan, using the effective interest rate method.
Financial liabilities are classified as current, unless the Group has an unconditional right to defer settle-ment of the liability to at least one year after the balance sheet date.
The market value of issued bonds has been determined as the market value at 31 December (level 1 – quoted prices).
The market value of bank loans has been determined as the present value of expected future instalments and interest payments using the Group's current interest rate on loans as the discount rate (level 2 – observable inputs).
In addition to seniorbonds, we have issued a number of hybrid bonds; see note 6.3 'Hybrid capital'.
for repayment or collateral in the event of the Danish State holding less than 50% of the share capital or voting rights in Ørsted A/S (change of control), or for repayment in the event of Moody's or Standard & Poor's downgrading our rating to Baa3 or BBB- or below, respectively.
Furthermore, we had non-cancellable credit facilities of DKK 10,447 million at 31 December 2018 (2017: DKK 10,424 million) with a number of Scandinavian and international banks. In connection with these credit facilities, we may be met with demands for cancellation and repayment of any used share in the event of players other than a group consisting of the Danish State and Danish power distribution companies acquiring more than 50% of the share capital or voting rights in Ørsted A/S, or in the event of the Danish State ceasing to hold at least 20% of the share capital. Our financing agreements are not subject to any other unusual terms or conditions.
Market value of bond and bank debtThe market value of our bond and bank debt amounted to DKK 28,048 million and DKK 3,622 million, respectively, at 31 Decem-ber 2018 (2017: DKK 32,959 million andDKK 2,108 million, respectively). The market value of our bond and bank debt exceeds the carrying amount due to the drop in interest levels since the establishment of the debt.
Loan arrangementsAt 31 December 2018, we had loan obligations totalling DKK 1,964 million (2017: DKK 2,069 million) to the European Investment Bank and the Nordic Investment Bank. The loans are recognised in the balance sheet under bank debt. The loans offered by these multilateral financial institutions include loans to co-fund infrastructure and energy projects on favour-able terms and with maturities exceeding those normally available in the commercial banking market. In connection with these loans, the Group may be met with demands
Ørsted Annual report 2018 Financial statements Consolidated financial statements – 6. Capital structure
137 / 193
Note summary Contents

2016 2017 2018
6.2 Equity
Development in share capital, DKKm 2018 2017
Share capital at 1 January 4,204 4,204
Share capital at 31 December 4,204 4,204
2018 2017
Earnings per share, DKKmBusiness
performance IFRSBusiness
performance IFRS
Profit (loss) for the year fromcontinuing operations 19,486 18,266 13,279 13,321
Interest and costs after tax, hybrid capital owners of Ørsted A/S (425) (425) (716) (716)
Non-controlling interests (25) (25) 10 10
Ørsted's share of profit (loss) for the year from continuing operations 19,036 17,816 12,573 12,615
Profit (loss) for the year fromdiscontinued operations 10 10 6,920 6,104
Ørsted's share of profit (loss) for the year from discontinued operations 10 10 6,920 6,104
('000)
Average number of outstanding shares 420,139 420,139 420,155 420,155
Dilutive effect of share programme 466 466 271 271
Average number of outstanding shares, diluted 420,605 420,605 420,426 420,426
(DKK)
Profit (loss) per share
From continuing operations 45.3 42.4 29.9 30.0
From discontinued operations 0.0 0.0 16.5 14.5
Total profit (loss) per share 45.3 42.4 46.4 44.5
The table shows earnings per share distributed on continuing and discontinued operations. Diluted profit
(loss) per share corresponds to profit (loss) per share, as the dilutive effect of the share programme is 0.1% of the share capital (2017: 0.1% of the share capital).
Dividends The Board of Directors recommends that dividends of DKK 4,099 million (2017:DKK 3,783 million) be paid for the financial year, corresponding to DKK 9.75 per share (2017: DKK 9 per share). The proposed divi-dends correspond to a dividend yield of 2.2% (2017: 2.7%) calculated on the basis of the closing price for an Ørsted share on the last trading day of the year.
Owners in ØrstedThe Danish State is the principal shareholder with an ownership interest of 50.1%. In addition, SEAS-NVE and The Capital Group also have significant ownership interests. See note 16 'Ownership information' in the parent company's financial statements.
2.2
2.7
Dividend yield, %
The graph shows the proposed dividends in relation to the closing price for an Ørsted share on the last trading day of the year.
Share capital Ørsted's share capital is DKK 4,203,810,800, divided into shares of DKK 10. The share capital is unchanged from last year. No shares are subject to special rights or restrictions on voting rights. The shares are fully paid up.
Treasury sharesTo secure our share programme, we acquired additional treasury shares in November 2018. The total portfolio of treasury shares consist of 335,904 shares at 31 December 2018 (2017: 225,904), corresponding to 0.1% of the share capital.
2.2
Ørsted Annual report 2018 Financial statements Consolidated financial statements – 6. Capital structure
138 / 193
Note summary Contents
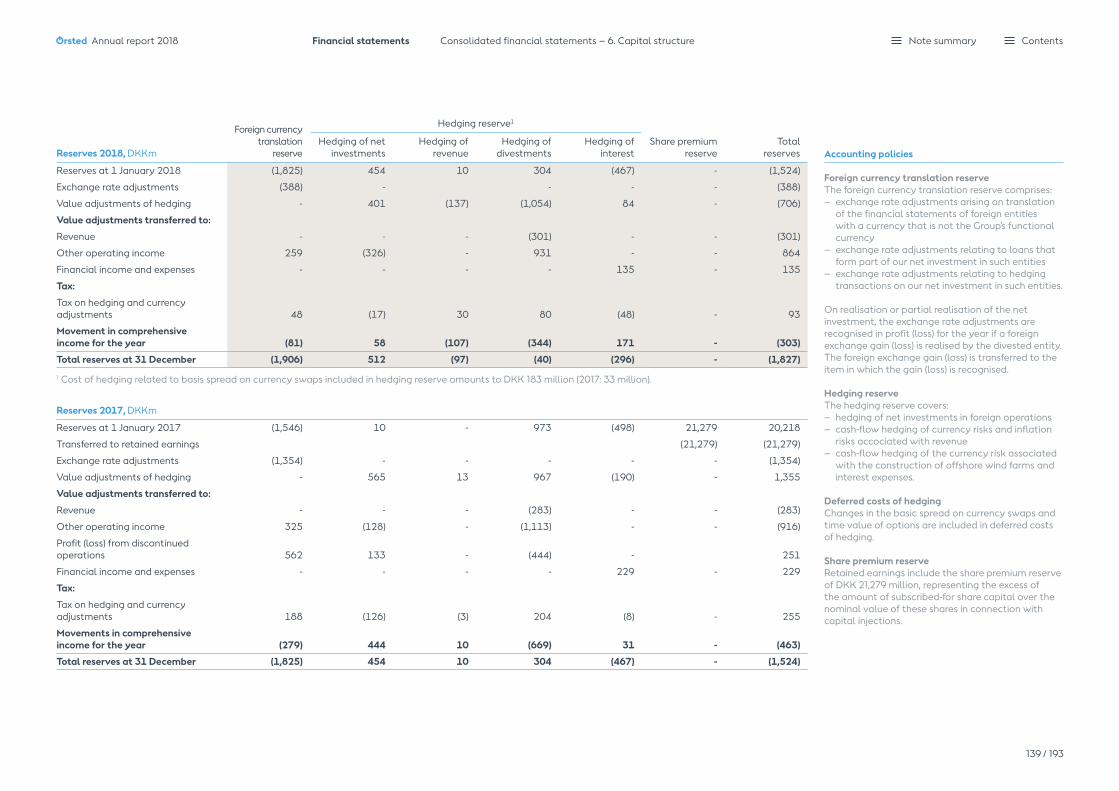
Reserves 2018, DKKm
Foreign currency translation
reserve
Hedging reserve1
Share premium reserve
Total reserves
Hedging of net investments
Hedging of revenue
Hedging of divestments
Hedging of interest
Reserves at 1 January 2018 (1,825) 454 10 304 (467) - (1,524)
Exchange rate adjustments (388) - - - - (388)
Value adjustments of hedging - 401 (137) (1,054) 84 - (706)
Value adjustments transferred to:
Revenue - - - (301) - - (301)
Other operating income 259 (326) - 931 - - 864
Financial income and expenses - - - - 135 - 135
Tax:
Tax on hedging and currency adjustments 48 (17) 30 80 (48) - 93
Movement in comprehensive income for the year (81) 58 (107) (344) 171 - (303)
Total reserves at 31 December (1,906) 512 (97) (40) (296) - (1,827)
1 Cost of hedging related to basis spread on currency swaps included in hedging reserve amounts to DKK 183 million (2017: 33 million).
Reserves 2017, DKKm
Reserves at 1 January 2017 (1,546) 10 - 973 (498) 21,279 20,218
Transferred to retained earnings (21,279) (21,279)
Exchange rate adjustments (1,354) - - - - - (1,354)
Value adjustments of hedging - 565 13 967 (190) - 1,355
Value adjustments transferred to:
Revenue - - - (283) - - (283)
Other operating income 325 (128) - (1,113) - - (916)
Profit (loss) from discontinued operations 562 133 - (444) - 251
Financial income and expenses - - - - 229 - 229
Tax:
Tax on hedging and currency adjustments 188 (126) (3) 204 (8) - 255
Movements in comprehensive income for the year (279) 444 10 (669) 31 - (463)
Total reserves at 31 December (1,825) 454 10 304 (467) - (1,524)
Accounting policies
Foreign currency translation reserve The foreign currency translation reserve comprises:– exchange rate adjustments arising on translation
of the financial statements of foreign entities with a currency that is not the Group's functional currency
– exchange rate adjustments relating to loans that form part of our net investment in such entities
– exchange rate adjustments relating to hedging transactions on our net investment in such entities.
On realisation or partial realisation of the netinvestment, the exchange rate adjustments are recognised in profit (loss) for the year if a foreign exchange gain (loss) is realised by the divested entity. The foreign exchange gain (loss) is transferred to the item in which the gain (loss) is recognised.
Hedging reserveThe hedging reserve covers:– hedging of net investments in foreign operations– cash-flow hedging of currency risks and inflation
risks accociated with revenue– cash-flow hedging of the currency risk associated
with the construction of offshore wind farms and interest expenses.
Deferred costs of hedgingChanges in the basic spread on currency swaps and time value of options are included in deferred costs of hedging.
Share premium reserveRetained earnings include the share premium reserve of DKK 21,279 million, representing the excess of the amount of subscribed-for share capital over the nominal value of these shares in connection with capital injections.
Ørsted Annual report 2018 Financial statements Consolidated financial statements – 6. Capital structure
139 / 193
Note summary Contents
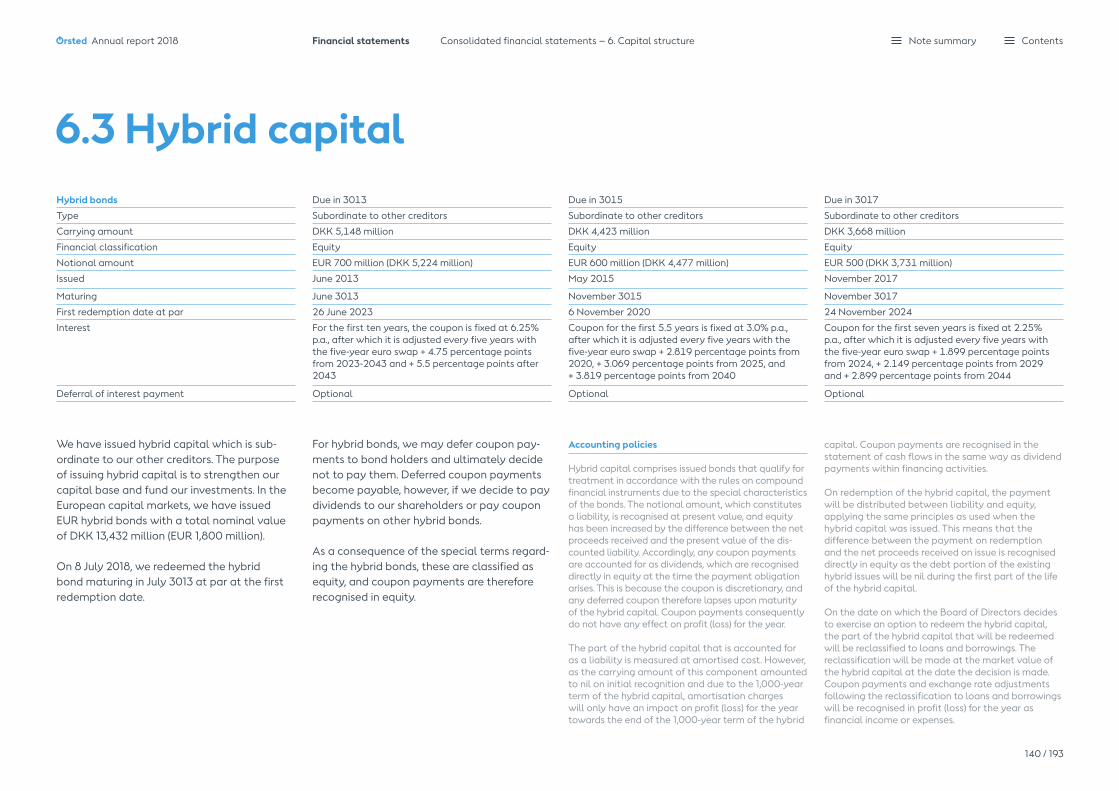
6.3 Hybrid capitalHybrid bonds Due in 3013 Due in 3015 Due in 3017
Type Subordinate to other creditors Subordinate to other creditors Subordinate to other creditors
Carrying amount DKK 5,148 million DKK 4,423 million DKK 3,668 million
Financial classification Equity Equity Equity
Notional amount EUR 700 million (DKK 5,224 million) EUR 600 million (DKK 4,477 million) EUR 500 (DKK 3,731 million)
Issued June 2013 May 2015 November 2017
Maturing June 3013 November 3015 November 3017
First redemption date at par 26 June 2023 6 November 2020 24 November 2024
Interest For the first ten years, the coupon is fixed at 6.25% p.a., after which it is adjusted every five years with the five-year euro swap + 4.75 percentage points from 2023-2043 and + 5.5 percentage points after 2043
Coupon for the first 5.5 years is fixed at 3.0% p.a., after which it is adjusted every five years with the five-year euro swap + 2.819 percentage points from 2020, + 3.069 percentage points from 2025, and + 3.819 percentage points from 2040
Coupon for the first seven years is fixed at 2.25% p.a., after which it is adjusted every five years with the five-year euro swap + 1.899 percentage points from 2024, + 2.149 percentage points from 2029 and + 2.899 percentage points from 2044
Deferral of interest payment Optional Optional Optional
We have issued hybrid capital which is sub-ordinate to our other creditors. The purpose of issuing hybrid capital is to strengthen our capital base and fund our investments. In the European capital markets, we have issued EUR hybrid bonds with a total nominal value of DKK 13,432 million (EUR 1,800 million).
On 8 July 2018, we redeemed the hybrid bond maturing in July 3013 at par at the first redemption date.
For hybrid bonds, we may defer coupon pay-ments to bond holders and ultimately decide not to pay them. Deferred coupon payments become payable, however, if we decide to pay dividends to our shareholders or pay coupon payments on other hybrid bonds.
As a consequence of the special terms regard-ing the hybrid bonds, these are classified as equity, and coupon payments are therefore recognised in equity.
Accounting policies
Hybrid capital comprises issued bonds that qualify for treatment in accordance with the rules on compound financial instruments due to the special characteristics of the bonds. The notional amount, which constitutes a liability, is recognised at present value, and equity has been increased by the difference between the net proceeds received and the present value of the dis-counted liability. Accordingly, any coupon payments are accounted for as dividends, which are recognised directly in equity at the time the payment obligation arises. This is because the coupon is discretionary, and any deferred coupon therefore lapses upon maturity of the hybrid capital. Coupon payments consequently do not have any effect on profit (loss) for the year.
The part of the hybrid capital that is accounted for as a liability is measured at amortised cost. However, as the carrying amount of this component amounted to nil on initial recognition and due to the 1,000-year term of the hybrid capital, amortisation charges will only have an impact on profit (loss) for the year towards the end of the 1,000-year term of the hybrid
capital. Coupon payments are recognised in the statement of cash flows in the same way as dividend payments within financing activities.
On redemption of the hybrid capital, the payment will be distributed between liability and equity, applying the same principles as used when the hybrid capital was issued. This means that the difference between the payment on redemption and the net proceeds received on issue is recognised directly in equity as the debt portion of the existing hybrid issues will be nil during the first part of the life of the hybrid capital.
On the date on which the Board of Directors decides to exercise an option to redeem the hybrid capital, the part of the hybrid capital that will be redeemed will be reclassified to loans and borrowings. The reclassification will be made at the market value of the hybrid capital at the date the decision is made. Coupon payments and exchange rate adjustments following the reclassification to loans and borrowings will be recognised in profit (loss) for the year as financial income or expenses.
Ørsted Annual report 2018 Financial statements Consolidated financial statements – 6. Capital structure
140 / 193
Note summary Contents

Cash and cash equivalents, securities, DKKm 2018 2017
Cash, available 2,663 3,891
Total cash and cash equivalents at 31 December, cf. statement of cash flows 2,663 3,891
Cash can be specified as follows:
Cash, available 2,663 3,891
Cash, not available for use 852 312
Total cash at 31 December, cf. balance sheet 3,515 4,203
Securities can be specified as follows:
Securities, available 24,769 24,843
Securities, not available for use 732 437
Total securities at 31 December 25,501 25,280
The table shows our cash and securities which are divided into available and not available for use.
Our liquidity and financing risks are managed centrally in accordance with the principles and delegated authorities laid down by the Board of Directors.
One of the most significant financial manage-ment tasks is to secure sufficient and flexible financial resources in relation to our day-to-day operations, investment programme and debt maturity profile.
We therefore define minimum financial resources for the coming calendar year.
Cash, cash equivalents and securitiesSecurities are a key element in our financial resources, for which reason investments are primarily made in liquid AAA-rated Danish mortgage bonds and to a lesser extent in other bonds. Most of the securities qualify for repo transactions in the Danish central bank, 'Danmarks Nationalbank'.
Securities not available for use comprise securities pledged as collateral for: – insurance- related provisions;
DKK 399 million at 31 December 2018 (2017: DKK 397 million)
– trading in financial instruments; DKK 333 million at 31 December 2018 (2017: DKK 40 million).
At 31 December 2018, we had received collateral in the amount of DKK 852 million (2017: DKK 787 million) concerning the positive market value of derivatives.
Cash not available for use comprise: – collateral for insurance-related provisions;
DKK 264 million (2017: DKK 312 million)– collateral for US power purchase agree-
ments; DKK 246 million (2017: DKK 0 million)– collateral for other transactions;
DKK 342 million (2017: DKK 0 million).
6.4 Financial resources
Financial resources, DKK million
Cash, available Securities, available Undrawn, non-cancellable credit facilities
2018
2017
DKK 39,158 million
DKK 37,879 million
Overview of securities, DKKm
MaturitiesFixed
rateFloating
rate 2018Fixed
rateFloating
rate 2017
0-2 years 3,178 1,086 4,264 2,091 1,971 4,062
2-5 years 15,073 3,460 18,533 17,712 3,506 21,218
After 5 years 2,671 33 2,704 - - -
Total carrying amount 20,922 4,579 25,501 19,803 5,477 25,280
The tabel shows our securities split into maturities and fixed or floating interest rate.
Ørsted Annual report 2018 Financial statements Consolidated financial statements – 6. Capital structure
141 / 193
Note summary Contents

Maturity analysis of loans and borrowings 2018, DKKm 2019 2020 2021-2022 After 2022 2018
Bank loans and issued bonds
Notional amount 2,213 235 6,917 18,179 27,544
Interest payments 1,003 873 1,654 8,074 11,604
Trade payables 13,093 - - - 13,093
Derivatives 6,066 1,626 133 414 8,239
Tax equity debt 66 59 143 334 602
Other payables 5,327 - - - 5,327
Liabilities relating to assets classified as held for sale 812 - - - 812
Total payment obligations 28,580 2,793 8,847 27,001 67,221
Maturity analysis of loans and borrowings 2017, DKKm 2018 2019 2020-2021 After 2021 2017
Bank loans and issued bonds
Notional amount 3,828* 2,192 2,345 21,457 29,822
Interest payments 1,152 973 1,690 8,772 12,587
Trade payables 11,499 - - - 11,499
Other payables 5,644 216 - - 5,860
Derivatives 2,912 736 471 6 4,125
Liabilities relating to assets classified as held for sale 119 - - - 119
Total payment obligations 25,154 4,117 4,506 30,235 64,012
* The amount primarily relates to reclassified hybrid capital. See more in note 6.3 'Hybrid capital'.
Accounting policies
Securities comprise bonds that are monitored, measured and reported at market value on an on-going basis in conformity with the Group's investment policy. Changes in market value are recognised in profit (loss) for the year as financial income and expenses. Purchase and sale of securities are recog-nised at the settlement date.
For listed securities, market value equals the market price, and for unlisted securities, market value is estimated based on generally accepted valuation methods and market data.
Divested securities where repurchase agreements (repo transactions) has been made at the time of sale are recognised in the balance sheet at the settlement date as if the securities were still held. The amount received is recognised as a liability, and the difference between the selling price and the pur-chase price is recognised in profit (loss) for the year over the term as interest. The return on the securities is recognised in profit (loss) for the year.
Maturity analysis of loans and borrowingsThe Group's cash needs in respect of its financial loans and borrowings are shown in the table on the left. The maturity analysis was determined on 31 December.
The maturity analysis is based on undiscounted cash flows, including estimated interest payments. Interest payments are based on market conditions and interest -rate hedging entered into on 31 December.
The maturity analysis does not include hybrid capital classified as equity. At 31 December 2018, we had is-sued hybrid capital with a notional amount totalling DKK 13,432 million due in 3013 (DKK 5,224 million), 3015 (DKK 4,477 million) and 3017 (DKK 3,731 million), respectively.
Ørsted Annual report 2018 Financial statements Consolidated financial statements – 6. Capital structure
142 / 193
Note summary Contents

Accounting policies
Market value adjustments of interest rate and currency derivatives that have not been entered into for hedging purposes are presented as financial income or expenses.
The accounting policy for the tax equity partner's contractual return is described in note 4.5 'Tax equity liabilities'.
Net financial income and expenses, DKKm 2018 2017
Interest expenses, net (877) (629)
Interest element of provisions, etc. (408) (451)
Tax equity partner's contractual return (44) -
Capital losses on early repayment of loans and interest rate swaps - (230)
Value adjustments of derivatives, net (64) (67)
Exchange rate adjustments, net 285 391
Value adjustments of securities, net (176) (150)
Other financial income and expenses 6 94
Net financial income and expenses (1,278) (1,042)
6.5 Financial income and expenses
Financial income and expenses, DKKm 2018 2017
Interest income from cash, etc. 62 71
Interest income from securities at market value 264 216
Capital gains on securities at market value 119 250
Foreign exchange gains 2,033 1,523
Value adjustments of derivatives 670 2,043
Other financial income 31 150
Total financial income 3,179 4,253Interest expenses relating to loans and borrowings, etc. (1,710) (1,670)
Interest expenses transferred to assets 506 754
Interest element of provisions (280) (303)
Tax equity partner's contractual return (44) -
Capital losses on securities at market value (304) (419)
Foreign exchange losses (1,978) (1,568)
Value adjustments of derivatives (466) (1,887)
Other financial expenses (181) (202)
Total financial expenses (4,457) (5,295)Net financial income and expenses (1,278) (1,042)
The table shows net financial income and expenses, corresponding to our internal control.
Exchange rate adjustments and hedging contracts entered into to hedge currency risks are presented net under the item 'Exchange rate adjustments, net'.
Exchange rate adjust ments of currency hedging are recognised in revenue and cost of sales with a gain of DKK 268 million (2017: a gain of DKK 190 million).
Borrowing costs transferred to property, plant and equipment under construction are calculated at the weighted average effective interest rate for general borrowing. This amounted to 4.1% in 2018 (2017: 5.3%).
Ørsted Annual report 2018 Financial statements Consolidated financial statements – 6. Capital structure
143 / 193
Note summary Contents

A-/A3
BBB+/Baa1
BBB/Baa2
BBB-/Baa3
2014 2015 2016 2017 2018 2020
6.6 Funds from operations (FFO)/ adjusted interest-bearing net debt
Funds from operations (FFO), DKKm 2018 2017
EBITDA – business performance 30,029 22,519
Interest expenses, net (877) (629)
Reversal of interest expenses transferred to assets (506) (754)
Interest element of decommissioning obligations (192) (194)
50% of coupon payments on hybrid capital (272) (320)
Calculated interest paid on operating lease obligations (196) (234)
Adjusted interest expenses, net (2,043) (2,131)Reversal of gain (loss) on divestment of assets (14,995) (10,835)
Reversal of recognised operating lease payment in profit (loss) for the year 778 885
Total current tax (3,068) (2,447)
Funds from operations (FFO) 10,701 7,991
Adjusted interest-bearing net debt, DKKm 2018 2017
Total interest-bearing net debt (2,219) (1,517)
50% of hybrid capital 6,619 6,619
Cash and securities not available for distribution, excluding repo loans 1,583 749
Present value of operating lease payments 4,819 6,095
Decommissioning obligations 5,471 4,751
Deferred tax on decommissioning obligations (757) (797)
Total adjusted interest-bearing net debt 15,516 15,900
Funds from operations (FFO)/ adjusted interest-bearing net debt, % 2018 2017
Funds from operations (FFO)/ adjusted interest-bearing net debt 69.0% 50.3%
The table shows which items are included in FFO. FFO is calculated for the continuing operations.
The table shows which items are included in the adjusted interest- bearing debt as well as FFO relative to adjusted interest-bearing debt.
The figure shows the development in our credit rating since 2014 compared to our objective.
Our long-term target is for funds from opera-tions (FFO) to be around 30% of adjusted interest-bearing net debt.
FFO/adjusted interest-bearing net debt was 69% in 2018, exceeding the target.
Rating, category
S&P Moody's Fitch Financial objective
Ørsted Annual report 2018 Financial statements Consolidated financial statements – 6. Capital structure
144 / 193
Note summary Contents

7.Risk management
Risk management 146Market risks 147 Hedge accounting and economic hedging 150 Energy trading portfolio 152 Sensitivity analysis of financial instruments 153 Credit risks 154 Categories of financial instruments 155Fair value measurement 156
Ørsted Annual report 2018 Note summary Contents

Power Gas Oil SpreadGBP USD
7. Risk managementMarket and credit risks are a natural part of our business activities and a precondition for being able to create value. Through risk management, risks are reduced to an acceptable level.
Aquisitions in 2018We have aquired Lincoln Clearn Energy in October 2018 and Deepwater Wind in November 2018. The two aquisitions have increased our power and USD exposure.
Currency and energy exposuresAt the end of 2018, our forward-looking energy and currency exposures from produc tion, sales, investments and divestments for 2019-2023 had been reduced from DKK 24.0 billion and DKK 64.7 billon to DKK 9.1 billion and DKK 19.1 billion respectively via hedging.
Trading portfolioWe have a limited trading portfolio, the main purpose of which is to optimise the execution of hedging contracts and gain from short-term energy price fluctuations. The trading activities comply with the mandates approved by the Board of Directors. Read more in note7.3 'Energy Trading portfolio'.
Energy exposure 2019-2023, DKKbn
Before hedging After hedging
Currency exposure 2019-2023, DKKbn
Before hedging After hedging
-2.4-0.1-0.1
0.3
19.3
7.1
2.2 1.6
62.2
-2.5
16.6
-2.5
Our currency exposure for 2019-2023 totalled DKK 64.7 billion before hedging and DKK 19.1 billion after hedging at the end of 2018. We do not deem EUR to constitute a risk, as we expect that Denmark will maintain its fixed exchange-rate policy.
Our energy exposures for 2019-2023 totalled DKK 24.0 billion before hedging and DKK 9.1 billion after hedging at the end of 2018.
5 years We hedge prices for up to five years to reduce cash flow fluctuations.
+0.4bn In 2018, business performance EBITDA was positively impacted by DKK 368 million from hedging instruments against a positiv impact by DKK 1,665 million in 2017.
-3.0bnThe value of our energy and currency hedging instruments at 31 December 2018 was negative at DKK 3,032 million, which will reduce business performance EBITDA in a future period, against DKK -812 million at 31 December 2017.
Ørsted Annual report 2018 Financial statements Consolidated financial statements – 7. Risk management
146 / 193
Note summary Contents

2019 2020 2021 2022 2023
Market risks and market risk managementOur most significant market risks relate to:– energy prices– foreign exchange rates – inflation rates and – interest rates.
We manage market risks to protect Ørsted against market price volatility and ensure stable and robust financial ratios that support our growth strategy.
In the first five years, we primarily hedge future prices using derivatives to reduce cash flow fluctuations. We are almost fully hedged in the first two years. At longer durations, we also manage our market risks; our power exposure is partly mitigated through long term power purchasing agreements (PPA), and debt is used to manage currency, interest rate and inflation risk. Our long-term risk picture is determined by our strategic asset portfolio.
Minimum hedging levels are determined by the Board of Directors. In the first two years, a high degree of hedging is wanted to ensure stable cash flows after tax. The degree of hedging is declining in subsequent years. This is due to: – reduced certainty about long-term
production volumes and – increasing hedging costs in the medium to
long term; both spread costs and cost of collateral.
Energy price risksOur consolidated energy exposure after hedging for the years 2019-2023 can be sum-marised as shown in the table.
Risk after hedging DKKbn
Effect of price change+10% -10%
Power: 7.1 sales position +0.7 -0.7
Gas: 0.1 sales position +0.0 -0.0
Oil: 0.1 purchase position -0.0 +0.0
Spread: 1.6 sales position +0.2 -0.2
A 10% increase in the power price in 2019-2023 will therefore result in a gain of DKK 0.7 billion in the period, all else remaining unchanged.
Currency risksOur consolidated currency exposure after hedging for the years 2019-2023 can be sum-marised as shown in the table.
Risk after hedging DKKbn
Effect of price change+10% -10%
GBP: 16.6 sales position +1.7 -1.7
USD: 2.5 purchase position -0.3 +0.3
Our largest currency exposure relates to GBP due to our investments in offshore wind farms in the UK. During 2018, we have experienced a substantial increase in long-term USD expo-sure, due to acquisition of both onshore and offshore companies in the US. Our exposure towards New Taiwan Dollar will increase if we
take final investment decision for the awarded offshore capacity in Taiwan.
In general, highly certain cash flows in foreign currencies are hedged within the first five years.
This means that exchange rates related to energy prices in foreign currency are not hedged until the energy price is hedged. Hence, GBP exchange rates associated with power generation in the UK is not hedged until the GBP power price is hedged.
Cash flows that relate to fixed tariffs and guaranteed minimum prices from offshore wind farms in the UK deviate from the main principle. Hedging of these, less operating expenses, is based on a declining level of
7.1 Market riskshedging over the five-year risk management horizon. The target is to hedge 100% of the risk in year 1, declining by 20 percentage points each year, to 20% in year 5.
Our GBP exposure amounted to DKK 16.6 billion after hedging for the years 2019-2023. This unhedged GBP exposure stems from subsidised GBP income less operational expenditures.
The GBP exchange rate for hedges impacting EBITDA in 2019 and 2020 is hedged at an aver-age exchange rate of DKK/GBP 8.4 and 8.4.
Our EUR risk is subject to continuous assess-ment, but is generally not hedged as we believe that Denmark will maintain its fixed exchange-rate policy.
GBP exposures, DKKbn
Before hedging After hedging
The graph shows our GBP exposure before and after hedges from:– divestment and
investment– green certificates– hedged energy.
21.7
-0.5
11.7
1.3
5.52.7
13.9
5.4
9.47.7
Ørsted Annual report 2018 Financial statements Consolidated financial statements – 7. Risk management
147 / 193
Note summary Contents
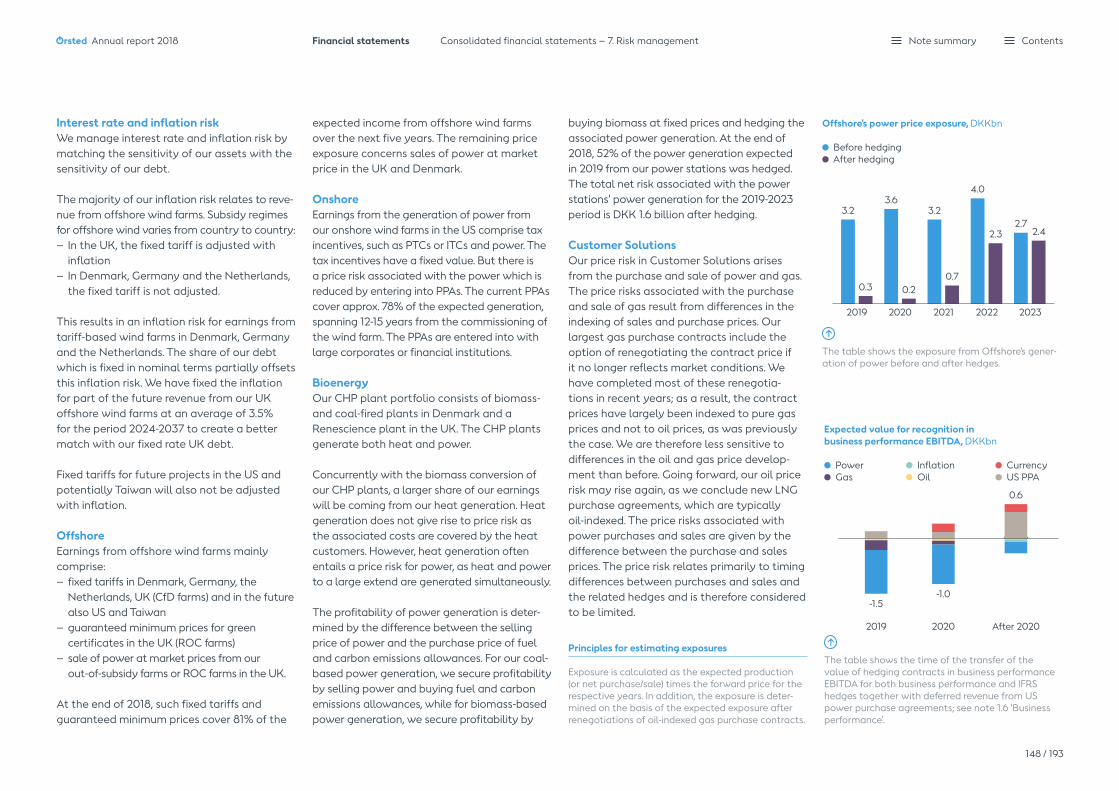
2019 2020 2021 2022 2023
2019 2020 After 2020
Interest rate and inflation riskWe manage interest rate and inflation risk by matching the sensitivity of our assets with the sensitivity of our debt.
The majority of our inflation risk relates to reve-nue from offshore wind farms. Subsidy regimes for offshore wind varies from country to country:– In the UK, the fixed tariff is adjusted with
inflation – In Denmark, Germany and the Netherlands,
the fixed tariff is not adjusted.
This results in an inflation risk for earnings from tariff-based wind farms in Denmark, Germany and the Netherlands. The share of our debt which is fixed in nominal terms partially offsets this inflation risk. We have fixed the inflation for part of the future revenue from our UK offshore wind farms at an average of 3.5% for the period 2024-2037 to create a better match with our fixed rate UK debt.
Fixed tariffs for future projects in the US and potentially Taiwan will also not be adjusted with inflation.
Offshore Earnings from offshore wind farms mainly comprise: – fixed tariffs in Denmark, Germany, the
Netherlands, UK (CfD farms) and in the future also US and Taiwan
– guaranteed minimum prices for green certificates in the UK (ROC farms)
– sale of power at market prices from our out-of-subsidy farms or ROC farms in the UK.
At the end of 2018, such fixed tariffs and guaranteed minimum prices cover 81% of the
expected income from offshore wind farms over the next five years. The remaining price exposure concerns sales of power at market price in the UK and Denmark.
OnshoreEarnings from the generation of power from our onshore wind farms in the US comprise tax incentives, such as PTCs or ITCs and power. The tax incentives have a fixed value. But there is a price risk associated with the power which is reduced by entering into PPAs. The current PPAs cover approx. 78% of the expected generation, spanning 12-15 years from the commissioning of the wind farm. The PPAs are entered into with large corporates or financial institutions.
BioenergyOur CHP plant portfolio consists of biomass- and coal-fired plants in Denmark and a Renescience plant in the UK. The CHP plants generate both heat and power. Concurrently with the biomass conversion of our CHP plants, a larger share of our earnings will be coming from our heat generation. Heat generation does not give rise to price risk as the associated costs are covered by the heat customers. However, heat generation often entails a price risk for power, as heat and power to a large extend are generated simultaneously.
The profitability of power generation is deter-mined by the difference between the selling price of power and the purchase price of fuel and carbon emissions allowances. For our coal-based power generation, we secure profitability by selling power and buying fuel and carbon emissions allowances, while for biomass-based power generation, we secure profitability by
buying biomass at fixed prices and hedging the associated power generation. At the end of 2018, 52% of the power generation expected in 2019 from our power stations was hedged. The total net risk associated with the power stations' power generation for the 2019-2023 period is DKK 1.6 billion after hedging.
Customer SolutionsOur price risk in Customer Solutions arises from the purchase and sale of power and gas. The price risks associated with the purchase and sale of gas result from differences in the indexing of sales and purchase prices. Our largest gas purchase contracts include the option of renegotiating the contract price if it no longer reflects market conditions. We have completed most of these renegotia-tions in recent years; as a result, the contract prices have largely been indexed to pure gas prices and not to oil prices, as was previously the case. We are therefore less sensitive to differences in the oil and gas price develop-ment than before. Going forward, our oil price risk may rise again, as we conclude new LNG purchase agreements, which are typically oil-indexed. The price risks associated with power purchases and sales are given by the difference between the purchase and sales prices. The price risk relates primarily to timing differences between purchases and sales and the related hedges and is therefore considered to be limited.
The table shows the exposure from Offshore's gener-ation of power before and after hedges.
-1.5-1.0
0.6
The table shows the time of the transfer of the value of hedging contracts in business performance EBITDA for both business performance and IFRS hedges together with deferred revenue from US power purchase agreements; see note 1.6 'Business performance'.
Expected value for recognition in business performance EBITDA, DKKbn
Power Gas
Inflation Oil
Currency US PPA
Principles for estimating exposures
Exposure is calculated as the expected production (or net purchase/sale) times the forward price for the respective years. In addition, the exposure is deter-mined on the basis of the expected exposure after renegotiations of oil-indexed gas purchase contracts.
Offshore's power price exposure, DKKbn
Before hedging After hedging
3.2
0.3
3.6
0.2
3.2
0.7
4.0
2.32.7
2.4
Ørsted Annual report 2018 Financial statements Consolidated financial statements – 7. Risk management
148 / 193
Note summary Contents

2018 2017
Energy hedgingCurrency and interest
rate hedging Energy hedgingCurrency and interest
rate hedging
NoteOverview of the Group's derivative positions, DKKm
Contractu-al principal
amountMarket
value
Contractu-al principal
amountMarket
value
Contractu-al principal
amountMarket
value
Contractu-al principal
amountMarket
value
Recognised with EBITDA impact
1.6, 7.2 Economic hedging 27,927 (3,806) 29,684 712 21,396 (940) 25,303 592
7.2 Hedging of cash flows, currency - - 12,434 22 - - 23,588 678
7.3 Trading portfolio 6,509 313 - - 8,720 118 - -
Total 34,436 (3,493) 42,118 734 30,116 (822) 48,891 1,270
Recognised in financial income and expenses
7.2 Hedging of fair value, currency - - 10,388 (761) - - 18,178 (716)
7.2 Hedging of cash flows, inflation - - 15,547 (69) - - - -
7.2 Hedging of cash flows, interest - - 1,602 56 - - - -
7.2 Hedging of cash flows, currency - - 2,721 (272) - - 2,739 (365)
Other interest derivatives - - 6,588 (39) - - 550 -
Other currency derivatives - - 3,798 436 - - 3,923 605
Total - - 40,644 (649) - - 25,390 (476)
Recognised in other comprehensive income
7.2 Hedging of net investments - - 27,839 888 - - 29,686 476
Total - - 27,839 888 - - 29,686 476
Total continuing operations 34,436 (3,493) 110,601 973 30,116 (822) 103,967 1,270
Recognised in discontinued operations
7.2 Hedging of fair value, currency - - 2,285 (106) - - 2,480 48
Total discontinued operations - - 2,285 (106) - - 2,480 48
Total 34,436 (3,493) 112,886 867 30,116 (822) 106,447 1,318
The table shows the Group's derivatives and commercial contracts according to the type of accounting treatment and the items affected. The accounting treatment and classification of hedging contracts depend on the purpose of the hedging: – Economic hedging comprises hedging of energy-related risks and related currency risks. These hedging contracts are treated as hedge accoun ting in accordance with the business performance principle (see note 1.6 'Business performance' for a detailed description), whereby the value adjustment (loss/gain) is deferred and only recognised during the period in which the hedged transaction materialises. Under IFRS, the value adjustment of this type of hedging is recognised directly in the income statement.
– Hedging of cash flows concerning interest rates, inflation and currencies comprises hedging of future in terest payments and currency risks on future income. When hedging cash flows, the effec-tive portion of the market value is temporarily recognised in equity until the hedged transaction materialises.
– Hedging of the market value of securities or currencies comprises hedging of recognised assets or liabilities. By hedging the market value, the effective portion of the market value is recognised in profit (loss) for the year together with changes in the market value of the hedged asset or the hedged liability.
– Hedging of net investments comprises hedging of the currency risk associated with investments in assets located in foreign countries. By hedging net investments, the effective portion of the market value is recognised in equity until the hedged net investment is divested.
– The trading portfolio and other interest and currency derivatives are recognised at market value in the income statement.
Note 1.1 'Significant changes in the currentreporting period' provides further details on economic hedging, including information about the underlying products traded.
Ørsted Annual report 2018 Financial statements Consolidated financial statements – 7. Risk management
149 / 193
Note summary Contents

Hedge accounting2018, DKKm
Contractual principal amount
Maturity analysis Market value Recognised in comprehen-sive income
Expected transfers to income statement
2019 2020 After 2020 Asset Liability 2019 2020 After 2020
Hedging of cash flows Revenue (USD) 1,152 214 935 3 - (55) (55) (11) (42) (2) Divestments (GBP) 11,282 10,733 549 - 113 (36) (51) (49) (2) - Interest payments (GBP) 2,721 543 543 1,635 - (272) (187) (99) (65) (23) Interest payments (fixed) 1,602 18 24 1,560 56 - (193) (41) (38) (114) Revenue (UK inflation) 15,547 - - 15,547 34 (103) (69) - - (69)Hedging of fair value GBP (sell position) 5,911 (4,481) - 10,392 60 (832) EUR (sell position) 4,477 - - 4,477 11 - USD (buy position) 2,285 1,306 979 - - (106)Hedging of net investment GBP 23,281 2,879 428 19,974 1,075 (178) EUR 4,477 - - 4,477 2 (13) USD 81 - - 81 21 (19)
2017, DKKm 2018 2019 After 2019 2018 2019 After 2019
Hedging of cash flows Revenue (USD) 1,316 136 132 1,048 27 (14) 13 1 1 11 Divestments (GBP) 22,272 10,143 11,575 554 819 (154) 385 344 41 - Interest payments (fixed) - - - - - - (234) (41) (41) (152) Interest payments (GBP) 2,739 548 548 1,643 - (365) (365) (105) (102) (158)Hedging of fair value EUR 9,391 4,924 - 4,467 3 (1) GBP 8,787 - - 8,787 - (718) USD 2,480 310 1,240 930 48 -Hedging of net investment GBP 23,868 10,563 2,602 10,703 1,381 (906) EUR 5,668 1,201 - 4,467 2 (2) USD 150 - - 150 1 -
7.2 Hedge accounting and economic hedging
Cash flow hedgingWe have entered into forward exchange con-tracts for the purpose of hedging the currency risk associated with the construction of offshore wind farms which are expected to be divested.
Ineffectiveness of currency hedging totalled DKK 0 million (2017: DKK 0 million). Forward exchange contracts have also been concluded for the purpose of hedging the currency risk as-sociated with interest payments on loans in GBP.
Accounting policies
We primarily use hedge accounting for currency and interest where it is possible to use hedging instruments which hedge the desired risk one-to-one. The GBP exposure, for example, is hedged using GBP forward exchange contracts, GBP swaps or GBP loans. There are thus no significant sources of ineffective-ness. For currency swaps, the basic spread is account-ed for according to the cost of the hedging model.
To the extent that a risk needs to be hedged, and if there is no fully effective instrument available in the market, analyses are performed of the expected effectiveness of the hedging instrument before the hedging transaction is concluded. In this case, the ratio between the hedged risk and the hedging instrument may deviate from the one-to-one prin-ciple and will be determined as the ratio which most effectively hedges the desired risk.
We recognise changes to the market value of hedging instruments that qualify for recognition as a hedge of future cash flows in other comprehensive income in the hedging reserve. On realisation of the hedged cash flow, the resulting gains or losses are transferred from equity and recognised in the same item as the hedged item. However, on hedging of proceeds from future loans, the resulting gain or loss is transferred from equity over the term of the loan.
When we conclude a hedging transaction, and each time we present financial statements thereafter, we assess whether the hedged exposure and the hedging instrument are still financially correlated. If the hedged cash flows are no longer expected to be realised, the accumulated value change is trans-ferred to profit (loss) for the year.
Changes in the market value of derivatives that are classified as hedges of the fair value of a recognised asset or liability are recognised in profit (loss) for the year together with changes in the value of the hedged asset or liability to the extent of the hedged risk.
All hedges take place using an instrument with the same price risk as the exposure. The GBP
exposure, for example, is hedged using GBP derivatives or GBP loans. Therefore, the hedging
ratio for all IFRS hedges is one-to-one.
Ørsted Annual report 2018 Financial statements Consolidated financial statements – 7. Risk management
150 / 193
Note summary Contents
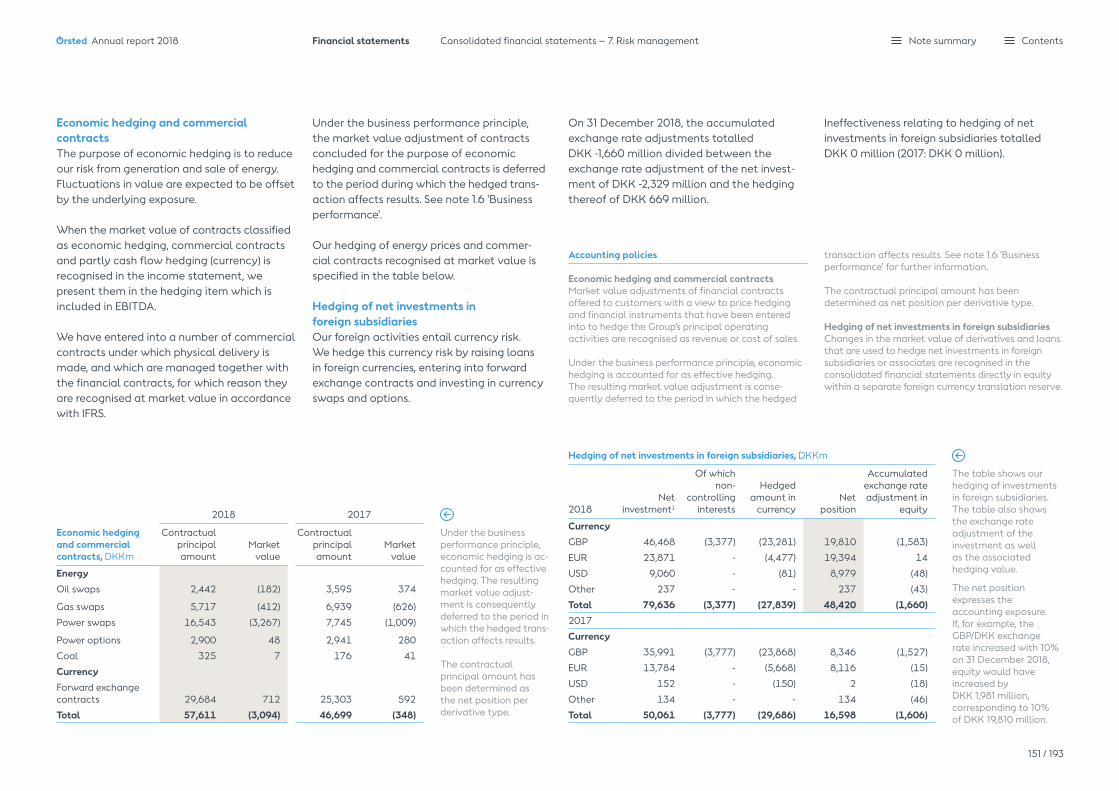
Economic hedging and commercial contractsThe purpose of economic hedging is to reduce our risk from generation and sale of energy. Fluctuations in value are expected to be offset by the underlying exposure.
When the market value of contracts classified as economic hedging, commercial contracts and partly cash flow hedging (currency) is recognised in the income statement, we present them in the hedging item which is included in EBITDA.
We have entered into a number of commercial contracts under which physical delivery is made, and which are managed together with the financial contracts, for which reason they are recognised at market value in accordance with IFRS.
Economic hedging and commercial contracts, DKKm
2018 2017
Contractualprincipal amount
Marketvalue
Contractualprincipal amount
Marketvalue
Energy Oil swaps 2,442 (182) 3,595 374
Gas swaps 5,717 (412) 6,939 (626)
Power swaps 16,543 (3,267) 7,745 (1,009)
Power options 2,900 48 2,941 280
Coal 325 7 176 41
CurrencyForward exchange contracts 29,684 712 25,303 592
Total 57,611 (3,094) 46,699 (348)
Under the business performance principle, economic hedging is ac-counted for as effective hedging. The resulting market value adjust-ment is consequently deferred to the period in which the hedged trans-action affects results.
The contractual principal amount has been determined as the net position per derivative type.
Hedging of net investments in foreign subsidiaries, DKKm
2018 Net
investment1
Of which non-
controlling interests
Hedged amount in
currencyNet
position
Accumulated exchange rate adjustment in
equity
CurrencyGBP 46,468 (3,377) (23,281) 19,810 (1,583)
EUR 23,871 - (4,477) 19,394 14
USD 9,060 - (81) 8,979 (48)
Other 237 - - 237 (43)
Total 79,636 (3,377) (27,839) 48,420 (1,660)2017
CurrencyGBP 35,991 (3,777) (23,868) 8,346 (1,527)
EUR 13,784 - (5,668) 8,116 (15)
USD 152 - (150) 2 (18)
Other 134 - - 134 (46)
Total 50,061 (3,777) (29,686) 16,598 (1,606)
The table shows our hedging of investments in foreign subsidiaries. The table also shows the exchange rate adjustment of the investment as well as the associated hedging value.
The net position expresses the accounting exposure. If, for example, theGBP/DKK exchange rate increased with 10% on 31 December 2018, equity would have increased by DKK 1,981 million, corresponding to 10% of DKK 19,810 million.
Under the business performance principle, the market value adjustment of contracts concluded for the purpose of economic hedging and commercial contracts is deferred to the period during which the hedged trans-action affects results. See note 1.6 'Business performance'.
Our hedging of energy prices and commer-cial contracts recognised at market value is specified in the table below.
Hedging of net investments in foreign subsidiariesOur foreign activities entail currency risk. We hedge this currency risk by raising loans in foreign currencies, entering into forward exchange contracts and investing in currency swaps and options.
On 31 December 2018, the accumulated exchange rate adjustments totalledDKK -1,660 million divided between the exchange rate adjustment of the net invest-ment of DKK -2,329 million and the hedging thereof of DKK 669 million.
Accounting policies
Economic hedging and commercial contracts Market value adjustments of financial contracts offered to customers with a view to price hedging and financial instruments that have been entered into to hedge the Group's principal operatingactivities are recognised as revenue or cost of sales.
Under the business performance principle, economic hedging is accounted for as effective hedging. The resulting market value adjustment is conse-quently deferred to the period in which the hedged
transaction affects results. See note 1.6 'Business performance' for further information.
The contractual principal amount has beendetermined as net position per derivative type.
Hedging of net investments in foreign subsidiariesChanges in the market value of derivatives and loans that are used to hedge net investments in foreignsubsidiaries or associates are recognised in the consolidated financial statements directly in equity within a separate foreign currency translation reserve.
Ineffectiveness relating to hedging of net investments in foreign subsidiaries totalled DKK 0 million (2017: DKK 0 million).
Ørsted Annual report 2018 Financial statements Consolidated financial statements – 7. Risk management
151 / 193
Note summary Contents
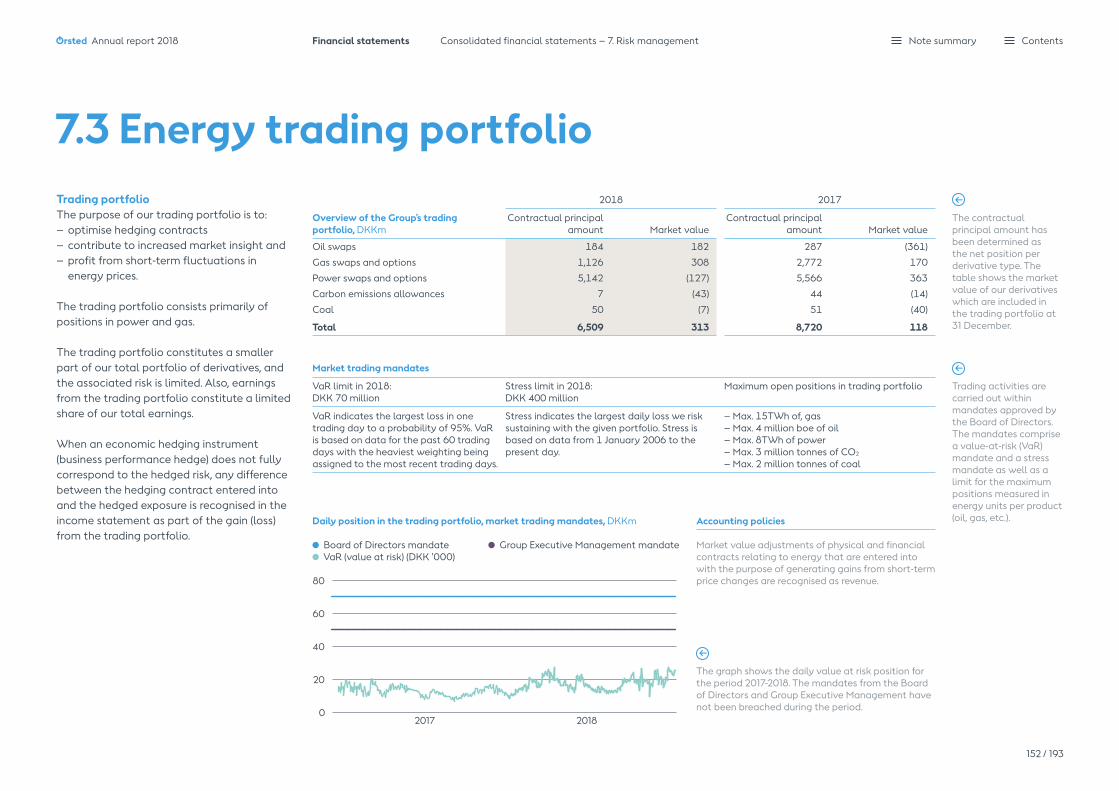
0
20
40
60
80
2017 2018
Trading portfolioThe purpose of our trading portfolio is to: – optimise hedging contracts– contribute to increased market insight and– profit from short-term fluctuations in
energy prices.
The trading portfolio consists primarily of positions in power and gas.
The trading portfolio constitutes a smaller part of our total portfolio of derivatives, and the associated risk is limited. Also, earnings from the trading portfolio constitute a limited share of our total earnings.
When an economic hedging instrument (business performance hedge) does not fully correspond to the hedged risk, any difference between the hedging contract entered into and the hedged exposure is recognised in the income statement as part of the gain (loss) from the trading portfolio.
Overview of the Group's trading portfolio, DKKm
2018 2017
Contractual principal amount Market value
Contractual principal amount Market value
Oil swaps 184 182 287 (361)
Gas swaps and options 1,126 308 2,772 170
Power swaps and options 5,142 (127) 5,566 363
Carbon emissions allowances 7 (43) 44 (14)
Coal 50 (7) 51 (40)
Total 6,509 313 8,720 118
Market trading mandates
VaR limit in 2018: DKK 70 million
Stress limit in 2018: DKK 400 million
Maximum open positions in trading portfolio
VaR indicates the largest loss in one trading day to a probability of 95%. VaR is based on data for the past 60 trading days with the heaviest weighting being assigned to the most recent trading days.
Stress indicates the largest daily loss we risk sustaining with the given portfolio. Stress is based on data from 1 January 2006 to the present day.
– Max. 15TWh of, gas– Max. 4 million boe of oil– Max. 8TWh of power– Max. 3 million tonnes of CO2
– Max. 2 million tonnes of coal
7.3 Energy trading portfolio
Accounting policies
Market value adjustments of physical and financial contracts relating to energy that are entered into with the purpose of generating gains from short-term price changes are recognised as revenue.
Daily position in the trading portfolio, market trading mandates, DKKm
Board of Directors mandate Group Executive Management mandate VaR (value at risk) (DKK '000)
The contractual principal amount has been determined as the net position per derivative type. The table shows the market value of our derivatives which are included in the trading portfolio at 31 December.
Trading activities are carried out within mandates approved by the Board of Directors. The mandates comprise a value-at-risk (VaR) mandate and a stress mandate as well as a limit for the maximum positions measured in energy units per product (oil, gas, etc.).
The graph shows the daily value at risk position for the period 2017-2018. The mandates from the Board of Directors and Group Executive Management have not been breached during the period.
Ørsted Annual report 2018 Financial statements Consolidated financial statements – 7. Risk management
152 / 193
Note summary Contents
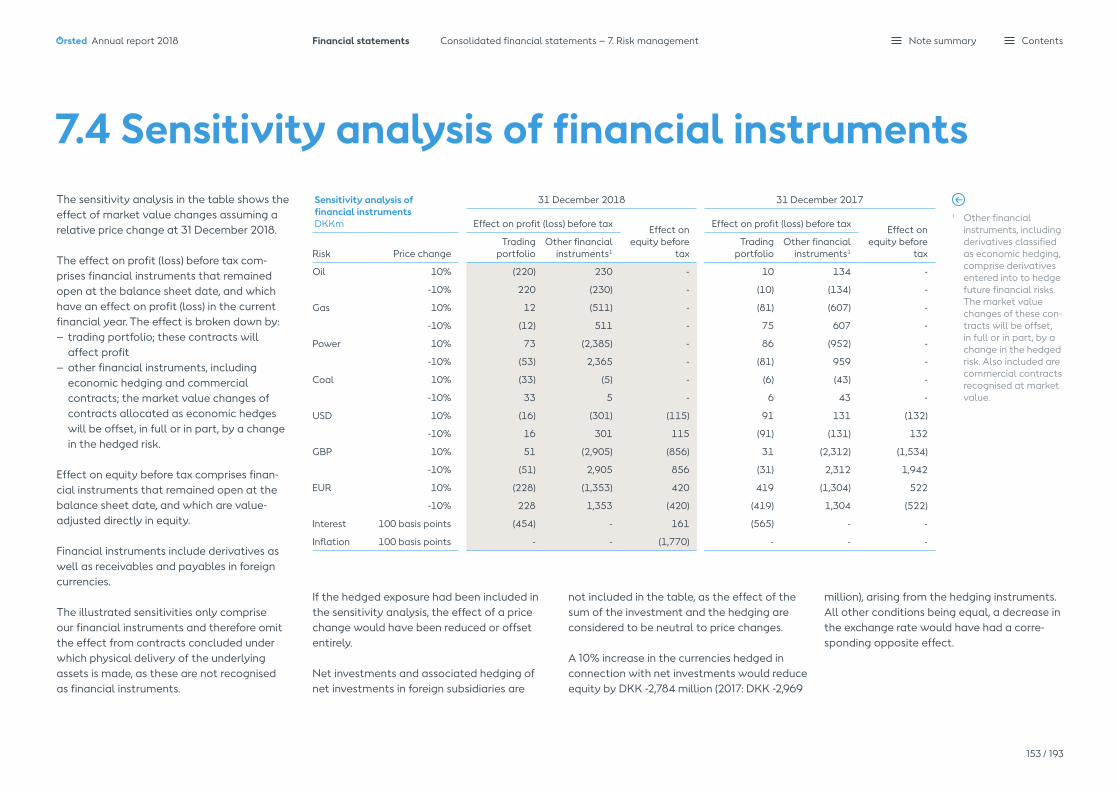
7.4 Sensitivity analysis of financial instruments Sensitivity analysis of financial instruments DKKm
31 December 2018 31 December 2017
Effect on profit (loss) before tax Effect on equity before
tax
Effect on profit (loss) before tax Effect on equity before
taxRisk Price changeTrading
portfolioOther financial
instruments1Trading
portfolioOther financial
instruments1
Oil 10% (220) 230 - 10 134 -
-10% 220 (230) - (10) (134) -
Gas 10% 12 (511) - (81) (607) -
-10% (12) 511 - 75 607 -
Power 10% 73 (2,385) - 86 (952) -
-10% (53) 2,365 - (81) 959 -
Coal 10% (33) (5) - (6) (43) -
-10% 33 5 - 6 43 -
USD 10% (16) (301) (115) 91 131 (132)
-10% 16 301 115 (91) (131) 132
GBP 10% 51 (2,905) (856) 31 (2,312) (1,534)
-10% (51) 2,905 856 (31) 2,312 1,942
EUR 10% (228) (1,353) 420 419 (1,304) 522
-10% 228 1,353 (420) (419) 1,304 (522)
Interest 100 basis points (454) - 161 (565) - -
Inflation 100 basis points - - (1,770) - - -
The sensitivity analysis in the table shows the effect of market value changes assuming a relative price change at 31 December 2018.
The effect on profit (loss) before tax com-prises financial instruments that remained open at the balance sheet date, and which have an effect on profit (loss) in the current financial year. The effect is broken down by:– trading portfolio; these contracts will
affect profit– other financial instruments, including
economic hedging and commercial contracts; the market value changes of contracts allocated as economic hedges will be offset, in full or in part, by a change in the hedged risk.
Effect on equity before tax comprises finan-cial instruments that remained open at the balance sheet date, and which are value- adjusted directly in equity.
Financial instruments include derivatives as well as receivables and payables in foreign currencies.
The illustrated sensitivities only comprise our financial instruments and therefore omit the effect from contracts concluded under which physical delivery of the underlying assets is made, as these are not recognised as financial instruments.
If the hedged exposure had been included in the sensitivity analysis, the effect of a price change would have been reduced or offset entirely.
Net investments and associated hedging of net investments in foreign subsidiaries are
not included in the table, as the effect of the sum of the investment and the hedging are considered to be neutral to price changes.
A 10% increase in the currencies hedged in connection with net investments would reduce equity by DKK -2,784 million (2017: DKK -2,969
million), arising from the hedging instruments. All other conditions being equal, a decrease in the exchange rate would have had a corre-sponding opposite effect.
1 Other financial instruments, including derivatives classified as economic hedging, comprise derivatives entered into to hedge future financial risks. The market value changes of these con-tracts will be offset, in full or in part, by a change in the hedged risk. Also included are commercial contracts recognised at market value.
Ørsted Annual report 2018 Financial statements Consolidated financial statements – 7. Risk management
153 / 193
Note summary Contents

Credit quality of the Group's counterparties, DKKm 2018 2017
AAA/Aaa 20,949 23,329
AA/Aa 3,078 5,197
A/A 6,428 4,969
BBB/Baa 3,817 1,712
Non-rated 11,638 11,072
Total credit exposure 45,910 46,279
Offsetting of financial assets, DKKm DerivativesTrade
receivables 2018 DerivativesTrade
receivables 2017
Financial assets 12,173 23,173 35,346 9,743 33,270 43,013
Financial liabilities, offset (7,435) (20,060) (27,495) (5,000) (29,480) (34,480)
Financial assets in the balance sheet 4,738 3,113 7,851 4,743 3,790 8,533Amounts not offset in the balance sheet:
Liabilities with set-off rights (1,485) - (1,485) (1,611) - (1,611)
Collateral received in the form of bonds (614) - (614) (787) - (787)
Net 2,639 3,113 5,752 2,345 3,790 6,135
The table shows the credit quality of our counter-parties, distributed by category. In addition, we have receivables and construction agreements related to the construction of offshore wind farms amounting to DKK 6,951 million (2017: DKK 13.349 million) where we have collateral in the offshore wind farm under construction.
We are exposed to credit risks from our trading partners and customers. A large part of our counterparty risks concerns major international energy companies and banks. Such trading is regulated under standard agreements, such as EFET and ISDA agree-ments, which feature, for instance, credit rating and netting provisions. Our credit exposure is mainly concentrated on counterparties in Denmark, the UK, Germany and Sweden.
We limit our credit risks by:– systematically rating significant
counterparties– granting credit limits or– demanding that collateral be furnished
or credit insurance put in place.
The counterparties and credit limits granted are monitored on an ongoing basis. The monitoring is based on the framework established by our Board of Directors and Group Executive Management. For the most significant counterparties, an internal credit rating is required to determine the internal rating and the granting of credit limits. The rating is based on information from external credit rating agencies, publicly available information and own analyses.
7.5 Credit risks
Offsetting of financial liabilities, DKKm DerivativesTrade
payables 2018 DerivativesTrade
payables 2017
Financial liabilities 13,410 23,085 36,495 8,700 32,327 41,027
Financial assets, offset (7,435) (20,060) (27,495) (5,000) (29,480) (34,480)
Financial liabilities in the balance sheet 5,975 3,025 9,000 3,700 2,847 6,547Amounts not offset in the balance sheet:
Assets with set-off rights (1,485) - (1,485) (1,611) - (1,611)
Collateral provided in the form of bonds (713) - (713) (40) - (40)
Net 3,777 3,025 6,802 2,049 2,847 4,896
The table shows our financial assets and liabilities where a share is offset and is therefore presented net. Offset-ting is typically limited within specific products.
We suffered no losses from any single major counterparty in 2018 or 2017.
The credit risk from our financial assets prima rily concerns derivatives, cash and bond port folios as well as receivables. The assessment is based on the individual counterparty's ratings with Standard & Poor's, Moody's and Fitch. The figures do not reflect our actual credit exposure as the positions are calculated before offsetting our debt to such counterparties.
The AAA/Aaa category covers our position in Danish AAA-rated government and mortgage bonds. The non-rated category primarily consists of trade receivables from customers, such as end-users.
Accounting policies
We only offset positive and negative values if we are entitled to and intend to settle several financial instruments net.
Ørsted Annual report 2018 Financial statements Consolidated financial statements – 7. Risk management
154 / 193
Note summary Contents

Categories of financial instruments, DKKm 2018 2017
Energy and currency derivatives 4,096 2,589
Securities 25,501 25,280
Financial assets measured at fair value via the income statement 29,597 27,869
Interest and inflation derivatives 90 -
Currency derivatives 1,282 2,281
Derivatives (assets) used as hedging instruments 1,372 2,281
Trade receivables 10,741 9,170
Other accounts receivable 8,896 8,812
Financial assets measured at amortised cost 19,637 17,982
Energy and currency derivatives 6,480 2,214
Financial liabilities measured at fair value via the income statement 6,480 2,214
Interest and inflation derivatives 103 -
Currency derivatives 1,511 2,160
Derivatives (liabilities) used as hedging instruments 1,614 2,160
Bank loans and issued bonds 27,296 29,636
Trade payables 13,082 11,499
Other accounts payable 3,207 2,767
Financial liabilities measured at amortised cost 43,585 43,902
Financial instruments are used for various purposes. The purpose determines the category, and whether the value adjustment of the instrument should be recognised in the profit (loss) for the year or as part of the hedging reserve in equity.
The fair value of financial instruments measured at amortised cost is identical to the carrying amount with the excep-tion of bank loans and issued bonds where the market value is stated in note 6.1 ' Interest-bearing debt'.
7.6 Categories of financial instruments
The table shows our financial instruments divided into categories. The categories indicate how the financial instru-ments are recognised in the financial statement.
Ørsted Annual report 2018 Financial statements Consolidated financial statements – 7. Risk management
155 / 193
Note summary Contents
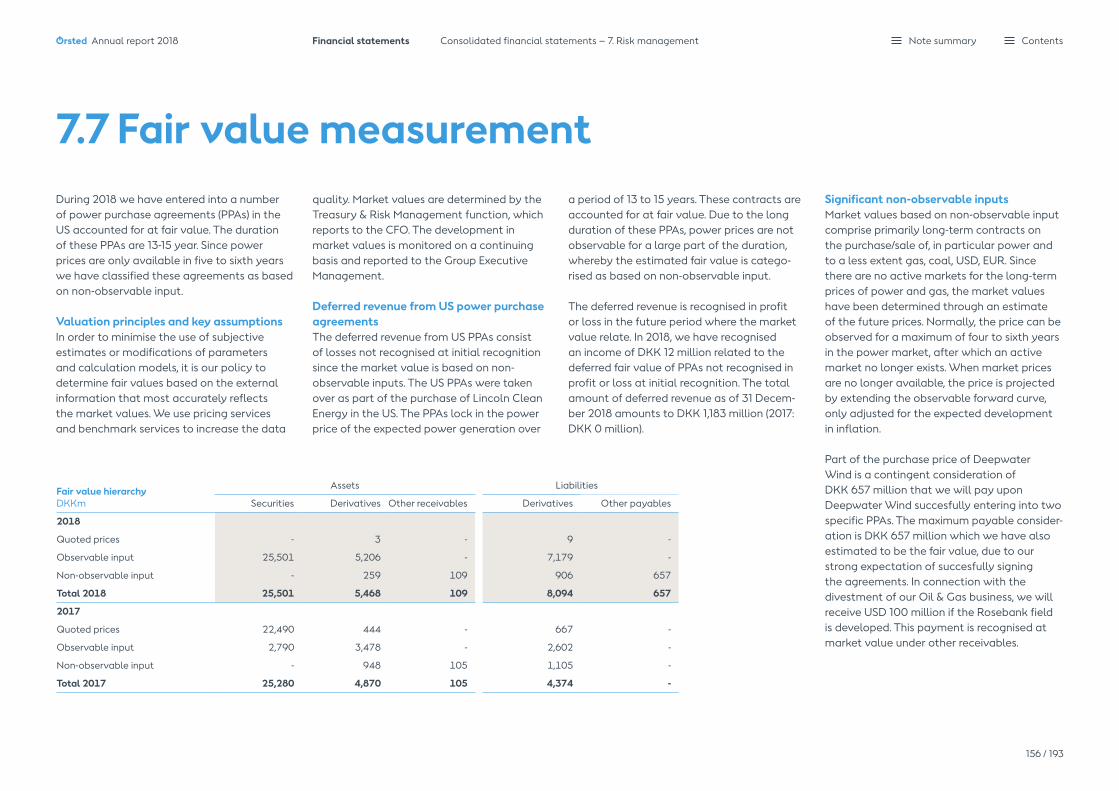
Significant non-observable inputs Market values based on non-observable input comprise primarily long-term contracts on the purchase/sale of, in particular power and to a less extent gas, coal, USD, EUR. Since there are no active markets for the long-term prices of power and gas, the market values have been determined through an estimate of the future prices. Normally, the price can be observed for a maximum of four to sixth years in the power market, after which an active market no longer exists. When market prices are no longer available, the price is projected by extending the observable forward curve, only adjusted for the expected development in inflation.
Part of the purchase price of DeepwaterWind is a contingent consideration ofDKK 657 million that we will pay upon Deepwater Wind succesfully entering into two specific PPAs. The maximum payable consider-ation is DKK 657 million which we have alsoestimated to be the fair value, due to our strong expectation of succesfully signing the agreements. In connection with the divestment of our Oil & Gas business, we will receive USD 100 million if the Rosebank field is developed. This payment is recognised at market value under other receivables.
7.7 Fair value measurement
Fair value hierarchy DKKm
Assets Liabilities
Securities Derivatives Other receivables Derivatives Other payables
2018
Quoted prices - 3 - 9 -
Observable input 25,501 5,206 - 7,179 -
Non-observable input - 259 109 906 657
Total 2018 25,501 5,468 109 8,094 657
2017
Quoted prices 22,490 444 - 667 -
Observable input 2,790 3,478 - 2,602 -
Non-observable input - 948 105 1,105 -
Total 2017 25,280 4,870 105 4,374 -
a period of 13 to 15 years. These contracts are accounted for at fair value. Due to the long duration of these PPAs, power prices are not observable for a large part of the duration, whereby the estimated fair value is catego-rised as based on non-observable input.
The deferred revenue is recognised in profit or loss in the future period where the market value relate. In 2018, we have recognised an income of DKK 12 million related to the deferred fair value of PPAs not recognised in profit or loss at initial recognition. The total amount of deferred revenue as of 31 Decem-ber 2018 amounts to DKK 1,183 million (2017: DKK 0 million).
During 2018 we have entered into a number of power purchase agreements (PPAs) in the US accounted for at fair value. The duration of these PPAs are 13-15 year. Since power prices are only available in five to sixth years we have classified these agreements as based on non-observable input.
Valuation principles and key assumptionsIn order to minimise the use of subjectiveestimates or modifications of parameters and calculation models, it is our policy to determine fair values based on the external information that most accurately reflects the market values. We use pricing services and benchmark services to increase the data
quality. Market values are determined by the Treasury & Risk Management function, which reports to the CFO. The development inmarket values is monitored on a continuing basis and reported to the Group Executive Management.
Deferred revenue from US power purchase agreementsThe deferred revenue from US PPAs consist of losses not recognised at initial recognition since the market value is based on non-observable inputs. The US PPAs were taken over as part of the purchase of Lincoln Clean Energy in the US. The PPAs lock in the power price of the expected power generation over
Ørsted Annual report 2018 Financial statements Consolidated financial statements – 7. Risk management
156 / 193
Note summary Contents

102030405060708090
100
Non-observable inputs per commodity price input, DKKm 2018 2017
US power prices (2,533) -
Other power prices (52) (157)
Gas prices 127 -
Total (2,458) (157)
Sensitivity of non-observable inputs, DKKm Sensitivity
Non-observable inputs Market value +10% -10%
ERCOT North real time, 2024-2033 (194) (105) 105
ERCOT North day ahead, 2024-2033 (388) (275) 275
ERCOT West day ahead, 2023-2033 (90) (33) 33
ERCOT West real time, 2025-2033 (132) (34) 34
SPP North real time, 2023-2033 (288) (68) 68
Total (1,092) (515) 515
US power prices are the most significant non-observable input. The non-observable US power prices used asbasis for the marketvalues as of 31 Decem-ber 2018 are illustrated in the graph below.
The table shows the market value related to the non-observable input for the stated period and sensitivity per power price index. The sensitivity illustrates the impact on the market value as of 31 December 2018 if the non-observable price increases/decreases by 10%. The most critical non-observable input is US power prices in the period 2023-2033. If power prices as of 31 December 2018 increased/decreased by 10%, the market value would decrease/increase by DKK 515 million. The sensitivity analysis is presented on the different US power price areas in the tabel above.
The graph shows the US power prices in the period where prices are not observable, and which we have used as basis for calculating market value as of 31 December 2018.
Derivatives valued on the basis of non-observable input, DKKm 2018
Market value at 1 January (157)
Value adjustments through profit or loss 61
Sales/redemptions 580
Purchases/issues (1,814)
Additions due to acquisitions of enterprises (1,184)
Transferred from quoted prices and observable input (344)
Transferred to quoted prices and observable input 400
Market value at 31 December before deferred gain/loss (2,458)
Deferred loss at initial recognition 1,811
Market value at 31 December (647)
The table shows the movements during the year in the total market value (assets and liabilities) of derivatives valued on the basis of non-observable inputs.
2017
Market value at 1 January (157)
Net changes in market value -
Market value at 31 December (157)
Non-observable inputs, US power prices
SPP North RT Ercot North RT Ercot West DA Ercot West RT Ercot North DA
Accounting policies
Market values based on quoted prices comprise quoted securities and derivatives that are traded in active markets. The market value of derivatives traded in an active market are often settled on a daily basis, thereby minimising the market value presented on the balance sheet.
Market values based on observable inputs comprise derivatives where valuation models with observable inputs are used to measure fair value.
All assets and liabilities measured at market value are measured on a recurring basis.
In business combinations, gain (loss) at initial recognition on derivatives whose values are based on non-observable inputs are deferred and recog-nised in the period to which the value relate.
01/
01/
23
01/
01/
24
01/
01/
25
01/
01/
26
01/
01/
27
01/
01/
28
01/
01/
29
01/
01/
30
01/
01/
31
01/
01/
32
01/
01/
33
Ørsted Annual report 2018 Financial statements Consolidated financial statements – 7. Risk management
157 / 193
Note summary Contents
8. Other notes
Related-party transactions 159Operating lease obligations 160Auditor's fees 161Contractual obligations 161Company overview 162
Ørsted Annual report 2018 Note summary Contents
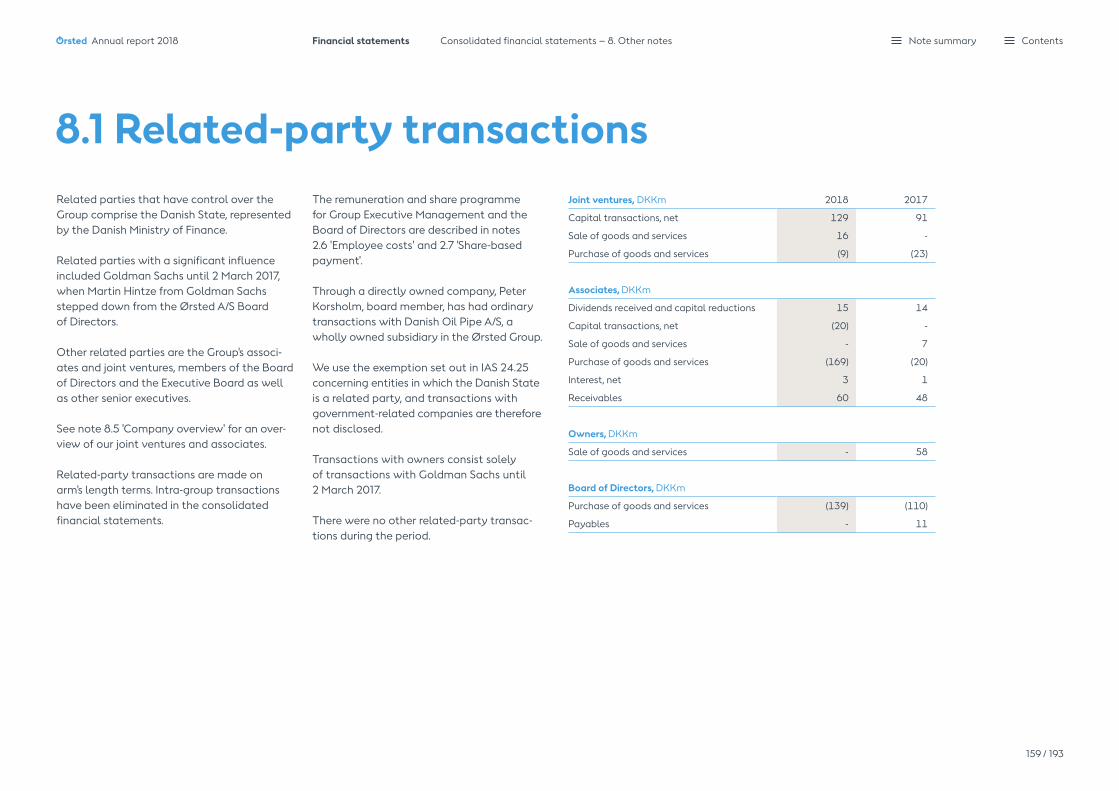
Joint ventures, DKKm 2018 2017
Capital transactions, net 129 91
Sale of goods and services 16 -
Purchase of goods and services (9) (23)
Associates, DKKm
Dividends received and capital reductions 15 14
Capital transactions, net (20) -
Sale of goods and services - 7
Purchase of goods and services (169) (20)
Interest, net 3 1
Receivables 60 48
Owners, DKKm
Sale of goods and services - 58
Board of Directors, DKKm
Purchase of goods and services (139) (110)
Payables - 11
Related parties that have control over the Group comprise the Danish State, represented by the Danish Ministry of Finance.
Related parties with a significant influence included Goldman Sachs until 2 March 2017, when Martin Hintze from Goldman Sachs stepped down from the Ørsted A/S Board of Directors.
Other related parties are the Group's associ-ates and joint ventures, members of the Board of Directors and the Executive Board as well as other senior executives.
See note 8.5 'Company overview' for an over-view of our joint ventures and associates.
Related-party transactions are made on arm's length terms. Intra-group transactions have been eliminated in the consolidated financial statements.
8.1 Related-party transactionsThe remuneration and share programme for Group Executive Management and the Board of Directors are described in notes 2.6 ' Employee costs' and 2.7 'Share-based payment'.
Through a directly owned company, Peter Korsholm, board member, has had ordin ary transactions with Danish Oil Pipe A/S, a wholly owned subsidiary in the Ørsted Group.
We use the exemption set out in IAS 24.25 concerning entities in which the Danish State is a related party, and transactions with government-related companies are therefore not disclosed.
Transactions with owners consist solely of transactions with Goldman Sachs until 2 March 2017.
There were no other related-party transac-tions during the period.
Ørsted Annual report 2018 Financial statements Consolidated financial statements – 8. Other notes
159 / 193
Note summary Contents

Lease payments recognised in profit (loss) for the year amounted to DKK 778 million (2017: DKK 885 million).
For the purpose of calculating the FFO/ adjusted interest-bearing net debt credit metric, the present value and interest expenses of the lease obligations are calculated. The results and the discount rate are shown in the table with supplementary information for operating lease obligations.
We reduced the discount rate in 2017 due to the continued low interest rate environment.
Accounting policies
We recognise operating lease payments in profit (loss) for the year over the term of the lease on a straight-line basis. When using assets held under operating leases in respect of construction of off-shore wind farms or other assets, we recognise lease payments in the cost of the asset in step with the construction of the asset.
We will implement the new lease accounting rules in IFRS 16 'Leases' on 1 January 2019. See note 1.4 ' Implementation of new or changed accounting standards and interpretations'.
Operating lease obligations by segment 2018, DKKm
Offshore
Onshore Bioenergy
Customer Solutions
Other activities Total
0-1 year 737 15 9 159 198 1,118
1-3 years 584 31 13 159 409 1,196
3-5 years 363 31 14 161 399 968
5-10 years 731 75 36 20 1,007 1,869
10-15 years 726 79 39 0 280 1,124
After 15 years 748 284 62 0 38 1,132
Total 3,889 515 173 499 2,331 7,407
Present value 2,336 308 112 310 1,753 4,819
Operating lease obligations by segment 2017, DKKm
0-1 year 462 - 11 145 171 789
1-3 years 1,148 - 16 238 404 1,806
3-5 years 433 - 13 159 403 1,008
5-10 years 1,032 - 35 101 1,024 2,192
10-15 years 1,022 - 38 0 454 1,514
After 15 years 1,276 - 71 0 51 1,398
Total 5,373 - 184 643 2,507 8,707
Present value 3,638 - 117 453 1,887 6,095
Supplementary information to operating lease obligations, continuing operations, DKKm 2018 2017
Present value of lease payments 4,819 6,095
Lease payments recognised in profit (loss) for the year 778 885
Calculated interest expenses on lease obligations 196 234
Discount rate applied 3.5% 3.5%
Our total operating lease obligations decreased by DKK 1,300 million relative to last year. The decrease in the obligations is primarily due to the farm-down of the Hornsea 1 and run-off of existing leases. The acquisition of Lincoln Clean Energy (Onshore) and Deepwater Wind (Offshore) added DKK 635 milllion to the obligations (per 31 December 2018), which partly off-sets the first mentioned effects on the operating lease obligations.
Offshore's assets held under operating leases mainly comprise seabeds relating to the off-shore wind farms in the UK and service vessels.
Onshore's leases comprise plots of land relating to onshore wind farms.
Customer Solutions mainly lease gas storage facilities in Germany.
Leased assets recognised under 'Other activ i-ties' mainly comprise our two office premises in Gentofte and London. The premises are used by employees in most of our segments.
Seabed leases include variable lease pay-ments which depend on the number of mega-watt hours generated. However, we have typically agreed on minimum lease payments for the seabeds.
8.2 Operating lease obligations
The present value is calculated by discounting the individual obligations each year using our internal discount rate of 3.5% (2017: 3.5%).
Ørsted Annual report 2018 Financial statements Consolidated financial statements – 8. Other notes
160 / 193
Note summary Contents

Contractual obligations by segment, DKKm
Offshore
Onshore Bioenergy
Customer Solutions Total
0-1 year 13,258 1,957 417 546 16,178
1-5 years 5,555 854 18 - 6,427
2018 18,813 2,811 435 546 22,605
2017 31,485 - 890 1,121 33,496
At 31 December 2018, contractual obliga-tions in Offshore mainly related to offshore wind turbines, foundations and cables, etc., for the construction of offshore wind farms. The obligations in Onshore mainly related to purchases of onshore wind
8.4 Contractual obligations
turbines. In Bioenergy, the obligations mainly related to the biomass conversion of Asnæs Power Station, while the obligations of Customer Solutions related to the roll-out of smart meters.
Overview of concluded contracts where delivery
had not taken place at 31 December 2018.
In 2017, PwC provided advisory services totalling DKK 1.8 million concerning acquisi-tion and divestment activities, which are not included in our limit for the use of PwC for non-audit services.
Auditor's fees, DKKm 2018 2017
Audit and audit-related fees
Statutory audit 11 11
Other assurance engagements 2 2
Non-audit services
Tax and VAT advice 3 4
Other services 7 7
Total fees to PwC 23 24
Fee for non-audit services in percent of statutory audit fee 94% 100%
8.3 Auditor's fees
PwC is Ørsted's auditor appointed by the annual general meeting. PwC audits the consolidated financial statements of Ørsted and our subsidiaries' financial statements in all the countries where we are represented.
It is our policy that the annual fee for non- audit services provided by our statutory auditor cannot exceed the annual fee for statutory audit services measured at Group level. The cap may be exceeded subject to approval by the Audit and Risk Committee.
Other assurance engagements primarily included reviews of ESG data and reviews of regulatory financial statements.
Tax and VAT advice primarily included advice in connection with the divestment of assets and enterprises and advice in connection with the preparation of tax returns and the calculation of the income subject to Danish joint taxation.
Other services include other consultancy services from PwC, including advice in connec-tion with due diligence and the divestment of assets and enterprises.
Fees for services other than statutory audit supplied by PwC Denmark to Ørsted amounted to DKK 9 million (2017: DKK 8 million) and con-sisted of accounting and tax advice in connec-tion with both acquisition and divest ment of assets and enterprises, review of ESG data and other general accounting and tax advice.
Ørsted Annual report 2018 Financial statements Consolidated financial statements – 8. Other notes
161 / 193
Note summary Contents

8.5 Company overview
Segment/company/registered office Type1Ownership
interest
Parent company
Ørsted A/S, Fredericia, Denmark - -
Offshore
Anholt Havvindmøllepark I/S2,3, Fredericia, Denmark JO 50%
Barrow Offshore Wind Limited, London, UK S 100%
Bay State HoldCo LLC., Delaware, USA JO 50%
Bay State Wind LLC2., Delaware, USA JO 50%
Boreas B.V., Gravenhage, Netherlands S 100%
Borkum Riffgrund I Holding A/S, Fredericia, Denmark S 100%
Borkum Riffgrund I Offshore Windpark A/S GmbH & Co. oHG, Norden, Germany S 50%
Borkum Riffgrund 2 Holding GmbH, Hamburg, Germany S 100%
Borkum Riffgrund 2 Offshore Wind Farm GmbH & Co. oHG, Norden, Germany JO 50%
Borssele Wind Farm C.V., Gravenhage, Netherlands S 100%
Breesea Limited, London, UK S 100%
BSW Holdco LLC, Delaware, USA JO 50%
BSW Projectco LLC2, Delaware, USA JO 50%
Burbo Extension Holding Ltd, London, UK JO 50%
Burbo Extension Ltd 2, London, UK S 50%
Celtic Array Limited, Berkshire, UK JV 50%
Cerulea Limited, London, UK S 100%
CT Offshore A/S under frivillig likvidation, Fredericia, Denmark S 100%
Cygnus Wind Transmission Limited, London, UK S 100%
CH-SP Series 7-05 (C), LLC, Delaware, USA S 100%
CH-SP Series 13-05 (C), LLC, Delaware, USA S 100%
CH-SP Series 15-01 (C), LLC, Delaware, USA S 100%
CH-SP Series 17-01 (C), LLC, Delaware, USA S 100%
Deepwater Wind, LLC, Delaware, USA S 100%
Deepwater Wind Block Island Transmission, LLC, Delaware, USA S 100%
Segment/company/registered office Type1Ownership
interest
Deepwater Wind Block Island, LLC, Delaware, USA S 100%
Deepwater Wind Block Island Holdings, LLC5, Delaware, USA S 100%
Deepwater Wind Hudson Canyon, LLC, Delaware, USA S 100%
Deepwater Wind New England, LLC, Delaware, USA S 100%
Deepwater Wind New Jersey, LLC, Delaware, USA S 100%
Deepwater Wind New York, LLC, Delaware, USA S 100%
Deepwater Wind Operating, LLC, Delaware, USA S 100%
Deepwater Wind Rhode Island, LLC (taxed as corporation), Delaware, USA S 100%
Deepwater Wind South Fork, LLC, Delaware, USA S 100%
DWBI Class B member, LLC, Delaware, USA S 100%
DWW MARI Holdings, LLC, Delaware, USA S 100%
DWW Rev 1, LLC, Delaware, USA S 100%
Euros B.V., Gravenhage, Netherlands S 100%
Formosa I International Investment Co., Limited, Taipei City, Taiwan JV 35%
Formosa I Wind Power Co2., Ltd, Taipei City, Taiwan JV 35%
Garden State Offshore Energy, LLC, Delaware, USA JV 50%
Gode Wind 03 GmbH, Hamburg, Germany S 100%
Gode Wind 04 GmbH, Hamburg, Germany S 100%
Gode Wind 1 Offshore Wind Farm GmbH & Co. oHG, Norden, Germany JO 50%
Gode Wind 2 Offshore Wind Farm P/S GmbH & Co. oHG, Norden, Germany JO 50%
Gunfleet Sands Holding Ltd., London, UK S 50%
Gunfleet Sands II Limited2, London, UK S 50%
Gunfleet Sands Limited2, London, UK S 50%
GSOE I, LLC, Delaware, USA JV 50%
Horns Rev I Offshore Wind Farm, Fredericia, Denmark JO 40%
Hornsea 1 Holdings Limited, London, UK JO 50%
Hornsea 1 Limited2, London, UK JO 50%
Lincs Renewable Energy Holdings Limited, London, UK JO 50%
Ørsted Annual report 2018 Financial statements Consolidated financial statements – 8. Other notes
162 / 193
Note summary Contents

Segment/company/registered office Type1Ownership
interest
Lincs Wind Farm (Holding) Limited, London, UK JO 25%
Lincs Wind Farm Limited2, Aberdeen, UK JO 25%
London Array Limited, Kent, UK JO 25%
Morecambe Wind Limited, London, UK JO 50%
Njord Limited2, London, UK S 50%
Northeast Wind Energy LLC, Delaware , USA S 50%
Northern Energy OWP West GmbH, Hamburg, Germany S 100%
Notos B.V., Gravenhage, Netherlands S 100%
Nysted Havmøllepark I, Fredericia, Denmark JO 43%
Nysted I A/S, Fredericia, Denmark S 86%
Nördlicher Grund GmbH, Hamburg, Germany S 100%
Ocean Wind LLC, Delaware, USA S 100%
OFTRAC Limited, London, UK S 100%
Optimus Wind Limited, London, UK S 100%
Optimus Wind Transmission Limited, London, UK S 100%
Orsted Borkum Riffgrund I GmbH, Hamburg, Germany S 100%
Orsted Borkum Riffgrund I HoldCo GmbH, Hamburg, Germany S 100%
Orsted Borkum Riffgrund West I GmbH, Hamburg, Germany S 100%
Orsted Borkum Riffgrund West II GmbH, Hamburg, Germany S 100%
Orsted Borssele 1 B.V., 's-Gravenhage, Netherlands S 100%
Orsted Borssele Holding B.V., 's-Gravenhage, Netherlands S 100%
Orsted Burbo (UK) Limited, London, UK S 100%
Orsted Burbo Extension Holding Ltd, London, UK S 100%
Orsted Gode Wind 1 Holding GmbH, Hamburg, Germany S 100%
Orsted Gode Wind 2 GmbH, Hamburg, Germany S 100%
Orsted Gunfleet Sands Demo Ltd, London, UK S 100%
Orsted Hornsea 1 Holdings Limited S 100%
Orsted Hornsea Project Four Limited, London, UK S 100%
Orsted Hornsea Project Three (UK) Limited, London, UK S 100%
Orsted InvestCo Limited, Taipei City, Taiwan S 100%
Orsted Isle of Man (UK) Limited, Isle of Man S 100%
Orsted Lincs (UK) Ltd., London, UK S 100%
Segment/company/registered office Type1Ownership
interest
Orsted London Array II Limited, London, UK S 100%
Orsted London Array Limited, London, UK S 100%
Orsted North America Inc., Delaware, USA S 100%
Orsted Power (Gunfleet Sands) Ltd, London, UK S 100%
Orsted Power (Participation) Ltd, London, UK S 100%
Orsted Power (UK) Limited, London, UK S 100%
Orsted Race Bank (Holding) Ltd., London, UK S 100%
Orsted Shell Flats (UK) Limited, London, UK S 100%
Orsted Speicher R GmbH, Hamburg, Germany S 100%
Orsted Taiwan Ltd., Taipei City, Taiwan S 100%
Orsted UK III Limited, London, UK S 100%
Orsted US East Coast Offshore Wind Holdco, LLC, Delaware, USA S 100%
Orsted US East Coast Offshore Wind, LLC, Delaware, USA S 100%
Orsted Walney Extension Holdings Limited, London, UK S 100%
Orsted West of Duddon Sands (UK) Limited, London, UK S 100%
Orsted Westermost Rough Limited, London, UK S 100%
Orsted Wind Power A/S (branch) S 100%
Orsted Wind Power Germany GmbH, Hamburg, Germany S 100%
Orsted Wind Power Netherlands B.V., 's-Gravenhage, Netherlands S 100%
Orsted Wind Power Netherlands Holding B.V.,'s-Gravenhage, Netherlands S 100%
Orsted Wind Power North America LLC, USA, Delaware, USA S 100%
Preparatory Office of Greater Changhua Offshore Wind Farm NE Ltd., Changhua County, Taiwan S 100%
Preparatory Office of Greater Changhua Offshore Wind Farm NW Ltd., Changhua County, Taiwan S 100%
Preparatory Office of Greater Changhua Offshore Wind Farm SE Ltd., Changhua County, Taiwan S 100%
Preparatory Office of Greater Changhua Offshore Wind Farm SW Ltd., Changhua County, Taiwan S 100%
Race Bank Wind Farm (Holding) Limited, London, UK JO 50%
Race Bank Wind Farm Limited2, London, UK JO 50%
Rhiannon Wind Farm Limited2, Windsor, UK JV 50%
Scarweather Sands Limited, Coventry, UK JV 50%
Ørsted Annual report 2018 Financial statements Consolidated financial statements – 8. Other notes
163 / 193
Note summary Contents
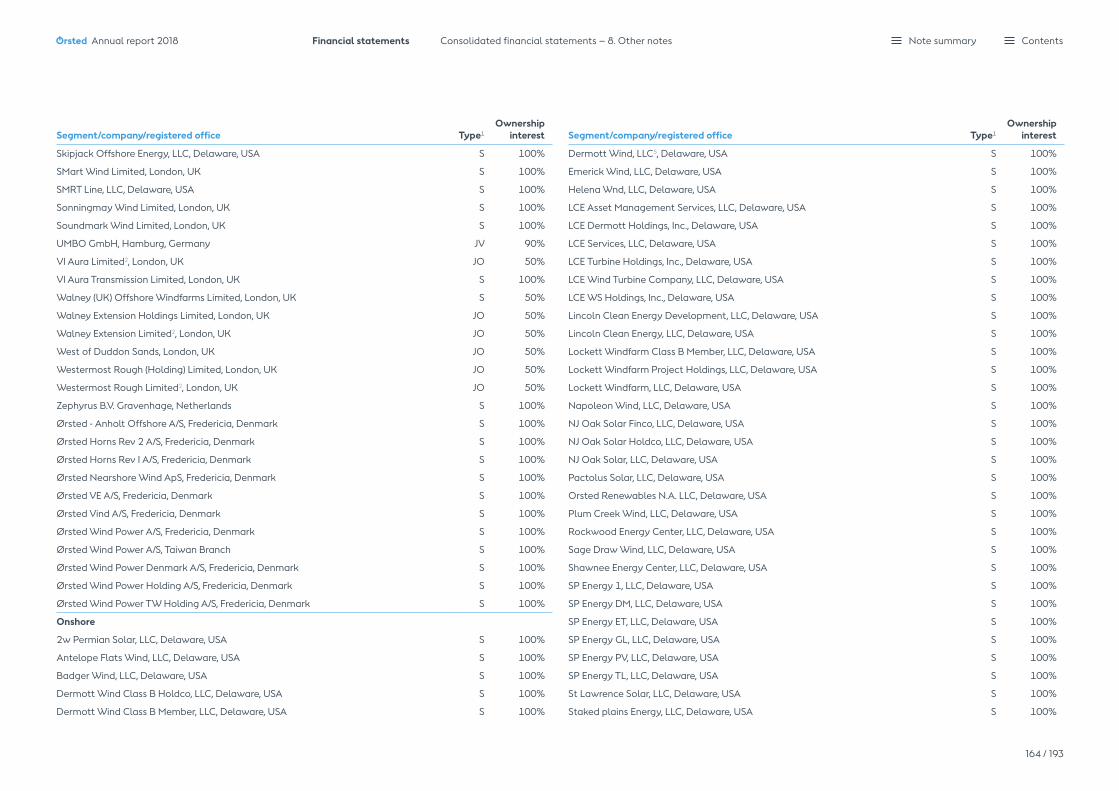
Segment/company/registered office Type1Ownership
interest
Skipjack Offshore Energy, LLC, Delaware, USA S 100%
SMart Wind Limited, London, UK S 100%
SMRT Line, LLC, Delaware, USA S 100%
Sonningmay Wind Limited, London, UK S 100%
Soundmark Wind Limited, London, UK S 100%
UMBO GmbH, Hamburg, Germany JV 90%
VI Aura Limited2, London, UK JO 50%
VI Aura Transmission Limited, London, UK S 100%
Walney (UK) Offshore Windfarms Limited, London, UK S 50%
Walney Extension Holdings Limited, London, UK JO 50%
Walney Extension Limited2, London, UK JO 50%
West of Duddon Sands, London, UK JO 50%
Westermost Rough (Holding) Limited, London, UK JO 50%
Westermost Rough Limited2, London, UK JO 50%
Zephyrus B.V. Gravenhage, Netherlands S 100%
Ørsted - Anholt Offshore A/S, Fredericia, Denmark S 100%
Ørsted Horns Rev 2 A/S, Fredericia, Denmark S 100%
Ørsted Horns Rev I A/S, Fredericia, Denmark S 100%
Ørsted Nearshore Wind ApS, Fredericia, Denmark S 100%
Ørsted VE A/S, Fredericia, Denmark S 100%
Ørsted Vind A/S, Fredericia, Denmark S 100%
Ørsted Wind Power A/S, Fredericia, Denmark S 100%
Ørsted Wind Power A/S, Taiwan Branch S 100%
Ørsted Wind Power Denmark A/S, Fredericia, Denmark S 100%
Ørsted Wind Power Holding A/S, Fredericia, Denmark S 100%
Ørsted Wind Power TW Holding A/S, Fredericia, Denmark S 100%
Onshore
2w Permian Solar, LLC, Delaware, USA S 100%
Antelope Flats Wind, LLC, Delaware, USA S 100%
Badger Wind, LLC, Delaware, USA S 100%
Dermott Wind Class B Holdco, LLC, Delaware, USA S 100%
Dermott Wind Class B Member, LLC, Delaware, USA S 100%
Segment/company/registered office Type1Ownership
interest
Dermott Wind, LLC5, Delaware, USA S 100%
Emerick Wind, LLC, Delaware, USA S 100%
Helena Wnd, LLC, Delaware, USA S 100%
LCE Asset Management Services, LLC, Delaware, USA S 100%
LCE Dermott Holdings, Inc., Delaware, USA S 100%
LCE Services, LLC, Delaware, USA S 100%
LCE Turbine Holdings, Inc., Delaware, USA S 100%
LCE Wind Turbine Company, LLC, Delaware, USA S 100%
LCE WS Holdings, Inc., Delaware, USA S 100%
Lincoln Clean Energy Development, LLC, Delaware, USA S 100%
Lincoln Clean Energy, LLC, Delaware, USA S 100%
Lockett Windfarm Class B Member, LLC, Delaware, USA S 100%
Lockett Windfarm Project Holdings, LLC, Delaware, USA S 100%
Lockett Windfarm, LLC, Delaware, USA S 100%
Napoleon Wind, LLC, Delaware, USA S 100%
NJ Oak Solar Finco, LLC, Delaware, USA S 100%
NJ Oak Solar Holdco, LLC, Delaware, USA S 100%
NJ Oak Solar, LLC, Delaware, USA S 100%
Pactolus Solar, LLC, Delaware, USA S 100%
Orsted Renewables N.A. LLC, Delaware, USA S 100%
Plum Creek Wind, LLC, Delaware, USA S 100%
Rockwood Energy Center, LLC, Delaware, USA S 100%
Sage Draw Wind, LLC, Delaware, USA S 100%
Shawnee Energy Center, LLC, Delaware, USA S 100%
SP Energy 1, LLC, Delaware, USA S 100%
SP Energy DM, LLC, Delaware, USA S 100%
SP Energy ET, LLC, Delaware, USA S 100%
SP Energy GL, LLC, Delaware, USA S 100%
SP Energy PV, LLC, Delaware, USA S 100%
SP Energy TL, LLC, Delaware, USA S 100%
St Lawrence Solar, LLC, Delaware, USA S 100%
Staked plains Energy, LLC, Delaware, USA S 100%
Ørsted Annual report 2018 Financial statements Consolidated financial statements – 8. Other notes
164 / 193
Note summary Contents

Segment/company/registered office Type1Ownership
interest
Tahoka Wind Class B Holdco, LLC, Delaware, USA S 100%
Tahoka Wind Class B Member, LLC, Delaware, USA S 100%
Tahoka Wind Project Holdings, LLC5, Delaware, USA S 100%
Tahoka Wind, LLC, Delaware, USA S 100%
Western Trail Wind, LLC, Delaware, USA S 100%
Willow Springs Class B Holdco, LLC, Delaware, USA S 100%
Willow Springs Class B Member, LLC, Delaware, USA S 100%
Willow Springs Project Holdings, LLC5, Delaware, USA S 100%
Willow Springs Windfarm, LLC, Delaware, USA S 100%
Bioenergy
Cure Renescience B.V., 's-Gravenhage, Netherlands JV 50%
DE Thermal Power Nr. 1 A/S in voluntary liquidation, Fredericia, Denmark S 100%
DONG Energy New Bio Solutions Co. Ltd.,China S 100%
Emineral A/S, Fredericia, Denmark JO 50%
Haderslev Kraftvarmeværk A/S in voluntary liquidation, Fredericia, Denmark S 100%
Inbicon A/S, Fredericia, Denmark S 100%
Kalundborg Bioenergi A/S, Skanderborg, Denmark JV 40%
Konsortiet for etablering af Maabjerg Energy Concept2, Holstebro, Denmark NC 50%
Maabjerg Energy Concept A/S, Fredericia, Denmark S 70%
Orsted Bioenergy & Thermal Power A/S (UK branch) S 100%
Orsted Energy Storage & Solar N.A. LLC, Delaware, USA S 100%
Orsted ESS Mersey Limited, London, UK S 100%
Orsted Holding Ludwigsau I GmbH, Hamburg, Germany S 100%
Orsted Kraftwerke Holding GmbH, Hamburg, Germany S 100%
Orsted Netherlands B.V., 's-Gravenhage, Netherlands S 100%
Orsted Renescience Northwich Limited, London, UK S 100%
Orsted Renescience Northwich O&M Limited, London, UK S 100%
Orsted SP (UK) Limited, London, UK S 100%
Orsted SP Holding (UK) Limited, London, UK S 100%
Pyroneer A/S, Fredericia, Denmark S 100%
Renescience A/S, Fredericia, Denmark S 100%
Severn Power Funding Limited., London, UK S 100%
Segment/company/registered office Type1Ownership
interest
Stigsnæs Vandindvinding I/S, Slagelse, Denmark NC 64%
Vejen Kraftvarmeværk A/S in voluntary liquidation, Fredericia, Denmark S 100%
Wilson Battery Storage LLC, Delaware, USA S 100%
Ørsted Bioenergy & Thermal Power A/S4, Fredericia, Denmark S 100%
Ørsted Energy Storage Solution Holding A/S, Fredericia, Denmark S 100%
Ørsted GWS Avedøre Biogas A/S, Fredericia, Danmark S 100%
Ørsted New Bio Solutions China A/S, Fredericia, Denmark S 100%
Ørsted New Bio Solutions Holding A/S, Fredericia, Denmark S 100%
Customer Solutions
Danish Offshore Gas Systems A/S, Fredericia, Denmark S 100%
Danish Oil Pipe A/S, Fredericia, Denmark S 100%
Etzel-Kavernenbetriebsgesellschaft mbH & Co. KG, Bremen, Germany A 33%
Etzel-Kavernenbetriebs-Verwaltungsgesellschaft mbH, Bremen, Germany A 33%
Obviux A/S, Fredericia, Denmark S 100%
Orsted AB, Malmö, Sweden S 100%
Orsted Energy Solutions (UK) Limited, London, UK S 100%
Orsted Infrastructure GmbH3, Hamburg, Germany S 100%
Orsted Leitung E GmbH, Hamburg, Germany S 100%
Orsted Markets GmbH, Hamburg, Germany S 100%
Orsted Power Sales (UK) Limited, London, UK S 100%
Orsted S&D (UK) Limited, London, UK S 100%
Orsted Sales (UK) Limited, London, UK S 100%
Orsted Sales GmbH, Hamburg, Germany S 100%
Orsted Salg & Service A/S (UK branch) S 100%
Orsted Services B.V.'s, Gravenhage, Netherlands S 100%
Orsted Speicher E GmbH, Hamburg, Germany S 100%
Radius Elnet A/S, Fredericia, Denmark S 100%
Valified ApS, Copenhagen, Denmark A 31%
Ørsted Pipelines A/S, Fredericia, Denmark S 100%
Ørsted Real Estate A/S, Fredericia, Denmark S 100%
Ørsted Sales & Distribution A/S, Fredericia, Denmark S 100%
Ørsted Salg & Service A/S, Fredericia, Denmark S 100%
Ørsted Annual report 2018 Financial statements Consolidated financial statements – 8. Other notes
165 / 193
Note summary Contents

Segment/company/registered office Type1Ownership
interest
Other
EM El Holding A/S, Fredericia, Denmark S 100%
EnergiGruppen Jylland El A/S, Fredericia, Denmark S 100%
EnergiGruppen Jylland El Holding A/S, Fredericia, Denmark S 100%
Lithium Balance A/S, Egedal, Denmark A 15%
Orsted (UK) Limited., London, UK S 100%
Orsted Holdings N.A. Inc, Delaware, USA S 100%
Orsted Services Malaysia Sdn. Bhd., Kuala Lumpur, Malaysia S 100%
Orsted Venture N.A. LLC, Delaware, USA S 100%
Orsted Polska Sp. z o. o., Warszawa, Poland S 100%
Ørsted EGJ A/S, Fredericia, Denmark S 100%
Ørsted El A/S4, Fredericia, Denmark S 100%
Ørsted Insurance A/S4, Fredericia, Denmark S 100%
Ørsted North America Holding A/S, Fredericia, Denmark S 100%
Ørsted nr. 1 2008 A/S3 4, Fredericia, Denmark S 100%
Ørsted Nr. 1 2014 A/S3 4, Fredericia, Denmark S 100%
Ørsted Nr. 2 2014 A/S3 4, Fredericia, Denmark S 100%
Ørsted Nr. 3 2014 A/S3 4, Fredericia, Denmark S 100%
Ørsted Nr. 4 2014 A/S3 4, Fredericia, Denmark S 100%
Ørsted Services A/S 4, Fredericia, Denmark S 100%
1 S = subsidiary A = associate JO = joint operation JV = joint venture NC = non-consolidated entity
2 The company is owned through a company which is not owned 100% by Ørsted. The disclosed owner-ship interest is Ørsted's ultimate ownership interest in the company.
3 The company applies the provision in section 5 or section 6 of the Danish Financial Statements Act to omit presenting a separate annual report.
4 Subsidiaries owned directly by Ørsted A/S.5 One or more tax equity partners own an
insignificant share of the company. See note 4.5 'Tax equity liabilities'. The company is fully consolidated.
Ørsted Annual report 2018 Financial statements Consolidated financial statements – 8. Other notes
166 / 193
Note summary Contents

Consolidated ESG statements (additional information)
Basis of reporting 168Environment 169Social 171Governance 172
Ørsted Annual report 2018 Note summary Contents
Ørsted ESG performance report 2018
Consolidated environmental, social and governance (ESG) statementsIn the consolidated ESG statements, we give an account of our results, objectives and accounting policies for the ESG data included in the management's review in this report.
Our full ESG data set can be seen in the independent publication 'ESG performance report 2018'. The ESG performance report also includes additional information, such as selected ESG indicators by country and all ESG accounting policies, including a list of references for conversion factors used in calculations.
Scope and consolidationUnless otherwise stated, ESG data is reported on the basis of the same principles as the financial statements. Thus, the consolidated ESG statements include consolidated data from the parent company, Ørsted A/S, and subsidiaries controlled by Ørsted A/S. Data from associates and joint ventures are not included.
The consolidation of safety data deviates from the above described principles. Safety data is collected using an operational scope. This means that we, irrespective of our owner-ship share, include 100% of injuries and hours worked etc., from all operations where Ørsted is responsible for safety, including safety for external suppliers.
8.3GWOur installed renewable capacity increased by 44% from 2017 to 2018. We have a target of 30GW installed renewable capacity in 2030.
75%The green share of our heat and power generation increased from 64% in 2017 to 75% in 2018. We have a target of 99% in 2025.
131gOur greenhouse gas intensity was reduced by 13% to 131g CO2/kWh in 2018. Our target is to reach 10g CO2/kWh in 2025.
4.7Total recordable injury rate (TRIR) has been reduced from 6.4 in 2017 to 4.7 in 2018. Our target is to reach 3.3 or below in 2025..
Basis of reportingData from acquisitions and divestments are included/excluded from the date of acquisition/divestment.
Danish Financial Statements Act, sections 99a and 99bPursuant to section 99a of the Danish Financial Statements Act, Ørsted is obliged to account for the company's CSR activi-ties and report on business strategies and activities with regard to human rights, labour rights, anti-corruption, the environment and the climate. By publishing our sustainability report (orsted.com/sustainability2018), Ørsted complies with section 99a of the Danish Financial Statements Act.
Ørsted's work for greater gender diversity at management level is reported in accordance with section 99b of the Danish Financial Statements Act. The reporting of gender diversity can be seen in our ESG performance report 2018.
Bussiness changes in 2018 affecting ESG dataAcquisition of: – Lincoln Clean Energy (onshore wind power)– Deepwater Wind (offshore wind power).
Divestment of: – 50% of Hornsea 1 (offshore wind farm)– Enecogen (thermal power plant, fossil).
Commissioning of: – Race Bank (offshore wind farm)– Walney Extension (offshore wind farm)– Borkum Riffgrund 2 (offshore wind farm)– Tahoka (onshore wind farm).
New ESG indicators in 2018– Installed renewable capacity.– Awarded and contracted capacity.– Onshore wind generation indicators.– Solar power generation.– Avoided carbon emissions (was reported
in the 2017 ESG performance report).– Job creation from offshore wind.– People powered from offshore wind.– Additional Board of Directors and Group
Executive Management information.
Discontinued ESG indicators– Wind energy content (replaced by
wind speed).– Employee loyalty (refer to the
ESG performance report 2018).
Our full ESG data set can be seen in the ESG performance report 2018. (orsted.com/ESGperformance2018)
Ørsted Annual report 2018 Financial statements Consolidated ESG statements (additional information)
168 / 193
Note summary Contents
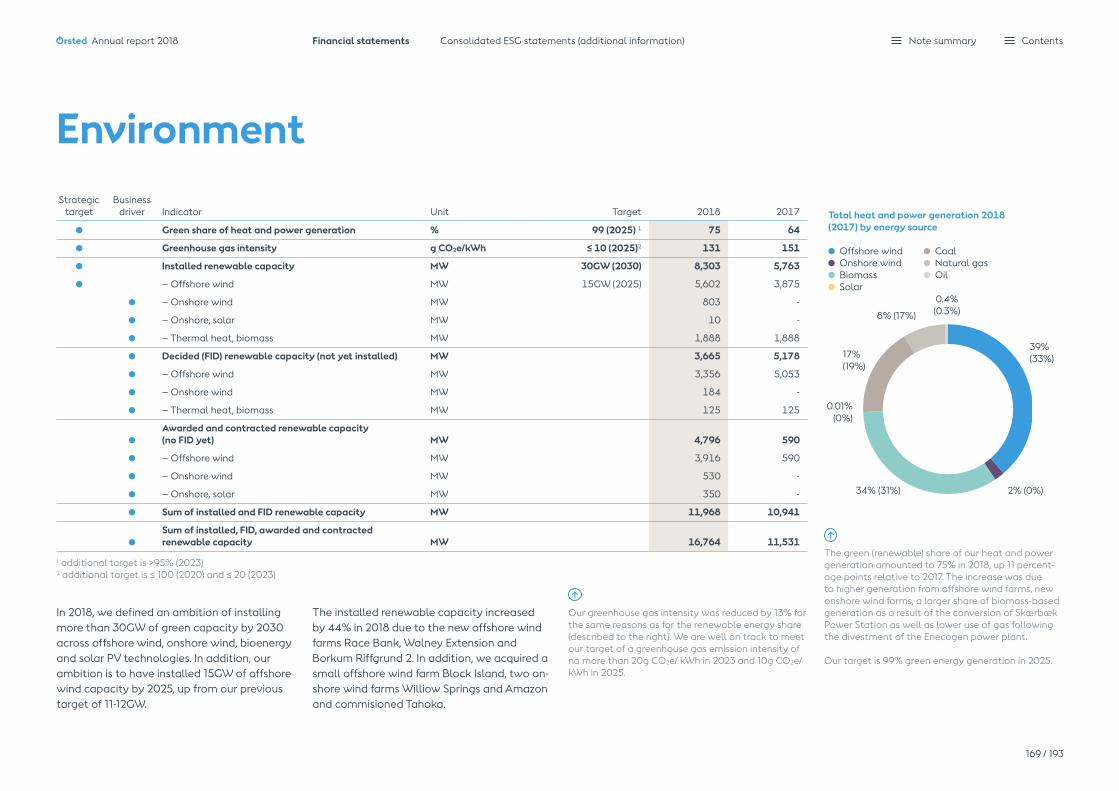
EnvironmentStrategic
targetBusiness
driver Indicator Unit Target 2018 2017
Green share of heat and power generation % 99 (2025) 1 75 64
Greenhouse gas intensity g CO2e/kWh ≤ 10 (2025)2 131 151
Installed renewable capacity MW 30GW (2030) 8,303 5,763
– Offshore wind MW 15GW (2025) 5,602 3,875
– Onshore wind MW 803 -
– Onshore, solar MW 10 -
– Thermal heat, biomass MW 1,888 1,888
Decided (FID) renewable capacity (not yet installed) MW 3,665 5,178
– Offshore wind MW 3,356 5,053
– Onshore wind MW 184 -
– Thermal heat, biomass MW 125 125
Awarded and contracted renewable capacity (no FID yet) MW 4,796 590
– Offshore wind MW 3,916 590
– Onshore wind MW 530 -
– Onshore, solar MW 350 -
Sum of installed and FID renewable capacity MW 11,968 10,941
Sum of installed, FID, awarded and contracted renewable capacity MW 16,764 11,531
1 additional target is >95% (2023)2 additional target is ≤ 100 (2020) and ≤ 20 (2023)
Our greenhouse gas intensity was reduced by 13% for the same reasons as for the renewable energy share (described to the right). We are well on track to meet our target of a greenhouse gas emission intensity of no more than 20g CO2e/ kWh in 2023 and 10g CO2e/ kWh in 2025.
Total heat and power generation 2018 (2017) by energy source
Offshore wind Onshore wind Biomass Solar
Coal Natural gas Oil
The green (renewable) share of our heat and power generation amounted to 75% in 2018, up 11 percent-age points relative to 2017. The increase was due to higher generation from offshore wind farms, new onshore wind farms, a larger share of biomass-based generation as a result of the conversion of Skærbæk Power Station as well as lower use of gas followingthe divestment of the Enecogen power plant.
Our target is 99% green energy generation in 2025.
0.4% (0.3%)
34% (31%)
0.01% (0%)
8% (17%)
39% (33%)
In 2018, we defined an ambition of installing more than 30GW of green capacity by 2030 across offshore wind, onshore wind, bioenergy and solar PV technologies. In addition, our ambition is to have installed 15GW of offshore wind capacity by 2025, up from our previous target of 11-12GW.
The installed renewable capacity increased by 44% in 2018 due to the new offshore wind farms Race Bank, Walney Extension and Borkum Riffgrund 2. In addition, we acquired a small offshore wind farm Block Island, two on-shore wind farms Williow Springs and Amazon and commisioned Tahoka.
2% (0%)
17% (19%)
Ørsted Annual report 2018 Financial statements Consolidated ESG statements (additional information)
169 / 193
Note summary Contents

Offshore generation capacity increased by 20% to 3.0GW in 2018 following commisioning of Race Bank, Walney Extension and Borkum Riffgrund 2 and acquisition of Deepwater Wind.
The acquisition of Lincoln Clean Energy added 0.8GW onshore capacity in 2018.
The higher wind capacity contributed to a 24% increase in wind-based generation in 2018.
Thermal power generation decreased by 18% in 2018, mainly due to the divestment of the Dutch power plant Enecogen. Power generation from Danish power plants increased by 4%, while thermal heat generation decreased by 2%.
The coal share of fuels increased in 2018 as we experienced a higher demand for power in periods where we were not generating heat. In these periods, fossil fuels are normally used. This was offset by a reduction in the use of natural gas and an increase in the use of biomass, resulting in an 11 percentage points higher biomass share of our thermal energy generation.
The certified share of renewable woody biomass increased from 72% in 2017 to 83% in 2018. The suppliers are still in the process of introducingcertifications in their production and supply chains, and only a few suppliers have certified their entire production. We expect the suppliers to continually increase their share of certification. Our target is to source all woody forest-based biomass as certified sustainable biomass by 2020.
Due to the increase in renewable energy generation, the amount of avoided carbon emissions increased by 21% from 2017 to 2018. In 2018, our renewable energy generation avoided 8.1 million tonnes carbon dioxide.
Strategic target
Business driver Indicator Unit Target 2018 2017
Generation, power and heat total TWh 26.0 25.7
Power generation TWh 17.2 16.7
– Offshore wind TWh 10.0 8.5
– Onshore wind TWh 0.5 -
– Solar TWh 0.003 -
– Thermal TWh 6.7 8.2
Heat generation, thermal TWh 8.8 9.0
Offshore wind indicators
Generation capacity GW 3.0 2.5
Wind speed m/s 9.1 9.3
Load factor % 42 44
Availability % 93 93
Onshore wind indicators
Generation capacity GW 0.8 -
Wind speed m/s 7.3 -
Load factor % 41 -
Availability % 92 -
Thermal heat and power generation indicators
Power generation capacity GW 2.8 3.4
Heat generation capacity GW 3.4 3.4
Degree days, Denmark Number 2,526 2,705
Coal share of fuels % 0 (2023) 38 30
Sourcing of certified biomass % 100% (2020) 83 72
Biomass share of thermal heat and power generation % 58 47
Avoided carbon emissions Million tonnes CO2e 8.1 6.7
– Offshore wind Million tonnes CO2e 6.3 5.3
– Onshore wind Million tonnes CO2e 0.4 -
– Biomass-converted generation Million tonnes CO2e 1.4 1.4
Ørsted Annual report 2018 Financial statements Consolidated ESG statements (additional information)
170 / 193
Note summary Contents

SocialStrategic
targetBusiness
driver Indicator Unit Target 2018 2017
Employees
Total number of employees at 31 December Number of FTEs 6,080 5,638
Average number of employees for the year Number of FTEs 5,796 5,738
Employee satisfaction Scale 0-100 ≥ 77 (2020) 76 76
Safety
Fatalities Number 0 0 0
LTIF (lost-time injury frequency) Per million working hours 1.5 1.6
TRIR (total recordable injury rate) Per million working hours ≤ 3.3 (2025) 4.7 6.4
Sales and distribution
Gas sales TWh 131.1 129.0
Power sales TWh 35.2 37.5
Power distribution TWh 8.4 8.4
Reliability of supply
Reliability of supply (power cuts per customer, SAIFI) Number 0.65 0.42
Customer satisfaction
Customer satisfaction, B2B Scale 1-100 ≥ 80 (2020) 75 77
Customer satisfaction, B2C in Denmark Scale 1-100 ≥ 80 (2020) 74 76
Customer satisfaction, distribution customers in Denmark Scale 1-100 ≥ 80 (2020) 81 82
Job year creation from offshore wind power value chain
Total job years over asset lifespans (based on installed and FID capacity) 1,000 FTE years 179 179
– Based on installed capacity 1,000 FTE years 112 78
– Based on decided capacity (FID), not yet installed 1,000 FTE years 67 101
People powered from offshore wind farms
Based on installed capacity Million people 12.5 8.6
The number of employees increased by 8% from 2017 to 2018.
Employee satisfaction continued to be high. With an employee satisfaction score of 76 in this year's employee satisfaction survey, we are close to achieving our target of 77 in 2020.
Safety KPIs showed good progress again in 2018. Our total recordable injury rate (TRIR) declined from 6.4 in 2017 to 4.7 in 2018. We registered 98 total recordable injuries (TRIs), 61 of which involved employees working for our suppliers. LTIF decreased from 1.6 in 2017 to 1.5 in 2018. There were no fatal accidents in 2018. We have set a new ambitious target for TRIR of 3.3 or lower by 2025.
The increase in power cuts per customer (SAIFI) was a result of more interruptions from cable cuts from excavation activities and a higher fault rate on our high voltage grids.
In a lifecycle perspective, our and our parters' investments in deploying green offshore energy have created 179,000 job years.
Our 2025 target of 15GW offshore wind capacity corresponds to more than 30 million people powered. Our 2030 target of 30GW renewable energy corresponds to more than 50 million people powered.
Ørsted Annual report 2018 Financial statements Consolidated ESG statements (additional information)
171 / 193
Note summary Contents
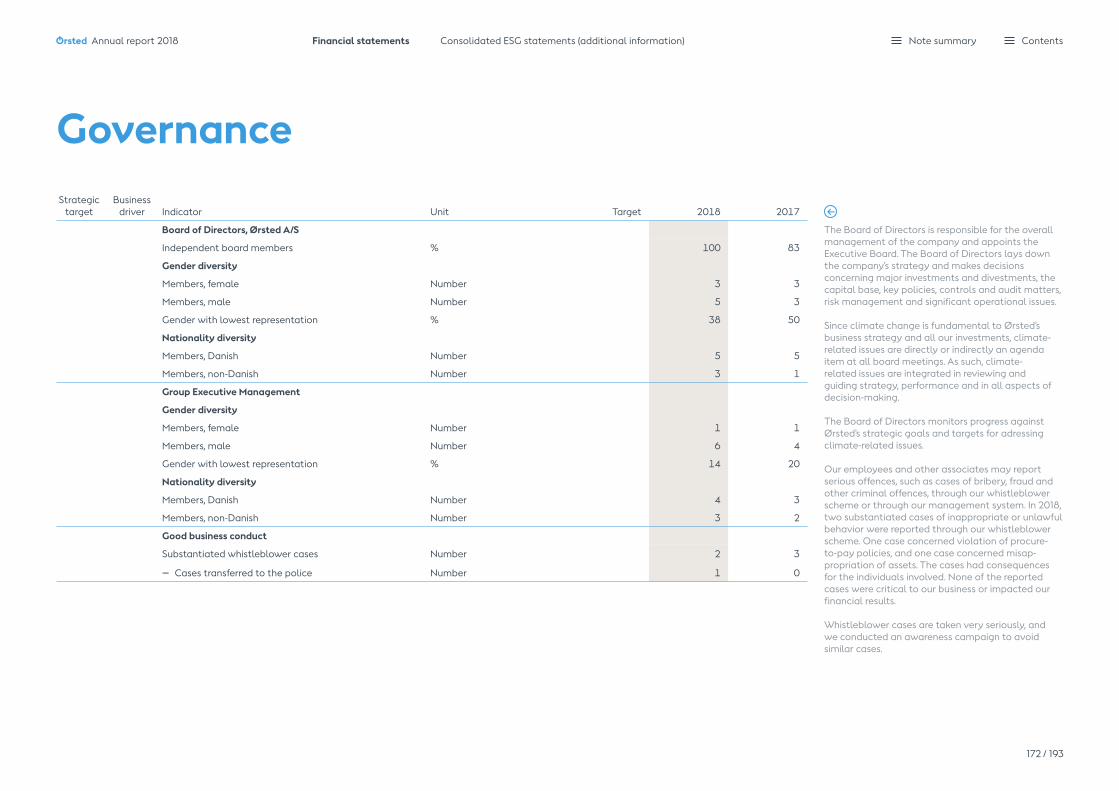
GovernanceStrategic
targetBusiness
driver Indicator Unit Target 2018 2017
Board of Directors, Ørsted A/S
Independent board members % 100 83
Gender diversity
Members, female Number 3 3
Members, male Number 5 3
Gender with lowest representation % 38 50
Nationality diversity
Members, Danish Number 5 5
Members, non-Danish Number 3 1
Group Executive Management
Gender diversity
Members, female Number 1 1
Members, male Number 6 4
Gender with lowest representation % 14 20
Nationality diversity
Members, Danish Number 4 3
Members, non-Danish Number 3 2
Good business conduct
Substantiated whistleblower cases Number 2 3
– Cases transferred to the police Number 1 0
The Board of Directors is responsible for the overall management of the company and appoints theExecutive Board. The Board of Directors lays down the company's strategy and makes decisions concerning major investments and divestments, the capital base, key policies, controls and audit matters, risk management and significant operational issues.
Since climate change is fundamental to Ørsted's business strategy and all our investments, climate-related issues are directly or indirectly an agenda item at all board meetings. As such, climate-related issues are integrated in reviewing and guiding strategy, performance and in all aspects of decision-making.
The Board of Directors monitors progress against Ørsted's strategic goals and targets for adressing climate-related issues.
Our employees and other associates may report serious offences, such as cases of bribery, fraud and other criminal offences, through our whistleblower scheme or through our management system. In 2018, two substantiated cases of inappropriate or unlawful behavior were reported through our whistleblower scheme. One case concerned violation of procure-to-pay policies, and one case concerned misap-propriation of assets. The cases had consequences for the individuals involved. None of the reported cases were critical to our business or impacted our financial results.
Whistleblower cases are taken very seriously, and we conducted an awareness campaign to avoid similar cases.
Ørsted Annual report 2018 Financial statements Consolidated ESG statements (additional information)
172 / 193
Note summary Contents
Accounting policies – Environment
Green share of heat and power generationThe green (renewable energy) share of our heat andpower generation and the distribution of the genera-tion on the individual energy sources and fuels arecalculated on the basis of the energy sources usedand the energy generated at the different energyplants.
Wind and solar-based generation is computed as the input from the individual plant (wind and solar),as there is only one source of power for each plant.
For CHP plants, the share of the specific fuel (e.g.biomass) is calculated relative to the total fuelconsumption for a given plant/unit within a giventime period. The specific fuel share is then multipliedwith the total heat and power generation for thespecific plant/unit in the specific period. The resultis the fuel-based generation for the individual unit –for example the biomass-based generation of heatand power in the CHP plant unit within a given time period.
Energy generation based on fuel, wind and solar is added up to a total which tallies with total genera-tion. The percentage share of the individual energy sources is calculated by dividing generation from individual energy source with the total generation.
The following energy sources and fuels are consid-ered renewable energy: wind, solar and biomass. Thefollowing energy sources are considered fossil energysources: coal, natural gas and oil.
Greenhouse gas intensityGreenhouse gas intensity is defined as the green-house gas emissions from the CHP plants divided bythe total heat and power generation.
Greenhouse gases comprise greenhouse gas emis-sions in accordance with the GHG Protocol from thecombustion of fuels in thermal heat and power generation. Greenhouse gases thus comprise carbon dioxide (CO2), nitrous oxide (N2O) and methane (CH4).
Installed renewable energy capacityThe installed renewable energy capacity is calcu-lated as the cumulative renewable gross capacity installed by Ørsted before divestments.
For installed renewable thermal capacity, we use theheat capacity, as heat is the primary thermal energy generation, and as bioconversions of the thermal power stations are driven by heat contracts.
Decided (FID) capacityDecided (FID) capacity is the renewable capacityfor which a final investment decision (FID) has been made.
Awarded and contracted renewable capacityThe awarded renewable capacity is based on thecapacities which have been awarded to Ørsted in auctions and tenders. The contracted capacity is the capacity for which Ørsted has signed a contract or power purchase agreement (PPA) concerning a new renewable energy plant. Typically, offshore wind farms are awarded, whereas onshore wind farms are contracted. We include the full capacity if more than 50% of PPAs/offtake is secured.
GenerationPower generation from wind is calculated as sold generation. The Gunfleet Sands and Walney 1 and 2 offshore wind farms have been consolidated accord-ing to ownership interest. The other wind farms are financially consolidated.
Thermal power generation is determined as net gen-eration sold based on settlements from the official Danish production database. Data for generation from foreign facilities are provided by the operators.
Thermal heat (including steam) generation is meas-ured as net output sold to heat customers.
Heat and power generation capacityPower generation capacity from wind farms is calcu-lated and included from the time when the individual wind turbine has passed a 240-hour test.
The Gunfleet Sands and Walney 1 and 2 offshorewind farms have been consolidated according toownership interest. Other wind farms and CHPplants are financially consolidated.
The thermal heat and power generation capacity is a measure of the maximum capability to generate heat and power. The capacity can change over time with plant modifications. For each power station, the
capacity is given for generation with the primary fuel mix. Overload is not included.
Availability and load factorThe time-based availability factor (availability)is calculated as the ratio of the number of hoursthe wind farms are available for power generation to the total number of hours in a given period. Total availability is determined by weighting the individual wind farm's availability against the capacity of the offshore wind farm. Availability is commercially adjusted.
The load factor is calculated as the ratio betweenactual generation over a period relative to potentialgeneration which is possible by continuouslyexploiting the maximum capacity over the sameperiod. The load factor is commercially adjusted.
Commercially adjusted means that, for Danish andGerman offshore wind farms, availability and loadfactor, respectively, are adjusted if the offshorewind farm has been financially compensated by thetransmission system operators in situations wherethe offshore wind farm is available for generation,but the output cannot be supplied to the grid dueto maintenance or grid interruptions. Wind farms in other countries are not compensated for non-access to the grid. New wind turbines are included in the calculation of availability and load factor once they have passed a 240-hour test.
Wind speedOffshore wind speed shows the wind speeds of theareas for Ørsted's offshore wind farms. The windspeeds where the individual offshore windfarms are located are provided to Ørsted by anexternal supplier. Wind speeds are weighted on thebasis of the capacity of the individual offshore windfarms and consolidated to an Ørsted total.
Onshore wind speed is based on wind speedmeasurements from anemometers on the wind turbines.
Degree daysDegree days are a measure of how cold it has beenand thus indicate the amount of energy needed toheat a building. The number of degree days helps tocompare the heat demand for a given year with a
normal year. The number of degree days expresses the difference between an average indoor tempera-ture of 17°C and the outside mean temperature for a given period. The need for heat increases with the number of degree days.
Coal share of fuels used for thermal heat and power generationThe coal share is calculated as the coal consumption in GJ relative to the total fuel volume in GJ.
Sourcing of certified biomass Certified biomass is defined as forest-based woody biomass, i.e. wood pellets and wood chips. Biomass is measured as sourced woody biomass delivered to the individual combined heat and power plants within the reporting period.
Certified sustainable woody biomass sourced must be certified within at least one of the claim cate-gories accepted by the Danish industry agreement on certified biomass. Accepted claim categories are: FSC 100%, FSC Mix, PEFC 100%, SBP compliant.
Certified biomass is calculated as the amount of sourced woody biomass compared to the total amount of sourced woody biomass delivered to individual power stations within the reporting period.
Biomass share of thermal heat and power generationThis is calculated as the green share of heat and power generation, but is only shown for thermal generation, i.e. for the business unit Bioenergy.
Avoided carbon emissionsThe avoided carbon emissions due to generation from offshore and onshore wind farms are calculat-ed assuming that the generation from wind farms replace an equal quantity of electricity generated using fossil fuels.
The avoided carbon emission due to conversion ofcombined heat and power plants and subsequentswitch of fuel from fossil to biomass (i.e. biomassfrom dedicated plantations or biomass residues) iscalculated from the energy content of the fuel usedat power plants. It is assumed that the use of 1GJ ofbiomass fuel avoids the use of 1GJ of fossil fuels. The upstream emissions from biomass fuel production and transportation are included.
Ørsted Annual report 2018 Financial statements Consolidated ESG statements (additional information)
173 / 193
Note summary Contents

Accounting policies – Social
EmployeesOur reporting covers contractually employedemployees in all Ørsted companies in which Ørsted holds an ownership interest of more than 50%. Employees in associates are not included.
Employee data are recognised based on recordsfrom the Group's ordinary registration systems. Thenumber of employees is determined as the numberof employees at the end of each month convertedto full-time equivalents (FTEs).
Employees who have been made redundant arerecognised until the expiry of their notice period,regardless of whether they have been released fromall or some of their duties during their notice period.
Employee satisfactionØrsted conducts a comprehensive employee satisfaction survey once a year. All Ørsted employees with a few exceptions are invited to participate in thesurvey.
The following employees are not invited toparticipate: Employees who joined the companyshortly before the employee satisfaction survey,employees who resigned shortly after the employeesatisfaction survey, interns, consultants/advisers andexternal temporary workers who do not have anemployment contract with Ørsted.
In the survey, a number of questions are asked. The answers are given on a scale from 1 to 10 and are subsequently converted to index figures on a scale from 0 to 100.
SafetyOccupational injuries are calculated according tooperational scope. Data from companies whollyor partly owned by Ørsted, and where Ørsted isresponsible for safety, is included. Occupationalinjuries and lost-time injuries are calculated for bothour own employees and suppliers. Data from all Ørsted locations is recognised.
The lost-time injury frequency (LTIF) is calculated asthe number of lost-time injuries per one million hoursworked. The number of hours worked is based on1,667 working hours annually per full-time employee
and monthly records of the number of employeesconverted into full-time employees. For suppliers, theactual number of hours worked is recognised on thebasis of data provided by the supplier, access controlsystems at locations or estimates.
LTIF includes lost-time injuries defined as injuries thatresult in incapacity to work for one or more calendardays in addition to the day of the incident.
In addition to lost-time injuries, TRIR also includes injuries where the injured person is able to perform restricted work the day after the accident as well as accidents where the injured person has received medical treatment.
Fatalities are the number of employees who lost their lives as a result of a work-related incident.
Sales and distributionSales of power and natural gas are calculated asphysical sales to retail and wholesale customers andexchanges. Sales of power and gas are based onreadings from Ørsted's trading systems. Internal salesto Bioenergy are not included in the statement.
Power distribution is determined on the basis of datafrom the official system in Denmark, which measuresand calculates total area consumption.
Reliability of supplySystem average interruption frequency index (SAIFI) covers the frequency of announced and unannounced power outages for the customer. SAIFI is calculated as the average number of power outages per customer per year. SAIFI is pre-sented here without the transmission grids, as these grids are operated by Energinet and therefore do not lie within the responsibility of Radius.
Customer satisfactionCustomer satisfaction for residential customers (B2C)in Denmark is measured according to interactionbetween the customer and Ørsted. The score istherefore not an expression of customers' overallsatisfaction with Ørsted, but is rather related to agiven situation. The score is calculated as a weightedscore based on a number of different types of touchpoints. The current touch points are customer servicefor gas and power, outbound sales and web. Anexternal supplier conducts interviews.
Customer satisfaction for business customers (B2B)is determined on the basis of customer satisfactionsurveys among Ørsted's business customers in thecountries where we have B2B customers. Customersatisfaction is determined on the basis of interviewsabout customers' satisfaction with Ørsted as awhole. The survey only comprises active customerswith whom Ørsted has been in touch in connectionwith contracts for the supply of power or gas in theprevious month. So-called sleeping customersare therefore not included in the statement. Themethod follows the ACSI model based on the Europe-an customer satisfaction index (EPSI) scale. External agencies conduct the interviews and report absolute and weighted results.
Customer satisfaction for distribution customersin Denmark is determined on the basis of differenttypes of interactions with distribution customers:disruption of supply, replacement of meters as wellas customer and market support. Customer satisfac-tion is measured as the customer's satisfaction in aspecific context. Respondents are randomly selected,and the survey is carried out by an external supplier.
Customer satisfaction for residential and distributioncustomers thus relates to a specific situation, where-as customer satisfaction for business customers is anexpression of the customer satisfaction with Ørsted as a whole. We have a number of very large businesscustomers. In respect of these, it is important for us toassess the customer relationship in general and notjust the experience of a specific situation.
Job creationThe number of job years is calculated based on a factor for job years per MW installed from the International Renewable Energy Agency, IRENA. The job year creation factor is based on a 500MW off-shore wind farm. The factor is not adjusted for other details, such as when the wind farm was constructed (wind turbine size and other parameters), wind farm size-specific parameters beyond a simple scaling of capacity size, geographical position (i.e. water depths and distance to shore).
The number of job years created relates only to the value chain from procurement and manufacturing, over installation, operation and maintenance, to decommissioning.
This means that job years related to for examplemining and manufacturing of steel and concreteas well as local jobs, such as hotels and dining for people working on local sites, are not included. Alifetime of 25 years for all wind farms is used.
The number of job years relates to the installed capacity and not Ørsted's ownership share of the wind farm. The number of job years varies during the lifespan, and most of the jobs are created in the beginning during construction and installation.
People poweredThe number of people powered is calculated on the basis of capacity, a fixed industrial load factor for offshore wind farms and country-specific power consumption per person. The indicator is calculated based on the full capacities of the wind farms and not Ørsted's ownership share.
Accounting policies – Governance
Board of Directors of Ørsted A/SThe employee representatives on the Board of Directors are not included in the data for the Board of Directors.
Substantiated whistleblower casesØrsted's whistleblower hotline is available forinternal and external reporting of suspected casesof inappropriate or illegal behaviour. Whistleblowercases are received and handled by the Internal Auditfunction, which also receives similar reports throughthe management system and from compliance officers.
All reports are managed in accordance with theguidelines for the handling of whistleblower reportsapproved by the Audit and Risk Committee, which isultimately responsible for the whistleblower scheme.
Only cases, which are closed during the financialyear, and which have been reported to the Audit andRisk Committee as fully or partially substantiated,are reported in the ESG statement.
Cases transferred to the policeCases transferred to the police are defined as the number of cases reported in accordance with the above which are transferred to the police.
Ørsted Annual report 2018 Financial statements Consolidated ESG statements (additional information)
174 / 193
Note summary Contents

Parent company financial statements
Income statement 176Balance sheet 176Statement of changes in equity 177
Notes 178 1. Basis of reporting 2. Employee costs 3. Financial income and expenses 4. Tax on profit (loss) for the year and deferred tax 5. Distribution of net profit 6. Investments in subsidiaries 7. Receivables from subsidiaries 8. Derivatives 9. Securities 10. Loans and borrowings 11. Other provisions 12. Contingent liabilities 13. Related-party transactions 14. Operating lease obligations 15. Auditor's fees 16. Ownership information
Ørsted Annual report 2018 Note summary Contents

Note Income statement, DKKm 2018 2017
Revenue 198 232
2 Employee costs (33) (31)
External expenses (356) (315)
Operating profit (loss) (EBIT) (191) (114)
Gain on divestment of enterprises (10) (4,210)
3 Financial income 10,014 13,667
3 Financial expenses (6,732) (10,486)
Profit (loss) before tax 3,081 (1,143)
4 Tax on profit (loss) for the year (69) (76)
5 Profit (loss) for the year 3,012 (1,219)
Note Assets, DKKm 2018 2017
6 Investments in subsidiaries 40,425 41,762
7 Receivables from subsidiaries 55,131 48,706
Other receivables 1,082 1,325
Financial assets 96,638 91,793
Non-current assets 96,638 91,793
Receivables from subsidiaries 32,933 15,664
8 Derivatives 3,102 3,596
Other receivables 604 524
Receivables 36,639 19,784
9 Securities 24,740 24,806
Cash 1,105 862
Current assets 62,484 45,452
Assets 159,122 137,245
Note Equity and liabilities, DKKm 2018 2017
Share capital 4,204 4,204
Reserves (296) (467)
Retained earnings 25,968 27,522
Proposed dividends 4,099 3,783
Equity attributable to shareholders in Ørsted A/S 33,975 35,042
10 Hybrid capital 13,239 13,239
Equity 47,214 48,281
4 Deferred tax 97 81
11 Other provisions 794 775
10 Bank loans and issued bonds 23,482 25,715
10 Other payables 0 27
Non-current liabilities 24,373 26,598
Bank loans and issued bonds 3,448 6,509
8 Derivatives 3,322 4,020
Trade payables 34 159
Payables to subsidiaries 79,364 48,638
Other payables 1,242 2,433
Income tax 125 607
Current liabilities 87,535 62,366
Liabilities 111,908 88,964
Equity and liabilities 159,122 137,245
Income statement 1 January - 31 December
Balance sheet 31 December
Ørsted Annual report 2018 Financial statements Parent company financial statements
176 / 193
Note summary Contents

Share capital com-position and dividends are disclosed in note 6.2 to the consolidated financial statements. You can also find information on treasury shares.
Statement of changes in equity, DKKm Share capitalHedging
reserve
Share premium
reserveRetained earnings
Proposed dividends
Shareholders in Ørsted A/S Hybrid capital Total
Equity at 1 January 2018 4,204 (467) - 27,522 3,783 35,042 13,239 48,281
Profit (loss) for the year - - - 2,587 - 2,587 425 3,012
Dividends paid - - - 2 (3,783) (3,781) - (3,781)
Proposed dividends - - - (4,099) 4,099 - - -
Purchase of treasury shares - - - (48) - (48) - (48)
Value adjustments of hedging instruments - 84 - - - 84 - 84
Value adjustments transferred to financial income and expenses - 135 - - - 135 - 135
Tax on changes in equity - (48) - - - (48) - (48)
Coupon payments, hybrid capital - - - - - - (545) (545)
Tax on coupon payments - - - - - - 120 120
Share-based payment - - - 4 - 4 - 4
Changes in equity in 2018 - 171 - (1,554) 316 (1,067) - (1,067)
Equity at 31 December 2018 4,204 (296) - 25,968 4,099 33,975 13,239 47,214
Equity at 1 January 2017 4,204 (497) 21,279 11,958 2,522 39,466 13,248 52,714
Transferred to retained earnings - - (21,279) 21,279 - - - -
Profit (loss) for the year - - - (1,935) - (1,935) 716 (1,219)
Dividends paid - - - 1 (2,522) (2,521) - (2,521)
Proposed dividends - - - (3,783) 3,783 - - -
Value adjustments of hedging instruments - 254 - - - 254 - 254
Value adjustment transferred to gain on divestment of enterprises - (444) - - - (444) - (444)
Value adjustments transferred to financial income and expenses - 229 - - - 229 - 229
Tax on changes in equity - (9) - - - (9) - (9)
Coupon payments, hybrid capital - - - - - - (640) (640)
Tax on coupon payments and costs, hybrid capital - - - - - - 141 141
Additions of issued hybrid capital - - - - - - 3,668 3,668
Hybrid capital transferred to payables - - - - - - (3,894) (3,894)
Share-based payment - - - 2 - 2 - 2
Changes in equity in 2017 - 30 (21,279) 15,564 1,261 (4,424) (9) (4,433)
Equity at 31 December 2017 4,204 (467) - 27,522 3,783 35,042 13,239 48,281
Statement of changes in equity 1 January - 31 December
Ørsted Annual report 2018 Financial statements Parent company financial statements
177 / 193
Note summary Contents

Accounting policiesThe parent company financial statements have been prepared in accordance with the provisions of the Danish Financial Statements Act (reporting class D).
The accounting policies remain unchanged from the previous year.
Unless otherwise stated, the financial statements are presented in Danish kroner (DKK) rounded to the nearest million.
The parent company accounting policies are consistent with the accounting policies described for the consolidated financial statements, with the following exceptions.
Foreign currency translationWe recognise exchange rate adjustments of receivables from and payables to sub-sidiaries as financial income and expenses in the income statement when the balances are accounted for as part of the total net investment in foreign enterprises. Likewise, we recognise foreign exchange gains and losses on loans and derivatives in the income statement as financial income and expenses when they have been entered into to hedge the net investment in the foreign enterprises.
RevenueRental income comprises income from com-mercial leases and is recognised over the term of the lease. Income from services is recognised when delivery has taken place.
Dividends from investmentsDividends from subsidiaries and associates are recognised in the income statement for the financial year in which the dividends are approved at the annual general meeting. If the dividends exceed the total income after the time of takeover, the dividends are recognised as a reduction of the cost of the investment under assets.
InvestmentsWe measure our investments in subsidiaries and associates at cost. If there is any indication that the value of a company is lower than our future earnings in the company, impairment testing of the company is carried out as described in the consolidated financial state-ments. The carrying amount is written down to the recoverable amount whenever the carrying amount exceeds the future earnings in the company (recoverable amount).
If we have a legal or constructive obligation to cover a deficit in subsidiaries and associ-ates, we recognise a provision for this.
TaxØrsted A/S is taxed jointly with its Danish sub-sidiaries. The jointly taxed companies are part of joint taxation with the parent company as the management company.
Subsidiaries are included in the joint taxation from the date they are consolidated in the consolidated financial statements and up to the date on which they are no longer consolidated.
Current tax for 2018 is recognised by the individual jointly taxed companies.
Statement of cash flowsWe do not prepare a separate statement of cash flows for the parent company. Reference is made to the consolidated statement of cash flows on page 77.
1. Basis of reportingKey accounting estimates
In connection with the preparation of the financial statements, a number of accounting estimates have been made that affect the profit (loss) and balance sheet. Estimates are regularly reassessed by management on the basis of historical experience and other relevant factors.
Impairment testIf there is any indication that the carrying amount is lower than our future earnings in a company, we test for impairment as described in the consolidated financial statements. The future earnings of the company (recoverable amount) are calculated based on assumptions concerning significant estimates.
New legislationThe Danish Financial Statements Act has been changed, and it is now possible to use certain IFRS standards to interpret the act. For Ørsted A/S, it will be relevant to use IFRS 16 'Leases', and we expect to implement it from 1 January 2019.
Ørsted Annual report 2018 Financial statements Parent company financial statements
178 / 193
Note summary Contents

Employee costs, DKKm 2018 2017
Wages and salaries 24 24
Share-based payment 4 2
Remuneration for the Board of Directors 5 5
Total employee costs 33 31
Remuneration for the Executive Board, DKK '000
Henrik Poulsen Marianne WiinholtExecutive Board,
total
2018 2017 2018 2017 2018 2017
Fixed salary 10,500 9,700 5,900 5,061 16,400 14,761
Cash-based incentive schemes 2,993 2,656 1,637 1,348 4,630 4,004
Share-based incentive scheme 2,306 1,367 1,231 713 3,537 2,080
IPO Executive Retention Bonus 1,232 1,848 643 964 1,875 2,812
Pension, incl. social security and benefits 313 326 242 196 555 522
Total 17,344 15,897 9,653 8,282 26,997 24,179
The remuneration report in the management's review and notes 2.6 and 2.7 to the consoli-dated financial statements describe the remuneration of the Executive Board and the Board of Directors, share-based pay-ment, termination and bonus scheme for the
Executive Board and details on the remunera-tion of the Board of Directors.
The parent company had an average of five employees in 2018 (2017: five employees).
Financial income and expenses, DKKm 2018 2017
Interest income from cash, etc. 56 14
Interest income from subsidiaries 1,803 1,432
Interest income from securities at market value 258 211
Capital gains on securities at market value 119 55
Foreign exchange gains 1,243 664
Value adjustments of derivatives 2,511 8,751
Dividends received 4,024 2,513
Other financial income - 27
Total financial income 10,014 13,667
Interest expenses relating to loans and borrowings (1,502) (1,584)
Interest expenses to subsidiaries (9) (9)
Impairment of investments in subsidiaries (1,400) -
Capital losses on securities at market value (292) (217)
Foreign exchange losses (1,169) (1,549)
Value adjustments of derivatives (2,330) (7,106)
Other financial expenses (30) (21)
Total financial expenses (6,732) (10,486)
Net financial income and expenses 3,282 3,181
2. Employee costs 3. Financial income and expenses
Ørsted Annual report 2018 Financial statements Parent company financial statements
179 / 193
Note summary Contents
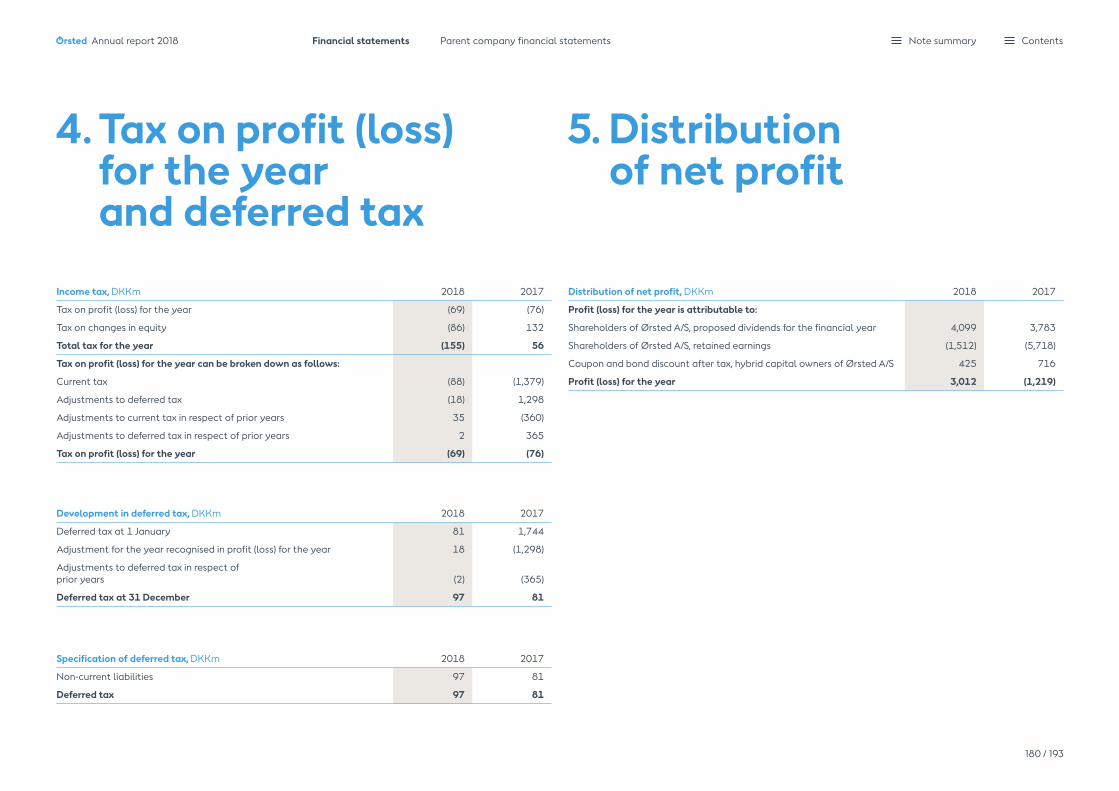
Development in deferred tax, DKKm 2018 2017
Deferred tax at 1 January 81 1,744
Adjustment for the year recognised in profit (loss) for the year 18 (1,298)
Adjustments to deferred tax in respect of prior years (2) (365)
Deferred tax at 31 December 97 81
4. Tax on profit (loss) for the year and deferred tax
Income tax, DKKm 2018 2017
Tax on profit (loss) for the year (69) (76)
Tax on changes in equity (86) 132
Total tax for the year (155) 56
Tax on profit (loss) for the year can be broken down as follows:
Current tax (88) (1,379)
Adjustments to deferred tax (18) 1,298
Adjustments to current tax in respect of prior years 35 (360)
Adjustments to deferred tax in respect of prior years 2 365
Tax on profit (loss) for the year (69) (76)
Specification of deferred tax, DKKm 2018 2017
Non-current liabilities 97 81
Deferred tax 97 81
Distribution of net profit, DKKm 2018 2017
Profit (loss) for the year is attributable to:
Shareholders of Ørsted A/S, proposed dividends for the financial year 4,099 3,783
Shareholders of Ørsted A/S, retained earnings (1,512) (5,718)
Coupon and bond discount after tax, hybrid capital owners of Ørsted A/S 425 716
Profit (loss) for the year 3,012 (1,219)
5. Distribution of net profit
Ørsted Annual report 2018 Financial statements Parent company financial statements
180 / 193
Note summary Contents

Note 8.5 of the consolidated financial statements contains a complete overview of subsidiaries, etc.
6. Investments in subsidiaries
Investments in subsidiaries, DKKm 2018 2017
Cost at 1 January 41,762 70,436
Additions 63 2,333
Disposals - (31,007)
Cost at 31 December 41,825 41,762
Value adjustments at 1 January - (15,681)
Impairment losses (1,400) -
Disposals - 15,681
Value adjustments at 31 December (1,400) -
Carrying amount at 31 December 40,425 41,762
We have tested investments in subsidiaries for impairment by comparing the expected future income from the individual subsidiaries with their carrying amounts.
The impairment test in 2018 gave rise toan impairment of DKK 1,400 million which is mainly attributable to the shortening of the green power subsidy time period in Denmark announced in 2018. Also, we no longer see a viable business case for a new CHP plant in the Esbjerg and Varde areas when the current district heating agreement ends in 2022. Both elements relate to our Bioenergy business.
The 2017 disposal for the year primarily con-cern the divestment of our Oil & Gas business, which was closed on 29 September 2017. The divestment resulted in a loss of DKK 4,179 million in the parent company financial state-ments. The sale resulted in a gain of DKK 2,179 million in the consolidated financial state-ments. The difference occurs due to different accounting policies.
7. Receivables from subsidiaries
Non-current receivables from subsidiaries, DKKm 2018 2017
Cost at 1 January 48,706 50,402
Additions 17,641 18,552
Disposals (11,216) (20,248)
Cost at 31 December 55,131 48,706
Ørsted Annual report 2018 Financial statements Parent company financial statements
181 / 193
Note summary Contents

2018 2017
Overview of derivative positions, DKKm
Contractual principal amount Market value
Contractual principal amount Market value
Interest derivatives 6,588 (39) 550 -
Currency derivatives 17,623 (181) 36,665 (424)
Total 24,211 (220) 37,215 (424)
Assets 3,102 3,596
Equity and liabilities (3,322) (4,020)
Securities not available for use are used as collateral for repo loans and trading in financial instruments.
8. DerivativesØrsted A/S has assumed the subsidiaries' currency risks via forward exchange contracts, which have subsequently been hedged in the market. Furthermore, hedging contracts have been concluded to hedge the currency risk associated with investments in subsidiaries in foreign currencies.
We have also entered into a number of interest rate swaps to manage our interest rate risk.
The company has fair value hedged loans and receivables in GBP, USD and EUR. The value of the fair value hedge offset in the income statement amounted to DKK 263 million (2017: DKK 289 million).
Derivatives at the end of December 2018 mature as follows: 2019: DKK -99 million, 2020: DKK -268 million, after 2020: DKK 147 million (2017: 2018: DKK -24 million, 2019: DKK -76 million, after 2019: DKK -324 million).
9. SecuritiesSecurities are primarily liquid AAA-rated Danish mortgage bonds that qualify for repo transactions in the Danish central bank,
'Danmarks Nationalbank'. Repo transactions are transactions where securities are provided as collateral for a loan.
Securities, DKKm 2018 2017
Securities, available 24,407 24,766
Securities, not available for use 333 40
Total securities 24,740 24,806
10. Loans and borrowingsAt 31 December 2018, we had issued hybrid capital with a total notional amount of DKK 13,432 million (2017: DKK 17,125 million). The hybrid bonds have a 1,000-year term and expires as follows: DKK 5,224 million in 3013, DKK 4,477 million in 3015 and DKK 3,731 million in 3017, respectively.
The long-term portion of bank loans and issued bonds amounted to DKK 23,482 million at 31 December 2018 (2017: DKK 25,715 million), of which DKK 16,376 million (2017: DKK 16,528 million) fall due in more than five years.
The long-term portion of other payables amounted to DKK 0 million at 31 December 2018 (2017: DKK 27 million) falls due in 1-5 years.
See note 7.1 to the consolidated financial statements and the management's review on pages 66-69 for more details on risk and risk management.
Ørsted Annual report 2018 Financial statements Parent company financial statements
182 / 193
Note summary Contents
12. Contingent liabilitiesContingent liabilitiesGuaranteesØrsted A/S has provided guarantees in connec-tion with participation by subsidiaries and subsidiaries' joint operations and joint ventures in the construction and operation of offshore wind farms and natural gas installations as well as guarantees in respect of leases, decommissioning obligations and purchase, sale and supply agreements, etc.
Ørsted A/S also acts as guarantor with primary liability for bank balances in certain subsidiaries.
IndemnitiesØrsted is a member of the reinsurance company Oil Insurance Ltd. In the event of an exit, an exit premium will be payable, which has been calculated at USD 10.3 million at 31 December 2018 (2017: USD 6.8 million).
Ørsted A/S is taxed jointly with other com-panies in the Ørsted Group. As management company, the company has unlimited as well as joint and several liability together with the other jointly taxed companies for Dan-ish income taxes and withholding taxes on dividends, interest and royalties related to the jointly taxed companies.
LitigationØrsted A/S is not a party to any litigation proceedings or legal disputes that could have an effect on the company's financial position, either individually or collectively.
11. Other provisionsWe have made provisions for non-current liabilities totalling DKK 794 million (2017: DKK 775) which fall due in 1-5 years. The liabil-ities concern the divestment of our Oil & Gas business, which was closed in 2017.
Ørsted Annual report 2018 Financial statements Parent company financial statements
183 / 193
Note summary Contents
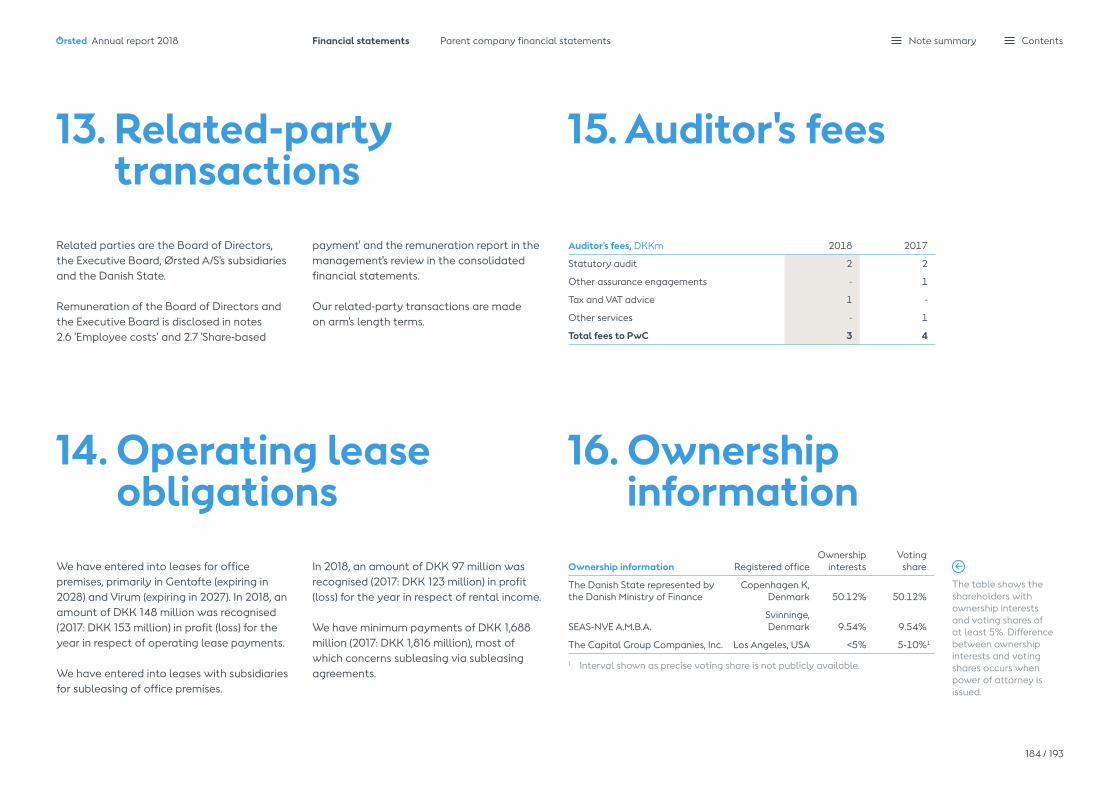
14. Operating lease obligations
We have entered into leases for office premises, primarily in Gentofte (expiring in 2028) and Virum (expiring in 2027). In 2018, an amount of DKK 148 million was recognised (2017: DKK 153 million) in profit (loss) for the year in respect of operating lease payments.
We have entered into leases with subsidiaries for subleasing of office premises.
15. Auditor's fees
Auditor's fees, DKKm 2018 2017
Statutory audit 2 2
Other assurance engagements - 1
Tax and VAT advice 1 -
Other services - 1
Total fees to PwC 3 4
In 2018, an amount of DKK 97 million was recognised (2017: DKK 123 million) in profit (loss) for the year in respect of rental income.
We have minimum payments of DKK 1,688 million (2017: DKK 1,816 million), most of which concerns subleasing via subleasing agreements.
16. Ownership information
Ownership information Registered officeOwnership
interestsVoting
share
The Danish State represented by the Danish Ministry of Finance
Copenhagen K, Denmark 50.12% 50.12%
SEAS-NVE A.M.B.A.Svinninge, Denmark 9.54% 9.54%
The Capital Group Companies, Inc. Los Angeles, USA <5% 5-10%1
1 Interval shown as precise voting share is not publicly available.
The table shows the shareholders with ownership interests and voting shares of at least 5%. Difference between ownership interests and voting shares occurs when power of attorney is issued.
13. Related-party transactions
Related parties are the Board of Directors, the Executive Board, Ørsted A/S's subsidiaries and the Danish State.
Remuneration of the Board of Directors and the Executive Board is disclosed in notes 2.6 'Employee costs' and 2.7 'Share-based
payment' and the remuneration report in the management's review in the consolidated financial statements.
Our related-party transactions are made on arm's length terms.
Ørsted Annual report 2018 Financial statements Parent company financial statements
184 / 193
Note summary Contents

Management statement, auditor's reports and glossary
Statement by the Executive Board and the Board of Directors 186Independent auditor's report 187Limited assurance report of the independent auditor 191Glossary 192
Ørsted Annual report 2018 Contents

Statement by the Executive Board and the Board of DirectorsThe Board of Directors and the Executive Board have today considered and approved the annual report of Ørsted A/S for the finan-cial year 1 January - 31 December 2018.
The consolidated financial statements have been prepared in accordance with International Financial Reporting Standards as adopted by the EU and additional require-ments in the Danish Financial Statements Act. The financial statements of the parent company, Ørsted A/S, have been prepared in accordance with the provisions of the Danish Financial Statements Act.
In our opinion, the consolidated financial statements and the parent company finan-cial statements provide a fair presentation of the Group's and the parent company's assets, liabilities and financial position at 31 December 2018 and of the results of the Group's and the parent company's operations and the Group's cash flows for the financial year 1 January - 31 December 2018.
In our opinion, the management's review provides a fair presentation of the develop-ment in the Group's and the parent company's operations and financial circumstances, of the results for the year and of the overall financial position of the Group and the parent company as well as a description of the most significant
risks and elements of uncertainty facing the Group and the parent company.
In our opinion, the consolidated ESG state-ments ('Additional information') represent a reasonable, fair and balanced representa-tion of the Group's social responsibility and sustainability performance and are presented in accordance with the stated accounting policies.
We recommend that the annual report be adopted at the annual general meeting.
Board of Directors:
Thomas Thune Andersen Chairman
Pia Gjellerup
Benny D. Loft
Poul Dreyer*
Lene SkoleDeputy Chairman
Jørgen Kildahl
Dieter Wemmer
Benny Gøbel*
Lynda Armstrong
Peter Korsholm
Hanne Sten Andersen*
Skærbæk, 31 January 2019
Executive Board:
Henrik Poulsen President and CEO
Marianne WiinholtCFO
* Employee representative
Ørsted Annual report 2018 Financial statements Management statement, auditor's reports and glossary
186 / 193
Contents
To the shareholders of Ørsted A/S
Our opinionIn our opinion, the consolidated financial statements give a true and fair view of the Group's financial position at 31 December 2018 and of the results of the Group's operations and cash flows for the financial year 1 January to 31 December 2018 in accordance with Inter-national Financial Reporting Standards asadopted by the EU ('IFRS') and further require-ments in the Danish Financial Statements Act.
Moreover, in our opinion, the parent company financial statements give a true and fair view of the parent company's financial position at 31 December 2018 and of the results of the parent company's operations for the financial year 1 January to 31 December 2018 in accord-ance with the Danish Financial Statements Act.
Our opinion is consistent with our auditor's long-form report to the Audit and Risk Committee and the Board of Directors.
What we have auditedThe Consolidated Financial Statements of Ørsted A/S for the financial year 1 January to 31 December 2018, pp. 72-166 and 186, comprise the consolidated income statement, the consolidated statement of comprehensive
Independent auditors' reportincome, the consolidated balance sheet, the consolidated statement of changes in equity, the consolidated cash flow statement and the notes to the consolidated financial statements, including summary of significant accounting policies.
The parent company financial statements of Ørsted A/S for the financial year 1 January to 31 December 2018, pp. 175-184, comprise the income statement, the balance sheet, the statement of changes in equity and the notes to the parent financial statements, including summary of significant accounting policies.
Collectively referred to as the 'Financial Statements'.
Basis for opinionWe conducted our audit in accordance with International Standards on Auditing (ISAs) and the additional requirements applicable in Denmark. Our responsibilities under those standards and requirements are further described in the auditor's responsibilities for the audit of the financial statements section of our report.
We believe that the audit evidence we have obtained is sufficient and appropriate to provide a basis for our opinion.
IndependenceWe are independent of the Group in accordance with the International Ethics Standards Board for Accountants' Code of Ethics for Professional Accountants (IESBA Code) and the additional ethical requirements applicable in Denmark. We have also fulfilled our other ethical respon-sibilities in accordance with the IESBA Code.
To the best of our knowledge and belief, prohibited non-audit services referred to in Article 5(1) of Regulation (EU) No. 537/2014 were not provided.
AppointmentWe were first appointed auditors of Ørsted A/S on 19 April 2010 for the financial year 2010. We have been reappointed annually by shareholder resolution for a total period of un-interrupted engagement of 9 years, including the financial year 2018.
Key audit mattersKey audit matters are those matters that, in our professional judgement, were of most significance in our audit of the financial statements for 2018. These matters were addressed in the context of our audit of the financial statements as a whole, and in forming our opinion thereon, and we do not provide a separate opinion on these matters.
Ørsted Annual report 2018 Financial statements Management statement, auditor's reports and glossary
187 / 193
Contents

Key audit matter How our audit addressed the key audit matter
Construction contracts The Group has adopted the accounting standardIFRS 15 'Revenue from Contracts with Customers' from 1 January 2018, using the modified retro-spective method. The adoption has affected the timing of when income and costs are recognised in respect of offshore transmission assets and the presentation of construction agreements in the balance sheet.
The accuracy of the revenue recognition related towork in progress of large construction agreementsand its presentation in the consolidated incomestatement is dependent on complex estimationmethodologies, including estimates, such as the forecasted costs related to the constructions andthe degree of completion for construction agreements.
We focused on this area because the revenue recognised with reference to the degree ofcompletion both requires complex and subjectivejudgements and estimates by management.
Refer to notes 1.4, 2.2 and 4.2 in the consolidatedfinancial statements.
On a sample basis, we tested whether revenue isaccurately recorded and challenged the forecastedcosts related to the constructions, including theassumptions used, and by evaluating the outcomeof previous estimates by agreeing the actual costsincurred post-year end to the forecasted costs forthe period.
We also assessed how the project managersdetermined that the degree of completion wascorrectly determined through obtaining theircalculations and agreeing the inputs todocumentary evidence or our independentlyformed expectation, as appropriate.
We evaluated management's assessment of thetransition from IAS 11 and IAS 18 to IFRS 15 applying the modified retrospective method, including the impact on the on-going construction of the offshore transmission assets as well as the changed presentation made by management in respect of the transition.
Key audit matter How our audit addressed the key audit matter
Divestments of partnership interestsIn connection with divestments of partnership interests (often 50%) in offshore wind farms under construction, estimates and judgement are required in respect of the sales price for accounting purpose for the divestment and the subsequent construc-tion agreement, respectively, and in calculating the divestment gain, including any provisions recog-nised to cover guarantees, indemnities, etc. Further-more, judgement is required in respect of classifying the divested interest as either divestment of assets (gain recognised as part of Other income) or divestment of an enterprise (gain recognised as part of gain/loss from divestment of enterprises). Finally, judgement is required in respect of whether the Group's retained share in the partnership is a joint operation or a joint venture.
We focused on this area because the calculation ofthe divestment gain is dependent on complex andsubjective judgements and estimates by manage-ment and because the presentation in the income statement is dependent on judgement about the partnership interest disposed, and whether the partnership interest retained is a joint operation or a joint venture.
Refer to note 2.5 in the consolidated financial statements.
We evaluated whether management hadappropriately determined the divestment gain, thepresentation hereof and the subsequent treatmentof the partnership interest by for example:
– Reading the share purchase agreements.
– Reading the shareholders agreements.
– Reading the construction and other related agreements.
– Consider the sales price for accounting purpose for the divestment and the construction agree-ment, respectively.
– Testing the gain statement on the divestment of the partnership interest, including the provisions recognised to cover guarantees, indemnities, etc., in the share purchase agreement.
– Consider whether the disclosures of the divestment gain and the subsequent recognition and presentation of the partnership were in compliance with IFRS.
Ørsted Annual report 2018 Financial statements Management statement, auditor's reports and glossary
188 / 193
Contents

Key audit matter How our audit addressed the key audit matter
Business combinationsWhen acquiring businesses, the Group performeda purchase price allocation ('PPA') exercise for each acquisition separately, resulting in various assets and liabilities being separately valued. The Group used projected financial information in the PPA exercise.
Management uses their best knowledge to make estimates when utilising the Group's valuation methodologies. In order to determine the fair value of the separately identified assets and liabilities in a business combination, the valuation methodolo-gies require input based on assumptions about the future and use discounted cash flow forecasts. The significant judgements and estimates involved in the PPA exercise mainly relate to assessing the fair value of production assets, assets under construc-tion, tax equity partner balances and derivatives.
We focused on this area because the PPA exercises, which involves the identification of the acquired assets and liabilities and their respective fair values, require complex and subjective judgements and estimates by management.
Refer to note 3.3 in the consolidated financialstatements.
We assessed whether the acquisitions during theperiod met the criteria of a business combination.
We verified the assets and liabilities recorded in the opening balance, by performing procedures, including, amongst others, obtaining statements of cash and bank balances acquired, agreeing the opening balance to the trial balance and the tax equity liabilities to underlying contracts and specifications.
We involved our internal specialists in assessing the valuation methodologies used by management and the fair valuation of the acquired assets and liabilities. We challenged the key assumptions used to determine the fair value of production assets, assets under construction, tax equity partner balances, derivatives, etc.
Finally, we assessed the adequacy of disclosuresrelating to the business combinations.
Statement on management's reviewManagement is responsible for the manage-ment's review, pp. 4-71.
Our opinion on the financial statements does not cover management's review, and we do not express any form of assurance conclusion thereon.
In connection with our audit of the financial statements, our responsibility is to read management's review and, in doing so, consid-er whether management's review is materially inconsistent with the financial statements or our knowledge obtained in the audit, or other-wise appears to be materially misstated.
Moreover, we considered whether manage-ment's review includes the disclosures required by the Danish Financial Statements Act.
Based on the work we have performed, in our view, management's review is in accordance with the consolidated financial statements and the parent company financial statements and has been prepared in accordance with the requirements of the Danish Financial State-ment Act. We did not identify any material misstatement in management's review.
Management's responsibilities for the financial statements Management is responsible for the prepara-tion of consolidated financial statements that give a true and fair view in accordance with International Financial Reporting Standards as adopted by the EU and further require-ments in the Danish Financial Statements Act and for the preparation of parent company
financial statements that give a true and fair view in accordance with the Danish Financial Statements Act, and for such internal control as management determines is necessary to enable the preparation of financial state-ments that are free from material misstate-ment, whether due to fraud or error.
In preparing the financial statements, man-agement is responsible for assessing the Group's and the parent company's ability to continue as a going concern, disclosing, as applicable, matters related to going concern and using the going concern basis of account-ing unless management either intends to liquidate the Group or the parent company or to cease operations, or has no realistic alternative but to do so.
Auditor's responsibilities for the audit of the financial statementsOur objectives are to obtain reasonable assurance about whether the financial Statements as a whole are free from material misstatement, whether due to fraud or error, and to issue an auditor's report that includes our opinion. Reasonable assurance is a high level of assurance, but is not a guarantee that an audit conducted in accordance with ISAs and the additional requirements applicable in Denmark will always detect a material mis-statement when it exists. Misstatements can arise from fraud or error and are considered material if, individually or in the aggregate, they could reasonably be expected to influ-ence the economic decisions of users taken on the basis of these financial statements.
As part of an audit in accordance with ISAs and additional requirements applicable in
Ørsted Annual report 2018 Financial statements Management statement, auditor's reports and glossary
189 / 193
Contents

Denmark, we exercise professional judgement and maintain professional scepticism through-out the audit. We also:
– Identify and assess the risks of material misstatement of the financial statements, whether due to fraud or error, design and perform audit procedures responsive to those risks, and obtain audit evidence that is sufficient and appropriate to provide a basis for our opinion. The risk of not detecting a material misstatement resulting from fraud is higher than for one resulting from error, as fraud may involve collusion, forgery, intentional omissions, misrepresentations, or the override of internal control.
– Obtain an understanding of internal control relevant to the audit in order to design audit procedures that are appropriate in the circumstances, but not for the purpose of expressing an opinion on the effective-ness of the Group's and the Company's internal control.
– Evaluate the appropriateness of accounting policies used and the reasonableness of accounting estimates and related disclosures made by Management.
– Conclude on the appropriateness of man-agement's use of the going concern basis of
accounting and based on the audit evidence obtained, whether a material uncertainty exists related to events or conditions that may cast significant doubt on the Group's and the parent company's ability to contin-ue as a going concern. If we conclude that a material uncertainty exists, we are required to draw attention in our auditor's report to the related disclos ures in the financial state-ments or, if such disclosures are inadequate, to modify our opinion. Our conclusions are based on the audit evidence obtained up to the date of our auditor's report. However, future events or conditions may cause the Group or the parent company to cease to continue as a going concern.
– Evaluate the overall presentation, structure and content of the financial statements, including the disclosures, and whether the financial statements represent the under-lying transactions and events in a manner that achieves fair presentation.
– Obtain sufficient appropriate audit evi-dence regarding the financial information of the entities or business activities within the Group to express an opinion on the consolidated financial statements. We are responsible for the direction, supervision and performance of the group audit. We remain solely responsible for our audit opinion.
We communicate with those charged with governance regarding, among other matters, the planned scope and timing of the audit
and significant audit findings, including any significant deficiencies in internal control that we identify during our audit.
We also provide those charged with gover-nance with a statement that we have complied with relevant ethical requirements regarding independence, and to communicate with them all relationships and other matters that may reasonably be thought to bear on our independence, and where applicable, related safeguards.
From the matters communicated with those charged with governance, we determine those matters that were of most significance in the audit of the financial statements of the current period and are therefore the key audit matters. We describe these matters in our auditor's report unless law or regulation precludes public disclosure about the matter or when, in extremely rare circumstances, we determine that a matter should not be com-municated in our report because the adverse consequences of doing so would reasonably be expected to outweigh the public interest benefits of such communication.
Hellerup, 31 January 2019
PricewaterhouseCoopersStatsautoriseret RevisionspartnerselskabCVR-nr. 33 77 12 31
Lars Baungaard State Authorised Public Accountant mne23331
Rasmus Friis JørgensenState Authorised Public Accountant mne28705
Ørsted Annual report 2018 Financial statements Management statement, auditor's reports and glossary
190 / 193
Contents

To the stakeholders of Ørsted A/SØrsted A/S engaged us to provide limited assurance on the data described below and set out in the consolidated environment, social and governance (ESG) statements of the Ørsted A/S annual report for the year ended 31 December 2018.
Our conclusionBased on the procedures we have performed and the evidence we have obtained, nothing has come to our attention that causes us not to believe that data in the 2018 Consolidated ESG Statements on pages 167-174 of the Annual Report for the year ended 31 December 2018 are free of material misstatements and has been prepared, in all material respects, in accordance with the accounting policies as stated on pages 167-174 of the 2018 Ørsted A/S Annual Report.
This conclusion is to be read in the context of what we say in the remainder of our report.
What we are assuring The scope of our work was limited to assurance over data in the Consolidated ESG Statements on pages 167-174 of the Ørsted A/S Annual Report for the year ended 31 December 2018.
Professional standards applied and level of assuranceWe performed a limited assurance engagement in accordance with International Standard on Assurance Engagements 3000 (Revised) 'Assurance Engagements other than Audits and Reviews of Historical Financial Information'. A limited assurance engagement is substantially less in scope than a reasonable assurance
Limited assurance report of the independent auditor engagement in relation to both the risk assess-ment procedures, including an understanding of internal control, and the procedures performed in response to the assessed risks; consequently, the level of assurance obtained in a limited assurance engagement is substantially lower than the assurance that would have been obtained had a reasonable assurance engage-ment been performed.
Our independence and quality controlWe have complied with the Code of Ethics for Professional Accountants issued by the Inter-national Ethics Standards Board for Account-ants, which includes independence and other ethical requirements founded on fundamental principles of integrity, objectivity, professional competence and due care, confidentiality and professional behaviour. The firm applies International Standard on Quality Control 1 and accordingly maintains a comprehensive system of quality control, including documented poli-cies and procedures regarding compliance with ethical requirements, professional standards and applicable legal and regulatory requirements. Our work was carried out by an independent multidisciplinary team with experience in sustainability reporting and assurance.
Understanding reporting and measurement methodologiesData and information need to be read and un-derstood together with the accounting policies (pages 167-174 of the 2018 Ørsted A/S Annual Report), which management are solely respon-sible for selecting and applying. The absence of a significant body of established practice on which to draw to evaluate and measure
non-financial information allows for different, but acceptable, measurement techniques and can affect comparability between entities and over time.
Work performedWe are required to plan and perform our work in order to consider the risk of material misstate-ment of the data. In doing so and based on our professional judgement, we:– Conducted interviews with Group functions
to assess consolidation processes, use of company- wide systems and controls per-formed at Group level;
– Performed an assessment of materiality and the selection of topics for the 2018 Ørsted A/S consolidated ESG statements;
– Conducted analytical review of the data and trend explanations submitted by all business units for consolidation at Group level;
– Evaluated internal and external documenta-tion to determine whether information in the 2018 Ørsted A/S consolidated ESG statements is supported by sufficient evidence.
Management's responsibilitiesManagement of Ørsted A/S is responsible for:– Designing, implementing and maintaining
internal control over information relevant to the preparation of data in the 2018 consol-idated ESG statements on pages 167-174 in the annual report that are free from material misstatement, whether due to fraud or error;
– Establishing objective accounting policies for preparing data;
– Measuring and reporting data in the 2018 consolidated ESG statements based on the accounting policies; and
– The content of the 2018 consolidated ESG statements.
Our responsibilityWe are responsible for:– Planning and performing the engagement
to obtain limited assurance about whether data in the 2018 Ørsted A/S sonsolidated ESG statements on pages 167-174 of the 2018 Annual Report are free of material misstate-ments and has been prepared, in all material respects, in accordance with the accounting policies;
– Forming an independent conclusion, based on the procedures we have performed and the evidence we have obtained; and
– Reporting our conclusion to the stakeholders of Ørsted A/S.
Hellerup, 31 January 2018
PricewaterhouseCoopersStatsautoriseret RevisionspartnerselskabCVR-no. 33 77 12 31
Lars BaungaardState Authorised Public Accountantmne23331
Rasmus Friis JørgensenState Authorised Public Accountant mne28705
Ørsted Annual report 2018 Financial statements Management statement, auditor's reports and glossary
191 / 193
Contents
Availability: Time-based availability is the ratio of the number of hours in a given period the offshore wind farms are available for power generation to the total number of hours in the same period. Total availability is weighted on the basis of the size of the individual wind farms. Availability is adjusted for breakdowns if compensation is received from the transmission owner.
Awarded capacity: Offshore capacity that we have been awarded in auctions and tenders, but where we need to sign a PPA and take final investment decision.
Biomass conversion: When a CHP plant is converted from using fossil fuels to using biomass, such as wood pellets, wood chips and straw. After the conversion, the CHP plant will typically be able to use biomass along with the original fuel types.
Carbon emissions allowances: Carbon emissions allowances subject to the European Union Emissions Trading Scheme (EU ETS).
CfD: A contract for difference is a subsidy that guar-antees the difference between the market reference price and the exercise price won.
CHP plant: A combined heat and power (CHP) plant generates both heat and power in the same process.
Commissioning/COD: When our assets are in oper-ation, and the legal liability has been transferred from the supplier to us.
Contracted capacity: Onshore capacity where we have signed a PPA, but where we need to take final investment decision.
Cost of electricity: Average cost measured as present value per megawatt hour (MWh) generated from offshore wind power, covering costs for development and construction as well as subsequent operation and maintenance of the offshore wind farm.
Decided (FID) and installed capacity: Installed offshore wind capacity plus capacity for wind farms where a final investment decision has been made.
Degree days: Number of degrees in absolute figures in difference between the average temperature and the official Danish indoor temperature of 17 degrees Celsius.
EEX: European Energy Exchange, German power exchange.
EPC: Engineering, procurement and construction. The part of our business which handles the construction and installation of our offshore wind farms.
FTE: Employees (full-time equivalent). The number of full-time employees during a fixed time period.
Generation capacity: Ørsted's ownership of the wind turbines. The wind turbines are included when each wind turbine has passed the 240-hour test.
Green certificates: Certificate awarded to producers of environment-friendly power as a supplement to the market price of power in the given price area.
Green dark spread (GDS): Green dark spread represents the contribution margin per MWh of power generated at a coal-fired CHP plant of a given efficiency. It is determined as the difference between the market price of power and the cost of the coal (in-cluding associated freight costs) and carbon emissions allowances used to generate the power.
Green spark spread (GSS): Green spark spread rep-resents the contribution margin per MWh generated at a gas-fired power station of a given efficiency. It is determined as the difference between the market price of power and the costs of the gas and carbon emissions allowances used to generate the power.
Hedging instruments: Financial and physical instru-ments that can be used to guarantee a specific price for the purchase or sale of, for example, commodities and currency.
Installed capacity: Installed capacity where the offshore wind farm has been completed and has passed the 200-hour test.
Investment tax credits (ITCs): Federal tax credit based on qualifying renewable investment costs.
LNG: Liquefied natural gas. Gas that has been liquefied by cooling to minus 161 degrees Celsius. LNG takes up 600 times less space than conventional gas.
Load factor: The ratio between the actual power generation in a given period relative to the potential generation which is possible by continuously exploit-ing the maximum capacity over the same period.
NBP: National Balancing Points, UK gas hub.
Nord Pool: The Norwegian-based Nordic power exchange, which facilitates power trading in Norway, Sweden, Finland and Denmark.
Offshore transmission assets: Offshore transmission assets connect offshore generation to the onshore grid and typically include the offshore power trans-mission infrastructure, an onshore substation and the electrical equipment relating to the operation of the substation.
O&M: Operation and maintenance. The part of our business that operates and maintains our offshore wind farms after installation.
Partnership income: Income originating from our partners' purchase of ownership interests in the offshore wind farms. Includes both the gain in connection with the farm-down and the subsequent construction of the wind farm.
Production tax credit (PTC): Federal tax credit based on eligible power generation in the US.
PSO: Indirect taxes regarding the public service obli-gation (PSO) which are used to finance research and green energy and are charged to power customers along with other tariff elements.
Public obligation: A company with a public obligation is bound by law to deliver power or natural gas to a certain geographic area at prices approved by the Danish Energy Regulatory Authority.
GlossaryQHSE: Quality, health, safety and environment.
Ramp-up: Generation until an offshore wind farm has been completed and commissioned.
ROCs: Renewable obligation certificates issued by Ofgem in the UK to operators of accredited generating stations for the eligible renewable energy they generate. Operators can trade ROCs with other parties.
Stress: Method of measuring the market trading risk of loss on a portfolio from day to day, calculated on a fair-value basis.
Tax equity: An arrangement where an investor obtains rights to federal tax credits and other tax attributes in exchange for a cash contribution.
Thermal generation: Power and heat generated through the combustion of fossil fuels, biomass or waste.
TRIR: In addition to lost-time injuries, total recordable injury rate (TRIR) also includes injuries where the injured person is able to perform restricted work the day after the accident as well as accidents where the injured person has received medical treatment.
TTF: Title Transfer Facility, Dutch gas hub.
TWh: Terawatt hour. The amount of energy generated in one hour with the effect of 1TW. 1TWh is equivalent to 1,000GWh or 1,000,000MWh.
Value at risk (VaR): A financial term used for measur-ing the loss that may occur in connection with a risk position, assuming a certain volatility, and that the position is held for a certain period of time.
Wind speed: Shows the wind speed for Ørsted's offshore wind farms. The wind measurements are weighted on the basis of our generation capacity and can be compared to a normal wind period, based on20 years' historical wind observations.
Ørsted Annual report 2018 Financial statements Management statement, auditor's reports and glossary
192 / 193
Contents

Ørsted A/SKraftværksvej 53DK-7000 Fredericia Tel.: +45 99 55 11 11CVR No. 36213728
https://orsted.com/en
Group CommunicationMartin BarleboTel.: +45 99 55 95 52
Investor RelationsDaniel LerupTel.: +45 99 55 97 22
Design and layoute-Types
Publication:31 January 2019
Front page photo:Burbo Bank Offshore Wind Farm in the Irish Sea of the UK