Original Research Paper Flow patterns and velocity fields in two-dimensional thin slice panel with...
10
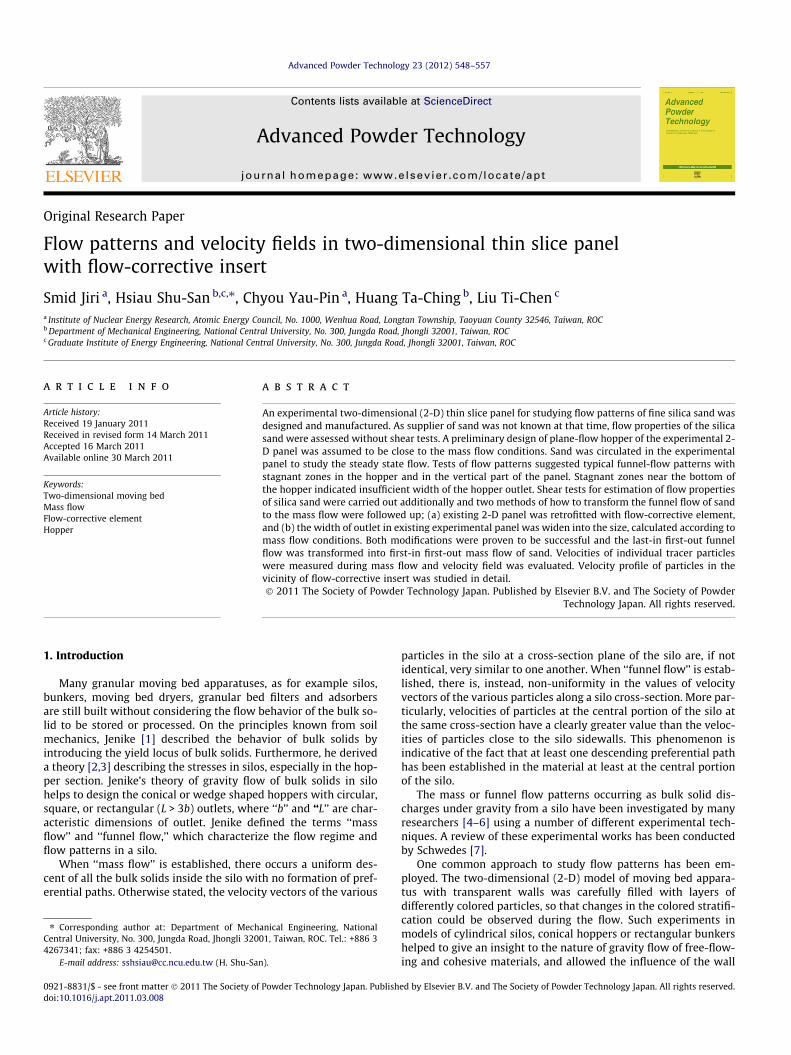
Original Research Paper Flow patterns and velocity fields in two-dimensional thin slice panel with flow-corrective insert Smid Jiri a , Hsiau Shu-San b,c,⇑ , Chyou Yau-Pin a , Huang Ta-Ching b , Liu Ti-Chen c a Institute of Nuclear Energy Research, Atomic Energy Council, No. 1000, Wenhua Road, Longtan Township, Taoyuan County 32546, Taiwan, ROC b Department of Mechanical Engineering, National Central University, No. 300, Jungda Road, Jhongli 32001, Taiwan, ROC c Graduate Institute of Energy Engineering, National Central University, No. 300, Jungda Road, Jhongli 32001, Taiwan, ROC article info Article history: Received 19 January 2011 Received in revised form 14 March 2011 Accepted 16 March 2011 Available online 30 March 2011 Keywords: Two-dimensional moving bed Mass flow Flow-corrective element Hopper abstract An experimental two-dimensional (2-D) thin slice panel for studying flow patterns of fine silica sand was designed and manufactured. As supplier of sand was not known at that time, flow properties of the silica sand were assessed without shear tests. A preliminary design of plane-flow hopper of the experimental 2- D panel was assumed to be close to the mass flow conditions. Sand was circulated in the experimental panel to study the steady state flow. Tests of flow patterns suggested typical funnel-flow patterns with stagnant zones in the hopper and in the vertical part of the panel. Stagnant zones near the bottom of the hopper indicated insufficient width of the hopper outlet. Shear tests for estimation of flow properties of silica sand were carried out additionally and two methods of how to transform the funnel flow of sand to the mass flow were followed up; (a) existing 2-D panel was retrofitted with flow-corrective element, and (b) the width of outlet in existing experimental panel was widen into the size, calculated according to mass flow conditions. Both modifications were proven to be successful and the last-in first-out funnel flow was transformed into first-in first-out mass flow of sand. Velocities of individual tracer particles were measured during mass flow and velocity field was evaluated. Velocity profile of particles in the vicinity of flow-corrective insert was studied in detail. Ó 2011 The Society of Powder Technology Japan. Published by Elsevier B.V. and The Society of Powder Technology Japan. All rights reserved. 1. Introduction Many granular moving bed apparatuses, as for example silos, bunkers, moving bed dryers, granular bed filters and adsorbers are still built without considering the flow behavior of the bulk so- lid to be stored or processed. On the principles known from soil mechanics, Jenike [1] described the behavior of bulk solids by introducing the yield locus of bulk solids. Furthermore, he derived a theory [2,3] describing the stresses in silos, especially in the hop- per section. Jenike’s theory of gravity flow of bulk solids in silo helps to design the conical or wedge shaped hoppers with circular, square, or rectangular (L >3b) outlets, where ‘‘b’’ and ‘‘L’’ are char- acteristic dimensions of outlet. Jenike defined the terms ‘‘mass flow’’ and ‘‘funnel flow,’’ which characterize the flow regime and flow patterns in a silo. When ‘‘mass flow’’ is established, there occurs a uniform des- cent of all the bulk solids inside the silo with no formation of pref- erential paths. Otherwise stated, the velocity vectors of the various particles in the silo at a cross-section plane of the silo are, if not identical, very similar to one another. When ‘‘funnel flow’’ is estab- lished, there is, instead, non-uniformity in the values of velocity vectors of the various particles along a silo cross-section. More par- ticularly, velocities of particles at the central portion of the silo at the same cross-section have a clearly greater value than the veloc- ities of particles close to the silo sidewalls. This phenomenon is indicative of the fact that at least one descending preferential path has been established in the material at least at the central portion of the silo. The mass or funnel flow patterns occurring as bulk solid dis- charges under gravity from a silo have been investigated by many researchers [4–6] using a number of different experimental tech- niques. A review of these experimental works has been conducted by Schwedes [7]. One common approach to study flow patterns has been em- ployed. The two-dimensional (2-D) model of moving bed appara- tus with transparent walls was carefully filled with layers of differently colored particles, so that changes in the colored stratifi- cation could be observed during the flow. Such experiments in models of cylindrical silos, conical hoppers or rectangular bunkers helped to give an insight to the nature of gravity flow of free-flow- ing and cohesive materials, and allowed the influence of the wall 0921-8831/$ - see front matter Ó 2011 The Society of Powder Technology Japan. Published by Elsevier B.V. and The Society of Powder Technology Japan. All rights reserved. doi:10.1016/j.apt.2011.03.008 ⇑ Corresponding author at: Department of Mechanical Engineering, National Central University, No. 300, Jungda Road, Jhongli 32001, Taiwan, ROC. Tel.: +886 3 4267341; fax: +886 3 4254501. E-mail address: [email protected] (H. Shu-San). Advanced Powder Technology 23 (2012) 548–557 Contents lists available at ScienceDirect Advanced Powder Technology journal homepage: www.elsevier.com/locate/apt
-
Upload
independent -
Category
Documents
-
view
4 -
download
0
Transcript of Original Research Paper Flow patterns and velocity fields in two-dimensional thin slice panel with...
Advanced Powder Technology 23 (2012) 548–557
Contents lists available at ScienceDirect
Advanced Powder Technology
journal homepage: www.elsevier .com/locate /apt
Original Research Paper
Flow patterns and velocity fields in two-dimensional thin slice panelwith flow-corrective insert
Smid Jiri a, Hsiau Shu-San b,c,⇑, Chyou Yau-Pin a, Huang Ta-Ching b, Liu Ti-Chen c
a Institute of Nuclear Energy Research, Atomic Energy Council, No. 1000, Wenhua Road, Longtan Township, Taoyuan County 32546, Taiwan, ROCb Department of Mechanical Engineering, National Central University, No. 300, Jungda Road, Jhongli 32001, Taiwan, ROCc Graduate Institute of Energy Engineering, National Central University, No. 300, Jungda Road, Jhongli 32001, Taiwan, ROC
a r t i c l e i n f o a b s t r a c t
Article history:Received 19 January 2011Received in revised form 14 March 2011Accepted 16 March 2011Available online 30 March 2011
Keywords:Two-dimensional moving bedMass flowFlow-corrective elementHopper
0921-8831/$ - see front matter � 2011 The Society ofdoi:10.1016/j.apt.2011.03.008
⇑ Corresponding author at: Department of MechCentral University, No. 300, Jungda Road, Jhongli 3204267341; fax: +886 3 4254501.
E-mail address: [email protected] (H. Shu-Sa
An experimental two-dimensional (2-D) thin slice panel for studying flow patterns of fine silica sand wasdesigned and manufactured. As supplier of sand was not known at that time, flow properties of the silicasand were assessed without shear tests. A preliminary design of plane-flow hopper of the experimental 2-D panel was assumed to be close to the mass flow conditions. Sand was circulated in the experimentalpanel to study the steady state flow. Tests of flow patterns suggested typical funnel-flow patterns withstagnant zones in the hopper and in the vertical part of the panel. Stagnant zones near the bottom ofthe hopper indicated insufficient width of the hopper outlet. Shear tests for estimation of flow propertiesof silica sand were carried out additionally and two methods of how to transform the funnel flow of sandto the mass flow were followed up; (a) existing 2-D panel was retrofitted with flow-corrective element,and (b) the width of outlet in existing experimental panel was widen into the size, calculated according tomass flow conditions. Both modifications were proven to be successful and the last-in first-out funnelflow was transformed into first-in first-out mass flow of sand. Velocities of individual tracer particleswere measured during mass flow and velocity field was evaluated. Velocity profile of particles in thevicinity of flow-corrective insert was studied in detail.� 2011 The Society of Powder Technology Japan. Published by Elsevier B.V. and The Society of Powder
Technology Japan. All rights reserved.
1. Introduction
Many granular moving bed apparatuses, as for example silos,bunkers, moving bed dryers, granular bed filters and adsorbersare still built without considering the flow behavior of the bulk so-lid to be stored or processed. On the principles known from soilmechanics, Jenike [1] described the behavior of bulk solids byintroducing the yield locus of bulk solids. Furthermore, he deriveda theory [2,3] describing the stresses in silos, especially in the hop-per section. Jenike’s theory of gravity flow of bulk solids in silohelps to design the conical or wedge shaped hoppers with circular,square, or rectangular (L > 3b) outlets, where ‘‘b’’ and ‘‘L’’ are char-acteristic dimensions of outlet. Jenike defined the terms ‘‘massflow’’ and ‘‘funnel flow,’’ which characterize the flow regime andflow patterns in a silo.
When ‘‘mass flow’’ is established, there occurs a uniform des-cent of all the bulk solids inside the silo with no formation of pref-erential paths. Otherwise stated, the velocity vectors of the various
Powder Technology Japan. Publish
anical Engineering, National01, Taiwan, ROC. Tel.: +886 3
n).
particles in the silo at a cross-section plane of the silo are, if notidentical, very similar to one another. When ‘‘funnel flow’’ is estab-lished, there is, instead, non-uniformity in the values of velocityvectors of the various particles along a silo cross-section. More par-ticularly, velocities of particles at the central portion of the silo atthe same cross-section have a clearly greater value than the veloc-ities of particles close to the silo sidewalls. This phenomenon isindicative of the fact that at least one descending preferential pathhas been established in the material at least at the central portionof the silo.
The mass or funnel flow patterns occurring as bulk solid dis-charges under gravity from a silo have been investigated by manyresearchers [4–6] using a number of different experimental tech-niques. A review of these experimental works has been conductedby Schwedes [7].
One common approach to study flow patterns has been em-ployed. The two-dimensional (2-D) model of moving bed appara-tus with transparent walls was carefully filled with layers ofdifferently colored particles, so that changes in the colored stratifi-cation could be observed during the flow. Such experiments inmodels of cylindrical silos, conical hoppers or rectangular bunkershelped to give an insight to the nature of gravity flow of free-flow-ing and cohesive materials, and allowed the influence of the wall
ed by Elsevier B.V. and The Society of Powder Technology Japan. All rights reserved.
S. Jiri et al. / Advanced Powder Technology 23 (2012) 548–557 549
angle and the outlet size to be determined. It became evident thatthe flow patterns could be conveniently classified into two groupswhich are now generally known as funnel flow (alternatively ‘‘coreflow’’ or ‘‘plug flow’’) and mass flow [8–10] in agreement with Je-nike’s definition [1].
Two-dimensional modeling of bulk solid flows may not be theaccurate modeling for describing a true 3-D solid flow. No matterhow convenient the 2-D method of observing flow may be, it oftenlends to erroneous observation. Johanson [11] demonstrated theflow around a flat plate insert in 2-D thin slice model of bin withdry sand and colored markers. He compared these flow patternswith the axis-symmetric flow patterns around a circular insert ina cylindrical bin of the same dimensions as the slice model. Thesame sand and marker technique were used. The flow pattern inthe cylindrical bin was exposed by removing the front half of thebin after flow had taken place. Differences in stratification of mark-ers and flow of markers around insert were evident. It appears thatthe only safe way to model flow of bulk solids is in the three-dimensional models of the full size moving bed apparatuses.
The present research tasks are to study the flow patterns in a 2-D thin slice panel with no stagnant regions. As the height of panelwith transparent front and rear glass walls was not critical, it isdecided to design a mass flow hopper of panel according to themethod of Jenike [3]. The mass flow parameters of hopper in panelare calculated for fine silica sand. Flow properties of sand weremeasured using Jenike’s shear tester [3,12].
The contradiction and uncertainty in design of the experimentalpanel may consist, in fact, that the 2-D hopper of our panel satis-fied condition for mass flow, but for factual mass flow in the plane(wedge-shaped) three-dimensional (3-D) hopper. It means that ourdesign method was not compatible with our 2-D model. The designprocedure, flow patterns observation showing funnel flow in 2-Dpanel and retrofitting the panel with saddle roof flow-correctiveinsert are described in this work.
2. Experimental setup and procedure
2.1. Materials and apparatus
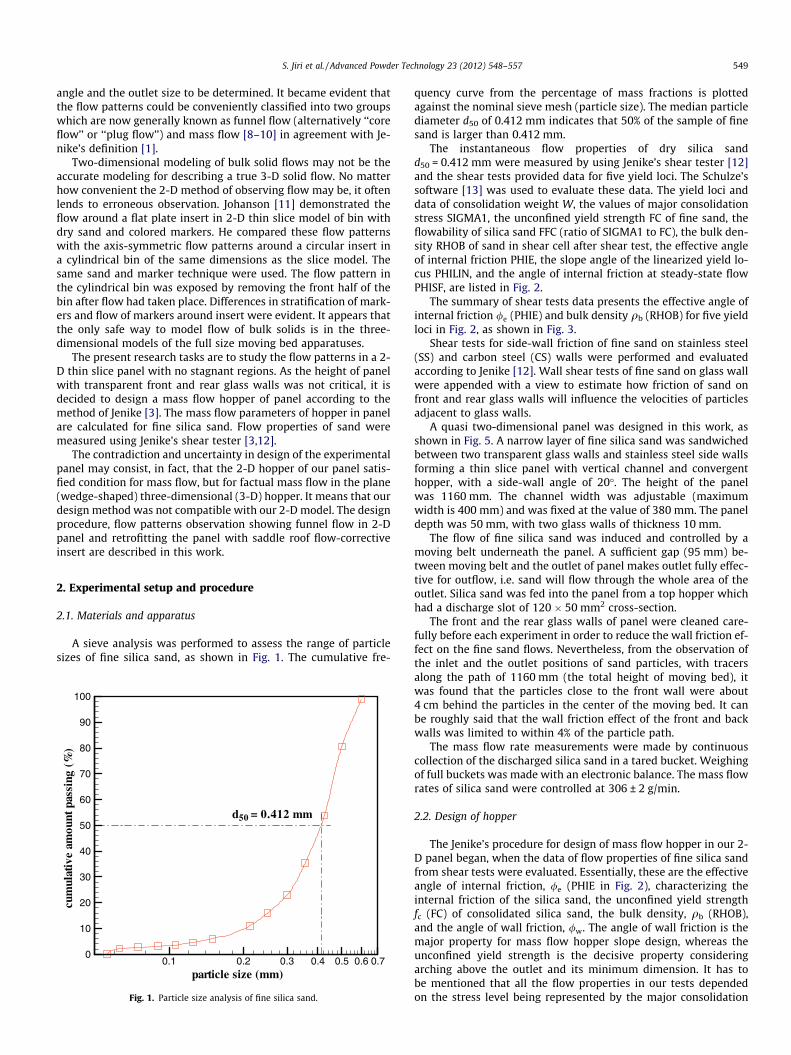
A sieve analysis was performed to assess the range of particlesizes of fine silica sand, as shown in Fig. 1. The cumulative fre-
particle size (mm)
cum
ulat
ive
amou
ntpa
ssin
g(%
)
0.1 0.2 0.3 0.4 0.5 0.6 0.70
10
20
30
40
50
60
70
80
90
100
d50 = 0.412 mm
Fig. 1. Particle size analysis of fine silica sand.
quency curve from the percentage of mass fractions is plottedagainst the nominal sieve mesh (particle size). The median particlediameter d50 of 0.412 mm indicates that 50% of the sample of finesand is larger than 0.412 mm.
The instantaneous flow properties of dry silica sandd50 = 0.412 mm were measured by using Jenike’s shear tester [12]and the shear tests provided data for five yield loci. The Schulze’ssoftware [13] was used to evaluate these data. The yield loci anddata of consolidation weight W, the values of major consolidationstress SIGMA1, the unconfined yield strength FC of fine sand, theflowability of silica sand FFC (ratio of SIGMA1 to FC), the bulk den-sity RHOB of sand in shear cell after shear test, the effective angleof internal friction PHIE, the slope angle of the linearized yield lo-cus PHILIN, and the angle of internal friction at steady-state flowPHISF, are listed in Fig. 2.
The summary of shear tests data presents the effective angle ofinternal friction /e (PHIE) and bulk density qb (RHOB) for five yieldloci in Fig. 2, as shown in Fig. 3.
Shear tests for side-wall friction of fine sand on stainless steel(SS) and carbon steel (CS) walls were performed and evaluatedaccording to Jenike [12]. Wall shear tests of fine sand on glass wallwere appended with a view to estimate how friction of sand onfront and rear glass walls will influence the velocities of particlesadjacent to glass walls.
A quasi two-dimensional panel was designed in this work, asshown in Fig. 5. A narrow layer of fine silica sand was sandwichedbetween two transparent glass walls and stainless steel side wallsforming a thin slice panel with vertical channel and convergenthopper, with a side-wall angle of 20�. The height of the panelwas 1160 mm. The channel width was adjustable (maximumwidth is 400 mm) and was fixed at the value of 380 mm. The paneldepth was 50 mm, with two glass walls of thickness 10 mm.
The flow of fine silica sand was induced and controlled by amoving belt underneath the panel. A sufficient gap (95 mm) be-tween moving belt and the outlet of panel makes outlet fully effec-tive for outflow, i.e. sand will flow through the whole area of theoutlet. Silica sand was fed into the panel from a top hopper whichhad a discharge slot of 120 � 50 mm2 cross-section.
The front and the rear glass walls of panel were cleaned care-fully before each experiment in order to reduce the wall friction ef-fect on the fine sand flows. Nevertheless, from the observation ofthe inlet and the outlet positions of sand particles, with tracersalong the path of 1160 mm (the total height of moving bed), itwas found that the particles close to the front wall were about4 cm behind the particles in the center of the moving bed. It canbe roughly said that the wall friction effect of the front and backwalls was limited to within 4% of the particle path.
The mass flow rate measurements were made by continuouscollection of the discharged silica sand in a tared bucket. Weighingof full buckets was made with an electronic balance. The mass flowrates of silica sand were controlled at 306 ± 2 g/min.
2.2. Design of hopper
The Jenike’s procedure for design of mass flow hopper in our 2-D panel began, when the data of flow properties of fine silica sandfrom shear tests were evaluated. Essentially, these are the effectiveangle of internal friction, /e (PHIE in Fig. 2), characterizing theinternal friction of the silica sand, the unconfined yield strengthfc (FC) of consolidated silica sand, the bulk density, qb (RHOB),and the angle of wall friction, /w. The angle of wall friction is themajor property for mass flow hopper slope design, whereas theunconfined yield strength is the decisive property consideringarching above the outlet and its minimum dimension. It has tobe mentioned that all the flow properties in our tests dependedon the stress level being represented by the major consolidation
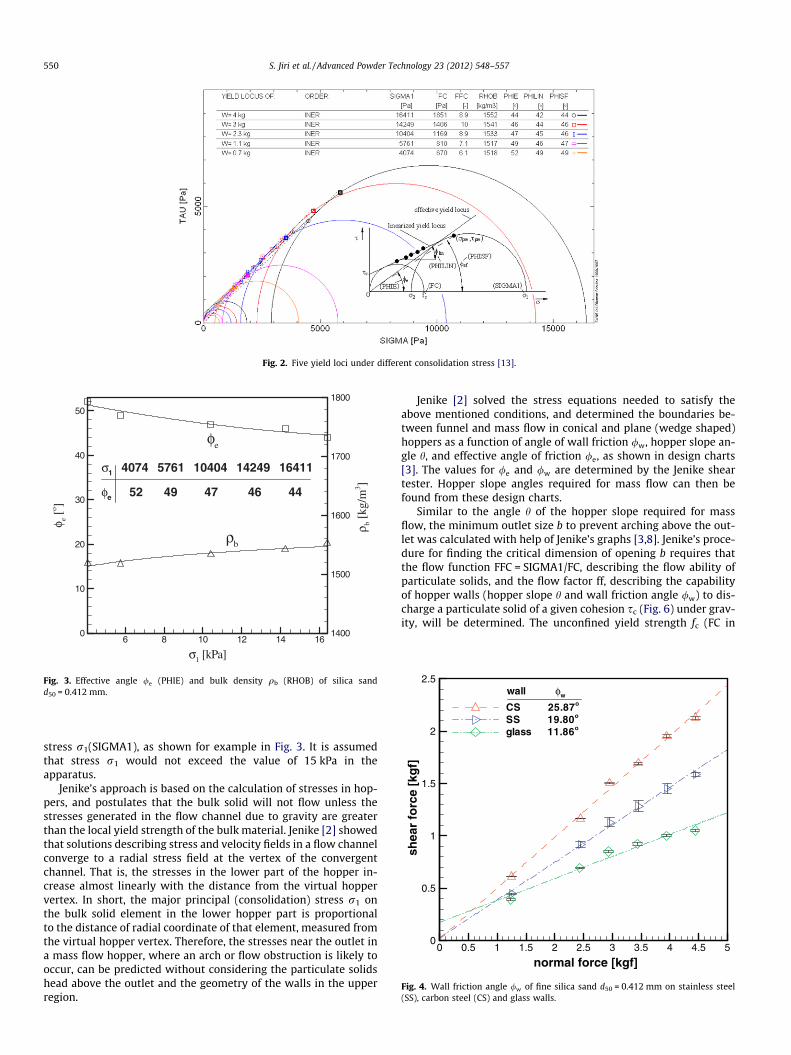
Fig. 2. Five yield loci under different consolidation stress [13].
σ1 [kPa]
φ e[o ]
ρ b[k
g/m
3 ]
6 8 10 12 14 160
10
20
30
40
50
1400
1500
1600
1700
1800
ρb
φe
σ1 4074 5761 10404 14249 16411
φe 52 49 47 46 44
Fig. 3. Effective angle /e (PHIE) and bulk density qb (RHOB) of silica sandd50 = 0.412 mm.
normal force [kgf]
shea
r fo
rce
[kg
f]
0 0.5 1 1.5 2 2.5 3 3.5 4 4.5 50
0.5
1
1.5
2
2.5
CS 25.87o
SS 19.80o
glass 11.86o
wall φw
Fig. 4. Wall friction angle /w of fine silica sand d50 = 0.412 mm on stainless steel(SS), carbon steel (CS) and glass walls.
550 S. Jiri et al. / Advanced Powder Technology 23 (2012) 548–557
stress r1(SIGMA1), as shown for example in Fig. 3. It is assumedthat stress r1 would not exceed the value of 15 kPa in theapparatus.
Jenike’s approach is based on the calculation of stresses in hop-pers, and postulates that the bulk solid will not flow unless thestresses generated in the flow channel due to gravity are greaterthan the local yield strength of the bulk material. Jenike [2] showedthat solutions describing stress and velocity fields in a flow channelconverge to a radial stress field at the vertex of the convergentchannel. That is, the stresses in the lower part of the hopper in-crease almost linearly with the distance from the virtual hoppervertex. In short, the major principal (consolidation) stress r1 onthe bulk solid element in the lower hopper part is proportionalto the distance of radial coordinate of that element, measured fromthe virtual hopper vertex. Therefore, the stresses near the outlet ina mass flow hopper, where an arch or flow obstruction is likely tooccur, can be predicted without considering the particulate solidshead above the outlet and the geometry of the walls in the upperregion.
Jenike [2] solved the stress equations needed to satisfy theabove mentioned conditions, and determined the boundaries be-tween funnel and mass flow in conical and plane (wedge shaped)hoppers as a function of angle of wall friction /w, hopper slope an-gle h, and effective angle of friction /e, as shown in design charts[3]. The values for /e and /w are determined by the Jenike sheartester. Hopper slope angles required for mass flow can then befound from these design charts.
Similar to the angle h of the hopper slope required for massflow, the minimum outlet size b to prevent arching above the out-let was calculated with help of Jenike’s graphs [3,8]. Jenike’s proce-dure for finding the critical dimension of opening b requires thatthe flow function FFC = SIGMA1/FC, describing the flow ability ofparticulate solids, and the flow factor ff, describing the capabilityof hopper walls (hopper slope h and wall friction angle /w) to dis-charge a particulate solid of a given cohesion sc (Fig. 6) under grav-ity, will be determined. The unconfined yield strength fc (FC in
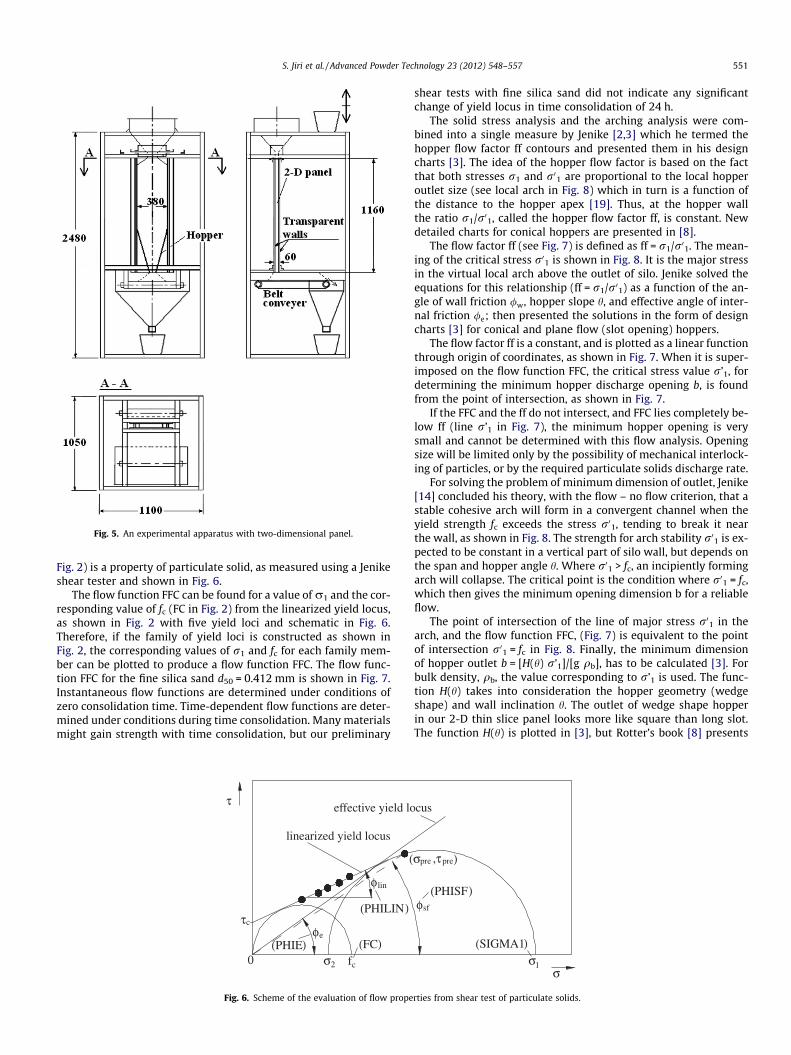
Fig. 5. An experimental apparatus with two-dimensional panel.
S. Jiri et al. / Advanced Powder Technology 23 (2012) 548–557 551
Fig. 2) is a property of particulate solid, as measured using a Jenikeshear tester and shown in Fig. 6.
The flow function FFC can be found for a value of r1 and the cor-responding value of fc (FC in Fig. 2) from the linearized yield locus,as shown in Fig. 2 with five yield loci and schematic in Fig. 6.Therefore, if the family of yield loci is constructed as shown inFig. 2, the corresponding values of r1 and fc for each family mem-ber can be plotted to produce a flow function FFC. The flow func-tion FFC for the fine silica sand d50 = 0.412 mm is shown in Fig. 7.Instantaneous flow functions are determined under conditions ofzero consolidation time. Time-dependent flow functions are deter-mined under conditions during time consolidation. Many materialsmight gain strength with time consolidation, but our preliminary
0
τc
τ
linearized yield locus
σ2 fc
effective yield lo
φlin
eφ
(
(FC)
(PHILIN)
)(PHIE
Fig. 6. Scheme of the evaluation of flow prope
shear tests with fine silica sand did not indicate any significantchange of yield locus in time consolidation of 24 h.
The solid stress analysis and the arching analysis were com-bined into a single measure by Jenike [2,3] which he termed thehopper flow factor ff contours and presented them in his designcharts [3]. The idea of the hopper flow factor is based on the factthat both stresses r1 and r01 are proportional to the local hopperoutlet size (see local arch in Fig. 8) which in turn is a function ofthe distance to the hopper apex [19]. Thus, at the hopper wallthe ratio r1/r01, called the hopper flow factor ff, is constant. Newdetailed charts for conical hoppers are presented in [8].
The flow factor ff (see Fig. 7) is defined as ff = r1/r01. The mean-ing of the critical stress r01 is shown in Fig. 8. It is the major stressin the virtual local arch above the outlet of silo. Jenike solved theequations for this relationship (ff = r1/r01) as a function of the an-gle of wall friction /w, hopper slope h, and effective angle of inter-nal friction /e; then presented the solutions in the form of designcharts [3] for conical and plane flow (slot opening) hoppers.
The flow factor ff is a constant, and is plotted as a linear functionthrough origin of coordinates, as shown in Fig. 7. When it is super-imposed on the flow function FFC, the critical stress value r’1, fordetermining the minimum hopper discharge opening b, is foundfrom the point of intersection, as shown in Fig. 7.
If the FFC and the ff do not intersect, and FFC lies completely be-low ff (line r’1 in Fig. 7), the minimum hopper opening is verysmall and cannot be determined with this flow analysis. Openingsize will be limited only by the possibility of mechanical interlock-ing of particles, or by the required particulate solids discharge rate.
For solving the problem of minimum dimension of outlet, Jenike[14] concluded his theory, with the flow – no flow criterion, that astable cohesive arch will form in a convergent channel when theyield strength fc exceeds the stress r01, tending to break it nearthe wall, as shown in Fig. 8. The strength for arch stability r01 is ex-pected to be constant in a vertical part of silo wall, but depends onthe span and hopper angle h. Where r01 > fc, an incipiently formingarch will collapse. The critical point is the condition where r01 = fc,which then gives the minimum opening dimension b for a reliableflow.
The point of intersection of the line of major stress r01 in thearch, and the flow function FFC, (Fig. 7) is equivalent to the pointof intersection r01 = fc in Fig. 8. Finally, the minimum dimensionof hopper outlet b = [H(h) r’1]/[g qb], has to be calculated [3]. Forbulk density, qb, the value corresponding to r’1 is used. The func-tion H(h) takes into consideration the hopper geometry (wedgeshape) and wall inclination h. The outlet of wedge shape hopperin our 2-D thin slice panel looks more like square than long slot.The function H(h) is plotted in [3], but Rotter’s book [8] presents
σ1σ
cus
sfφ
preσ ,τpre)
)(PHISF
)(SIGMA1
rties from shear test of particulate solids.
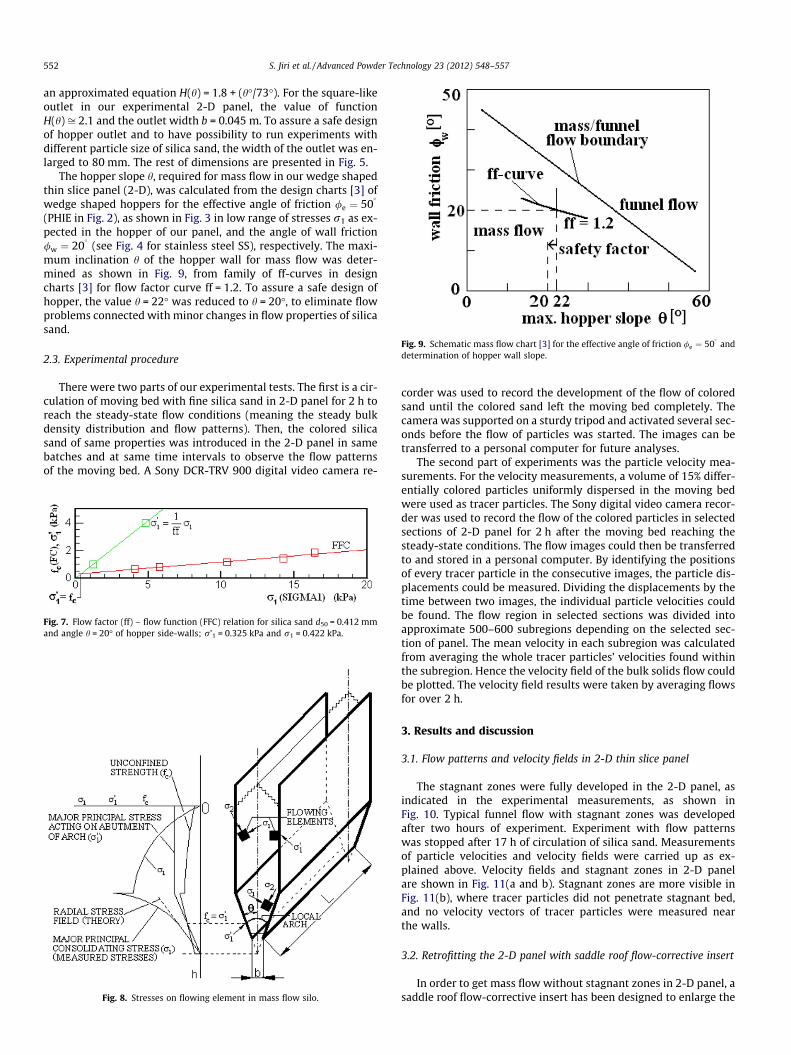
Fig. 9. Schematic mass flow chart [3] for the effective angle of friction /e ¼ 50�
anddetermination of hopper wall slope.
552 S. Jiri et al. / Advanced Powder Technology 23 (2012) 548–557
an approximated equation H(h) = 1.8 + (h�/73�). For the square-likeoutlet in our experimental 2-D panel, the value of functionH(h) ffi 2.1 and the outlet width b = 0.045 m. To assure a safe designof hopper outlet and to have possibility to run experiments withdifferent particle size of silica sand, the width of the outlet was en-larged to 80 mm. The rest of dimensions are presented in Fig. 5.
The hopper slope h, required for mass flow in our wedge shapedthin slice panel (2-D), was calculated from the design charts [3] ofwedge shaped hoppers for the effective angle of friction /e ¼ 50
�
(PHIE in Fig. 2), as shown in Fig. 3 in low range of stresses r1 as ex-pected in the hopper of our panel, and the angle of wall friction/w ¼ 20
�(see Fig. 4 for stainless steel SS), respectively. The maxi-
mum inclination h of the hopper wall for mass flow was deter-mined as shown in Fig. 9, from family of ff-curves in designcharts [3] for flow factor curve ff = 1.2. To assure a safe design ofhopper, the value h = 22� was reduced to h = 20�, to eliminate flowproblems connected with minor changes in flow properties of silicasand.
2.3. Experimental procedure
There were two parts of our experimental tests. The first is a cir-culation of moving bed with fine silica sand in 2-D panel for 2 h toreach the steady-state flow conditions (meaning the steady bulkdensity distribution and flow patterns). Then, the colored silicasand of same properties was introduced in the 2-D panel in samebatches and at same time intervals to observe the flow patternsof the moving bed. A Sony DCR-TRV 900 digital video camera re-
Fig. 7. Flow factor (ff) – flow function (FFC) relation for silica sand d50 = 0.412 mmand angle h = 20� of hopper side-walls; r’1 = 0.325 kPa and r1 = 0.422 kPa.
Fig. 8. Stresses on flowing element in mass flow silo.
corder was used to record the development of the flow of coloredsand until the colored sand left the moving bed completely. Thecamera was supported on a sturdy tripod and activated several sec-onds before the flow of particles was started. The images can betransferred to a personal computer for future analyses.
The second part of experiments was the particle velocity mea-surements. For the velocity measurements, a volume of 15% differ-entially colored particles uniformly dispersed in the moving bedwere used as tracer particles. The Sony digital video camera recor-der was used to record the flow of the colored particles in selectedsections of 2-D panel for 2 h after the moving bed reaching thesteady-state conditions. The flow images could then be transferredto and stored in a personal computer. By identifying the positionsof every tracer particle in the consecutive images, the particle dis-placements could be measured. Dividing the displacements by thetime between two images, the individual particle velocities couldbe found. The flow region in selected sections was divided intoapproximate 500–600 subregions depending on the selected sec-tion of panel. The mean velocity in each subregion was calculatedfrom averaging the whole tracer particles’ velocities found withinthe subregion. Hence the velocity field of the bulk solids flow couldbe plotted. The velocity field results were taken by averaging flowsfor over 2 h.
3. Results and discussion
3.1. Flow patterns and velocity fields in 2-D thin slice panel
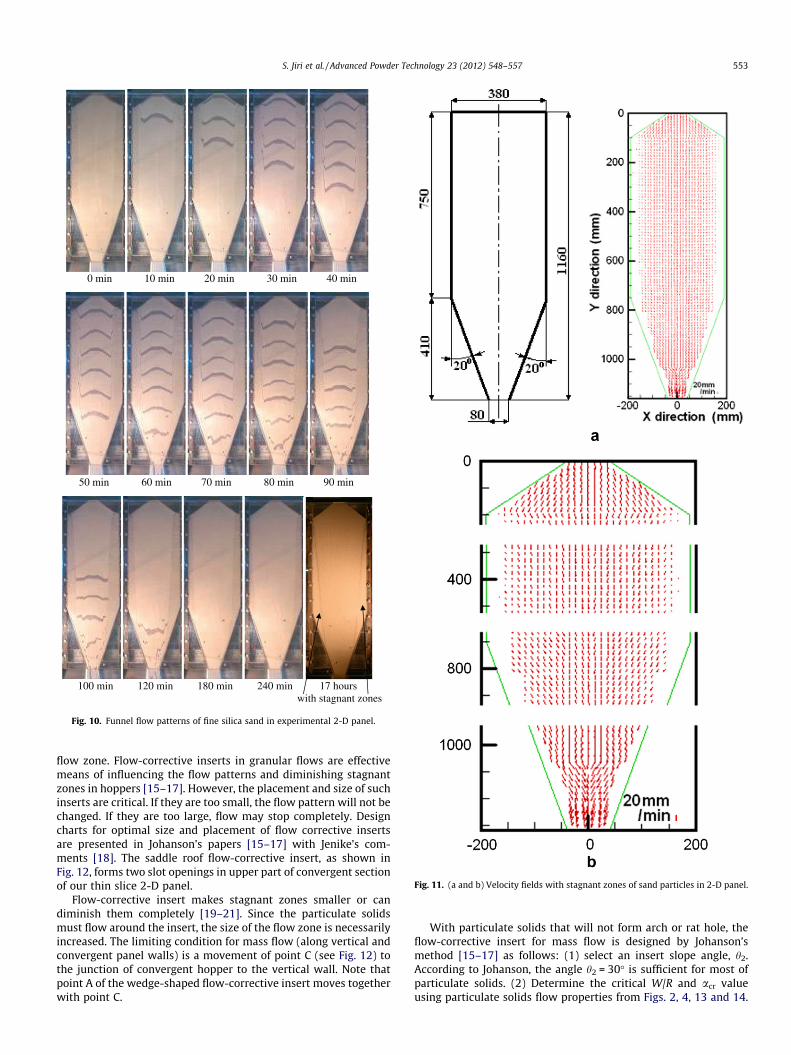
The stagnant zones were fully developed in the 2-D panel, asindicated in the experimental measurements, as shown inFig. 10. Typical funnel flow with stagnant zones was developedafter two hours of experiment. Experiment with flow patternswas stopped after 17 h of circulation of silica sand. Measurementsof particle velocities and velocity fields were carried up as ex-plained above. Velocity fields and stagnant zones in 2-D panelare shown in Fig. 11(a and b). Stagnant zones are more visible inFig. 11(b), where tracer particles did not penetrate stagnant bed,and no velocity vectors of tracer particles were measured nearthe walls.
3.2. Retrofitting the 2-D panel with saddle roof flow-corrective insert
In order to get mass flow without stagnant zones in 2-D panel, asaddle roof flow-corrective insert has been designed to enlarge the
0 min 10 min 20 min 30 min 40 min
50 min 60 min 70 min 80 min 90 min
100 min 120 min 180 min 240 min 17 hours with stagnant zones
Fig. 10. Funnel flow patterns of fine silica sand in experimental 2-D panel.
Fig. 11. (a and b) Velocity fields with stagnant zones of sand particles in 2-D panel.
S. Jiri et al. / Advanced Powder Technology 23 (2012) 548–557 553
flow zone. Flow-corrective inserts in granular flows are effectivemeans of influencing the flow patterns and diminishing stagnantzones in hoppers [15–17]. However, the placement and size of suchinserts are critical. If they are too small, the flow pattern will not bechanged. If they are too large, flow may stop completely. Designcharts for optimal size and placement of flow corrective insertsare presented in Johanson’s papers [15–17] with Jenike’s com-ments [18]. The saddle roof flow-corrective insert, as shown inFig. 12, forms two slot openings in upper part of convergent sectionof our thin slice 2-D panel.
Flow-corrective insert makes stagnant zones smaller or candiminish them completely [19–21]. Since the particulate solidsmust flow around the insert, the size of the flow zone is necessarilyincreased. The limiting condition for mass flow (along vertical andconvergent panel walls) is a movement of point C (see Fig. 12) tothe junction of convergent hopper to the vertical wall. Note thatpoint A of the wedge-shaped flow-corrective insert moves togetherwith point C.
With particulate solids that will not form arch or rat hole, theflow-corrective insert for mass flow is designed by Johanson’smethod [15–17] as follows: (1) select an insert slope angle, h2.According to Johanson, the angle h2 = 30� is sufficient for most ofparticulate solids. (2) Determine the critical W/R and acr valueusing particulate solids flow properties from Figs. 2, 4, 13 and 14.
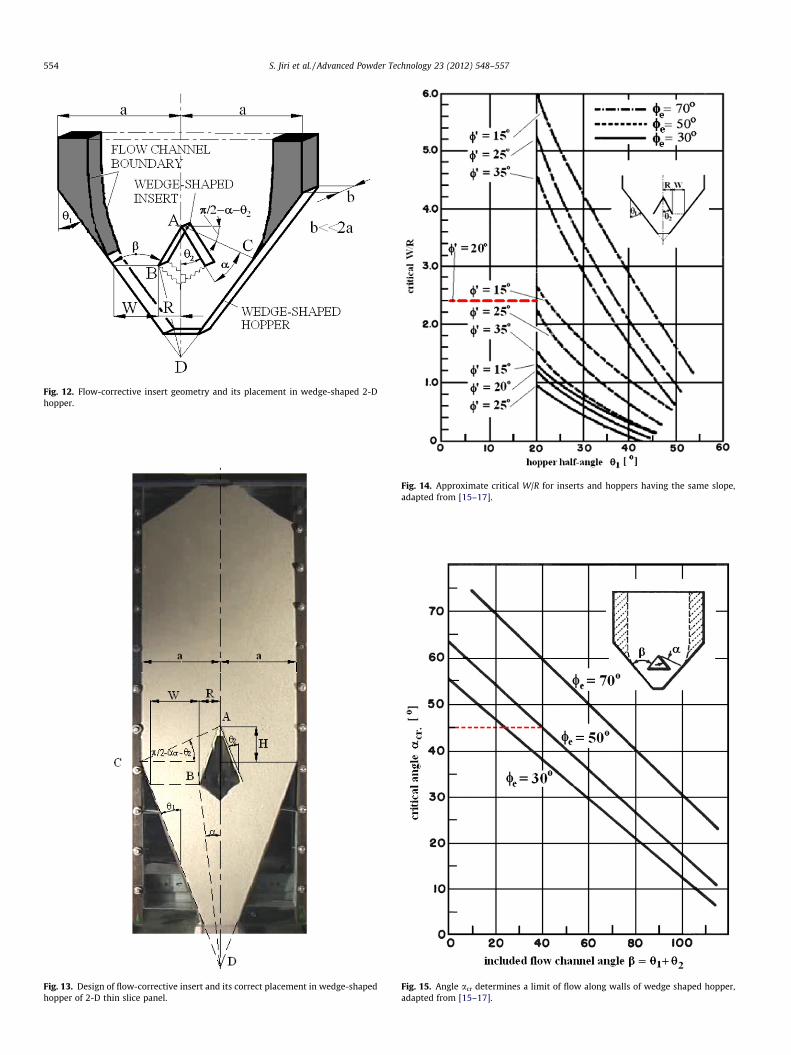
Fig. 12. Flow-corrective insert geometry and its placement in wedge-shaped 2-Dhopper.
Fig. 13. Design of flow-corrective insert and its correct placement in wedge-shapedhopper of 2-D thin slice panel.
Fig. 14. Approximate critical W/R for inserts and hoppers having the same slope,adapted from [15–17].
Fig. 15. Angle acr determines a limit of flow along walls of wedge shaped hopper,adapted from [15–17].
554 S. Jiri et al. / Advanced Powder Technology 23 (2012) 548–557
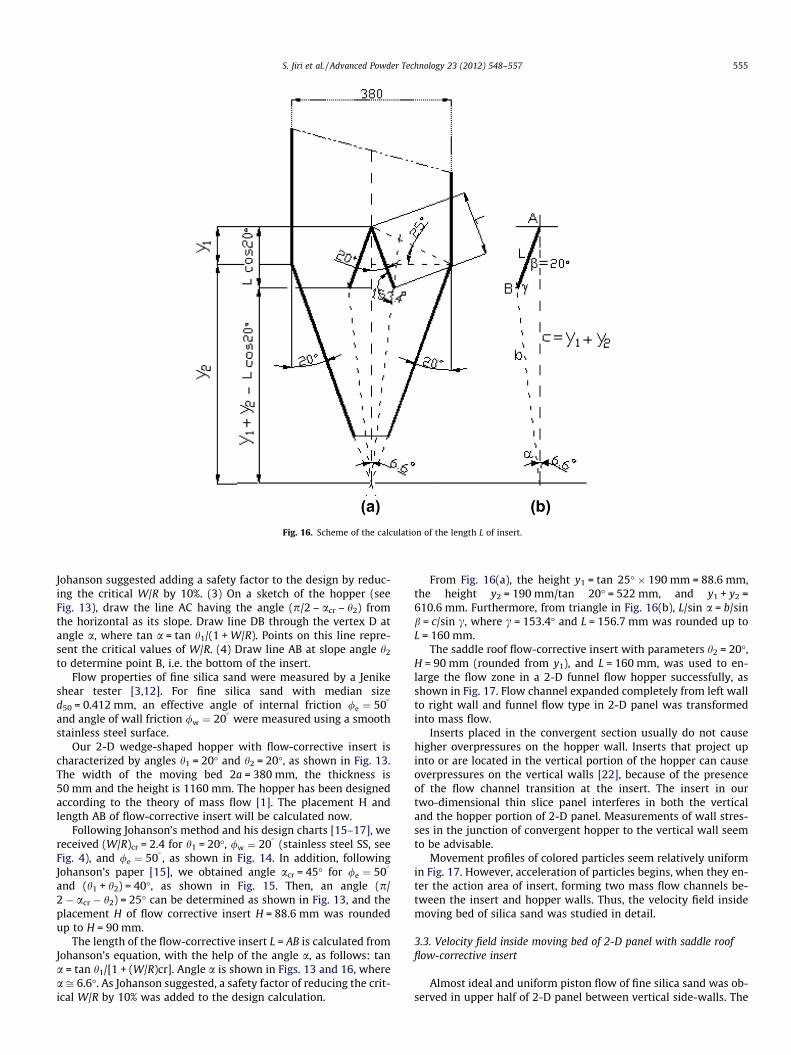
Fig. 16. Scheme of the calculation of the length L of insert.
S. Jiri et al. / Advanced Powder Technology 23 (2012) 548–557 555
Johanson suggested adding a safety factor to the design by reduc-ing the critical W/R by 10%. (3) On a sketch of the hopper (seeFig. 13), draw the line AC having the angle (p/2 – acr – h2) fromthe horizontal as its slope. Draw line DB through the vertex D atangle a, where tan a = tan h1/(1 + W/R). Points on this line repre-sent the critical values of W/R. (4) Draw line AB at slope angle h2
to determine point B, i.e. the bottom of the insert.Flow properties of fine silica sand were measured by a Jenike
shear tester [3,12]. For fine silica sand with median sized50 = 0.412 mm, an effective angle of internal friction /e ¼ 50
�
and angle of wall friction /w ¼ 20�
were measured using a smoothstainless steel surface.
Our 2-D wedge-shaped hopper with flow-corrective insert ischaracterized by angles h1 = 20� and h2 = 20�, as shown in Fig. 13.The width of the moving bed 2a = 380 mm, the thickness is50 mm and the height is 1160 mm. The hopper has been designedaccording to the theory of mass flow [1]. The placement H andlength AB of flow-corrective insert will be calculated now.
Following Johanson’s method and his design charts [15–17], wereceived (W/R)cr = 2.4 for h1 = 20�, /w ¼ 20
�(stainless steel SS, see
Fig. 4), and /e ¼ 50�, as shown in Fig. 14. In addition, following
Johanson’s paper [15], we obtained angle acr = 45� for /e ¼ 50�
and (h1 + h2) = 40�, as shown in Fig. 15. Then, an angle (p/2 � acr � h2) = 25� can be determined as shown in Fig. 13, and theplacement H of flow corrective insert H = 88.6 mm was roundedup to H = 90 mm.
The length of the flow-corrective insert L = AB is calculated fromJohanson’s equation, with the help of the angle a, as follows: tana = tan h1/[1 + (W/R)cr]. Angle a is shown in Figs. 13 and 16, wherea ffi 6.6�. As Johanson suggested, a safety factor of reducing the crit-ical W/R by 10% was added to the design calculation.
From Fig. 16(a), the height y1 = tan 25� � 190 mm = 88.6 mm,the height y2 = 190 mm/tan 20� = 522 mm, and y1 + y2 =610.6 mm. Furthermore, from triangle in Fig. 16(b), L/sin a = b/sinb = c/sin c, where c = 153.4� and L = 156.7 mm was rounded up toL = 160 mm.
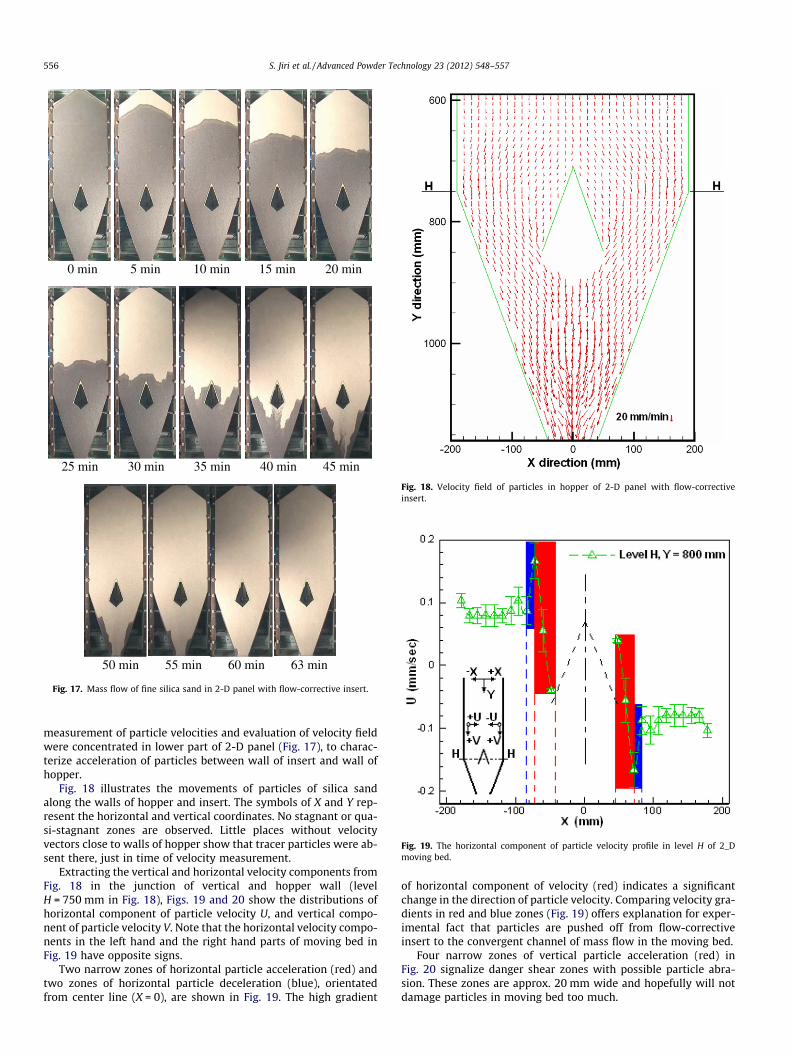
The saddle roof flow-corrective insert with parameters h2 = 20�,H = 90 mm (rounded from y1), and L = 160 mm, was used to en-large the flow zone in a 2-D funnel flow hopper successfully, asshown in Fig. 17. Flow channel expanded completely from left wallto right wall and funnel flow type in 2-D panel was transformedinto mass flow.
Inserts placed in the convergent section usually do not causehigher overpressures on the hopper wall. Inserts that project upinto or are located in the vertical portion of the hopper can causeoverpressures on the vertical walls [22], because of the presenceof the flow channel transition at the insert. The insert in ourtwo-dimensional thin slice panel interferes in both the verticaland the hopper portion of 2-D panel. Measurements of wall stres-ses in the junction of convergent hopper to the vertical wall seemto be advisable.
Movement profiles of colored particles seem relatively uniformin Fig. 17. However, acceleration of particles begins, when they en-ter the action area of insert, forming two mass flow channels be-tween the insert and hopper walls. Thus, the velocity field insidemoving bed of silica sand was studied in detail.
3.3. Velocity field inside moving bed of 2-D panel with saddle roofflow-corrective insert
Almost ideal and uniform piston flow of fine silica sand was ob-served in upper half of 2-D panel between vertical side-walls. The
0 min 5 min 10 min 15 min 20 min
25 min 30 min 35 min 40 min 45 min
50 min 55 min 60 min 63 min
Fig. 17. Mass flow of fine silica sand in 2-D panel with flow-corrective insert.
Fig. 18. Velocity field of particles in hopper of 2-D panel with flow-correctiveinsert.
Fig. 19. The horizontal component of particle velocity profile in level H of 2_Dmoving bed.
556 S. Jiri et al. / Advanced Powder Technology 23 (2012) 548–557
measurement of particle velocities and evaluation of velocity fieldwere concentrated in lower part of 2-D panel (Fig. 17), to charac-terize acceleration of particles between wall of insert and wall ofhopper.
Fig. 18 illustrates the movements of particles of silica sandalong the walls of hopper and insert. The symbols of X and Y rep-resent the horizontal and vertical coordinates. No stagnant or qua-si-stagnant zones are observed. Little places without velocityvectors close to walls of hopper show that tracer particles were ab-sent there, just in time of velocity measurement.
Extracting the vertical and horizontal velocity components fromFig. 18 in the junction of vertical and hopper wall (levelH = 750 mm in Fig. 18), Figs. 19 and 20 show the distributions ofhorizontal component of particle velocity U, and vertical compo-nent of particle velocity V. Note that the horizontal velocity compo-nents in the left hand and the right hand parts of moving bed inFig. 19 have opposite signs.
Two narrow zones of horizontal particle acceleration (red) andtwo zones of horizontal particle deceleration (blue), orientatedfrom center line (X = 0), are shown in Fig. 19. The high gradient
of horizontal component of velocity (red) indicates a significantchange in the direction of particle velocity. Comparing velocity gra-dients in red and blue zones (Fig. 19) offers explanation for exper-imental fact that particles are pushed off from flow-correctiveinsert to the convergent channel of mass flow in the moving bed.
Four narrow zones of vertical particle acceleration (red) inFig. 20 signalize danger shear zones with possible particle abra-sion. These zones are approx. 20 mm wide and hopefully will notdamage particles in moving bed too much.
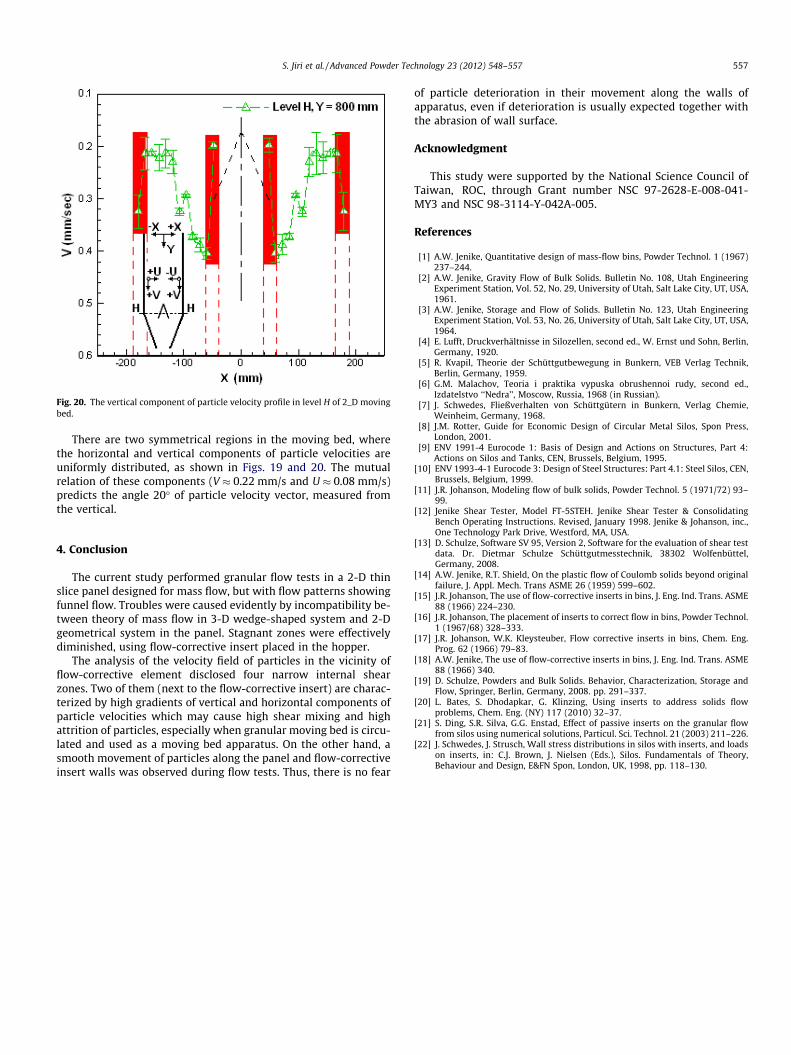
Fig. 20. The vertical component of particle velocity profile in level H of 2_D movingbed.
S. Jiri et al. / Advanced Powder Technology 23 (2012) 548–557 557
There are two symmetrical regions in the moving bed, wherethe horizontal and vertical components of particle velocities areuniformly distributed, as shown in Figs. 19 and 20. The mutualrelation of these components (V � 0.22 mm/s and U � 0.08 mm/s)predicts the angle 20� of particle velocity vector, measured fromthe vertical.
4. Conclusion
The current study performed granular flow tests in a 2-D thinslice panel designed for mass flow, but with flow patterns showingfunnel flow. Troubles were caused evidently by incompatibility be-tween theory of mass flow in 3-D wedge-shaped system and 2-Dgeometrical system in the panel. Stagnant zones were effectivelydiminished, using flow-corrective insert placed in the hopper.
The analysis of the velocity field of particles in the vicinity offlow-corrective element disclosed four narrow internal shearzones. Two of them (next to the flow-corrective insert) are charac-terized by high gradients of vertical and horizontal components ofparticle velocities which may cause high shear mixing and highattrition of particles, especially when granular moving bed is circu-lated and used as a moving bed apparatus. On the other hand, asmooth movement of particles along the panel and flow-correctiveinsert walls was observed during flow tests. Thus, there is no fear
of particle deterioration in their movement along the walls ofapparatus, even if deterioration is usually expected together withthe abrasion of wall surface.
Acknowledgment
This study were supported by the National Science Council ofTaiwan, ROC, through Grant number NSC 97-2628-E-008-041-MY3 and NSC 98-3114-Y-042A-005.
References
[1] A.W. Jenike, Quantitative design of mass-flow bins, Powder Technol. 1 (1967)237–244.
[2] A.W. Jenike, Gravity Flow of Bulk Solids. Bulletin No. 108, Utah EngineeringExperiment Station, Vol. 52, No. 29, University of Utah, Salt Lake City, UT, USA,1961.
[3] A.W. Jenike, Storage and Flow of Solids. Bulletin No. 123, Utah EngineeringExperiment Station, Vol. 53, No. 26, University of Utah, Salt Lake City, UT, USA,1964.
[4] E. Lufft, Druckverhältnisse in Silozellen, second ed., W. Ernst und Sohn, Berlin,Germany, 1920.
[5] R. Kvapil, Theorie der Schüttgutbewegung in Bunkern, VEB Verlag Technik,Berlin, Germany, 1959.
[6] G.M. Malachov, Teoria i praktika vypuska obrushennoi rudy, second ed.,Izdatelstvo ‘‘Nedra’’, Moscow, Russia, 1968 (in Russian).
[7] J. Schwedes, Fließverhalten von Schüttgütern in Bunkern, Verlag Chemie,Weinheim, Germany, 1968.
[8] J.M. Rotter, Guide for Economic Design of Circular Metal Silos, Spon Press,London, 2001.
[9] ENV 1991-4 Eurocode 1: Basis of Design and Actions on Structures, Part 4:Actions on Silos and Tanks, CEN, Brussels, Belgium, 1995.
[10] ENV 1993-4-1 Eurocode 3: Design of Steel Structures: Part 4.1: Steel Silos, CEN,Brussels, Belgium, 1999.
[11] J.R. Johanson, Modeling flow of bulk solids, Powder Technol. 5 (1971/72) 93–99.
[12] Jenike Shear Tester, Model FT-5STEH. Jenike Shear Tester & ConsolidatingBench Operating Instructions. Revised, January 1998. Jenike & Johanson, inc.,One Technology Park Drive, Westford, MA, USA.
[13] D. Schulze, Software SV 95, Version 2, Software for the evaluation of shear testdata. Dr. Dietmar Schulze Schüttgutmesstechnik, 38302 Wolfenbüttel,Germany, 2008.
[14] A.W. Jenike, R.T. Shield, On the plastic flow of Coulomb solids beyond originalfailure, J. Appl. Mech. Trans ASME 26 (1959) 599–602.
[15] J.R. Johanson, The use of flow-corrective inserts in bins, J. Eng. Ind. Trans. ASME88 (1966) 224–230.
[16] J.R. Johanson, The placement of inserts to correct flow in bins, Powder Technol.1 (1967/68) 328–333.
[17] J.R. Johanson, W.K. Kleysteuber, Flow corrective inserts in bins, Chem. Eng.Prog. 62 (1966) 79–83.
[18] A.W. Jenike, The use of flow-corrective inserts in bins, J. Eng. Ind. Trans. ASME88 (1966) 340.
[19] D. Schulze, Powders and Bulk Solids. Behavior, Characterization, Storage andFlow, Springer, Berlin, Germany, 2008. pp. 291–337.
[20] L. Bates, S. Dhodapkar, G. Klinzing, Using inserts to address solids flowproblems, Chem. Eng. (NY) 117 (2010) 32–37.
[21] S. Ding, S.R. Silva, G.G. Enstad, Effect of passive inserts on the granular flowfrom silos using numerical solutions, Particul. Sci. Technol. 21 (2003) 211–226.
[22] J. Schwedes, J. Strusch, Wall stress distributions in silos with inserts, and loadson inserts, in: C.J. Brown, J. Nielsen (Eds.), Silos. Fundamentals of Theory,Behaviour and Design, E&FN Spon, London, UK, 1998, pp. 118–130.