Can Walmart make us healthier? The effect of market forces ...
Upload
independentCategory
view
5download
0
Flow Porometry:What Can Flow Porometry Do For Us?
Akshaya Jena and Krishna Gupta.Porous materials, Inc.
83 Brown Road, Ithaca, NY 14850, USA
Abstract
Use of modern technology has made flow porometry a very powerful and versatiletool for determination of a wide variety of pore structure characteristics of filtrationmedia. The technique is described. Test results have been presented to demonstrate theuse of the technique for measurement of pore structure characteristics. Measurablecharacteristics include the constricted pore diameter, the largest pore diameter, the meanflow pore diameter, pore distribution, gas permeability, liquid permeability, envelopesurface area and effects of operational variables such as temperature, pressure, chemicalenvironment and stress. Applications of the technique including pore characteristics inthe thickness direction, pore characteristics in the x-y plane, properties of individuallayers of multi-layered products determined in-situ without separating the layers andevaluation of properties without cutting samples and damaging the products, have beenillustrated.
Introduction
Filtration media may contain three kinds of pores; closed pores, blind pores andthrough pores (Figure 1). Closed pores are not accessible. Blind pores do not permit flow.Through pores permit flow. The diameter of the through pore at its most constricted partdetermines flow and is equal to size of the smallest particle that would be prevented frompassing through the filtration media (Figure 2a). The largest through pore constricteddiameter, the mean flow pore diameter and the pore distribution determine the efficiencyof separation by the filtration media. Similarly, Liquid permeability determines the rate ofthe filtration process. For separation of small solids from gases, external surface area(surface area of through pores) is important because small particles tend to stick to thesurface (Figure 2b). The rates of such filtration processes are determined by gaspermeability. All these important characteristics and the effects of operational variablescan be determined by a single instrument based on flow porometry. No other instrumentis capable of such versatility. The technique and its applications are discussed in thispaper.

Figure 1. Three possible kinds of pores.
(a) Constricted pore diameter (b) Envelope (external) surface area
Figure 2. Important characteristics of porous media for filtration
Flow Porometry
Principle A liquid is selected that does not react with the sample and spontaneously fills thepores of the sample (wetting liquid) [1]. A pressurized non-reacting gas is used to removeliquid from pores and permit gas flow (Figure 3).
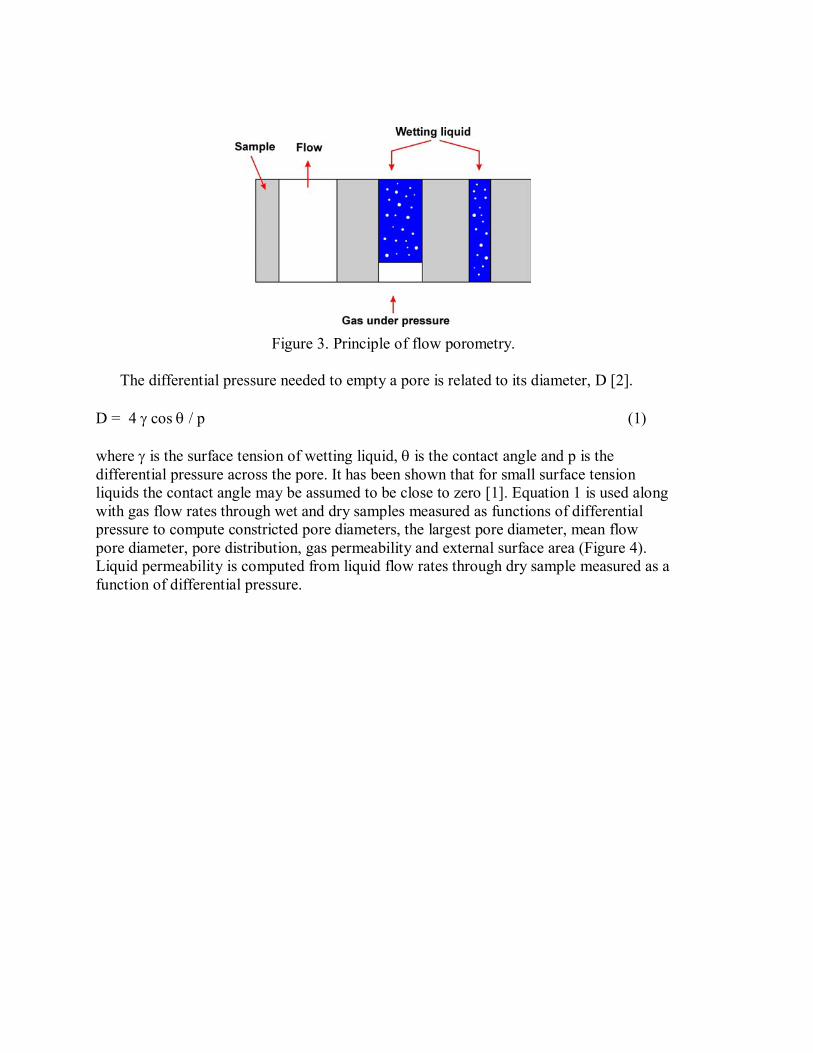
Figure 3. Principle of flow porometry.
The differential pressure needed to empty a pore is related to its diameter, D [2].
D = 4 γ cos θ / p (1)
where γ is the surface tension of wetting liquid, θ is the contact angle and p is thedifferential pressure across the pore. It has been shown that for small surface tensionliquids the contact angle may be assumed to be close to zero [1]. Equation 1 is used alongwith gas flow rates through wet and dry samples measured as functions of differentialpressure to compute constricted pore diameters, the largest pore diameter, mean flowpore diameter, pore distribution, gas permeability and external surface area (Figure 4).Liquid permeability is computed from liquid flow rates through dry sample measured as afunction of differential pressure.

(a)
(b)
Figure 4. Pore characteristics obtainable from measured flow rates and pressures. Wetand dry curves represent flows through wet and dry samples respectively. Half-dry curveis computed to yield half of the flow rate through dry sample (dry curve). (a) Porediameters and permeability. (b) pore distribution.
Definition of pore diameter Equating the work done by the gas in displacing the liquid at a certain location in thepore to the increase in surface free energy due to replacement of liquid/solid surface bythe gas/solid surface, it can be shown that [2]:
PdV = γ cos θ dS (2)
where dV is the volume of liquid displaced in the pore and dS is the increase in thegas/solid interfacial area (decrease in the liquid/solid interfacial area). Pore diameter D isdefined (Figure 5) such that:
[dS / dV] pore = [dS / dV] circular opening of diameter D = 4/D (3)
Equation 1 follows from Equations 2 & 3.
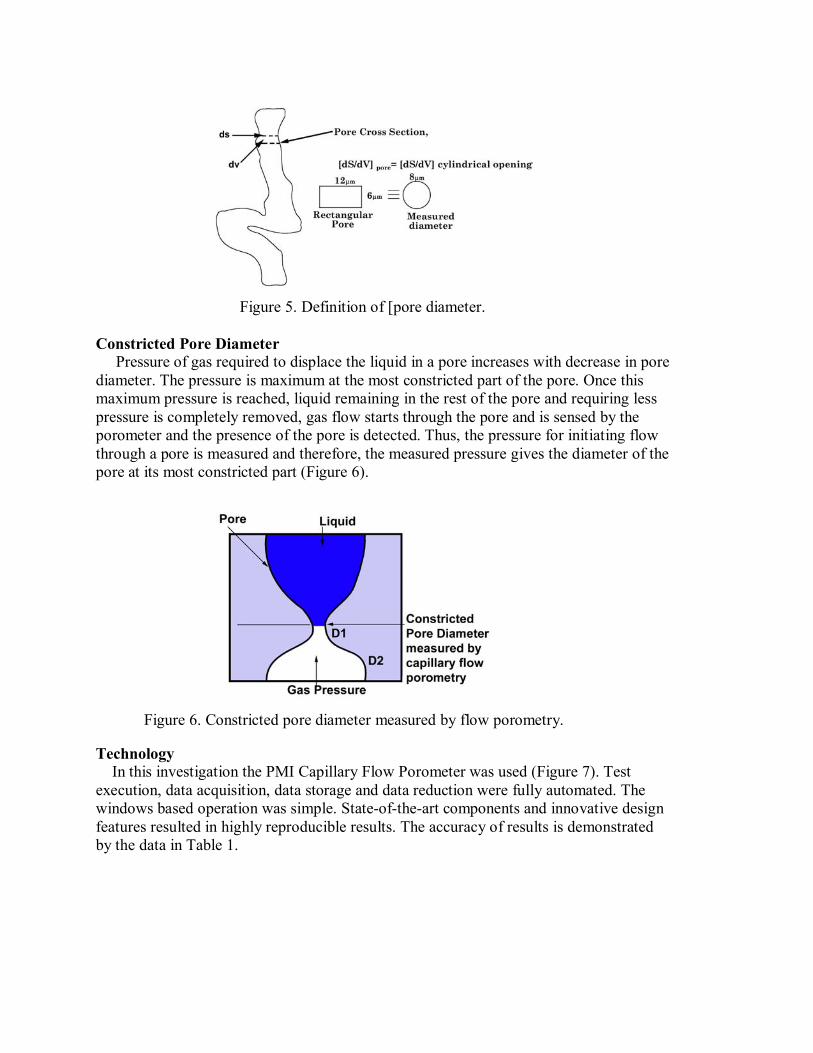
Figure 5. Definition of [pore diameter.
Constricted Pore Diameter Pressure of gas required to displace the liquid in a pore increases with decrease in porediameter. The pressure is maximum at the most constricted part of the pore. Once thismaximum pressure is reached, liquid remaining in the rest of the pore and requiring lesspressure is completely removed, gas flow starts through the pore and is sensed by theporometer and the presence of the pore is detected. Thus, the pressure for initiating flowthrough a pore is measured and therefore, the measured pressure gives the diameter of thepore at its most constricted part (Figure 6).
Figure 6. Constricted pore diameter measured by flow porometry.
Technology In this investigation the PMI Capillary Flow Porometer was used (Figure 7). Testexecution, data acquisition, data storage and data reduction were fully automated. Thewindows based operation was simple. State-of-the-art components and innovative designfeatures resulted in highly reproducible results. The accuracy of results is demonstratedby the data in Table 1.
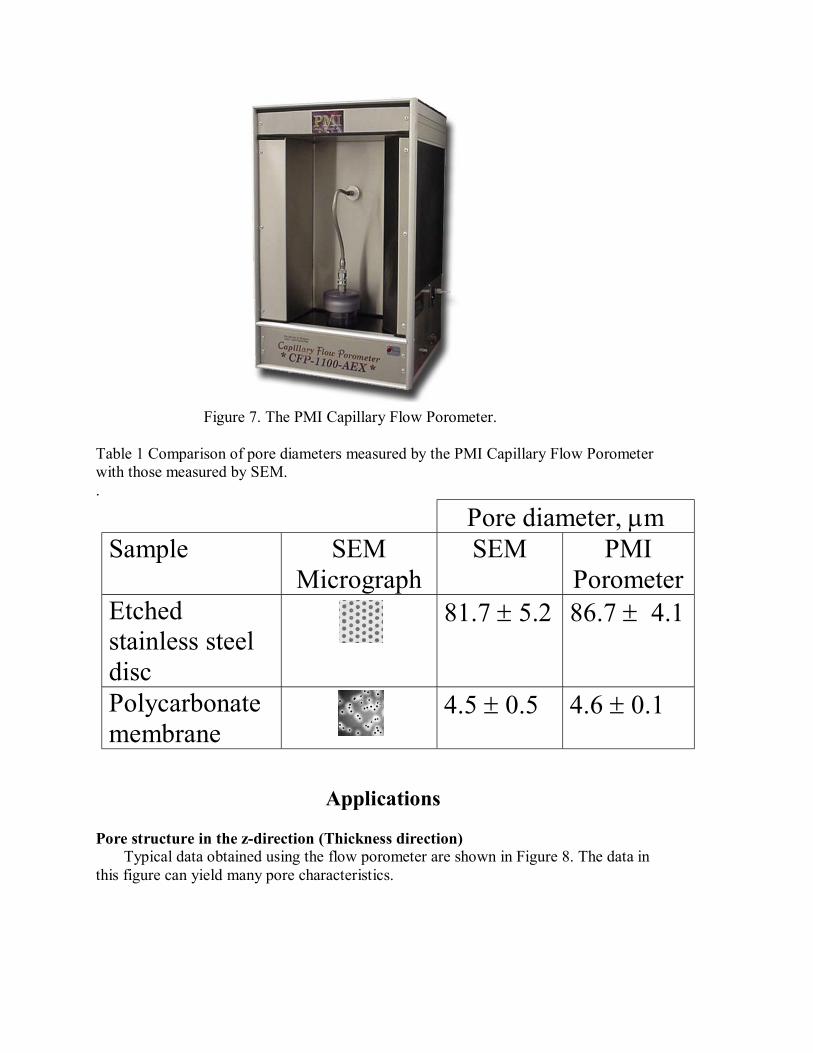
Figure 7. The PMI Capillary Flow Porometer.
Table 1 Comparison of pore diameters measured by the PMI Capillary Flow Porometerwith those measured by SEM..
Pore diameter, µmSample SEM
MicrographSEM PMI
PorometerEtchedstainless steeldisc
81.7 ± 5.2 86.7 ± 4.1
Polycarbonatemembrane
4.5 ± 0.5 4.6 ± 0.1
Applications
Pore structure in the z-direction (Thickness direction) Typical data obtained using the flow porometer are shown in Figure 8. The data inthis figure can yield many pore characteristics.

Figure 8. Flow rates measured as functions of differential pressure through a ceramicfilter material.
The flow distribution derived from these data is presented in Figure 9 in terms of thedistribution function, f.
f = - d[100×(Fw/Fd)] /dD (4)
where Fw and Fd are flow rates through wet and dry samples. The area under the curve inany pore diameter range gives percentage of flow through that range. It has been shownthat the distribution curve is generally close to the pore number fraction in the filtrationmedia [3]. The results of analysis of the measured data are tabulated in Table 2.
Figure 9. Flow distribution over pore diameter.
Dry Curve
Wet Curve
Half-dry Curve

Table 2. Pore characteristics of filtration media obtained from data in Figure 8.
Characteristics Values
The largest constricted pore diameter 0.1640 mµ
Mean flow constricted pore diameter 0.0256 mµ
Constricted pore diameter range 0.164 - 0.016 mµ
Peak of unimodal distribution 0.02 mµ
Constricted pore diameter range 0.164 - 0.064 mµof most pores
Gas permeability Gas permeability is obtained from the gas flow rates through a dry filtration mediummeasured as a function of differential pressure. Figure 10 shows data obtained with aceramic filtration medium. The average air permeability calculated from the flow rates is3.7×10-6 Darcies. The permeability can also be expressed in any other desired unit suchas Frazier, Gurley, Rayls and volume /unit time-unit area-unit pressure gradient. Oneadvantage of flow porometry is that permeability could be measured as a function ofpressure.
Figure 10. Air flow rate through a ceramic filtration medium.
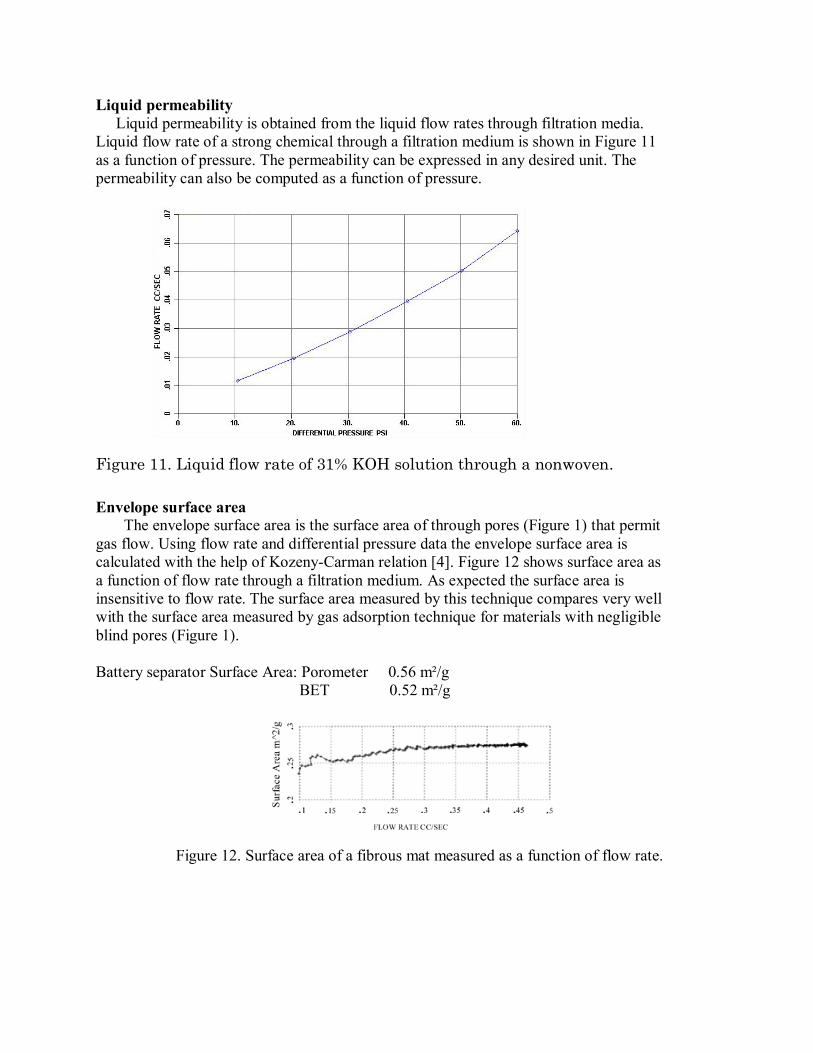
Liquid permeability Liquid permeability is obtained from the liquid flow rates through filtration media.Liquid flow rate of a strong chemical through a filtration medium is shown in Figure 11as a function of pressure. The permeability can be expressed in any desired unit. Thepermeability can also be computed as a function of pressure.
Figure 11. Liquid flow rate of 31% KOH solution through a nonwoven.
Envelope surface area The envelope surface area is the surface area of through pores (Figure 1) that permitgas flow. Using flow rate and differential pressure data the envelope surface area iscalculated with the help of Kozeny-Carman relation [4]. Figure 12 shows surface area asa function of flow rate through a filtration medium. As expected the surface area isinsensitive to flow rate. The surface area measured by this technique compares very wellwith the surface area measured by gas adsorption technique for materials with negligibleblind pores (Figure 1).
Battery separator Surface Area: Porometer 0.56 m²/g BET 0.52 m²/g
Figure 12. Surface area of a fibrous mat measured as a function of flow rate.

Average fiber diameter The average fiber diameter is computed from the flow rate using the Davies [5]equation. The measured average fiber diameters compare very well the directly measuredaverage fiber diameters. This is demonstrated by the data in Figure 13.
Figure13. Measured average fiber diameters plotted against the actual fiber diametersin a nonwoven filtration medium.
Effects of orientation (Pore structure in the x-y plane) Pore structure in the z-direction (thickness direction) can be considerably differentfrom that in the x-y plane of a material (Figure 14). These pore characteristics can bemeasured by the capillary flow porometer.
Figure 14. Directional pore structure.
0
5
10
15
20
25
0 5 10 15 20 25
Actual Fiber Diameter
Cal
cula
ted
Fibe
r Dia
mte
r

Figure 15. Widely different pore distributions along the thickness (z-direction) and in thethe x-y plane of a nonwoven filter material.
Effects of temperature The instrument can measure pore characteristics at temperatures up to 100° C. Gasand liquid permeability can be measured up to 200° C. Figure 16 shows data on gaspermeability measured at two temperatures.
Figure 16. Air permeability at 70 °C and 20 °C.
0
50
100
150
200
250
300
350
400
0 2 4 6 8 10 12
Average Pore Diam eter (Microns)
Pore
Siz
e D
istr
ibut
ion
In -p lane
T hro ug h-p lane

Effects of chemical environment Tests can be performed with liquids of interest. Sample saturated in desired chemicalcan be tested. Chemicals used in applications can be used as wetting liquids. Strongchemicals like phosphoric acid, KOH and saline solutions can be used for the test. Figure17 shows the results of a pore structure characterization performed using a KOH solution.
Figure 17. Pore structure characteristics of a separator determined using KOH solution.
Effect of pressure Liquid permeability at pressures up to 200 psi can be measured. The data in Figure18 gives permeability up to 160 psi.
Figure 18 Permeability at 160 PSI
Effects of compressive stress During application, most filtration media are subjected to stress. Stress can changepore structure appreciably. Filter media maintained under compressive stress could betested for changes in their pore characteristics. Figure 19 shows that the effects of stresscan be considerable.

Figure 19. Effect of compressive stress up to 1200 kPa on bubble point pore diameter.
Effects of stress cycles In many applications like dewatering of paper pulp, the filtration media are subjectedto cyclic stress. Stress cycles may change pore characteristics considerably. Figure 20shows the effects of cyclic stress on a nonwoven material.
Figure 20. Effects of number of stress cycles between 15 and 35 psi on % changes in thebubble point pore diameter and mean flow pore diameter
Pore structures of individual layers of a two-layer filtration media withoutseparating the layers. The instrument can measure pore structure characteristics of individual layers of amulti layered filtration media without separating the layers. The instrument can alsomeasure graded pore structure. The principle of the test technique is illustrated in Figure
-50
-40
-30
-20
-10
0
10
Log
(Cyc
les)
, % C
hang
e in
dia
met
er
Log (Cycles) 0 1 2 3% Change in bubble point pore diameter -27.8 -29.9 -43.6 -43.9% Change in mean flow pore diameter 1.4 4.6 -0.2 6.7
1 2 3 4

21 [6]. The considerably different pore sizes in the two separate layers of a hot gasceramic filter is shown in Figure 22.
Low pressure High pressure .Figure 21. Techniques for determination of pore structure of layered or graded filtrationmedia.
Figure 22. Considerably different pores of the two layers of a ceramic hot gas filtrationmedia determined in-situ without separating the layers.
On-line characterization of pore structure The instrument chamber of the on-line capillary flow porometer is so designed thatsamples are not required to be cut from a bulk material. The test head either clamps on tothe area to be tested on any part of the final product or the product may be made to slidethrough the test head. This design of the instrument permits tests to be performed on anypart of huge rolls of products for evaluation of homogeneity, suitability of materials forapplications and process control without damaging the material in any way. Two testhead systems are shown in Figure 23.

(b) Slide through.
(a) Clamp on.
Figure 23. Two test heads of the PMI On-Line Porometer
Summary and Conclusion1. Principle of flow porometry, its potentials and its limitations have been discussed.2. Many applications of the technique have been demonstrated using the PMI Capillary
Flow Porometer.3. Constricted pore diameters, the largest pore diameter, mean flow pore diameter, pore
distribution, envelope surface area, average fiber diameter, gas permeability andliquid permeability were measured. The effects of temperature, pressure, chemicalenvironment, compressive stress, stress cycles, and orientation were also measured.Determination of pore structures of individual layers of multi-layered structures, porestructures in thickness direction as well as in the x-y plane and pore structures at

many locations of large filtration media without damaging the material in any waywere demonstrated.
4. Capillary flow porometer is a highly versatile instrument capable of measuring all theimportant pore structure characteristics of filtration media.
References
1. Vibhor Gupta and A. K. Jena, Advances in Filtration and Separation Technology,American Filtration & Separation Society, 13b (1999), 833.
2. A. K. Jena and K. M. Gupta, Journal of Power Sources, 80 (1999), 46.3. A. K. Jena and K.M. Gupta, Proceedings of International Conference Filtration 99,
Chicago, INDA (Association of the Nonwoven Fabrics Industry), Book of Papers,23.1.
4. Gerard Kraus, J.W. Ross and L A. Girifalco, Phys. Chem., Vol. 57. 1953, pp. 330-333.
5. C.N. Davies, Proceedings of the Institute of Mechanical Engineers, London, 1B,1952, pp.185-194.
6. A. Jena and K. Gupta, F &S Filtrieren und Separieren, 16 (2002), 13.
Copyright © 2022 FDOKUMEN