Original Article Physical Activity Patterns of College Students ...
11
PJAHS • Volume 3 Issue 2 2020 • (doi:10.36413/pjahs.0302.006) 36 Original Article Physical Activity Patterns of College Students of the University of Santo Tomas Reil Vinard Espino a , Consuelo Gonzalez-Suarez a , Karen Leslie Pineda a , Stephanie Ann Balid-Attwell a , Kristina Devora b , Diane Mendoza c a Center for Health Research and Movement Science, University of Santo Tomas, Manila, Philippines; b Department of Physical Therapy, College of Rehabilitation Sciences, University of Santo Tomas, Manila, Philippines; c Department of Nutrition and Dietetics, College of Education, University of Santo Tomas, Manila, Philippines Correspondence should be addressed to: Reil Vinard Espino a ; [email protected] Article Received: July 4, 2019 Article Accepted: August 6, 2019 Article Published: February 14, 2020 (Online) Copyright © 2020 Espino et al. This is an open-access article distributed under the Creative Commons Attribution License, which permits unrestricted use, distribution, and reproduction in any medium, provided the original work is properly cited. Abstract Objectives: This study examined the physical activity patterns of the University of Santo Tomas college students in Manila, Philippines in terms of participation in moderate to vigorous physical activity, frequency and duration of participation, METS-min/week, sitting habits and walking activities. Methods: A total of 551 males and 850 female college students (N=1401) from the University of Santo Tomas were randomly selected for the study. After anthropometric measurements (height, weight, BMI and Waist circumference) were taken, the International Physical Activity Questionnaire (short form) was answered by the students. Results: A greater percentage of male college students engage in vigorous physical activity (66.97%) in terms of frequency per week (2.42 + 1.56 days), duration (119.52 + 70.70 minutes) and MET-min/week (2252.77 + 2789.81 METS). On the other hand, more female college students engage in moderate physical activity in terms of frequency per week (4.69 + 2.04 days). However, male college students who engage in moderate physical activity spend a longer duration (106.02 + 108.55 minutes) and higher MET- min/week (1945.59 + 2721.02 METS) than their female counterpart. Conclusion: It is important to engage in physical activity on a daily basis, with recommendations given by the American Heart Association and the World Health Organization. Appropriate physical activity assists young people to develop healthy musculoskeletal tissues, cardiovascular system, neuromuscular awareness and maintain a healthy body weight and composition. It has also been associated with psychological benefits in young people by improving control over anxiety and depression, good self- perception and expression, as well as avoidance of tobacco, alcohol and drug use. Keywords: physical activity patterns, emerging adults, metabolic equivalents, sitting habits, anthropometric measurements, international physical activity questionnaire INTRODUCTION Physical inactivity has been identified as the 4 th leading cause of death worldwide. 1,2 It is one of the biggest public health problems of the 21 st century with low cardiorespiratory fitness accounting for more deaths compared to other risk factors such as obesity, smoking, hypertension, hypercholesterolemia and diabetes mellitus. 3 World Health Organization (WHO) recommendations are that adults aged 18–64 years perform at least 150 minutes of moderate-intensity aerobic physical activity or at least 75 minutes of vigorous-intensity aerobic physical activity throughout the week, or an equivalent combination of moderate-intensity and vigorous-intensity activity to improve cardiorespiratory and muscular fitness, bone health, and to reduce the risk of non- communicable diseases (NCD) and depression. 4 Research has shown that majority of risk factors for NCDs are closely related to diet and physical inactivity. 1,2 Despite the well - documented evidence regarding the negative health consequences of physical inactivity, the majority of adults do not meet the recommended physical activity
-
Upload
khangminh22 -
Category
Documents
-
view
2 -
download
0
Transcript of Original Article Physical Activity Patterns of College Students ...

PJAHS • Volume 3 Issue 2 2020 • (doi:10.36413/pjahs.0302.006)
36
Original Article
Physical Activity Patterns of College Students of the University of Santo Tomas
Reil Vinard Espinoa, Consuelo Gonzalez-Suareza, Karen Leslie Pinedaa, Stephanie Ann Balid-Attwella, Kristina Devorab, Diane Mendozac
aCenter for Health Research and Movement Science, University of Santo Tomas, Manila, Philippines; bDepartment of Physical Therapy, College of Rehabilitation Sciences, University of Santo Tomas, Manila, Philippines; cDepartment of Nutrition and Dietetics, College of Education, University of Santo Tomas, Manila, Philippines
Correspondence should be addressed to: Reil Vinard Espinoa; [email protected]
Article Received: July 4, 2019
Article Accepted: August 6, 2019
Article Published: February 14, 2020 (Online)
Copyright © 2020 Espino et al. This is an open-access article distributed under the Creative Commons Attribution License, which permits unrestricted use, distribution, and reproduction in any medium, provided the original work is properly cited.
Abstract
Objectives: This study examined the physical activity patterns of the University of Santo Tomas college students in Manila, Philippines in terms of participation in moderate to vigorous physical activity, frequency and duration of participation, METS-min/week, sitting habits and walking activities. Methods: A total of 551 males and 850 female college students (N=1401) from the University of Santo Tomas were randomly selected for the study. After anthropometric measurements (height, weight, BMI and Waist circumference) were taken, the International Physical Activity Questionnaire (short form) was answered by the students. Results: A greater percentage of male college students engage in vigorous physical activity (66.97%) in terms of frequency per week (2.42 + 1.56 days), duration (119.52 + 70.70 minutes) and MET-min/week (2252.77 + 2789.81 METS). On the other hand, more female college students engage in moderate physical activity in terms of frequency per week (4.69 + 2.04 days). However, male college students who engage in moderate physical activity spend a longer duration (106.02 + 108.55 minutes) and higher MET-min/week (1945.59 + 2721.02 METS) than their female counterpart. Conclusion: It is important to engage in physical activity on a daily basis, with recommendations given by the American Heart Association and the World Health Organization. Appropriate physical activity assists young people to develop healthy musculoskeletal tissues, cardiovascular system, neuromuscular awareness and maintain a healthy body weight and composition. It has also been associated with psychological benefits in young people by improving control over anxiety and depression, good self-perception and expression, as well as avoidance of tobacco, alcohol and drug use.
Keywords: physical activity patterns, emerging adults, metabolic equivalents, sitting habits, anthropometric measurements, international physical activity questionnaire
INTRODUCTION
Physical inactivity has been identified as the 4th leading cause of death worldwide.1,2 It is one of the biggest public health problems of the 21st century with low cardiorespiratory fitness accounting for more deaths compared to other risk factors such as obesity, smoking, hypertension, hypercholesterolemia and diabetes mellitus.3 World Health Organization (WHO) recommendations are that adults aged 18–64 years perform at least 150 minutes of moderate-intensity aerobic physical activity or at least 75 minutes of vigorous-intensity aerobic physical activity throughout the week, or an
equivalent combination of moderate-intensity and vigorous-intensity activity to improve cardiorespiratory and muscular fitness, bone health, and to reduce the risk of non-communicable diseases (NCD) and depression.4 Research has shown that majority of risk factors for NCDs are closely related to diet and physical inactivity.1,2
Despite the well - documented evidence regarding the negative health consequences of physical inactivity, the majority of adults do not meet the recommended physical activity

PJAHS • Volume 3 Issue 2 2020 • (doi:10.36413/pjahs.0302.006)
37
guidelines.5 The following risk factors for physical inactivity: (a) socio-demographic (female gender, older age, higher income), (b) psychological (low self-efficacy), (c) social (lack of social support, sense of control), (d) health risk behavior (smoking, alcohol use, being overweight or obese, inadequate fruit and vegetable consumption), (e) depressive symptoms, and (f) lack of knowledge of exercise-heart disease link, and lack of beliefs in health benefits of exercise. 6,7 Recent population estimates suggest that 5.3 million deaths from NCDs could be prevented annually if people were sufficiently active according to these recommendations.8
Physical inactivity studies among university students have been predominantly conducted in high-income countries. For instance, several reviews have shown that the proportion of students who were physically inactive was 20-40% in western countries,9,10 to 42% in Pacific Asian, and 44% in developing countries.6
In the Philippines, Gonzalez-Suarez et al. explored the level of physical activity in children and pre-adolescents in 200911 and 2011.12
Tudor-Locke in 2003,13 showed that 51% of Filipino youth aged 14-16 years did not participate in vigorous physical activity and had spent more than 2 hours engaged in multimedia usage daily.13
To the authors’ knowledge, no study has been conducted in the emerging adults’ population. Therefore, this study examines the physical activity patterns and the differences in physical activity patterns of students, both male and female, in the University of Santo Tomas, Manila, Philippines in terms of participation in moderate to vigorous physical activity, frequency, and duration of participation, Metabolic Equivalents (METS-min/week) - the amount of oxygen consumed while sitting at rest and is equal to 3.5 ml O2 per kg body weight x min., sitting habits, and walking activities.
METHODS
Ethical Considerations. Ethical approval was obtained from the Ethics Review Committee of
the College of Rehabilitation Sciences, University of Santo Tomas (UST).
Study Design. A cross-sectional descriptive study design was used to describe the physical activity involvement of first to fourth-year college students. This is part of the research project which investigates the causative factors associated with the prevalence of overweight and obesity among emerging adults in the University of Santo Tomas.
Sampling Procedure. The participants were selected through a random cluster sampling method. The list of class sections where the participants were randomly selected was provided by the Santo Tomas E-Service providers (STEPS), the university’s electronic student database. Using OpenEpi Version 2, the sample size was calculated. With a total population of 42,000 college students at the University of Santo Tomas and a national prevalence of 23.3% for overweight and obesity, BMI weight ranges from age 18 to 39, a sample of 1430 were recruited to achieve 90% power. Participants were 1st to 4th-year college students enrolled in the University of Santo Tomas for the school year 2015-2016. There are no exclusion criteria for this study. This study was conducted at the University of Santo Tomas (UST) located in Manila, Philippines, which houses 23 colleges.14. Before data collection commenced, inter-rater and intra-rater reliability test were conducted among assessors. On the day of the assessment, the participants were asked to answer the consent forms and fill out the socio-demographic datasheet. After anthropometric measurements (height, weight, BMI and Waist circumference) were taken, the International Physical Activity Questionnaire (short form) was answered by the students.
Equipment
1. Detecto© Weighing Scale and Stadiometer were used to measure weight (kg) and height (m).
2. Lafayette© tape measure was used to measure the waist and hip circumference
Outcome Measures
Anthropometric Measurements

PJAHS • Volume 3 Issue 2 2020 • (doi:10.36413/pjahs.0302.006)
38
Height and Weight. Height is a vertical measurement which measures the distance from the base of the foot to the apex of the head. Its unit of measurement is meters (m). Weight measures the amount of mass a person carries, and its unit of measurement is kilograms (kg).
In measuring height, the data gatherer asked the subject to remove his/her shoes, socks, and other accessories. After this, the subject was instructed to plant the foot in the middle of the plate facing opposite the stadiometer and the Stretch Stature method was used. The subject was made to stand in a relaxed position, feet together and arms at the side. The data gatherer performed the Frankfort Plane to ensure that the subject was facing front without excess upward or downward movement of the head. Height was measured at the apex of the head after the subject was instructed to breathe in for optimum measurement.
Measuring weight was taken with minimal clothing of the subjects and without any accessories.
Body Mass Index. Body Mass Index (BMI) is a simple index of height and weight that is commonly used to classify underweight, overweight and obesity in adults. The equation for BMI is weight (kg) divided by the height (m²). Norms from the World Health Organization and the Asia Pacific were used.15
Waist Circumference. Waist circumference (WC) is considered the simplest yet the best estimation to measure the danger of central obesity among the anthropometric parameters. Central Obesity is defined as an excess storage of visceral fat located at the abdominal area that could increase the probability of health risk. Two most common sites need to be considered in locating the measurement of the waist. First is between the location of the last palpable rib and directly above the iliac crest. The second one which is more general is the narrowest point of the waist above the navel/umbilicus, still between the lowest rib and the iliac crest. The instrument needed to measure the waist circumference is the Lafayette© tape measure. Waist circumference was measured in centimeters (cm).
International Physical Activity Questionnaire (Short form). The International Physical Activity Questionnaire (IPAQ) is comprised of 4 questionnaires used to obtain comparable data on health-related physical activity. The IPAQ was developed by an international group of experts to estimate physical activity patterns. The short form contained 9 items that can estimate the time spent in physical activity with at least 10-minute bouts over 7 days. A recent review of multi-country (including 12 countries) reliability and validity results for 7 self-reported physical activity measures evaluated in adults reported that typical IPAQ correlations were 0.80 for reliability and 0.30 for validity and exhibited properties that are at least as good as other established self-report physical activity measures.16 Considering the diversity of samples and countries present in the study, these results support the acceptability of the psychometric performance of the IPAQ.16
Treatment of the Data. IPAQ has provided methods of assessing physical activity according to intensity and metabolic equivalent, as well as sitting time.16
• Low - not meeting the moderate or vigorous physical activity
• Moderate - 3 or more days of vigorous physical activity for at least 20 minutes per day; 5 or more days of moderate-intensity activity and/or walking at least 30 minutes per day; 5 or more days of any combination of walking, moderate-intensity or vigorous-intensity activities
• High - vigorous-intensity activity on at least 3 days achieving a minimum total physical activity of at least 1500 MET-minutes/week; 7 or more days of any combination of walking, moderate-intensity or vigorous-intensity activities achieving a minimum total physical activity of at least 3000 MET-minutes/week
Intensity17
Intensity refers to the rate at which the activity was performed, or the magnitude of the effort required to perform an activity or exercise.17 The intensity of physical activity can be categorized into light, moderate, and heavy. This was reflected in questions 1,3, and 5.

PJAHS • Volume 3 Issue 2 2020 • (doi:10.36413/pjahs.0302.006)
39
Light: Less than 3 METs (<3 METS); about 40 to 54% of Maximal Heart Rate (MHR). In IPAQ, it was represented by walking as the form of activity (question 5) and was measured in minutes per day.
Moderate: Approximately 3-6 METs; 50 to 70% of MHR (requires a moderate amount of effort and noticeably accelerates the heart rate). In IPAQ, it corresponds to question 3. Moderate activities were defined as activities that take moderate physical effort and make one breathe somewhat harder than normal which was performed at least 10 minutes at a time. Activities including brisk walking, stair climbing, recreational sports such as football, basketball, volleyball, table tennis, and 30 minutes of aerobic dancing (with rest in between). These were measured in minutes.
Heavy: Approximately >6 METs; 70 to 85% of MHR (requires a large amount of effort and causes rapid breathing and a substantial increase in heart rate). This was asked in question 1 of IPAQ. Vigorous or heavy activities were defined as a physical effort that made one breathe harder than normal, done for at least 10 minutes at a time.
Metabolic Equivalents17
Metabolic Equivalents (METs) is commonly used to express the intensity of physical activities, and the ratio of a person's working metabolic rate relative to their resting metabolic rate. METs were calculated using the number of minutes per day that the participants were involved in walking (light physical activity), moderate and vigorous physical activity. This was calculated as follows:
MET values and formula for the computation of MET-minutes17
• Light (Walking) MET - minutes/week = 3.3 walking minutes walking days
• Moderate MET - minutes/week = 4.0 moderate activity minutes moderate days
• Vigorous MET - minutes/week = 8.0 vigorous activity minutes vigorous intensity days
Physical Activity17
Physical Activity can be classified by 3 categories namely low, moderate, and high. These were calculated as follows:
Low - Individuals who do not meet the criteria for moderate or vigorous activity are considered to have ‘low’ physical activity level
Moderate - The pattern of activity to be classified as moderate was either of the following criteria:
a. 3 or more days of vigorous-intensity activity of at least 20 minutes per day
b. 5 or more days of moderate-intensity activity and/or walking of at least 30 minutes per day
c. 5 or more days of any combination of walking, moderate-intensity or vigorous-intensity activities achieving a minimum total physical activity of at least 600 MET-minutes/week.
Individuals meeting at least one of the above criteria would be defined as accumulating a minimum level of activity and therefore be classified as ‘moderate’.
High - The two criteria for classification as ‘high’ were:
a. vigorous-intensity activity on at least 3 days achieving a minimum Total physical activity of at least 1500 MET-minutes/week
b. 7 or more days of any combination of walking, moderate-intensity or vigorous-intensity activities achieving a minimum Total physical activity of at least 3000 MET-minutes/week.
Sitting Time17
Sitting Time is defined as the number of hours an individual spent sitting in a day, which includes time spent at work, at home, while doing course work and during leisure time. The number of hours per day was indicated and observed for 7 days. It was then averaged to get the mean sitting time. For the IPAQ short form, data on sitting should be reported as median values and interquartile ranges. For the sitting question in the IPAQ long form, ‘Minutes’ was used as the indicator to reflect time spent in sitting rather than MET-minutes, which suggested an estimate of energy expenditure.

PJAHS • Volume 3 Issue 2 2020 • (doi:10.36413/pjahs.0302.006)
40
Sitting variables include:
• Sitting Total Minutes per week = (weekday sitting minutes 5 weekdays) + (weekend day sitting minutes 2 weekend days)
• Average Sitting Total Minutes per day = (weekday sitting minutes 5 weekdays) + (weekend day sitting minutes 2 weekend days) divided by 7 days
The Australian Heart Foundation states that there are no public health guidelines on how long adults should sit, however, a good guide is to follow the Australian Government’s physical activity recommendations for 5 to 18-year olds. These recommendations suggested limiting activities involving long sitting time to less than 2 hours a day. These studies showed that those who spent less than 2 hours of sitting time have a lower risk of early death than those sitting for more than 2 hours a day.17
According to the IPAQ, the classification of a good sitting habit is by only having a total of less than 5 hours of sitting time per day. On the other hand, the classification of a bad sitting habit is by having a total of more than five hours of sitting time per day.
Data Analysis. All data was encoded in MS Excel© spreadsheet software and analyzed using STATA 13© statistical software. Descriptive statistics such as mean, standard deviation, frequency, and proportion were used to summarize the responses in IPAQ. T-Test for independent samples and chi-square test for independence were used to determine significant difference between year levels of college students. P-values less than or equal to 0.05 were considered significant to the study and only statistically significant results will be reported in this paper.
RESULTS
Subject Profile. A total of 551 males and 850 female college students (N=1401) from the University of Santo Tomas participated in the study. Tables 1 and 2 report the comparison of anthropometric measurements (age range, height, weight, BMI and WC) based on sex and year level. Significant differences between gender were observed in all anthropometric
measurements with males generally taller (1.68m + 0.06), heavier (68.32kg +14.71), greater BMI (24.21 + 4.64) and WC (88.80cm + 128.47) measurements.
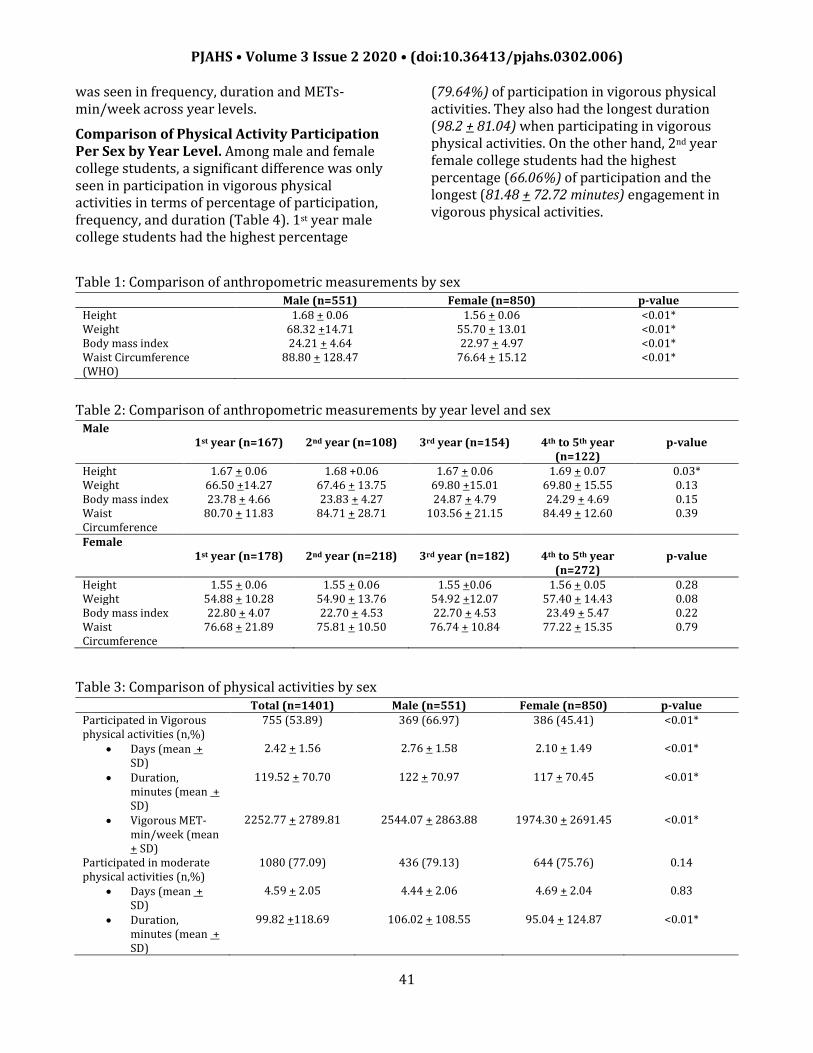
Comparison of Physical Activity Participation Between Sexes. A significant difference was seen in terms of participation in moderate to vigorous physical activity between males and females (Table 3). A greater percentage of male university college students engaged in vigorous physical activity (66.97%) in terms of frequency per week (2.42 + 1.56 days), duration (119.52 + 70.70 minutes) and MET-min/week (2252.77 + 2789.81 METS). On the other hand, more female college students engaged in moderate physical activity in terms of frequency per week (4.69 + 2.04 days). However, male college students who engage in moderate physical activity spend a longer duration (106.02 + 108.55 minutes) and higher MET-min/week (1945.59 + 2721.02 METS) than their female counterpart. In terms of walking activities, while no significant difference in participation was seen between sex, the duration (94.26 + 152.82 days) and MET-min/week (1945.59 + 2721.02 METS) were greater among male participants. In terms of sitting duration, male and female college students spend almost the same time sitting in a day which was longer than the recommended duration of the Australian Heart Foundation.
Comparison of Physical Activity Participation by Year Level. Comparing moderate and vigorous physical activity engagement across year levels, significant differences in participation can be observed (Table 4). 2nd year college students were seen to have the greatest percentage of participation in vigorous physical activity (68.40%) while 1st year college students have the greatest percentage of participation in moderate physical activity (85.51%). Based on frequency, duration and METS-min/week of participation in both vigorous and moderate intensity physical activity, the 3rd year college students reported the most frequent (3.06 + 1.88 days), have the longest duration (108.32 + 126.48 minutes) and have the highest METS (3148.05 + 3811.37 METS) in both categories of physical activity intensities. In terms of walking activities and sitting duration, no significant difference
PJAHS • Volume 3 Issue 2 2020 • (doi:10.36413/pjahs.0302.006)
41
was seen in frequency, duration and METs-min/week across year levels.
Comparison of Physical Activity Participation Per Sex by Year Level. Among male and female college students, a significant difference was only seen in participation in vigorous physical activities in terms of percentage of participation, frequency, and duration (Table 4). 1st year male college students had the highest percentage
(79.64%) of participation in vigorous physical activities. They also had the longest duration (98.2 + 81.04) when participating in vigorous physical activities. On the other hand, 2nd year female college students had the highest percentage (66.06%) of participation and the longest (81.48 + 72.72 minutes) engagement in vigorous physical activities.
Table 1: Comparison of anthropometric measurements by sex Male (n=551) Female (n=850) p-value Height 1.68 + 0.06 1.56 + 0.06 <0.01* Weight 68.32 +14.71 55.70 + 13.01 <0.01* Body mass index 24.21 + 4.64 22.97 + 4.97 <0.01* Waist Circumference (WHO)
88.80 + 128.47 76.64 + 15.12 <0.01*
Table 2: Comparison of anthropometric measurements by year level and sex Male 1st year (n=167) 2nd year (n=108) 3rd year (n=154) 4th to 5th year
(n=122) p-value
Height 1.67 + 0.06 1.68 +0.06 1.67 + 0.06 1.69 + 0.07 0.03* Weight 66.50 +14.27 67.46 + 13.75 69.80 +15.01 69.80 + 15.55 0.13 Body mass index 23.78 + 4.66 23.83 + 4.27 24.87 + 4.79 24.29 + 4.69 0.15 Waist Circumference
80.70 + 11.83 84.71 + 28.71 103.56 + 21.15 84.49 + 12.60 0.39
Female 1st year (n=178) 2nd year (n=218) 3rd year (n=182) 4th to 5th year
(n=272) p-value
Height 1.55 + 0.06 1.55 + 0.06 1.55 +0.06 1.56 + 0.05 0.28 Weight 54.88 + 10.28 54.90 + 13.76 54.92 +12.07 57.40 + 14.43 0.08 Body mass index 22.80 + 4.07 22.70 + 4.53 22.70 + 4.53 23.49 + 5.47 0.22 Waist Circumference
76.68 + 21.89 75.81 + 10.50 76.74 + 10.84 77.22 + 15.35 0.79
Table 3: Comparison of physical activities by sex Total (n=1401) Male (n=551) Female (n=850) p-value Participated in Vigorous physical activities (n,%)
755 (53.89) 369 (66.97) 386 (45.41) <0.01*
• Days (mean + SD)
2.42 + 1.56 2.76 + 1.58 2.10 + 1.49 <0.01*
• Duration, minutes (mean + SD)
119.52 + 70.70 122 + 70.97 117 + 70.45 <0.01*
• Vigorous MET-min/week (mean + SD)
2252.77 + 2789.81 2544.07 + 2863.88 1974.30 + 2691.45 <0.01*
Participated in moderate physical activities (n,%)
1080 (77.09) 436 (79.13) 644 (75.76) 0.14
• Days (mean + SD)
4.59 + 2.05 4.44 + 2.06 4.69 + 2.04 0.83
• Duration, minutes (mean + SD)
99.82 +118.69 106.02 + 108.55 95.04 + 124.87 <0.01*

PJAHS • Volume 3 Issue 2 2020 • (doi:10.36413/pjahs.0302.006)
42
• Moderate MET-min/week (mean + SD)
1834.97 + 2980.64 1945.59 + 2721.02 1749.45 + 3167.34 <0.01*
Participated in walking activities (n,%)
1356 (96.79) 535 (97.10) 821 (96.59) 0.60
• Days (mean + SD)
6.19 + 1.37 6.24 + 1.30 6.17 + 1.42 0.39
• Duration, minutes (mean + SD)
82.72 + 135.63 94.26 + 152.82 74.17 + 120.79 <0.01*
• Walking MET-min/week (mean + SD)
1125.67 + 2480.38 1384.98 + 2791.43 956.69 + 2240.42 <0.01*
Sitting duration/day, , minutes (mean + SD)
455.87 + 249.96 433.97 + 226.81 470.47 + 263.48” 0.08
Table 4: Comparison of physical activity by year level per gender All 1st year
(n=345) 2nd year (n=326)
3rd year (n=336)
4th to 5th year (n=394)
p-value
Participated in Vigorous physical activities (n,%)
229 (66.38) 223 (68.40) 154 (45.83) 149 (37.82) <0.01*
• Days (mean + SD) 2.41 + 1.54 1.82 +1.21 3.06 + 1.88 2.68 +1.39 <0.01*
• Duration, minutes (mean + SD)
119.37 + 74.51 128.96 + 52.96 121.39 + 84.33 103.42 + 70.57 <0.01*
• Vigorous MET-min/week (mean + SD)
2151.79 + 2583.05
1781.70 + 1866.85
3148.05 + 3811.37
2187.65 + 2817.68
<0.01*
Participated in moderate physical activities (n,%)
295 (85.51) 252 (77.30) 257 (76.49) 276 (70.05) <0.01*
• Days (mean + SD) 4.55 + 2.07 4.49 +2.21 4.67 + 1.84 4.63 +2.08 0.02*
• Duration, minutes (mean + SD)
105.74 + 131.07 96.19 + 80.36 108.32 + 126.48 88.78 + 125.74 <0.01*
• Moderate MET-min/week (mean + SD)
1931.22 + 3236.20
1497.91 + 1787.26
2092.34 + 3147.70
1787.13 + 3359.91
<0.01*
Participated in walking activities (n,%)
339 (98.26) 318 (97.55) 318 (94.64) 381 (96.70) 0.04*
• Days (mean + SD) 6.20 + 1.34 6.28 + 1.29 6.15 + 1.38 6.14 + 1.47 0.40
• Duration, minutes (mean + SD)
85.08 + 153.23 78.87 + 117.73 79.44 + 125.10 86.63 + 142.05 0.92
• Walking MET-min/week (mean + SD)
1122.23 + 2515.10
1038.65 + 2167.95
1144.63 + 2430.64
1185.53 + 2729.77
0.98
Sitting duration/day, minutes (mean + SD)
470.81 + 256.50 442.59 + 223.92 474.44 + 280.37 438.85 + 236.70 0.44
Male 1st year
(n=167) 2nd year (n=108)
3rd year (n=154)
4th to 5th year (n=122)
P value
Participated in Vigorous physical activities (n,%)
133 (79.64) 79 (73.15) 87 (56.49) 70 (57.38) <0.01*
• Days (mean + SD) 2.20 +1.82 1.71 + 1.60 1.71 + 1.98 1.65 + 1.77 0.04*
• Duration, minutes (mean + SD)
98.2 + 81.04 97.02 + 77.71 67.50 + 91.51 55.53 + 64.51 <0.01*
• Vigorous MET-min/week (mean + SD)
2059.40 + 2779.42
1775.56 + 2259.02
1662.08 + 3240.02
1205.90 + 1627.16
0.10
Participated in moderate physical activities (n,%)
148 (88.62) 86 (79.63) 118 (76.62) 84 (68.85) 0.22

PJAHS • Volume 3 Issue 2 2020 • (doi:10.36413/pjahs.0302.006)
43
• Days (mean + SD) 3.82 + 2.37 3.59 + 2.65 3.38 + 2.56 3.17 + 2.75 0.62
• Duration, minutes (mean + SD)
91.74 + 115.08 86.76 + 89.63 79.60 + 110.01 53.87 +89.89 0.04*
• Moderate MET-min/week (mean + SD)
1646.82 + 2786.54
1425.35 + 2030.73
1485.56 + 2551.60
1128.79 + 2370.44
0.29
Participated in walking activities (n,%)
166 (99.40) 106 (98.15) 145 (94.16) 118 (96.72) 0.44
• Days (mean + SD) 6.30 + 1.22 6.22 + 1.42 5.78 + 2.00 5.94 + 1.82 0.31
• Duration, minutes (mean + SD)
94.77 + 181.85 82.13 + 100.31 86.53 + 148.09 95.62 + 141.00 0.76
• Walking MET-min/week (mean + SD)
1432.91 + 2999.30
1102.29 +1905.20
1337.79 + 2977.83
1447.54 + 2792.26
0.85
Sitting duration/day, , minutes (mean + SD)
82 (52.90) 59 (34.71) 84 (46.41) 67 (29.39) 0.93
Female 1st year
(n=178) 2nd year (n=218)
3rd year (n=182)
4th to 5th year (n=272)
P value
Participated in Vigorous physical activities (n,%)
96 (53.93) 144 (66.06) 67 (36.81) 79 (29.04) <0.01*
• Days (mean + SD) 1.03 +1.33 1.01 +1.07 1.15 + 1.96 0.73 + 1.36 <0.01*
• Duration, minutes (mean + SD)
57.72 +81.2 81.48 + 72.72 43.43 + 73.47 29.64 + 63.92 0.02*
• Vigorous MET-min/week (mean + SD)
836.18 + 1623.37
942.94 + 1359.81
1257.36 + 2977.83
657.50 + 2167.13
0.65
Participated in moderate physical activities (n,%)
147 (82.58) 166 (76.15) 139 (76.37) 192 (70.59) 0.21
• Days (mean + SD) 3.95 + 2.61 3.41 + 2.74 3.74 + 2.55 3.27 + 2.74 0.31
• Duration, minutes (mean + SD)
75.98 + 134.07 57.46 + 73.18 75.43 + 124.62 56.44 + 116.00 0.34
• Moderate MET-min/week (mean + SD)
1419.49 + 134.07
844.13 + 1357.24
1462.27 + 3026.61
1102.83 + 2969.03
0.33
Participated in walking activities (n,%)
173 (97.19) 212 (97.25) 172 (95.05) 263 (96.69) 0.52
• Days (mean + SD) 5.90 +1.80 6.08 +1.69 5.86 +1.87 5.94 + 1.82 0.27
• Duration, minutes (mean + SD)
69.00 + 103.92 71.78 + 123.73 65.64 +91.46 75.44 + 138.99 0.45
• Walking MET-min/week (mean + SD)
792.93 + 1866.94
969.00 + 2260.31
867.99 + 1695.00
1011.35 + 2640.75
0.43
Sitting duration/day, , minutes (mean + SD)
73 (47.10) 111 (65.29) 97 (53.59) 161 (70.61) 0.02*
Discussion
It is important to monitor key NCD risk factors and their determinants to curb the future burden of chronic diseases. Due to the increasing importance of NCDs in low- and middle-income countries, knowledge and a detailed understanding of their underlying risk factors in these countries are of great importance.18 This paper presents the first known information on the physical activity participation of university college students, who reflect a large part of
emerging adults in the Philippines. “Emerging adulthood” is typically defined as 18–25 years of age which is marked by important transitions such as leaving home and increasing autonomy in decision-making; however, at the same time, adult responsibilities such as financial independence and residential and employment stability are in constant flux.19 This is also the stage where individuals enter the university which is a less restrictive environment compared to secondary schooling. The demands of studying

PJAHS • Volume 3 Issue 2 2020 • (doi:10.36413/pjahs.0302.006)
44
are often more intense since the choice of a collegiate course will dictate their future careers. A great percentage of these individuals live away from home and stay in dormitories. Because of these factors, there are numerous changes including physiologic, psychological and lifestyle behaviors that occur during emerging adulthood that may have a strong influence on the development of lifestyle diseases. Several findings in this paper require further investigation.
Findings show that the majority of female college students are considered to be inactive, whilst in terms of PA classification, a greater number of male college students engage in vigorous physical activity while more female college students engage in moderate physical activity. Several researches have reported similar results, wherein males are more likely than females to be engaged in vigorous physical activity.20,21,22,23,24 Beville et al. showed that in terms of sports participation, 67% of males participated in sports, whereas only 26.4% of female students participated in sports.25 They also reported that a subgroup of college students whose were at greatest risk for physical inactivity are college females; with more college females than males reporting no days of moderate-intensity aerobic exercise for at least 30 minutes per week and no days of vigorous-intensity aerobic exercise for at least 20 minutes per week (26.1% vs. 23.3%; 44.2% vs. 33.3%, respectively).26 Other authors have contradicted these findings. In a study conducted by Pedisic et al., there were no significant differences in physical activity of both sexes observed during studies conducted among students from Croatia.27 Females obtained an overall value on the level of 45.1-54.1 MET/hour/ week, while males obtained 49.3-58.7 MET/hour/week. In the case of students from South Africa, no significant differences in individual levels of activity were also found between males and females.28
Comparing moderate and vigorous physical activity engagement across year levels, significant differences can be observed. The pattern of involvement in moderate to vigorous physical activity declined from 1st year to 2nd year, increased in the 3rd year and decreased again in the 4th year. Based on this pattern of
participation, 3rd year college students were seen to have the greatest percentage of participation in both moderate and vigorous physical activity. 1st year male college students reported the highest frequency and duration when participating in vigorous physical activities. On the other hand, 2nd year female college students had the highest frequency and duration when participating in vigorous physical activities. The same was seen in terms of PA categories across year level with the 4th to 5th year college students considered to be inactive, 2nd year to be minimally active and the 3rd year to be active. In a study by Haase et al. in 2004, increasing age was found to be associated with increased odds to be physically inactive. This is consistent with findings observed in previous international comparative studies from predominantly high-income countries and could reflect the general decrease in physical activity with age.29 In terms of walking activities and sitting duration, no significant difference was seen across year levels in this study.
The Centers for Disease Control and Prevention (CDC) assert that many adult Americans do not meet the national guidelines for aerobic physical activity, and muscle-strengthening physical activity.30 Likewise, a large number of American college students are not engaging in adequate amounts of PA.31 Findings from the American College Health Association-National College Health Assessment indicate that 23.4% of college students reported no days of moderate-intensity cardiovascular or aerobic exercise of at least 30 minutes, and 38.4% reported zero days of vigorous-intensity physical activity of at least 20 minutes in the last 7 days.30
Significant differences were seen in this study in terms of sitting habits, with the 4th to 5th year college students having the longest time sitting down The sitting duration of college students ranged from 430 mins/day to almost 500 mins/ day, which are higher values compared to the findings of other studies on this topic. Bergier in 2015, found students spend 300 mins/day, on average, in a sitting position where the most popular leisure activities were watching television, playing computer games, and using the Internet.22
PJAHS • Volume 3 Issue 2 2020 • (doi:10.36413/pjahs.0302.006)
45
CONCLUSIONS
This research showed that a greater percentage of male college students engaged in vigorous physical activity. On the other hand, more female college students engaged in moderate physical activity. Checking the physical activity participation per year level, 2nd year college students were seen to have the greatest percentage of participation in vigorous physical activity while the 1st year college students had the greatest percentage of participation in moderate physical activity. 3rd year college students were the most frequent, had the longest duration and had the highest METS achieved in both these categories of physical activity intensities. In terms of walking activities and sitting duration, no significant difference was seen in frequency, duration and METs-min/week across year levels.
It is important to engage in physical activity on a daily basis. Appropriate physical activity assists young people to develop healthy musculoskeletal tissues, cardiovascular system, neuromuscular awareness and maintain a healthy body weight and composition. It has also been associated with psychological benefits in young people by improving control over anxiety and depression, good self-perception and expression, as well as avoidance of tobacco, alcohol and drug use.
Limitation of the study. The study was conducted at only one university. Given the huge student population and diversity of students in terms of income across the Philippines, this paper may not be representative of the whole.
As the method used in this study is cross-sectional, it only describes a phenomenon in a specific time and does not show cause and effect, therefore a longitudinal study is warranted. Although reportedly reliable and valid, the IPAQ is self-administered, and not objective and therefore may exhibit recall bias.
Individual author’s contributions
R.E., C.S.; Designed the protocol, gathered data, analyzed data and co-wrote the paper.
R.E., C.S., K.P., S.A., D.M., K.D..; Designed the protocol, and Gathered data
Disclosure statement
This paper is not funded by any funding agencies.
Conflicts of interest
The authors of this paper declare no conflicting interest.
References
1. World Health Organization. Global health risks: mortality and burden of disease attributable to selected major risks. Geneva: 2009
2. World Health Organization. World health report 2002: reducing risks, promoting healthy life. Geneva: 2002
3. Blair S. Physical Inactivity: the biggest public health problem of the 21st century. British Journal of Sports Medicine 2009; 43: 1-2
4. World Health Organization. Global recommendations on physical activity for health: 18–64 years old [Internet]. Geneva: 2011
5. Irwin JD. Prevalence of university students’ sufficient physical activity: a systematic review. Perceptual and Motor Skills. 2004 Jun;98(3 Pt 1):927–43. PMID:15209309
6. Haase A, Steptoe A, Sallis JF, Wardle J (2004) Leisure-time physical activity in university students from 23 countries: associations with health beliefs, risk awareness, and national economic development. Preventive Medicine 39(1):182–190
7. Pengpid S, Peltzer K (2013) Physical inactivity and associated factors among university students in South Africa. African Journal for Physical Health Education, Recreation and Dance 19(1):145–156
8. Lee IM, Shiroma EJ, Lobelo F, Puska P, Blair SN, Katzmarzyk PT, Lancet Physical Activity Series Working Group (2012) Effect of physical inactivity on major non-communicable diseases worldwide: an analysis of burden of disease and life expectancy. Lancet 6736(panel 2):1–11
9. Irwin JD (2004) Prevalence of university students’ sufficient physical activity: a systematic review. Perceptual and Motor Skills.98:927–943
10. Keating XD, Guan J, Pin˜ero JC, Bridges DM (2005) A meta-analysis of college students’ physical activity behaviors. Journal of American College Health 54(2):116–125
11. Gonzalez-Suarez C, Worley A, Grimmer-Somers K, Dones V. School Based Interventions on Childhood Obesity: A Meta Analysis. American Journal of Preventive Medicine 2009; 5: 418-427

PJAHS • Volume 3 Issue 2 2020 • (doi:10.36413/pjahs.0302.006)
46
12. Gonzalez-Suarez C, Grimmer-Somers K. The Association of Physical Activity and Physical Fitness with Pre-Adolescent Obesity: An Observational Study in Metro manila, Philippines. Journal of Physical Activity and Health 2011; 8: 804 -810
13. Tudor-Locke, C., Ainsworth, B.E., Adair, L.S., Popkin, B.M. (2003). Physical activity in Filipino youth: the Cebu Longitudinal Health and Nutrition Survey. International Journal of Obesity, 27, 181-190.
14. ust.edu.ph[Internet]. University of Santo Tomas; c2019 Available from: (https://www.ust.edu.ph)
15. The International Classification of adult underweight, overweight and obesity according to BMI [Internet]. Geneva: World Health Organization, 1995, 2000, 2002, 2004 Available from: (https://www.ncbi.nlm.nih.gov/pubmed/12164464?dopt=Abstract)(https://www.ncbi.nlm.nih.gov/pubmed/14726171?dopt=Abstract)
16. Craig, C. et al. International Physical Activity Questionnaire: 12-Country Reliability and Validity. Official Journal of the American College of Sports Medicine: 2003; 1381-1395.
17. Guidelines for Data Processing and Analysis of the International Physical Activity Questionnaire (IPAQ) – Short and Long Forms, November 2005: 1-15, Retrieved March 18, 2016 from http://www.academia.edu/5346814/Guidelines_for_Data_Processing_and_Analysis_of_the_International_Physical_Activity_Questionnaire_IPAQ_Short_and_Long_Forms_Contents
18. Hallal P, Andersen L, Bull F, Guthold R, Haskell W, Ekelund U. Global Physical Activity levels: Surveillance progress, Pitfalls, and Prospects 2012. The Lancet, 380: 247-257
19. Nelson T, Gortmaker S, Subramanian S V, Cheung L, Wechsler H. Disparities in Overweight and Obesity Among US College Students. American Journal of Health Behavior; Jul/Aug 2007; 31, 4; ProQuest
20. Keating XD, Guan J, Pinero JC, Bridges DW. A meta-analysis of college students’ physical activity behaviors. Journal of American College Health. 2005;54:116-125.
21. King KA, Vidourek RA, English L, Merianos AL, Vigorous physical activity among college students: using the health belief model to assess involvement and social support, Archives of Exercise in Health and Disease 4 (2): 267-279, 2014
22. Buckworth J, Nigg C. Physical activity, exercise, and sedentary behavior in college students. Journal of American College Health 2004;53:28–34
23. Bergier J, Kapka- Skrzypczak L, Biliński P, Paprzycki P, Wojtyła A. Physical activity of Polish adolescents and young adults according to IPAQ: a population based study: Annals of Agricultural and Environmental Medicine. 2012;19(1):109-15.
24. Bloemhoff HJ. Gender and race-related physical activity levels of South African university students: African Journal
for Physical Health Education, Recreation and Dance 2010;16(4):25-35.
25. Beville J , Meyer M , Usdan S , Turner L, Jackson J, Lian B. Gender Differences in College Leisure Time Physical Activity: Application of the Theory of Planned Behavior and Integrated Behavioral Model 2013. 62: 173-184
26. American College Health Association. American College Health Association–National College Health Assessment II: Reference Group Executive Summary Fall 2011. Baltimore, MD: American College Health Association; 2011.
27. Pedišić Ž, Rakovac M, Bennie J, Jurakić D, Bauman A. E. Levels and correlates of domainspecific physical activity in university students: Cross-sectional findings from Croatia. Kinesiology 2014;46(1):12-22
28. Pengpid S, Peltzer K. Physical inactivity and associated factors among university students in South Africa. AJPHERD 2013;19(1):143-53.
29. Haase A, Steptoe A, Sallis JF, Wardle J. Leisure-time physical activity in university students from 23 countries: associations with health beliefs, risk awareness, and national economic development 2004. Preventive Medicine. 39(1):182-90.
30. American College Health Association. American College Health Association–National College Health Assessment II: Reference Group Executive Summary Fall 2011. Baltimore, MD: American College Health Association; 2011.
31. Racette SB, Deusinger SS, Strube MJ, Highstein GR, Deusinger RH. Changes in weight and health behaviors from freshman through senior year of college. Journal of Nutrition Education and Behavior 2008;40:39–42.