ORIGINAL ARTICLE: How many species of shore fishes are there in the Tropical Eastern Pacific?
14
ORIGINAL ARTICLE How many species of shore fishes are there in the Tropical Eastern Pacific? Fernando A. Zapata 1 and D. Ross Robertson 2 * INTRODUCTION Despite the recent renewal of debate and speculation (May, 1990; Erwin, 1983, 1991; Gaston, 1991a; Ødegaard, 2000), biologists seem far from providing an acceptable answer to the basic question of how many species there are on the Earth. Knowledge of the richness and composition of the world’s biota is fundamental for both theoretical and practical reasons. 1 Departamento de Biologı ´a, Universidad del Valle, Apartado Ae´reo 25360, Cali, Colombia, 2 Smithsonian Tropical Research Institute, Balboa, Panama ´ *Correspondence: D. Ross Robertson, STRI, Unit 0948, APO AA 34002, USA. E-mail: [email protected] Both authors contributed equally to this work. ABSTRACT Aim To assess whether the total richness of the shore-fish fauna of a discrete biogeographical region can be predicted, and to estimate how long it is likely to take to enumerate that fauna. Location The Tropical Eastern Pacific (TEP), an isolated biogeographical region with a high level of endemism (72%) among its modestly rich, known fauna of shore fishes (1222 named + 58 known undescribed shallow-water species). Methods We used patterns in the long-term dynamics and accumulation curves of descriptions of new species, which began in 1758, correlates of these patterns, and the body size–frequency distributions of various ecological groups of the fauna to (1) try to predict the total richness of that fauna, (2) estimate how many species might be missing and what biological characteristics they might have, and (3) estimate how long their discovery and description will take to complete. Results Accumulation curves for the entire fauna, for all TEP endemics or for reef and soft-bottom species (77.5% of the fauna) are not approaching asymptotes, and their description rates have remained fairly stable over the past century. However, curves for pelagic and multi-habitat species (22.5% of the fauna) may be nearing asymptotes, perhaps because these species are relatively accessible to collection. These curves clearly indicate that the total TEP fauna is substantially richer than the presently known fauna, but do not allow reliable prediction of its richness. Extrapolations from frequency distributions of the body size of different ecological groups of TEP fishes indicate that the entire fauna is at least 12–15% larger than the currently known fauna. Main conclusions From recent description trends, undiscovered species will tend to be small, have limited geographic and depth ranges, and live in deeper water. Poorly known, priority areas for taxonomic investigation in the TEP include deeper reef habitats, two isolated island groups, and several continental areas with unusual environments. At current levels of traditional taxonomic activity, the description of known unnamed species will take c.15 years, and assessment of the richness of unknown species, which probably number in the hundreds, will take decades. Keywords Body-size variation, depth-range effects, faunal richness, geographic range size, habitat richness, habitat-use effects, shore fishes, species-description dynamics, Tropical Eastern Pacific. Journal of Biogeography (J. Biogeogr.) (2007) 34, 38–51 38 www.blackwellpublishing.com/jbi ª 2006 Blackwell Publishing Ltd doi:10.1111/j.1365-2699.2006.01586.x No claim to original US government works
-
Upload
universidaddelvallecolombia -
Category
Documents
-
view
1 -
download
0
Transcript of ORIGINAL ARTICLE: How many species of shore fishes are there in the Tropical Eastern Pacific?
ORIGINALARTICLE
How many species of shore fishes arethere in the Tropical Eastern Pacific?
Fernando A. Zapata1� and D. Ross Robertson2*�
INTRODUCTION
Despite the recent renewal of debate and speculation (May,
1990; Erwin, 1983, 1991; Gaston, 1991a; Ødegaard, 2000),
biologists seem far from providing an acceptable answer to the
basic question of how many species there are on the Earth.
Knowledge of the richness and composition of the world’s
biota is fundamental for both theoretical and practical reasons.
1Departamento de Biologıa, Universidad del
Valle, Apartado Aereo 25360, Cali, Colombia,2Smithsonian Tropical Research Institute,
Balboa, Panama
*Correspondence: D. Ross Robertson, STRI,
Unit 0948, APO AA 34002, USA.
E-mail: [email protected]
�Both authors contributed equally to this work.
ABSTRACT
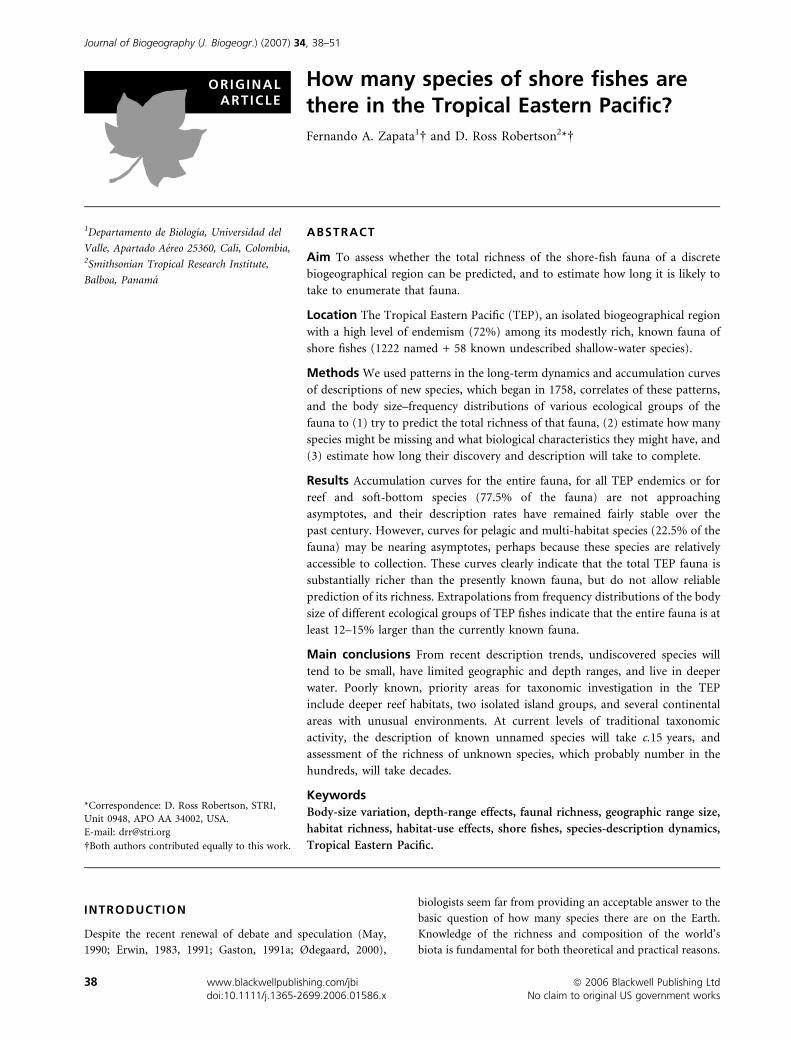
Aim To assess whether the total richness of the shore-fish fauna of a discrete
biogeographical region can be predicted, and to estimate how long it is likely to
take to enumerate that fauna.
Location The Tropical Eastern Pacific (TEP), an isolated biogeographical region
with a high level of endemism (72%) among its modestly rich, known fauna of
shore fishes (1222 named + 58 known undescribed shallow-water species).
Methods We used patterns in the long-term dynamics and accumulation curves
of descriptions of new species, which began in 1758, correlates of these patterns,
and the body size–frequency distributions of various ecological groups of the
fauna to (1) try to predict the total richness of that fauna, (2) estimate how many
species might be missing and what biological characteristics they might have, and
(3) estimate how long their discovery and description will take to complete.
Results Accumulation curves for the entire fauna, for all TEP endemics or for
reef and soft-bottom species (77.5% of the fauna) are not approaching
asymptotes, and their description rates have remained fairly stable over the
past century. However, curves for pelagic and multi-habitat species (22.5% of the
fauna) may be nearing asymptotes, perhaps because these species are relatively
accessible to collection. These curves clearly indicate that the total TEP fauna is
substantially richer than the presently known fauna, but do not allow reliable
prediction of its richness. Extrapolations from frequency distributions of the body
size of different ecological groups of TEP fishes indicate that the entire fauna is at
least 12–15% larger than the currently known fauna.
Main conclusions From recent description trends, undiscovered species will
tend to be small, have limited geographic and depth ranges, and live in deeper
water. Poorly known, priority areas for taxonomic investigation in the TEP
include deeper reef habitats, two isolated island groups, and several continental
areas with unusual environments. At current levels of traditional taxonomic
activity, the description of known unnamed species will take c.15 years, and
assessment of the richness of unknown species, which probably number in the
hundreds, will take decades.
Keywords
Body-size variation, depth-range effects, faunal richness, geographic range size,
habitat richness, habitat-use effects, shore fishes, species-description dynamics,
Tropical Eastern Pacific.
Journal of Biogeography (J. Biogeogr.) (2007) 34, 38–51
38 www.blackwellpublishing.com/jbi ª 2006 Blackwell Publishing Ltddoi:10.1111/j.1365-2699.2006.01586.x No claim to original US government works

First, such information is essential for understanding the
ecological and evolutionary forces determining the structure,
dynamics and persistence of the faunas and floras of different
biogeographical regions and environments (Brown, 1995;
Vermeij, 2001). Second, ongoing habitat degradation, changes
in ecosystems arising from over-harvesting and from species
invasions (Peterson & Estes, 2001; Steneck & Carlton, 2001),
and the increasing risk of species extinction (e.g. Carlton et al.,
1999; Brooks et al., 2002) mean that the timely acquisition of
such knowledge is vital for the development of conservation
priorities and effective management policies (Lubchenco, 1998;
Palumbi, 2001).
At present, however, the compositions of most taxa in most
biogeographical regions remain very incompletely known,
including those of some of the best-known terrestrial verteb-
rate groups (e.g. mammals; see Patterson, 1994, 2000, 2001).
The relative lack of such knowledge is a much larger problem
in the Tropics than in temperate areas, because the Tropics
comprise large areas of habitat that contain most of the world’s
species, and yet they have received much less attention. This
situation is particularly acute in tropical marine environments,
which, owing to their enormous areas and depth range, are
much more difficult to sample than are terrestrial environ-
ments. While tropical marine birds and mammals are relatively
well documented, they represent a tiny fraction of the tropical
marine biota; most other marine taxa are still very poorly
known. For high-diversity tropical ecosystems, such as coral
reefs, only crude estimates of the numbers of species in
particular regions are available (e.g. Paulay, 1997; Reaka-
Kudla, 1997; Bouchet et al., 2002).
Fishes constitute the largest group of vertebrates, with
c. 26,000 species described, c. 64% of which are marine (see
FishBase: http://www.fishbase.org; Catalog of Fishes: http://
www.calacademy.org/research/ichthyology/catalog). Because
they are a prominent component of regional marine biotas,
and represent important resources for humans, they have
received considerable attention from taxonomists. However,
nearly two and a half centuries after the first formal descriptions
by Linnaeus in 1758, 200–300 new species of fishes continue to
be described each year, increasing the currently known fauna
by c. 1% per year (see Catalog of Fishes: http://www.
calacademy.org/research/ichthyology/catalog). This is true even
in the case of regions with relatively modestly rich faunas, such as
the tropical Eastern Pacific (TEP).
Determining whether the richness of a major taxon’s
regional fauna can readily be predicted is useful for assessing
how quickly global biodiversity is likely to be adequately
documented. Such documentation involves not only tradi-
tional taxonomy but also molecular genetics [see Species 2000
(http://www.sp2000.org), Systematics 2000 (Anonymous,
1994), and the Census of Marine Life (http://www.coml.org/
coml.htm)]. CBOL, the Consortium for the Barcode of Life
(http://www.barcoding.si.edu), for example, proposes to gen-
etically ‘barcode’ all species of fishes by about 2010 (see
Beardsley, 2005). Here we use a comprehensive data set on the
shallow shore-living fishes known from the TEP to examine
the rates, patterns and correlates of morphospecies descrip-
tions by traditional taxonomists over the past c. 250 years. We
then assess whether this information allows us to predict the
total richness of the TEP shore-fish fauna, and how long it is
likely to take to name formally the undescribed species
currently known to exist there. Finally, we identify poorly
sampled habitats and locations in that region that represent
high-priority areas for taxonomic research.
METHODS
The study area – the TEP biogeographical region
The TEP marine biogeographical region (Fig. 1) encompasses
the continental coast of the Americas from about Bahia
Magdalena on the southern Pacific coast of the Baja California
Peninsula (Mexico), through the Sea of Cortez and south to
Cabo Blanco, on the northern coast of Peru. The points where
the cold currents that flow from high to low latitudes (the
California current in the north, and Peru coastal current in the
south) turn westwards define these northern and southern
limits of the region (Briggs, 1974; Glynn & Ault, 2000). The
TEP also includes five oceanic islands or archipelagoes: the
Revillagigedo Islands, Clipperton Atoll, Cocos Isalnd, Malpelo
Island, and the Galapagos Archipelago, which are separated
from the mainland by c. 350–1000 km of deep ocean.
Continental islands occur mainly in the Gulf of California
and along the coast of Panama (see Mora & Robertson, 2005a).
The western limit of the TEP is defined by the Eastern Pacific
Barrier (EPB) – a 5000-km-wide expanse of deep open ocean
that separates the westernmost island in the region
(Clipperton) from the nearest Central Pacific islands, the Line
Islands (Ekman, 1953; Briggs, 1974; Robertson et al., 2004).
The EPB has acted as a barrier partly isolating the TEP shore
biota from that of the rest of the Indo-Pacific for as long as
65 Myr (Grigg & Hey, 1992). The TEP has also been totally
Figure 1 The TEP biogeographical region. The black area along
the coastline represents the continental shelf.
How many Tropical Eastern Pacific shore fishes?
Journal of Biogeography 34, 38–51 39ª 2006 Blackwell Publishing Ltd. No claim to original US government works

isolated from its adjacent sister biogeographical region, the
Greater Caribbean, for the c. 3 Myr that have elapsed since the
final closure of the Isthmus of Panama (Coates & Obando,
1996). As a result of strong isolation by these highly effective
barriers, the TEP has the highest level of shore-fish endemism
of any region of comparable size: c. 72% of all species and c.
79% of those resident in the TEP occur only there (Robertson
& Allen, 2002).
The great majority (c. 96%) of the shallow-water habitat
occurs along the continental coastline, which has a very narrow
continental shelf (Fig. 1), while the Galapagos Archipelago
provides c. 95% of the same habitat at the oceanic islands
(Robertson et al., 2004). Rocky shores along the coastline are
interrupted by two large expanses of sand and mud shorelines
– the 370-km-long Sinaloan Gap on the south-east shoreline of
the Gulf of California, and the c. 1000-km-long Central
American Gap, from southern Mexico to northern El Salvador
(Glynn & Ault, 2000; Hastings, 2000; Robertson & Allen,
2002). Corals occur throughout much of the TEP. However,
the total cover of structural coral reefs in that region is only
c. 25 km2 (Robertson 1998), and such reefs represent a
significant source of habitat at only one site within the region
– the 4 km2 of coral reef that constitutes Clipperton Atoll
(Glynn & Ault, 2000).
Data
Information for the analyses presented here comes from a
comprehensive data base on the shallow (0–100 m depth)
marine shore-fish fauna of the TEP published by Robertson &
Allen (2002). This fauna includes species living in brackish
shoreline environments as well as those in fully marine
habitats. The version of the data base published in 2002
treated 1195 species, and it has since been extended to include
1241 species, 1222 of them currently valid species described in
the scientific literature by professional taxonomists. The
remaining 19 species are at various stages in the process of
being described. Species endemic to the TEP (n ¼ 876) are
either restricted entirely to the region, or have the bulk (75%
or more) of their range within it. Some also occur, typically as
vagrants, however, in temperate areas to the north and south
of the TEP, or westwards across the EPB. Non-endemics have
most of their ranges outside the TEP, and many occur in the
TEP only as vagrants. The data base on species characteristics,
which includes information that we use here on geographic
distributions, depth ranges, habitat associations, and body
sizes, is derived from an exhaustive review of the primary
taxonomic, zoogeographic and ecological literature (>1000
individual citations from the scientific literature, 524 of which
present the species descriptions we refer to here), as well as our
own fieldwork throughout much of the region.
Analyses
We used the year of publication of the description of each
currently valid species to examine patterns in the rate of
species description over time, and to construct species
accumulation curves for the entire described fauna and its
various ecological subgroups. Essentially, all these species were
described by professional taxonomists or ichthyologists, and
there have been virtually no recent descriptions by non-
professionals, a practice that has affected the rate of descrip-
tions in other marine groups (e.g. molluscs, Bouchet, 1997).
The rate of descriptions of new species in a fauna depends in
part on the amount of activity by taxonomists. To provide a
crude indication of the dynamics of description in relation to
the level of taxonomic activity, we examined how the number
of active taxonomists, the number of papers describing species,
and the number of species described per taxonomist per year
have varied through time. For this, we divided our sample
period (1758–2004) into quarter-century intervals, except for
the first (1758–1775) and last (1976–2004) intervals, and
treated the taxonomist population as all people who authored
or coauthored species descriptions during each period.
Our analyses tacitly assume that the description accumula-
tion curve and dynamics of description of currently valid TEP
fishes over the past 250 years reflects the actual temporal
pattern of species discovery. However, description dynamics
can easily be affected by taxonomists splitting or lumping
already described species. In particular, a large amount of
recent splitting could maintain the upward trajectory of an
accumulation curve with little or no actual discovery, while a
large amount of recent lumping would have the opposite
effect. However, our examination of the literature shows that
very little splitting or lumping has taken place with TEP fishes,
and that recent (post-1975) reviews of genera that included
descriptions of multiple new species relied on new or
previously unexamined material relating to poorly known
taxa. Hence, we believe that our assumption that the tempo of
description reflects that of discovery is correct in the present
case.
Species characteristics that are likely to affect the historical
pattern of species discovery in any taxon in any environment
include abundance, body size, geographic and habitat distri-
butions, and behaviour. Large, widely distributed species that
are common, easily observed and occur in a variety of habitats
are likely to be discovered earlier than species with the opposite
characteristics (Gaston, 1991b; Gaston & Blackburn, 1994;
Patterson, 2001; Reed & Boback, 2002, Collen et al., 2004).
Hence, we examined species-description accumulation curves
for TEP fishes in relation to patterns of variation among
species in their geographic and depth ranges, habitat usage and
body size. Owing to a lack of data we did not examine the
relationship between abundance and description date. Abun-
dance data are completely absent for many species, and
abundance measures obtained through different methods (e.g.
density estimates obtained by visual censuses of reef fishes vs.
numbers of individuals captured by trawling on soft bottoms)
cannot be directly compared. As the TEP has a largely
uncomplicated and longitudinally oriented continental shore-
line, we used the latitudinal range of each species in the eastern
Pacific (both in and out of the TEP) as a proxy for its
F. A. Zapata and D. R. Robertson
40 Journal of Biogeography 34, 38–51ª 2006 Blackwell Publishing Ltd. No claim to original US government works

geographic range. For depth-range characteristics, we consid-
ered, for each species, the absolute range, the minimum depth
of occurrence, and the midpoint of the depth range. Each
species was assigned to either a single primary habitat category
[demersal reef, demersal soft bottom (on sand or mud), or
pelagic (living in the water column)] or, for fishes using more
than one habitat, a multi-habitat category. For size, we used
the maximum recorded body length.
Both logistic and von Bertalanffy growth functions can
predict an asymptote, which, in the case of well-fitting species
description curves, would represent the predicted total fauna
size. Hence we examined the fit of species accumulation curves
to both functions using the past computer program (Hammer
et al., 2001). Patterns of covariation between year of descrip-
tion and log-transformed body size, latitudinal range, latitu-
dinal range limits, depth range, and minimum and maximum
depths were examined by correlation. Because we found
significant correlations between the year of description and all
of these variables, we examined the extent to which year of
description could be predicted from each variable independ-
ently using a multiple (forward step-wise) linear regression
analysis. This was carried out for the entire fauna, for TEP
endemics, and for species in different habitat-use categories.
Habitat-use categories were included as independent binomial
variables (1 if the species was present in a given habitat,
0 otherwise) in the analyses of the entire fauna and of TEP
endemics.
The comparative analysis of a diverse species assemblage can
be confounded by phylogenetic effects. First, apparent patterns
may reflect greater trait variation within higher-level than
within lower-level taxa. For instance, requiem sharks
(Carcharhinidae), which are large-bodied, on average might
have been described earlier than gobies (Gobiidae), which are
much smaller than sharks, suggesting an effect of body size on
time of discovery even if the body-size effect within either
family was weak, absent or even opposite. Second, species with
a common phylogenetic history tend to exhibit similar trait
values and may not be treated as statistically independent data
points (Felsenstein, 1985). Methods to deal with these
confounding effects of phylogeny, such as phylogenetic-
independent contrasts, require a well-supported and nearly
complete phylogeny (Harvey & Pagel, 1991), which is not
available for TEP fishes. Hence we addressed the first problem
by examining relationships within speciose lower-level taxa
(within each of 17 families that contain at least 20 species, and
each of 12 genera that contain at least 10 species). To reduce
the second problem we examined the relationships among
variables at the family level across the entire fauna, using
family means for both biological characteristics (latitudinal
and depth ranges, and body size) and date of description.
Body-size frequency distributions have often been used to
examine how many species are expected in different size classes
and thus to estimate the full richness of regional or global
biotas (e.g. May, 1978, 1988). Although an inverse relationship
between body size and number of species in an area was
initially predicted (Hutchinson & MacArthur, 1959; May,
1988), some empirical studies have shown that there is a
paucity of small species in known faunas (Blackburn & Gaston,
1994; Gaston & Blackburn, 2000). We examined the frequency
distribution of maximum body sizes among the members of
our fauna and found that it was log-normal (see Results).
Based on this property, we then estimated the number of ‘yet
to be discovered’ species from the currently ‘unfilled’ area
under the log-normal curve, using the computer program
lognorm (Ludwig & Reynolds, 1988). We made two estimates
of ‘undiscovered’ species using different values for the modal
size class: (1) the value derived from the log-normal fitting
procedure, and (2) the observed value.
The discovery of new species undoubtedly is affected by the
intensity of sampling in different habitats at different depths.
While the water column and the surface of soft bottoms can be
effectively sampled using trawl nets across the entire depth
range we consider here, different sampling methods must be
used for reefs. Reef habitats are most effectively sampled by
SCUBA divers using rotenone or other fish poisons, the only
means of effectively sampling the group of small, cryptic
species living within the reef matrix (Smith, 1973; Russell
et al., 1978; Smith-Vaniz et al., 1999; Ackerman & Bellwood,
2000; Smith et al., 2003). For example, 45% of the fish species
collected by Collette et al. (2003) at a small Caribbean island
were obtained using rotenone. The lower limit of normal
SCUBA work for such collecting is about 35 m. Hence we
contrasted the body-size distributions of species whose depth-
range midpoints were less than or greater than 35 m, to
estimate the number of small (< modal size), deep-living
species in each habitat-use category that might not have been
sampled by faunal surveys carried out to date.
Finally, we also queried 19 professional fish taxonomists
who have current or recent experience with all major
families belonging to the region’s fauna as to how many
undescribed TEP species they are aware of in the taxa on
which they work; that is, numbers of known species, not
guesses of how many there might be. We also used the
number of known but undescribed species and the average
current annual rate of description of new TEP species to
estimate how long taxonomists are likely to take to describe
those species alone.
RESULTS
The historical dynamics of species description and
structure of species-description accumulation curves
The description accumulation curve of all TEP fishes is
somewhat S-shaped (Fig. 2a), reflecting the fact that the rate of
description has changed through time (Fig. 2b). Initially there
was a slow period from 1758 to about 1832 (an average rate of
description of 1.5 new species per year), followed by a rapid
phase from 1833 to 1905 (9.5 year)1), and then a slow period
again (4.5 year)1; Fig 2a,b). A similar pattern is obtained for
the TEP endemics, whose accumulation curve is offset from
that of the entire fauna because they began to be described
How many Tropical Eastern Pacific shore fishes?
Journal of Biogeography 34, 38–51 41ª 2006 Blackwell Publishing Ltd. No claim to original US government works

> 40 years later than the non-endemics (Fig 2a,c). Mean rates
of description for regional endemics range from 0.9 species per
year during the initial slow phase (1801–61) to 10.2 year)1
during the rapid phase (1862–1905), before settling down to
3.8 year)1 thereafter (Fig. 2c). It is very noticeable that in
neither the full set nor the endemics subset has there been a
recent decline in the rate of accumulation of species descrip-
tions (Fig. 2). Rather, the rate of descriptions over the past
50 years has continued at the rate maintained over the last
century: a mean of 4.6 species per year for the entire set and of
4.3 year)1 for the TEP endemics. For both all-species and the
endemics, the slopes of the regression lines of the number of
species described per year over that period are positive, but do
not differ significantly from 0 (all-species regression: number
of species ¼ )54.9 + 0.030 year, r ¼ 0.14, P ¼ 0.29; endemics
regression: number of species ¼ )62.3 + 0.034 year, r ¼ 0.16,
P ¼ 0.24).
The level of activity by taxonomists relating to descriptions of
TEP shore fishes has varied considerably through time (Fig. 3).
Both the number of taxonomists authoring species descriptions
each year (Fig. 3a) and the number of papers that described new
species each year (Fig. 3b) have generally increased with time,
albeit with a decline between 1901 and 1950. The number of
papers describing new species per year and the number of species
described per author per year (Fig 3c,d) both peaked in the latter
half of the 19th century, probably owing to a burst of discovery
activity within a ‘virgin’ fauna containing an abundance of
endemic species. However, the fact that rate of descriptions per
author per year has remained fairly stable over the last century
indicates that there has been no major decline in return-for-
taxonomic-effort over that period.
Species-description accumulation curves differ among species
that live in different habitats (Fig. 4a). Descriptions of reef,
pelagic and multi-habitat species initially accumulated faster
than did those of soft-bottom species. However, after 1860 the
rate of description of soft-bottom species exceeded that of
species in other habitats. While the rates of description
accumulation for pelagic and multi-habitat species have
declined over the last century, those of reef and soft-bottom
species have not. However, rates of accumulation have remained
Figure 2 The tempo of species descriptions
of members of the TEP shore-fish fauna.
(a) Accumulation curves of species
descriptions for the total and endemic
components with fitted logistic functions.
The number of new species described per
year with 5-year running means for (b) the
entire TEP fish fauna and (c) the TEP
endemics.
F. A. Zapata and D. R. Robertson
42 Journal of Biogeography 34, 38–51ª 2006 Blackwell Publishing Ltd. No claim to original US government works
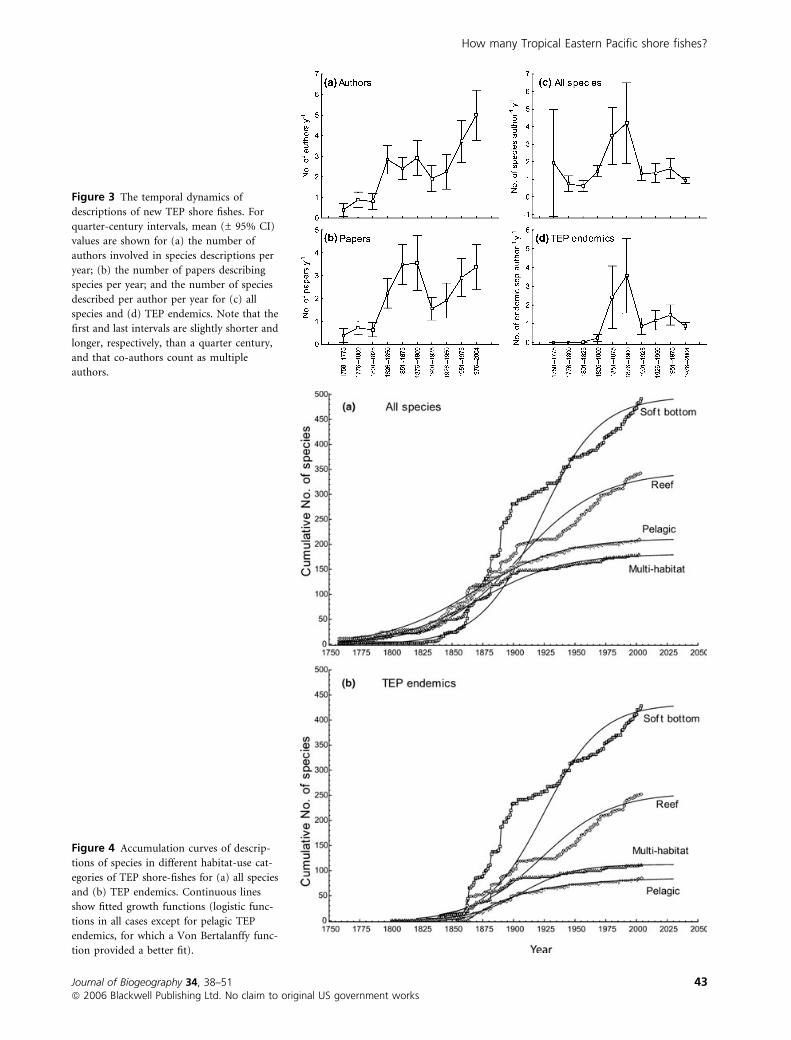
Figure 3 The temporal dynamics of
descriptions of new TEP shore fishes. For
quarter-century intervals, mean (± 95% CI)
values are shown for (a) the number of
authors involved in species descriptions per
year; (b) the number of papers describing
species per year; and the number of species
described per author per year for (c) all
species and (d) TEP endemics. Note that the
first and last intervals are slightly shorter and
longer, respectively, than a quarter century,
and that co-authors count as multiple
authors.
Figure 4 Accumulation curves of descrip-
tions of species in different habitat-use cat-
egories of TEP shore-fishes for (a) all species
and (b) TEP endemics. Continuous lines
show fitted growth functions (logistic func-
tions in all cases except for pelagic TEP
endemics, for which a Von Bertalanffy func-
tion provided a better fit).
How many Tropical Eastern Pacific shore fishes?
Journal of Biogeography 34, 38–51 43ª 2006 Blackwell Publishing Ltd. No claim to original US government works

significantly positive in all cases. Patterns of description
accumulation among TEP endemics are similar to those of the
entire fauna, except that pelagic and multi-habitat species began
to be described earlier than reef and soft-bottom species
(Fig. 4b). Description accumulation curves for fishes in different
habitat categories are better described by a logistic than by a Von
Bertalanffy function, except in the case of pelagic species.
Although statistical fits of these functions have high and
significant coefficients of determination, neither function
adequately describes species accumulation curves, except for
the Von Bertalanffy growth function in pelagic species (see
Fig. 4). Although the recent declines in species accumulation
rates of pelagic and multi-habitat species are signs that these
groups may be nearing complete inventories, there are no
indications that curves of reef and soft-bottom species, which
together represent the bulk (77.5%) of the fauna, are approach-
ing asymptotes (Fig. 4). Under the assumption that the fitted
functions satisfactorily describe accumulation curves (which
clearly they do not – Figs 2 & 4), asymptotes of the endemics
curves will not be reached for another 12–19 years (22–24 years
for the total fauna) at current levels of taxonomic activity. Based
on the current average rate of descriptions, all of the known
undescribed species will probably not be formally named for
another 12–15 years.
Correlates of species description dynamics
Although the relationship is quite weak, species that have wide
latitudinal distributions tend to have been described earlier
than those with relatively restricted ranges (Fig. 5a). Average
range sizes are c. 41� of latitude for species described first vs.
c. 10� for those described most recently. Furthermore, both the
southern and northern limits of the distribution of newly
described species moved from higher latitudes towards the
Tropics as time progressed, so that most recently described
species tend to be those restricted to the central part of the TEP
(Fig. 5b), around 12�N (see Mora & Robertson, 2005b).
The tempo of description is related to the depth of occurrence
in two ways. First, there is a very weak tendency for species with
larger depth ranges to have been described earlier than those with
smaller depth ranges: mean absolute depth ranges of species
described first vs. those described most recently are c. 70 m vs.
c. 20 m, respectively (Fig. 5c). Second, the upper limit of the
depth range of most recently described species tends to be deeper
than that of species first described (Fig. 5d). Through time there
also has been a continuing decline in the average body size of
newly described species (Fig. 5e): those described at the
beginning of the present century are, on average, one order of
magnitude shorter in length than those described in the 18th
Figure 5 Relationships between date of description of new species in the entire described TEP shore-fish fauna and (a) absolute latitudinal
range, (b) northern and southern limits of the latitudinal range, (c) absolute depth range, (d) upper limit of depth range, and (e) maximum
body length.
F. A. Zapata and D. R. Robertson
44 Journal of Biogeography 34, 38–51ª 2006 Blackwell Publishing Ltd. No claim to original US government works

century. Essentially the same latitudinal-, depth- and body-size-
related patterns as shown for the entire fauna in Fig. 5 occur
among the TEP endemics and also among the bony fishes
(Table 1). The latter results indicate that the entire fauna pattern
is generally not dominated by non-endemic species (except for
the depth-related pattern, which is weaker in endemics), or by
elasmobranchs, which tend to be large, and have broad
latitudinal and depth ranges.
Family-level correlations between mean year of description
and mean values of body size, and latitudinal- and depth-
range characteristics are largely consistent with those found
in the species-level analyses. At the family level, all
correlations, except those with maximum depth and absolute
depth range, were significant and in the same direction as in
the species-level results (Table 1). Finally, a number of
significant correlations within each of 17 speciose families
and within each of 12 genera of TEP teleosts (Table 2) show
that the same patterns as found in the entire fauna often
occur within lower-level taxa and thus contribute to the
overall patterns. Hence, we believe that the results of our
species-level entire-fauna analyses are robust, and that the
major patterns that emerge in these analyses (Fig. 5 and
Tables 1–3) are indicative of recent trends across a range of
taxa and can act as predictors, albeit weak ones, of future
patterns of discovery.
Inspection of Fig. 5 indicates that most of the correlations
discussed above might largely reflect characteristics of species
described prior to 1900. Because recent patterns are likely to
act as better indicators than longer-term patterns of future
trends we re-examined these relationships using descriptions
made from 1950 onwards. Body size, the upper limit of depth
range and absolute depth range remained significantly corre-
lated with date of description. Thus, most of the long-term
patterns reported in Fig. 5 and Table 1 are consistent with
recent trends.
A multiple regression model indicates that, for the entire
fauna, body size is the most important predictor of the date of
description, followed by latitudinal range, and minimum
depth of occurrence (Table 3a). The same analysis using
family-mean values for these variables confirms this result,
although minimum depth appears as the second most
important predictor of the mean year of description (results
not shown). At the species level, when habitat-use categories
were added to the multiple regression model, occurrence on
soft bottoms significantly increased (but only by 2.2%) the
amount of variance explained, to a total of 34.5%. This effect
occurred because soft-bottom and reef species have been
described significantly later on average than pelagic and multi-
habitat species, with soft-bottom species latest of all. Consid-
ering species in each habitat category, body size consistently
accounted for the greatest proportion of the variance in the
date of description in all habitats except soft bottoms
(Table 3a). In the latter case, latitudinal range had a greater
effect, although it accounted for a smaller proportion of the
variance (c. 14%) than did body size on the other habitats
(c. 19–31%). Among the TEP endemics (Table 3b), latitudinal
Table 1 Correlations between year of description and body size, latitudinal-range characteristics (northern and southern limits of dis-
tribution and absolute range) and depth-range characteristics (maximum and minimum depths and absolute range) for all species
(N ¼ 1222 in 141 families), TEP endemic species only (N ¼ 876), and bony fishes only (N ¼ 1120). Correlations for families are based on
family mean values for date of description, for body size, and latitudinal and depth ranges
Correlate
Entire fauna
TEP endemics Bony fishesSpecies Families
r P r P r P r P
Log maximum length )0.482 < 0.0001 )0.585 < 0.0001 )0.344 < 0.0001 )0.478 < 0.0001
Northern limit of distribution )0.282 < 0.0001 )0.333 < 0.0001 )0.358 < 0.0001 )0.256 < 0.0001
Southern limit of distribution 0.313 < 0.0001 0.453 < 0.0001 0.343 < 0.0001 0.303 < 0.0001
Latitudinal range )0.425 < 0.0001 )0.478 < 0.0001 )0.473 < 0.0001 )0.410 < 0.0001
Log minimum depth 0.230 < 0.0001 0.406 < 0.0001 0.168 < 0.0001 0.219 < 0.0001
Log maximum depth )0.197 < 0.0001 )0.137 0.1050 )0.015 0.6540 )0.160 < 0.0001
Log depth range )0.236 < 0.0001 )0.161 0.0560 )0.057 0.0930 )0.204 < 0.0001
Table 2 Occurrence of statistically significant correlations
between year of description and body size, latitudinal-range and
depth-range characteristics in 12 genera and 17 families of TEP
teleosts.
Correlate
Genera
with cor-
relation
Families
with cor-
relation Direction of correlation in
No.
% of
total No.
% of
total Genera Families
Full data
set
Maximum length 4 33.3 14 82.4 All ) All ) )Latitudinal range
Northern limit 2 16.7 8 47.1 All ) All ) )Southern limit 1 8.3 1 5.9 + + +
Absolute range 5 41.7 8 47.1 All ) All ) )Depth range
Minimum depth 6 50.0 4 23.5 All + 2+, 2) +
Maximum depth 3 25.0 4 23.5 2+, 1) 2+, 2) )Absolute range 3 25.0 5 29.4 2+, 1) 2+, 3) )
How many Tropical Eastern Pacific shore fishes?
Journal of Biogeography 34, 38–51 45ª 2006 Blackwell Publishing Ltd. No claim to original US government works

range was the most important predictor of the date of
description, both in the entire group and among species using
different habitats. Minimum depth was the second most
important factor in all cases except in reef fishes, for which
body size was the second most important predictor. Together
the significant variables explained 24.6–40.9% of the variance
in each of the groups of endemics.
Size–frequency distributions and potentially ‘missing’
species
The entire described TEP fish fauna (1222 species) has a log-
normal frequency distribution of body sizes (Kolmogorov–
Smirnov D ¼ 0.0319, P > 0.15; Fig. 6a). Numbers of ‘missing’
species indicated by the unfilled areas under the curve range
from 7 to 147 species, depending on whether the fit-produced
modal value or the observed modal value is used to calculate
these areas. Based on our survey of taxonomic experts, we
know that there are at least 58 unnamed species (from 34
genera in 19 families) that have been collected in the TEP and
await formal description. Adding these undescribed species to
the regional sample increases the estimate of undiscovered
species to between 10 and 196 species, depending on whether
the curve-fitted or the observed modal size value is used.
What types of fishes might the ‘missing’ species be? Depth
probably has had an effect on the discovery of different types of
species as there has been little sampling below c. 35 m by
SCUBA divers using ichthyocides, the most efficient method
for collecting small fishes that live within the substratum
matrix. The body-size frequency distribution of shallow-living
species (those with depth-range midpoints above 35 m) is
biased toward smaller sizes, while that of deeper-water species
is biased towards larger sizes (Fig. 6b). Not only are shallow
species smaller on average than deep species (mean maximum
lengths are 21 and 48 cm, respectively, for all species, and 20
and 35 cm, respectively, for bony fishes), but the relative
proportions of species in the size classes towards the tails of the
distributions differ significantly between the two groups
(Kolmogorov–Smirnov two-sample test, Dmax ¼ )0.251,
P < 0.001 for all species, Dmax ¼ )0.254, P < 0.001 for bony
fishes). Because body size is positively correlated with most
other correlates of date of description (i.e. latitudinal range,
depth range and minimum depth), but negatively correlated
with date of description, many TEP species yet to be
discovered seem likely to be small, have restricted latitudinal
and depth ranges, and have a deeper minimum depth of
occurrence. As depth range is positively correlated with body
size (r ¼ 0.49, P < 0.0001), most small species found in deep
water probably tend not to occur in shallow water. If the
proportions of species in the four smallest size classes are
approximately equal in species with shallow and deep depth-
range midpoints (those with depth-range midpoints above and
below 35 m – Fig. 6b), then c. 112 species of small bony fishes
could be awaiting discovery in TEP waters 35–100 m deep.
Body-size distributions of deep and shallow species also vary
among species using different habitats. As with the entire
Table 3 Results of multiple regressions of effects of body size,
latitudinal range, depth range and minimum depth of occurrence
on year of description of TEP shore fishes
Species group N
Independent variables
Log
max
length
Log
lat
range
Log
min
depth
Soft
bottom
Log
depth
range
Multi-
habitat
(a) Entire fauna
All species 1217 23.05 4.99 3.87 2.18 0.41
Reef 341 31.46 5.65 3.00
Soft bottom 487 3.17 13.88 4.30
Pelagic 210 20.34 1.60
Multi-habitat 179 18.63 8.03 4.30
(b) TEP endemics
All species 871 2.74 22.32 2.63 0.39
Reef 251 6.15 32.50 2.22
Soft bottom 424 1.19 17.43 4.67
Pelagic 85 *
Multi-habitat 111 21.65 2.91
Percentage of variance in year of description explained by
each variable: max length ¼ maximum total length; lat
range ¼ absolute latitudinal range; min depth ¼ shallowest
depth of occurrence; depth range ¼ absolute depth range.
*No independent variable accounted for any significant vari-
ation in year of description.
Figure 6 Size–frequency distributions of TEP shore fishes for the
entire described fauna (N ¼ 1222 species) with fit of log-normal
distribution (a) and in relation to depth of occurrence for bony
fishes (b).
F. A. Zapata and D. R. Robertson
46 Journal of Biogeography 34, 38–51ª 2006 Blackwell Publishing Ltd. No claim to original US government works

fauna, the distributions of shallow-water species in each
habitat are biased towards smaller sizes, while those of deep-
water species are biased towards larger sizes (Fig. 7). However,
the biases are stronger in pelagic and reef species than in soft-
bottom and multi-habitat species. Sampling effects are prob-
ably involved in producing some of these differences. For
example, trawl nets, which can effectively catch small species
on the surface of soft bottoms and in the water column, are not
used for sampling reefs. In contrast, the bias towards large
pelagic species in deeper water may be real, as pelagic nets
should be able readily to catch small pelagic species at depths
of 35–100 m, which are relatively shallow for net operations.
A deficit of small species on deep reefs and soft bottoms is
much more likely to be caused by a sampling effect than is an
apparent deficit of large species in shallow water, because the
latter are much more amenable to collection than the former.
If there are equal proportions of species in the three smallest
size classes of deep- and shallow-water species in both reef and
soft-bottom fishes, there may be 42 species awaiting discovery
in deeper reef habitats and 33 species in deeper soft-bottom
habitats.
DISCUSSION
Predicting the total size of the TEP fauna
From the tempo of species descriptions
Neither the species-description accumulation curve for the
entire fauna, nor that for the TEP endemics shows a tendency
to be approaching an asymptote. Among the four different
habitat-use groups, only the curves for pelagic and multi-
habitat species appear to be reaching an asymptote, and hence
these groups may be almost fully documented. To some extent,
differences in the structure of these curves must reflect patterns
of collecting activity. Pelagic species have characteristics that
should make them most likely to have been collected: they tend
to be large, have broad geographic and depth ranges, and they
live in a habitat that makes them relatively accessible to
traditional sampling using nets and hooked lines. The curve for
multi-habitat species may be approaching an asymptote
mainly because usage of more than one habitat increases their
accessibility to collection. However, as these two groups
represent only 22.5% of the total fauna, the major components
of the regional fauna clearly are not approaching full docu-
mentation.
Intensive collecting activities by divers using SCUBA, which
increased the range of habitats that could be sampled with
rotenone, began < 50 years ago. Widespread use of this
technique has probably contributed to sustaining the upward
trajectory of reef-fish descriptions. Even so, the return for
taxonomic effort (the number of species described per author
per year) does not appear to have declined recently, indicating
that plenty of species remain to be described. Hence, we
conclude that the shore-fish fauna of the TEP probably is
considerably larger than the currently known fauna, but that
species accumulation curves cannot be used to predict the total
richness of that fauna. Furthermore, the analysis of accumula-
tion curves suggests that, even if the entire-fauna curve was
approaching an asymptote, that fauna would not be fully
documented for at least another two decades.
From body-size frequency distributions
Fitting of the log-normal distribution to the size–frequency
distribution of the entire fish fauna produced widely varying
estimates of the size of the unknown component of that fauna.
Using the fit-produced modal value, only 7–10 species are
predicted to be currently unknown. Clearly, this is a gross
underestimation given recent rates of species discovery, the
Figure 7 Size–frequency distributions of
TEP shore fishes using different habitats in
two depth groups (shallow: midpoint of
depth range < 35 m; deep: that midpoint
> 35 m).
How many Tropical Eastern Pacific shore fishes?
Journal of Biogeography 34, 38–51 47ª 2006 Blackwell Publishing Ltd. No claim to original US government works

lack of levelling-off in species accumulation curves, and the
substantially larger number (58) of known undescribed species.
However, the use of observed modal values indicates that there
may be 147–196 species currently unaccounted for. If so, then
the entire fauna could comprise around 1369–1476 species,
12–15% more than are currently known. This seems more
reasonable, given the structure of species accumulation curves.
Furthermore, these estimates may be conservative because this
extrapolation from the log-normal size frequency distribution
is to some extent dependent on the size of the known fauna on
which estimates are based.
Recently described species tend to be small, to have narrow
latitudinal ranges and depth ranges, and to occur in deeper
water. Small deep-living species also tend to have narrow
latitudinal and depth ranges. In all four habitat categories there
is a bias towards larger species in the size–frequency distribu-
tions of deeper species compared with shallow species. It seems
reasonable that some of that bias could reflect inadequate
sampling in deeper water, particularly for reef fishes. If there
were proportionately as many small species on deep as on
shallow reefs then undiscovered small species on deep reefs
alone could increase the currently known fauna of 1280 species
by 3.3%. If the same reasoning is applied to soft-bottom species,
many of which live buried in the substratum, then undiscov-
ered deep soft-bottom species could represent an additional
2.6% of the known fauna. However, we cannot rule out the
possibility that there really are relatively few small undiscovered
species in deep habitats. The question of how much of the
depth biases in the abundance of small species is the result of a
lack of sampling in deep water remains a very open one.
Potential effects of genetic analyses on the determination of
faunal richness
The data and analyses presented above all relate to morpho-
species. However, most morphospecies in the TEP have
relatively large geographic ranges (Mora & Robertson,
2005a), and the assessment of genetic relationships among
geographically isolated populations of such species has barely
begun. The few such studies done to date have produced a
mixture of results. While some provide indications of genetic
integration of populations throughout the region (e.g. Bowen
et al., 2001; Muss et al., 2001), others indicate the existence of
significant genetic breaks among populations along the
continental shoreline, not only at the scale of different ends
of the region (Lessios et al., 1995; Colborn et al., 2001), but
also at the smaller scale of inside vs. outside the Gulf of
California (Bernardi et al., 2003; Sandoval-Castillo et al., 2004;
Bernardi & Lape, 2005), and at the much smaller scale of
different parts of the Gulf of California (Riginos & Victor,
2001). The Sinaloan and Central American Gaps evidently
represent significant barriers to the dispersal of shallow-water
reef fishes. These barriers have led to the production of
geographically isolated species and subspecies, and the
subdivision of the continental shoreline of the TEP into three
faunal provinces, each of which has its own suite of endemic
species and subspecies (Springer, 1959; Hastings, 2000;
Robertson & Allen, 2002). The very limited existing genetic
data, when combined with the taxonomic information on
allopatric morpho-subspecies, indicate that these barriers
could separate a significant number of geographically isolated
cryptic species. Each of the oceanic islands and archipelagos
has its own endemic shore fishes and, collectively, insular
endemics make up about 12% of the TEP endemic shore-fish
fauna (Robertson, 2001; Robertson & Allen, 2002). Genetic
studies are also needed to assess the extent to which
populations of widespread morphospecies living on the
isolated oceanic islands represent cryptic local endemics.
Priority areas for future investigations
The most poorly sampled areas in the TEP from the
perspective of fish taxonomy include the following.
Deep-reef habitats
Recent collecting in various parts of the central and west
Pacific by divers using rebreather apparatus that allows them
to sample habitats down to c.125 m has produced an
abundance of new deep-living reef fish species (Pyle, 2000).
R. Pyle’s unpublished data (pers. comm. to D.R.R., 2005)
indicate the following patterns concerning the diversity and
distributions of deep-reef fishes in these areas. (i) Only about
one-third of species living deeper than 45 m also occur in
shallow water. (ii) The percentage of species collected that are
new (i.e. undescribed) increases with depth, and, at the deepest
levels, can reach > 50%. (iii) Deep-reef species may represent
30% of all (i.e. shallow + deep) species at a site. (iv) The
geography of diversity differs in deep and shallow species.
Notably, the proportion of deep species shared between sites is
only about 1/8 of the proportion of shallow species shared
between the same sites. This pattern may apply at both small
(same island group) and large (different parts of the Pacific)
spatial scales. Even if much of this last difference is an artifact
of the small number of deep sites so far sampled, the central
and west Pacific evidently host a rich fauna of deep-reef fishes.
There has been almost no sampling of reef habitats aimed at
small species in the TEP at depths between 40 and 100 m; this
group of species is largely inaccessible except through fish-
poison collections. The Galapagos Islands represent the only
exception. Submarine-based collecting there in the 1990s led
to the discovery of 29 new species of deep demersal fishes
(J. McCosker, pers. comm. 2005), equivalent to c. 13% of the
demersal fishes currently known to occur above 100 m depth
at these islands. However, the submarine sampling activity was
concentrated between 150 and 1000 m, and all the new species
were found below 150 m. Among the named reef-only TEP
fishes, 67% do not occur below 35 m, and only 2.6% are
restricted to depths below that level; in other words, the great
majority of the known reef fishes occur only in shallow water,
and the known reef-fish fauna includes very few deep species.
It is clear from the combination of this information, the results
F. A. Zapata and D. R. Robertson
48 Journal of Biogeography 34, 38–51ª 2006 Blackwell Publishing Ltd. No claim to original US government works

from submarine collecting in the Galapagos and from
rebreather collecting in the central and western Pacific that
currently unknown reef fishes living at 40–100 m along the
continental shore and at the isolated oceanic islands could
represent a substantial component of the TEP reef-fish fauna.
Oceanic Islands
Each of the oceanic islands in the TEP has a significant number
of endemic shore fishes (Robertson, 2001; Robertson & Allen,
2002), and the faunas of these islands differ markedly in
composition from that of the mainland (Robertson et al.,
2004). The least well known of the ocean-island shallow faunas
is that of the Revillagigedo group – four islands scattered over
200 km of ocean, 400 km south of the tip of the Baja
California Peninsula. Shallow shore fishes have also not been
comprehensively collected at the Tres Marias group of islands,
located in deep water c. 100 km offshore in the southern Gulf
of California, although one apparent endemic reef fish is
known from them (Robertson & Allen, 2002).
Continental areas
Environmental conditions vary considerably along the con-
tinental shoreline of the TEP, with numerous seasonal
upwelling systems, and marked differences in mean tempera-
ture and average rainfall in different parts (Glynn & Ault,
2000). There are several continental areas where there has been
little or no modern collecting of shore fishes, including some
with special environmental characteristics that might well be
expected to affect the composition of the local shore-fish
fauna. These include (1) most of the central and southern coast
of Mexico, particularly the large upwelling system in the Gulf
of Tehuantepec; (2) the northern coast of Colombia, which
receives runoff from a large area with one of the highest
rainfalls in the world and has the lowest salinity regime in the
TEP; and (3) Ecuador in general and the large estuarine system
of the Gulf of Guayaquil in particular. This Gulf is situated at
the southern edge of the TEP, where there is a strong gradient
in physical conditions in coastal waters.
CONCLUSIONS
Species-description accumulation curves for the entire fauna
and its various components indicate that the TEP shore-fish
fauna is distinctly richer than the known fauna. However, these
curves do not allow prediction of what the total richness of
that fauna is likely to be. Based on the shape of the body size–
frequency distribution for the entire fauna, and differences in
the size–frequency distributions of deep- and shallow-living
fishes, we estimate that there may be c. 150–200 currently
unknown species, which would increase the size of the regional
fauna by 12–15%. However, given that the description
trajectories of both reef and soft-bottom species, which
together represent 77.5% of the known fauna, show no signs
of slowing down, and that there remains a significant number
of areas in the TEP where both shallow and deep fishes are not
well known, we think that that our estimate is quite
conservative. Recent trends indicate that presently unknown
species will tend to be small, have limited depth and latitudinal
ranges, and live in deeper areas. However, as these trends are
weak and collectively leave much variation unexplained, it is
likely that the unknown species will include significant
numbers of relatively large fishes, fishes that live in shallow
water, and fishes that have broad depth ranges and wide
latitudinal ranges.
The rate of descriptions has remained at about 4.2 species per
year (3.8 year)1 for TEP endemics) over the past century. This
represents c. 0.3% year)1 of the existing named regional fauna, a
relatively low rate compared with the current global total of
c. 1% year)1 for all currently named fishes (Catalog of Fishes:
http://www.calacademy.org/research/ichthyology/catalog). At
that rate it will take c. 15 years to describe the 58 unnamed
species that we know exist in the TEP. As it is likely that there are
several times as many species remaining to be discovered, and
that much sampling will be needed to cover the highest-priority
areas in the region, a reasonably complete documentation of this
regional fauna will probably take several decades at current levels
of research activity. Neither the rate of discovery and description
of morphospecies of shore fishes in the TEP nor the lack of
genetic data relating to the richness of additional cryptic
diversity bodes well for the rapid documentation of the size of
that regional fauna. At current rates of activity, documentation
by traditional taxonomy alone is likely to take several decades.
Problems and time frames relating to the documentation of the
TEP shore-fish fauna, which probably represents only c. 5% of
the global marine shore-fish fauna, are probably representative
of the situation in most parts of the Tropics.
ACKNOWLEDGEMENTS
We thank the following taxonomists for information about un-
described TEP fish species: C. Baldwin, P. Bearez, R. Betancur,
J. Briggs, W. Bussing, T.J. Castro-Aguirre, L. Chao, B.
Collette, L. Findley, P. Heemstra, J. McCosker, J. McEachran,
T. Munroe, J. Neilsen, S. Poss, D.G. Smith, W. Smith-Vaniz, J.
Van Tassell and H.J. Walker. J. Christy, R. Collin, B. Collette,
H. Lessios, J.A.F. Diniz-Filho, and an anonymous referee
provided useful comments on previous versions of this paper.
This work was supported by a Smithsonian Institution Short-
Term Visitor Award to F.A.Z.
REFERENCES
Ackerman, J.L. & Bellwood, D.R. (2000) Reef fish assemblages:
a re-evaluation using enclosed rotenone stations. Marine
Ecology Progress Series, 206, 227–237.
Anonymous (1994) The systematics agenda (2000): charting the
biosphere. Technical Report of the Society of Systematic
Biologists, New York, NY.
How many Tropical Eastern Pacific shore fishes?
Journal of Biogeography 34, 38–51 49ª 2006 Blackwell Publishing Ltd. No claim to original US government works

Beardsley, S. (2005) Bending to barcodes. Scientific American,
292, 26–28.
Bernardi, G. & Lape, J. (2005) Tempo and mode of speciation
in the Baja California disjunct fish species Anisotremus
davidsonii. Molecular Ecology, 14, 4085–4096.
Bernardi, G., Findley, L. & Rocha-Olivares, A. (2003) Vicar-
iance and dispersal across Baja California in disjunct marine
fish populations. Evolution, 57, 1599–1609.
Blackburn, T.M. & Gaston, K.J. (1994) Animal body size dis-
tributions: patterns, mechanisms and implications. Trends
in Ecology & Evolution, 9, 471–474.
Bouchet, P. (1997) Inventorying the molluscan diversity of the
world: what is our rate of progress? Veliger, 40, 1–11.
Bouchet, P., Lozouet, P., Maestrati, P. & Heros, V. (2002)
Assessing the magnitude of species richness in tropical
marine environments: exceptionally high numbers of mol-
lusks at a New Caledonia site. Biological Journal of the Lin-
naean Society, 75, 421–436.
Bowen, B.W., Bass, A.L., Garcia-Rodriguez, A.I., Rocha, L.A. &
Robertson, D.R. (2001) Phylogeography of the trumpetfish
(Aulostomus spp.): a ring species complex on a global scale.
Evolution, 55, 1029–1039.
Briggs, J.C. (1974) Marine zoogeography. McGraw-Hill, New
York, NY.
Brooks, T.M., Mittermeier, R.A., Mittermeier, C.G., da Fon-
seca, G.A.B., Rylands, A.B., Konstant, W.R., Flick, P.,
Pilgrim, J., Oldfield, S., Magin, G. & Hilton-Taylor, C.
(2002) Habitat loss and extinction in the hotspots of bio-
diversity. Conservation Biology, 16, 909–923.
Brown, J.H. (1995) Macroecology. University of Chicago Press,
Chicago, IL.
Carlton, J.T., Geller, J.B., Reaka-Kudla, M.L. & Norse, E.A.
(1999) Historical extinctions in the sea. Annual Review of
Ecology & Systematics, 30, 515–538.
Coates, A.G. & Obando, J.A. (1996) The geologic evolution of
the Central American Isthmus. Evolution and environments
in tropical America (ed. by J.B.C. Jackson, A.F. Budd and
A.G. Coates), pp. 21–56. University of Chicago Press, Chi-
cago, IL.
Colborn, J., Crabtree, R.E., Shaklee, J.B., Pfeiler, E. & Bowen,
B.W. (2001) The evolutionary enigma of bonefishes (Albula
spp): cryptic species and ancient separations in a globally
distributed shorefish. Evolution, 55, 807–820.
Collen, B., Purvis, A. & Gittleman, J.L. (2004) Biological
correlates of description date of carnivores and primates.
Global Ecology and Biogeography, 13, 459–467.
Collette, B.B., Williams, J.T., Thacker, C.E. & Smith, M.L.
(2003) Shore fishes of Navassa Island, West Indies: a case
study on the need for rotenone sampling in reef fish bio-
diversity studies. Aqua, 6, 89–131.
Ekman, S. (1953) Zoogeography of the sea. Sidgwick and
Jackson, London.
Erwin, T.L. (1983) Tropical forest canopies, the last biotic
frontier. Bulletin of the Entomological Society of America, 29,
14–19.
Erwin, T.L. (1991) How many species are there?: revisited.
Conservation Biology, 5, 330–333.
Felsenstein, J. (1985) Phylogenies and the comparative meth-
od. The American Naturalist, 125, 1–15.
Gaston, K.J. (1991a) The magnitude of global insect species
richness. Conservation Biology, 5, 283–296.
Gaston, K.J. (1991b) Body size and the probability of des-
cription: the beetle fauna of Britain. Ecological Entomology,
16, 505–508.
Gaston, K.J. & Blackburn, T.M. (1994) Are newly
described bird species small-bodied? Biodiversity Letters, 2,
16–20.
Gaston, K.J. & Blackburn, T.M. (2000) Macroecology. Blackwell
Science, Oxford.
Glynn, P.W. & Ault, S.J. (2000) A biogeographic analysis and
review of the far eastern Pacific coral reef region. Coral Reefs,
19, 1–23.
Grigg, R.W. & Hey, R. (1992) Paleoceanography of the tropical
eastern Pacific Ocean. Science, 255, 172–178.
Hammer, Ø., Harper, D.A.T. & Ryan, P.D. (2001) PAST:
paleontological statistics software package for education and
data analysis. Palaeontologia Electronica, 4, 1–9 http://
palaeo-electronica.org/2001_1/past/issue1_01.htm.
Harvey, P.H. & Pagel, M.D. (1991) The comparative method in
evolutionary biology. Oxford University Press, Oxford.
Hastings, P.A. (2000) Biogeography of the tropical eastern
Pacific: distribution and phylogeny of chaenopsid fishes.
Zoological Journal of the Linnaean Society, 128, 319–
335.
Hutchinson, G.E. & MacArthur, R.H. (1959) A theoretical
ecological model of size distributions among species of an-
imals. The American Naturalist, 93, 117–125.
Lessios, H.A., Allen, G.R., Wellington, G.M. & Bermingham, E.
(1995) Genetic and morphological evidence that the Eastern
Pacific damselfish Abudefduf declivifrons is distinct from A.
concolor (Pomacentridae). Copeia, 1995, 277–288.
Lubchenco, J. (1998) Entering the century of the environment:
a new social contract for science. Science, 279, 491–497.
Ludwig, J.A. & Reynolds, J.F. (1988) Statistical ecology: a primer
on methods and computing. John Wiley & Sons, New York,
NY.
May, R.M. (1978) The dynamics and diversity of insect faunas.
Diversity of insect faunas (ed. by B.A. Mound and N.
Waloff), pp. 188–204. Blackwell, Oxford.
May, R.M. (1988) How many species are there on earth? Sci-
ence, 241, 1441–1449.
May, R.M. (1990) How many species? Philosophical Transac-
tions of the Royal Society of London Series B, Biological Sci-
ences, 330, 293–304.
Mora, C. & Robertson, D.R. (2005a) Factors shaping the
range-size frequency distribution of the endemic fish fauna
of the Tropical Eastern Pacific. Journal of Biogeography, 32,
277–286.
Mora, C. & Robertson, D.R. (2005b) Causes of latitudinal
gradients in species richness: a test with the endemic
F. A. Zapata and D. R. Robertson
50 Journal of Biogeography 34, 38–51ª 2006 Blackwell Publishing Ltd. No claim to original US government works

shorefishes of the Tropical Eastern Pacific. Ecology, 86,
1771–1782.
Muss, A., Robertson, D.R., Stepien, C.A., Wirtz, P. & Bowen,
B.W. (2001) Phylogeography of Ophioblennius: the role of
ocean currents and geography in reef fish evolution. Evo-
lution, 55, 561–572.
Ødegaard, F. (2000) How many species of arthropods? Erwin’s
estimate revised. Biological Journal of the Linnaean Society,
71, 583–597.
Palumbi, S.R. (2001) The ecology of marine protected areas.
Marine community ecology (ed. by M.D. Bertness, S.D.
Gaines and M.E. Hay), pp. 509–530. Sinauer Associates,
Sunderland, MA.
Patterson, B.D. (1994) Accumulating knowledge on the
dimensions of biodiversity: systematic perspectives on
Neotropical mammals. Biodiversity Letters, 2, 79–86.
Patterson, B.D. (2000) Patterns and trends in the discovery of
new Neotropical mammals. Diversity & Distributions, 6,
145–151.
Patterson, B.D. (2001) Fathoming tropical biodiversity: the
continuing discovery of Neotropical mammals. Diversity &
Distributions, 7, 191–196.
Paulay, G. (1997) Diversity and distribution of reef organisms.
Life and death of coral reefs (ed. by C. Birkeland), pp. 298–
353. Chapman & Hall, New York, NY.
Peterson, C.H. & Estes, J.A. (2001) Conservation and man-
agement of marine communities. Marine community ecology
(ed. by M.D. Bertness, S.D. Gaines and M.E. Hay), pp. 469–
507. Sinauer Associates, Sunderland, MA.
Pyle, R.L. (2000) Assessing undiscovered fish biodiversity on
deep coral reefs using advanced self-contained diving tech-
nology. MTS Journal, 34, 82–91.
Reaka-Kudla, M.L. (1997) The global biodiversity of coral
reefs: a comparison with rain forests. Biodiversity II:
understanding and protecting our biological resources (ed. by
M.L. Wilson and E.O. Wilson), pp. 83–108. Joseph Henri
Press, New York, NY.
Reed, R.N. & Boback, S.M. (2002) Does body size predict dates
of species description among North American and Aus-
tralian reptiles and amphibians? Global Ecology & Biogeo-
graphy, 11, 41–47.
Riginos, C. & Victor, B.C. (2001) Larval spatial distributions
and other early life-history characteristics predict genetic
differentiation in eastern Pacific blennioid fishes. Proceedings
of the Royal Society of London Series B, Biological Sciences,
268, 1–6.
Robertson, D.R. (1998) Do coral reef fish faunas have a dis-
tinctive taxonomic structure? Coral Reefs, 17, 179–186.
Robertson, D.R. (2001) Population maintenance among
tropical reef-fishes: inferences from the biology of small-
island endemics. Proceedings of the National Academy of
Sciences USA, 98, 5668–5670.
Robertson, D.R. & Allen, G.R. (2002) Shorefishes of
the tropical eastern Pacific: an information system. CD-
ROM. Smithsonian Tropical Research Institute, Balboa,
Panama.
Robertson, D.R., Grove, J.S. & McCosker, J.E. (2004) Tropical
transpacific shorefishes. Pacific Science, 58, 507–565.
Russell, B.C., Talbot, F.H., Anderson, G.R.V. & Goldman, B.
(1978) Collection and sampling of reef fishes. Coral reefs:
research methods (ed. by D.R. Stoddart and R.E. Johannes),
pp. 329–345. Monographs on oceanographic research 39,
UNESCO, Norwich.
Sandoval-Castillo, J., Rocha-Olivares, A., Villavicencio-Garay-
zar, C. & Balart, E. (2004) Cryptic isolation of Gulf of
California shovelnose guitarfish evidenced by mitochondrial
DNA. Marine Biology, 145, 983–988.
Smith, C.L. (1973) Small rotenone stations: a tool for studying
coral reef fish communities. American Museum Novitates,
2512, 1–21.
Smith, C.L., Tyler, J.C., Davis, W.P., Jones, R.S., Smith, D.G. &
Baldwin, C.C. (2003) Fishes of Pelican Cays, Belize. Atoll
Research Bulletin, 497, 1–88.
Smith-Vaniz, W., Collette, B.B. & Luckhurst, B.E. (1999)
Fishes of Bermuda. American Society of Ichthyologists &
Herpetologists Special Publication, 4, 1–424. Allen Press,
Laurence, KS.
Springer, V.G. (1959) Systematics and zoogeography of the
clinid fishes of the subtribe Labrisomini Hubbs. Publications
of the Institute of Marine Science of the University of Texas, 5,
417–492.
Steneck, R.S. & Carlton, J.T. (2001) Human alterations of
marine communities: students beware. Marine community
ecology (ed. by M.D. Bertness, S.D. Gaines and M.E. Hay),
pp. 445–468. Sinauer Associates, Sunderland, MA.
Vermeij, G.J. (2001) Community assembly in the sea: geologic
history of the living shore biota. Marine community ecology
(ed. by M.D. Bertness, S.D. Gaines and M.E. Hay), pp. 39–
60, Sinauer Associates, Sunderland, MA.
BIOSKETCHES
Fernando Zapata is a professor in the Marine Biology
Section of the Department of Biology at Universidad del Valle.
His research and teaching focus on the population and
community ecology, macroecology and biogeography of fishes
and corals in the Tropical Eastern Pacific. He also has an
interest in the theoretical and empirical aspects of the study of
diversity gradients.
D. Ross Robertson has been a researcher with the Smith-
sonian Tropical Research Institute since 1975. His interests
include many aspects of the biology of tropical reef fishes –
biogeography, ecology, population biology, demography,
evolution and taxonomy. His work on the fishes of the
Tropical Eastern Pacific led to the production in 2002 of the
co-authored CD-ROM ‘Shorefishes of the Tropical Eastern
Pacific: an information system’.
Editor: David Bellwood
How many Tropical Eastern Pacific shore fishes?
Journal of Biogeography 34, 38–51 51ª 2006 Blackwell Publishing Ltd. No claim to original US government works