Origin and evolution of a splay fault in the Nankai accretionary wedge
6
LETTERS PUBLISHED ONLINE: 16 AUGUST 2009 | DOI: 10.1038/NGEO609 Origin and evolution of a splay fault in the Nankai accretionary wedge Michael Strasser 1 * , Gregory F. Moore 2,3 , Gaku Kimura 3,4 , Yujin Kitamura 5 , Achim J. Kopf 1 , Siegfried Lallemant 6 , Jin-Oh Park 3,7 , Elizabeth J. Screaton 8 , Xin Su 9 , Michael B. Underwood 10 and Xixi Zhao 11 Subduction zones are often characterized by wedge-shaped sedimentary complexes—called accretionary prisms—that form when sediments are scraped off the subducting plate and added to the overriding plate. Large, landward-dipping thrust faults can cut through such a prism: these faults, known as ‘megasplay faults’ 1,2 , originate near the top of the subducting plate and terminate at the shallow, landward edge of the prism 1,3–6 . Megasplay faults have been the subject of numerous geological and geophysical studies 4–15 , but their initiation and evolution through time remains poorly constrained. Here we combine seismic reflection data from the Nankai accretionary wedge with geological data collected by the Integrated Ocean Drilling Program (IODP) and find that the splay fault cutting this wedge initiated ∼1.95 Million years (Myr) ago in the lower part of the prism as an out-of-sequence thrust (OOST). After an initial phase of high activity, the movement along the fault slowed down, but uplift and reactivation of the fault resumed about 1.55 Myr ago. The alternating periods of high and low activity along the splay fault that we document hint at episodic changes in the mechanical stability of accretionary prisms. Great earthquakes and tsunamis along subduction zones are generated when large areas of the megathrust rupture and slip propagates along faults, transferring displacement close to the sea bed. For example, the devastating wave generated by the 2004 Sumatra earthquake 16 showed us this hazardous force of nature quite plainly. Many studies have inferred that coseis- mic slip along splay-faults provides a mechanism by which earthquakes generate tsunamis 1,3–5,9,10 . On longer timescales, ‘ge- ologically’ active splay faults may accommodate a significant portion of plate convergence stresses 6 . The geological history of such faults thus has important implications for the structural evolution of accretionary margins, as well as for the related tectonics of the seismogenic zone, and its geohazard potential. Conceptually, a splay fault may evolve from reactivation of pre- existing faults or discontinuities, such as when the basal décollement is strengthening and its shear strength approaches the value of internal friction of the prism, or by readjustment of the wedge taper angle owing to a décollement step down and accompa- nied underplating 12,13 . 1 MARUM, Centre for Marine Environmental Sciences, University of Bremen, 28359 Bremen, Germany, 2 Department of Geology and Geophysics, University of Hawaii, Honolulu, Hawaii 96822, USA, 3 Institute for Research on Earth Evolution, Japan Agency for Marine-Earth Science Technology, Kanazawa-ku, Yokohama, Kanagawa 2360001, Japan, 4 Department of Earth and Planetary Science, The University of Tokyo, Tokyo 113-0033, Japan, 5 IFM-GEOMAR, The Leibniz-Institute of Marine Sciences at University of Kiel, 24148 Kiel, Germany, 6 Geosiences & Environment Cergy, University of Cergy-Pontoise, 95031 Cergy-Pontoise, France, 7 Ocean Research Institute, The University of Tokyo, Tokyo 164-8639, Japan, 8 Department of Geology, University of Florida, Gainesville, Florida 32611, USA, 9 School of Marine Geosciences, China University of Geosciences, Beijing 100083, China, 10 Department of Geological Sciences, University of Missouri, Columbia, Missouri 65211, USA, 11 Department of Earth and Planetary Sciences, University of California, Santa Cruz, California 95064, USA. *e-mail: [email protected]. For the Nankai Trough, where the Philippine Sea plate is subducting below south west Japan and repeatedly producing destructive earthquakes 17 , reflection seismic images have been used to identify such a splay fault as a first-order margin-dominating structure that extends more than 120 km along the strike 4,5 . Me- chanical arguments 15,18 , seismic 8 and tsunami 9,10 waveform inver- sions, and reflection seismic data that image the splay fault–seafloor intersection 5 strongly suggest that this fault, termed ‘megasplay’ 2 , is the primary coseismic plate boundary near the up-dip terminus of slip and contributed to generating devastating historic tsunamis. In the Kumano Basin area, the megasplay branches from the plate boundary thrust ∼50 km landward of the trench 4 (Fig. 1). Substantial long-term slip is documented by sequence boundaries and progressive landward tilting of strata in the forearc basin 5,19 . The shallow part of the megasplay is a complex thrust system with backwards-breaking branches that truncate the imbricate thrust faults within the accretionary prism 5,19 . This observation, along with the fact that slope sediments overlying the thrust sheet have been overridden by the megasplay, led to the conclusion that after ‘normal’ in-sequence thrusting and building of an accretionary prism, the out-of-sequence megasplay fault broke through at the back of the prism 5 . New results from the IODP Expedition 316 drilling the shallow portion of the megasplay and an adjacent slope basin partly overridden by the fault (Sites C0004 (ref. 20) and C0008 (ref. 21); Figs 1 and 2) allow us to test this interpretation, assign age control on the conceptual prism-development model, and explore the splay-fault origin and evolution and its relation to the structural evolution of the Nankai margin through time. Coring at Site C0008A recovered the full slope-basin strati- graphic succession and the top of the underlying accretionary prism 21 . The boundary between older accreted sediments (unit II; maximum age 2.87 Myr (Fig. 3)) and the overlying slope-basin sediments (unit I) correlates to a high amplitude, landward-dipping seismic reflection, indicating that the accommodation for slope- basin sediments was created behind anticlinal structures related to in-sequence forward-propagating thrusts. The lowermost part of the slope-basin stratigraphic succession consists of a 40-m-thick mass transport complex (MTC; ref. 21). In seismic data, the MTC corresponds to a package characterized by 648 NATURE GEOSCIENCE | VOL 2 | SEPTEMBER 2009 | www.nature.com/naturegeoscience © 2009 Macmillan Publishers Limited. All rights reserved.
Transcript of Origin and evolution of a splay fault in the Nankai accretionary wedge

LETTERSPUBLISHED ONLINE: 16 AUGUST 2009 | DOI: 10.1038/NGEO609
Origin and evolution of a splay fault in the Nankaiaccretionary wedgeMichael Strasser1*, Gregory F. Moore2,3, Gaku Kimura3,4, Yujin Kitamura5, Achim J. Kopf1,Siegfried Lallemant6, Jin-Oh Park3,7, Elizabeth J. Screaton8, Xin Su9, Michael B. Underwood10
and Xixi Zhao11
Subduction zones are often characterized by wedge-shapedsedimentary complexes—called accretionary prisms—thatform when sediments are scraped off the subducting plate andadded to the overriding plate. Large, landward-dipping thrustfaults can cut through such a prism: these faults, known as‘megasplay faults’1,2, originate near the top of the subductingplate and terminate at the shallow, landward edge of theprism1,3–6. Megasplay faults have been the subject of numerousgeological and geophysical studies4–15, but their initiation andevolution through time remains poorly constrained. Here wecombine seismic reflection data from the Nankai accretionarywedge with geological data collected by the Integrated OceanDrilling Program (IODP) and find that the splay fault cuttingthis wedge initiated∼1.95 Million years (Myr) ago in the lowerpart of the prism as an out-of-sequence thrust (OOST). Afteran initial phase of high activity, the movement along the faultslowed down, but uplift and reactivation of the fault resumedabout 1.55 Myr ago. The alternating periods of high and lowactivity along the splay fault that we document hint at episodicchanges in the mechanical stability of accretionary prisms.
Great earthquakes and tsunamis along subduction zones aregenerated when large areas of the megathrust rupture and slippropagates along faults, transferring displacement close to thesea bed. For example, the devastating wave generated by the2004 Sumatra earthquake16 showed us this hazardous force ofnature quite plainly. Many studies have inferred that coseis-mic slip along splay-faults provides a mechanism by whichearthquakes generate tsunamis1,3–5,9,10. On longer timescales, ‘ge-ologically’ active splay faults may accommodate a significantportion of plate convergence stresses6. The geological history ofsuch faults thus has important implications for the structuralevolution of accretionary margins, as well as for the relatedtectonics of the seismogenic zone, and its geohazard potential.Conceptually, a splay fault may evolve from reactivation of pre-existing faults or discontinuities, such aswhen the basal décollementis strengthening and its shear strength approaches the value ofinternal friction of the prism, or by readjustment of the wedgetaper angle owing to a décollement step down and accompa-nied underplating12,13.
1MARUM, Centre for Marine Environmental Sciences, University of Bremen, 28359 Bremen, Germany, 2Department of Geology and Geophysics,University of Hawaii, Honolulu, Hawaii 96822, USA, 3Institute for Research on Earth Evolution, Japan Agency for Marine-Earth Science Technology,Kanazawa-ku, Yokohama, Kanagawa 2360001, Japan, 4Department of Earth and Planetary Science, The University of Tokyo, Tokyo 113-0033, Japan,5IFM-GEOMAR, The Leibniz-Institute of Marine Sciences at University of Kiel, 24148 Kiel, Germany, 6Geosiences & Environment Cergy, University ofCergy-Pontoise, 95031 Cergy-Pontoise, France, 7Ocean Research Institute, The University of Tokyo, Tokyo 164-8639, Japan, 8Department of Geology,University of Florida, Gainesville, Florida 32611, USA, 9School of Marine Geosciences, China University of Geosciences, Beijing 100083, China,10Department of Geological Sciences, University of Missouri, Columbia, Missouri 65211, USA, 11Department of Earth and Planetary Sciences, University ofCalifornia, Santa Cruz, California 95064, USA. *e-mail: [email protected].
For the Nankai Trough, where the Philippine Sea plate issubducting below south west Japan and repeatedly producingdestructive earthquakes17, reflection seismic images have been usedto identify such a splay fault as a first-order margin-dominatingstructure that extends more than 120 km along the strike4,5. Me-chanical arguments15,18, seismic8 and tsunami9,10 waveform inver-sions, and reflection seismic data that image the splay fault–seafloorintersection5 strongly suggest that this fault, termed ‘megasplay’2, isthe primary coseismic plate boundary near the up-dip terminus ofslip and contributed to generating devastating historic tsunamis.
In the Kumano Basin area, the megasplay branches from theplate boundary thrust ∼50 km landward of the trench4 (Fig. 1).Substantial long-term slip is documented by sequence boundariesand progressive landward tilting of strata in the forearc basin5,19.The shallow part of the megasplay is a complex thrust system withbackwards-breaking branches that truncate the imbricate thrustfaults within the accretionary prism5,19. This observation, alongwith the fact that slope sediments overlying the thrust sheet havebeen overridden by the megasplay, led to the conclusion that after‘normal’ in-sequence thrusting and building of an accretionaryprism, the out-of-sequence megasplay fault broke through at theback of the prism5. New results from the IODP Expedition 316drilling the shallow portion of the megasplay and an adjacent slopebasin partly overridden by the fault (Sites C0004 (ref. 20) andC0008(ref. 21); Figs 1 and 2) allow us to test this interpretation, assign agecontrol on the conceptual prism-development model, and explorethe splay-fault origin and evolution and its relation to the structuralevolution of the Nankai margin through time.
Coring at Site C0008A recovered the full slope-basin strati-graphic succession and the top of the underlying accretionaryprism21. The boundary between older accreted sediments (unitII; maximum age 2.87Myr (Fig. 3)) and the overlying slope-basinsediments (unit I) correlates to a high amplitude, landward-dippingseismic reflection, indicating that the accommodation for slope-basin sediments was created behind anticlinal structures related toin-sequence forward-propagating thrusts.
The lowermost part of the slope-basin stratigraphic successionconsists of a 40-m-thick mass transport complex (MTC; ref. 21). Inseismic data, the MTC corresponds to a package characterized by
648 NATURE GEOSCIENCE | VOL 2 | SEPTEMBER 2009 | www.nature.com/naturegeoscience
© 2009 Macmillan Publishers Limited. All rights reserved.
NATURE GEOSCIENCE DOI: 10.1038/NGEO609 LETTERS
Kumano Basinsediments
Subducting oceanic crust
Décollement Shikoku Basin sediment
Older accretionary prism
Slope sediments
Forearc basinForearc
highFrontal
thrust zoneMegasplayfault zone Imbricate thrust zone Trench
5 kmVE = 2X
Dep
th (
km)
NW SEC0004C0002
C0008Fig. 2
C0004
C0002
C0008
Shikoku Kii
Honshu
Eurasianplate
Philippine Seaplate
Honshu
Kii
Nankai Trough Pacificplate
33°
134° 136° 138°
10
8
6
4
a b
Megasplay fault
31°
35°La
titud
e (N
)Longitude (E)
Figure 1 |Geological setting of the Nankai accretionary wedge. a, Shaded relief map of the Nankai Trough showing the regional setting of the IODPNanTroSEIZE (Nankai Trough Seismogenic Zone Experiment) drilling transect2,19. The red line through IODP drill Sites C0002, C0004 and C0008 showsthe location of the seismic cross-section in Fig. 1b. The inset is a tectonic map of the Philippine Sea region. b, Interpreted composite seismic line of theNanTroSEIZE transect, after Moore et al.19. VE= 2X: twofold vertical exaggeration.
Dep
th (
m)
2,750
3,000
3,250
NW SE
U I
bU
nit I
I
C0008-A
C0008-C
Uni
t I
Uni
t IU
nit I
IU
nit I
IIU
nit I
V
C0004 A-D
Uplifted prism
Accretionary prismMTC
Slope basin
Hiatus1.6¬1.77 Myr*
~2¬2.5 Myr*
~1.65 ¬ 1.8 Myr*
~1.55 Myr*
~1.24/1.24 Myr*
1.95¬2.4 Myr*
Splay fault
IODP Exp. 316 age constraints(biostratigraphy and magnetostratigraphy)
*
MTC mass transport complex
100 m
No VE
Figure 2 |Data compilation across the shallow megasplay system. Detail and interpretation of the seismic inline IL 2675 crossing IODP Sites C0004,C0008A and C0008C. The location is shown in Fig. 1b. Overlain are lithostratigraphic sections of drill sites (see Fig. 3 for the symbol legend) and ageconstraints for key stratigraphic horizons20,21.
low amplitude, fuzzy reflections of low lateral continuity. This bodythickens towards the northwest where it has been fully overriddenby the splay fault, which indicates that the fault has been activealmost since the onset ofMTC formation. The low content of calciteleads us to conclude that in its early stage, the basin was in deepwater below the calcite compensation depth (CCD (ref. 22); Fig. 3).Magnetostratigraphy shows that the whole MTC was depositedduring times of continuously positive polarities correlated to theOlduvai subchron (1.95–1.77Myr; Fig. 3). We thus interpret theoccurrence of older nanofossil assemblages within the lower partof the MTC as being reworked (Fig. 3) and assign an age of∼1.95Myr to the base.
This date further provides a minimum age for accretion.It follows that Site C0008 was at a frontal-prism-toe positionsometime between 2.87 and 1.95Myr. This relatively large timespan suggests a stratigraphic hiatus and that the MTC does not
conformably overlie the prism. Similarly, maximum andminimumaccretion ages for the prism now uplifted in the hanging-wallblock of the splay fault can be constrained from age controlover the lithological boundary between overlying slope-apronsediments and underlying accreted strata at Site C0004. In thecore, this boundary corresponds to a sharp angular unconformitywith a hiatus spanning between 1.46–1.6 and 2.06 to 2.512Myr,and between 1.77 and 1.95Myr, as derived from nanofossilbiostratigraphy and magnetostratigraphy, respectively20 (Fig. 3).There is some discrepancy between the age models, but we knowthat the accretion age has to be older at Site C0004 than at SiteC0008, as reasoned by geometrical arguments within the splay-fault thrust system. We use the overlap range for maximum andminimum accretion ages at both sites to conclude that there isno major discontinuity in accretion age even where the splay-fault system is crossed. Hence, our data document that sometime
NATURE GEOSCIENCE | VOL 2 | SEPTEMBER 2009 | www.nature.com/naturegeoscience 649© 2009 Macmillan Publishers Limited. All rights reserved.

LETTERS NATURE GEOSCIENCE DOI: 10.1038/NGEO609
100
200
300
400
Depth
(mbsf)
J
Polarity chron Nannofossilevents
0.42
0.780.991.071.771.952.58
1.77
Age (Myr) Polarity chronAge (Myr)
0.440.91.0781.24
1.46¬1.6
2.872.06¬2.52
3.653.79
4.13
3.65
1.560-1.617
1.67
Unit I
Unit II
Unit III
Unit IV
Lithostratigraphy
Content of calcite (wt%)
Content of calite
Carb dataXRD data
C0004 C&D
(mbsf)
Content of calcite (wt%)
Carb dataXRD data
1.071.211.24
1.77
0.063>1.04 ¬ <1.078
<1.67< 2.135<2.393<2.87
1.241.34
1.34
1.461.46
1.46
>1.6¬<1.67?>1.24¬<1.34
>1.6
C0008A
Sandy silt
Silt turbidite
Hemipelagic mud
Volcanic ash Sand turbidite
Breccia/conglomerate
Legend
0 10 20 30
E
M
Ga
O
Gi
Ga
M
B
O
LithostratigraphyDepth
Content of calcite
(Myr ago)
Nannofossilevents
(Myr ago)
Unit IA:
Unit IB:
Unit II:
BJ
O
CMM
M
M
100
200
300
0
0 10 20 30
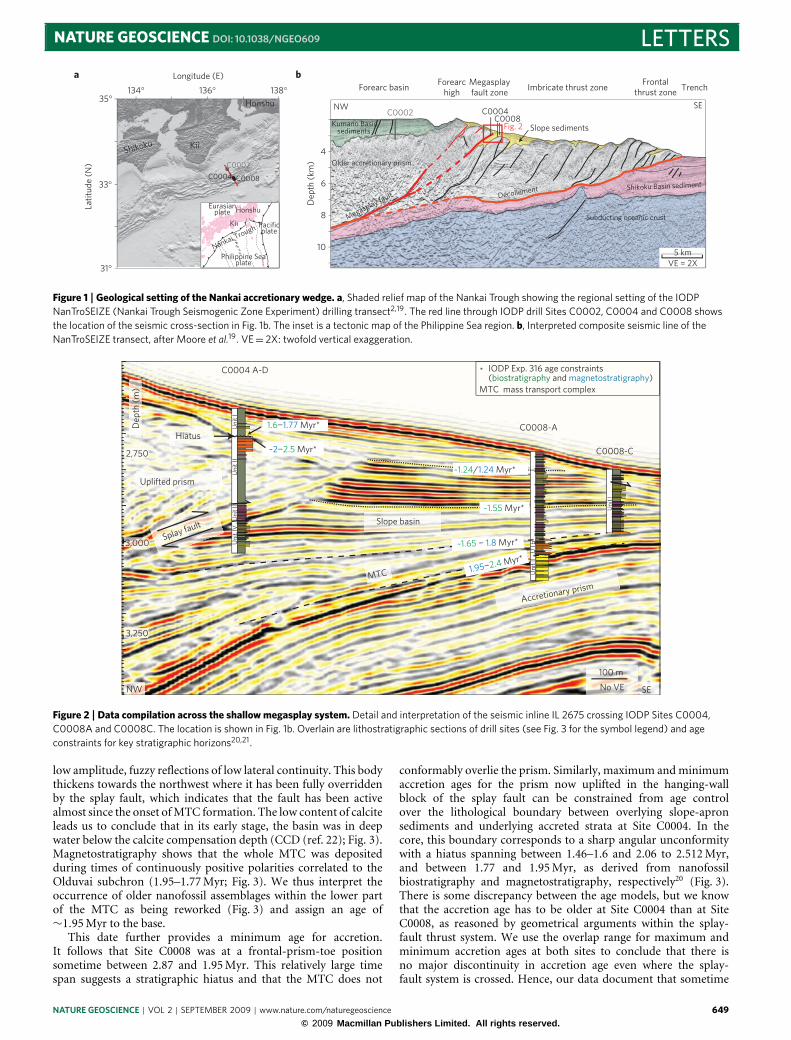
Figure 3 | IODP Sites C0004 and C0008; core data. Compilation of the magnetostratigraphy, biostratigraphy, lithostratigraphy and content of calcitevalues for Sites C0004 (ref. 20) and C0008 (ref. 21). Blue boxes in the nanofossil event column indicate likely reworking due to mass movements. Thedashed vertical line in the content of calcite plot marks the interpreted threshold condition for deposition below or above the calcite compensation depthCCD (∼4.0±0.6 km; ref. 22). Note that we have interpreted this value as 10% calcite, which still accounts for some (10%) calcite reworking by downslopesediment transport processes. The magnetostratigraphy abbreviations are: B: Brunhes chron, M: Matuyama chron, Ga: Gauss chron, Gi: Gilbert chron,J: Jaramillo subchron, CM: Cobb Mountain subchron, O: Olduvai subchron, E: Emporer event.
between 2.512 and 1.95Myr (with an older age within this age rangebeingmore likely) the tectono-stratigraphic systemwas in a frontal-prism-toe position with a forward-propagating deformation frontat a nearly steady rate of accretion (Fig. 4d). At ∼1.95Myr, what isnow the shallow portion of the megasplay initiated as an OOST thatoverrode mass-wasting deposits accumulating in the slope basinsituated in a lower prismposition below the CCD (Fig. 4c).
The subsequent evolution of the splay-fault system is recon-structed by back-stripping fault movements in seismic data (Fig. 4,Supplementary Fig. S1). Along the transect studied, the fault zoneis bounded by an upper and a lower fault20 (Fig. 2), the lateralextent of which, however, is small, suggesting an anastomosingpattern of the shallow part of the megasplay fault system19. Thelower fault does not cut the shallow slope sediments youngerthan 1.46–1.6Myr but the upper fault cuts them and thus isyounger. Back-stripping movement along the lower branch, whichour data show to have been active between ∼1.95 and ∼1.55Myr,reveals horizontal throw rates of ∼8.6mkyr−1 between 1.95 and1.8Myr, 2.5mkyr−1 between 1.8 and 1.7Myr, and 1.93mkyr−1between 1.7 and 1.55Myr (Fig. 4, Supplementary Fig. S1). Thissuggests that after an initial high-activity phase, movement alongthe lower fault continuously decreased. During its initial phasebetween 1.95 and 1.8Myr the OOST accommodated ∼15–22%of the estimated plate convergence during that time, as inferredby relating the reconstructed horizontal throw rate along thefault to mean plate motions of between 4 cm yr−1(ref. 23) and6 cm yr−1 (ref. 24). This relatively high value suggests that duringthat time, prism forward growth was probably diminished or tem-porarily ceased (Fig. 4c). Since ∼1.8Myr, the initial high-activityperiod then was followed by ∼250 kyr of decreased rate of out-of-sequence thrusting, most likely accompanied by more efficienttransfer of the plate convergence to the frontal prism, resulting
in forward propagation of the deformation front and accretion byin-sequence thrusting (Fig. 4b).
This reconstruction does not support the previously heldhypothesis that onset of movement along the splay-fault systemand associated uplift of the hanging-wall block caused formationof the forearc high, thereby creating accommodation and favouringonset of rapid sedimentation in the Kumano Basin5. Results fromIODP Expedition 315 (ref. 25) coring at Site C0002 (Fig. 1)integrated with three-dimensional seismic interpretation19 indicatethat rapid forearc-basin deposition started around 1.56–1.67Myr,and thus ∼400 kyr after our inferred age of splay-fault origin.One possible explanation for this discrepancy would be a timedelay between creation of accommodation and the reorganizationof sediment-delivery systems25. Alternatively, as suggested by ouranalysis, this discrepancy can be explained by interpreting thrustingalong the lower splay-fault branch as corresponding to activityalong the initial OOST in a frontal-prism setting. Formation ofthe forearc high and subsequent onset of rapid forearc-basinsedimentation then links to uplift and reactivation of this OOSTas a ‘megasplay’ system∼1.56–1.67Myr ago. This interpretation isreinforced by low concentration of calcite in the underthrust sectionat Site C0004 (Fig. 3), revealing that at least until 1.56–1.61Myr,deposition occurred below CCD and uplift thus has to be younger.Similarly, the increase of content of calcite in the slope sedimentstrata at Site C0008A between ∼160 and 40m below the seafloor(mbsf) suggests that the tectono-stratigraphic system becameshallower at some time between∼1.6 and∼1.24Myr (Fig. 3).
Reconstruction of throw rates along the upper megasplay faultsince 1.55Myr cannot be constrained because no tie-points areavailable. But owing to the significant age reversal of more than1Myr over the fault drilled at Site C0004 (ref. 20) (Fig. 3), throwis expected to be large. Along the IODP drilling transect studied it
650 NATURE GEOSCIENCE | VOL 2 | SEPTEMBER 2009 | www.nature.com/naturegeoscience
© 2009 Macmillan Publishers Limited. All rights reserved.

NATURE GEOSCIENCE DOI: 10.1038/NGEO609 LETTERS
~ 2.2 Myr- Sedimentation in an emerging slope basin- In-sequence forward imbrication
1.8 Myr- Start of OOST at ~1.95 Myr- High initial activity phase and mass-wasting- 8.6 m kyr¬1 horizontal displacement- Reduced forward imbrication
1.55 Myr- Continuously decreasing displacement along the initial OOST between 1.8 and 1.55 Myr- In-sequence forward imbrication
Since 1.55 Myr
Masswasting
CCD
CCD
CCD
Platesubduction
Platesubduction
Masswasting
a
b
c
d
- Megasplay fault activation, uplift and formation of forearc-high- Alternating periods of high and low activity- Backwards branching likely since ~1.24 Myr
CCD
Figure 4 | Summary diagram showing the splay-fault origin and evolutionin the Nankai accretionary wedge. a–d, Left and right panels show overallsketches of accretionary prism scale and close-up views on the shallowmegasplay system, respectively, for different time steps. The sizes of thered and blue arrows indicate the relative activities of the splay fault andprism forward growth, respectively. The dashed horizontal line shows theapproximate depth of the carbonate compensation depth (CCD). Thesplay-fault system initiated∼1.95 Myr ago as an OOST in the lower part ofthe accretionary wedge. From∼1.55 Myr, this initial OOST has beenuplifted and became reactivated, favouring ongoing ‘megasplay’ slip alongit. Alternating periods of high and low splay-fault activity are linked in anout-of-phase mode to accretionary prism forward growth and in-sequencefrontal imbrications.
seems that displacement along this short segment of the megasplayfault ceased at ∼1.24Myr, suggesting that it only experienced arelatively short period of high activity between∼1.55 and 1.24Myr.This interpretation is supported by high sedimentation rates inthe slope basin and the occurrences of age reversals within thetime-correlative section at Site C0008 (ref. 21; Fig. 3) that reflecta highly dynamic sedimentation and mass-wasting regime duringthis period of high splay-fault activity. This was followed by a phaseduring which activity decreased or dislocated through backwardbranching in the shallow part of this fault segment, as demonstratedby Moore and colleagues5. However, seismic data clearly show thatthe megasplay truncates very young sediments near the seabedadjacent to the drilling transect, revealing that various smallsegments of the fault system are moving independently and that themegasplay system in general is thus still highly active5,19.
In summary, our results present a dynamic picture beginningwith the birth and the early evolution of the Nankai megasplayfault system, which records out-of-sequence thrusting in the lowerpart of the accretionary prism starting at ∼1.95Myr, followed byuplift and ongoing/reactivated activity as megasplay fault since∼1.55Myr. Our most significant conclusion is that splay-faultactivity varies through time, with alternating high-activity periodsduring which splay-fault thrusting accommodates a large part of the
plate convergence and phases, with a decrease of throw along theOOST butmore efficient transfer to the deformation front resultingin in-sequence frontal imbrication. This implies alternating overallaccretionary prism mechanical stability, the forcing factor(s) ofwhich remain to be discovered. Possible candidates are roughnesschanges on the incoming plate (for example, ridges or seamounts)or changes in trench sedimentation influencing pore-pressureevolution and mechanical stability of the sedimentary section onthe subducting oceanic plate. Both processes have been documentedand proposed to affect the evolution of the Nankai accretionaryprism and the seismogenic zone26–30. Future studies using newIODP samples and data fromdeep drill holes2 will yield themeans toexplore whether and how theymay control the observed alternatingsplay-fault activity, and its relation to the onset of forearc-basinsedimentation and changes in rate of prism forward growth.
Received 6 April 2009; accepted 22 July 2009; published online16 August 2009
References1. Fukao, Y. Tsunami earthquakes and subduction processes near deep-sea
trenches. J. Geophys. Res. 84, 2303–2314 (1979).2. Tobin, H. J. & Kinoshita, M. NanTroSEIZE: The IODP Nankai trough
seismogenic zone experiment. Sci. Drill. 2, 23–27 (2006).3. Plafker, G. Alaskan earthquake of 1964 and Chilean earthquake of 1960:
Implications for arc tectonics. J. Geophys. Res. 77, 901–925 (1972).4. Park, J.-O., Tsuru, T., Kodaira, S., Cummins, P. R. & Kaneda, Y. Splay fault
branching along the Nankai subduction zone. Science 297, 1157–1160 (2002).5. Moore, G. F. et al. Three-dimensional splay fault geometry and implications
for tsunami generation. Science 318, 1128–1131 (2007).6. Collot, J. Y., Agudelo, W., Ribodetti, A. & Marcailou, B. Origin of a crustal
splay fault and its relation to the seismogenic zone and underplating at theerosional north Ecuador—south Colombia oceanic margin. J. Geophys. Res.113, B12102 (2008).
7. Bangs, N. L. et al. Broad, weak regions of the Nankai Megathrust andimplications for shallow coseismic slip. Earth Planet. Sci. Lett. 284,44–49 (2009).
8. Kikuchi, M., Nakamura, M. & Yoshikawa, K. Source rupture processes of the1944 Tonankai earthquake and the 1945 Mikawa earthquake derived fromlow-gain seismograms. Earth Planets Space 55, 159–172 (2003).
9. Baba, T., Cummins, P. R., Hori, T. &Kaneda, Y. High precision slip distributionof the 1944 Tonankai earthquake inferred from tsunami waveforms: Possibleslip on a splay fault. Tectonophysics 426, 119–134 (2006).
10. Tanioka, Y. & Satake, K. Detailed coseismic slip distribution of the 1944Tonankai earthquake estimated from tsunami waveforms. Geophys. Res. Lett.28, 1075–1078 (2001).
11. Katsumi, K. Out-of-sequence thrust of an accretionary complex. Mem. Geol.Soc. Jpn 50, 131–146 (1998).
12. Kimura, G. et al. Transition of accretionary wedge structures around theup-dip limit of the seismogenic subduction zone. Earth Planet. Sci. Lett. 255,471–484 (2007).
13. Morley, C. K. Out-of-sequence thrusts. Tectonics 7, 539–561 (1988).14. Gutscher, M.-A., Kukowski, N., Malavieille, J. & Lallemand, S. Cyclical
behavior of thrust wedges: Insights from high basal friction sandboxexperiments. Geology 24, 135–138 (1996).
15. Wang, K. & Hu, Y. Accretionary prisms in subduction earthquake cycles: Thetheory of dynamic Coulomb wedge. J. Geophys. Res. 111, B06410 (2006).
16. Lay, T. et al. The great Sumatra–Andaman earthquake of 26 December 2004.Science 308, 1127–1133 (2005).
17. Ando, M. Source mechanisms and tectonic significance of historicalearthquakes along theNankai trough, Japan.Tectonophysics 27, 119–140 (1975).
18. Kame, N., Rice, J. R. & Dmowska, R. Effects of prestress state and rupturevelocity on dynamic fault branching. J. Geophys. Res. 108, B5-2265 (2003).
19. Moore, G. F. et al. in Structural and Seismic Stratigraphic Frameworkof the NanTroSEIZE Stage 1 Transect: Proc. IODP 314/315/316(eds Kinoshita, M. et al.) (Integrated Ocean Drilling Program ManagementInternational, 2009).
20. Kinoshita, M. et al. (eds) Expedition 316 Scientists. Expedition 316 Site C0004:Proc. IODP 314/315/316 (Integrated Ocean Drilling Program ManagementInternational, 2009).
21. Kinoshita, M. et al. (eds) Expedition 316 Scientists. Expedition 316 Site C0008:Proc. IODP 314/315/316 (Integrated Ocean Drilling Program ManagementInternational, 2009).
22. Van Andel, T. H. Mesozoic/Cenozoic calcite compensation depth and theglobal distribution of calcareous sediments. Earth Planet. Sci. Lett. 26,187–194 (1975).
NATURE GEOSCIENCE | VOL 2 | SEPTEMBER 2009 | www.nature.com/naturegeoscience 651© 2009 Macmillan Publishers Limited. All rights reserved.

LETTERS NATURE GEOSCIENCE DOI: 10.1038/NGEO609
23. Seno, T., Stein, S. & Gripp, A. E. A model for the motion of the Philippinesea plate consistent with Nuvel-1 and geological data. J. Geophys. Res. 98,17941–17948 (1993).
24. Miyazaki, S. I. & Heki, K. Crustal velocity field of southwest Japan: Subductionand arc–arc collision. J. Geophys. Res. 106, 4305–4326 (2001).
25. Kinoshita, M. et al. (eds) Expedition 315 Scientists. Expedition 315 Site C0002:Proc. IODP 314/315/316 (Integrated Ocean Drilling Program ManagementInternational, 2009).
26. Kodaira, S. et al. Cyclic ridge subduction at an inter-plate locked zone offcentral Japan. Geophys. Res. Lett. 30, 1339 (2003).
27. Park, J.-O., Moore, G. F., Tsuru, T., Kodaira, S. & Kaneda, Y. A subductedoceanic ridge influencing the Nankai megathrust earthquake rupture.Earth Planet. Sci. Lett. 217, 77–84 (2003).
28. Bangs, N. L. B., Gulick, S. P. S. & Shipley, T. H. Seamount subduction erosionin the Nankai Trough and its potential impact on the seismogenic zone.Geology 34, 701–704 (2006).
29. Screaton, E. J., Saffer, D., Henry, P. & Kunze, S. Porosity loss within theunderthrust sediment of the Nankai accretionary complex: Implications foroverpressures. Geology 30, 19–22 (2002).
30. Saffer, D. & Bekins, B. A. Hydrologic controls on the morphology andmechanics of accretionary wedges. Geology 30, 271–274 (2002).
AcknowledgementsThis research used samples and data provided by the Integrated Ocean Drilling Program(IODP). This work was supported by fellowship grants from the Swiss National ScienceFoundation (Grant No PBEZ2-118865) and the DFG-Research Centre/Cluster ofExcellence ‘The Ocean in the Earth System’ (to M.S.), the US National ScienceFoundation to the University of Hawaii (G.M.) and the Japanese Ministry of Education,Culture, Science, Sports, and Technology to JAMSTEC.
Author contributionsM.S., paper writing, lithostratigraphy, data integration, conceptual model; G.M., paperwriting, seismic stratigraphy, conceptual model, project planning; G.K., E.J.S., projectplanning, data integration, J.-O.P., seismic data processing, conceptual model; A.J.K.,S.L., conceptual model; Y.K., X.Z., magnetostratigraphy, X.S., biostratigraphy, M.B.U.,lithostratigraphy, mineralogy, data integration.
Additional informationSupplementary information accompanies this paper on www.nature.com/naturegeoscience.Reprints and permissions information is available online at http://npg.nature.com/reprintsandpermissions. Correspondence and requests for materials should beaddressed to M.S.
652 NATURE GEOSCIENCE | VOL 2 | SEPTEMBER 2009 | www.nature.com/naturegeoscience
© 2009 Macmillan Publishers Limited. All rights reserved.

SUPPLEMENTARY INFORMATIONdoi: 10.1038/ngeo609
nature geoscience | www.nature.com/naturegeoscience 1
500 mNo VE
Dep
th (K
m)
2.5
3.0
3.5
IL 2675
NW SEXL5400 5350 5300 5250 5200
C0004C0008A
C0008C
1.95 1.8 1.551.7
>1300m in 150 ka
8.6m/ka 2.5 m/ka 1.93 m/ka
250 m in 100 ka
290 m in 150 ka
Age tie-points forback-stripping [Ma]
Horizontal throw between tie points
Horizontal throw-rate
1.95 Ma1.8 Ma1.7 Ma
1.24 Ma1.55 Ma
Suplementary Figure S1: Back-stripping of seismic data and reconstruction of splay-fault development
The figures shows Interpretation of seismic inline 2675 crossing Sites C0004, C0008A and C0008C, and age constraints of key horizons from borehole data21, that was used as basis for back-stripping displacement along the splay fault. VE = vertical exaggeration. Location is shown in Fig. 1B. Table below shows reconstructed throw estimates as inferred from the back-stripping. Note that the horizontal throw rate reconstructed for the time period between 1.95 and 1.8 Ma may only represent an approximate value, because extrapolation of isochron 1.95 Ma down to depth of >3.5km may not be unique (dashed red line) and part of the horizontal throw may have been accommodated by secondary faults shown by the thin blue lines.