Orientation of the Myosin Light Chain Region by Single Molecule Total Internal Reflection...
11
Orientation of the Myosin Light Chain Region by Single Molecule Total Internal Reflection Fluorescence Polarization Microscopy Margot E. Quinlan, Joseph N. Forkey, and Yale E. Goldman Pennsylvania Muscle Institute, University of Pennsylvania, Philadelphia, Pennsylvania 19104-6083 ABSTRACT To study the orientation and dynamics of myosin, we measured fluorescence polarization of single molecules and ensembles of myosin decorating actin filaments. Engineered chicken gizzard regulatory light chain (RLC), labeled with bisiodoacetamidorhodamine at cysteine residues 100 and 108 or 104 and 115, was exchanged for endogenous RLC in rabbit skeletal muscle HMM or S1. AEDANS-labeled actin, fully decorated with labeled myosin fragment or a ratio of ;1:1000 labeled:unlabeled myosin fragment, was adhered to a quartz slide. Eight polarized fluorescence intensities were combined with the actin orientation from the AEDANS fluorescence to determine the axial angle (relative to actin), the azimuthal angle (around actin), and RLC mobility on the 10 ms timescale. Order parameters of the orientation distributions from heavily labeled filaments agree well with comparable measurements in muscle fibers, verifying the technique. Experiments with HMM provide sufficient angular resolution to detect two orientations corresponding to the two heads in rigor. Experiments with S1 show a single orientation intermediate to the two seen for HMM. The angles measured for HMM are consistent with heads bound on adjacent actin monomers of a filament, under strain, similar to predictions based on ensemble measurements made on muscle fibers with electron microscopy and spectroscopic experiments. INTRODUCTION Repeated cycles of myosin attachment to actin, tilting and detachment, fueled by hydrolysis of ATP, are thought to translocate interdigitating filaments in muscle (1,2) or var- ious cellular cargoes in nonmuscle cells (3). The ‘‘lever arm hypothesis’’ suggests that the motor domain (MD) of the myosin head binds rigidly to actin, whereas the light chain domain (LCD) produces the motion by rotating about a ful- crum within the MD. Evidence from x-ray crystallography, spectroscopic experiments, electron microscopy, low-angle x-ray diffraction from muscle fibers, and mechanics in vitro have provided strong evidence that the LCD serves as a lever arm, amplifying subnanometer sized motions in the MD associated with ATP hydrolysis and product release into nanometer-scale motions at the head-tail junction (4–6). Some motions or tilting within the MD may also contribute to force production and filament sliding (7,8). With the processive myosin isoform V, tilting motions of the LCD large enough to explain the step length have been detected in single molecules (9). In muscle fibers, tilting motions of the RLC have mostly been observed during filament sliding after length changes (10–13), leading some to question whether tilting is the result of sliding rather than causing it (14). The orientation distribution of the LCD in an isometrically contracting muscle fiber is very broad due to thermal rotational motions on the nanosecond to microsec- ond timescales and due to cycling through all of the states of the enzymatic cycle (13,15,16). In addition to these dynamic processes, static disorder, due to the mismatched periodici- ties of the actin and myosin filaments (17) and/or strain in the LCD (18,19), is expected to broaden the angular distribution among the attached myosin heads. The orientational disorder in rigor (in the absence of ATP) is less than that during active contraction, but the contributions of static and dynamic disorder have not been accurately determined. Spectroscopic evidence suggests broader distributions of the LCD (20,21) than the MD (22,23). To address these issues directly, we applied the total internal reflection fluorescence polarization technique de- scribed in the accompanying article (24) to simultaneously detect orientations and dynamics of single myosin molecules in rigor actomyosin complexes. Orientation of the LCD was determined using actin filaments decorated with labeled subfragment-1 (S1) and heavy meromyosin (HMM). Low and high ratios of labeled to unlabeled myosin subunits enabled measurements from individual molecules and populations, respectively. Data from highly labeled filaments facilitated comparison with measurements on muscle fibers. In data from individual molecules, the average orientation and the extent of motions on the microsecond timescale were determined simultaneously (24). The data suggest that in rigor, the heads of HMM bind at two orientations that differ in both tilt and twist. Microsecond dynamic disorder ac- counts for ;35° of orientational dispersion. The two average orientations are consistent with the two heads bound to adjacent actin monomers and strained toward each other. S1 Submitted September 23, 2004, and accepted for publication April 27, 2005. Address reprint requests to Yale E. Goldman, D-700 Richards Bldg., School of Medicine, University of Pennsylvania, Philadelphia, PA 19104- 6083. Tel.: 215-898-4017; Fax: 215-898-2653; E-mail: goldmany@ mail.med.upenn.edu. Joseph N. Forkey’s present address is Precision Optics Corp., Gardner, MA 01440. Margot E. Quinlan’s present address is Dept. of Cellular and Molecular Pharmacology, University of California, San Francisco, CA 94143-2200. Ó 2005 by the Biophysical Society 0006-3495/05/08/1132/11 $2.00 doi: 10.1529/biophysj.104.053496 1132 Biophysical Journal Volume 89 August 2005 1132–1142
Transcript of Orientation of the Myosin Light Chain Region by Single Molecule Total Internal Reflection...
Orientation of the Myosin Light Chain Region by Single Molecule TotalInternal Reflection Fluorescence Polarization Microscopy
Margot E. Quinlan, Joseph N. Forkey, and Yale E. GoldmanPennsylvania Muscle Institute, University of Pennsylvania, Philadelphia, Pennsylvania 19104-6083
ABSTRACT To study the orientation and dynamics of myosin, we measured fluorescence polarization of single moleculesand ensembles of myosin decorating actin filaments. Engineered chicken gizzard regulatory light chain (RLC), labeled withbisiodoacetamidorhodamine at cysteine residues 100 and 108 or 104 and 115, was exchanged for endogenous RLC in rabbitskeletal muscle HMM or S1. AEDANS-labeled actin, fully decorated with labeled myosin fragment or a ratio of ;1:1000labeled:unlabeled myosin fragment, was adhered to a quartz slide. Eight polarized fluorescence intensities were combined withthe actin orientation from the AEDANS fluorescence to determine the axial angle (relative to actin), the azimuthal angle (aroundactin), and RLC mobility on the �10 ms timescale. Order parameters of the orientation distributions from heavily labeledfilaments agree well with comparable measurements in muscle fibers, verifying the technique. Experiments with HMM providesufficient angular resolution to detect two orientations corresponding to the two heads in rigor. Experiments with S1 showa single orientation intermediate to the two seen for HMM. The angles measured for HMM are consistent with heads bound onadjacent actin monomers of a filament, under strain, similar to predictions based on ensemble measurements made on musclefibers with electron microscopy and spectroscopic experiments.
INTRODUCTION
Repeated cycles of myosin attachment to actin, tilting and
detachment, fueled by hydrolysis of ATP, are thought to
translocate interdigitating filaments in muscle (1,2) or var-
ious cellular cargoes in nonmuscle cells (3). The ‘‘lever arm
hypothesis’’ suggests that the motor domain (MD) of the
myosin head binds rigidly to actin, whereas the light chain
domain (LCD) produces the motion by rotating about a ful-
crum within the MD. Evidence from x-ray crystallography,
spectroscopic experiments, electron microscopy, low-angle
x-ray diffraction from muscle fibers, and mechanics in vitro
have provided strong evidence that the LCD serves as a lever
arm, amplifying subnanometer sized motions in the MD
associated with ATP hydrolysis and product release into
nanometer-scale motions at the head-tail junction (4–6).
Some motions or tilting within the MD may also contribute
to force production and filament sliding (7,8).
With the processive myosin isoform V, tilting motions of
the LCD large enough to explain the step length have been
detected in single molecules (9). In muscle fibers, tilting
motions of the RLC have mostly been observed during
filament sliding after length changes (10–13), leading some
to question whether tilting is the result of sliding rather than
causing it (14). The orientation distribution of the LCD in an
isometrically contracting muscle fiber is very broad due to
thermal rotational motions on the nanosecond to microsec-
ond timescales and due to cycling through all of the states of
the enzymatic cycle (13,15,16). In addition to these dynamic
processes, static disorder, due to the mismatched periodici-
ties of the actin and myosin filaments (17) and/or strain in the
LCD (18,19), is expected to broaden the angular distribution
among the attached myosin heads. The orientational disorder
in rigor (in the absence of ATP) is less than that during active
contraction, but the contributions of static and dynamic
disorder have not been accurately determined. Spectroscopic
evidence suggests broader distributions of the LCD (20,21)
than the MD (22,23).
To address these issues directly, we applied the total
internal reflection fluorescence polarization technique de-
scribed in the accompanying article (24) to simultaneously
detect orientations and dynamics of single myosin molecules
in rigor actomyosin complexes. Orientation of the LCD was
determined using actin filaments decorated with labeled
subfragment-1 (S1) and heavy meromyosin (HMM). Low
and high ratios of labeled to unlabeled myosin subunits
enabled measurements from individual molecules and
populations, respectively. Data from highly labeled filaments
facilitated comparison with measurements on muscle fibers.
In data from individual molecules, the average orientation
and the extent of motions on the microsecond timescale were
determined simultaneously (24). The data suggest that in
rigor, the heads of HMM bind at two orientations that differ
in both tilt and twist. Microsecond dynamic disorder ac-
counts for;35� of orientational dispersion. The two averageorientations are consistent with the two heads bound to
adjacent actin monomers and strained toward each other. S1
Submitted September 23, 2004, and accepted for publication April 27, 2005.
Address reprint requests to Yale E. Goldman, D-700 Richards Bldg.,
School of Medicine, University of Pennsylvania, Philadelphia, PA 19104-
6083. Tel.: 215-898-4017; Fax: 215-898-2653; E-mail: goldmany@
mail.med.upenn.edu.
Joseph N. Forkey’s present address is Precision Optics Corp., Gardner, MA
01440.
Margot E. Quinlan’s present address is Dept. of Cellular and Molecular
Pharmacology, University of California, San Francisco, CA 94143-2200.
� 2005 by the Biophysical Society
0006-3495/05/08/1132/11 $2.00 doi: 10.1529/biophysj.104.053496
1132 Biophysical Journal Volume 89 August 2005 1132–1142

binds at an intermediate orientation. Some of these results
have been presented in preliminary form (25,26).
MATERIALS AND METHODS
Protein purification and labeling
Fast skeletal muscle myosin II and actin were isolated, purified, and stored as
described in Forkey et al. (24). HMMwas made according to Kron et al. (27)
and was stored on ice for up to 1 week. S1 was made by papain digestion in
the presence of MgCl2 to retain the regulatory light chain (RLC) ((28) as
modified by Okamoto and Sekine (29)). It was either stored on ice for up to 1
week or rapidly frozen and stored at �80�C for up to 2 months. Actin was
labeled at Cys374 with N-(iodoacetyl)-N9-(5-sulfo-1-napthyl)ethylenedi-amine (1,5-I-AEDANS, Sigma (St. Louis, MO) No. I8879 (24)).
Chicken gizzard RLC mutants, labeled with bisiodoacetamidorhod-
amine (BR) at pairs of engineered cysteine residues (100 and 108 or 104
and 115; (13)), were a gift from Dr. John E. T. Corrie, MRC Mill Hill,
London. The labeled RLC mutants are termed 100-BR-108 and 104-BR-
115. They were exchanged for the endogenous RLC subunits in purified
myosin proteolytic fragments, HMM or S1. The myosin fragment was
combined with labeled RLC at threefold molar excess (RLC/myosin head)
in exchange buffer (12 mM EDTA, 120 mM KCl, 10 mM HEPES, pH
7.0, 2 mM DTT). After a 30 min incubation at 30�C, 12 mM MgC12 was
added, and the solution was cooled on ice for 15 min. Myosin was
separated from free RLC by centrifugation with actin in the absence of
ATP, resuspension of the pellet, and a second centrifugation in the
presence of ATP. A typical exchange (starting with 2 mM myosin) yielded
0.5 mM protein (;100% active) with ;50% of the heads labeled, as
estimated by absorbance of rhodamine (e549 ¼ 89,000 M�1cm�1; (30))
and protein concentration determined by Bradford assay. For HMM,
molecules with one and two labeled heads were both present. Exchanged
protein was stored on ice for up to 1 week. No significant differences in
sliding velocity were detected between labeled and unlabeled myosin or
labeled and unlabeled actin with in vitro gliding assays (31,32), using
actin stabilized with Bodipy 650/665-conjugated phalloidin for visualiza-
tion (Molecular Probes (Eugene, OR), B-12382).
Experimental apparatus
The experimental apparatus, signal acquisition, and analysis are described
in the accompanying article (24). The rhodamine-labeled myosin was
excited with a frequency-doubled Nd:YAG laser (532 nm), cycling
between four combinations of excitation paths and polarizations every
40 ms (Figs. 1 and S1 of Forkey et al. (24)). Fluorescence emission was
directed either onto an intensified charge-coupled device camera or through
a polarizing beamsplitter onto two photon-counting avalanche photodiodes
(APDs). The resulting photon counts corresponded to eight raw intensity
time courses (see Fig. 2 and Forkey et al. (24)). Two additional laser beams
approached the sample at glancing angles to generate evanescent waves.
An ultraviolet (355 nm) laser was used to excite AEDANS-actin for colo-
calization of F-actin with labeled myosin (Fig. 1). A HeNe (633 nm) laser
was used to excite Bodipy 650/665-phalloidin in control sliding velocity
experiments.
Slide preparation
The surfaces of a ;10 ml flow chamber (24) were coated with 1 mg/ml
poly-L-lysine (Sigma, P-0879) for 1 min, rinsed with water, and then track
buffer (TB: 25 mM KCl, 20 mM HEPES, pH 7.4, 4 mM MgCl2, 100 mM
DTT) was added. Equimolar concentrations of actin and myosin heads
(10 nM actin and 5 nM HMM or 10 nM S1 in TB) were mixed with actin
in suspension, and the decorated actin was applied to flow chambers to
produce ‘‘tracks’’ of actomyosin (33). An excess of unlabeled HMM or S1
(;200 nM) was added to the actomyosin suspension ,1 min before
adding two volumes of the mixture to the flow chamber. The excess
unlabeled myosin fragment helped to align the actin filament axis with the
flow direction (Fig. 1). The actomyosin complexes were allowed to bind to
the surfaces for 2 min and then the chamber was washed with TB or TB
plus 0.5 mg/ml bovine serum albumin to block the surfaces, and then TB
plus 5 U/ml apyrase (grade VII, Sigma A6535). For ensemble experi-
ments, ;50% of the myosin heads were labeled, whereas for single
molecule experiments a ;1:1000 ratio of labeled/unlabeled myosin heads
was used. Actomyosin tracks were attached to the surface via the myosin
fragments as demonstrated by movement of the actin filaments upon
addition of ATP.
Experimental protocol for singlemolecule observations
Actomyosin tracks were added to a flow chamber at typical concentrations
of 5 nM actin monomers, 5 nM unlabeled myosin, and 5 pM labeled heads
for single molecule observations. A single image of AEDANS-actin
fluorescence was acquired with 83 ms integration time. The same field was
FIGURE 1 Colocalization of actin filaments with
sparsely labeled myosin. Actin filaments labeled with
AEDANS (blue) at Cys374 are decorated with HMM or S1.
Labeled and unlabeled myosin fragments are mixed
;1:1000 so individual rhodamine (red) molecules can be
distinguished along the length of the actin filaments. When
the decorated filaments are added in the presence of excess
free HMM or S1, respectively, to a poly-L-lysine coated
flow chamber, the filaments are aligned well, as pictured
here, due to a balance between flow forces and attachment
frequency.
Orientation of Single Myosin RLCs 1133
Biophysical Journal 89(2) 1132–1142
then illuminated with the time-multiplexed 532 nm laser beams and an
image of the rhodamine-labeled myosin was recorded with 149 ms
integration time. On an overlay of the two images, a spot was selected
containing a rhodamine fluorophore based on its intensity and its co-
localization with a well-aligned actin filament. The piezo-electric stage
was then moved, under computer control, to shift this spot in the x-y plane
into a point conjugate with the APDs. The eight intensity traces described
above were collected for 10 s (250 cycles, 40 ms each). If all of the
polarized traces from a molecule bleached simultaneously to background
levels in a stepwise manner, indicating bleaching of a single molecule, it
was analyzed further. For traces showing two stepwise bleaches, only the
interval immediately before the last bleaching step was analyzed. The
polarized intensity levels after photobleaching were taken as the eight
background intensities for each molecule.
Spots giving ITot ¼ 200 � 850 counts per 40 ms recording cycle and
a single step bleach were retained for further analysis. Optical correction
factors X1, X2, X12, and Cd, defined in Forkey et al. ((24), Materials and
Methods and Supplemental Information, Eq. B.1), were measured after each
data set was recorded to calculate corrected intensities.
Values for b and a, corresponding to the axial and azimuthal angles of
the probe dipoles, respectively, relative to the F-actin axis (see Fig. 2 b of
Forkey et al. (24)), were determined from u and f and the actin orientation
using an Euler rotation matrix (34). Gaussian curves were fitted to the
distributions of b by minimizing the negative log of the likelihood that the
data are described by a single Gaussian component (�ln(LC1) or the sum of
two Gaussians (�ln(LC2); (35)):
�lnðLC1Þ ¼ �N lnðNÞ1 +i
�ðbi � mÞ2
2s2
� �
1N ln
Z p2
0
exp �ðx � mÞ2
2s2
� �dx
� �
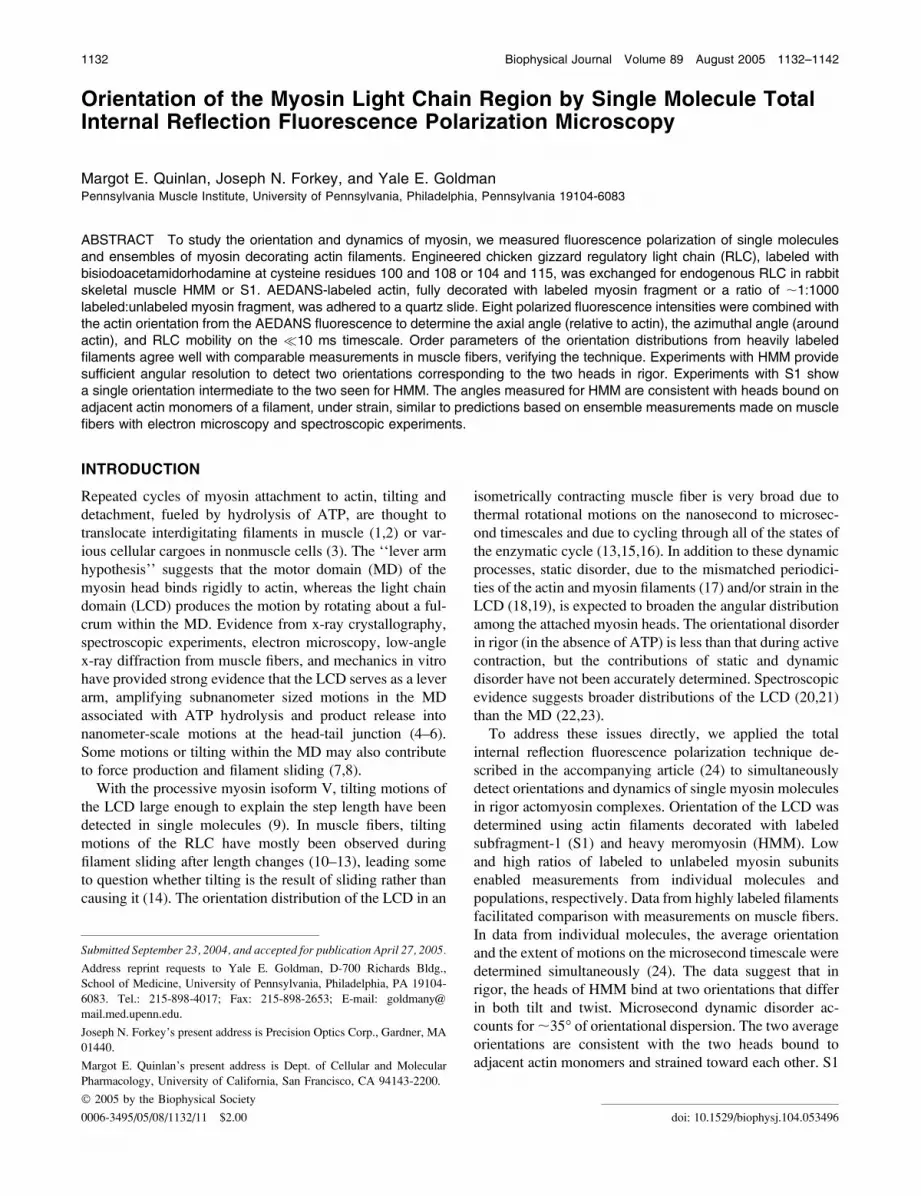
FIGURE 2 Typical single molecule polar-
ized fluorescence data. Measurements were
made from a single HMM(104-BR-115)
molecule bound to an actin filament in the
presence of apyrase as described in Materials
and Methods. Alternation of excitation path-
ways (1 and 2) and excitation polarization
(s and p) with simultaneous collection with
two detector polarizations (x and y) produceseight measurements every 40 ms. The
numbers of photons detected by the APDs
in each 10 ms interval are plotted as eight
polarized fluorescence intensities. The
weighted sum (ITot (24)) of these intensities
is plotted in black. The eight intensities are
then fit to determine the orientation, b (red),
a (green), slow wobble, d (blue), and IFit(blue), a value proportional to the total
intensity (minus background). The average
angles for the molecule shown here are b ¼82�, a ¼ 35�, and d ¼ 20�. The average xr2 ¼2.2. The intensity levels and angles are
constant as expected for actomyosin in the
absence of ATP. A high b value is common
for the highly polarized probe (104-BR-115).
1134 Quinlan et al.
Biophysical Journal 89(2) 1132–1142
where the five free parameters are q, the proportion of area under component
1, m1, and s1, the mean and standard deviation of component 1 and m2 and
s2, the mean and standard deviation of component 2. To evaluate the
goodness of each fit, the binned distributions were compared to the predicted
values (Fig. 5) by calculating the reduced x2,
x2
r ¼+i
ðyi � fiÞ2
fiN �M
;
where yi is the measured value of each bin and fi is the predicted value for
i ¼ 1..N bins and N � M is the degrees of freedom with M equal to the
number of free parameters. To determine whether the data for S1 and HMM
statistically justified fitting with two Gaussian peaks rather than one, the
parameter 2Dln(L) ¼ 2(ln(LC1) � ln(LC2)) was calculated. This metric is
distributed as x2 (36) with three degrees of freedom (the difference of fitting
one curve with two free parameters, m and s, and two curves with five
free parameters, m1, s1, m2, s2, and q, the fraction of component 1). This
procedure was carried out with Gaussian components either weighted by sin
b or not. The peak angles were not affected by this weighting, although the
partition between the two components was shifted slightly. The curves
without sin b weighting fit the distributions slightly better, so those results
are reported.
To compare single molecule and multiple molecule experiments, order
parameters were calculated directly from the distributions of single
molecules (see Supplementary Information). Alternatively, the sum of
intensities from many single molecules on sparsely decorated filaments was
assumed to be equal to that of highly decorated filaments. Under that
assumption, intensities from all of the single molecule experiments were
added and the resulting values analyzed as if they had been measured from
one filament.
Experimental protocol for multiplemolecule observations
In experiments on actomyosin tracks with higher labeling density, the same
procedure was followed to make up the sample except that myosin
fragments with ;50% of the RLC labeled were used directly instead of
diluting them into unlabeled myosin fragments as above. The excita-
tion intensity was reduced to ;3 mW such that photobleaching was
negligible for a 2 s illumination. Each of the eight polarized intensities was
averaged over the entire recording period. Intensities from a clear region
between filaments were subtracted from averaged filament intensities to
correct for background light. The analysis is described in Supplementary
Information.
RESULTS AND DISCUSSION
The term ‘‘myosin fragment’’ will be used throughout the
article for HMM or S1. In all cases, experiments were per-
formed on AEDANS-labeled actin filaments decorated at
approximately equimolar ratios of S1 or HMM heads to actin
monomers. The degree of labeling refers to the fraction of the
myosin fragments containing labeled RLC.
Multiple molecule experiments
Fluorescence polarization was measured from actin filaments
decorated with myosin fragments containing ;50% labeled
RLC per myosin head. The filaments selected were aligned
either along the x- or y-axis as described in Materials and
Methods. Experiments on these samples, similar to those
described for labeled actin in the accompanying article (24),
showed that the microscope and analytical procedures result
in reliable angular measurements. These tests are reported in
Supplementary Information. Polarization ratios, as defined in
Forkey et al. (24), averaging as high as 0.4 and 0.6 were
measured with 100-BR-108 and 104-BR-115, respectively,
with both HMM and S1 samples (Fig. S1), indicating that the
fluorophores were well ordered in these samples. The single
molecule data were compared to the data from more heavily
labeled filaments by adding together the intensities of many
single molecules, which label actin filaments oriented in the
same direction. The polarization ratio values from the
‘‘summed singles’’ (yellow dots in Fig. S1) closely track
those from heavily labeled filaments, providing a strong
indication that the single molecule data represent the same
orientation distributions. Further comparisons of single
molecules and muscle fibers are discussed in Supplementary
Information (Table S1 and Fig. S3).
Single molecule experiments
Actin filaments were fully decorated with either HMM or S1
as above, but the labeled myosin fragments were diluted
;1:1000 with the corresponding unlabeled fragment, allow-
ing single rhodamine-labeled heads to be resolved (Fig. 1
and (24)).
A typical measurement from a single HMM(104-BR-115)
molecule bound to an actin filament in the presence of
apyrase is shown in Fig. 2. Data from HMM(100-BR-108)
and both S1 samples are similar. When the fluorescence
emission from a single rhodamine-labeled myosin head was
projected onto the detectors, the eight polarized intensities
were usually constant for 0.5–5 s and then all bleached to the
background intensity level at one time (at 3 s in Fig. 2). The
relative magnitudes of the eight polarized fluorescence
intensities from each individual molecule were variable as
expected for molecules oriented in different directions. A
weighted, relatively orientation-independent, sum of these
intensities (see Forkey et al. (24); Fig. 2, ITot) and the fitted
value reflecting the total intensity less background, IFit, were
�lnðLC2Þ ¼ �N lnðNÞ1 +i
ln q exp �ðbi � m1Þ2
2s2
1
� �1 ð1� qÞexp �ðbi � m2Þ
2
2s2
2
� �� �
1N ln q
Z p2
0
exp �ðx � m1Þ2
2s2
1
� �dx1 ð1� qÞ
Z p2
0
exp �ðx � m2Þ2
2s2
2
� �dx
� �;
Orientation of Single Myosin RLCs 1135
Biophysical Journal 89(2) 1132–1142
also constant until the fluorophore bleached. Histograms of
the average IFit values from individual molecules have one
narrow peak (data not shown). The homogeneous intensity
distribution and the single-step bleaching indicate that the
data from the traces are from single fluorophores. Occasion-
ally (17% of recordings), the total intensity trace decreased to
background in two discrete steps, presumably indicating that
two rhodamine molecules were located very close to each
other. Only the portion of the recording preceding the last
bleaching step was considered.
Analytical expressions for the probe angles (b and a) and
mobility on the 4 ns� t � 10 ms timescale (d), fitted to the
traces (see Materials and Methods and (24)), showed that the
orientation and extent of motion are unvarying (Fig. 2,
lowest two panels). The fitted total intensity, IFit (blue trace
in the fifth panel), matches the ITot minus background, and
the average xr2 for this trace was 2.2, a typical value,
indicating that the fitting procedure predicts the experimental
recordings well.
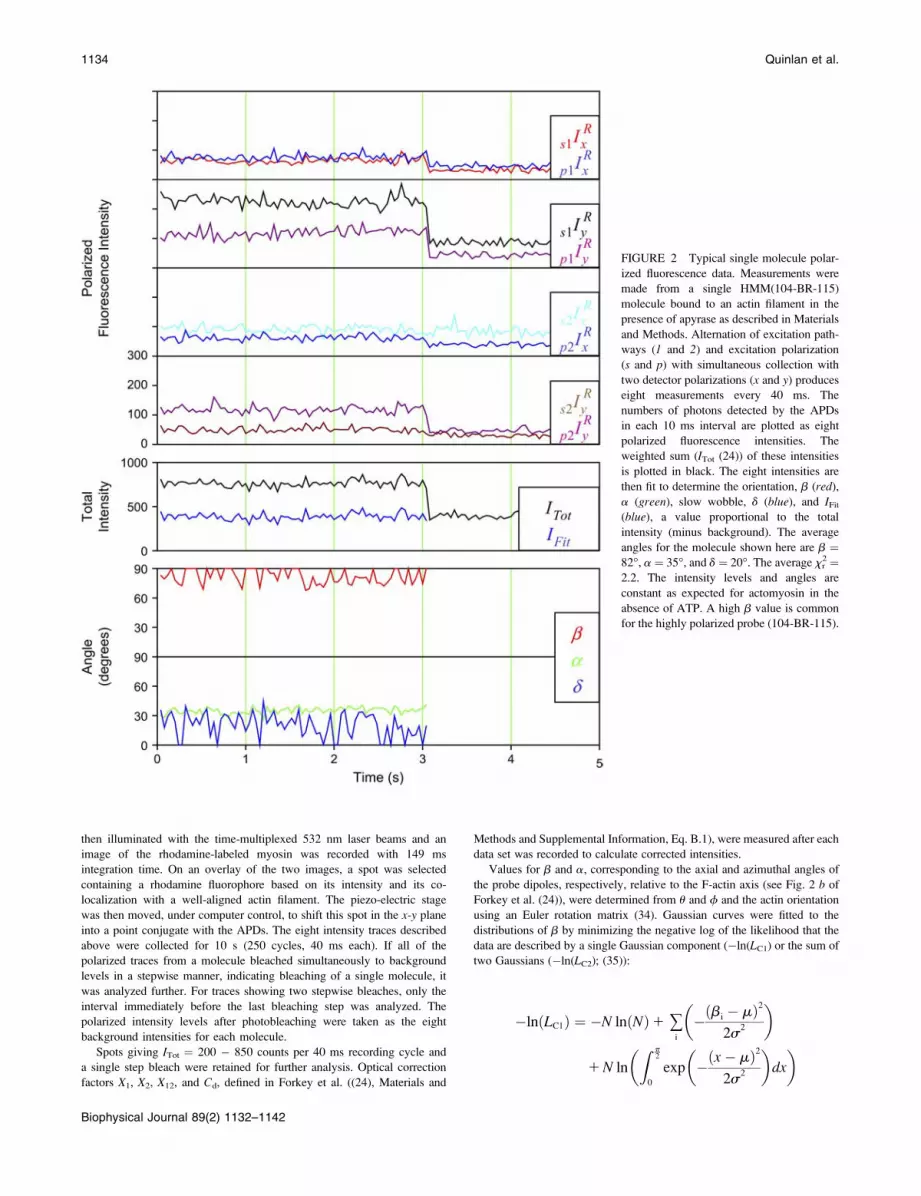
Transitions
In 44% of the traces recorded from single rhodamine mol-
ecules bound to RLC, the polarized fluorescence intensities
showed abrupt changes before bleaching. These transitions
often occurred in several of the polarized fluorescence traces
in opposite directions, so that the total intensity was constant
(Fig. 3). This behavior is characteristic of an angular change
of the fluorophore and is incompatible with a change in
the fluorophore brightness, a translation or laser intensity
FIGURE 3 Large transitions apparent in
the polarized fluorescence intensities of a
rigor HMM(100-BR-108) molecule. Inter-
vals discussed in the text are indicated by
arrows at the top of the plots. The total in-
tensity (ITot) remains constant, indicating that
the transitions are not a result of photobleach-
ing or an additional fluorophore passing
through the detection region. The intensity
transitions indicate an apparent orientation
change (Db ¼ 24�) and a decrease in slow
wobble (Dd ¼ 18�) but no change in IFit.
1136 Quinlan et al.
Biophysical Journal 89(2) 1132–1142
fluctuation. In Fig. 3, the apparent orientation of the
fluorophore shows an abrupt change indicative of a rotation
of 24� inb and 18� in d. The fitted total intensity, IFit, matched
the measured sum of intensities, ITot less background, and theaverage xr
2 value of the fitted angles was 2.2, indicating that
the data are well described by an apparent rotation of the
fluorophore. One or more such transitions were observed in
31%–54% of recordings from the four combinations of the
two fragments labeled with HMM(100-BR-108) and
HMM(104-BR-115). This high frequency of sudden rota-
tional motions was unexpected in experiments in the absence
of ATP and possibly indicates detachment of some of the
myosin heads from actin, spontaneous rotations while main-
taining attachment, or artifactual photochemical events.
Grouping the data according to whether a transition was
observed or not showed no significant differences in average
orientation. Thus, it is unlikely that the molecules undergoing
apparent rotations represent a distinct orientation distribution.
Intervals with steady polarized fluorescence intensities
ended either with a transition of the polarized intensities
(as in Fig. 3, interval A) or when the fluorophore bleached
(end of interval B). Assuming both of these processes to be
Markovian, the total exit rate from an interval of steady
polarized intensities (kdwell, the reciprocal of the dwell time)
is the sum of the bleaching and transition rates. Durations of
steady intensity intervals and overall recording time before
bleach were measured for a series of recordings. The dwell
times for steady intensities and the fluorescence durations
were both distributed approximately exponentially, giving
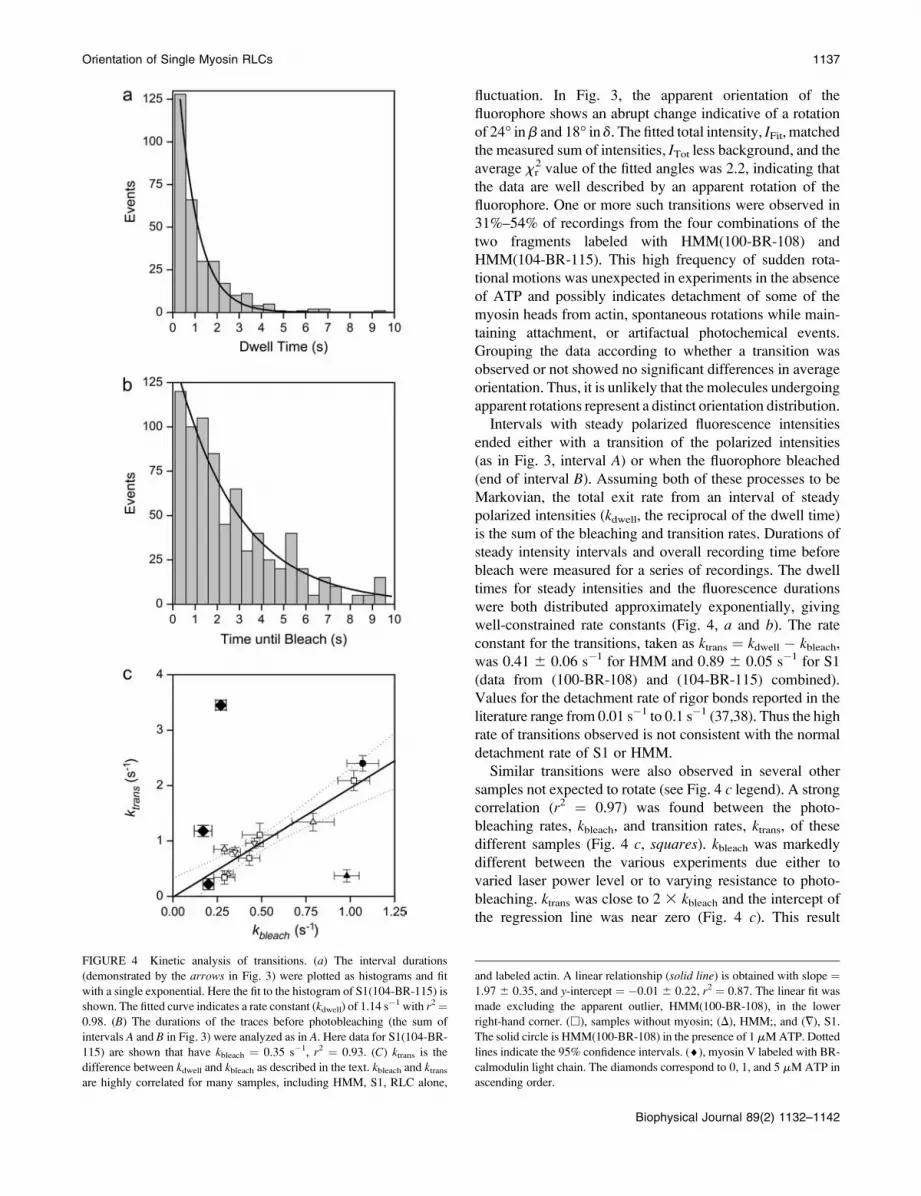
well-constrained rate constants (Fig. 4, a and b). The rate
constant for the transitions, taken as ktrans ¼ kdwell � kbleach,was 0.41 6 0.06 s�1 for HMM and 0.89 6 0.05 s�1 for S1
(data from (100-BR-108) and (104-BR-115) combined).
Values for the detachment rate of rigor bonds reported in the
literature range from 0.01 s�1 to 0.1 s�1 (37,38). Thus the high
rate of transitions observed is not consistent with the normal
detachment rate of S1 or HMM.
Similar transitions were also observed in several other
samples not expected to rotate (see Fig. 4 c legend). A strong
correlation (r2 ¼ 0.97) was found between the photo-
bleaching rates, kbleach, and transition rates, ktrans, of thesedifferent samples (Fig. 4 c, squares). kbleach was markedly
different between the various experiments due either to
varied laser power level or to varying resistance to photo-
bleaching. ktrans was close to 2 3 kbleach and the intercept of
the regression line was near zero (Fig. 4 c). This result
FIGURE 4 Kinetic analysis of transitions. (a) The interval durations
(demonstrated by the arrows in Fig. 3) were plotted as histograms and fit
with a single exponential. Here the fit to the histogram of S1(104-BR-115) is
shown. The fitted curve indicates a rate constant (kdwell) of 1.14 s�1 with r2¼
0.98. (B) The durations of the traces before photobleaching (the sum of
intervals A and B in Fig. 3) were analyzed as in A. Here data for S1(104-BR-
115) are shown that have kbleach ¼ 0.35 s�1, r2 ¼ 0.93. (C) ktrans is the
difference between kdwell and kbleach as described in the text. kbleach and ktransare highly correlated for many samples, including HMM, S1, RLC alone,
and labeled actin. A linear relationship (solid line) is obtained with slope ¼1.97 6 0.35, and y-intercept ¼ �0.01 6 0.22, r2 ¼ 0.87. The linear fit was
made excluding the apparent outlier, HMM(100-BR-108), in the lower
right-hand corner. (h), samples without myosin; (D), HMM;, and (=), S1.
The solid circle is HMM(100-BR-108) in the presence of 1 mMATP. Dotted
lines indicate the 95% confidence intervals. (¤), myosin V labeled with BR-
calmodulin light chain. The diamonds correspond to 0, 1, and 5 mM ATP in
ascending order.
Orientation of Single Myosin RLCs 1137
Biophysical Journal 89(2) 1132–1142

strongly suggests that the sudden transitions represent a
photochemical artifact.
When kbleach was purposefully varied by illuminating
HMM(100-BR-108) with different laser power levels (Fig. 4
c, open triangles), the data were again highly correlated withapproximately the same relationship as the other samples.
One set of HMM(100-BR-108) (solid triangle in Fig. 4 c) isvery different, having an unexpectedly low rate of angular
transitions. When this outlier is excluded, the slope and
intercept are 1.97 6 0.35 and �0.01 6 0.22, respectively
(mean 6 SE, r2 ¼ 0.87). When this point is included in the
regression, the slope is 1.03 6 0.56 and the y-intercept is0.34 6 0.34 (r2 ¼ 0.30). The similar relationship between
bleaching rate and transition rate for these different protein
samples indicates that the predominant mechanism for the
apparent rotation is an artifactual photochemical phenome-
non in which the transitions are proportional to the number of
excitation-emission cycles.
In another study, data from myosin V labeled with BR on
a calmodulin light chain (9) were acquired at several ATP
concentrations (Fig. 4 c, black diamonds). In the absence of
ATP, ktrans versus kbleach fell on the same regression line
shown in Fig. 4 c. In the presence of 1 and 5 mM ATP,
however, ktrans increased with increasing [ATP], whereas
kbleach remained unchanged. Under these conditions, the
rotations far outnumbered the photochemical transitions
making dynamic orientation measurements reliable (9).
The single molecule data plotted in Fig. S1 (yellow dots)and all of the data presented below are taken from the initial
portion of each single molecule recording before the first
photochemically induced transition has occurred (e.g., in-
terval A in Fig. 3). By accepting only the initial portion of
each recording, the major effects of this artifact are removed
from the orientation data in the absence of ATP. However,
the photochemical phenomena present under these condi-
tions prevented us from studying active rotational motions of
myosin II in the presence of ATP.
Two additional apparent photochemical effects were
detected in the single molecule data. In ;5% of the single
molecule traces, the total fluorescence intensity suddenly
increased for 40–120 ms just before the bleach.Wazawa et al.
(39) detected similar intensity spikes in single molecule
fluorescence recordings from tetramethylrhodamine probes
bound to Cys707 of S1, and they found a simultaneous blue
shift in the fluorophore emission spectrum. Presumably
some processes that lead to photobleaching briefly alter the
spectral properties and orientations.
When measurements were made in the presence of
antifade enzymes (glucose oxidase and catalase as per
Harada et al. (40)) and high concentrations of DTT (.50
mM), apparent transient darkening and recovery (‘‘blink-
ing’’) was observed. A high concentration of DTT was more
effective than enzymes alone or enzymes with low DTT
concentrations in delaying bleaching without introducing
blinking. Therefore, deoxygenating enzymes were not in-
cluded in the experiments. We also observed blinking in
rhodamine-labeled actin (41). This behavior may indicate
reversible production of a nonfluorescent chemical species of
the chromophore. These phenomena would be difficult to
detect in ensemble experiments, but their presence should
be considered in studies of protein rotational motions using
single molecule fluorescence polarization.
Angular distributions of individual molecules
Orientation distributions of the probe dipoles relative to the
actin axis (b) in the absence of ATP, and before any apparent
photochemically induced rotational motions, are plotted in
Fig. 5. Fitting the same equations to the time-course data
successively for each 40 ms time point and then calculating
the average of the fitted orientations gave similar results.
Fitted values for b, a, or d .89.5� or ,0.5� were not
reliable, due to the shallow x2 surfaces in these angular
regions, and were discarded (24). The average xr2 was 1.3 6
0.1, indicating that the equations fit the intensity data well.
The azimuthal angle of the probes, a, is expected to be
uniformly distributed around the actin axis. In all four
experimental samples, the mean value of a is near 45� (Fig.5), and the spread of values is broad (SD ; 20�). Values ofa close to 0� and 90�, however, are populated less than
expected for a perfectly uniform distribution. This behavior
also occurs in simulated data (42) and thus accounts for the
observed distribution of a. There is no correlation (r , 0.1)
for any of the samples between a and b or d, further sug-
gesting that the probes are randomly distributed around the
actin axis.
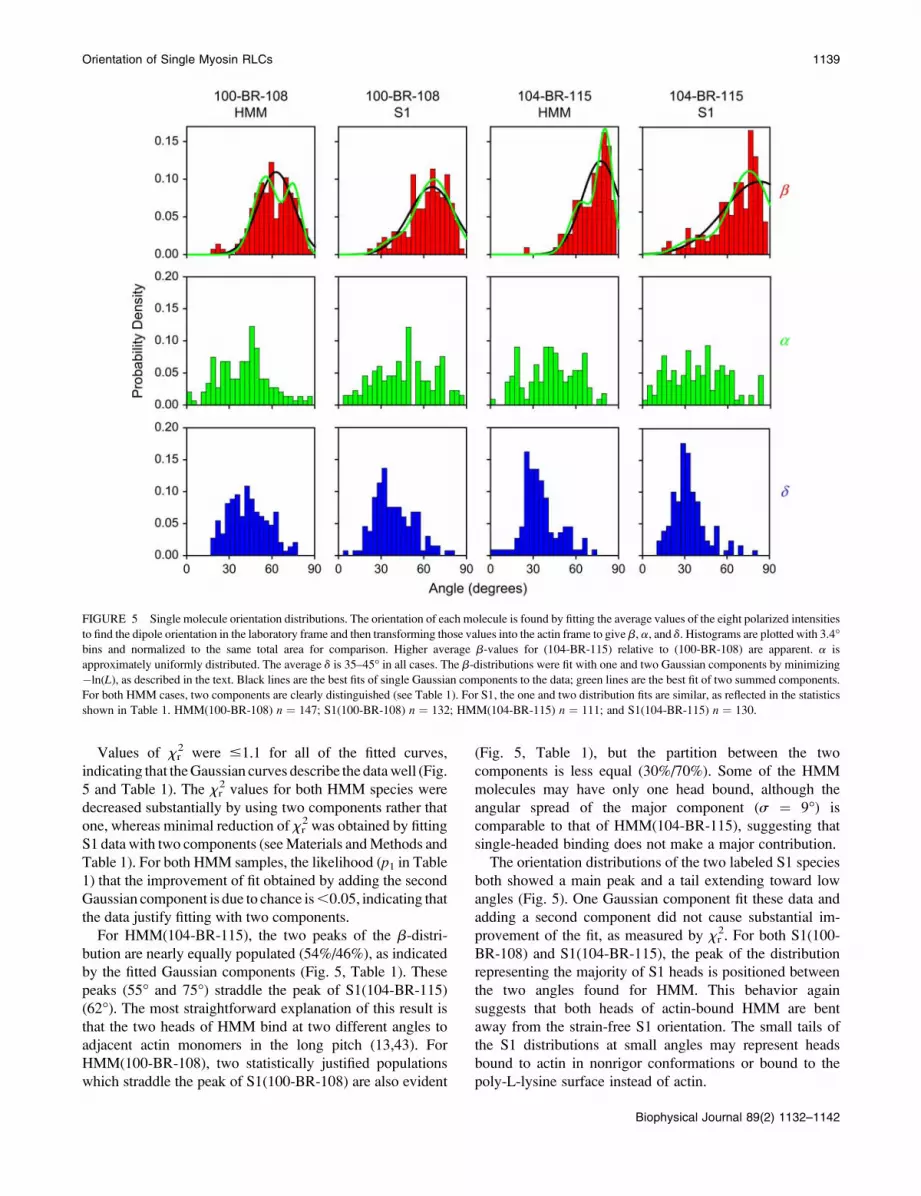
The distributions of axial angle, b, have mean angles
of 61� (HMM(100-BR-108)), 63� (S1(100-BR-108)), 73�(HMM(104-BR-115)), and 67� (S1(104-BR-115)). The
higher values of b (more perpendicular to the actin axis)
for S1(104-BR-115) and HMM(104-BR-115), relative to
those for S1(100-BR-108) and HMM(100-BR-108), are
consistent with data on these probes within muscle fibers
(13,21).
The distributions of b were more narrow (SD 11�–17�)than those for a. The distributions of individual b-values for
both S1 samples are broader than the corresponding dis-
tributions from HMM (Fig. 5). The b-distributions for
HMM(100-BR-108) and HMM(104-BR-115) each show
two clear peaks (Fig. 5, Table 1).
Model angular distributions with one or two Gaussian
components were fit to the b-distributions of all of the
samples (Fig. 5), by minimizing the negative logarithm of the
likelihood (�ln(L)) that the model is the best fit (see
Materials and Methods). For HMM(100-BR-108) and
HMM(104-BR-115), including the few molecules having
b-values ,30� increased the xr2 values of the fitted
orientation distributions 3- to 10-fold and were thus dis-
carded as outliers. No outliers were discarded for S1(100-
BR-108) or S1(104-BR-115).
1138 Quinlan et al.
Biophysical Journal 89(2) 1132–1142
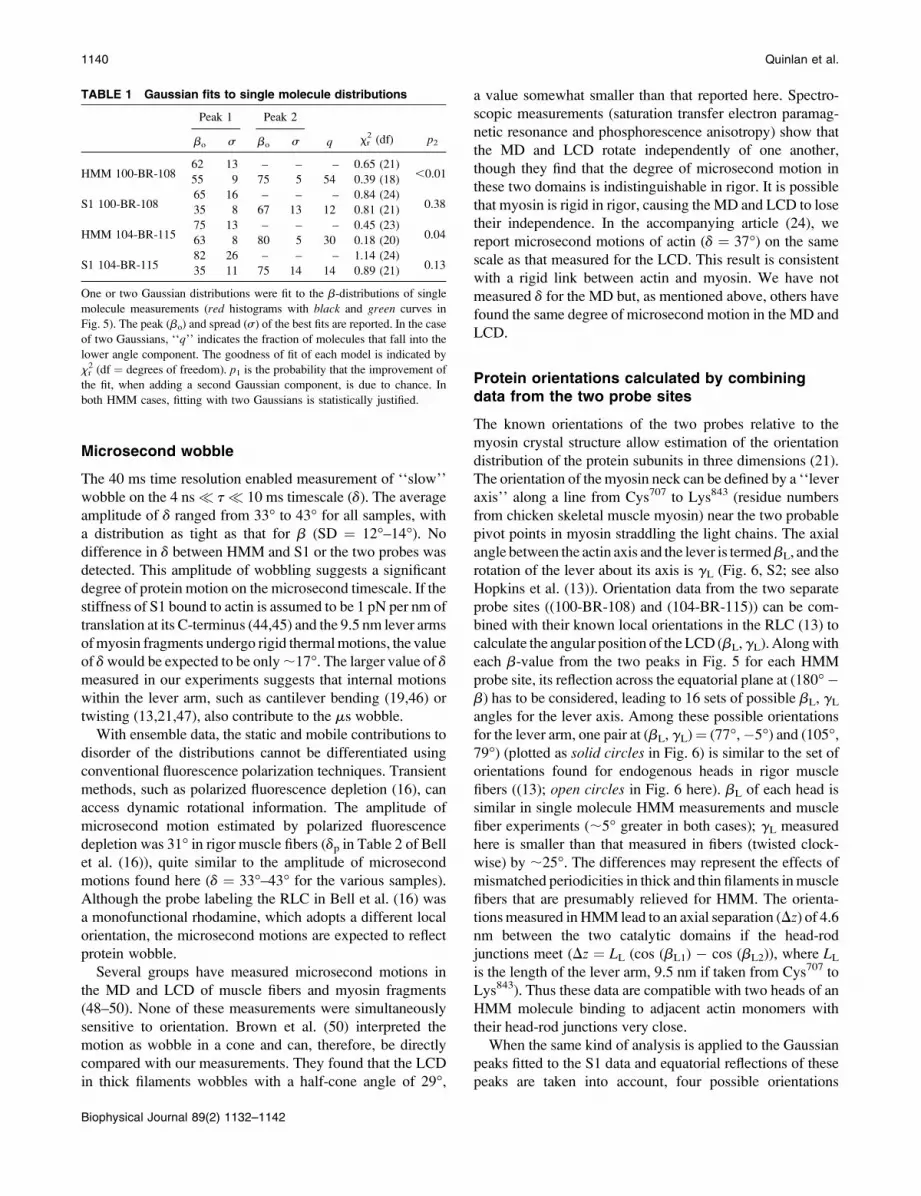
Values of xr2 were #1.1 for all of the fitted curves,
indicating that theGaussian curves describe the datawell (Fig.
5 and Table 1). The xr2 values for both HMM species were
decreased substantially by using two components rather that
one, whereas minimal reduction of xr2 was obtained by fitting
S1 data with two components (seeMaterials andMethods and
Table 1). For both HMM samples, the likelihood (p1 in Table1) that the improvement of fit obtained by adding the second
Gaussian component is due to chance is,0.05, indicating that
the data justify fitting with two components.
For HMM(104-BR-115), the two peaks of the b-distri-
bution are nearly equally populated (54%/46%), as indicated
by the fitted Gaussian components (Fig. 5, Table 1). These
peaks (55� and 75�) straddle the peak of S1(104-BR-115)
(62�). The most straightforward explanation of this result is
that the two heads of HMM bind at two different angles to
adjacent actin monomers in the long pitch (13,43). For
HMM(100-BR-108), two statistically justified populations
which straddle the peak of S1(100-BR-108) are also evident
(Fig. 5, Table 1), but the partition between the two
components is less equal (30%/70%). Some of the HMM
molecules may have only one head bound, although the
angular spread of the major component (s ¼ 9�) is
comparable to that of HMM(104-BR-115), suggesting that
single-headed binding does not make a major contribution.
The orientation distributions of the two labeled S1 species
both showed a main peak and a tail extending toward low
angles (Fig. 5). One Gaussian component fit these data and
adding a second component did not cause substantial im-
provement of the fit, as measured by xr2. For both S1(100-
BR-108) and S1(104-BR-115), the peak of the distribution
representing the majority of S1 heads is positioned between
the two angles found for HMM. This behavior again
suggests that both heads of actin-bound HMM are bent
away from the strain-free S1 orientation. The small tails of
the S1 distributions at small angles may represent heads
bound to actin in nonrigor conformations or bound to the
poly-L-lysine surface instead of actin.
FIGURE 5 Single molecule orientation distributions. The orientation of each molecule is found by fitting the average values of the eight polarized intensities
to find the dipole orientation in the laboratory frame and then transforming those values into the actin frame to give b, a, and d. Histograms are plotted with 3.4�bins and normalized to the same total area for comparison. Higher average b-values for (104-BR-115) relative to (100-BR-108) are apparent. a is
approximately uniformly distributed. The average d is 35–45� in all cases. The b-distributions were fit with one and two Gaussian components by minimizing
�ln(L), as described in the text. Black lines are the best fits of single Gaussian components to the data; green lines are the best fit of two summed components.
For both HMM cases, two components are clearly distinguished (see Table 1). For S1, the one and two distribution fits are similar, as reflected in the statistics
shown in Table 1. HMM(100-BR-108) n ¼ 147; S1(100-BR-108) n ¼ 132; HMM(104-BR-115) n ¼ 111; and S1(104-BR-115) n ¼ 130.
Orientation of Single Myosin RLCs 1139
Biophysical Journal 89(2) 1132–1142
Microsecond wobble
The 40 ms time resolution enabled measurement of ‘‘slow’’
wobble on the 4 ns� t � 10 ms timescale (d). The average
amplitude of d ranged from 33� to 43� for all samples, with
a distribution as tight as that for b (SD ¼ 12�–14�). Nodifference in d between HMM and S1 or the two probes was
detected. This amplitude of wobbling suggests a significant
degree of protein motion on the microsecond timescale. If the
stiffness of S1 bound to actin is assumed to be 1 pN per nm of
translation at its C-terminus (44,45) and the 9.5 nm lever arms
ofmyosin fragments undergo rigid thermalmotions, the value
of dwould be expected to be only;17�. The larger value of dmeasured in our experiments suggests that internal motions
within the lever arm, such as cantilever bending (19,46) or
twisting (13,21,47), also contribute to the ms wobble.
With ensemble data, the static and mobile contributions to
disorder of the distributions cannot be differentiated using
conventional fluorescence polarization techniques. Transient
methods, such as polarized fluorescence depletion (16), can
access dynamic rotational information. The amplitude of
microsecond motion estimated by polarized fluorescence
depletion was 31� in rigor muscle fibers (dp in Table 2 of Bell
et al. (16)), quite similar to the amplitude of microsecond
motions found here (d ¼ 33�–43� for the various samples).
Although the probe labeling the RLC in Bell et al. (16) was
a monofunctional rhodamine, which adopts a different local
orientation, the microsecond motions are expected to reflect
protein wobble.
Several groups have measured microsecond motions in
the MD and LCD of muscle fibers and myosin fragments
(48–50). None of these measurements were simultaneously
sensitive to orientation. Brown et al. (50) interpreted the
motion as wobble in a cone and can, therefore, be directly
compared with our measurements. They found that the LCD
in thick filaments wobbles with a half-cone angle of 29�,
a value somewhat smaller than that reported here. Spectro-
scopic measurements (saturation transfer electron paramag-
netic resonance and phosphorescence anisotropy) show that
the MD and LCD rotate independently of one another,
though they find that the degree of microsecond motion in
these two domains is indistinguishable in rigor. It is possible
that myosin is rigid in rigor, causing the MD and LCD to lose
their independence. In the accompanying article (24), we
report microsecond motions of actin (d ¼ 37�) on the same
scale as that measured for the LCD. This result is consistent
with a rigid link between actin and myosin. We have not
measured d for the MD but, as mentioned above, others have
found the same degree of microsecond motion in the MD and
LCD.
Protein orientations calculated by combiningdata from the two probe sites
The known orientations of the two probes relative to the
myosin crystal structure allow estimation of the orientation
distribution of the protein subunits in three dimensions (21).
The orientation of the myosin neck can be defined by a ‘‘lever
axis’’ along a line from Cys707 to Lys843 (residue numbers
from chicken skeletal muscle myosin) near the two probable
pivot points in myosin straddling the light chains. The axial
angle between the actin axis and the lever is termedbL, and the
rotation of the lever about its axis is gL (Fig. 6, S2; see also
Hopkins et al. (13)). Orientation data from the two separate
probe sites ((100-BR-108) and (104-BR-115)) can be com-
bined with their known local orientations in the RLC (13) to
calculate the angular position of the LCD (bL,gL). Alongwith
each b-value from the two peaks in Fig. 5 for each HMM
probe site, its reflection across the equatorial plane at (180��b) has to be considered, leading to 16 sets of possible bL, gLangles for the lever axis. Among these possible orientations
for the lever arm, one pair at (bL, gL)¼ (77�,�5�) and (105�,79�) (plotted as solid circles in Fig. 6) is similar to the set of
orientations found for endogenous heads in rigor muscle
fibers ((13); open circles in Fig. 6 here). bL of each head is
similar in single molecule HMM measurements and muscle
fiber experiments (;5� greater in both cases); gL measured
here is smaller than that measured in fibers (twisted clock-
wise) by ;25�. The differences may represent the effects of
mismatched periodicities in thick and thin filaments inmuscle
fibers that are presumably relieved for HMM. The orienta-
tionsmeasured in HMM lead to an axial separation (Dz) of 4.6nm between the two catalytic domains if the head-rod
junctions meet (Dz ¼ LL (cos (bL1) � cos (bL2)), where LLis the length of the lever arm, 9.5 nm if taken from Cys707 to
Lys843). Thus these data are compatible with two heads of an
HMM molecule binding to adjacent actin monomers with
their head-rod junctions very close.
When the same kind of analysis is applied to the Gaussian
peaks fitted to the S1 data and equatorial reflections of these
peaks are taken into account, four possible orientations
TABLE 1 Gaussian fits to single molecule distributions
Peak 1 Peak 2
q xr2 (df) p2bo s bo s
HMM 100-BR-10862 13 – – – 0.65 (21)
,0.0155 9 75 5 54 0.39 (18)
S1 100-BR-10865 16 – – – 0.84 (24)
0.3835 8 67 13 12 0.81 (21)
HMM 104-BR-11575 13 – – – 0.45 (23)
0.0463 8 80 5 30 0.18 (20)
S1 104-BR-11582 26 – – – 1.14 (24)
0.1335 11 75 14 14 0.89 (21)
One or two Gaussian distributions were fit to the b-distributions of single
molecule measurements (red histograms with black and green curves in
Fig. 5). The peak (bo) and spread (s) of the best fits are reported. In the case
of two Gaussians, ‘‘q’’ indicates the fraction of molecules that fall into the
lower angle component. The goodness of fit of each model is indicated by
xr2 (df ¼ degrees of freedom). p1 is the probability that the improvement of
the fit, when adding a second Gaussian component, is due to chance. In
both HMM cases, fitting with two Gaussians is statistically justified.
1140 Quinlan et al.
Biophysical Journal 89(2) 1132–1142
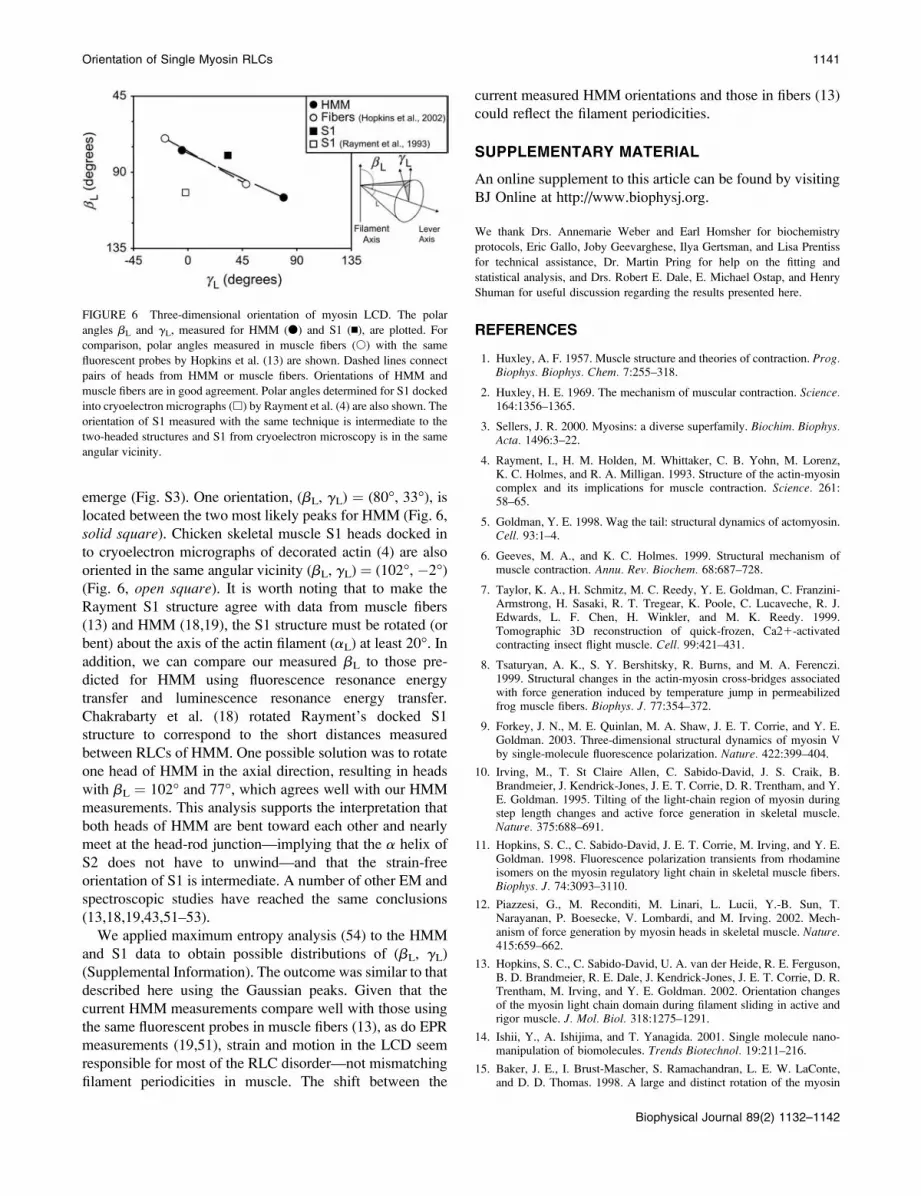
emerge (Fig. S3). One orientation, (bL, gL) ¼ (80�, 33�), islocated between the two most likely peaks for HMM (Fig. 6,
solid square). Chicken skeletal muscle S1 heads docked in
to cryoelectron micrographs of decorated actin (4) are also
oriented in the same angular vicinity (bL, gL) ¼ (102�, �2�)(Fig. 6, open square). It is worth noting that to make the
Rayment S1 structure agree with data from muscle fibers
(13) and HMM (18,19), the S1 structure must be rotated (or
bent) about the axis of the actin filament (aL) at least 20�. Inaddition, we can compare our measured bL to those pre-
dicted for HMM using fluorescence resonance energy
transfer and luminescence resonance energy transfer.
Chakrabarty et al. (18) rotated Rayment’s docked S1
structure to correspond to the short distances measured
between RLCs of HMM. One possible solution was to rotate
one head of HMM in the axial direction, resulting in heads
with bL ¼ 102� and 77�, which agrees well with our HMM
measurements. This analysis supports the interpretation that
both heads of HMM are bent toward each other and nearly
meet at the head-rod junction—implying that the a helix of
S2 does not have to unwind—and that the strain-free
orientation of S1 is intermediate. A number of other EM and
spectroscopic studies have reached the same conclusions
(13,18,19,43,51–53).
We applied maximum entropy analysis (54) to the HMM
and S1 data to obtain possible distributions of (bL, gL)
(Supplemental Information). The outcome was similar to that
described here using the Gaussian peaks. Given that the
current HMM measurements compare well with those using
the same fluorescent probes in muscle fibers (13), as do EPR
measurements (19,51), strain and motion in the LCD seem
responsible for most of the RLC disorder—not mismatching
filament periodicities in muscle. The shift between the
current measured HMM orientations and those in fibers (13)
could reflect the filament periodicities.
SUPPLEMENTARY MATERIAL
An online supplement to this article can be found by visiting
BJ Online at http://www.biophysj.org.
We thank Drs. Annemarie Weber and Earl Homsher for biochemistry
protocols, Eric Gallo, Joby Geevarghese, Ilya Gertsman, and Lisa Prentiss
for technical assistance, Dr. Martin Pring for help on the fitting and
statistical analysis, and Drs. Robert E. Dale, E. Michael Ostap, and Henry
Shuman for useful discussion regarding the results presented here.
REFERENCES
1. Huxley, A. F. 1957. Muscle structure and theories of contraction. Prog.Biophys. Biophys. Chem. 7:255–318.
2. Huxley, H. E. 1969. The mechanism of muscular contraction. Science.164:1356–1365.
3. Sellers, J. R. 2000. Myosins: a diverse superfamily. Biochim. Biophys.Acta. 1496:3–22.
4. Rayment, I., H. M. Holden, M. Whittaker, C. B. Yohn, M. Lorenz,K. C. Holmes, and R. A. Milligan. 1993. Structure of the actin-myosincomplex and its implications for muscle contraction. Science. 261:58–65.
5. Goldman, Y. E. 1998. Wag the tail: structural dynamics of actomyosin.Cell. 93:1–4.
6. Geeves, M. A., and K. C. Holmes. 1999. Structural mechanism ofmuscle contraction. Annu. Rev. Biochem. 68:687–728.
7. Taylor, K. A., H. Schmitz, M. C. Reedy, Y. E. Goldman, C. Franzini-Armstrong, H. Sasaki, R. T. Tregear, K. Poole, C. Lucaveche, R. J.Edwards, L. F. Chen, H. Winkler, and M. K. Reedy. 1999.Tomographic 3D reconstruction of quick-frozen, Ca21-activatedcontracting insect flight muscle. Cell. 99:421–431.
8. Tsaturyan, A. K., S. Y. Bershitsky, R. Burns, and M. A. Ferenczi.1999. Structural changes in the actin-myosin cross-bridges associatedwith force generation induced by temperature jump in permeabilizedfrog muscle fibers. Biophys. J. 77:354–372.
9. Forkey, J. N., M. E. Quinlan, M. A. Shaw, J. E. T. Corrie, and Y. E.Goldman. 2003. Three-dimensional structural dynamics of myosin Vby single-molecule fluorescence polarization. Nature. 422:399–404.
10. Irving, M., T. St Claire Allen, C. Sabido-David, J. S. Craik, B.Brandmeier, J. Kendrick-Jones, J. E. T. Corrie, D. R. Trentham, and Y.E. Goldman. 1995. Tilting of the light-chain region of myosin duringstep length changes and active force generation in skeletal muscle.Nature. 375:688–691.
11. Hopkins, S. C., C. Sabido-David, J. E. T. Corrie, M. Irving, and Y. E.Goldman. 1998. Fluorescence polarization transients from rhodamineisomers on the myosin regulatory light chain in skeletal muscle fibers.Biophys. J. 74:3093–3110.
12. Piazzesi, G., M. Reconditi, M. Linari, L. Lucii, Y.-B. Sun, T.Narayanan, P. Boesecke, V. Lombardi, and M. Irving. 2002. Mech-anism of force generation by myosin heads in skeletal muscle. Nature.415:659–662.
13. Hopkins, S. C., C. Sabido-David, U. A. van der Heide, R. E. Ferguson,B. D. Brandmeier, R. E. Dale, J. Kendrick-Jones, J. E. T. Corrie, D. R.Trentham, M. Irving, and Y. E. Goldman. 2002. Orientation changesof the myosin light chain domain during filament sliding in active andrigor muscle. J. Mol. Biol. 318:1275–1291.
14. Ishii, Y., A. Ishijima, and T. Yanagida. 2001. Single molecule nano-manipulation of biomolecules. Trends Biotechnol. 19:211–216.
15. Baker, J. E., I. Brust-Mascher, S. Ramachandran, L. E. W. LaConte,and D. D. Thomas. 1998. A large and distinct rotation of the myosin
FIGURE 6 Three-dimensional orientation of myosin LCD. The polar
angles bL and gL, measured for HMM (d) and S1 (n), are plotted. For
comparison, polar angles measured in muscle fibers (s) with the same
fluorescent probes by Hopkins et al. (13) are shown. Dashed lines connect
pairs of heads from HMM or muscle fibers. Orientations of HMM and
muscle fibers are in good agreement. Polar angles determined for S1 docked
into cryoelectron micrographs (h) by Rayment et al. (4) are also shown. The
orientation of S1 measured with the same technique is intermediate to the
two-headed structures and S1 from cryoelectron microscopy is in the same
angular vicinity.
Orientation of Single Myosin RLCs 1141
Biophysical Journal 89(2) 1132–1142
light chain domain occurs upon muscle contraction. Proc. Natl. Acad.Sci. USA. 95:2944–2949.
16. Bell, M. G., R. E. Dale, U. A. van der Heide, and Y. E. Goldman. 2002.Polarized fluorescence depletion reports orientation distribution androtational dynamics of muscle cross-bridges. Biophys. J. 83:1050–1073.
17. Huxley, H. E., and W. Brown. 1967. The low-angle x-ray diagram ofvertebrate striated muscle and its behaviour during contraction andrigor. J. Mol. Biol. 30:383–434.
18. Chakrabarty, T., M. Xiao, R. Cooke, and P. R. Selvin. 2002. Holdingtwo heads together: stability of the myosin II rod measured by res-onance energy transfer between the heads. Proc. Natl. Acad. Sci. USA.99:6011–6016.
19. Baumann, B. A. J., H. Liang, K. Sale, B. D. Hambly, and P. G. Fajer.2004. Myosin regulatory domain orientation in skeletal muscle fibers:application of novel electron paramagnetic resonance spectral de-composition and molecular modeling methods. Biophys. J. 86:3030–3041.
20. Hambly, B., K. Franks, and R. Cooke. 1991. Orientation of spin-labeled light chain-2 exchanged onto myosin cross-bridges in glyc-erinated muscle fibers. Biophys. J. 59:127–138.
21. Corrie, J. E. T., B. D. Brandmeier, R. E. Ferguson, D. R. Trentham, J.Kendrick-Jones, S. C. Hopkins, U. A. van der Heide, Y. E. Goldman,C. Sabido-David, R. E. Dale, S. Criddle, and M. Irving. 1999. Dynamicmeasurement of myosin light-chain-domain tilt and twist in musclecontraction. Nature. 400:425–430.
22. Thomas, D. D., and R. Cooke. 1980. Orientation of spin-labeledmyosin heads in glycerinated muscle fibers. Biophys. J. 32:891–906.
23. Berger, C. L., J. S. Craik, D. R. Trentham, J. E. T. Corrie, and Y. E.Goldman. 1996. Fluorescence polarization of skeletal muscle fiberslabeled with rhodamine isomers on the myosin heavy chain. Biophys. J.71:3330–3343.
24. Forkey, J. N., M. E. Quinlan, and Y. E. Goldman. 2005. Measurementof single macromolecule orientation by total internal reflection fluo-rescence polarization microscopy. Biophys. J. 89:1261–1271.
25. Quinlan, M. E., J. N. Forkey, J. E. T. Corrie, and Y. E. Goldman. 2002.Orientation of the myosin light chain region by single- and multi-molecule total internal reflection fluorescence polarization microscopy.Biophys. J. 82:404a. (Abstr.)
26. Quinlan, M. E., J. N. Forkey, J. E. T. Corrie, and Y. E. Goldman. 1999.Tilting of the light chain region in single myosin molecules using totalinternal reflection fluorescence polarization microscopy. Biophys. J.76:A165. (Abstr.)
27. Kron, S. J., Y. Y. Toyoshima, T. Q. P. Uyeda, and J. A. Spudich. 1991.Assays for actin sliding movement over myosin-coated surfaces.Methods Enzymol. 196:399–416.
28. Margossian, S. S., and S. Lowey. 1982. Preparation of myosin and itssubfragments from rabbit skeletal muscle. Methods Enzymol. 85(Pt. B):55–71.
29. Okamoto, Y., and T. Sekine. 1985. A streamlined method of sub-fragment one preparation from myosin. J. Biochem. (Tokyo). 98:1143–1145.
30. Corrie, J. E. T., J. S. Craik, and V. R. N. Munasinghe. 1998. Ahomobifunctional rhodamine for labeling proteins with definedorientations of a fluorophore. Bioconjug. Chem. 9:160–167.
31. Kron, S. J., and J. A. Spudich. 1986. Fluorescent actin filaments moveon myosin fixed to a glass surface. Proc. Natl. Acad. Sci. USA. 83:6272–6276.
32. Sase, I., H. Miyata, S. Ishiwata, and K. Kinosita Jr. 1997. Axialrotation of sliding actin filaments revealed by single-fluorophoreimaging. Proc. Natl. Acad. Sci. USA. 94:5646–5650.
33. Toyoshima, Y. Y., C. Toyoshima, and J. A. Spudich. 1989.Bidirectional movement of actin filaments along tracks of myosinheads. Nature. 341:154–156.
34. Zare, R. N. 1988. Angular Momentum: Understanding Spatial Aspectsin Chemistry and Physics. Wiley-Interscience, New York. 77–81.
35. Press, W. H., S. A. Teukolsky, W. T. Vetterling, and B. P. Flannery.1992. Numerical Recipes in C: The Art of Scientific Computing, 2nded. Cambridge University Press, New York.
36. Mood, A. M., F. A. Graybill, and D. C. Boes. 1974. Tests ofhypotheses. In Introduction to the Theory of Statistics, 3rd ed.McGraw-Hill, New York.
37. Marston, S., and A. Weber. 1975. The dissociation constant of the actin-heavy meromyosin subfragment-1 complex. Biochemistry. 14:3868–3873.
38. Nishizaka, T., R. Seo, H. Tadakuma, K. Kinosita Jr., and S. Ishiwata.2000. Characterization of single actomyosin rigor bonds: load de-pendence of lifetime and mechanical properties.Biophys. J. 79:962–974.
39. Wazawa, T., Y. Ishii, T. Funatsu, and T. Yanagida. 2000. Spectralfluctuation of a single fluorophore conjugated to a protein molecule.Biophys. J. 78:1561–1569.
40. Harada, Y., K. Sakurada, T. Aoki, D. D. Thomas, and T. Yanagida.1990. Mechanochemical coupling in actomyosin energy transductionstudied by in vitro movement assay. J. Mol. Biol. 216:49–68.
41. Rosenberg, S. A., M. E. Quinlan, J. N. Forkey, and Y. E. Goldman.2005. Rotational motions of macromolecules by single-moleculefluorescence microscopy. Acc. Chem. Res. In press.
42. Quinlan, M. E. 2002. Single molecule fluorescence polarization studiesof the myosin light chain domain. PhD thesis. University of Penn-sylvania, Philadelphia.
43. Schmitz, H., M. C. Reedy, M. K. Reedy, R. T. Tregear, H. Winkler,and K. A. Taylor. 1996. Electron tomography of insect flight muscle inrigor and AMPPNP at 23 degrees C. J. Mol. Biol. 264:279–301.
44. Veigel, C., M. L. Bartoo, D. C. S. White, J. C. Sparrow, and J. E. Molloy.1998. The stiffness of rabbit skeletal actomyosin cross-bridges de-termined with an optical tweezers transducer.Biophys. J. 75:1424–1438.
45. Linari, M., I. Dobbie, M. Reconditi, N. Koubassova, M. Irving, G.Piazzesi, and V. Lombardi. 1998. The stiffness of skeletal muscle inisometric contraction and rigor: the fraction of myosin heads bound toactin. Biophys. J. 74:2459–2473.
46. Dobbie, I., M. Linari, G. Piazzesi, M. Reconditi, N. Koubassova, M. A.Ferenczi, V. Lombardi, and M. Irving. 1998. Elastic bending and activetilting of myosin heads during muscle contraction. Nature. 396:383–387.
47. Volkmann, N., D. Hanein, G. Ouyang, K. M. Trybus, D. J. DeRosier,and S. Lowey. 2000. Evidence for cleft closure in actomyosin uponADP release. Nat. Struct. Biol. 7:1147–1155.
48. Adhikari, B., K. Hideg, and P. G. Fajer. 1997. Independent mobility ofcatalytic and regulatory domains of myosin heads. Proc. Natl. Acad.Sci. USA. 94:9643–9647.
49. Roopnarine, O., A. G. Szent-Gyorgyi, and D. D. Thomas. 1998.Microsecond rotational dynamics of spin-labeled myosin regulatorylight chain induced by relaxation and contraction of scallop muscle.Biochemistry. 37:14428–14436.
50. Brown, L. J., N. Klonis, W. H. Sawyer, P. G. Fajer, and B. D. Hambly.2001. Independent movement of the regulatory and catalytic domainsof myosin heads revealed by phosphorescence anisotropy. Biochem-istry. 40:8283–8291.
51. Zhao, L., J. Gollub, and R. Cooke. 1996. Orientation of paramagneticprobes attached to gizzard regulatory light chain bound to myosinheads in rabbit skeletal muscle. Biochemistry. 35:10158–10165.
52. Chakrabarty, T., C. Yengo, C. Baldacchino, L.-Q. Chen, H. L.Sweeney, and P. R. Selvin. 2003. Does the S2 rod of myosin II uncoilupon two-headed binding to actin? A leucine-zippered HMM study.Biochemistry. 42:12886–12892.
53. Liu, J., M. C. Reedy, Y. E. Goldman, C. Franzini-Armstrong, H.Sasaki, R. T. Tregear, C. Lucaveche, H. Winkler, B. A. J. Baumann,J. M. Squire, T. C. Irving, M. K. Reedy, and K. A. Taylor. 2004. Electrontomography of fast frozen, stretched rigor fibers reveals elasticdistortions in the myosin crossbridges. J. Struct. Biol. 147:268–282.
54. Van der Heide, U. A., S. C. Hopkins, and Y. E. Goldman. 2000. Amaximum entropy analysis of protein orientations using fluorescencepolarization data from multiple probes. Biophys. J. 78:2138–2150.
1142 Quinlan et al.
Biophysical Journal 89(2) 1132–1142